Feeds:
Posts
Comments

Archive for the ‘Na-K transport’ Category

Eight Subcellular Pathologies driving Chronic Metabolic Diseases – Methods for Mapping Bioelectronic Adjustable Measurements as potential new Therapeutics: Impact on Pharmaceuticals in Use

Eight Subcellular Pathologies driving Chronic Metabolic Diseases – Methods for Mapping Bioelectronic Adjustable Measurements as potential new Therapeutics: Impact on Pharmaceuticals in Use

Curators:


THE VOICE of Aviva Lev-Ari, PhD, RN

In this curation we wish to present two breaking through goals:

Goal 1:

Exposition of a new direction of research leading to a more comprehensive understanding of Metabolic Dysfunctional Diseases that are implicated in effecting the emergence of the two leading causes of human mortality in the World in 2023: (a) Cardiovascular Diseases, and (b) Cancer

Goal 2:

Development of Methods for Mapping Bioelectronic Adjustable Measurements as potential new Therapeutics for these eight subcellular causes of chronic metabolic diseases. It is anticipated that it will have a potential impact on the future of Pharmaceuticals to be used, a change from the present time current treatment protocols for Metabolic Dysfunctional Diseases.

According to Dr. Robert Lustig, M.D, an American pediatric endocrinologist. He is Professor emeritus of Pediatrics in the Division of Endocrinology at the University of California, San Francisco, where he specialized in neuroendocrinology and childhood obesity, there are eight subcellular pathologies that drive chronic metabolic diseases.

These eight subcellular pathologies can’t be measured at present time.

In this curation we will attempt to explore methods of measurement for each of these eight pathologies by harnessing the promise of the emerging field known as Bioelectronics.

Unmeasurable eight subcellular pathologies that drive chronic metabolic diseases

  1. Glycation
  2. Oxidative Stress
  3. Mitochondrial dysfunction [beta-oxidation Ac CoA malonyl fatty acid]
  4. Insulin resistance/sensitive [more important than BMI], known as a driver to cancer development
  5. Membrane instability
  6. Inflammation in the gut [mucin layer and tight junctions]
  7. Epigenetics/Methylation
  8. Autophagy [AMPKbeta1 improvement in health span]

Diseases that are not Diseases: no drugs for them, only diet modification will help

Image source

Robert Lustig, M.D. on the Subcellular Processes That Belie Chronic Disease

https://www.youtube.com/watch?v=Ee_uoxuQo0I


Exercise will not undo Unhealthy Diet

Image source

Robert Lustig, M.D. on the Subcellular Processes That Belie Chronic Disease

https://www.youtube.com/watch?v=Ee_uoxuQo0I


These eight Subcellular Pathologies driving Chronic Metabolic Diseases are becoming our focus for exploration of the promise of Bioelectronics for two pursuits:

  1. Will Bioelectronics be deemed helpful in measurement of each of the eight pathological processes that underlie and that drive the chronic metabolic syndrome(s) and disease(s)?
  2. IF we will be able to suggest new measurements to currently unmeasurable health harming processes THEN we will attempt to conceptualize new therapeutic targets and new modalities for therapeutics delivery – WE ARE HOPEFUL

In the Bioelecronics domain we are inspired by the work of the following three research sources:

  1. Biological and Biomedical Electrical Engineering (B2E2) at Cornell University, School of Engineering https://www.engineering.cornell.edu/bio-electrical-engineering-0
  2. Bioelectronics Group at MIT https://bioelectronics.mit.edu/
  3. The work of Michael Levin @Tufts, The Levin Lab
Michael Levin is an American developmental and synthetic biologist at Tufts University, where he is the Vannevar Bush Distinguished Professor. Levin is a director of the Allen Discovery Center at Tufts University and Tufts Center for Regenerative and Developmental Biology. Wikipedia
Born: 1969 (age 54 years), Moscow, Russia
Education: Harvard University (1992–1996), Tufts University (1988–1992)
Affiliation: University of Cape Town
Research interests: Allergy, Immunology, Cross Cultural Communication
Awards: Cozzarelli prize (2020)
Doctoral advisor: Clifford Tabin
Most recent 20 Publications by Michael Levin, PhD
SOURCE
SCHOLARLY ARTICLE
The nonlinearity of regulation in biological networks
1 Dec 2023npj Systems Biology and Applications9(1)
Co-authorsManicka S, Johnson K, Levin M
SCHOLARLY ARTICLE
Toward an ethics of autopoietic technology: Stress, care, and intelligence
1 Sep 2023BioSystems231
Co-authorsWitkowski O, Doctor T, Solomonova E
SCHOLARLY ARTICLE
Closing the Loop on Morphogenesis: A Mathematical Model of Morphogenesis by Closed-Loop Reaction-Diffusion
14 Aug 2023Frontiers in Cell and Developmental Biology11:1087650
Co-authorsGrodstein J, McMillen P, Levin M
SCHOLARLY ARTICLE
30 Jul 2023Biochim Biophys Acta Gen Subj1867(10):130440
Co-authorsCervera J, Levin M, Mafe S
SCHOLARLY ARTICLE
Regulative development as a model for origin of life and artificial life studies
1 Jul 2023BioSystems229
Co-authorsFields C, Levin M
SCHOLARLY ARTICLE
The Yin and Yang of Breast Cancer: Ion Channels as Determinants of Left–Right Functional Differences
1 Jul 2023International Journal of Molecular Sciences24(13)
Co-authorsMasuelli S, Real S, McMillen P
SCHOLARLY ARTICLE
Bioelectricidad en agregados multicelulares de células no excitables- modelos biofísicos
Jun 2023Revista Española de Física32(2)
Co-authorsCervera J, Levin M, Mafé S
SCHOLARLY ARTICLE
Bioelectricity: A Multifaceted Discipline, and a Multifaceted Issue!
1 Jun 2023Bioelectricity5(2):75
Co-authorsDjamgoz MBA, Levin M
SCHOLARLY ARTICLE
Control Flow in Active Inference Systems – Part I: Classical and Quantum Formulations of Active Inference
1 Jun 2023IEEE Transactions on Molecular, Biological, and Multi-Scale Communications9(2):235-245
Co-authorsFields C, Fabrocini F, Friston K
SCHOLARLY ARTICLE
Control Flow in Active Inference Systems – Part II: Tensor Networks as General Models of Control Flow
1 Jun 2023IEEE Transactions on Molecular, Biological, and Multi-Scale Communications9(2):246-256
Co-authorsFields C, Fabrocini F, Friston K
SCHOLARLY ARTICLE
Darwin’s agential materials: evolutionary implications of multiscale competency in developmental biology
1 Jun 2023Cellular and Molecular Life Sciences80(6)
Co-authorsLevin M
SCHOLARLY ARTICLE
Morphoceuticals: Perspectives for discovery of drugs targeting anatomical control mechanisms in regenerative medicine, cancer and aging
1 Jun 2023Drug Discovery Today28(6)
Co-authorsPio-Lopez L, Levin M
SCHOLARLY ARTICLE
Cellular signaling pathways as plastic, proto-cognitive systems: Implications for biomedicine
12 May 2023Patterns4(5)
Co-authorsMathews J, Chang A, Devlin L
SCHOLARLY ARTICLE
Making and breaking symmetries in mind and life
14 Apr 2023Interface Focus13(3)
Co-authorsSafron A, Sakthivadivel DAR, Sheikhbahaee Z
SCHOLARLY ARTICLE
The scaling of goals from cellular to anatomical homeostasis: an evolutionary simulation, experiment and analysis
14 Apr 2023Interface Focus13(3)
Co-authorsPio-Lopez L, Bischof J, LaPalme JV
SCHOLARLY ARTICLE
The collective intelligence of evolution and development
Apr 2023Collective Intelligence2(2):263391372311683SAGE Publications
Co-authorsWatson R, Levin M
SCHOLARLY ARTICLE
Bioelectricity of non-excitable cells and multicellular pattern memories: Biophysical modeling
13 Mar 2023Physics Reports1004:1-31
Co-authorsCervera J, Levin M, Mafe S
SCHOLARLY ARTICLE
There’s Plenty of Room Right Here: Biological Systems as Evolved, Overloaded, Multi-Scale Machines
1 Mar 2023Biomimetics8(1)
Co-authorsBongard J, Levin M
SCHOLARLY ARTICLE
Transplantation of fragments from different planaria: A bioelectrical model for head regeneration
7 Feb 2023Journal of Theoretical Biology558
Co-authorsCervera J, Manzanares JA, Levin M
SCHOLARLY ARTICLE
Bioelectric networks: the cognitive glue enabling evolutionary scaling from physiology to mind
1 Jan 2023Animal Cognition
Co-authorsLevin M
SCHOLARLY ARTICLE
Biological Robots: Perspectives on an Emerging Interdisciplinary Field
1 Jan 2023Soft Robotics
Co-authorsBlackiston D, Kriegman S, Bongard J
SCHOLARLY ARTICLE
Cellular Competency during Development Alters Evolutionary Dynamics in an Artificial Embryogeny Model
1 Jan 2023Entropy25(1)
Co-authorsShreesha L, Levin M
5

5 total citations on Dimensions.

Article has an altmetric score of 16
SCHOLARLY ARTICLE
1 Jan 2023BIOLOGICAL JOURNAL OF THE LINNEAN SOCIETY138(1):141
Co-authorsClawson WP, Levin M
SCHOLARLY ARTICLE
Future medicine: from molecular pathways to the collective intelligence of the body
1 Jan 2023Trends in Molecular Medicine
Co-authorsLagasse E, Levin M

THE VOICE of Dr. Justin D. Pearlman, MD, PhD, FACC

PENDING

THE VOICE of  Stephen J. Williams, PhD

Ten TakeAway Points of Dr. Lustig’s talk on role of diet on the incidence of Type II Diabetes


  1. 25% of US children have fatty liver
  2. Type II diabetes can be manifested from fatty live with 151 million  people worldwide affected moving up to 568 million in 7 years
  3. A common myth is diabetes due to overweight condition driving the metabolic disease
  4. There is a trend of ‘lean’ diabetes or diabetes in lean people, therefore body mass index not a reliable biomarker for risk for diabetes
  5. Thirty percent of ‘obese’ people just have high subcutaneous fat.  the visceral fat is more problematic
  6. there are people who are ‘fat’ but insulin sensitive while have growth hormone receptor defects.  Points to other issues related to metabolic state other than insulin and potentially the insulin like growth factors
  7. At any BMI some patients are insulin sensitive while some resistant
  8. Visceral fat accumulation may be more due to chronic stress condition
  9. Fructose can decrease liver mitochondrial function
  10. A methionine and choline deficient diet can lead to rapid NASH development


Read Full Post »

A Concise Review of Cardiovascular Biomarkers of Hypertension

Curator: Larry H. Bernstein, MD, FCAP

LPBI

Revised 5/25/2016


Introduction

While a large body of work had been done on cholesterol synthesis, HDL and LDL cholesterol, triglycerides, and lipoproteins for a quarter century, and the concept of metabolic syndrome was emerging, there was neither a unifying concept nor a sufficient multivariable approach to apply the use of laboratory markers to clinical practice.  The mathematical foundation for such an evaluation of the biological markers and the computational tools were maturing at the turn of the 20th century, and the interest in outcomes research for improved healthcare practice was maturing. In addition, there was now heavy investment in health information systems that would support emerging health networks of a rapidly consolidating patient base.  This has become important for the pharmaceutical industry and for allied health sciences to enable a suitable method of measuring the effectiveness of drug and of lifestyle changes to improve the population health.

The importance of finding biomarkers for hypertension is significant as stated above. I refer to observations in a lecture by Teresa Seeman, Ph.D., Professor, UCLA Geffen School of Medicine (1).
The missed cased of hypertension in the U.S. alone has been examined by the NHANES studies. Table  I
shows the poor identification of this serious chronic condition. The next table (Table II)*, also from NHANES  (Seeman study) looks at Allostatic Load for biomarkers using component biomarker measurement criterion cutpoints.  Table III* gives the odds ratios for mortality by Allostatic Load Score.

An explanatory problem for our difficulty with diagnosis of a number of hypertension disease “subsets” is that there is peripheral hypertension that might be idiopathic, or it might be related to coexisting diseases with both inflammatory and vascular structural dynamics nature.  In addition, this may be concurrent with pulmonary hypertension, systemic hypertension, and progressive renal disease.  This discussion is reserved for later.  As stated, the late or missed diagnosis of systemic or essential idiopathic hypertension is illustrated in the three Seeman tables (1).


Table 1

Table 2

Table 3


Table 1*. Missed cases by “self report”

Self-reports

vs undiagnosed

study NHANES 88-94 NHANES 99-2004 NHANES 2005-08
Hypertension %unaware  BP > 140/90 42.7 43.5 39.06
SR-controlled
SR-high

Unaware

  7.45

10

13.88

8.35

10.85

16.12

6.5

10.18

19.98

High cholesterol Chol > 220 g/dl 55.93 49.3 47.05
SR-controlled
SR- high
Unaware
  11.02
8.68
12.12
8.47
8.72
18.5
7.22
8.12
23.46
Diabetes HgA1C > 6.4%      
SR-controlled

SR- high

Unaware

  2.41

3.43

1.64

1.76

5.01

3.09

2.11
5.51
3.09

*modified from Seeman


Table II* USHANES: Allostatic Load – component cutpoints

Biomarker Total N High Risk Percent (%) Cutpoint
DBP (mm Hg) 15,489 1,180   7.62    90
SBP (mm Hg) 15,491 3,461 22.34  140
Pulse Rate 15,117 1,009   6.67    90
HgA1C (%) 15,441 1,482   9.60    6.4
WHR 14,824 6,778 45.72    0.94
HDL Cholesterol (mg/dl) 15,187 3,440 22.65     40
Total Cholesterol

(mg/dl)

15,293 3,196  20.90    240

*From  T. Seaman, UCLA Geffen SOM


Table III*. Odds of mortality by Allostatic Load Score.

ALS Odds Ratio
7-8 5
6 2.6
5 2.3
4 2.1
3 1.8
2 1.5
1 1.4


*From  T. Seaman, UCLA Geffen SOM


I refer to cardiovascular diseases in reference to an aggregate of diseases affecting the heart, the circulatory system from large artery to the capillary, the lungs and kidneys, excluding the lymphatics.
These major disease entities are both separate and interrelated, not necessarily found in the same combinations. However, they account for a growing proportion of illness, apart from cancers, that affect the aging population of western societies. In the discussion that follows, I shall construct a picture of the pathophysiology of cardiovascular diseases, describe the major biomarkers for the assessment of these, point out the relationship of these to hypertension, and try to develop a more targeted approach to the assessment of hypertension and related disorders.

Chronic kidney disease (CKD) is defined as persistent kidney damage accompanied by a reduction in the glomerular filtration rate (GFR) and the presence of albuminuria. The rise in incidence of CKD is attributed to an aging populace and increases in hypertension (HTN), diabetes, and obesity within the U.S. population. CKD is associated with a host of complications including electrolyte imbalances, mineral and bone disorders, anemia, dyslipidemia, and HTN. It is well known that CKD is a risk factor for cardiovascular disease (CVD), and that a reduced GFR and albuminuria are independently associated with an increase in cardiovascular and all-cause mortality.

The relationship between CKD and HTN is cyclic, as CKD can contribute to or cause HTN (3). Elevated BP leads to damage of blood vessels within the kidney, as well as throughout the body. This damage impairs the kidney’s ability to filter fluid and waste from the blood, leading to an increase of fluid volume in the blood—thus causing an increase in BP.


A cursory description of the blood circulation

The full circulation involves the heart as a pump, and the arteries and veins, comprising small and large vessels, and capillaries at the point of delivery of oxygen and capture of carbon dioxide, and of transfer of substrates to tissues.  The brain, liver, pancreas and spleen, and endocrines are not further considered here, except for a consideration on neuro-humoral peptides that have emerged in the regulation of blood pressure and are essential to the stress response. The lung and the liver are both important with respect to the exchange of air and metabolites, and both have secondary circulations, the pulmonary and the portal vascular circulations.  In the case of the lungs, the vena cava flows into the right atrium, which delivers unoxygenated blood to the lungs via the right ventricle and right pulmonary artery, which returns to the left atrium by way of the right pulmonary vein.  The blood from the left atrium that flows into the left ventricle is ejected into the aorta.  The coronary arteries that nourish the heart are at the base of the aorta.  The heart muscle is a syncytium, unlike striated muscle, and it is densely packed with mitochondria, suitable for continuous contraction under vasovagal control. This is the anatomical construct, but the physiology is still being clarified because normal function and disease are both a matter of regulatory control.

In order to understand hypertension, we have to view the heart functioning over a long period of time.
In a still frame picture, we envision the left ventricle contracts emptying the oxygenated blood into the circulation. The ejection of blood into the aorta is called systole, by which the blood is delivered by the force of contraction into the circulation.  The filling pressure is called diastole.  So we have a filling and an emptying, and heard by the stethoscope is a lub-dub, synchronously repeated.   A normal systolic blood pressure is below 120. A systolic blood pressure of 120 to 139 means you have prehypertension, or borderline high blood pressure. Even people with prehypertension are at a higher risk of developing heart disease. A systolic blood pressure number of 140 or higher is considered to be hypertension, or high blood pressure. The diastolic blood pressure number or the bottom number indicates the pressure in the arteries when the heart rests between beats. A normal diastolic blood pressure number is less than 80. A diastolic blood pressure between 80 and 89 indicates prehypertension. A diastolic blood pressure number of 90 or higher is considered to be hypertension or high blood pressure. So now we have identified a systolic and a diastolic high blood pressure. Systolic pressure increases with vigorous activity, and becomes normal when the activity resides.  The systolic blood pressure increases with age. Over time, consistently high blood pressure weakens and damages the blood vessels so affected. Moreover, changes in the body’s normal functions may cause high blood pressure, including changes to kidney fluid and salt balances, the renin-angiotensin-aldosterone system, sympathetic nervous system activity, and blood vessel structure and function.


Starling’s Law of the Heart

Two principal intrinsic mechanisms, namely the Frank-Starling mechanism and rate induced regulation, enable the myocardium to adapt to changes in hemodynamic conditions. The Frank-Starling mechanism (also referred to as Starling’s law of the heart), is invoked in response to changes in the resting length of the myocardial fibers. Rate-induced regulation is invoked in response to changes in the frequency of the heartbeat.  (3-9).

Frank and Starling (3, 4) showed that an increase in diastolic volume caused an increase in systolic performance. The stretch effect persists across a range of myocardial contractile states, but during exercise it plays only a lesser role augmenting ventricular function maximal exercise. This is because in healthy human subjects adrenergic reflex mechanisms modulate myocardial performance, heart rate, vascular impedance and coronary flow during exercise and changes in these variables can overshadow the effect of fiber stretch or even prevent an increase in end-diastolic volume during stress (5). (See you- tube (6).

According to Lakatta muscle length modulates the extent of myofilament calcium ion (Ca2+) activation (7-9).   Similarly, the fiber length during a contraction, which is determined in part by the load encountered during shortening, also determines the extent of myofilament Ca2+ activation. Therefore, the terms preload, afterload and myocardial contractile state lose part of their significance in light of current knowledge.


Biology and High Blood Pressure

Researchers continue to study how various changes in normal body functions cause high blood pressure. The key functions affected in high blood pressure include (10):

Kidney Fluid and Salt Balances

The kidneys normally regulate the body’s salt balance by retaining sodium and water and excreting potassium. Imbalances in this kidney function can expand blood volumes, which can cause high blood pressure.

Renin-Angiotensin-Aldosterone System

The renin-angiotensin-aldosterone system makes angiotensin and aldosterone hormones. Angiotensin narrows or constricts blood vessels, which can lead to an increase in blood pressure. Aldosterone controls how the kidneys balance fluid and salt levels. Increased aldosterone levels or activity may change this kidney function, leading to increased blood volumes and high blood pressure.

Sympathetic Nervous System Activity

The sympathetic nervous system has important functions in blood pressure regulation, including heart rate, blood pressure, and breathing rate. Researchers are investigating whether imbalances in this system cause high blood pressure.

Blood Vessel Structure and Function

Changes in the structure and function of small and large arteries may contribute to high blood pressure. The angiotensin pathway and the immune system may stiffen small and large arteries, which can affect blood pressure.

Two or more types of hypertension

Systemic hypertension

Idiopathic hypertension

Hypertension from chronic renal disease

Pulmonary artery hypertension

Hypertension associated with systemic chronic inflammatory disease (rheumatoid arthritis and other collagen vascular diseases)

Genetic Causes of High Blood Pressure

Much of the understanding of the body systems involved in high blood pressure has come from genetic studies. High blood pressure often runs in families. Years of research have identified many genes and other mutations associated with high blood pressure, some in the renal salt regulatory and renin-angiotensin-aldosterone pathways. However, these known genetic factors only account for 2 to 3 percent of all cases. Emerging research suggests that certain DNA changes during fetal development also may cause the development of high blood pressure later in life.

Environmental Causes of High Blood Pressure

Environmental causes of high blood pressure include unhealthy lifestyle habits, being overweight or obese, and medicines.

Other medical causes of high blood pressure include other medical conditions such as chronic kidney disease, sleep apnea, thyroid problems, or certain tumors.

The common complications of hypertension and their signs and symptoms include:

http://www.nhlbi.nih.gov/health/health-topics/topics/hbp/causes10


Pulse Pressure and Stroke Volume

The  pulse pressure is the difference between systolic (the upper number) and diastolic (the lower number) (11).

Systemic pulse pressure = Psystolic – Pdiastolic

The pulse pressure is 40 mmHg for a typical blood pressure reading of 120/80 mmHg.

Pulse pressure (PP) is proportional to stroke volume (SV), the amount of blood pumped from the heart in one beat, and inversely proportional to the compliance or flexibility of the blood vessels, mainly the aorta.

A low (also called narrow) pulse pressure means that not much blood is being expelled from the heart, and can be caused by a number of factors, including severe blood loss due to trauma, congestive heart failure, shock, a narrowing of the valve leading from the heart to the aorta (stenosis), and fluid accumulating around the heart (tamponade).

High (or wide) pulse pressures occur during exercise, as stroke volume increases and the overall resistance to blood flow decreases. It can also occur for many reasons, such as hardening of the arteries (which can have numerous causes), various deficiencies in the aorta (mainly) or other arteries, including leaksfistulas, and a usually-congenital condition known as AVM, pain/anxiety, fever, anemia, pregnancy, and more. Certain medications for high blood pressure can widen pulse pressure, while others narrow it. A chronic increase in pulse pressure is a risk factor for heart disease, and can lead to the type of arrhythmia called atrial fibrillation or A-Fib.


Hypertension Background and Definition

The prevalence of CKD has steadily increased over the past two decades, and was reported to affect over 13% of the U.S. population in 2004.  In 2009, more than 570,000 people in the United States were classified as having end-stage renal disease (ESRD), including nearly 400,000 dialysis patients and over 17,000 transplant recipients.  A patient is determined to have ESRD when he or she requires replacement therapy, including dialysis or kidney transplantation. A National Health Examination Survey (NHANES) spanning 2005-2006 showed that 29% of US adults 18 years of age and older were hypertensive, and of those with high blood pressure (BP), 78% were aware they were hypertensive, 68% were being treated with antihypertensive agents, and only 64% of treated individuals had controlled hypertension (12, 13). In addition, data from NHANES 1999-2006 estimated that 30% of adults 20 years of age and older have prehypertension, defined as an untreated SBP of 120-139 mm Hg or untreated DBP of 80-89 mmHg (12, 13).

Hypertension is the most important modifiable risk factor for coronary heart disease (the leading cause of death in North America), stroke (the third leading cause), congestive heart failure, end-stage renal disease, and peripheral vascular disease. The 2010 Institute for Clinical Systems Improvement (ICSI) guideline (14) on the diagnosis and treatment of hypertension indicates that systolic blood pressure (SBP) should be the major factor to detect, evaluate, and treat hypertension In adults aged 50 years and older. The 2013 joint European Society of Hypertension (ESH) (15) and the European Society of Cardiology (ESC) (16) guidelines recommend that ambulatory blood-pressure monitoring (ABPM) be incorporated into the assessment of cardiovascular risk factors and hypertension.

The JNC 7 (17) identifies the following as major cardiovascular risk factors:

  • Hypertension: component of metabolic syndrome
  • Tobacco use, particularly cigarettes, including chewing tobacco
  • Elevated LDL cholesterol (or total cholesterol ≥240 mg/dL) or low HDL cholesterol: component of metabolic syndrome
  • Diabetes mellitus: component of metabolic syndrome
  • Obesity (BMI ≥30 kg/m 2): component of metabolic syndrome
  • Age greater than 55 years for men or greater than 65 years for women: increased risk begins at the respective ages; the Adult Treatment Panel III used earlier age cut points to suggest the need for earlier action
  • Estimated glomerular filtration rate less than 60 mL/min
  • Microalbuminuria
  • Family history of premature cardiovascular disease (men < 55 years; women < 65 years)
  • Lack of exercise

The Eighth Report of the JNC (JNC 8), released in December 2013 no longer recommends just thiazide-type diuretics as initial therapy in most patients. In essence, the JNC 8 recommends treating to 150/90 mm Hg in patients over age 60 years; for everybody else, the goal BP is 140/90 (18).

Biomarkers Associated with Hypertension

The biomarkers associated with hypertension are for the most part derived from features that characterize the disordered physiology. We might first consider the measurement of blood pressure. Then it becomes necessary to analyze the physiological elements that largely contribute to blood pressure. Finally, there are several biomarkers that have loomed large as measures are myocardial function or myocardial cell death, and are also not independent of renal function, that are indicators of short term and long term cardiovascular status. Having already indicated the importance of measurement of pulse, diastolic and systolic blood pressure in the routine examination of physical status, which is related to cardiac output we shall pay attention to the pulse pressure and pulse wave velocity.    These were defined in the preceding discussion.  They are critically related to the development of hypertension and in the long term, they emerge significantly earlier than either congestive heart failure, chronic kidney disease, acute coronary syndrome, stroke, or cardio-renal syndrome.

Even though cardiovascular disease (CVD), the leading cause of death in developed countries, is not predicted by classic risk factors, there are elements of the risk factor association that need further exploration and will be dissected, such as activity level, obesity, lipids, diabetes mellitus, family history and stress.  Further analysis will point to endocrine and/or metabolic factors that drive cardiovascular risk.

In taking into account the blood pressure measurements, we consider the pulse pressure (PP) and the pulse wave velocity (PWV).  If we refer back to the stroke volume and the Law of the Heart, the systolic blood pressure (SBP) is increased with increased left ventricular output that raises the left ventricular (LV) afterload. This coincides with a decrease in diastolic pressure (DBP) that accompanies a change in coronary artery perfusion (CAP).  Thus, many studies point to increased SBP as a strong risk factor for stroke and CVD.  However, there are sufficient studies that indicate the brachial artery pulse pressure (PP) is a strong determinant of CVD and stroke, and these two elements, SBP and brachial artery PP, may be an indicator of increased arterial stiffness in hypertensive patients and the general population. Brachial PP is also a determinant of recurrent events after acute coronary syndrome (ACS) or with left ventricular hypertrophy (LVH), or the risk of CHF in the aging population, and of all-cause-mortality in the general population.  In addition, the aortic PWV calculated from the Framingham equations was a suitable predictor of CVD risk. In a classic study of arterial stiffness and of CVD and all-cause mortality in an essential hypertension cohort at the Broussais Hospital between 1980 and 1996 (19), the carotid-femoral PWV was measured as an indicator of aortic stiffness, and it was found to be significantly associated with all-cause and CVD mortality independent of previous CVD, age, and diabetes. They tested the hypothesis that aortic stiffness is a predictor of cardiovascular and all-cause mortality in hypertensive patients based on the consideration that the elastic properties of the aorta and central arteries are the major determinants of systemic arterial impedance, and the PWV measured along the aortic and aorto-iliac pathway is the most clinically relevant. They assessed arterial stiffness by measuring the PWV using  the Moens-Korteweg equation based on the increase of the square root of the elasticity modulus in stiffer arteries (20).

PWV as a Diagnostic Test

To assess the performance of PWV considered as a diagnostic test, with the use of receiver operating characteristic (ROC) curves, they calculated sensitivities, specificities, positive predictive values, and negative predictive values of PWV at different cutoff values, first to detect the presence of AA in the overall population and second to detect patients with high 10-year cardiovascular mortality risk in the subgroup of 462 patients without AA with age range from 30 to 74 years. Optimal cutoff values of PWV were defined as the maximization of the sum of sensitivity and specificity.

The main finding of the study was that PWV was a strong predictor of cardiovascular risks as determined by the Framingham equations in a population of treated or untreated subjects with essential hypertension (21). They measured the PWV from foot-to-foot transit time in the aorta for a noninvasive evaluation of regional aortic stiffness, which allows an estimate of the distance traveled by the pulse. The presence of a PWV > 13 m/s, taken alone, appeared as a strong predictor of cardiovascular mortality with high performance values (21). Their work and other studies (22, 23) established increased pulse pressure, the major hemodynamic consequence of increased aortic PWV, as a strong independent predictor of cardiac mortality, mainly MI, in populations of normotensive and hypertensive subjects.

In addition to the findings above, the PWV was found to be an independent predictor of future increase in SBP and of incident hypertension in the Baltimore study (21). The authors reported that in a subset of 306 subjects who were normotensive at baseline, hypertension developed in 105 (34%) during a median follow-up of 4.3 years (range 2 to 12 years). PWV was also an independent predictor of incident hypertension (hazard ratio 1.10 per 1 m/s increase in PWV, 95% confidence interval 1.00 to 1.30, p = 0.03) in individuals with a follow-up duration greater than the median. The authors (21) concluded that carotid-femoral PWV measured using nondirectional transcutaneous Doppler probes (model 810A, 9 to 10-Mhz probes, Parks Medical Electronics, Inc., Aloha, Oregon) could be done to identify normotensive individuals who should be targeted for the implementation of interventions aimed at preventing or delaying the progression of subclinical arterial stiffening and the onset of hypertension.  They reported that age, BMI, and MAP were independently associated with higher SBP on the last visit (Table IV); in addition, PWV was also independently associated with higher SBP on the last visit, and explained 4% of its variance. As shown in Table V, age, BMI, and MAP (p = 0.09, p = 0.009, p < 0.0001 respectively for the interaction terms with time) were predictors of the longitudinal changes in SBP. In addition, PWV was also an independent predictor of the longitudinal increase in SBP (p = 0.003 for the interaction term with time).

In addition, they report that in the group with follow-up duration greater than the median (in which all subjects remained normotensive for the first 4.3 years), beyond age (hazard ratio [HR] 1.02 per 1 year, 95% confidence interval [CI] 0.99 to 1.04, p = 0.2) and SBP (HR 1.05 per 1 mm Hg, 95% CI 1.01 to 1.09, p = 0.006), both HDL (HR 0.96 per 1 mg/dl, 95% CI 0.93 to 0.99, p = 0.02) and PWV (HR 1.10 per 1 m/s, 95% CI 1.00 to 1.30, p = 0.03) (Fig. 1) were independent predictors of incident HTN.

Their findings in a longitudinal projection indicate that PWV, a marker of central arterial stiffening, is an independent determinant of longitudinal SBP increase in healthy BLSA volunteers, and an independent risk factor for incident hypertension among normotensive subjects followed up for longer than 4 years. The study was accompanied by a commentary in the same journal that states: “Pulse wave velocity (PWV) is a simple measure of the time taken by the pressure wave to travel over a specific distance. By virtue of its intrinsic relation to the mechanical properties of the artery by the Moens–Kortweg formula (PWV=√(Eh/2)Rρ; where E is the Young’s Modulus of the arterial wall, h the wall thickness, R the end- diastolic radius and ρ is the density of blood)(20), and buoyed a number of longitudinal studies that reported on the independent predictive value of PWV measurement for cardiovascular events and mortality in various populations, PWV is now widely accepted as the ‘gold standard’ measure of arterial stiffness.


Table IV Multiple Regression Analysis Evaluating the Predictors of Last Visit SBP 21

Variable Parameter
Estimate
Standard
Error
p Value
Age (yrs) 0.32 0.06 <0.0001
Gender (men) 0.65 1.78 0.71
Race (white) −1.22 2.00 0.54
Smoking (ever) 2.48 1.61 0.12
BMI (kg/m2)* 0.61 0.22 0.006
MAP (mm Hg)* 0.60 0.08 <0.0001
PWV (m/s)* 1.56 0.38 <0.0001
Heart rate (beats/min) 0.08 0.06 0.20
Total cholesterol (mg/dl) −0.005 0.02 0.83
Triglycerides (mg/dl) −0.009 0.01 0.50
HDL cholesterol (mg/dl) −0.001 0.07 0.98
Glucose (mg/dl) −0.02 0.06 0.75


Table V Predictors of Longitudinal SBP Derived From a Linear Mixed-Effects Regression Model 21

Variable Coefficient Standardized

Coefficient

95% Confidence

Interval

p Value
Time (yrs) 3.14 0.14 0.61 to 5.66 0.02
Age (yrs) −0.37 0.25 −0.68 to −0.06 0.02
Age2 (yrs2)* 0.006 0.08 0.002 to 0.008 <0.0001
Gender (men) 0.61 0.03 −1.26 to 2.47 0.52
BMI (kg/m2)* 0.25 0.11 −0.01 to 0.50 0.06
MAP (mmHg)* 1.03 0.47 0.93 to 1.12 <0.0001
PWV (m/s) 0.29 0.12 −0.16 to 0.74 0.21
Time × age* 0.02 0.04 −0.002 to 0.038 0.09
Time × BMI* 0.10 0.06 0.02 to 0.183 0.009
Time × MAP* −0.08 −0.12 −0.11 to −0.05 <0.0001
Time × PWV* 0.22 0.08 0.07 to 0.36 0.003


Figure 1 21

http://content.onlinejacc.org/data/Journals/JAC/23115/10065_gr1.jpeg

Figure 2.21

http://content.onlinejacc.org/data/Journals/JAC/23115/10065_gr2.jpeg

The interest in this physiological measure is illustrated by the increasing number and diversity of research publications in this arena related to human hypertension, relating PWV to pathophysiological processes (for example, homocysteine, inflammation and extracellular matrix turnover and disorders related to hypertension, such as sleep apnea). The epidemiology, genetic associations and prognostic implications of PWV (and arterial stiffness) have also been reported as has the relationship to hemodynamics, cardiac structure and function.” (24) Furthermore, arterial stiffening may be “characterized by an increase in (central) PP and changes in the morphology of the arterial waveform, both of which can now be measured non-invasively using tonometers from commercially available devices. Wave reflection is typically characterized by aortic pressure augmentation (ΔP) and the augmentation index (ΔP/PP) (Figure 3)(24). Higher augmented pressure, as an index of wave reflection, has been linked to adverse clinical outcomes in different populations.

Figure 3.24

Analysis of the pressure waveform. The initial systolic pressure is labelled as P1 and augmented pressure ( P) is typically measured as the difference between peak pressure (P2) and P1. Augmentation index is  P/PP. PP, pulse pressure.    http://www.nature.com/jhh/journal/v22/n10/images/jhh200847f1.gif 24

A review by Payne et al. (25) states that aortic stiffness and arterial pulse wave reflections determine elevated central systolic pressure and are associated with risk of adverse cardiovascular outcomes. This is because an impaired compensatory mechanism through matrix metalloproteinases of remodeling to compensate for changes in wall stress, possibly related to angiotensin II and inhibition of the vascular adhesion protein semicarbazide-sensitive amine oxidase, related to reduced elastin fiber cross-linking. This has implications for pharmacological agents that target age-related advanced glycation end-product cross-links. This also brings into consideration NO playing a considerable role. But they caution that the endogenous NO synthase inhibitors asymmetric dimethylarginine and L-NG-monomethyl arginine associated with clinical atherosclerosis don’t appear to be associated with arterial stiffening. The matter leaves much to be explained.  The mechanisms underlying arterial stiffness could well require insights into inflammation, calcification, vascular growth and remodeling, and endothelial dysfunction. Nevertheless, arterial stiffness is independently associated with cardiovascular outcome in most of the situations where it has been examined.  Given this train of thinking, O’Rourke (26) considers a progressive arterial dilatation with repeated cycles of stress that leads to degeneration of the arterial wall and increases the pressure wave impulse and wave velocity, augmenting the pressure in late systole. Drugs may reduce wave reflection, but have no direct effect on arterial stiffness.  However, reduction in wave reflection decreases aortic systolic pressure augmentation.  DK Arnett (26) depicts the effect of persistently elevated blood pressure in the following diagram (Figure 4).


Figure 4.26  Both transient and sustained stiffening of the artery are likely to be present in hypertension.

An initial elevation in blood pressure may establish a positive feedback in which hypertension biomechanically increases arterial stiffness without any structural change. This elevated blood pressure   might later lead to additional vascular hypertrophy and hyperplasia, collagen deposition, and atherosclerosis, and fixed elevations in arterial stiffness.  As to a genetic factor, she refers to a gene contributing to pulse pressure on chromosome 8 located at 32 cM, which also contains the lipoprotein lipase (LPL) gene which has been associated with hypertension. LPL may be an important candidate gene for pulse pressure.  She specifically identifies a relationship between genetic regions contributing to aortic compliance in African American sibships ascertained for hypertension in Figure 5 (27).  These results suggest there may be influential genetic regions contributing to aortic compliance in African American sibships ascertained for hypertension (27). Collectively, these two studies, the first to our knowledge, indicate the presence of genetic factors influencing hypertension.

Other authors state that PWV has a direct relationship to intrinsic elasticity of the arterial wall, and it is an independent predictor of CVD related morbidity and mortality, but it is not associated with classical risk factors for atherosclerosis (28).  They point out that PWV doesn’t increase during early stages of atherosclerosis, as measured by intima-media thickness and non-calcified atheroma, but it does increase in the presence of aortic calcification that occurs with advanced atherosclerotic plaque. Age-related
PWV measurement. Carotid-to-femoral PWV is calculated by dividing the distance (d) between the two arterial sites by the difference in time of pressure wave arrival between the carotid (t1) and femoral artery (t2) referenced to the R wave of the electrocardiogram.

Figure 5. Linkage of arterial compliance on chromosome 2: HyperGEN27

Widening of the pulse pressure is the major cause of age-related increase in prevalence of hypertension and is related to arterial stiffening. (28)  Commonly used points for measuring the PWV are the carotid and femoral artery because they are superficial and easy to access. Arterial distensibility is measured by the Bramwell and Hill equation (29): PWV = √(V × ΔP/ρ × ΔV), where ρ is blood density. This is shown in Figure 6.


Figure 6 28


View larger version:


Furthermore, these authors (28) report arterial stiffness increases with age by approximately 0.1 m/s/y in East Asian populations with low prevalences of atherosclerosis, but some authors have found accelerated stiffening between 50 and 60 years of age. In contrast, stiffness of peripheral arteries increases less or not at all with increasing age. Again, ageing of the arterial media is associated with increased expression of matrix metalloproteinases (MMP), which are members of the zinc-dependent endopeptidase family and are involved in degradation of vascular elastin and collagen fibers. Several different types of MMP exist in the vascular wall, but in relation to arterial stiffness, much interest has focused on MMP-2 and MMP-9.  This concludes the discussion of PP and PWV in the evolution of hypertension.


Diagnostic Biomarkers of essential hypertension.

Ioannidis and Tzoulaki (30) reviewed the literature on 10 popular ‘‘new’’ biomarkers and found that each one had accrued more than 6000 publications.1 The predictive effects of these popular blood biomarkers for coronary heart disease in the general population are listed in Table VI (31).


Table VI.* Predictive Value of New Biomarkers 30,31

Biomarker Adjusted Relative Risk (95% C.I.)
Triglycerides 0.99 (0.94–1.05)
C-reactive protein 1.39 (1.32–1.47)
Fibrinogen 1.45 (1.34–1.57)
Interleukin 6 1.27 (1.19–1.35)
BNP or NT-proBNP 1.42 (1.24–1.63)
Serum albumin 1.2 (1.1–1.3)
ICAM-1 (0.75–1.64)
Homocysteine 1.05 (1.03–1.07)
Uric acid 1.09 (1.03–1.16)

*Ionnidis and Tzoulaki from Giles
The majority of these biomarkers show small effects, if any, even in combination.  Giles (31) points out that an elevated homocysteine level might be of great importance to a young person with a myocardial infarction and a positive family history of similar occurrences. Emerging biomarkers, eg, asymmetric and symmetric dimethylarginine and galectin-3, are promising more specific biomarkers based on pathophysiologies for cardiovascular disease. Even then, blood pressure remains the biomarker par excellence for hypertension and for many other cardiovascular entities.

The importance of blood pressure was highlighted by the report of the cardiovascular lifetime risk pooling project.(10) Starting at 55 years of age, 61,585 men and women were followed over an average of 14 years, ie, 700,000 person-years. Individuals who maintained or decreased their blood pressure to normal levels had the lowest remaining lifetime risk for cardiovascular disease (22–41%) compared with individuals who had or developed hypertension by 55 years of age (42–69%). The study indicated that efforts should continue to emphasize the importance of lowering blood pressure and avoiding or delaying the incidence of hypertension to reduce the lifetime risk for cardiovascular disease

A small study involving 120 hypertensive patients with or without heart failure tried to establish a multi-biomarker approach to heart failure (HF) in hypertensive patients using N-terminal pro BNP (32). The following biomarkers were included in the study: Collagen III N-terminal propeptide (PIIINP), cystatin C (CysC), lipocalin-2/NGAL, syndecan-4, tumor necrosis factor-α (TNF-α), interleukin 1 receptor type I (IL1R1), galectin-3, cardiotrophin-1 (CT-1), transforming growth factor β (TGF-β) and N-terminal pro-brain natriuretic peptide (NT-proBNP). The highest discriminative value for HF was observed for NT-proBNP (area under the receiver operating characteristic curve (AUC) = 0.873) and TGF-β (AUC = 0.878). On the basis of ROC curve analysis they found that CT-1 > 152 pg/mL, TGF-β < 7.7 ng/mL, syndecan > 2.3 ng/mL, NT-proBNP > 332.5 pg/mL, CysC > 1 mg/L and NGAL > 39.9 ng/mL were significant predictors of overt HF. There was only a small improvement in predictive ability of the multi-biomarker panel including the four biomarkers with the best performance in the detection of HF (NT-proBNP, TGF-β, CT-1, CysC) compared to the panel with NT-proBNP, TGF-β and CT-1 (absent  CysC). The biomarkers with different pathophysiological backgrounds (NT-proBNP, TGF-β, CT-1) give additive prognostic value for incident compared to NT-proBNP alone.

Inflammation has been associated with pathophysiology of hypertension and vascular damage. Resistant hypertensive patients (RHTN) have unfavorable prognosis due to poor blood pressure control and higher prevalence of target organ damage. Endothelial dysfunction and arterial stiffness are involved in such condition. Previous studies showed that RHTN patients have higher arterial stiffness and endothelial dysfunction than controlled hypertensive and normotensive subjects. The relationship between high blood pressure levels and arterial stiffness may be explained in part, by inflammatory pathways. Previous studies also found that hypertensive subjects have higher levels of inflammatory cytokines including TNF-α, IL-10, IL-1β and CRP. Moreover, IL-1β correlates with arterial stiffness and levels of blood pressure, which are particularly high in patients with resistant hypertension. Increased inflammatory cytokines levels might be related to the development of vascular damage and to the higher cardiovascular risk of resistant hypertensive patients. Elevated BP may cause cardiovascular structural and functional alterations leading to organ damage such as left ventricular hypertrophy, arterial and renal dysfunction. TNF-α inhibition reduced systolic BP and endothelial inflammation in SHR [33]. They also found that IL-1β correlates with arterial stiffness and levels of blood pressure, even after adjust for age and glucose [33]. These investigators then demonstrated that isoprostane levels, an oxidative stress marker, were associated with endothelial dysfunction in these patients [33].

Chao et al. carried out studies of kallistatin (34-36). Kallistatin is an endogenous protein in human plasma as a tissue Kallikrein-Binding Protein (KBP). Tissue kallikrein is a serine protease that releases vasodilating kinin peptides from kininogen substrate. The tissue kallikrein-kinin system is involved in mediating beneficial effects in hypertension as well as cardiac, cerebral and renal injury. KBP was later identified as a serine protease inhibitor (serpin) because of its ability to inhibit tissue kallikrein activity, and was subsequently named “kallistatin”. Kallistatin is mainly expressed in the liver, but is also present in the heart, kidney and blood vessel. Kallistatin protein contains two structural elements: an active site and a heparin-binding domain. The active site of kallistatin is crucial for complex formation with tissue kallikrein, and thus tissue kallikrein inhibition.

Kallistatin is expressed in tissues relevant to cardiovascular function, and has consequently been shown to have vasodilating properties.  Kallistatin has pleiotropic effects in vasodilation and inhibition of inflammation, angiogenesis, oxidative stress, fibrosis, and cancer progression. Injection of a neutralizing Kallistatin antibody into hypertensive rats aggravates cardiovascular and renal injury in association with increased inflammation, oxidative stress and tissue remodeling.  Neither the blood pressure-lowering effect nor the vasorelaxation ability of kallistatin is abolished by icatibant (Hoe140, a kinin B2 receptor antagonist), indicating that kallistatin-mediated vasodilation is unrelated to the tissue kallikrein-kinin system.

The findings reported indicate that kallistatin exerts beneficial effects against hypertension and organ damage. Kallistatin levels in circulation, body fluids or tissues were lower in patients with liver disease, septic syndrome, diabetic retinopathy, severe pneumonia, inflammatory bowel disease, and cancer of the colon and prostate. In addition, reduced plasma kallistatin levels are associated with adiposity and metabolic risk in apparently healthy African American youths. Considered a negative acute-phase protein, circulating kallistatin levels as well as hepatic expression are rapidly reduced within 24 hours after Lipopolysaccharide (LPS) induced endotoxemia in mice. Similarly, circulating kallistatin levels are markedly decreased in patients with septic syndrome and liver disease. Taking together, the studies indicate that kallistatin exhibits potent anti-inflammatory activity.

The pathogenesis of hypertension and cardiovascular and renal diseases is tightly linked to increased oxidative stress and reduced NO bioavailability (37-39). Time-dependent elevation of circulating oxygen species are associated with reduced kallistatin levels in animal models of hypertension and cardiovascular and renal injury. Stimulation of NO formation by kallistatin may lead to inhibition of oxidative stress and thus multi-organ damage. On the other hand, endogenous kallistatin depletion by neutralizing antibody increased oxidative stress and aggravated cardiovascular and renal damage.

A human kallistatin gene polymorphism has been shown to correlate with a decreased risk of developing acute kidney injury during septic shock. Kallistatin levels are markedly reduced in both humans and mice with sepsis syndrome. However, kallistatin administration protects against lethality and organ injury in animal models of toxic septic shock. Moreover, kallistatin levels are decreased in patients with liver disease, septic shock, inflammatory bowel disease, severe pneumonia and acute respiratory distress syndrome. Taken together, the results indicate that kallistatin has the potential to be a molecular biomarker for patients with sepsis, cardiovascular and metabolic disorders.

Pulmonary hypertension (PH) is defined as a mean pulmonary artery pressure of .25 mmHg at rest or .30 mmHg with exercise. Right heart catheterization is required for the definitive diagnosis. Subsequent investigations are instituted to further characterize the disease. The 6-min walk test (6MWT), a measure of exercise capacity, and the New York Heart Association (NYHA)/World Health Organization (WHO) functional classification, a measure of severity, are used to follow the clinical course while receiving treatment, and these both correlate with disease severity and prognosis (43).

Pulmonary arterial hypertension (PAH) is a progressive disease of the pulmonary vasculature that leads to exercise limitation, right heart failure, and death. There is a need for biomarkers that can aid in early detection, disease surveillance, and treatment monitoring in PAH. Several potential molecules have been investigated; however, only brain natriuretic peptide is currently recommended at diagnosis and for follow-up of PAH patients.

ANP is released from storage granules in atrial tissue, while BNP is secreted from ventricular tissue in a constitutive fashion. ANP secretion is stimulated by atrial stretch caused by atrial volume overload; BNP is released in response to ventricular stretch. Natriuretic peptides act on the kidney, causing natriuresis and diuresis, and relax vascular smooth muscle, causing arterial and venous dilatation, leading to reduced blood pressure and ventricular preload. ANP and BNP are released as prohormones and then cleaved into the active peptide and an inactive N-terminal fragment (43).

Natriuretic peptide precursors are released in response to atrial and ventricular stretch, cleaved into active molecules and inactive precursors and convert guanosine 59-triphosphate (GTP) to cyclic guanosine monophosphate (cGMP), leading to their various physiological actions.

There are a number of confounding factors in the interpretation of natriuretic peptide levels, including left heart disease, sex, age and renal dysfunction. Since most studies exclude patients with left heart disease and renal dysfunction, it becomes problematic extrapolating these results to an unselected population (43).

Endothelin-1 (ET-1) is a peptide found in abundance in the human lung and, through action of endothelin receptors (ETA and ETB) on vascular smooth muscle cells, is implicated in the pathogenesis of PAH. Endothelin receptor antagonists are approved for the treatment of PAH. Levels of circulating ET-1 and related molecules are logical biomarkers of interest in PAH. ET-1 is elevated in PAH compared to controls, and correlates with pulmonary hemodynamic parameters. In addition, higher ET-1 levels are associated with increased mortality in patients treated for PAH. ET-1’s precursor, big-ET-1, has a longer half-life and hence is more stable than ET-1.

Endothelin-1 ET-1 is a potent endogenous vasoconstrictor and proliferative cytokine. The ET-1 gene is translated to prepro-ET-1 which is then cleaved, by the action of an intracellular endopeptidase, to form the biologically inactive big ET-1. ET-converting enzymes further cleave this to form functional ET-1 . There are two ET receptor isoforms, termed type A (ETA), located predominantly on vascular smooth muscle cells, and type B (ETB), predominantly expressed on vascular endothelial cells but also on arterial smooth muscle. Activation of both receptor subtypes, when located on vascular smooth muscle, results in vasoconstriction and cell proliferation. In addition, the endothelial ETB receptor mediates vasodilatation and clearance of ET-1 (43).

Prepro-ET-1 is cleaved to inactive big ET-1 and then further cleaved to form active ET-1. This acts on vascular smooth muscle via the ETA and ETB receptors, causing vasoconstriction and cell proliferation, and on endothelial cells via ETB receptors, releasing nitric oxide (NO) and prostacyclin (PGI2), causing vasorelaxation.

As a biomarker, ADMA has been evaluated in several different classes of PH (43, 44). In IPAH, plasma levels are significantly higher than in healthy, matched controls. In such patients, plasma ADMA correlates positively with right atrial pressure, and negatively with mixed venous oxygen saturation, stroke volume, cardiac index and survival. On stepwise multiple regression analysis, ADMA is an independent predictor of mortality and, using Kaplan–Meier survival curves, patients with supramedian ADMA levels have significantly worse survival than those with inframedian levels.

Patients with idiopathic PAH, plasma levels of Ang-1 and Ang-2 were higher in PAH patients as compared to healthy controls.  Moreover, higher plasma levels of Ang-2 were associated with lower CI and mixed venous oxygen saturation (SvO2) and higher PVR, and, with therapy initiation, changes in Ang-2 correlated with changes in hemodynamics (45, 46).

Endostatin is an antiangiogenic peptide. It is synthesized by myocardium, is detectable in the peripheral circulation of patients with decompensated heart failure, and predicts mortality.48 In PAH, reduced RV myocardial oxygen delivery is felt to contribute to a transition from RV adaptation to failure (46).

Cyclic guanosine monophosphate (cGMP) is an intracellular second messenger of nitric oxide and an indirect marker of natriuretic peptide production (46).

Human pentraxin 3 (PTX3) is a protein synthesized by vascular cells that regulates angiogenesis, inflammation, and cell proliferation (46).

N-terminal propeptide of procollagen III (PIIINP), carboxy-terminal telopeptide of collagen I (CITP), matrix metalloproteinase-9 (MMP-9), and tissue inhibitor of metalloproteinase I (TIMP-1)(46).

Osteopontin (OPN) is a matricellular protein that mediates cell migration, adhesion, remodeling, and survival of the vascular and inflammatory cells (46).

F2-isoprostane is a marker of lipid peroxidation of arachidonic acid, which stimulates endothelial cell proliferation and ET-1 synthesis and may play a role in the pathogenesis of PAH (46).

Circulating fibrocytes are bone marrow-derived cells (CD45 /collagen I ) that contribute to organ fibrosis and extracellular matrix deposition (46).

Circulating miRs (46)

Despite many other substances being investigated as potential biomarkers in PAH, more research is needed to validate the results of small studies and assess their clinical utility. Widespread clinical use of current investigational biomarkers will require validated clinical laboratory techniques and increased knowledge of levels in the healthy population as well as other disease states.

Here are important tests in clinical practice (47):


6-min walk distance

Cardiac index

WHO FC

PIIINP

Higher tertiles associated with worse disease

worse renal function

higher right atrial pressure (RAP)

CITP – vascular remodeling


Recent guidelines (17, 18) encourage the use of screening examinations, such as an echocardiogram (UCG), in high-risk populations for the early detection of PAH . To detect PAH in patients with connective tissue disease (CTD), the obvious screening tests are an UCG and spirometry, including assessment of the diffusing capacity of the lung for carbon monoxide (DLCO). Previous studies have suggested that B-type natriuretic peptide (BNP) and its N-terminal prohormone (NT-proBNP) are potential biomarkers for PAH. However, neither BNP nor NT-pro BNP are specific biomarkers of the degeneration of the pulmonary artery; rather, they are biomarkers of cardiac burden resulting from right heart failure.

Human pentraxin 3 (PTX3) is a specific biomarker for PAH, reflecting pulmonary vascular proteins. They are divided into short and long pentraxins on the basis of their primary structure.
C-Reactive protein (CRP) and serum amyloid P are the classic short pentraxins that are produced in the liver in response to systemic inflammatory cytokines (48). In contrast, PTX3 is one of the long pentraxins. It is synthesized by local vascular cells, such as smooth muscle cells, endothelial cells and fibroblasts, as well as innate immunity cells at sites of inflammation. PTX3 plays a key role in the regulation of cell proliferation and angiogenesis (49).

Increased plasma PTX3 levels have been reported in patients with acute myocardial injury in the
24 h after admission to hospital, with levels returning to normal after 3 days. Similarly, PTX3 levels are higher in patients with unstable angina pectoris, with the changes in PTX3 levels found to be independent of other coronary risk factors, such as obesity and diabetes mellitus. Finally, high serum PTX3 levels have been reported in patents with vasculitis, such as small-vessel vasculitis  and Takayasu aortitis.

Mean plasma PTX3 concentrations in the CTD-PAH and CTD patients were 5.02+0.69 ng/mL (range 1.82–12.94 ng/mL) and 2.40+0.14 ng/mL (range 0.70–4.29 ng/mL), respectively (Table 2). Log transformation of the data revealed significantly higher PTX3 levels in CTD-PAH than in CTD patients (1.49+0.12 vs. 0.82+0.06 log ng/mL, respectively; P = 0.001).(not shown)(50)

Figure 1. Serum pentraxin 3 (PTX3) concentrations in 50 patients with pulmonary arterial hypertension (PAH) and 100 healthy controls, and their correlation with serum concentrations of other biomarkers. A: Comparison of PTX3 concentrations in PAH patients and healthy controls. Mean plasma PTX3 concentrations were 4.4060.37 and 1.94+0.09 ng/mL in the controls and PAH patients, respectively. B: Distribution of log-transformed PTX3 concentrations in PAH patients and healthy controls. C: Log-transformed PTX3 concentrations were significantly higher in patients with PAH than in healthy controls (1.34+0.07 vs. 0.55+0.05 log ng/mL, respectively; P,0.001). D, E: There was no correlation between plasma concentrations of PTX3 and either B-type natriuretic peptide (BNP; r=0.33, P=0.02) or C-reactive protein (CRP; r=0.21, P=0.14) in PAH patients. (not shown) (50)


Table 2. Clinical characteristics and biomarkers in patients with connective tissue disease, with or without pulmonary arterial hypertension.

CTD-PAH ( n =17)                CTD alone ( n =34)       P -value

Age (years)                                 56.3+4.6                                 56.3+2.7               0.990

No. women (%)                         15 (88)                                      31(91)                  0.745

No. with SSc (%)                       10 (59)                                      20 (59)                    1

No. with heart failure (%)          1 (6)                                         0                            –

No. being treated for PAH (%)   17 (100)                                  0                           –

Serum PTX3 (mg/dL)                   5.02+0.69                          2.40+0.14             0.001

Serum CRP (mg/dL)                   0.24+0.09                            0.22+0.04             0.936

Serum BNP (pg/mL)                 189.3+74.                            4 49.3+12.1            0.014

…..  CTD, connective tissue disease; PAH, pulmonary arterial hypertension; SSc, scleroderma;

Figure 3. Receiver operating characteristic (ROC) curves for pentraxin 3 (PTX3) and other biomarkers in patients with connective tissue disease (CTD). The areas under the ROC curve (AUCROC) for PTX3 was 0.866 (95% confidence interval (CI) 0.757–0.974). The star indicates the threshold concentration of 2.85 ng/mL PTX3 that maximized true-positive and false-negative results (sensitivity 94.1%, specificity 73.5%). The AUCROC for C-reactive protein (CRP) was 0.518 (95% CI 0.333–0.704), whereas that for B-type natriuretic peptide (BNP) was 0.670 (95% CI 0.497–0.842). (50)  http://dx.doi.org:/10.1371/journal.pone.0045834.g003

This study was to determine whether PTX3, the regulation of which is independent of that of the systemic inflammatory marker CRP, is a useful biomarker for diagnosing PAH. The investigators found that PTX3 may be a more sensitive biomarker for PAH than BNP, which is, to date, the most established biomarker for PAH, especially in patients with CTD-PAH. Their findings suggest that PTX3 does not reflect the cardiac burden due to the pulmonary hypertension, but rather the activity of pulmonary vascular degeneration because PTX3 levels were significantly decreased after active treatment specifically for PAH (50). PLoS ONE 7(9): e45834. http://dx.doi.org:/10.1371/journal.pone.0045834.

Pharmacologic treatment for pulmonary arterial hypertension (PAH) remains suboptimal and mortality rates are still high, even with pulmonary vasodilator therapy. In addition, we have only an incomplete understanding of the pathobiology of PAH, which is characterized at the tissue level by fibrosis, hypertrophy and plexiform remodeling of the distal pulmonary arterioles. Novel therapeutic approaches that might target pulmonary vascular remodeling, rather than pulmonary vaso-reactivity, require precise patient phenotyping both in terms of clinical status and disease subtype. However, current risk stratification models are cumbersome and not precise enough for choosing or assessing the results of therapeutic intervention. Biomarkers used in patients with left heart failure, such as troponin-T and N-terminal pro-B-type natriuretic peptide (NT-proBNP) are elevated in PAH patients but tend to simply reflect increased circulating plasma volumes and elevated right heart pressure, rather than conveying information about disease mechanism.

In this issue of Heart, Calvier and colleagues (see page 390) (51)propose galectin-3 as a useful biomarker in PAH. The rationale for this hypothesis is that elevated aldosterone levels induce an increase in serum levels of galectin-3, a β-galactoside-binding lectin expressed by circulating myocytes, endothelial cells and other cardiovascular cell types. Among other effects, activation of the aldosterone/galactin-3 pathway promotes fibrosis (51), suggesting that elevated levels will correlate with the severity of PAH due to increased pulmonary arteriolar remodeling. To test this hypothesis, serum levels were measured in a total of 57 patients – 41 with idiopathic PAH (iPAH) and 16 with PAH associated with a connective tissue disorder (CTD). The magnitude of elevation in serum levels of aldosterone, galectin-3 and NT-proBNP each correlated with the severity of PAH. However, as shown in figure 1, although serum levels of galectin-3 were elevated in both iPAH and PAH-CTD patients, aldosterone was elevated only in those with iPAH.

In addition, elevated vascular cell adhesion molecule 1 (VCAM-1) and proinflammatory, anti-angiogenic interleukin 12 (IL-12) in were elevated only in PAH-CTD patients, not in those in iPAH. These data suggest that aldosterone and galectin-3 can be used as biomarkers “in tandem” that reflect both the severity and cause of PAH (52).

In the accompanying editorial, Maron (see page 335) summarizes the knowledge gaps in PAH and concludes: “Taken together, Calvier and colleagues provide a key contribution to an underdeveloped area of pulmonary vascular medicine and in doing so identify galectin-3/aldosterone as promising biomarker(s) for informing both disease pathobiology and clinical status in PAH. The rationale of this pursuit in PAH was based, in part, on lessons earned from left heart failure in which the importance of systemically circulating vasoactive factors to clinical trajectory is well established. In this regard, the current work not only develops a novel scientific avenue worthy of further investigation, but also adds to the evolving body of evidence implicating a role for neurohumoral activation in the pathophysiology of PAH”.

Rheumatoid arthritis (RA) affects about 1% of the population and is known to be a significant risk factor for cardiovascular disease, with a 3-fold increased risk of myocardial infarction, a 2-fold increased risk of sudden death and a 50% increase in cardiovascular mortality rates. However, outcomes after PCI in RA patients have not been well characterized and there is little data on the possible effects of disease modifying therapy for RA on risk of restenosis after percutaneous coronary intervention (PCI). In a single center retrospective cohort study, Sintek and colleagues (53)(see page 363) compared the primary endpoint of repeat target vessel revascularization (TVR) in 143 RA patients matched to 541 other.

Pathophysiological targets of differing imaging modalities, demonstrate targets for tracers/contrast agents/pharmacotherapy used in SPECT, PET, MRI and echocardiography to assess myocardial viability.  (Not shown. Adapted from Schuster et al., J Am Coll Cardiol 2012; 59:359–70.)

Ischemic cardiomyopathy implies significant left ventricular systolic dysfunction with an underlying pathophysiology that includes myocardial scarring, hibernation and stunning, or a combination of these disease states. The role of imaging in assessment of myocardial viability is emphasized (not shown) (54) with brief summaries of the role of echocardiography, single photon emission computed tomography (SPECT), positron emission tomography (PET), and magnetic resonance imaging (MRI). The effects of revascularization in patients with ischemic cardiomyopathy remain controversial. Instead, the key elements of evidence based therapy for ischemic cardiomyopathy are standard medical therapy for heart failure combined with implantable cardiac defibrillation (ICD) and/or biventricular pacing device therapy in appropriate patients.

The relationship between the heart and the kidney in hypertension and heart failure

Hypertension is undoubtedly a factor in the treatment of chronic kidney disease because of the relationship between kidney function and BP components that have been studied in people with CKD, diabetes, and hypertension.  Cystatin C was used to evaluate the association between kidney function and both SBP and DBP and 24-h creatinine clearance (CrCl) among 906 participants in the Heart and Soul Study.  (56).  The study investigators hypothesized that although both creatinine and cystatin C are freely filtered at the glomerulus, a major difference between them is that creatinine is secreted by renal tubules, whereas cystatin C is metabolized by the proximal tubule and only a small fraction appears in the urine. In addition, Cystatin C has also been shown to be a stronger predictor of adverse outcomes than serum creatinine. Based on the more linear relationship of cystatin C with GFR, they hypothesized that cystatin C would have a stronger association with SBP than conventional measures of kidney function. Their results found that SBP was linearly associated with cystatin C concentrations (1.19 ± 0.55 mm Hg increase per 0.4 mg/L cystatin C, P = .03) across the range of kidney functions, but only in subjects with CrCl <60 mL/min (6.4 ± 2.13 mm Hg increase per 28 mL/min, P = .003), not >60 mL/min. Further, the DBP was not associated with cystatin C or CrCl. However, PP was linearly associated with both cystatin C (1.28 ± 0.55 mm Hg per 0.4 mg/L cystatin, P = .02) and CrCl <60 mL/min (7.27 ± 2.16 mm Hg per 28 mL/min, P = .001). The relationship between SBP and cystatin C by decile is shown in Figure 7 and Table 3.

Figure 7.

Mean systolic blood pressure (SBP) and diastolic blood pressure (DBP) by decile of kidney function measured as cystatin C. http://www.ncbi.nlm.nih.gov/pmc/articles/PMC2771570/bin/nihms-153474-f0001.jpg


Table 3

Linear regression of systolic blood pressure by kidney function (N = 906)

Age-adjusted Multivariable adjusted*
Measure N β coefficient P β coefficient P
Cystatin-C (per 0.4 mg/L [SD] increase) 1.75 ± 0.72 .01 1.19 ± 0.55 .03
    Overall
    >1.0 551 2.23 ± 0.07 .03 1.23 ± 0.03 .04
    <1.0 355 1.59 ± 0.04 .71 0.54 ± 0.01 .87
Spline P value for difference in slopes .85
24-h CrCl (per 28 mL/min [SD] decrease)
    Overall 1.96 ± 0.76 .01 0.91 ± 0.61 .14
    <60 222 11.20 ± 2.74 <.001 6.40 ± 2.13 .003
    >60 684 0.31 ± 0.99 .42 0.36 ± 0.77 .64
    Spline P-value for difference in slopes .01

The results for both Cystatin C and for eGFR are in agreement with incidence rates for heart failure (57)categorized by ejection fraction (EF) and kidney function over 1992−2000 in the Cardiovascular Health Study. Estimated glomerular filtration rate (mL/min per 1.73 m2) is labeled as “eGFR”. (http://www.ncbi.nlm.nih.gov/pmc/articles/PMC2258307/bin/nihms-39968-f0002.jpg).

The association of cystatin C with risk for SHF appeared linear across quartiles of cystatin C (57) and slightly stronger at the highest categories of cystatin C, whereas the lower three quartiles of cystatin C had similar risks for DHF. Participants with an estimated GFR ≥ 60 mL/min per 1.73 m2 had an equal likelihood of developing DHF or SHF, whereas participants with an estimated GFR < 60 mL/min per 1.73 m2 had a greater likelihood of developing SHF.

When an interaction term for HF type (SHF or DHF) was inserted into a fully adjusted standard Cox proportional hazards model with HF with either type of EF as the outcome, the association of continuous cystatin C with SHF was significantly greater than the association of cystatin C with DHF ( P value for interaction < 0.001). The association of estimated GFR and SHF compared with DHF was weaker (P value for interaction = 0.06 for the fully adjusted model).

Ascending quartiles of cystatin C were associated with increasing adjusted risk for the development of “unclassified” HF, defined by the absence of a point-of-care EF measurement. The magnitude of the fully adjusted hazard ratios for the association between cystatin C and risk of unclassified HF were intermediate between those described for DHF and SHF [hazard ratios (95% confidence intervals) for each higher quartile of cystatin C 1.00 (reference), 1.12 (0.80−1.57), 1.84 (1.34−2.51), 2.18 (1.58−3.00)]. The authors state that increased left atrial filling pressures trigger the release of atrial natriuretic peptide and inhibition of vasopressin, which leads to decreased renal sympathetic tone and diuresis early in the pathogenesis of HF (57).  They suggest that even relatively small decrements in k58idney function contribute to the risk of SHF.

Aldosterone plays a key role in homeostatic control and maintenance of blood pressure (BP) by regulation of extracellular volume, vascular tone, and cardiac output. Taking this assumption further, a study unrelated to that above explored the magnitude of the effect of relative aldosterone excess in predicting peripheral as well as aortic blood pressure in a cohort of patients undergoing coronary angiography.  (58) They found that mean peripheral systolic blood pressure (SBP) and diastolic blood pressure (DBP) of the entire cohort were 141 ± 24 mm Hg and 81 ± 11 mm Hg, respectively. Median SBP and aortic SBP increased steadily and significantly from aldosterone/renin ratio (ARR), respectively; p < 0.0001 for both) after multivariate adjustment for parameters potentially influencing BP. ARR emerged as the second most significant independent predictor (after age) of mean SBP and as the most important predictor of mean DBP in this patient cohort.  The authors stress the importance of the ARR in modulating BP over a much wider range than is currently appreciated, as it was already known that the ARR was positively associated with pulse wave velocity in young normotensive healthy adults, indicating that relative aldosterone excess might affect arterial remodeling and precede BP rise as a result of increased vascular stiffness. In this study the ARR was calculated as the PAC/PRC ratio (pg/ml/pg/ml). An ARR >50 pg/ml had a sensitivity and specificity of ARR of 89% and 96%, respectively, for primary aldosteronism. The ARR was modeled as a continuous ratio (with log-transformed values).  The study carried out a multivariate stepwise regression analysis for predictors of BP (not shown). They illustrate (not shown) that marked increases in PRC are a major characteristic of lower ARR categories, and that  across a broad range of ARR values, inappropriately elevated aldosterone levels exert a strong effect on BP values and constitute the most important and second-most important predictor of DBP and SBP, respectively.

Cystatin C may be ordered when a health practitioner is not satisfied with the results of other tests, such as a creatinine or creatinine clearance, or wants to check for early kidney dysfunction, particularly in the elderly, and/or wants to monitor known impairment over time. In diverse populations it has been found to improve the estimate of GFR when combined in an equation with blood creatinine. A high level in the blood corresponds to a decreased glomerular filtration rate (GFR) and hence to kidney dysfunction. Since cystatin C is produced throughout the body at a constant rate and removed and broken down by the kidneys, it should remain at a steady level in the blood if the kidneys are working efficiently and the GFR is normal.

Chronic kidney disease (CKD) is defined as the presence of: persistent and usually progressive reduction in GFR (GFR <60 mL/min/1.73 m2) and/or albuminuria (>30 mg of urinary albumin per gram of urinary creatinine), regardless of GFR. Cystatin C is an index of GFR, especially in patients where serum creatinine may be misleading (eg, very obese, elderly, or malnourished patients); for such patients, use of CKD-EPI cystatin C equation is recommended to estimate GFR. Cystatin C eGFR may have advantages over creatinine eGFR in certain patient groups in whom muscle mass is abnormally high or low (for example quadriplegics, very elderly, or malnourished individuals). Blood levels of cystatin C also equilibrate more quickly than creatinine, and therefore, serum cystatin C may be more accurate than serum creatinine when kidney function is rapidly changing (59) (for example amongst hospitalized individuals).

It is a low molecular weight (13,250 kD) cysteine proteinase inhibitor that is produced by all nucleated cells and found in body fluids, including serum. Since it is formed at a constant rate and freely filtered by the kidneys, its serum concentration is inversely correlated with the glomerular filtration rate (GFR); that is, high values indicate low GFRs while lower values indicate higher GFRs, similar to creatinine. While both cystatin C and creatinine are freely filtered by glomeruli, cystatin C is reabsorbed and metabolized by proximal renal tubules. Thus, under normal conditions, cystatin C does not enter the final excreted urine to any significant degree, and the serum concentration is unaffected by infections, inflammatory or neoplastic states, or by body mass, diet, or drugs.  GFR can be estimated (eGFR) from serum cystatin C utilizing an equation which includes the age and gender of the patient (CKD-EPI cystatin C equation, developed by Inker et al. (59) It demonstrated good correlation with measured iothalamate clearance in patients with all common causes of kidney disease, including kidney transplant recipients.

According to the National Kidney Foundation Kidney Disease Outcome Quality Initiative (K/DOQI) classification, among patients with CKD, irrespective of diagnosis, the stage of disease should be assigned based on the level of kidney function:

Table 4

Stage Description GFR mL/min/BSA
1 Kidney damage with normal or  increased GFR 90
2 Kidney damage with mild decrease in  GFR 60-89
3 Moderate decrease in GFR 30-59
4 Severe decrease in GFR 15-29
5 Kidney failure <15 (or dialysis)

(http://www2.kidney.org/professionals/kdoqi/guidelines_ckd/p4_class_g1.htm)

In a study to evaluate cystatin C as a measure of renal function in comparison to serum creatinine, 500 patients had cystatin C measured by nephelometry and glomerular filtration rate (GFR) measured by nonradiolabeled iothalamate clearance (59). In addition, serum creatinine was measured and the patients’ medical records reviewed. The correlation of 1/cystatin C with GFR (r=0.90) was significantly superior than 1/creatinine (r=0.82, p<0.05) with GFR. The superior correlation of 1/cystatin C with GFR was observed in the various clinical subgroups of patients studied (ie, subjects with no suspected renal disease, renal transplant patients, recipients of some other transplant, patients with glomerular disease, and patients with non-glomerular renal disease). The findings indicated that cystatin C may be superior to serum creatinine for the assessment of GFR in a wide spectrum of patients (59). Others have similarly found that cystatin C correlates better than serum creatinine for assessment of GFR. (60)

Patients were screened for 3 chronic kidney disease (CKD) studies in the United States (n = 2,980) and a clinical population in Paris, France (n = 438)(61).   GFR was measured by using urinary clearance of iodine125-iothalamate in the US studies and chromium51-EDTA in the Paris study. GFR was calculated using the 4 new equations based on serum cystatin C alone, serum cystatin C, serum creatinine, or both with age, sex, and race. New equations were developed by using linear regression with log GFR as the outcome in two thirds of data from US studies. Internal validation was performed in the remaining one third of data from US CKD studies; external validation was performed in the Paris study.

Mean mGFR, serum creatinine, and serum cystatin C values were 48 mL/min/1.73 m2 (5th to 95th percentile, 15 to 95), 2.1 mg/dL, and 1.8 mg/L, respectively. For the new equations, coefficients for age, sex, and race were significant in the equation with serum cystatin C, but 2- to 4-fold smaller than in the equation with serum creatinine (62, 63). Measures of performance in new equations were consistent across the development and internal and external validation data sets. Percentages of estimated GFR within 30% of mGFR for equations based on serum cystatin C alone, serum cystatin C, serum creatinine, or both levels with age, sex, and race were 81%, 83%, 85%, and 89%, respectively. The equation using serum cystatin C level alone yields estimates with small biases in age, sex, and race subgroups, which are improved in equations including these variables. It is concluded that Serum cystatin C level alone provides GFR estimates not linked to muscle mass, and that an equation including serum cystatin C level in combination with serum creatinine level, age, sex, and race provides the most accurate estimates.
The authors report that absence of urinary excretion has made it difficult to rigorously evaluate cystatin C as a filtration marker and to examine its non-GFR determinants. They also point out that a high level of variation in the cystatin C assay (64, 65), and standardization and calibration of clinical laboratories will be important to obtain accurate GFR estimation using cystatin C, as has been shown for creatinine.

The study reported above was followed by a major study by Inker LA, et al. (59). Their findings are summarized as follows. Mean measured GFRs were 68 and 70 ml per minute per 1.73 m2 of body-surface area in the development and validation data sets, respectively. In the validation data set, the creatinine–cystatin C equation performed better than equations that used creatinine or cystatin C alone. Bias was similar among the three equations, with a median difference between measured and estimated GFR of 3.9 ml per minute per 1.73 m2 with the combined equation, as compared with 3.7 and 3.4 ml per minute per 1.73 m2 with the creatinine equation and the cystatin C equation (P=0.07 and P=0.05), respectively. Precision was improved with the combined equation (interquartile range of the difference, 13.4 vs. 15.4 and 16.4 ml per minute per 1.73 m2, respectively [P=0.001 and P<0.001]), and the results were more accurate (percentage of estimates that were >30% of measured GFR, 8.5 vs. 12.8 and 14.1, respectively [P<0.001 for both comparisons]). In participants whose estimated GFR based on creatinine was 45 to 74 ml per minute per 1.73 m2, the combined equation improved the classification of measured GFR as either less than 60 ml per minute per 1.73 m2 or greater than or equal to 60 ml per minute per 1.73 m2 (net reclassification index, 19.4% [P<0.001]) and correctly reclassified 16.9% of those with an estimated GFR of 45 to 59 ml per minute per 1.73 m2 as having a GFR of 60 ml or higher per minute per 1.73 m2.

Other studies have established the importance of cystatin C levels(66, 67) and the factors influencing cystatin C levels on renal function measurement (68), including an implication that cystatin C, an alternative measure of kidney function, was a stronger predictor of the risk of cardiovascular events and death than either creatinine or the estimated GFR (69). This includes the Dallas Heart Study (30) finding that cystatin C was independently associated with a specific cardiac phenotype of concentric hypertrophy, including increased LV mass, concentricity, and wall thickness, but it was not associated with LV systolic function or volume. This association was particularly robust in hypertensives and blacks. The Cystatin C concentrations within stages of CKD are shown in Table 5 (70).

Table 5

      Cystatin C level
Stage a Description GFR range a (ml/min/1.73 m2) Native kidney disease b Transplant recipient c
1 Normal or increased GFR 90 0.80 0.87
2 Mildly decreased GFR 60 to 89 0.80 to 1.09 0.87 to 1.23
3 Moderately decreased GFR 30 to 59 1.10 to 1.86 1.24 to 2.24
4 Severely decreased GFR 15 to 29 1.87 to 3.17 2.25 to 4.10
5 Kidney Failure <15 >3.17 >4.10

a GFR estimates and CKD stage will be inaccurate if there is a calibration difference with the Dade-Behring BN II Nephelometer assay used in this study.

b Using the prediction equation: GFR=66.8 (cystatin C)-1.30.

c Using the prediction equation: GFR=76.6 (cystatin C)-1.16.


Copeptin, a novel marker

Urinary albumin excretion is a powerful predictor of progressive cardiovascular and renal disease. Copeptin is the inactive C-terminal fragment of the vasopressin precursor. It is a reliable marker of vasopressin secretion serves as a useful substitute for circulating vasopressin concentration. This allows  for the indirect measurement of vasopressin in epidemiological studies. Moreover, it has been shown that copeptin is a candidate biomarker for pneumonia 32), a predictor of outcome in heart failure, and is a powerful predictor of renal disease associated with albumin excretion (71).  Figure 8 shows the association between copeptin and 24-hour urinary volume, 24-h urinary osmolality and osmolality (71).


Figure 8


Association between quintiles of copeptin and median 24-h UAE (upper panel) and prevalence of microalbuminuria (lower panel) for males and females. Differences between the quintiles were tested by Kruskal–Wallis test. UAE, urinary albumin excretion.


Table 6 shows the association between copeptin concentration and urinary albumin excretion (UAE) in a log-log plot (71).


Model Corrected for β 95% CI for β P
Males        
 1 − (Crude) 0.25 0.20–0.30 <0.001
 2 As 1+age 0.21 0.16–0.26 <0.001
 3 As 2+MAP, BMI, smoking, glucose, cholesterol, CRP, and eGFR 0.10 0.05–0.16 <0.001
 4 As 3+diuretics and ACEi/ARB. 0.09 0.04–0.15 0.001
         
Females
 1 − (Crude) 0.19 0.15–0.23 <0.001
 2 As 1+age 0.17 0.14–0.22 <0.001
 3 As 2+MAP, BMI, smoking, glucose, cholesterol, CRP, and eGFR 0.16 0.11–0.21 <0.001
 4 As 3+diuretics and ACEi/ARB. 0.17 0.12–0.21 <0.001

ACEi, angiotensin-converting enzyme inhibitor; ARB, angiotensin-II-receptor blocker; BMI, body mass index; CHD, coronary heart disease; CI, confidence interval; CRP, C-reactive protein; eGFR, estimated glomerular filtration rate; MAP, mean arterial pressure.

Log copeptin concentration was entered in the regression analyses as independent and log UAE as the dependent variable. Copeptin was associated with UAE in all age groups, but this association is the strongest when subjects are older. Twenty-four-hour urinary volume and 24-h urinary osmolarity were significantly different, with 24-h urinary volume being higher and 24-h urinary osmolarity being lower in the oldest age group when compared with the youngest age group. In both males and females, high copeptin concentration (a surrogate for vasopressin) is associated with low 24-h urinary volume and high 24-h urinary osmolarity. However, urinary osmolarity was independently associated with UAE, but it was weaker than that between copeptin and UAE.  This might indicate that induction of specific glomerular hyperfiltration or decreased tubular albumin reabsorption are associated with this relationship. In addition, subjects with higher levels of copeptin had lower renal function.  These investigators concluded that copeptin (a reliable substitute for vasopressin) is associated with UAE and microalbuminuria, consistent with the hypothesis that vasopressin induces UAE (72).  Other studies indicated that copeptin levels are increased in patients with pulmonary artery hypertension (73), and
higher serum copeptin levels, a surrogate for arginine vasopressin (AVP) release, are associated not only with systolic and diastolic blood pressure but also with several components of metabolic syndrome (74) including obesity, elevated concentration of triglycerides, albuminuria, and serum uric acid level.


Natriuretic peptides in the evaluation of heart failure

The brain type natriuretic peptide (BNP) and the N-terminal pro B-type natriuretic peptide (NT proBNP), but not yet the atrial natriuretic peptide have gained prominence in the evaluation of patients with CHF, which may be with or without preserved ejection fraction . Richards et al. (75)  make the following points.


  • Threshold values of B-type natriuretic peptide (BNP) and N-terminal prohormone B-type natriuretic peptide (NT-proBNP) validated for diagnosis of undifferentiated acutely decompensated heart failure (ADHF) remain useful in patients with heart failure with preserved ejection fraction (HFPEF), with minor loss of diagnostic performance.


  • BNP and NT-proBNP measured on admission with ADHF are powerfully predictive of in-hospital mortality in both HFPEF and heart failure with reduced EF (HFREF), with similar or greater risk in HFPEF as in HFREF associated with any given level of either peptide.


  • In stable treated heart failure, plasma natriuretic peptide concentrations often fall below cut-point values used for the diagnosis of ADHF in the emergency department; in HFPEF, levels average approximately half those in HFREF.


  • BNP and NT-proBNP are powerful independent prognostic markers in both chronic HFREF and chronic HFPEF, and the risk of important clinical adverse outcomes for a given peptide level is similar regardless of left ventricular ejection fraction.


  • Serial measurement of BNP or NT-proBNP to monitor status and guide treatment in chronic heart failure may be more applicable in HFREF than in HFPEF.


In addition, they point out the following:


BNP and NT-proBNP fall below ADHF thresholds in stable HFREF in approximately 50% and 20% of cases, respectively. Levels in stable HFPEF are even lower, approximately half those in HFREF.


Whereas BNPs have 90% sensitivity for asymptomatic LVEF of less than 40% in the community (a precursor state for HFREF), they offer no clear guide to the presence of early community based HFPEF.


Guidelines recommend BNP and NT-proBNP as adjuncts to the diagnosis of acute and chronic HF and for risk stratification. Refinements for application to HFPEF are needed.


The prognostic power of NPs is similar in HFREF and HFPEF. Defined levels of BNP and NT-proBNP correlate with similar short-term and long-term risks of important clinical adverse outcomes in both HFREF and HFPEF.


They provide a diagnostic algorithm for suspected heart failure (75)(Figure 9).


Figure 9

Diagnostic algorithm for suspected heart failure presenting either acutely or nonacutely


Diagnostic algorithm for suspected heart failure presenting either acutely or nonacutely. a In the acute setting, mid-regional pro–atrial natriuretic peptide may also be used (cutoff point 120 pmol/L; ie, <120 pmol/L 5 heart failure unlikely). b Other causes of elevated natriuretic peptide levels in the acute setting are an acute coronary syndrome, atrial or ventricular arrhythmias, pulmonary embolism, and severe chronic obstructive pulmonary disease with elevated right heart pressures, renal failure, and sepsis. Other causes of an elevated natriuretic level in the nonacute setting are old age (>75 years), atrial arrhythmias, left ventricular hypertrophy, chronic obstructive pulmonary disease, and chronic kidney disease. c Exclusion cutoff points for natriuretic peptides are chosen to minimize the false-negative rate while reducing unnecessary referrals for echocardiography. Treatment may reduce natriuretic peptide concentration, and natriuretic peptide concentrations may not be markedly elevated in patients with heart failure with preserved ejection fraction.


Patients with acute pulmonary symptoms and with acute myocardial infarct present with dyspnea to the Emergency Department.  The evaluation is made particularly difficult in a patient for whom there is no prior history. Maisel et al. (76) presented the utility of the midregion proadrenomedullin (MR-proADM) in all patients presenting with acute shortness of breath.  They found that MR-proADM was superior to BNP or troponin for predicting 90-day all-cause mortality in patients presenting with acute dyspnea (c index = 0.755, p < 0.0001). Furthermore, MR-proADM added significantly to all clinical variables (all adjusted hazard ratios: HR=3.28), and it was also superior to all other biomarkers.


There is a large body of recent work that has enlarged our view of hypertension, kidney disease, cardiovascular disease, including heart failure with (HFpEF) or without preserved ejection fraction. I shall here refer to my review in Leaders in Pharmaceutical Innovation  (78).  The piece contains a study that I published  (79) with collaborators in Brooklyn, Bridgeport and Philadelphia that is no longer available from the publisher.


The natriuretic peptides, B-type natriuretic peptide (BNP) and NT-proBNP that have emerged as tools for diagnosing congestive heart failure (CHF) are affected by age and renal insufficiency (RI).  NTproBNP is used in rejecting CHF and as a marker of risk for patients with acute coronary syndromes. This observational study was undertaken to evaluate the reference value for interpreting NT-proBNP concentrations. The hypothesis is that increasing concentrations of NT-proBNP are associated with the effects of multiple co-morbidities, not merely CHF,

resulting in altered volume status or myocardial filling pressures.


NT-proBNP was measured in a population with normal trans-thoracic echocardiograms
(TTE) and free of anemia or renal impairment. Exclusion conditions were the following
co-morbidities:


  • anemia as defined by WHO,
  • atrial fibrillation (AF),
  • elevated troponin T exceeding 0.070 mg/dl,
  • systolic or diastolic blood pressure exceeding 140 and 90 respectively,
  • ejection fraction less than 45%,
  • left ventricular hypertrophy (LVH),
  • left ventricular wall relaxation impairment, and
  • renal insufficiency (RI) defined by creatinine clearance < 60ml/min using
    the MDRD formula .

Study participants were seen in acute care for symptoms of shortness of breath suspicious for CHF requiring evaluation with cardiac NTproBNP assay. The median NT-proBNP for patients under 50 years is 60.5 pg/ml with an upper limit of 462 pg/ml, and for patients over 50 years the median was 272.8 pg/ml with an upper limit of 998.2 pg/ml.

We suggested that NT-proBNP levels can be more accurately interpreted only after removal of the major co-morbidities that affect an increase in this  peptide in serum. The PRIDE study guidelines (http://www.pridestudy.org/)  should be applied until presence or absence of comorbidities is diagnosed. With no comorbidities, the reference range for normal over 50 years of age remains steady at ~1000 pg/ml. The effect shown in previous papers likely is due to increasing concurrent comorbidity with age.

We observed the following changes with respect to NTproBNP and age:

(i) Sharp increase in NT-proBNP at over age 50

(ii) Increase in NT-proBNP at 7% per decade over 50

(iii) Decrease in eGFR at 4% per decade over 50

(iv) Slope of NT-proBNP increase with age is related to proportion of patients with eGFR less than 90

(v) NT-proBNP increase can be delayed or accelerated based on disease comorbidities

The mean and 95% CI of NTproBNP (CHF removed) by the National Kidney Foundation staging for eGFR interval (eGFR scale: 0, > 120; 1, 90 to 119;2, 60 to 89; 3, 40 to 59; 4, 15 to 39; 5, under 15 ml/min). We created a new variable to minimize the effects of age and eGFR variability by correcting these large effects in the whole sample population.

Adjustment of the NT-proBNP for  both eGFR and for age over 50 differences. We have carried out a normalization to adjust for both eGFR and for age over 50:

(i) Take Log of NT-proBNP and multiply by 1000
(ii) Divide the result by eGFR (using MDRD9 or Cockroft Gault10)
(iii) Compare results for age under 50, 50-70, and over 70 years
(iv) Adjust to age under 50 years by multiplying by 0.66 and 0.56.

Figure 10


NKF staging by GFRe interval and NT-proBNP (CHF removed).


The equation does not require weight because the results are reported normalized

to 1.73 m2 body surface area, which is an accepted average adult surface area.


This is illustrated in Figure 11.

Figure 11


Plot of 1000*log (NT-proBNP)/GFR vs age at  eGFR over 90  and 60 ml/min

Figure 12 compares the reference ranges for NTproBNP before and after adjustment.

  • before adjustment; b) after adjustment. c) the scatterplot for 1000xlog(NT proBNP) versus 1000xlog(NT-proBNP/eGFR). Superimposed scatterplot and regression line with centroid and

confidence interval for 1000*log(NT-proBNP)/eGFR vs age (anemia removed)

at eGFR over 40 and 90 ml/min. (Black: eGFR > 90, Blue:  eGFR > 40)


More recent work is enlightening.  Hijazi et al. (80) studied the incremental value of measuring N-terminal pro–B-type natriuretic peptide (NT-proBNP) levels in addition to established risk factors (including the CHA2DS2VASc [heart failure, hypertension, age 75 years and older, diabetes, and previous stroke or transient ischemic attack, vascular disease, age 65 to 74 years, and sex category) for the prediction of cardiovascular and bleeding events. They concluded that NT-proBNP levels are often elevated in atrial fibrillation (AF) and it is independently associated with an increased risk for stroke and mortality. NT-proBNP improves risk stratification beyond the CHA2DS2VASc score and might be a novel tool for improved stroke prediction in AF. The

efficacy of apixaban compared with warfarin was independent of the NT-proBNP level. Moreover, natriuretic peptides are regulatory hormones associated with cardiac remodeling, namely, left ventricular hypertrophy and systolic/diastolic dysfunction. Another study reported that the risk of death of patients with plasma NT-proBNP 133 pg/mL (third tertile of the distribution) was 3.3 times that of patients with values 50.8 pg/mL (first tertile; hazard ratio: 3.30 [95% CI: 0.90 to 12.29]). This predictive value was independent of, and superior to, that of 2 ECG indexes of left ventricular hypertrophy, the Sokolov-Lyon index and the amplitude of the R wave in lead aVL and it persisted in patients without ECG left ventricular hypertrophy (81).
Many patients presenting with acute dyspnea (including those with ADHF) have multiple coexisting medical disorders that may complicate their diagnosis and management. These patients presenting with acute dyspnea may have longer hospital length of stay and are at high risk for repeat hospitalization or death. In this presentation testing for brain natriuretic peptide (BNP) or NT-proBNP has been shown to be valuable for an accurate and efficient diagnosis and prognostication of HF (82).


The biological activity of BNP, the product of an intracellular peptide (proBNP108) that is converted to NT-proBNP, includes stimulation of natriuresis and vasorelaxation; inhibition of renin, aldosterone, and sympathetic nervous activity; inhibition of fibrosis; and improvement in myocardial relaxation.


Figure 13


Biology of the natriuretic peptide system. BNP indicates brain natriuretic peptide; NT-proBNP, amino-terminal pro-B-type natriuretic peptide; and DPP-IV, dipeptidyl peptidase-4.

The authors remind us that approximately 20% of patients with acute dyspnea have BNP or NT-proBNP levels that are above the cutoff point to exclude HF but too low to definitively identify it (82). Knowledge of the differential diagnosis of non-HF elevation of NP, as well as interpretation of the BNP or NT-proBNP value in the context of a clinical assessment is essential.  Across all stages of HF, elevated BNP or NT-proBNP concentrations are at least comparable prognostic predictors of mortality and cardiovascular events relative to traditional predictors of outcome in this setting, with increasing NP concentrations predicting worse prognosis in a linear fashion. This prognostic value may be used to stratify patients at the highest risk of adverse outcomes (see Figure 2 In this page). Age-adjusted Kaplan-Meier survival curve of mortality at 1 year associated with an elevated amino-terminal pro-B-type natriuretic peptide    (NT-proBNP) concentration at emergency department presentation with dyspnea in those with acutely decompensated heart failure. Reproduced from Januzzi et al22. (82)

The importance of determining diastolic and systolic function and for measurement of pulmonary artery pressure by echocardiography is clear, as NT-proBNP levels may be increased with increase in pulmonary pressure as well as conditions that increase cardiac output. Although Hijazi et al. used the Cockcroft-Gault (CG) equation to determine the glomerular filtration rate (GFR) the CG equation may find higher eGFR in older individuals (80). In addition, elevated NT-proBNP independently predicts all-cause mortality and morbidity of patients with AF. A prominent disease with elevated NT-proBNP is a respiratory system disease, such as chronic obstructive pulmonary disease, pulmonary embolism, and interstitial lung disease, in which B-type natriuretic peptide levels are elevated in response to the pressure of the right side of the heart. The authors conclude that one should keep in mind that NT-proBNP alone may be inadequate.

NT-proBNP level is used for the detection of acute CHF and as a predictor of survival. However, a number of factors, including renal function, may affect the NT-proBNP levels. This study aims to provide a more precise way of interpreting NT-proBNP levels based on GFR, independent of age. This study includes 247 pts in whom CHF and known confounders of elevated NT-proBNP were excluded, to show the relationship of GFR in association with age. The effect of eGFR on NT-proBNP level was adjusted by dividing 1000 x log(NT-proBNP) by eGFR then further adjusting for age in order to determine a normalized NT-proBNP value. The normalized NT-proBNP levels were affected by eGFR independent of the age of the patient. A normalizing function based on eGFR eliminates the need for an age-based reference ranges for NT-proBNP (79).

The routine use of natiuretic peptides in severely dyspneic patients has recently been called into question. We hypothesized that the diagnostic utility of Amino Terminal pro Brain Natiuretic Peptide (NT-proBNP) is diminished in a complex elderly population (83)

We studied 502 consecutive patients in whom NT-proBNP values were obtained to evaluate severe dyspnea in the emergency department (84). The diagnostic utility of NT-proBNP for the diagnosis of congestive heart failure (CHF) was assessed utilizing several published guidelines, as well as the manufacturer’s suggested age dependent cut-off points. The area under the receiver operator curve (AUC) for NT-proBNP was 0.70. Using age-related cut points, the diagnostic accuracy of NT-proBNP for the diagnosis of CHF was below prior reports (70% vs. 83%). Age and estimated creatinine clearance correlated directly with NT-proBNP levels, while hematocrit correlated inversely. Both age > 50 years and to a lesser extent hematocrit < 30% affected the diagnostic accuracy of NT-proBNP, while renal function had no effect. In multivariate analysis, a prior history of CHF was the best predictor of current CHF, odds ratio (OR) = 45; CI: 23-88.

The diagnostic accuracy of NT-proBNP for the evaluation of CHF appears less robust in an elderly population with a high prevalence of prior CHF. Age and hematocrit levels, may adversely affect the diagnostic accuracy off NT-proBNP (85).

Obesity and hypertension.

Obesity is associated with an increased risk of hypertension. In the past 5 years there have been dramatic advances into the genetic and neurobiological mechanisms of obesity with the discovery of leptin and novel neuropeptide pathways regulating appetite and metabolism. In this brief review, we argue that these mounting advances into the neurobiology of obesity have and will continue to provide new insights into the regulation of arterial pressure in obesity. We focus our comments on the sympathetic, vascular, and renal mechanisms of leptin and melanocortin receptor agonists and on the regulation of arterial pressure in rodent models of genetic obesity. Three concepts are proposed (86).

First, the effect of obesity on blood pressure may depend critically on the genetic-neurobiological mechanisms underlying the obesity. Second, obesity is not consistently associated with increased blood pressure, at least in rodent models. Third, the blood pressure response to obesity may be critically influenced by modifying alleles in the genetic background.

Leptin plays an important role in regulation of body weight through regulation of food intake and sympathetically mediated thermogenesis. The hypothalamic melanocortin system, via activation of the melanocortin-4 receptor (MC4-R), decreases appetite and weight, but its effects on sympathetic nerve activity (SNA) are unknown. In addition, it is not known whether sympathoactivation to leptin is mediated by the melanocortin system.

The following study (87) tested the interactions between these systems in regulation of brown adipose tissue (BAT) and renal and lumbar SNA in anesthetized Sprague-Dawley rats. Intracerebroventricular administration of the MC4-R agonist MT-II (200 to 600 pmol) produced a dose-dependent sympathoexcitation affecting BAT and renal and lumbar beds. This response was completely blocked by the MC4-R antagonist SHU9119 (30 pmol ICV). Administration of leptin (1000 m g/kg IV) slowly increased BAT SNA (baseline, 4166 spikes/s; 6 hours, 196628 spikes/s; P50.001) and renal SNA (baseline, 116616 spikes/s; 6 hours, 169626 spikes/s; P50.014).

Intracerebroventricular administration of SHU9119 did not inhibit leptin-induced BAT sympathoexcitation (baseline, 3567 spikes/s; 6 hours, 158634 spikes/s; P50.71 versus leptin alone). However, renal sympathoexcitation to leptin was completely blocked by SHU9119 (baseline, 142617 spikes/s; 6 hours, 146625 spikes/s; P50.007 versus leptin alone). The study (87) demonstrates that the hypothalamic melanocortin system can act to increase sympathetic nerve traffic to thermogenic BAT and other tissues. Our data also suggest that leptin increases renal SNA through activation of hypothalamic melanocortin receptors. In contrast, sympathoactivation to thermogenic BAT by leptin appears to be independent of the melanocortin system.

Troponins

The introduction of the first generation troponins T and I was an important event leading to the declining use of creatine kinase isoenzyme MB because of the short half-life in the circulation of CKMB and the possibility of missing a late presenting ACS. The situation then would call for the measurement of lactate dehydrogenase isoenzyme 1 (H-type), which had a decline in use.  The troponins T and I are proteins associated with the muscle contractile element with high specificity for the cardiomyocyte apparatus, which increased rapidly after ACS and which had estimated diagnostic cutoffs of 0.08 mg/dl and 1 mg/dl respectively.  The choice of marker was largely dependent of the instrument platform.  These biomarkers went through several generations of improvement to improve the diagnostic sensitivity to a cutoff at 2 SD of the lower limit of detection, magnifying confusion in interpretation that had always existed. These cardiospecific markers are elevated in patients with hypertension and specifically, long term CKD. This was clarified by introducing the terms Type 1 and Type 2 myocardial infarct, designating the classic ACS due to plaque rupture as Type 1.  However, the type 2 class might well be non-homogeneous. In any case, these are the best we have in detecting myocardial ischemic damage with biomarker release.


Discussion

This discussion has covered a large body of research involving hypertension, the kidney, and cardiovascular humoral mechanisms of control with a broad brush.  The work that has been done is far more than is cited.  There are several biomarkers that we have considered. They are not only laboratory based measurements.  They are: PWV, cystatin C, eGFR, copeptin, BNP or NT-BNP, Midregional prohormone adrenomedullin (MR-ADM), urinary albumin excretion, and the aldosterone/renin ratio.

The preceding discussion reminds us of the story of the blind men palpating an elephant, set in a poem by John Godfrey Saxe. These blind men were asked to tell of their experiences palpating different parts of an elephant, without seeing the entire animal Figure 1. Each of the blind men was able to palpate one part of the elephant, and thus was able to describe it in terms that were “partly in the right.” However, because none of them was able to encompass the entire elephant in their hands, they were also “in the wrong,” in that they failed to identify the whole elephant (88).
The blind men and the elephant. Poem by John Godfrey Saxe (Cartoon originally copyrighted by the authors (88); G. Renee Guzlas, artist). http://www.nature.com/ki/journal/v62/n5/thumbs/4493262f1bth.gif

These authors advanced the “elephant” as the increased oxidative burden in the uremic milieu of patients with chronic kidney disease. I introduce the concept in the diagnostic dilemma about what biomarkers are diagnostically informative in hypertension and ischemic CVD poses a conundrum. In reviewing the full gamut of biomarkers, we have a replay of the Lone Ranger and the silver bullet.  The problem is that there is no “silver” bullet.  We are accustomed to rely on clinical observations that are themselves weak covariates in actual experience.  The studies that have been done to validate the effectiveness of key biomarkers are well designed and show relevance in the populations studied.  However, they are insufficient by themselves in the emergent care population.
 

Impediments to a solution to the problem

Tests are ordered by physicians based on the findings in a clinical history and physical examination. Test that are ordered are reimbursed by insurance carriers, Medicare and Medicaid based on a provisional diagnosis.  The provisional diagnosis generates an ICD10 code, which has been most recently revised with a weighted input from the insurers that is not in favor of considered clinical evidence.  Moreover, the provider of care is graded based on the number of patients seen and the tests performed on a daily basis over any period.  Given this situation, and in addition, the requirement to interact with an outmoded information system that is more helpful to the insurer and less helpful to the provider, it is not surprising that there is a large burnout of the nursing and physician practitioner workforce.  If the diagnosis is inconclusive at the time of patient examination, then the work is not reimbursable based on ICD10 coding requirements that are disease specific.   This problem breaks down into a workload and a reimbursement inconsistency, neither of which makes sense in terms of the original studies on Diagnosis Related Groups (89) at Yale by Robert Fetter’s group.  The problem is made worse by the design and selection of healthcare information systems.

Many have pointed out the flaws in current EHR design that impede the optimum use of data and hinder workflow. Researchers have suggested that EHRs can be part of a learning health system to better capture and use data to improve clinical practice, create new evidence, educate, and support research efforts. The health care system suffers from both inefficient and ineffective use of data. Data are suboptimally displayed to users, undernetworked, underutilized, and wasted. Errors, inefficiencies, and increased costs occur on the basis of unavailable data in a system that does not coordinate the exchange of information, or adequately support its use (90). Clinicians’ schedules are stretched to the limit and yet the system in which they work exerts little effort to streamline and support carefully engineered care processes. Information for decision-making is difficult to access in the context of hurried real-time workflows(91)


The solution to the problem

The current design of the Electronic Medical Record (EMR) is a linear presentation of portions of the record by services, by diagnostic method, and by date, to cite examples.  This allows perusal through a graphical user interface (GUI) that partitions the information or necessary reports in a workstation entered by keying to icons.  This requires that the medical practitioner finds the history, medications, laboratory reports, cardiac imaging and EKGs, and radiology in different workspaces.  The introduction of a DASHBOARD has allowed a presentation of drug reactions, allergies, primary and secondary diagnoses, and critical information about any patient the care giver needing access to the record.  The advantage of this innovation is obvious.  The startup problem is what information is presented and how it is displayed, which is a source of variability and a key to its success.

Gil David and Larry Bernstein have developed, in consultation with Prof. Ronald Coifman, in the Yale University Applied Mathematics Program, a software system that is the equivalent of an intelligent Electronic Health Records Dashboard (92)( that provides empirical medical reference and suggests quantitative diagnostics options.

The most commonly ordered test used for managing patients worldwide is the hemogram that often incorporates the review of a peripheral smear.  While the hemogram has undergone progressive modification of the measured features over time the subsequent expansion of the panel of tests has provided a window into the cellular changes in the production, release or suppression of the formed elements from the blood-forming organ to the circulation.  In the hemogram one can view data reflecting the characteristics of a broad spectrum of medical conditions.

How we frame our expectations is so important that it determines the data we collect to examine the process.   In the absence of data to support an assumed benefit, there is no proof of validity at whatever cost.   This has meaning for hospital operations, for nonhospital laboratory operations, for companies in the diagnostic business, and for planning of health systems.

In 1983, a vision for creating the EMR was introduced by Lawrence Weed, expressed by McGowan and Winstead-Fry (93)

The data presented has to be comprehended in context with vital signs, key symptoms, and an accurate medical history.  Consequently, the limits of memory and cognition are tested in medical practice on a daily basis.  We deal with problems in the interpretation of data presented to the physician, and how through better design of the software that presents this data the situation could be improved.  The computer architecture that the physician uses to view the results is more often than not presented as the designer would prefer, and not as the end-user would like.

Eugene Rypka contributed greatly to clarifying the extraction of features (94) in a series of articles, which set the groundwork for the methods used today in clinical microbiology.  The method he describes is termed S-clustering, and will have a significant bearing on how we can view hematology data.  He describes S-clustering as extracting features from endogenous data that amplify or maximize structural information to create distinctive classes.  The method classifies by taking the number of features with sufficient variety to map into a theoretic standard. The mapping is done by a truth table, and each variable is scaled to assign values for each: message choice.  The number of messages and the number of choices forms an N-by N table.  He points out that the message choice in an antibody titer would be converted from 0 + ++ +++ to 0 1 2 3.

Bernstein and colleagues had a series of studies using Kullback-Liebler Distance  (effective information) for clustering to examine the latent structure of the elements commonly used for diagnosis of myocardial infarction (95-97)(CK-MB, LD and the isoenzyme-1 of LD),  protein-energy malnutrition (serum albumin, serum transthyretin, condition associated with protein malnutrition (see Jeejeebhoy and subjective global assessment), prolonged period with no oral intake), prediction of respiratory distress syndrome of the newborn (RDS), and prediction of lymph nodal involvement of prostate cancer, among other studies.   The exploration of syndromic classification has made a substantial contribution to the diagnostic literature, but has only been made useful through publication on the web of calculators and nomograms (such as Epocrates and Medcalc) accessible to physicians through an iPhone.  These are not an integral part of the EMR, and the applications require an anticipation of the need for such processing.

Gil David et al. (90, 92) introduced an AUTOMATED processing of the data available to the ordering physician and can anticipate an enormous impact in diagnosis and treatment of perhaps half of the top 20 most common causes of hospital admission that carry a high cost and morbidity.  For example: anemias (iron deficiency, vitamin B12 and folate deficiency, and hemolytic anemia or myelodysplastic syndrome); pneumonia; systemic inflammatory response syndrome (SIRS) with or without bacteremia; multiple organ failure and hemodynamic shock; electrolyte/acid base balance disorders; acute and chronic liver disease; acute and chronic renal disease; diabetes mellitus; protein-energy malnutrition; acute respiratory distress of the newborn; acute coronary syndrome; congestive heart failure; disordered bone mineral metabolism; hemostatic disorders; leukemia and lymphoma; malabsorption syndromes; and cancer(s)[breast, prostate, colorectal, pancreas, stomach, liver, esophagus, thyroid, and parathyroid]. The same approach has also been applied to the problem of hospital malnutrition, but it has not been sufficiently applied to hypertension, cardiovascular diseases, acute coronary syndrome, chronic renal failure.

We have developed (David G, Bernstein L, and Coifman) (92) a software system that is the equivalent of an intelligent Electronic Health Records Dashboard that provides empirical medical reference and suggests quantitative diagnostics options. The primary purpose is to gather medical information, generate metrics, analyze them in realtime and provide a differential diagnosis, meeting the highest standard of accuracy. The system builds its unique characterization and provides a list of other patients that share this unique profile, therefore utilizing the vast aggregated knowledge (diagnosis, analysis, treatment, etc.) of the medical community. The main mathematical breakthroughs are provided by accurate patient profiling and inference methodologies in which anomalous subprofiles are extracted and compared to potentially relevant cases. As the model grows and its knowledge database is extended, the diagnostic and the prognostic become more accurate and precise. We anticipate that the effect of implementing this diagnostic amplifier would result in higher physician productivity at a time of great human resource limitations, safer prescribing practices, rapid identification of unusual patients, better assignment of patients to observation, inpatient beds, intensive care, or referral to clinic, shortened length of patients ICU and bed days.

The main benefit is a real time assessment as well as diagnostic options based on comparable cases, flags for risk and potential problems as illustrated in the following case acquired on 04/21/10. The patient was diagnosed by our system with severe SIRS at a grade of 0.61 .

Method for data organization and classification via characterization metrics.

The database is organized to enable linking a given profile to known profiles. This is achieved by associating a patient to a peer group of patients having an overall similar profile, where the similar profile is obtained through a randomized search for an appropriate weighting of variables. Given the selection of a patients’ peer group, we build a metric that measures the dissimilarity of the patient from its group. This is achieved through a local iterated statistical analysis in the peer group.

This characteristic metric is used to locate other patients with similar unique profiles, for each of whom we repeat the procedure described above. This leads to a network of patients with similar risk condition. Then, the classification of the patient is inferred from the medical known condition of some of the patients in the linked network.

How do we organize the data and linkages provided in the first place?

Predictors: PWV, cystatin C, creatinine, urea, eGFR, copeptin, BNP or NT-BNP, TnI or TnT, Midregional prohormone adrenomedullin (MR-ADM), urinary albumin excretion, and the aldosterone/renin ratio, homocysteine, transthyretin, glucose, albumin, chol/LDL, LD, Na+, K+,  Cl, HCO3, pH.

Conditions: AMI, CRF, ARF, hypertension, HFpEF, HFcEF, ADHF, obesity, PHT, RVHF, pulmonary edema, PEM

Other variables: sex (M,F), age, BMI. …

Conditioning data: take log transform for large ascending values, OR take deciles of variables, if necessary.  This could apply to NT-proBNP, BNP, TnI, TnT, CK and LD.

Arrange predictor variables in columns and patient-sequence in rows.  This is a bidimentional table.  The problem is to assign diagnoses to each patient-in sequence. There can be more than one diagnosis.

In reality the patient-sequence or identifier is not relevant. Only the condition assignment is.  The condition assignments are made in a column adjacent to the patient, and they fall into rows.
The construct appears to be a 2×2, but it is actually an n-dimensional  matrix.  Each patient position has one or more diagnoses.

Multivariate statistical analysis is used to extend this analysis to two or more predictors.   In this case a multiple linear regression or a linear discriminant function would be used to predict a dependent variable from two or more independent variables.   If there is linear association dependency of the variables is assumed and the test of hypotheses requires that the variances of the predictors are normally distributed.  A method using a log-linear model circumvents the problem of the distributional dependency in a method called ordinal regression.    There is also a relationship of analysis of variance, a method of examining differences between the means of  two or more groups.  Then there is linear discriminant analysis, a method by which we examine the linear separation between groups rather than the linear association between groups.  Finally, the neural network is a nonlinear, nonparametric model for classifying data with several variables into distinct classes. In this case we might imagine a curved line drawn around the groups to divide the classes. The focus of this discussion will be the use of linear regression  and explore other methods for classification purposes (98).

The real issue is how a combination of variables falls into a table with meaningful information.  We are concerned with accurate assignment into uniquely variable groups by information in test relationships. One determines the effectiveness of each variable by its contribution to information gain in the system.  The reference or null set is the class having no information.  Uncertainty in assigning to a classification is only relieved by providing sufficient information.  One determines the effectiveness of each variable by its contribution to information gain in the system.  The possibility for realizing a good model for approximating the effects of factors supported by data used for inference owes much to the discovery of Kullback-Liebler distance or “information” (99), and Akaike (100) found a simple relationship between K-L information and Fisher’s maximized log-likelihood function. A solid foundation in this work was elaborated by Eugene Rypka (101).  Of course, this was made far less complicated by the genetic complement that defines its function, which made more accessible the study of biochemical pathways.  In addition, the genetic relationships in plant genetics were accessible to Ronald Fisher for the application of the linear discriminant function.    In the last 60 years the application of entropy comparable to the entropy of physics, information, noise, and signal processing, has been fully developed by Shannon, Kullback, and others,  and has been integrated with modern statistics, as a result of the seminal work of Akaike, Leo Goodman, Magidson and Vermunt, and unrelated work by Coifman. Dr. Magidson writes about Latent Class Model evolution:

The recent increase in interest in latent class models is due to the development of extended algorithms which allow today’s computers to perform LC analyses on data containing more than just a few variables, and the recent realization that the use of such models can yield powerful improvements over traditional approaches to segmentation, as well as to cluster, factor, regression and other kinds of analysis.

Perhaps the application to medical diagnostics had been slowed by limitations of data capture and computer architecture as well as lack of clarity in definition of what are the most distinguishing features needed for diagnostic clarification.  Bernstein and colleagues (102-104) had a series of studies using Kullback-Liebler Distance  (effective information) for clustering to examine the latent structure of the elements commonly used for diagnosis of myocardial infarction (CK-MB, LD and the isoenzyme-1 of LD),  protein-energy malnutrition (serum albumin, serum transthyretin, condition associated with protein malnutrition (see Jeejeebhoy and subjective global assessment), prolonged period with no oral intake), prediction of respiratory distress syndrome of the newborn (RDS), and prediction of lymph nodal involvement of prostate cancer, among other studies.   The exploration of syndromic classification has made a substantial contribution to the diagnostic literature, but has only been made useful through publication on the web of calculators and nomograms (such as Epocrates and Medcalc) accessible to physicians through an iPhone.  These are not an integral part of the EMR, and the applications require an anticipation of the need for such processing.

Gil David et al. introduced an AUTOMATED processing of the data (104) available to the ordering physician and can anticipate an enormous impact in diagnosis and treatment of perhaps half of the top 20 most common causes of hospital admission that carry a high cost and morbidity.  For example: anemias (iron deficiency, vitamin B12 and folate deficiency, and hemolytic anemia or myelodysplastic syndrome); pneumonia; systemic inflammatory response syndrome (SIRS) with or without bacteremia; multiple organ failure and hemodynamic shock; electrolyte/acid base balance disorders; acute and chronic liver disease; acute and chronic renal disease; diabetes mellitus; protein-energy malnutrition; acute respiratory distress of the newborn; acute coronary syndrome; congestive heart failure; disordered bone mineral metabolism; hemostatic disorders; leukemia and lymphoma; malabsorption syndromes; and cancer(s)[breast, prostate, colorectal, pancreas, stomach, liver, esophagus, thyroid, and parathyroid].

Our database organized to enable linking a given profile to known profiles(102-104). This is achieved by associating a patient to a peer group of patients having an overall similar profile, where the similar profile is obtained through a randomized search for an appropriate weighting of variables. Given the selection of a patients’ peer group, we build a metric that measures the dissimilarity of the patient from its group. This is achieved through a local iterated statistical analysis in the peer group.

We then use this characteristic metric to locate other patients with similar unique profiles, for each of whom we repeat the procedure described above. This leads to a network of patients with similar risk condition. Then, the classification of the patient is inferred from the medical known condition of some of the patients in the linked network. Given a set of points (the database) and a newly arrived sample (point), we characterize the behavior of the newly arrived sample, according to the database. Then, we detect other points in the database that match this unique characterization. This collection of detected points defines the characteristic neighborhood of the newly arrived sample. We use the characteristic neighborhood in order to classify the newly arrived sample. This process of differential diagnosis is repeated for every newly arrived point.   The medical colossus we have today has become a system out of control and beset by the elephant in the room – an uncharted complexity.


References

  1. http://www.geronet.ucla.edu/research/researchers/385


  1. Chronic Kidney Disease and Hypertension: A Destructive Combination. Buffet L, Ricchetti C.  http://www.medscape.com/viewarticle/766696


  1. Frank O. Zur Dynamik des Herzmuskels. J Biol. 1895;32:370-447. Translation from German: Chapman CP, Wasserman EB. On the dynamics of cardiac muscle. Am Heart J. 1959; 58:282-317.


  1. Starling EH. Linacre Lecture on the Law of the Heart. London, England: Longmans; 1918.


  1. ftp://www.softchalk.com/Step1softchalksyllabus/starlings%20Law%20.pdf


  1. https://youtu.be/5SO58NndlPI


  1. Lakatta EG. Starling’s Law of the Heart Is Explained by an Intimate Interaction of Muscle Length and Myofilament Calcium Activation. J Am Coll Cardiol 1987; 10:1157-64.


  1. Lakatta EG, DiFrancesco D. J Mol Cell Cardiol. 2009 Aug; 47(2):157-70.
    http://dx.doi.org:/10.1016/j.yjmcc.2009.03.022. What keeps us ticking: a funny current, a calcium clock, or both?


  1. Lakatta EG, Maltsev VA, Vinogradova TM. A coupled SYSTEM of intracellular Ca2+ clocks and surface membrane voltage clocks controls the time keeping mechanism of the heart’s pacemaker. Circ Res.2010 Mar 5; 106(4):659-73. http://dx.doi.org:/10.1161/CIRCRESAHA.109.206078.


  1. NHLBI, NIH, Health. http://www.nhlbi.nih.gov/health/health-topics/topics/hbp/causes
  1. Clark CE and Powell RJ. The differential blood pressure sign in general practice: prevalence and prognostic value. Family Practice 2002; 19:439–441.
  2. Madhur  MS. Medscape. http://emedicine.medscape.com/article/241381-treatment
  3. Roger VL, Go AS, Lloyd-Jones DM, et al. Heart disease and stroke statistics–2012 update: a report from the American Heart Association. Circulation. 2012 Jan 3. 125(1):e2-e220. [Medline].
  4. Institute for Clinical Systems Improvement (ICSI). Hypertension diagnosis and treatment. Bloomington, Minn: Institute for Clinical Systems Improvement (ICSI); 2010.
  5. Whelton PK, Appel LJ, Sacco RL, Anderson CA, Antman EM, Campbell N, et al. Sodium, Blood Pressure, and Cardiovascular Disease: Further Evidence Supporting the American Heart Association Sodium Reduction Recommendations. Circulation. 2012 Nov 2. [Medline].
  6. O’Riordan M. New European Hypertension Guidelines Released: Goal Is Less Than 140 mm Hg for All. Medscape [serial online]. Available at http://www.medscape.com/viewarticle/806367. Accessed: June 24, 2013.
  7. Chobanian AV, Bakris GL, Black HR, Cushman WC, Green LA, Izzo JL Jr, et al. Seventh report of the Joint National Committee on Prevention, Detection, Evaluation, and Treatment of High Blood Pressure. Hypertension. 2003 Dec. 42(6):1206-52. [Medline].
  8. [Guideline] James PA, Oparil S, Carter BL, et al. 2014 Evidence-based guideline for the management of high blood pressure in adults: report from the panel members appointed to the Eighth Joint National Committee (JNC 8). JAMA. 2013 Dec 18. [Medline][Full Text].
  9. Laurent S, Boutouyrie P, Asmar R, et al. Aortic stiffness is an independent predictor of all-cause and cardiovascular mortality in hypertensive patients. Hypertension. 2001 May; 37(5):1236-41.
    http://hyper.ahajournals.org/content/37/5/1236.long  http://dx.doi.org:/10.1161/01.HYP.37.5.1236


  1. Shahmirzadi D, Li RX, Konofagou EE. Pulse-Wave Propagation in Straight-Geometry Vessels

for Stiffness Estimation: Theory, Simulations, Phantoms and In Vitro Findings. J Biomechanical Engineering Oct 26, 2012; 134(114502): 1-7. http://dx.doi.org:/10.1115/1.4007747


  1. Najjar SS, Scuteri A, Shetty V, …, Lakatta EG. Pulse wave velocity is an independent predictor of the longitudinal increase in systolic blood pressure and of incident hypertension in the Baltimore Longitudinal Study of Aging. J Am Coll Cardiol.2008 Apr 8; 51(14):1377-83. http://dx.doi.org:/10.1016/j.jacc.2007.10.065


  1. Lim HS and Lip GYH. Arterial stiffness: beyond pulse wave velocity and its measurement. Journal of Human Hypertension (2008) 22, 656–658; http://dx.doi.org:/10.1038/jhh.2008.4
  2. Payne RA, Wilkinson IB, Webb DJ. Arterial Stiffness and Hypertension – Emerging Concepts. Hypertension.2010; 55: 9-14.   http://dx.doi.org:/10.1161/HYPERTENSIONAHA.107.090464
  3. http://www.nature.com/jhh/journal/v22/n10/images/jhh200847f1.gif
  4. O’Rourke M. Arterial stiffness, systolic blood pressure, and logical treatment of arterial hypertension. Hypertension. 1990 Apr; 15(4):339-47. http://www.fac.org.ar/scvc/llave/hbp/arnett/arnetti.htm
  5. Arnett DK1, Tyroler HA, …., Howard G, Heiss G. Hypertension and subclinical carotid artery atherosclerosis in blacks and whites. The Atherosclerosis Risk in Communities Study. ARIC Investigators. Arch Intern Med. 1996 Sep 23; 156(17):1983-9. http://archinte.jamanetwork.com/article.aspx?articleid=622453
  6. Cecelja M, Chowienczyk P. Role of arterial stiffness in cardiovascular disease. JRSM Cardiovascular Disease July 2012; 1(4):11 http://cvd.sagepub.com/content/1/4/11.full
  7. Peralta CA, Whooley MA, Ix JH, and Shlipak MG .  Kidney Function and Systolic Blood Pressure New Insights from Cystatin C: Data from the Heart and Soul Study. Am J Hypertens. 2006 Sep; 19(9):939–946.   http://dx.doi.org:/10.1016/j.amjhyper.2006.02.007
  8. Asmar R, Benetos A, Topouchian J, Laurent P, Pannier B, Brisac AM , Target R, Levy BI.
    Assessment of Arterial Distensibility by Automatic Pulse Wave Velocity Measurement: Validation and Clinical Application Studies. Hypertension. 1995; 26: 485-490. http://dx.doi.org:/10.1161/01.HYP.26.3.485
  9. Ioannidis JPA, Tzoulaki I. Minimal and null predictive effects for the most popular blood biomarkers of cardiovascular disease. Circ Res. 2012; 110:658–662.
  1. Giles T. Biomarkers, Cardiovascular Disease, and Hypertension. J Clin Hypertension 2013; 15(1)   http://dx.doi.org:/10.1111/jch.12014


  1. Bielecka-Dabrowa A, Gluba-Brzózka A, Michalska-Kasiczak M, Misztal M, Rysz J and Banach M.   The Multi-Biomarker Approach for Heart Failure in Patients with Hypertension. Int. J. Mol. Sci. 2015; 16: 10715-10733;  http://dx.doi.org:/10.3390/ijms160510715


  1. Barbaro N, Moreno H. Inflammatory biomarkers associated with arterial stiffness in resistant hypertension.  Inflamm Cell Signal 2014; 1: e330. http://dx.doi.org:/10.14800/ics.330.


  1. Chao J, Schmaier A, Chen LM, Yang Z, Chao L. Kallistatin, a novel human tissue kallikrein inhibitor: levels in body fluids, blood cells, and tissues in health and disease. J Lab Clin Med. 1996 Jun; 127(6):612-20. http://www.ncbi.nlm.nih.gov/pubmed/8648266


  1. Chao J, Chao L. Functional Analysis of Human Tissue Kallikrein in Transgenic Mouse Models. Hypertension. 1996; 27: 491-494. http://dx.doi.org://10.1161/01.HYP.27.3.491


  1. Chao J, Bledsoe G and Chao L. Kallistatin: A Novel Biomarker for Hypertension, Organ Injury and Cancer. Austin Biomark Diagn. 2015; 2(2): 1019).


  1. Touyz RM , Schiffrin EL. Reactive oxygen species in vascular biology: implications in hypertension. Histochem, Cell Biol Oct 2004; 122(4):339-352.  http://link.springer.com/article/10.1007/s00418-004-0696-7


  1. Nozik-Grayck E1, Stenmark KR. Role of reactive oxygen species in chronic hypoxia-induced pulmonary hypertension and vascular remodeling. Adv Exp Med Biol. 2007; 618:101-12.
    http://www.ncbi.nlm.nih.gov/pubmed/18269191


  1. Paravicin TM and Touyz RM. NADPH Oxidases, Reactive Oxygen Species, and Hypertension. Diabetes Care 2008 Feb; 31(Supplement 2): S170-S180. http://dx.doi.org/10.2337/dc08-s247


  1. Schiffrin EL. Endothelin: role in hypertension. Biol Res. 1998; 31(3):199-208. Review.


  1. Schiffrin EL. Role of endothelin-1 in hypertension and vascular disease. Am J Hypertens. 2001 Jun;14(6 Pt 2):83S-89S. Review.


  1. Schiffrin EL. Endothelin and endothelin antagonists in hypertension. J Hypertens. 1998 Dec; 16(12 Pt 2):1891-5. Review.


  1. Warwick G, Thomas PS and Yates DH. Biomarkers in pulmonary hypertension.
    Eur Respir J 2008; 32: 503–512 http://dx.doi.org:/10.1183/09031936.00160307


  1. Zhang S, Yang T, Xu X, Wang M, Zhong L, et al. Oxidative stress and nitric oxide signaling related biomarkers in patients with pulmonary hypertension: a case control study. BMC Pulm Med. 2015; 15: 50.    http://dx.doi.org:/1186/s12890-015-0045-8


  1. Kierszniewska-Stępień D, Pietras T, Ciebiada M, Górski P, and Stępień H. Concentration of angiopoietins 1 and 2 and their receptor Tie-2 in peripheral blood in patients with chronic obstructive pulmonary disease. Postepy Dermatol Alergol. 2015 Dec; 32(6): 443–448. http://dx.doi.org:/5114/pdia.2014.44008


  1. Circulating Biomarkers in Pulmonary Arterial Hypertension. Al-Zamani M, Trammell AW,  Safdar Z.  Adv Pulm Hypertension 2015; 14(1):21-27.


  1. Safdar et al. Hea rt  Fai lure  JACC 2014; 2(4): 412– 21.


  1. Camozzi M, Zacchigna S, Rusnati M, Coltrini D, et al. Pentraxin 3 Inhibits Fibroblast Growth Factor 2–Dependent Activation of Smooth Muscle Cells In Vitro and Neointima Formation In Vivo. Arterioscler Thromb Vasc Biol. 2005; 25:1837-1842. http://atvb.ahajournals.org/content/25/9/1837.full.pdf


  1. Presta M, Camozzi M, Salvatori G, and Rusnatia M. Role of the soluble pattern recognition receptor PTX3 in vascular biology. J Cell Mol Med. 2007 Jul; 11(4): 723–738.
    http://dx.doi.org:/1111/j.1582-4934.2007.00061.x


  1. Tamura Y, Ono T, Kuwana M, Inoue K, Takei M, Yamamoto T, Kawakami T, et al. Human pentraxin 3 (PTX3) as a novel biomarker for the diagnosis of pulmonary arterial hypertension.
    PLoS One. 2012;7(9):e45834. http://dx.doi.org:/10.1371/journal.pone.0045834.


  1. Calvier L, Legchenko E, Grimm L, Sallmon H, Hatch A, Plouffe BD, Schroeder C, et al. Galectin-3 and aldosterone as potential tandem biomarkers in pulmonary arterial hypertension. Heart. 2016 Mar 1; 102(5):390-6. http://dx.doi.org:/10.1136/heartjnl-2015-308365


  1. Otto CM. Heart 2016; 102:333–334. Heartbeat: Biomarkers and pulmonary artery hypertension. http://dx.doi.org:/10.1136/heartjnl-2015-309220


  1. Sintek MA, Sparrow CT, Mikuls TR, Lindley KJ, Bach RG, et al. Repeat revascularisation outcomes after percutaneous coronary intervention in patients with rheumatoid arthritis. Heart. 2016 Mar 1; 102(5):363-9. http://dx.doi.org:/10.1136/heartjnl-2015-308634.


  1. Camici PG, Wijns W, Borgers M, De Silva R, et al. Pathophysiological Mechanisms of Chronic Reversible Left Ventricular Dysfunction due to Coronary Artery Disease (Hibernating Myocardium). Circulation. 1997; 96: 3205-3214. http://dx.doi.org:/10.1161/01.CIR.96.9.3205


  1. Rahimtoola SH, Dilsizian V, Kramer CM, Marwick TH, and Jean-Louis J. Vanoverschelde.
    Chronic Ischemic Left Ventricular Dysfunction: From Pathophysiology to Imaging and its Integration into Clinical Practice. JACC Cardiovasc Imaging. 2008 Jul 7; 1(4): 536–555.

http://dx.doi.org:/10.1016/j.jcmg.2008.05.009


  1. Peralta CA, Whooley MA, Ix JH, Shlipak MG. Kidney function and systolic blood pressure new insights from cystatin C: data from the Heart and Soul Study. Am J Hypertens. 2006 Sep; 19(9):939-46. http://dx.doi.org:/10.1016/j.amjhyper.2006.02.007


  1. Moran A, Katz R, Nicolas L. Smith NL, Fried LF, Sarnak MJ, …, Shlipak, MG. Cystatin C Concentration as a Predictor of Systolic and Diastolic Heart Failure. J Card Fail. 2008 Feb; 14(1): 19–26. http://dx.doi.org:/10.1016/j.cardfail.2007.09.002


  1. Tomaschitz A, Maerz W, Pilz S, at al. Aldosterone/Renin Ratio Determines Peripheral and Blood Pressure Values Over a Broad Range. J Am Coll Cardiol 2010-5-11; 55(19):2171-2180.
  2. Inker LA, Schmid CH, Tighiouart H, et al: Estimating glomerular filtration rate from serum creatinine and cystatin C. N Engl J Med 2012 Jul; 367(1):20-29.   http://dx.doi.org:/10.1056/NEJMoa1114248
  3. Buehrig CK, Larson TS, Bergert JH, et al: Cystatin C is superior to serum creatinine for the assessment of renal function. J Am Soc Nephrol 2001; 12:194A
  4. Grubb AO: Cystatin C – properties and use as a diagnostic marker. Adv Clin Chem 2000; 35:63-99
  5. Stevens LA, Coresh J, Schmid CH, Feldman H, et al. Estimating GFR using serum cystatin C alone and in combination with serum creatinine: a pooled analysis of 3,418 individuals with CKD.
    Am J Kidney Dis. 2008 Mar; 51(3):395-406. http://dx.doi.org:/10.1053/j.ajkd.2007.11.018
  6. Levey AS, Coresh J, Greene T, et al. Using standardized serum creatinine values in the modification of diet in renal disease study equation for estimating glomerular filtration rate. Ann Intern Med. 2006;145:247–254.
  7. Stevens LA, Coresh J, Greene T, Levey AS. Assessing kidney function – measured and estimated glomerular filtration rate. N Engl J Med. 2006; 354:2473–2483.
  8. Grubb A, Nyman U, Bjork J, et al. Simple cystatin C-based prediction equations for glomerular filtration rate compared with the Modification of Diet in Renal Disease Prediction Equation for adults and the Schwartz and the Counahan-Barratt Prediction Equations for children. Clin Chem. 2005; 51:1420–1431.
  9. Weir MR.  Improving the Estimating Equation for GFR — A Clinical Perspective. N Engl J Med 2012; 367:75-76.    http://dx.doi.org:/10.1056/NEJMe1204489
  10. Shlipak MG, Sarnak MJ, Katz R, Fried LF, et al. Cystatin C and the Risk of Death and Cardiovascular Events among Elderly Persons. http://journal.9med.net/qikan/article.php?id=216331
  11. Knight EL, Verhave JC, Spiegelman D, et al. Factors influencing serum cystatin C levels other than renal function and the impact on renal function measurementKidney International 2004; 65:1416–1421;  http://dx.doi.org:/10.1111/j.1523-1755.2004.00517.x
  12. Parag C. Patel, Colby R. Ayers, Sabina A. Murphy, et al. Association of Cystatin C with Left Ventricular Structure and Function (The Dallas Heart Study). Circulation: Heart Failure. 2009; 2: 98-104.  http://dx.doi.org:/10.1161/CIRCHEARTFAILURE.108.807271.
  13. Rule AD, Bergstralh EJ, Slezak JM, Bergert J, Larson TS. Glomerular filtraton rate estimated by cystatin C among different clinical presentations. Kidney Int. 2006; 69:399–405. http://dx.doi.org:/10.1038/sj.ki.5000073
  14. Muller B, Morgenthaler N, Stolz D, et al. Circulating levels of copeptin, a novel biomarker, in lower respiratory tract infections. Eur J Clin Invest 2007;37, 145–152.
  15. Stoiser B, Mortl D, Hulsmann M, et al. Copeptin, a fragment of the vasopressin precursor, as a novel predictor of outcome in heart failure.  Eur J Clin Invest Nov 2006; 36(11):771–778.
    http://dx.doi.org:/10.1111/j.1365-2362.2006.01724.x
  16. Meijer E, Bakker SJL, Helbesma N, et al. Copeptin, a surrogate marker of vasopressin, is associated with microalbuminuria in a large population cohort.  Kidney Intl 2010; 77:29–36.
    http://dx.doi.org:/10.1038/ki.2009.397
  17. Nickel NP, Lichtinghagen R, Golpon H, et al. Circulating levels of copeptin predict outcome in patients with pulmonary arterial hypertension. Respir Res. Nov 19, 2013; 14:130. http://dx.doi.org:/10.1186/1465-9921-14-130
  18. Tenderenda-Banasiuk E,  Wasilewska A, Filonowicz R, et al. Serum copeptin levels in adolescents with primary hypertension. Pediatr Nephrol. 2014; 29(3): 423–429.    doi:  10.1007/s00467-013-2683-5
  19. Richards M, Januzzi JL, and Troughton RW. Natriuretic Peptides in Heart Failure with Preserved Ejection Fraction.  Heart Failure Clin 2014; 10:453–470. http://dx.doi.org/10.1016/j.hfc.2014.04.006
  20. Maisel A, Mueller C, Nowak M and Peacock WF, et al. Midregion Prohormone Adrenomedullin and Prognosis in Patients Presenting with Acute Dyspnea Results from the BACH (Biomarkers in Acute Heart Failure) Trial. J Am Coll Cardiol 2011; 58(10):1057–67.  http://dx.doi.org:/10.1016/j.jacc.2011.06.006.
  21. Bernstein LH. Heart-Lung-Kidney: Essential Ties. Leaders in Pharmaceutical Innovation. http://pharmaceuticalinnovations.com
  22. Bernstein LH, Zions MY, Alam ME, et al.  What is the best approximation of reference normal for NT-proBNP? Clinical levels for enhanced assessment of NT-proBNP (CLEAN). J Med Lab and Diag 04/2011; 2:16-21. http://www.academicjournals.org/jmld
  23. Hijazi  Z., Wallentin  L., Siegbahn  A., et al; N-terminal pro-B-type natriuretic peptide for risk assessment in patients with atrial fibrillation: insights from the ARISTOTLE trial (Apixaban for the Prevention of Stroke in Subjects With Atrial Fibrillation. J Am Coll Cardiol. 2013; 61:2274-2284
  24. Paget V, Legedz L, Gaudebout N, et al. N-Terminal Pro-Brain Natriuretic Peptide A Powerful Predictor of Mortality in Hypertension. Hypertension. 2011; 57:702-709   http://hyper.ahajournals.org/content/57/4/702.full.pdf]
  25. Kim Han-Naand  Januzzi JL.  Natriuretic Peptide Testing in Heart Failure. Circulation 2011;  123: 2015-2019. http://dx.doi.org:/10.1161/CIRCULATIONAHA.110.979500
  26. Balta S, Demirkol S, Aydogan M, and Celik T. Higher N-Terminal Pro–B-Type Natriuretic Peptide May Be Related to Very Different Conditions.  J Am Coll Cardiol. 2013; 62(17):1634-1635.   http://dx.doi.org:/10.1016/j.jacc.2013.04.093
  27. Bernstein LH1, Zions MY, Haq SA, et al. Effect of renal function loss on NT-proBNP level variations. Clin Biochem. 2009 Jul; 42(10-11): 1091-8. http://dx.doi.org:/10.1016/j.clinbiochem.2009.02.027
  28. Afaq MA, Shoraki A, Oleg I, Bernstein L, and Stuart W. Zarich.  Validity of Amino Terminal pro-Brain Natiuretic Peptide in a Medically Complex Elderly Population. J Clin Med Res. 2011 Aug; 3(4): 156–163.   doi:  10.4021/jocmr606w
  29. Mark AL, Correia M, MorganDA, et al. New Concepts From the Emerging Biology of Obesity. Hypertension. 1999; 33[part II]:537-541.
  30. Himmelfarb J, Stenvinkel P, Ikizler TA and Hakim RM. The elephant in uremia: Oxidant stress as a unifying concept of cardiovascular disease in uremia. Kidney International (2002) 62, 1524–1538; http://dx.doi.org:/10.1046/j.1523-1755.2002.00600.x  http://www.nature.com/ki/journal/v62/n5/full/4493262a.html
  31. The blind men and the elephant. Poem by John Godfrey Saxe (Cartoon originally copyrighted by the authors; G. Renee Guzlas, artist). http://www.nature.com/ki/journal/v62/n5/thumbs/4493262f1bth.gif
  32. Fetter RB. Diagnosis Related Groups: Understanding Hospital Performance. Interfaces Jan. – Feb., 1991; 21(1), Franz Edelman Award Papers: 6-26
  33. Bernstein LH. Inadequacy of EHRs. Pharmaceutical Intelligence. http://pharmaceuticalintelligence.com/2015/11/05/inadequacy-of-ehrs/
  34. Celi LA,  Marshall JD, Lai Y, Stone DJ. Disrupting Electronic Health Records Systems: The Next Generation.  JMIR  Med Inform 2015 (23.10.15);  3(4) :e34
    http://dx.doi.org:/10.2196/medinform.4192
  35. Realtime Clinical Expert Support. Pharmaceutical Intelligence.  http://pharmaceuticalintelligence.com/2015/05/10/realtime-clinical-expert-support/
  36. McGowan JJ and Winstead-Fry P. Problem Knowledge Couplers: reengineering evidence-based medicine through interdisciplinary development, decision support, and research. Bull Med Libr Assoc. 1999 October;  87(4):462–470.)
  37. Rypka EW and Babb R. Automatic construction and use of an identification scheme. In MEDICAL RESEARCH ENGINEERING Apr 19709; (2):9-19. https://www.researchgate.net/publication/17720773_Automatic_construction_and_use_of_an_identification_scheme
  38. Rudolph, R. A., Bernstein, L. H. and Babb, J. Information induction for predicting acute myocardial infarction. Clinical Chemistry 1988; 34: 2031-2038.
  39. Bernstein LH, Qamar A, McPherson C, Zarich S. Evaluating a new graphical ordinal logit method (GOLDminer) in the diagnosis of myocardial infarction utilizing clinical features and laboratory data. Yale J Biol Med 1999; 72:259-268.
  40. Bernstein LH, Good IJ, Holtzman, Deaton ML, Babb J. Diagnosis of acute myocardial infarction from two measurements of creatine kinase isoenzyme MB with use of nonparametric probability estimation. Clin Chem 1989; 35(3):444-447.
  41. Bernstein LH. Regression: A richly textured method for comparison and classification of predictor variables. http://pharmaceuticalintelligence.com/2012/08/14/regression-a-richly-textured-method-for-comparison-and-classification-of-predictor-variables/
  42. Posada D and Buckley TR. Model Selection and Model Averaging in Phylogenetics: Advantages of Akaike Information Criterion and Bayesian Approaches over Likelihood Ratio Tests. Syst. Biol. 200; 53(5):793–808. http://dx.doi.org:/10.1080/10635150490522304
  1. Kullback S. and Leibler R. On Information and Sufficiency. Ann Math Statistics. Mar 1951; 22(1):79-86. http://www.csee.wvu.edu/~xinl/library/papers/math/statistics/Kullback_Leibler_1951.pdf
  2. Bernstein LH, David G, Rucinski J, Coifman RR. Converting Hematology Based Data Into an Inferential Interpretation. In INTECH Open Access Publisher, 2012. https://books.google.com/books/about/Converting_Hematology_Based_Data_Into_an.html
  3. Bernstein LH, David G, Coifman RR. Generating Evidence Based Interpretation of Hematology Screens via Anomaly Characterization. Open Clin Chem J 2011; 4:10-16
  4. Bernstein LH. Automated Inferential Diagnosis of SIRS, sepsis, septic shock. Medical Informatics View. http://pharmaceuticalintelligence.com/2012/08/01/automated-inferential-diagnosis-of-sirs-sepsis-septic-shock/
  5. Bernstein LH, David G, Coifman RR. The Automated Nutritional Assessment. Nutrition  2013; 29: 113-121


Other related articles published in this Open Access Online Scientific Journal include the following: 

Biomarkers and risk factors for cardiovascular events, endothelial dysfunction, and thromboembolic complications

Commentary on Biomarkers for Genetics and Genomics of Cardiovascular Disease: Views by Larry H Bernstein, MD, FCAP

Summary – Volume 4, Part 2: Translational Medicine in Cardiovascular Diseases

Pathophysiological Effects of Diabetes on Ischemic-Cardiovascular Disease and on Chronic Obstructive Pulmonary Disease (COPD)

Assessing Cardiovascular Disease with Biomarkers

Endothelial Function and Cardiovascular Disease

Adenosine Receptor Agonist Increases Plasma Homocysteine

Inadequacy of EHRs

Innervation of Heart and Heart Rate

Biomarker Guided Therapy

Pharmacogenomics

The Union of Biomarkers and Drug Development

Natriuretic Peptides in Evaluating Dyspnea and Congestive Heart Failure

Epilogue: Volume 4 – Translational, Post-Translational and Regenerative Medicine in Cardiology

Atherosclerosis Independence: Genetic Polymorphisms of Ion Channels Role in the Pathogenesis of Coronary Microvascular Dysfunction and Myocardial Ischemia (Coronary Artery Disease (CAD))

Erythropoietin (EPO) and Intravenous Iron (Fe) as Therapeutics for Anemia in Severe and Resistant CHF: The Elevated N-terminal proBNP Biomarker

Biomarkers: Diagnosis and Management, Present and Future

Genetic Analysis of Atrial Fibrillation

Landscape of Cardiac Biomarkers for Improved Clinical Utilization

Fractional Flow Reserve (FFR) & Instantaneous wave-free ratio (iFR): An Evaluation of Catheterization Lab Tools for Ischemic Assessment

Dealing with the Use of the High Sensitivity Troponin (hs cTn) Assays

Cardiotoxicity and Cardiomyopathy Related to Drugs Adverse Effects

Amyloidosis with Cardiomyopathy

Accurate Identification and Treatment of Emergent Cardiac Events

The potential contribution of informatics to healthcare is more than currently estimated

Realtime Clinical Expert Support

Metabolomics is about Metabolic Systems Integration

Automated Inferential Diagnosis of SIRS, sepsis, septic shock

Read Full Post »

Biology, Physiology and Pathophysiology of Heat Shock Proteins

Curation: Larry H. Bernstein, MD, FCAP


Heat Shock Proteins (HSP)

  1. Exploring the association of molecular chaperones, heat shock proteins, and the heat shock response in physiological/pathological processes

Hsp70 chaperones: Cellular functions and molecular mechanism

M. P. MayerB. Bukau
Cell and Molec Life Sci  Mar 2005; 62:670  http://dx.doi.org:/10.1007/s00018-004-4464-6

Hsp70 proteins are central components of the cellular network of molecular chaperones and folding catalysts. They assist a large variety of protein folding processes in the cell by transient association of their substrate binding domain with short hydrophobic peptide segments within their substrate proteins. The substrate binding and release cycle is driven by the switching of Hsp70 between the low-affinity ATP bound state and the high-affinity ADP bound state. Thus, ATP binding and hydrolysis are essential in vitro and in vivo for the chaperone activity of Hsp70 proteins. This ATPase cycle is controlled by co-chaperones of the family of J-domain proteins, which target Hsp70s to their substrates, and by nucleotide exchange factors, which determine the lifetime of the Hsp70-substrate complex. Additional co-chaperones fine-tune this chaperone cycle. For specific tasks the Hsp70 cycle is coupled to the action of other chaperones, such as Hsp90 and Hsp100.

70-kDa heat shock proteins (Hsp70s) assist a wide range of folding processes, including the folding and assembly of newly synthesized proteins, refolding of misfolded and aggregated proteins, membrane translocation of organellar and secretory proteins, and control of the activity of regulatory proteins [17]. Hsp70s have thus housekeeping functions in the cell in which they are built-in components of folding and signal transduction pathways, and quality control functions in which they proofread the structure of proteins and repair misfolded conformers. All of these activities appear to be based on the property of Hsp70 to interact with hydrophobic peptide segments of proteins in an ATP-controlled fashion. The broad spectrum of cellular functions of Hsp70 proteins is achieved through

  • the amplification and diversification of hsp70genes in evolution, which has generated specialized Hsp70 chaperones,
  • co-chaperones which are selectively recruited by Hsp70 chaperones to fulfill specific cellular functions and
  • cooperation of Hsp70s with other chaperone systems to broaden their activity spectrum. Hsp70 proteins with their co-chaperones and cooperating chaperones thus constitute a complex network of folding machines.

Protein folding processes assisted by Hsp70

The role of Hsp70s in the folding of non-native proteins can be divided into three related activities: prevention of aggregation, promotion of folding to the native state, and solubilization and refolding of aggregated proteins. In the cellular milieu, Hsp70s exert these activities in the quality control of misfolded proteins and the co- and posttranslational folding of newly synthesized proteins. Mechanistically related but less understood is the role of Hsp70s in the disassembly of protein complexes such as clathrin coats, viral capsids and the nucleoprotein complex, which initiates the replication of bacteriophage λ DNA. A more complex folding situation exists for the Hsp70-dependent control of regulatory proteins since several steps in the folding and activation process of these substrates are assisted by multiple chaperones.

Hsp70 proteins together with their co-chaperones of the J-domain protein (JDP) family prevent the aggregation of non-native proteins through association with hydrophobic patches of substrate molecules, which shields them from intermolecular interactions (‘holder’ activity). Some JDPs such as Escherichia coli DnaJ and Saccharomyces cerevisiae Ydj1 can prevent aggregation by themselves through ATP-independent transient and rapid association with the substrates. Only members of the Hsp70 family with general chaperone functions have such general holder activity.

Hsp70 chaperone systems assist non-native folding intermediates to fold to the native state (‘folder’ activity). The mechanism by which Hsp70-chaperones assist the folding of non-native substrates is still unclear. Hsp70-dependent protein folding in vitro occurs typically on the time scale of minutes or longer. Substrates cycle between chaperone-bound and free states until the ensemble of molecules has reached the native state. There are at least two alternative modes of action. In the first mechanism Hsp70s play a rather passive role. Through repetitive substrate binding and release cycles they keep the free concentration of the substrate sufficiently low to prevent aggregation, while allowing free molecules to fold to the native state (‘kinetic partitioning’). In the second mechanism, the binding and release cycles induce local unfolding in the substrate, e.g. the untangling of a misfolded β-sheet, which helps to overcome kinetic barriers for folding to the native state (‘local unfolding’) [8–11]. The energy of ATP may be used to induce such conformational changes or alternatively to drive the ATPase cycle in the right direction.

Hsp70 in cellular physiology and pathophysiology

Two Hsp70 functions are especially interesting, de novo folding of nascent polypeptides and interaction with signal transduction proteins, and therefore some aspects of these functions shall be discussed below in more detail. Hsp70 chaperones were estimated to assist the de novo folding of 10–20% of all bacterial proteins whereby the dependence on Hsp70 for efficient folding correlated with the size of the protein [12]. Since the average protein size in eukaryotic cells is increased (52 kDa in humans) as compared to bacteria (35 kDa in E. coli) [25], it is to be expected that an even larger percentage of eukaryotic proteins will be in need of Hsp70 during de novo folding. This reliance on Hsp70 chaperones increases even more under stress conditions. Interestingly, mutated proteins [for example mutant p53, cystis fibrosis transmembrane regulator (CFTR) variant ΔF508, mutant superoxid dismutase (SOD) 1] seem to require more attention by the Hsp70 chaperones than the corresponding wild-type protein [2629]. As a consequence of this interaction the function of the mutant protein can be preserved. Thereby Hsp70 functions as a capacitor, buffering destabilizing mutations [30], a function demonstrated earlier for Hsp90 [3132]. Such mutations are only uncovered when the overall need for Hsp70 action exceeds the chaperone capacity of the Hsp70 proteins, for example during stress conditions [30], at certain stages in development or during aging, when the magnitude of stress-induced increase in Hsp70 levels declines [3334]. Alternatively, the mutant protein can be targeted by Hsp70 and its co-chaperones to degradation as shown e.g. for CFTRΔF508 and some of the SOD1 mutant proteins [35,36]. Deleterious mutant proteins may then only accumulate when Hsp70 proteins are overwhelmed by other, stress-denatured proteins. Both mechanisms may contribute to pathological processes such as oncogenesis (mutant p53) and neurodegenerative diseases, including amyotrophic, lateral sclerosis (SOD1 mutations), Parkinsonism (α-synuclein mutations), Huntington’s chorea (huntingtin with polyglutamin expansions) and spinocerebellar ataxias (proteins with polyglutamin expansions).

De novo folding is not necessarily accelerated by Hsp70 chaperones. In some cases folding is delayed for different reasons. First, folding of certain proteins can only proceed productively after synthesis of the polypeptide is completed as shown, e.g. for the reovirus lollipop-shaped protein sigma 1 [37]. Second, proteins destined for posttranslational insertion into organellar membranes are prevented from aggregation and transported to the translocation pore [38]. Third, in the case of the caspase-activated DNase (CAD), the active protein is dangerous for the cell and therefore can only complete folding in the presence of its specific inhibitor (ICAD). Hsp70 binds CAD cotranslationally and mediates folding only to an intermediate state. Folding is completed after addition of ICAD, which is assembled into a complex with CAD in an Hsp70-dependent manner [39]. Similar folding pathways may exist also for other potentially dangerous proteins.

As mentioned above Hsp70 interacts with key regulators of many signal transduction pathways controlling cell homeostasis, proliferation, differentiation and cell death. The interaction of Hsp70 with these regulatory proteins continues in activation cycles that also involve Hsp90 and a number of co-chaperones. The regulatory proteins, called clients, are thereby kept in an inactive state from which they are rapidly activated by the appropriate signals. Hsp70 and Hsp90 thus repress regulators in the absence of the upstream signal and guarantee full activation after the signal transduction pathway is switched on [6]. Hsp70 can be titrated away from these clients by other misfolded proteins that may arise from internal or external stresses. Consequently, through Hsp70 disturbances of the cellular system induced by environmental, developmental or pathological processes act on these signal transduction pathways.

In this way stress response and apoptosis are linked to each other. Hsp70 inhibits apoptosis acting on the caspase-dependent pathway at several steps both upstream and downstream of caspase activation and on the caspase-independent pathway. Overproduction of Hsp70 leads to increased resistance against apoptosis-inducing agents such as tumor necrosis factor-α(TNFα), staurosporin and doxorubicin, while downregulation of Hsp70 levels by antisense technology leads to increased sensitivity towards these agents [1840]. This observation relates to many pathological processes, such as oncogenesis, neurodegeneration and senescence. In many tumor cells increased Hsp70 levels are observed and correlate with increased malignancy and resistance to therapy. Downregulation of the Hsp70 levels in cancer cells induce differentiation and cell death [41]. Neurodegenerative diseases such as Alzheimer’s disease, Parkinson’s disease, Huntington’s corea and spinocerebellar ataxias are characterized by excessive apoptosis. In several different model systems overexpression of Hsp70 or one of its co-chaperones could overcome the neurodegenerative symptoms induced by expression of a disease-related gene (huntingtin, α-synuclein or ataxin) [20,42]. Senescence in cell culture as well as aging in vivo is correlated with a continuous decline in the ability to mount a stress response [3443]. Age-related symptoms and diseases reflect this decreased ability to cope with cellular stresses. Interestingly, centenarians seem to be an exception to the rule, as they show a significant induction of Hsp70 production after heat shock challenge [44].

ATPase domain and ATPase cycle

Substrate binding

The coupling mechanism: nucleotide-controlled opening and closing of the substrate binding cavity

The targeting activity of co-chaperones

J-domain proteins

Bag proteins

Hip, Hop and CHIP

Perspectives

The Hsp70 protein family and their co-chaperones constitute a complex network of folding machines which is utilized by cells in many ways. Despite considerable progress in the elucidation of the mechanistic basis of these folding machines, important aspects remain to be solved. With respect to the Hsp70 proteins it is still unclear whether their activity to assist protein folding relies on the ability to induce conformational changes in the bound substrates, how the coupling mechanism allows ATP to control substrate binding and to what extent sequence variations within the family translate into variations of the mechanism. With respect to the action of co-chaperones we lack a molecular understanding of the coupling function of JDPs and of how co-chaperones target their Hsp70 partner proteins to substrates. Furthermore, it can be expected that more cellular processes will be discovered that depend on the chaperone activity of Hsp70 chaperones.


  1. The biochemistry and ultrastructure of molecular chaperones

Structure and Mechanism of the Hsp90 Molecular Chaperone Machinery

Laurence H. Pearl and Chrisostomos Prodromou
Ann Rev of Biochem July 2006;75:271-294
http://dx.doi.org:/10.1146/annurev.biochem.75.103004.142738

Heat shock protein 90 (Hsp90) is a molecular chaperone essential for activating many signaling proteins in the eukaryotic cell. Biochemical and structural analysis of Hsp90 has revealed a complex mechanism of ATPase-coupled conformational changes and interactions with cochaperone proteins, which facilitate activation of Hsp90’s diverse “clientele.” Despite recent progress, key aspects of the ATPase-coupled mechanism of Hsp90 remain controversial, and the nature of the changes, engendered by Hsp90 in client proteins, is largely unknown. Here, we discuss present knowledge of Hsp90 structure and function gleaned from crystallographic studies of individual domains and recent progress in obtaining a structure for the ATP-bound conformation of the intact dimeric chaperone. Additionally, we describe the roles of the plethora of cochaperones with which Hsp90 cooperates and growing insights into their biochemical mechanisms, which come from crystal structures of Hsp90 cochaperone complexes.


  1. Properties of heat shock proteins (HSPs) and heat shock factor (HSF)

Heat shock factors: integrators of cell stress, development and lifespan

Malin Åkerfelt,*‡ Richard I. Morimoto,§ and Lea Sistonen*‡
Nat Rev Mol Cell Biol. 2010 Aug; 11(8): 545–555.  doi:  10.1038/nrm2938

Heat shock factors (HSFs) are essential for all organisms to survive exposures to acute stress. They are best known as inducible transcriptional regulators of genes encoding molecular chaperones and other stress proteins. Four members of the HSF family are also important for normal development and lifespan-enhancing pathways, and the repertoire of HSF targets has thus expanded well beyond the heat shock genes. These unexpected observations have uncovered complex layers of post-translational regulation of HSFs that integrate the metabolic state of the cell with stress biology, and in doing so control fundamental aspects of the health of the proteome and ageing.

In the early 1960s, Ritossa made the seminal discovery of temperature-induced puffs in polytene chromosomes of Drosophila melanogaster larvae salivary glands1. A decade later, it was shown that the puffing pattern corresponded to a robust activation of genes encoding the heat shock proteins (HSPs), which function as molecular chaperones2. The heat shock response is a highly conserved mechanism in all organisms from yeast to humans that is induced by extreme proteotoxic insults such as heat, oxidative stress, heavy metals, toxins and bacterial infections. The conservation among different eukaryotes suggests that the heat shock response is essential for survival in a stressful environment.

The heat shock response is mediated at the transcriptional level by cis-acting sequences called heat shock elements (HSEs; BOX 1) that are present in multiple copies upstream of the HSP genes3. The first evidence for a specific transcriptional regulator, the heat shock factor (HSF) that can bind to the HSEs and induce HSP gene expression, was obtained through DNA–protein interaction studies on nuclei isolated from D. melanogaster cells4,5. Subsequent studies showed that, in contrast to a single HSF in invertebrates, multiple HSFs are expressed in plants and vertebrates68. The mammalian HSF family consists of four members: HSF1,HSF2, HSF3 and HSF4. Distinct HSFs possess unique and overlapping functions (FIG. 1), exhibit tissue-specific patterns of expression and have multiple post-translational modifications (PTMs) and interacting protein partners7,9,10. Functional crosstalk between HSF family members and PTMs facilitates the fine-tuning of HSF-mediated gene regulation. The identification of many targets has further extended the impact of HSFs beyond the heat shock response. Here, we present the recent discoveries of novel target genes and physiological functions of HSFs, which have changed the view that HSFs act solely in the heat shock response. Based on the current knowledge of small-molecule activators and inhibitors of HSFs, we also highlight the potential for pharmacologic modulation of HSF-mediated gene regulation.

Box 1

The heat shock element

http://www.ncbi.nlm.nih.gov/pmc/articles/PMC3402356/bin/nihms281610u1.jpg

Heat shock factors (HSFs) act through a regulatory upstream promoter element, called the heat shock element (HSE). In the DNA-bound form of a HSF, each DNA-binding domain (DBD) recognizes the HSE in the major groove of the double helix6. The HSE was originally identified using S1 mapping of transcripts of the Drosophila melanogaster heat shock protein (HSP) genes3 (see the figure; part a). Residues –47 to –66 are necessary for heat inducibility. HSEs in HSP gene promoters are highly conserved and consist of inverted repeats of the pentameric sequence nGAAn132. The type of HSEs that can be found in the proximal promoter regions of HSP genes is composed of at least three contiguous inverted repeats: nTTCnnGAAnnTTCn132134. The promoters of HSF target genes can also contain more than one HSE, thereby allowing the simultaneous binding of multiple HSFs. The binding of an HSF to an HSE occurs in a cooperative manner, whereby binding of an HSF trimer facilitates binding of the next one135. More recently, Trinklein and colleagues used chromatin immunoprecipitation to enrich sequences bound by HSF1 in heat-shocked human cells to define the HSE consensus sequence. They confirmed the original finding of Xiao and Lis, who identified guanines as the most conserved nucleotides in HSEs87,133 (see the figure; part b). Moreover, in a pair of inverted repeats, a TTC triplet 5′ of a GAA triplet is separated by a pyrimidine–purine dinucleotide, whereas the two nucleotides separating a GAA triplet 5′ from a TTC triplet is unconstrained87. The discovery of novel HSF target genes that are not involved in the heat shock response has rendered it possible that there may be HSEs in many genes other than the HSP genes. Although there are variations in these HSEs, the spacing and position of the guanines are invariable7. Therefore, both the nucleotides and the exact spacing of the repeated units are considered as key determinants for recognition by HSFs and transcriptional activation. Part b of the figure is modified, with permission, from REF. 87 © (2004) The American Society for Cell Biology.

Figure 1     http://www.ncbi.nlm.nih.gov/pmc/articles/PMC3402356/bin/nihms281610f1.gif

The mammalian HSF machinery

HSFs as stress integrators

A hallmark of stressed cells and organisms is the increased synthesis of HSPs, which function as molecular chaperones to prevent protein misfolding and aggregation to maintain protein homeostasis, also called proteostasis11. The transcriptional activation of HSP genes is mediated by HSFs (FIG. 2a), of which HSF1 is the master regulator in vertebrates. Hsf1-knockout mouse and cell models have revealed that HSF1 is a prerequisite for the transactivation of HSP genes, maintenance of cellular integrity during stress and development of thermotolerance1215. HSF1 is constitutively expressed in most tissues and cell types16, where it is kept inactive in the absence of stress stimuli. Thus, the DNA-binding and transactivation capacity of HSF1 are coordinately regulated through multiple PTMs, protein–protein interactions and subcellular localization. HSF1 also has an intrinsic stress-sensing capacity, as both D. melanogaster and mammalian HSF1 can be converted from a monomer to a homotrimer in vitro in response to thermal or oxidative stress1719.

Figure 2    http://www.ncbi.nlm.nih.gov/pmc/articles/PMC3402356/bin/nihms281610f2.gif

Members of the mammalian HSF family

Functional domains

HSFs, like other transcription factors, are composed of functional domains. These have been most thoroughly characterized for HSF1 and are schematically presented in FIG. 2b. The DNA-binding domain (DBD) is the best preserved domain in evolution and belongs to the family of winged helix-turn-helix DBDs2022. The DBD forms a compact globular structure, except for a flexible wing or loop that is located between β-strands 3 and 4 (REF. 6). This loop generates a protein– protein interface between adjacent subunits of the HSF trimer that enhances high-affinity binding to DNA by cooperativity between different HSFs23. The DBD can also mediate interactions with other factors to modulate the transactivating capacity of HSFs24. Consequently, the DBD is considered as the signature domain of HSFs for target-gene recognition.

The trimerization of HSFs is mediated by arrays of hydrophobic heptad repeats (HR-A and HR-B) that form a coiled coil, which is characteristic for many Leu zippers6,25 (FIG. 2b). The trimeric assembly is unusual, as Leu zippers typically facilitate the formation of homodimers or heterodimers. Suppression of spontaneous HSF trimerization is mediated by yet another hydrophobic repeat, HR-C2628. Human HSF4 lacks the HR-C, which could explain its constitutive trimerization and DNA-binding activity29. Positioned at the extreme carboxyl terminus of HSFs is the transactivation domain, which is shared among all HSFs6except for yeast Hsf, which has transactivation domains in both the amino and C termini, and HSF4A, which completely lacks a transactivation domain2931. In HSF1, the transactivation domain is composed of two modules — AD1 and AD2, which are rich in hydrophobic and acidic residues (FIG. 3a) — that together ensures a rapid and prolonged response to stress32,33. The transactivation domain was originally proposed to provide stress inducibility to HSF1 (REFS 34,35), but it soon became evident that an intact regulatory domain, located between the HR-A and HR-B and the transactivation domain, is essential for the responsiveness to stress stimuli32,33,36,37. Because several amino acids that are known targets for different PTMs reside in the regulatory domain33,3842, the structure and function of this domain are under intensive investigation.

Figure 3    http://www.ncbi.nlm.nih.gov/pmc/articles/PMC3402356/bin/nihms281610f3.gif

HSF1 undergoes multiple PTMs on activation

Regulation of the HSF1 activation–attenuation cycle

The conversion of the inactive monomeric HSF1 to high-affinity DNA-binding trimers is the initial step in the multistep activation process and is a common feature of all eukaryotic HSFs43,44 (FIG. 3b). There is compelling evidence for HSF1 interacting with multiple HSPs at different phases of its activation cycle. For example, monomeric HSF1 interacts weakly with HSP90 and, on stress, HSF1 dissociates from the complex, allowing HSF1 trimerization45,46 (FIG. 3b). Trimeric HSF1 can be kept inactive when its regulatory domain is bound by a multi-chaperone complex of HSP90, co-chaperone p23 (also known as PTGES3) and immunophilin FK506-binding protein 5 (FKBP52; also known as FKBP4)4651. Elevated levels of both HSP90 and HSP70 negatively regulate HSF1 and prevent trimer formation on heat shock52. Activated HSF1 trimers also interact with HSP70 and the co-chaperone HSP40 (also known as DNAJB1), but instead of suppressing the DNA-binding activity of HSF1, this interaction inhibits its transactivation capacity5254. Although the inhibitory mechanism is still unknown, the negative feedback from the end products of HSF1-dependent transcription (the HSPs) provides an important control step in adjusting the duration and intensity of HSF1 activation according to the levels of chaperones and presumably the levels of nascent and misfolded peptides.

A ribonucleoprotein complex containing eukaryotic elongation factor 1A (eEF1A) and a non-coding RNA, heat shock RNA-1 (HSR-1), has been reported to possess a thermosensing capacity. According to the proposed model, HSR-1 undergoes a conformational change in response to heat stress and together with eEF1A facilitates trimerization of HSF1 (REF. 55). How this activation mode relates to the other regulatory mechanisms associated with HSFs remains to be elucidated.

Throughout the activation–attenuation cycle, HSF1 undergoes extensive PTMs, including acetylation, phosphorylation and sumoylation (FIG. 3). HSF1 is also a phosphoprotein under non-stress conditions, and the results from mass spectrometry (MS) analyses combined with phosphopeptide mapping experiments indicate that at least 12 Ser residues are phosphorylated41,5659. Among these sites, stress-inducible phosphorylation of Ser230 and Ser326 in the regulatory domain contributes to the transactivation function of HSF1 (REFS 38,41). Phosphorylation-mediated sumoylation on a single Lys residue in the regulatory domain occurs rapidly and transiently on exposure to heat shock; Ser303 needs to be phosphorylated before a small ubiquitin-related modifier (SUMO) can be conjugated to Lys298 (REF. 39). The extended consensus sequence ΨKxExxSP has been named the phosphorylation-dependent sumoylation motif (PDSM; FIG. 3)40. The PDSM was initially discovered in HSF1 and subsequently found in many other proteins, especially transcriptional regulators such as HSF4, GATA1, myocyte-specific enhancer factor 2A (MEF2A) and SP3, which are substrates for both SUMO conjugation and Pro-directed kinases40,6062.

Recently, Mohideen and colleagues showed that a conserved basic patch on the surface of the SUMO-conjugating enzyme ubiquitin carrier protein 9 (UBC9; also known as UBE2I) discriminates between the phosphorylated and non-phosphorylated PDSM of HSF1 (REF. 63). Future studies will be directed at elucidating the molecular mechanisms for dynamic phosphorylation and UBC9-dependent SUMO conjugation in response to stress stimuli and establishing the roles of kinases, phosphatases and desumoylating enzymes in the heat shock response. The kinetics of phosphorylation-dependent sumoylation of HSF1 correlates inversely with the severity of heat stress, and, as the transactivation capacity of HSF1 is impaired by sumoylation and this PTM is removed when maximal HSF1 activity is required40, sumoylation could modulate HSF1 activity under moderate stress conditions. The mechanisms by which SUMO modification represses the transactivating capacity of HSF1, and the functional relationship of this PTM with other modifications that HSF1 is subjected to, will be investigated with endogenous substrate proteins.

Phosphorylation and sumoylation of HSF1 occur rapidly on heat shock, whereas the kinetics of acetylation are delayed and coincide with the attenuation phase of the HSF1 activation cycle. Stress-inducible acetylation of HSF1 is regulated by the balance of acetylation by p300–CBP (CREB-binding protein) and deacetylation by the NAD+-dependent sirtuin, SIRT1. Increased expression and activity of SIRT1 enhances and prolongs the DNA-binding activity of HSF1 at the human HSP70.1promoter, whereas downregulation of SIRT1 enhances the acetylation of HSF1 and the attenuation of DNA-binding without affecting the formation of HSF1 trimers42. This finding led to the discovery of a novel regulatory mechanism of HSF1 activity, whereby SIRT1 maintains HSF1 in a state that is competent for DNA binding by counteracting acetylation (FIG. 3). In the light of current knowledge, the attenuation phase of the HSF1 cycle is regulated by a dual mechanism: a dependency on the levels of HSPs that feed back directly by weak interactions with HSF1, and a parallel step that involves the SIRT1-dependent control of the DNA-binding activity of HSF1. Because SIRT1 has been implicated in caloric restriction and ageing, the age-dependent loss of SIRT1 and impaired HSF1 activity correlate with an impairment of the heat shock response and proteostasis in senescent cells, connecting the heat shock response to nutrition and ageing (see below).

HSF dynamics on the HSP70 promoter

For decades, the binding of HSF to the HSP70.1 gene has served as a model system for inducible transcription in eukaryotes. In D. melanogaster, HSF is constitutively nuclear and low levels of HSF are associated with the HSP70promoter before heat shock6466. The uninduced HSP70 promoter is primed for transcription by a transcriptionally engaged paused RNA polymerase II (RNAP II)67,68. RNAP II pausing is greatly enhanced by nucleosome formation in vitro, implying that chromatin remodelling is crucial for the release of paused RNAP II69. It has been proposed that distinct hydrophobic residues in the transactivation domain of human HSF1 can stimulate RNAP II release and directly interact withBRG1, the ATPase subunit of the chromatin remodelling complex SWI/SNF70,71. Upon heat shock, RNAP II is released from its paused state, leading to the synthesis of a full-length transcript. Rapid disruption of nucleosomes occurs across the entire HSP70 gene, at a rate that is faster than RNAP II-mediated transcription72. The nucleosome displacement occurs simultaneously with HSF recruitment to the promoter in D. melanogaster. Downregulation of HSF abrogates the loss of nucleosomes, indicating that HSF provides a signal for chromatin rearrangement, which is required for HSP70 nucleosome displacement. Within seconds of heat shock, the amount of HSF at the promoter increases drastically and HSF translocates from the nucleoplasm to several native loci, including HSP genes. Interestingly, the levels of HSF occupying the HSP70 promoter reach saturation soon after just one minute65,73.

HSF recruits the co-activating mediator complex to the heat shock loci, which acts as a bridge to transmit activating signals from transcription factors to the basal transcription machinery. The mediator complex is recruited by a direct interaction with HSF: the transactivation domain of D. melanogaster HSF binds to TRAP80(also known as MED17), a subunit of the mediator complex74. HSF probably has other macromolecular contacts with the preinitiation complex as it binds to TATA-binding protein (TBP) and the general transcription factor TFIIB in vitro75,76. In contrast to the rapid recruitment and elongation of RNAP II on heat shock, activated HSF exchanges very slowly at the HSP70 promoter. HSF stays stably bound to DNA in vivo and no turnover or disassembly of transcription activator is required for successive rounds of HSP70 transcription65,68.

Functional interplay between HSFs

Although HSF1 is the principal regulator of the heat shock response, HSF2 also binds to the promoters of HSP genes. In light of our current knowledge, HSF2 strictly depends on HSF1 for its stress-related functions as it is recruited to HSP gene promoters only in the presence of HSF1 and this cooperation requires an intact HSF1 DBD77. Nevertheless, HSF2 modulates, both positively and negatively, the HSF1-mediated inducible expression of HSP genes, indicating that HSF2 can actively participate in the transcriptional regulation of the heat shock response. Coincident with the stress-induced transcription of HSP genes, HSF1 and HSF2 colocalize and accumulate rapidly on stress into nuclear stress bodies (NSBs; BOX 2), where they bind to a subclass of satellite III repeats, predominantly in the human chromosome 9q12 (REFS 7880). Consequently, large and stable non-coding satellite III transcripts are synthesized in an HSF1-dependent manner in NSBs81,82. The function of these transcripts and their relationship with other HSF1 targets, and the heat shock response in general, remain to be elucidated.


Box 2

Nuclear stress bodies  

http://www.ncbi.nlm.nih.gov/pmc/articles/PMC3402356/bin/nihms281610u2.jpg

The cell nucleus is highly compartmentalized and dynamic. Many nuclear factors are diffusely distributed throughout the nucleoplasm, but they can also accumulate in distinct subnuclear compartments, such as nucleoli, speckles, Cajal bodies and promyelocytic leukaemia (PML) bodies136. Nuclear stress bodies (NSBs) are different from any other known nuclear bodies137,138. Although NSBs were initially thought to contain aggregates of denatured proteins and be markers of heat-shocked cells, their formation can be elicited by various stresses, such as heavy metals and proteasome inhibitors137. NSBs are large structures, 0.3–3 μm in diameter, and are usually located close to the nucleoli or nuclear envelope137,138. NSBs consist of two populations: small, brightly stained bodies and large, clustered and ring-like structures137.

NSBs appear transiently and are the main site of heat shock factor 1 (HSF1) and HSF2 accumulation in stressed human cells80. HSF1 and HSF2 form a physically interacting complex and colocalize into small and barely detectable NSBs after only five minutes of heat shock, but the intensity and size of NSBs increase after hours of continuous heat shock. HSF1 and HSF2 colocalize in HeLa cells that have been exposed to heat shock for one hour at 42°C (see the figure; confocal microscopy image with HSF1–green fluorescent protein in green and endogenous HSF2 in red). NSBs form on specific chromosomal loci, mainly on q12 of human chromosome 9, where HSFs bind to a subclass of satellite III repeats78,79,83. Stress-inducible and HSF1-dependent transcription of satellite III repeats has been shown to produce non-coding RNA molecules, called satellite III transcripts81,82. The 9q12 locus consists of pericentromeric heterochromatin, and the satellite III repeats provide scaffolds for docking components, such as splicing factors and other RNA-processing proteins139143.

HSF2 also modulates the heat shock response through the formation of heterotrimers with HSF1 in the NSBs when bound to the satellite III repeats83 (FIG. 4). Studies on the functional significance of heterotrimerization indicate that HSF1 depletion prevents localization of HSF2 to NSBs and abolishes the stress-induced synthesis of satellite III transcripts. By contrast, increased expression of HSF2 leads to its own activation and the localization of both HSF1 and HSF2 to NSBs, where transcription is spontaneously induced in the absence of stress stimuli. These results suggest that HSF2 can incorporate HSF1 into a transcriptionally competent heterotrimer83. It is possible that the amounts of HSF2 available for heterotrimerization with HSF1 influence stress-inducible transcription, and that HSF1–HSF2 heterotrimers regulate transcription in a temporal manner. During the acute phase of heat shock, HSF1 is activated and HSF1–HSF2 heterotrimers are formed, whereas upon prolonged exposures to heat stress the levels of HSF2 are diminished, thereby limiting heterotrimerization83. Intriguingly, in specific developmental processes such as corticogenesis and spermatogenesis, the expression of HSF2 increases spatiotemporarily, leading to its spontaneous activation. Therefore, it has been proposed that HSF-mediated transactivation can be modulated by the levels of HSF2 to provide a switch that integrates the responses to stress and developmental stimuli83 (FIG. 4). Functional relationships between different HSFs are emerging, and the synergy of DNA-binding activities among HSF family members offers an efficient way to control gene expression in a cell- and stimulus-specific manner to orchestrate the differential upstream signalling and target-gene networks.

Figure 4   http://www.ncbi.nlm.nih.gov/pmc/articles/PMC3402356/bin/nihms281610f4.gif


Interactions between different HSFs provide distinct functional modes in transcriptional regulation

A new member of the mammalian HSF family, mouse HSF3, was recently identified10. Avian HSF3 was shown to be activated at higher temperatures and with different kinetics than HSF1 (REF. 84), whereas in mice, heat shock induces the nuclear translocation of HSF3 and activation of stress-responsive genes other than HSP genes10. Future experiments will determine whether HSF3 is capable of interacting with other HSFs, potentially through heterocomplex formation. HSF4 has not been implicated in the heat shock response, but it competes with HSF1 for common target genes in mouse lens epithelial cells85, which will be discussed below. It is important to elucidate whether the formation of homotrimers or hetero trimers between different family members is a common theme in HSF-mediated transcriptional regulation.


HSFs as developmental regulators

Evidence is accumulating that HSFs are highly versatile transcription factors that, in addition to protecting cells against proteotoxic stress, are vital for many physioogical functions, especially during development. The initial observations using deletion experiments of the D. melanogaster Hsf gene revealed defective oogenesis and larvae development86. These effects were not caused by obvious changes in HSP gene expression patterns, which is consistent with the subsequent studies showing that basal expression of HSP genes during mouse embryogenesis is not affected by the lack of HSF1 (REF. 13). These results are further supported by genome-wide gene expression studies revealing that numerous genes, not classified as HSP genes or molecular chaperones, are under HSF1-dependent control87,88.

Although mice lacking HSF1 can survive to adulthood, they exhibit multiple defects, such as increased prenatal lethality, growth retardation and female infertility13. Fertilized oocytes do not develop past the zygotic stage when HSF1-deficient female mice are mated with wild-type male mice, indicating that HSF1 is a maternal factor that is essential for early post-fertilization development89. Recently, it was shown that HSF1 is abundantly expressed in maturing oocytes, where it regulates specifically Hsp90α transcription90. The HSF1-deficient oocytes are devoid of HSP90α and exhibit a blockage of meiotic maturation, including delayed G2–M transition or germinal vesicle breakdown and defective asymmetrical division90. Moreover, intra-ovarian HSF1-depleted oocytes contain dysfunctional mitochondria and are sensitive to oxidative stress, leading to reduced survival91. The complex phenotype of Hsf1-knockout mice also demonstrates the involvement of HSF1 in placenta formation, placode development and the immune system15,85,92,93, further strengthening the evidence for a protective function of HSF1 in development and survival.

Both HSF1 and HSF2 are key regulators in the developing brain and in maintaining proteostasis in the central nervous system. Disruption of Hsf1 results in enlarged ventricles, accompanied by astrogliosis, neurodegeneration, progressive myelin loss and accumulation of ubiquitylated proteins in specific regions of the postnatal brain under non-stressed conditions94,95. The expression of HSP25 (also known as HSPB1) and α-crystallin B chain (CRYAB), which are known to protect cells against stress-induced protein damage and cell death, is dramatically decreased in brains lacking HSF1 (REF. 13). In contrast to HSF1, HSF2 is already at peak levels during early brain development in mice and is predominantly expressed in the proliferative neuronal progenitors of the ventricular zone and post-mitotic neurons of the cortical plate9699. HSF2-deficient mice have enlarged ventricles and defects in cortical lamination owing to abnormal neuronal migration9799. Incorrect positioning of superficial neurons during cortex formation in HSF2-deficient embryos is caused by decreased expression of the cyclin-dependent kinase 5 (CDK5) activator p35, which is a crucial regulator of the cortical migration signalling pathway100,101. The p35 gene was identified as the first direct target of HSF2 in cortex development99. As correct cortical migration requires the coordination of multiple signalling molecules, it is likely that HSF2, either directly or indirectly, also regulates other components of the same pathway.


Cooperativity of HSFs in development

In adult mice, HSF2 is most abundantly expressed in certain cell types of testes, specifically pachytene spermatocytes and round spermatids102. The cell-specific expression of HSF2 in testes is regulated by a microRNA, miR-18, that directly binds to the 3′ untranslated region (UTR) of HSF2 (J.K. Björk, A. Sandqvist, A.N. Elsing, N. Kotaja and L.S., unpublished observations). Targeting of HSF2 in spermatogenesis reveals the first physiological role for miR-18, which belongs to the oncomir-1 cluster associated mainly with tumour progression103. In accordance with the expression pattern during the maturation of male germ cells, HSF2-null male mice display several abnormal features in spermatogenesis, ranging from smaller testis size and increased apoptosis at the pachytene stage to a reduced amount of sperm and abnormal sperm head shape97,98,104. A genome-wide search for HSF2 target promoters in mouse testis revealed the occupancy of HSF2 on the sex chromosomal multi-copy genes spermiogenesis specific transcript on the Y 2 (Ssty2), Sycp3-like Y-linked (Sly) and Sycp3-like X-linked (Slx), which are important for sperm quality104. Compared with the Hsf2-knockout phenotype, disruption of both Hsf1 and Hsf2 results in a more pronounced phenotype, including larger vacuolar structures, more widely spread apoptosis and a complete lack of mature spermatozoa and male sterility105. The hypo thesis that the activities of HSF1 and HSF2 are intertwined and essential for spermatogenesis is further supported by our results that HSF1 and HSF2 synergistically regulate the sex chromosomal multi-copy genes in post-meiotic round spermatids (M.Å., A. Vihervaara, E.S. Christians, E. Henriksson and L.S., unpublished observations). Given that the sex chromatin mostly remains silent after meiosis, HSF1 and HSF2 are currently the only known transcriptional regulators during post-meiotic repression. These results, together with the earlier findings that HSF2 can also form heterotrimers with HSF1 in testes83, strongly suggest that HSF1 and HSF2 act in a heterocomplex and fine-tune transcription of their common target genes during the maturation of male germ cells.

HSF1 and HSF4 are required for the maintenance of sensory organs, especially when the organs are exposed to environmental stimuli for the first time after birth85,88. During the early postnatal period, Hsf1-knockout mice display severe atrophy of the olfactory epithelium, increased accumulation of mucus and death of olfactory sensory neurons88. Although lens development in HSF4-deficient mouse embryos is normal, severe abnormalities, including inclusion-like structures in lens fibre cells, appear soon after birth and the mice develop cataracts85,106,107. Intriguingly, inherited severe cataracts occurring in Chinese and Danish families have been associated with a mutation in the DBD of HSF4 (REF. 108). In addition to the established target genes, Hsp25Hsp70 and Hsp90, several new targets for HSF1 and HSF4, such as crystallin γF (Crygf), fibroblast growth factor 7 (Fgf7) and leukaemia inhibitory factor (Lif) have been found to be crucial for sensory organs85,88. Furthermore, binding of either HSF1 or HSF4 to the Fgf7 promoter shows opposite effects on gene expression, suggesting competitive functions between the two family members85. In addition to the proximal promoters, HSF1, HSF2 and HSF4 bind to other genomic regions (that is, introns and distal parts of protein-coding genes in mouse lens), and there is also evidence for either synergistic interplay or competition between distinct HSFs occupying the target-gene promoters109. It is possible that the different HSFs are able to compensate for each other to some extent. Thus, the identification of novel functions and target genes for HSFs has been a considerable step forward in understanding their regulatory mechanisms in development.


HSFs and lifespan

The lifespan of an organism is directly linked to the health of its tissues, which is a consequence of the stability of the proteome and functionality of its molecular machineries. During its lifetime, an organism constantly encounters environmental and physiological stress and requires an efficient surveillance of protein quality to prevent the accumulation of protein damage and the disruption of proteostasis. Proteotoxic insults contribute to cellular ageing, and numerous pathophysiological conditions, associated with impaired protein quality control, increase prominently with age11. From studies on the molecular basis of ageing, in which a wide range of different model systems and experimental strategies have been used, the insulin and insulin-like growth factor 1 receptor (IGF1R) signalling pathway, which involves the phosphoinositide 3-kinase (PI3K) and AKT kinases and the Forkhead box protein O (FOXO) transcription factors (such as DAF-16 in Caenorhabditis elegans), has emerged as a key process. The downregulation of HSF reduces the lifespan and accelerates the formation of protein aggregates in C. elegans carrying mutations in different components of the IGF1R-mediated pathway. Conversely, inhibition of IGF1R signalling results in HSF activation and promotes longevity by maintaining proteostasis110,111. These results have prompted many laboratories that use other model organisms to investigate the functional relationship between HSFs and the IGF1R signalling pathway.

The impact of HSFs on the lifespan of whole organisms is further emphasized by a recent study, in which proteome stability was examined during C. elegansageing112. The age-dependent misfolding and downregulation of distinct metastable proteins, which display temperature-sensitive missense mutations, was examined in different tissues. Widespread failure in proteostasis occurred rapidly at an early stage of adulthood, coinciding with the severely impaired heat shock response and unfolded protein response112. The age-dependent collapse of proteostasis could be restored by overexpression of HSF and DAF-16, strengthening the evidence for the unique roles of these stress-responsive transcription factors to prevent global instability of the proteome.

Limited food intake or caloric restriction is another process that is associated with an enhancement of lifespan. In addition to promoting longevity, caloric restriction slows down the progression of age-related diseases such as cancer, cardiovascular diseases and metabolic disorders, stimulates metabolic and motor activities, and increases resistance to environmental stress stimuli113. To this end, the dynamic regulation of HSF1 by the NAD+-dependent protein deacetylase SIRT1, a mammalian orthologue of the yeast transcriptional regulator Sir2, which is activated by caloric restriction and stress, is of particular interest. Indeed, SIRT1 directly deacetylates HSF1 and keeps it in a state that is competent for DNA binding. During ageing, the DNA-binding activity of HSF1 and the amount of SIRT1 are reduced. Consequently, a decrease in SIRT1 levels was shown to inhibit HSF1 DNA-binding activity in a cell-based model of ageing and senescence42. Furthermore, an age-related decrease in the HSF1 DNA-binding activity is reversed in cells exposed to caloric restriction114. These results indicate that HSF1 and SIRT1 function together to protect cells from stress insults, thereby promoting survival and extending lifespan. Impaired proteostasis during ageing may at least partly reflect the compromised HSF1 activity due to lowered SIRT1 expression.


Impact of HSFs in disease

The heat shock response is thought to be initiated by the presence of misfolded and damaged proteins, and is thus a cell-autonomous response. When exposed to heat, cells in culture, unicellular organisms, and cells in a multicellular organism can all trigger a heat shock response autonomously115117. However, it has been proposed that multicellular organisms sense stress differently to isolated cells. For example, the stress response is not properly induced even if damaged proteins are accumulated in neurodegenerative diseases like Huntington’s disease and Parkinson’s disease, suggesting that there is an additional control of the heat shock response at the organismal level118. Uncoordinated activation of the heat shock response in cells in a multicellular organism could cause severe disturbances of interactions between cells and tissues. In C. elegans, a pair of thermosensory neurons called AFDs, which sense and respond to temperature, regulate the heat shock response in somatic tissues by controlling HSF activity119,120. Moreover, the heat shock response in C. elegans is influenced by the metabolic state of the organism and is reduced under conditions that are unfavourable for growth and reproduction121. Neuronal control may therefore allow organisms to coordinate the stress response of individual cells with the varying metabolic requirements in different tissues and developmental stages. These observations are probably relevant to diseases of protein misfolding that are highly tissue-specific despite the often ubiquitous expression of damaged proteins and the heat shock response.

Elevated levels of HSF1 have been detected in several types of human cancer, such as breast cancer and prostate cancer122,123. Mice deficient in HSF1 exhibit a lower incidence of tumours and increased survival than their wild-type counterparts in a classical chemical skin carcinogenesis model and in a genetic model expressing an oncogenic mutation of p53. Similar results have been obtained in human cancer cells lines, in which HSF1 was depleted using an RNA interference strategy124. HSF1 expression is likely to be crucial for non-oncogene addiction and the stress phenotype of cancer cells, which are attributes given to many cancer cells owing to their high intrinsic level of proteotoxic and oxidative stress, frequent spontaneous DNA damage and aneuploidy125. Each of these features may disrupt proteostasis, raising the need for efficient chaperone and proteasome activities. Accordingly, HSF1 would be essential for the survival of cancer cells that experience constant stress and develop non-oncogene addiction.


HSFs as therapeutic targets

Given the unique role of HSF1 in stress biology and proteostasis, enhanced activity of this principal regulator during development and early adulthood is important for the stability of the proteome and the health of the cell. However, HSF1 is a potent modifier of tumorigenesis and, therefore, a potential target for cancer therapeutics125. In addition to modulating the expression of HSF1, the various PTMs of HSF1 that regulate its activity should be considered from a clinical perspective. As many human, age-related pathologies are associated with stress and misfolded proteins, several HSF-based therapeutic strategies have been proposed126. In many academic and industrial laboratories, small molecule regulators of HSF1 are actively being searched for (see Supplementary information S1 (table)). For example, celastrol, which has antioxidant properties and is a natural compound derived from the Celastreace family of plants, activates HSF1 and induces HSP expression with similar kinetics to heat shock, and could therefore be a potential candidate molecule for treating neurodegenerative diseases127,128. In a yeast-based screen, a small-molecule activator of human HSF1 was found and named HSF1A129. HSF1A, which is structurally distinct from the other known activators, activates HSF1 and enhances chaperone expression, thereby counteracting protein misfolding and cell death in polyQ-expressing neuronal precursor cells129. Triptolide, also from the Celastreace family of plants, is a potent inhibitor of the transactivating capacity of HSF1 and has been shown to have beneficial effects in treatments of pancreatic cancer xenografts130,131. These examples of small-molecule regulators of HSF1 are promising candidates for drug discovery and development. However, the existence of multiple mammalian HSFs and their functional interplay should also be taken into consideration when planning future HSF-targeted therapies.


Concluding remarks and future perspectives

HSFs were originally identified as specific heat shock-inducible transcriptional regulators of HSP genes, but now there is unambiguous evidence for a wide variety of HSF target genes that extends beyond the molecular chaperones. The known functions governed by HSFs span from the heat shock response to development, metabolism, lifespan and disease, thereby integrating pathways that were earlier strictly divided into either cellular stress responses or normal physiology.

Although the extensive efforts from many laboratories focusing on HSF biology have provided a richness of understanding of the complex regulatory mechanisms of the HSF family of transcription factors, several key questions remain. For example, what are the initial molecular events (that is, what is the ‘thermometer’) leading to the multistep activation of HSFs? The chromatin-based interaction between HSFs and the basic transcription machinery needs further investigation before the exact interaction partners at the chromatin level can be established. The activation and attenuation mechanisms of HSFs require additional mechanistic insights, and the roles of the multiple signal transduction pathways involved in post-translational regulation of HSFs are only now being discovered and are clearly more complex than anticipated. Although still lacking sufficient evidence, the PTMs probably serve as rheostats to allow distinct forms of HSF-mediated regulation in different tissues during development. Further emphasis should therefore be placed on understanding the PTMs of HSFs during development, ageing and different protein folding diseases. Likewise, the subcellular distribution of HSF molecules, including the mechanism by which HSFs shuttle between the cytoplasm and the nucleus, remains enigmatic, as do the movements of HSF molecules in different nuclear compartments such as NSBs.

Most studies on the impact of HSFs in lifespan and disease have been conducted with model organisms such as D. melanogaster and C. elegans, which express a single HSF. The existence of multiple members of the HSF family in mammals warrants further investigation of their specific and overlapping functions, including their extended repertoire of target genes. The existence of multiple HSFs in higher eukaryotes with different expression patterns suggests that they may have functions that are triggered by distinct stimuli, leading to activation of specific target genes. The impact of the HSF family in the adaptation to diverse biological environments is still poorly understood, and future studies are likely to broaden the prevailing view of HSFs being solely stress-inducible factors. To this end, the crosstalk between distinct HSFs that has only recently been uncovered raises obvious questions about the stoichiometry between the components in different complexes residing in different cellular compartments, and the mechanisms by which the factors interact with each other. Interaction between distinct HSF family members could generate new opportunities in designing therapeutics for protein-folding diseases, metabolic disorders and cancer.


  1. Role in the etiology of cancer

Expression of heat shock proteins and heat shock protein messenger ribonucleic acid in human prostate carcinoma in vitro and in tumors in vivo

Dan Tang,1 Md Abdul Khaleque,2 Ellen L. Jones,1 Jimmy R. Theriault,2 Cheng Li,3 Wing Hung Wong,3 Mary Ann Stevenson,2 and Stuart K. Calderwood1,2,4
Cell Stress Chaperones. 2005 Mar; 10(1): 46–58. doi:  10.1379/CSC-44R.1

Heat shock proteins (HSPs) are thought to play a role in the development of cancer and to modulate tumor response to cytotoxic therapy. In this study, we have examined the expression of hsf and HSP genes in normal human prostate epithelial cells and a range of prostate carcinoma cell lines derived from human tumors. We have observed elevated expressions of HSF1, HSP60, and HSP70 in the aggressively malignant cell lines PC-3, DU-145, and CA-HPV-10. Elevated HSP expression in cancer cell lines appeared to be regulated at the post–messenger ribonucleic acid (mRNA) levels, as indicated by gene chip microarray studies, which indicated little difference in heat shock factor (HSF) or HSP mRNA expression between the normal and malignant prostate cell lines. When we compared the expression patterns of constitutive HSP genes between PC-3 prostate carcinoma cells growing as monolayers in vitro and as tumor xenografts growing in nude mice in vivo, we found a marked reduction in expression of a wide spectrum of the HSPs in PC-3 tumors. This decreased HSP expression pattern in tumors may underlie the increased sensitivity to heat shock of PC-3 tumors. However, the induction by heat shock of HSP genes was not markedly altered by growth in the tumor microenvironment, and HSP40, HSP70, and HSP110 were expressed abundantly after stress in each growth condition. Our experiments indicate therefore that HSF and HSP levels are elevated in the more highly malignant prostate carcinoma cells and also show the dominant nature of the heat shock–induced gene expression, leading to abundant HSP induction in vitro or in vivo.

Heat shock proteins (HSPs) were first discovered as a cohort of proteins that is induced en masse by heat shock and other chemical and physical stresses in a wide range of species (Lindquist and Craig 1988Georgopolis and Welch 1993). The HSPs (Table 1) have been subsequently characterized as molecular chaperones, proteins that have in common the property of modifying the structures and interactions of other proteins (Lindquist and Craig 1988Beckmann et al 1990;Gething and Sambrook 1992Georgopolis and Welch 1993Netzer and Hartl 1998). Molecular chaperone function dictates that the HSP often interact in a stoichiometric, one-on-one manner with their substrates, necessitating high intracellular concentrations of the proteins (Lindquist and Craig 1988Georgopolis and Welch 1993). As molecules that shift the balance from denatured, aggregated protein conformation toward ordered, functional conformation, HSPs are particularly in demand when the protein structure is disrupted by heat shock, oxidative stress, or other protein-damaging events (Lindquist and Craig 1988;Gething and Sambrook 1992Georgopolis and Welch 1993). The HSP27, HSP40,HSP70, and HSP110 genes have therefore evolved a highly efficient mechanism for mass synthesis during stress, with powerful transcriptional activation, efficient messenger ribonucleic acid (mRNA) stabilization, and selective mRNA translation (Voellmy 1994). HSP27, HSP70, HSP90, and HSP110 increase to become the dominantly expressed proteins after stress (Hickey and Weber 1982Landry et al 1982Li and Werb 1982Subjeck et al 1982Henics et al 1999) (Zhao et al 2002). Heat shock factor (HSF) proteins have been shown to interact with the promoters of many HSP genes and ensure prompt transcriptional activation in stress and equally precipitous switch off after recovery (Sorger and Pelham 1988Wu 1995). The hsf gene family includes HSF1 (hsf1), the molecular coordinator of the heat shock response, as well as 2 less well-characterized genes, hsf2 and hsf4(Rabindran et al 1991Schuetz et al 1991) (Nakai et al 1997). In addition to the class of HSPs induced by heat, cells also contain a large number of constitutively expressed HSP homologs, which are also listed in Table 1. The constitutive HSPs are found in a variety of multiprotein complexes containing both HSPs and cofactors (Buchner 1999). These include HSP10-HSP60 complexes that mediate protein folding and HSP70- and HSP90-containing complexes that are involved in both generic protein-folding pathways and in specific association with regulatory proteins within the cell (Netzer and Hartl 1998). HSP90 plays a particularly versatile role in cell regulation, forming complexes with a large number of cellular kinases, transcription factors, and other molecules (Buchner 1999Grammatikakis et al 2002).


Table 1     http://www.ncbi.nlm.nih.gov/pmc/articles/PMC1074571/bin/i1466-1268-10-1-46-t01.jpg


Heat shock protein family genes studied by microchip array analysis

Many tumor types contain high concentrations of HSP of the HSP28, HSP70, and HSP90 families compared with adjacent normal tissues (Ciocca et al 1993Yano et al 1999Cornford et al 2000Strik et al 2000Ricaniadis et al 2001Ciocca and Vargas-Roig 2002). We have concentrated here on HSP gene expression in prostate carcinoma. The progression of prostatic epithelial cells to the fully malignant, metastatic phenotype is a complex process and involves the expression of oncogenes as well as escape from androgen-dependent growth and survival (Cornford et al 2000). There is a molecular link between HSP expression and tumor progression in prostate cancer in that HSP56, HSP70, and HSP90 regulate the function of the androgen receptor (AR) (Froesch et al 1998Grossmann et al 2001). Escape from AR dependence during tumorigenesis may involve altered HSP-AR interactions (Grossmann et al 2001). The role of HSPs in tumor development may also be related to their function in the development of tolerance to stress (Li and Hahn 1981). Thermotolerance is induced in cells preconditioned by mild stress coordinately with the expression of high HSP levels (Landry et al 1982Li and Werb 1982Subjeck et al 1982). Elevated HSP expression appears to be a factor in tumor pathogenesis, and, among other mechanisms, this may involve the ability of individual HSPs to block the pathways of apoptosis and permit malignant cells to arise despite the triggering of apoptotic signals during transformation (Volloch and Sherman 1999). De novo HSP expression may also afford protection of cancer cells from treatments such as chemotherapy and hyperthermia by thwarting the proapoptotic influence of these modalities (Gabai et al 1998Hansen et al 1999Blagosklonny 2001Asea et al 2001Van Molle et al 2002). The mechanisms underlying HSP induction in tumor cells are not known but may reflect the genetic alterations accompanying malignancy or the disordered state of the tumor microenvironment, which would be expected to lead to cellular stress.

Here, we have examined expression of hsf and HSP genes in immortalized normal human prostate epithelial cells and a range of prostate carcinoma cells obtained from human tumors at the mRNA and protein levels. Our aim was to determine whether hsf-HSP expression profiles are conserved in cells that express varying degrees of malignancy, under resting conditions and after heat and ionizing radiation. In addition, we have compared HSP expression profiles of a metastatic human prostate carcinoma cell line growing either in monolayer culture or as a tumor xenograft in nude mice. These studies were prompted by findings in our laboratory that prostate carcinoma cells are considerably more sensitive to heat-induced apoptosis in vivo growing as tumors compared with similar cells growing in tissue culture in vitro. Our studies show that, although the hsf-HSP expression profiles are similar in normal and malignant prostate-derived cells at the mRNA level, expression at the protein level was very different. HSF1 and HSP protein expression was highest in the 3 aggressively metastatic prostate cancer cell lines (PC-3, DU-145, and CA-HPV-10). Although the gene expression patterns of constitutive HSP differ enormously in PC-3 cells in vitro and in xenografts in vivo, stress induction of HSP genes is not markedly altered by exposure to the tumor microenvironment, indicating the hierarchical rank of the stress response that permits it to override other forms of regulation. ……

The experiments described here are largely supportive of the notion that HSP gene expression and HSF activity and expression are increased in more advanced stages of cancer (Fig 4). The most striking finding in the study was the elevation of HSF1 and HSP levels in aggressively malignant prostate carcinoma cell lines (Fig 4). It is significant that these changes in HSF and HSP levels would not have been predicted from microarray studies of HSF (Fig 3) and HSP (Fig 1) mRNA levels. The increased HSF levels observed in the metastatic prostate carcinoma cell lines in particular appear to be due to altered regulation of either mRNA translation or protein turnover (or both) (Figs 3 and ​and4).4). Although we do not at this stage know the mechanisms involved, 1 candidate could be differential activity of the proteosome in the metastatic cell lines: both HSF1 and HSF2 are targets for proteosomal degradation (Mathew et al 1998). Despite these differences in HSP expression between cells of varying degrees of malignancy under growth conditions, stress caused a major shift in HSP gene expression and activation of HSP40-1, HSP70-1A, HSP70-1B, HSP70-6 (HSP70B), DNA-J2–like, and HSP105 in all cells (Fig 2). Even in LnCap cells with minimal HSF1 and HSF2 expression, heat-inducible HSP70 protein expression was observed (Fig 4). Interestingly, we observed minimal induction of the HSP70B gene in LnCap cells: because the HSP70B promoter is known to be almost exclusively induced by stress through the HSE in its promoter, the findings may suggest that a mechanism for HSP70 induction alternative to HSF1 activation may be operative in LnCap cells (Schiller et al 1988). Increased HSP expression in cancer patients has been shown to signal a poor response to treatment by a number of modalities, suggesting that HSP expression is involved with development of resistance to treatment in addition to being involved in the mechanisms of malignant progression (Ciocca et al 1993Cornford et al 2000Yamamoto et al 2001Ciocca and Vargas-Roig 2002;Mese et al 2002). In addition, subpopulations of LnCap-derived cells, selected for enhanced capacity to metastasize, have been shown to express elevated levels of HSF1, HSP70, and HSP27 compared with nonselected controls (Hoang et al 2000). This may be highly significant because our studies indicate minimal levels of HSF1 and HSP in the poorly metastatic parent LnCap cells (Figs 1 and ​and4).4). Previous studies have also indicated that elevated HSP70 expression occurs at an early stage in cellular immortalization from embryonic stem cells (Ravagnan et al 2001). We had to use immortalized prostatic epithelial cells for our normal controls and may have missed a very early change in HSP expression during the immortalization process.

As indicated by the kinetic studies (Figs 5–7), HSPs are activated at a number of regulatory levels by stress in addition to transcriptional activation, and these may include stress-induced mRNA stabilization, differential translation, and protein stabilization (Hickey and Weber 1982Zhao et al 2002). HSF1 activity and HSP expression appear to be subject to differential regulation by a number of pathways at normal temperatures but are largely independent of such regulation when exposed to heat shock, which overrides constitutive regulation and permits prompt induction of this emergency response.

Growth of PC-3 cells in vivo as tumor xenografts was accompanied by a marked decrease in constitutive HSP expression (Figs 8 and ​and11).11). Decreased HSP expression was part of a global switch in gene expression that accompanies the switch of PC-3 cells from growth as monolayers in tissue culture to growth as tumors in vivo (D. Tang and S.K. Calderwood, in preparation). Many reports indicate changes in a wide range of cellular properties as cells grow as tumors, and these properties may reflect the remodeling of gene expression patterns. These changes may reflect adaptation to the chemical nature of the tumor microenvironment and the alterations in cell-cell interaction in growth as a tumor in vivo. Our studies also indicate the remarkable sturdiness of the heat shock response that remains intact in the PC-3 cells growing in vivo despite the global rearrangements in other gene expressions mentioned above (Figs 10 and ​and1111).

The elevation in HSF1 and HSP levels in cancer shown in our studies and in those of others and its association with a poor prognosis and inferior response to therapy suggests the strategy of targeting HSP in cancer therapy. Treatment with HSP70 antisense oligonucleotides, for instance, can cause tumor cell apoptosis on its own and can synergize with heat shock in cell killing (Jones et al 2004). Indeed, it has been shown that antagonizing heat-inducible HSP expression with quercitin, a bioflavonoid drug that inhibits HSF1 activation, or by using antisense oligonucleotides directed against HSP70 mRNA further sensitizes PC-3 cells to heat-induced apoptosis in vitro and leads to tumor regression in vivo (Asea et al 2001Lepchammer et al 2002Jones et al 2004) (A. Asea et al, personal communication). The strategy of targeting HSP expression or function in cancer cells may thus be indicated. Such a strategy might prove particularly effective because constitutive HSP expression is reduced in tumors, and this might be related to increased killing of PC-3 tumor cells by heat (Fig 12).


  1. Molecular chaperones in aging

Aging and molecular chaperones

Csaba So˝ti*, Pe´ter Csermely
Exper Geront 2003; 38:1037–1040  http://195.111.72.71/docs/pcs/03exger.pdf

Chaperone function plays a key role in sequestering damaged proteins and in repairing proteotoxic damage. Chaperones are induced by environmental stress and are called as stress or heat shock proteins. Here, we summarize the current knowledge about protein damage in aged organisms, about changes in proteolytic degradation, chaperone expression and function in the aging process, as well as the involvement of chaperones in longevity and cellular senescence. The role of chaperones in aging diseases, such as in Alzheimer’s disease, Parkinson’s disease, Huntington’s disease and in other neurodegenerative diseases as well as in atherosclerosis and in cancer is discussed. We also describe how the balance between chaperone requirement and availability becomes disturbed in aged organisms, or in other words, how chaperone overload develops. The consequences of chaperone overload are also outlined together with several new research strategies to assess the functional status of chaperones in the aging process.

Molecular chaperones Chaperones are ubiquitous, highly conserved proteins (Hartl, 1996), either assisting in the folding of newly synthesized or damaged proteins in an ATP-dependent active process or working in an ATP-independent passive mode sequestering damaged proteins for future refolding or digestion. Environmental stress leads to proteotoxic damage. Damaged, misfolded proteins bind to chaperones, and liberate the heat shock factor (HSF) from its chaperone complexes. HSF is activated and transcription of chaperone genes takes place (Morimoto, 2002). Most chaperones, therefore, are also called stress or (after the archetype of experimental stress) heat shock proteins (Hsp-s).

Aging proteins—proteins of aging organisms During the life-span of a stable protein, various posttranslational modifications occur including backbone and side chain oxidation, glycation, etc. In aging organisms, the disturbed cellular homeostasis leads to an increased rate of protein modification: in an 80-year old human, half of all proteins may become oxidized (Stadtman and Berlett, 1998). Susceptibility to various proteotoxic damages is mainly increased due to dysfunction of mitochondrial oxidation of starving yeast cells (Aguilaniu et al., 2001). In prokaryotes, translational errors result in folding defects and subsequent protein oxidation (Dukan et al., 2000), which predominantly takes place in growth arrested cells (Ballesteros et al., 2001). Additionally, damaged signalling networks loose their original stringency, and irregular protein phosphorylation occurs (e.g.: the Parkinson disease-related a-synuclein also becomes phosphorylated, leading to misfolding and aggregation; Neumann et al., 2002).

Aging protein degradation Irreversibly damaged proteins are recognized by chaperones, and targeted for degradation. Proteasome level and function decreases with aging, and some oxidized, aggregated proteins exert a direct inhibition on proteasome activity. Chaperones also aid in lysosomal degradation. The proteolytic changes are comprehensively reviewed by Szweda et al. (2002). Due to the degradation defects, damaged proteins accumulate in the cells of aged organisms, and by aggregation may cause a variety of protein folding diseases (reviewed by So˝ti and Csermely, 2002a).

Aging chaperones I: defects in chaperone induction Damaged proteins compete with the HSF in binding to the Hsp90-based cytosolic chaperone complex, which may contribute to the generally observed constitutively elevated chaperone levels in aged organisms (Zou et al., 1998; So˝ti and Csermely, 2002b). On the contrary, the majority of the reports showed that stress-induced synthesis of chaperones is impaired in aged animals. While HSF activation does not change, DNA binding activity may be reduced during aging (Heydari et al., 2000). A number of signaling events use an overlapping network of chaperones not only to establish the activation-competent state of different transcription factors (e.g. steroid receptors), but also as important elements in the attenuation of respective responses. HSF transcriptional activity is also negatively influenced by higher levels of chaperones (Morimoto, 2002). Differential changes of these proteins in various organisms and tissues may lead to different extents of (dys)regulation. More importantly, the cross-talk between different signalling pathways through a shared pool of chaperones may have severe consequences during aging when the cellular conformational homeostasis is deranged (see below).

Aging chaperones II: defects in chaperone function   Direct studies on chaperone function in aged organisms are largely restricted to a-crystallin having a decreased activity in aged human lenses (Cherian and Abraham, 1995; Cherian-Shaw et al., 1999). In a recent study, an initial test of passive chaperone function of whole cytosols was assessed showing a decreased chaperone capacity in aged rats compared to those of young counterparts (Nardai et al., 2002). What can be the mechanism behind these deleterious changes in chaperone function? Chaperones may also be prone to oxidative damage, as GroEL is preferentially oxidized in growth-arrested E. coli (Dukan and Nystro¨m, 1999). Macario and Conway de Macario (2002) raised the idea of ‘sick chaperones’ in aged organisms in a recent review. Indeed, chaperones are interacting with a plethora of other proteins (Csermely, 2001a), which requires rather extensive binding surfaces. These exposed areas may make chaperones a preferential target for proteotoxic damage: chaperones may behave as ‘suicide proteins’ during aging, sacrificing themselves instead of ‘normal’ proteins. The high abundance of chaperones (which may constitute more than 5% of cellular proteins), and their increased constitutive expression in aged organisms makes them a good candidate for this ‘altruistic courtesy.’ It may be especially true for mitochondrial Hsp60, the role of which would deserve extensive studies.

Aging chaperones III: defects in capacity, the chaperone overload Another possible reason of decreased chaperone function is chaperone overload (Csermely, 2001b). In aging organisms, the balance between misfolded proteins and available free chaperones is grossly disturbed: increased protein damage, protein degradation defects increase the amount of misfolded proteins, while chaperone damage, inadequate synthesis of molecular chaperones and irreparable folding defects (due to posttranslational changes) decrease the amount of available free chaperones. Chaperone overload occurs, where the need for chaperones may greatly exceed the available chaperone capacity (Fig. 1). Under these conditions, the competition for available chaperones becomes fierce and the abundance of damaged proteins may disrupt the folding assistance to other chaperone targets, such as: (1) newly synthesized proteins; (2) ‘constantly damaged’ (mutant) proteins; and (3) constituents of the cytoarchitecture (Csermely, 2001a). This may cause defects in signal transduction, protein transport, immune recognition, cellular organization as well as the appearance of previously buffered, hidden mutations in the phenotype of the cell (Csermely, 2001b). Chaperone overload may significantly decrease the robustness of cellular networks, as well as shift their function towards a more stochastic behavior. As a result of this, aging cells become more disorganized, their adaptation is impaired.

Fig. 1. Chaperone overload: a shift in the balance between misfolded proteins and available free chaperones in aging organisms. The accumulation of chaperone substrates along with an impaired chaperone function may exhaust the folding assistance to specific chaperone targets and leads to deterioration in vital processes. Chaperone overload may significantly decrease the robustness of cellular networks, and compromise the adaptative responses. See text for details.

Senescent cells and chaperones The involvement of chaperones in aging at the cellular level is recently reviewed (So˝ti et al., 2003). Non-dividingsenescent-peripheral cells tend to have increased chaperone levels (Verbeke et al., 2001), and cannot preserve the induction of several chaperones (Liu et al., 1989), similarly to cells from aged animals. Activation and binding of HSF to the heat shock element is decreased in aged cells (Choi et al., 1990). Interestingly, cellular senescence seems to unmask a proteasomal activity leading to the degradation of HSF (Bonelli et al., 2001). Chaperone induction per se seems to counteract senescence. Repeated mild heat shock (a kind of hormesis) has been reported to delay fibroblast aging (Verbeke et al., 2001), though it does not seem to extend replicative lifespan. A major chaperone, Hsp90 is required for the correct function of telomerase, an important enzyme to extend the life-span of cells (Holt et al., 1999). Mortalin (mtHsp70/Grp75), a member of the Hsp70 family, produces opposing phenotypic effects related to its localization. In normal cells, it is pancytoplasmically distributed, and its expression causes senescence. Its upregulation and perinuclear distribution, however, is connected to transformation, probably via p53 inactivation. Mortalin also induces life-span extension in human fibroblasts or in C. elegans harboring extra copies of the orthologous gene (Kaul et al., 2002).

Aging organisms and chaperones: age-related diseases Unbalanced chaperone requirement and chaperone capacity in aged organisms helps the accumulation of aggregated proteins, which often cause folding diseases, mostly of the nervous system, due to the very limited proliferation potential of neurons. Over expression of chaperones often delays the onset or diminishes the symptoms of the disease (So˝ti and Csermely, 2002b). Other aging diseases, such as atherosclerosis and cancer are also related to chaperone action. Here space limitation precludes a detailed description of these rapidly developing fields, however, numerous recent reviews were published on these subjects, where the interested readers may find a good summary and several hints for further readings (Ferreira and Carlos, 2002; Neckers, 2002; Sarto et al., 2000; Wick and Xu, 1999).


Chaperones and Longevity

Increased chaperone induction leads to increased longevity (Tatar et al., 1997). Moreover, a close correlation exists between stress resistance and longevity in several long-lived C. elegans and Drosophila mutants (Lithgow and Kirkwood, 1996). As the other side of the same coin, damaged HSF has been found as an important gene to cause accelerated aging in C. elegans (Garigan et al., 2002). Caloric restriction, the only effective experimental manipulation known to retard aging in rodents and primates (Ramsey et al., 2000), restores age-impaired chaperone induction, while reversing the age-induced changes in constitutive Hsp levels (see So˝ti and Csermely, 2002a,b). These examples confirm the hypothesis that a better adaptation capacity to various stresses greatly increases the chances to reach longevity. 10. Conclusions and perspectives Aging can be defined as a multicausal process leading to a gradual decay of self-defensive mechanisms, and an exponential accumulation of damage at the molecular, cellular and organismal level. The protein oxidation, damage, misfolding and aggregation together with the simultaneously impaired function and induction of chaperones in aged organisms disturb the balance between chaperone requirement and availability. There are several important aspects for future investigation of this field: † the measurement of active chaperone function (i.e. chaperone-assisted refolding of damaged proteins) in cellular extracts does not have a well-established method yet; † we have no methods to measure free chaperone levels; † among the consequences of chaperone overload, changes in signal transduction, protein transport, immune recognition and cellular organization have not been systematically measured and/or related to the protein folding homeostasis of aging organisms and cells.


  1. Extracellular HSPs in inflammation and immunity

Cutting Edge: Heat Shock Protein (HSP) 60 Activates the Innate Immune Response: CD14 Is an Essential Receptor for HSP60 Activation of Mononuclear Cells1

Amir Kol,* Andrew H. Lichtman,† Robert W. Finberg,‡ Peter Libby,*† and Evelyn A. Kurt-Jones2‡
J  Immunol 2000; 164: 13–17.  https://www.researchgate.net/profile/Robert_Finberg/publication/12696457_Cutting_Edge_Heat_Shock_Protein_(HSP)_60_Activates_the_Innate_Immune_Response_CD14_Is_an_Essential_Receptor_for_HSP60_Activation_of_Mononuclear_Cells/links/53ee00460cf23733e80b21c0.pdf

Heat shock proteins (HSP), highly conserved across species, are generally viewed as intracellular proteins thought to serve protective functions against infection and cellular stress. Recently, we have reported the surprising finding that human and chlamydial HSP60, both present in human atheroma, can activate vascular cells and macrophages. However, the transmembrane signaling pathways by which extracellular HSP60 may activate cells remains unclear. CD14, the monocyte receptor for LPS, binds numerous microbial products and can mediate activation of monocytes/macrophages and endothelial cells, thus promoting the innate immune response. We show here that human HSP60 activates human PBMC and monocyte-derived macrophages through CD14 signaling and p38 mitogen-activated protein kinase, sharing this pathway with bacterial LPS. These findings provide further insight into the molecular mechanisms by which extracellular HSP may participate in atherosclerosis and other inflammatory disorders by activating the innate immune system.

There is increasing interest in the role of nontraditional mediators of inflammation in atherosclerosis (1). Recent studies from our laboratory have shown that chlamydial and human heat shock protein 60 (HSP60)3 colocalize in human atheroma (2), and either HSP60 induces adhesion molecule and cytokine production by human vascular cells and macrophages, in a pattern similar to that induced by Escherichia coli LPS (3, 4). These results suggested that HSP60 and LPS might share similar signaling mechanisms. CD14 is the major high-affinity receptor for bacterial LPS on the cell membrane of mononuclear cells and macrophages (5, 6). In addition to LPS, CD14 functions as a signaling receptor for other microbial products, including peptidoglycan from Gram-positive bacteria and mycobacterial lipoarabinomann (7, 8). CD14 is considered a pattern recognition receptor for microbial Ags and, with Toll-like receptor (TLR) proteins, an important mediator of innate immune responses to infection (9–14). We have examined the role of CD14 in the response of human monocytes and macrophages to HSP60.  …..

HSP may play a central role in the innate immune response to microbial infections. Because both microbes and stressed or injured host cells produce abundant HSP (36), and dying cells likely release these proteins, it is conceivable that HSP furnish signals that inform the innate immune system of the presence of infection and cell damage. The findings reported here, that human HSP60 induces IL-6 production by mononuclear cells and macrophages via the CD14, supports this hypothesis, suggesting that human HSP60 may act together with LPS or other microbial products to provoke innate immune responses.

Inflammation and immunity can contribute to the pathogenesis and complications of atherosclerosis (37). Moreover, the search for novel risk factors for atherosclerosis has revived the concept that microbial products might substantially contribute to the inflammatory reaction in the atheromatous vessel wall (38, 39). We have shown that chlamydial HSP60 colocalizes with human HSP60 in the macrophages of human atheroma (2). Therefore, bacterial and human HSP60, released from dying or injured cells during atherogenesis (40) or myocardial injury (41), may further promote local inflammation and possibly activate the innate immune system. Previous reports that immunization with mycobacterial HSP65 enhances atheroma formation in rabbits (42), have suggested an important role for HSPs in atherogenesis, particularly because the high degree of homology between HSPs of the same m.w. among different species might stimulate autoimmunity (43).

In conclusion, our findings, that CD14 mediates cellular activation induced by human HSP60 provide further insight into the molecular mechanisms by which HSP may activate the innate immune system and participate in atherogenesis and other inflammatory disorders.

DAMPs, PAMPs and alarmins: all we need to know about danger

Marco E. Bianchi1
J. Leukoc. Biol. 81: 1–5; 2007.   http://aerozon.ru/documents/publications/37_Bianche.pdf

Multicellular animals detect pathogens via a set of receptors that recognize pathogen associated molecular patterns (PAMPs). However, pathogens are not the only causative agents of tissue and cell damage: trauma is another one. Evidence is accumulating that trauma and its associated tissue damage are recognized at the cell level via receptor-mediated detection of intracellular proteins released by the dead cells. The term “alarmin” is proposed to categorize such endogenous molecules that signal tissue and cell damage. Intriguingly, effector cells of innate and adaptive immunity can secrete alarmins via nonclassical pathways and often do so when they are activated by PAMPs or other alarmins. Endogenous alarmins and exogenous PAMPs therefore convey a similar message and elicit similar responses; they can be considered subgroups of a larger set, the damage associated molecular patterns (DAMPs).

Multicellular animals must distinguish whether their cells are alive or dead and detect when microorganisms intrude, and have evolved surveillance/defense/repair mechanisms to this end. How these mechanisms are activated and orchestrated is still incompletely understood, and I will argue that that these themes define a unitary field of investigation, of both basic and medical interest.

A complete system for the detection, containment, and repair of damage caused to cells in the organism requires warning signals, cells to respond to them via receptors and signaling pathways, and outputs in the form of physiological responses. Classically, a subset of this system has been recognized and studied in a coherent form: pathogen-associated molecular patterns (PAMPs) are a diverse set of microbial molecules which share a number of different recognizable biochemical features (entire molecules or, more often, part of molecules or polymeric assemblages) that alert the organism to intruding pathogens [1]. Such exogenous PAMPs are recognized by cells of the innate and acquired immunity system, primarily through toll-like receptors (TLRs), which activate several signaling pathways, among which NF-kB is the most distinctive. As a result, some cells are activated to destroy the pathogen and/or pathogen-infected cells, and an immunological response is triggered in order to produce and select specific T cell receptors and antibodies that are best suited to recognize the pathogen on a future occasion. Most of the responses triggered by PAMPs fall into the general categories of inflammation and immunity.

However, pathogens are not the only causative agents of tissue and cell damage: trauma is another one. Tissues can be ripped, squashed, or wounded by mechanical forces, like falling rocks or simply the impact of one’s own body hitting the ground. Animals can be wounded by predators. In addition, tissues can be damaged by excessive heat (burns), cold, chemical insults (strong acids or bases, or a number of different cytotoxic poisons), radiation, or the withdrawal of oxygen and/or nutrients. Finally, humans can also be damaged by specially designed drugs, such as chemotherapeutics, that are meant to kill their tumor cells with preference over their healthy cells. Very likely, we would not be here to discuss these issues if evolution had not incorporated in our genetic program ways to deal with these damages, which are not caused by pathogens but are nonetheless real and common enough. Tellingly, inflammation is also activated by these types of insults. A frequently quoted reason for the similarity of the responses evoked by pathogens and trauma is that pathogens can easily breach wounds, and infection often follows trauma; thus, it is generally effective to respond to trauma as if pathogens were present. In my opinion, an additional reason is that pathogens and trauma both cause tissue and cell damage and thus trigger similar responses.

None of these considerations is new; however, a new awareness of the close relationship between trauma- and pathogenevoked responses emerged from the EMBO Workshop on Innate Danger Signals and HMGB1, which was held in February 2006 in Milano (Italy); many of the findings presented at the meeting are published in this issue of the Journal of Leukocyte Biology. At the end of the meeting, Joost Oppenheim proposed the term “alarmin” to differentiate the endogenous molecules that signal tissue and cell damage. Together, alarmins and PAMPs therefore constitute the larger family of damage-associated molecular patterns, or DAMPs.

Extranuclear expression of HMGB1 has been involved in a number of pathogenic conditions: sepsis [44], arthritis [45, 46], atherosclerosis [10], systemic lupus erythematosus (SLE) [47], cancer [48] and hepatitis [49, this issue]. Uric acid has been known to be the aethiologic agent for gout since the 19th century. S100s may be involved in arthritis [31, this issue] and psoriasis [50]. However, although it is clear that excessive alarmin expression might lead to acute and chronic diseases, the molecular mechanisms underlying these effects are still largely unexplored.

The short list of alarmins presented above is certainly both provisional and incomplete and serves only as an introduction to the alarmin concept and to the papers published in this issue of JLB. Other molecules may be added to the list, including cathelicidins, defensins and eosinophil-derived neurotoxin (EDN) [51], galectins [52], thymosins [53], nucleolin [54], and annexins [55; and 56, this issue]; more will emerge with time. Eventually, the concept will have to be revised and adjusted to the growing information. Indeed, I have previously argued that any misplaced protein in the cell can signal damage [57], and Polly Matzinger has proposed that any hydrophobic surface (“Hyppo”, or Hydrophobic protein part) might act as a DAMP [58]. As most concepts in biology, the alarmin category serves for our understanding and does not correspond to a blueprint or a plan in the construction of organisms. Biology proceeds via evolution, and evolution is a tinkerer or bricoleur, finding new functions for old molecules. In this, the reuse of cellular components as signals for alerting cells to respond to damage and danger, is a prime example.


  1. Role of heat shock and the heat shock response in immunity and cancer


Heat Shock Proteins: Conditional Mediators of Inflammation in Tumor Immunity

Stuart K. Calderwood,1,* Ayesha Murshid,1 and Jianlin Gong1
Front Immunol. 2012; 3: 75.  doi:  10.3389/fimmu.2012.00075

Heat shock protein (HSP)-based anticancer vaccines have undergone successful preclinical testing and are now entering clinical trial. Questions still remain, however regarding the immunological properties of HSPs. It is now accepted that many of the HSPs participate in tumor immunity, at least in part by chaperoning tumor antigenic peptides, introducing them into antigen presenting cells such as dendritic cells (DC) that display the antigens on MHC class I molecules on the cell surface and stimulate cytotoxic lymphocytes (CTL). However, in order for activated CD8+ T cells to function as effective CTL and kill tumor cells, additional signals must be induced to obtain a sturdy CTL response. These include the expression of co-stimulatory molecules on the DC surface and inflammatory events that can induce immunogenic cytokine cascades. That such events occur is indicated by the ability of Hsp70 vaccines to induce antitumor immunity and overcome tolerance to tumor antigens such as mucin1. Secondary activation of CTL can be induced by inflammatory signaling through Toll-like receptors and/or by interaction of antigen-activated T helper cells with the APC. We will discuss the role of the inflammatory properties of HSPs in tumor immunity and the potential role of HSPs in activating T helper cells and DC licensing.

Heat shock protein, vaccine, inflammation, antigen presentation

Heat shock proteins (HSP) were first discovered as a group of polypeptides whose level of expression increases to dominate the cellular proteome after stress (Lindquist and Craig, 1988). These increases in HSPs synthesis correlate with a marked resistance to potentially toxic stresses such as heat shock (Li and Werb,1982). The finding that such proteins have extracellular immune functions suggested that, as highly abundant intracellular proteins they could be prime candidates as danger signals to the immune response (Srivastava and Amato,2001). There are several human HSP gene families with known immune significance and their classification is reviewed in Kampinga et al. (2009). These include the HSPA (Hsp70) family, which includes the HPA1A and HSPA1B genes encoding the two major stress-inducible Hsp70s, that together are often referred to as Hsp72. When referring to Hsp70 in this chapter, we generally refer to the products of these two genes. The Hsp70 family also includes two other members with immune function – HSPA8 and HSPA5 genes, whose protein products are known as Hsc70 the major constitutive Hsp70 family member and Grp78, a key ER-resident protein. In addition two more Hsp70 related genes have immune significance and these include HSPH2 (Hsp110) and HSPH4 the ER-resident class H protein Grp170. The Hsp90 family also has major functions in tumor immunity and these include HSPC2 and HSPC3, which encode the major cytoplasmic proteins Hsp90a and Hsp90b, and HSPC4 that encodes ER chaperone Grp94. In addition, the product of the HSPD1 gene, the mitochondrial chaperone Hsp60 has some immunological functions. Mice have been shown to encode orthologs of each of these genes (Kampinga et al., 2009).

It has been suggested that many of the HSPs have the property of damage associated molecular patterns (DAMPs), inducers of sterile inflammation and innate immunity (Kono and Rock, 2008). The additional discovery that intracellular HSPs function as molecular chaperones and can bind to a wide spectrum of intracellular polypeptides further indicated that they could play a broad role in the immune response and might mediate both innate immunity due to their status as DAMPs and adaptive immunity by chaperoning antigens.

Heat shock proteins are currently employed as vaccines in cancer immunotherapy (Tamura et al., 1997; Murshid et al., 2011a). The rationale behind the approach is that if HSPs can be extracted from tumor tissue bound to the polypeptides which they chaperone during normal metabolism, they may retain antigenic peptides specific to the tumor (Noessner et al., 2002; Srivastava, 2002; Wang et al., 2003; Enomoto et al., 2006; Gong et al., 2010). Indeed, vaccines based on Hsp70, Hsp90, Grp94, Hsp110, and Grp170 polypeptide complexes have been used successfully to immunize mice to a range of tumor types and Hsp70 and Grp94 vaccines have undergone recent clinical trials (rev: Murshid et al., 2011a). These effects of the HSP vaccines on tumor immunity appear to be mediated largely to the associated, co-isolated tumor polypeptides, although in the case of Grp94 this question is still controversial and tumor regression was observed in mice treated with the chaperone devoid of its peptide binding domain (Udono and Srivastava, 1993; Srivastava, 2002; Nicchitta, 2003; Chandawarkar et al., 2004; Nicchitta et al.,2004). Use of such HSP vaccines is potentially a powerful approach to tumor immunotherapy as the majority of the antigenic repertoire of most individual tumor cells is unknown (Srivastava and Old, 1988; Srivastava, 1996). Individual cancer cells are likely to take a lone path in accumulating a spectrum of random mutations. Although some mutations are functional, permitting cells to become transformed and to progress into a highly malignant state, many such changes are likely to be passenger mutations not required to drive tumor growth (Srivastava and Old, 1988; Srivastava, 1996). Some of these individual mutant sequences will be novel antigenic epitopes and together with the few known shared tumor antigens comprise an “antigenic fingerprint” for each individual tumor (Srivastava,1996). Accumulation of mutations in cancer appears to be related to, and may drive the increases in HSPs observed in many tumors (Kamal et al., 2003; Whitesell and Lindquist, 2005; Trepel et al., 2010). As the mutant conformations of tumor proteins are “locked in” due to the covalent nature of the alterations, cancer cells appear to be under permanent proteotoxic stress and rich in HSP expression (Ciocca and Calderwood, 2005). For tumor immunology these conditions may offer a therapeutic opportunity as individual HSPs, whose expression is expanded in cancer will chaperone a cross-section of the “antigenic fingerprint” of the individual tumors (Murshid et al., 2011a). This approach was first utilized by Srivastava (20002006) and led to the development of immunotherapy using HSP–peptide complexes.

In addition to using HSP–peptide complexes extracted from tumors, in cases where tumor antigens are known, these can be directly loaded onto purified or recombinant HSPs and the complex used as a vaccine. This procedure has been carried out successfully in the case of the “large HSPs,” Hsp110 and Grp170 (Manjili et al., 20022003). A variant of this approach employs the molecular engineering of tumor antigens in order to produce molecular chaperone-fusion genes which encode products in which the HSP is fused covalently to the antigen. The fusion proteins are then employed as vaccines. This approach was pioneered by Young et al. who showed that a fusion between mycobacterial Hsp70 and ovalbumin could induced cytotoxic lymphocytes (CTL) in mice with the capacity to kill Ova-expressing cancer cells (Suzue et al., 1997). The vaccines could be used effectively without adjuvant and adjuvant properties were ascribed to the molecular chaperone component of the fusion protein. Subsequent studies have confirmed the utility of the approach in targeting common tumor antigens such as the melanoma antigen Mage3 (Wang et al., 2009).

HSPs and Immunosurveillance in Cancer

The question next arises as to the role of endogenous HSPs, with or without bound antigens in immunosurveillance of cancer cells. Although the immune system can recognize tumor antigens and generate a CTL response, most cancers evade immune cell killing by a range of strategies (van der Bruggen et al., 1991; Pardoll,2003). These include the down-regulation of surface MHC class I molecules by individual tumor cells and release of immunosuppressive IL-10 by tumors (Moller and Hammerling, 1992; Chouaib et al., 2002). Tumors in vivo also appear to attract a range of hematopoietic cells with immunosuppressive action including regulatory CD4+CD25+FoxP3+ T cells (Treg), M2 macrophages, myeloid-derived suppressor cells (MDSC) and some classes of natural killer cells (Pekarek et al.,1995; Terabe et al., 2005; Mantovani et al., 2008; Marigo et al., 2008). The tumor milieu also contain a small fraction of cells of mesenchymal origin identified by surface fibroblast activation protein-a (FAP cells) that suppress antitumor immune responses (Kraman et al., 2010). Endogenous tumor HSPs may also participate in immune suppression. Although the majority of the HSPs function as intracellular molecular chaperones, a fraction of these proteins can be released from cells even under unstressed conditions and may participate in immune functions (rev: Murshid and Calderwood, 2012). Intracellular Hsp70 can be actively secreted from tumor cells in either free form or packaged into lipid-bounded structures called exosomes (Mambula and Calderwood, 2006b; Chalmin et al., 2010). In addition Hsp70 and Hsp90 can also be found associated with the surfaces of tumor cells where they can function as molecular chaperones or as recognition structures for immune cells (Sidera et al., 2008; Qin et al., 2010; Multhoff and Hightower, 2011). As Hsp70 was shown in a number of earlier studies to be pro-inflammatory due to its interaction with pattern recognition receptors such as Toll-like receptors 2 and 4 (TLR2 and TLR4), these findings might suggest, as mentioned above, that Hsp70 released by tumors could be pro-inflammatory and possess the properties of DAMPs (Asea et al., 20002002; Vabulas et al., 2002). However, subsequent studies indicated that a portion of the TLR4 activation detected in the earlier reports, involving exposure of monocytes, macrophages, or dendritic cells (DC) to HSPs in vitro may be due to trace contamination with bacterial pathogen associated molecular patterns (PAMPs), potent TLR activators (Tsan and Gao,2004). In spite of these drawbacks, an overwhelming amount of evidence now seems to indicate the interaction of Hsp70 and other HSPs with TLRs (particularly TLR4) in vivo – in a wide range of physiological and pathological conditions, leading to acute inflammation in many conditions (Chase et al., 2007; Wheeler et al., 2009; see Appendix for a full list of references). Thus both TLR2 and TLR4 appear to be important components of inflammatory responses to Hsp70 under many pathophysiological conditions. In cancer therapy it has been shown that autoimmunity can be triggered in mice through necrotic killing of melanocytes engineered to overexpress Hsp70; such treatment led to the concomitant immune destruction of B16 melanoma tumors that share patterns of antigen expression with the killed melanocytes (Sanchez-Perez et al., 2006). Hsp70 appears to play an adjuvant role in this form of therapy through its interaction with TLR4 and induction of the cytokine TNF-a (Sanchez-Perez et al., 2006). However, despite these findings it has also been shown that depletion of Hsp70 in cancer cells can, in the absence of other treatments lead to tumor regression by inducing antitumor immunity (Rerole et al., 2011). This effect appears to be due to the secretion by cancer cells of immunosuppressive exosomes containing Hsp70 that activate MDSC and lead to local immunosuppression (Chalmin et al., 2010). Under normal circumstances therefore, release of endogenous Hsp70 into the extracellular microenvironment may be a component of the tumor defenses against immunosurveillance. Extracellular Hsp60 has also been shown be immunomodulatory and can increase levels of FoxP3 Treg in vitro and suppress T cell-mediated immunity (de Kleer et al., 2010; Aalberse et al., 2011).

The pro-inflammatory properties of extracellular HSPs may be more evident underin vivo situations particularly in the context of tissue damage (Sanchez-Perez et al.,2006). For instance when elevated temperatures were used to boost Hsp70 release from Lewis Lung carcinoma cells in vivo, antitumor immunity was activated along with release of chemokines CCL2, CCL5, and CCL10, in a TLR4-dependent manner, leading to attraction of DC and T cells into the tumor (Chen et al., 2009). Thus under resting conditions, the tumor milieu appears to be a specialized immunosuppressive environment, rich in inhibitory cells such as Treg, MDSC, and M2 macrophages and inaccessible to “exhausted” CD8+ T cells that often fail to penetrate the tumor microcirculation. However, under inflammatory conditions involving necrotic cell killing of tumor cells, extracellular HSPs may be able to amplify the anticancer immune response, intracellular HSPs may be released to further increase such a response and CTL may triggered to penetrate the tumor milieu, inducing antigen-specific cancer cell killing (Evans et al., 2001; Mambula and Calderwood, 2006a; Sanchez-Perez et al., 2006; Chen et al., 2009).


HSP-Based Anticancer Vaccines

It is apparent that a number of HSP types, conjugated to peptide complexes (HSP.PC) from cancer cells form effective bases for immunotherapy approaches with unique properties, as mentioned above (Calderwood et al., 2008; Murshid et al., 2011a). The immunogenicity of most HSP.PC appears to involve the ability of the HSPs to sample the tumor “antigenic fingerprint,” deliver the antigens to antigen presenting cells (APC) such as DC and stimulate activation of CTL (Tamura et al., 1997; Singh-Jasuja et al., 2000b; Wang et al., 2003; Murshid et al.,2010). A number of studies show that HSPs can chaperone tumor antigens and deliver them to the appropriate destination – MHC class I molecules on the DC surface (Singh-Jasuja et al., 2000a,b; Srivastava and Amato, 2001; Delneste et al.,2002; Enomoto et al., 2006; Gong et al., 2009). In addition, Hsp70 has been shown to chaperone viral antigenic peptides and increase cross priming of human CTL under ex vivo conditions (Tischer et al., 2011). However, it is still far from clear how the process of HSP-mediated cross priming unfolds. For instance, the CD8+ expressing DC subpopulation in lymph nodes is regarded as the primary cross-presenting APC (Heath and Carbone, 2009). It is not however currently known whether the CD8+ DC subset or other peripheral or lymph-node resident, DC interact with HSP vaccines to induce cross presentation. HSPs appear to be able to enter APC, such as mouse bone marrow derived DC (BMDC) and human DC in a receptor-mediated manner (Basu et al., 2001; Delneste et al., 2002; Gong et al.,2009; Murshid et al., 2010). However, no unique endocytosing HSP receptor has emerged and HSP–antigen complexes appear instead to be taken up by proteins with “scavenger” function such as LOX-1, SRECI, and CD91 that can each take up a wide range of extracellular ligands (Basu et al., 2001; Delneste et al., 2002; Theriault et al., 2006; Murshid et al., 2010). A pathway for Hsp90–peptide (Hsp90.PC) uptake has been characterized in mouse BMDC by scavenger receptor SRECI (Murshid et al., 2010). SRECI is able to mediate the whole process of Hsp90.PC endocytosis, trafficking through the cytoplasm to the sites of antigen processing and presentation of antigens to CD8+ T lymphocytes on MHC class I molecules (Murshid et al., 2010). This process is known as antigen cross presentation (Kurts et al., 2010). It is not currently clear what the relative contribution to antigen cross presentation of the various HSP receptors might be under in vivo conditions. It may be that each receptor class contributes to an individual aspect of CTL activation by HSP peptide complexes although a definitive understanding may await studies in mice deficient in each receptor class.


HSPs and CTL Programming

It is evident that that HSPs can mediate antigen cross presentation and activate CD8+ T lymphocytes. However, presentation of tumor antigens by DC is not sufficient for CTL programming and, in the absence of co-stimulatory molecules and innate immunity, the “helpless” CD8+ cells will cease to proliferate abundantly and will most likely undergo apoptosis (Schurich et al., 2009; Kurts et al., 2010). One mechanism for enhancing CTL programming involves activation of the TLR pathways that lead to synthesis of co-stimulatory molecules (Rudd et al.,2009; Yamamoto and Takeda, 2010). The co-stimulatory molecules, including CD80 and CD86 then become expressed on the DC cell surface and amplify the signals induced by binding of the T cell receptor on CD8+ T cells to MHC class I peptide complexes on the presenting DC (Parra et al., 1995; Rudd et al., 2009). This process is important in pathogen infection in which microbially derived antigens are encountered in the presence of inflammatory PAMPs that can activate innate immune transcriptional networks. Originally it had been thought that HSPs could provide analogous stimulation through their suspected activity as DAMPs and their inbuilt ability to trigger innate immunity through TLR2 and TLR4 on DC (Asea et al., 20002002; Vabulas et al., 2002). (The potential role of HSPs as DAMPs has been the subject of a recent review: van Eden et al., 2012). Subsequent studies on the capacity of HSPs to bind TLRs do not indicate avid binding of Hsp70 to either TLR2 or TLR4 when expressed in cells deficient in HSP receptors in vitro (Theriault et al., 2006). In vivo however, TLR signaling is essential for Hsp70 vaccine-induced tumor cell killing. Studies of tumor-bearing mice treated with an Hsp70 vaccine in vivo indicated that vaccine function is depleted by knockout of the TLR signaling intermediate Myd88 and completely abrogated by double knockout of TLR2 and TLR4 (Gong et al., 2009). These findings were somewhat complicated by the fact that TLR4 is involved in upstream regulation of the expression of Hsp70 receptor SRECI, but do strongly implicate a role for these receptors in amplifying immune signaling by Hsp70 vaccines and Hsp70-based immunotherapy (Sanchez-Perez et al., 2006; Gong et al., 2009). It is still not clear to what degree HSPs are capable of providing a sturdy DC maturing signal through TLR2/TLR4. The potency of HSP anticancer vaccines could potentially be improved by addition of PAMPs such as CpG DNA shown to activate TLR9, or double stranded RNA that can activate TLR3 (Murshid et al., 2011a). As mentioned, one contradictory factor in the earlier studies was that, although TLR2 and TLR4 are required for a sturdy Hsp70 vaccine-mediated immune response, direct binding of Hsp70 to these receptors was not observed (Theriault et al., 2006; Gong et al., 2009; Murshid et al., 2012). A rationale for these findings might be that HSPs can activate TLR signaling indirectly through primary binding to established HSP receptors such as LOX-1 and SRECI which secondarily recruit and activate the TLRs (Murshid et al., 2011b). Both of these scavenger receptors bind to TLR2 upon stimulation and activate TLR2-based signaling (Jeannin et al., 2005; A. Murshid and SK Calderwood, in preparation). In addition, we have found that Hsp90–SRECI complexes move to the lipid raft compartment of the cell, an environment highly enriched in TLR2 and TLR4 (Triantafilou et al., 2002; Murshid et al., 2010).

http://www.ncbi.nlm.nih.gov/pmc/articles/PMC3342006/bin/fimmu-03-00075-g001.jpg

Heat shock protein–peptide complexes extracted from tumor cells interact with endocytosing receptors (HSP-R) such as SRECI or signaling receptors (TLR) such as TLR4 on DC. SREC1 mediates uptake and intracellular processing of antigens and the presentation of resulting peptides on surface MHC class I and MHC class II proteins. MHC class II receptor–peptide complexes then bind to T cell receptors on CD4+ cells. One consequence of binding is interaction of CD40 ligand on the MHC class II cell with CD40 on the DC leading to the licensing interaction that results in enhanced expression of co-stimulatory proteins on the DC cell surface. The licensed DC may then interact with CD8+ T cells through T cell interaction with MHC class I peptide complexes. This effect will be enhanced by simultaneous interaction of CD80 or Cd86 co-stimulatory complexes on the DC with CD28 on the CD8+ cells, leading to effective CD8+ CTL that can lyse tumor cells. T cell programming can also be amplified by signals emanating from activated TLR that can boost levels of CD80 and CD86 as well as inflammatory cytokines (not shown).


Hsp70, Cell Damage, and Inflammation

The question of whether Hsp70 acts as DAMP and could by itself induce an inflammatory response in cancer patients in vivo is still open. However, some recent studies by Vile et al. using a gene therapy approach may shed some light on the inflammatory role of Hsp70 in tumor therapy. In this approach, as mentioned above, normal murine tissues were engineered to express high Hsp70 levels then subjected to treatments that lead to necrotic killing. The aim was to stimulate an autoimmune response that could lead to bystander immune killing of tumor cells that share the antigenic repertoire as the killed normal cells (Sanchez-Perez et al.,2006). In the initial studies, normal melanocytes were preloaded with Hsp70 plasmids and then necrotic cell death was triggered (Daniels et al., 2004). This treatment led to T cell-mediated immune killing of syngeneic B16 melanoma cells transplanted at a distant site in the mouse, presumably in response to antigens shared by the killed normal melanocytes and melanoma cell (Daniels et al., 2004). This effect only occurred when melanocytes were induced to undergo necrosis and Hsp70 levels were elevated, indicating a role for high levels of Hsp70 in the tumor specific immune response. Interestingly, these conditions did not lead to a prolonged autoimmune response, an effect mediated by the induction of a delayed Treg response (Srivastava, 2003; Daniels et al., 2004). It is notable that some early studies of chaperone-based tumor vaccines in animal models demonstrated a primary CTL response to tumors in response to treatment followed by delayed activation of a Treg reaction, and that chaperone levels must be carefully titrated for effective induction of tumor immunity (Udono and Srivastava, 1993; Liu et al.,2009). The role of Hsp70 in autoimmune rejection of tumors was also investigated in prostate cancer (Kottke et al., 2007). Ablation of normal prostate cells by necrotic killing with fusogenic viruses in the absence of Hsp70 elevation led to the induction of the cytokines IL-10 and TGF-b in the mouse prostate and a Treg response. However, when Hsp70 levels were elevated in these cells, IL-10, TGF-b, and IL-6 were induced simultaneously, the IL-6 component leading to further induction of IL-17, a profound Th17 response and tumor rejection (Kottke et al.,2007). Thus elevated levels of Hsp70, presumably released from cells undergoing necrosis can influence the local cytokine patterns and lead to an inflammatory statein vivo. Interestingly, these results seem to be tissue specific as inflammatory killing of pancreatic cells even in the presence of elevated Hsp70 did not provoke IL-6 release, a Th17 response or tumor rejection and the Treg response dominated under these conditions (Kottke et al., 2009). Thus the role of Hsp70 in tissue inflammation and tumor rejection seems to require elevated concentrations of extracellular chaperones, significant levels of necrotic cell killing, and tissue specific cytokine release.

Conclusion

  • Earlier studies investigating HSP vaccines considered such structures to be the “Swiss penknives” of immunology able to deliver antigens directly to APC and confer a maturing signal that could render DC able to effectively program CTL (Srivastava and Amato, 2001; Noessner et al., 2002). It is well established now that Hsp70, Hsp90, Hsp110, and GRP170 can chaperone tumor antigens and activate antigen cross presentation (Murshid et al., 2011a). In addition, HSPs were thought to be DAMPs with ability to strongly activate TLR signaling and innate immunity (Asea et al., 2000). However, although there is compelling evidence to indicate that Hsp70, for instance can interact with TLR4 under a number of pathological situations (see Appendix, Sanchez-Perez et al., 2006), it remains unclear whether free Hsp70 binds directly to the Toll-like receptor and induces innate immunity in the absence of other treatments in vitro(Tsan and Gao, 2004).
  • Elevated levels of extracellular HSPs appear to have the capacity to amplify the effects of inflammatory signals emanating from necrotic cells in vivoin a TLR4-dependent manner (Daniels et al., 2004; Sanchez-Perez et al., 2006; Kottke et al., 2007). In the presence of cell injury and death, elevated levels of Hsp70 appear to increase the production of inflammatory signals that involve cytokines such as IL-6 and IL-17 and lead to a specific T cell-mediated immune response to tumor cells sharing antigens with the dying cells (Kottke et al., 2007). The mechanisms involved in these processes are not clear although one possibility is that HSPs can induce the engulfment of necrotic cells. Hsp70 has been shown to increase bystander engulfment of a variety of structures (Wang et al., 2006a,b). In addition, tumor cells treated with elevated temperatures release inflammatory chemokines in an Hsp70 and TLR4-dependent mechanisms and this effect may be significant in CTL programming and tumor cell killing (Chen et al., 2009). Our studies indicate that CTL induction by Hsp70 vaccines in vivo has an absolute requirement for TLR2 and TLR4 suggesting that at least in vivo HSPs can trigger innate immunity through TLR signaling (Gong et al., 2009).
  • HSPs appear also to be able to direct antigen presentation through the class II pathway in DC and may stimulate T helper cells (Gong et al., 2009). It may thus be possible that HSPs participate in DC licensing and reinforce CTL programming during exposure to HSP vaccines. Future studies will address these questions.
  • A further interesting consideration is whether HSPs released from untreated tumor cells enhance or depress tumor immunity. One initial study shows that Hsp70 released from tumor cells in exosomes can strongly decrease tumor immunity through effects on MDSC (Chalmin et al., 2010). Further studies will be required to make a definitive statement on these questions.


  1. Protein aggregation disorders and HSP expression

Chaperone suppression of aggregation and altered subcellular proteasome localization imply protein misfolding in SCA1

Christopher J. Cummings1,5, Michael A. Mancini3, Barbara Antalffy4, Donald B. DeFranco7, Harry T. Orr8 & Huda Y. Zoghbi1,2,6
Nature Genetics 19, 148 – 154 (1998) http://dx.doi.org:/10.1038/502

Spinocerebellar ataxia type 1 (SCA1) is an autosomal dominant neurodegenerative disorder caused by expansion of a polyglutamine tract in ataxin-1. In affected neurons of SCA1 patients and transgenic mice, mutant ataxin-1 accumulates in a single, ubiquitin-positive nuclear inclusion. In this study, we show that these inclusions stain positively for the 20S proteasome and the molecular chaperone HDJ-2/HSDJ. Similarly, HeLa cells transfected with mutant ataxin-1 develop nuclear aggregates which colocalize with the 20S proteasome and endogenous HDJ-2/HSDJ. Overexpression of wild-type HDJ-2/HSDJ in HeLa cells decreases the frequency of ataxin-1 aggregation. These data suggest that protein misfolding is responsible for the nuclear aggregates seen in SCA1, and that overexpression of a DnaJ chaperone promotes the recognition of a misfolded polyglutamine repeat protein, allowing its refolding and/or ubiquitin-dependent degradation.

Effects of heat shock, heat shock protein 40 (HDJ-2), and proteasome inhibition on protein aggregation in cellular models of Huntington’s disease

Andreas Wyttenbach, Jenny Carmichael, Jina Swartz, Robert A. Furlong, Yolanda Narain, Julia Rankin, and David C. Rubinsztein*
https://www.researchgate.net/profile/David_Rubinsztein/publication/24447892_Effects_of_heat_shock_heat_shock_protein_40_(HDJ2)_and_proteasome_inhibition_on_protein_aggregation_in_cellular_models_of_Huntington’s_disease/links/00b7d528b80aab69bb000000.pdf

Huntington’s disease (HD), spinocerebellar ataxias types 1 and 3 (SCA1, SCA3), and spinobulbar muscular atrophy (SBMA) are caused by CAGypolyglutamine expansion mutations. A feature of these diseases is ubiquitinated intraneuronal inclusions derived from the mutant proteins, which colocalize with heat shock proteins (HSPs) in SCA1 and SBMA and proteasomal components in SCA1, SCA3, and SBMA. Previous studies suggested that HSPs might protect against inclusion formation, because overexpression of HDJ-2yHSDJ (a human HSP40 homologue) reduced ataxin-1 (SCA1) and androgen receptor (SBMA) aggregate formation in HeLa cells. We investigated these phenomena by transiently transfecting part of huntingtin exon 1 in COS-7, PC12, and SH-SY5Y cells. Inclusion formation was not seen with constructs expressing 23 glutamines but was repeat length and time dependent for mutant constructs with 43–74 repeats. HSP70, HSP40, the 20S proteasome and ubiquitin colocalized with inclusions. Treatment with heat shock and lactacystin, a proteasome inhibitor, increased the proportion of mutant huntingtin exon 1-expressing cells with inclusions. Thus, inclusion formation may be enhanced in polyglutamine diseases, if the pathological process results in proteasome inhibition or a heat-shock response. Overexpression of HDJ-2yHSDJ did not modify inclusion formation in PC12 and SH-SY5Y cells but increased inclusion formation in COS-7 cells. To our knowledge, this is the first report of an HSP increasing aggregation of an abnormally folded protein in mammalian cells and expands the current understanding of the roles of HDJ-2yHSDJ in protein folding.


  1. Hsp70 in blood cell differentiation.


Apoptosis Versus Cell Differentiation -Role of Heat Shock Proteins HSP90, HSP70 and HSP27

David Lanneau, Aurelie de Thonel, Sebastien Maurel, Celine Didelot, and Carmen Garrido
Prion. 2007 Jan-Mar; 1(1): 53–60.  http://www.ncbi.nlm.nih.gov/pmc/articles/PMC2633709/

Heat shock proteins HSP27, HSP70 and HSP90 are molecular chaperones whose expression is increased after many different types of stress. They have a protective function helping the cell to cope with lethal conditions. The cytoprotective function of HSPs is largely explained by their anti-apoptotic function. HSPs have been shown to interact with different key apoptotic proteins. As a result, HSPs can block essentially all apoptotic pathways, most of them involving the activation of cystein proteases called caspases. Apoptosis and differentiation are physiological processes that share many common features, for instance, chromatin condensation and the activation of caspases are frequently observed. It is, therefore, not surprising that many recent reports imply HSPs in the differentiation process. This review will comment on the role of HSP90, HSP70 and HSP27 in apoptosis and cell differentiation. HSPs may determine de fate of the cells by orchestrating the decision of apoptosis versus differentiation.

Key Words: apoptosis, differentiation, heat shock proteins, chaperones, cancer cells, anticancer drugs

Go to:

Introduction

Stress or heat shock proteins (HSPs) were first discovered in 19621 as a set of highly conserved proteins whose expression was induced by different kinds of stress. It has subsequently been shown that most HSPs have strong cytoprotective effects and behave as molecular chaperones for other cellular proteins. HSPs are also induced at specific stages of development, differentiation and during oncogenesis.2 Mammalian HSPs have been classified into five families according to their molecular size: HSP100, HSP90, HSP70, HSP60 and the small HSPs. Each family of HSPs is composed of members expressed either constitutively or regulated inducibly, and/or targeted to different sub-cellular compartments. The most studied HSPs are HSP90, the inducible HSP70 (also called HSP72) and the small heat shock protein HSP27.

HSP90 is a constitutively abundant chaperone that makes up 1–2% of cytosolic proteins. It is an ATP-dependent chaperone that accounts for the maturation and functional stability of a plethora of proteins termed HSP90 client proteins. In mammals, HSP90 comprises 2 homologue proteins (HSP90α and HSP90β) encoded by separated but highly conserved genes that arose through duplication during evolution.3 Most studies do not differentiate between the two isoforms because for a long time they have been considered as having the same function in the cells. However, recent data and notably out-of-function experiments indicate that at least some functions of the beta isoform are not overlapped by HSP90α’s functions.4 HSP70, like HSP90, binds ATP and undergoes a conformational change upon ATP binding, needed to facilitate the refolding of denatured proteins. The chaperone function of HSP70 is to assist the folding of newly synthesized polypeptides or misfolded proteins, the assembly of multi-protein complexes and the transport of proteins across cellular membranes.5,6 HSP90 and HSP70 chaperone activity is regulated by co-chaperones like Hip, CHIP or Bag-1 that increase or decrease their affinity for substrates through the stabilization of the ADP or ATP bound state. In contrast to HSP90 and HSP70, HSP27 is an ATP-independent chaperone, its main chaperone function being protection against protein aggregation.7 HSP27 can form oligomers of more than 1000 Kda. The chaperone role of HSP27 seems modulated by its state of oligomerization, the multimer being the chaperone competent state.8 This oligomerization is a very dynamic process modulated by the phosphorylation of the protein that favors the formation of small oligomers. Cell-cell contact and methylglyoxal can also modulate the oligomerization of the protein.9

It is now well accepted that HSPs are important modulators of the apoptotic pathway. Apoptosis, or programmed cell death, is a type of death essential during embryogenesis and, latter on in the organism, to assure cell homeostasis. Apoptosis is also a very frequent type of cell death observed after treatment with cytotoxic drugs.10 Mainly, two pathways of apoptosis can be distinguished, although cross-talk between the two signal transducing cascades exists (Fig. 1). The extrinsic pathway is triggered through plasma membrane proteins of the tumor necrosis factor (TNF) receptor family known as death receptors, and leads to the direct activation of the proteases called caspases, starting with the receptor-proximal caspase-8. The intrinsic pathway involves intracellular stress signals that provoke the permeabilization of the outer mitochondrial membrane, resulting in the release of pro-apoptotic molecules normally confined to the inter-membrane space. Such proteins translocate from mitochondria to the cytosol in a reaction that is controlled by Bcl-2 and Bcl-2-related proteins.11 One of them is the cytochrome c, which interacts with cytosolic apoptosis protease-activating factor-1 (Apaf-1) and pro-caspase-9 to form the apoptosome, the caspase-3 activation complex.12Apoptosis inducing factor (AIF) and the Dnase, EndoG, are other mitochondria intermembrane proteins released upon an apoptotic stimulus. They translocate to the nucleus and trigger caspase-independent nuclear changes.13,14 Two additional released mitochondrial proteins, Smac/Diablo and Htra2/Omi, activate apoptosis by neutralizing the inhibitory activity of the inhibitory apoptotic proteins (IAPs) that associate with and inhibit caspases15 (Fig. 1).

Figure 1     http://www.ncbi.nlm.nih.gov/pmc/articles/PMC2633709/figure/F1/

Modulation of apoptosis and differentiation by HSP90, HSP70 and HSP27. In apoptosis (upper part), HSP90 can inhibit caspase (casp.) activation by its interaction with Apaf1. HSP90 stabilizes proteins from the survival signaling including RIP, Akt and 

Apoptosis and differentiation are two physiological processes that share different features like chromatin condensation or the need of caspase activity.16 It has been demonstrated in many differentiation models that the activation of caspases is preceded by a mitochondrial membrane depolarization and release of mitochondria apoptogenic molecules.17,18 This suggests that the mitochondrial-caspase dependent apoptotic pathway is a common intermediate for conveying apoptosis and differentiation. Timing, intensity and cellular compartmentalization might determine whether a cell is to die or differentiate. HSPs might be essential to orchestrate this decision. This review will describe the role of HSP90, HSP70 and HSP27 in apoptosis and cell differentiation.


HSP27, HSP70 and HSP90 are Anti-Apoptotic Proteins

Overexpression of HSP27, HSP70 or HSP90 prevents apoptosis triggered by various stimuli, including hyperthermia, oxidative stress, staurosporine, ligation of the Fas/Apo-1/CD95 death receptor or anticancer drugs.2,1921 Downregulation or inhibition of HSP27, HSP70 or HSP90 have been shown to be enough to sensitize a cell to apoptosis, proving that endogenous levels of those chaperones seem to be sufficiently high to control apoptosis.2224 It is now known that these chaperones can interact with key proteins of the apoptotic signaling pathways (Fig. 1).


HSP90: A survival protein through its client proteins.

HSP90 client proteins include a number of signaling proteins like ligand-dependent transcription factors and signal transducing kinases that play a role in the apoptotic process. Upon binding and hydrolysis of ATP, the conformation of HSP90 changes and the client protein, which is no longer chaperoned, is ubiquitinated and degraded by the proteasome.25

A function for HSP90 in the serine/threonine protein kinase Akt pathway was first suggested by studies using an HSP90 inhibitor that promoted apoptosis in HEK293T and resulted in suppressed Akt activity.26 A direct interaction between Akt and HSP90 was reported later.27 Binding of HSP90 protects Akt from protein phosphatase 2A (PP2A)-mediated dephosphorylation.26 Phosphorylated Akt can then phosphorylate the Bcl-2 family protein Bad and caspase-9 leading to their inactivation and to cell survival.28,29 But Akt has been also shown to phosphorylate IkB kinase, which results in promotion of NFkB-mediated inhibition of apoptosis.30 When the interaction HSP90/Akt was prevented by HSP90 inhibitors, Akt was dephosphorylated and destabilized and the likelihood of apoptosis increased.27 Additional studies showed that another chaperone participates in the Akt-HSP90 complex, namely Cdc37.26 Together this complex protects Akt from proteasome degradation. In human endothelial cells during high glucose exposure, apoptosis can be prevented by HSP90 through augmentation of the protein interaction between eNOS and HSP90 and recruitment of the activated Akt.31 HSP90 has also been shown to interact with and stabilize the receptor interacting protein (RIP). Upon ligation of TNFR-1, RIP-1 is recruited to the receptor and promotes the activation of NFκB and JNK. Degradation of RIP-1 in the absence of HSP90 precludes activation of NFκB mediated by TNFα and sensitizes cells to apoptosis.32 Another route by which HSP90 can affect NFκB survival activity is via the IKK complex.33 The HSP90 inhibitor geldanamycin prevents TNF-induced activation of IKK, highlighting the role of HSP90 in NFκB activation. Some other HSP90 client proteins through which this chaperone could participate in cell survival are p5334 and the transcription factors Her2 and Hif1α.35,36

But the anti-apoptotic role of HSP90 can also be explained by its effect and interaction with proteins not defined as HSP90 client proteins (i.e., whose stability is not regulated by HSP90). HSP90 overexpression in human leukemic U937 cells can prevent the activation of caspases in cytosolic extracts treated with cytochrome c probably because HSP90 can bind to Apaf-1 and inhibit its oligomerization and further recruitment of procaspase-9.37

Unfortunately, most studies do not differentiate between HSP90α and HSP90β. It has recently been demonstrated in multiple myeloma, in which an over expression of HSP90 is necessary for cell survival, that depletion of HSP90β by siRNA is sufficient to induce apoptosis. This effect is strongly increased when also HSP90α is also depleted,23 suggesting different and cooperating anti-apoptotic properties for HSP90α and HSP90β. Confirming this assumption, in mast cells, HSP90β has been shown to associate with the anti-apoptotic protein Bcl-2. Depletion of HSP90β with a siRNA or inhibion of HSP90 with geldanamycin inhibits HSP90β interaction with Bcl-2 and results in cytochrome c release, caspase activation and apoptosis.38

In conclusion, HSP90 anti-apoptotic functions can largely be explained by its chaperone role assuring the stability of different proteins. Recent studies suggest that the two homologue proteins, HSP90α and HSP90β, might have different survival properties. It would be interesting to determine whether HSP90α and HSP90β bind to different client proteins or bind with different affinity.


HSP70: A quintessential inhibitor of apoptosis.

HSP70 loss-of-function studies demonstrated the important role of HSP70 in apoptosis. Cells lacking hsp70.1 and hsp70.3, the two genes that code for inductive HSP70, are very sensitive to apoptosis induced by a wide range of lethal stimuli.39Further, the testis specific isoform of HSP70 (hsp70.2) when ablated, results in germ cell apoptosis.40 In cancer cells, depletion of HSP70 results in spontaneous apoptosis.41

HSP70 has been shown to inhibit the apoptotic pathways at different levels (Fig. 1). At the pre-mitochondrial level, HSP70 binds to and blocks c-Jun N-terminal Kinase (JNK1) activity.42,43 Confirming this result, HSP70 deficiency induces JNK activation and caspase-3 activation44 in apoptosis induced by hyperosmolarity. HSP70 also has been shown to bind to non-phosphorylated protein kinase C (PKC) and Akt, stabilizing both proteins.45

At the mitochondrial level, HSP70 inhibits Bax translocation and insertion into the outer mitochondrial membrane. As a consequence, HSP70 prevents mitochondrial membrane permeabilization and release of cytochrome c and AIF.46

At the post-mitochondrial level HSP70 has been demonstrated to bind directly to Apaf-1, thereby preventing the recruitment of procaspase-9 to the apoptosome.47However, these results have been contradicted by a study in which the authors demonstrated that HSP70 do not have any direct effect on caspase activation. They explain these contradictory results by showing that it is a high salt concentration and not HSP70 that inhibits caspase activation.48

HSP70 also prevents cell death in conditions in which caspase activation does not occur.49 Indeed, HSP70 binds to AIF, inhibits AIF nuclear translocation and chromatin condensation.39,50,51 The interaction involves a domain of AIF between aminoacids 150 and 228.52 AIF sequestration by HSP70 has been shown to reduce neonatal hypoxic/ischemic brain injury.53 HSP70 has also been shown to associate with EndoG and to prevent DNA fragmentation54 but since EndoG can form complexes with AIF, its association with HSP70 could involve AIF as a molecular bridge.

HSP70 can also rescue cells from a later phase of apoptosis than any known survival protein, downstream caspase-3 activation.55 During the final phases of apoptosis, chromosomal DNA is digested by the DNase CAD (caspase activated DNase), following activation by caspase-3. The enzymatic activity and proper folding of CAD has been reported to be regulated by HSP70.56

At the death receptors level, HSP70 binds to DR4 and DR5, thereby inhibiting TRAIL-induced assembly and activity of death inducing signaling complex (DISC).57 Finally, HSP70 has been shown to inhibit lysosomal membrane permeabilization thereby preventing cathepsines release, proteases also implicated in apoptosis.58,59

In conclusion, HSP70 is a quintessential regulator of apoptosis that can interfere with all main apoptotic pathways. Interestingly, the ATP binding domain of HSP70 is not always required. For instance, while the ATPase function is needed for the Apaf-150 and AIF binding,51 it is dispensable for JNK60 or GATA-161binding/protection. In this way, in erythroblasts, in which HSP70 blocks apoptosis by protecting GATA-1 from caspase-3 cleavage, a HSP70 mutant that lacks the ATP binding domain of HSP70 is as efficient as wild type HSP70 in assuring the protection of erythroblasts.61


HSP27: An inhibitor of caspase activation.

HSP27 depletion reports demonstrate that HSP27 essentially blocks caspase-dependent apoptotic pathways. Small interefence targeting HSP27 induces apoptosis through caspase-3 activation.62,63 This may be consequence of the association of HSP27 with cytochrome c in the cytosol, thereby inhibiting the formation of the caspase-3 activation complex as demonstrated in leukemia and colon cancer cells treated with different apoptotic stimuli.6466 This interaction involves amino-acids 51 and 141 of HSP27 and do not need the phosphorylation of the protein.65 In multiple myeloma cells treated with dexamethasone, HSP27 has also been shown to interact with Smac.67

HSP27 can also interfere with caspase activation upstream of the mitochondria.66This effect seems related to the ability of HSP27 to interact and regulate actin microfilaments dynamics. In L929 murine fibrosarcoma cells exposed to cytochalasin D or staurosporine, overexpressed HSP27 binds to F-actin68preventing the cytoskeletal disruption, Bid intracellular redistribution and cytochrome c release66 (Fig. 1). HSP27 has also important anti-oxidant properties. This is related to its ability to uphold glutathione in its reduced form,69 to decrease reactive oxygen species cell content,19 and to neutralize the toxic effects of oxidized proteins.70 These anti-oxidant properties of HSP27 seem particularly relevant in HSP27 protective effect in neuronal cells.71

HSP27 has been shown to bind to the kinase Akt, an interaction that is necessary for Akt activation in stressed cells. In turn, Akt could phosphorylate HSP27, thus leading to the disruption of HSP27-Akt complexes.72 HSP27 also affects one downstream event elicited by Fas/CD95. The phosphorylated form of HSP27 directly interacts with Daxx.73 In LNCaP tumor cells, HSP27 has been shown to induce cell protection through its interaction with the activators of transcription 3 (Stat3).74 Finally, HSP27 protective effect can also be consequence of its effect favouring the proteasomal degradation of certain proteins under stress conditions. Two of the proteins that HSP27 targets for their ubiquitination/proteasomal degradation are the transcription factor nuclear factor κB (NFκB) inhibitor IκBα and p27kip1. The pronounced degradation of IkBα induced by HSP27 overexpression increases NFκB dependent cell survival75 while that of p27kip1facilitates the passage of cells to the proliferate phases of the cellular cycle. As a consequence HSP27 allows the cells to rapidly resume proliferation after a stress.76

Therefore, HSP27 is able to block apoptosis at different stages because of its interaction with different partners. The capacity of HSP27 to interact with one or another partner seems to be determined by the oligomerization/phosphorylation status of the protein, which, at its turn, might depend on the cellular model/experimental conditions. We have demonstrated in vitro and in vivo that for HSP27 caspase-dependent anti-apoptotic effect, large non-phosphorylated oligomers of HSP27 were the active form of the protein.77 Confirming these results, it has recently been demonstrated that methylglyoxal modification of HSP27 induces large oligomers formation and increases the anti-apoptotic caspase-inhibitory properties of HSP27.78 In contrast, for HSP27 interaction with the F-actin and with Daxx, phosphorylated and small oligomers of HSP27 were necessary73,79 and it is its phosphorylated form that protects against neurotoxicity.80


HSP27, HSP70 and HSP90 and Cell Differentiation

Under the prescribed context of HSPs as powerful inhibitors of apoptosis, it is reasonable to assume that an increase or decrease in their expression might modulate the differentiation program. The first evidence of the role of HSPs in cell differentiation comes from their tightly regulated expression at different stages of development and cell differentiation. For instance during the process of endochondrial bone formation, they are differentially expressed in a stage-specific manner.81 In addition, during post-natal development, time at which extensive differentiation takes place, HSPs expression is regulated in neuronal and non-neuronal tissues.82 In hemin-induced differentiation of human K562 erythroleukemic cells, genes coding for HSPs are induced.83

In leukemic cells HSP27 has been described as a pre-differentiation marker84because its induction occurs early during differentiation.8588 HSP27 expression has also been suggested as a differentiation marker for skin keratinocytes89 and for C2C12 muscle cells.90 This role for HSP27 in cell differentiation might be related to the fact that HSP27 expression increases as cells reach the non proliferative/quiescent phases of the cellular cycle (G0/G1).19,76

Subcellular localization is another mechanism whereby HSPs can determine whether a cell is to die or to differentiate. We, and others, have recently demonstrated the essential function of nuclear HSP70 for erythroid differentiation. During red blood cells’ formation, HSP70 and activated caspase-3 accumulate in the nucleus of the erythroblast.91 HSP70 directly associates with GATA-1 protecting this transcription factor required for erythropoiesis from caspase-3 cleavage. As a result, erythroblats continue their differentiation process instead of dying by apoptosis.61 HSP70, during erythropoiesis in TF-1 cells, have been shown to bind to AIF and thereby to block AIF-induced apoptosis, thus allowing the differentiation of erythroblasts to proceed.18

HSP90 has been required for erythroid differentiation of leukemia K562 cells induced by sodium butyrate92 and for DMSO-differentiated HL-60 cells. Regulation of HSP90 isoforms may be a critical event in the differentiation of human embryonic carcinoma cells and may be involved in differentiation into specific cell lineages.93 This effect of HSP90 in cell differentiation is probably because multiple transduction proteins essential for differentiation are client proteins of HSP90 such as Akt,94 RIP32 or Rb.95 Loss of function studies confirm that HSP90 plays a role in cell differentiation and development. In Drosophila melanogaster, point mutations of HSP83 (the drosophila HSP90 gene) are lethal as homozygotes. Heteterozygous mutant combinations produce viable adults with the same developmental defect: sterility.96 In Caenorhabditis elegans, DAF-21, the homologue of HSP90, is necessary for oocyte development.97 In zebrafish, HSP90 is expressed during normal differentiation of triated muscle fibres. Disruption of the activity of the proteins or the genes give rise to failure in proper somatic muscle development.98 In mice, loss-of-function studies demonstrate that while HSP90α loss-of-function phenotype appears to be normal, HSP90β is lethal. HSP90β is essential for trophoblasts differentiation and thereby for placenta development and this function can not be performed by HSP90α.4

HSP90 inhibitors have also been used to study the role of HSP90 in cell differentiation. These inhibitors such as the benzoquinone ansamycin geldanamycin or its derivative the 17-allylamino-17-demethoxygeldanamycin (17-AAG), bind to the ATP-binding “pocket” of HSP90 with higher affinity than natural nucleotides and thereby HSP90 chaperone activity is impaired and its client proteins are degraded. As could be expected by the reported role of HSP90 in cell differentiation, inhibitors of HSP90 block C2C12 myoblasts differentiation.99 In cancer cells and human leukemic blasts, 17-AAG induces a retinoblastoma-dependent G1 block. These G1 arrested cells do not differentiate but instead die by apoptosis.100

However, some reports describe that inhibitors of HSP90 can induce the differentiation process. In acute myeloid leukemia cells, 17-AAG induced apoptosis or differentiation depending on the dose and time of the treatment.101Opposite effects on cell differentiation and apoptosis are also obtained with the HSP90 inhibitor geldanamycin: in PC12 cells it induced apoptosis while in murin neuroblastoma N2A cells it induced differentiation.102 In breast cancer cells, 17-AAG-induced G1 block is accompanied by differentiation followed by apoptosis.103 The HSP90 inhibitor PU3, a synthetic purine that like 17-AAG binds with high affinity to the ATP “pocket” of HSP90, caused breast cancer cells arrest in G1 phase and differentiation.104

These contradictory reports concerning the inhibitors of HSP90 and cell differentiation could be explained if we consider that these drugs, depending on the experimental conditions, can have some side effects more or less independent of HSP90. Another possibility is that these studies do not differentiate between the amount of HSP90α and HSP90β inhibited. It is presently unknown whether HSP90 inhibitors equally block both isoforms, HSP90α and HSP90β. It not known neither whether post-translational modifications of HSP90 (acetylation, phosphorylation.) can affect their affinity for the inhibitors. HSP90α has been reported to be induced by lethal stimuli while the HSP90β can be induced by growth factors or cell differentiating signals.105 Mouse embryos out-of-function studies clearly show the role of HSP90β in the differentiation process and, at least for HSP90β role in embryo cell differentiation, there is not an overlap with HSP90α functions. Therefore, we can hypothesized that it can be the degree of inhibition of HSP90β by the HSP90 inhibitors that would determine whether or not there is a blockade of the differentiation process. This degree of inhibition of the different HSP90 isoforms might be conditioned by their cellular localization and their post-translational modifications. It should be noted, however, that the relative relevance of HSP90β in the differentiation process might depend on the differentiation model studied.

To summarize, we can hypothesize that the role in the differentiation process of a chaperone will be determined by its transient expression, subcellular redistribution and/or post-translational modifications induced at a given stage by a differ- entiation factor. How can HSPs affect the differentiation process? First by their anti-apoptotic role interfering with caspase activity, we and other authors have shown that caspase activity was generally required for cell differentiation.16,17Therefore, HSPs by interfering with caspase activity at a given moment, in a specific cellular compartment, may orchestrate the decision differentiation versus apoptosis. In this way, we have recently shown that HSP70 was a key protein to orchestrate this decision in erythroblasts.61 Second, HSPs may affect the differentiation process by regulating the nuclear/cytosolic shuttling of proteins that take place during differentiation. For instance, c-IAP1 is translocated from the nucleus to the cytosol during differentiation of hematopoietic and epithelial cells, and we have demonstrated that HSP90 is needed for this c-IAP1 nuclear export.106It has also been shown that, during erythroblast differentiation, HSP70 is needed to inhibit AIF nuclear translocation.18 Third, in the case of HSP90, the role in the differentiation process could be through certain of its client proteins, like RIP or Akt, whose stability is assured by the chaperone.


Repercussions and Concluding Remarks

The ability of HSPs to modulate the fate of the cells might have important repercussions in pathological situations such as cancer. Apoptosis, differentiation and oncogenesis are very related processes. Defaults in differentiation and/or apoptosis are involved in many cancer cells’ aetiology. HSPs are abnormally constitutively high in most cancer cells and, in clinical tumors, they are associated with poor prognosis. In experimental models, HSP27 and HSP70 have been shown to increase cancer cells’ tumorigenicty and their depletion can induce a spontaneous regression of the tumors.24,107 Several components of tumor cell-associated growth and survival pathways are HSP90 client proteins. These qualities have made HSPs targets for anticancer drug development. Today, although many research groups and pharmaceutical companies look for soluble specific inhibitors of HSP70 and HSP27, only specific soluble inhibitors of HSP90 are available for clinical trials. For some of them (17-AAG) phase II clinical trials are almost finished.108 However, considering the new role of HSP90β in cell differentiation, it seems essential to re-evaluate the functional consequences of HSP90 blockade.

Differential expression of heat shock protein 70 (hsp70) in …

by D Lang – ‎2000 Journal of Leukocyte Biology  www.jleukbio.org/content/68/5/729.long


Related articles

Differential expression of heat shock protein 70 (hsp70) in human monocytes … Induction of hsp70 in different cell lines also increases the resistance to … (NO), oxidative stress, chemotherapeutic agents, ceramide, or radiation []. ….. and type-2 cytokines in the regulation of human monocyte apoptosis  Blood 90,1618-1625.

Cell Death and Disease – Do not stress, just differentiate …

Nature Jan 29, 2015 by C Boudesco – ‎2015 – ‎Related articles

– The concept that cell differentiation needs a specific pattern of HSPs was first … shock, suggesting a specific role for HSPs in red blood cell formation. … Conversely, HSP70, the well-described role of which is to assist the … Trinklein ND et al Cell Stress Chaperones 2004; 9: 21–28.

Cell Death and Differentiation – Pharmacological induction …

Nature by ZN Demidenko – ‎2006 – ‎ ‎Related articles

Nov 25, 2005 – Pharmacological induction of Hsp70 protects apoptosis-prone cells from …. GA did not cause cleavage of caspase-9 and PARP in HL60 cells …

HSP90 and HSP70: Implication in Inflammation Processes …

by M Sevin – ‎2015  – ‎Related articles  www.hindawi.com/journals/mi/2015/970242/

Sep 27, 2015 – In Bcr-abl leukaemia cells, the expression of the protein HSP70 is also elevated ….. GATA-1 protein level during erythroid cell differentiation,” Blood, vol. …. Cdc37 and Hsp90,” Molec Cell 2002; 9(2): 401–410


HSF-1 activates the ubiquitin proteasome system to promote non-apoptotic developmental cell death inC. elegans

A new pathway for non-apoptotic cell death

The results presented here allow us to construct a model for the initiation and execution of LCD in C. elegans (Figure 7). The logic of the LCD pathway may be similar to that of developmental apoptotic pathways. In C. elegans and Drosophila, where the control of specific cell deaths has been primarily examined, cell lineage or fate determinants control the expression of specific transcription factors that then impinge on proteins regulating caspase activation (Fuchs and Steller, 2011). Likewise, LCD is initiated by redundant determinants that require a transcription factor to activate protein degradation genes.

Figure 7.

https://elife-publishing-cdn.s3.amazonaws.com/12821/elife-12821-fig7-v3-480w.jpg

Figure 7. Model for linker cell death.

Green, upstream regulators. Orange, HSF-1. Purple, proteolytic components.    DOI: http://dx.doi.org/10.7554/eLife.12821.016


Our data suggest that three partially redundant signals control LCD initiation. The antagonistic Wnt pathways we describe may provide positional information to the linker cell, as the relevant ligands are expressed only near the region where the linker cell dies. The LIN-29 pathway, which controls timing decisions during the L4-adult molt, may ensure that LCD takes place only at the right time. Finally, while the TIR-1/SEK-1 pathway could act constitutively in the linker cell, it may also respond to specific cues from neighboring cells. Indeed, MAPK pathways are often induced by extracellular ligands. We propose that these three pathways, together, trigger activation of HSF-1. Our data support a model in which HSF-1 is present in two forms, HSF-1LC, promoting LCD, and HSF-1HS, protecting cells from stresses, including heat shock. We postulate that the redundant LCD initiation pathways tip the balance in favor of HSF-1LC, allowing this activity to bind to promoters and induce transcription of key LCD effectors, including LET-70/UBE2D2 and other components of the ubiquitin proteasome system (UPS), functioning through E3 ligase complexes consisting of CUL-3, RBX-1, BTBD-2, and SIAH-1.

Importantly, the molecular identification of LCD components and their interactions opens the door to testing the impact of this cell death pathway on vertebrate development. For example, monitoring UBE2D2 expression during development could reveal upregulation in dying cells. Likewise, genetic lesions in pathway components we identified may lead to a block in cell death. Double mutants in apoptotic and LCD genes would allow testing of the combined contributions of these processes.

The proteasome and LCD

As is the case with caspase proteases that mediate apoptosis (Pop and Salvesen, 2009), how the UPS induces LCD is not clear, and remains an exciting area of future work. That loss of BTBD-2, a specific E3 ligase component, causes extensive linker cell survival suggests that a limited set of targets may be required for LCD. Previous work demonstrated that BTBD2, the vertebrate homolog of BTBD-2, interacts with topoisomerase I (Khurana et al., 2010; Xu et al., 2002), raising the possibility that this enzyme may be a relevant target, although other targets may exist.

The UPS has been implicated in a number of cell death processes in which it appears to play a general role in cell dismantling, most notably, perhaps, in intersegmental muscle remodeling during metamorphosis in moths (Haas et al., 1995). However, other studies suggest that the UPS can have specific regulatory functions, as with caspase inhibition by IAP E3 ligases (Ditzel et al., 2008).

During Drosophila sperm development, caspase activity is induced by the UPS to promote sperm individualization, a process that resembles cytoplasm-specific activation of apoptosis (Arama et al., 2007). While C. elegans caspases are dispensible for LCD, it remains possible that they participate in linker cell dismantling or serve as a backup in case the LCD program fails.

Finally, the proteasome contains catalytic domains with target cleavage specificity reminiscent of caspases; however, inactivation of the caspase-like sites does not, alone, result in overt cellular defects (Britton et al., 2009), suggesting that this activity may be needed to degrade only specific substrates. Although the proteasome generally promotes proteolysis to short peptides, site-specific cleavage of proteins by the proteasome has been described (Chen et al., 1999). It is intriguing to speculate, therefore, that caspases and the proteasome may have common, and specific, targets in apoptosis and LCD.

A pro-death developmental function for HSF-1

Our discovery that C. elegans heat-shock factor, HSF-1, promotes cell death is surprising. Heat-shock factors are thought to be protective proteins, orchestrating the response to protein misfolding induced by a variety of stressors, including elevated temperature. Although a role for HSF1 has been proposed in promoting apoptosis of mouse spermatocytes following elevated temperatures (Nakai et al., 2000), it is not clear whether this function is physiological. In this context, HSF1 induces expression of the gene Tdag51 (Hayashida et al., 2006). Both pro- and anti-apoptotic activities have been attributed to Tdag51 (Toyoshima et al., 2004), and which is activated in sperm is not clear. Recently, pathological roles for HSF1 in cancer have been detailed (e.g. Mendillo et al., 2012), but in these capacities HSF1 still supports cell survival.

Developmental functions for HSF1 have been suggested in which HSF1 appears to act through transcriptional targets different from those of the heat-shock response (Jedlicka et al., 1997), although target identity remains obscure. Here, we have shown that HSF-1 has at least partially non-overlapping sets of stress-induced and developmental targets. Indeed, typical stress targets of HSF-1, such as the small heat-shock gene hsp-16.49 as well as genes encoding larger chaperones, likehsp-1, are not expressed during LCD, whereas let-70, a direct transcriptional target for LCD, is not induced by heat shock. Interestingly, the yeast let-70 homologs ubc4 and ubc5 are induced by heat shock (Seufert and Jentsch, 1990), supporting a conserved connection between HSF and UBE2D2-family proteins. However, the distinction between developmental and stress functions is clearly absent in this single-celled organism, raising the possibility that this separation of function may be a metazoan innovation.

What distinguishes the stress-related and developmental forms of HSF-1? One possibility is that whereas the stress response appears to be mediated by HSF-1 trimerization, HSF-1 monomers or dimers might promote LCD roles. Although this model would nicely account for the differential activities in stress responses and LCD of the HSF-1(R145A) transgenic protein, which would be predicted to favor inactivation of a larger proportion of higher order HSF-1 complexes, the identification of conserved tripartite HSEs in the let-70 and rpn-3 regulatory regions argues against this possibility. Alternatively, selective post-translational modification of HSF-1 could account for these differences. In mammals, HSF1 undergoes a variety of modifications including phosphorylation, acetylation, ubiquitination, and sumoylation (Xu et al., 2012), which, depending on the site and modification, stimulate or repress HSF1 activity. In this context, it is of note that p38/MAPK-mediated phosphorylation of HSF1 represses its stress-related activity (Chu et al., 1996), and the LCD regulator SEK-1 encodes a MAPKK. However, no single MAPK has been identified that promotes LCD (E.S.B., M.J.K. unpublished results), suggesting that other mechanisms may be at play.

Our finding that POP-1/TCF does not play a significant role in LCD raises the possibility that Wnt signaling exerts direct control over HSF-1 through interactions with β-catenin. However, we have not been able to demonstrate physical interactions between these proteins to date (M.J.K, unpublished results).

Finally, a recent paper (Labbadia and Morimoto, 2015) demonstrated that in young adult C. elegans, around the time of LCD, global binding of HSF-1 to its stress-induced targets is reduced through changes in chromatin modification. Remarkably, we showed that chromatin regulators play a key role in let-70 induction and LCD (J.A.M., M.J.K and S.S., manuscript in preparation), suggesting, perhaps, that differences in HSF-1 access to different loci may play a role in distinguishing its two functions.

LCD and neurodegeneration

Previous studies from our lab raised the possibility that LCD may be related to degenerative processes that promote vertebrate neuronal death. Nuclear crenellation is evident in dying linker cells and in degenerating cells in polyQ disease (Abraham et al., 2007) and the TIR-1/Sarm adapter protein promotes LCD in C. elegans as well as degeneration of distal axonal segments following axotomy in Drosophila and vertebrates (Osterloh et al., 2012). The studies we present here, implicating the UPS and heat-shock factor in LCD, also support a connection with neurodegeneration. Indeed, protein aggregates found in cells of patients with polyQ diseases are heavily ubiquitylated (Kalchman et al., 1996). Chaperones also colocalize with protein aggregates in brain slices from SCA patients, and HSF1 has been shown to alleviate polyQ aggregation and cellular demise in both polyQ-overexpressing flies and in neuronal precursor cells (Neef et al., 2010). While the failure of proteostatic mechanisms in neurodegenerative diseases is generally thought to be a secondary event in their pathogenesis, it is possible that this failure reflects the involvement of a LCD-like process, in which attempts to engage protective measures instead result in activation of a specific cell death program.

Read Full Post »

https://www.youtube.com/v/AfO51ELsECg?fs=1&hl=fr_FR

Effects of Heterogeneous Diffuse Fibrosis on Arrhythmia Dynamics and Mechanism. Ivan V. Kazbanov et al (2016), Scientific Reports http://dx.doi.org/10.1038/s...

Sourced through Scoop.it from: www.youtube.com

See on Scoop.itCardiovascular Disease: PHARMACO-THERAPY

Read Full Post »

Hybrid lipid bioelectronic membranes

Larry H. Bernstein, MD, FCAP, Curator

LPBI


Hybrid solid-state chips and biological cells integrated at molecular level

Biological ion channels combine with solid-state transistors to create a new kind of hybrid bioelectronics. Imagine chips with dog-like capability to taste and smell, or even recognize specific molecules.
http://www.kurzweilai.net/hybrid-solid-state-chips-and-biological-cells-integrated-at-molecular-level
Illustration depicting a biocell attached to a CMOS integrated circuit with a membrane containing sodium-potassium pumps in pores. Energy is stored chemically in ATP molecules. When the energy is released as charged ions (which are then converted to electrons to power the chip at the bottom of the experimental device), the ATP is converted to ADP + inorganic phosphate. (credit: Trevor Finney and Jared Roseman/Columbia Engineering)

Columbia Engineering researchers have combined biological and solid-state components for the first time, opening the door to creating entirely new artificial biosystems.

In this experiment, they used a biological cell to power a conventional solid-state complementary metal-oxide-semiconductor (CMOS) integrated circuit. An artificial lipid bilayer membrane containing adenosine triphosphate (ATP)-powered ion pumps (which provide energy for cells) was used as a source of ions (which were converted to electrons to power the chip).

The study, led by Ken Shepard, Lau Family Professor of Electrical Engineering and professor of biomedical engineering at Columbia Engineering, was published online today (Dec. 7, 2015) in an open-access paper in Nature Communications.

How to build a hybrid biochip

Living systems achieve this functionality with their own version of electronics based on lipid membranes and ion channels and pumps, which act as a kind of “biological transistor.” Charge in the form of ions carry energy and information, and ion channels control the flow of ions across cell membranes.

Solid-state systems, such as those in computers and communication devices, use electrons; their electronic signaling and power are controlled by field-effect transistors.

To build a prototype of their hybrid system, Shepard’s team packaged a CMOS integrated circuit (IC) with an ATP-harvesting “biocell.” In the presence of ATP, the system pumped ions across the membrane, producing an electrical potential (voltage)* that was harvested by the integrated circuit.

“We made a macroscale version of this system, at the scale of several millimeters, to see if it worked,” Shepard notes. “Our results provide new insight into a generalized circuit model, enabling us to determine the conditions to maximize the efficiency of harnessing chemical energy through the action of these ion pumps. We will now be looking at how to scale the system down.”

While other groups have harvested energy from living systems, Shepard and his team are exploring how to do this at the molecular level, isolating just the desired function and interfacing this with electronics. “We don’t need the whole cell,” he explains. “We just grab the component of the cell that’s doing what we want. For this project, we isolated the ATPases because they were the proteins that allowed us to extract energy from ATP.”

The capability of a bomb-sniffing dog, no Alpo required

Next, the researchers plan to go much further, such as recognizing specific molecules and giving chips the potential to taste and smell.

The ability to build a system that combines the power of solid-state electronics with the capabilities of biological components has great promise, they believe. “You need a bomb-sniffing dog now, but if you can take just the part of the dog that is useful — the molecules that are doing the sensing — we wouldn’t need the whole animal,” says Shepard.

The technology could also provide a power source for implanted electronic devices in ATP-rich environments such as inside living cells, the researchers suggest.

*  “In general, integrated circuits, even when operated at the point of minimum energy in subthreshold, consume on the order of 10−2 W mm−2 (or assuming a typical silicon chip thickness of 250 μm, 4 × 10⁻² W mm−3). Typical cells, in contrast, consume on the order of 4 × 10⁻⁶ W mm−3. In the experiment, a typical active power dissipation for the IC circuit was 92.3 nW, and the active average harvesting power was 71.4 fW for the biocell (the discrepancy is managed through duty-cycled operation of the IC).” — Jared M. Roseman et al./Nature Communications


Hybrid integrated biological–solid-state system powered with adenosine triphosphate

Jared M. RosemanJianxun LinSiddharth RamakrishnanJacob K. Rosenstein & Kenneth L. Shepard
Nature Communications 7 Dec 2015; 6(10070)
     http://dx.doi.org:/10.1038/ncomms10070

There is enormous potential in combining the capabilities of the biological and the solid state to create hybrid engineered systems. While there have been recent efforts to harness power from naturally occurring potentials in living systems in plants and animals to power complementary metal-oxide-semiconductor integrated circuits, here we report the first successful effort to isolate the energetics of an electrogenic ion pump in an engineered in vitro environment to power such an artificial system. An integrated circuit is powered by adenosine triphosphate through the action of Na+/K+ adenosine triphosphatases in an integrated in vitro lipid bilayer membrane. The ion pumps (active in the membrane at numbers exceeding 2 × 106mm−2) are able to sustain a short-circuit current of 32.6pAmm−2 and an open-circuit voltage of 78mV, providing for a maximum power transfer of 1.27pWmm−2 from a single bilayer. Two series-stacked bilayers provide a voltage sufficient to operate an integrated circuit with a conversion efficiency of chemical to electrical energy of 14.9%.


Figure 1: Fully hybrid biological–solid-state system.


Fully hybrid biological-solid-state system.

http://www.nature.com/ncomms/2015/151207/ncomms10070/images/ncomms10070-f1.jpg

(a) Illustration depicting biocell attached to CMOS integrated circuit. (b) Illustration of membrane in pore containing sodium–potassium pumps. (c) Circuit model of equivalent stacked membranes, =2.1pA, =98.6G, =575G and =75pF, Ag/AgCl electrode equivalent resistance RWE+RCE<20k, energy-harvesting capacitor CSTOR=100nF combined with switch as an impedance transformation network (only one switch necessary due to small duty cycle), and CMOS IC voltage doubler and resistor representing digital switching load. RL represents the four independent ring oscillator loads. (d) Equivalent circuit detail of stacked biocell. (e) Switched-capacitor voltage doubler circuit schematic.


The energetics of living systems are based on electrochemical membrane potentials that are present in cell plasma membranes, the inner membrane of mitochondria, or the thylakoid membrane of chloroplasts1. In the latter two cases, the specific membrane potential is known as the proton-motive force and is used by proton adenosine triphosphate (ATP) synthases to produce ATP. In the former case, Na+/K+-ATPases hydrolyse ATP to maintain the resting potential in most cells.

While there have been recent efforts to harness power from some naturally occurring potentials in living systems that are the result of ion pump action both in plants2 and animals3, 4 to power complementary metal-oxide semiconductor (CMOS) integrated circuits (ICs), this work is the first successful effort to isolate the energetics of an electrogenic ion pump in an engineered in vitroenvironment to power such an artificial system. Prior efforts to harness power from in vitromembrane systems incorporating ion-pumping ATPases5, 6, 7, 8, 9 and light-activated bacteriorhodopsin9, 10, 11 have been limited by difficulty in incorporating these proteins in sufficient quantity to attain measurable current and in achieving sufficiently large membrane resistances to harness these currents. Both problems are solved in this effort to power an IC from ATP in an in vitro environment. The resulting measurements provide new insight into a generalized circuit model, which allows us to determine the conditions to maximize the efficiency of harnessing chemical energy through the action of electrogenic ion pumps.


ATP-powered IC

Figure 1a shows the complete hybrid integrated system, consisting of a CMOS IC packaged with an ATP-harvesting ‘biocell’. The biocell consists of two series-stacked ATPase bearing suspended lipid bilayers with a fluid chamber directly on top of the IC. Series stacking of two membranes is necessary to provide the required start-up voltage for IC and eliminates the need for an external energy source, which is typically required to start circuits from low-voltage supplies2, 3. As shown inFig. 1c, a matching network in the form of a switched capacitor allows the load resistance of the IC to be matched to that presented by the biocell. In principle, the switch S can be implicit. The biocell charges CSTOR until the self start-up voltage, Vstart, is reached. The chip then operates until the biocell voltage drops below the minimum supply voltage for operation, Vmin. Active current draw from the IC stops at this point, allowing the charge to build up again on CSTOR. In our case, however, the IC leakage current exceeds 13.5nA at Vstart, more than can be provided by the biocell. As a result, an explicit transistor switch and comparator (outside of the IC) are used for this function in the experimental results presented here, which are not powered by the biocell and not included in energy efficiency calculations (see Supplementary Discussion for additional details). The energy from the biocell is used to operate a voltage converter (voltage doubler) and some simple inverter-based ring oscillators in the IC, which receive power from no other sources.

Figure 1: Fully hybrid biological–solid-state system.

http://www.nature.com/ncomms/2015/151207/ncomms10070/images/ncomms10070-f1.jpg


……..   Prior to the addition of ATP, the membrane produces no electrical power and has an Rm of 280G. A 1.7-pA short-circuit (SC) current (Fig. 2b) through the membrane is observed upon the addition of ATP (final concentration 3mM) to the cis chamber where functional, properly oriented enzymes generate a net electrogenic pump current. To perform these measurements, currents through each membrane of the biocell are measured using a voltage-clamp amplifier (inset of Fig. 2b) with a gain of 500G with special efforts taken to compensate amplifier leakage currents. Each ATPase transports three Na+ ions from the cis chamber to the trans chamber and two K+ ions from thetrans chamber to the cis chamber (a net charge movement of one cation) for every molecule of ATP hydrolysed. At a rate of 100 hydrolysis events per second under zero electrical (SC) bias13, this results in an electrogenic current of ~16aA. The observed SC current corresponds to about 105 active ATPases in the membrane or a concentration of about 2 × 106mm−2, about 5% of the density of channels occurring naturally in mammalian nerve fibres14. It is expected that half of the channels inserted are inactive because they are oriented incorrectly.

Figure 2: Single-cell biocell characterization.

http://www.nature.com/ncomms/2015/151207/ncomms10070/images_article/ncomms10070-f2.jpg

(a)…Pre-ATP data linear fit (black line) slope yield Rm=280G. Post ATP data fit to a Boltzmann curve, slope=0.02V (blue line). Post-ATP linear fit (red line) yields Ip=−1.8pA and Rp=61.6G, which corresponds to a per-ATP source resistance of 6.16 × 10¹⁵. The current due to membrane leakage through R_{m} is subtracted in the post-ATP curve…. (b)…


Current–voltage characteristics of the ATPases

Figure 2a shows the complete measured current–voltage (IV) characteristic of a single ATPase-bearing membrane in the presence of ATP. The current due to membrane leakage through Rm is subtracted in the post-ATP curve. The IV characteristic fits a Boltzmann sigmoid curve, consistent with sodium–potassium pump currents measured on membrane patches at similar buffer conditions13, 15, 16. This nonlinear behaviour reflects the fact that the full ATPase transport cycle (three Na+ ions from cis to trans and two K+ ions from trans to cis) time increases (the turn-over rate, kATP, decreases) as the membrane potential increases16. No effect on pump current is expected from any ion concentration gradients produced by the action of the ATPases (seeSupplementary Discussion). Using this Boltzmann fit, we can model the biocell as a nonlinear voltage-controlled current source IATPase (inset Fig. 2a), in which the current produced by this source varies as a function of Vm. In the fourth quadrant, where the cell is producing electrical power, this model can be linearized as a Norton equivalent circuit, consisting of a DC current source (Ip) in parallel with a current-limiting resistor (Rp), which acts to limit the current delivered to the load at increasing bias (IATPase~IpVm/Rp). Figure 2c shows the measured and simulated charging of Cm for a single membrane (open-circuited voltage). A custom amplifier with input resistance Rin>10T was required for this measurement (see Electrical Measurement Methods).


Reconciling operating voltage differences

The electrical characteristics of biological systems and solid-state systems are mismatched in their operating voltages. The minimum operating voltage of solid-state systems is determined by the need for transistors to modulate a Maxwell–Boltzmann (MB) distribution of carriers by several orders of magnitude through the application of a potential that is several multiples of kT/q (where kis Boltzmann’s constant, T is the temperature in degrees Kelvin and q is the elementary charge). Biological systems, while operating under the same MB statistics, have no such constraints for operating ion channels since they are controlled by mechanical (or other conformational) processes rather than through modulation of a potential barrier. To bridge this operating voltage mismatch, the circuit includes a switched-capacitor voltage doubler (Fig. 1d) that is capable of self-startup from voltages as low Vstart=145mV (~5.5kT/q) and can be operated continuously from input voltages from as low as Vmin=110mV (see Supplementary Discussion)…..


Maximizing the efficiency of harvesting energy from ATP

Solid-state systems and biological systems are also mismatched in their operating impedances. In our case, the biocell presents a source impedance, =84.2G, while the load impedance presented by the complete integrated circuit (including both the voltage converter and ring oscillator loads) is approximately RIC=200k. (The load impedance, RL, of the ring oscillators alone is 305k.) This mismatch in source and load impedance is manifest in large differences in power densities. In general, integrated circuits, even when operated at the point of minimum energy in subthreshold, consume on the order of 10−2Wmm−2 (or assuming a typical silicon chip thickness of 250μm, 4 × 10⁻²Wmm−3) (ref. 17). Typical cells, in contrast, consume on the order of 4 × 10⁻⁶Wmm−3 (ref. 18). In our case, a typical active power dissipation for our circuit is 92.3nW, and the active average harvesting power is 71.4fW for the biocell. This discrepancy is managed through duty-cycled operation of the IC in which the circuit is largely disabled for long periods of time (Tcharge), integrating up the power onto a storage capacitor (CSTOR), which is then expended in a very brief period of activity (Trun), as shown in Fig. 3a.

The overall efficiency of the system in converting chemical energy to the energy consumed in the load ring oscillator (η) is given by the product of the conversion efficiency of the voltage doubler (ηconverter) and the conversion efficiency of chemical energy to electrical energy in the biocell (ηbiocell), η=ηconverter × ηbiocell. ηconverter is relatively constant over the range of input voltages at ~59%, as determined by various loading test circuits included in the chip design (Supplementary Figs 1–6). ηbiocell, however, varies with transmembrane potential Vm. η is the efficiency in transferring power to the power ring oscillator loads from the ATP harvested by biocell.

…….

To first order, the energy made available to the Na+/K+-ATPase by the hydrolysis of ATP is independent of the chemical or electric potential of the membrane and is given by |ΔGATP|/(qNA), where ΔGATP is the Gibbs free energy change due to the ATP hydrolysis reaction per mole of ATP at given buffer conditions and NA is Avogadro’s number. Since every charge that passes through IATPase corresponds to a single hydrolysis event, we can use two voltage sources in series with IATPase to independently account for the energy expended by the pumps both in moving charge across the electric potential difference and in moving ions across the chemical potential difference. The dependent voltage source Vloss in this branch fixes the voltage across IATPase, and the total power produced by the pump current source is (|ΔGATP|/NA)(NkATP), which is the product of the energy released per molecule of ATP, the number of active ATPases and the ATP turnover rate. The power dissipated in voltage source Vchem models the work performed by the ATPases in transporting ions against a concentration gradient. In the case of the Na+/K+ ATPase,Vchem is given by . The power dissipated in this source is introduced back into the circuit in the power generated by the Nernst independent voltage sources, and . The power dissipated in the dependent voltage source Vloss models any additional power not used to perform chemical or electrical work. ……
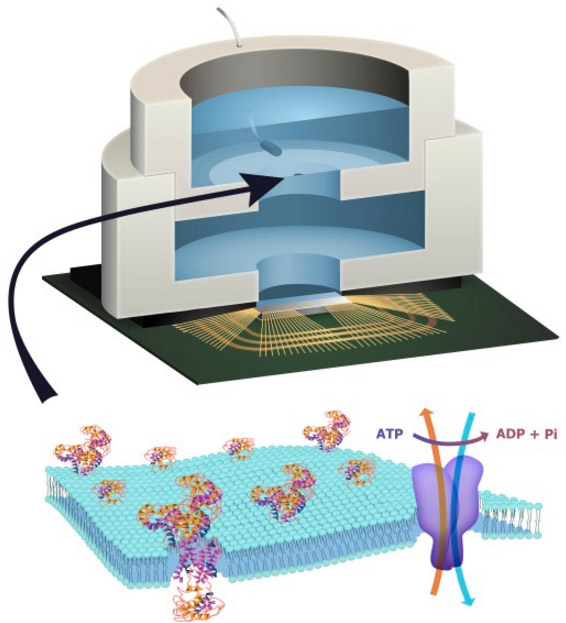
 

Integration of ATP-harvesting ion pumps could provide a means to power future CMOS microsystems scaled to the level of individual cells22. In molecular diagnostics, the integration of pore-forming proteins such as alpha haemolysin23 or MspA porin24 with CMOS electronics is already finding application in DNA sequencing25. Exploiting the large diversity of function available in transmembrane proteins in these hybrid systems could, for example, lead to highly specific sensing platforms for airborne odorants or soluble molecular entities26, 27. Heavily multiplexed platforms could become high-throughput in vitro drug-screening platforms against this diversity of function. In addition, integration of transmembrane proteins with CMOS may become a convenient alternative to fluorescence for coupling to synthetic biological systems28.


Roseman, J. M. et al. Hybrid integrated biological–solid-state system powered with adenosine triphosphate. Nat. Commun. 6:10070      http://dx.doi.org:/10.1038/ncomms10070 (2015).


  • Rottenberg, H. The measurement of membrane potential and deltapH in cells, organelles, and vesicles. Methods Enzymol. 55, 547569 (1979).
  • Himes, C., Carlson, E., Ricchiuti, R. J., Otis, B. P. & Parviz, B. A. Ultralow voltage nanoelectronics powered directly, and solely, from a tree. IEEE Trans. Nanotechnol. 9, 25(2010).
  • Mercier, P. P., Lysaght, A. C., Bandyopadhyay, S., Chandrakasan, A. P. & Stankovic, K. M.Energy extraction from the biologic battery in the inner ear. Nat. Biotechnol. 30, 12401243(2012).
  • Halámková, L. et al. Implanted Biofuel Cell Operating in a Living Snail. J. Am. Chem. Soc.134, 50405043 (2012).


Read Full Post »

Irreconciliable Dissonance in Physical Space and Cellular Metabolic Conception

Irreconciliable Dissonance in Physical Space and Cellular Metabolic Conception

Curator: Larry H. Bernstein, MD, FCAP

Pasteur Effect – Warburg Effect – What its history can teach us today. 

José Eduardo de Salles Roselino

The Warburg effect, in reality the “Pasteur-effect” was the first example of metabolic regulation described. A decrease in the carbon flux originated at the sugar molecule towards the end of the catabolic pathway, with ethanol and carbon dioxide observed when yeast cells were transferred from an anaerobic environmental condition to an aerobic one. In Pasteur´s studies, sugar metabolism was measured mainly by the decrease of sugar concentration in the yeast growth media observed after a measured period of time. The decrease of the sugar concentration in the media occurs at great speed in yeast grown in anaerobiosis (oxygen deficient) and its speed was greatly reduced by the transfer of the yeast culture to an aerobic condition. This finding was very important for the wine industry of France in Pasteur’s time, since most of the undesirable outcomes in the industrial use of yeast were perceived when yeasts cells took a very long time to create, a rather selective anaerobic condition. This selective culture media was characterized by the higher carbon dioxide levels produced by fast growing yeast cells and by a higher alcohol content in the yeast culture media.

However, in biochemical terms, this finding was required to understand Lavoisier’s results indicating that chemical and biological oxidation of sugars produced the same calorimetric (heat generation) results. This observation requires a control mechanism (metabolic regulation) to avoid burning living cells by fast heat released by the sugar biological oxidative processes (metabolism). In addition, Lavoisier´s results were the first indications that both processes happened inside similar thermodynamics limits. In much resumed form, these observations indicate the major reasons that led Warburg to test failure in control mechanisms in cancer cells in comparison with the ones observed in normal cells.

[It might be added that the availability of O2 and CO2 and climatic conditions over 750 million years that included volcanic activity, tectonic movements of the earth crust, and glaciation, and more recently the use of carbon fuels and the extensive deforestation of our land masses have had a large role in determining the biological speciation over time, in sea and on land. O2 is generated by plants utilizing energy from the sun and conversion of CO2. Remove the plants and we tip the balance. A large source of CO2 is from beneath the earth’s surface.]

Biology inside classical thermodynamics places some challenges to scientists. For instance, all classical thermodynamics must be measured in reversible thermodynamic conditions. In an isolated system, increase in P (pressure) leads to increase in V (volume), all this occurring in a condition in which infinitesimal changes in one affects in the same way the other, a continuum response. Not even a quantic amount of energy will stand beyond those parameters.

In a reversible system, a decrease in V, under same condition, will led to an increase in P. In biochemistry, reversible usually indicates a reaction that easily goes either from A to B or B to A. For instance, when it was required to search for an anti-ischemic effect of Chlorpromazine in an extra hepatic obstructed liver, it was necessary to use an adequate system of increased biliary system pressure in a reversible manner to exclude a direct effect of this drug over the biological system pressure inducer (bile secretion) in Braz. J. Med. Biol. Res 1989; 22: 889-893. Frequently, these details are jumped over by those who read biology in ATGC letters.

Very important observations can be made in this regard, when neutral mutations are taken into consideration since, after several mutations (not affecting previous activity and function), a last mutant may provide a new transcript RNA for a protein and elicit a new function. For an example, consider a Prion C from lamb getting similar to bovine Prion C while preserving  its normal role in the lamb when its ability to change Human Prion C is considered (Stanley Prusiner).

This observation is good enough, to confirm one of the most important contributions of Erwin Schrodinger in his What is Life:

“This little book arose from a course of public lectures, delivered by a theoretical physicist to an audience of about four hundred which did not substantially dwindle, though warned at the outset that the subject matter was a difficult one and that the lectures could not be termed popular, even though the physicist’s most dreaded weapon, mathematical deduction, would hardly be utilized. The reason for this was not that the subject was simple enough to be explained without mathematics, but rather that it was much too involved to be fully accessible to mathematics.”

After Hans Krebs, description of the cyclic nature of the citrate metabolism and after its followers described its requirement for aerobic catabolism two major lines of research started the search for the understanding of the mechanism of energy transfer that explains how ADP is converted into ATP. One followed the organic chemistry line of reasoning and therefore, searched for a mechanism that could explain how the breakdown of carbon-carbon link could have its energy transferred to ATP synthesis. One of the major leaders of this research line was Britton Chance. He took into account that relatively earlier in the series of Krebs cycle reactions, two carbon atoms of acetyl were released as carbon dioxide ( In fact, not the real acetyl carbons but those on the opposite side of citrate molecule). In stoichiometric terms, it was not important whether the released carbons were or were not exactly those originated from glucose carbons. His research aimed at to find out an intermediate proteinaceous intermediary that could act as an energy reservoir. The intermediary could store in a phosphorylated amino acid the energy of carbon-carbon bond breakdown. This activated amino acid could transfer its phosphate group to ADP producing ATP. A key intermediate involved in the transfer was identified by Kaplan and Lipmann at John Hopkins as acetyl coenzyme A, for which Fritz Lipmann received a Nobel Prize.

Alternatively, under possible influence of the excellent results of Hodgkin and Huxley a second line of research appears. The work of Hodgkin & Huxley indicated that the storage of electrical potential energy in transmembrane ionic asymmetries and presented the explanation for the change from resting to action potential in excitable cells. This second line of research, under the leadership of Peter Mitchell postulated a mechanism for the transfer of oxide/reductive power of organic molecules oxidation through electron transfer as the key for the energetic transfer mechanism required for ATP synthesis.
This diverted the attention from high energy (~P) phosphate bond to the transfer of electrons. During most of the time the harsh period of the two confronting points of view, Paul Boyer and followers attempted to act as a conciliatory third party, without getting good results, according to personal accounts (in L. A. or Latin America) heard from those few of our scientists who were able to follow the major scientific events held in USA, and who could present to us later. Paul  Boyer could present how the energy was transduced by a molecular machine that changes in conformation in a series of 3 steps while rotating in one direction in order to produce ATP and in opposite direction in order to produce ADP plus Pi from ATP (reversibility).

However, earlier, a victorious Peter Mitchell obtained the result in the conceptual dispute, over the Britton Chance point of view, after he used E. Coli mutants to show H+ gradients in the cell membrane and its use as energy source, for which he received a Nobel Prize. Somehow, this outcome represents such a blow to Chance’s previous work that somehow it seems to have cast a shadow over very important findings obtained during his earlier career that should not be affected by one or another form of energy transfer mechanism.  For instance, Britton Chance got the simple and rapid polarographic assay method of oxidative phosphorylation and the idea of control of energy metabolism that brings us back to Pasteur.

This metabolic alternative result seems to have been neglected in the recent years of obesity epidemics, which led to a search for a single molecular mechanism required for the understanding of the accumulation of chemical (adipose tissue) reserve in our body. It does not mean that here the role of central nervous system is neglected. In short, in respiring mitochondria the rate of electron transport linked to the rate of ATP production is determined primarily by the relative concentrations of ADP, ATP and phosphate in the external media (cytosol) and not by the concentration of respiratory substrate as pyruvate. Therefore, when the yield of ATP is high as it is in aerobiosis and the cellular use of ATP is not changed, the oxidation of pyruvate and therefore of glycolysis is quickly (without change in gene expression), throttled down to the resting state. The dependence of respiratory rate on ADP concentration is also seen in intact cells. A muscle at rest and using no ATP has a very low respiratory rate.   [When skeletal muscle is stressed by high exertion, lactic acid produced is released into the circulation and is metabolized aerobically by the heart at the end of the activity].

This respiratory control of metabolism will lead to preservation of body carbon reserves and in case of high caloric intake in a diet, also shows increase in fat reserves essential for our biological ancestors survival (Today for our obesity epidemics). No matter how important this observation is, it is only one focal point of metabolic control. We cannot reduce the problem of obesity to the existence of metabolic control. There are numerous other factors but on the other hand, we cannot neglect or remove this vital process in order to correct obesity. However, we cannot explain obesity ignoring this metabolic control. This topic is so neglected in modern times that we cannot follow major research lines of the past that were interrupted by the emerging molecular biology techniques and the vain belief that a dogmatic vision of biology could replace all previous knowledge by a new one based upon ATGC readings. For instance, in order to display bad consequences derived from the ignorance of these old scientific facts, we can take into account, for instance, how ion movements across membranes affects membrane protein conformation and therefore contradicts the wrong central dogma of molecular biology. This change in protein conformation (with unchanged amino acid sequence) and/or the lack of change in protein conformation is linked to the factors that affect vital processes as the heart beats. This modern ignorance could also explain some major pitfalls seen in new drugs clinical trials and in a small scale on bad medical practices.

The work of Britton Chance and of Peter Mitchell have deep and sound scientific roots that were made with excellent scientific techniques, supported by excellent scientific reasoning and that were produced in a large series of very important intermediary scientific results. Their sole difference was to aim at very different scientific explanations as their goals (They have different Teleology in their minds made by their previous experiences). When, with the use of mutants obtained in microorganisms P Mitchell´s goal was found to survive and B Chance to succumb to the experimental evidence, all those excellent findings of B Chance and followers were directed to the dustbin of scientific history as an example of lack of scientific consideration.  [On the one hand, the Mitchell model used a unicellular organism; on the other, Chance’s work was with eukaryotic cells, quite relevant to the discussion.]

We can resume the challenge faced by these two great scientists in the following form: The first conceptual unification in bioenergetics, achieved in the 1940s, is inextricably bound up with the name of Fritz Lipmann. Its central feature was the recognition that adenosine triphosphate, ATP, serves as a universal energy  “currency” much as money serves as economic currency. In a nutshell, the purpose of metabolism is to support the synthesis of ATP. In microorganisms, this is perfect! In humans or mammals, or vertebrates, by the same reason that we cannot consider that gene expression is equivalent to protein function (an acceptable error in the case of microorganisms) this oversimplifies the metabolic requirement with a huge error. However, in case our concern is ATP chemistry only, the metabolism produces ATP and the hydrolysis of ATP pays for the performance of almost, all kinds of works. It is possible to presume that to find out how the flow of metabolism (carbon flow) led to ATP production must be considered a major focal point of research of the two contenders. Consequently, what could be a minor fall of one of the contenders, in case we take into account all that was found during their entire life of research, the real failure in B Chance’s final goal was amplified far beyond what may be considered by reason!

Another aspect that must be taken into account: Both contenders have in the scientific past a very sound root. Metabolism may produce two forms of energy currency (I personally don´t like this expression*) and I use it here because it was used by both groups in order to express their findings. Together with simplistic thermodynamics, this expression conveys wrong ideas): The second kind of energy currency is the current of ions passing from one side of a membrane to the other. The P. Mitchell scientific root undoubtedly have the work of Hodgkin & Huxley, Huxley &  Huxley, Huxley & Simmons

*ATP is produced under the guidance of cell needs and not by its yield. When glucose yields only 2 ATPs per molecule it is oxidized at very high speed (anaerobiosis) as is required to match cellular needs. On the other hand, when it may yield (thermodynamic terms) 38 ATP the same molecule is oxidized at low speed. It would be similar to an investor choice its least money yield form for its investment (1940s to 1972) as a solid support. B. Chance had the enzymologists involved in clarifying how ATP could be produced directly from NADH + H+ oxidative reductive metabolic reactions or from the hydrolysis of an enolpyruvate intermediary. Both competitors had their work supported by different but, sound scientific roots and have produced very important scientific results while trying to present their hypothetical point of view.

Before the winning results of P. Mitchell were displayed, one line of defense used by B. Chance followers was to create a conflict between what would be expected by a restrictive role of proteins through its specificity ionic interactions and the general ability of ionic asymmetries that could be associated with mitochondrial ATP production. Chemical catalyzed protein activities do not have perfect specificity but an outstanding degree of selective interaction was presented by the lock and key model of enzyme interaction. A large group of outstanding “mitochondriologists” were able to show ATP synthesis associated with Na+, K+, Ca2+… asymmetries on mitochondrial membranes and any time they did this, P. Mitchell have to display the existence of antiporters that exchange X for hydrogen as the final common source of chemiosmotic energy used by mitochondria for ATP synthesis.

This conceptual battle has generated an enormous knowledge that was laid to rest, somehow discontinued in the form of scientific research, when the final E. Coli mutant studies presented the convincing final evidence in favor of P. Mitchell point of view.

Not surprisingly, a “wise anonymous” later, pointed out: “No matter what you are doing, you will always be better off in case you have a mutant”

(Principles of Medical Genetics T D Gelehrter & F.S. Collins chapter 7, 1990).

However, let’s take the example of a mechanical wristwatch. It clearly indicates when the watch is working in an acceptable way, that its normal functioning condition is not the result of one of its isolated components – or something that can be shown by a reductionist molecular view.  Usually it will be considered that it is working in an acceptable way, in case it is found that its accuracy falls inside a normal functional range, for instance, one or two standard deviations bellow or above the mean value for normal function, what depends upon the rigor wisely adopted. While, only when it has a faulty component (a genetic inborn error) we can indicate a single isolated piece as the cause of its failure (a reductionist molecular view).

We need to teach in medicine, first the major reasons why the watch works fine (not saying it is “automatic”). The functions may cross the reversible to irreversible regulatory limit change, faster than what we can imagine. Latter, when these ideas about normal are held very clear in the mind set of medical doctors (not medical technicians) we may address the inborn errors and what we may have learn from it. A modern medical technician may cause admiration when he uses an “innocent” virus to correct for a faulty gene (a rather impressive technological advance). However, in case the virus, later shows signals that indicate that it was not so innocent, a real medical doctor will be called upon to put things in correct place again.

Among the missing parts of normal evolution in biochemistry a lot about ion fluxes can be found. Even those oscillatory changes in Ca2+ that were shown to affect gene expression (C. De Duve) were laid to rest since, they clearly indicate a source of biological information that despite the fact that it does not change nucleotides order in the DNA, it shows an opposing flux of biological information against the dogma (DNA to RNA to proteins). Another, line has shown a hierarchy, on the use of mitochondrial membrane potential: First the potential is used for Ca2+ uptake and only afterwards, the potential is used for ADP conversion into ATP (A. L. Lehninger). In fact, the real idea of A. L. Lehninger was by far, more complex since according to him, mitochondria works like a buffer for intracellular calcium releasing it to outside in case of a deep decrease in cytosol levels or capturing it from cytosol when facing transient increase in Ca2+ load. As some of Krebs cycle dehydrogenases were activated by Ca2+, this finding was used to propose a new control factor in addition to the one of ADP (B. Chance). All this was discontinued with the wrong use of calculus (today we could indicate bioinformatics in a similar role) in biochemistry that has established less importance to a mitochondrial role after comparative kinetics that today are seen as faulty.

It is important to combat dogmatic reasoning and restore sound scientific foundations in basic medical courses that must urgently reverse the faulty trend that tries to impose a view that goes from the detail towards generalization instead of the correct form that goes from the general finding well understood towards its molecular details. The view that led to curious subjects as bioinformatics in medical courses as training in sequence finding activities can only be explained by its commercial value. The usual form of scientific thinking respects the limits of our ability to grasp new knowledge and relies on reproducibility of scientific results as a form to surpass lack of mathematical equation that defines relationship of variables and the determination of its functional domains. It also uses old scientific roots, as its sound support never replaces existing knowledge by dogmatic and/or wishful thinking. When the sequence of DNA was found as a technical advance to find amino acid sequence in proteins it was just a technical advance. This technical advance by no means could be considered a scientific result presented as an indication that DNA sequences alone have replaced the need to study protein chemistry, its responses to microenvironmental changes in order to understand its multiple conformations, changes in activities and function. As E. Schrodinger correctly describes the chemical structure responsible for the coded form stored of genetic information must have minimal interaction with its microenvironment in order to endure hundreds and hundreds years as seen in Hapsburg’s lips. Only magical reasoning assumes that it is possible to find out in non-reactive chemical structures the properties of the reactive ones.

For instance, knowledge of the reactions of the Krebs cycle clearly indicate a role for solvent that no longer could be considered to be an inert bath for catalytic activity of the enzymes when the transfer of energy include a role for hydrogen transport. The great increase in understanding this change on chemical reaction arrived from conformational energy.

Again, even a rather simplistic view of this atomic property (Conformational energy) is enough to confirm once more, one of the most important contribution of E. Schrodinger in his What is Life:

“This little book arose from a course of public lectures, delivered by a theoretical physicist to an audience of about four hundred which did not substantially dwindle, though warned at the outset that the subject matter was a difficult one and that the lectures could not be termed popular, even though the physicist’s most dreaded weapon, mathematical deduction, would hardly be utilized. The reason for this was not that the subject was simple enough to be explained without mathematics, but rather that it was much too involved to be fully accessible to mathematics.”

In a very simplistic view, while energy manifests itself by the ability to perform work conformational energy as a property derived from our atomic structure can be neutral, positive or negative (no effect, increased or decreased reactivity upon any chemistry reactivity measured as work)

Also:

“I mean the fact that we, whose total being is entirely based on a marvelous interplay of this very kind, yet if all possess the power of acquiring considerable knowledge about it. I think it possible that this knowledge may advance to little just a short of a complete understanding -of the first marvel. The second may well be beyond human understanding.”

In fact, scientific knowledge allows us to understand how biological evolution may have occurred or have not occurred and yet does not present a proof about how it would have being occurred. It will be always be an indication of possible against highly unlike and never a scientific proven fact about the real form of its occurrence.

As was the case of B. Chance in its bioenergetics findings, we may get very important findings that indicates wrong directions in the future as was his case, or directed toward our past.

The Skeleton of Physical Time – Quantum Energies in Relative Space of S-labs

By Radoslav S. Bozov  Independent Researcher

WSEAS, Biology and BioSystems of Biomedicine

Space does not equate to distance, displacement of an object by classically defined forces – electromagnetic, gravity or inertia. In perceiving quantum open systems, a quanta, a package of energy, displaces properties of wave interference and statistical outcomes of sums of paths of particles detected by a design of S-labs.

The notion of S-labs, space labs, deals with inherent problems of operational module, R(i+1), where an imagination number ‘struggles’ to work under roots of a negative sign, a reflection of an observable set of sums reaching out of the limits of the human being organ, an eye or other foundational signal processing system.

While heavenly bodies, planets, star systems, and other exotic forms of light reflecting and/or emitting objects, observable via naked eye have been deduced to operate under numerical systems that calculate a periodic displacement of one relative to another, atomic clocks of nanospace open our eyes to ever expanding energy spaces, where matrices of interactive variables point to the problem of infinity of variations in scalar spaces, however, defining properties of minute universes as a mirror image of an astronomical system. The first and furthermost problem is essentially the same as those mathematical methodologies deduced by Isaac Newton and Albert Einstein for processing a surface. I will introduce you to a surface interference method by describing undetermined objective space in terms of determined subjective time.

Therefore, the moment will be an outcome of statistical sums of a numerical system extending from near zero to near one. Three strings hold down a dual system entangled via interference of two waves, where a single wave is a product of three particles (today named accordingly to either weak or strong interactions) momentum.

The above described system emerges from duality into trinity the objective space value of physical realities. The triangle of physical observables – charge, gravity and electromagnetism, is an outcome of interference of particles, strings and waves, where particles are not particles, or are strings strings, or  are waves waves of an infinite character in an open system which we attempt to define to predict outcomes of tomorrow’s parameters, either dependent or independent as well as both subjective to time simulations.

We now know that aging of a biological organism cannot be defined within singularity. Thereafter, clocks are subjective to apparatuses measuring oscillation of defined parameters which enable us to calculate both amplitude and a period, which we know to be dependent on phase transitions.

The problem of phase was solved by the applicability of carbon relative systems. A piece of diamond does not get wet, yet it holds water’s light entangled property. Water is the dark force of light. To formulate such statement, we have been searching truth by examining cooling objects where the Maxwell demon is translated into information, a data complex system.

Modern perspectives in computing quantum based matrices, 0+1 =1 and/or 0+0=1, and/or 1+1 =0, will be reduced by applying a conceptual frame of Aladdin’s flying anti-gravity carpet, unwrapping both past and future by sending a photon to both, placing present always near zero. Thus, each parallel quantum computation of a natural system approaching the limit of a vibration of a string defining 0 does not equal 0, and 1 does not equal 1. In any case, if our method 1+1 = 1, yet, 1 is not 1 at time i+1. This will set the fundamentals of an operational module, called labris operator or in simplicity S-labs. Note, that 1 as a result is an event predictable to future, while interacting parameters of addition 1+1 may be both, 1 as an observable past, and 1 as an imaginary system, or 1+1 displaced interactive parameters of past observable events. This is the foundation of Future Quantum Relative Systems Interference (QRSI), taking analytical technologies of future as a result of data matrices compressing principle relative to carbon as a reference matter rational to water based properties.

Goedel’s concept of loops exist therefore only upon discrete relative space uniting to parallel absolute continuity of time ‘lags’. ( Goedel, Escher and Bach: An Eternal Golden Braid. A Metaphorical Fugue on Minds and Machines in the Spirit of Lewis Carroll. D Hofstadter.  Chapter XX: Strange Loops, Or Tangled Hierarchies. A grand windup of many of the ideas about hierarchical systems and self-reference. It is concerned with the snarls which arise when systems turn back on themselves-for example, science probing science, government investigating governmental wrongdoing, art violating the rules of art, and finally, humans thinking about their own brains and minds. Does Gödel’s Theorem have anything to say about this last “snarl”? Are free will and the sensation of consciousness connected to Gödel’s Theorem? The Chapter ends by tying Gödel, Escher, and Bach together once again.)  The fight struggle in-between time creates dark spaces within which strings manage to obey light properties – entangled bozons of information carrying future outcomes of a systems processing consciousness. Therefore, Albert Einstein was correct in his quantum time realities by rejecting a resolving cube of sugar within a cup of tea (Henri Bergson 19th century philosopher. Bergson’s concept of multiplicity attempts to unify in a consistent way two contradictory features: heterogeneity and continuity. Many philosophers today think that this concept of multiplicity, despite its difficulty, is revolutionary.) However, the unity of time and space could not be achieved by deducing time to charge, gravity and electromagnetic properties of energy and mass.

Charge is further deduced to interference of particles/strings/waves, contrary to the Hawking idea of irreducibility of chemical energy carrying ‘units’, and gravity is accounted for by intrinsic properties of   anti-gravity carbon systems processing light, an electromagnetic force, that I have deduced towards ever expanding discrete energy space-energies rational to compressing mass/time. The role of loops seems to operate to control formalities where boundaries of space fluctuate as a result of what we called above – dark time-spaces.

Indeed, the concept of horizon is a constant due to ever expanding observables. Thus, it fails to acquire a rational approach towards space-time issues.

Richard Feynman has touched on issues of touching of space, sums of paths of particle traveling through time. In a way he has resolved an important paradigm, storing information and possibly studying it by opening a black box. Schroedinger’s cat is alive again, but incapable of climbing a tree when chased by a dog. Every time a cat climbs a garden tree, a fruit falls on hedgehogs carried away parallel to living wormholes whose purpose of generating information lies upon carbon units resolving light.

In order to deal with such a paradigm, we will introduce i+1 under square root in relativity, therefore taking negative one ( -1 = sqrt (i+1), an operational module R dealing with Wheelers foam squeezed by light, releasing water – dark spaces. Thousand words down!

What is a number? Is that a name or some kind of language or both? Is the issue of number theory possibly accountable to the value of the concept of entropic timing? Light penetrating a pyramid holding bean seeds on a piece of paper and a piece of slice of bread, a triple set, where a church mouse has taken a drop of tear, but a blood drop. What an amazing physics! The magic of biology lies above egoism, above pride, and below Saints.

We will set up the twelve parameters seen through 3+1 in classic realities:

–              discrete absolute energies/forces – no contradiction for now between Newtonian and Albert Einstein mechanics

–              mass absolute continuity – conservational law of physics in accordance to weak and strong forces

–              quantum relative spaces – issuing a paradox of Albert Einstein’s space-time resolved by the uncertainty principle

–              parallel continuity of multiple time/universes – resolving uncertainty of united space and energy through evolving statistical concepts of scalar relative space expansion and vector quantum energies by compressing relative continuity of matter in it, ever compressing flat surfaces – finding the inverse link between deterministic mechanics of displacement and imaginary space, where spheres fit within surface of triangles as time unwraps past by pulling strings from future.

To us, common human beings, with an extra curiosity overloaded by real dreams, value happens to play in the intricate foundation of life – the garden of love, its carbon management in mind, collecting pieces of squeezed cooling time.

The infinite interference of each operational module to another composing ever emerging time constrains unified by the Solar system, objective to humanity, perhaps answers that a drop of blood and a drop of tear is united by a droplet of a substance separating negative entropy to time courses of a physical realities as defined by an open algorithm where chasing power subdue to space becomes an issue of time.

Jose Eduardo de Salles Roselino

Some small errors: For intance an increase i P leads to a decrease in V ( not an increase in V)..


Radoslav S. Bozov  Independent Researcher

If we were to use a preventative measures of medical science, instruments of medical science must predict future outcomes based on observable parameters of history….. There are several key issues arising: 1. Despite pinning a difference on genomic scale , say pieces of information, we do not know how to have changed that – that is shift methylome occupying genome surfaces , in a precise manner.. 2. Living systems operational quo DO NOT work as by vector gravity physics of ‘building blocks. That is projecting a delusional concept of a masonry trick, who has not worked by corner stones and ever shifting momenta … Assuming genomic assembling worked, that is dealing with inferences through data mining and annotation, we are not in a position to read future in real time, and we will never be, because of the rtPCR technology self restriction into data -time processing .. We know of existing post translational modalities… 3. We don’t know what we don’t know, and that foundational to future medicine – that is dealing with biological clocks, behavior, and various daily life inputs ranging from radiation to water systems, food quality, drugs…

Read Full Post »

Depth Underwater and Underground

Writer and Curator: Larry H. Bernstein, MD, FCAP 


Introduction

Deep diving for mammals is dangerous for humans and land based animals for too long, and it has dangerous consequences, most notable in nitrogen emboli  with very deep underwater diving. Other mammals live in water and have adapted to a water habitat.  This is another topic that needs further exploration.

Deep diving has different meanings depending on the context. Even in recreational diving the meaning may vary:

In recreational diving, a depth below about 30 metres (98 ft), where nitrogen narcosis becomes a significant hazard for most divers, may be considered a “deep dive”

In technical diving, a depth below about 60 metres (200 ft) where hypoxic breathing gas becomes necessary to avoid oxygen toxicity may be considered a “deep dive”.

Early experiments carried out by Comex S.A. (Compagnie maritime d’expertises) using hydrox and trimix attained far greater depths than any recreational technical diving. One example being the Comex Janus IV open-sea dive to 501 metres (1,644 ft) in 1977. The open-sea diving depth record was achieved in 1988 by a team of Comex divers who performed pipe line connection exercises at a depth of 534 metres (1,752 ft) in the Mediterranean Sea as part of the Hydra 8 program. These divers needed to breathe special gas mixtures because they were exposed to very high ambient pressure (more than 50 times atmospheric pressure).

Then there is the adaptation to the water habitat as a living environment. The two main types of aquatic ecosystems are marine ecosystems and freshwater ecosystems.

http://en.wikipedia.org/wiki/Deep_diving

Marine ecosystems are part of the earth’s aquatic ecosystem. The habitats that make up this vast system range from the productive nearshore regions to the barren ocean floor. The marine waters may be fully saline, brackish or nearly fresh. The saline waters have a salinity of 35-50 ppt (= parts per thousand). The freshwater has a salinity of less than 0.5 ppt. The brackish water lies in between these 2. Marine habitats are situated from the coasts, over the continental shelf to the open ocean and deep sea. The ecosystems are sometimes linked with each other and are sometimes replacing each other in other geographical regions. The reason why habitats differ from another is because of the physical factors that influence the functioning and diversity of the habitats. These factors are temperature, salinity, tides, currents, wind, wave action, light and substrate.

Marine ecosystems are home to a host of different species ranging from planktonic organisms that form the base of the marine food web to large marine mammals. Many species rely on marine ecosystems for both food and shelter from predators. They are very important to the overall health of both marine and terrestrial environments. Coastal habitats are those above the spring high tide limit or above the mean water level in non-tidal waters.  They are close to the sea and include habitats such as coastal dunes and sandy shores, beaches , cliffs and supralittoral habitats. Coastal habitats alone account for approximately 30% of all marine biological productivity.

http://www.marbef.org/wiki/marine_habitats_and_ecosystems

All plant and animal life forms are included from the microscopic picoplankton all the way to the majestic blue whale, the largest creature in the sea—and for that matter in the world. It wasn’t until the writings of Aristotle from 384-322 BC that specific references to marine life were recorded. Aristotle identified a variety of species including crustaceans, echinoderms, mollusks, and fish.
Today’s classification system was developed by Carl Linnaeus external link as an important tool for use in the study of biology and for use in the protection of biodiversity. Without very specific classification information and a naming system to identify species’ relationships, scientists would be limited in attempts to accurately describe the relationships among species. Understanding these relationships helps predict how ecosystems can be altered by human or natural factors.

Preserving biodiversity is facilitated by taxonomy. Species data can be better analyzed to determine the number of different species in a community and to determine how they might be affected by environmental stresses. Family, or phylogenetic, trees for species help predict environmental impacts on individual species and their relatives.

http://marinebio.org/oceans/marine-taxonomy/

For generations, whales and other marine mammals have intrigued humans. 2,400 years ago, Aristotle, a Greek scientist and philosopher, recognized that whales are mammals, not fish, because they nurse their young and breathe air like other mammals. There are numerous myths and legends surrounding marine mammals. The Greeks believed that killing a dolphin was as bad as murdering a human. An Amazon legend said that river dolphins came to shore dressed as men to woo pretty girls during fiestas. During the Middle Ages, there were numerous legends surrounding the narwhals’ amazing tusk, which was thought to have come from the unicorn.

Insert movie

Marine mammals evolved from their land dwelling ancestors over time by developing adaptations to life in the water. To aid swimming, the body has become streamlined and the number of body projections has been reduced. The ears have shrunk to small holes in size and shape. Mammary glands and sex organs are not part of the external physiology, and posterior (hind) limbs are no longer present.

Mechanisms to prevent heat loss have also been developed. The cylindrical body shape with small appendages reduces the surface area to volume ratio of the body, which reduces heat loss. Marine mammals also have a counter current heat exchange mechanism created by convergent evolution external link where the heat from the arteries is transferred to the veins as they pass each other before getting to extremities, thus reducing heat loss. Some marine mammals also have a thick layer of fur with a water repellent undercoat and/or a thick layer of blubber that can’t be compressed. The blubber provides insulation, a food reserve, and aids with buoyancy. These heat loss adaptations can also lead to overheating for animals that spend time out of the water. To prevent overheating, seals or sea lions will swim close to the surface with their front flippers waving in the air. They also flick sand onto themselves to keep the sun from directly hitting their skin. Blood vessels can also be expanded to act as a sort of radiator.

One of the major behavioral adaptations of marine mammals is their ability to swim and dive. Pinnipeds swim by paddling their flippers while sirenians and cetaceans move their tails or flukes up and down.

Some marine mammals can swim at relatively high speeds. Sea lions swim up to 35 kph and orcas can reach 50 kph. The fastest marine mammal, however, is the common dolphin, which reaches speeds up to 64 kph. While swimming, these animals take very quick breaths. For example, fin whales can empty and refill their huge lungs in less than 2 seconds. Marine mammals’ larynx and esophagus close automatically when they open their mouths to catch prey during dives. Oxygen is stored in hemoglobin in the blood and in myoglobin in the muscles. The lungs are also collapsible so that air is pushed into the windpipe preventing excess nitrogen from being absorbed into the tissues. Decreasing pressure can cause excess nitrogen to expand in the tissues as animals ascend to shallower depths, which can lead to decompression sickness,  aka “the bends.” Bradycardia, the reduction of heart rate by 10 to 20%, also takes place to aid with slowing respiration during dives and the blood flow to non-essential body parts. These adaptations allow sea otters to stay submerged for 4 to 5 minutes and dive to depths up to 55 m. Pinnipeds can often stay down for 30 minutes and reach average depths of 150-250 m. One marine mammal with exceptional diving skills is the Weddell seal, which can stay submerged for at least 73 minutes at a time at depths up to 600 m. The length and depth of whale dives depends on the species. Baleen whales feed on plankton near the surface of the water and have no need to dive deeply so they are rarely seen diving deeper than 100 m external link. Toothed whales seek larger prey at deeper depths and some can stay down for hours at depths of up to 2,250 m external link.

http://marinebio.org/oceans/marine-mammals/

Human Experience

Albert Behnke: Nitrogen Narcosis

Casey A. Grover and David H. Grover
The Journal of Emergency Medicine, 2014; 46(2):225–227
http://dx.doi.org/10.1016/j.jemermed.2013.08.080

As early as 1826, divers diving to great depths noted that descent often resulted in a phenomenon of intoxication and euphoria. In 1935, Albert Behnke discovered nitrogen as the cause of this clinical syndrome, a condition now known as nitrogen narcosis. Nitrogen narcosis consists of the development of euphoria, a false sense of security, and impaired judgment upon underwater descent using compressed air below 34 atmospheres (99 to 132 feet). At greater depths, symptoms can progress to loss of consciousness. The syndrome remains relatively unchanged in modern diving when compressed air is used. Behnke’s use of non-nitrogencontaining gas mixtures subsequent to his discovery during the 1939 rescue of the wrecked submarine USS Squalus pioneered the use of non-nitrogencontaining gas mixtures, which are used by modern divers when working at great depth to avoid the effects of nitrogen narcosis.

Behnke’s first duty station as a licensed physician was as assistant medical officer for Submarine Division 20 in San Diego, which was then commanded by one of the Navy’s rising stars, Captain Chester W. Nimitz of World War II fame.
In this setting, Dr. Behnke spent his free time constructively by learning to dive, using the traditional ‘‘hard-hat’’ gear aboard the USS Ortalon, a submarine rescue vessel to which he also rotated. Diving was not a notable specialty of the Navy at the time, and the service was slow in developing the infrastructure for it. Dr. Behnke devoted his efforts to research on the topic of diving medicine, as well as developing a more sound understanding of the biophysics of diving. In 1932, he wrote a letter to the Surgeon General describing some of his observations on arterial gas embolism, which earned him some accolades from the Navy and resulted in his transfer to Harvard’s School of Public Health as a graduate fellow. After 2 years at Harvard, the Navy assigned duty to Dr. Behnke at the Navy’s submarine escape training tower at Pearl Harbor. He worked extensively here on developing techniques for rescuing personnel from disabled submarines on the sea floor. In 1937, he was one of three Navy physicians assigned to the Navy’s Experimental Diving Unit. This team worked on improving the rescue system, plus updating the diving recompression tables originally developed by the British in 1908.

The intoxicating effects of diving were first described by a French physician named Colladon in 1826, who reported that descent in a diving bell resulted in his feeling a ‘‘state of excitement as though I had drunk some alcoholic liquor’’.
The etiology of this phenomenon remained largely unknown until the 1930s, when the British military researcher Damant again highlighted the issue, and reported very unpredictable behavior in his divers during descents as deep as 320 feet during the British Admiralty Deep Sea diving trials. Two initial theories arose as to the etiology for this effect, the first being from psychological causes by Hill and Phillip in 1932, and the second being from oxygen toxicity by Haldane in 1935.

Dr. Behnke and his colleagues at the Harvard School of Public Health had another idea as to the etiology of this phenomenon. In 1935, based on observation of individuals in experiments with a pressure chamber, Dr. Behnke published an article in the American Journal of Physiology in which he posited that nitrogen was the etiology of the intoxicating effects of diving.

Nitrogen narcosis, described as ‘‘rapture of the deep’’ by Jacques Cousteau, still remains a relatively common occurrence in modern diving, despite major advances in diving technology since Behnke’s initial description of the pathophysiologic cause of the condition in 1935. The development of symptoms of this condition varies from diver to diver, but usually begins when a depth of 4 atmospheres (132 feet) is reached in divers using compressed air. More sensitive divers can develop symptoms at only 3 atmospheres (99 feet), and other divers may not be affected up to depths as high as 6 atmospheres (198 feet). Interestingly, tolerance to nitrogen narcosis can be developed by frequent diving and exposure to the effects of compressed air at depth.

  1. Acott C. A brief history of diving and decompression illness. SPUMS J 1999;29:98–109.
    2. Bornmann R. Dr. Behnke, founder of UHMS, dies. Pressure 1992; 21:14.
    3. Behnke AR, Thomson RM, Motley P. The psychologic effects from breathing air at 4 atmospheric pressures. Am J Physiol 1935; 112:554–8.
    4. Behnke AR, Johnson FS, Poppen JR, Motley P. The effect of oxygen on man at pressures from 1 to 4 atmospheres. AmJ Physiol 1934; 110:565–72.

Exhaled nitric oxide concentration and decompression-induced bubble formation: An index of decompression severity in humans?

J.-M. Pontier, Buzzacott, J. Nastorg, A.T. Dinh-Xuan, K. Lambrechts
Nitric Oxide 39 (2014) 29–34
http://dx.doi.org/10.1016/j.niox.2014.04.005

Introduction: Previous studies have highlighted a decreased exhaled nitric oxide concentration (FE NO) in divers after hyperbaric exposure in a dry chamber or following a wet dive. The underlying mechanisms of this decrease remain however unknown. The aim of this study was to quantify the separate effects of submersion, hyperbaric hyperoxia exposure and decompression-induced bubble formation on FE NO after a wet dive.
Methods: Healthy experienced divers (n = 31) were assigned to either

  • a group making a scuba-air dive (Air dive),
  • a group with a shallow oxygen dive protocol (Oxygen dive) or

a group making a deep dive breathing a trimix gas mixture (deep-dive).
Bubble signals were graded with the KISS score. Before and after each dive FE NO values were measured using a hand-held electrochemical analyzer.
Results: There was no change in post-dive values of FE NO values (expressed in ppb = parts per billion) in the Air dive group (15.1 ± 3.6 ppb vs. 14.3 ± 4.7 ppb, n = 9, p = 0.32). There was a significant decrease in post-dive values of FE NO in the Oxygen dive group (15.6 ± 6 ppb vs. 11.7 ± 4.7 ppb, n = 9, p = 0.009). There was an even more pronounced decrease in the deep dive group (16.4 ± 6.6 ppb vs. 9.4 ± 3.5 ppb, n = 13, p < 0.001) and a significant correlation between KISS bubble score >0 (n = 13) and percentage decrease in post-dive FE NO values (r = -0.53, p = 0.03). Discussion: Submersion and hyperbaric hyperoxia exposure cannot account entirely for these results suggesting the possibility that, in combination, one effect magnifies the other. A main finding of the present study is a significant relationship between reduction in exhaled NO concentration and dive-induced bubble formation. We postulate that exhaled NO concentration could be a useful index of decompression severity in healthy human divers.

Brain Damage in Commercial Breath-Hold Divers

Kiyotaka Kohshi, H Tamaki, F Lemaıtre, T Okudera, T Ishitake, PJ Denoble
PLoS ONE 9(8): e105006 http://dx.doi.org:/10.1371/journal.pone.0105006

Background: Acute decompression illness (DCI) involving the brain (Cerebral DCI) is one of the most serious forms of diving related injuries which may leave residual brain damage. Cerebral DCI occurs in compressed air and in breath-hold divers, likewise. We conducted this study to investigate whether long-term breath-hold divers who may be exposed to repeated symptomatic and asymptomatic brain injuries, show brain damage on magnetic resonance imaging (MRI).
Subjects and Methods: Our study subjects were 12 commercial breath-hold divers (Ama) with long histories of diving work in a district of Japan. We obtained information on their diving practices and the presence or absence of medical problems, especially DCI events. All participants were examined with MRI to determine the prevalence of brain lesions.
Results: Out of 12 Ama divers (mean age: 54.965.1 years), four had histories of cerebral DCI events, and 11 divers demonstrated ischemic lesions of the brain on MRI studies. The lesions were situated in the cortical and/or subcortical area (9 cases), white matters (4 cases), the basal ganglia (4 cases), and the thalamus (1 case). Subdural fluid collections were seen in 2 cases. Conclusion: These results suggest that commercial breath-hold divers are at a risk of clinical or subclinical brain injury which may affect the long-term neuropsychological health of divers.

Decompression illness

Richard D Vann, Frank K Butler, Simon J Mitchell, Richard E Moon
Lancet 2010; 377: 153–64

Decompression illness is caused by intravascular or extravascular bubbles that are formed as a result of reduction in environmental pressure (decompression). The term covers both arterial gas embolism, in which alveolar gas or venous gas emboli (via cardiac shunts or via pulmonary vessels) are introduced into the arterial circulation, and decompression sickness, which is caused by in-situ bubble formation from dissolved inert gas. Both syndromes can occur in divers, compressed air workers, aviators, and astronauts, but arterial gas embolism also arises from iatrogenic causes unrelated to decompression. Risk of decompression illness is
affected by immersion, exercise, and heat or cold. Manifestations range from itching and minor pain to neurological symptoms, cardiac collapse, and death. First aid treatment is 100% oxygen and definitive treatment is recompression to increased pressure, breathing 100% oxygen. Adjunctive treatment, including fluid administration and prophylaxis against venous thromboembolism in paralyzed patients, is also recommended. Treatment is, in most cases, effective although residual deficits can remain in serious cases, even after several recompressions.

Bubbles can have mechanical, embolic, and biochemical effects with manifestations ranging from trivial to fatal. Clinical manifestations can be caused by direct effects from extravascular (autochthonous) bubbles such as mechanical distortion of tissues causing pain, or vascular obstruction causing stroke-like signs and symptoms. Secondary effects can cause delayed symptom onset up to 24 h after surfacing. Endothelial damage by intravascular bubbles can cause capillary leak, extravasation of plasma, and haemoconcentration. Impaired endothelial function, as measured by decreased effects of vasoactive compounds, has been reported in animals and might occur in man. Hypotension can occur in severe cases. Other effects include platelet activation and deposition, leucocyte-endothelial adhesion, and possibly consequences of vascular occlusion believed to occur in thromboembolic stroke such as ischaemia-reperfusion injury, and apoptosis.

Classification of initial and of all eventual manifestations of decompression illness in 2346 recreational diving accidents reported to the Divers Alert Network from 1998 to 2004 For all instances of pain, 58% consisted of joint pain, 35% muscle pain, and 7% girdle pain. Girdle pain often portends spinal cord involvement. Constitutional symptoms included headache, lightheadedness, inappropriate fatigue, malaise, nausea or vomiting, and anorexia. Muscular discomfort included stiffness, pressure, cramps, and spasm but excluded pain. Pulmonary manifestations included dyspnoea and cough.

Other than depth and time, risk of decompression sickness is affected by other factors that affect inert gas exchange and bubble formation, such as immersion (vs dry hyperbaric chamber exposure), exercise, and temperature. Immersion decreases venous pooling and increases venous return and cardiac output. Warm environments improve peripheral perfusion by promoting vasodilation, whereas cool temperatures decrease perfusion through vasoconstriction. Exercise increases both peripheral perfusion and temperature. The effect of environmental conditions on risk of decompression sickness is dependent on the phase of the pressure exposure. Pressure, exercise, immersion, or a hot environment increase inert gas uptake and risk of decompression sickness. During decom-pression these factors increase inert gas elimination and therefore decrease the risk of decompression sickness. Conversely, uptake is reduced during rest or in a cold environment, hence a diver resting in a cold environment on the bottom has decreased risk of decompression sickness. Rest or low temperatures during decompression increase the risk. If exercise occurs after decompression when super-saturation is present, bubble formation increases and risk of decompression sickness rises.

Exercise at specific times before a dive can decrease the risk of serious decompression sickness in animals and incidence of venous gas emboli in both animals and man. The mechanisms of these effects are unknown but might involve modulation of nitric oxide production and effects on endothelium. Venous gas emboli and risk of decompression sickness increase slightly with age and body-mass index.

Arterial gas embolism should be suspected if a diver has a new onset of altered consciousness, confusion, focal cortical signs, or seizure during ascent or within a few minutes after surfacing from a compressed gas dive.

If the diver spends much time at depth and might have absorbed substantial inert gas before surfacing, arterial gas embolism and serious decompression sickness can coexist, and in such cases, spinal cord manifestations can predominate. Other organ systems, such as the heart, can also be affected, but the clinical diagnosis of gas embolism is not reliable without CNS manifestations. Arterial gas embolism is rare in altitude exposure; if cerebral symptoms occur after altitude exposure, the cause is usually decompression sickness.

Nondermatomal hypoaesthesia and truncal ataxia are common in neurological decompression sickness and can be missed by cursory examination. Pertinent information includes level of consciousness and mental status, cranial nerve function, and motor strength. Coordination can be affected disproportionately, and abnormalities can be detected by assessment of finger-nose movement, and, with eyes open and closed, ability to stand and walk and do heel-toe walking backwards and forwards. Many of these simple tests can be done on the scene by untrained companions.

Panel: Differential diagnosis of decompression illness
Inner-ear barotrauma
Middle-ear or maxillary sinus overinfl ation
Contaminated diving gas and oxygen toxic effects
Musculoskeletal strains or trauma sustained before, during, or after diving
Seafood toxin ingestion (ciguatera, pufferfish, paralytic shellfish poisoning)
Immersion pulmonary edema
Water aspiration
Decompression chamber

Decompression chamber

Decompression chamber. fluidic or pneumatic ventilator is shown at the left. The infusion pump is contained within a plastic cover, in which 100% nitrogen is used to decrease the fi re risk in the event of an electrical problem. The monitor screen is outside the chamber and can be seen through the viewing port. Photo from Duke University Medical Center, with permission.

Long-term outcomes of 69 divers with spinal cord decompressionsickness, by manifestation
n %
No residual symptoms 34 49·3
Any residual symptom 35 50·7
Mild paraesthesias, weakness, or pain 14 20·3
Some impairment of daily activities 21 30·4
Difficulty walking 11 15·9
Impaired micturition 13 18·8
Impaired defecation 15 21·7
Impaired sexual function 15 21·7

Decompression illness occurs in a small population but is an international problem that few physicians are trained to recognise or manage. Although its manifestations are often mild, the potential for permanent injury exists in severe cases, especially if unrecognised or inadequately treated. Emergency medical personnel should be aware of manifestations of decompression illness in the setting of a patient with a history of recent diving or other exposure to substantial pressure change, and should contact an appropriate consultation service for advice.

Diving Medicine: Contemporary Topics and Their Controversies

Michael B. Strauss and Robert C. Borer, Jr
Am J Emerg Med 2001; 19:232-238
http://dx.doi.org:/10.1053/ajem.2001.22654

SCUBA diving is a popular recreational sport. Although serious injuries occur infrequently, when they do knowledge of diving medicine and/or where to obtain appropriate consultation is essential. The emergency physician is likely to be the first physician contact the injured diver has. We discuss 8 subjects
in diving medicine which are contemporary, yet may have controversies associated with them. From this information the physician dealing primarily with the injured diver will have a basis for understanding and managing, as
well as where to find additional help, for his/her patients’ diving injuries.

Over the past 10 years, new knowledge and equipment improvements have made diving safer and more enjoyable. Estimates of actively participating sports divers show a striking increase over this time interval while the number of SCUBA diving deaths annually has remained nearly level at approximately 100. A further indicator of recreational diving safety is that reflected in the nearly constant number of diving injuries (1000 per annum) over the most recent 5 reported years, or approximately 0.53 to 3.4 incidents/10,000 dives.

Divers Alert Network.
The Divers Alert Network (DAN) is a nonprofit organization directed and staffed by experts in the specialty of diving medicine.6 DAN provides immediate consultation for both divers and physicians in the diagnosis and initial management of diving injuries. This 24-hour service is available free world-wide through a dedicated emergency telephone line: 1-919-684-4326. The DAN staff will also identify the nearest appropriate recompression treatment facility and knowledgeable physicians for an expedient referral. General diving medical inquiries can be answered during normal weekday hours either through an information telephone line: 1-919-684-2948 or through an interactive web site http://www.diversalertnetwork.org.

Use of 100% Oxygen for Initial, on the Scene, Management of Diving Accidents
The breathing of pure oxygen is crucial for the initial management of the diving related problems of arterial gas embolism (AGE), decompression sickness (DCS), pulmonary barotrauma (thoracic squeeze), aspiration pneumonitis, and hypoxic encephalopathy associated with near drowning. In 1985, Dick reported that in many cases the neurologic symptoms of AGE and DCS were resolved with the immediate breathing of pure oxygen on the surface. The breathing of pure oxygen reduces bubble size by increasing the differential pressure for the inert gas to diffuse out of the bubble and it also speeds the washout of inert gas from body tissues. The early elimination of the bubble prevents hypoxia and the interaction of the bubble with the blood vessel lining. This interaction leads to secondary problems of capillary leak, bleeding, inflammation, ischemia, and cell death. These secondary problems are the reasons not all DCS symptoms resolve with recompression chamber treatment. The immediate use of pure oxygen for the medical management of these diving problems is analogous to the use of cardiopulmonary resuscitation for the witnessed cardiac arrest; the sooner initiated the better the results.

Diving Education

Medical Fitness for Diving

Asthma has the potential risk for AGE. Neuman reviewed the subject of asthma and diving. He and his coauthors recommend that asthmatics who are asymptomatic, not on medications and have no exercised induced abnormality on pulmonary function studies be allowed to dive.

Conditions leading to loss of consciousness, such as insulin dependent diabetes and epilepsy, can result in drowning. Carefully controlled diving studies in diabetics, who are free from complications, are now defining the safe requirements for diving. Epilepsy remains as a disqualification except in individuals with a history of febrile seizures ending prior to 5 years of age.

Availability of Hyperbaric Oxygen Treatment Facilities

The availability of these chambers makes it possible for divers who become symptomatic after SCUBA diving to readily receive recompression treatment. This is important because the closer the initiation of recompression treatment to the onset of DCS (and AGE) signs and symptoms, the greater the likelihood of full recovery.

Improved Diving Equipment

Mixed and Rebreather Gas Diving
Mixed gas diving involves changing the breathing gas from air which has 20% oxygen to higher oxygen percentages (nitrox). As the amount of oxygen is increased in the gas mixture, the amount of the inert gas (nitrogen) is reduced. With oxygen enriched air there is less tissue deposition of inert gas per unit of time under water for any given depth. However, because of increased oxygen partial pressures, the seizure threshold for oxygen toxicity is lowered. For normal sports diving activities, oxygen toxicity with mixed gas diving is only a theoretical concern.

Decompression Illness is More Than Bubbles

When AGE occurs, DCS symptoms may be concurrent or appear during or after recompression treatment even though the decompression tables were not violated on the dive. When DCS occurs in this situation it appears resistant to recompression treatment (Neuman) perhaps because of the inflammatory reaction generated by the bubble-blood vessel interaction from the AGE. In cases of DCI where components of both DCS and AGE are suspected, the diver should be observed for a minimum of 24 hours after the recompression treatment is completed for the delayed onset of DCS.

No theory of DCS discounts the primary role of bubbles in this condition. However, new information suggests that there are precursors to bubble formation and post-bubbling events that occur as a consequence of the bubbles. As mentioned earlier, venous gas emboli are a common occurrence diving ascent and ordinarily are filtered out harmlessly by the lungs. Precursors to DCS include stasis, dehydration and too rapid of ascents. These conditions allow the ubiquitous VGE to enlarge, coalesce and occlude the venous side of the circulation. Massive venous bubbling to the lungs can cause pulmonary vessel obstruction described as the chokes. If right to left shunts occur in the heart, VGE can become AGE to the brain. If the arterial flow is slow enough and/or the gradients large enough, autochthonus (ie, spontaneous) bubbles can form in the arterial circulation and lead to any of the consequences of AGE. In such situations it could be difficult to determine whether the DCI event was from AGE or DCS even after careful analysis of the dive profile. Hollenbeck’s model for diving paraplegia includes the setting of venous stasis (Batson’s plexus of veins) in the spinal canal, bubble formation, bubble enlargement possibly from off gassing of the spinal cord, blood vessel occlusion, and venous side infarctions of the spinal cord.
Contemporary Management of DCS

Problem Intervention Effect
Bubble Recompression
with HBO
Reduce bubble size
1. Washout inert gas.
2. Change bubble composition by diffusion.
Stasis and dehydration Hydration: oral fluids if alert, IV fluids otherwise. Improve blood flow.
InflammationCell Ischemia ? Anti-inflammatory medicationsHBO Reduce interaction between bubble and blood vessel endothelium.
Improve oxygen availability to hypoxic tissues, reduce edema and also reduces the interaction between bubble and blood vessel endothelium.

.

Conclusions

We anticipate that in the future there will be further improvements for the safety and enjoyment of the recreational SCUBA diver. For example, the dive computer of the future will be able to individualize dive profiles for different personal medical parameters such as age, body composition and fitness level. Diver locators could quickly target a missing diver and save time and gas consumption as well as prevent serious diving mishaps. Drugs may be developed that would minimize the effect of bubbles interacting with body tissues and prevent DCS and AGE.

Extracorporeal membrane oxygenation therapy for pulmonary decompression illness

Yutaka Kondo, Masataka Fukami and Ichiro Kukita
Kondo et al. Critical Care 2014; 18:438 http://ccforum.com/content/18/3/438/10.1186/cc13935

Pulmonary decompression illness is rarely observed in clinical settings, and most patients die prior to hospitalization. We administered ECMO therapy to rescue a patient, even though this therapy has rarely been reported with good outcome in patients with decompression illness. In addition, we had to select venovenous ECMO even with the patient showing right ventricular failure. A lot of physicians may select venoarterial ECMO if the patient shows right ventricular failure, but the important physiological mechanism of pulmonary decompression illness is massive air embolism in the pulmonary arteries, and the bubbles diminish within the first 24 hours. The management of decompression illness therefore differs substantially from the usual right-sided heart failure.

Extremes of barometric pressure

Jane E Risdall, David P Gradwell
Anaesthesia and Intensive Care Medicine 16:2
Ascent to elevated altitude, commonly achieved through flight, by climbing or by residence in highland regions, exposes the individual to reduced ambient pressure. Although there are physical manifestations of this exposure as a consequence of Boyle’s law, the primary physiological challenge is of hypobaric hypoxia. The acute physiological and longer-term adaptive responses of the cardiovascular, respiratory, hematological and neurological systems to altitude are described, together with an outline of the presentation and management of acute mountain sickness, high-altitude pulmonary edema and high-altitude cerebral edema. While many millions experience modest exposure to altitude as a result of flight in pressurized aircraft, fewer individuals are exposed to increased ambient pressure. The pressure changes during diving and hyperbaric exposures result in greater changes in gas load and gas toxicity. Physiological effects include the consequences of increased work of breathing and redistribution of circulating volume. Neurological manifestations may be the direct result of pressure or a consequence of gas toxicity at depth. Increased tissue gas loads may result in decompression illness on return to surface or subsequent ascent in flight.

  • understand the physical effects of changes in ambient pressure and the physiological consequences on the cardiovascular respiratory and neurological systems
  • gain an awareness that exposure to reduced ambient pressure produces both acute and more chronic effects, with differing signs, symptoms and time to onset at various altitudes
  • develop an awareness of the toxic effects of ‘inert’ gases at increased ambient pressures and the pathogenesis and management of decompression illness

Decompression illness According to Henry’s law, at a constant temperature the amount of gas which dissolves in a liquid is proportional to the pressure of that gas or its partial pressure, if it is part of a mixture of gases. Breathing gases at increased ambient pressure will increase the amount of each gas dissolved in the fluid phases of body tissues. On ascent this excess gas has to be given up. If the ascent is controlled at a sufficiently slow rate, elimination will be via the respiratory system. If the ascent is too fast, excess gas may come out of solution and form free bubbles in the tissues or circulation. Bubbles may contain any of the gases in the breathing mixture, but it is the presence of inert gas bubbles (nitrogen or helium) that are thought most likely to give rise to problems, since the elimination of excess oxygen is achieved by metabolism as well as ventilation. These bubbles may act as venous emboli or may trigger inflammatory tissue responses giving rise to symptoms of decompression illness (DCI). Signs and symptoms of DCI may appear up to 48 hours after exposure to increased ambient pressure and include joint pains, motor and sensory deficits, dyspnoea, cough and skin rashes.

Neurological effects of deep diving

Marit Grønning, Johan A. Aarli
Journal of the Neurological Sciences 304 (2011) 17–21
http://dx.doi.org:/10.1016/j.jns.2011.01.021

Deep diving is defined as diving to depths more than 50 m of seawater (msw), and is mainly used for occupational and military purposes. A deep dive is characterized by the compression phase, the bottom time and the decompression phase. Neurological and neurophysiologic effects are demonstrated in divers during the compression phase and the bottom time. Immediate and transient neurological effects after deep dives have been shown in some divers. However, the results from the epidemiological studies regarding long term neurological effects from deep diving are conflicting and still not conclusive.

Possible immediate neurological effects of deep diving
Syndrome Pressure
Hyperoxia/oxygen seizures >152 kPa (5 msw)
HypoxiaHypercapnia
Nitrogen narcosis >354 kPa (25 msw)
High pressure nervous syndrome >1.6 MPa (150 msw)
Neurological decompression sickness

Neurological effects have been demonstrated, both clinically and neurophysiologically in divers during the compression phase and the bottom time. Studies of divers before and after deep dives have shown immediate and transient neurological effects in some divers. However, the results from the epidemiological and clinical studies regarding long term neurological effects from deep diving are conflicting and still not conclusive. Prospective clinical studies with sufficient power and sensitivity are needed to solve this important issue.

Today deep diving to more than 100 msw is routinely performed globally in the oil- and gas industry. In the North Sea remote underwater intervention and maintenance is performed by the use of remotely operated vehicles (ROV), both in conjunction to and as an alternative to manned underwater operations. There will, however, always be a need for human divers in the technically more advanced underwater operations and for contingency repair operations.

P300 latency indexes nitrogen narcosis

Barry Fowler, Janice Pogue and Gerry Porlier
Electroencephalography, and clinical Neurophysiology, 1990, 75:221-229

This experiment investigated the effects of nitrogen narcosis on reaction time (RT) and P300 latency and amplitude, Ten subjects breathed either air or a non-narcotic 20% oxygen-80% helium (heliox) mixture in a hyperbaric chamber at 6.5, 8.3 and 10 atmospheres absolute (ATA), The subjects responded under controlled accuracy conditions to visually presented male or female names in an oddball paradigm. Single-trial analysis revealed a strong relationship between RT and P300 latency, both of which were slowed in a dose-related manner by hyperbaric air but not by heliox. A clear-cut dose-response relationship could not be established for P300 amplitude. These results indicate that P300 latency indexes nitrogen narcosis and are interpreted as support for the slowed processing model of inert gas narcosis.

Adaptation to Deep Water Habitat

Effects of hypoxia on ionic regulation, glycogen utilization and antioxidative ability in the gills and liver of the aquatic air-breathing fish Trichogaster microlepis

Chun-Yen Huang, Hui-Chen Lina, Cheng-Huang Lin
Comparative Biochemistry and Physiology, Part A 179 (2015) 25–34
http://dx.doi.org/10.1016/j.cbpa.2014.09.001

We examined the hypothesis that Trichogaster microlepis, a fish with an accessory air-breathing organ, uses a compensatory strategy involving changes in both behavior and protein levels to enhance its gas exchange ability. This compensatory strategy enables the gill ion-regulatory metabolism to maintain homeostasis during exposure to hypoxia. The present study aimed to determinewhether ionic regulation, glycogen utilization and antioxidant activity differ in terms of expression under hypoxic stresses; fish were sampled after being subjected to 3 or 12 h of hypoxia and 12 h of recovery under normoxia. The air-breathing behavior of the fish increased under hypoxia. No morphological modification of the gills was observed. The expression of carbonic anhydrase II did not vary among the treatments. The Na+/K+-ATPase enzyme activity did not decrease, but increases in Na+/K+-ATPase protein expression and ionocyte levels were observed. The glycogen utilization increased under hypoxia as measured by glycogen phosphorylase protein expression and blood glucose level, whereas the glycogen content decreased. The enzyme activity of several components of the antioxidant system in the gills, including catalase, glutathione peroxidase, and superoxidase dismutase, increased in enzyme activity. Based on the above data, we concluded that T. microlepis is a hypoxia-tolerant species that does not exhibit ion-regulatory suppression but uses glycogen to maintain energy utilization in the gills under hypoxic stress. Components of the antioxidant system showed increased expression under the applied experimental treatments.

Divergence date estimation and a comprehensive molecular tree of extant cetaceans

Michael R. McGowen , Michelle Spaulding, John Gatesy
Molecular Phylogenetics and Evolution 53 (2009) 891–906
http://dx.doi.org/10.1016/j.ympev.2009.08.018

Cetaceans are remarkable among mammals for their numerous adaptations to an entirely aquatic existence, yet many aspects of their phylogeny remain unresolved. Here we merged 37 new sequences from the nuclear genes RAG1 and PRM1 with most published molecular data for the group (45 nuclear loci, transposons, mitochondrial genomes), and generated a supermatrix consisting of 42,335 characters. The great majority of these data have never been combined. Model-based analyses of the supermatrix produced a solid, consistent phylogenetic hypothesis for 87 cetacean species. Bayesian analyses corroborated odontocete (toothed whale) monophyly, stabilized basal odontocete relationships, and completely resolved branching events within Mysticeti (baleen whales) as well as the problematic speciose clade Delphinidae (oceanic dolphins). Only limited conflicts relative to maximum likelihood results were recorded, and discrepancies found in parsimony trees were very weakly supported. We utilized the Bayesian supermatrix tree to estimate divergence dates among lineages using relaxed-clock methods. Divergence estimates revealed rapid branching of basal odontocete lineages near the Eocene–Oligocene boundary, the antiquity of river dolphin lineages, a Late Miocene radiation of balaenopteroid mysticetes, and a recent rapid radiation of Delphinidae beginning [1]10 million years ago. Our comprehensive,  time calibrated tree provides a powerful evolutionary tool for broad-scale comparative studies of Cetacea.

Mitogenomic analyses provide new insights into cetacean origin and evolution

Ulfur Arnason, Anette Gullberg, Axel Janke
Gene 333 (2004) 27–34
http://dx.doi.org:/10.1016/j.gene.2004.02.010

The evolution of the order Cetacea (whales, dolphins, porpoises) has, for a long time, attracted the attention of evolutionary biologists. Here we examine cetacean phylogenetic relationships on the basis of analyses of complete mitochondrial genomes that represent all extant cetacean families. The results suggest that the ancestors of recent cetaceans had an explosive evolutionary radiation 30–35 million years before present. During this period, extant cetaceans divided into the two primary groups, Mysticeti (baleen whales) and Odontoceti (toothed whales). Soon after this basal split, the Odontoceti diverged into the four extant lineages, sperm whales, beaked whales, Indian river dolphins and delphinoids (iniid river dolphins, narwhals/belugas, porpoises and true dolphins). The current data set has allowed test of two recent morphological hypotheses on cetacean origin. One of these hypotheses posits that Artiodactyla and Cetacea originated from the extinct group Mesonychia, and the other that Mesonychia/Cetacea constitutes a sister group to Artiodactyla. The current results are inconsistent with both these hypotheses. The findings suggest that the claimed morphological similarities between Mesonychia and Cetacea are the result of evolutionary convergence rather than common ancestry.

The order Cetacea traditionally includes three suborders: the extinct Archaeoceti and the recent Odontoceti and Mysticeti. It is commonly believed that the evolution of ancestral cetaceans from terrestrial to marine (aquatic) life was accompanied by a fast and radical morphological adaptation. Such a scenario may explain why it was, for a long time, difficult to morphologically establish the position of Cetacea in the mammalian tree and even to settle whether Cetacea constituted a monophyletic group.

Biochemical analyses in the 1950s  and 1960s had shown a closer relationship between cetaceans and artiodactyls (even-toed hoofed mammals) than between cetaceans and any other eutherian order and karyological studies in the late 1960s and early 1970s unequivocally supported cetacean monophyly (Arnason, 1969, 1974). The nature of the relationship between cetaceans and artiodactyls was resolved in phylogenetic studies of mitochondrial (mt) cytochrome b (cytb) genes (Irwin and Arnason, 1994; Arnason and Gullberg, 1996) that placed Cetacea within the order Artiodactyla itself as the sister group of the Hippopotamidae (see also Sarich, 1993). The Hippopotamidae/ Cetacea relationship was subsequently supported in studies of nuclear data (Gatesy et al., 1996; Gatesy, 1997) and statistically established in analysis of complete mt genomes (Ursing and Arnason, 1998). The relationship has also been confirmed in analyses of combined nuclear and mt sequences (Gatesy et al., 1999; Cassens et al., 2000) and in studies of short interspersed repetitive elements (SINEs). Artiodactyla and Cetacea are now commonly referred to as Cetartiodactyla.

Previous analyses of the complete cytb gene of more than 30 cetacean species (Arnason and Gullberg, 1996) identified five primary lineages of recent cetaceans, viz., Mysticeti and the four odontocete lineages Physeteridae (sperm whales), Platanistidae (Indian river dolphins), Ziphiidae (beaked whales) and Delphinoidea (iniid river dolphins, porpoises, narwhals and dolphins). However, these studies left unresolved the relationships of the five lineages as well as those between the three delphinoid families Monodontidae (narwhals, belugas), Phocoenidae (porpoises) and Delphinidae (dolphins). Similarly, the relationships between the four mysticete families Balaenidae (right whales), Neobalaenidae (pygmy right whales), Eschrichtiidae (gray whales) and Balaenopteridae (rorquals) were not conclusively resolved in analyses of cytb genes.

Fig. (not shown). Cetartiodactyl relationships and the estimated times of their divergences. The tree was established on the basis of maximum likelihood analysis of the concatenated amino acid (aa) sequences of 12 mt protein-coding genes. Length of alignment 3610 aa. Support values for branches A–H are shown in the insert.
Cetruminantia (branch A) receives moderate support and Cetancodonta (B) strong support. Cetacea (C) splits into monophyletic Mysticeti (baleen whales) and monophyletic Odontoceti (toothed whales). Odontoceti has four basal lineages, Physeteridae (sperm whales: represented by the sperm and pygmy sperm whales), Ziphiidae (beaked whales: bottlenose and Baird’s beaked whales), Platanistidae (Indian river dolphins: Indian river dolphin) and Delphinoidea. Delphinoidea encompasses the families Iniidae (iniid river dolphins: Amazon river dolphin, La Plata dolphin), Monodontidae (narwhals/belugas: narwhal), Phocoenidae (porpoises: harbour porpoise) and Delphinidae (dolphins: white-beaked dolphin). The common odontocete branch and the branches separating the four cetacean lineages are short. These relationships are therefore somewhat unstable (cf. Section 3.1 and Table 1). Iniid river dolphins (F) are solidly nested within the Delphinoidea (E). Thus, traditional river dolphins (Platanistidae + Iniidae) do not form a monophyletic unit. Molecular estimates of divergence times (Sanderson 2002) were based on two calibration points, A/C-60 and O/M-35 (cf. Section 3.2). Due to the short lengths of internal branches, some estimates for these divergences overlap. NJ: neighbor joining; MP: maximum parsimony; LBP: local bootstrap probability; QP: quartet puzzling. The bar shows the number of aa substitutions per site.

The limited molecular resolution among basal cetacean lineages has been known for some time. Studies of hemoglobin and myoglobin (Goodman, 1989; Czelusniak et al., 1990) have either joined Physeteridae and Mysticeti to the exclusion of Delphinoidea (myoglobin data) or Mysticeti and Delphinoidea to the exclusion of Physeteridae (hemoglobin data). Thus, neither of the data sets identified monophyletic Odontoceti by joining the two odontocete lineages (Physeteridae and Delphinoidea) to the exclusion of Mysticeti. A similar instability was recognized and cautioned against in analyses of some mt data, notably, sequences of rRNA genes (Arnason et al., 1993b). The suggestion (Milinkovitch et al., 1993) of a sister group relationship between Physeteridae and the mysticete family Balaenopteridae (rorquals) was based on a myoglobin data set (which joins Physeteridae and Mysticeti to the exclusion of Delphinoidea) that was complemented with partial data of the mt 16S rRNA gene.

The cetancodont divergence times calculated using A/C-60 and O/M-35 as references have been included in Fig. 1. As a result of the short branches separating several cetacean lineages, the estimates of these divergences overlap. The same observation has been made in calculations based on SINE flanking sequences (Nikaido et al., 2001). There is a general consistency between the current and the flanking sequence datings, except for those involving the Balaenopteridae, which are somewhat younger in our analysis than in the SINEs study. The currently estimated age of the divergence between Hippopotamus and Cetacea (c53.5 MYBP) is consistent with the age (>50 MY) of the oldest archaeocete fossils identified so far (Bajpai and Gingerich, 1998). This suggests that the ages allocated to the two references, A/C-60 (the divergence between ruminant artiodactyls and cetancodonts) and O/M-35 (the divergence between odontocetes and mysticetes) are reasonably accurate.

The dating of the divergence between the blue and fin whales is of interest regarding hybridization between closely related mammalian species. Previous molecular analyses (Arnason et al., 1991b; Spilliaert et al., 1991) demonstrated the occurrence of hybridization between these two species. These studies, which were based on three hybrids (one female and two males), showed that either species could be the mother or father in these hybridizations. The two male hybrids had rudimentary testes, whereas the female hybrid was in her second pregnancy. This suggests that the blue and fin whales may be close to the limit for permissible species hybridization among mammals.

The current data set has allowed examination of the coherence between the molecular results and two prevalent morphological hypotheses related to cetacean evolution. The first hypothesis, which in essence originates from Van Valen (1966, 1968), postulates that monophyletic Artiodactyla and monophyletic Cetacea evolved separately from the extinct Palaeocene group Mesonychia. This hypothesis was recently reinforced in a morphological study (Thewissen et al., 2001) that included mesonychians, two archaeocete taxa (Ambuloocetus and Pakicetus) and some extant and fossil artiodactyls. The study of Thewissen et al. (2001) showed a sister group relationship between monophyletic Artiodactyla and monophyletic Cetacea, with Mesonychia as the basal sister group of Artiodactyla/Cetacea, a conclusion consistent with the palaeontological age of Mesonychia relative to that of Artiodactyla and Cetacea. The second hypothesis favours a sister group relationship between Mesonychia and Cetacea with the Mesonychia/Cetacea clade as the sister group of monophyletic Artiodactyla (O’Leary and Geisler, 1999; see also Gatesy and O’Leary, 2001).

Although the position of Mesonychia differs in the two morphological hypotheses, both correspond to a sister group relationship between Cetacea and monophyletic Artiodactyla among extant cetartiodactyls. Thus, both hypotheses can be tested against the current data set. The result of such a test has been included in Table 1, topology (m)(not shown). As evident, both these morphological hypotheses are incongruent with the mitogenomic findings.

Morphological studies have not provided an answer to the question whether mysticetes and odontocetes had separate origins among the archaeocetes (Fordyce and de Muizon, 2001). However, the long common cetacean branch and the short branches separating the five extant cetacean lineages strongly suggest an origin of modern cetaceans from the same archaeocete group (probably the Dorudontidae).

The limbs of Ambulocetus constitute somewhat of an evolutionary enigma. As evident in Thewissen et al.’s (1994) paper, Ambulocetus has very large hind limbs compared to its forelimbs, a difference that is less pronounced in later silhouette drawings of the animal. It is nevertheless evident that evolution from the powerful hindlimbs of Ambulocetus to their rudimentation in archaeocetes constitutes a remarkable morphological reversal if Ambulocetus is connected to the cetacean branch after the separation of the hippopotamid and cetacean lineages.

For natural reasons, systematic schemes have traditionally been based on external morphological characteristics. The rates of morphological and molecular evolution are rarely (if ever) strictly correlated, however, and this may give rise to inconsistency between traditional systematics and molecular findings. The emerging consensus that the order Cetacea resides within another traditional order, Artiodactyla, makes apparent the incongruity in cetartiodactyl nomenclature (Graur and Higgins, 1994). In this instance, a possible solution for maintaining reasonable consistency between nomenclature and phylogeny would be to recognize Cetartiodactyla as an order with three suborders: Suina, Tylopoda and Cetruminantia. According to such a scheme, Cetacea would (together with the Hippopotamidae) constitute a parvorder within the infraorder Cetancodonta.

Cytochrome b and Bayesian inference of whale phylogeny

Laura May-Collado, Ingi Agnarsson
Molecular Phylogenetics and Evolution 38 (2006) 344–354
http://dx.doi.org//10.1016/j.ympev.2005.09.019

In the mid 1990s cytochrome b and other mitochondrial DNA data reinvigorated cetacean phylogenetics by proposing many novel

and provocative hypotheses of cetacean relationships. These results sparked a revision and reanalysis of morphological datasets, and the collection of new nuclear DNA data from numerous loci. Some of the most controversial mitochondrial hypotheses have now become benchmark clades, corroborated with nuclear DNA and morphological data; others have been resolved in favor of more traditional views. That major conflicts in cetacean phylogeny are disappearing is encouraging. However, most recent papers aim specifically to resolve higher-level conflicts by adding characters, at the cost of densely sampling taxa to resolve lower-level relationships. No molecular study to date has included more than 33 cetaceans. More detailed molecular phylogenies will provide better tools for evolutionary studies. Until more genes are available for a high number of taxa, can we rely on readily available single gene mitochondrial data? Here, we estimate the phylogeny of 66 cetacean taxa and 24 outgroups based on Cytb sequences. We judge the reliability of our phylogeny based on the recovery of several deep-level benchmark clades. A Bayesian phylogenetic analysis recovered all benchmark clades and for the Wrst time supported Odontoceti monophyly based exclusively on analysis of a single mitochondrial gene. The results recover the monophyly, with the exception of only one taxa within Cetacea, and the most recently proposed super- and subfamilies. In contrast, parsimony never recovered all benchmark clades and was sensitive to a priori weighting decisions. These results provide the most detailed phylogeny of Cetacea to date and highlight the utility of both Bayesian methodology in general, and of Cytb in cetacean phylogenetics. They furthermore suggest that dense taxon sampling, like dense character sampling, can overcome problems in phylogenetic reconstruction.

Some long standing debates are all but resolved: our understanding of deeper level cetacean phylogeny has grown strong. However, the strong focus of most recent studies, aiming specifically to resolve these higher level conflicts by adding mostly characters rather than taxa, has left our understanding of lower level relationships among whale species lagging behind. Mitogenomic data, for example, is available only for 16 cetacean species, and no molecular study to date has included more than 33 cetaceans. It seems timely to focus on more detailed (genus, and species level) molecular phylogenies. These will provide better tools for detailed evolutionary studies, and are necessary to test existing morphological phylogenetic hypotheses, and current cetacean classification.

We judge the reliability of our phylogeny based on the recovery of the previously mentioned benchmark clades, in addition to the less controversial clades Perissodactyla, Euungulata (sensu Waddell et al., 2001; Perissodactyla+ Cetartiodactyla), Cetacea, and Mysticeti. Because Cytb is thought to be most reliable at lower taxonomic levels (due to high substitution rates), recovering ‘known’ deeper clades gives credibility to these new findings which have not been addressed by studies using few taxa. We compare the performance of Bayesian analyses versus parsimony under four different models, and briefly examine the sensitivity of the results to taxon sampling. We use our results to discuss agreement and remaining conflict in cetacean phylogenetics, and provide comments on current classification.

The Bayesian analysis recovered all seven benchmark clades. Support for five of the benchmark clades is high (100 posterior probabilities) but rather low for Cetancodonta (79) and marginal for the monophyly of Odontoceti. The analysis also recovered all but one family level, and most sub- and superfamily level cetacean taxa. The results broadly corroborate current cetacean classiffcation, while also pointing to some lower-level groups that may need redefinition.

Many recent cetacean phylogenetic studies include relatively few taxa, in part due to a focus on generating more characters to resolve higher level phylogenetics. While addressing crucial questions and providing the backbone for lower level phylogenies, such studies have limited utility for classification, and for comparative evolutionary studies. In some cases sparse taxon sampling may also confound the results. Of course, taxon sampling is usually simply constrained by the availability of character data, but for some reason many studies have opted to include only one, or a few outgroup taxa, even if many are available.

We find that as long as outgroup taxon sampling was extensive, Bayesian analyses of Cytb recovered all the a priori identified benchmark clades. When only a few outgroups were chosen, however, the Bayesian analysis negated Odontoceti monophyly, as have many previous parsimony analyses of mitochondrial DNA. Furthermore, in almost every detailed comparison possible our results mirror the findings O’Leary et al. (2004), the most ‘character-complete’ (but including relatively few cetacean taxa) analysis to date (37,000 characters from morphology, SINE, and 51 gene fragments). This result gives credibility to our findings, including previously untested lower level clades.

  • Monophyly and placement of Mysticeti (baleen whales).
  • Monophyly of Odontoceti (toothed whales)
  • Delphinoids
  • River Dolphins
  • Beaked and sperm whales

A major goal of phylogenetics is a phylogeny of life (i.e., many taxa), based on multiple lines of evidence (many characters of many types). However, when phylogenies based on relatively few characters can be judged reliable based on external evidence (taxonomic congruence with other phylogenies using many characters, but few taxa), they seem like very promising and useful ‘first guess’ hypotheses. The evolution of sexual dimorphism, echolocation, social behavior, and whistles and other communicative signals, and major ecological shifts (e.g., transition to fresh water) are among the numerous interesting questions in cetacean biology that this phylogeny can help answer.

Deep-diving sea lions exhibit extreme bradycardia in long duration dives

Birgitte I. McDonald1, and Paul J. Ponganis
The Journal of Experimental Biology (2014) 217, 1525-1534 http://dx.doi.org:/10.1242/jeb.098558

Heart rate and peripheral blood flow distribution are the primary determinants of the rate and pattern of oxygen store utilization and ultimately breath-hold duration in marine endotherms. Despite this, little is known about how otariids (sea lions and fur seals) regulate heart rate (fH) while diving. We investigated dive fH in five adult female California sea lions (Zalophus californianus) during foraging trips by instrumenting them with digital electrocardiogram (ECG) loggers and time depth recorders. In all dives, dive fH (number of beats/duration; 50±9 beats min−1) decreased compared with surface rates (113±5 beats min−1), with all dives exhibiting an instantaneous fH below resting (<54 beats min−1) at some point during the dive. Both dive fH and minimum instantaneous fH significantly decreased with increasing dive duration. Typical instantaneous fH profiles of deep dives (>100 m) consisted of:

(1) an initial rapid decline in fH resulting in the lowest instantaneous fH of the dive at the end of descent, often below 10 beats min−1 in dives longer than 6 min in duration;
(2) a slight increase in fH to ~10–40 beats min−1 during the bottom portion of the dive; and
(3) a gradual increase in fH during ascent with a rapid increase prior to surfacing.

Thus, fH regulation in deep-diving sea lions is not simply a progressive bradycardia. Extreme bradycardia and the presumed associated reductions in pulmonary and peripheral blood flow during late descent of deep dives should

(a) contribute to preservation of the lung oxygen store,
(b) increase dependence of muscle on the myoglobin-bound oxygen store,
(c) conserve the blood oxygen store and
(d) help limit the absorption of nitrogen at depth.

This fH profile during deep dives of sea lions may be characteristic of deep-diving marine endotherms that dive on inspiration as similar fH profiles have been recently documented in the emperor penguin, another deep diver that dives on inspiration.

The resting ƒH measured in this study (54±6 beats min−1) was lower than predicted for an animal of similar size (~80 beats min−1 for an 80 kg mammal). In part, this may be due to the fact that the sea lions were probably sleeping. The resting ƒH in our study was also lower than previous measurements in captive juvenile California sea lions (87±17 beats min−1, average mass 30 kg)  and wild Antarctic fur seals (78±5 beats min−1, body mass 30–50 kg). However, we found a significant negative relationship between mass and resting ƒH even with our small sample size of five sea lions (resting ƒH = –0.58 Mb +100.26, r2=0.81, F1,3=12.37, P=0.039). For a 30 kg sea lion, this equation predicts a resting ƒH of 83 beats min−1, which is similar to what was measured previously in juvenile sea lions, suggesting this equation may be useful in estimating resting ƒH in sea lions.

The sea lions exhibited a distinct sinus arrhythmia fluctuating between a minimum of 42±9 and a maximum of 87±12 beats min−1, comparable to the sinus arrhythmias described in other diving birds and mammals, including sea lions. The minimum instantaneous ƒH during the sinus arrhythmia was similar to the mean minimum ƒH in dives less than 3 min (37±7 beats min−1), indicating that in dives less than 3 min (estimated cADL), ƒH only decreased to levels observed during exhalation at rest. This is consistent with observations in emperor penguins and elephant seals, where it was proposed that in dives shorter than the aerobic dive limit (ADL) the reduction in ƒH is regulated by a mechanism of cardiorespiratory control similar to that governing the respiratory sinus arrhythmia, with a further reduction only occurring in dives longer than the ADL.

Fig. 3. (not shown) Instantaneous fH and dive depth profiles of a California sea lion (CSL12_2). Data are from (A) a short, shallow dive (1.3 min, 45 m), (B) a mid-duration dive (4.8 min, 239 m) and (C) a long-duration dive (8.5 min, 305 m). Minimum instantaneous fH reached 37 beats min−1 in the short dive
(A) 19 beats min−1 in the mid-duration dive
(B) and 7 beats min−1 in the long duration dive
(C) Prominent features typical of mid- and long-duration dives include

  • a surface interval tachycardia (pre- and post-dive);
  • a steady rapid decrease in fH during initial descent;
  • a gradual decline in fH towards the end of descent with the lowest fH of the dive at the end of descent;
  • a slight increase and sometimes variable fH during the bottom portion of the dive; and
  • a slow increase in fH during ascent,
  • often ending in a rapid increase just before surfacing.

We obtained the first diving ƒH data from wild sea lions on natural foraging trips, demonstrating how they regulate ƒH over a range of dive durations. Sea lions always decreased dive ƒH from surface ƒH values; however, individual sea lions exhibited different dive ƒH, accounting for a significant amount of the variation in the relationship between dive duration and ƒH (intra-individual correlation: 75–81%)). The individual differences in dive ƒH exhibited in this study suggest that different dive capacities of individual sea lions may partially account for the range of dive strategies exhibited in a previous study (Villegas-Amtmann et al., 2011). Despite the individual differences in ƒH, the pattern of the dive ƒH response was similar in all the sea lions. As predicted, sea lions only consistently displayed a true bradycardia on mid- to long- duration dives (>4 min) (Fig. 5A). Additionally, as seen in freely diving phocids, dive ƒH and minimum ƒH were negatively related to dive duration, with the longest duration dives having the lowest dive ƒH and displaying the most intense bradycardia, often below 10 beats min−1 (Fig. 5A,B).

Profiles of mean fH at 10 s intervals of dives

Profiles of mean fH at 10 s intervals of dives

Fig 4.  Profiles of mean fH at 10 s intervals of dives for (A) six duration categories and (B) five depth categories. Standard error bars are shown. Data were pooled from 461 dives performed by five sea lions. The number of dives in each category and the number of sea lions performing the dives in each category are provided in the keys.

The mild bradycardia and the dive ƒH profiles observed in the shorter duration dives (<3 min) were similar to those observed in trained juvenile California sea lions and adult Stellar sea lions, but much more intense than ƒH observed in freely diving Antarctic fur seals. Surprisingly, although dive ƒH of trained Steller sea lions was similar, Steller sea lions regularly exhibited lower minimum ƒH, with minimum ƒH almost always less than 20 beats min−1 in dives less than 2 min in duration. In the wild, California sea lions rarely exhibited a minimum ƒH less than 20 beats min−1 in similar duration dives (Fig. 5B), suggesting greater blood oxygen transport during these natural short-duration dives.

Fig. 5. (not shown)  fH decreases with increasing dive duration. Dive duration versus (A) dive fH (total number of beats/dive duration), (B) minimum instantaneous fH and (C) bottom fH (total beats at bottom of dive/bottom time) for California sea lions (461 dives from five sea lions).

Although California sea lions are not usually considered exceptional divers, they exhibited extreme bradycardia, comparable to that of the best diving phocids, during their deep dives. In dives greater than 6 min in duration, minimum ƒH was usually less than 10 beats min−1 and sometimes as low as 6 beats mins−1 (Fig. 5B), which is similar to extreme divers such as emperor penguins (3 beats min−1), elephant seals (3 beats min−1), grey seals (2 beats min−1) and Weddell seals (<10 beats min−1), and even as low as what was observed in forced submersion studies. Thus, similar to phocids, the extreme bradycardia exhibited during forced submersions is also a routine component of the sea lion’s physiological repertoire, allowing them to perform long-duration dives.

While the degree of bradycardia observed in long dives of California sea lions was similar to the extreme bradycardia observed in phocids, the ƒH profiles were quite different. In general, phocid ƒH decreases abruptly upon submergence. The intensity of the initial phocid bradycardia either remains relatively stable or intensifies as the dive progresses, and does not start to increase until the seal begins its ascent. In contrast, the ƒH profiles of sea lions were more complex, showing a more gradual decrease during descent, with the minimum ƒH of the dive usually towards the end of descent (Figs 3, 6). There was often a slight increase in ƒH during the bottom portion of the dive, and as soon as the sea lions started to ascend, the ƒH slowly started to increase, often becoming irregular during the middle of ascent, before increasing rapidly as the sea lion approached the surface.

Fig. 6. (not shown) Instantaneous fH and dive depth profiles of the longest dive (10.0 min, 385 m) from a California sea lion (CSL12_1). During this dive, instantaneous fH reached 7 beats min−1 and was less than 20 beats min−1 for over 5.5 min. Post-dive fH was high in the first 0.5–1 min after surfacing, but then declined to ~100 beats min−1 towards the end of the surface interval.

Implications for pulmonary gas exchange

The moderate dive ƒH in short, shallow dives compared with the much slower ƒH of deep long-duration dives suggests more pulmonary blood flow and greater potential for reliance on lung O2. Most of these dives were to depths of less than 100 m (well below the estimated depth of lung collapse near 200 m), so maintenance of a moderate ƒH during these dives may allow sea lions to maximise use of the potentially significant lung O2 stores (~16% of total body O2 stores) throughout the dive. This is supported by venous blood O2 profiles, where, occasionally, there was no decrease in venous blood O2 between the beginning and end of the dive; this can only occur if pulmonary gas exchange continues throughout the dive. Greater utilization of the lung O2 store in sea lions is consistent with higher dive ƒH in other species that both dive on inspiration and typically perform shallow dives (dolphins, porpoises, some penguin species), and in deeper diving species when they perform shallow dives (emperor penguins).

In deeper dives of sea lions, although ƒH was lower and bradycardia more extreme, the diving ƒH profiles suggest that pulmonary gas exchange is also important. In long-duration dives, even though ƒH started to decrease upon or shortly after submergence, the decrease was not as abrupt as in phocids. Additionally, in long deep dives, despite having overall low dive ƒH, there were more heart beats before resting ƒH was reached compared with short, shallow dives. In dives less than 3 min in duration, there were ~10–15 beats until instantaneous ƒH reached resting values. In longer duration dives (>3 min), there were usually ~30–40 beats before instantaneous ƒH reached resting values. We suggest the greater number of heart beats early in these deeper dives enables more gas exchange and blood O2 uptake at shallow depths, thus allowing utilisation of the postulated larger respiratory O2 stores in deeper dives The less abrupt decline in ƒH we observed in sea lions is similar to the more gradual declines documented in emperor penguins and porpoises, where it has also been proposed that the gradual decrease in ƒH allows them to maximise pulmonary gas exchange at shallower depths. However, as sea lions swam deeper, ƒH decreased further (Figs 3, 6), and by 200 m depth (the approximate depth of lung collapse, instantaneous ƒH was 14 beats min−1. Such an extreme decline in ƒH in conjunction with increased pulmonary shunting due to lung compression at greater depths will result in minimization of both O2 and N2 uptake by blood, even before the depth of full lung collapse (100% pulmonary shunt) is reached.

Implications for blood flow

ƒH is often used as a proxy to estimate blood flow and perfusion during diving because of the relative ease of its measurement. This is based on the assumption that stroke volume does not change during diving in sea lions, and, hence, changes in ƒH directly reflect changes in cardiac output. As breath-hold divers maintain arterial pressure while diving, changes in cardiac output should be associated with changes in peripheral vascular resistance and changes in blood flow to tissues. In Weddell seals, a decrease in cardiac output of ~85% during forced submersions resulted in an 80–100% decrease in tissue perfusion in all tissues excluding the brain, adrenal glands and lung. Sea lions exhibited extremely low instantaneous ƒH values that often remained low for significant portions of the dive (Figs 4, 6), suggesting severe decreases in tissue perfusion in dives greater than 5 min in duration. In almost all dives greater than 6 min in duration, instantaneous ƒH reached 10 beats min−1, and stayed below 20 beats min−1 for more than a minute. At a ƒH of 20 beats min−1, cardiac output will be ~36% of resting cardiac output and only about 18% of average surface cardiac output. At these levels of cardiac suppression, most of this flow should be directed towards the brain and heart.

Conclusions

We successfully obtained diving ƒH profiles from a deep-diving otariid during natural foraging trips. We found that

(1) ƒH decreases during all dives, but true and more intense bradycardia only occurred in longer duration dives and
(2) in the longest duration dives, ƒH and presumed cardiac output were as low as 20% of resting values.

We conclude that, although initial high ƒH promotes gas exchange early in deep dives, the extremely low ƒH in late descent of deep dives (a) preserves lung O2, (b) conserves blood O2, (c) increases the dependence of muscle on myoglobin-bound O2 and (d) limits N2 absorption at depth. This ƒH profile, especially during the late descent/early bottom phase of deep dives is similar to that of deep-diving emperor penguins, and may be characteristic of deep diving endotherms that dive on inspiration.

Dive duration was the fixed effect in all models, and to account for the lack of independence caused by having many dives from the same individual, individual (sea lion ID) was included as a random effect. Covariance and random effect structures of the full models were evaluated using Akaike’s information criterion (AIC) and examination of residual plots. AICs from all the tested models are presented with the best model in bold.

Additionally, dives were classified as short-duration (less than 3 min, minimum cADL), mid-duration (3–5 min, range of cADLs) or long-duration (>5 min) dives. Differences in pre-dive ƒH, dive ƒH, minimum ƒH, post-dive ƒH, and heart beats to resting between the categories were investigated using mixed effects ANOVA, followed by post hoc Tukey tests. In all models, dive duration category was the fixed effect and individual (sea lion ID) was included as a random effect. Model fit was accessed by examination of the residuals. All means are expressed ±s.d. and results of the Tukey tests were considered significant at P<0.05. Statistical analysis was performed in R.

Investigating Annual Diving Behaviour by Hooded Seals (Cystophora cristata) within the Northwest Atlantic Ocean

Julie M. Andersen, Mette Skern-Mauritzen, Lars Boehme
PLoS ONE 8(11): e80438. http://dx.doi.org:/10.1371/journal.pone.0080438

With the exception of relatively brief periods when they reproduce and molt, hooded seals, Cystophora cristata, spend most of the year in the open ocean where they undergo feeding migrations to either recover or prepare for the next fasting period. Valuable insights into habitat use and diving behavior during these periods have been obtained by attaching Satellite Relay Data Loggers (SRDLs) to 51 Northwest (NW) Atlantic hooded seals (33 females and 18 males) during icebound fasting periods (200422008). Using General Additive Models (GAMs) we describe habitat use in terms of First Passage Time (FPT) and analyze how bathymetry, seasonality and FPT influence the hooded seals’ diving behavior described by maximum dive depth, dive duration and surface duration. Adult NW Atlantic hooded seals exhibit a change in diving activity in areas where they spend .20 h by increasing maximum dive depth, dive duration and surface duration, indicating a restricted search behavior. We found that male and female hooded seals are spatially segregated and that diving behavior varies between sexes in relation to habitat properties and seasonality. Migration periods are described by increased dive duration for both sexes with a peak in May, October and January. Males demonstrated an increase in dive depth and dive duration towards May (post-breeding/pre-molt) and August–October (post-molt/pre-breeding) but did not show any pronounced increase in surface duration. Females dived deepest and had the highest surface duration between December and January (post-molt/pre-breeding). Our results suggest that the smaller females may have a greater need to recover from dives than that of the larger males. Horizontal segregation could have evolved as a result of a resource partitioning strategy to avoid sexual competition or that the energy requirements of males and females are different due to different energy expenditure during fasting periods.

Novel locomotor muscle design in extreme deep-diving whales

P. Velten, R. M. Dillaman, S. T. Kinsey, W. A. McLellan and D. A. Pabst
The Journal of Experimental Biology 216, 1862-1871
http://dx.doi.org:/10.1242/jeb.081323

Most marine mammals are hypothesized to routinely dive within their aerobic dive limit (ADL). Mammals that regularly perform deep, long-duration dives have locomotor muscles with elevated myoglobin concentrations that are composed of predominantly large, slow-twitch (Type I) fibers with low mitochondrial volume densities (Vmt). These features contribute to extending ADL by increasing oxygen stores and decreasing metabolic rate. Recent tagging studies, however, have challenged the view that two groups of extreme deep-diving cetaceans dive within their ADLs. Beaked whales (including Ziphius cavirostris and Mesoplodon densirostris) routinely perform the deepest and longest average dives of any air-breathing vertebrate, and short-finned pilot whales (Globicephala macrorhynchus) perform high-speed sprints at depth. We investigated the locomotor muscle morphology and estimated total body oxygen stores of several species within these two groups of cetaceans to determine whether they

(1) shared muscle design features with other deep divers and
(2) performed dives within their calculated ADLs.

Muscle of both cetaceans displayed high myoglobin concentrations and large fibers, as predicted, but novel fiber profiles for diving mammals. Beaked whales possessed a sprinterʼs fiber-type profile, composed of ~80% fast-twitch (Type II) fibers with low Vmt. Approximately one-third of the muscle fibers of short-finned pilot whales were slow-twitch, oxidative, glycolytic fibers, a rare fiber type for any mammal. The muscle morphology of beaked whales likely decreases the energetic cost of diving, while that of short-finned pilot whales supports high activity events. Calculated ADLs indicate that, at low metabolic rates, both beaked and short-finned pilot whales carry sufficient onboard oxygen to aerobically support their dives.

Serial cross-sections of the m. longissimus dorsi of Mesoplodon densirostris

Serial cross-sections of the m. longissimus dorsi of Mesoplodon densirostris

Fig. Serial cross-sections of the m. longissimus dorsi of Mesoplodon densirostris (A–D) and Globicephala macrorhynchus (E–H). Scale bars, 50μm. Muscle sections stained for the alkaline (A,E) and acidic (B,F) preincubations of myosin ATPase were used to distinguish Type I and II fibers. Muscle sections stained for succinate dehydrogenase (C,G) and α-glycerophosphate dehydrogenase (D,H) were used to distinguish glycolytic (gl), oxidative (o) and intermediate (i) fibers.

Previous studies of the locomotor muscles of deep-diving marine mammals have demonstrated that these species share a suite of adaptations that increase onboard oxygen stores while slowing the rate at which these stores are utilized, thus extending ADL. Their locomotor muscles display elevated myoglobin concentrations and are composed predominantly of large Type I fibers. Vmt are also lower in deep divers than in shallow divers or athletic terrestrial species. The results of this study indicate that beaked whales and short-finned pilot whales do not uniformly display these characteristics and that each possesses a novel fiber profile compared with those of other deep divers.

The phylogeny of Cetartiodactyla: The importance of dense taxon sampling, missing data, and the remarkable promise of cytochrome b to provide reliable species-level phylogenies

Ingi Agnarsson, Laura J. May-Collado
Molecular Phylogenetics and Evolution 48 (2008) 964–985
http://dx.doi.org:/10.1016/j.ympev.2008.05.046

We perform Bayesian phylogenetic analyses on cytochrome b sequences from 264 of the 290 extant cetartiodactyl mammals (whales plus even-toed ungulates) and two recently extinct species, the ‘Mouse Goat’ and the ‘Irish Elk’. Previous primary analyses have included only a small portion of the species diversity within Cetartiodactyla, while a complete supertree analysis lacks resolution and branch lengths limiting its utility for comparative studies. The benefits of using a single-gene approach include rapid phylogenetic estimates for a large number of species. However, single-gene phylogenies often differ dramatically from studies involving multiple datasets suggesting that they often are unreliable. However, based on recovery of benchmark clades—clades supported in prior studies based on multiple independent datasets—and recovery of undisputed traditional taxonomic groups, Cytb performs extraordinarily well in resolving cetartiodactyl phylogeny when taxon sampling is dense. Missing data, however, (taxa with partial sequences) can compromise phylogenetic accuracy, suggesting a tradeoff between the benefits of adding taxa and introducing question marks. In the full data, a few species with a short sequences appear misplaced, however, sequence length alone seems a poor predictor of this phenomenon as other taxa.

The mammalian superorder Cetartiodactyla (whales and eventoed ungulates) contains nearly 300 species including many of immense commercial importance (cow, pig, and sheep) and of conservation interest and aesthetic value (antelopes, deer, giraffe, dolphins, and whales) (MacDonald, 2006). Certain members of this superorder count among the best studied organisms on earth, whether speaking morphologically, behaviorally, physiologically or genetically. Understanding the interrelationships among cetartiodactyl species, therefore, is of obvious importance with equally short sequences were not conspicuously misplaced. Although we recommend awaiting a better supported phylogeny based on more character data to reconsider classification and taxonomy within Cetartiodactyla, the new phylogenetic hypotheses provided here represent the currently best available tool for comparative species-level studies within this group. Cytb has been sequenced for a large percentage of mammals and appears to be a reliable phylogenetic marker as long as taxon sampling is dense. Therefore, an opportunity exists now to reconstruct detailed phylogenies of most of the major mammalian clades to rapidly provide much needed tools for species-level comparative studies.

Our results support the following relationship among the four major cetartiodactylan lineages (((Tylopoda ((Cetancodonta (Ruminantia + Suina))), with variable support. This arrangement has not been suggested previously, to our knowledge (see review in O’Leary and Gatesy, 2008 and discussion).

Relationships among clades within Cetancodonta are identical to those found by May-Collado and Agnarsson (2006).

Within Ruminantia all our analyzes suggest the following relationships among families: (((((Tragulidae((((Antilocapridae(((Giraffidae(( Cervidae(Moschidae + Bovidae))))) with relatively high support, supporting the subdivision of Ruminantia into Tragulina and Pecora.
In the rare cases where our results are inconsistent with benchmark clades, ad hoc explanations seem reasonable. The placement of M. meminna (Tragulidae) within Bovidae is likely an artifact of missing data, although remarkably it is the only conspicuous misplacement of a species across the whole phylogeny at the family level (while three species appear to be misplaced at the subfamily level within Cervidae in the full analysis, see Fig. 5a). This is supported by the fact that the placement of Moschiola receives low support, and the removal of Moschiola prior to analysis increases dramatically the support for clades close to where it nested (not shown, analysis available from authors), suggesting it had a tendency to ‘jump around’. Two other possibilities cannot be ruled out, however. One, that possibly the available sequence in Genbank may be mislabeled. And second, it should be kept in mind that the validity of Tragulidae has never been tested with molecular data including more than two species.

Oxygen and carbon dioxide fluctuations in burrows of subterranean blind mole rats indicate tolerance to hypoxic–hypercapnic stresses

Imad Shams, Aaron Avivi, Eviatar Nevo
Comparative Biochemistry and Physiology, Part A 142 (2005) 376 – 382
http://dx.doi.org:/10.1016/j.cbpa.2005.09.003

The composition of oxygen (O2), carbon dioxide (CO2), and soil humidity in the underground burrows from three species of the Israeli subterranean mole rat Spalax ehrenbergi superspecies were studied in their natural habitat. Two geographically close populations of each species from contrasting soil types were probed. Maximal CO2 levels (6.1%) and minimal O2 levels (7.2%) were recorded in northern Israel in the breeding mounds of S. carmeli in a flooded, poor drained field of heavy clay soil with very high volumetric water content. The patterns of gas fluctuations during the measurement period among the different Spalax species studied were similar. The more significant differentiation in gas levels was not among species, but between neighboring populations inhabiting heavy soils or light soils: O2 was lower and CO2 was higher in the heavy soils (clay and basaltic) compared to the relatively light soils (terra rossa and rendzina). The extreme values of gas concentration, which occurred during the rainy season, seemed to fluctuate with partial flooding of the tunnels, animal digging activity, and over-crowded breeding mounds inhabited by a nursing female and her offspring. The gas composition and soil water content in neighboring sites with different soil types indicated large differences in the levels of hypoxic–hypercapnic stress in different populations of the same species. A growing number of genes associated with hypoxic stress have been shown to exhibit structural and functional differences between the subterranean Spalax and the aboveground rat (Rattus norvegicus), probably reflecting the molecular adaptations that Spalax went through during 40 million years of evolution to survive efficiently in the severe fluctuations in gas composition in the underground habitat.

map of the studied sites

map of the studied sites

Schematic map of the studied sites: S. galili (2n =52): 1— Rehania (chalk); 2— Dalton (basaltic); S. golani (2n =54): 3— Majdal Shams (terra tossa); 4—Masa’ada (basaltic soils); S. carmeli (2n =58): 5— Al-Maker (heavy clay); 6— Muhraqa (terra rossa).

Comparison of gas composition (O2 and CO2) and water content between light and heavy soils inhabited by S. carmeli

Comparison of gas composition (O2 and CO2) and water content between light and heavy soils inhabited by S. carmeli

Comparison of gas composition (O2 and CO2) and water content between light and heavy soils inhabited by S. carmeli, Al-Maker (heavy soil) and Muhraqa (light soil). AverageTSD of measurements in the burrows of approximately 10 animals at a given date is presented. **p <0.01, T-test and Mann– Whitney test).

Subterranean mammals, which live in closed underground burrow systems, experience an atmosphere that is different from the atmosphere above-ground. Gas exchange between these two atmospheres depends on diffusion through the soil, which in turn, depends on soil particle size, water content, and burrow depth. Heavy soils (clay and basaltic), hold water and have little air space for gas diffusion. A large deviation from external gas composition is found in the burrows of Spalax living in these soil types. The maximal measured concentration of CO2 was 6.1% in Spalax breeding mounds, which is one of the highest concentrations among studied mammals in natural conditions. At the same time 7.2% O2 was measured in water saturated heavy clay soil

seasonal variation from August to March in mean O2, CO2, and soil water content

seasonal variation from August to March in mean O2, CO2, and soil water content

Example of seasonal variation from August to March in mean O2, CO2, and soil water content (VWC) in the Al-Maker population (2n =58, heavy soil). Values are presented as mean TSD.

In this study new data were presented for a wild mammal that survives in an extreme hypoxic–hypercapnic environment. Interestingly, the very low concentrations of O2 experienced by Spalax are correlated with the expression pattern of hypoxia related genes.  So far, we have shown higher and longer-term mRNA expression of erythropoietin, the main factor that regulates the level of circulating red blood cells, in subterranean Spalax compared to the above-ground rat in response to hypoxic stress, as well as differences in the response of erythropoietin to hypoxia in different populations of Spalax experiencing different hypoxic stress in nature. We also demonstrated that erythropoietin pattern of expression is different in Spalax than in Rattus throughout development, a pattern suggesting more efficient hypoxic tolerance in Spalax starting as early as in the embryonic stages. Furthermore, vascular endothelial growth factor (VEGF), which is a critical angiogenic factor that responds to hypoxia, is constitutively expressed at maximal levels in Spalax muscles, the most energy consuming tissue during digging. This level is 1.6-fold higher than in Rattus muscles and is correlated with significantly higher blood vessel concentration in the Spalax muscles compared to the Rattus muscles. Likewise, myoglobin the globin involved in oxygen homeostasis in skeletal muscles, exhibits different expression pattern under normoxia and in response to hypoxia in Spalax muscles compared to rat muscles as well as between different populations of Spalax exposed to different hypoxic stress in nature (unpublished results). Similarly, neuroglobin, a brain-specific globin involved in reversible oxygen binding, i.e., presumably in cellular homeostasis, is expressed differently in the Spalax brain compared to Rattus brain. Like erythropoietin and myoglobin also neuroglobin is expressed differently in Spalax populations experiencing different oxygen supply (unpublished results). Furthermore, Spalax p53 harbors two amino acid substitutions in its binding domain, which are identical to mutations found in p53 of human cancer cells. These substitutions endow Spalax p53 with several-fold higher activation of cell arrest and DNA repair genes compared to human p53 and favor activation of DNA repair genes over apoptotic genes. The study of specific tumoral variants indicates that such preference of growth arrest over apoptosis possibly results as a response to the hypoxic environmental stress known in tumors. Differences in the structure of other molecules related to homeostasis, namely, hemoglobin, haptoglobin (Nevo, 1999), and cytoglobin (unpublished) were also observed in Spalax.

Stress, adaptation, and speciation in the evolution of the blind mole rat, Spalax, in Israel

Eviatar Nevo
Molecular Phylogenetics and Evolution 66 (2013) 515–525
http://dx.doi.org/10.1016/j.ympev.2012.09.008

Environmental stress played a major role in the evolution of the blind mole rat superspecies Spalax ehrenbergi, affecting its adaptive evolution and ecological speciation underground. Spalax is safeguarded all of its life underground from aboveground climatic fluctuations and predators. However, it encounters multiple stresses in its underground burrows including darkness, energetics, hypoxia, hypercapnia, food scarcity, and pathogenicity. Consequently, it evolved adaptive genomic, proteomic, and phenomic complexes to cope with those stresses. Here I describe some of these adaptive complexes, and their theoretical and applied perspectives. Spalax mosaic molecular and organismal evolution involves reductions or regressions coupled with expansions or progressions caused by evolutionary tinkering and natural genetic engineering. Speciation of Spalax in Israel occurred in the Pleistocene, during the last 2.00–2.35 Mya, generating four species associated intimately with four climatic regimes with increasing aridity stress southwards and eastwards representing an ecological speciational adaptive trend: (Spalax golani, 2n = 54?S. galili, 2n = 52?S. carmeli, 2n = 58?S. judaei, 2n = 60). Darwinian ecological speciation occurred gradually with relatively little genetic change by Robertsonian chromosomal and genic mutations. Spalax genome sequencing has just been completed. It involves multiple adaptive complexes to life underground and is an evolutionary model to a few hundred underground mammals. It involves great promise in the future for medicine, space flight, and deep-sea diving.

Stress is a major driving force of evolution (Parsons, 2005; Nevo, 2011). Parsons defined stress as the ‘‘environmental factor causing potential injurious changes to biological systems with a potential for impacts on evolutionary processes’’. The global climatic transition from the middle Eocene to the early Oligocene (45–35 Ma = Million years ago) led to extensive convergent evolution underground of small subterranean mammals across the planet (Nevo, 1999; Lacey et al., 2000; Bennett and Faulkes, 2000; Begall et al., 2007). The subterranean ecotope provided small mammals with shelter from predators and extreme aboveground climatic stressful fluctuations of temperature and humidity. However, they had to evolve genomic adaptive complexes for the immense underground stresses of darkness, energy for burrowing in solid soil, low productivity and food scarcity, hypoxia, hypercapnia, and high infectivity. These stresses have been described in Nevo (1999, 2011) and Nevo et al. (2001); and Nevo list of Spalax publication at http://evolution.haifa.ac.il with many cited references relevant to these stresses).

blind subterranean mole rat of the Spalax ehrenbergi superspecies

blind subterranean mole rat of the Spalax ehrenbergi superspecies

The blind subterranean mole rat of the Spalax ehrenbergi superspecies in Israel. An extreme example of adaptation to life underground

Circadian rhythm and genes

adaptive circadian genes. We identified the circadian rhythm of Spalax
(Nevo et al., 1982) and described, cloned, sequenced, and expressed several circadian genes in Spalax. These include Clock, MOP3, three Period (Per), and cryptochromes (Avivi et al., 2001, 2002, 2003). The Spalax circadian genes are differentially conserved, yet characterized by a significant number of amino acid substitutions. The glutamine-rich area of Clock, which is assumed to function in circadian rhythmicity, is expanded in Spalax compared with that of mice and humans and is different in amino acid composition from that of rats. All three Per genes of Spalax oscillate with a periodicity of 24 h in the suprachaismatic nucleus, eye, and Harderian gland and are expressed in peripheral organs. Per genes are involved in clock resetting. Spalax Per 3 is unique in mammals though its function is still unresolved. The Spalax Per genes contribute to the unique adaptive circadian rhythm to life underground. The cryptochrome (Cry) genes, found in animals and plants, act both as photoreceptors and as ingredients of the negative feedback mechanism of the biological Clock. The CRY 1 protein is significantly closer to the human homolog than to that of mice, as was also shown in parts of the immunogenetic system. Both Cry 1 and Cry 2 mRNAs were found in the SCN, eye, harderian gland, and in peripheral tissues. Remarkably, the distinctly hypertrophied harderian gland is central in Spalax’s unique underground circadian rhythmicity (Pevet et al., 1984).

  • Spalax eye mosaic evolution
  • Gene expression in the eye of Spalax
  • Brain evolution in Spalax to underground stresses
  • Spalax: four species in Israel

The morphological, physiological, and behavioral Spalax eye patterns are underlain by gene expression representing regressive and progressive associated transcripts. Regressive transcripts involve B-2 microglobulin, transketolase, four keratins, alpha enolase, and different heat shock proteins. Several proteins may be involved in eye degeneration. These include heat shock protein 90alpha (hsp90alpha), found also in the blind fish Astyanax mexicanus, two transcripts of programmed cell death proteins, oculospanin, and peripherin 2, both belonging to the Tetraspanin family, in which 60 different mutations cause eye degeneration in humans. Several progressive transcripts in the Spalax eye are found in the retina of many mammals involving gluthatione, peroxidase 4, B spectrin, and Ankyrin; the last two characterize rod cells in the retina. Some transcripts are involved in metabolic processing of retinal, a vertebrate key component in phototransduction, and a relative of vitamin A.

cross section of the developing eye of the mole rat

cross section of the developing eye of the mole rat

Light micrographs showing cross section of the developing eye of the mole rat Spalax ehrenbergi. (A) Optic cup and lens vesicle initially develop normally (x100). (B) Eye at a later embryonic stage. Note appearance of iris-ciliary body rudiment (arrows), and development of the lens nucleus (L). ON, optic nerve (x100). (C) Eye at a still later fetal stage. Note massive growth of the iris-ciliary body complex colobomatous opening (arrow) (x100). (D) Early postnatal stage. The iris-ciliary body complex completely fills the chamber. The lens is vascularized and vacuolated (x100). (E) Adult eye. Eyelids are completely closed and pupil is absent. Note atrophic appearance of the optic disc region (arrow) (x65). (F) Higher magnification of the adult retina. The different retinal layers are retained: PE, pigment epithelium: RE, receptor layer; ON, outer nuclear layer: IN, inner nuclear layer; GC, ganglion cell layer (x500) (from Sanyal et al., 1990, Fig. 1).

The brains of subterranean mammals underwent dramatic evolution in accordance with underground stresses for digging and photoperiodic perception associated with vibrational, tactile, vocal, olfactory, and magnetic communication systems replacing sight, as is seen in Spalax. The brain of Spalax is twice as large as that of the laboratory rat of the same body size. The somatosensory region in the isocortex of Spalax is 1.7 times, the thalamic nuclei 1.3 times, and the motor cortex 3.1 times larger than in the sighted laboratory rat Rattus norvegicus matched to body size.

The ecological stress determinant in Spalax brain evolution is highlighted by the four species of the Spalax ehrenbergi superspecies in Israel. They differentiated chromosomally (by means of Robertsonian mutations and fission), allopatrically, and clinally southwards into four species associated with different climatic regimes, following the gradient of increasing aridity stress and decreasing predictability southwards towards the desert: Spalax galili (2n = 52) ->S. golani (2n = 54)->S. carmeli (2n = 58)->S. judaei (2n = 60), and eastwards S. galili ->S. golani (2n = 52–>54) (Fig. 2). This chromosomal speciation trend southwards is associated with the regional aridity stress southwards (and eastwards) in Israel, budding new species adapted genomically, proteomically, and phenomically (i.e., in morphology, physiology, and behavior) to increasing stresses of higher solar radiation, temperature, and drought southwards (Nevo, 1999; Nevo et al., 2001; Nevo
list of Spalax at http://evolution.haifa.ac.il). A uniquely recent discovery of incipient sympatric ecological speciation at a microscale in Spalax triggered by local stresses occurs within Spalax galili.

retinal input to primary visual structures in Spalax

retinal input to primary visual structures in Spalax

Relative degree of retinal input to primary visual structures in Spalax, hamster, rat, and Spalacopus cyanus (South American Octodontidae, ‘‘coruro’’). These rodents are of similar body size (120–140 g). B. Relative degree of change in the proportions of retinal input to different primary visual structures in Spalax compared with measures obtained in other rodents. A relative progressive development in Spalax is seen in structures involved in photoperiodic and neuroendocrine functions (SCN, BNST).The main regressive feature is the drastic relative reduction of retinal input to the superior colliculus. The main regressive feature is the drastic reduction of retinal input to the superior colliculus. The relative size of other visual structures in Spalax is modified compared to that of the other species. c. Comparison of the absolute size (volume, mm3 x 10-4) of visual structures in Spalax and other rodents. The size of the SCN is equivalent in all species. The vLGN and dLGN are reduced by 87–93% in Spalax. The retino-recipient layers of the superior colliculus are reduced by 97%. Abbreviations: SCN: suprachiasmatic nucleus; BNST: bed nucleus of the stria terminalis; dLGN: dorsal lateral geniculate nucleus; SC: superior colliculus [From Cooper et al., 1993 (Fig 3)].

Subterranean life has a high energetic cost if an animal has to burrow in order to obtain its food. For a 150 g Thomomys bottae, burrowing 1 m may be 360–3400 times more expensive energetically than moving the same distance on the surface (Vleck, 1979). Mean rates of oxygen consumption during burrowing at 22 oC are from 2.8 to 7.1 times the RMR. Vleck developed a model examining the energetics of foraging by burrowing and found that, in the desert, Thomomys adjusts the burrow segment length to minimize the cost of burrowing. Since burrowing becomes less economic as body size increases, Vleck (1981) predicted that the maximum possible body size that a subterranean mammal can attain depends on a balance between habitat productivity and the cost of burrowing in local soils. Vleck’s cost of burrowing hypothesis has been verified in multiple cases. Heth (1989) demonstrated longer burrows in the rendzina soil and shorter ones in the terra rossa soil, associating lower productivity in the former for Spalax.

Food is a limiting factor for subterranean mammals. The abundance and distribution of food explain some of the ecological, physiological, and behavioral characteristics of subterranean mammals. In a field test of Spalax foraging strategy, we concluded that Spalax was a generalist due to the constraints of the subterranean ecotope. Restricted foraging time primarily during the winter when soil is wet, and the high energetic investment of tunneling to get to food items is significantly reduced than in summertime.
We also identified a decrease in the basic metabolic rate towards the desert, i.e., economizing energetics. The maintenance of adequate O2 transport in a subterranean mammal confronting hypoxia requires adaptation along the O2 transport system, achieved by increasing the flow of O2 in the convection systems (ventilation and perfusion) and by reduction of oxygen pressure (PO2) gradients at the diffusion barriers (lung blood, blood-tissue (Arieli, 1990). The PO2 gradient between blood capillaries and respiring mitochondria capillaries is large, and any adaptation at this level could be significant for O2 transport. Reduction of diffusion distance in a muscle can be achieved, like in Spalax, by increasing the number of capillaries that surround muscle fiber or by reducing fiber areas.

Geographic distribution in Israel of the four chromosomal species belonging to the S. ehrenbergi superspecies

Geographic distribution in Israel of the four chromosomal species belonging to the S. ehrenbergi superspecies

Geographic distribution in Israel of the four chromosomal species belonging to the S. ehrenbergi superspecies that are separated by narrow hybrid zones (2n = 52, 54, 58, and 60, now named as S. galili, S. golani, S. carmeli, and S. judaei, respectively; see Nevo et al., 2001).

Spalacid evolution, based on mtDNA, is driven by climatic oscillations and stresses. The underground ecotope provided subterranean mammals with shelter from extreme climate (temperature and humidity) fluctuations, and predators. However, they had to extensively and intensively adapt to the multiple underground stresses (darkness, energetic, low productivity and
food scarcity, hypoxia, hypercapnia, and high infectivity). All subterranean mammals, including spalacids as an extreme case, share convergent molecular and organismal adaptations to their shared unique underground ecotope. Evolution underground, as exemplified here in spalacids, led to mosaic molecular and organismal evolutionary syndromes to cope with multiple stresses.

Speciation involves all rates – from gradual to rapid. Subterranean mammals, with the spalacid example discussed above, provide uniquely rich evolutionary global tests of speciation and adaptation, convergence, regression, progression, and mosaic evolutionary processes. Adaptation and speciation underground was one of the most dramatic natural experiments verifying Darwinian evolution.

The Spalax genome sequencing has just been completed. It is being analyzed and will soon be published in 2012. This will be a milestone in understanding how numerous mammals across the globe, who found underground shelter from climatic fluctuations and stresses above ground, cope with the new suite of stresses they encountered underground, demanding a new engineering overhaul on all organizational levels, selecting for adaptive complexes to cope with the new underground stresses. The main current and future challenges are to compare and contrast genome sequences and identify the genomic basis of adaptation and speciation.

This global Cenozoic experiment could answer the following open questions: How heterozygous is the whole genome? How prevalent are retrotransposons and what is their functional role? How many genes are involved in the Spalax genome and how are they regulated? What are the genic and regulatory networks resisting the multiple stresses underground? How much of the Spalax genome is conserved and how much is reorganized to cope with the underground stresses? How is the solitary blind mole rat, Spalax, different from the social naked mole rat Heterocephalus? How are the processes of reduction, expansion, and genetic tinkering and engineering reflected across the genome? How effective is copy number variation in regulation? Is there similarity in the transcriptomes of subterranean mammals? How could we harness the rich genome repertoire of Spalax to revolutionize medicine, especially in the realm of hypoxia tolerance and the related major diseases of the western world, e.g., cancer, stroke, and cardiovascular diseases? What is the phylogenetic origin of Spalax? How much of the Spalax genome represents its phylogenetic roots and how much of coding and noncoding genomic regions are shared with other subterranean mammals across the globe in adapting to life underground?

The Atmospheric Environment of the Fossorial Mole Rat (Spalax Ehrenbergi): Effects of Season, Soil Texture, Rain, Temperature and Activity

  1. Arieli
    Comp Biochen Physiol. 1978; 63A:569-5151. The fossorial mole rat (Spalax ehrenbergi) may inhabit heavy soil with low gas permeability.
  2. Air composition in burrows in heavy soil deviates from atmospheric air more than that of burrows in light soil.
  3. In winter and spring O2 and CO2 concentrations in breeding mounds were 16.5% O2 and 2.5-3x CO2 and the extreme values measured were 14.0% O2 and 4.8% Cot.
  4. Hypoxia and hypercapnia in the burrow develop shortly after rain and when ambient temperature drops.
  5. Composition of the burrows air is influenced by the solubility of CO2 in soil water and by faster penetration of oxygen than outflowing of CO2.

Hypo-osmotic stress-induced physiological and ion-osmoregulatory responses in European sea bass (Dicentrarchus labrax) are modulated differentially by nutritional status

Amit Kumar Sinha, AF Dasan, R Rasoloniriana, N Pipralia, R Blust, G De Boeck
Comparative Biochemistry and Physiology, Part A 181 (2015) 87–99
http://dx.doi.org/10.1016/j.cbpa.2014.11.024

We investigated the impact of nutritional status on the physiological, metabolic and ion-osmoregulatory performance of European sea bass (Dicentrarchus labrax)when acclimated to seawater (32 ppt), brackishwater (20 and 10 ppt) and hyposaline water (2.5 ppt) for 2 weeks. Following acclimation to different salinities, fish were either fed or fasted (unfed for 14 days). Plasma osmolality, [Na+], [Cl−] and muscle water contentwere severely altered in fasted fish acclimated to 10 and 2.5 ppt in comparison to normal seawater-acclimated fish, suggesting ion regulation and acid–base balance disturbances. In contrast to feed-deprived fish, fed fish were able to avoid osmotic perturbation more effectively. This was accompanied by an increase in Na+/K+-ATPase expression and activity, transitory activation of H+-ATPase (only at 2.5 ppt) and down-regulation of Na+/K+/2Cl− gene expression. Ammonia excretion rate was inhibited to a larger extent in fasted fish acclimated to low salinities while fed fish were able to excrete efficiently. Consequently, the build-up of ammonia in the plasma of fed fish was relatively lower. Energy stores, especially glycogen and lipid, dropped in the fasted fish at low salinities and progression towards the anaerobic metabolic pathway became evident by an increase in plasma lactate level. Overall, the results indicate no osmotic stress in both feeding treatments within the salinity range of 32 to 20 ppt. However, at lower salinities (10–2.5 ppt) feed deprivation tends to reduce physiological, metabolic, ion-osmo-regulatory and molecular compensatory mechanisms and thus limits the fish’s abilities to adapt to a hypo-osmotic environment.

The absence of ion-regulatory suppression in the gills of the aquatic air-breathing fish Trichogaster lalius during oxygen stress

Chun-Yen Huang, Hsueh-Hsi Lin, Cheng-Huang Lin, Hui-Chen Lin
Comparative Biochemistry and Physiology, Part A 179 (2015) 7–16
http://dx.doi.org/10.1016/j.cbpa.2014.08.017

The strategy for most teleost to survive in hypoxic or anoxic conditions is to conserve energy expenditure, which can be achieved by suppressing energy-consuming activities such as ion regulation. However, an air-breathing fish can cope with hypoxic stress using a similar adjustment or by enhancing gas exchange ability, both behaviorally and physiologically. This study examined Trichogaster lalius, an air-breathing fish without apparent gill modification, for their gill ion-regulatory abilities and glycogen utilization under a hypoxic  treatment. We recorded air-breathing frequency, branchial morphology, and the expression of ion-regulatory proteins (Na+/K+-ATPase and vacuolar-type H+-ATPase) in the 1st and 4th gills and labyrinth organ (LO), and the expression of glycogen utilization (GP, glycogen phosphorylase protein expression and glycogen content) and other protein responses (catalase, CAT; carbonic anhydrase II, CAII; heat shock protein 70, HSP70; hypoxia-inducible factor-1α, HIF-1α; proliferating cell nuclear antigen, PCNA; superoxidase dismutase, SOD) in the gills of T. lalius after 3 days in hypoxic and restricted conditions. No morphological modification of the 1st and 4th gills was observed. The air breathing behavior of the fish and CAII protein expression both increased under hypoxia. Ion-regulatory abilities were not suppressed in the hypoxic or restricted groups, but glycogen utilization was enhanced within the groups. The expression of HIF-1α, HSP70 and PCNA did not vary among the treatments. Regarding the antioxidant system, decreased CAT enzyme activity was observed among the groups. In conclusion, during hypoxic stress, T. lalius did not significantly reduce energy consumption but enhanced gas exchange ability and glycogen expenditure.

The combined effect of hypoxia and nutritional status on metabolic and ionoregulatory responses of common carp (Cyprinus carpio)

Sofie Moyson, HJ Liew, M Diricx, AK Sinha, R Blusta, G De Boeck
Comparative Biochemistry and Physiology, Part A 179 (2015) 133–143
http://dx.doi.org/10.1016/j.cbpa.2014.09.017

In the present study, the combined effects of hypoxia and nutritional status were examined in common carp (Cyprinus carpio), a relatively hypoxia tolerant cyprinid. Fish were either fed or fasted and were exposed to hypoxia (1.5–1.8mgO2 L−1) at or slightly above their critical oxygen concentration during 1, 3 or 7 days followed by a 7 day recovery period. Ventilation initially increased during hypoxia, but fasted fish had lower ventilation frequencies than fed fish. In fed fish, ventilation returned to control levels during hypoxia, while in fasted fish recovery only occurred after reoxygenation. Due to this, C. carpio managed, at least in part, to maintain aerobic metabolism during hypoxia: muscle and plasma lactate levels remained relatively stable although they tended to be higher in fed fish (despite higher ventilation rates). However, during recovery, compensatory responses differed greatly between both feeding regimes: plasma lactate in fed fish increased with a simultaneous breakdown of liver glycogen indicating increased energy use, while fasted fish seemed to economize energy and recycle decreasing plasma lactate levels into increasing liver glycogen levels. Protein was used under both feeding regimes during hypoxia and subsequent recovery: protein levels reduced mainly in liver for fed fish and in muscle for fasted fish. Overall, nutritional status had a greater impact on energy reserves than the lack of oxygen with a lower hepatosomatic index and lower glycogen stores in fasted fish. Fasted fish transiently increased Na+/K+-ATPase activity under hypoxia, but in general ionoregulatory balance proved to be only slightly disturbed, showing that sufficient energy was left for ion regulation.

The effect of temperature and body size on metabolic scope of activity in juvenile Atlantic cod Gadus morhua L.

Bjørn Tirsgaard, Jane W. Behrens, John F. Steffensen
Comparative Biochemistry and Physiology, Part A 179 (2015) 89–94
http://dx.doi.org/10.1016/j.cbpa.2014.09.033

Changes in ambient temperature affect the physiology and metabolism and thus the distribution of fish. In this study we used intermittent flow respirometry to determine the effect of temperature (2, 5, 10, 15 and 20 °C) and wet body mass (BM) (~30–460 g) on standard metabolic rate (SMR, mg O2 h−1), maximum metabolic rate (MMR, mg O2 h−1) and metabolic scope (MS, mg O2 h−1) of juvenile Atlantic cod. SMR increased with BM irrespectively of temperature, resulting in an average scaling exponent of 0.87 (0.82–0.92). Q10 values were 1.8–2.1 at temperatures between 5 and 15 °C but higher (2.6–4.3) between 2 and 5 °C and lower (1.6–1.4) between 15 and 20 °C in 200 and 450 g cod. MMR increased with temperature in the smallest cod (50 g) but in the larger cod MMR plateaued between 10, 15 and 20 °C. This resulted in a negative correlation between the optimal temperature for MS (Topt) and BM, Topt being respectively 14.5, 11.8 and 10.9 °C in a 50, 200 and 450 g cod. Irrespective of BM cold water temperatures resulted in a reduction (30–35%) of MS whereas the reduction of MS at warm temperatures was only evident for larger fish (200 and 450 g), caused by plateauing of MMR at 10 °C and above. Warm temperatures thus seem favorable for smaller (50 g) juvenile cod, but not for larger conspecifics (200 and 450 g).

Read Full Post »

Biochemical Insights of Dr. Jose Eduardo de Salles Roselino

Larry H. Bernstein, MD, FCAP, Interviewer, Curator

Leaders in Pharmaceutical Intelligence

Biochemical Insights of Dr. Jose Eduardo de Salles Roselino

http://pharmaceuticalintelligence.com/12/24/2014/larryhbern/Biochemical_
Insights_of_Dr._Jose_Eduardo_de_Salles_Roselino/

Article ID #165: Biochemical Insights of Dr. Jose Eduardo de Salles Roselino. Published on 12/17/2014

WordCloud Image Produced by Adam Tubman

Biochemical Insights of Dr. Jose Eduardo de Salles Roselino

How is it that developments late in the 20th century diverted the attention of
biological processes from a dynamic construct involving interacting chemical
reactions under rapidly changing external conditions effecting tissues and cell
function to a rigid construct that is determined unilaterally by the genome
construct, diverting attention from mechanisms essential for seeing the complete
cellular construct?

Larry, I assume that in case you read the article titled Neo – Darwinism, The
Modern Synthesis and Selfish Genes that bares no relationship with Physiology
with Molecular Biology J. Physiol 2011; 589(5): 1007-11 by Denis Noble, you might
find that it was the key factor required in order to understand the dislodgment
of physiology as a foundation of medical reasoning. In the near unilateral emphasis
of genomic activity as a determinant of cellular activity all of the required general
support for the understanding of my reasoning. The DNA to protein link goes
from triplet sequence to amino acid sequence. That is the realm of genetics.
Further, protein conformation, activity and function requires that environmental
and micro-environmental factors should be considered (Biochemistry). If that
were not the case, we have no way to bridge the gap between the genetic
code and the evolution of cells, tissues, organs, and organisms.

  • Consider this example of hormonal function. I would like to stress in
    the cAMP dependent hormonal response, the transfer of information
    that 
    occurs through conformation changes after protein interactions.
    This mechanism therefore, requires that proteins must not have their
    conformation determined by sequence alone.
    Regulatory protein conformation is determined by its sequence plus
    the interaction it has in its micro-environment. For instance, if your
    scheme takes into account what happens inside the membrane and
    that occurs before cAMP, then production is increased by hormone
    action. A dynamic scheme  will show an effect initially, over hormone
    receptor (hormone binding causing change in its conformation) followed
    by GTPase change in conformation caused by receptor interaction and
    finally, Adenylate cyclase change in conformation and in activity after
    GTPase protein binding in a complex system that is dependent on self-
    assembly and also, on changes in their conformation in response to
    hormonal signals (see R. A Kahn and A. G Gilman 1984 J. Biol. Chem.
    v. 259,n 10 pp6235-6240. In this case, trimeric or dimeric G does not
    matter). Furthermore, after the step of cAMP increased production we
    also can see changes in protein conformation.  The effect of increased
    cAMP levels over (inhibitor protein and protein kinase protein complex)
    also is an effect upon protein conformation. Increased cAMP levels led
    to the separation of inhibitor protein (R ) from cAMP dependent protein
    kinase (C ) causing removal of the inhibitor R and the increase in C activity.
    R stands for regulatory subunit and C for catalytic subunit of the protein
    complex.
  • This cAMP effect over the quaternary structure of the enzyme complex
    (C protein kinase + R the inhibitor) may be better understood as an
    environmental information producing an effect in opposition to
    what may be considered as a tendency  towards a conformation
    “determined” by the genetic code. This “ideal” conformation
    “determined” by the genome  would be only seen in crystalline
    protein.
     In carbohydrate metabolism in the liver the hormonal signal
    causes a biochemical regulatory response that preserves homeostatic
    levels of glucose (one function) and in the muscle, it is a biochemical
    regulatory response that preserves intracellular levels of ATP (another
    function).
  • Therefore, sequence alone does not explain conformation, activity
    and function of regulatory proteins
    .  If this important regulatory
    mechanism was  not ignored, the work of  S. Prusiner (Prion diseases
    and the BSE crisis Stanley B. Prusiner 1997 Science; 278: 245 – 251,
    10  October) would be easily understood.  We would be accustomed
    to reason about changes in protein conformation caused by protein
    interaction with other proteins, lipids, small molecules and even ions.
  • In case this wrong biochemical reasoning is used in microorganisms.
    Still it is wrong but, it will cause a minor error most of the time, since
    we may reduce almost all activity of microorganism´s proteins to a
    single function – The production of another microorganism. However,
    even microorganisms respond differently to their micro-environment
    despite a single genome (See M. Rouxii dimorphic fungus works,
    later). The reason for the reasoning error is, proteins are proteins
    and DNA are DNA quite different in chemical terms. Proteins must
    change their conformation to allow for fast regulatory responses and
    DNA must preserve its sequence to allow for genetic inheritance.

Read Full Post »

Summary and Perspectives: Impairments in Pathological States: Endocrine Disorders, Stress Hypermetabolism and Cancer

Summary and Perspectives: Impairments in Pathological States: Endocrine Disorders, Stress Hypermetabolism and Cancer

Author and Curator: Larry H. Bernstein, MD, FCAP

Article ID #160: Summary and Perspectives: Impairments in Pathological States: Endocrine Disorders, Stress Hypermetabolism and Cancer. Published on 11/9/2014

WordCloud Image Produced by Adam Tubman

This summary is the last of a series on the impact of transcriptomics, proteomics, and metabolomics on disease investigation, and the sorting and integration of genomic signatures and metabolic signatures to explain phenotypic relationships in variability and individuality of response to disease expression and how this leads to  pharmaceutical discovery and personalized medicine.  We have unquestionably better tools at our disposal than has ever existed in the history of mankind, and an enormous knowledge-base that has to be accessed.  I shall conclude here these discussions with the powerful contribution to and current knowledge pertaining to biochemistry, metabolism, protein-interactions, signaling, and the application of the -OMICS to diseases and drug discovery at this time.

The Ever-Transcendent Cell

Deriving physiologic first principles By John S. Torday | The Scientist Nov 1, 2014
http://www.the-scientist.com/?articles.view/articleNo/41282/title/The-Ever-Transcendent-Cell/

Both the developmental and phylogenetic histories of an organism describe the evolution of physiology—the complex of metabolic pathways that govern the function of an organism as a whole. The necessity of establishing and maintaining homeostatic mechanisms began at the cellular level, with the very first cells, and homeostasis provides the underlying selection pressure fueling evolution.

While the events leading to the formation of the first functioning cell are debatable, a critical one was certainly the formation of simple lipid-enclosed vesicles, which provided a protected space for the evolution of metabolic pathways. Protocells evolved from a common ancestor that experienced environmental stresses early in the history of cellular development, such as acidic ocean conditions and low atmospheric oxygen levels, which shaped the evolution of metabolism.

The reduction of evolution to cell biology may answer the perennially unresolved question of why organisms return to their unicellular origins during the life cycle.

As primitive protocells evolved to form prokaryotes and, much later, eukaryotes, changes to the cell membrane occurred that were critical to the maintenance of chemiosmosis, the generation of bioenergy through the partitioning of ions. The incorporation of cholesterol into the plasma membrane surrounding primitive eukaryotic cells marked the beginning of their differentiation from prokaryotes. Cholesterol imparted more fluidity to eukaryotic cell membranes, enhancing functionality by increasing motility and endocytosis. Membrane deformability also allowed for increased gas exchange.

Acidification of the oceans by atmospheric carbon dioxide generated high intracellular calcium ion concentrations in primitive aquatic eukaryotes, which had to be lowered to prevent toxic effects, namely the aggregation of nucleotides, proteins, and lipids. The early cells achieved this by the evolution of calcium channels composed of cholesterol embedded within the cell’s plasma membrane, and of internal membranes, such as that of the endoplasmic reticulum, peroxisomes, and other cytoplasmic organelles, which hosted intracellular chemiosmosis and helped regulate calcium.

As eukaryotes thrived, they experienced increasingly competitive pressure for metabolic efficiency. Engulfed bacteria, assimilated as mitochondria, provided more bioenergy. As the evolution of eukaryotic organisms progressed, metabolic cooperation evolved, perhaps to enable competition with biofilm-forming, quorum-sensing prokaryotes. The subsequent appearance of multicellular eukaryotes expressing cellular growth factors and their respective receptors facilitated cell-cell signaling, forming the basis for an explosion of multicellular eukaryote evolution, culminating in the metazoans.

Casting a cellular perspective on evolution highlights the integration of genotype and phenotype. Starting from the protocell membrane, the functional homolog for all complex metazoan organs, it offers a way of experimentally determining the role of genes that fostered evolution based on the ontogeny and phylogeny of cellular processes that can be traced back, in some cases, to our last universal common ancestor.  ….

As eukaryotes thrived, they experienced increasingly competitive pressure for metabolic efficiency. Engulfed bacteria, assimilated as mitochondria, provided more bioenergy. As the evolution of eukaryotic organisms progressed, metabolic cooperation evolved, perhaps to enable competition with biofilm-forming, quorum-sensing prokaryotes. The subsequent appearance of multicellular eukaryotes expressing cellular growth factors and their respective receptors facilitated cell-cell signaling, forming the basis for an explosion of multicellular eukaryote evolution, culminating in the metazoans.

Casting a cellular perspective on evolution highlights the integration of genotype and phenotype. Starting from the protocell membrane, the functional homolog for all complex metazoan organs, it offers a way of experimentally determining the role of genes that fostered evolution based on the ontogeny and phylogeny of cellular processes that can be traced back, in some cases, to our last universal common ancestor.

Given that the unicellular toolkit is complete with all the traits necessary for forming multicellular organisms (Science, 301:361-63, 2003), it is distinctly possible that metazoans are merely permutations of the unicellular body plan. That scenario would clarify a lot of puzzling biology: molecular commonalities between the skin, lung, gut, and brain that affect physiology and pathophysiology exist because the cell membranes of unicellular organisms perform the equivalents of these tissue functions, and the existence of pleiotropy—one gene affecting many phenotypes—may be a consequence of the common unicellular source for all complex biologic traits.  …

The cell-molecular homeostatic model for evolution and stability addresses how the external environment generates homeostasis developmentally at the cellular level. It also determines homeostatic set points in adaptation to the environment through specific effectors, such as growth factors and their receptors, second messengers, inflammatory mediators, crossover mutations, and gene duplications. This is a highly mechanistic, heritable, plastic process that lends itself to understanding evolution at the cellular, tissue, organ, system, and population levels, mediated by physiologically linked mechanisms throughout, without having to invoke random, chance mechanisms to bridge different scales of evolutionary change. In other words, it is an integrated mechanism that can often be traced all the way back to its unicellular origins.

The switch from swim bladder to lung as vertebrates moved from water to land is proof of principle that stress-induced evolution in metazoans can be understood from changes at the cellular level.

http://www.the-scientist.com/Nov2014/TE_21.jpg

A MECHANISTIC BASIS FOR LUNG DEVELOPMENT: Stress from periodic atmospheric hypoxia (1) during vertebrate adaptation to land enhances positive selection of the stretch-regulated parathyroid hormone-related protein (PTHrP) in the pituitary and adrenal glands. In the pituitary (2), PTHrP signaling upregulates the release of adrenocorticotropic hormone (ACTH) (3), which stimulates the release of glucocorticoids (GC) by the adrenal gland (4). In the adrenal gland, PTHrP signaling also stimulates glucocorticoid production of adrenaline (5), which in turn affects the secretion of lung surfactant, the distension of alveoli, and the perfusion of alveolar capillaries (6). PTHrP signaling integrates the inflation and deflation of the alveoli with surfactant production and capillary perfusion.  THE SCIENTIST STAFF

From a cell-cell signaling perspective, two critical duplications in genes coding for cell-surface receptors occurred during this period of water-to-land transition—in the stretch-regulated parathyroid hormone-related protein (PTHrP) receptor gene and the β adrenergic (βA) receptor gene. These gene duplications can be disassembled by following their effects on vertebrate physiology backwards over phylogeny. PTHrP signaling is necessary for traits specifically relevant to land adaptation: calcification of bone, skin barrier formation, and the inflation and distention of lung alveoli. Microvascular shear stress in PTHrP-expressing organs such as bone, skin, kidney, and lung would have favored duplication of the PTHrP receptor, since sheer stress generates radical oxygen species (ROS) known to have this effect and PTHrP is a potent vasodilator, acting as an epistatic balancing selection for this constraint.

Positive selection for PTHrP signaling also evolved in the pituitary and adrenal cortex (see figure on this page), stimulating the secretion of ACTH and corticoids, respectively, in response to the stress of land adaptation. This cascade amplified adrenaline production by the adrenal medulla, since corticoids passing through it enzymatically stimulate adrenaline synthesis. Positive selection for this functional trait may have resulted from hypoxic stress that arose during global episodes of atmospheric hypoxia over geologic time. Since hypoxia is the most potent physiologic stressor, such transient oxygen deficiencies would have been acutely alleviated by increasing adrenaline levels, which would have stimulated alveolar surfactant production, increasing gas exchange by facilitating the distension of the alveoli. Over time, increased alveolar distension would have generated more alveoli by stimulating PTHrP secretion, impelling evolution of the alveolar bed of the lung.

This scenario similarly explains βA receptor gene duplication, since increased density of the βA receptor within the alveolar walls was necessary for relieving another constraint during the evolution of the lung in adaptation to land: the bottleneck created by the existence of a common mechanism for blood pressure control in both the lung alveoli and the systemic blood pressure. The pulmonary vasculature was constrained by its ability to withstand the swings in pressure caused by the systemic perfusion necessary to sustain all the other vital organs. PTHrP is a potent vasodilator, subserving the blood pressure constraint, but eventually the βA receptors evolved to coordinate blood pressure in both the lung and the periphery.

Gut Microbiome Heritability

Analyzing data from a large twin study, researchers have homed in on how host genetics can shape the gut microbiome.
By Tracy Vence | The Scientist Nov 6, 2014

Previous research suggested host genetic variation can influence microbial phenotype, but an analysis of data from a large twin study published in Cell today (November 6) solidifies the connection between human genotype and the composition of the gut microbiome. Studying more than 1,000 fecal samples from 416 monozygotic and dizygotic twin pairs, Cornell University’s Ruth Ley and her colleagues have homed in on one bacterial taxon, the family Christensenellaceae, as the most highly heritable group of microbes in the human gut. The researchers also found that Christensenellaceae—which was first described just two years ago—is central to a network of co-occurring heritable microbes that is associated with lean body mass index (BMI).  …

Of particular interest was the family Christensenellaceae, which was the most heritable taxon among those identified in the team’s analysis of fecal samples obtained from the TwinsUK study population.

While microbiologists had previously detected 16S rRNA sequences belonging to Christensenellaceae in the human microbiome, the family wasn’t named until 2012. “People hadn’t looked into it, partly because it didn’t have a name . . . it sort of flew under the radar,” said Ley.

Ley and her colleagues discovered that Christensenellaceae appears to be the hub in a network of co-occurring heritable taxa, which—among TwinsUK participants—was associated with low BMI. The researchers also found that Christensenellaceae had been found at greater abundance in low-BMI twins in older studies.

To interrogate the effects of Christensenellaceae on host metabolic phenotype, the Ley’s team introduced lean and obese human fecal samples into germ-free mice. They found animals that received lean fecal samples containing more Christensenellaceae showed reduced weight gain compared with their counterparts. And treatment of mice that had obesity-associated microbiomes with one member of the Christensenellaceae family, Christensenella minuta, led to reduced weight gain.   …

Ley and her colleagues are now focusing on the host alleles underlying the heritability of the gut microbiome. “We’re running a genome-wide association analysis to try to find genes—particular variants of genes—that might associate with higher levels of these highly heritable microbiota.  . . . Hopefully that will point us to possible reasons they’re heritable,” she said. “The genes will guide us toward understanding how these relationships are maintained between host genotype and microbiome composition.”

J.K. Goodrich et al., “Human genetics shape the gut microbiome,” Cell,  http://dx.doi.org:/10.1016/j.cell.2014.09.053, 2014.

Light-Operated Drugs

Scientists create a photosensitive pharmaceutical to target a glutamate receptor.
By Ruth Williams | The Scentist Nov 1, 2014
http://www.the-scientist.com/?articles.view/articleNo/41279/title/Light-Operated-Drugs/

light operated drugs MO1

light operated drugs MO1

http://www.the-scientist.com/Nov2014/MO1.jpg

The desire for temporal and spatial control of medications to minimize side effects and maximize benefits has inspired the development of light-controllable drugs, or optopharmacology. Early versions of such drugs have manipulated ion channels or protein-protein interactions, “but never, to my knowledge, G protein–coupled receptors [GPCRs], which are one of the most important pharmacological targets,” says Pau Gorostiza of the Institute for Bioengineering of Catalonia, in Barcelona.

Gorostiza has taken the first step toward filling that gap, creating a photosensitive inhibitor of the metabotropic glutamate 5 (mGlu5) receptor—a GPCR expressed in neurons and implicated in a number of neurological and psychiatric disorders. The new mGlu5 inhibitor—called alloswitch-1—is based on a known mGlu receptor inhibitor, but the simple addition of a light-responsive appendage, as had been done for other photosensitive drugs, wasn’t an option. The binding site on mGlu5 is “extremely tight,” explains Gorostiza, and would not accommodate a differently shaped molecule. Instead, alloswitch-1 has an intrinsic light-responsive element.

In a human cell line, the drug was active under dim light conditions, switched off by exposure to violet light, and switched back on by green light. When Gorostiza’s team administered alloswitch-1 to tadpoles, switching between violet and green light made the animals stop and start swimming, respectively.

The fact that alloswitch-1 is constitutively active and switched off by light is not ideal, says Gorostiza. “If you are thinking of therapy, then in principle you would prefer the opposite,” an “on” switch. Indeed, tweaks are required before alloswitch-1 could be a useful drug or research tool, says Stefan Herlitze, who studies ion channels at Ruhr-Universität Bochum in Germany. But, he adds, “as a proof of principle it is great.” (Nat Chem Biol, http://dx.doi.org:/10.1038/nchembio.1612, 2014)

Enhanced Enhancers

The recent discovery of super-enhancers may offer new drug targets for a range of diseases.
By Eric Olson | The Scientist Nov 1, 2014
http://www.the-scientist.com/?articles.view/articleNo/41281/title/Enhanced-Enhancers/

To understand disease processes, scientists often focus on unraveling how gene expression in disease-associated cells is altered. Increases or decreases in transcription—as dictated by a regulatory stretch of DNA called an enhancer, which serves as a binding site for transcription factors and associated proteins—can produce an aberrant composition of proteins, metabolites, and signaling molecules that drives pathologic states. Identifying the root causes of these changes may lead to new therapeutic approaches for many different diseases.

Although few therapies for human diseases aim to alter gene expression, the outstanding examples—including antiestrogens for hormone-positive breast cancer, antiandrogens for prostate cancer, and PPAR-γ agonists for type 2 diabetes—demonstrate the benefits that can be achieved through targeting gene-control mechanisms.  Now, thanks to recent papers from laboratories at MIT, Harvard, and the National Institutes of Health, researchers have a new, much bigger transcriptional target: large DNA regions known as super-enhancers or stretch-enhancers. Already, work on super-enhancers is providing insights into how gene-expression programs are established and maintained, and how they may go awry in disease.  Such research promises to open new avenues for discovering medicines for diseases where novel approaches are sorely needed.

Super-enhancers cover stretches of DNA that are 10- to 100-fold longer and about 10-fold less abundant in the genome than typical enhancer regions (Cell, 153:307-19, 2013). They also appear to bind a large percentage of the transcriptional machinery compared to typical enhancers, allowing them to better establish and enforce cell-type specific transcriptional programs (Cell, 153:320-34, 2013).

Super-enhancers are closely associated with genes that dictate cell identity, including those for cell-type–specific master regulatory transcription factors. This observation led to the intriguing hypothesis that cells with a pathologic identity, such as cancer cells, have an altered gene expression program driven by the loss, gain, or altered function of super-enhancers.

Sure enough, by mapping the genome-wide location of super-enhancers in several cancer cell lines and from patients’ tumor cells, we and others have demonstrated that genes located near super-enhancers are involved in processes that underlie tumorigenesis, such as cell proliferation, signaling, and apoptosis.

Super-enhancers cover stretches of DNA that are 10- to 100-fold longer and about 10-fold less abundant in the genome than typical enhancer regions.

Genome-wide association studies (GWAS) have found that disease- and trait-associated genetic variants often occur in greater numbers in super-enhancers (compared to typical enhancers) in cell types involved in the disease or trait of interest (Cell, 155:934-47, 2013). For example, an enrichment of fasting glucose–associated single nucleotide polymorphisms (SNPs) was found in the stretch-enhancers of pancreatic islet cells (PNAS, 110:17921-26, 2013). Given that some 90 percent of reported disease-associated SNPs are located in noncoding regions, super-enhancer maps may be extremely valuable in assigning functional significance to GWAS variants and identifying target pathways.

Because only 1 to 2 percent of active genes are physically linked to a super-enhancer, mapping the locations of super-enhancers can be used to pinpoint the small number of genes that may drive the biology of that cell. Differential super-enhancer maps that compare normal cells to diseased cells can be used to unravel the gene-control circuitry and identify new molecular targets, in much the same way that somatic mutations in tumor cells can point to oncogenic drivers in cancer. This approach is especially attractive in diseases for which an incomplete understanding of the pathogenic mechanisms has been a barrier to discovering effective new therapies.

Another therapeutic approach could be to disrupt the formation or function of super-enhancers by interfering with their associated protein components. This strategy could make it possible to downregulate multiple disease-associated genes through a single molecular intervention. A group of Boston-area researchers recently published support for this concept when they described inhibited expression of cancer-specific genes, leading to a decrease in cancer cell growth, by using a small molecule inhibitor to knock down a super-enhancer component called BRD4 (Cancer Cell, 24:777-90, 2013).  More recently, another group showed that expression of the RUNX1 transcription factor, involved in a form of T-cell leukemia, can be diminished by treating cells with an inhibitor of a transcriptional kinase that is present at the RUNX1 super-enhancer (Nature, 511:616-20, 2014).

Fungal effector Ecp6 outcompetes host immune receptor for chitin binding through intrachain LysM dimerization 
Andrea Sánchez-Vallet, et al.   eLife 2013;2:e00790 http://elifesciences.org/content/2/e00790#sthash.LnqVMJ9p.dpuf

LysM effector

LysM effector

http://img.scoop.it/ZniCRKQSvJOG18fHbb4p0Tl72eJkfbmt4t8yenImKBVvK0kTmF0xjctABnaLJIm9

While host immune receptors

  • detect pathogen-associated molecular patterns to activate immunity,
  • pathogens attempt to deregulate host immunity through secreted effectors.

Fungi employ LysM effectors to prevent

  • recognition of cell wall-derived chitin by host immune receptors

Structural analysis of the LysM effector Ecp6 of

  • the fungal tomato pathogen Cladosporium fulvum reveals
  • a novel mechanism for chitin binding,
  • mediated by intrachain LysM dimerization,

leading to a chitin-binding groove that is deeply buried in the effector protein.

This composite binding site involves

  • two of the three LysMs of Ecp6 and
  • mediates chitin binding with ultra-high (pM) affinity.

The remaining singular LysM domain of Ecp6 binds chitin with

  • low micromolar affinity but can nevertheless still perturb chitin-triggered immunity.

Conceivably, the perturbation by this LysM domain is not established through chitin sequestration but possibly through interference with the host immune receptor complex.

Mutated Genes in Schizophrenia Map to Brain Networks
From www.nih.gov –  Sep 3, 2013

Previous studies have shown that many people with schizophrenia have de novo, or new, genetic mutations. These misspellings in a gene’s DNA sequence

  • occur spontaneously and so aren’t shared by their close relatives.

Dr. Mary-Claire King of the University of Washington in Seattle and colleagues set out to

  • identify spontaneous genetic mutations in people with schizophrenia and
  • to assess where and when in the brain these misspelled genes are turned on, or expressed.

The study was funded in part by NIH’s National Institute of Mental Health (NIMH). The results were published in the August 1, 2013, issue of Cell.

The researchers sequenced the exomes (protein-coding DNA regions) of 399 people—105 with schizophrenia plus their unaffected parents and siblings. Gene variations
that were found in a person with schizophrenia but not in either parent were considered spontaneous.

The likelihood of having a spontaneous mutation was associated with

  • the age of the father in both affected and unaffected siblings.

Significantly more mutations were found in people

  • whose fathers were 33-45 years at the time of conception compared to 19-28 years.

Among people with schizophrenia, the scientists identified

  • 54 genes with spontaneous mutations
  • predicted to cause damage to the function of the protein they encode.

The researchers used newly available database resources that show

  • where in the brain and when during development genes are expressed.

The genes form an interconnected expression network with many more connections than

  • that of the genes with spontaneous damaging mutations in unaffected siblings.

The spontaneously mutated genes in people with schizophrenia

  • were expressed in the prefrontal cortex, a region in the front of the brain.

The genes are known to be involved in important pathways in brain development. Fifty of these genes were active

  • mainly during the period of fetal development.

“Processes critical for the brain’s development can be revealed by the mutations that disrupt them,” King says. “Mutations can lead to loss of integrity of a whole pathway,
not just of a single gene.”

These findings support the concept that schizophrenia may result, in part, from

  • disruptions in development in the prefrontal cortex during fetal development.

James E. Darnell’s “Reflections”

A brief history of the discovery of RNA and its role in transcription — peppered with career advice
By Joseph P. Tiano

James Darnell begins his Journal of Biological Chemistry “Reflections” article by saying, “graduate students these days

  • have to swim in a sea virtually turgid with the daily avalanche of new information and
  • may be momentarily too overwhelmed to listen to the aging.

I firmly believe how we learned what we know can provide useful guidance for how and what a newcomer will learn.” Considering his remarkable discoveries in

  • RNA processing and eukaryotic transcriptional regulation

spanning 60 years of research, Darnell’s advice should be cherished. In his second year at medical school at Washington University School of Medicine in St. Louis, while
studying streptococcal disease in Robert J. Glaser’s laboratory, Darnell realized he “loved doing the experiments” and had his first “career advancement event.”
He and technician Barbara Pesch discovered that in vivo penicillin treatment killed streptococci only in the exponential growth phase and not in the stationary phase. These
results were published in the Journal of Clinical Investigation and earned Darnell an interview with Harry Eagle at the National Institutes of Health.

Darnell arrived at the NIH in 1956, shortly after Eagle  shifted his research interest to developing his minimal essential cell culture medium, still used. Eagle, then studying cell metabolism, suggested that Darnell take up a side project on poliovirus replication in mammalian cells in collaboration with Robert I. DeMars. DeMars’ Ph.D.
adviser was also James  Watson’s mentor, so Darnell met Watson, who invited him to give a talk at Harvard University, which led to an assistant professor position
at the MIT under Salvador Luria. A take-home message is to embrace side projects, because you never know where they may lead: this project helped to shape
his career.

Darnell arrived in Boston in 1961. Following the discovery of DNA’s structure in 1953, the world of molecular biology was turning to RNA in an effort to understand how
proteins are made. Darnell’s background in virology (it was discovered in 1960 that viruses used RNA to replicate) was ideal for the aim of his first independent lab:
exploring mRNA in animal cells grown in culture. While at MIT, he developed a new technique for purifying RNA along with making other observations

  • suggesting that nonribosomal cytoplasmic RNA may be involved in protein synthesis.

When Darnell moved to Albert Einstein College of Medicine for full professorship in 1964,  it was hypothesized that heterogenous nuclear RNA was a precursor to mRNA.
At Einstein, Darnell discovered RNA processing of pre-tRNAs and demonstrated for the first time

  • that a specific nuclear RNA could represent a possible specific mRNA precursor.

In 1967 Darnell took a position at Columbia University, and it was there that he discovered (simultaneously with two other labs) that

  • mRNA contained a polyadenosine tail.

The three groups all published their results together in the Proceedings of the National Academy of Sciences in 1971. Shortly afterward, Darnell made his final career move
four short miles down the street to Rockefeller University in 1974.

Over the next 35-plus years at Rockefeller, Darnell never strayed from his original research question: How do mammalian cells make and control the making of different
mRNAs? His work was instrumental in the collaborative discovery of

  • splicing in the late 1970s and
  • in identifying and cloning many transcriptional activators.

Perhaps his greatest contribution during this time, with the help of Ernest Knight, was

  • the discovery and cloning of the signal transducers and activators of transcription (STAT) proteins.

And with George Stark, Andy Wilks and John Krowlewski, he described

  • cytokine signaling via the JAK-STAT pathway.

Darnell closes his “Reflections” with perhaps his best advice: Do not get too wrapped up in your own work, because “we are all needed and we are all in this together.”

Darnell Reflections - James_Darnell

Darnell Reflections – James_Darnell

http://www.asbmb.org/assets/0/366/418/428/85528/85529/85530/8758cb87-84ff-42d6-8aea-96fda4031a1b.jpg

Recent findings on presenilins and signal peptide peptidase

By Dinu-Valantin Bălănescu

γ-secretase and SPP

γ-secretase and SPP

Fig. 1 from the minireview shows a schematic depiction of γ-secretase and SPP

http://www.asbmb.org/assets/0/366/418/428/85528/85529/85530/c2de032a-daad-41e5-ba19-87a17bd26362.png

GxGD proteases are a family of intramembranous enzymes capable of hydrolyzing

  • the transmembrane domain of some integral membrane proteins.

The GxGD family is one of the three families of

  • intramembrane-cleaving proteases discovered so far (along with the rhomboid and site-2 protease) and
  • includes the γ-secretase and the signal peptide peptidase.

Although only recently discovered, a number of functions in human pathology and in numerous other biological processes

  • have been attributed to γ-secretase and SPP.

Taisuke Tomita and Takeshi Iwatsubo of the University of Tokyo highlighted the latest findings on the structure and function of γ-secretase and SPP
in a recent minireview in The Journal of Biological Chemistry.

  • γ-secretase is involved in cleaving the amyloid-β precursor protein, thus producing amyloid-β peptide,

the main component of senile plaques in Alzheimer’s disease patients’ brains. The complete structure of mammalian γ-secretase is not yet known; however,
Tomita and Iwatsubo note that biochemical analyses have revealed it to be a multisubunit protein complex.

  • Its catalytic subunit is presenilin, an aspartyl protease.

In vitro and in vivo functional and chemical biology analyses have revealed that

  • presenilin is a modulator and mandatory component of the γ-secretase–mediated cleavage of APP.

Genetic studies have identified three other components required for γ-secretase activity:

  1. nicastrin,
  2. anterior pharynx defective 1 and
  3. presenilin enhancer 2.

By coexpression of presenilin with the other three components, the authors managed to

  • reconstitute γ-secretase activity.

Tomita and Iwatsubo determined using the substituted cysteine accessibility method and by topological analyses, that

  • the catalytic aspartates are located at the center of the nine transmembrane domains of presenilin,
  • by revealing the exact location of the enzyme’s catalytic site.

The minireview also describes in detail the formerly enigmatic mechanism of γ-secretase mediated cleavage.

SPP, an enzyme that cleaves remnant signal peptides in the membrane

  • during the biogenesis of membrane proteins and
  • signal peptides from major histocompatibility complex type I,
  • also is involved in the maturation of proteins of the hepatitis C virus and GB virus B.

Bioinformatics methods have revealed in fruit flies and mammals four SPP-like proteins,

  • two of which are involved in immunological processes.

By using γ-secretase inhibitors and modulators, it has been confirmed

  • that SPP shares a similar GxGD active site and proteolytic activity with γ-secretase.

Upon purification of the human SPP protein with the baculovirus/Sf9 cell system,

  • single-particle analysis revealed further structural and functional details.

HLA targeting efficiency correlates with human T-cell response magnitude and with mortality from influenza A infection

From www.pnas.org –  Sep 3, 2013 4:24 PM

Experimental and computational evidence suggests that

  • HLAs preferentially bind conserved regions of viral proteins, a concept we term “targeting efficiency,” and that
  • this preference may provide improved clearance of infection in several viral systems.

To test this hypothesis, T-cell responses to A/H1N1 (2009) were measured from peripheral blood mononuclear cells obtained from a household cohort study
performed during the 2009–2010 influenza season. We found that HLA targeting efficiency scores significantly correlated with

  • IFN-γ enzyme-linked immunosorbent spot responses (P = 0.042, multiple regression).

A further population-based analysis found that the carriage frequencies of the alleles with the lowest targeting efficiencies, A*24,

  • were associated with pH1N1 mortality (r = 0.37, P = 0.031) and
  • are common in certain indigenous populations in which increased pH1N1 morbidity has been reported.

HLA efficiency scores and HLA use are associated with CD8 T-cell magnitude in humans after influenza infection.
The computational tools used in this study may be useful predictors of potential morbidity and

  • identify immunologic differences of new variant influenza strains
  • more accurately than evolutionary sequence comparisons.

Population-based studies of the relative frequency of these alleles in severe vs. mild influenza cases

  • might advance clinical practices for severe H1N1 infections among genetically susceptible populations.

Metabolomics in drug target discovery

J D Rabinowitz et al.

Lewis-Sigler Institute for Integrative Genomics, Princeton University, Princeton, NJ.
Cold Spring Harbor Symposia on Quantitative Biology 11/2011; 76:235-46.
http://dx.doi.org:/10.1101/sqb.2011.76.010694 

Most diseases result in metabolic changes. In many cases, these changes play a causative role in disease progression. By identifying pathological metabolic changes,

  • metabolomics can point to potential new sites for therapeutic intervention.

Particularly promising enzymatic targets are those that

  • carry increased flux in the disease state.

Definitive assessment of flux requires the use of isotope tracers. Here we present techniques for

  • finding new drug targets using metabolomics and isotope tracers.

The utility of these methods is exemplified in the study of three different viral pathogens. For influenza A and herpes simplex virus,

  • metabolomic analysis of infected versus mock-infected cells revealed
  • dramatic concentration changes around the current antiviral target enzymes.

Similar analysis of human-cytomegalovirus-infected cells, however, found the greatest changes

  • in a region of metabolism unrelated to the current antiviral target.

Instead, it pointed to the tricarboxylic acid (TCA) cycle and

  • its efflux to feed fatty acid biosynthesis as a potential preferred target.

Isotope tracer studies revealed that cytomegalovirus greatly increases flux through

  • the key fatty acid metabolic enzyme acetyl-coenzyme A carboxylase.
  • Inhibition of this enzyme blocks human cytomegalovirus replication.

Examples where metabolomics has contributed to identification of anticancer drug targets are also discussed. Eventual proof of the value of

  • metabolomics as a drug target discovery strategy will be
  • successful clinical development of therapeutics hitting these new targets.

 Related References

Use of metabolic pathway flux information in targeted cancer drug design. Drug Discovery Today: Therapeutic Strategies 1:435-443, 2004.

Detection of resistance to imatinib by metabolic profiling: clinical and drug development implications. Am J Pharmacogenomics. 2005;5(5):293-302. Review. PMID: 16196499

Medicinal chemistry, metabolic profiling and drug target discovery: a role for metabolic profiling in reverse pharmacology and chemical genetics.
Mini Rev Med Chem.  2005 Jan;5(1):13-20. Review. PMID: 15638788 [PubMed – indexed for MEDLINE] Related citations

Development of Tracer-Based Metabolomics and its Implications for the Pharmaceutical Industry. Int J Pharm Med 2007; 21 (3): 217-224.

Use of metabolic pathway flux information in anticancer drug design. Ernst Schering Found Symp Proc. 2007;(4):189-203. Review. PMID: 18811058

Pharmacological targeting of glucagon and glucagon-like peptide 1 receptors has different effects on energy state and glucose homeostasis in diet-induced obese mice. J Pharmacol Exp Ther. 2011 Jul;338(1):70-81. http://dx.doi.org:/10.1124/jpet.111.179986. PMID: 21471191

Single valproic acid treatment inhibits glycogen and RNA ribose turnover while disrupting glucose-derived cholesterol synthesis in liver as revealed by the
[U-C(6)]-d-glucose tracer in mice. Metabolomics. 2009 Sep;5(3):336-345. PMID: 19718458

Metabolic Pathways as Targets for Drug Screening, Metabolomics, Dr Ute Roessner (Ed.), ISBN: 978-953-51-0046-1, InTech, Available from: http://www.intechopen.com/books/metabolomics/metabolic-pathways-as-targets-for-drug-screening

Iron regulates glucose homeostasis in liver and muscle via AMP-activated protein kinase in mice. FASEB J. 2013 Jul;27(7):2845-54.
http://dx.doi.org:/10.1096/fj.12-216929. PMID: 23515442

Metabolomics and systems pharmacology: why and how to model the human metabolic network for drug discovery

Drug Discov. Today 19 (2014), 171–182     http://dx.doi.org:/10.1016/j.drudis.2013.07.014

Highlights

  • We now have metabolic network models; the metabolome is represented by their nodes.
  • Metabolite levels are sensitive to changes in enzyme activities.
  • Drugs hitchhike on metabolite transporters to get into and out of cells.
  • The consensus network Recon2 represents the present state of the art, and has predictive power.
  • Constraint-based modelling relates network structure to metabolic fluxes.

Metabolism represents the ‘sharp end’ of systems biology, because changes in metabolite concentrations are

  • necessarily amplified relative to changes in the transcriptome, proteome and enzyme activities, which can be modulated by drugs.

To understand such behaviour, we therefore need (and increasingly have) reliable consensus (community) models of

  • the human metabolic network that include the important transporters.

Small molecule ‘drug’ transporters are in fact metabolite transporters, because

  • drugs bear structural similarities to metabolites known from the network reconstructions and
  • from measurements of the metabolome.

Recon2 represents the present state-of-the-art human metabolic network reconstruction; it can predict inter alia:

(i) the effects of inborn errors of metabolism;

(ii) which metabolites are exometabolites, and

(iii) how metabolism varies between tissues and cellular compartments.

However, even these qualitative network models are not yet complete. As our understanding improves

  • so do we recognise more clearly the need for a systems (poly)pharmacology.

Introduction – a systems biology approach to drug discovery

It is clearly not news that the productivity of the pharmaceutical industry has declined significantly during recent years

  • following an ‘inverse Moore’s Law’, Eroom’s Law, or
  • that many commentators, consider that the main cause of this is
  • because of an excessive focus on individual molecular target discovery rather than a more sensible strategy
  • based on a systems-level approach (Fig. 1).
drug discovery science

drug discovery science

Figure 1.

The change in drug discovery strategy from ‘classical’ function-first approaches (in which the assay of drug function was at the tissue or organism level),
with mechanistic studies potentially coming later, to more-recent target-based approaches where initial assays usually involve assessing the interactions
of drugs with specified (and often cloned, recombinant) proteins in vitro. In the latter cases, effects in vivo are assessed later, with concomitantly high levels of attrition.

Arguably the two chief hallmarks of the systems biology approach are:

(i) that we seek to make mathematical models of our systems iteratively or in parallel with well-designed ‘wet’ experiments, and
(ii) that we do not necessarily start with a hypothesis but measure as many things as possible (the ’omes) and

  • let the data tell us the hypothesis that best fits and describes them.

Although metabolism was once seen as something of a Cinderella subject,

  • there are fundamental reasons to do with the organisation of biochemical networks as
  • to why the metabol(om)ic level – now in fact seen as the ‘apogee’ of the ’omics trilogy –
  •  is indeed likely to be far more discriminating than are
  • changes in the transcriptome or proteome.

The next two subsections deal with these points and Fig. 2 summarises the paper in the form of a Mind Map.

metabolomics and systems pharmacology

metabolomics and systems pharmacology

http://ars.els-cdn.com/content/image/1-s2.0-S1359644613002481-gr2.jpg

Metabolic Disease Drug Discovery— “Hitting the Target” Is Easier Said Than Done

David E. Moller, et al.   http://dx.doi.org:/10.1016/j.cmet.2011.10.012

Despite the advent of new drug classes, the global epidemic of cardiometabolic disease has not abated. Continuing

  • unmet medical needs remain a major driver for new research.

Drug discovery approaches in this field have mirrored industry trends, leading to a recent

  • increase in the number of molecules entering development.

However, worrisome trends and newer hurdles are also apparent. The history of two newer drug classes—

  1. glucagon-like peptide-1 receptor agonists and
  2. dipeptidyl peptidase-4 inhibitors—

illustrates both progress and challenges. Future success requires that researchers learn from these experiences and

  • continue to explore and apply new technology platforms and research paradigms.

The global epidemic of obesity and diabetes continues to progress relentlessly. The International Diabetes Federation predicts an even greater diabetes burden (>430 million people afflicted) by 2030, which will disproportionately affect developing nations (International Diabetes Federation, 2011). Yet

  • existing drug classes for diabetes, obesity, and comorbid cardiovascular (CV) conditions have substantial limitations.

Currently available prescription drugs for treatment of hyperglycemia in patients with type 2 diabetes (Table 1) have notable shortcomings. In general,

Therefore, clinicians must often use combination therapy, adding additional agents over time. Ultimately many patients will need to use insulin—a therapeutic class first introduced in 1922. Most existing agents also have

  • issues around safety and tolerability as well as dosing convenience (which can impact patient compliance).

Pharmacometabolomics, also known as pharmacometabonomics, is a field which stems from metabolomics,

  • the quantification and analysis of metabolites produced by the body.

It refers to the direct measurement of metabolites in an individual’s bodily fluids, in order to

  • predict or evaluate the metabolism of pharmaceutical compounds, and
  • to better understand the pharmacokinetic profile of a drug.

Alternatively, pharmacometabolomics can be applied to measure metabolite levels

  • following the administration of a pharmaceutical compound, in order to
  • monitor the effects of the compound on certain metabolic pathways(pharmacodynamics).

This provides detailed mapping of drug effects on metabolism and

  • the pathways that are implicated in mechanism of variation of response to treatment.

In addition, the metabolic profile of an individual at baseline (metabotype) provides information about

  • how individuals respond to treatment and highlights heterogeneity within a disease state.

All three approaches require the quantification of metabolites found

relationship between -OMICS

relationship between -OMICS

http://upload.wikimedia.org/wikipedia/commons/thumb/e/eb/OMICS.png/350px-OMICS.png

Pharmacometabolomics is thought to provide information that

Looking at the characteristics of an individual down through these different levels of detail, there is an

  • increasingly more accurate prediction of a person’s ability to respond to a pharmaceutical compound.
  1. the genome, made up of 25 000 genes, can indicate possible errors in drug metabolism;
  2. the transcriptome, made up of 85,000 transcripts, can provide information about which genes important in metabolism are being actively transcribed;
  3. and the proteome, >10,000,000 members, depicts which proteins are active in the body to carry out these functions.

Pharmacometabolomics complements the omics with

  • direct measurement of the products of all of these reactions, but with perhaps a relatively
  • smaller number of members: that was initially projected to be approximately 2200 metabolites,

but could be a larger number when gut derived metabolites and xenobiotics are added to the list. Overall, the goal of pharmacometabolomics is

  • to more closely predict or assess the response of an individual to a pharmaceutical compound,
  • permitting continued treatment with the right drug or dosage
  • depending on the variations in their metabolism and ability to respond to treatment.

Pharmacometabolomic analyses, through the use of a metabolomics approach,

  • can provide a comprehensive and detailed metabolic profile or “metabolic fingerprint” for an individual patient.

Such metabolic profiles can provide a complete overview of individual metabolite or pathway alterations,

This approach can then be applied to the prediction of response to a pharmaceutical compound

  • by patients with a particular metabolic profile.

Pharmacometabolomic analyses of drug response are

Pharmacogenetics focuses on the identification of genetic variations (e.g. single-nucleotide polymorphisms)

  • within patients that may contribute to altered drug responses and overall outcome of a certain treatment.

The results of pharmacometabolomics analyses can act to “inform” or “direct”

  • pharmacogenetic analyses by correlating aberrant metabolite concentrations or metabolic pathways to potential alterations at the genetic level.

This concept has been established with two seminal publications from studies of antidepressants serotonin reuptake inhibitors

  • where metabolic signatures were able to define a pathway implicated in response to the antidepressant and
  • that lead to identification of genetic variants within a key gene
  • within the highlighted pathway as being implicated in variation in response.

These genetic variants were not identified through genetic analysis alone and hence

  • illustrated how metabolomics can guide and inform genetic data.

en.wikipedia.org/wiki/Pharmacometabolomics

Benznidazole Biotransformation and Multiple Targets in Trypanosoma cruzi Revealed by Metabolomics

Andrea Trochine, Darren J. Creek, Paula Faral-Tello, Michael P. Barrett, Carlos Robello
Published: May 22, 2014   http://dx.doi.org:/10.1371/journal.pntd.0002844

The first line treatment for Chagas disease, a neglected tropical disease caused by the protozoan parasite Trypanosoma cruzi,

  • involves administration of benznidazole (Bzn).

Bzn is a 2-nitroimidazole pro-drug which requires nitroreduction to become active. We used a

  • non-targeted MS-based metabolomics approach to study the metabolic response of T. cruzi to Bzn.

Parasites treated with Bzn were minimally altered compared to untreated trypanosomes, although the redox active thiols

  1. trypanothione,
  2. homotrypanothione and
  3. cysteine

were significantly diminished in abundance post-treatment. In addition, multiple Bzn-derived metabolites were detected after treatment.

These metabolites included reduction products, fragments and covalent adducts of reduced Bzn

  • linked to each of the major low molecular weight thiols:
  1. trypanothione,
  2. glutathione,
  3. g-glutamylcysteine,
  4. glutathionylspermidine,
  5. cysteine and
  6. ovothiol A.

Bzn products known to be generated in vitro by the unusual trypanosomal nitroreductase, TcNTRI,

  • were found within the parasites,
  • but low molecular weight adducts of glyoxal, a proposed toxic end-product of NTRI Bzn metabolism, were not detected.

Our data is indicative of a major role of the

  • thiol binding capacity of Bzn reduction products
  • in the mechanism of Bzn toxicity against T. cruzi.


Read Full Post »

Summary to Metabolomics

Summary to Metabolomics

Author and Curator: Larry H. Bernstein, MD, FCAP 

This concludes a long step-by-step journey into rediscovering biological processes from the genome as a framework to the remodeled and reconstituted cell through a number of posttranscription and posttranslation processes that modify the proteome and determine the metabolome.  The remodeling process continues over a lifetime. The process requires a balance between nutrient intake, energy utilization for work in the lean body mass, energy reserves, endocrine, paracrine and autocrine mechanisms, and autophagy.  It is true when we look at this in its full scope – What a creature is man?

http://masspec.scripps.edu/metabo_science/recommended_readings.php
 Recommended Readings and Historical Perspectives

Metabolomics is the scientific study of chemical processes involving metabolites. Specifically, metabolomics is the “systematic study of the unique chemical fingerprints that specific cellular processes leave behind”, the study of their small-molecule metabolite profiles.[1] The metabolome represents the collection of all metabolites in a biological cell, tissue, organ or organism, which are the end products of cellular processes.[2] mRNA gene expression data and proteomic analyses reveal the set of gene products being produced in the cell, data that represents one aspect of cellular function. Conversely, metabolic profiling can give an instantaneous snapshot of the physiology of that cell. One of the challenges of systems biology and functional genomics is to integrate proteomic, transcriptomic, and metabolomic information to provide a better understanding of cellular biology.

The term “metabolic profile” was introduced by Horning, et al. in 1971 after they demonstrated that gas chromatography-mass spectrometry (GC-MS) could be used to measure compounds present in human urine and tissue extracts. The Horning group, along with that of Linus Pauling and Arthur B. Robinson led the development of GC-MS methods to monitor the metabolites present in urine through the 1970s.

Concurrently, NMR spectroscopy, which was discovered in the 1940s, was also undergoing rapid advances. In 1974, Seeley et al. demonstrated the utility of using NMR to detect metabolites in unmodified biological samples.This first study on muscle highlighted the value of NMR in that it was determined that 90% of cellular ATP is complexed with magnesium. As sensitivity has improved with the evolution of higher magnetic field strengths and magic angle spinning, NMR continues to be a leading analytical tool to investigate metabolism. Efforts to utilize NMR for metabolomics have been influenced by the laboratory of Dr. Jeremy Nicholson at Birkbeck College, University of London and later at Imperial College London. In 1984, Nicholson showed 1H NMR spectroscopy could potentially be used to diagnose diabetes mellitus, and later pioneered the application of pattern recognition methods to NMR spectroscopic data.

In 2005, the first metabolomics web database, METLIN, for characterizing human metabolites was developed in the Siuzdak laboratory at The Scripps Research Institute and contained over 10,000 metabolites and tandem mass spectral data. As of September 2012, METLIN contains over 60,000 metabolites as well as the largest repository of tandem mass spectrometry data in metabolomics.

On 23 January 2007, the Human Metabolome Project, led by Dr. David Wishart of the University of Alberta, Canada, completed the first draft of the human metabolome, consisting of a database of approximately 2500 metabolites, 1200 drugs and 3500 food components. Similar projects have been underway in several plant species, most notably Medicago truncatula and Arabidopsis thaliana for several years.

As late as mid-2010, metabolomics was still considered an “emerging field”. Further, it was noted that further progress in the field depended in large part, through addressing otherwise “irresolvable technical challenges”, by technical evolution of mass spectrometry instrumentation.

Metabolome refers to the complete set of small-molecule metabolites (such as metabolic intermediates, hormones and other signaling molecules, and secondary metabolites) to be found within a biological sample, such as a single organism. The word was coined in analogy with transcriptomics and proteomics; like the transcriptome and the proteome, the metabolome is dynamic, changing from second to second. Although the metabolome can be defined readily enough, it is not currently possible to analyse the entire range of metabolites by a single analytical method. The first metabolite database(called METLIN) for searching m/z values from mass spectrometry data was developed by scientists at The Scripps Research Institute in 2005. In January 2007, scientists at the University of Alberta and the University of Calgary completed the first draft of the human metabolome. They catalogued approximately 2500 metabolites, 1200 drugs and 3500 food components that can be found in the human body, as reported in the literature. This information, available at the Human Metabolome Database (www.hmdb.ca) and based on analysis of information available in the current scientific literature, is far from complete.

Each type of cell and tissue has a unique metabolic ‘fingerprint’ that can elucidate organ or tissue-specific information, while the study of biofluids can give more generalized though less specialized information. Commonly used biofluids are urine and plasma, as they can be obtained non-invasively or relatively non-invasively, respectively. The ease of collection facilitates high temporal resolution, and because they are always at dynamic equilibrium with the body, they can describe the host as a whole.

Metabolites are the intermediates and products of metabolism. Within the context of metabolomics, a metabolite is usually defined as any molecule less than 1 kDa in size.
A primary metabolite is directly involved in the normal growth, development, and reproduction. A secondary metabolite is not directly involved in those processes.  By contrast, in human-based metabolomics, it is more common to describe metabolites as being either endogenous (produced by the host organism) or exogenous. Metabolites of foreign substances such as drugs are termed xenometabolites. The metabolome forms a large network of metabolic reactions, where outputs from one enzymatic chemical reaction are inputs to other chemical reactions.

Metabonomics is defined as “the quantitative measurement of the dynamic multiparametric metabolic response of living systems to pathophysiological stimuli or genetic modification”. The word origin is from the Greek μεταβολή meaning change and nomos meaning a rule set or set of laws. This approach was pioneered by Jeremy Nicholson at Imperial College London and has been used in toxicology, disease diagnosis and a number of other fields. Historically, the metabonomics approach was one of the first methods to apply the scope of systems biology to studies of metabolism.

There is a growing consensus that ‘metabolomics’ places a greater emphasis on metabolic profiling at a cellular or organ level and is primarily concerned with normal endogenous metabolism. ‘Metabonomics’ extends metabolic profiling to include information about perturbations of metabolism caused by environmental factors (including diet and toxins), disease processes, and the involvement of extragenomic influences, such as gut microflora. This is not a trivial difference; metabolomic studies should, by definition, exclude metabolic contributions from extragenomic sources, because these are external to the system being studied.

Toxicity assessment/toxicology. Metabolic profiling (especially of urine or blood plasma samples) detects the physiological changes caused by toxic insult of a chemical (or mixture of chemicals).

Functional genomics. Metabolomics can be an excellent tool for determining the phenotype caused by a genetic manipulation, such as gene deletion or insertion. Sometimes this can be a sufficient goal in itself—for instance, to detect any phenotypic changes in a genetically-modified plant intended for human or animal consumption. More exciting is the prospect of predicting the function of unknown genes by comparison with the metabolic perturbations caused by deletion/insertion of known genes.

Nutrigenomics is a generalised term which links genomics, transcriptomics, proteomics and metabolomics to human nutrition. In general a metabolome in a given body fluid is influenced by endogenous factors such as age, sex, body composition and genetics as well as underlying pathologies. The large bowel microflora are also a very significant potential confounder of metabolic profiles and could be classified as either an endogenous or exogenous factor. The main exogenous factors are diet and drugs. Diet can then be broken down to nutrients and non- nutrients.

http://en.wikipedia.org/wiki/Metabolomics

Jose Eduardo des Salles Roselino

The problem with genomics was it was set as explanation for everything. In fact, when something is genetic in nature the genomic reasoning works fine. However, this means whenever an inborn error is found and only in this case the genomic knowledge afterwards may indicate what is wrong and not the completely way to put biology upside down by reading everything in the DNA genetic as well as non-genetic problems.

Coordination of the transcriptome and metabolome by the circadian clock PNAS 2012

Coordination of the transcriptome and metabolome by the circadian clock PNAS 2012

analysis of metabolomic data and differential metabolic regulation for fetal lungs, and maternal blood plasma

conformational changes leading to substrate efflux.img

conformational changes leading to substrate efflux.img

The cellular response is defined by a network of chemogenomic response signatures.

The cellular response is defined by a network of chemogenomic response signatures.

Dynamic Construct of the –Omics

Dynamic Construct of the –Omics

 genome cartoon

genome cartoon

central dogma phenotype

central dogma phenotype

Read Full Post »

Older Posts »