Funding, Deals & Partnerships: BIOLOGICS & MEDICAL DEVICES; BioMed e-Series; Medicine and Life Sciences Scientific Journal – http://PharmaceuticalIntelligence.com
Rare earth-doped nanoparticles applications in biological imaging and tumor treatment
Reporter: Irina Robu, PhD
Bioimaging aims to interfere as little as possible with life processes and can be used to gain information on the 3-D structure of the observed specimen from the outside. Bioimaging ranges from the observation of subcellular structures and the entire cells over tissues up to entire multicellular organisms. The technology uses light, fluorescence, ultrasound, X-ray, magnetic resonance as sources of imaging. The more common imaging is fluorescence imaging which is used to monitor the dynamic interaction between the drug molecules and tumor cells and the ability to monitor the real time dynamic process in biological tissues.
Researchers from the Xi’an Institute of Optics and Precision Mechanics (XIOPM) of the Chinese Academy of Sciences (CAS) described the recent progress they made in the rare earth-doped nanoparticles in the field of bio-engineering and tumor treatment. It is well known that producing small nanoparticles with good dispersion and exploitable optical coherence properties is highly challenging. According to them, these rare earth-doped nanoparticles can be vested with additional capabilities such as water solubility, biocompatibility, drug-loading ability and the target ability for different tumors by surface functionalization. The luminescent properties and structure design were also looked at.
According to the Chinese researchers, for applying the RE-doped NPs to the diagnosis and treatment of tumors, their first goal is to improve water solubility and biocompatibility. The second goal would be to give the nanoparticles the ability to target tumors by surface functionalization. Lastly, biocompatible water-soluble tumor-targeting NPs can be used as carriers to load drugs for treatment of tumor cells. All things considered, the recent research progress on the development of fluorescence intensity of NPs, surface modification, and tumor targeted diagnosis and treatment has also been emphasized.
The cardiovascular team at SSM Health Cardinal Glennon Children’s Hospital found a solution for better surgical planning using 3D printing. As a pediatric center, Glennon Children’s Hospital deals with the most complex patients, which requires surgeries within days or weeks of birth. According to the center, one of the pediatric patients was an infant diagnosed in utero via fetal ultrasound with an unusual form of switch of great arteries. Deoxygenated blue blood entered the right atrium which connected to the left ventricle, then to the aorta and the oxygenated red blood entered the left atrium which connects to the right ventricle and then to the pulmonary artery. The pediatric patients had a very large ventricular septal defect connecting both ventricles and severe narrowing between the left ventricle and the aorta.
It is obvious that the patient was fairly blue as deoxygenated blood was directed toward the aorta. The balloon atrial septostomy made in the first few days of life. Yet, the tachycardia persisted. The surgical team from SSM Health Cardinal Glennon Children’s Hospital, led by Charles Huddleston, MD used 3D printing to identify the anatomy of the patient clearly and provided them with the ability to repair the mitral valve. It seems that the neonatal atrial switch appeared to be the best plan, even if the operation proved challenging.
The team knew that they could go into the procedure knowing that the tissue can be safely removed without damage to the mitral valve. The team was able to show that the 3D model was essential in determining the optimal surgical approach and with the help of the 3D printed heart model, the neonatal atrial switch, the VSD closure and the subaortic stenosis resection was performed effectively on a 20-day infant. The surgery allowed the mitral valve function to remain intact. The pediatric patient cardiac function improved gradually and is expected to have an excellent recovery.
3D printing is a fabrication technique used to transform digital objects into physical models, which builds structures of arbitrary geometry by depositing material in successive layers on the basis of specific digital design. Even though, the use of 3D bioprinting in cardiovascular medicine is relatively new development, advancement within this discipline is occurring at such a rapid rate. Most cardiologists believed the costs would be too high for routine use such that the price tag was better for academic applications.
Now as the prices are starting to lower, the idea of using 3D printed models of organs vessels and tissue manufactured based on CT, MRI and echocardiography might be beneficial according to Dr. Fadi Matar, professor at University of South Florida. He and his cardiology colleagues use 3D printed models to allow them to view patient’s complex anatomies before deciding what treatments to pursue. The models allow them to calculate the size and exact placement of devices which has led to shorter procedure time and better outcome.
In a study published in Academic Radiology, David Ballard, professor at University School of Medicine appraised the costs of setting up a 3D printing lab including the commercial printer plus software, lab space, materials and staffing. According to Ballard’s team, the commercial printers start at $12,000 but can be as high as high as $500,000.
According to American Medical Association-approved Category III Current Procedural Terminology (CPT) codes allows cardiology relief from setting up a new 3D printing lab such as Codes 0559T and 0560T, for individually prepared 3D-printed anatomical models with one or more components (including arteries and veins) and Codes 0561T and 0562T, which are for the production of personalized 3D-printed cutting or drilling tools that use patient imaging data and often are used to guide or facilitate surgery.
These codes have been met with enthusiasm by teams eyeing 3D printing, but there are noteworthy limitations to Category III codes—which are temporary codes describing emerging technologies, services and procedures that are used for tracking effectiveness data. It is important to note that Category III codes are not reimbursed but often are a step toward reimbursement.
New and improved materials also might lead to a sharper focus on 3D printing in cardiology. Dr. Fadi Matar says companies are working on materials that better mimic elements of the heart. Such “mimicry” ought to enhance the value of 3D-printed models since they will give cardiologists more realistic insights into how specific devices will interact with an individual patient’s heart. Even with the complex modalities of using 3D bioprinting, in time there would be less obstacles to being able to set up a 3D bioprinter lab.
Group of Researchers @ University of California, Riverside, the University of Chicago, the U.S. Department of Energy’s Argonne National Laboratory, and Northwestern University solve COVID-19 Structure and Map Potential Therapeutics
Reporters: Stephen J Williams, PhD and Aviva Lev-Ari, PhD, RN
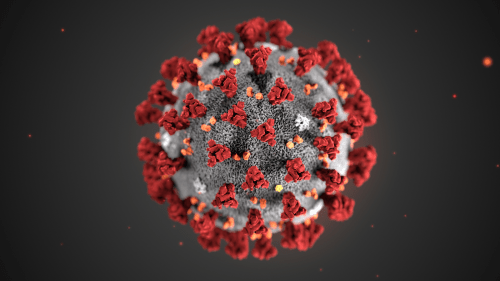
This illustration, created at the Centers for Disease Control and Prevention (CDC), reveals ultrastructural morphology exhibited by coronaviruses. Note the spikes that adorn the outer surface of the virus, which impart the look of a corona surrounding the virion, when viewed electron microscopically. A novel coronavirus virus was identified as the cause of an outbreak of respiratory illness first detected in Wuhan, China in 2019.
Image of newly mapped coronavirus protein, called Nsp15, which helps the virus replicate.
How UC is responding to the coronavirus (COVID-19)
The University of California is vigilantly monitoring and responding to new information about the coronavirus (COVID-19) outbreak, which has been declared a global health emergency.
The 3-D structure of a potential drug target in a newly mapped protein of COVID-19, or coronavirus, has been solved by a team of researchers from the University of California, Riverside, the University of Chicago, the U.S. Department of Energy’s Argonne National Laboratory, and Northwestern University.
The scientists said their findings suggest drugs previously developed to treat the earlier SARS outbreak could now be developed as effective drugs against COVID-19.
The initial genome analysis and design of constructs for protein synthesis were performed by the bioinformatic group of Adam Godzik, a professor of biomedical sciences at the UC Riverside School of Medicine.
The protein Nsp15 from Severe Acute Respiratory Syndrome Coronavirus 2, or SARS-CoV-2, is 89% identical to the protein from the earlier outbreak of SARS-CoV. SARS-CoV-2 is responsible for the current outbreak of COVID-19. Studies published in 2010 on SARS-CoV revealed inhibition of Nsp15 can slow viral replication.This suggests drugs designed to target Nsp15 could be developed as effective drugs against COVID-19.
Adam Godzik, UC Riverside professor of biomedical sciences Credit: Sanford Burnham Prebys Medical Discovery Institute
“While the SARS-CoV-19 virus is very similar to the SARS virus that caused epidemics in 2003, new structures shed light on the small, but potentially important differences between the two viruses that contribute to the different patterns in the spread and severity of the diseases they cause,” Godzik said.
The structure of Nsp15, which will be released to the scientific community on March 4, was solved by the group of Andrzej Joachimiak, a distinguished fellow at the Argonne National Laboratory, University of Chicago Professor, and Director of the Structural Biology Center at Argonne’s Advanced Photon Source, a Department of Energy Office of Science user facility.
“Nsp15 is conserved among coronaviruses and is essential in their lifecycle and virulence,” Joachimiak said. “Initially, Nsp15 was thought to directly participate in viral replication, but more recently, it was proposed to help the virus replicate possibly by interfering with the host’s immune response.”
Mapping a 3D protein structure of the virus, also called solving the structure, allows scientists to figure out how to interfere in the pathogen’s replication in human cells.
“The Nsp15 protein has been investigated in SARS as a novel target for new drug development, but that never went very far because the SARS epidemic went away, and all new drug development ended,” said Karla Satchell, a professor of microbiology-immunology at Northwestern, who leads the international team of scientists investigating the structure of the SARS CoV-2 virus to understand how to stop it from replicating. “Some inhibitors were identified but never developed into drugs. The inhibitors that were developed for SARS now could be tested against this protein.”
Rapid upsurge and proliferation of SARS-CoV-2 raised questions about how this virus could become so much more transmissible as compared to the SARS and MERS coronaviruses. The scientists are mapping the proteins to address this issue.
Over the past two months, COVID-19 infected more than 80,000 people and caused at least 2,700 deaths. Although currently mainly concentrated in China, the virus is spreading worldwide and has been found in 46 countries. Millions of people are being quarantined, and the epidemic has impacted the world economy. There is no existing drug for this disease, but various treatment options, such as utilizing medicines effective in other viral ailments, are being attempted.
Godzik, Satchell, and Joachimiak — along with the entire center team — will map the structure of some of the 28 proteins in the virus in order to see where drugs can throw a chemical monkey wrench into its machinery. The proteins are folded globular structures with precisely defined functions and their “active sites” can be targeted with chemical compounds.
The first step is to clone and express the genes of the virus proteins and grow them as protein crystals in miniature ice cube-like trays. The consortium includes nine labs across eight institutions that will participate in this effort.
Above is a modified version of the Northwestern University news release written by Marla Paul.
3D printing is a technique that has gained immense popularity for its ability to create 3D structures in art, jewelry, engineering, medicine. In this case, radiologists use 3D printing to transform a 2D scan into 3D visualization of a patient’s anatomy. Radiologists use their unique skills to visualize the anatomy of the organs of interest which give them a large advantage in communicating with patients as well as surgical teams.
The 3D printed anatomical models have proved valuable in providing a better understanding of complex anatomies and being used as a tangible aid for pre-surgical planning. It gives the patient a clear understanding of what is happening and it provides a great value when it comes to patient specific care. However, 3D modelling is essential at the beginning but it can also be a useful tool for surgeons. The list of medical 3D printing benefits is infinite. Just recently, a scientific team at University of Minnesota constructed their own patient specific 3D organ model based on MRI scans and prostate tissue samples of patients. The organs allow surgeons to plan and rehearse surgery.
In addition to researchers at University of Minnesota, Siemens Health engineers also created a platform to make medical apps that can be accessible throughout hospitals. In addition, Siemens Health partnered up with Materialise to make 3D printing software an integral part of the radiology workflow.
Hence, using 3D bioprinting is a desirable path to follow for radiologist. Not only they get to interpret anatomy, but now they can use 3D bioprinting as a state of the art tool that empower them to provide immense value to an audience that stretches from patient to practitioner.
The impact of Machine Learning (ML) and Artificial Intelligence (AI) during the last decade has been tremendous. With the rise of infobesity, ML/AI is evolving to an essential capability to help mine the sheer volume of patient genomics, omics, sensor/wearables and real-world data, and unravel the knot of healthcare’s most complex questions.
Despite the advancements in technology, organizations struggle to prioritize and implement ML/AI to achieve the anticipated value, whilst managing the disruption that comes with it. In this session, panelists will discuss ML/AI implementation and adoption strategies that work. Panelists will draw upon their experiences as they share their success stories, discuss how to implement digital diagnostics, track disease progression and treatment, and increase commercial value and ROI compared against traditional approaches.
most of trials which are done are still in training AI/ML algorithms with training data sets. The best results however have been about 80% accuracy in training sets. Needs to improve
All data sets can be biased. For example a professor was looking at heartrate using a IR detector on a wearable but it wound up that different types of skin would generate a different signal to the detector so training sets maybe population biases (you are getting data from one group)
clinical grade equipment actually haven’t been trained on a large set like commercial versions of wearables, Commercial grade is tested on a larger study population. This can affect the AI/ML algorithms.
Regulations: The regulatory bodies responsible is up to debate. Whether FDA or FTC is responsible for AI/ML in healtcare and healthcare tech and IT is not fully decided yet. We don’t have the guidances for these new technologies
some rules: never use your own encryption always use industry standards especially when getting personal data from wearables. One hospital corrupted their system because their computer system was not up to date and could not protect against a virus transmitted by a wearable.
pharma companies understand they need to increase value of their products so very interested in how AI/ML can be used.
Please follow LIVE on TWITTER using the following @ handles and # hashtags:
Diabetes is a life-long condition where your body does not produce enough insulin (Type 1) or your body cannot use the insulin it has effectively. Since there is no cure for diabetes, the artificial pancreas system comes as a relief for patients that are suffering with this disease.
The artificial pancreas, MiniMed 670G hybrid closed loop system designed by Medtronic is the first FDA-approved device that measures glucose levels and delivers the appropriate dose of basal insulin. The system comprises Medtronic’s MiniMed 670G insulin pump that is strapped to the body, an infusion patch that delivers insulin via catheter from the pump and a sensor which measures glucose levels under the skin and can be worn for 7 days at a time. While the device regulates basal, or background, insulin, patients must still manually request bolus insulin at mealtimes.
The device is intended for people age 14 or older with Type 1 diabetes and is intended to regulate insulin levels with “little to no input” from the patient. The artificial pancreas measures blood sugar levels using a constant glucose monitor (CGM) and communicates the information to an insulin pump which calculates and releases the required amount of insulin into the body, just as the pancreas does in people without diabetes.
The 2016 FDA approval was done in just three months which is a record for any medical device. The agency evaluated data from a clinical trial in which 123 patients with Type 1 diabetes used the system’s hybrid closed-loop feature as repeatedly during a three-month period. The trial presented the device to be safe for use in those 14 and older, showing no serious adverse events. The system is on sale since spring 2017.
While further clinical research is needed to ensure that the strength of the device in different settings is consistent, several researchers support the view that “artificial pancreas systems are a safe and effective treatment approach for people with type 1 diabetes. Medtronic counts this device as a step toward a fully automated, closed-loop system.
Extracellular RNA and their carriers in disease diagnosis and therapy, Volume 2 (Volume Two: Latest in Genomics Methodologies for Therapeutics: Gene Editing, NGS and BioInformatics, Simulations and the Genome Ontology), Part 1: Next Generation Sequencing (NGS)
Reporter and Curator: Dr. Sudipta Saha, Ph.D.
RNA plays various roles in determining how the information in our genes drives cell behavior. One of its roles is to carry information encoded by our genes from the cell nucleus to the rest of the cell where it can be acted on by other cell components. Rresearchers have now defined how RNA also participates in transmitting information outside cells, known as extracellular RNA or exRNA. This new role of RNA in cell-to-cell communication has led to new discoveries of potential disease biomarkers and therapeutic targets. Cells using RNA to talk to each other is a significant shift in the general thought process about RNA biology.
Researchers explored basic exRNA biology, including how exRNA molecules and their transport packages (or carriers) were made, how they were expelled by producer cells and taken up by target cells, and what the exRNA molecules did when they got to their destination. They encountered surprising complexity both in the types of carriers that transport exRNA molecules between cells and in the different types of exRNA molecules associated with the carriers. The researchers had to be exceptionally creative in developing molecular and data-centric tools to begin making sense of the complexity, and found that the type of carrier affected how exRNA messages were sent and received.
As couriers of information between cells, exRNA molecules and their carriers give researchers an opportunity to intercept exRNA messages to see if they are associated with disease. If scientists could change or engineer designer exRNA messages, it may be a new way to treat disease. The researchers identified potential exRNA biomarkers for nearly 30 diseases including cardiovascular disease, diseases of the brain and central nervous system, pregnancy complications, glaucoma, diabetes, autoimmune diseases and multiple types of cancer.
As for example some researchers found that exRNA in urine showed promise as a biomarker of muscular dystrophy where current studies rely on markers obtained through painful muscle biopsies. Some other researchers laid the groundwork for exRNA as therapeutics with preliminary studies demonstrating how researchers might load exRNA molecules into suitable carriers and target carriers to intended recipient cells, and determining whether engineered carriers could have adverse side effects. Scientists engineered carriers with designer RNA messages to target lab-grown breast cancer cells displaying a certain protein on their surface. In an animal model of breast cancer with the cell surface protein, the researchers showed a reduction in tumor growth after engineered carriers deposited their RNA cargo.
Other than the above research work the scientists also created a catalog of exRNA molecules found in human biofluids like plasma, saliva and urine. They analyzed over 50,000 samples from over 2000 donors, generating exRNA profiles for 13 biofluids. This included over 1000 exRNA profiles from healthy volunteers. The researchers found that exRNA profiles varied greatly among healthy individuals depending on characteristics like age and environmental factors like exercise. This means that exRNA profiles can give important and detailed information about health and disease, but careful comparisons need to be made with exRNA data generated from people with similar characteristics.
Next the researchers will develop tools to efficiently and reproducibly isolate, identify and analyze different carrier types and their exRNA cargos and allow analysis of one carrier and its cargo at a time. These tools will be shared with the research community to fill gaps in knowledge generated till now and to continue to move this field forward.
A Nonlinear Methodology to Explain Complexity of the Genome and Bioinformatic Information, Volume 2 (Volume Two: Latest in Genomics Methodologies for Therapeutics: Gene Editing, NGS and BioInformatics, Simulations and the Genome Ontology), Part 1: Next Generation Sequencing (NGS)
A Nonlinear Methodology to Explain Complexity of the Genome and Bioinformatic Information
Reporter: Stephen J. Williams, Ph.D.
Multifractal bioinformatics: A proposal to the nonlinear interpretation of genome
The following is an open access article by Pedro Moreno on a methodology to analyze genetic information across species and in particular, the evolutionary trends of complex genomes, by a nonlinear analytic approach utilizing fractal geometry, coined “Nonlinear Bioinformatics”. This fractal approach stems from the complex nature of higher eukaryotic genomes including mosaicism, multiple interdispersed genomic elements such as intronic regions, noncoding regions, and also mobile elements such as transposable elements. Although seemingly random, there exists a repetitive nature of these elements. Such complexity of DNA regulation, structure and genomic variation is felt best understood by developing algorithms based on fractal analysis, which can best model the regionalized and repetitive variability and structure within complex genomes by elucidating the individual components which contributes to an overall complex structure rather than using a “linear” or “reductionist” approach looking at individual coding regions, which does not take into consideration the aforementioned factors leading to genetic complexity and diversity.
Indeed, many other attempts to describe the complexities of DNA as a fractal geometric pattern have been described. In a paper by Carlo Cattani “Fractals and Hidden Symmetries in DNA“, Carlo uses fractal analysis to construct a simple geometric pattern of the influenza A virus by modeling the primary sequence of this viral DNA, namely the bases A,G,C, and T. The main conclusions that
fractal shapes and symmetries in DNA sequences and DNA walks have been shown and compared with random and deterministic complex series. DNA sequences are structured in such a way that there exists some fractal behavior which can be observed both on the correlation matrix and on the DNA walks. Wavelet analysis confirms by a symmetrical clustering of wavelet coefficients the existence of scale symmetries.
suggested that, at least, the viral influenza genome structure could be analyzed into its basic components by fractal geometry.
This approach has been used to model the complex nature of cancer as discussed in a 2011 Seminars in Oncology paper
Abstract: Cancer is a highly complex disease due to the disruption of tissue architecture. Thus, tissues, and not individual cells, are the proper level of observation for the study of carcinogenesis. This paradigm shift from a reductionist approach to a systems biology approach is long overdue. Indeed, cell phenotypes are emergent modes arising through collective non-linear interactions among different cellular and microenvironmental components, generally described by “phase space diagrams”, where stable states (attractors) are embedded into a landscape model. Within this framework, cell states and cell transitions are generally conceived as mainly specified by gene-regulatory networks. However, the system s dynamics is not reducible to the integrated functioning of the genome-proteome network alone; the epithelia-stroma interacting system must be taken into consideration in order to give a more comprehensive picture. Given that cell shape represents the spatial geometric configuration acquired as a result of the integrated set of cellular and environmental cues, we posit that fractal-shape parameters represent “omics descriptors of the epithelium-stroma system. Within this framework, function appears to follow form, and not the other way around.
As authors conclude
” Transitions from one phenotype to another are reminiscent of phase transitions observed in physical systems. The description of such transitions could be obtained by a set of morphological, quantitative parameters, like fractal measures. These parameters provide reliable information about system complexity. “
the authors describe that gene expression networks display time series display fractal and long-range dependence characteristics.
Abstract: Gene expression is a vital process through which cells react to the environment and express functional behavior. Understanding the dynamics of gene expression could prove crucial in unraveling the physical complexities involved in this process. Specifically, understanding the coherent complex structure of transcriptional dynamics is the goal of numerous computational studies aiming to study and finally control cellular processes. Here, we report the scaling properties of gene expression time series in Escherichia coliand Saccharomyces cerevisiae. Unlike previous studies, which report the fractal and long-range dependency of DNA structure, we investigate the individual gene expression dynamics as well as the cross-dependency between them in the context of gene regulatory network. Our results demonstrate that the gene expression time series display fractal and long-range dependence characteristics. In addition, the dynamics between genes and linked transcription factors in gene regulatory networks are also fractal and long-range cross-correlated. The cross-correlation exponents in gene regulatory networks are not unique. The distribution of the cross-correlation exponents of gene regulatory networks for several types of cells can be interpreted as a measure of the complexity of their functional behavior.
Given that multitude of complex biomolecular networks and biomolecules can be described by fractal patterns, the development of bioinformatic algorithms would enhance our understanding of the interdependence and cross funcitonality of these mutiple biological networks, particularly in disease and drug resistance. The article below by Pedro Moreno describes the development of such bioinformatic algorithms.
Pedro A. Moreno
Escuela de Ingeniería de Sistemas y Computación, Facultad de Ingeniería, Universidad del Valle, Cali, Colombia
E-mail: pedro.moreno@correounivalle.edu.co
Eje temático: Ingeniería de sistemas / System engineering
Recibido: 19 de septiembre de 2012
Aceptado: 16 de diciembre de 2013
Abstract
The first draft of the human genome (HG) sequence was published in 2001 by two competing consortia. Since then, several structural and functional characteristics for the HG organization have been revealed. Today, more than 2.000 HG have been sequenced and these findings are impacting strongly on the academy and public health. Despite all this, a major bottleneck, called the genome interpretation persists. That is, the lack of a theory that explains the complex puzzles of coding and non-coding features that compose the HG as a whole. Ten years after the HG sequenced, two recent studies, discussed in the multifractal formalism allow proposing a nonlinear theory that helps interpret the structural and functional variation of the genetic information of the genomes. The present review article discusses this new approach, called: “Multifractal bioinformatics”.
Keywords: Omics sciences, bioinformatics, human genome, multifractal analysis.
1. Introduction
Omic Sciences and Bioinformatics
In order to study the genomes, their life properties and the pathological consequences of impairment, the Human Genome Project (HGP) was created in 1990. Since then, about 500 Gpb (EMBL) represented in thousands of prokaryotic genomes and tens of different eukaryotic genomes have been sequenced (NCBI, 1000 Genomes, ENCODE). Today, Genomics is defined as the set of sciences and technologies dedicated to the comprehensive study of the structure, function and origin of genomes. Several types of genomic have arisen as a result of the expansion and implementation of genomics to the study of the Central Dogma of Molecular Biology (CDMB), Figure 1 (above). The catalog of different types of genomics uses the Latin suffix “-omic” meaning “set of” to mean the new massive approaches of the new omics sciences (Moreno et al, 2009). Given the large amount of genomic information available in the databases and the urgency of its actual interpretation, the balance has begun to lean heavily toward the requirements of bioinformatics infrastructure research laboratories Figure 1 (below).
The bioinformatics or Computational Biology is defined as the application of computer and information technology to the analysis of biological data (Mount, 2004). An interdisciplinary science that requires the use of computing, applied mathematics, statistics, computer science, artificial intelligence, biophysical information, biochemistry, genetics, and molecular biology. Bioinformatics was born from the need to understand the sequences of nucleotide or amino acid symbols that make up DNA and proteins, respectively. These analyzes are made possible by the development of powerful algorithms that predict and reveal an infinity of structural and functional features in genomic sequences, as gene location, discovery of homologies between macromolecules databases (Blast), algorithms for phylogenetic analysis, for the regulatory analysis or the prediction of protein folding, among others. This great development has created a multiplicity of approaches giving rise to new types of Bioinformatics, such as Multifractal Bioinformatics (MFB) that is proposed here.
1.1 Multifractal Bioinformatics and Theoretical Background
MFB is a proposal to analyze information content in genomes and their life properties in a non-linear way. This is part of a specialized sub-discipline called “nonlinear Bioinformatics”, which uses a number of related techniques for the study of nonlinearity (fractal geometry, Hurts exponents, power laws, wavelets, among others.) and applied to the study of biological problems (http://pharmaceuticalintelligence.com/tag/fractal-geometry/). For its application, we must take into account a detailed knowledge of the structure of the genome to be analyzed and an appropriate knowledge of the multifractal analysis.
1.2 From the Worm Genome toward Human Genome
To explore a complex genome such as the HG it is relevant to implement multifractal analysis (MFA) in a simpler genome in order to show its practical utility. For example, the genome of the small nematode Caenorhabditis elegans is an excellent model to learn many extrapolated lessons of complex organisms. Thus, if the MFA explains some of the structural properties in that genome it is expected that this same analysis reveals some similar properties in the HG.
The C. elegans nuclear genome is composed of about 100 Mbp, with six chromosomes distributed into five autosomes and one sex chromosome. The molecular structure of the genome is particularly homogeneous along with the chromosome sequences, due to the presence of several regular features, including large contents of genes and introns of similar sizes. The C. elegans genome has also a regional organization of the chromosomes, mainly because the majority of the repeated sequences are located in the chromosome arms, Figure 2 (left) (C. elegans Sequencing Consortium, 1998). Given these regular and irregular features, the MFA could be an appropriate approach to analyze such distributions.
Meanwhile, the HG sequencing revealed a surprising mosaicism in coding (genes) and noncoding (repetitive DNA) sequences, Figure 2 (right) (Venter et al., 2001). This structure of 6 Gbp is divided into 23 pairs of chromosomes (diploid cells) and these highly regionalized sequences introduce complex patterns of regularity and irregularity to understand the gene structure, the composition of sequences of repetitive DNA and its role in the study and application of life sciences. The coding regions of the genome are estimated at ~25,000 genes which constitute 1.4% of GH. These genes are involved in a giant sea of various types of non-coding sequences which compose 98.6% of HG (misnamed popularly as “junk DNA”). The non-coding regions are characterized by many types of repeated DNA sequences, where 10.6% consists of Alu sequences, a type of SINE (short and dispersed repeated elements) sequence and preferentially located towards the genes. LINES, MIR, MER, LTR, DNA transposons and introns are another type of non-coding sequences which form about 86% of the genome. Some of these sequences overlap with each other; as with CpG islands, which complicates the analysis of genomic landscape. This standard genomic landscape was recently clarified, the last studies show that 80.4% of HG is functional due to the discovery of more than five million “switches” that operate and regulate gene activity, re-evaluating the concept of “junk DNA”. (The ENCODE Project Consortium, 2012).
Given that all these genomic variations both in worm and human produce regionalized genomic landscapes it is proposed that Fractal Geometry (FG) would allow measuring how the genetic information content is fragmented. In this paper the methodology and the nonlinear descriptive models for each of these genomes will be reviewed.
1.3 The MFA and its Application to Genome Studies
Most problems in physics are implicitly non-linear in nature, generating phenomena such as chaos theory, a science that deals with certain types of (non-linear) but very sensitive dynamic systems to initial conditions, nonetheless of deterministic rigor, that is that their behavior can be completely determined by knowing initial conditions (Peitgen et al, 1992). In turn, the FG is an appropriate tool to study the chaotic dynamic systems (CDS). In other words, the FG and chaos are closely related because the space region toward which a chaotic orbit tends asymptotically has a fractal structure (strange attractors). Therefore, the FG allows studying the framework on which CDS are defined (Moon, 1992). And this is how it is expected for the genome structure and function to be organized.
The MFA is an extension of the FG and it is related to (Shannon) information theory, disciplines that have been very useful to study the information content over a sequence of symbols. Initially, Mandelbrot established the FG in the 80’s, as a geometry capable of measuring the irregularity of nature by calculating the fractal dimension (D), an exponent derived from a power law (Mandelbrot, 1982). The value of the D gives us a measure of the level of fragmentation or the information content for a complex phenomenon. That is because the D measures the scaling degree that the fragmented self-similarity of the system has. Thus, the FG looks for self-similar properties in structures and processes at different scales of resolution and these self-similarities are organized following scaling or power laws.
Sometimes, an exponent is not sufficient to characterize a complex phenomenon; so more exponents are required. The multifractal formalism allows this, and applies when many subgroups of fractals with different scalar properties with a large number of exponents or fractal dimensions coexist simultaneously. As a result, when a spectrum of multifractal singularity measurement is generated, the scaling behavior of the frequency of symbols of a sequence can be quantified (Vélez et al, 2010).
The MFA has been implemented to study the spatial heterogeneity of theoretical and experimental fractal patterns in different disciplines. In post-genomics times, the MFA was used to study multiple biological problems (Vélez et al, 2010). Nonetheless, very little attention has been given to the use of MFA to characterize the content of the structural genetic information of the genomes obtained from the images of the Chaos Representation Game (CRG). First studies at this level were made recently to the analysis of the C. elegans genome (Vélez et al, 2010) and human genomes (Moreno et al, 2011). The MFA methodology applied for the study of these genomes will be developed below.
2. Methodology
The Multifractal Formalism from the CGR
2.1 Data Acquisition and Molecular Parameters
Databases for the C. elegans and the 36.2 Hs_ refseq HG version were downloaded from the NCBI FTP server. Then, several strategies were designed to fragment the genomic DNA sequences of different length ranges. For example, the C. elegans genome was divided into 18 fragments, Figure 2 (left) and the human genome in 9,379 fragments. According to their annotation systems, the contents of molecular parameters of coding sequences (genes, exons and introns), noncoding sequences (repetitive DNA, Alu, LINES, MIR, MER, LTR, promoters, etc.) and coding/ non-coding DNA (TTAGGC, AAAAT, AAATT, TTTTC, TTTTT, CpG islands, etc.) are counted for each sequence.
2.2 Construction of the CGR 2.3 Fractal Measurement by the Box Counting Method
Subsequently, the CGR, a recursive algorithm (Jeffrey, 1990; Restrepo et al, 2009) is applied to each selected DNA sequence, Figure 3 (above, left) and from which an image is obtained, which is quantified by the box-counting algorithm. For example, in Figure 3 (above, left) a CGR image for a human DNA sequence of 80,000 bp in length is shown. Here, dark regions represent sub-quadrants with a high number of points (or nucleotides). Clear regions, sections with a low number of points. The calculation for the D for the Koch curve by the box-counting method is illustrated by a progression of changes in the grid size, and its Cartesian graph, Table 1
The CGR image for a given DNA sequence is quantified by a standard fractal analysis. A fractal is a fragmented geometric figure whose parts are an approximated copy at full scale, that is, the figure has self-similarity. The D is basically a scaling rule that the figure obeys. Generally, a power law is given by the following expression:
Where N(E) is the number of parts required for covering the figure when a scaling factor E is applied. The power law permits to calculate the fractal dimension as:
The D obtained by the box-counting algorithm covers the figure with disjoint boxes ɛ = 1/E and counts the number of boxes required. Figure 4 (above, left) shows the multifractal measure at momentum q=1.
2.4 Multifractal Measurement
When generalizing the box-counting algorithm for the multifractal case and according to the method of moments q, we obtain the equation (3) (Gutiérrez et al, 1998; Yu et al, 2001):
Where the Mi number of points falling in the i-th grid is determined and related to the total number M0 and ɛ to box size. Thus, the MFA is used when multiple scaling rules are applied. Figure 4 (above, right) shows the calculation of the multifractal measures at different momentum q (partition function). Here, linear regressions must have a coefficient of determination equal or close to 1. From each linear regression D are obtained, which generate an spectrum of generalized fractal dimensions Dq for all q integers, Figure 4 (below, left). So, the multifractal spectrum is obtained as the limit:
The variation of the q integer allows emphasizing different regions and discriminating their fractal a high Dq is synonymous of the structure’s richness and the properties of these regions. Negative q values emphasize the scarce regions; a high Dq indicates a lot of structure and properties in these regions. In real world applications, the limit Dqreadily approximated from the data using a linear fitting: the transformation of the equation (3) yields:
Which shows that ln In(Mi )= for set q is a linear function in the ln(ɛ), Dq can therefore be evaluated as q the slope of a fixed relationship between In(Mi )= and (q-1) ln(ɛ). The methodologies and approaches for the method of box-counting and MFA are detailed in Moreno et al, 2000, Yu et al, 2001; Moreno, 2005. For a rigorous mathematical development of MFA from images consult Multifractal system, wikipedia.
2.5 Measurement of Information Content
Subsequently, from the spectrum of generalized dimensions Dq, the degree of multifractality ΔDq(MD) is calculated as the difference between the maximum and minimum values of D : ΔD qq = Dqmax– Dqmin(Ivanov et al, 1999). When qmaxqmin ΔDq is high, the multifractal spectrum is rich in information and highly aperiodic, when ΔDq is small, the resulting dimension spectrum is poor in information and highly periodic. It is expected then, that the aperiodicity in the genome would be related to highly polymorphic genomic aperiodic structures and those periodic regions with highly repetitive and not very polymorphic genomic structures. The correlation exponent t(q) = (q – 1)Dq, Figure 4 (below, right ) can also be obtained from the multifractal dimension Dq. The generalized dimension also provides significant specific information. D(q = 0) is equal to the Capacity dimension, which in this analysis is the size of the “box count”. D(q = 1) is equal to the Information dimension and D(q = 2) to the Correlation dimension. Based on these multifractal parameters, many of the structural genomic properties can be quantified, related, and interpreted.
2.6 Multifractal Parameters and Statistical and Discrimination Analyses
Once the multifractal parameters are calculated (Dq = (-20, 20), ΔDq, πq, etc.), correlations with the molecular parameters are sought. These relations are established by plotting the number of genome molecular parameters versus MD by discriminant analysis with Cartesian graphs in 2-D, Figure 5 (below, left) and 3-D and combining multifractal and molecular parameters. Finally, simple linear regression analysis, multivariate analysis, and analyses by ranges and clusterings are made to establish statistical significance.
3 Results and Discussion
3.1 Non-linear Descriptive Model for the C. elegans Genome
When analyzing the C. elegans genome with the multifractal formalism it revealed what symmetry and asymmetry on the genome nucleotide composition suggested. Thus, the multifractal scaling of the C. elegans genome is of interest because it indicates that the molecular structure of the chromosome may be organized as a system operating far from equilibrium following nonlinear laws (Ivanov et al, 1999; Burgos and Moreno-Tovar, 1996). This can be discussed from two points of view:
1) When comparing C. elegans chromosomes with each other, the X chromosome showed the lowest multifractality, Figure 5 (above). This means that the X chromosome is operating close to equilibrium, which results in an increased genetic instability. Thus, the instability of the X could selectively contribute to the molecular mechanism that determines sex (XX or X0) during meiosis. Thus, the X chromosome would be operating closer to equilibrium in order to maintain their particular sexual dimorphism.
2) When comparing different chromosome regions of the C. elegans genome, changes in multifractality were found in relation to the regional organization (at the center and arms) exhibited by the chromosomes, Figure 5 (below, left). These behaviors are associated with changes in the content of repetitive DNA, Figure 5 (below, right). The results indicated that the chromosome arms are even more complex than previously anticipated. Thus, TTAGGC telomere sequences would be operating far from equilibrium to protect the genetic information encoded by the entire chromosome.
All these biological arguments may explain why C. elegans genome is organized in a nonlinear way. These findings provide insight to quantify and understand the organization of the non-linear structure of the C. elegans genome, which may be extended to other genomes, including the HG (Vélez et al, 2010).
3.2 Nonlinear Descriptive Model for the Human Genome
Once the multifractal approach was validated in C. elegans genome, HG was analyzed exhaustively. This allowed us to propose a nonlinear model for the HG structure which will be discussed under three points of view.
1) It was found that the HG high multifractality depends strongly on the contents of Alu sequences and to a lesser extent on the content of CpG islands. These contents would be located primarily in highly aperiodic regions, thus taking the chromosome far from equilibrium and giving to it greater genetic stability, protection and attraction of mutations, Figure 6 (A-C). Thus, hundreds of regions in the HG may have high genetic stability and the most important genetic information of the HG, the genes, would be safeguarded from environmental fluctuations. Other repeated elements (LINES, MIR, MER, LTRs) showed no significant relationship,
Figure 6 (D). Consequently, the human multifractal map developed in Moreno et al, 2011 constitutes a good tool to identify those regions rich in genetic information and genomic stability. 2) The multifractal context seems to be a significant requirement for the structural and functional organization of thousands of genes and gene families. Thus, a high multifractal context (aperiodic) appears to be a “genomic attractor” for many genes (KOGs, KEEGs), Figure 6 (E) and some gene families, Figure 6 (F) are involved in genetic and deterministic processes, in order to maintain a deterministic regulation control in the genome, although most of HG sequences may be subject to a complex epigenetic control.
3) The classification of human chromosomes and chromosome regions analysis may have some medical implications (Moreno et al, 2002; Moreno et al, 2009). This means that the structure of low nonlinearity exhibited by some chromosomes (or chromosome regions) involve an environmental predisposition, as potential targets to undergo structural or numerical chromosomal alterations in Figure 6 (G). Additionally, sex chromosomes should have low multifractality to maintain sexual dimorphism and probably the X chromosome inactivation.
All these fractals and biological arguments could explain why Alu elements are shaping the HG in a nonlinearly manner (Moreno et al, 2011). Finally, the multifractal modeling of the HG serves as theoretical framework to examine new discoveries made by the ENCODE project and new approaches about human epigenomes. That is, the non-linear organization of HG might help to explain why it is expected that most of the GH is functional.
4. Conclusions
All these results show that the multifractal formalism is appropriate to quantify and evaluate genetic information contents in genomes and to relate it with the known molecular anatomy of the genome and some of the expected properties. Thus, the MFB allows interpreting in a logic manner the structural nature and variation of the genome.
The MFB allows understanding why a number of chromosomal diseases are likely to occur in the genome, thus opening a new perspective toward personalized medicine to study and interpret the GH and its diseases.
The entire genome contains nonlinear information organizing it and supposedly making it function, concluding that virtually 100% of HG is functional. Bioinformatics in general, is enriched with a novel approach (MFB) making it possible to quantify the genetic information content of any DNA sequence and their practical applications to different disciplines in biology, medicine and agriculture. This novel breakthrough in computational genomic analysis and diseases contributes to define Biology as a “hard” science.
MFB opens a door to develop a research program towards the establishment of an integrative discipline that contributes to “break” the code of human life. (http://pharmaceuticalintelligence. com/page/3/).
5. Acknowledgements
Thanks to the directives of the EISC, the Universidad del Valle and the School of Engineering for offering an academic, scientific and administrative space for conducting this research. Likewise, thanks to co authors (professors and students) who participated in the implementation of excerpts from some of the works cited here. Finally, thanks to Colciencias by the biotechnology project grant # 1103-12-16765.
6. References
Blanco, S., & Moreno, P.A. (2007). Representación del juego del caos para el análisis de secuencias de ADN y proteínas mediante el análisis multifractal (método “box-counting”). In The Second International Seminar on Genomics and Proteomics, Bioinformatics and Systems Biology (pp. 17-25). Popayán, Colombia. [ Links ]
Burgos, J.D., & Moreno-Tovar, P. (1996). Zipf scaling behavior in the immune system. BioSystem , 39, 227-232. [ Links ]
C. elegans Sequencing Consortium. (1998). Genome sequence of the nematode C. elegans: a platform for investigating biology. Science , 282, 2012-2018. [ Links ]
Gutiérrez, J.M., Iglesias A., Rodríguez, M.A., Burgos, J.D., & Moreno, P.A. (1998). Analyzing the multifractals structure of DNA nucleotide sequences. In, M. Barbie & S. Chillemi (Eds.) Chaos and Noise in Biology and Medicine (cap. 4). Hackensack (NJ): World Scientific Publishing Co. [ Links ]
Jeffrey, H.J. (1990). Chaos game representation of gene structure. Nucleic Acids Research , 18, 2163-2175. [ Links ]
Mandelbrot, B. (1982). La geometría fractal de la naturaleza. Barcelona. España: Tusquets editores. [ Links ]
Moon, F.C. (1992). Chaotic and fractal dynamics. New York: John Wiley. [ Links ]
Moreno, P.A. (2005). Large scale and small scale bioinformatics studies on the Caenorhabditis elegans enome. Doctoral thesis. Department of Biology and Biochemistry, University of Houston, Houston, USA. [ Links ]
Moreno, P.A., Burgos, J.D., Vélez, P.E., Gutiérrez, J.M., & et al., (2000). Multifractal analysis of complete genomes. In P roceedings of the 12th International Genome Sequencing and Analysis Conference (pp. 80-81). Miami Beach (FL). [ Links ]
Moreno, P.A., Rodríguez, J.G., Vélez, P.E., Cubillos, J.R., & Del Portillo, P. (2002). La genómica aplicada en salud humana. Colombia Ciencia y Tecnología. Colciencias , 20, 14-21. [ Links ]
Moreno, P.A., Vélez, P.E., & Burgos, J.D. (2009). Biología molecular, genómica y post-genómica. Pioneros, principios y tecnologías. Popayán, Colombia: Editorial Universidad del Cauca. [ Links ]
Moreno, P.A., Vélez, P.E., Martínez, E., Garreta, L., Díaz, D., Amador, S., Gutiérrez, J.M., et. al. (2011). The human genome: a multifractal analysis. BMC Genomics , 12, 506. [ Links ]
Mount, D.W. (2004). Bioinformatics. Sequence and ge nome analysis. New York: Cold Spring Harbor Laboratory Press. [ Links ]
Peitgen, H.O., Jürgen, H., & Saupe D. (1992). Chaos and Fractals. New Frontiers of Science. New York: Springer-Verlag. [ Links ]
Restrepo, S., Pinzón, A., Rodríguez, L.M., Sierra, R., Grajales, A., Bernal, A., Barreto, E. et. al. (2009). Computational biology in Colombia. PLoS Computational Biology, 5 (10), e1000535. [ Links ]
The ENCODE Project Consortium. (2012). An integrated encyclopedia of DNA elements in the human genome. Nature , 489, 57-74. [ Links ]
Vélez, P.E., Garreta, L.E., Martínez, E., Díaz, N., Amador, S., Gutiérrez, J.M., Tischer, I., & Moreno, P.A. (2010). The Caenorhabditis elegans genome: a multifractal analysis. Genet and Mol Res , 9, 949-965. [ Links ]
Venter, J.C., Adams, M.D., Myers, E.W., Li, P.W., & et al. (2001). The sequence of the human genome. Science , 291, 1304-1351. [ Links ]
Use of 3D Bioprinting for Development of Toxicity Prediction Models
Curator: Stephen J. Williams, PhD
SOT FDA Colloquium on 3D Bioprinted Tissue Models: Tuesday, April 9, 2019
The Society of Toxicology (SOT) and the U.S. Food and Drug Administration (FDA) will hold a workshop on “Alternative Methods for Predictive Safety Testing: 3D Bioprinted Tissue Models” on Tuesday, April 9, at the FDA Center for Food Safety and Applied Nutrition in College Park, Maryland. This workshop is the latest in the series, “SOT FDA Colloquia on Emerging Toxicological Science: Challenges in Food and Ingredient Safety.”
Human 3D bioprinted tissues represent a valuable in vitro approach for chemical, personal care product, cosmetic, and preclinical toxicity/safety testing. Bioprinting of skin, liver, and kidney is already appearing in toxicity testing applications for chemical exposures and disease modeling. The use of 3D bioprinted tissues and organs may provide future alternative approaches for testing that may more closely resemble and simulate intact human tissues to more accurately predict human responses to chemical and drug exposures.
A synopsis of the schedule and related works from the speakers is given below:
8:40 AM–9:20 AM
Overview and Challenges of Bioprinting
Sharon Presnell, Amnion Foundation, Winston-Salem, NC
9:20 AM–10:00 AM
Putting 3D Bioprinting to the Use of Tissue Model Fabrication
Y. Shrike Zhang, Brigham and Women’s Hospital, Harvard Medical School and Harvard-MIT Division of Health Sciences and Technology, Boston, MA
10:00 AM–10:20 AM
Break
10:20 AM–11:00 AM
Uses of Bioprinted Liver Tissue in Drug Development
Jean-Louis Klein, GlaxoSmithKline, Collegeville, PA
11:00 AM–11:40 AM
Biofabrication of 3D Tissue Models for Disease Modeling and Chemical Screening
Marc Ferrer, National Center for Advancing Translational Sciences, NIH, Rockville, MD
Dr. Sharon Presnell was most recently the Chief Scientific Officer at Organovo, Inc., and the President of their wholly-owned subsidiary, Samsara Sciences. She received a Ph.D. in Cell & Molecular Pathology from the Medical College of Virginia and completed her undergraduate degree in biology at NC State. In addition to her most recent roles, Presnell has served as the director of cell biology R&D at Becton Dickinson’s corporate research center in RTP, and as the SVP of R&D at Tengion. Her roles have always involved the commercial and clinical translation of basic research and early development in the cell biology space. She serves on the board of the Coulter Foundation at the University of Virginia and is a member of the College of Life Sciences Foundation Board at NC State. In January 2019, Dr. Presnell will begin a new role as President of the Amnion Foundation, a non-profit organization in Winston-Salem.
Integrating Kupffer cells into a 3D bioprinted model of human liver recapitulates fibrotic responses of certain toxicants in a time and context dependent manner. This work establishes that the presence of Kupffer cells or macrophages are important mediators in fibrotic responses to certain hepatotoxins and both should be incorporated into bioprinted human liver models for toxicology testing.
Abstract: Modeling clinically relevant tissue responses using cell models poses a significant challenge for drug development, in particular for drug induced liver injury (DILI). This is mainly because existing liver models lack longevity and tissue-level complexity which limits their utility in predictive toxicology. In this study, we established and characterized novel bioprinted human liver tissue mimetics comprised of patient-derived hepatocytes and non-parenchymal cells in a defined architecture. Scaffold-free assembly of different cell types in an in vivo-relevant architecture allowed for histologic analysis that revealed distinct intercellular hepatocyte junctions, CD31+ endothelial networks, and desmin positive, smooth muscle actin negative quiescent stellates. Unlike what was seen in 2D hepatocyte cultures, the tissues maintained levels of ATP, Albumin as well as expression and drug-induced enzyme activity of Cytochrome P450s over 4 weeks in culture. To assess the ability of the 3D liver cultures to model tissue-level DILI, dose responses of Trovafloxacin, a drug whose hepatotoxic potential could not be assessed by standard pre-clinical models, were compared to the structurally related non-toxic drug Levofloxacin. Trovafloxacin induced significant, dose-dependent toxicity at clinically relevant doses (≤ 4uM). Interestingly, Trovafloxacin toxicity was observed without lipopolysaccharide stimulation and in the absence of resident macrophages in contrast to earlier reports. Together, these results demonstrate that 3D bioprinted liver tissues can both effectively model DILI and distinguish between highly related compounds with differential profile. Thus, the combination of patient-derived primary cells with bioprinting technology here for the first timedemonstrates superior performance in terms of mimicking human drug response in a known target organ at the tissue level.
A great interview with Dr. Presnell and the 3D Models 2017 Symposium is located here:
Please clickhere for Web based and PDF version of interview
Some highlights of the interview include
Exciting advances in field showing we can model complex tissue-level disease-state phenotypes that develop in response to chronic long term injury or exposure
Sees the field developing a means to converge both the biology and physiology of tissues, namely modeling the connectivity between tissues such as fluid flow
Future work will need to be dedicated to develop comprehensive analytics for 3D tissue analysis. As she states “we are very conditioned to get information in a simple way from biochemical readouts in two dimension, monocellular systems” however how we address the complexity of various cellular responses in a 3D multicellular environment will be pertinent.
Additional challenges include the scalability of such systems and making such system accessible in a larger way
Shrike Zhang, Brigham and Women’s Hospital, Harvard Medical School and Harvard-MIT Division of Health Sciences and Technology
Dr. Zhang currently holds an Assistant Professor position at Harvard Medical School and is an Associate Bioengineer at Brigham and Women’s Hospital. His research interests include organ-on-a-chip, 3D bioprinting, biomaterials, regenerative engineering, biomedical imaging, biosensing, nanomedicine, and developmental biology. His scientific contributions have been recognized by >40 international, national, and regional awards. He has been invited to deliver >70 lectures worldwide, and has served as reviewer for >400 manuscripts for >30 journals. He is serving as Editor-in-Chief for Microphysiological Systems, and Associate Editor for Bio-Design and Manufacturing. He is also on Editorial Board of Bioprinting, Heliyon, BMC Materials, and Essays in Biochemistry, and on Advisory Panel of Nanotechnology.
Skardal A, Murphy SV, Devarasetty M, Mead I, Kang HW, Seol YJ, Shrike Zhang Y, Shin SR, Zhao L, Aleman J, Hall AR, Shupe TD, Kleensang A, Dokmeci MR, Jin Lee S, Jackson JD, Yoo JJ, Hartung T, Khademhosseini A, Soker S, Bishop CE, Atala A.
Sci Rep. 2017 Aug 18;7(1):8837. doi: 10.1038/s41598-017-08879-x.
Bhise NS, Manoharan V, Massa S, Tamayol A, Ghaderi M, Miscuglio M, Lang Q, Shrike Zhang Y, Shin SR, Calzone G, Annabi N, Shupe TD, Bishop CE, Atala A, Dokmeci MR, Khademhosseini A.
Biofabrication. 2016 Jan 12;8(1):014101. doi: 10.1088/1758-5090/8/1/014101.
Marc Ferrer, National Center for Advancing Translational Sciences, NIH
Marc Ferrer is a team leader in the NCATS Chemical Genomics Center, which was part of the National Human Genome Research Institute when Ferrer began working there in 2010. He has extensive experience in drug discovery, both in the pharmaceutical industry and academic research. Before joining NIH, he was director of assay development and screening at Merck Research Laboratories. For 10 years at Merck, Ferrer led the development of assays for high-throughput screening of small molecules and small interfering RNA (siRNA) to support programs for lead and target identification across all disease areas.
At NCATS, Ferrer leads the implementation of probe development programs, discovery of drug combinations and development of innovative assay paradigms for more effective drug discovery. He advises collaborators on strategies for discovering small molecule therapeutics, including assays for screening and lead identification and optimization. Ferrer has experience implementing high-throughput screens for a broad range of disease areas with a wide array of assay technologies. He has led and managed highly productive teams by setting clear research strategies and goals and by establishing effective collaborations between scientists from diverse disciplines within industry, academia and technology providers.
Ferrer has a Ph.D. in biological chemistry from the University of Minnesota, Twin Cities, and completed postdoctoral training at Harvard University’s Department of Molecular and Cellular Biology. He received a B.Sc. degree in organic chemistry from the University of Barcelona in Spain.
Wilson KM, Mathews-Griner LA, Williamson T, Guha R, Chen L, Shinn P, McKnight C, Michael S, Klumpp-Thomas C, Binder ZA, Ferrer M, Gallia GL, Thomas CJ, Riggins GJ.
SLAS Technol. 2019 Feb;24(1):28-40. doi: 10.1177/2472630318803749. Epub 2018 Oct 5.