Healthcare analytics, AI solutions for biological big data, providing an AI platform for the biotech, life sciences, medical and pharmaceutical industries, as well as for related technological approaches, i.e., curation and text analysis with machine learning and other activities related to AI applications to these industries.
Eight Subcellular Pathologies driving Chronic Metabolic Diseases – Methods for Mapping Bioelectronic Adjustable Measurements as potential new Therapeutics: Impact on Pharmaceuticals in Use
In this curation we wish to present two breaking through goals:
Goal 1:
Exposition of a new direction of research leading to a more comprehensive understanding of Metabolic Dysfunctional Diseases that are implicated in effecting the emergence of the two leading causes of human mortality in the World in 2023: (a) Cardiovascular Diseases, and (b) Cancer
Goal 2:
Development of Methods for Mapping Bioelectronic Adjustable Measurements as potential new Therapeutics for these eight subcellular causes of chronic metabolic diseases. It is anticipated that it will have a potential impact on the future of Pharmaceuticals to be used, a change from the present time current treatment protocols for Metabolic Dysfunctional Diseases.
According to Dr. Robert Lustig, M.D, an American pediatric endocrinologist. He is Professor emeritus of Pediatrics in the Division of Endocrinology at the University of California, San Francisco, where he specialized in neuroendocrinology and childhood obesity, there are eight subcellular pathologies that drive chronic metabolic diseases.
These eight subcellular pathologies can’t be measured at present time.
In this curation we will attempt to explore methods of measurement for each of these eight pathologies by harnessing the promise of the emerging field known as Bioelectronics.
Unmeasurable eight subcellular pathologies that drive chronic metabolic diseases
Glycation
Oxidative Stress
Mitochondrial dysfunction [beta-oxidation Ac CoA malonyl fatty acid]
Insulin resistance/sensitive [more important than BMI], known as a driver to cancer development
Membrane instability
Inflammation in the gut [mucin layer and tight junctions]
Epigenetics/Methylation
Autophagy [AMPKbeta1 improvement in health span]
Diseases that are not Diseases: no drugs for them, only diet modification will help
Image source
Robert Lustig, M.D. on the Subcellular Processes That Belie Chronic Disease
These eight Subcellular Pathologies driving Chronic Metabolic Diseases are becoming our focus for exploration of the promise of Bioelectronics for two pursuits:
Will Bioelectronics be deemed helpful in measurement of each of the eight pathological processes that underlie and that drive the chronic metabolic syndrome(s) and disease(s)?
IF we will be able to suggest new measurements to currently unmeasurable health harming processes THEN we will attempt to conceptualize new therapeutic targets and new modalities for therapeutics delivery – WE ARE HOPEFUL
In the Bioelecronics domain we are inspired by the work of the following three research sources:
Michael Levin is an American developmental and synthetic biologist at Tufts University, where he is the Vannevar Bush Distinguished Professor. Levin is a director of the Allen Discovery Center at Tufts University and Tufts Center for Regenerative and Developmental Biology. Wikipedia
THE VOICE of Dr. Justin D. Pearlman, MD, PhD, FACC
PENDING
THE VOICE of Stephen J. Williams, PhD
Ten TakeAway Points of Dr. Lustig’s talk on role of diet on the incidence of Type II Diabetes
25% of US children have fatty liver
Type II diabetes can be manifested from fatty live with 151 million people worldwide affected moving up to 568 million in 7 years
A common myth is diabetes due to overweight condition driving the metabolic disease
There is a trend of ‘lean’ diabetes or diabetes in lean people, therefore body mass index not a reliable biomarker for risk for diabetes
Thirty percent of ‘obese’ people just have high subcutaneous fat. the visceral fat is more problematic
there are people who are ‘fat’ but insulin sensitive while have growth hormone receptor defects. Points to other issues related to metabolic state other than insulin and potentially the insulin like growth factors
At any BMI some patients are insulin sensitive while some resistant
Visceral fat accumulation may be more due to chronic stress condition
Fructose can decrease liver mitochondrial function
A methionine and choline deficient diet can lead to rapid NASH development
Extracellular RNA and their carriers in disease diagnosis and therapy, Volume 2 (Volume Two: Latest in Genomics Methodologies for Therapeutics: Gene Editing, NGS and BioInformatics, Simulations and the Genome Ontology), Part 1: Next Generation Sequencing (NGS)
Reporter and Curator: Dr. Sudipta Saha, Ph.D.
RNA plays various roles in determining how the information in our genes drives cell behavior. One of its roles is to carry information encoded by our genes from the cell nucleus to the rest of the cell where it can be acted on by other cell components. Rresearchers have now defined how RNA also participates in transmitting information outside cells, known as extracellular RNA or exRNA. This new role of RNA in cell-to-cell communication has led to new discoveries of potential disease biomarkers and therapeutic targets. Cells using RNA to talk to each other is a significant shift in the general thought process about RNA biology.
Researchers explored basic exRNA biology, including how exRNA molecules and their transport packages (or carriers) were made, how they were expelled by producer cells and taken up by target cells, and what the exRNA molecules did when they got to their destination. They encountered surprising complexity both in the types of carriers that transport exRNA molecules between cells and in the different types of exRNA molecules associated with the carriers. The researchers had to be exceptionally creative in developing molecular and data-centric tools to begin making sense of the complexity, and found that the type of carrier affected how exRNA messages were sent and received.
As couriers of information between cells, exRNA molecules and their carriers give researchers an opportunity to intercept exRNA messages to see if they are associated with disease. If scientists could change or engineer designer exRNA messages, it may be a new way to treat disease. The researchers identified potential exRNA biomarkers for nearly 30 diseases including cardiovascular disease, diseases of the brain and central nervous system, pregnancy complications, glaucoma, diabetes, autoimmune diseases and multiple types of cancer.
As for example some researchers found that exRNA in urine showed promise as a biomarker of muscular dystrophy where current studies rely on markers obtained through painful muscle biopsies. Some other researchers laid the groundwork for exRNA as therapeutics with preliminary studies demonstrating how researchers might load exRNA molecules into suitable carriers and target carriers to intended recipient cells, and determining whether engineered carriers could have adverse side effects. Scientists engineered carriers with designer RNA messages to target lab-grown breast cancer cells displaying a certain protein on their surface. In an animal model of breast cancer with the cell surface protein, the researchers showed a reduction in tumor growth after engineered carriers deposited their RNA cargo.
Other than the above research work the scientists also created a catalog of exRNA molecules found in human biofluids like plasma, saliva and urine. They analyzed over 50,000 samples from over 2000 donors, generating exRNA profiles for 13 biofluids. This included over 1000 exRNA profiles from healthy volunteers. The researchers found that exRNA profiles varied greatly among healthy individuals depending on characteristics like age and environmental factors like exercise. This means that exRNA profiles can give important and detailed information about health and disease, but careful comparisons need to be made with exRNA data generated from people with similar characteristics.
Next the researchers will develop tools to efficiently and reproducibly isolate, identify and analyze different carrier types and their exRNA cargos and allow analysis of one carrier and its cargo at a time. These tools will be shared with the research community to fill gaps in knowledge generated till now and to continue to move this field forward.
When T cells receive the appropriate signals through the T cell receptor (TCR) complex and the costimulatory receptor CD28, a complex rearrangement of the cytoskeleton occurs that enables the formation of the immunological synapse, a specialized structure that forms between the antigen-presenting cell and the T cell. In this week’s issue, Roybal et al. used sophisticated imaging of live cells and computational image analysis to visualize the dynamic rearrangements of actin and various regulatory proteins in T cells activated through the TCR in the absence or presence of CD28 signaling. The regulatory proteins WAVE2 and cofilin were efficiently recruited to the immunological synapse only when both TCR and CD28 signaled. Fried et al. used a different fluorescence imaging approach, triple-color FRET (fluorescence resonance energy transfer), to visualize not the movement of proteins with the cell, but the interactions between the actin-regulatory proteins WASp and WIP in live cells. The WASp-WIP interaction is required for T cell activation. The triple-color FRET analysis revealed how changes in the interaction between WASp and WIP resulted in WASp functioning as both an on and off switch. Although most studies’ focus of T cell cytoskeletal dynamics is on the changes that occur at the immunological synapse, as González-Granado et al. showed, the nuclear cytoskeleton is also important for the immune response. In this study, live-cell imaging and immunofluorescence analysis revealed that nuclear lamin-A contributed to the polymerization of actin and, thus, immunological synapse formation. These studies highlight the insights that can be obtained about molecular dynamics from live-cell image analysis.
K. T. Roybal, T. E. Buck, X. Ruan, B. H. Cho, D. J. Clark, R. Ambler, H. M. Tunbridge, J. Zhang, P. Verkade, C. Wülfing, R. F. Murphy, Computational spatiotemporal analysis identifies WAVE2 and cofilin as joint regulators of costimulation-mediated T cell actin dynamics. Sci. Signal.9, rs3 (2016). [Abstract]
Computational spatiotemporal analysis identifies WAVE2 and cofilin as joint regulators of costimulation-mediated T cell actin dynamics
T cells must receive signals through the T cell receptor (TCR) and the costimulatory receptor CD28 to become fully activated. Critical to this process is the reorganization of plasma membrane actin at the immunological synapse, the interface between a T cell and an antigen-presenting cell. Roybal et al.imaged actin and fluorescently tagged actin regulatory proteins in T cells activated through the TCR in the absence or presence of CD28 signaling. Computational image processing to normalize differences in cell shape enabled tracking of the fluorescent proteins. The regulatory proteins WAVE2 and cofilin were efficiently recruited to the immunological synapse only when both TCR and CD28 signaled. Constitutive activation of either protein in TCR-stimulated T cells enabled normal actin reorganization even when CD28 signaling was blocked. This combination of imaging and computational analysis could be applied to other systems to determine the spatiotemporal dynamics of signaling molecules.
Fluorescence microscopy is one of the most important tools in cell biology research because it provides spatial and temporal information to investigate regulatory systems inside cells. This technique can generate data in the form of signal intensities at thousands of positions resolved inside individual live cells. However, given extensive cell-to-cell variation, these data cannot be readily assembled into three- or four-dimensional maps of protein concentration that can be compared across different cells and conditions. We have developed a method to enable comparison of imaging data from many cells and applied it to investigate actin dynamics in T cell activation. Antigen recognition in T cells by the T cell receptor (TCR) is amplified by engagement of the costimulatory receptor CD28. We imaged actin and eight core actin regulators to generate over a thousand movies of T cells under conditions in which CD28 was either engaged or blocked in the context of a strong TCR signal. Our computational analysis showed that the primary effect of costimulation blockade was to decrease recruitment of the activator of actin nucleation WAVE2 (Wiskott-Aldrich syndrome protein family verprolin-homologous protein 2) and the actin-severing protein cofilin to F-actin. Reconstitution of WAVE2 and cofilin activity restored the defect in actin signaling dynamics caused by costimulation blockade. Thus, we have developed and validated an approach to quantify protein distributions in time and space for the analysis of complex regulatory systems.
S. Fried, B. Reicher, M. H. Pauker, S. Eliyahu, O. Matalon, E. Noy, J. Chill, M. Barda-Saad, Triple-color FRET analysis reveals conformational changes in the WIP-WASp actin-regulating complex. Sci. Signal.7, ra60 (2014). [Abstract]
Triple-Color FRET Analysis Reveals Conformational Changes in the WIP-WASp Actin-Regulating Complex
Wiskott-Aldrich syndrome protein (WASp) is a key regulator of the actin cytoskeletal machinery. Binding of WASp-interacting protein (WIP) to WASp modulates WASp activity and protects it from degradation. Formation of the WIP-WASp complex is crucial for the adaptive immune response. We found that WIP and WASp interacted in cells through two distinct molecular interfaces. One interaction occurred between the WASp-homology-1 (WH1) domain of WASp and the carboxyl-terminal domain of WIP that depended on the phosphorylation status of WIP, which is phosphorylated by protein kinase C θ (PKCθ) in response to T cell receptor activation. The other interaction occurred between the verprolin homology, central hydrophobic region, and acidic region (VCA) domain of WASp and the amino-terminal domain of WIP. This latter interaction required actin, because it was inhibited by latrunculin A, which sequesters actin monomers. With triple-color fluorescence resonance energy transfer (3FRET) technology, we demonstrated that the WASp activation mechanism involved dissociation of the first interaction, while leaving the second interaction intact. This conformation exposed the ubiquitylation site on WASp, leading to degradation of WASp. Together, these data suggest that the activation and degradation of WASp are delicately balanced and depend on the phosphorylation state of WIP. Our molecular analysis of the WIP-WASp interaction provides insight into the regulation of actin-dependent processes.
J. M. González-Granado, C. Silvestre-Roig, V. Rocha-Perugini, L. Trigueros-Motos, D. Cibrián, G. Morlino, M. Blanco-Berrocal, F. G. Osorio, J. M. P. Freije, C. López-Otín, F. Sánchez-Madrid, V. Andrés, Nuclear envelope Lamin-a couples actin dynamics with immunological synapse architecture and T cell activation.Sci. Signal.7, ra37 (2014). [Abstract]
Nuclear Envelope Lamin-A Couples Actin Dynamics with Immunological Synapse Architecture and T Cell Activation
In many cell types, nuclear A-type lamins regulate multiple cellular functions, including higher-order genome organization, DNA replication and repair, gene transcription, and signal transduction; however, their role in specialized immune cells remains largely unexplored. We showed that the abundance of A-type lamins was almost negligible in resting naïve T lymphocytes, but was increased upon activation of the T cell receptor (TCR). The increase in lamin-A was an early event that accelerated formation of the immunological synapse between T cells and antigen-presenting cells. Polymerization of F-actin in T cells is a critical step for immunological synapse formation, and lamin-A interacted with the linker of nucleoskeleton and cytoskeleton (LINC) complex to promote F-actin polymerization. We also showed that lamin-A expression accelerated TCR clustering and led to enhanced downstream signaling, including extracellular signal–regulated kinase 1/2 (ERK1/2) signaling, as well as increased target gene expression. Pharmacological inhibition of the ERK pathway reduced lamin-A–dependent T cell activation. Moreover, mice lacking lamin-A in immune cells exhibited impaired T cell responses in vivo. These findings underscore the importance of A-type lamins for TCR activation and identify lamin-A as a previously unappreciated regulator of the immune response.
T cell activation by antigens involves the formation of a complex, highly dynamic, yet organized signaling complex at the site of the T cell receptors (TCRs). Srikanth et al. found that the lymphocyte-specific large guanosine triphosphatase of the Rab family CRACR2A-a associated with vesicles near the Golgi in unstimulated mouse and human CD4+ T cells. Upon TCR activation, these vesicles moved to the immunological synapse (the contact region between a T cell and an antigen-presenting cell). The guanine nucleotide exchange factor Vav1 at the TCR complex recruited CRACR2A-a to the complex. Without CRACR2A-a, T cell activation was compromised because of defective calcium and kinase signaling.
More than 60 members of the Rab family of guanosine triphosphatases (GTPases) exist in the human genome. Rab GTPases are small proteins that are primarily involved in the formation, trafficking, and fusion of vesicles. We showed that CRACR2A (Ca2+ release–activated Ca2+ channel regulator 2A) encodes a lymphocyte-specific large Rab GTPase that contains multiple functional domains, including EF-hand motifs, a proline-rich domain (PRD), and a Rab GTPase domain with an unconventional prenylation site. Through experiments involving gene silencing in cells and knockout mice, we demonstrated a role for CRACR2A in the activation of the Ca2+ and c-Jun N-terminal kinase signaling pathways in response to T cell receptor (TCR) stimulation. Vesicles containing this Rab GTPase translocated from near the Golgi to the immunological synapse formed between a T cell and a cognate antigen-presenting cell to activate these signaling pathways. The interaction between the PRD of CRACR2A and the guanidine nucleotide exchange factor Vav1 was required for the accumulation of these vesicles at the immunological synapse. Furthermore, we demonstrated that GTP binding and prenylation of CRACR2A were associated with its localization near the Golgi and its stability. Our findings reveal a previously uncharacterized function of a large Rab GTPase and vesicles near the Golgi in TCR signaling. Other GTPases with similar domain architectures may have similar functions in T cells.
Technologies For Targeting And Delivering Chemotherapeutics Directly To The Tumour Site
Curator: David Orchard-Webb, PhD
Chemotherapy is normally associated with debilitating side effects due to systemic toxicity to normal cells, however targeting the chemotherapeutics directly to the tumour should dramatically reduce these side effects. Several technologies designed to accomplish this are under development (Table 1).
Researchers of the NTU-Northwestern Institute of Nanomedicine at Nanyang Technological University in Singapore are developing magnetic microbubbles which can contain chemotherapeutics. The microbubbles can be systemically delivered and imaged in real time. The chemotherapeutic is released from the microbubbles at the tumour site by directing ultrasound at the location [1]. Therefore this technology has the potential to specifically deliver any chemotherapeutic to a desired tumour site in the body.
For more on nanoparticle delivery make sure to read the following pharmaceutical intelligence article concerning iCluster technology:
Researchers at PanTher Therapeutics are developing a novel drug-eluting device for targeting chemotherapeutics to solid tumours. The cremaphor formulation of paclitaxel has dose limiting toxicity which prevent its use for pancreatic cancer. Paclitaxel’s toxicity like the majority of chemotherapeutics stems from its systemic delivery and toxicity to normal cells. However recently an albumin-bound formulation (nab-paclitaxel) has demonstrated increased survival times in combination with gemcitabine compared to gemcitabine alone [2]. And now PanTher Therapeutics’ novel biodegradable device has been developed which can deliver chemotherapeutics including paclitaxel directly to the pancreas limiting systemic toxicities [3].
The device has been tested with paclitaxel and shown favourable results in mouse xenograft models over systemically delivered paclitaxel. The device is flexible and can be surgically placed over the pancreatic tumour where it rests delivering a steady flow of paclitaxel for the duration of the treatment. The one time insertion is an attractive aspect compared with repeated intravenous deliveries.
Researchers at PharmaCyte Biotech, Inc. are developing a cell encapsidation technology called Cell-in-a-Box® which protects the cells inside from the host immune system while allowing the free exchange of soluble proteins and chemicals. The chemotherapeutic ifosfamide is activated in the liver by cytochrome P450 enzymes and must travel systemically to the tumour site. The greater the distance of the tumour from the liver the greater the dose requirement for effective delivery. The toxicities induced by an effective dose for pancreatic cancer are too great. Using Cell-in-a-Box®, activated ifosfamide can however be targeted to the pancreatic cancer reducing the dose requirement.
Cell-in-a-Box® is made of polymers of cellulose sulphate [4]. Clinical studies have shown that it is possible to encapsulate 293 cells overexpressing cytochrome P450 and deliver the capsules to the pancreas via the blood vessels without adverse effects. Lower doses of ifosfamide can then be systemically delivered and yet have a high active local concentration at the pancreas. A phase II trial is planned to confirm effectiveness in pancreatic cancer patients refractory to gemcitabine and abraxane or FOLFIRINOX [5].
Researchers of the University of North Carolina at Chapel Hill have developed a new device based on inserting positive and negative electrodes on either side of a tumour, injecting a chemotherapeutic and then applying an electric field in order to drive the therapeutic into the tumour. This Iontophoresis device has been tested in pancreatic cancer mouse xenograft models with gemcitabine and the newer combination FOLFIRINOX. Significant tumour volume reductions compared to intravenous delivery of the chemotherapeutic were found in both cases [6, 7]. Clinical trials are planned in the near future [8].
REFERENCES
Gao, Yu, Chon U Chan, Qiushi Gu, Xudong Lin, Wencong Zhang, David Chen Loong Yeo, Astrid Marlies Alsema, et al. ‘Controlled Nanoparticle Release from Stable Magnetic Microbubble Oscillations’. NPG Asia Materials 8, no. 4 (8 April 2016): e260. doi:10.1038/am.2016.37.
Ma, W. W., and M. Hidalgo. ‘The Winning Formulation: The Development of Paclitaxel in Pancreatic Cancer’. Clinical Cancer Research 19, no. 20 (15 October 2013): 5572–79. doi:10.1158/1078-0432.CCR-13-1356.
Ligorio, Matteo, Laura Indolfi, David T. Ting, Kristina Xega, Nicola Aceto, Francesca Bersani, Cristina R. Ferrone, et al. ‘Abstract 4584: A Novel Drug-Eluting Platform for Localized Treatment of Pancreatic Cancer’. Cancer Research 74, no. 19 Supplement (10 January 2014): 4584–4584. doi:10.1158/1538-7445.AM2014-4584.
Byrne, J. D., M. N. R. Jajja, A. T. O’Neill, L. R. Bickford, A. W. Keeler, N. Hyder, K. Wagner, et al. ‘Local Iontophoretic Administration of Cytotoxic Therapies to Solid Tumors’. Science Translational Medicine 7, no. 273 (4 February 2015): 273ra14–273ra14. doi:10.1126/scitranslmed.3009951.
Byrne, James D., Mohammad R. N. Jajja, Allison N. Schorzman, Amanda W. Keeler, J. Christopher Luft, William C. Zamboni, Joseph M. DeSimone, and Jen Jen Yeh. ‘Iontophoretic Device Delivery for the Localized Treatment of Pancreatic Ductal Adenocarcinoma’. Proceedings of the National Academy of Sciences 113, no. 8 (23 February 2016): 2200–2205. doi:10.1073/pnas.1600421113.
The 2013 Nobel Prize in Physiology or Medicine was awarded to to Randy W. Schekman, at the University of California at Berkeley; James E. Rothman, at Yale University in New Haven, Connecticut; and Thomas C. Südhof, at Stanford University, for their discoveries of machinery regulating vesicle traffic, a major transport system in cells.three U.S. scientists for their work on how the cell coordinates its transport system to shuttle proteins and other molecules from one location to another.
The organization and transport of molecules across cellular mmembranes is accomplished via vesicles that shuttle cargo between organelles or fuse to other structures to release their cargo outside the cell. The vesicle transport system is critical for a variety of physiological processes, ranging from signaling in the brainto release of hormones and immune cytokines.
Schekman identified three classes of genes that control different facets of the cell’s transport system.
This was followed by James Rothman’s discovery that a protein complex enables vesicles to fuse with their target membranes (pictured in orange above). This lock and key mechanism ensures that the vesicle fuses at the right location and that cargo molecules are delivered to the correct destination.
Also in the 1990s, Thomas Südhof was studying how nerve cells communicate in the brain. Calcium ions were known to be involved in vesicle cargo release, and Südhof searched for calcium sensitive proteins in nerve cells. He identified the molecular machinery (pictured in purple above) that responds to an influx of calcium ions (Ca2+) and triggers vesicle fusion.
Extracellular vesicles are participate in the pathogenesis of various diseases, most notably neurodegenerative disorders, and extracellular vesicles are likely to have therapeutic applications in large-molecule drug delivery.
Andaloussi et al. Extracellular vesicles: biology and emerging therapeutic opportunities. Nature Reviews Drug Discovery 2013 Vol: 12(5):347-357. DOI: 10.1038/nrd3978 View abstract
Anderson et al. Role of extracellular membrane vesicles in the pathogenesis of various diseases, including cancer, renal diseases, atherosclerosis, and arthritis. Lab Invest. 2010 Nov;90(11):1549-57. DOI: 10.1038/labinvest.2010.152. Epub 2010 Aug 30. View abstract
Machinery Regulating Vesicle Traffic, A Major Transport System in our Cells
Together, Rothman, Schekman and Südhof have transformed the way we view transport of molecular cargo to specific destinations inside and outside the cell. Their discoveries explain a long-standing enigma in cell biology and also shed new light on how disturbances in this machinery can have deleterious effects and contribute to conditions such as neurological diseases, diabetes, and immunological disorders.
Eukaryotic cells differ from prokaryotic cells by their more complex intracellular organization. In eukaryotes, specific cellular functions are compartmentalized into the cell nucleus and organelles surrounded by intracellular membranes. This compartmentalization vastly improves the efficiency of many cellular functions and prevents potentially dangerous molecules from roaming freely within the cell. But when distinct cellular processes are compartmentalized, a problem emerges. Different compartments need to exchange specific molecules (Figure 1). Furthermore, certain molecules need to be exported to the cell exterior. Most molecules are too large to directly pass through membranes, thus a mechanism that ensures specific delivery of this molecular cargo is required.
Figure 1: Each cell in the body has a complex organization where specific cellular functions are separated into different compartments called organelles. Molecules produced in the cell are packaged in vesicles and transported with special and temporal precision to the correct locations within and outside the cell.
Mysteries of cellular compartmentalization have long intrigued scientists. Improved light microscopy techniques aided in the understanding of intracellular organization in eukaryotic cells, but the advent of electron microscopy and new staining techniques, combined with subcellular fractionation assays using differential ultracentrifugation procedures, led to a deeper understanding of the cell’s inner life. Albert Claude, George Palade and Christian de Duve, who received the Nobel Prize in Physiology or Medicine 1974*, were pioneers in this area and have shed light on how the cell is organized and compartmentalized. Secretory proteins were shown to be produced on ribosomes in the endoplasmic reticulum (ER) and trafficked to the Golgi complex (named after the 1906 Nobel Laureate Camillo Golgi) (Figure 1). Progress was also made in deciphering how proteins find their appropriate destination. Günter Blobel was awarded the 1999 Nobel Prize in Physiology or Medicine* for his discoveries that proteins have intrinsic signals that govern their transport and localization in the cell. Yet, a lingering question remained. How are molecules, including hormones, transport proteins, and neurotransmitters, correctly routed to their appropriate destination? From the work of Palade, the traffic of secretory proteins from the ER was understood to be carried out using small membrane-surrounded vesicles that bud from one membrane and fuse with another, but how precision could be acquired in this process remained enigmatic.
The work of Rothman, Schekman and Südhof represents a paradigm shift in our understanding of how the eukaryotic cell, with its complex internal compartmentalization, organizes the routing of molecules packaged in vesicles to various intracellular destinations, as well as to the outside of the cell. Specificity in the delivery of molecular cargo is essential for cell function and survival. This specificity is required for the release of neurotransmitters into the presynaptic region of a nerve cell to transmit a signal to a neighboring nerve cell. Likewise, specificity is required for the export of hormones such as insulin to the cell surface. While vesicles within the cell were long known to be critical components of this transportation scheme, the precise mechanism by which these vesicles found their correct destination and how they fused with organelles or the plasma membrane to deliver the cargo remained mysterious. The work of the three 2013 Laureates radically altered our understanding of this aspect of cell physiology. Randy W. Schekman used yeast genetics to identify a set of genes critical for vesicular trafficking. He showed that these genes were essential for life and could be classified into three categories regulating different aspects of vesicle transport. James E. Rothman embarked on a biochemical approach and identified proteins that form a functional complex controlling cell fusion. Proteins on the vesicle and target membrane sides bind in specific combinations, ensuring precise delivery of molecular cargo to the right destination. Thomas C. Südhof became interested in how vesicle fusion machinery was controlled. He unraveled the mechanism by which calcium ions trigger release of neurotransmitters, and identified key regulatory components in the vesicle fusion machinery.
Schekman discovered genes encoding proteins that are key regulators of vesicle traffic. Comparing normal with genetically mutated yeast cells in which vesicle traffic was disturbed, he identified genes that control transport to different compartments and to the cell surface
Rothman published a series of papers where he reconstituted the intracellular transport of the VSV-G protein within the Golgi complex. He then used the assay to study both vesicle budding and fusion, and purified proteins from the cytoplasm that were required for transport. The first protein to be purified was the Nethylmaleimide-sensitive factor (NSF). Rothman’s discovery of NSF paved the way for the subsequent identification of other proteins important for the control of vesicle fusion, and the next one in line was SNAP (soluble NSFattachment protein). SNAPs bind to membranes and assist in the recruitment of NSF.
One of the yeast mutants, sec18, corresponded to NSF, which also revealed that the vesicle fusion machinery was evolutionarily ancient. Furthermore, Rothman and Schekman collaboratively cloned sec17 and provided evidence of its functional equivalence to SNAP. Other sec genes were shown to correspond to genes encoding fusion proteins were identified by other methods.
Using the NSF and SNAP proteins as bait, Rothman next turned to brain tissue, from which he purified proteins that he later named SNAREs (soluble NSF-attachment protein receptors). Intriguingly, three SNARE proteins, VAMP/Synaptobrevin, SNAP-25 and syntaxin, were found in stoichiometric amounts, which suggested to Rothman that they functioned together in the vesicle and target membranes. The three proteins had previously been identified by several scientists, including Richard Scheller, Kimio Akagawa, Reinhard Jahn and Pietro de Camilli, and localized to the presynaptic region, but their function was largely unknown. VAMP/Synaptobrevin resided on the vesicle, whereas SNAP-25 and syntaxin were found at the plasma membrane. This prompted Rothman to propose a hypothesis – the SNARE hypothesis – which stipulated that target and vesicle SNAREs (t-SNAREs and v-SNAREs) were critical for vesicle fusion through a set of sequential steps of synaptic docking, activation and fusion.
Thomas C. Südhof originally trained at the Georg-August-Universität and the Max-Planck Institute for Biophysical Sciences in Göttingen, Germany, and was a postdoctoral fellow with Michael Brown and Joseph Goldstein (Nobel Prize 1985) at University of Texas Southwestern Medical School in Dallas. As a junior group leader, he set out to study how synaptic vesicle fusion was controlled. Rothman and Schekman had provided fundamental machinery for vesicle fusion, but how vesicle fusion was temporally controlled remained enigmatic. Vesicular fusions in the body need to be kept carefully in check, and in some cases vesicle fusion has to be executed with high precision in response to specific stimuli. This is the case for example for neurotransmitter release in the brain and for insulin secretion from the endocrine pancreas.
The neurophysiology field was electrified by the discoveries of Bernard Katz, Ulf von Euler and Julius Axelrod who received the Nobel Prize in Physiology or Medicine 1970* for their discoveries concerning the humoral transmittors in the nerve terminals and the mechanism for their storage, release and inactivation. Südhof was intrigued by the rapid exocytosis of synaptic vesicles, which is under tight temporal control and regulated by the changes in the cytoplasmic free calcium concentration. Südhof elucidated how calcium regulates neurotransmitter release in neurons and discovered that complexin and synaptotagmin are two critical proteins in calcium-mediated vesicle fusion.
Illustration depicting a biocell attached to a CMOS integrated circuit with a membrane containing sodium-potassium pumps in pores. Energy is stored chemically in ATP molecules. When the energy is released as charged ions (which are then converted to electrons to power the chip at the bottom of the experimental device), the ATP is converted to ADP + inorganic phosphate. (credit: Trevor Finney and Jared Roseman/Columbia Engineering)
Columbia Engineering researchers have combined biological and solid-state components for the first time, opening the door to creating entirely new artificial biosystems.
In this experiment, they used a biological cell to power a conventional solid-state complementary metal-oxide-semiconductor (CMOS) integrated circuit. An artificial lipid bilayer membrane containing adenosine triphosphate (ATP)-powered ion pumps (which provide energy for cells) was used as a source of ions (which were converted to electrons to power the chip).
The study, led by Ken Shepard, Lau Family Professor of Electrical Engineering and professor of biomedical engineering at Columbia Engineering, was published online today (Dec. 7, 2015) in an open-access paper in Nature Communications.
How to build a hybrid biochip
Living systems achieve this functionality with their own version of electronics based on lipid membranes and ion channels and pumps, which act as a kind of “biological transistor.” Charge in the form of ions carry energy and information, and ion channels control the flow of ions across cell membranes.
Solid-state systems, such as those in computers and communication devices, use electrons; their electronic signaling and power are controlled by field-effect transistors.
To build a prototype of their hybrid system, Shepard’s team packaged a CMOS integrated circuit (IC) with an ATP-harvesting “biocell.” In the presence of ATP, the system pumped ions across the membrane, producing an electrical potential (voltage)* that was harvested by the integrated circuit.
“We made a macroscale version of this system, at the scale of several millimeters, to see if it worked,” Shepard notes. “Our results provide new insight into a generalized circuit model, enabling us to determine the conditions to maximize the efficiency of harnessing chemical energy through the action of these ion pumps. We will now be looking at how to scale the system down.”
While other groups have harvested energy from living systems, Shepard and his team are exploring how to do this at the molecular level, isolating just the desired function and interfacing this with electronics. “We don’t need the whole cell,” he explains. “We just grab the component of the cell that’s doing what we want. For this project, we isolated the ATPases because they were the proteins that allowed us to extract energy from ATP.”
The capability of a bomb-sniffing dog, no Alpo required
Next, the researchers plan to go much further, such as recognizing specific molecules and giving chips the potential to taste and smell.
The ability to build a system that combines the power of solid-state electronics with the capabilities of biological components has great promise, they believe. “You need a bomb-sniffing dog now, but if you can take just the part of the dog that is useful — the molecules that are doing the sensing — we wouldn’t need the whole animal,” says Shepard.
The technology could also provide a power source for implanted electronic devices in ATP-rich environments such as inside living cells, the researchers suggest.
* “In general, integrated circuits, even when operated at the point of minimum energy in subthreshold, consume on the order of 10−2 W mm−2 (or assuming a typical silicon chip thickness of 250 μm, 4 × 10⁻² W mm−3). Typical cells, in contrast, consume on the order of 4 × 10⁻⁶ W mm−3. In the experiment, a typical active power dissipation for the IC circuit was 92.3 nW, and the active average harvesting power was 71.4 fW for the biocell (the discrepancy is managed through duty-cycled operation of the IC).” — Jared M. Roseman et al./Nature Communications
There is enormous potential in combining the capabilities of the biological and the solid state to create hybrid engineered systems. While there have been recent efforts to harness power from naturally occurring potentials in living systems in plants and animals to power complementary metal-oxide-semiconductor integrated circuits, here we report the first successful effort to isolate the energetics of an electrogenic ion pump in an engineered in vitro environment to power such an artificial system. An integrated circuit is powered by adenosine triphosphate through the action of Na+/K+ adenosine triphosphatases in an integrated in vitro lipid bilayer membrane. The ion pumps (active in the membrane at numbers exceeding 2 × 106mm−2) are able to sustain a short-circuit current of 32.6pAmm−2 and an open-circuit voltage of 78mV, providing for a maximum power transfer of 1.27pWmm−2 from a single bilayer. Two series-stacked bilayers provide a voltage sufficient to operate an integrated circuit with a conversion efficiency of chemical to electrical energy of 14.9%.
(a) Illustration depicting biocell attached to CMOS integrated circuit. (b) Illustration of membrane in pore containing sodium–potassium pumps. (c) Circuit model of equivalent stacked membranes, =2.1pA, =98.6GΩ, =575GΩ and =75pF, Ag/AgCl electrode equivalent resistance RWE+RCE<20kΩ, energy-harvesting capacitor CSTOR=100nF combined with switch as an impedance transformation network (only one switch necessary due to small duty cycle), and CMOS IC voltage doubler and resistor representing digital switching load. RL represents the four independent ring oscillator loads. (d) Equivalent circuit detail of stacked biocell. (e) Switched-capacitor voltage doubler circuit schematic.
The energetics of living systems are based on electrochemical membrane potentials that are present in cell plasma membranes, the inner membrane of mitochondria, or the thylakoid membrane of chloroplasts1. In the latter two cases, the specific membrane potential is known as the proton-motive force and is used by proton adenosine triphosphate (ATP) synthases to produce ATP. In the former case, Na+/K+-ATPases hydrolyse ATP to maintain the resting potential in most cells.
While there have been recent efforts to harness power from some naturally occurring potentials in living systems that are the result of ion pump action both in plants2 and animals3, 4 to power complementary metal-oxide semiconductor (CMOS) integrated circuits (ICs), this work is the first successful effort to isolate the energetics of an electrogenic ion pump in an engineered in vitroenvironment to power such an artificial system. Prior efforts to harness power from in vitromembrane systems incorporating ion-pumping ATPases5, 6, 7, 8, 9 and light-activated bacteriorhodopsin9, 10, 11 have been limited by difficulty in incorporating these proteins in sufficient quantity to attain measurable current and in achieving sufficiently large membrane resistances to harness these currents. Both problems are solved in this effort to power an IC from ATP in an in vitro environment. The resulting measurements provide new insight into a generalized circuit model, which allows us to determine the conditions to maximize the efficiency of harnessing chemical energy through the action of electrogenic ion pumps.
ATP-powered IC
Figure 1a shows the complete hybrid integrated system, consisting of a CMOS IC packaged with an ATP-harvesting ‘biocell’. The biocell consists of two series-stacked ATPase bearing suspended lipid bilayers with a fluid chamber directly on top of the IC. Series stacking of two membranes is necessary to provide the required start-up voltage for IC and eliminates the need for an external energy source, which is typically required to start circuits from low-voltage supplies2, 3. As shown inFig. 1c, a matching network in the form of a switched capacitor allows the load resistance of the IC to be matched to that presented by the biocell. In principle, the switch S can be implicit. The biocell charges CSTOR until the self start-up voltage, Vstart, is reached. The chip then operates until the biocell voltage drops below the minimum supply voltage for operation, Vmin. Active current draw from the IC stops at this point, allowing the charge to build up again on CSTOR. In our case, however, the IC leakage current exceeds 13.5nA at Vstart, more than can be provided by the biocell. As a result, an explicit transistor switch and comparator (outside of the IC) are used for this function in the experimental results presented here, which are not powered by the biocell and not included in energy efficiency calculations (see Supplementary Discussion for additional details). The energy from the biocell is used to operate a voltage converter (voltage doubler) and some simple inverter-based ring oscillators in the IC, which receive power from no other sources.
…….. Prior to the addition of ATP, the membrane produces no electrical power and has an Rm of 280GΩ. A 1.7-pA short-circuit (SC) current (Fig. 2b) through the membrane is observed upon the addition of ATP (final concentration 3mM) to the cis chamber where functional, properly oriented enzymes generate a net electrogenic pump current. To perform these measurements, currents through each membrane of the biocell are measured using a voltage-clamp amplifier (inset of Fig. 2b) with a gain of 500GΩ with special efforts taken to compensate amplifier leakage currents. Each ATPase transports three Na+ ions from the cis chamber to the trans chamber and two K+ ions from thetrans chamber to the cis chamber (a net charge movement of one cation) for every molecule of ATP hydrolysed. At a rate of 100 hydrolysis events per second under zero electrical (SC) bias13, this results in an electrogenic current of ~16aA. The observed SC current corresponds to about 105 active ATPases in the membrane or a concentration of about 2 × 106mm−2, about 5% of the density of channels occurring naturally in mammalian nerve fibres14. It is expected that half of the channels inserted are inactive because they are oriented incorrectly.
(a)…Pre-ATP data linear fit (black line) slope yield Rm=280GΩ. Post ATP data fit to a Boltzmann curve, slope=0.02V (blue line). Post-ATP linear fit (red line) yields Ip=−1.8pA and Rp=61.6GΩ, which corresponds to a per-ATP source resistance of 6.16 × 10¹⁵. The current due to membrane leakage through R_{m} is subtracted in the post-ATP curve…. (b)…
Current–voltage characteristics of the ATPases
Figure 2a shows the complete measured current–voltage (I–V) characteristic of a single ATPase-bearing membrane in the presence of ATP. The current due to membrane leakage through Rm is subtracted in the post-ATP curve. The I–V characteristic fits a Boltzmann sigmoid curve, consistent with sodium–potassium pump currents measured on membrane patches at similar buffer conditions13, 15, 16. This nonlinear behaviour reflects the fact that the full ATPase transport cycle (three Na+ ions from cis to trans and two K+ ions from trans to cis) time increases (the turn-over rate, kATP, decreases) as the membrane potential increases16. No effect on pump current is expected from any ion concentration gradients produced by the action of the ATPases (seeSupplementary Discussion). Using this Boltzmann fit, we can model the biocell as a nonlinear voltage-controlled current source IATPase (inset Fig. 2a), in which the current produced by this source varies as a function of Vm. In the fourth quadrant, where the cell is producing electrical power, this model can be linearized as a Norton equivalent circuit, consisting of a DC current source (Ip) in parallel with a current-limiting resistor (Rp), which acts to limit the current delivered to the load at increasing bias (IATPase~Ip−Vm/Rp). Figure 2c shows the measured and simulated charging of Cm for a single membrane (open-circuited voltage). A custom amplifier with input resistance Rin>10TΩ was required for this measurement (see Electrical Measurement Methods).
Reconciling operating voltage differences
The electrical characteristics of biological systems and solid-state systems are mismatched in their operating voltages. The minimum operating voltage of solid-state systems is determined by the need for transistors to modulate a Maxwell–Boltzmann (MB) distribution of carriers by several orders of magnitude through the application of a potential that is several multiples of kT/q (where kis Boltzmann’s constant, T is the temperature in degrees Kelvin and q is the elementary charge). Biological systems, while operating under the same MB statistics, have no such constraints for operating ion channels since they are controlled by mechanical (or other conformational) processes rather than through modulation of a potential barrier. To bridge this operating voltage mismatch, the circuit includes a switched-capacitor voltage doubler (Fig. 1d) that is capable of self-startup from voltages as low Vstart=145mV (~5.5kT/q) and can be operated continuously from input voltages from as low as Vmin=110mV (see Supplementary Discussion)…..
Maximizing the efficiency of harvesting energy from ATP
Solid-state systems and biological systems are also mismatched in their operating impedances. In our case, the biocell presents a source impedance, =84.2GΩ, while the load impedance presented by the complete integrated circuit (including both the voltage converter and ring oscillator loads) is approximately RIC=200kΩ. (The load impedance, RL, of the ring oscillators alone is 305kΩ.) This mismatch in source and load impedance is manifest in large differences in power densities. In general, integrated circuits, even when operated at the point of minimum energy in subthreshold, consume on the order of 10−2Wmm−2 (or assuming a typical silicon chip thickness of 250μm, 4 × 10⁻²Wmm−3) (ref. 17). Typical cells, in contrast, consume on the order of 4 × 10⁻⁶Wmm−3 (ref. 18). In our case, a typical active power dissipation for our circuit is 92.3nW, and the active average harvesting power is 71.4fW for the biocell. This discrepancy is managed through duty-cycled operation of the IC in which the circuit is largely disabled for long periods of time (Tcharge), integrating up the power onto a storage capacitor (CSTOR), which is then expended in a very brief period of activity (Trun), as shown in Fig. 3a.
The overall efficiency of the system in converting chemical energy to the energy consumed in the load ring oscillator (η) is given by the product of the conversion efficiency of the voltage doubler (ηconverter) and the conversion efficiency of chemical energy to electrical energy in the biocell (ηbiocell), η=ηconverter × ηbiocell. ηconverter is relatively constant over the range of input voltages at ~59%, as determined by various loading test circuits included in the chip design (Supplementary Figs 1–6). ηbiocell, however, varies with transmembrane potential Vm. η is the efficiency in transferring power to the power ring oscillator loads from the ATP harvested by biocell.
…….
To first order, the energy made available to the Na+/K+-ATPase by the hydrolysis of ATP is independent of the chemical or electric potential of the membrane and is given by |ΔGATP|/(qNA), where ΔGATP is the Gibbs free energy change due to the ATP hydrolysis reaction per mole of ATP at given buffer conditions and NA is Avogadro’s number. Since every charge that passes through IATPase corresponds to a single hydrolysis event, we can use two voltage sources in series with IATPase to independently account for the energy expended by the pumps both in moving charge across the electric potential difference and in moving ions across the chemical potential difference. The dependent voltage source Vloss in this branch fixes the voltage across IATPase, and the total power produced by the pump current source is (|ΔGATP|/NA)(NkATP), which is the product of the energy released per molecule of ATP, the number of active ATPases and the ATP turnover rate. The power dissipated in voltage source Vchem models the work performed by the ATPases in transporting ions against a concentration gradient. In the case of the Na+/K+ ATPase,Vchem is given by . The power dissipated in this source is introduced back into the circuit in the power generated by the Nernst independent voltage sources, and . The power dissipated in the dependent voltage source Vloss models any additional power not used to perform chemical or electrical work. ……
Integration of ATP-harvesting ion pumps could provide a means to power future CMOS microsystems scaled to the level of individual cells22. In molecular diagnostics, the integration of pore-forming proteins such as alpha haemolysin23 or MspA porin24 with CMOS electronics is already finding application in DNA sequencing25. Exploiting the large diversity of function available in transmembrane proteins in these hybrid systems could, for example, lead to highly specific sensing platforms for airborne odorants or soluble molecular entities26, 27. Heavily multiplexed platforms could become high-throughput in vitro drug-screening platforms against this diversity of function. In addition, integration of transmembrane proteins with CMOS may become a convenient alternative to fluorescence for coupling to synthetic biological systems28.
Himes, C., Carlson, E., Ricchiuti, R. J., Otis, B. P. & Parviz, B. A.Ultralow voltage nanoelectronics powered directly, and solely, from a tree. IEEE Trans. Nanotechnol.9, 2–5(2010).
Mercier, P. P., Lysaght, A. C., Bandyopadhyay, S., Chandrakasan, A. P. & Stankovic, K. M.Energy extraction from the biologic battery in the inner ear. Nat. Biotechnol.30, 1240–1243(2012).
Cell Death Pathway Insights, Volume 2 (Volume Two: Latest in Genomics Methodologies for Therapeutics: Gene Editing, NGS and BioInformatics, Simulations and the Genome Ontology), Part 2: CRISPR for Gene Editing and DNA Repair
Cell Death Pathway Insights
Larry H. Bernstein, MD, FCAP, Curator
LPBI
Phosphorylation and activation of ubiquitin-specific protease-14 by Akt regulates the 1 ubiquitin-proteasome system
Daichao Xu1,2, Bing Shan1,4, Byung-Hoon Lee3,4, Kezhou Zhu1,4, Tao Zhang1,4, Huawang Sun1, 4 Min Liu1, Linyu Shi1, Wei Liang1, et al.
eLife 2015;10.7554/eLife.10510 DOI: http://dx.doi.org/10.7554/eLife.10510
In this study, we report that USP14 is an Akt substrate and that this phosphorylation activates the DUB activity of USP14 both in vitro and in cells. We also demonstrate that phosphorylation of USP14 is critical for Akt to control UPS and consequentially global protein degradation via the UPS.
Regulation of ubiquitin-proteasome system (UPS), which controls the turnover of short-lived proteins in eukaryotic cells, is critical in maintaining cellular proteostasis. Here we show that 40 USP14, a major deubiquitinating enzyme that regulates the UPS, is a substrate of Akt, a serine/threonine-specific protein kinase critical in mediating intracellular signaling transducer for growth factors. We report that Akt-mediated phosphorylation of USP14 at Ser432, which normally blocks its catalytic site in the inactive conformation, activates its deubiquitinating activity in vitro and in cells. We also demonstrate that phosphorylation of USP14 is critical for Akt to regulate proteasome activity and consequently global protein degradation. Since Akt can be activated by a wide range of growth factors and is under negative control by phosphoinosotide phosphatase PTEN, we suggest that regulation of UPS by Akt-mediated phosphorylation of USP14 may provide a common mechanism for growth factors to control global proteostasis and for promoting tumorigenesis in PTEN-negative cancer cells.
The ubiquitin-proteasome system (UPS), a major degradative mechanism in eukaryotic cells, is involved in the degradation of short-lived proteins as well as misfolded and damaged proteins 69 (Komander and Rape, 2012). The 26S proteasome specifically targets and degrades proteins conjugated to ubiquitin. Regulation of protein deubiquitination by deubiquitinating enzymes (DUBs) is recognized as an important regulatory step in the ubiquitin-proteasome system. USP14, a deubiquitinating enzyme reversibly associated with the proteasome, negatively regulates the activity of proteasomes by trimming ubiquitin chains on proteasome-bound substrates (Borodovsky et al., 2001; Koulich et al., 2008; Lee et al., 2010). Purified recombinant USP14 is largely inactive and can be highly activated when in association with proteasome (Hu 76 et al., 2005; Koulich et al., 2008; Lee et al., 2010). However, a significant fraction of USP14 is present intracellularly in a proteasome-free state (Koulich et al., 2008) and it is not clear if and how proteasome-free USP14 might serve a significant physiological function. Akt, a serine/threonine-specific protein kinase and an important intracellular signaling transducer for growth factors such as insulin, is involved in regulating cell proliferation, metabolism, transcription, migration and apoptosis (Manning and Cantley, 2007). The activity of Akt is regulated by PI(3,4,5)P3, a lipid product of the phosphoinositide 3-kinases (PI3Ks). The intracellular levels of PI(3,4,5)P3 are negatively regulated by phosphatases such as SHIP1/2 and PTEN. The latter, a phosphoinoside phosphatase, is encoded by a tumor suppressor gene that is mutated in human cancers at high frequency (Cantley and Neel, 1999). Akt has been reported to mediate the phosphorylation of many substrates that in turn regulate cell proliferation, metabolism, transcription, migration and apoptosis. However, very little is known about its role in the UPS, and furthermore no mechanistic link between Akt and UPS has been elucidated.
Two forms of USP14 have been determined crystallographically: the inactive free form and an adduct between Ub-aldehyde (Ubal) and USP14, which provides insight into the catalytically active state (Hu et al., 2005). The key difference between these two structures is in the position of the blocking loops, BL1 and BL2, which project over the catalytic cleft of USP14 and block the access of the C-terminal residues of ubiquitin in the inactive form (Figure 1A). In Ubal-modified USP14, BL1 and BL2 are rearranged, thus exposing the cleft. In particular, Ser432, located within BL2, shifts its position over a distance of 3-5Å between the two states (Hu et al., 2005) (Figure 1B). Since Ser432 residue is located very close to a highly negatively charged patch (Figure 107 1C), we reasoned that when Ser432 residue was phosphorylated, the negatively charged phosphate group might induce a repulsive force, thereby inducing rearrangement of the BL2 loop and removing the inhibitory effect of this loop on the activity of USP14. The amino acid 110 sequences around Ser432 are highly evolutionarily conserved among USP14 orthologues 111 (Figure 1D) and Ser432 is predicted to be an Akt substrate by Scansite (http://scansite3.mit.edu/#home). We therefore tested the possibility that USP14 might be a substrate of activated Akt. We first examined the interaction between USP14 and Akt using a co-immunoprecipitation assay. As shown in Figure1-figure supplement 1A, when USP14 and Akt were overexpressed in HEK293T cells, their interaction was readily detectable. To test whether Akt could phosphorylate USP14, we overexpressed USP14 and an activated Akt (Myr-Akt) in HEK293T cells, and performed a quantitative phosphoproteomic analysis (Figure 118 1-figure supplement 1B). We identified four phosphorylation sites on USP14 when it was 119 expressed alone: Ser143, Ser230, Thr235, and Ser432 (Figure 1-figure supplement 1C-D). Notably, the phosphorylation levels of two of the four sites, Ser143 and Ser432, were increased considerably in cells expressing activated Akt (Figure 1E).
Figure 1. Structural basis of USP14 activation by phosphorylation of Ser432. (A) Detailed view of blocking loop 2 (BL2), which occludes the active site of USP14 (PDB access code 2AYN). The BL2 loop, which contains Ser432, is shown in stick model, in the apo form. (B) Combined ribbon representation and stick model showing a comparison of the conformations of the BL2 loop containing in the apo form (blue, PDB access code 2AYN) and in the USP14-Ubal adduct (orange, PDB access code 2AYO). In this drawing, the Ser432 and Cys114 residues are 504 shown in stick model, and the bound Ubal (a ubiquitin derivative in which the C-terminal 505 carboxylate is replaced by an aldehyde) in the complex is drawn in green. (C) A surface charge potential representation (contoured at ±7 kT/eV; blue/red) of USP14 (PDB accession 2AYN) showing that the S432 residue is very close to a highly negatively charged patch mainly formed by the acidic E188, D199 and E202 residues. When S432 is phosphorylated, the negatively charged phosphate group may induce a repulsive force, thereby relieving inhibition of the catalytic activity of USP14. (D) USP14 domain organization and sequence alignment of the Akt 511 phosphorylation site within USP14 orthologues from different species. Two blocking loops (BL1 512 and BL2) covering the USP14 active site are shown. The Akt phosphorylation site in USP14 from different species as predicted by Scansite. (E) S432 is the major phosphorylation site in USP14. HEK293T cells were treated as in Figure 1-figure supplement 1B, followed by ESI-MS analysis. Spectral counts were determined by ESI-MS. (F) Akt phosphorylates USP14 in vitro. Bacterially expressed and purified USP14 was incubated with active Akt in the presence of ATP. Reaction products were resolved by SDS-PAGE, and phosphorylated species were detected by a phospho-Ser antibody.
Since Ser432 residue is located very close to a highly negatively charged patch (Figure 107 1C), we reasoned that when Ser432 residue was phosphorylated, the negatively charged phosphate group might induce a repulsive force, thereby inducing rearrangement of the BL2 loop and removing the inhibitory effect of this loop on the activity of USP14. The amino acid sequences around Ser432 are highly evolutionarily conserved among USP14 orthologues (Figure 1D) and Ser432 is predicted to be an Akt substrate by Scansite (http://scansite3.mit.edu/#home). We therefore tested the possibility that USP14 might be a substrate of activated Akt. We first examined the interaction between USP14 and Akt using a co-immunoprecipitation assay. As shown in Figure1-figure supplement 1A, when USP14 and Akt were overexpressed in HEK293T cells, their interaction was readily detectable. To test whether Akt could phosphorylate USP14, we overexpressed USP14 and an activated Akt (Myr-Akt) in HEK293T cells, and performed a quantitative phosphoproteomic analysis (Figure 1-figure supplement 1B). We identified four phosphorylation sites on USP14 when it was expressed alone: Ser143, Ser230, Thr235, and Ser432 (Figure 1-figure supplement 1C-D). Notably, the phosphorylation levels of two of the four sites, Ser143 and Ser432, were increased considerably in cells expressing activated Akt (Figure 1E).
To examine whether USP14 is a direct substrate for Akt, we conducted an in vitro kinase 123 assay using activated recombinant Akt and purified recombinant USP14 expressed in E. coli. We 124 found that co-incubation of USP14 and Akt led to modification of USP14 as detected by a pan phospho-Ser antibody (Figure 1F), suggesting that USP14 is a substrate for Akt.
Figure 1-figure supplement 1. Akt phosphorylates USP14. (A) Akt interacts with USP14. HEK293T cells were transfected with indicated plasmids for 24 h. The cell lysates were collected for co-immunoprecipitation and western blotting analysis. (B) Schematic representation of mass spectrometry assay to determine USP14 phosphorylation sites by Akt. (C) Four phosphorylation sites of USP14 were determined by mass spectrometry. (D) The representative MS/MS spectrum of phosphorylated tryptic peptide ‘SSSphosSGHYVSWVK’ of human USP14 protein. The peptide sequence ‘SSSphosSGHYVSWVK’ containing phosphorylated S432 was identified by shotgun analysis using mass spectrometry when USP14 was co-expressed with Myr-Akt in HEK293T cells. Fragmentation ion of the amide bond of the peptide result in formation of ‘b’ ion and ‘y’ ion series corresponding to the N-terminal and C-terminal fragments respectively. Representative ions with phosphorylation and H2O loss were manually labeled in red on the spectrum.
To determine if Ser143 and Ser432 were indeed phosphorylated by Akt, we used this pan phospho-Ser antibody as above and found phosphorylation of WT USP14, but not of S143A/S432A mutant USP14, after incubating with activated Akt in a kinase assay (Figure 2A). To differentiate the relative importance of Ser143 and Ser432 as phosphorylation sites by Akt, we overexpressed activated Akt (Myr-Akt) in HEK293T cells with WT, S143A, S432A or double S143A/S432A (AA) mutants. We found that S143A mutant showed partially reduced phosphorylation as compared to that of WT, whereas phosphorylation of the USP14 S432A mutant was significantly decreased and that of AA double mutant was completely eliminated (Figure 2B). These results suggested S432 as a major and S143 as a minor phosphorylation site of Akt.
The phosphorylation of USP14 by Akt was further confirmed using an Akt phosphorylation-consensus motif (R××S/T) antibody (Figure 2-figure supplement 1A). The reactivity of USP14 with pan phospho-Ser antibody was eliminated after incubation with lambda phosphatase (Figure 2C). Notably, the phosphorylation levels of USP14 were decreased in cells when treated with MK2206, an inhibitor of Akt (Figure 2D), or when serum deprived, a condition known to inactivate endogenous Akt (Zhang et al., 2015) (Figure 2D).
To further verify the phosphorylation of USP14 S432 by Akt, we developed a phospho-Ser432 specific antibody. Phosphorylation of S432 can be detected after incubation of WT, but not S432A mutant USP14, with recombinant activated Akt in a kinase reaction (Figure 145 2E). This was further confirmed by using phos-tag electrophoresis which can specifically retard the migration of phosphorylated protein species (Kinoshita et al., 2009) (Figure 2E). Expression of Myr-Akt also led to S342 phosphorylation of endogenous USP14 (Figure 2F). Treatment with either MK2206 or AZD5363, two structurally unrelated Akt inhibitors, led to decrease of USP14 S432 phosphorylation levels (Figure 2-figure supplement 1B-C). Moreover, treatment with PI3K inhibitors, either Wortmannin or GDC0941, but not ERK1/2 inhibitor U0126, also significantly decreased the phosphorylation levels of USP14 S432 (Figure 2-figure supplement 152 1D-E). In addition, we tested growth factors such as IGF-1 or EGF, both of which are known to promote activation of Akt. We found that the treatment of IGF-1 or EGF resulted in phosphorylation of USP14 S432, which was blocked in cells pre-treated with MK2206 (Figure 155 2G-H). Finally, USP14 S432 is dramatically more phosphorylated in PTEN knockout mouse embryonic fibroblasts (MEFs), which carry high levels of Akt activity, than that of WT MEFs as determined by western blotting using the phospho-USP14(S432) antibody and phos-tag electrophoresis (Figure 2I), and the phosphorylation of USP14 S432 was blocked by Akt inhibitors (Figure 2-figure supplement 1F). From these results, we conclude that Ser432 of USP14 is a major phosphorylation site by Akt.
Figure 2. USP14 is phosphorylated at Ser432 by activated Akt. (A) In vitro phosphorylation 521 of USP14 at S432 by Akt. Bacterially expressed and purified wide type USP14 or AA mutant incubated with active Akt in the presence of ATP. Reaction products were resolved by SDS-PAGE, and phosphorylation was detected by the phospho-Ser antibody. (B) Akt phosphorylates USP14 at S432 in vivo. Western blot analysis of whole cell lysate and immunoprecipitates derived from HEK293T cells transfected with wild type USP14, USP14 S143A, USP14 S432A and USP14 S143A/S432A (AA) constructs using the phospho-Ser antibody. L.E., long exposure. (C) Immunoprecipitation (IP) and IB analysis of HEK293T cells transfected with HA-USP14 and Myr-Akt and preincubated with or without λ-phosphatase as indicated. (D) Inhibition of Akt decreased exogenous USP14 phosphorylation. HEK293T cells were transfected with Myc-USP14 for 20 h then treated with 1 μM MK2206 or deprived of serum for another 4 h before harvest. (E) In vitro kinase assay to detect Akt phosphorylation of USP14 by phospho-Ser432 specific antibody and phos-tag-containing gels. Bacterially expressed and purified wide type USP14 or S432A mutant was incubated with active Akt in the presence of ATP. The reaction products were resolved by SDS-PAGE, and USP14 phosphorylation was detected using an antibody that specifically recognizes Ser432 phosphorylation of USP14 or determined by differential migration on phos-tag gels. (F) In vivo detection of endogenous USP14 Ser432 phosphorylation by anti-p-Ser432 specific antibody. Western blot analysis of immunoprecipitates derived from H4 cells transfected with or without Myr-Akt plasmids using the anti-p-Ser432 specific antibody. (G, H) Phosphorylation of endogenous USP14 S432 upon 540 stimulation with IGF-1 or EGF. HEK293T cells were serum-starved and pre-treated with Akt inhibitor MK2206 (1 μM) for 30 min before stimulation with IGF-1 (100 ng/mL) for 30 min (G) or EGF (100 ng/mL) for 1 h (H). The cell lysates were immunoprecipitated with USP14 antibody and western-blotted with anti-p-S432 antibody. (I) Phosphorylation of endogenous USP14 S432 in Pten knockout cells with high activity of Akt. Lysates from MEFs with indicated genotypes 545 were immunoprecipitated with USP14 antibody and then western-blotted with p-S432 antibody. The differential migration of phospho-USP14 on phos-tag-containing gels was determined as shown in the bottom panel.
Activation of USP14 by Akt mediated phosphorylation Because bacterially expressed and purified USP14 protein exhibits very low catalytic activity (Lee et al., 2010), we tested whether Akt-mediated phosphorylation might activate the DUB activity of USP14. We compared the activity of recombinant USP14 in a Ub-AMC (ubiquitin-7-amido-4-methylcoumarin, a fluorogenic substrate) hydrolysis assay in the presence or absence of Akt. Bacterially expressed and purified USP14 (Figure 3-figure supplement 1) showed trace hydrolyzing activity towards Ub-AMC as reported (Lee et al., 2010), while USP14 incubated with Akt showed high activity (Figure 3A). To validate Akt-mediated activation of USP14 in cells, we co-expressed USP14 and Myr-Akt in HEK293T cells. USP14 immunoprecipitated from cells co-expressing activated Akt showed higher activity in Ub-AMC assay than that expressed alone (Figure 3B). On the other hand, USP14 isolated from HEK293T cells incubated with Akt inhibitor MK2206 showed reduced activity in Ub-AMC assay (Figure 3C). Moreover, USP14 isolated from HEK293T cells stimulated with IGF-1 showed higher
activity, which was suppressed when cells were pre-treated with MK2206 (Figure 3D). To determine the specific contribution of Ser432, we compared the activity of USP14 S432A mutant protein in Ub-AMC assay with that of WT in the presence of Akt, and found that the stimulating effect of Akt on the hydrolyzing activity of USP14 was largely blocked by S432A mutation (Figure 3E), but not by S143A mutation (Figure 3-figure supplement 2B).
To further characterize the effect of Ser432 phosphorylation, we expressed and purified recombinant S432E USP14 protein, which mimics the phosphorylation state of USP14, from E. coli (Figure 3-figure supplement 1) and analyzed its activity by Ub-AMC assay. Interestingly, we found that USP14 S432E mutant protein alone showed high levels of Ub-AMC hydrolyzing activity (Figure 3F). Consistent with S432 as the major phosphorylation site by Akt, double E mutant (S143E/S432E) showed almost the same levels of hydrolyzing activity as that of S432E single mutant and S143E mutation had no significant impact on the activity of USP14 (Figure 3-figure supplement 2C-D). To determine its enzyme kinetics, we incubated USP14 S432E mutant protein with increasing amounts of Ub-AMC (Figure 3-figure supplement 2E) and determined the Km value (Km = 26 μM) from the slope of a Lineweaver-Burk plot (Figure 3G).
We characterized the distributions of p-S432 USP14 and total USP14 with that of proteasome in Pten-/- MEFs using glycerol gradient centrifugation (Koulich et al., 2008). We found that majority of p-S432 USP14 was distributed in the fractions with lower molecular weight proteins and distinguishable from the fractions where larger protein complexes, such as proteasomes, were localized. On the other hand, unphosphorylated USP14 was found in the fractions where larger molecular weight complexes, such as proteasome, are known to be localized (Figure 3-figure supplement 2F). Thus, S432 phosphorylated and unphosphorylated USP14 might be distributed differently in the cells. We next determined whether phospho-mimetic mutant of USP14 could be further activated by interacting with proteasome. Interestingly, we found that the Ub-AMC hydrolytic activity of S432E mutant could be further 200 activated when incubated with proteasome in vitro (Figure 3H). Taken together, these results suggest that S432 phosphorylation and intraction with proteasome may be two different
regulatory mechanisms for USP14.
Figure 3. Phosphorylation of USP14 by Akt activates USP14 DUB activity. (A) Akt activates USP14 DUB activity in vitro. USP14 protein (1μg) was incubated with or without active Akt (1 μg) in kinase assay buffer in a total volume of 50 μL for 1 h at 30oC, then the reaction mixtures were subjected to Ub-AMC assay. RFU, relative fluorescence units. (B, C) Akt activates USP14 in cells. USP14 was immunoprecipitated from HEK293T cells co-expressed with activated Akt (B) or treated with 10 μM MK2206 for 4h (C) and then eluted with HA-peptide following Ub-AMC hydrolysis assay. (D) Activation of USP14 by stimulating cells with IGF-1. HEK293T cells were serum-starved and pre-treated with or without Akt inhibitor MK2206 (1 μM) for 30 min before stimulation with IGF-1 (100ng/mL) for 30 min. USP14 was then immunoprecipitated and eluted with HA-peptide. The activity of USP14 was determined using Ub-AMC hydrolysis assay. (E) USP14 activation by Akt is blocked by S432A mutation. Ub-AMC hydrolysis assay of wide type USP14 or S432A mutant in the presence or absence of active Akt. (F) Ub-AMC hydrolysis assay of bacterially expressed and purified wide type USP14 or S432E mutant. (G) Lineweaver-Burk analysis of USP14 S432E, obtained by measuring the initial rates at varying Ub-AMC concentrations (see Figure 3-figure supplement 2E for reference). (H) The activity of phospho-mimetic USP14 mutant can be further stimulated by the presence of proteasome. Ub-AMC hydrolysis assay of wild type USP14 or S432E mutant in the presence or absence of Ub-VS-treated human proteasome [VS-proteasome (see Lee et al., 2010); 1 nM]. Ptsm, 26S proteasome.
Phosphorylation of USP14 promotes both K48 and K63 deubiquitination activity To assess the impact of USP14 phosphorylation on its selectivity towards different types of 206 ubiquitin linkages, we incubated USP14 WT and S432E mutant protein with diubiquitin species of K48, K63 and linear linkages. Conversion to monomeric Ub was monitored via SDS-PAGE followed by western blotting. We observed significantly increased hydrolytic activity of S432E mutant, as compared to that of WT, towards both Lys48 and Lys63 diubiquitin, while linear diubiquitin was not readily cleaved by WT or mutant USP14 (Figure 4A-B and Figure 4-figure supplement 1A). Similarly, immunoprecipitated USP14 from cells showed significant activity toward both Lys48 and Lys63 diubiquitin, but not linear diubiquitin (Figure 4-figure supplement 1B-C). In contrast, S432A mutant immunoprecipitated from cells showed lower activity towards both Lys48 and Lys63 diubiquitin than that of WT (Figure 4C). Regulation of ubiquitin-proteasome system by Akt depends on phosphorylation of USP14. Since USP14 is a negative regulator of the UPS (Koulich et al., 2008; Lee et al., 2010; Lee et al., 2011) and we found USP14 can be phosphorylated and activated by Akt, we reasoned that 219 Akt-mediated activation of USP14 might lead to inhibition of the ubiquitin-proteasome system (UPS) and generally enhance the stability of many proteins. To this end, we generated a stable 221 cell line expressing GFP-CL1 (also known as GFPu), an engineered ubiquitin-dependent proteasome substrate widely used as a reporter for UPS activity (Bence et al., 2001; Kelly et al., 2007; Li et al., 2013; Liu et al., 2014) (Figure 5-figure supplement 1A-C). Treatment of cells with Akt inhibitors or serum deprivation or PI3K inhibitor, all of which can block Akt activity (Zhang et al., 2015), led to reduced level of GFP-CL1 as detected by both western blotting and fluorescence microscopy (Figure 5A-C and Figure 5-figure supplement 1D). Conversely, the expression of activated Akt (Myr-Akt) led to increased levels of GFP-CL1 protein. Treatment of WT H4 cells with IGF-1 or EGF also led to increased levels of GFP-CL1 protein (Figure 5D-G and Figure 5-figure supplement 1E). In contrast, in USP14 knockout H4 cells (generated using CRISPR/Cas9 technology, Figure 5-figure supplement 2A-D), the expression of Myr-Akt did not affect the levels of GFP-CL1 (Figure 5H). From these results, we conclude that Akt 232 negatively regulates the UPS in an USP14-dependent manner.
We next tested the importance of USP14 phosphorylation for Akt to regulate UPS. We found that in contrast to USP14 WT reconstituted H4 cells, USP14 AA mutant reconstituted H4 cells showed no increase in the accumulation of GFP-CL1 in response to the expression of activated Akt (Figure 5-figure supplement 2E and Figure 5I). As a control, we found that the expression of Akt had no effect on a ubiquitin-independent substrate of the proteasome, C-terminal ornithine decarboxylase-GFP (GFP-cODC) (Hoyt et al., 2005; Kelly et al., 2007; Lee et al., 2010) (Figure 5-figure supplement 2F-G), suggesting that Akt does not inhibit the UPS through a general inhibition of the proteasome itself. Taken together, these data show that 241 phosphorylation of USP14 by Akt is important for this kinase to negatively regulate the UPS in a ubiquitin-dependent manner.
Phosphorylation of USP14 regulates global protein degradation To further understand the physiological roles of Akt-mediated USP14 phosphorylation and subsequently activation, we sought to study the impact of USP14 phosphorylation on global protein degradation. Since the loss of USP14 accelerates cellular proteolysis (Koulich et al., 2008; Lee et al., 2010), we performed a quantitative proteomic analysis to determine the levels of proteins in WT H4 cells, H4 USP14-KO cells, and H4 USP14-KO cells complemented with WT USP14, S143A/S432A (AA) or S143D/S432D (DD) mutants. Using an isobaric TMT labeling approach, our mass spectrometry analysis identified 18,400 peptides with high confidence (q<0.01), corresponding to 3,648 proteins with a minimum of two peptides from each protein. 2,763 proteins, which were quantified in at least 2 replicates, were subjected to further analysis. We found the global protein patterns of H4 USP14-KO cells were similar to those of H4 USP14 KO-AA cells, but distinct from those of WT H4 cells. We identified a common set of 87 proteins that were reduced in H4 KO cells as compared to H4 WT cells or to H4 KO cells complemented with WT USP14 (KO-WT) (Figure 6, Lane1-2). The levels of these proteins were also significantly reduced in H4 KO-AA cells (Figure 6, Lane 3). Importantly, the levels of this set of 87 proteins in H4 KO-DD cells were significantly higher than that of H4 KO-AA cells (Figure 6, Lane 4).
Figure 6. Phosphorylation of USP14 regulates global protein degradation. The quantitative 605 analysis of proteome change in USP14 knockout or USP14 mutant cells were performed by 606 TMT-isobaric labeling followed by shotgun analysis. The heat map was plotted based on the set of 87 proteins that are down-regulated greater than or equal to 1.2 fold in H4 KO cells compared to H4 WT cells or to H4 KO cells complemented with WT USP14 (KO-WT). The log base 2 of average ratios was plotted as indicated.
To verify that the identified changes in protein abundance were due to proteasomal degradation, we treated H4 KO-AA cells with proteasome inhibitor MG132 and analyzed the protein level change of these 87 proteins. We found that the levels of these proteins increased significantly in MG132-treated KO-AA cells compared to that of control KO-AA cells (Figure 6, Lane 5), suggesting that these proteins were indeed subject to an increased rate of proteasome degradation with expression of non-phosphorylatable USP14. Interestingly, the top hit on this list of 87 proteins that were differentially regulated upon the loss of USP14 is mTOR, a central established regulator of cellular metabolism and tumorigenesis. We confirmed the role of USP14 on the levels of mTOR by western blotting. We found that the levels of mTOR were reduced inH4 KO and H4 KO cells complemented with USP14 AA mutant, but restored upon the expression of USP14 DD mutant (Figure 6-figure supplement 1). Taken together, our results suggest that phosphorylation of USP14 may provide a mechanism for Akt to regulate global protein degradation through the proteasome, which in turn may control key cellular pathways involved in regulating metabolism and tumorigenesis.
NF-kB-Independent Role of IKKa/IKKb in Preventing RIPK1 Kinase-Dependent Apoptotic and Necroptotic Cell Death during TNF Signaling
IKKa/IKKb prevent RIPK1 kinase-dependent death independently of NF-kB activation
IKKa/IKKb directly phosphorylate RIPK1 in TNFR1 complex I
Impaired phosphorylation of RIPK1 correlates with enhanced binding to FADD/caspase-8
IKK kinase inhibition induces TNF-mediated RIPK1 kinasedependent cell death in vivo
In Brief Dondelinger et al. describe an unexpected NF-kB-independent function of the IKK complex in protecting against TNF-induced RIPK1 kinase-dependent cell death. In TNFR1 complex I, IKKa/ IKKb directly phosphorylates RIPK1, leading to a reduction in RIPK1’s ability to bind FADD/caspase-8 and to induce apoptosis.
TNF is a master pro-inflammatory cytokine. Activation of TNFR1 by TNF can result in both RIPK1-independent apoptosis and RIPK1 kinase-dependent apoptosisornecroptosis.Thesecelldeathoutcomes are regulated by two distinct checkpoints during TNFR1 signaling. TNF-mediated NF-kB-dependent induction of pro-survival or anti-apoptotic molecules is a well-known late checkpoint in the pathway, protecting cells from RIPK1-independent death. On the other hand, the molecular mechanism regulating the contribution of RIPK1 to cell death is far less understood. We demonstrate here that the IKK complex phosphorylates RIPK1 at TNFR1 complex I and protects cells from RIPK1 kinase-dependent death, independent of its function in NF-kB activation. We provide in vitro and in vivo evidence that inhibition of IKKa/IKKb or its upstream activators sensitizes cells to death by inducing RIPK1 kinase-dependent apoptosis or necroptosis. We therefore report on an unexpected, NF-kB-independent role for the IKK complex in protecting cells from RIPK1-dependent death downstream of TNFR1.
The IkB kinase (IKK) complex, composed of the regulatory subunit NEMO (also known as IKKg) and the two catalytic subunits IKKa and IKKb, plays a central role in the induction of immune and inflammatory responses as well as in promoting cell survival and tumorigenesis (Baldwin, 2012; Baud and Karin, 2009; Hayden and Ghosh, 2012; Liu et al., 2012). Its activation constitutes the ignition phase of the canonical NF-kB pathway, which
ultimately results in the translocation of NF-kB dimers to the nucleus, where they promote transcription of a myriad of genes involved in inflammation, survival, and tumorigenesis.
TNF is a master pro-inflammatory cytokine, and inappropriate TNF signaling has been demonstrated to drive many inflammatory diseases. Activation of TNFR1 by TNF promotes inflammation either directly by activating the canonical NF-kB pathway or indirectly by promoting cell death, which exacerbates inflammation by releasing damage-associated molecular patterns (DAMPs) as well as by affecting the permeability of the bodily barriers to microbes (Pasparakis and Vandenabeele, 2015). In most cell types, activation of TNFR1 does not induce death but triggers canonical NF-kB-dependent transcriptional upregulation of genes encoding pro-survival and pro-inflammatory molecules. Ligation of TNF to trimeric TNFR1 induces the rapid assembly of a plasma membrane-bound signaling complex, known as complex I, that contains TRADD, RIPK1, and the E3 ubiquitin ligases TRAF2, cIAP1, cIAP2, and LUBAC (Walczak, 2011). The conjugation of ubiquitin chains to RIPK1 by cIAP1/ cIAP2 generates binding sites for TAB2/TAB3 and NEMO and allows further recruitment and activation of TAK1 and IKKa/ IKKb (Bertrand et al., 2008; Ea et al., 2006; Gerlach et al., 2011; Kanayama et al., 2004; Mahoney et al., 2008; Wu et al., 2006). TAK1 activates the IKK complex by phosphorylation, resulting in the rapid and selective IKK-mediated phosphorylation of IkBa and in its subsequent ubiquitylation-dependent proteasomal degradation. IkBa degradation then permits translocation of the NF-kB heterodimer p50/p65 to the nucleus, where it induces transcription of multiple responsive genes, including pro-survival genes such as cFLIP (Hayden and Ghosh, 2014). The anti-apoptotic potential of cFLIP resides in its ability to counteract activation of caspase-8 from a cytosolic TRADD-FADD-caspase-8 cytosolic complex, named complex IIa, which is believed to originate from complex I internalization (Irmler et al., 1997; Micheau and Tschopp, 2003; Wang et al., 2008; Wilson et al., 2009). Accordingly, TNFR1-mediated RIPK1-independent apoptosis requires inhibition of the NF-kB response (Van Antwerp et al., 1996), commonly obtained in vitro by the use of pharmacological inhibitors of transcription or translation, respectively, Actinomycin D (ActD) and cycloheximide (CHX).
The NF-kB-mediated induction of pro-survival/anti-apoptotic molecules is, however, not the only cell death checkpoint in the TNFR1 pathway (O’Donnell and Ting, 2011). Indeed, altering activation of the canonical NF-kB pathway by inhibiting components located upstream of IkBa, namely, cIAP1/cIAP2, TAK1, and NEMO, was reported to further sensitize cells to death by additionally inducing RIPK1-dependent death (Dondelinger et al., 2013; Legarda-Addison et al., 2009; O’Donnell et al., 2012). Depending on the cellular context, activated RIPK1 accelerates cell death either by promoting assembly of a RIPK1FADD-caspase-8 cytosolic apoptotic complex, referred to as complex IIb (Wilson et al., 2009), or by promoting necroptosis via activation of the RIPK3-MLKL pathway (Pasparakis and Vandenabeele, 2015). Although initiated by cIAP1/cIAP2-mediated ubiquitylation of RIPK1 in complex I, the last molecular step in the regulation of this early RIPK1 kinase-dependent cell death checkpoint is currently unknown. In this study, we demonstrate that RIPK1 is a bona fide substrate of IKKa and IKKb and that IKKa/IKKb-mediated phosphorylation of RIPK1 in complex I protects cells from RIPK1 kinase-dependent death.
NEMO Deficiency and IKKa/IKKb Double Deficiencies Induce TNFR1-Mediated RIPK1 Kinase-Dependent Apoptosis We previously reported that the ubiquitin chains conjugated to RIPK1 by cIAP1/cIAP2 do not constitute the ultimate step regulating the contribution of RIPK1 to TNF-induced cell death. Indeed, genetic or pharmacological inhibition of TAK1 also drivesRIPK1-dependentdeathwithoutaffectingRIPK1ubiquitylation in complex I (Dondelinger et al., 2013). In this study, we investigated the role of the IKK complex in the regulation of this cell death checkpoint. Indeed, the IKK complex lies between TAK1andIkBainthepathway,andalthoughexpressionofaproteasome-resistant form of IkBa (IkBaSR) induces RIPK1-independent apoptosis (Dondelinger et al., 2013), NEMO deficiency was reported to sensitize cells to TNF-induced death by additionally promoting RIPK1-dependent apoptosis (Legarda-Addison et al., 2009). In absence of cIAP1/cIAP2 or TAK1, TNF-mediated RIPK1-dependent apoptosis was shown to rely on RIPK1 kinase activity (Dondelinger et al., 2013; Wang et al., 2008). To test whether this is also true in absence of NEMO, we first stimulated NEMO-deficient mouse embryonic fibroblasts (MEFs) with TNF in the absence or presence of Nec-1, a RIPK1 kinase inhibitor. Interestingly, we found that Nec-1 greatly, but not entirely,protectedNemo/MEFsfromTNF-induced apoptosis, as monitored by cell permeability, caspase-3 activity, and caspase-3 and caspase-8 processing (Figures 1A–1D, 1K, and 1L). These results indicated that, similarly as cIAP1/cIAP2 and TAK1, NEMO also regulates both RIPK1 kinase-dependent and RIPK1-independent cell death checkpoints downstream of TNFR1. To test whether this protective function of NEMO
reflects its role as adaptor protein recruiting IKKa and IKKb to TNFR1 complex I, we next stimulated Ikka/, Ikkb/, and Ikka//Ikkb/ MEFs with TNF. Interestingly, while IKKa or IKKb single deficiency had little effect on apoptosis induction (Figures 1E–1H), their combined depletion mimicked the phenotype observed in the Nemo/ MEFs (Figures 1I–1L), suggesting redundant roles of IKKa and IKKb downstream of NEMO in preventing RIPK1-dependent apoptosis. To exclude the possibility that the phenotypes observed in the various MEF genotypes were originating from intrinsic defects due to clonal expansion, we confirmed our findings in Ripk1+/+ and Ripk1/ MEFs depleted of IKK proteins by siRNA (Figure S1). Of note, NEMO siRNA had little effect on cell death induction in these experiments, probably due to the poor efficiency in repressing NEMO.
Figure 1. NEMO Deficiency and IKKa/IKKb Double Deficiencies Induce TNFR1-Mediated RIPK1 Kinase-Dependent Apoptosis (A–L)MEFsoftheindicatedgenotypesweretreatedwith20ng/mlhTNFinthepresenceorabsenceofNec-1,andcelldeath(A,C,E,G,andI)andcaspaseactivity (B, D, F, H, and J) were measured in function of time, respectively, by SytoxGreen positivity and DEVD-AMC fluorescence. Protein levels were determined by immunoblotting in unstimulated cells (K) or 15 hr poststimulation with the indicated compounds (L). Forthe celldeath results, error bars represent theSEM ofthreeindependent experiments. Forthe caspase-3activity results, error bars represent SDof triplicates of one representative experiment. See also Figure S1.
IKKa and IKKb Mediate Their Protective Effect on RIPK1 via Their Enzymatic Activities Because IKKa and IKKb are serine/threonine kinases, we next evaluated the requirement of their enzymatic activities for their ability to repress RIPK1-dependent apoptosis. To do so, we tested the effect of five different IKK inhibitors on TNF-induced death and found that all of them led to a combination of RIPK1 kinase-dependent and RIPK1-independent death, as observed in the Ikka//Ikkb/ MEFs (Figures S2A and S2B). We further confirmed RIPK1 kinase-dependent apoptosis induction using TPCA-1 (Figures 2A–2C), as this inhibitor had no effect on TNF-induced death in Ikka//Ikkb/ MEFs (Figure S2B). TPCA-1 was used at 5 mM, a concentration reported to inhibit both IKKa and IKKb kinase activities (IC50 = 400 nM and 17.9 nM for IKKa and IKKb, respectively) (Podolin et al., 2005). We demonstrated that the apoptotic cell death was mostly depending on RIPK1 kinase activity by either co-incubating cells with Nec-1 (Figures 2A–2C) or by stimulating RIPK1 kinase-dead-expressing MEFs (Ripk1 K45A)(Figures 2D and 2E) (Berger et al., 2014). Importantly, Nec-1 had no effect in Ripk1 K45A MEFs, excluding any off-target effect (Figures S2E andS2F). Of note, similar results were obtained upon pharmacological inhibition of cIAP1/cIAP2 or TAK1 (Figures 2F, 2G, S2C, and S2D). In line with a role of IKKa and IKKb downstream of cIAP1/cIAP2, TAK1, and NEMO in the pathway, we tested the effect of TPCA-1 on TNF-induced death in ciap1/2/, Tak1/, and Nemo/ MEFs and found no additional effect (Figures 2H–2K). Together, these results indicate that the kinase activities of IKKa/IKKb regulate, downstream of cIAP1/cIAP2, TAK1, and NEMO, both RIPK1 kinasedependent and RIPK1-independent cell death checkpoints.
Figure 2. IKKa and IKKb Mediate Their Protective Effect on RIPK1 via Their Enzymatic Activities (A, B,and D–K)Ripk1+/+ or MEFsof theindicated genotypes weretreated with20ng/ml hTNF inthepresenceof theindicated compounds, and celldeath (A,D,F, H, I, J, K) and caspase-3 activity (B, E, G) were measured in function of time, respectively, by SytoxGreen positivity and DEVD-AMC fluorescence. (C) Protein levels in wild-type MEFs determined by immunoblotting 4 hr poststimulation. Forthecell death results,error bars represent the SEMof three independent experiments. Forthe caspase-3 activity results, error bars represent SDoftriplicates of one representative experiment. See also Figure S2.
IKKa/IKKb Protect Cells from RIPK1-Dependent Apoptosis Independently of NF-kB We previously demonstrated that, in absence of cIAP1/cIAP2 or TAK1, RIPK1 contribution to TNF-induced death is regulated independently of a defect in the canonical NF-kB-dependent upregulation of pro-survival genes (Dondelinger et al., 2013). Moreover, NEMO was also reported to inhibit RIPK1 activation in an NF-kB-independent manner (Legarda-Addison et al., 2009; O’Donnell et al., 2012). IKKa and IKKb are best known for their roles in NF-kB activation, but NF-kB-independent functions have also been reported (Hinz and Scheidereit, 2014). To confirm that IKKa and IKKb regulate RIPK1 activation independently of the canonical NF-kB response, we took two different approaches. In the first one, we tested the effect of inhibiting IKKa/IKKb in conditions where the NF-kB response is prevented by incubating the cells with the translational inhibitor CHX. In the second, we used p65/ MEFs, which are defective for canonical NF-kB activation (Beg et al., 1995). As previously reported (Wang et al., 2008), apoptosis induced by TNF+CHX occurred with a slow kinetic and independently of RIPK1 kinase activity (Figures 3A–3C). Remarkably, a pretreatment with TPCA-1 greatly sensitized cells to apoptosis, and this sensitization was prevented by Nec-1 (Figures 3A– 3C, S3A, and S3B). Similar results were obtained when stimu
lating NF-kB-deficient p65/ MEFs with TNF and TPCA-1 (Figures 3D–3F) or in combination with TAK1 and cIAP1/ cIAP2 inhibitors (Figures S3C and S3D). Together, these results demonstrate that RIPK1-independent and -dependent apoptotic pathways are regulated by two different cell death checkpoints downstream of TNFR1 and that IKKa/IKKb regulate both of them in NF-kB-dependent and -independent manners, respectively.
Figure 3. IKKa/IKKb Protect Cells from RIPK1-Dependent Apoptosis Independently of NF-kB (A,B,D,andE)Ripk1+/+ (AandB)orp65/(DandE)MEFswerestimulatedwith20ng/mlhTNFinthepresenceoftheindicatedcompounds,andcelldeath(Aand D) and caspase activity (B and E) were measured in function of time, respectively, by SytoxGreen positivity and DEVD-AMC fluorescence. (C and F) Ripk1+/+ (C) or p65/ (F) MEFs were stimulated for, respectively, 15 hr and 8 hr with the indicated compounds, and protein levels were determined by immunoblotting. Forthe celldeath results, error bars represent theSEM ofthreeindependent experiments. Forthe caspase-3activity results, error bars represent SDof triplicates of one representative experiment. See also Figure S3.
Defective RIPK1 Phosphorylation in Complex I Correlates with RIPK1 Kinase-Dependent Contribution to TNF-Induced Apoptosis Knowing that the IKK complex physically interacts with RIPK1 in complex I, we hypothesized that the kinase-dependent role of IKKa/IKKb in preventing RIPK1 kinase-dependent apoptosis results from its ability to phosphorylate RIPK1. To test this hypothesis, we analyzed whether RIPK1 is phosphorylated in complex I and whether its phosphorylation state is altered in conditions affecting activation of IKKa/IKKb, but not when the pathway is inhibited downstream of IKKa/IKKb. Because RIPK1 is highly ubiquitylated in complex I (which prevents the detection by immunoblot of potential mobility shifts resulting from its phosphorylation), we removed the ubiquitin chains conjugated to RIPK1 by incubating complex I, pulled-down using FLAG-TNF, with the deubiquitylase USP2 (Figure 4A). By doing so, we observed that the pool of deubiquitylated RIPK1 was running at a higher molecular weight than normal and confirmed, by l-phosphatase treatment, that this mobility shift was resulting from phosphorylation, but not auto-phosphorylation since it was not inhibited by Nec-1 or in Ripk1 K45A MEFs (Figures 4A–4C). Remarkably, and in line with the model of cIAP1/ cIAP2-mediated ubiquitylation-dependent recruitment of TAK1 and NEMO/IKKa/IKKb to complex I and with our cell death results, we found that RIPK1 phosphorylation in complex I is affected in ciap1/2/, Tak1/, Nemo/, and Ikka//Ikkb/, but not in Ikka/, Ikkb/, and p65/ MEFs or in MEFs preincubated with CHX (Figures 4D, 4E, 4G, and 4H). Importantly, IKK activity is greatly affected (as observed by IkBa phosphorylation) in all conditions in which we observed impaired RIPK1 phosphorylation, thereby further demonstrating the link between RIPK1 phosphorylation and IKK enzymatic activities (Figure 4E). Defective RIPK1 phosphorylation in complex I was also observed following pharmacological inhibition of cIAP1/ cIAP2, TAK1, or IKKa/IKKb (Figure 4F).
Figure 4. Defective RIPK1 Phosphorylation in Complex I Correlates with RIPK1 Kinase-Dependent Contribution to TNF-Induced Apoptosis (A–H) Ripk1+/+ MEFs (A, B, F, and H) or MEFs with the indicated genotype (C, D, E, and G) were stimulated for 5 min with 2 mg/ml FLAG-hTNF in the presence or absence of the indicated compounds. TNFR1 complex I was then FLAG immunoprecipitated, incubated with the deubiquitylating enzyme USP2 or lambda phosphatase (l PPase) when indicated, and RIPK1 ubiquitylation and phosphorylation finally analyzed by immunoblotting. * indicates an aspecific band. See also Figure S7
Direct Phosphorylation of RIPK1 by IKKa/IKKb Prevents RIPK1 from Integrating Complex IIb To test the direct contribution of IKKa/IKKb to RIPK1 phosphorylation, we next performed in vitro kinase assays using recombinant proteins and included Nec-1 in the reactions to prevent RIPK1 autophosphorylation. We found that both IKKa and IKKb directly phosphorylated full-length RIPK1 or a mutated version lacking the death and RHIM domain (RIPK11–479)(Figures 5A, 5B, and S4A). Of note, RIPK1 phosphorylation by IKKb induced a mobility shift of RIPK1 not detected when using IKKa (Figures 5A and 5B), suggesting some specificity in the residues phosphorylated by both kinases. In line with our cellular data, TPCA-1 repressed, although with different efficiencies, the direct phosphorylation of RIPK1 by IKKa and IKKb. In contrast, recombinant TAB1/TAK1 did notlead to detectable RIPK1 phosphorylation by autoradiography (Figure 5C).
We next tested the consequence of genetic or pharmacological inhibition of IKKa/IKKb, and of the resulting defective phosphorylation of RIPK1 in complex I, on the ability of RIPK1 to integrate the cytosolic caspase-8-activating complex IIb. We found, by performing FADD and caspase-8 immunoprecipitations, that inhibition of IKKa/IKKb enzymatic activities resulted in the binding of RIPK1 to FADD and caspase-8, a process relying on RIPK1 kinase activity (Figures 5D–5G). In contrast, CHX pre-treatment, which does not affect phosphorylation of RIPK1 in complex I (Figure 4H), led to much less recruitment of RIPK1 to FADD/caspase-8, and this recruitment was not inhibited by Nec-1 (Figures 5F, 5G, and S4B). Of note, association of TRADD with FADD/caspase-8 was not observed under these conditions. Together, these results suggest that IKKa/IKKb-mediated phosphorylation of RIPK1 either represses RIPK1 kinase activity or interferes with RIPK1’s ability to bind complex IIb components.
Figure 5. Direct Phosphorylation of RIPK1 by IKKa/IKKb Prevents RIPK1 from Integrating Complex IIb (A–C) Recombinant GST-IKKa, GST-IKKb, or GST-TAB1-TAK1 fusion protein was incubated with a recombinant truncated (GST-RIPK11–479) or full-length (GST-RIPK1FL) form of RIPK1 in a radioactive in vitro kinase assay in the presence of the indicated inhibitors. Phosphorylation was revealed by SDS-PAGE followed by autoradiography. (D–G) MEFs with the indicated genotype (D and E) or Ripk1+/+ MEFs (F and G) were pre-incubated with zVAD-fmk and with the indicated compounds for 30 min and then stimulated with 20 ng/ml hTNF. After 4 hr, complex II was isolated by FADD or caspase-8 immunoprecipitation and RIPK1 binding revealed by immunoblotting. See also Figure S4.
IKKa/IKKb Mediate In Vivo Protection to RIPK1 KinaseDependent Death To test the in vivo relevance of our in vitro findings, we evaluated the contribution of RIPK1 kinase activity to two different mouse models of TNF-induced death. In the first one, we injected Ripk1K45A/K45A and Ripk1+/+ littermates with TNF in association with D-galactosamine. In this well-known model of acute hepatitis, TNF-mediated hepatocyte apoptosis is reported to result from transcriptional inhibition (Decker and Keppler, 1974), thereby affecting the NF-kB pathway downstream of IKKa/ IKKb. In accordance with our in vitro results, we found that Ripk1K45A/K45A mice were not protected from TNF-induced lethality and apoptotic liver damage, as monitored by survival curves, blood levels of aspartate transaminase/alanine transaminase (AST/ALT), caspase-3 activation in the liver by DEVDase assays, and active caspase-3 staining (Figures 6A–6E). Blood levels of lactate dehydrogenase (LDH), a marker of necrosis, were not upregulated by TNF+GalN injection (Figure 6F).
In the next model, we injected Ripk1K45A/K45A and Ripk1+/+ littermates with a sub-lethal dose of TNF (5 mg) in presence or absence of TPCA-1 (10 mg/kg) to inhibit the canonical NF-kB pathway at the level of IKKa/IKKb. Remarkably, while TPCA-1 hadnotoxicity onitsown(FiguresS5AandS5B),itscombination with TNF resulted in the rapid death of all Ripk1+/+, but no Ripk1K45A/K45A, mice (Figure 6G). Accordingly, Ripk1K45A/K45A mice were protected from TNF-induced hypothermia and had no increase in serum levels of ASL/ALT or caspase-3 activation in the liver (Figures 6H–6L). In contrast to TNF+GalN injection, TNF+TPCA-1 led to a substantial increase of LDH levels in the serum that was also absent in Ripk1K45A/K45A mice, suggesting additional necroptosis induction (Figure 6M). Importantly, RIPK1 kinase inhibition by co-administration of Nec-1s (Degterev et al., 2013), a modified and more stable version of Nec-1, in C57BL/6J mice also significantly delayed the death and injury induced by TNF+TPCA-1 injection (Figures S5C–S5I).
Together, these in vivo results demonstrate TNF-mediated RIPK1-independent and RIPK1 kinase-dependent hepatocyte apoptosis in condition of NF-kB inhibition downstream or at the level of IKKa/IKKb, respectively.
Figure 6. IKKa/IKKb Mediate In Vivo Protection to RIPK1 Kinase-Dependent Death (A) Cumulative survival rates of littermate Ripk1+/+ and Ripk1K45A/K45A C57BL/6J females injected with GalN 15 min prior to injection with mTNF (n = 5). (B, C, and F) Blood AST (B), ALT (C), and LDH (F) levels determined 3 hr post-TNF injection (Ripk1+/+ n = 3, and Ripk1K45A/K45A n = 4). (D and E) Caspase-3 activity in liver samples (Ripk1+/+ n = 3, and Ripk1K45A/K45A n = 4) isolated 3 hr post-TNF injection and determined by Ac-DEVD-AMC fluorescence assay (D) or anti-cleaved caspase-3 staining (E). (G) Cumulative survival rates of littermate Ripk1+/+ and Ripk1K45A/K45A C57BL/6J females injected with TPCA-1 20 min prior to injection with mTNF (n = 5). (H) Body temperature as a function of time. (I, J, and M) Blood AST (I), ALT (J), and LDH (M) levels determined 3 hr post-TNF injection (n = 4). (K and L) Caspase-3 activity in liver samples (n = 4) isolated 3 hr post-TNF injection and determined by Ac-DEVD-AMC fluorescence assay (K) or anti-cleaved caspase-3 staining (L). Scale bar, 25 mm. Error bars represent the SEM of the indicated n values. See also Figure S5.
IKKa/IKKb Protect Cells from RIPK1 Kinase-Dependent Necroptosis Independently of NF-kB Our in vivo results suggested that TNF+TPCA-1 additionally induced necroptosis in the injected mice. To test the possibility that IKKa/IKKb also regulates RIPK1 kinase-dependent necroptosis independently of NF-kB, we in vitro stimulated MEFs with TNF+CHX in the presence of the pan caspase inhibitor zVAD-fmk and of TPCA-1. As shown in Figure 7A,TNF-mediated
necroptosis induced by TNF+CHX+zVAD is fully repressed by Nec-1 but still greatly enhanced by additionally inhibiting IKKa/ IKKb with TPCA-1 (Figures 7A and S6A). The mouse fibrosarcoma cell line L929sAhFAS is a prototypic model for necroptosis since these cells succumb by necroptosis upon single TNF stimulation. While inhibiting NF-kB by CHX sensitized these cells to necroptosis, the sensitization was again enhanced when IKKa/ IKKb was additionally inhibited by TPCA-1 (Figures 7B and S6B). Our results therefore demonstrate that IKKa/IKKb prevent RIPK1 kinase-dependent apoptosis and necroptosis downstream of TNFR1 independently of their known function in protecting the cells from death by mediating NF-kB-dependent upregulation of pro-survival/anti-death genes.
RIPK1 kinase-dependent necroptosis relies on the downstream activation of the RIPK3-MLKL pathway (Cho et al., 2009; He et al., 2009; Pasparakis and Vandenabeele, 2015;Sun et al., 2012; Zhang et al., 2009; Zhao et al., 2012). To further characterize the contribution of RIPK3 to the lethality resulting from the in vivo injection of TNF+TPCA-1, we challenged Ripk3+/+ and Ripk3/ littermates with this trigger. Contrary to Ripk1K45A/K45A mice, Ripk3/ mice were greatly, but not entirely, protected from death and hypothermia induced by TNF+TPCA-1 (Figures 7C and 7D). Interestingly, the protection was not originating from the liver, as RIPK3 deficiency did not prevent liver damage (Figures 7E–7H). Instead, RIPK3 deficiency prevented the increased of LDH levels in the blood, resulting from necrosis of undefined organ(s) (Figure 7I). These in vivo results therefore suggest that the lethality induced by TNF+TPCA-1 results from both RIPK1 kinase-dependent apoptosis and necroptosis.
Figure 7. IKKa/IKKb Protect Cells from RIPK1 Kinase-Dependent Necroptosis Independently of NF-kB (A and B) Ripk1+/+ MEFs (A) and L929sAhFas cells (B) were stimulated with hTNF (20 ng/ml in A and 33 pg/ml in B) in the presence of the indicated compounds, and cell death was measured as a function of time by SytoxGreen positivity. (C) Cumulative survival rates of littermate Ripk3+/+ and Ripk3/ C57BL/6J females injected with TPCA-1 20 min prior to injection with mTNF (Ripk3+/+ n = 4, and Ripk3/ n = 7). (D) Body temperature as a function of time. (E, F, and I) Blood AST (E), ALT (F), and LDH (I) levels determined 3 hr post-TNF injection (Ripk3+/+ n = 4, and Ripk3/ n = 3). (G and H) Caspase-3 activity in liver samples (Ripk3+/+ n = 4, and Ripk3/n = 3) isolated 3 hr post-TNF injection and determined by Ac-DEVD-AMC fluorescence assay (G) or anti-cleaved caspase-3 staining (H). Scale bar,25mm.Fortheinvitrocell death results,error bars represent the SEM of three independent experiments. For the in vivo results,error bars represent the SEM of the indicated n values
Sensing of TNF by TNFR1 at the cell surface can paradoxically result in the activation of signaling pathways with opposite consequences: cell survival or cell death. The fact that survival is the dominant outcome in most cell types indicates the existence of molecular mechanisms actively repressing TNFR1-mediated cell death.Two major mechanisms have been reported to control cell death downstream of TNFR1 (O’Donnell and Ting, 2011).The first identified one is well characterized and consists in a relatively slow process involving the NF-kB-dependent induction of pro-survival/anti-death molecules, such as cFLIP (Karin and Lin, 2002; Kreuz et al., 2001; Liu et al., 1996; Micheau et al., 2001; Panayotova-Dimitrova et al., 2013; Van Antwerp et al., 1996; Wang et al., 1998). The second one, which is less understood and more recently reported, is believed to take place at an earlier stage following TNFR1 activation and is shown to be independent of the NF-kB response (Dondelinger et al., 2013; Legarda-Addison et al., 2009; O’Donnell et al., 2007, 2012; Wang et al., 2008). Interestingly, while the first checkpoint regulates slow apoptosis by inhibiting activation of complex IIa (TRADD-FADD-caspase-8), the second one regulates the contribution of RIPK1 to cell death by either preventing RIPK1 from integrating the apoptotic complex IIb (RIPK1-FADD-casapase-8) or by limiting its contribution to the necrosome (RIPK1RIPK3-MLKL) (Cho et al., 2009; He et al., 2009; Sun et al., 2012; Vanlangenakker et al., 2011; Wang et al., 2008; Wilson et al., 2009; Zhang et al., 2009; Zhao et al., 2012). It has long been thought that IKKa/IKKb inhibits TNF-induced cell death through activation of the NF-kB pathway. In this study, we provide evidences that IKKa and IKKb also regulate cell death by direct phosphorylation of RIPK1 at the level of TNFR1 complex I.
TNF-induced RIPK1-dependent apoptosis was first described in conditions affecting cIAP1/cIAP2-mediated RIPK1 ubiquitylation (Bertrand et al., 2008; O’Donnell et al., 2007; Petersen et al., 2007; Wang et al., 2008), which led to the hypothesis that the ubiquitin chains on RIPK1 were directly preventing its binding to FADD, keeping RIPK1 in a survival modus. This‘‘direct’’effect, however, has later been challenged. Binding of the adaptor proteins TABs and NEMO to RIPK1 ubiquitin chains allows recruitment of TAK1 and of IKKa/IKKb to TNFR1 complex I (Ea et al., 2006; Li et al., 2006; Wu et al., 2006), and TAK1 inhibition was shown to result in TNF-mediated RIPK1-dependent apoptosis without affecting RIPK1 ubiquitylation status (Dondelinger et al., 2013). We show here that RIPK1 is phosphorylated in complex I and that affecting RIPK1 ubiquitylation by cIAP1/ cIAP2depletion directlyimpactsitsphosphorylation.Incontrast, TAK1, NEMO, or IKKa/IKKb depletion affects RIPK1 phosphorylation and induces RIPK1-dependent cell death but does not alter its ubiquitylation state in complex I. Together, these results indicate that ubiquitylation and phosphorylation of RIPK1 occur sequentially and that RIPK1 phosphorylation regulates its killing potential. Because activation of the IKK complex lies downstream of TAK1 but upstream of IkBa and p65, our results suggest a model in which IKKa/IKKb constitute the last step in the regulation of the RIPK1 cell death checkpoint (graphical abstract). Indeed, p65 deletion, expression of IkBaSR, or CHX pre-treatment induces TNF-mediated RIPK1-independent apoptosis and does not alter RIPK1 ubiquitylation or phosphorylation in complex I.
RIPK1 enzymatic activity is needed for the integration of RIPK1 to complex IIb and to the necrosome, which respectively drives apoptosis or necroptosis under TNF-stimulated conditions (Cho et al., 2009; Dondelinger et al., 2013; He et al., 2009; Wang et al., 2008). The precise role of RIPK1 kinase activity in these processes remains unclear but may involve autophosphorylation-driven conformational changes allowing increased binding of RIPK1 to the death complex components. The kinase activity of RIPK1 therefore requires active repression to avoid unnecessary cell death. A recent report suggests that RIPK1 phosphorylation on Ser89 suppresses its kinase activity (McQuade et al., 2013). It is therefore tempting to speculate that IKK-mediated phosphorylation of RIPK1 in complex I affects RIPK1 kinase activity. Alternatively, the phosphorylation of RIPK1 by IKKs may directly affect binding of RIPK1 to the death complex components or facilitate its dissociation from complex I. We performed mass spectrometry analysis to identify the residues of RIPK1 phosphorylated by IKKa and IKKb and found several sites, but not Ser89 (Figures S4C and S4D). Unfortunately, we were unable to demonstrate the direct physiological relevance of the identified phosphorylation sites due to the fact that all Ripk1/ reconstituted MEFs, even those with WT RIPK1 (irrespective of RIPK1 expression levels), started to succumb upon single TNF stimulation (data not shown), a problem previously reported (Gentleetal., 2011). The fact that the combined repression of IKKa and IKKb is needed to induce RIPK1 kinase-dependent death, and that the phosphorylation by each kinase results in different RIPK1 mobility shifts when run on gels, may indicate that phosphorylation on several residues is required to negatively regulate RIPK1.
IKKa and IKKb are best known for their roles in NF-kB activation, but NF-kB-independent functions have also been reported, some of which are even implicated in cell fate decisions (Hinz and Scheidereit, 2014). Using pharmacological inhibition of IKKa/IKKb in a p65-deficient background, or together with CHX, we demonstrated an NF-kB-independent function of IKKa/IKKb in protecting cells from TNF-induced RIPK1 kinasedependent apoptosis and necroptosis. In vivo, we demonstrate that TNF induces apoptosis of hepatocytes independently of RIPK1 when the NF-kB pathway is affected downstream of IKKa/IKKb (TNF+GalN). In contrast, pharmacological inhibition of the NF-kB pathway at the level of IKKa/IKKb (TNF+TPCA-1) sensitizesmicetoTNF-inducedshock,whichisaccompaniedby RIPK1 kinase-dependent, but RIPK3-independent, apoptosis of hepatocytes and RIPK1/RIPK3-dependent cellular death, presumably necroptosis, in undefined organs. We can indeed not formally rule out the possibility that the increase in serum LDH levels originates from secondary necrosis of apoptotic cells. Importantly, genetic and chemical inhibition of RIPK1 enzymatic activity protected the mice from TNF-induced cellular damage and death. These results therefore demonstrate the in vivo roles of IKKa/IKKb in protecting cells from RIPK1 kinase-dependent death.
The LUBAC complex, which includes its component Sharpin, is recruited to complex I during TNF signaling, and the inactivating mouse Sharpin cpdm mutation was reported to cause multi-organinflammationresultingfromTNF-mediated RIPK1kinase-dependent death (Berger et al., 2014; Kumari et al., 2014; Rickard et al., 2014). In line with our results, we found that TNF-mediated RIPK1 kinase-dependent death of mouse dermal fibroblasts (MDFs) isolated from Sharpincpdm mice is associated with defective RIPK1 phosphorylation in complex I (Figures S7A and S7B), probably resulting from the altered recruitment of IKK proteins to complex I, as previously reported for other LUBAC components (Haas et al., 2009). The genetic disruption of Nemo, Ikka, Ikkb, orIkka/Ikkb in mice results in early lethality with massive cellular death in several organs, such as the liver, the skin, and, in the case of Ikka//b/ mice, the nervous system (Hu et al., 1999; Li et al., 1999, 2000; Rudolph et al., 2000; Takeda et al., 1999). So far, these phenotypes have exclusively been explained by defects in NF-kB activation, but our study indicates that RIPK1 activation probably contributes to these pathological conditions. In the same line, RIPK1 kinase-dependent apoptosis may drive the spontaneous development of hepatocellular carcinoma observed in mice ablated of Nemo in the liver parenchymal cells (Luedde et al., 2007). Testing the contribution of RIPK1 to those phenotypes is an exciting future challenge, which may open doors for the use of chemical inhibitors of RIPK1 in the treatment of human diseases associated with IKK malfunctions, such as incontinentia pigmenti (Conte et al., 2014).
Translocation of interleukin-1β into a vesicle intermediate in autophagy-mediated secretion
Min Zhang1, Sam Kenny2, Liang Ge1, Ke Xu2 and Randy Schekman1*
eLife 2015;10.7554/eLife.11205 http://dx.doi.org/10.7554/eLife.11205
In this study, we probed the organelle association and molecular requirements for the secretion of one such unconventional cargo protein, IL-1β. Using surrogate cell lines rather than macrophages to reconstitute autophagy-mediated secretion of IL-1β (Figure 1), we find mature IL-1β localized to the lumen of the membrane in early intermediates and mature autophagosomes (Figures 2-4, 6). This surprising location may help to explain how mature IL-1β is secreted in a soluble form to the cell surface (Figure 9C). However, localization to the lumen between the two membranes of the autophagosome would require that IL-1β is translocated from the cytoplasm across the membrane precursor of a phagophore, rather than being engulfed as the phagophore membrane matures by closure into an autophagosome.
The exact route by which the autophagosome delivers mature IL-1β to the cell surface as well as how it avoids fusion with degradative lysosome remains obscure, possibly involving interaction with the multi-vesicular body or some form of lysosome as a prelude to fusion at the cell surface (Figure 9C), and this process may require selective recruitment of membrane sorting and targeting factors such as Rabs and SNAREs.
Recent evidence suggests that autophagy facilitates the unconventional secretion of the pro-inflammatory cytokine interleukin 1β (IL-1β). Here, we reconstituted an autophagy-regulated secretion of mature IL-1β (m-IL-1β) in non-macrophage cells. We found that cytoplasmic IL-1β associates with the autophagosome and m-IL-1β enters into the lumen of a vesicle intermediate but not into the cytoplasmic interior formed by engulfment of the autophagic membrane. In advance of secretion, m-IL-1β appears to be translocated across a membrane in an event that may require m-IL-1β to be unfolded or remain conformationally flexible and is dependent on two KFERQ-like motifs essential for the association of IL-1β with HSP90. A vesicle, possibly a precursor of the phagophore, contains translocated m-IL-1β and later turns into an autophagosome in which m-IL-1β resides within the intermembrane space of the double-membrane structure. Completion of IL-1β secretion requires Golgi reassembly and stacking proteins (GRASPs) and multi-vesicular body (MVB) formation.
Most eukaryotic secretory proteins with an N-terminal signal peptide are delivered through the classical secretion pathway involving an endoplasmic reticulum (ER)-to-Golgi apparatus itinerary (Lee et al., 2004; Schatz and Dobberstein, 1996). However, a substantial number of secretory proteins lack a classical signal peptide, called leaderless cargoes, and are released by unconventional means of secretion (Nickel and Rabouille, 2009; Nickel and Seedorf, 2008). The range of unconventional secretory cargoes encompasses angiogenic growth factors, inflammatory cytokines and extracellular matrix components etc. most of which play essential roles for development, immune surveillance and tissue organization (Nickel, 2003; Rabouille et al., 2012). Unlike a unified route for classical protein secretion, leaderless cargoes undergoing unconventional secretion employ multiple means of protein delivery, the details of which are largely unknown (Ding et al., 2012; Nickel, 2010; Rabouille et al., 2012; Zhang and Schekman, 2013).
IL-1β is one of the most intensely investigated cargoes of unconventional secretion. A biologically inactive 31 kDa precursor, pro-IL-1β, is made following initiation of the NF-κB signaling cascade. Pro-IL-1β is subsequently converted into the active form, the 17 kDa mature IL-1β, by the pro-inflammatory protease caspase-1 which is activated, in response to extracellular stimuli, after its recruitment to a multi-protein complex called the inflammasome (Burns et al., 2003; Cerretti et al., 1992; Rathinam et al., 2012; Thornberry et al., 1992). Interpretation of the mechanism of unconventional secretion of IL-1β is complicated by the fact that one of the physiologic reservoirs of this cytokine, macrophages, undergoes pyroptotic death and cell lysis under conditions of inflammasome activation of caspase-1. Indeed, many reports including two recent publications make the case for cell lysis as a means of release of mature IL-1β (Liu et al., 2014; Shirasaki et al., 2014). In contrast, other reports demonstrate proper secretion of mature IL-1β without cell lysis in, for example, neutrophils, which are nonetheless dependent on the inflammasome response to activate caspase-1 and secrete mature IL-1β (Chen et al., 2014).
Macroautophagy (hereafter autophagy) is a fundamental mechanism for bulk turnover of intracellular components in response to stresses such as starvation, oxidative stress and pathogen invasion (Mizushima and Levine, 2010; Yang and Klionsky, 2010). The process is characterized by the formation of a double-membrane vesicle, called the autophagosome, through the elongation and closure of a cup-shaped membrane precursor, termed the phagophore, to engulf cytoplasmic cargoes (Hamasaki et al., 2013; Lamb et al., 2013). Completion of autophagosome formation requires a sophisticated protein-vesicle network organized by autophagic factors, such as autophagy-related (ATG) proteins, and target membranes (Feng et al., 2014; Mizushima et al., 2011). Besides the degradative function, autophagy or ATG proteins have recently been implicated in multiple secretory pathways including the delivery of leaderless cargoes undergoing unconventional secretion, such as the mammalian pro-inflammatory cytokines IL-1β and IL-18, the nuclear factor HMGB1, and the yeast acyl coenzyme A-binding protein Acb1, to the extracellular space (Bruns et al., 2011; Dupont et al., 2011; Duran et al., 2010; Manjithaya and Subramani, 2011; Pfeffer, 2010; Subramani and Malhotra, 2013). The Golgi reassembly and stacking protein(s) GRASP(s) (GRASP55 and GRASP65 in mammals, dGRASP in Drosophila, GrpA in Dictyostelium and Grh1 in yeast) are required for autophagy-regulated unconventional secretion (Giuliani et al., 2011; Kinseth et al., 2007; Levi and Glick, 2007; Manjithaya et al., 2010).
Dupont et al. (2011) documented a role for autophagy in the secretion of mature IL-1β (Dupont et al., 2011), but how a protein sequestered within an autophagosome could be exported as a soluble protein was unexplained. Here, we sought to understand how conditions of starvation-induced autophagy could localize IL-1β into an autophagosomal membrane. We reconstituted the autophagy-regulated secretion of IL-1β in cultured cell lines and detected a vesicle intermediate, possibly an autophagosome precursor, containing mature IL-1β. Three-dimensional (3D) Stochastic Optical Reconstruction Microscopy (STORM) demonstrated that, after entering into the autophagosome, IL-1β colocalizes with LC3 on the autophagosomal membrane, which, together with an antibody accessibility assay and observations from biochemical assays, implies a topological distribution in the intermembrane space of the autophagosome. This distribution of IL-1β explains the mechanism accounting for its secretion as a soluble protein through either a direct fusion of autophagosome with the plasma membrane or via the MVB pathway. Quite aside from the possible complication of cell lysis, another body of work has suggested an unconventional pathway for the proper secretion of IL-1β. Pro-IL-1β lacks a typical signal peptide and the propeptide is processed in the cytosol rather than the ER (Rubartelli et al., 1990; Singer et al., 1988). Although mature IL-1β appears to be incorporated into a vesicular transport system, secretion is not blocked by Brefeldin A, a drug that blocks the traffic of standard secretory proteins form the Golgi apparatus (Rubartelli et al., 1990). Multiple mechanisms have been implicated in the unconventional secretion of IL-1β, including autophagy, secretory lysosomes, multi-vesicular body (MVB) formation and micro-vesicle shedding (Andrei et al., 1999; Andrei et al., 2004; Brough et al., 2003; Lopez-Castejon and Brough, 2011; MacKenzie et al., 2001; Qu et al., 2007; Verhoef et al., 2003). However, a clear demonstration of the mechanism for the entry of IL-1β into a vesicular carrier, e.g. the autophagosome, is lacking.
Reconstitution of autophagy-regulated IL-1β secretion
A dual effect of autophagy has been proposed on the secretion of IL-1β in macrophages (Deretic et al., 2012; Jiang et al., 2013). On one hand, induction of autophagy directly promotes IL-1β secretion after inflammasome activation by incorporating it into the autophagosomal carrier (Dupont et al., 2011). On the other hand, autophagy indirectly dampens IL-1β secretion by degrading components of the inflammasome as well as reducing endogenous triggers for inflammasome assembly, including reactive oxygen species (ROS) and damaged components, which are required for the activation of caspase-1 and the production of active IL-1β (Harris et al., 2011; Nakahira et al., 2011; Shi et al., 2012; Zhou et al., 2011).
To focus our study specifically on the role of autophagy in IL-1β secretion, we reconstituted a stage of IL-1β secretion downstream of inflammasome activation by co-expressing pro-IL-1β (p-IL-1β) and pro-caspase-1 (p-caspase-1) in non-macrophage cells. As shown in Figure 1A, the generation and secretion (~5%) of mature IL-1β (m-IL-1β) was achieved by co-expression of p-IL-1β and p-caspase-1 in HEK293T cells. Mature IL-1β was not produced or secreted without p-caspase-1, whereas a low level of secreted p-IL-1β (~0.2%) was detected with or without the expression of p-caspase-1. Furthermore, little cell lysis occurred during the treatment we used to induce IL-1β secretion: Much less precursor than mature IL-1β and little cytoplasmic tubulin was detected released into the cell supernatant during the 2 h incubation in starvation medium (Figure 1A). Starvation, a condition that stimulates autophagy, enhanced IL-1β secretion (~3 fold) and reduced the level of IL-1β in the cell lysates (Figure 1A, B). Inhibition of autophagy by the phosphatidylinositol 3-kinase (PI3K) inhibitors 3-methyladenine (3-MA) or wortmannin (Wtm) blocked IL-1β secretion activated by starvation and caused the accumulation of mature IL-1β in the cell (Figure 1B). Likewise, in an autophagy-deficient cell line, Atg5 knockout (KO) mouse embryo fibroblasts (MEFs) (Mizushima et al., 2001), IL-1β secretion was reduced and failed to respond to starvation (Figure 1C). Moreover, IL-1β secretion was also inhibited in a dose-dependent manner in the presence of an ATG4B mutant (C74A) (Fujita et al., 2008), or after the depletion of ATG2A and B (Velikkakath et al., 2012), or FIP200 (Hara et al., 2008), which block autophagosome biogenesis at different stages (Figure 1D-F). Therefore, the reconstituted system recapitulates the autophagy-regulated secretion of IL-1β.
In macrophages, MVB formation and GRASP proteins are required for IL-1β secretion (Dupont et al., 2011; Qu et al., 2007). Inhibiting MVB formation by depletion of the ESCRT components, hepatocyte growth factor receptor substrate (Hrs) or TSG101, compromised secretion of IL-1β and CD63, an exosome marker (Figure 1-figure supplement 1A). Knockdown of the GRASP55 or GRASP65 also led to the reduction of IL-1β secretion (Figure 1- figure supplement 1B). Therefore, in addition to functions required for autophagy, the secretion of IL-1β in HEK293T cells depends on GRASP proteins and at least two proteins implicated in MVB formation, as reported previously (Dupont et al., 2011; Qu et al., 2007).
Figure 1 Reconstitution of autophagy-regulated IL-1β secretion in cultured cells (A) Reconstitution of starvation-induced IL-1β secretion in HEK293T cells. HEK293T cells were transfected with a single plasmid encoding p-IL-1β or together with the p-caspase-1 plasmid. After transfection (24 h), the cells were either treated in regular (DMEM) or starvation (EBSS) medium for 2 h. The medium and cells were collected separately and immunoblot was performed to determine the level of indicated proteins. (B) PI3K inhibitors 3-methyladenine (3-MA) or wortmannin (Wtm) inhibit IL-1β secretion. HEK293T cells transfected with p-IL-1β and p-caspase-1 plasmids were cultured in DMEM, EBSS, or EBSS containing 10 mM 3-MA or 20 nM wortmannin for 2 h. The medium and cells were collected separately and immunoblot was performed as shown in (A). (C) IL-1β secretion is blocked in Atg5 KO MEFs. Control WT or Atg5 KO MEFs were transfected with p-IL-1β and p-caspase-1 plasmids. After transfection (24 h), the cells were either cultured in DMEM or EBSS for 2 h followed by immunoblot as shown in (A). (D) IL-1β secretion is inhibited by the ATG4B mutant (C74A). HEK293T cells were transfected with plasmids encoding p-IL-1β, p-caspase-1 and different amounts of ATG4B (C74A) plasmid DNA as indicated. After transfection (24 h), cells were starved in EBSS for 2 h followed by immunoblot as shown in (A). (E) Knockdown of Atg2 reduces IL-1β secretion. HEK293T cells were transfected with control siRNA or siRNAs against Atg2A, Atg2B alone or both. After transfection (48 h), the cells were transfected with p-IL-1β and p-caspase-1 plasmids. After another 24 h, the cells were starved in EBSS for 2 h followed by immunoblot as shown in (A). (F) Knockdown of FIP200 reduces IL-1β secretion. HEK293T cells were transfected with control siRNA or FIP200 siRNA. IL-1β secretion under starvation conditions was determined as shown in (E). Quantification of IL-1β secretion was calculated as the ratio between the amount of IL-1β in the medium and the total amount (the sum of IL-1β in both medium and lysate).
Figure 1- figure supplement 1 Depletion of ESCRT or GRASPs affects IL-1β secretion HEK293T cells were transfected with indicated siRNAs (Hrs (ESCRT-0) (A), Tsg101 (ESCRT-I) (A), GRASP55 (B) or GRASP65 (B)). After transfection (48 h), the cells were transfected with p-IL-1β and p-caspase-1 plasmids. After another 24 h, the cells were starved in EBSS for 2 h followed by immunoblot as shown in Figure 1A. Quantification of IL-1β secretion was calculated as the ratio between the amount of IL-1β in the medium and the total amount (the sum of IL-1β in both medium and lysate).
IL-1β transits through an autophagosomal carrier during secretion.
To study if autophagy directly regulates IL-1β secretion, we employed a three-step membrane fractionation procedure as described previously (Figure 2A)(Ge et al., 2013). We first performed a differential centrifugation to obtain 3k, 25k and 100k membrane pellet fractions. Both IL-1β and the lipidated form of LC3 (LC3-II), a protein marker of autophagosome, were mainly enriched in the 25k membrane fraction (Figure 2B). We then separated the 25k membrane through a sucrose step gradient ultracentrifugation where both IL-1β and LC3-II co-distributed in the L fraction at the boundary between 0.25 M and 1.1 M layer of sucrose (Figure 2B). Further fractionation of the L fraction using an OptiPrep gradient showed co-fractionation of IL-1β with LC3-II (Figure 2C). To confirm the presence of IL-1β in the autophagosome, we performed immunoisolation of LC3-positive autophagosomes from the 25k fraction and found that IL-1β, especially the mature form, co-sedimented with autophagosomes (Figure 2D). Consistent with our observations, a recent study also showed a colocalization of IL-1β and LC3 in the form of puncta in macrophages (Dupont et al., 2011). These data demonstrate that at least a fraction of intracellular mature IL-1β associates with the autophagosome, possibly related to its role in IL-1β secretion.
Figure 2 IL-1β vesicles co-fractionate with LC3 vesicles (A) Membrane fractionation scheme. Briefly, HEK293T cells transfected with p-IL-1β and p-caspase-1 plasmids were starved in EBSS for 2 h, collected and homogenized. Cell lysates were subjected to differential centrifugations at 3,000×g (3k), 25,000×g (25k) and 100,000×g (100k). The level of IL-1β in each membrane fraction was determined by immunoblot. The 25k pellet, in which IL-1β was mainly enriched, was selected and a sucrose gradient ultracentrifugation was performed to separate membranes in the 25k pellet to the L (light) and P (pellet) fractions. The L fraction, which contained the majority of IL-1β, was further resolved on an OptiPrep gradient after which ten fractions from the top were collected. (B, C) Immunoblot was performed to examine the distribution of IL-1β, LC3 as well as the indicated membrane markers in the indicated membrane fractions. T, top; B, bottom (D) HEK293T cells transfected with p-IL-1β, p-caspase-1 and FLAG-tagged LC3-I plasmids were starved in EBSS for 2 h. LC3 positive membranes were immunoisolated with anti-FLAG agarose from the 25k pellet and the presence of IL-1β was determined by immunoblot analysis. FT, flowthrough.
To determine if IL-1β is localized to the phagophore in the absence of autophagosome completion, we fractionated membranes from ATG2-depleted cells, which are deficient in phagophore elongation and therefore fail to form mature autophagosomes (Velikkakath et al., 2012), and examined the distribution of LC3-II, which remains attached to immature phagophore membranes, and mature and precursor IL-1β. We performed the three-step fractionation described above. In control cells, IL-1β co-distributed with LC3-II in all three steps (Figure 3). Depletion of ATG2 did not affect the co-fractionation of IL-1β and LC3-II (Figure 3), indicating that IL-1β enters into the phagophore membrane before the completion of the autophagosome.
Figure 3 IL-1β co-distributes with LC3 in Atg2-depleted cells (A) HEK293T cells were transfected with siRNAs against Atg2A and Atg2B followed with p-IL-1β and 739 p-caspase-1 plasmids as shown in Figure 1E. The cells were starved in EBSS for 2 h. Membrane fractions (3k, 25k, 100k (×g), L and P) were separated from the post-nuclear supernatant as depicted in Figure 2B. (B) Ten membrane fractions were collected from the OptiPrep gradient ultracentrifugation as depicted in Figure 2C. Immunoblot was performed to examine the distribution of IL-1β, LC3 as well as the indicated membrane markers. T, top; B, bottom.
Autophagosome formation is not required for entry of IL-1β into vesicles
We asked how IL-1β enters into the autophagosome. One possibility is engulfment through the closure of the phagophore membrane during autophagosome maturation as in the capture of autophagic cargo. In this scenario, closure of the phagophore to complete autophagosome formation would be required to sequester IL-1β away from the cytoplasm. Alternatively, we considered the possibility that IL-1β may be translocated through a membrane into the lumen of the phagophore envelope and be sequestered from the cytoplasm even before the mature autophagosome is sealed. To test this possibility, we performed proteinase K protection experiments with the membranes from ATG2-depleted cells (Figure 4A). In control cells, p62 (an autophagic cargo) and a fraction of LC3-II (which was encapsulated after autophagosome completion), as well as mature IL-1β, were largely resistant to proteinase K digestion similar to the ER luminal protein, protein disulfide isomerase (PDI). In contrast, SEC22B, a membrane anchored SNARE protein exposed to the cytoplasm, was sensitive to proteinase K digestion (Figure 4A). Triton X-100 treatment permeabilized the membrane and rendered all proteins tested sensitive to proteinase K digestion (Figure 4A). This demonstrated that the majority of membrane localized IL-1β was sequestered within an organelle, likely the autophagosome, as demonstrated by the fractionation results of Figures 2 and 3. However, the result did not pinpoint where within the autophagosome IL-1β was housed. In ATG2-depleted cells, p62 and LC3-II remained sensitive to proteinase K digestion, consistent with the hypothesis that ATG2 is essential for maturation and closure of the autophagosome (Figure 4A). However, in the same samples the majority of IL-1β resisted degradation by proteinase K treatment (Figure 4A), except on addition of Triton X-100 to permeabilize membranes. Although the precursor form of IL-1β remained associated with isolated autophagosome and phagophore membranes (Figure 3), the protein was degraded when membranes from normal and ATG2-depleted cells were treated with protease in the presence or absence of Triton X-100 (data not shown). Thus, the mature but not the precursor IL-1β appears to be transported into the phagophore.
A most recent study showed that small, closed double-membrane structures could be observed in ATG2-depleted cells (Kishi-Itakura et al., 2014). To rule out the possibility that IL-1β was engulfed by the small closed autophagosomes, we employed Atg5 KO MEFs in which the phagophore could not be closed (Kishi-Itakura et al., 2014; Mizushima et al., 2001). Similar to what we observed in ATG2-depleted cells, IL-1β was protected from proteinase K digestion in membranes from Atg5 KO MEFs (Figure 4B). In addition, IL-1β was sequestered within vesicles in FIP200 (another early factor in phagophore development (Hara et al., 2008)) knockdown cells (Figure 4C). These data indicate that the entry of IL-1β into the vesicle carrier is not dependent on the formation of the autophagosome. These results are inconsistent with a role for engulfment of IL-1β by the maturing phagophore and suggest instead that IL-1β may be translocated across a membrane into a vesicle precursor of the phagophore, possibly at a very early stage in the development of the organelle.
Figure 4 Closure of the autophagosome is not required for the entry of IL-1β into vesicles (A) HEK293T cells were transfected with siRNAs against Atg2A and Atg2B followed by transfection with p-IL-1β and p-caspase-1 plasmids as shown in Figure 1E. The cells were starved in EBSS for 2 h and proteinase K digestion was performed with the 25k membrane fractions. (B) Atg5 WT, KO MEFs were transfected with p-IL-1β and p-caspase-1 plasmids as shown in Figure 1B. The cells were starved in EBSS for 2 h followed by proteinase K digestion as shown in (A). 752 (C) HEK293T cells were transfected with siRNA against FIP200 followed by analysis of membrane entry of 753 IL-1β as shown in (A). The level of proteinase K protection was calculated as the percentage of the total protein. Error bars represent standard deviations of at least three experiments.
Entry of IL-1β into the vesicle carrier requires protein conformational flexibility
We then sought to test if IL-1β could directly translocate across the membrane of a vesicle carrier. As protein unfolding is usually required for protein translocation, we adopted an approach used in many other circumstances wherein a targeted protein is fused to dihydrofolate reductase (DHFR), an enzyme whose three-dimensional structure is stabilized by the folate derivative aminopterin, hence providing a chemical ligand to impede the unfolding process (Backhaus et al., 2004; Eilers and Schatz, 1986; Wienhues et al., 1991). We first determined the secretion of the DHFR-fused IL-1β. As shown in Figure 5A, secretion of a mature IL-1β-DHFR fusion protein was enhanced by starvation similar to the untagged counterpart. Importantly, IL-1β-DHFR secretion was reduced in a dose-dependent manner in the presence of aminopterin (Figure 5B). Of notice, treatment of aminopterin did not completely abolish IL-1β secretion perhaps due to a cell death-induced release of IL-1β at high concentrations of aminopterin, as indicated by the release of a low level of tubulin into the medium fraction (Figure 5B). As a control, aminopterin did not reduce the secretion of untagged IL-1β, confirming its specific effect on DHFR (Figure 5- figure supplement 1). Fractionation of cells 185 incubated with aminopterin showed a reduced level of IL-1β in the membrane fraction with a corresponding 186 increase in the cytosol fraction (Figure 5C). The residual DHFR-tagged IL-1β associated with membranes from aminopterin-treated cells was sensitive to proteinase K digestion (Figure 5D), indicating that this pool of membrane-associated IL-1β did not translocate into the lumen of the vesicle. The data suggest that entry of IL-1β into a vesicle carrier involves a process of protein unfolding and translocation.
Figure 5 Protein unfolding is required for the entry of IL-1β into vesicles (A) Secretion of DHFR-tagged IL-1β. HEK293T cells were transfected with p-IL-1β-DHFR and p-caspase-1 plasmids. After transfection (24 h), the cells were treated with DMEM or EBSS for 2 h. Release of IL-1β was determined as shown in Figure 1. (B) Secretion of IL-1β-DHFR was inhibited by aminopterin. HEK293T cells were transfected with p-IL-1β-DHFR and p-caspase-1 plasmids. After transfection (24 h), the cells were treated with EBSS, or EBSS containing different concentrations of aminopterin as indicated for 15 min followed by determination of IL-1β secretion as shown in (A). Quantification of IL-1β secretion was calculated as the ratio between the amount of IL-1β in the medium and the total amount (the sum of IL-1β in both medium and lysate). (C) Less IL-1β enters into membrane in the presence of aminopterin. HEK293T cells were transfected with p-IL-1β-DHFR and p-caspase-1 plasmids. After transfection (24 h), the cells were either untreated or treated with 5 μM aminopterin in EBSS for 2 h. The membrane fraction was collected from the top fractions of a Nycodenz density gradient resolved from membranes in a 25k pellet as described in Material and Methods. The cytosolic fraction was collected as the supernatant after 100k×g centrifugation. All fractions were analyzed by immunoblotting using indicated antibodies. (D) IL-1β-DHFR is not protected from proteinase K in the presence of aminopterin. Nycodenz -floated membrane fraction collected as shown in (C) was subjected to proteinase K digestion and then analyzed by immunoblotting using indicated antibodies.
Figure 5- figure supplement 1 Secretion of IL-1β is not affected by aminopterin HEK293T cells were transfected with p-IL-1β and p-caspase-1 plasmids. After transfection (24 h), the cells were treated with EBSS, or EBSS containing different concentrations of aminopterin as indicated for 15 min followed by determination of IL-1β secretion as shown in Figure 1 (A).
IL-1β colocalizes with LC3 on the autophagosome envelope
If IL-1β is directly translocated across the membrane of a vesicle intermediate, fusion of these vesicles to form a double-membrane autophagosome would deposit IL-1β in the lumen between the two membranes of the autophagosome. To visualize the subcellular localization of IL-1β, we employed U2OS cells, which formed 194 large and distinct autophagosomes after starvation. U2OS cells co-expressing p-IL-1β and p-caspase-1 secreted IL-1β in a starvation-enhanced and PI3K-dependent manner similar to HEK293T cells (Figure 6- figure supplement 1). To prepare for the subsequent fluorescence imaging, we also employed a FLAG-tagged m-IL-1β, which allowed us to directly determine the topological localization of the m-IL-1β. Secretion of m-IL-1β-FLAG from U2OS cells was stimulated by starvation and dependent on PI3K (Figure 6- figure supplement 1).
To determine the topological distribution of IL-1β, we first performed confocal immunofluorescence labeling experiments. After starvation, cells were exposed to 40 μg/ml of digitonin to permeabilize the plasma membrane, harvested and washed with cold PBS to remove the excess cytosolic m-IL-1β-FLAG. In cells expressing either p-IL-1β and p-caspase-1, or m-IL-1β alone, LC3 and IL-1β were observed by confocal microscopy to localize together or adjacent to one another on the edge of ring-shaped autophagosomes (Figure 6- figure supplement 2). To further resolve these ring structures, we employed 3D STORM (Huang et al., 2008; Rust et al., 2006) super-resolution microscopy (Hell, 2007; Huang et al., 2010) (Figure 6 and Figure 6- figure supplements 3, 4 and Videos 1 and 2). Ring-shaped autophagosomes positive for LC3 (cyan) formed after starvation. Some IL-1β (magenta) also organized in ring-shaped structures that co-localized with LC3 (Figure 6 and Figure 6- figure supplement 3). Around 18 ring structures of IL-1β accounting for ~5% of the total IL-1β signal were observed in each cell. A 3D virtual Z-stack analysis confirmed the spatial co-distribution of LC3 and IL-1β on a ball-shaped vesicle (Video 1 and 2). The diameter of the structures double-labeled with LC3 and IL-1β are ~700 nm (larger structures up to 2 μm in diameter were also found) which is comparable to the size of the autophagosome. Occasionally, we also found IL-1β localized in the center of the ring structure, where cytoplasmic autophagic cargoes fill, surrounded by LC3 (Figure 6-figure supplement 4). This portion of IL-1β was possibly being engulfed by the autophagosome.
The visual detection of IL-1β localized to ring-shaped autophagosomes is consistent with our biochemical assays that place IL-1β in the intermembrane space between the outer and inner membrane of the autophagosome. We devised a further visual test of this conclusion using selective permeabilization of cell surface and intracellular membranes with digitonin and saponin, respectively (Figure 6-figure supplement 5). We compared antibody accessibility to IL-1β and DFCP1, a marker located on the cytosolic surface of the omegasome (a harbor for the phagophore) in both WT and Atg5 KO cells. Consistent with a cytosolic surface localization, DFCP1 was readily labeled in cells treated with digitonin alone (selectively permeabilizes the plasma membrane) in both WT and Atg5 KO cells (Figure 6-figure supplement 5A-E). In contrast, IL-1β was accessible to the antibody only after treatment with digitonin and saponin (gently permeabilizes the endomembrane) (Figure 6-figure supplement 5A, B and F) in WT cells. This by itself would not distinguish localization of IL-1β to the intermembrane space vs the cytoplasmic enclosed space of a mature autophagosome. However, in Atg5 KO cells where the phagophore precursor envelope remains open and exposed to the cytosol, saponin treatment was necessary to expose IL-1β to antibody and roughly half of the labeled structures coincided with the phagophore marker DFCP1 (Figure 6-figure supplement 5C, D and F). This visual assay further confirms the intermembrane localization of IL-1β in the phagophore and 231 autophagosome.
Figure 6 Topological localization of IL-1β in the autophagosomal carrier determined by STORM U2OS cells were transfected with a plasmid containing the expression cassette of FLAG-tagged mature IL-1β (m-IL-1β-FLAG). After transfection (24 h), the cells were starved in EBSS for 1 h followed by immunofluorescence labeling with mouse monoclonal anti-LC3 and rabbit polyclonal anti-FLAG antibodies. STORM analysis imaging and data analysis were performed as described in Materials and Methods. Cyan, LC3; Magenta, IL-1β; Bars: 2 μm (original image) and 500 nm (magnified inset)
Figure 6- figure supplement 1 Secretion of IL-1β in U2OS cells 795 U2OS cells were transfected with plasmids encoding the p-IL-1β and p-caspase-1 (first 4 lanes) or m-IL-1β-FLAG (last 4 lanes). After transfection (24 h), the cells were untreated or starved in the absence or presence of indicated PI3K inhibitors (3-MA or wortmannin (Wtm)) followed by measurement of secretion as indicated in Figure 1 (A) and (B). α-m-IL-1β, IL-1b antibody; α-FLAG, FLAG antibody
Figure 6- figure supplement 2 Localization of IL-1β determined by confocal microscopy U2OS cells were transfected with plasmids encoding the p-IL-1β and p-caspase-1 (A) or m-IL-1β-FLAG (B). After transfection (24 h), the cells were starved for 1 h followed by immunofluorescence labeling and confocal 804 microscopy analysis. Bar: 10 μm
Figure 6- figure supplement 3 Extra images for Figure 6 Bars: 2 μm (original image) and 500 nm (magnified inset)
Figure 6- figure supplement 4 A minority of IL-1β engulfed by autophagosome U2OS cells were transfected and treated followed by STORM analysis as shown in Figure 6. Arrow head points to the autophagosome with engulfed IL-1β. Bar: 2 μm
Figure 6- figure supplement 5 Determination of the topological localization of IL-1β in the autophagosome and phagophore (A, C) Diagrams of autophagosome (A)/phagophore (B) and omegasome, antibody accessibility for each possible situation of IL-1β localization, and summaries of the antibody accessibility of m-IL-1β-FLAG (red) and EGFP-DFCP1 (green) are illustrated. (B, D) U2OS cells (B) and Atg5 KO MEFs (D) were transfected with plasmids encoding the m-IL-1β-FLAG and EGFP-DFCP1. After transfection (24 h), the cells were starved in EBSS for 1 h followed by digitonin treatment and fixation (see Materials and Methods). The cells were either labeled with anti-FLAG (to label IL-1β) and anti-EGFP (to label EGFP-DFCP1) antibodies (Digitonin) or further treated with Saponin followed by antibody labeling (Digitonin+Saponin). Images were acquired by confocal microscopy. Bar: 10 μm 825 (E) Quantification of the percentage of EGFP-DFCP1 labeled by EGFP antibody. Percentage was counted by 826 the ratio of puncta numbers of antibody labeled EGFP-DFCP1 and EGFP-DFCP1 according to the EGFP signal. Error bars are standard deviations of more than 50 cells in two independent experiments. (F) Quantification of the puncta number for m-IL-1β-FLAG puncta (red) and those colocalized with DFCP1 (yellow). Error bars are standard deviations of more than 50 cells in two independent experiments.
Video 1 832 3D section of the magnified structure in Figure 6 (upper one) 833 The virtual Z-section thickness is 150 nm, and the step size is 50 nm. Cyan, LC3; Magenta, IL-1β; Bar 500 nm 834 835 Video 2 836 3D section of the magnified structure in Figure 6 (lower one) 837 The virtual Z-section thickness is 150 nm, and the step size is 50 nm. Cyan, LC3; Magenta, IL-1β; Bar 500 nm
Two KFERQ-like motifs are required for the entry of IL-1β into the vesicle carrier
In chaperone-mediated autophagy (CMA), cargoes are recognized by a KFERQ sequence motif for transport into the lysosome (Dice et al., 1986; Kaushik and Cuervo, 2012). We analyzed the primary sequence of IL-1β and found three KFERQ-like motifs on IL-1β including 127LRDEQ131, 132QKSLV136 and 198QLESV202 (Figure 7A). We mutated the glutamine, which has been shown to be essential for the function of the motif, as well as an adjacent amino acid in each motif (E130Q131, Q132K133 and Q198L199) to alanines and examined the secretion efficiency of these mutants. The 130-131AA mutant did not affect secretion of IL-1β (Figure 7B). However, the Q132K133 and Q198L199 mutations were both defective in secretion of mature IL-1β which instead accumulated in the cytoplasmic fraction (Figure 7B). A low level of release of the pro-forms persisted as seen with WT and mutant protein (Figure 7B). The cytoplasmic mature forms of the mutant proteins were less abundant in the membrane fraction compared with the WT mature IL-1β (Figure 7C, compare the lanes without proteinase K treatment). In addition, the membrane associated mutant IL-1β remained proteinase K accessible (less than 10% of protection compared with ~45% of WT IL-1β), demonstrating that these two KFERQ-like motifs are required for the membrane translocation of IL-1β (Figure 7C). Equal amounts of WT and mutant p-IL-1β associated with the membrane but both remained largely proteinase K accessible (Figure 7C).
Figure 7 Mutation of the KFERQ-like motif affects IL-1β secretion and entry into vesicles (A) Protein sequence of IL-1β. The yellow region indicates mature IL-1β. Three KFERQ-like motifs (aa127-131, aa132-136 and aa198-202) are highlighted in red underlined bold. (B) Secretion of IL-1β mutants. HEK293T cells were transfected with p-IL-1β-DHFR and p-caspase-1 plasmids. After transfection (24 h), the cells were either treated with DMEM or EBSS for 2 h. Secretion of 845 IL-1β mutant proteins was detected by immunoblot. (C) IL-1β mutant 132-133AA or 198-199AA is accessible to proteinase K digestion. HEK293T cells were transfected with plasmids encoding p-caspase-1 and IL-1β mutant 132-133AA or 198-199AA. After transfection (24 h), the cells were treated with EBSS for 2 h. The 25k membrane fraction was collected and subjected to proteinase K digestion assay and then analyzed by immunoblot using indicated antibodies. The level of proteinase K protection was calculated as the percentage of the total protein. Error bars represent standard deviations of at least three experiments.
HSP90 is required for the entry of IL-1β into the vesicle intermediate
The chaperone protein HSC70 and HSP90 have been reported to function in chaperone-mediated autophagy (CMA) (Kaushik and Cuervo, 2012; Majeski and Dice, 2004). HSP70 has also been implicated in autophagy and stress responses (Murphy, 2013). We performed shRNA-mediated knockdown of the three chaperone proteins to assess their potential role in the membrane translocation of IL-1β. Knockdown of Hsp90, but not of Hsp70 or Hsc70 substantially reduced IL-1β secretion (Figure 8A). As a control, knockdown of Hsc70 compromised CMA as indicated by the stabilization of a CMA cargo, GAPDH (Figure 8-figure supplement 1A). Moreover, secretion of mature IL-1β was inhibited in a dose-dependent manner by an HSP90 inhibitor geldanamycin (Figure 8B). In both experiments, mature IL-1β accumulated in the cytosol fraction at the expense of secretion. Knockdown of Hsp90 also rendered IL-1β accessible to proteinase K digestion (Figure 8C), consistent with a role for HSP90 in the translocation of IL-1β as opposed to some later secretion event. Furthermore, in a co-immunoprecipitation assay, HSP90 associated with m-IL-1β but not the translocation-deficient mutants Q132K133 and Q198L199 (Figure 8D). Although p-IL-1β also formed a complex with HSP90, the efficiency appeared lower than for m-IL-1β. These results suggest that HSP90 binds to a region of the mature IL-1β, including the essential residues Q132K133 and Q198L199, to promote the translocation event. Cleavage of p-IL-1β by caspase-1 may potentiate the recruitment of HSP90 to the mature form of IL-1β however chaperone binding is not required for this proteolytic event (Figures 8D and 7B).
In the CMA pathway, HSC70 and HSP90 play different roles. HSC70 binds to cargoes and delivers them into 266 the lysosome as well as disassembling LAMP2A oligomers, whereas HSP90 is required for the oligomerization and stability of LAMP2A (Bandyopadhyay et al., 2008; Chiang et al., 1989). Co-immunoprecipitation indicated that IL-1β associates with HSP90 but not HSC70 (Figure 8-figure supplement 1B). In addition, knockdown of Lamp2A compromised CMA but did not affect the secretion of IL-1β, and disruption of the lysosome did not result in the release of IL-1β from the membrane carrier (Figure 8-figure supplement 1C-E). These data suggest that the translocation of IL-1β into the vesicle carrier is mechanistically distinct from CMA.
Figure 8 HSP90 is involved in the entry of IL-1β into vesicles (A) Knockdown of Hsp90 inhibits IL-1β secretion. HEK293T cells were transduced with lentivirus carrying control (Ctrl) shRNA or shRNA against Hsc70, Hsp90 or Hsp70. Then the cells were transfected with p-IL-1β and p-caspase-1 plasmids. After transfection (24 h), the cells were cultured in EBSS for 2 h followed by determination of IL-1β secretion by immunoblot. (B) IL-1β secretion is reduced in the presence of HSP90 inhibitor geldanamycin. HEK293T cells were transfected with p-IL-1β and p-caspase-1 plasmids. After transfection (24 h), the cells were treated with EBSS containing different concentrations of geldanamycin as indicated. Immunoblot was performed as shown in Figure 1. Quantification of IL-1β secretion was calculated as the ratio between the amount of IL-1β in the medium and the total amount (the sum of IL-1β in both medium and lysate). (C) IL-1β remains accessible to proteinase K in Hsp90 knockdown cells. HEK293T cells were transduced with lentivirus carrying control (Ctrl) shRNA or shRNA against Hsp90. Then the cells were transfected with p-IL-1β and p-caspase-1 plasmids. After transfection (24 h), the cells were cultured in EBSS for 2 h. The 25k membrane fraction was collected and digested with proteinase K and then analyzed by immunoblotting using indicated antibodies. (D) Association of HSP90 with IL-1β WT and mutants. HEK293T cells transfected with p-caspase-1 and IL-1β mutant 132-133AA or 198-199AA were starved in EBSS for 2 h. Immunoprecipitation (IP) with anti-HSP90 antibody coupled to protein G-agarose was performed, followed by an immunoblot with anti-IL-1β and anti-HSP90 antibodies.
Figure 8- figure supplement 1 Translocation of IL-1β is mechanistically different from CMA (A) Knockdown of Hsc70 reduces CMA. HEK293T cells transduced with lentivirus carrying control (Ctrl) shRNA or shRNA against Hsc70 were incubated with regular medium (-CMA) or DMEM (+CMA) in the presence of 20 μg/ml cycloheximide for 24 h. The cells were lysed and analyzed by immunoblotting using indicated antibodies. For quantification, the ratio of GAPDH and tubulin was calculated and normalized by that in control (-CMA) treatment which was set as one. (B) Co-immunoprecipitation of HSC70 or HSP90 with IL-1β. HEK293T cells transfected with m-IL-1β-FLAG were starved in EBSS for 2 h. Immunoprecipitation (IP) with anti-HSC70 or anti-HSP90 antibody coupled to protein A/G-agarose was performed, followed by an immunoblot with indicated antibodies. (C) Knockdown of Lamp2 blocks CMA. HEK293T cells were transfected with control or LAMP2 siRNA. After transfection (48 h), the cells were trypsinized and plated. After 24 h, siRNA transfection was repeated. After another 48 h, the cells were trypsinized and plated. After 24 h, the cells were incubated with regular medium (-CMA) or DMEM (+CMA) in the presence of 20 μg/ml cycloheximide for 24 h. The cells were lysed and analyzed by immunoblotting using indicated antibodies. For quantification, the ratio of GAPDH and Tubulin was calculated and normalized by that in control (-CMA) treatment which was set as one. (D) Knockdown of LAMP2 does not affect IL-1β secretion. HEK293T cells were transfected with control or LAMP2 siRNA as show in (C). After the second siRNA transfection (24h), the cells were transfected with m-IL-1β-FLAG plasmid. After transfection (24 h), the cells were either cultured in DMEM or EBSS for 2 h followed by determination of IL-1β secretion by immunoblot as shown in Figure 1A. Quantification of IL-1β secretion was calculated as the ratio between the amount of IL-1β in the medium and the total amount (the sum of IL-1β in both medium and lysate). (E) Level of IL-1β in the membrane fraction was not affected by lysosome disruption. HEK293T cells 897 transfected with m-IL-1β were cultured in EBSS for 2 h and then treated with DMSO or 0.5 mM glycyl-L-phenylalanine-2-naphthylamide (GPN) for 10 min. The membrane fraction was collected from the top fractions of a Nycodenz density gradient resolved from membranes in a 25k pellet as described in Material and Methods. Both membrane fraction and cell lysis were analyzed by immunoblotting using indicated antibodies.
We next asked if starvation regulated the association between HSP90 and IL-1β. We performed an HSP90 co-immunoprecipitation experiment with cytosol prepared from cells grown in nutrient-rich or starvation conditions (Figure 9A). Starvation led to a ~2.5 fold increase of the association of HSP90 and IL-1β (Figure 9A). This increase was likely not due to starvation-stimulated processing of p-IL-1β because starvation had no effect on the cleavage of mutant forms of IL-1β unable to bind HSP90 (Figure 7B). Starvation led to a ~ 2 fold increase in the membrane localization and cytosolic depletion of mature IL-1β (Figure 9B). Starvation may stimulate the recruitment of a complex of m-IL-1β/HSP90 to the membrane responsible for IL-1β translocation (Figure 9B).
Figure 9 Induction of autophagy enhances the membrane incorporation of IL-1β (A) Starvation enhances the association of IL-1β with HSP90. HEK293T cells transfected with p-IL-1β and p-caspase-1 were cultured in DMEM or EBSS for 2 h. Immunoprecipitation with anti-HSP90 antibody was performed followed by an immunoblot with anti-IL-1β and anti-HSP90 antibodies. (B) Starvation promotes the entry of IL-1β into the membrane fraction. HEK293T cells transfected with p-IL-1β and p-caspase-1 were cultured in DMEM or EBSS for 2 h. The membrane fraction was collected from the top fractions of a Nycodenz density gradient resolved from membranes in a 25k pellet as described in Material and Methods. The cytosolic fraction was collected as the supernatant after 100k×g centrifugation. Immunoblot was performed to determine the levels of IL-1β in both fractions. (C) A proposed model for autophagy-mediated IL-1β secretion. Cytosolic IL-1β associates with HSP90 which facilitates the translocation of IL-1β into the lumen of a vesicle carrier which later either turns into a phagophore and an autophagosome or fuses with them. IL-1β localizes between the outer and inner membrane after the double membrane autophagosome forms. The topological distribution ensures the secretion of IL-1β in a soluble form. The IL-1β-containing autophagosome may directly fuse with the plasma membrane or further fuse with a MVB followed by fusion with the plasma membrane.
Genetic and cell biological studies have implicated autophagy in the transport of several leaderless cargoes to the extracellular space (Bruns et al., 2011; Dupont et al., 2011; Duran et al., 2010; Manjithaya et al., 2010). Unconventional secretory cargoes, such as IL-1β and Acb1, have been shown to have overlapping requirements with formation of the autophagosome or its precursor suggesting that the autophagosome may physically convey these cargo proteins to the cell surface. A key question is if and how these cargoes engage the autophagosome and how this structure exports soluble cargo molecules. In this study, we probed the organelle association and molecular requirements for the secretion of one such unconventional cargo protein, IL-1β. Using surrogate cell lines rather than macrophages to reconstitute autophagy-mediated secretion of IL-1β (Figure 1), we find mature IL-1β localized to the lumen of the membrane in early intermediates and mature autophagosomes (Figures 2-4, 6). This surprising location may help to explain how mature IL-1β is secreted in a soluble form to the cell surface (Figure 9C). However, localization to the lumen between the two membranes of the autophagosome would require that IL-1β is translocated from the cytoplasm across the membrane precursor of a phagophore, rather than being engulfed as the phagophore membrane matures by closure into an autophagosome. Our evidence suggests that IL-1β must unfold or be held in an unfolded state to promote membrane translocation (Figure 5) and that a complex sorting signal in the mature portion of IL-1β interacts with HSP90 to deliver the chaperone and its cargo to a site on a phagophore precursor membrane where the mature species is translocated (Figures 7-9).
The unconventional secretory cargo fibroblast growth factor 2 (FGF2) has been shown to directly translocate across the plasma membrane as a folded protein without the apparent aid of chaperones (Backhaus et al., 2004; Steringer et al., 2015). Unlike FGF2, the entry of IL-1β into the autophagosomal carrier appears to be dependent on protein unfolding in a conformational state that may be fostered by the association of HSP90 with two KFERQ-like sequences within the mature portion of IL-1β (Figure 5 and 8). This translocation mechanism appears superficially similar to another delivery process termed HSC70-dependent CMA in which autophagic cargoes bearing KFERQ targeting motifs are directed into the lysosome for degradation. Indeed, using a cell-free approach to study the import of CMA cargo into isolated lysosomes, Salvador et al. (2000) reported that DHFR fused to a CMA cargo is blocked in translocation by addition of methotrexate, a drug that stabilizes DHFR to unfolding, just as we have shown that IL-1β fused to DHFR is blocked in cells treated with a cell permeable folate analog, aminopterin (Wei et al., 2013). In our fractionation study, IL-1β distributed in LC3-positive autophagosomal carriers that were separated from the lysosome marker LAMP2, the proposed receptor or channel for uptake of CMA cargo (Kaushik and Cuervo, 2012)(Figure 2B). This observation, together with the involvement of a different chaperone i.e. HSP90, suggests distinct routes for IL-1β and cargoes of the CMA pathway.
The target membrane for IL-1β translocation may be a vesicle that could fuse with or form the autophagosome. We find that mature IL-1β can be detected within protease inaccessible membranes in cells blocked early in the autophagic pathway (e.g. ATG5 null cells and cells depleted of FIP200, both of which block at a stage prior to the lipidation of LC3). The identity of the vesicle carrier is unknown and could be any one of those reported to supply membrane to the formation of the autophagosome (Ge et al., 2014a; Lamb et al., 2013). Although we have ruled out the involvement of LAMP2A IL-1β translocation, it is likely that a membrane receptor locating on the membrane of the vesicle carrier, perhaps a functional equivalent of LAMP2A, recruits the protein complex of HSP90 and IL-1β, therefore designating the correct membrane targeting of IL-1β. In addition, a protein conducting channel may be involved in the translocation of IL-1β into the membrane. It seems unlikely that a standard translocation channel, such as SEC61, is involved in this import process, but no current evidence bears on this point.
The exact route by which the autophagosome delivers mature IL-1β to the cell surface as well as how it avoids fusion with degradative lysosome remains obscure, possibly involving interaction with the multi-vesicular body or some form of lysosome as a prelude to fusion at the cell surface (Figure 9C), and this process may require selective recruitment of membrane sorting and targeting factors such as Rabs and SNAREs. Fusion of the autophagosome directly with the plasma membrane would lead to the release of soluble IL-1β available to trigger an inflammatory response in the surrounding tissue. If mature IL-1β were engulfed within the cytoplasmic interior of the autophagosome, fusion of this organelle at the cell surface might release an intact vesicle corresponding to the inner membrane-enclosed cytoplasmic compartment of the autophagosome. We found mature IL-1β secreted by macrophages or in our surrogate cell system to be completely soluble, thus inconsistent with the engulfment model (data not shown). An alternative possibility may be that the autophagosome fuses with another intracellular organelle such as the MVB or the lysosome under conditions where the inner membrane of the autophagosome is degraded. If so, mature IL-1β would be available for secretion if the combined organelle (amphisome, Figure 9C) fused with the plasma membrane. However, for this model to be viable, the mature IL-1β released on dissolution of the autophagosome inner membrane would have to withstand proteolytic attack such as may be encountered in an amphisome or lysosome. Because mature IL-1β is clearly sensitive to proteolysis (Figure 4), thus any compartment engaged in presenting autophagosomal content to the cell surface must be depleted of proteases. The nature of the organelle that delivers autophagosome content to the plasma membrane may be probed by selective ablation of different Rab proteins, e.g. Rab11, Rab27 and Rab35, which appear to be required for fusion of the MVB with the cell surface (Hsu et al., 2010; Ostrowski et al., 2010; Savina et al., 2002), or Rab27a and Rab38, implicated in the fusion of lysosomes at the cell surface (Blott and Griffiths, 2002; Hume et al., 2001; Jager et al., 2000.


 . The power dissipated in this source is introduced back into the circuit in the power generated by the Nernst independent voltage sources,
  and
and  . The power dissipated in the dependent voltage source Vloss models any additional power not used to perform chemical or electrical work. ……
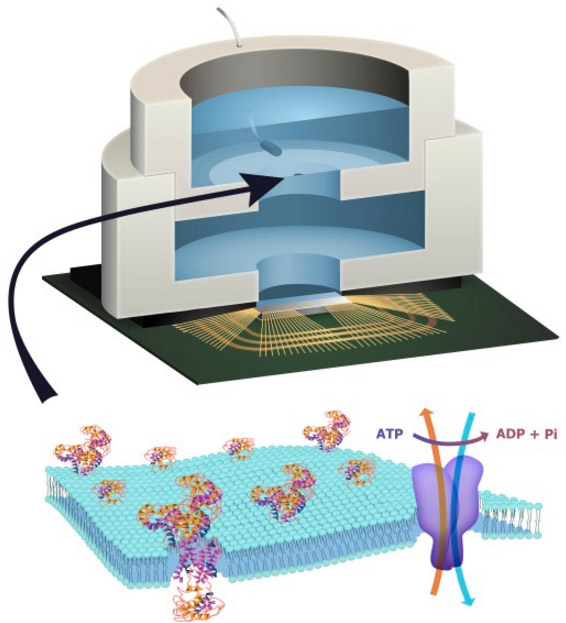