Funding, Deals & Partnerships: BIOLOGICS & MEDICAL DEVICES; BioMed e-Series; Medicine and Life Sciences Scientific Journal – http://PharmaceuticalIntelligence.com
Use of Systems Biology for Design of inhibitor of Galectins as Cancer Therapeutic – Strategy and Software
Curator:Stephen J. Williams, Ph.D.
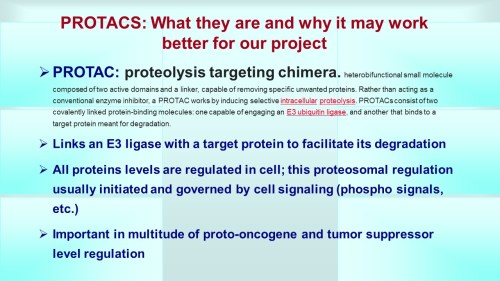
Below is a slide representation of the overall mission 4 to produce a PROTAC to inhibit Galectins 1, 3, and 9.
Using A Priori Knowledge of Galectin Receptor Interaction to Create a BioModel of Galectin 3 Binding
Now after collecting literature from PubMed on “galectin-3” AND “binding” to determine literature containing kinetic data we generate a WordCloud on the articles.
This following file contains the articles needed for BioModels generation.
From the WordCloud we can see that these corpus of articles describe galectin binding to the CRD (carbohydrate recognition domain). Interestingly there are many articles which describe van Der Waals interactions as well as electrostatic interactions. Certain carbohydrate modifictions like Lac NAc and Gal 1,4 may be important. Many articles describe the bonding as well as surface interactions. Many studies have been performed with galectin inhibitors like TDGs (thio-digalactosides) like TAZ TDG (3-deoxy-3-(4-[m-fluorophenyl]-1H-1,2,3-triazol-1-yl)-thio-digalactoside). This led to an interesting article
.
Dual thio-digalactoside-binding modes of human galectins as the structural basis for the design of potent and selective inhibitors
Human galectins are promising targets for cancer immunotherapeutic and fibrotic disease-related drugs. We report herein the binding interactions of three thio-digalactosides (TDGs) including TDG itself, TD139 (3,3′-deoxy-3,3′-bis-(4-[m-fluorophenyl]-1H-1,2,3-triazol-1-yl)-thio-digalactoside, recently approved for the treatment of idiopathic pulmonary fibrosis), and TAZTDG (3-deoxy-3-(4-[m-fluorophenyl]-1H-1,2,3-triazol-1-yl)-thio-digalactoside) with human galectins-1, -3 and -7 as assessed by X-ray crystallography, isothermal titration calorimetry and NMR spectroscopy. Five binding subsites (A-E) make up the carbohydrate-recognition domains of these galectins. We identified novel interactions between an arginine within subsite E of the galectins and an arene group in the ligands. In addition to the interactions contributed by the galactosyl sugar residues bound at subsites C and D, the fluorophenyl group of TAZTDG preferentially bound to subsite B in galectin-3, whereas the same group favored binding at subsite E in galectins-1 and -7. The characterised dual binding modes demonstrate how binding potency, reported as decreased Kd values of the TDG inhibitors from μM to nM, is improved and also offer insights to development of selective inhibitors for individual galectins.
Figures
Figure 1. Chemical structures of L3, TDG…
Figure 2. Structural comparison of the carbohydrate…
Proteolysis-targeting chimeras (PROTACs) are a promising new class of drugs that selectively degrade cellular proteins of interest. PROTACs that target oncogene products are avidly being explored for cancer therapies, and several are currently in clinical trials. Drug resistance is a substantial challenge in clinical oncology, and resistance to PROTACs has been reported in several cancer cell models. Here, using proteomic analysis, we found intrinsic and acquired resistance mechanisms to PROTACs in cancer cell lines mediated by greater abundance or production of the drug efflux pump MDR1. PROTAC-resistant cells were resensitized to PROTACs by genetic ablation of ABCB1 (which encodes MDR1) or by coadministration of MDR1 inhibitors. In MDR1-overexpressing colorectal cancer cells, degraders targeting either the kinases MEK1/2 or the oncogenic mutant GTPase KRASG12C synergized with the dual epidermal growth factor receptor (EGFR/ErbB)/MDR1 inhibitor lapatinib. Moreover, compared with single-agent therapies, combining MEK1/2 degraders with lapatinib improved growth inhibition of MDR1-overexpressing KRAS-mutant colorectal cancer xenografts in mice. Together, our findings suggest that concurrent blockade of MDR1 will likely be required with PROTACs to achieve durable protein degradation and therapeutic response in cancer.
INTRODUCTION
Proteolysis-targeting chimeras (PROTACs) have emerged as a revolutionary new class of drugs that use cancer cells’ own protein destruction machinery to selectively degrade essential tumor drivers (1). PROTACs are small molecules with two functional ends, wherein one end binds to the protein of interest, whereas the other binds to an E3 ubiquitin ligase (2, 3), bringing the ubiquitin ligase to the target protein, leading to its ubiquitination and subsequent degradation by the proteasome. PROTACs have enabled the development of drugs against previously “undruggable” targets and require neither catalytic activity nor high-affinity target binding to achieve target degradation (4). In addition, low doses of PROTACs can be highly effective at inducing degradation, which can reduce off-target toxicity associated with high dosing of traditional inhibitors (3). PROTACs have been developed for a variety of cancer targets, including oncogenic kinases (5), epigenetic proteins (6), and, recently, KRASG12C proteins (7). PROTACs targeting the androgen receptor or estrogen receptor are avidly being evaluated in clinical trials for prostate cancer (NCT03888612) or breast cancer (NCT04072952), respectively.
However, PROTACs may not escape the overwhelming challenge of drug resistance that befalls so many cancer therapies (8). Resistance to PROTACs in cultured cells has been shown to involve genomic alterations in their E3 ligase targets, such as decreased expression of Cereblon (CRBN), Von Hippel Lindau (VHL), or Cullin2 (CUL2) (9–11). Up-regulation of the drug efflux pump encoded by ABCB1—MDR1 (multidrug resistance 1), a member of the superfamily of adenosine 5′-triphosphate (ATP)–binding cassette (ABC) transporters—has been shown to convey drug resistance to many anticancer drugs, including chemotherapy agents, kinase inhibitors, and other targeted agents (12). Recently, PROTACs were shown to be substrates for MDR1 (10, 13), suggesting that drug efflux represents a potential limitation for degrader therapies. Here, using degraders (PROTACs) against bromodomain and extraterminal (BET) bromodomain (BBD) proteins and cyclin-dependent kinase 9 (CDK9) as a proof of concept, we applied proteomics to define acquired resistance mechanisms to PROTAC therapies in cancer cells after chronic exposure. Our study reveals a role for the drug efflux pump MDR1 in both acquired and intrinsic resistance to protein degraders in cancer cells and supports combination therapies involving PROTACs and MDR1 inhibitors to achieve durable protein degradation and therapeutic responses.
Fig. 1. Proteomic characterization of degrader-resistant cancer cell lines. (A) Workflow for identifying protein targets up-regulated in degrader-resistant cancer cells. Single-run proteome analysis was performed, and changes in protein levels among parent and resistant cells were determined by LFQ. m/z, mass/charge ratio. (B and C) Cell viability assessed by CellTiter-Glo in parental and dBET6- or Thal SNS 032–resistant A1847 cells treated with increasing doses of dBET6 (B) or Thal SNS 032 (C) for 5 days. Data were analyzed as % of DMSO control, presented as means ± SD of three independent assays. Growth inhibitory 50% (GI50) values were determined using Prism software. (D to G) Immunoblotting for degrader targets and downstream signaling in parental A1847 cells and their derivative dBET6-R or Thal-R cells treated with increasing doses of dBET6 or Thal SNS 032 for 4 hours. The dBET6-R and Thal-R cells were continuously cultured in 500 nM PROTAC. Blots are representative, and densitometric analyses are means ± SD from three blots, each normalized to the loading control, GAPDH. DC50 values, quantitating either (E) the dose of dBET6 that reduces BRD2, BRD3, or BRD4 or (G) the dose of Thal SNS 032 that reduces CDK9 protein levels 50% of the DMSO control treatment, were determined with Prism software. Pol II, polymerase II. (H to K) Volcano plot of proteins with increased or reduced abundance in dBET6-R (H) or Thal-R (I) A1847 cells relative to parental cells. Differences in protein log2 LFQ intensities among degrader-resistant and parental cells were determined by paired t test permutation-based adjusted P values at FDR of <0.05 using Perseus software. The top 10 up-regulated proteins in each are shown in (J) and (K), respectively. FC, fold change. (L and M) ABCB1 log2 LFQ values in dBET6-R cells from (H) and Thal-R cells from (I) compared with those in parental A1847 cells. Data are presented as means ± SD from three independent assays. By paired t test permutation-based adjusted P values at FDR of <0.05 using Perseus software, ***P ≤ 0.001. (N) Cell viability assessed by CellTiter-Glo in parental and MZ1-resistant SUM159 cells treated with increasing doses of MZ1 for 5 days. Data were analyzed as % of DMSO control, presented as means of three independent assays. GI50 values were determined using Prism software. (O and P) Immunoblotting for degrader targets and downstream signaling in parental or MZ1-R SUM159 cells treated with increasing doses of MZ1 for 24 hours. The MZ1-R cells were continuously cultured in 500 nM MZ1. Blots are representative, and densitometric analyses are means ± SD from three blots, each normalized to the loading control, GAPDH. DC50 values were determined in Prism software. (Q and R) Top 10 up-regulated proteins (Q) and ABCB1 log2 LFQ values (R) in MZ1-R cells relative to parental SUM159 cells
Fig. 2. Chronic exposure to degraders induces MDR1 expression and drug efflux activity. (A) ABCB1 mRNA levels in parental and degrader-resistant cell lines as determined by qRT-PCR. Data are means ± SD of three independent experiments. ***P ≤ 0.001 by Student’s t test. (B) Immunoblot analysis of MDR1 protein levels in parental and degrader-resistant cell lines. Blots are representative of three independent experiments. (C to E) Immunofluorescence (“IF”) microscopy of MDR1 protein levels in A1847 dBET6-R (C), SUM159 MZ1-R (D), and Thal-R A1847 cells (E) relative to parental cells. Nuclear staining by DAPI. Images are representative of three independent experiments. Scale bars, 100 μm. (F) Drug efflux activity in A1847 dBET6-R, SUM159 MZ1-R, and Thal-R A1847 cells relative to parental cells (Par.) using rhodamine 123 efflux assays. Bars are means ± SD of three independent experiments. ***P ≤ 0.001 by Student’s t test. (G) Intracellular dBET6 levels in parental or dBET-R A1847 cells transfected with a CRBN sensor and treated with increasing concentrations of dBET6. Intracellular dBET6 levels measured using the CRBN NanoBRET target engagement assay. Data were analyzed as % of DMSO control, presented as means ± SD of three independent assays. *P ≤ 0.05, **P ≤ 0.01, and ***P ≤ 0.001 by Student’s t test. (H and I) FISH analysis of representative drug-sensitive parental and drug-resistant A1847 (H) and SUM159 (I) cells using ABCB1 and control XCE 7 centromere probes. Images of interphase nuclei were captured with a Metasystems Metafer microscope workstation, and the raw images were extracted and processed to depict ABCB1 signals in magenta, centromere 7 signals in cyan, and DAPI-stained nuclei in blue. (J and K) CpG methylation status of the ABCB1 downstream promoter (coordinates: chr7.87,600,166-87,601,336) by bisulfite amplicon sequencing in parent and degrader-resistant A1847 (J) and SUM159 (K) cells. Images depict the averaged percentage of methylation for each region of the promoter, where methylation status is depicted by color as follows: red, methylated; blue, unmethylated. Schematic of the ABCB1 gene with the location of individual CpG sites is shown. Graphs are representative of three independent experiments. (L and M) Immunoblot analysis of MDR1 protein levels after short-term exposure [for hours (h) or days (d) as indicated] to BET protein degraders dBET6 or MZ1 (100 nM) in A1847 (L) and SUM159 (M) cells, respectively. Blots are representative of three independent experiments. (N to P) Immunoblot analysis of MDR1 protein levels in A1847 and SUM159 cells after long-term exposure (7 to 30 days) to BET protein degraders dBET6 (N), Thal SNS 032 (O), or MZ1 (P), each at 500 nM. Blots are representative of three independent experiments. (Q and R) Immunoblot analysis of MDR1 protein levels in degrader-resistant A1847 (Q) and SUM159 (R) cells after PROTAC removal for 2 or 7 days. Blots are representative of three independent experiments.
Fig. 3. Blockade of MDR1 activity resensitizes degrader-resistant cells to PROTACs. (A and B) Cell viability by CellTiter-Glo assay in parental and degrader-resistant A1847 (A) and SUM159 (B) cells transfected with control siRNA or siRNAs targeting ABCB1 and cultured for 120 hours. Data were analyzed as % of control, presented as means ± SD of three independent assays. ***P ≤ 0.001 by Student’s t test. (C and D) Immunoblot analysis of degrader targets after ABCB1 knockdown in parental and degrader-resistant A1847 (C) and SUM159 (D) cells. Blots are representative, and densitometric analyses using ImageJ are means ± SD of three blots, each normalized to the loading control, GAPDH. (E) Drug efflux activity, using the rhodamine 123 efflux assay, in degrader-resistant cells after MDR1 inhibition by tariquidar (0.1 μM). Data are means ± SD of three independent experiments. ***P ≤ 0.001 by Student’s t test. (F to H) Cell viability by CellTiter-Glo assay in parental and dBET6-R (F) or Thal-R (G) A1847 cells or MZ1-R SUM159 cells (H) treated with increasing concentrations of tariquidar. Data are % of DMSO control, presented as means ± SD of three independent assays. GI50 value determined with Prism software. (I to K) Immunoblot analysis of degrader targets after MDR1 inhibition (tariquidar, 0.1 μM for 24 hours) in parental and degrader-resistant A1847 cells (I and J) and SUM159 cells (K). Blots are representative, and densitometric analyses are means ± SD from three blots, each normalized to the loading control, GAPDH. (L and M) A 14-day colony formation assessed by crystal violet staining of (L) A1847 cells or (M) SUM159 cells treated with degrader (0.1 μM; dBET6 or MZ1, respectively) and MDR1 inhibitor tariquidar (0.1 μM). Images are representative of three biological replicates. (N) Immunoblotting for MDR1 in SUM159 cells stably expressing FLAG-MDR1 after selection with hygromycin. (O) Long-term 14-day colony formation assay of SUM159 cells expressing FLAG-MDR1 that were treated with DMSO, MZ1 (0.1 μM), or MZ1 and tariquidar (0.1 μM) for 14 days, assessed by crystal violet staining. Representative images of three biological replicates are shown. (P and Q) RT-PCR (P) and immunoblot (Q) analysis of ABCB1 mRNA and MDR1 protein levels, respectively, in parental or MZ1-R HCT116, OVCAR3, and MOLT4 cells.
Fig. 4. Overexpression of MDR1 conveys intrinsic resistance to degrader therapies in cancer cells. (A) Frequency of ABCB1 mRNA overexpression in a panel of cancer cell lines, obtained from cBioPortal for Cancer Genomics using Z-score values of >1.2 for ABCB1 mRNA levels (30). (B) Immunoblot for MDR1 protein levels in a panel of 10 cancer cell lines. Blots are representative of three independent experiments. (C) Cell viability by CellTiter-Glo assay in cancer cell lines expressing high or low MDR1 protein levels and treated with Thal SNS 032 for 5 days. Data were analyzed as % of DMSO control, presented as means ± SD of three independent assays. GI50 values were determined with Prism software. (D to F) Immunoblot analysis of CDK9 in MDR1-low (D) or MDR1-high (E) cell lines after Thal SNS 032 treatment for 4 hours. Blots are representative, and densitometric analyses using ImageJ are means ± SD from three blots, each normalized to the loading control, GAPDH. DC50 value determined with Prism. (G and H) Immunoblotting of control and MDR1-knockdown DLD-1 cells treated for 4 hours with increasing concentrations of Thal SNS 032 [indicated in (H)]. Blots are representative, and densitometric analysis data are means ± SD from three blots, each normalized to the loading control, GAPDH. DC50 value determined with Prism. (I) Drug efflux activity using rhodamine 123 efflux assays in DLD-1 cells treated with DMSO or 0.1 μM tariquidar. Data are means ± SD of three independent experiments. ***P ≤ 0.001 by Student’s t test. (J) Intracellular Thal SNS 032 levels, using the CRBN NanoBRET target engagement assay, in MDR1-overexpressing DLD-1 cells treated with DMSO or 0.1 μM tariquidar and increasing doses of Thal SNS 032. Data are % of DMSO control, presented as means ± SD of three independent assays. **P ≤ 0.01 and ***P ≤ 0.001 by Student’s t test. (K to N) Immunoblotting in DLD-1 cells treated with increasing doses of Thal SNS 032 (K and L) or dBET6 (M and N) alone or with tariquidar (0.1 μM) for 4 hours. Blots are representative, and densitometric analyses are means ± SD from three blots, each normalized to the loading control, GAPDH. DC50 value of Thal SNS 032 for CDK9 reduction (L) or of dBET6 for BRD4 reduction (N) determined with Prism. (O to T) Bliss synergy scores based on cell viability by CellTiter-Glo assay, colony formation, and immunoblotting in DLD-1 cells treated with the indicated doses of Thal SNS 032 (O to Q) or dBET6 (R to T) alone or with tariquidar. Cells were treated for 14 days for colony formation assays and 24 hours for immunoblotting.
Fig. 5. Repurposing dual kinase/MDR1 inhibitors to overcome degrader resistance in cancer cells. (A and B) Drug efflux activity by rhodamine 123 efflux assays in degrader-resistant [dBET-R (A) or Thal-R (B)] A1847 cells after treatment with tariquidar, RAD001, or lapatinib (each 2 μM). Data are means ± SD of three independent experiments. *P ≤ 0.05 by Student’s t test. (C and D) CellTiter-Glo assay for the cell viability of parental, dBET6-R, or Thal-R A1847 cells treated with increasing concentrations of RAD001 (C) or lapatinib (D). Data were analyzed as % of DMSO control, presented as means ± SD of three independent assays. GI50 values were determined with Prism software. (E to I) Immunoblot analysis of degrader targets in parental (E), dBET6-R (F and G), and Thal-R (H and I) A1847 cells treated with increasing concentrations of RAD001 or lapatinib for 4 hours. Blots are representative, and densitometric analyses are means ± SD from three blots, each normalized to the loading control, GAPDH. DC50 value of dBET6 for BRD4 reduction (G) or of Thal SNS 032 for CDK9 reduction (I) determined with Prism. (J) Immunoblotting for cleaved PARP in dBET6-R or Thal-R A1847 cells treated with RAD001, lapatinib, or tariquidar (each 2 μM) for 24 hours. Blots are representative of three independent blots. (K to N) Immunoblotting for BRD4 in DLD-1 cells treated with increasing doses of dBET6 alone or in combination with either RAD001 or lapatinib [each 2 μM (K and L)] or KU-0063794 or afatinib [each 2 μM (M and N)] for 4 hours. Blots are representative of three independent experiments and, in (L), are means ± SD from three blots, each normalized to the loading control, GAPDH. DC50 value for BRD4 reduction (L) determined in Prism. (O) Colony formation by DLD-1 cells treated with DMSO, dBET6 (0.1 μM), lapatinib (2 μM), afatinib (2 μM), RAD001 (2 μM), KU-0063794 (2 μM), or the combination of inhibitor and dBET6 for 14 days. Images representative of three independent assays. (P and Q) Immunoblotting for CDK9 in DLD-1 cells treated with increasing doses of Thal SNS 032 and/or RAD001 (2 μM) or lapatinib (2 μM) for 4 hours. Blots are representative, and densitometric analyses are means ± SD from three blots, each normalized to the loading control, GAPDH. DC50 value for CDK9 reduction determined with Prism (Q). (R) Colony formation in DLD-1 cells treated with DMSO, Thal SNS 032 (0.5 μM), lapatinib (2 μM), and/or RAD001 (2 μM) as indicated for 14 days.
Fig. 6. Combining MEK1/2 degraders with lapatinib synergistically kills MDR1-overexpressing KRAS-mutant CRC cells and tumors. (A and B) ABCB1 expression in KRAS-mutant CRC cell lines from cBioPortal (30) (A) and MDR1 abundance in select KRAS-mutant CRC cell lines (B). (C) Cell viability assessed by CellTiter-Glo in CRC cells treated with increasing doses of MS432 for 5 days, analyzed as % of DMSO control. GI50 value determined with Prism software. (D) Colony formation by CRC cells 14 days after treatment with 1 μM MS432. (E) MEK1/2 protein levels assessed by immunoblot in CRC lines SKCO1 (low MDR1) or LS513 (high MDR1) treated with increasing doses of MS432 for 4 hours. (F) Rhodamine 123 efflux in LS513 cells treated with DMSO, 2 μM tariquidar, or 2 μM lapatinib. (G and H) Immunoblotting analysis in LS513 cells treated with increasing doses of MS432 alone or in combination with tariquidar (0.1 μM) or lapatinib (5 μM) for 24 hours. DC50 value for MEK1 levels determined with Prism. (I) Immunoblotting in LS513 cells treated with DMSO, PD0325901 (0.01 μM), lapatinib (5 μM), or the combination for 48 hours. (J and K) Immunoblotting in LS513 cells treated either with DMSO, MS432 (1 μM), tariquidar (0.1 μM) (J), or lapatinib (5 μM) (K), alone or in combination. (L) Bliss synergy scores determined from cell viability assays (CellTiter-Glo) in LS513 cells treated with increasing concentrations of MS432, lapatinib, or the combination. (M and N) Colony formation by LS513 cells (M) and others (N) treated with DMSO, lapatinib (2 μM), MS432 (1 μM), or the combination for 14 days. (O and P) Immunoblotting in LS513 cells treated with increasing doses of MS934 alone (O) or combined with lapatinib (5 μM) (P) for 24 hours. (Q and R) Tumor volume of LS513 xenografts (Q) and the body weights of the tumor-bearing nude mice (R) treated with vehicle, MS934 (50 mg/kg), lapatinib (100 mg/kg), or the combination. n = 5 mice per treatment group. In (A) to (R), blots and images are representative of three independent experiments, and quantified data are means ± SD [SEM in (Q) and (R)] of three independent experiments; ***P ≤ 0.001 by Student’s t test.
Fig. 7. Lapatinib treatment improves KRASG12C degrader therapies in MDR1-overexpressing CRC cell lines. (A and B) Colony formation by SW1463 (A) or SW837 (B) cells treated with DMSO, LC-2 (1 μM), or MRTX849 (1 μM) for 14 days. Images representative of three independent assays. (C to E) Immunoblotting in SW1463 cells (C and D) and SW837 cells (E) treated with DMSO, LC-2 (1 μM), tariquidar (0.1 μM) (C), or lapatinib (5 μM) (D and E) alone or in combination for 48 hours. Blots are representative of three independent experiments. (F and G) Bliss synergy scores based on CellTiter-Glo assay for the cell viability of SW1463 (F) or SW837 (G) cells treated with increasing concentrations of LC-2, lapatinib, or the combination. Data are means of three experiments ± SD. (H and I) Colony formation of SW1463 (H) or SW837 (I) cells treated as indicated (−, DMSO; LC-2, 1 μM; lapatinib, 2 μM; tariquidar, 0.1 μM) for 14 days. Images representative of three independent assays. (J) Rationale for combining lapatinib with MEK1/2 or KRASG12C degraders in MDR1-overexpressing CRC cell lines. Simultaneous blockade of MDR1 and ErbB receptor signaling overcomes degrader resistance and ErbB receptor kinome reprogramming, resulting in sustained inhibition of KRAS effector signaling.
The UK Biobank (UKBB) this week unveiled to scientists the entire genomes of 200,000 people who are part of a long-term British health study.
The trove of genomes, each linked to anonymized medical information, will allow biomedical scientists to scour the full 3 billion base pairs of human DNA for insights into the interplay of genes and health that could not be gleaned from partial sequences or scans of genome markers. “It is thrilling to see the release of this long-awaited resource,” says Stephen Glatt, a psychiatric geneticist at the State University of New York Upstate Medical University.
Other biobanks have also begun to compile vast numbers of whole genomes, 100,000 or more in some cases (see table, below). But UKBB stands out because it offers easy access to the genomic information, according to some of the more than 20,000 researchers in 90 countries who have signed up to use the data. “In terms of availability and data quality, [UKBB] surpasses all others,” says physician and statistician Omar Yaxmehen Bello-Chavolla of the National Institute for Geriatrics in Mexico City.
Enabling your vision to improve public health
Data drives discovery. We have curated a uniquely powerful biomedical database that can be accessed globally for public health research. Explore data from half a million UK Biobank participants to enable new discoveries to improve public health.
This UKBB biobank represents genomes collected from 500,000 middle-age and elderly participants for 2006 to 2010. The genomes are mostly of a European descent. Other large scale genome sequencing ventures like Iceland’s DECODE, which collected over 100,000 genomes, is now a subsidiary of Amgen, and mostly behind IP protection, not Open Access as this database represents.
UK Biobank is a large-scale biomedical database and research resource, containing in-depth genetic and health information from half a million UK participants. The database is regularly augmented with additional data and is globally accessible to approved researchers undertaking vital research into the most common and life-threatening diseases. It is a major contributor to the advancement of modern medicine and treatment and has enabled several scientific discoveries that improve human health.
A summary of some large scale genome sequencing projects are show in the table below:
Biobank
Completed Whole Genomes
Release Information
UK Biobank
200,000
300,000 more in early 2023
TransOmics for Precision Medicien
161,000
NIH requires project specific request
Million Veterans Program
125,000
Non-Veterans Affairs researchers get first access
100,000 Genomes Project
120,000
Researchers must join Genomics England collaboration
All of Us
90,000
NIH expects to release 2022
Other Related Articles on Genome Biobank Projects in this Open Access Online Scientific Journal Include the Following:
Novartis uses a ‘dimmer switch’ medication to fine-tune gene therapy candidates
Reporter: Amandeep Kaur, BSc., MSc.
Using viral vectors, lipid nanoparticles, and other technologies, significant progress has been achieved in refining the delivery of gene treatments. However, modifications to the cargo itself are still needed to increase safety and efficacy by better controlling gene expression.
To that end, researchers at Children’s Hospital of Philadelphia (CHOP) have created a “dimmer switch” system that employs Novartis’ investigational Huntington’s disease medicine branaplam (LMI070) as a regulator to fine-tune the quantity of proteins generated from a gene therapy.
The investigational medicine branaplam was shown to fine-tune the expression of an erythropoietin gene therapy in mice by scientists from Children’s Hospital of Philadelphia and Novartis. (Novartis)
According to a new study published in Nature, the Xon system altered quantities of erythropoietin—which is used to treat anaemia associated with chronic renal disease—delivered to mice using viral vectors. The method has previously been licenced by Novartis, the maker of the Zolgensma gene therapy for spinal muscular atrophy.
The Xon system depends on a process known as “alternative splicing,” in which RNA is spliced to include or exclude specific exons of a gene, allowing the gene to code for multiple proteins. The team used branaplam, a small-molecule RNA-splicing modulator, for this platform. The medication was created to improve SMN2 gene splicing in order to cure spinal muscular atrophy. Novartis shifted its research to try the medication against Huntington’s disease after a trial failure.
A gene therapy’s payload remains dormant until oral branaplam is given, according to Xon. The medicine activates the expression of the therapy’s functional gene by causing it to splice in the desired way. Scientists from CHOP and the Novartis Institutes for BioMedical Research put the dimmer switch to the exam in an Epo gene therapy carried through adeno-associated viral vectors. The usage of branaplam increased mice Epo levels in the blood and hematocrit levels (the proportion of red blood cells to whole blood) by 60% to 70%, according to the researchers. The researchers fed the rodents branaplam again as their hematocrit decreased to baseline levels. The therapy reinduced Epo to levels similar to those seen in the initial studies, according to the researchers.
The researchers also demonstrated that the Xon system could be used to regulate progranulin expression, which is utilised to treat PGRN-deficient frontotemporal dementia and neuronal ceroid lipofuscinosis. The scientists emphasised that gene therapy requires a small treatment window to be both safe and effective.
In a statement, Beverly Davidson, Ph.D., the study’s senior author,said, “The dose of a medicine can define how high you want expression to be, and then the system can automatically ‘dim down’ at a pace corresponding to the half-life of the protein.”
“We may imagine scenarios in which a medication is used only once, such as to control the expression of foreign proteins required for gene editing, or only on a limited basis. Because the splicing modulators we examined are administered orally, compliance to control protein expression from viral vectors including Xon-based cassettes should be high.”
In gene-modifying medicines, scientists have tried a variety of approaches to alter gene expression. For example, methyl groups were utilised as a switch to turn on or off expression of genes in the gene-editing system CRISPR by a team of researchers from the Massachusetts Institute of Technology and the University of California, San Francisco.
Auxolytic, a biotech company founded by Stanford University academics, has described how knocking down a gene called UMPS could render T-cell therapies ineffective by depriving T cells of the nutrition uridine. Xon could also be tailored to work with cancer CAR-T cell therapy, according to the CHOP-Novartis researchers. The dimmer switch could help prevent cell depletion by halting CAR expression, according to the researchers. According to the researchers, such a tuneable switch could help CRISPR-based treatments by providing “a short burst” of production of CRISPR effector proteins to prevent undesirable off-target editing.
Reporter: Danielle Smolyar, Research Assistant 3 – Text Analysis for 2.0 LPBI Group’s TNS #1 – 2020/2021 Academic Internship in Medical Text Analysis (MTA)
Recently, researchers at Mount Sinai were able to develop a therapeutic agent that shows high levels of effectiveness in Vitro disrupting a biological pathway that allow cancer to survive. This finding is according to a paper which was published in Cancer Discovery, which is a Journal of the American Association of cancer research in July 2021.
The therapy in which they focus on is a molecule named MS21, which causes the degradation of AKT which is an enzyme that is very active and present in cancers. In this study there was much evidence that pharmacological degradation of AKT is a feasible treatment for cancer’s which have a mutation in certain genes.
AKT is a cancer gene that encodes an enzyme that is abnormally activated in cancer cells to stimulate tumor growth. The degradation of AKT reverses all these processes which ultimately inhibits further tumor growth.
“Our study lays a solid foundation for the clinical development of an AKT degrader for the treatment of human cancers with certain gene mutations,” said Ramon Parsons, MD, Ph.D., Director of The Tisch Cancer Institute and Ward-Coleman Chair in Cancer Research and Chair of Oncological Sciences at the Icahn School of Medicine at Mount Sinai. “Examination of 44,000 human cancers identified that 19 percent of tumors have at least one of these mutations, suggesting that a large population of cancer patients could benefit from therapy with an AKT degrader such as MS21.”
MS21 was tested and human cancer derived cell lines, is used in Laboratories as a model to study the efficacy of different cancer therapies.
At Mount Sinai they were looking to develop MS21 with an industry partner in order to open clinical trials for patients.
“Translating these findings into effective cancer therapies for patients is a high priority because the mutations and the resulting cancer-driving pathways that we lay out in this study are arguably the most commonly activated pathways in human cancer, but this effort has proven to be particularly challenging,” said Jian Jin, Ph.D., Mount Sinai Professor in Therapeutics Discovery and Director of the Mount Sinai Center for Therapeutics Discovery at Icahn Mount Sinai. “We look forward to an opportunity to develop this molecule into a therapy that is ready to be studied in clinical trials.”
Advancing cancer precision medicine by creating a better toolbox for cancer therapy
Jian Jin1,2,3,4,5*, Arvin C. Dar1,2,3,4, Deborah Doroshow1
A
mong approximately 20,000 proteins in the human proteome, 627 have been identified by cancer-dependency studies as priority cancer targets, which are functionally important for various cancers. Of these 600-plus priority targets, 232 are enzymes and 395 are nonenzyme proteins (1). Tremendous progress has been made over the past several decades in targeting enzymes, in particular kinas-es, which have suitable binding pockets that can be occupied by small-molecule inhibitors, leading to U.S. Food and Drug Administration (FDA) approvals of many small-molecule drugs as targeted anticancer thera-
1Tisch Cancer Institute; 2Department of Oncological Sciences; 3Department of Pharmacological Sciences; 4Mount Sinai Center for Therapeutics Discovery; 5Department of Neuroscience, Icahn School of Medicine at Mount Sinai, New York, NY
pies. However, most of the 395 nonenzyme protein targets, including transcription factors (TFs), do not have suitable binding pockets that can be effectively targeted by small molecules. These targets have consequently been considered undruggable; however, new cutting-edge approaches and technologies have recently been developed to target some of these “un-druggable” proteins in order to advance precision oncology.
TPD, a promising approach to precision cancer therapeutics
Targeted protein degradation (TPD) refers to the process of chemically eliminating proteins of interest (POIs) by utilizing small molecules, which are broadly divided into two types of modalities: PROteolysis Targeting Chimeras (PROTACs) and molecular glues (2). PROTACs are het-erobifunctional small molecules that contain two moieties: one binding the POI, linked to another binding an ubiquitin E3 ligase. The induced proximity between the POI and ubiquitination machinery leads to selective polyubiquitylation of the POI and its subsequent degradation by the ubiquitin–proteasome system (UPS). Molecular glues are monovalent small molecules, which, when built for TPD, directly induce interactions between the POI and an E3 ligase, also resulting in polyubiquitylation and subsequent degradation of the POI by the UPS. One of the biggest potential advantages of these therapeutic modalities over traditional inhibitors is that PROTACs and molecular glues can target undruggable proteins. Explosive growth has been seen in the TPD field over recent years (2, 3). Here, we highlight several recent advancements.
TF-PROTAC, a novel platform for targeting undruggable
tumorigenic TFs
Many undruggable TFs are tumorigenic. To target them, TF-PROTAC was developed (4), which exploits the fact that TFs bind DNA in a sequence-specific manner. TF-PROTAC was created to selectively bind a TF and E3 ligase simultaneously, by conjugating a DNA oligonucleotide specific for the TF of interest to a selective E3 ligase ligand. As stated earlier, this simultaneous binding and induced proximity leads to selective polyubiquitination of the TF and its subsequent degradation by the UPS. TF-PROTAC is a cutting-edge technology that could potentially provide a universal strategy for targeting most undruggable tumorigenic TFs.
Development of novel PROTAC degraders
WDR5, an important scaffolding protein, not an enzyme, is essential for sustaining tumorigenesis in multiple cancers, including MLL-rearranged (MLL-r) leukemia. However, small-molecule inhibitors that block the pro-tein–protein interaction (PPI) between WDR5 and its binding partners exhibit very modest cancer cell–killing effects, likely due to the confounding fact that these PPI inhibitors target only some—but not all—of WDR5’s on-cogenic functions. To address this shortcoming, a novel WDR5 PROTAC, MS67, was recently created using a powerful approach that effectively eliminates the protein and thereby all WDR5 functions via ternary complex structure-based design (Figure 1) (5). MS67 is a highly effective WDR5 degrader that potently and selectively degrades WDR5 and effectively suppresses the proliferation of tumor cells both in vitro and in vivo. This study provides strong evidence that pharmacological degradation of WDR5 as a novel therapeutic strategy is superior to WDR5 PPI inhibition for treating WDR5-dependent cancers.
EZH2 is an oncogenic methyltransferase that catalyzes histone H3 lysine 27 trimethylation, mediating gene repression. In addition to this canonical function, EZH2 has numerous noncanonical tumorigenic functions. EZH2 enzymatic inhibitors, however, are generally ineffective in
suppressing tumor growth in triple-negative breast cancer (TNBC) and MLL-r leukemia models and fail to phenocopy antitumor effects induced by EZH2 knockdown strategies. To target both canonical and noncanon-ical oncogenic functions of EZH2, several novel EZH2 degraders were recently developed, including MS1943, a hydrophobic tag–based EZH2 degrader (6), and MS177, an EZH2 PROTAC (7). MS1943 and MS177 effectively degrade EZH2 and suppress in vitro and in vivo growth in TNBC and MLL-r leukemia, respectively, suggesting that EZH2 degraders could provide a novel and effective therapeutic strategy for EZH2-dependent tumors.
MS21, a novel AKT PROTAC degrader, was developed to target activated AKT, the central node of the PI3K–AKT–mTOR signaling pathway (8). MS21 effectively suppresses the proliferation of PI3K–PTEN pathway-mutant cancers with wild-type KRAS and BRAF, which represent a large percentage of all human cancers. Another recent technology that expands the bifunctional toolbox for TPD is the demonstration that the E3 ligase KEAP1 can be leveraged for PROTAC development using a selective KEAP1 ligand (9). Overall, tremendous progress has been made in discovering novel degraders, some of which have advanced to clinical development as targeted therapies (2, 3).
Novel approaches to selective TPD in cancer cells
To minimize uncontrolled protein degradation in normal tissues, which may cause potential toxicity, a new technology was developed that incorporates a light-inducible switch, termed “opto-PROTAC” (10). This switch serves as a caging group that renders opto-PROTAC inactive in all cells in the absence of ultraviolet (UV) light. Upon UV irradiation, however, the caging group is removed, resulting in the release of the active degrader and spatiotemporal control of TPD in cancer cells. Another strategy to achieve selective TPD in cancer over normal cells is to cage degraders with a folate group (11, 12). Folate-caged degraders are inert and selectively concentrated within cancer cells, which overexpress folate receptors compared to normal cells. The caging group is subsequently removed inside tumor cells, releasing active degraders and achieving selective TPD in these cells. These novel approaches potentially enable degraders to be precision cancer medicines.
11
Frontiers of Medical Research: Cancer
Trametiglue, a novel and atypical molecular glue
The RAS–RAF–MEK–ERK signaling pathway, one of the most frequently mutated pathways in cancer, has been intensively targeted. Several drugs, such as the KRAS G12C inhibitor sotorasib and the MEK inhibitor trametinib, have been approved by the FDA. A significant advancement in this area is the discovery that trametinib unexpectedly binds a pseudokinase scaffold termed “KSR” in addition to MEK through interfacial contacts (13). Based on this structural and mechanistic insight, tra-metiglue, an analog of trametinib, was created as a novel molecular glue to limit adaptive resistance to MEK inhibition by enhancing interfacial binding between MEK, KSR, and the related homolog RAF. This study provides a strong foundation for developing next-generation drugs that target the RAS pathway.
TF-DUBTAC, a novel technology to stabilize undruggable tumor-suppressive TFs
Complementary to degrading tumorigenic TFs, stabilizing tumor-suppressive TFs could provide another effective approach for treating cancer. While most tumor-suppressive TFs are undruggable, TF-DUBTAC was recently developed as a generalizable platform to stabilize tumor-suppressive TFs (14). Deubiquitinase-targeting chimeras (DUBTACs) are heterobifunctional small molecules with a deubiquitinase (DUB) ligand linked to a POI ligand, which stabilize POIs by harnessing the deubiq-uitination machinery (15). Similar to TF-PROTAC, TF-DUBTAC exploits the fact that most TFs bind specific DNA sequences. TF-DUBTAC links a DNA oligonucleotide specific to a tumor-suppressive TF with a selective DUB ligand, resulting in simultaneous binding of the TF and DUB. The induced proximity between the TF and DUB leads to selective deubiquiti-
Putting a bull’s-eye on cancer’s back
Scientists are aiming the immune systems’ “troops” directly at tumors to better treat cancer
Joshua D. Brody, Brian D. Brown
I
mmunotherapy has transformed the treatment of several types of cancers. In particular, immune checkpoint blockade (ICB), which reinvigorates killer T cells, has helped extend the lives of many patients with advanced-stage lung, bladder, kidney, or skin cancers. Unfortunately, ~80% of patients do not respond to current immunotherapies or even-tually relapse. Emerging data indicate that one of the most profound ways cancers resist immunotherapy is by keeping killer T cells out of the tumor and putting other immune cells in a suppressed state (1). This understanding is giving rise to a new frontier in immunotherapy that is using synthetic biology and other approaches to reprogram the tumor from immune “cold” to immune “hot,” so T cells can be recruited to the tumor, and enter, target, and destroy the cancer cells (2) (Figure 1).
Cancers protect themselves by keeping out immune cells
Cancers grow in tissues like foreign invaders. Though they start from healthy cells, mutations turn cells malignant and allow them to grow unchecked. T cells can kill malignant cells that express mutated proteins, but cancers employ strategies to fend off the T cells. One way they do this is
12
nation of the TF and its stabilization. As an exciting new technology, TF-DUBTAC provides a potential general strategy to stabilize most undrugga-ble tumor-suppressive TFs for treating cancer.
Future outlook
The breathtaking pace we are seeing in the development of innovative approaches and technologies for advancing cancer therapies is only expected to accelerate. The promising clinical results achieved by PROTACs with established targets are particularly encouraging and pave the way for development of PROTACs for newer and more innovative targets. These groundbreaking discoveries have now put opportunities to fully realize cancer precision medicine within our reach.
References
F. M. Behan et al., Nature 568, 511–516 (2019).
B. Dale et al., Nat. Rev. Cancer 21, 638–654 (2021).
A. Mullard, Nat. Rev. Drug Discov. 20, 247–250 (2021).
J. Liu et al., J. Am. Chem. Soc. 143, 8902–8910 (2021).
X. Yu et al., Sci. Transl. Med. 13, eabj1578 (2021).
A. Ma et al., Nat. Chem. Biol. 16, 214–222 (2020).
J. Wang et al., Nat. Cell Biol. 24, 384–399 (2022).
J. Xu et al., Cancer Discov. 11, 3064–3089 (2021).
J. Wei et al., J. Am. Chem. Soc. 143, 15073–15083 (2021).
J. Liu et al., Sci. Adv. 6, eaay5154 (2020).
J. Liu et al., J. Am. Chem. Soc. 143, 7380–7387 (2021).
H. Chen et al., J. Med. Chem. 64, 12273–12285 (2021).
Z. M. Khan et al., Nature 588, 509–514 (2020).
J. Liu et al., J. Am. Chem. Soc. 144, 12934–12941 (2022).
N. J. Henning et al., Nat. Chem. Biol. 18, 412–421 (2022
Other related articles published on this Open Access Online Scientific Journal include the following:
Machine Learning (ML) in cancer prognosis prediction helps the researcher to identify multiple known as well as candidate cancer diver genes
From High-Throughput Assay to Systems Biology: New Tools for Drug Discovery
Curator: Stephen J. Williams, PhD
Marc W. Kirschner*
Department of Systems Biology Harvard Medical School
Boston, Massachusetts 02115
With the new excitement about systems biology, there is understandable interest in a definition. This has proven somewhat difficult. Scientific fields, like species, arise by descent with modification, so in their earliest forms even the founders of great dynasties are only marginally different than their sister fields and species. It is only in retrospect that we can recognize the significant founding events. Before embarking on a definition of systems biology, it may be worth remembering that confusion and controversy surrounded the introduction of the term “molecular biology,” with claims that it hardly differed from biochemistry. Yet in retrospect molecular biology was new and different. It introduced both new subject matter and new technological approaches, in addition to a new style.
As a point of departure for systems biology, consider the quintessential experiment in the founding of molecular biology, the one gene one enzyme hypothesis of Beadle and Tatum. This experiment first connected the genotype directly to the phenotype on a molecular level, although efforts in that direction can certainly be found in the work of Archibald Garrod, Sewell Wright, and others. Here a protein (in this case an enzyme) is seen to be a product of a single gene, and a single function; the completion of a specific step in amino acid biosynthesis is the direct result. It took the next 30 years to fill in the gaps in this process. Yet the one gene one enzyme hypothesis looks very different to us today. What is the function of tubulin, of PI-3 kinase or of rac? Could we accurately predict the phenotype of a nonlethal mutation in these genes in a multicellular organism? Although we can connect structure to the gene, we can no longer infer its larger purpose in the cell or in the organism. There are too many purposes; what the protein does is defined by context. The context also includes a history, either developmental or physiological. Thus the behavior of the Wnt signaling pathway depends on the previous lineage, the “where and when” questions of embryonic development. Similarly the behavior of the immune system depends on previous experience in a variable environment. All of these features stress how inadequate an explanation for function we can achieve solely by trying to identify genes (by annotating them!) and characterizing their transcriptional control circuits.
That we are at a crossroads in how to explore biology is not at all clear to many. Biology is hardly in its dotage; the process of discovery seems to have been perfected, accelerated, and made universally applicable to all fields of biology. With the completion of the human genome and the genomes of other species, we have a glimpse of many more genes than we ever had before to study. We are like naturalists discovering a new continent, enthralled with the diversity itself. But we have also at the same time glimpsed the finiteness of this list of genes, a disturbingly small list. We have seen that the diversity of genes cannot approximate the diversity of functions within an organism. In response, we have argued that combinatorial use of small numbers of components can generate all the diversity that is needed. This has had its recent incarnation in the simplistic view that the rules of cis-regulatory control on DNA can directly lead to an understanding of organisms and their evolution. Yet this assumes that the gene products can be linked together in arbitrary combinations, something that is not assured in chemistry. It also downplays the significant regulatory features that involve interactions between gene products, their localization, binding, posttranslational modification, degradation, etc. The big question to understand in biology is not regulatory linkage but the nature of biological systems that allows them to be linked together in many nonlethal and even useful combinations. More and more we come to realize that understanding the conserved genes and their conserved circuits will require an understanding of their special properties that allow them to function together to generate different phenotypes in different tissues of metazoan organisms. These circuits may have certain robustness, but more important they have adaptability and versatility. The ease of putting conserved processes under regulatory control is an inherent design feature of the processes themselves. Among other things it loads the deck in evolutionary variation and makes it more feasible to generate useful phenotypes upon which selection can act.
Systems biology offers an opportunity to study how the phenotype is generated from the genotype and with it a glimpse of how evolution has crafted the phenotype. One aspect of systems biology is the development of techniques to examine broadly the level of protein, RNA, and DNA on a gene by gene basis and even the posttranslational modification and localization of proteins. In a very short time we have witnessed the development of high-throughput biology, forcing us to consider cellular processes in toto. Even though much of the data is noisy and today partially inconsistent and incomplete, this has been a radical shift in the way we tear apart problems one interaction at a time. When coupled with gene deletions by RNAi and classical methods, and with the use of chemical tools tailored to proteins and protein domains, these high-throughput techniques become still more powerful.
High-throughput biology has opened up another important area of systems biology: it has brought us out into the field again or at least made us aware that there is a world outside our laboratories. Our model systems have been chosen intentionally to be of limited genetic diversity and examined in a highly controlled and reproducible environment. The real world of ecology, evolution, and human disease is a very different place. When genetics separated from the rest of biology in the early part of the 20th century, most geneticists sought to understand heredity and chose to study traits in the organism that could be easily scored and could be used to reveal genetic mechanisms. This was later extended to powerful effect to use genetics to study cell biological and developmental mechanisms. Some geneticists, including a large school in Russia in the early 20th century, continued to study the genetics of natural populations, focusing on traits important for survival. That branch of genetics is coming back strongly with the power of phenotypic assays on the RNA and protein level. As human beings we are most concerned not with using our genetic misfortunes to unravel biology’s complexity (important as that is) but with the role of our genetics in our individual survival. The context for understanding this is still not available, even though the data are now coming in torrents, for many of the genes that will contribute to our survival will have small quantitative effects, partially masked or accentuated by other genetic and environmental conditions. To understand the genetic basis of disease will require not just mapping these genes but an understanding of how the phenotype is created in the first place and the messy interactions between genetic variation and environmental variation.
Extracts and explants are relatively accessible to synthetic manipulation. Next there is the explicit reconstruction of circuits within cells or the deliberate modification of those circuits. This has occurred for a while in biology, but the difference is that now we wish to construct or intervene with the explicit purpose of describing the dynamical features of these synthetic or partially synthetic systems. There are more and more tools to intervene and more and more tools to measure. Although these fall short of total descriptions of cells and organisms, the detailed information will give us a sense of the special life-like processes of circuits, proteins, cells in tissues, and whole organisms in their environment. This meso-scale systems biology will help establish the correspondence between molecules and large-scale physiology.
You are probably running out of patience for some definition of systems biology. In any case, I do not think the explicit definition of systems biology should come from me but should await the words of the first great modern systems biologist. She or he is probably among us now. However, if forced to provide some kind of label for systems biology, I would simply say that systems biology is the study of the behavior of complex biological organization and processes in terms of the molecular constituents. It is built on molecular biology in its special concern for information transfer, on physiology for its special concern with adaptive states of the cell and organism, on developmental biology for the importance of defining a succession of physiological states in that process, and on evolutionary biology and ecology for the appreciation that all aspects of the organism are products of selection, a selection we rarely understand on a molecular level. Systems biology attempts all of this through quantitative measurement, modeling, reconstruction, and theory. Systems biology is not a branch of physics but differs from physics in that the primary task is to understand how biology generates variation. No such imperative to create variation exists in the physical world. It is a new principle that Darwin understood and upon which all of life hinges. That sounds different enough for me to justify a new field and a new name. Furthermore, the success of systems biology is essential if we are to understand life; its success is far from assured—a good field for those seeking risk and adventure.
Biologically active small molecules have a central role in drug development, and as chemical probes and tool compounds to perturb and elucidate biological processes. Small molecules can be rationally designed for a given target, or a library of molecules can be screened against a target or phenotype of interest. Especially in the case of phenotypic screening approaches, a major challenge is to translate the compound-induced phenotype into a well-defined cellular target and mode of action of the hit compound. There is no “one size fits all” approach, and recent years have seen an increase in available target deconvolution strategies, rooted in organic chemistry, proteomics, and genetics. This review provides an overview of advances in target identification and mechanism of action studies, describes the strengths and weaknesses of the different approaches, and illustrates the need for chemical biologists to integrate and expand the existing tools to increase the probability of evolving screen hits to robust chemical probes.
5.1.5. Large-Scale Proteomics
While FITExP is based on protein expression regulation during apoptosis, a study of Ruprecht et al. showed that proteomic changes are induced both by cytotoxic and non-cytotoxic compounds, which can be detected by mass spectrometry to give information on a compound’s mechanism of action. They developed a large-scale proteome-wide mass spectrometry analysis platform for MOA studies, profiling five lung cancer cell lines with over 50 drugs. Aggregation analysis over the different cell lines and the different compounds showed that one-quarter of the drugs changed the abundance of their protein target. This approach allowed target confirmation of molecular degraders such as PROTACs or molecular glues. Finally, this method yielded unexpected off-target mechanisms for the MAP2K1/2 inhibitor PD184352 and the ALK inhibitor ceritinib [97]. While such a mapping approach clearly provides a wealth of information, it might not be easily attainable for groups that are not equipped for high-throughput endeavors.
All-in-all, mass spectrometry methods have gained a lot of traction in recent years and have been successfully applied for target deconvolution and MOA studies of small molecules. As with all high-throughput methods, challenges lie in the accessibility of the instruments (both from a time and cost perspective) and data analysis of complex and extensive data sets.
5.2. Genetic Approaches
Both label-based and mass spectrometry proteomic approaches are based on the physical interaction between a small molecule and a protein target, and focus on the proteome for target deconvolution. It has been long realized that genetics provides an alternative avenue to understand a compound’s action, either through precise modification of protein levels, or by inducing protein mutations. First realized in yeast as a genetically tractable organism over 20 years ago, recent advances in genetic manipulation of mammalian cells have opened up important opportunities for target identification and MOA studies through genetic screening in relevant cell types [98]. Genetic approaches can be roughly divided into two main areas, with the first centering on the identification of mutations that confer compound resistance (Figure 3a), and the second on genome-wide perturbation of gene function and the concomitant changes in sensitivity to the compound (Figure 3b). While both methods can be used to identify or confirm drug targets, the latter category often provides many additional insights in the compound’s mode of action.
Figure 3. Genetic methods for target identification and mode of action studies. Schematic representations of (a) resistance cloning, and (b) chemogenetic interaction screens.
5.2.1. Resistance Cloning
The “gold standard” in drug target confirmation is to identify mutations in the presumed target protein that render it insensitive to drug treatment. Conversely, different groups have sought to use this principle as a target identification method based on the concept that cells grown in the presence of a cytotoxic drug will either die or develop mutations that will make them resistant to the compound. With recent advances in deep sequencing it is now possible to then scan the transcriptome [99] or genome [100] of the cells for resistance-inducing mutations. Genes that are mutated are then hypothesized to encode the protein target. For this approach to be successful, there are two initial requirements: (1) the compound needs to be cytotoxic for resistant clones to arise, and (2) the cell line needs to be genetically unstable for mutations to occur in a reasonable timeframe.
In 2012, the Kapoor group demonstrated in a proof-of-concept study that resistance cloning in mammalian cells, coupled to transcriptome sequencing (RNA-seq), yields the known polo-like kinase 1 (PLK1) target of the small molecule BI 2536. For this, they used the cancer cell line HCT-116, which is deficient in mismatch repair and consequently prone to mutations. They generated and sequenced multiple resistant clones, and clustered the clones based on similarity. PLK1 was the only gene that was mutated in multiple groups. Of note, one of the groups did not contain PLK1 mutations, but rather developed resistance through upregulation of ABCBA1, a drug efflux transporter, which is a general and non-specific resistance mechanism [101]. In a following study, they optimized their pipeline “DrugTargetSeqR”, by counter-screening for these types of multidrug resistance mechanisms so that these clones were excluded from further analysis (Figure 3a). Furthermore, they used CRISPR/Cas9-mediated gene editing to determine which mutations were sufficient to confer drug resistance, and as independent validation of the biochemical relevance of the obtained hits [102].
While HCT-116 cells are a useful model cell line for resistance cloning because of their genomic instability, they may not always be the cell line of choice, depending on the compound and process that is studied. Povedana et al. used CRISPR/Cas9 to engineer mismatch repair deficiencies in Ewing sarcoma cells and small cell lung cancer cells. They found that deletion of MSH2 results in hypermutations in these normally mutationally silent cells, resulting in the formation of resistant clones in the presence of bortezomib, MLN4924, and CD437, which are all cytotoxic compounds [103]. Recently, Neggers et al. reasoned that CRISPR/Cas9-induced non-homologous end-joining repair could be a viable strategy to create a wide variety of functional mutants of essential genes through in-frame mutations. Using a tiled sgRNA library targeting 75 target genes of investigational neoplastic drugs in HAP1 and K562 cells, they generated several KPT-9274 (an anticancer agent with unknown target)-resistant clones, and subsequent deep sequencing showed that the resistant clones were enriched in NAMPT sgRNAs. Direct target engagement was confirmed by co-crystallizing the compound with NAMPT [104]. In addition to these genetic mutation strategies, an alternative method is to grow the cells in the presence of a mutagenic chemical to induce higher mutagenesis rates [105,106].
When there is already a hypothesis on the pathway involved in compound action, the resistance cloning methodology can be extended to non-cytotoxic compounds. Sekine et al. developed a fluorescent reporter model for the integrated stress response, and used this cell line for target deconvolution of a small molecule inhibitor towards this pathway (ISRIB). Reporter cells were chemically mutagenized, and ISRIB-resistant clones were isolated by flow cytometry, yielding clones with various mutations in the delta subunit of guanine nucleotide exchange factor eIF2B [107].
While there are certainly successful examples of resistance cloning yielding a compound’s direct target as discussed above, resistance could also be caused by mutations or copy number alterations in downstream components of a signaling pathway. This is illustrated by clinical examples of acquired resistance to small molecules, nature’s way of “resistance cloning”. For example, resistance mechanisms in Hedgehog pathway-driven cancers towards the Smoothened inhibitor vismodegib include compound-resistant mutations in Smoothened, but also copy number changes in downstream activators SUFU and GLI2 [108]. It is, therefore, essential to conduct follow-up studies to confirm a direct interaction between a compound and the hit protein, as well as a lack of interaction with the mutated protein.
5.2.3. “Chemogenomics”: Examples of Gene-Drug Interaction Screens
When genetic perturbations are combined with small molecule drugs in a chemogenetic interaction screen, the effect of a gene’s perturbation on compound action is studied. Gene perturbation can render the cells resistant to the compound (suppressor interaction), or conversely, result in hypersensitivity and enhanced compound potency (synergistic interaction) [5,117,121]. Typically, cells are treated with the compound at a sublethal dose, to ascertain that both types of interactions can be found in the final dataset, and often it is necessary to use a variety of compound doses (i.e., LD20, LD30, LD50) and timepoints to obtain reliable insights (Figure 3b).
An early example of successful coupling of a phenotypic screen and downstream genetic screening for target identification is the study of Matheny et al. They identified STF-118804 as a compound with antileukemic properties. Treatment of MV411 cells, stably transduced with a high complexity, genome-wide shRNA library, with STF-118804 (4 rounds of increasing concentration) or DMSO control resulted in a marked depletion of cells containing shRNAs against nicotinamide phosphoribosyl transferase (NAMPT) [122].
The Bassik lab subsequently directly compared the performance of shRNA-mediated knockdown versus CRISPR/Cas9-knockout screens for the target elucidation of the antiviral drug GSK983. The data coming out of both screens were complementary, with the shRNA screen resulting in hits leading to the direct compound target and the CRISPR screen giving information on cellular mechanisms of action of the compound. A reason for this is likely the level of protein depletion that is reached by these methods: shRNAs lead to decreased protein levels, which is advantageous when studying essential genes. However, knockdown may not result in a phenotype for non-essential genes, in which case a full CRISPR-mediated knockout is necessary to observe effects [123].
Another NAMPT inhibitor was identified in a CRISPR/Cas9 “haplo-insufficiency (HIP)”-like approach [124]. Haploinsuffiency profiling is a well-established system in yeast which is performed in a ~50% protein background by heterozygous deletions [125]. As there is no control over CRISPR-mediated loss of alleles, compound treatment was performed at several timepoints after addition of the sgRNA library to HCT116 cells stably expressing Cas9, in the hope that editing would be incomplete at early timepoints, resulting in residual protein levels. Indeed, NAMPT was found to be the target of phenotypic hit LB-60-OF61, especially at earlier timepoints, confirming the hypothesis that some level of protein needs to be present to identify a compound’s direct target [124]. This approach was confirmed in another study, thereby showing that direct target identification through CRISPR-knockout screens is indeed possible [126].
An alternative strategy was employed by the Weissman lab, where they combined genome-wide CRISPR-interference and -activation screens to identify the target of the phase 3 drug rigosertib. They focused on hits that had opposite action in both screens, as in sensitizing in one but protective in the other, which were related to microtubule stability. In a next step, they created chemical-genetic profiles of a variety of microtubule destabilizing agents, rationalizing that compounds with the same target will have similar drug-gene interactions. For this, they made a focused library of sgRNAs, based on the most high-ranking hits in the rigosertib genome-wide CRISPRi screen, and compared the focused screen results of the different compounds. The profile for rigosertib clustered well with that of ABT-571, and rigorous target validation studies confirmed rigosertib binding to the colchicine binding site of tubulin—the same site as occupied by ABT-571 [127].
From the above examples, it is clear that genetic screens hold a lot of promise for target identification and MOA studies for small molecules. The CRISPR screening field is rapidly evolving, sgRNA libraries are continuously improving and increasingly commercially available, and new tools for data analysis are being developed [128]. The challenge lies in applying these screens to study compounds that are not cytotoxic, where finding the right dosage regimen will not be trivial.
SYSTEMS BIOLOGY AND CANCER RESEARCH & DRUG DISCOVERY
Integrative Analysis of Next-Generation Sequencing for Next-Generation Cancer Research toward Artificial Intelligence
The rapid improvement of next-generation sequencing (NGS) technologies and their application in large-scale cohorts in cancer research led to common challenges of big data. It opened a new research area incorporating systems biology and machine learning. As large-scale NGS data accumulated, sophisticated data analysis methods became indispensable. In addition, NGS data have been integrated with systems biology to build better predictive models to determine the characteristics of tumors and tumor subtypes. Therefore, various machine learning algorithms were introduced to identify underlying biological mechanisms. In this work, we review novel technologies developed for NGS data analysis, and we describe how these computational methodologies integrate systems biology and omics data. Subsequently, we discuss how deep neural networks outperform other approaches, the potential of graph neural networks (GNN) in systems biology, and the limitations in NGS biomedical research. To reflect on the various challenges and corresponding computational solutions, we will discuss the following three topics: (i) molecular characteristics, (ii) tumor heterogeneity, and (iii) drug discovery. We conclude that machine learning and network-based approaches can add valuable insights and build highly accurate models. However, a well-informed choice of learning algorithm and biological network information is crucial for the success of each specific research question
1. Introduction
The development and widespread use of high-throughput technologies founded the era of big data in biology and medicine. In particular, it led to an accumulation of large-scale data sets that opened a vast amount of possible applications for data-driven methodologies. In cancer, these applications range from fundamental research to clinical applications: molecular characteristics of tumors, tumor heterogeneity, drug discovery and potential treatments strategy. Therefore, data-driven bioinformatics research areas have tailored data mining technologies such as systems biology, machine learning, and deep learning, elaborated in this review paper (see Figure 1 and Figure 2). For example, in systems biology, data-driven approaches are applied to identify vital signaling pathways [1]. This pathway-centric analysis is particularly crucial in cancer research to understand the characteristics and heterogeneity of the tumor and tumor subtypes. Consequently, this high-throughput data-based analysis enables us to explore characteristics of cancers with a systems biology and a systems medicine point of view [2].Combining high-throughput techniques, especially next-generation sequencing (NGS), with appropriate analytical tools has allowed researchers to gain a deeper systematic understanding of cancer at various biological levels, most importantly genomics, transcriptomics, and epigenetics [3,4]. Furthermore, more sophisticated analysis tools based on computational modeling are introduced to decipher underlying molecular mechanisms in various cancer types. The increasing size and complexity of the data required the adaptation of bioinformatics processing pipelines for higher efficiency and sophisticated data mining methodologies, particularly for large-scale, NGS datasets [5]. Nowadays, more and more NGS studies integrate a systems biology approach and combine sequencing data with other types of information, for instance, protein family information, pathway, or protein–protein interaction (PPI) networks, in an integrative analysis. Experimentally validated knowledge in systems biology may enhance analysis models and guides them to uncover novel findings. Such integrated analyses have been useful to extract essential information from high-dimensional NGS data [6,7]. In order to deal with the increasing size and complexity, the application of machine learning, and specifically deep learning methodologies, have become state-of-the-art in NGS data analysis.
Figure 1. Next-generation sequencing data can originate from various experimental and technological conditions. Depending on the purpose of the experiment, one or more of the depicted omics types (Genomics, Transcriptomics, Epigenomics, or Single-Cell Omics) are analyzed. These approaches led to an accumulation of large-scale NGS datasets to solve various challenges of cancer research, molecular characterization, tumor heterogeneity, and drug target discovery. For instance, The Cancer Genome Atlas (TCGA) dataset contains multi-omics data from ten-thousands of patients. This dataset facilitates a variety of cancer researches for decades. Additionally, there are also independent tumor datasets, and, frequently, they are analyzed and compared with the TCGA dataset. As the large scale of omics data accumulated, various machine learning techniques are applied, e.g., graph algorithms and deep neural networks, for dimensionality reduction, clustering, or classification. (Created with BioRender.com.)
Figure 2. (a) A multitude of different types of data is produced by next-generation sequencing, for instance, in the fields of genomics, transcriptomics, and epigenomics. (b) Biological networks for biomarker validation: The in vivo or in vitro experiment results are considered ground truth. Statistical analysis on next-generation sequencing data produces candidate genes. Biological networks can validate these candidate genes and highlight the underlying biological mechanisms (Section 2.1). (c) De novo construction of Biological Networks: Machine learning models that aim to reconstruct biological networks can incorporate prior knowledge from different omics data. Subsequently, the model will predict new unknown interactions based on new omics information (Section 2.2). (d) Network-based machine learning: Machine learning models integrating biological networks as prior knowledge to improve predictive performance when applied to different NGS data (Section 2.3). (Created with BioRender.com).
Therefore, a large number of studies integrate NGS data with machine learning and propose a novel data-driven methodology in systems biology [8]. In particular, many network-based machine learning models have been developed to analyze cancer data and help to understand novel mechanisms in cancer development [9,10]. Moreover, deep neural networks (DNN) applied for large-scale data analysis improved the accuracy of computational models for mutation prediction [11,12], molecular subtyping [13,14], and drug repurposing [15,16].
2. Systems Biology in Cancer Research
Genes and their functions have been classified into gene sets based on experimental data. Our understandings of cancer concentrated into cancer hallmarks that define the characteristics of a tumor. This collective knowledge is used for the functional analysis of unseen data.. Furthermore, the regulatory relationships among genes were investigated, and, based on that, a pathway can be composed. In this manner, the accumulation of public high-throughput sequencing data raised many big-data challenges and opened new opportunities and areas of application for computer science. Two of the most vibrantly evolving areas are systems biology and machine learning which tackle different tasks such as understanding the cancer pathways [9], finding crucial genes in pathways [22,53], or predicting functions of unidentified or understudied genes [54]. Essentially, those models include prior knowledge to develop an analysis and enhance interpretability for high-dimensional data [2]. In addition to understanding cancer pathways with in silico analysis, pathway activity analysis incorporating two different types of data, pathways and omics data, is developed to understand heterogeneous characteristics of the tumor and cancer molecular subtyping. Due to its advantage in interpretability, various pathway-oriented methods are introduced and become a useful tool to understand a complex diseases such as cancer [55,56,57].
In this section, we will discuss how two related research fields, namely, systems biology and machine learning, can be integrated with three different approaches (see Figure 2), namely, biological network analysis for biomarker validation, the use of machine learning with systems biology, and network-based models.
2.1. Biological Network Analysis for Biomarker Validation
The detection of potential biomarkers indicative of specific cancer types or subtypes is a frequent goal of NGS data analysis in cancer research. For instance, a variety of bioinformatics tools and machine learning models aim at identify lists of genes that are significantly altered on a genomic, transcriptomic, or epigenomic level in cancer cells. Typically, statistical and machine learning methods are employed to find an optimal set of biomarkers, such as single nucleotide polymorphisms (SNPs), mutations, or differentially expressed genes crucial in cancer progression. Traditionally, resource-intensive in vitro analysis was required to discover or validate those markers. Therefore, systems biology offers in silico solutions to validate such findings using biological pathways or gene ontology information (Figure 2b) [58]. Subsequently, gene set enrichment analysis (GSEA) [50] or gene set analysis (GSA) [59] can be used to evaluate whether these lists of genes are significantly associated with cancer types and their specific characteristics. GSA, for instance, is available via web services like DAVID [60] and g:Profiler [61]. Moreover, other applications use gene ontology directly [62,63]. In addition to gene-set-based analysis, there are other methods that focuse on the topology of biological networks. These approaches evaluate various network structure parameters and analyze the connectivity of two genes or the size and interconnection of their neighbors [64,65]. According to the underlying idea, the mutated gene will show dysfunction and can affect its neighboring genes. Thus, the goal is to find abnormalities in a specific set of genes linked with an edge in a biological network. For instance, KeyPathwayMiner can extract informative network modules in various omics data [66]. In summary, these approaches aim at predicting the effect of dysfunctional genes among neighbors according to their connectivity or distances from specific genes such as hubs [67,68]. During the past few decades, the focus of cancer systems biology extended towards the analysis of cancer-related pathways since those pathways tend to carry more information than a gene set. Such analysis is called Pathway Enrichment Analysis (PEA) [69,70]. The use of PEA incorporates the topology of biological networks. However, simultaneously, the lack of coverage issue in pathway data needs to be considered. Because pathway data does not cover all known genes yet, an integration analysis on omics data can significantly drop in genes when incorporated with pathways. Genes that can not be mapped to any pathway are called ‘pathway orphan.’ In this manner, Rahmati et al. introduced a possible solution to overcome the ‘pathway orphan’ issue [71]. At the bottom line, regardless of whether researchers consider gene-set or pathway-based enrichment analysis, the performance and accuracy of both methods are highly dependent on the quality of the external gene-set and pathway data [72].
2.2. De Novo Construction of Biological Networks
While the known fraction of existing biological networks barely scratches the surface of the whole system of mechanisms occurring in each organism, machine learning models can improve on known network structures and can guide potential new findings [73,74]. This area of research is called de novo network construction (Figure 2c), and its predictive models can accelerate experimental validation by lowering time costs [75,76]. This interplay between in silico biological networks building and mining contributes to expanding our knowledge in a biological system. For instance, a gene co-expression network helps discover gene modules having similar functions [77]. Because gene co-expression networks are based on expressional changes under specific conditions, commonly, inferring a co-expression network requires many samples. The WGCNA package implements a representative model using weighted correlation for network construction that leads the development of the network biology field [78]. Due to NGS developments, the analysis of gene co-expression networks subsequently moved from microarray-based to RNA-seq based experimental data [79]. However, integration of these two types of data remains tricky. Ballouz et al. compared microarray and NGS-based co-expression networks and found the existence of a bias originating from batch effects between the two technologies [80]. Nevertheless, such approaches are suited to find disease-specific co-expressional gene modules. Thus, various studies based on the TCGA cancer co-expression network discovered characteristics of prognostic genes in the network [81]. Accordingly, a gene co-expression network is a condition-specific network rather than a general network for an organism. Gene regulatory networks can be inferred from the gene co-expression network when various data from different conditions in the same organism are available. Additionally, with various NGS applications, we can obtain multi-modal datasets about regulatory elements and their effects, such as epigenomic mechanisms on transcription and chromatin structure. Consequently, a gene regulatory network can consist of solely protein-coding genes or different regulatory node types such as transcription factors, inhibitors, promoter interactions, DNA methylations, and histone modifications affecting the gene expression system [82,83]. More recently, researchers were able to build networks based on a particular experimental setup. For instance, functional genomics or CRISPR technology enables the high-resolution regulatory networks in an organism [84]. Other than gene co-expression or regulatory networks, drug target, and drug repurposing studies are active research areas focusing on the de novo construction of drug-to-target networks to allow the potential repurposing of drugs [76,85].
2.3. Network Based Machine Learning
A network-based machine learning model directly integrates the insights of biological networks within the algorithm (Figure 2d) to ultimately improve predictive performance concerning cancer subtyping or susceptibility to therapy. Following the establishment of high-quality biological networks based on NGS technologies, these biological networks were suited to be integrated into advanced predictive models. In this manner, Zhang et al., categorized network-based machine learning approaches upon their usage into three groups: (i) model-based integration, (ii) pre-processing integration, and (iii) post-analysis integration [7]. Network-based models map the omics data onto a biological network, and proper algorithms travel the network while considering both values of nodes and edges and network topology. In the pre-processing integration, pathway or other network information is commonly processed based on its topological importance. Meanwhile, in the post-analysis integration, omics data is processed solely before integration with a network. Subsequently, omics data and networks are merged and interpreted. The network-based model has advantages in multi-omics integrative analysis. Due to the different sensitivity and coverage of various omics data types, a multi-omics integrative analysis is challenging. However, focusing on gene-level or protein-level information enables a straightforward integration [86,87]. Consequently, when different machine learning approaches tried to integrate two or more different data types to find novel biological insights, one of the solutions is reducing the search space to gene or protein level and integrated heterogeneous datatypes [25,88].
In summary, using network information opens new possibilities for interpretation. However, as mentioned earlier, several challenges remain, such as the coverage issue. Current databases for biological networks do not cover the entire set of genes, transcripts, and interactions. Therefore, the use of networks can lead to loss of information for gene or transcript orphans. The following section will focus on network-based machine learning models and their application in cancer genomics. We will put network-based machine learning into the perspective of the three main areas of application, namely, molecular characterization, tumor heterogeneity analysis, and cancer drug discovery.
3. Network-Based Learning in Cancer Research
As introduced previously, the integration of machine learning with the insights of biological networks (Figure 2d) ultimately aims at improving predictive performance and interpretability concerning cancer subtyping or treatment susceptibility.
3.1. Molecular Characterization with Network Information
Various network-based algorithms are used in genomics and focus on quantifying the impact of genomic alteration. By employing prior knowledge in biological network algorithms, performance compared to non-network models can be improved. A prominent example is HotNet. The algorithm uses a thermodynamics model on a biological network and identifies driver genes, or prognostic genes, in pan-cancer data [89]. Another study introduced a network-based stratification method to integrate somatic alterations and expression signatures with network information [90]. These approaches use network topology and network-propagation-like algorithms. Network propagation presumes that genomic alterations can affect the function of neighboring genes. Two genes will show an exclusive pattern if two genes complement each other, and the function carried by those two genes is essential to an organism [91]. This unique exclusive pattern among genomic alteration is further investigated in cancer-related pathways. Recently, Ku et al. developed network-centric approaches and tackled robustness issues while studying synthetic lethality [92]. Although synthetic lethality was initially discovered in model organisms of genetics, it helps us to understand cancer-specific mutations and their functions in tumor characteristics [91].
Furthermore, in transcriptome research, network information is used to measure pathway activity and its application in cancer subtyping. For instance, when comparing the data of two or more conditions such as cancer types, GSEA as introduced in Section 2 is a useful approach to get an overview of systematic changes [50]. It is typically used at the beginning of a data evaluation [93]. An experimentally validated gene set can provide information about how different conditions affect molecular systems in an organism. In addition to the gene sets, different approaches integrate complex interaction information into GSEA and build network-based models [70]. In contrast to GSEA, pathway activity analysis considers transcriptome data and other omics data and structural information of a biological network. For example, PARADIGM uses pathway topology and integrates various omics in the analysis to infer a patient-specific status of pathways [94]. A benchmark study with pan-cancer data recently reveals that using network structure can show better performance [57]. In conclusion, while the loss of data is due to the incompleteness of biological networks, their integration improved performance and increased interpretability in many cases.
3.2. Tumor Heterogeneity Study with Network Information
The tumor heterogeneity can originate from two directions, clonal heterogeneity and tumor impurity. Clonal heterogeneity covers genomic alterations within the tumor [95]. While de novo mutations accumulate, the tumor obtains genomic alterations with an exclusive pattern. When these genomic alterations are projected on the pathway, it is possible to observe exclusive relationships among disease-related genes. For instance, the CoMEt and MEMo algorithms examine mutual exclusivity on protein–protein interaction networks [96,97]. Moreover, the relationship between genes can be essential for an organism. Therefore, models analyzing such alterations integrate network-based analysis [98].
In contrast, tumor purity is dependent on the tumor microenvironment, including immune-cell infiltration and stromal cells [99]. In tumor microenvironment studies, network-based models are applied, for instance, to find immune-related gene modules. Although the importance of the interaction between tumors and immune cells is well known, detailed mechanisms are still unclear. Thus, many recent NGS studies employ network-based models to investigate the underlying mechanism in tumor and immune reactions. For example, McGrail et al. identified a relationship between the DNA damage response protein and immune cell infiltration in cancer. The analysis is based on curated interaction pairs in a protein–protein interaction network [100]. Most recently, Darzi et al. discovered a prognostic gene module related to immune cell infiltration by using network-centric approaches [101]. Tu et al. presented a network-centric model for mining subnetworks of genes other than immune cell infiltration by considering tumor purity [102].
3.3. Drug Target Identification with Network Information
In drug target studies, network biology is integrated into pharmacology [103]. For instance, Yamanishi et al. developed novel computational methods to investigate the pharmacological space by integrating a drug-target protein network with genomics and chemical information. The proposed approaches investigated such drug-target network information to identify potential novel drug targets [104]. Since then, the field has continued to develop methods to study drug target and drug response integrating networks with chemical and multi-omic datasets. In a recent survey study by Chen et al., the authors compared 13 computational methods for drug response prediction. It turned out that gene expression profiles are crucial information for drug response prediction [105].
Moreover, drug-target studies are often extended to drug-repurposing studies. In cancer research, drug-repurposing studies aim to find novel interactions between non-cancer drugs and molecular features in cancer. Drug-repurposing (or repositioning) studies apply computational approaches and pathway-based models and aim at discovering potential new cancer drugs with a higher probability than de novo drug design [16,106]. Specifically, drug-repurposing studies can consider various areas of cancer research, such as tumor heterogeneity and synthetic lethality. As an example, Lee et al. found clinically relevant synthetic lethality interactions by integrating multiple screening NGS datasets [107]. This synthetic lethality and related-drug datasets can be integrated for an effective combination of anticancer therapeutic strategy with non-cancer drug repurposing.
4. Deep Learning in Cancer Research
DNN models develop rapidly and become more sophisticated. They have been frequently used in all areas of biomedical research. Initially, its development was facilitated by large-scale imaging and video data. While most data sets in the biomedical field would not typically be considered big data, the rapid data accumulation enabled by NGS made it suitable for the application of DNN models requiring a large amount of training data [108]. For instance, in 2019, Samiei et al. used TCGA-based large-scale cancer data as benchmark datasets for bioinformatics machine learning research such as Image-Net in the computer vision field [109]. Subsequently, large-scale public cancer data sets such as TCGA encouraged the wide usage of DNNs in the cancer domain [110]. Over the last decade, these state-of-the-art machine learning methods have been incorporated in many different biological questions [111].
In addition to public cancer databases such as TCGA, the genetic information of normal tissues is stored in well-curated databases such as GTEx [112] and 1000Genomes [113]. These databases are frequently used as control or baseline training data for deep learning [114]. Moreover, other non-curated large-scale data sources such as GEO (https://www.ncbi.nlm.nih.gov/geo/, accessed on 20 May 2021) can be leveraged to tackle critical aspects in cancer research. They store a large-scale of biological data produced under various experimental setups (Figure 1). Therefore, an integration of GEO data and other data requires careful preprocessing. Overall, an increasing amount of datasets facilitate the development of current deep learning in bioinformatics research [115].
4.1. Challenges for Deep Learning in Cancer Research
Many studies in biology and medicine used NGS and produced large amounts of data during the past few decades, moving the field to the big data era. Nevertheless, researchers still face a lack of data in particular when investigating rare diseases or disease states. Researchers have developed a manifold of potential solutions to overcome this lack of data challenges, such as imputation, augmentation, and transfer learning (Figure 3b). Data imputation aims at handling data sets with missing values [116]. It has been studied on various NGS omics data types to recover missing information [117]. It is known that gene expression levels can be altered by different regulatory elements, such as DNA-binding proteins, epigenomic modifications, and post-transcriptional modifications. Therefore, various models integrating such regulatory schemes have been introduced to impute missing omics data [118,119]. Some DNN-based models aim to predict gene expression changes based on genomics or epigenomics alteration. For instance, TDimpute aims at generating missing RNA-seq data by training a DNN on methylation data. They used TCGA and TARGET (https://ocg.cancer.gov/programs/target/data-matrix, accessed on 20 May 2021) data as proof of concept of the applicability of DNN for data imputation in a multi-omics integration study [120]. Because this integrative model can exploit information in different levels of regulatory mechanisms, it can build a more detailed model and achieve better performance than a model build on a single-omics dataset [117,121]. The generative adversarial network (GAN) is a DNN structure for generating simulated data that is different from the original data but shows the same characteristics [122]. GANs can impute missing omics data from other multi-omics sources. Recently, the GAN algorithm is getting more attention in single-cell transcriptomics because it has been recognized as a complementary technique to overcome the limitation of scRNA-seq [123]. In contrast to data imputation and generation, other machine learning approaches aim to cope with a limited dataset in different ways. Transfer learning or few-shot learning, for instance, aims to reduce the search space with similar but unrelated datasets and guide the model to solve a specific set of problems [124]. These approaches train models with data of similar characteristics and types but different data to the problem set. After pre-training the model, it can be fine-tuned with the dataset of interest [125,126]. Thus, researchers are trying to introduce few-shot learning models and meta-learning approaches to omics and translational medicine. For example, Select-ProtoNet applied the ProtoTypical Network [127] model to TCGA transcriptome data and classified patients into two groups according to their clinical status [128]. AffinityNet predicts kidney and uterus cancer subtypes with gene expression profiles [129].
Figure 3. (a) In various studies, NGS data transformed into different forms. The 2-D transformed form is for the convolution layer. Omics data is transformed into pathway level, GO enrichment score, or Functional spectra. (b) DNN application on different ways to handle lack of data. Imputation for missing data in multi-omics datasets. GAN for data imputation and in silico data simulation. Transfer learning pre-trained the model with other datasets and fine-tune. (c) Various types of information in biology. (d) Graph neural network examples. GCN is applied to aggregate neighbor information. (Created with BioRender.com).
4.2. Molecular Charactization with Network and DNN Model
DNNs have been applied in multiple areas of cancer research. For instance, a DNN model trained on TCGA cancer data can aid molecular characterization by identifying cancer driver genes. At the very early stage, Yuan et al. build DeepGene, a cancer-type classifier. They implemented data sparsity reduction methods and trained the DNN model with somatic point mutations [130]. Lyu et al. [131] and DeepGx [132] embedded a 1-D gene expression profile to a 2-D array by chromosome order to implement the convolution layer (Figure 3a). Other algorithms, such as the deepDriver, use k-nearest neighbors for the convolution layer. A predefined number of neighboring gene mutation profiles was the input for the convolution layer. It employed this convolution layer in a DNN by aggregating mutation information of the k-nearest neighboring genes [11]. Instead of embedding to a 2-D image, DeepCC transformed gene expression data into functional spectra. The resulting model was able to capture molecular characteristics by training cancer subtypes [14].
Another DNN model was trained to infer the origin of tissue from single-nucleotide variant (SNV) information of metastatic tumor. The authors built a model by using the TCGA/ICGC data and analyzed SNV patterns and corresponding pathways to predict the origin of cancer. They discovered that metastatic tumors retained their original cancer’s signature mutation pattern. In this context, their DNN model obtained even better accuracy than a random forest model [133] and, even more important, better accuracy than human pathologists [12].
4.3. Tumor Heterogeneity with Network and DNN Model
As described in Section 4.1, there are several issues because of cancer heterogeneity, e.g., tumor microenvironment. Thus, there are only a few applications of DNN in intratumoral heterogeneity research. For instance, Menden et al. developed ’Scaden’ to deconvolve cell types in bulk-cell sequencing data. ’Scaden’ is a DNN model for the investigation of intratumor heterogeneity. To overcome the lack of training datasets, researchers need to generate in silico simulated bulk-cell sequencing data based on single-cell sequencing data [134]. It is presumed that deconvolving cell types can be achieved by knowing all possible expressional profiles of the cell [36]. However, this information is typically not available. Recently, to tackle this problem, single-cell sequencing-based studies were conducted. Because of technical limitations, we need to handle lots of missing data, noises, and batch effects in single-cell sequencing data [135]. Thus, various machine learning methods were developed to process single-cell sequencing data. They aim at mapping single-cell data onto the latent space. For example, scDeepCluster implemented an autoencoder and trained it on gene-expression levels from single-cell sequencing. During the training phase, the encoder and decoder work as denoiser. At the same time, they can embed high-dimensional gene-expression profiles to lower-dimensional vectors [136]. This autoencoder-based method can produce biologically meaningful feature vectors in various contexts, from tissue cell types [137] to different cancer types [138,139].
4.4. Drug Target Identification with Networks and DNN Models
In addition to NGS datasets, large-scale anticancer drug assays enabled the training train of DNNs. Moreover, non-cancer drug response assay datasets can also be incorporated with cancer genomic data. In cancer research, a multidisciplinary approach was widely applied for repurposing non-oncology drugs to cancer treatment. This drug repurposing is faster than de novo drug discovery. Furthermore, combination therapy with a non-oncology drug can be beneficial to overcome the heterogeneous properties of tumors [85]. The deepDR algorithm integrated ten drug-related networks and trained deep autoencoders. It used a random-walk-based algorithm to represent graph information into feature vectors. This approach integrated network analysis with a DNN model validated with an independent drug-disease dataset [15].
The authors of CDRscan did an integrative analysis of cell-line-based assay datasets and other drug and genomics datasets. It shows that DNN models can enhance the computational model for improved drug sensitivity predictions [140]. Additionally, similar to previous network-based models, the multi-omics application of drug-targeted DNN studies can show higher prediction accuracy than the single-omics method. MOLI integrated genomic data and transcriptomic data to predict the drug responses of TCGA patients [141].
4.5. Graph Neural Network Model
In general, the advantage of using a biological network is that it can produce more comprehensive and interpretable results from high-dimensional omics data. Furthermore, in an integrative multi-omics data analysis, network-based integration can improve interpretability over traditional approaches. Instead of pre-/post-integration of a network, recently developed graph neural networks use biological networks as the base structure for the learning network itself. For instance, various pathways or interactome information can be integrated as a learning structure of a DNN and can be aggregated as heterogeneous information. In a GNN study, a convolution process can be done on the provided network structure of data. Therefore, the convolution on a biological network made it possible for the GNN to focus on the relationship among neighbor genes. In the graph convolution layer, the convolution process integrates information of neighbor genes and learns topological information (Figure 3d). Consequently, this model can aggregate information from far-distant neighbors, and thus can outperform other machine learning models [142].
In the context of the inference problem of gene expression, the main question is whether the gene expression level can be explained by aggregating the neighboring genes. A single gene inference study by Dutil et al. showed that the GNN model outperformed other DNN models [143]. Moreover, in cancer research, such GNN models can identify cancer-related genes with better performance than other network-based models, such as HotNet2 and MutSigCV [144]. A recent GNN study with a multi-omics integrative analysis identified 165 new cancer genes as an interactive partner for known cancer genes [145]. Additionally, in the synthetic lethality area, dual-dropout GNN outperformed previous bioinformatics tools for predicting synthetic lethality in tumors [146]. GNNs were also able to classify cancer subtypes based on pathway activity measures with RNA-seq data. Lee et al. implemented a GNN for cancer subtyping and tested five cancer types. Thus, the informative pathway was selected and used for subtype classification [147]. Furthermore, GNNs are also getting more attention in drug repositioning studies. As described in Section 3.3, drug discovery requires integrating various networks in both chemical and genomic spaces (Figure 3d). Chemical structures, protein structures, pathways, and other multi-omics data were used in drug-target identification and repurposing studies (Figure 3c). Each of the proposed applications has a specialty in the different purposes of drug-related tasks. Sun et al. summarized GNN-based drug discovery studies and categorized them into four classes: molecular property and activity prediction, interaction prediction, synthesis prediction, and de novo drug design. The authors also point out four challenges in the GNN-mediated drug discovery. At first, as we described before, there is a lack of drug-related datasets. Secondly, the current GNN models can not fully represent 3-D structures of chemical molecules and protein structures. The third challenge is integrating heterogeneous network information. Drug discovery usually requires a multi-modal integrative analysis with various networks, and GNNs can improve this integrative analysis. Lastly, although GNNs use graphs, stacked layers still make it hard to interpret the model [148].
4.6. Shortcomings in AI and Revisiting Validity of Biological Networks as Prior Knowledge
The previous sections reviewed a variety of DNN-based approaches that present a good performance on numerous applications. However, it is hardly a panacea for all research questions. In the following, we will discuss potential limitations of the DNN models. In general, DNN models with NGS data have two significant issues: (i) data requirements and (ii) interpretability. Usually, deep learning needs a large proportion of training data for reasonable performance which is more difficult to achieve in biomedical omics data compared to, for instance, image data. Today, there are not many NGS datasets that are well-curated and -annotated for deep learning. This can be an answer to the question of why most DNN studies are in cancer research [110,149]. Moreover, the deep learning models are hard to interpret and are typically considered as black-boxes. Highly stacked layers in the deep learning model make it hard to interpret its decision-making rationale. Although the methodology to understand and interpret deep learning models has been improved, the ambiguity in the DNN models’ decision-making hindered the transition between the deep learning model and translational medicine [149,150].
As described before, biological networks are employed in various computational analyses for cancer research. The studies applying DNNs demonstrated many different approaches to use prior knowledge for systematic analyses. Before discussing GNN application, the validity of biological networks in a DNN model needs to be shown. The LINCS program analyzed data of ’The Connectivity Map (CMap) project’ to understand the regulatory mechanism in gene expression by inferring the whole gene expression profiles from a small set of genes (https://lincsproject.org/, accessed on 20 May 2021) [151,152]. This LINCS program found that the gene expression level is inferrable with only nearly 1000 genes. They called this gene list ’landmark genes’. Subsequently, Chen et al. started with these 978 landmark genes and tried to predict other gene expression levels with DNN models. Integrating public large-scale NGS data showed better performance than the linear regression model. The authors conclude that the performance advantage originates from the DNN’s ability to model non-linear relationships between genes [153].
Following this study, Beltin et al. extensively investigated various biological networks in the same context of the inference of gene expression level. They set up a simplified representation of gene expression status and tried to solve a binary classification task. To show the relevance of a biological network, they compared various gene expression levels inferred from a different set of genes, neighboring genes in PPI, random genes, and all genes. However, in the study incorporating TCGA and GTEx datasets, the random network model outperformed the model build on a known biological network, such as StringDB [154]. While network-based approaches can add valuable insights to analysis, this study shows that it cannot be seen as the panacea, and a careful evaluation is required for each data set and task. In particular, this result may not represent biological complexity because of the oversimplified problem setup, which did not consider the relative gene-expressional changes. Additionally, the incorporated biological networks may not be suitable for inferring gene expression profiles because they consist of expression-regulating interactions, non-expression-regulating interactions, and various in vivo and in vitro interactions.
“ However, although recently sophisticated applications of deep learning showed improved accuracy, it does not reflect a general advancement. Depending on the type of NGS data, the experimental design, and the question to be answered, a proper approach and specific deep learning algorithms need to be considered. Deep learning is not a panacea. In general, to employ machine learning and systems biology methodology for a specific type of NGS data, a certain experimental design, a particular research question, the technology, and network data have to be chosen carefully.”
Hoadley, K.A.; Yau, C.; Wolf, D.M.; Cherniack, A.D.; Tamborero, D.; Ng, S.; Leiserson, M.D.; Niu, B.; McLellan, M.D.; Uzunangelov, V.; et al. Multiplatform analysis of 12 cancer types reveals molecular classification within and across tissues of origin. Cell2014, 158, 929–944. [Google Scholar] [CrossRef] [PubMed]
Hutter, C.; Zenklusen, J.C. The cancer genome atlas: Creating lasting value beyond its data. Cell2018, 173, 283–285. [Google Scholar] [CrossRef]
Chuang, H.Y.; Lee, E.; Liu, Y.T.; Lee, D.; Ideker, T. Network-based classification of breast cancer metastasis. Mol. Syst. Biol.2007, 3, 140. [Google Scholar] [CrossRef]
Zhang, W.; Chien, J.; Yong, J.; Kuang, R. Network-based machine learning and graph theory algorithms for precision oncology. NPJ Precis. Oncol.2017, 1, 25. [Google Scholar] [CrossRef] [PubMed]
Ngiam, K.Y.; Khor, W. Big data and machine learning algorithms for health-care delivery. Lancet Oncol.2019, 20, e262–e273. [Google Scholar] [CrossRef]
Creixell, P.; Reimand, J.; Haider, S.; Wu, G.; Shibata, T.; Vazquez, M.; Mustonen, V.; Gonzalez-Perez, A.; Pearson, J.; Sander, C.; et al. Pathway and network analysis of cancer genomes. Nat. Methods2015, 12, 615. [Google Scholar]
Reyna, M.A.; Haan, D.; Paczkowska, M.; Verbeke, L.P.; Vazquez, M.; Kahraman, A.; Pulido-Tamayo, S.; Barenboim, J.; Wadi, L.; Dhingra, P.; et al. Pathway and network analysis of more than 2500 whole cancer genomes. Nat. Commun.2020, 11, 729. [Google Scholar] [CrossRef]
Luo, P.; Ding, Y.; Lei, X.; Wu, F.X. deepDriver: Predicting cancer driver genes based on somatic mutations using deep convolutional neural networks. Front. Genet.2019, 10, 13. [Google Scholar] [CrossRef]
Jiao, W.; Atwal, G.; Polak, P.; Karlic, R.; Cuppen, E.; Danyi, A.; De Ridder, J.; van Herpen, C.; Lolkema, M.P.; Steeghs, N.; et al. A deep learning system accurately classifies primary and metastatic cancers using passenger mutation patterns. Nat. Commun.2020, 11, 728. [Google Scholar] [CrossRef]
Chaudhary, K.; Poirion, O.B.; Lu, L.; Garmire, L.X. Deep learning–based multi-omics integration robustly predicts survival in liver cancer. Clin. Cancer Res.2018, 24, 1248–1259. [Google Scholar] [CrossRef]
Gao, F.; Wang, W.; Tan, M.; Zhu, L.; Zhang, Y.; Fessler, E.; Vermeulen, L.; Wang, X. DeepCC: A novel deep learning-based framework for cancer molecular subtype classification. Oncogenesis2019, 8, 44. [Google Scholar] [CrossRef]
Zeng, X.; Zhu, S.; Liu, X.; Zhou, Y.; Nussinov, R.; Cheng, F. deepDR: A network-based deep learning approach to in silico drug repositioning. Bioinformatics2019, 35, 5191–5198. [Google Scholar] [CrossRef]
Issa, N.T.; Stathias, V.; Schürer, S.; Dakshanamurthy, S. Machine and deep learning approaches for cancer drug repurposing. In Seminars in Cancer Biology; Elsevier: Amsterdam, The Netherlands, 2020. [Google Scholar]
The ICGC/TCGA Pan-Cancer Analysis of Whole Genomes Consortium. Pan-cancer analysis of whole genomes. Nature2020, 578, 82. [Google Scholar] [CrossRef] [PubMed]
King, M.C.; Marks, J.H.; Mandell, J.B. Breast and ovarian cancer risks due to inherited mutations in BRCA1 and BRCA2. Science2003, 302, 643–646. [Google Scholar] [CrossRef] [PubMed]
Courtney, K.D.; Corcoran, R.B.; Engelman, J.A. The PI3K pathway as drug target in human cancer. J. Clin. Oncol.2010, 28, 1075. [Google Scholar] [CrossRef] [PubMed]
Parker, J.S.; Mullins, M.; Cheang, M.C.; Leung, S.; Voduc, D.; Vickery, T.; Davies, S.; Fauron, C.; He, X.; Hu, Z.; et al. Supervised risk predictor of breast cancer based on intrinsic subtypes. J. Clin. Oncol.2009, 27, 1160. [Google Scholar] [CrossRef]
Yersal, O.; Barutca, S. Biological subtypes of breast cancer: Prognostic and therapeutic implications. World J. Clin. Oncol.2014, 5, 412. [Google Scholar] [CrossRef] [PubMed]
Zhao, L.; Lee, V.H.; Ng, M.K.; Yan, H.; Bijlsma, M.F. Molecular subtyping of cancer: Current status and moving toward clinical applications. Brief. Bioinform.2019, 20, 572–584. [Google Scholar] [CrossRef] [PubMed]
Jones, P.A.; Issa, J.P.J.; Baylin, S. Targeting the cancer epigenome for therapy. Nat. Rev. Genet.2016, 17, 630. [Google Scholar] [CrossRef] [PubMed]
Huang, S.; Chaudhary, K.; Garmire, L.X. More is better: Recent progress in multi-omics data integration methods. Front. Genet.2017, 8, 84. [Google Scholar] [CrossRef]
Chin, L.; Andersen, J.N.; Futreal, P.A. Cancer genomics: From discovery science to personalized medicine. Nat. Med.2011, 17, 297. [Google Scholar] [CrossRef] [PubMed]
Use of Systems Biology in Anti-Microbial Drug Development
Genomics, Computational Biology and Drug Discovery for Mycobacterial Infections: Fighting the Emergence of Resistance. Asma Munir, Sundeep Chaitanya Vedithi, Amanda K. Chaplin and Tom L. Blundell. Front. Genet., 04 September 2020 | https://doi.org/10.3389/fgene.2020.00965
In an earlier review article (Waman et al., 2019), we discussed various computational approaches and experimental strategies for drug target identification and structure-guided drug discovery. In this review we discuss the impact of the era of precision medicine, where the genome sequences of pathogens can give clues about the choice of existing drugs, and repurposing of others. Our focus is directed toward combatting antimicrobial drug resistance with emphasis on tuberculosis and leprosy. We describe structure-guided approaches to understanding the impacts of mutations that give rise to antimycobacterial resistance and the use of this information in the design of new medicines.
Genome Sequences and Proteomic Structural Databases
In recent years, there have been many focused efforts to define the amino-acid sequences of the M. tuberculosis pan-genome and then to define the three-dimensional structures and functional interactions of these gene products. This work has led to essential genes of the bacteria being revealed and to a better understanding of the genetic diversity in different strains that might lead to a selective advantage (Coll et al., 2018). This will help with our understanding of the mode of antibiotic resistance within these strains and aid structure-guided drug discovery. However, only ∼10% of the ∼4128 proteins have structures determined experimentally.
Several databases have been developed to integrate the genomic and/or structural information linked to drug resistance in Mycobacteria (Table 1). These invaluable resources can contribute to better understanding of molecular mechanisms involved in drug resistance and improvement in the selection of potential drug targets.
There is a dearth of information related to structural aspects of proteins from M. leprae and their oligomeric and hetero-oligomeric organization, which has limited the understanding of physiological processes of the bacillus. The structures of only 12 proteins have been solved and deposited in the protein data bank (PDB). However, the high sequence similarity in protein coding genes between M. leprae and M. tuberculosis allows computational methods to be used for comparative modeling of the proteins of M. leprae. Mainly monomeric models using single template modeling have been defined and deposited in the Swiss Model repository (Bienert et al., 2017), in Modbase (Pieper et al., 2014), and in a collection with other infectious disease agents (Sosa et al., 2018). There is a need for multi-template modeling and building homo- and hetero-oligomeric complexes to better understand the interfaces, druggability and impacts of mutations.
We are now exploiting Vivace, a multi-template modeling pipeline developed in our lab for modeling the proteomes of M. tuberculosis (CHOPIN, see above) and M. abscessus [Mabellini Database (Skwark et al., 2019)], to model the proteome of M. leprae. We emphasize the need for understanding the protein interfaces that are critical to function. An example of this is that of the RNA-polymerase holoenzyme complex from M. leprae. We first modeled the structure of this hetero-hexamer complex and later deciphered the binding patterns of rifampin (Vedithi et al., 2018; Figures 1A,B). Rifampin is a known drug to treat tuberculosis and leprosy. Owing to high rifampin resistance in tuberculosis and emerging resistance in leprosy, we used an approach known as “Computational Saturation Mutagenesis”, to identify sites on the protein that are less impacted by mutations. In this study, we were able to understand the association between predicted impacts of mutations on the structure and phenotypic rifampin-resistance outcomes in leprosy.
FIGURE 2
Figure 2.(A) Stability changes predicted by mCSM for systematic mutations in the ß-subunit of RNA polymerase in M. leprae. The maximum destabilizing effect from among all 19 possible mutations at each residue position is considered as a weighting factor for the color map that gradients from red (high destabilizing effects) to white (neutral to stabilizing effects) (Vedithi et al., 2020). (B) One of the known mutations in the ß-subunit of RNA polymerase, the S437H substitution which resulted in a maximum destabilizing effect [-1.701 kcal/mol (mCSM)] among all 19 possibilities this position. In the mutant, histidine (residue in green) forms hydrogen bonds with S434 and Q438, aromatic interactions with F431, and other ring-ring and π interactions with the surrounding residues which can impact the shape of the rifampin binding pocket and rifampin affinity to the ß-subunit [-0.826 log(affinity fold change) (mCSM-lig)]. Orange dotted lines represent weak hydrogen bond interactions. Ring-ring and intergroup interactions are depicted in cyan. Aromatic interactions are represented in sky-blue and carbonyl interactions in pink dotted lines. Green dotted lines represent hydrophobic interactions (Vedithi et al., 2020).
Examples of Understanding and Combatting Resistance
The availability of whole genome sequences in the present era has greatly enhanced the understanding of emergence of drug resistance in infectious diseases like tuberculosis. The data generated by the whole genome sequencing of clinical isolates can be screened for the presence of drug-resistant mutations. A preliminary in silico analysis of mutations can then be used to prioritize experimental work to identify the nature of these mutations.
FIGURE 3
Figure 3.(A) Mechanism of isoniazid activation and INH-NAD adduct formation. (B) Mutations mapped (Munir et al., 2019) on the structure of KatG (PDB ID:1SJ2; Bertrand et al., 2004).
Other articles related to Computational Biology, Systems Biology, and Bioinformatics on this online journal include:
Inhibitory CD161 receptor recognized as a potential immunotherapy target in glioma-infiltrating T cells by single-cell analysis
Reporter: Dr. Premalata Pati, Ph.D., Postdoc
Brain tumors, especially the diffused Gliomas are of the most devastating forms of cancer and have so-far been resistant to immunotherapy. It is comprehended that T cells can penetrate the glioma cells, but it still remains unknown why infiltrating cells miscarry to mount a resistant reaction or stop the tumor development.
Gliomas are brain tumors that begin from neuroglial begetter cells. The conventional therapeutic methods including, surgery, chemotherapy, and radiotherapy, have accomplished restricted changes inside glioma patients. Immunotherapy, a compliance in cancer treatment, has introduced a promising strategy with the capacity to penetrate the blood-brain barrier. This has been recognized since the spearheading revelation of lymphatics within the central nervous system. Glioma is not generally carcinogenic. As observed in a number of cases, the tumor cells viably reproduce and assault the adjoining tissues, by and large, gliomas are malignant in nature and tend to metastasize. There are four grades in glioma, and each grade has distinctive cell features and different treatment strategies. Glioblastoma is a grade IV glioma, which is the crucial aggravated form. This infers that all glioblastomas are gliomas, however, not all gliomas are glioblastomas.
Decades of investigations on infiltrating gliomas still take off vital questions with respect to the etiology, cellular lineage, and function of various cell types inside glial malignancies. In spite of the available treatment options such as surgical resection, radiotherapy, and chemotherapy, the average survival rate for high-grade glioma patients remains 1–3 years (1).
A recent in vitro study performed by the researchers of Dana-Farber Cancer Institute, Massachusetts General Hospital, and the Broad Institute of MIT and Harvard, USA, has recognized that CD161 is identified as a potential new target for immunotherapy of malignant brain tumors. The scientific team depicted their work in the Cell Journal, in a paper entitled, “Inhibitory CD161 receptor recognized in glioma-infiltrating T cells by single-cell analysis.” on 15th February 2021.
To further expand their research and findings, Dr. Kai Wucherpfennig, MD, PhD, Chief of the Center for Cancer Immunotherapy, at Dana-Farber stated that their research is additionally important in a number of other major human cancer types such as
melanoma,
lung,
colon, and
liver cancer.
Dr. Wucherpfennig has praised the other authors of the report Mario Suva, MD, PhD, of Massachusetts Common Clinic; Aviv Regev, PhD, of the Klarman Cell Observatory at Broad Institute of MIT and Harvard, and David Reardon, MD, clinical executive of the Center for Neuro-Oncology at Dana-Farber.
Hence, this new study elaborates the effectiveness of the potential effectors of anti-tumor immunity in subsets of T cells that co-express cytotoxic programs and several natural killer (NK) cell genes.
The Study-
IMAGE SOURCE: Experimental Strategy (Mathewson et al., 2021)
The group utilized single-cell RNA sequencing (RNA-seq) to mull over gene expression and the clonal picture of tumor-infiltrating T cells. It involved the participation of 31 patients suffering from diffused gliomas and glioblastoma. Their work illustrated that the ligand molecule CLEC2D activates CD161, which is an immune cell surface receptor that restrains the development of cancer combating activity of immune T cells and tumor cells in the brain. The study reveals that the activation of CD161 weakens the T cell response against tumor cells.
Based on the study, the facts suggest that the analysis of clonally expanded tumor-infiltrating T cells further identifies the NK gene KLRB1 that codes for CD161 as a candidate inhibitory receptor. This was followed by the use of
CRISPR/Cas9 gene-editing technology to inactivate the KLRB1 gene in T cells and showed that CD161 inhibits the tumor cell-killing function of T cells. Accordingly,
genetic inactivation of KLRB1 or
antibody-mediated CD161 blockade
enhances T cell-mediated killing of glioma cells in vitro and their anti-tumor function in vivo. KLRB1 and its associated transcriptional program are also expressed by substantial T cell populations in other forms of human cancers. The work provides an atlas of T cells in gliomas and highlights CD161 and other NK cell receptors as immune checkpoint targets.
Further, it has been identified that many cancer patients are being treated with immunotherapy drugs that disable their “immune checkpoints” and their molecular brakes are exploited by the cancer cells to suppress the body’s defensive response induced by T cells against tumors. Disabling these checkpoints lead the immune system to attack the cancer cells. One of the most frequently targeted checkpoints is PD-1. However, recent trials of drugs that target PD-1 in glioblastomas have failed to benefit the patients.
In the current study, the researchers found that fewer T cells from gliomas contained PD-1 than CD161. As a result, they said, “CD161 may represent an attractive target, as it is a cell surface molecule expressed by both CD8 and CD4 T cell subsets [the two types of T cells engaged in response against tumor cells] and a larger fraction of T cells express CD161 than the PD-1 protein.”
However, potential side effects of antibody-mediated blockade of the CLEC2D-CD161 pathway remain unknown and will need to be examined in a non-human primate model. The group hopes to use this finding in their future work by
utilizing their outline by expression of KLRB1 gene in tumor-infiltrating T cells in diffuse gliomas to make a remarkable contribution in therapeutics related to immunosuppression in brain tumors along with four other common human cancers ( Viz. melanoma, non-small cell lung cancer (NSCLC), hepatocellular carcinoma, and colorectal cancer) and how this may be manipulated for prevalent survival of the patients.
References
(1) Anders I. Persson, QiWen Fan, Joanna J. Phillips, William A. Weiss, 39 – Glioma, Editor(s): Sid Gilman, Neurobiology of Disease, Academic Press, 2007, Pages 433-444, ISBN 9780120885923, https://doi.org/10.1016/B978-012088592-3/50041-4.
4.1.3 Single-cell Genomics: Directions in Computational and Systems Biology – Contributions of Prof. Aviv Regev @Broad Institute of MIT and Harvard, Cochair, the Human Cell Atlas Organizing Committee with Sarah Teichmann of the Wellcome Trust Sanger Institute
4.1.7 Norwich Single-Cell Symposium 2019, Earlham Institute, single-cell genomics technologies and their application in microbial, plant, animal and human health and disease, October 16-17, 2019, 10AM-5PM
Positron Emission Tomography (PET) and Near-Infrared Fluorescence Imaging: Noninvasive Imaging of Cancer Stem Cells (CSCs) monitoring of AC133+ glioblastoma in subcutaneous and intracerebral xenograft tumors
Double Mutant PI3KA Found to Lead to Higher Oncogenic Signaling in Cancer Cells
Curator: Stephen J. Williams, PhD
PIK3CA (Phosphatidylinsitol 4,5-bisphosphate (PIP2) 3-kinase catalytic subunit α) is one of the most frequently mutated oncogenes in various tumor types ([1] and http://www.sanger.ac.uk/genetics/CGP/cosmic). Oncogenic mutations leading to the overactivation of PIK3CA, especially in context in of inactivating PTEN mutations, result in overtly high signaling activity and associated with the malignant phenotype.
In a Perspective article (Double trouble for cancer gene: Double mutations in an oncogene enhance tumor growth) in the journal Science[2], Dr. Alex Toker discusses the recent results of Vasan et al. in the same issue of Science[3] on the finding that double mutations in the same allele of PIK3CA are more frequent in cancer genomes than previously identified and these double mutations lead to increased PI3K pathway activation, increased tumor growth, and increased sensitivity to PI3K inhibitors in human breast cancer.
Today, the U.S. Food and Drug Administration approved Piqray (alpelisib) tablets, to be used in combination with the FDA-approved endocrine therapy fulvestrant, to treat postmenopausal women, and men, with hormone receptor (HR)-positive, human epidermal growth factor receptor 2 (HER2)-negative, PIK3CA-mutated, advanced or metastatic breast cancer (as detected by an FDA-approved test) following progression on or after an endocrine-based regimen.
The FDA also approved the companion diagnostic test, therascreen PIK3CA RGQ PCR Kit, to detect the PIK3CA mutation in a tissue and/or a liquid biopsy. Patients who are negative by
May 24, 2019
Today, the U.S. Food and Drug Administration approved Piqray (alpelisib) tablets, to be used in combination with the FDA-approved endocrine therapy fulvestrant, to treat postmenopausal women, and men, with hormone receptor (HR)-positive, human epidermal growth factor receptor 2 (HER2)-negative, PIK3CA-mutated, advanced or metastatic breast cancer (as detected by an FDA-approved test) following progression on or after an endocrine-based regimen.
The FDA also approved the companion diagnostic test, therascreen PIK3CA RGQ PCR Kit, to detect the PIK3CA mutation in a tissue and/or a liquid biopsy. Patients who are negative by the therascreen test using the liquid biopsy should undergo tumor biopsy for PIK3CA mutation testing.
“Piqray is the first PI3K inhibitor to demonstrate a clinically meaningful benefit in treating patients with this type of breast cancer. The ability to target treatment to a patient’s specific genetic mutation or biomarker is becoming increasingly common in cancer treatment, and companion diagnostic tests assist oncologists in selecting patients who may benefit from these targeted treatments,” said Richard Pazdur, M.D., director of the FDA’s Oncology Center of Excellence and acting director of the Office of Hematology and Oncology Products in the FDA’s Center for Drug Evaluation and Research. “For this approval, we employed some of our newer regulatory tools to streamline reviews without compromising the quality of our assessment. This drug is the first novel drug approved under the Real-Time Oncology Review pilot program. We also used the updated Assessment Aid, a multidisciplinary review template that helps focus our written review on critical thinking and consistency and reduces time spent on administrative tasks.”
Metastatic breast cancer is breast cancer that has spread beyond the breast to other organs in the body (most often the bones, lungs, liver or brain). When breast cancer is hormone-receptor positive, patients may be treated with anti-hormonal treatment (also called endocrine therapy), alone or in combination with other medicines, or chemotherapy.
The efficacy of Piqray was studied in the SOLAR-1 trial, a randomized trial of 572 postmenopausal women and men with HR-positive, HER2-negative, advanced or metastatic breast cancer whose cancer had progressed while on or after receiving an aromatase inhibitor. Results from the trial showed the addition of Piqray to fulvestrant significantly prolonged progression- free survival (median of 11 months vs. 5.7 months) in patients whose tumors had a PIK3CA mutation.
Common side effects of Piqray are high blood sugar levels, increase in creatinine, diarrhea, rash, decrease in lymphocyte count in the blood, elevated liver enzymes, nausea, fatigue, low red blood cell count, increase in lipase (enzymes released by the pancreas), decreased appetite, stomatitis, vomiting, weight loss, low calcium levels, aPTT prolonged (blood clotting taking longer to occur than it should), and hair loss.
Health care professionals are advised to monitor patients taking Piqray for severe hypersensitivity reactions (intolerance). Patients are warned of potentially severe skin reactions (rashes that may result in peeling and blistering of skin or mucous membranes like the lips and gums). Health care professionals are advised not to initiate treatment in patients with a history of severe skin reactions such as Stevens-Johnson Syndrome, erythema multiforme, or toxic epidermal necrolysis. Patients on Piqray have reported severe hyperglycemia (high blood sugar), and the safety of Piqray in patients with Type 1 or uncontrolled Type 2 diabetes has not been established. Before initiating treatment with Piqray, health care professionals are advised to check fasting glucose and HbA1c, and to optimize glycemic control. Patients should be monitored for pneumonitis/interstitial lung disease (inflammation of lung tissue) and diarrhea during treatment. Piqray must be dispensed with a patient Medication Guide that describes important information about the drug’s uses and risks.
Piqray is the first new drug application (NDA) for a new molecular entity approved under the Real-Time Oncology Review (RTOR) pilot program, which permits the FDA to begin analyzing key efficacy and safety datasets prior to the official submission of an application, allowing the review team to begin their review and communicate with the applicant earlier. Piqray also used the updated Assessment Aid (AAid), a multidisciplinary review template intended to focus the FDA’s written review on critical thinking and consistency and reduce time spent on administrative tasks. With these two pilot programs, today’s approval of Piqray comes approximately three months ahead of the Prescription Drug User Fee Act (PDUFA) VI deadline of August 18, 2019.
The FDA granted this application Priority Review designation. The FDA granted approval of Piqray to Novartis. The FDA granted approval of the therascreen PIK3CA RGQ PCR Kit to QIAGEN Manchester, Ltd.
Alpelisib is an orally bioavailable phosphatidylinositol 3-kinase (PI3K) inhibitor with potential antineoplastic activity. Alpelisib specifically inhibits PI3K in the PI3K/AKT kinase (or protein kinase B) signaling pathway, thereby inhibiting the activation of the PI3K signaling pathway. This may result in inhibition of tumor cell growth and survival in susceptible tumor cell populations. Activation of the PI3K signaling pathway is frequently associated with tumorigenesis. Dysregulated PI3K signaling may contribute to tumor resistance to a variety of antineoplastic agents.
Alpelisib has been used in trials studying the treatment and basic science of Neoplasms, Solid Tumors, BREAST CANCER, 3rd Line GIST, and Rectal Cancer, among others.
(S)-pyrrolidine-l,2-dicarboxylic acid 2-amide l-(4-methyl-5-[2-(2,2,2-trifluoro-l,l- dimethyl-ethyl)-pyridin-4-yl]-thiazol-2-yl)-amidei hereafter referred to as compound I,
is an alpha-selective phosphatidylinositol 3 -kinase (PI3K) inhibitor. Compound I was originally described in WO 2010/029082, wherein the synthesis of its free base form was described. There is a need for additional solid forms of compound I, for use in drug substance and drug product development. It has been found that new solid forms of compound I can be prepared as one or more polymorph forms, including solvate forms. These polymorph forms exhibit new physical properties that may be exploited in order to obtain new pharmacological properties, and that may be utilized in drug substance and drug product development. Summary of the Invention
In one aspect, provided herein is a crystalline form of the compound of formula I, or a solvate of the crystalline form of the compound of formula I, or a salt of the crystalline form of the compound of formula I, or a solvate of a salt of the crystalline form of the compound of formula I. In one embodiment, the crystalline form of the compound of formula I has the polymorph form SA, SB, Sc, or SD.
In another aspect, provided herein is a pharmaceutical composition comprising a crystalline compound of formula I. In one embodiment of the pharmaceutical composition, the crystalline compound of formula I has the polymorph form SA, SB,Sc, or So.
In another aspect, provided herein is a method for the treatment of disorders mediated by PI3K, comprising administering to a patient in need of such treatment an effective amount of a crystalline compound of formula I, particularly SA, SB, SC,or SD .
In yet another aspect, provided herein is the use of a crystalline compound of formula I, particularly SA, SB, SC, or SD, for the preparation of a medicament for the treatment of disorders mediated by PI3K.
Alpelisib is indicated in combination with fulvestrant to treat postmenopausal women, and men, with advanced or metastatic breast cancer.Label This cancer must be hormone receptor (HR)-positive, human epidermal growth factor receptor 2 (HER2)-negative, and PIK3CA mutated.Label The cancer must be detected by an FDA-approved test following progression on or after an endocrine-based regimen.Label
Alpelisib does not prolong the QTcF interval.Label Patients taking alpelisib experience a dose dependent benefit from treatment with a 51% advantage of a 200mg daily dose over a 100mg dose and a 22% advantage of 300mg once daily over 150mg twice daily.6 This suggests patients requiring a lower dose may benefit from twice daily dosing.6
Mechanism of action
Phosphatidylinositol-3-kinase-α (PI3Kα) is responsible for cell proliferation in response to growth factor-tyrosine kinase pathway activation.3 In some cancers PI3Kα’s p110α catalytic subunit is mutated making it hyperactive.3 Alpelisib inhibits (PI3K), with the highest specificity for PI3Kα.Label
Alpelisib reached a peak concentration in plasma of 1320±912ng/mL after 2 hours.4 Alpelisib has an AUClast of 11,100±3760h ng/mL and an AUCINF of 11,100±3770h ng/mL.4 A large, high fat meal increases the AUC by 73% and Cmax by 84% while a small, low fat meal increases the AUC by 77% and Cmax by 145%.Label
Volume of distribution
The apparent volume of distribution at steady state is 114L.Label
Alpelisib is metabolized by hydrolysis reactions to form the primary metabolite.Label It is also metabolized by CYP3A4.Label The full metabolism of Alpelisib has yet to be determined but a series of reactions have been proposed.4,5 The main metabolic reaction is the substitution of an amine group on alpelisib for a hydroxyl group to form a metabolite known as M44,5 or BZG791.Label Alpelisib can also be glucuronidated to form the M1 and M12 metabolites.4,5
Hover over products below to view reaction partners
36% of an oral dose is eliminated as unchanged drug in the feces and 32% as the primary metabolite BZG791 in the feces.Label 2% of an oral dose is eliminated in the urine as unchanged drug and 7.1% as the primary metabolite BZG791.Label In total 81% of an oral dose is eliminated in the feces and 14% is eliminated in the urine.Label
Half-life
The mean half life of alprelisib is 8 to 9 hours.Label
Clearance
The mean apparent oral clearance was 39.0L/h.4 The predicted clearance is 9.2L/hr under fed conditions.Label
Patients experiencing an overdose may present with hyperglycemia, nausea, asthenia, and rash.Label There is no antidote for an overdose of alpelisib so patients should be treated symptomatically.Label Data regarding an LD50 is not readily available.MSDS In clinical trials, patients were given doses of up to 450mg once daily.Label
Pregnancy, Lactation, and Fertility
Following administration in rats and rabbits during organogenesis, adverse effects on the reproductive system, such as embryo-fetal mortality, reduced fetal weights, and increased incidences of fetal malformations, were observed.Label Based on these findings of animals studies and its mechanism of action, it is proposed that alpelisib may cause embryo-fetal toxicity when administered to pregnant patients.Label There is no data available regarding the presence of alpelisib in breast milk so breast feeding mothers are advised not to breastfeed while taking this medication and for 1 week after their last dose.Label Based on animal studies, alpelisib may impair fertility of humans.Label
Carcinogenicity and Mutagenicity
Studies of carcinogenicity have yet to be performed.Label Alpelisib has not been found to be mutagenic in the Ames test.Label It is not aneugenic, clastogenic, or genotoxic in further assays.Label
Yuan TL, Cantley LC: PI3K pathway alterations in cancer: variations on a theme. Oncogene 2008, 27(41):5497-5510.
Toker A: Double trouble for cancer gene. Science 2019, 366(6466):685-686.
Vasan N, Razavi P, Johnson JL, Shao H, Shah H, Antoine A, Ladewig E, Gorelick A, Lin TY, Toska E et al: Double PIK3CA mutations in cis increase oncogenicity and sensitivity to PI3Kalpha inhibitors. Science 2019, 366(6466):714-723.
Systems Biology analysis of Transcription Networks, Artificial Intelligence, and High-End Computing Coming to Fruition in Personalized Oncology
Curator: Stephen J. Williams, Ph.D.
In the June 2020 issue of the journal Science, writer Roxanne Khamsi has an interesting article “Computing Cancer’s Weak Spots; An algorithm to unmask tumors’ molecular linchpins is tested in patients”[1], describing some early successes in the incorporation of cancer genome sequencing in conjunction with artificial intelligence algorithms toward a personalized clinical treatment decision for various tumor types. In 2016, oncologists Amy Tiersten collaborated with systems biologist Andrea Califano and cell biologist Jose Silva at Mount Sinai Hospital to develop a systems biology approach to determine that the drug ruxolitinib, a STAT3 inhibitor, would be effective for one of her patient’s aggressively recurring, Herceptin-resistant breast tumor. Dr. Califano, instead of defining networks of driver mutations, focused on identifying a few transcription factors that act as ‘linchpins’ or master controllers of transcriptional networks withing tumor cells, and in doing so hoping to, in essence, ‘bottleneck’ the transcriptional machinery of potential oncogenic products. As Dr. Castilano states
“targeting those master regulators and you will stop cancer in its tracks, no matter what mutation initially caused it.”
It is important to note that this approach also relies on the ability to sequence tumors by RNA-seq to determine the underlying mutations which alter which master regulators are pertinent in any one tumor. And given the wide tumor heterogeneity in tumor samples, this sequencing effort may have to involve multiple biopsies (as discussed in earlier posts on tumor heterogeneity in renal cancer).
As stated in the article, Califano co-founded a company called Darwin-Health in 2015 to guide doctors by identifying the key transcription factors in a patient’s tumor and suggesting personalized therapeutics to those identified molecular targets (OncoTarget™). He had collaborated with the Jackson Laboratory and most recently Columbia University to conduct a $15 million 3000 patient clinical trial. This was a bit of a stretch from his initial training as a physicist and, in 1986, IBM hired him for some artificial intelligence projects. He then landed in 2003 at Columbia and has been working on identifying these transcriptional nodes that govern cancer survival and tumorigenicity. Dr. Califano had figured that the number of genetic mutations which potentially could be drivers were too vast:
A 2018 study which analyzed more than 9000 tumor samples reported over 1.5 million mutations[2]
and impossible to develop therapeutics against. He reasoned that you would just have to identify the common connections between these pathways or transcriptional nodes and termed them master regulators.
A Pan-Cancer Analysis of Enhancer Expression in Nearly 9000 Patient Samples
Chen H, Li C, Peng X, et al. Cell. 2018;173(2):386-399.e12.
Abstract
The role of enhancers, a key class of non-coding regulatory DNA elements, in cancer development has increasingly been appreciated. Here, we present the detection and characterization of a large number of expressed enhancers in a genome-wide analysis of 8928 tumor samples across 33 cancer types using TCGA RNA-seq data. Compared with matched normal tissues, global enhancer activation was observed in most cancers. Across cancer types, global enhancer activity was positively associated with aneuploidy, but not mutation load, suggesting a hypothesis centered on “chromatin-state” to explain their interplay. Integrating eQTL, mRNA co-expression, and Hi-C data analysis, we developed a computational method to infer causal enhancer-gene interactions, revealing enhancers of clinically actionable genes. Having identified an enhancer ∼140 kb downstream of PD-L1, a major immunotherapy target, we validated it experimentally. This study provides a systematic view of enhancer activity in diverse tumor contexts and suggests the clinical implications of enhancers.
A diagram of how concentrating on these transcriptional linchpins or nodes may be more therapeutically advantageous as only one pharmacologic agent is needed versus multiple agents to inhibit the various upstream pathways:
VIPER Algorithm (Virtual Inference of Protein activity by Enriched Regulon Analysis)
The algorithm that Califano and DarwinHealth developed is a systems biology approach using a tumor’s RNASeq data to determine controlling nodes of transcription. They have recently used the VIPER algorithm to look at RNA-Seq data from more than 10,000 tumor samples from TCGA and identified 407 transcription factor genes that acted as these linchpins across all tumor types. Only 20 to 25 of them were implicated in just one tumor type so these potential nodes are common in many forms of cancer.
Other institutions like the Cold Spring Harbor Laboratories have been using VIPER in their patient tumor analysis. Linchpins for other tumor types have been found. For instance, VIPER identified transcription factors IKZF1 and IKF3 as linchpins in multiple myeloma. But currently approved therapeutics are hard to come by for targets with are transcription factors, as most pharma has concentrated on inhibiting an easier target like kinases and their associated activity. In general, developing transcription factor inhibitors in more difficult an undertaking for multiple reasons.
Identifying the multiple dysregulated oncoproteins that contribute to tumorigenesis in a given patient is crucial for developing personalized treatment plans. However, accurate inference of aberrant protein activity in biological samples is still challenging as genetic alterations are only partially predictive and direct measurements of protein activity are generally not feasible. To address this problem we introduce and experimentally validate a new algorithm, VIPER (Virtual Inference of Protein-activity by Enriched Regulon analysis), for the accurate assessment of protein activity from gene expression data. We use VIPER to evaluate the functional relevance of genetic alterations in regulatory proteins across all TCGA samples. In addition to accurately inferring aberrant protein activity induced by established mutations, we also identify a significant fraction of tumors with aberrant activity of druggable oncoproteins—despite a lack of mutations, and vice-versa. In vitro assays confirmed that VIPER-inferred protein activity outperforms mutational analysis in predicting sensitivity to targeted inhibitors.
Schematic overview of the VIPER algorithm From: Alvarez MJ, Shen Y, Giorgi FM, Lachmann A, Ding BB, Ye BH, Califano A: Functional characterization of somatic mutations in cancer using network-based inference of protein activity. Nature genetics 2016, 48(8):838-847.
(a) Molecular layers profiled by different technologies. Transcriptomics measures steady-state mRNA levels; Proteomics quantifies protein levels, including some defined post-translational isoforms; VIPER infers protein activity based on the protein’s regulon, reflecting the abundance of the active protein isoform, including post-translational modifications, proper subcellular localization and interaction with co-factors. (b) Representation of VIPER workflow. A regulatory model is generated from ARACNe-inferred context-specific interactome and Mode of Regulation computed from the correlation between regulator and target genes. Single-sample gene expression signatures are computed from genome-wide expression data, and transformed into regulatory protein activity profiles by the aREA algorithm. (c) Three possible scenarios for the aREA analysis, including increased, decreased or no change in protein activity. The gene expression signature and its absolute value (|GES|) are indicated by color scale bars, induced and repressed target genes according to the regulatory model are indicated by blue and red vertical lines. (d) Pleiotropy Correction is performed by evaluating whether the enrichment of a given regulon (R4) is driven by genes co-regulated by a second regulator (R4∩R1). (e) Benchmark results for VIPER analysis based on multiple-samples gene expression signatures (msVIPER) and single-sample gene expression signatures (VIPER). Boxplots show the accuracy (relative rank for the silenced protein), and the specificity (fraction of proteins inferred as differentially active at p < 0.05) for the 6 benchmark experiments (see Table 2). Different colors indicate different implementations of the aREA algorithm, including 2-tail (2T) and 3-tail (3T), Interaction Confidence (IC) and Pleiotropy Correction (PC).
Other articles from Andrea Califano on VIPER algorithm in cancer include:
Echeverria GV, Ge Z, Seth S, Zhang X, Jeter-Jones S, Zhou X, Cai S, Tu Y, McCoy A, Peoples M, Sun Y, Qiu H, Chang Q, Bristow C, Carugo A, Shao J, Ma X, Harris A, Mundi P, Lau R, Ramamoorthy V, Wu Y, Alvarez MJ, Califano A, Moulder SL, Symmans WF, Marszalek JR, Heffernan TP, Chang JT, Piwnica-Worms H.Sci Transl Med. 2019 Apr 17;11(488):eaav0936. doi: 10.1126/scitranslmed.aav0936.PMID: 30996079
Chen H, Li C, Peng X, Zhou Z, Weinstein JN, Liang H: A Pan-Cancer Analysis of Enhancer Expression in Nearly 9000 Patient Samples. Cell 2018, 173(2):386-399 e312.
Alvarez MJ, Shen Y, Giorgi FM, Lachmann A, Ding BB, Ye BH, Califano A: Functional characterization of somatic mutations in cancer using network-based inference of protein activity. Nature genetics 2016, 48(8):838-847.
Other articles of Note on this Open Access Online Journal Include:
This session will provide information regarding methodologic and computational aspects of proteogenomic analysis of tumor samples, particularly in the context of clinical trials. Availability of comprehensive proteomic and matching genomic data for tumor samples characterized by the National Cancer Institute’s Clinical Proteomic Tumor Analysis Consortium (CPTAC) and The Cancer Genome Atlas (TCGA) program will be described, including data access procedures and informatic tools under development. Recent advances on mass spectrometry-based targeted assays for inclusion in clinical trials will also be discussed.
Amanda G Paulovich, Shankha Satpathy, Meenakshi Anurag, Bing Zhang, Steven A Carr
Methods and tools for comprehensive proteogenomic characterization of bulk tumor to needle core biopsies
Shankha Satpathy
TCGA has 11,000 cancers with >20,000 somatic alterations but only 128 proteins as proteomics was still young field
CPTAC is NCI proteomic effort
Chemical labeling approach now method of choice for quantitative proteomics
Looked at ovarian and breast cancers: to measure PTM like phosphorylated the sample preparation is critical
Data access and informatics tools for proteogenomics analysis
Bing Zhang
Raw and processed data (raw MS data) with linked clinical data can be extracted in CPTAC
Python scripts are available for bioinformatic programming
Pathways to clinical translation of mass spectrometry-based assays
Meenakshi Anurag
· Using kinase inhibitor pulldown (KIP) assay to identify unique kinome profiles
· Found single strand break repair defects in endometrial luminal cases, especially with immune checkpoint prognostic tumors
· Paper: JNCI 2019 analyzed 20,000 genes correlated with ET resistant in luminal B cases (selected for a list of 30 genes)
· Validated in METABRIC dataset
· KIP assay uses magnetic beads to pull out kinases to determine druggable kinases
· Looked in xenografts and was able to pull out differential kinomes
· Matched with PDX data so good clinical correlation
· Were able to detect ESR1 fusion correlated with ER+ tumors
The adoption of omic technologies in the cancer clinic is giving rise to an increasing number of large-scale high-dimensional datasets recording multiple aspects of the disease. This creates the need for frameworks for translatable discovery and learning from such data. Like artificial intelligence (AI) and machine learning (ML) for the cancer lab, methods for the clinic need to (i) compare and integrate different data types; (ii) scale with data sizes; (iii) prove interpretable in terms of the known biology and batch effects underlying the data; and (iv) predict previously unknown experimentally verifiable mechanisms. Methods for the clinic, beyond the lab, also need to (v) produce accurate actionable recommendations; (vi) prove relevant to patient populations based upon small cohorts; and (vii) be validated in clinical trials. In this educational session we will present recent studies that demonstrate AI and ML translated to the cancer clinic, from prognosis and diagnosis to therapy.
NOTE: Dr. Fish’s talk is not eligible for CME credit to permit the free flow of information of the commercial interest employee participating.
Ron C. Anafi, Rick L. Stevens, Orly Alter, Guy Fish
Overview of AI approaches in cancer research and patient care
Rick L. Stevens
Deep learning is less likely to saturate as data increases
Deep learning attempts to learn multiple layers of information
The ultimate goal is prediction but this will be the greatest challenge for ML
ML models can integrate data validation and cross database validation
What limits the performance of cross validation is the internal noise of data (reproducibility)
Learning curves: not the more data but more reproducible data is important
Neural networks can outperform classical methods
Important to measure validation accuracy in training set. Class weighting can assist in development of data set for training set especially for unbalanced data sets
Discovering genome-scale predictors of survival and response to treatment with multi-tensor decompositions
Orly Alter
Finding patterns using SVD component analysis. Gene and SVD patterns match 1:1
Comparative spectral decompositions can be used for global datasets
Validation of CNV data using this strategy
Found Ras, Shh and Notch pathways with altered CNV in glioblastoma which correlated with prognosis
These predictors was significantly better than independent prognostic indicator like age of diagnosis
Identifying targets for cancer chronotherapy with unsupervised machine learning
Ron C. Anafi
Many clinicians have noticed that some patients do better when chemo is given at certain times of the day and felt there may be a circadian rhythm or chronotherapeutic effect with respect to side effects or with outcomes
ML used to determine if there is indeed this chronotherapy effect or can we use unstructured data to determine molecular rhythms?
Found a circadian transcription in human lung
Most dataset in cancer from one clinical trial so there might need to be more trials conducted to take into consideration circadian rhythms
Stratifying patients by live-cell biomarkers with random-forest decision trees
Guy Fish CEO Cellanyx Diagnostics
Some clinicians feel we may be overdiagnosing and overtreating certain cancers, especially the indolent disease
This educational session focuses on the chronic wound healing, fibrosis, and cancer “triad.” It emphasizes the similarities and differences seen in these conditions and attempts to clarify why sustained fibrosis commonly supports tumorigenesis. Importance will be placed on cancer-associated fibroblasts (CAFs), vascularity, extracellular matrix (ECM), and chronic conditions like aging. Dr. Dvorak will provide an historical insight into the triad field focusing on the importance of vascular permeability. Dr. Stewart will explain how chronic inflammatory conditions, such as the aging tumor microenvironment (TME), drive cancer progression. The session will close with a review by Dr. Cukierman of the roles that CAFs and self-produced ECMs play in enabling the signaling reciprocity observed between fibrosis and cancer in solid epithelial cancers, such as pancreatic ductal adenocarcinoma.
Harold F Dvorak, Sheila A Stewart, Edna Cukierman
The importance of vascular permeability in tumor stroma generation and wound healing
Harold F Dvorak
Aging in the driver’s seat: Tumor progression and beyond
Sheila A Stewart
Why won’t CAFs stay normal?
Edna Cukierman
Tuesday, June 23
3:00 PM – 5:00 PM EDT
Other Articles on this Open Access Online Journal on Cancer Conferences and Conference Coverage in Real Time Include