Feeds:
Posts
Comments

Archive for the ‘Pyridine nucleotides’ Category

Disease related changes in proteomics, protein folding, protein-protein interaction, Volume 2 (Volume Two: Latest in Genomics Methodologies for Therapeutics: Gene Editing, NGS and BioInformatics, Simulations and the Genome Ontology), Part 1: Next Generation Sequencing (NGS)

Disease related changes in proteomics, protein folding, protein-protein interaction

Curator: Larry H. Bernstein, MD, FCAP

LPBI


Frankenstein Proteins Stitched Together by Scientists

http://www.genengnews.com/gen-news-highlights/frankenstein-proteins-stitched-together-by-scientists/81252715/

http://www.genengnews.com/Media/images/GENHighlight/thumb_May11_2016_Wikipedia_1831Frankenstein2192501426.jpg

The Frankenstein monster, stitched together from disparate body parts, proved to be an abomination, but stitched together proteins may fare better. They may, for example, serve specific purposes in medicine, research, and industry. At least, that’s the ambition of scientists based at the University of North Carolina. They have developed a computational protocol called SEWING that builds new proteins from connected or disconnected pieces of existing structures. [Wikipedia]

Unlike Victor Frankenstein, who betrayed Promethean ambition when he sewed together his infamous creature, today’s biochemists are relatively modest. Rather than defy nature, they emulate it. For example, at the University of North Carolina (UNC), researchers have taken inspiration from natural evolutionary mechanisms to develop a technique called SEWING—Structure Extension With Native-substructure Graphs. SEWING is a computational protocol that describes how to stitch together new proteins from connected or disconnected pieces of existing structures.

“We can now begin to think about engineering proteins to do things that nothing else is capable of doing,” said UNC’s Brian Kuhlman, Ph.D. “The structure of a protein determines its function, so if we are going to learn how to design new functions, we have to learn how to design new structures. Our study is a critical step in that direction and provides tools for creating proteins that haven’t been seen before in nature.”

Traditionally, researchers have used computational protein design to recreate in the laboratory what already exists in the natural world. In recent years, their focus has shifted toward inventing novel proteins with new functionality. These design projects all start with a specific structural “blueprint” in mind, and as a result are limited. Dr. Kuhlman and his colleagues, however, believe that by removing the limitations of a predetermined blueprint and taking cues from evolution they can more easily create functional proteins.

Dr. Kuhlman’s UNC team developed a protein design approach that emulates natural mechanisms for shuffling tertiary structures such as pleats, coils, and furrows. Putting the approach into action, the UNC team mapped 50,000 stitched together proteins on the computer, and then it produced 21 promising structures in the laboratory. Details of this work appeared May 6 in the journal Science, in an article entitled, “Design of Structurally Distinct Proteins Using Strategies Inspired by Evolution.”

“Helical proteins designed with SEWING contain structural features absent from other de novo designed proteins and, in some cases, remain folded at more than 100°C,” wrote the authors. “High-resolution structures of the designed proteins CA01 and DA05R1 were solved by x-ray crystallography (2.2 angstrom resolution) and nuclear magnetic resonance, respectively, and there was excellent agreement with the design models.”

Essentially, the UNC scientists confirmed that the proteins they had synthesized contained the unique structural varieties that had been designed on the computer. The UNC scientists also determined that the structures they had created had new surface and pocket features. Such features, they noted, provide potential binding sites for ligands or macromolecules.

“We were excited that some had clefts or grooves on the surface, regions that naturally occurring proteins use for binding other proteins,” said the Science article’s first author, Tim M. Jacobs, Ph.D., a former graduate student in Dr. Kuhlman’s laboratory. “That’s important because if we wanted to create a protein that can act as a biosensor to detect a certain metabolite in the body, either for diagnostic or research purposes, it would need to have these grooves. Likewise, if we wanted to develop novel therapeutics, they would also need to attach to specific proteins.”

Currently, the UNC researchers are using SEWING to create proteins that can bind to several other proteins at a time. Many of the most important proteins are such multitaskers, including the blood protein hemoglobin.


Histone Mutation Deranges DNA Methylation to Cause Cancer

http://www.genengnews.com/gen-news-highlights/histone-mutation-deranges-dna-methylation-to-cause-cancer/81252723/

http://www.genengnews.com/Media/images/GENHighlight/thumb_May13_2016_RockefellerUniv_ChildhoodSarcoma1293657114.jpg

In some cancers, including chondroblastoma and a rare form of childhood sarcoma, a mutation in histone H3 reduces global levels of methylation (dark areas) in tumor cells but not in normal cells (arrowhead). The mutation locks the cells in a proliferative state to promote tumor development. [Laboratory of Chromatin Biology and Epigenetics at The Rockefeller University]

They have been called oncohistones, the mutated histones that are known to accompany certain pediatric cancers. Despite their suggestive moniker, oncohistones have kept their oncogenic secrets. For example, it has been unclear whether oncohistones are able to cause cancer on their own, or whether they need to act in concert with additional DNA mutations, that is, mutations other than those affecting histone structures.

While oncohistone mechanisms remain poorly understood, this particular question—the oncogenicity of lone oncohistones—has been resolved, at least in part. According to researchers based at The Rockefeller University, a change to the structure of a histone can trigger a tumor on its own.

This finding appeared May 13 in the journal Science, in an article entitled, “Histone H3K36 Mutations Promote Sarcomagenesis Through Altered Histone Methylation Landscape.” The article describes the Rockefeller team’s study of a histone protein called H3, which has been found in about 95% of samples of chondoblastoma, a benign tumor that arises in cartilage, typically during adolescence.

The Rockefeller scientists found that the H3 lysine 36–to–methionine (H3K36M) mutation impairs the differentiation of mesenchymal progenitor cells and generates undifferentiated sarcoma in vivo.

After the scientists inserted the H3 histone mutation into mouse mesenchymal progenitor cells (MPCs)—which generate cartilage, bone, and fat—they watched these cells lose the ability to differentiate in the lab. Next, the scientists injected the mutant cells into living mice, and the animals developed the tumors rich in MPCs, known as an undifferentiated sarcoma. Finally, the researchers tried to understand how the mutation causes the tumors to develop.

The scientists determined that H3K36M mutant nucleosomes inhibit the enzymatic activities of several H3K36 methyltransferases.

“Depleting H3K36 methyltransferases, or expressing an H3K36I mutant that similarly inhibits H3K36 methylation, is sufficient to phenocopy the H3K36M mutation,” the authors of the Science study wrote. “After the loss of H3K36 methylation, a genome-wide gain in H3K27 methylation leads to a redistribution of polycomb repressive complex 1 and de-repression of its target genes known to block mesenchymal differentiation.”

Essentially, when the H3K36M mutation occurs, the cell becomes locked in a proliferative state—meaning it divides constantly, leading to tumors. Specifically, the mutation inhibits enzymes that normally tag the histone with chemical groups known as methyls, allowing genes to be expressed normally.

In response to this lack of modification, another part of the histone becomes overmodified, or tagged with too many methyl groups. “This leads to an overall resetting of the landscape of chromatin, the complex of DNA and its associated factors, including histones,” explained co-author Peter Lewis, Ph.D., a professor at the University of Wisconsin-Madison and a former postdoctoral fellow in laboratory of C. David Allis, Ph.D., a professor at Rockefeller.

The finding—that a “resetting” of the chromatin landscape can lock the cell into a proliferative state—suggests that researchers should be on the hunt for more mutations in histones that might be driving tumors. For their part, the Rockefeller researchers are trying to learn more about how this specific mutation in histone H3 causes tumors to develop.

“We want to know which pathways cause the mesenchymal progenitor cells that carry the mutation to continue to divide, and not differentiate into the bone, fat, and cartilage cells they are destined to become,” said co-author Chao Lu, Ph.D., a postdoctoral fellow in the Allis lab.

Once researchers understand more about these pathways, added Dr. Lewis, they can consider ways of blocking them with drugs, particularly in tumors such as MPC-rich sarcomas—which, unlike chondroblastoma, can be deadly. In fact, drugs that block these pathways may already exist and may even be in use for other types of cancers.

“One long-term goal of our collaborative team is to better understand fundamental mechanisms that drive these processes, with the hope of providing new therapeutic approaches,” concluded Dr. Allis.


Histone H3K36 mutations promote sarcomagenesis through altered histone methylation landscape

Chao Lu, Siddhant U. Jain, Dominik Hoelper, …, C. David Allis1,, Nada Jabado,, Peter W. Lewis,
Science  13 May 2016; 352(6287):844-849 http://dx.doi.org:/10.1126/science.aac7272  http://science.sciencemag.org/content/352/6287/844

An oncohistone deranges inhibitory chromatin

Missense mutations (that change one amino acid for another) in histone H3 can produce a so-called oncohistone and are found in a number of pediatric cancers. For example, the lysine-36–to-methionine (K36M) mutation is seen in almost all chondroblastomas. Lu et al. show that K36M mutant histones are oncogenic, and they inhibit the normal methylation of this same residue in wild-type H3 histones. The mutant histones also interfere with the normal development of bone-related cells and the deposition of inhibitory chromatin marks.

Science, this issue p. 844

Several types of pediatric cancers reportedly contain high-frequency missense mutations in histone H3, yet the underlying oncogenic mechanism remains poorly characterized. Here we report that the H3 lysine 36–to–methionine (H3K36M) mutation impairs the differentiation of mesenchymal progenitor cells and generates undifferentiated sarcoma in vivo. H3K36M mutant nucleosomes inhibit the enzymatic activities of several H3K36 methyltransferases. Depleting H3K36 methyltransferases, or expressing an H3K36I mutant that similarly inhibits H3K36 methylation, is sufficient to phenocopy the H3K36M mutation. After the loss of H3K36 methylation, a genome-wide gain in H3K27 methylation leads to a redistribution of polycomb repressive complex 1 and de-repression of its target genes known to block mesenchymal differentiation. Our findings are mirrored in human undifferentiated sarcomas in which novel K36M/I mutations in H3.1 are identified.


Mitochondria? We Don’t Need No Stinking Mitochondria!


http://www.genengnews.com/Media/images/GENHighlight/thumb_fx11801711851.jpg
Diagram comparing typical eukaryotic cell to the newly discovered mitochondria-free organism. [Karnkowska et al., 2016, Current Biology 26, 1–11]
  • The organelle that produces a significant portion of energy for eukaryotic cells would seemingly be indispensable, yet over the years, a number of organisms have been discovered that challenge that biological pretense. However, these so-called amitochondrial species may lack a defined organelle, but they still retain some residual functions of their mitochondria-containing brethren. Even the intestinal eukaryotic parasite Giardia intestinalis, which was for many years considered to be mitochondria-free, was proven recently to contain a considerably shriveled version of the organelle.
  • Now, an international group of scientists has released results from a new study that challenges the notion that mitochondria are essential for eukaryotes—discovering an organism that resides in the gut of chinchillas that contains absolutely no trace of mitochondria at all.
  • “In low-oxygen environments, eukaryotes often possess a reduced form of the mitochondrion, but it was believed that some of the mitochondrial functions are so essential that these organelles are indispensable for their life,” explained lead study author Anna Karnkowska, Ph.D., visiting scientist at the University of British Columbia in Vancouver. “We have characterized a eukaryotic microbe which indeed possesses no mitochondrion at all.”


Mysterious Eukaryote Missing Mitochondria

Researchers uncover the first example of a eukaryotic organism that lacks the organelles.

By Anna Azvolinsky | May 12, 2016

http://www.the-scientist.com/?articles.view/articleNo/46077/title/Mysterious-Eukaryote-Missing-Mitochondria

http://www.the-scientist.com/images/News/May2016/620_Monocercomonides-Pa203.jpg

Monocercomonoides sp. PA203VLADIMIR HAMPL, CHARLES UNIVERSITY, PRAGUE, CZECH REPUBLIC

Scientists have long thought that mitochondria—organelles responsible for energy generation—are an essential and defining feature of a eukaryotic cell. Now, researchers from Charles University in Prague and their colleagues are challenging this notion with their discovery of a eukaryotic organism,Monocercomonoides species PA203, which lacks mitochondria. The team’s phylogenetic analysis, published today (May 12) in Current Biology,suggests that Monocercomonoides—which belong to the Oxymonadida group of protozoa and live in low-oxygen environmentsdid have mitochondria at one point, but eventually lost the organelles.

“This is quite a groundbreaking discovery,” said Thijs Ettema, who studies microbial genome evolution at Uppsala University in Sweden and was not involved in the work.

“This study shows that mitochondria are not so central for all lineages of living eukaryotes,” Toni Gabaldonof the Center for Genomic Regulation in Barcelona, Spain, who also was not involved in the work, wrote in an email to The Scientist. “Yet, this mitochondrial-devoid, single-cell eukaryote is as complex as other eukaryotic cells in almost any other aspect of cellular complexity.”

Charles University’s Vladimir Hampl studies the evolution of protists. Along with Anna Karnkowska and colleagues, Hampl decided to sequence the genome of Monocercomonoides, a little-studied protist that lives in the digestive tracts of vertebrates. The 75-megabase genome—the first of an oxymonad—did not contain any conserved genes found on mitochondrial genomes of other eukaryotes, the researchers found. It also did not contain any nuclear genes associated with mitochondrial functions.

“It was surprising and for a long time, we didn’t believe that the [mitochondria-associated genes were really not there]. We thought we were missing something,” Hampl told The Scientist. “But when the data kept accumulating, we switched to the hypothesis that this organism really didn’t have mitochondria.”

Because researchers have previously not found examples of eukaryotes without some form of mitochondria, the current theory of the origin of eukaryotes poses that the appearance of mitochondria was crucial to the identity of these organisms.

“We now view these mitochondria-like organelles as a continuum from full mitochondria to very small . Some anaerobic protists, for example, have only pared down versions of mitochondria, such as hydrogenosomes and mitosomes, which lack a mitochondrial genome. But these mitochondrion-like organelles perform essential functions of the iron-sulfur cluster assembly pathway, which is known to be conserved in virtually all eukaryotic organisms studied to date.

Yet, in their analysis, the researchers found no evidence of the presence of any components of this mitochondrial pathway.

Like the scaling down of mitochondria into mitosomes in some organisms, the ancestors of modernMonocercomonoides once had mitochondria. “Because this organism is phylogenetically nested among relatives that had conventional mitochondria, this is most likely a secondary adaptation,” said Michael Gray, a biochemist who studies mitochondria at Dalhousie University in Nova Scotia and was not involved in the study. According to Gray, the finding of a mitochondria-deficient eukaryote does not mean that the organelles did not play a major role in the evolution of eukaryotic cells.

To be sure they were not missing mitochondrial proteins, Hampl’s team also searched for potential mitochondrial protein homologs of other anaerobic species, and for signature sequences of a range of known mitochondrial proteins. While similar searches with other species uncovered a few mitochondrial proteins, the team’s analysis of Monocercomonoides came up empty.

“The data is very complete,” said Ettema. “It is difficult to prove the absence of something but [these authors] do a convincing job.”

To form the essential iron-sulfur clusters, the team discovered that Monocercomonoides use a sulfur mobilization system found in the cytosol, and that an ancestor of the organism acquired this system by lateral gene transfer from bacteria. This cytosolic, compensating system allowed Monocercomonoides to lose the otherwise essential iron-sulfur cluster-forming pathway in the mitochondrion, the team proposed.

“This work shows the great evolutionary plasticity of the eukaryotic cell,” said Karnkowska, who participated in the study while she was a postdoc at Charles University. Karnkowska, who is now a visiting researcher at the University of British Columbia in Canada, added: “This is a striking example of how far the evolution of a eukaryotic cell can go that was beyond our expectations.”

“The results highlight how many surprises may await us in the poorly studied eukaryotic phyla that live in under-explored environments,” Gabaldon said.

Ettema agreed. “Now that we’ve found one, we need to look at the bigger picture and see if there are other examples of eukaryotes that have lost their mitochondria, to understand how adaptable eukaryotes are.”

  1. Karnkowska et al., “A eukaryote without a mitochondrial organelle,” Current Biology,doi:10.1016/j.cub.2016.03.053, 2016.

organellesmitochondriagenetics & genomics and evolution


A Eukaryote without a Mitochondrial Organelle

Anna Karnkowska,  Vojtěch Vacek,  Zuzana Zubáčová,…,  Čestmír Vlček,  Vladimír HamplDOI: http://dx.doi.org/10.1016/j.cub.2016.03.053  Article Info

PDF (2 MB)   Extended PDF (2 MB)  Download Images(.ppt)  About Images & Usage

Highlights

  • Monocercomonoides sp. is a eukaryotic microorganism with no mitochondria
  • •The complete absence of mitochondria is a secondary loss, not an ancestral feature
  • •The essential mitochondrial ISC pathway was replaced by a bacterial SUF system

The presence of mitochondria and related organelles in every studied eukaryote supports the view that mitochondria are essential cellular components. Here, we report the genome sequence of a microbial eukaryote, the oxymonad Monocercomonoides sp., which revealed that this organism lacks all hallmark mitochondrial proteins. Crucially, the mitochondrial iron-sulfur cluster assembly pathway, thought to be conserved in virtually all eukaryotic cells, has been replaced by a cytosolic sulfur mobilization system (SUF) acquired by lateral gene transfer from bacteria. In the context of eukaryotic phylogeny, our data suggest that Monocercomonoides is not primitively amitochondrial but has lost the mitochondrion secondarily. This is the first example of a eukaryote lacking any form of a mitochondrion, demonstrating that this organelle is not absolutely essential for the viability of a eukaryotic cell.

http://www.cell.com/cms/attachment/2056332410/2061316405/fx1.jpg


HIV Particles Used to Trap Intact Mammalian Protein Complexes

Belgian scientists from VIB and UGent developed Virotrap, a viral particle sorting approach for purifying protein complexes under native conditions.

http://www.technologynetworks.com/Proteomics/news.aspx?ID=191122

This method catches a bait protein together with its associated protein partners in virus-like particles that are budded from human cells. Like this, cell lysis is not needed and protein complexes are preserved during purification.

With his feet in both a proteomics lab and an interactomics lab, VIB/UGent professor Sven Eyckerman is well aware of the shortcomings of conventional approaches to analyze protein complexes. The lysis conditions required in mass spectrometry–based strategies to break open cell membranes often affect protein-protein interactions. “The first step in a classical study on protein complexes essentially turns the highly organized cellular structure into a big messy soup”, Eyckerman explains.

Inspired by virus biology, Eyckerman came up with a creative solution. “We used the natural process of HIV particle formation to our benefit by hacking a completely safe form of the virus to abduct intact protein machines from the cell.” It is well known that the HIV virus captures a number of host proteins during its particle formation. By fusing a bait protein to the HIV-1 GAG protein, interaction partners become trapped within virus-like particles that bud from mammalian cells. Standard proteomic approaches are used next to reveal the content of these particles. Fittingly, the team named the method ‘Virotrap’.

The Virotrap approach is exceptional as protein networks can be characterized under natural conditions. By trapping protein complexes in the protective environment of a virus-like shell, the intact complexes are preserved during the purification process. The researchers showed the method was suitable for detection of known binary interactions as well as mass spectrometry-based identification of novel protein partners.

Virotrap is a textbook example of bringing research teams with complementary expertise together. Cross-pollination with the labs of Jan Tavernier (VIB/UGent) and Kris Gevaert (VIB/UGent) enabled the development of this platform.

Jan Tavernier: “Virotrap represents a new concept in co-complex analysis wherein complex stability is physically guaranteed by a protective, physical structure. It is complementary to the arsenal of existing interactomics methods, but also holds potential for other fields, like drug target characterization. We also developed a small molecule-variant of Virotrap that could successfully trap protein partners for small molecule baits.”

Kris Gevaert: “Virotrap can also impact our understanding of disease pathways. We were actually surprised to see that this virus-based system could be used to study antiviral pathways, like Toll-like receptor signaling. Understanding these protein machines in their natural environment is essential if we want to modulate their activity in pathology.“


Trapping mammalian protein complexes in viral particles

Sven Eyckerman, Kevin Titeca, …Kris GevaertJan Tavernier
Nature Communications Apr 2016; 7(11416)   http://dx.doi.org:/10.1038/ncomms11416

Cell lysis is an inevitable step in classical mass spectrometry–based strategies to analyse protein complexes. Complementary lysis conditions, in situ cross-linking strategies and proximal labelling techniques are currently used to reduce lysis effects on the protein complex. We have developed Virotrap, a viral particle sorting approach that obviates the need for cell homogenization and preserves the protein complexes during purification. By fusing a bait protein to the HIV-1 GAG protein, we show that interaction partners become trapped within virus-like particles (VLPs) that bud from mammalian cells. Using an efficient VLP enrichment protocol, Virotrap allows the detection of known binary interactions and MS-based identification of novel protein partners as well. In addition, we show the identification of stimulus-dependent interactions and demonstrate trapping of protein partners for small molecules. Virotrap constitutes an elegant complementary approach to the arsenal of methods to study protein complexes.

Proteins mostly exert their function within supramolecular complexes. Strategies for detecting protein–protein interactions (PPIs) can be roughly divided into genetic systems1 and co-purification strategies combined with mass spectrometry (MS) analysis (for example, AP–MS)2. The latter approaches typically require cell or tissue homogenization using detergents, followed by capture of the protein complex using affinity tags3 or specific antibodies4. The protein complexes extracted from this ‘soup’ of constituents are then subjected to several washing steps before actual analysis by trypsin digestion and liquid chromatography–MS/MS analysis. Such lysis and purification protocols are typically empirical and have mostly been optimized using model interactions in single labs. In fact, lysis conditions can profoundly affect the number of both specific and nonspecific proteins that are identified in a typical AP–MS set-up. Indeed, recent studies using the nuclear pore complex as a model protein complex describe optimization of purifications for the different proteins in the complex by examining 96 different conditions5. Nevertheless, for new purifications, it remains hard to correctly estimate the loss of factors in a standard AP–MS experiment due to washing and dilution effects during treatments (that is, false negatives). These considerations have pushed the concept of stabilizing PPIs before the actual homogenization step. A classical approach involves cross-linking with simple reagents (for example, formaldehyde) or with more advanced isotope-labelled cross-linkers (reviewed in ref. 2). However, experimental challenges such as cell permeability and reactivity still preclude the widespread use of cross-linking agents. Moreover, MS-generated spectra of cross-linked peptides are notoriously difficult to identify correctly. A recent lysis-independent solution involves the expression of a bait protein fused to a promiscuous biotin ligase, which results in labelling of proteins proximal to the activity of the enzyme-tagged bait protein6. When compared with AP–MS, this BioID approach delivers a complementary set of candidate proteins, including novel interaction partners78. Such particular studies clearly underscore the need for complementary approaches in the co-complex strategies.

The evolutionary stress on viruses promoted highly condensed coding of information and maximal functionality for small genomes. Accordingly, for HIV-1 it is sufficient to express a single protein, the p55 GAG protein, for efficient production of virus-like particles (VLPs) from cells910. This protein is highly mobile before its accumulation in cholesterol-rich regions of the membrane, where multimerization initiates the budding process11. A total of 4,000–5,000 GAG molecules is required to form a single particle of about 145 nm (ref. 12). Both VLPs and mature viruses contain a number of host proteins that are recruited by binding to viral proteins. These proteins can either contribute to the infectivity (for example, Cyclophilin/FKBPA13) or act as antiviral proteins preventing the spreading of the virus (for example, APOBEC proteins14).

We here describe the development and application of Virotrap, an elegant co-purification strategy based on the trapping of a bait protein together with its associated protein partners in VLPs that are budded from the cell. After enrichment, these particles can be analysed by targeted (for example, western blotting) or unbiased approaches (MS-based proteomics). Virotrap allows detection of known binary PPIs, analysis of protein complexes and their dynamics, and readily detects protein binders for small molecules.

Concept of the Virotrap system

Classical AP–MS approaches rely on cell homogenization to access protein complexes, a step that can vary significantly with the lysis conditions (detergents, salt concentrations, pH conditions and so on)5. To eliminate the homogenization step in AP–MS, we reasoned that incorporation of a protein complex inside a secreted VLP traps the interaction partners under native conditions and protects them during further purification. We thus explored the possibility of protein complex packaging by the expression of GAG-bait protein chimeras (Fig. 1) as expression of GAG results in the release of VLPs from the cells910. As a first PPI pair to evaluate this concept, we selected the HRAS protein as a bait combined with the RAF1 prey protein. We were able to specifically detect the HRAS–RAF1 interaction following enrichment of VLPs via ultracentrifugation (Supplementary Fig. 1a). To prevent tedious ultracentrifugation steps, we designed a novel single-step protocol wherein we co-express the vesicular stomatitis virus glycoprotein (VSV-G) together with a tagged version of this glycoprotein in addition to the GAG bait and prey. Both tagged and untagged VSV-G proteins are probably presented as trimers on the surface of the VLPs, allowing efficient antibody-based recovery from large volumes. The HRAS–RAF1 interaction was confirmed using this single-step protocol (Supplementary Fig. 1b). No associations with unrelated bait or prey proteins were observed for both protocols.

Figure 1: Schematic representation of the Virotrap strategy.

http://www.nature.com/ncomms/2016/160428/ncomms11416/images_article/ncomms11416-f1.jpg


Expression of a GAG-bait fusion protein (1) results in submembrane multimerization (2) and subsequent budding of VLPs from cells (3). Interaction partners of the bait protein are also trapped within these VLPs and can be identified after purification by western blotting or MS analysis (4).

Virotrap for the detection of binary interactions

We next explored the reciprocal detection of a set of PPI pairs, which were selected based on published evidence and cytosolic localization15. After single-step purification and western blot analysis, we could readily detect reciprocal interactions between CDK2 and CKS1B, LCP2 and GRAP2, and S100A1 and S100B (Fig. 2a). Only for the LCP2 prey we observed nonspecific association with an irrelevant bait construct. However, the particle levels of the GRAP2 bait were substantially lower as compared with those of the GAG control construct (GAG protein levels in VLPs; Fig. 2a, second panel of the LCP2 prey). After quantification of the intensities of bait and prey proteins and normalization of prey levels using bait levels, we observed a strong enrichment for the GAG-GRAP2 bait (Supplementary Fig. 2).

…..

Virotrap for unbiased discovery of novel interactions

For the detection of novel interaction partners, we scaled up VLP production and purification protocols (Supplementary Fig. 5 and Supplementary Note 1 for an overview of the protocol) and investigated protein partners trapped using the following bait proteins: Fas-associated via death domain (FADD), A20 (TNFAIP3), nuclear factor-κB (NF-κB) essential modifier (IKBKG), TRAF family member-associated NF-κB activator (TANK), MYD88 and ring finger protein 41 (RNF41). To obtain specific interactors from the lists of identified proteins, we challenged the data with a combined protein list of 19 unrelated Virotrap experiments (Supplementary Table 1 for an overview). Figure 3 shows the design and the list of candidate interactors obtained after removal of all proteins that were found in the 19 control samples (including removal of proteins from the control list identified with a single peptide). The remaining list of confident protein identifications (identified with at least two peptides in at least two biological repeats) reveals both known and novel candidate interaction partners. All candidate interactors including single peptide protein identifications are given in Supplementary Data 2 and also include recurrent protein identifications of known interactors based on a single peptide; for example, CASP8 for FADD and TANK for NEMO. Using alternative methods, we confirmed the interaction between A20 and FADD, and the associations with transmembrane proteins (insulin receptor and insulin-like growth factor receptor 1) that were captured using RNF41 as a bait (Supplementary Fig. 6). To address the use of Virotrap for the detection of dynamic interactions, we activated the NF-κB pathway via the tumour necrosis factor (TNF) receptor (TNFRSF1A) using TNFα (TNF) and performed Virotrap analysis using A20 as bait (Fig. 3). This resulted in the additional enrichment of receptor-interacting kinase (RIPK1), TNFR1-associated via death domain (TRADD), TNFRSF1A and TNF itself, confirming the expected activated complex20.

Figure 3: Use of Virotrap for unbiased interactome analysis

http://www.nature.com/ncomms/2016/160428/ncomms11416/images_article/ncomms11416-f3.jpg

Figure 4: Use of Virotrap for detection of protein partners of small molecules.

http://www.nature.com/ncomms/2016/160428/ncomms11416/images_article/ncomms11416-f4.jpg

….

Lysis conditions used in AP–MS strategies are critical for the preservation of protein complexes. A multitude of lysis conditions have been described, culminating in a recent report where protein complex stability was assessed under 96 lysis/purification protocols5. Moreover, the authors suggest to optimize the conditions for every complex, implying an important workload for researchers embarking on protein complex analysis using classical AP–MS. As lysis results in a profound change of the subcellular context and significantly alters the concentration of proteins, loss of complex integrity during a classical AP–MS protocol can be expected. A clear evolution towards ‘lysis-independent’ approaches in the co-complex analysis field is evident with the introduction of BioID6 and APEX25 where proximal proteins, including proteins residing in the complex, are labelled with biotin by an enzymatic activity fused to a bait protein. A side-by-side comparison between classical AP–MS and BioID showed overlapping and unique candidate binding proteins for both approaches78, supporting the notion that complementary methods are needed to provide a comprehensive view on protein complexes. This has also been clearly demonstrated for binary approaches15 and is a logical consequence of the heterogenic nature underlying PPIs (binding mechanism, requirement for posttranslational modifications, location, affinity and so on).

In this report, we explore an alternative, yet complementary method to isolate protein complexes without interfering with cellular integrity. By trapping protein complexes in the protective environment of a virus-like shell, the intact complexes are preserved during the purification process. This constitutes a new concept in co-complex analysis wherein complex stability is physically guaranteed by a protective, physical structure. A comparison of our Virotrap approach with AP–MS shows complementary data, with specific false positives and false negatives for both methods (Supplementary Fig. 7).

The current implementation of the Virotrap platform implies the use of a GAG-bait construct resulting in considerable expression of the bait protein. Different strategies are currently pursued to reduce bait expression including co-expression of a native GAG protein together with the GAG-bait protein, not only reducing bait expression but also creating more ‘space’ in the particles potentially accommodating larger bait protein complexes. Nevertheless, the presence of the bait on the forming GAG scaffold creates an intracellular affinity matrix (comparable to the early in vitro affinity columns for purification of interaction partners from lysates26) that has the potential to compete with endogenous complexes by avidity effects. This avidity effect is a powerful mechanism that aids in the recruitment of cyclophilin to GAG27, a well-known weak interaction (Kd=16 μM (ref. 28)) detectable as a background association in the Virotrap system. Although background binding may be increased by elevated bait expression, weaker associations are readily detectable (for example, MAL—MYD88-binding study; Fig. 2c).

The size of Virotrap particles (around 145 nm) suggests limitations in the size of the protein complex that can be accommodated in the particles. Further experimentation is required to define the maximum size of proteins or the number of protein complexes that can be trapped inside the particles.

….

In conclusion, Virotrap captures significant parts of known interactomes and reveals new interactions. This cell lysis-free approach purifies protein complexes under native conditions and thus provides a powerful method to complement AP–MS or other PPI data. Future improvements of the system include strategies to reduce bait expression to more physiological levels and application of advanced data analysis options to filter out background. These developments can further aid in the deployment of Virotrap as a powerful extension of the current co-complex technology arsenal.


New Autism Blood Biomarker Identified

Researchers at UT Southwestern Medical Center have identified a blood biomarker that may aid in earlier diagnosis of children with autism spectrum disorder, or ASD

http://www.technologynetworks.com/Proteomics/news.aspx?ID=191268


In a recent edition of Scientific Reports, UT Southwestern researchers reported on the identification of a blood biomarker that could distinguish the majority of ASD study participants versus a control group of similar age range. In addition, the biomarker was significantly correlated with the level of communication impairment, suggesting that the blood test may give insight into ASD severity.

“Numerous investigators have long sought a biomarker for ASD,” said Dr. Dwight German, study senior author and Professor of Psychiatry at UT Southwestern. “The blood biomarker reported here along with others we are testing can represent a useful test with over 80 percent accuracy in identifying ASD.”

ASD1 –  was 66 percent accurate in diagnosing ASD. When combined with thyroid stimulating hormone level measurements, the ASD1-binding biomarker was 73 percent accurate at diagnosis


A Search for Blood Biomarkers for Autism: Peptoids

Sayed ZamanUmar Yazdani,…, Laura Hewitson & Dwight C. German
Scientific Reports 2016; 6(19164) http://dx.doi.org:/10.1038/srep19164

Autism spectrum disorder (ASD) is a neurodevelopmental disorder characterized by impairments in social interaction and communication, and restricted, repetitive patterns of behavior. In order to identify individuals with ASD and initiate interventions at the earliest possible age, biomarkers for the disorder are desirable. Research findings have identified widespread changes in the immune system in children with autism, at both systemic and cellular levels. In an attempt to find candidate antibody biomarkers for ASD, highly complex libraries of peptoids (oligo-N-substituted glycines) were screened for compounds that preferentially bind IgG from boys with ASD over typically developing (TD) boys. Unexpectedly, many peptoids were identified that preferentially bound IgG from TD boys. One of these peptoids was studied further and found to bind significantly higher levels (>2-fold) of the IgG1 subtype in serum from TD boys (n = 60) compared to ASD boys (n = 74), as well as compared to older adult males (n = 53). Together these data suggest that ASD boys have reduced levels (>50%) of an IgG1 antibody, which resembles the level found normally with advanced age. In this discovery study, the ASD1 peptoid was 66% accurate in predicting ASD.

….

Peptoid libraries have been used previously to search for autoantibodies for neurodegenerative diseases19 and for systemic lupus erythematosus (SLE)21. In the case of SLE, peptoids were identified that could identify subjects with the disease and related syndromes with moderate sensitivity (70%) and excellent specificity (97.5%). Peptoids were used to measure IgG levels from both healthy subjects and SLE patients. Binding to the SLE-peptoid was significantly higher in SLE patients vs. healthy controls. The IgG bound to the SLE-peptoid was found to react with several autoantigens, suggesting that the peptoids are capable of interacting with multiple, structurally similar molecules. These data indicate that IgG binding to peptoids can identify subjects with high levels of pathogenic autoantibodies vs. a single antibody.

In the present study, the ASD1 peptoid binds significantly lower levels of IgG1 in ASD males vs. TD males. This finding suggests that the ASD1 peptoid recognizes antibody(-ies) of an IgG1 subtype that is (are) significantly lower in abundance in the ASD males vs. TD males. Although a previous study14 has demonstrated lower levels of plasma IgG in ASD vs. TD children, here, we additionally quantified serum IgG levels in our individuals and found no difference in IgG between the two groups (data not shown). Furthermore, our IgG levels did not correlate with ASD1 binding levels, indicating that ASD1 does not bind IgG generically, and that the peptoid’s ability to differentiate between ASD and TD males is related to a specific antibody(-ies).

ASD subjects underwent a diagnostic evaluation using the ADOS and ADI-R, and application of the DSM-IV criteria prior to study inclusion. Only those subjects with a diagnosis of Autistic Disorder were included in the study. The ADOS is a semi-structured observation of a child’s behavior that allows examiners to observe the three core domains of ASD symptoms: reciprocal social interaction, communication, and restricted and repetitive behaviors1. When ADOS subdomain scores were compared with peptoid binding, the only significant relationship was with Social Interaction. However, the positive correlation would suggest that lower peptoid binding is associated with better social interaction, not poorer social interaction as anticipated.

The ADI-R is a structured parental interview that measures the core features of ASD symptoms in the areas of reciprocal social interaction, communication and language, and patterns of behavior. Of the three ADI-R subdomains, only the Communication domain was related to ASD1 peptoid binding, and this correlation was negative suggesting that low peptoid binding is associated with greater communication problems. These latter data are similar to the findings of Heuer et al.14 who found that children with autism with low levels of plasma IgG have high scores on the Aberrant Behavior Checklist (p < 0.0001). Thus, peptoid binding to IgG1 may be useful as a severity marker for ASD allowing for further characterization of individuals, but further research is needed.

It is interesting that in serum samples from older men, the ASD1 binding is similar to that in the ASD boys. This is consistent with the observation that with aging there is a reduction in the strength of the immune system, and the changes are gender-specific25. Recent studies using parabiosis26, in which blood from young mice reverse age-related impairments in cognitive function and synaptic plasticity in old mice, reveal that blood constituents from young subjects may contain important substances for maintaining neuronal functions. Work is in progress to identify the antibody/antibodies that are differentially binding to the ASD1 peptoid, which appear as a single band on the electrophoresis gel (Fig. 4).

……..

The ADI-R is a structured parental interview that measures the core features of ASD symptoms in the areas of reciprocal social interaction, communication and language, and patterns of behavior. Of the three ADI-R subdomains, only the Communication domain was related to ASD1 peptoid binding, and this correlation was negative suggesting that low peptoid binding is associated with greater communication problems. These latter data are similar to the findings of Heuer et al.14 who found that children with autism with low levels of plasma IgG have high scores on the Aberrant Behavior Checklist (p < 0.0001). Thus, peptoid binding to IgG1 may be useful as a severity marker for ASD allowing for further characterization of individuals, but further research is needed.


  • Titration of IgG binding to ASD1 using serum pooled from 10 TD males and 10 ASD males demonstrates ASD1’s ability to differentiate between the two groups. (B)Detecting IgG1 subclass instead of total IgG amplifies this differentiation. (C) IgG1 binding of individual ASD (n=74) and TD (n=60) male serum samples (1:100 dilution) to ASD1 significantly differs with TD>ASD. In addition, IgG1 binding of older adult male (AM) serum samples (n=53) to ASD1 is significantly lower than TD males, and not different from ASD males. The three groups were compared with a Kruskal-Wallis ANOVA, H = 10.1781, p<0.006. **p<0.005. Error bars show SEM. (D) Receiver-operating characteristic curve for ASD1’s ability to discriminate between ASD and TD males.

http://www.nature.com/article-assets/npg/srep/2016/160114/srep19164/images_hires/m685/srep19164-f3.jpg


Association between peptoid binding and ADOS and ADI-R subdomains

Higher scores in any domain on the ADOS and ADI-R are indicative of more abnormal behaviors and/or symptoms. Among ADOS subdomains, there was no significant relationship between Communication and peptoid binding (z = 0.04, p = 0.966), Communication + Social interaction (z = 1.53, p = 0.127), or Stereotyped Behaviors and Restrictive Interests (SBRI) (z = 0.46, p = 0.647). Higher scores on the Social Interaction domain were significantly associated with higher peptoid binding (z = 2.04, p = 0.041).

Among ADI-R subdomains, higher scores on the Communication domain were associated with lower levels of peptoid binding (z = −2.28, p = 0.023). There was not a significant relationship between Social Interaction (z = 0.07, p = 0.941) or Restrictive/Repetitive Stereotyped Behaviors (z = −1.40, p = 0.162) and peptoid binding.


Computational Model Finds New Protein-Protein Interactions

Researchers at University of Pittsburgh have discovered 500 new protein-protein interactions (PPIs) associated with genes linked to schizophrenia.

http://www.technologynetworks.com/Proteomics/news.aspx?id=190995

Using a computational model they developed, researchers at the University of Pittsburgh School of Medicine have discovered more than 500 new protein-protein interactions (PPIs) associated with genes linked to schizophrenia. The findings, published online in npj Schizophrenia, a Nature Publishing Group journal, could lead to greater understanding of the biological underpinnings of this mental illness, as well as point the way to treatments.

There have been many genome-wide association studies (GWAS) that have identified gene variants associated with an increased risk for schizophrenia, but in most cases there is little known about the proteins that these genes make, what they do and how they interact, said senior investigator Madhavi Ganapathiraju, Ph.D., assistant professor of biomedical informatics, Pitt School of Medicine.

“GWAS studies and other research efforts have shown us what genes might be relevant in schizophrenia,” she said. “What we have done is the next step. We are trying to understand how these genes relate to each other, which could show us the biological pathways that are important in the disease.”

Each gene makes proteins and proteins typically interact with each other in a biological process. Information about interacting partners can shed light on the role of a gene that has not been studied, revealing pathways and biological processes associated with the disease and also its relation to other complex diseases.

Dr. Ganapathiraju’s team developed a computational model called High-Precision Protein Interaction Prediction (HiPPIP) and applied it to discover PPIs of schizophrenia-linked genes identified through GWAS, as well as historically known risk genes. They found 504 never-before known PPIs, and noted also that while schizophrenia-linked genes identified historically and through GWAS had little overlap, the model showed they shared more than 100 common interactors.

“We can infer what the protein might do by checking out the company it keeps,” Dr. Ganapathiraju explained. “For example, if I know you have many friends who play hockey, it could mean that you are involved in hockey, too. Similarly, if we see that an unknown protein interacts with multiple proteins involved in neural signaling, for example, there is a high likelihood that the unknown entity also is involved in the same.”

Dr. Ganapathiraju and colleagues have drawn such inferences on protein function based on the PPIs of proteins, and made their findings available on a website Schizo-Pi. This information can be used by biologists to explore the schizophrenia interactome with the aim of understanding more about the disease or developing new treatment drugs.

Schizophrenia interactome with 504 novel protein–protein interactions

MK GanapathirajuM Thahir,…,  CE LoscherEM Bauer & S Chaparala
npj Schizophrenia 2016;  2(16012)   http://dx.doi.org:/10.1038/npjschz.2016.12

(GWAS) have revealed the role of rare and common genetic variants, but the functional effects of the risk variants remain to be understood. Protein interactome-based studies can facilitate the study of molecular mechanisms by which the risk genes relate to schizophrenia (SZ) genesis, but protein–protein interactions (PPIs) are unknown for many of the liability genes. We developed a computational model to discover PPIs, which is found to be highly accurate according to computational evaluations and experimental validations of selected PPIs. We present here, 365 novel PPIs of liability genes identified by the SZ Working Group of the Psychiatric Genomics Consortium (PGC). Seventeen genes that had no previously known interactions have 57 novel interactions by our method. Among the new interactors are 19 drug targets that are targeted by 130 drugs. In addition, we computed 147 novel PPIs of 25 candidate genes investigated in the pre-GWAS era. While there is little overlap between the GWAS genes and the pre-GWAS genes, the interactomes reveal that they largely belong to the same pathways, thus reconciling the apparent disparities between the GWAS and prior gene association studies. The interactome including 504 novel PPIs overall, could motivate other systems biology studies and trials with repurposed drugs. The PPIs are made available on a webserver, called Schizo-Pi at http://severus.dbmi.pitt.edu/schizo-pi with advanced search capabilities.

Schizophrenia (SZ) is a common, potentially severe psychiatric disorder that afflicts all populations.1 Gene mapping studies suggest that SZ is a complex disorder, with a cumulative impact of variable genetic effects coupled with environmental factors.2 As many as 38 genome-wide association studies (GWAS) have been reported on SZ out of a total of 1,750 GWAS publications on 1,087 traits or diseases reported in the GWAS catalog maintained by the National Human Genome Research Institute of USA3 (as of April 2015), revealing the common variants associated with SZ.4 The SZ Working Group of the Psychiatric Genomics Consortium (PGC) identified 108 genetic loci that likely confer risk for SZ.5 While the role of genetics has been clearly validated by this study, the functional impact of the risk variants is not well-understood.6,7 Several of the genes implicated by the GWAS have unknown functions and could participate in possibly hitherto unknown pathways.8 Further, there is little or no overlap between the genes identified through GWAS and ‘candidate genes’ proposed in the pre-GWAS era.9

Interactome-based studies can be useful in discovering the functional associations of genes. For example,disrupted in schizophrenia 1 (DISC1), an SZ related candidate gene originally had no known homolog in humans. Although it had well-characterized protein domains such as coiled-coil domains and leucine-zipper domains, its function was unknown.10,11 Once its protein–protein interactions (PPIs) were determined using yeast 2-hybrid technology,12 investigators successfully linked DISC1 to cAMP signaling, axon elongation, and neuronal migration, and accelerated the research pertaining to SZ in general, and DISC1 in particular.13 Typically such studies are carried out on known protein–protein interaction (PPI) networks, or as in the case of DISC1, when there is a specific gene of interest, its PPIs are determined by methods such as yeast 2-hybrid technology.

Knowledge of human PPI networks is thus valuable for accelerating discovery of protein function, and indeed, biomedical research in general. However, of the hundreds of thousands of biophysical PPIs thought to exist in the human interactome,14,15 <100,000 are known today (Human Protein Reference Database, HPRD16 and BioGRID17 databases). Gold standard experimental methods for the determination of all the PPIs in human interactome are time-consuming, expensive and may not even be feasible, as about 250 million pairs of proteins would need to be tested overall; high-throughput methods such as yeast 2-hybrid have important limitations for whole interactome determination as they have a low recall of 23% (i.e., remaining 77% of true interactions need to be determined by other means), and a low precision (i.e., the screens have to be repeated multiple times to achieve high selectivity).18,19Computational methods are therefore necessary to complete the interactome expeditiously. Algorithms have begun emerging to predict PPIs using statistical machine learning on the characteristics of the proteins, but these algorithms are employed predominantly to study yeast. Two significant computational predictions have been reported for human interactome; although they have had high false positive rates, these methods have laid the foundation for computational prediction of human PPIs.20,21

We have created a new PPI prediction model called High-Confidence Protein–Protein Interaction Prediction (HiPPIP) model. Novel interactions predicted with this model are making translational impact. For example, we discovered a PPI between OASL and DDX58, which on validation showed that an increased expression of OASL could boost innate immunity to combat influenza by activating the RIG-I pathway.22 Also, the interactome of the genes associated with congenital heart disease showed that the disease morphogenesis has a close connection with the structure and function of cilia.23Here, we describe the HiPPIP model and its application to SZ genes to construct the SZ interactome. After computational evaluations and experimental validations of selected novel PPIs, we present here 504 highly confident novel PPIs in the SZ interactome, shedding new light onto several uncharacterized genes that are associated with SZ.

We developed a computational model called HiPPIP to predict PPIs (see Methods and Supplementary File 1). The model has been evaluated by computational methods and experimental validations and is found to be highly accurate. Evaluations on a held-out test data showed a precision of 97.5% and a recall of 5%. 5% recall out of 150,000 to 600,000 estimated number of interactions in the human interactome corresponds to 7,500–30,000 novel PPIs in the whole interactome. Note that, it is likely that the real precision would be higher than 97.5% because in this test data, randomly paired proteins are treated as non-interacting protein pairs, whereas some of them may actually be interacting pairs with a small probability; thus, some of the pairs that are treated as false positives in test set are likely to be true but hitherto unknown interactions. In Figure 1a, we show the precision versus recall of our method on ‘hub proteins’ where we considered all pairs that received a score >0.5 by HiPPIP to be novel interactions. In Figure 1b, we show the number of true positives versus false positives observed in hub proteins. Both these figures also show our method to be superior in comparison to the prediction of membrane-receptor interactome by Qi et al’s.24 True positives versus false positives are also shown for individual hub proteins by our method in Figure 1cand by Qi et al’s.23 in Figure 1d. These evaluations showed that our predictions contain mostly true positives. Unlike in other domains where ranked lists are commonly used such as information retrieval, in PPI prediction the ‘false positives’ may actually be unlabeled instances that are indeed true interactions that are not yet discovered. In fact, such unlabeled pairs predicted as interactors of the hub gene HMGB1 (namely, the pairs HMGB1-KL and HMGB1-FLT1) were validated by experimental methods and found to be true PPIs (See the Figures e–g inSupplementary File 3). Thus, we concluded that the protein pairs that received a score of ⩾0.5 are highly confident to be true interactions. The pairs that receive a score less than but close to 0.5 (i.e., in the range of 0.4–0.5) may also contain several true PPIs; however, we cannot confidently say that all in this range are true PPIs. Only the PPIs predicted with a score >0.5 are included in the interactome.

Figure 1

http://www.nature.com/article-assets/npg/npjschz/2016/npjschz201612/images_hires/w582/npjschz201612-f1.jpg

Computational evaluation of predicted protein–protein interactions on hub proteins: (a) precision recall curve. (b) True positive versus false positives in ranked lists of hub type membrane receptors for our method and that by Qi et al. True positives versus false positives are shown for individual membrane receptors by our method in (c) and by Qi et al. in (d). Thick line is the average, which is also the same as shown in (b). Note:x-axis is recall in (a), whereas it is number of false positives in (bd). The range of y-axis is observed by varying the threshold from 1.0–0 in (a), and to 0.5 in (bd).

SZ interactome

By applying HiPPIP to the GWAS genes and Historic (pre-GWAS) genes, we predicted over 500 high confidence new PPIs adding to about 1400 previously known PPIs.

Schizophrenia interactome: network view of the schizophrenia interactome is shown as a graph, where genes are shown as nodes and PPIs as edges connecting the nodes. Schizophrenia-associated genes are shown as dark blue nodes, novel interactors as red color nodes and known interactors as blue color nodes. The source of the schizophrenia genes is indicated by its label font, where Historic genes are shown italicized, GWAS genes are shown in bold, and the one gene that is common to both is shown in italicized and bold. For clarity, the source is also indicated by the shape of the node (triangular for GWAS and square for Historic and hexagonal for both). Symbols are shown only for the schizophrenia-associated genes; actual interactions may be accessed on the web. Red edges are the novel interactions, whereas blue edges are known interactions. GWAS, genome-wide association studies of schizophrenia; PPI, protein–protein interaction.

http://www.nature.com/article-assets/npg/npjschz/2016/npjschz201612/images_hires/m685/npjschz201612-f2.jpg


Webserver of SZ interactome

We have made the known and novel interactions of all SZ-associated genes available on a webserver called Schizo-Pi, at the addresshttp://severus.dbmi.pitt.edu/schizo-pi. This webserver is similar to Wiki-Pi33 which presents comprehensive annotations of both participating proteins of a PPI side-by-side. The difference between Wiki-Pi which we developed earlier, and Schizo-Pi, is the inclusion of novel predicted interactions of the SZ genes into the latter.

Despite the many advances in biomedical research, identifying the molecular mechanisms underlying the disease is still challenging. Studies based on protein interactions were proven to be valuable in identifying novel gene associations that could shed new light on disease pathology.35 The interactome including more than 500 novel PPIs will help to identify pathways and biological processes associated with the disease and also its relation to other complex diseases. It also helps identify potential drugs that could be repurposed to use for SZ treatment.

Functional and pathway enrichment in SZ interactome

When a gene of interest has little known information, functions of its interacting partners serve as a starting point to hypothesize its own function. We computed statistically significant enrichment of GO biological process terms among the interacting partners of each of the genes using BinGO36 (see online at http://severus.dbmi.pitt.edu/schizo-pi).


Protein aggregation and aggregate toxicity: new insights into protein folding, misfolding diseases and biological evolution

Massimo Stefani · Christopher M. Dobson

Abstract The deposition of proteins in the form of amyloid fibrils and plaques is the characteristic feature of more than 20 degenerative conditions affecting either the central nervous system or a variety of peripheral tissues. As these conditions include Alzheimer’s, Parkinson’s and the prion diseases, several forms of fatal systemic amyloidosis, and at least one condition associated with medical intervention (haemodialysis), they are of enormous importance in the context of present-day human health and welfare. Much remains to be learned about the mechanism by which the proteins associated with these diseases aggregate and form amyloid structures, and how the latter affect the functions of the organs with which they are associated. A great deal of information concerning these diseases has emerged, however, during the past 5 years, much of it causing a number of fundamental assumptions about the amyloid diseases to be reexamined. For example, it is now apparent that the ability to form amyloid structures is not an unusual feature of the small number of proteins associated with these diseases but is instead a general property of polypeptide chains. It has also been found recently that aggregates of proteins not associated with amyloid diseases can impair the ability of cells to function to a similar extent as aggregates of proteins linked with specific neurodegenerative conditions. Moreover, the mature amyloid fibrils or plaques appear to be substantially less toxic than the prefibrillar aggregates that are their precursors. The toxicity of these early aggregates appears to result from an intrinsic ability to impair fundamental cellular processes by interacting with cellular membranes, causing oxidative stress and increases in free Ca2+ that eventually lead to apoptotic or necrotic cell death. The ‘new view’ of these diseases also suggests that other degenerative conditions could have similar underlying origins to those of the amyloidoses. In addition, cellular protection mechanisms, such as molecular chaperones and the protein degradation machinery, appear to be crucial in the prevention of disease in normally functioning living organisms. It also suggests some intriguing new factors that could be of great significance in the evolution of biological molecules and the mechanisms that regulate their behaviour.

The genetic information within a cell encodes not only the specific structures and functions of proteins but also the way these structures are attained through the process known as protein folding. In recent years many of the underlying features of the fundamental mechanism of this complex process and the manner in which it is regulated in living systems have emerged from a combination of experimental and theoretical studies [1]. The knowledge gained from these studies has also raised a host of interesting issues. It has become apparent, for example, that the folding and unfolding of proteins is associated with a whole range of cellular processes from the trafficking of molecules to specific organelles to the regulation of the cell cycle and the immune response. Such observations led to the inevitable conclusion that the failure to fold correctly, or to remain correctly folded, gives rise to many different types of biological malfunctions and hence to many different forms of disease [2]. In addition, it has been recognised recently that a large number of eukaryotic genes code for proteins that appear to be ‘natively unfolded’, and that proteins can adopt, under certain circumstances, highly organised multi-molecular assemblies whose structures are not specifically encoded in the amino acid sequence. Both these observations have raised challenging questions about one of the most fundamental principles of biology: the close relationship between the sequence, structure and function of proteins, as we discuss below [3].

It is well established that proteins that are ‘misfolded’, i.e. that are not in their functionally relevant conformation, are devoid of normal biological activity. In addition, they often aggregate and/or interact inappropriately with other cellular components leading to impairment of cell viability and eventually to cell death. Many diseases, often known as misfolding or conformational diseases, ultimately result from the presence in a living system of protein molecules with structures that are ‘incorrect’, i.e. that differ from those in normally functioning organisms [4]. Such diseases include conditions in which a specific protein, or protein complex, fails to fold correctly (e.g. cystic fibrosis, Marfan syndrome, amyotonic lateral sclerosis) or is not sufficiently stable to perform its normal function (e.g. many forms of cancer). They also include conditions in which aberrant folding behaviour results in the failure of a protein to be correctly trafficked (e.g. familial hypercholesterolaemia, α1-antitrypsin deficiency, and some forms of retinitis pigmentosa) [4]. The tendency of proteins to aggregate, often to give species extremely intractable to dissolution and refolding, is of course also well known in other circumstances. Examples include the formation of inclusion bodies during overexpression of heterologous proteins in bacteria and the precipitation of proteins during laboratory purification procedures. Indeed, protein aggregation is well established as one of the major difficulties associated with the production and handling of proteins in the biotechnology and pharmaceutical industries [5].

Considerable attention is presently focused on a group of protein folding diseases known as amyloidoses. In these diseases specific peptides or proteins fail to fold or to remain correctly folded and then aggregate (often with other components) so as to give rise to ‘amyloid’ deposits in tissue. Amyloid structures can be recognised because they possess a series of specific tinctorial and biophysical characteristics that reflect a common core structure based on the presence of highly organised βsheets [6]. The deposits in strictly defined amyloidoses are extracellular and can often be observed as thread-like fibrillar structures, sometimes assembled further into larger aggregates or plaques. These diseases include a range of sporadic, familial or transmissible degenerative diseases, some of which affect the brain and the central nervous system (e.g. Alzheimer’s and Creutzfeldt-Jakob diseases), while others involve peripheral tissues and organs such as the liver, heart and spleen (e.g. systemic amyloidoses and type II diabetes) [7, 8]. In other forms of amyloidosis, such as primary or secondary systemic amyloidoses, proteinaceous deposits are found in skeletal tissue and joints (e.g. haemodialysis-related amyloidosis) as well as in several organs (e.g. heart and kidney). Yet other components such as collagen, glycosaminoglycans and proteins (e.g. serum amyloid protein) are often present in the deposits protecting them against degradation [9, 10, 11]. Similar deposits to those in the amyloidoses are, however, found intracellularly in other diseases; these can be localised either in the cytoplasm, in the form of specialised aggregates known as aggresomes or as Lewy or Russell bodies or in the nucleus (see below).

The presence in tissue of proteinaceous deposits is a hallmark of all these diseases, suggesting a causative link between aggregate formation and pathological symptoms (often known as the amyloid hypothesis) [7, 8, 12]. At the present time the link between amyloid formation and disease is widely accepted on the basis of a large number of biochemical and genetic studies. The specific nature of the pathogenic species, and the molecular basis of their ability to damage cells, are however, the subject of intense debate [13, 14, 15, 16, 17, 18, 19, 20]. In neurodegenerative disorders it is very likely that the impairment of cellular function follows directly from the interactions of the aggregated proteins with cellular components [21, 22]. In the systemic non-neurological diseases, however, it is widely believed that the accumulation in vital organs of large amounts of amyloid deposits can by itself cause at least some of the clinical symptoms [23]. It is quite possible, however, that there are other more specific effects of aggregates on biochemical processes even in these diseases. The presence of extracellular or intracellular aggregates of a specific polypeptide molecule is a characteristic of all the 20 or so recognised amyloid diseases. The polypeptides involved include full length proteins (e.g. lysozyme or immunoglobulin light chains), biological peptides (amylin, atrial natriuretic factor) and fragments of larger proteins produced as a result of specific processing (e.g. the Alzheimer βpeptide) or of more general degradation [e.g. poly(Q) stretches cleaved from proteins with poly(Q) extensions such as huntingtin, ataxins and the androgen receptor]. The peptides and proteins associated with known amyloid diseases are listed in Table 1. In some cases the proteins involved have wild type sequences, as in sporadic forms of the diseases, but in other cases these are variants resulting from genetic mutations associated with familial forms of the diseases. In some cases both sporadic and familial diseases are associated with a given protein; in this case the mutational variants are usually associated with early-onset forms of the disease. In the case of the neurodegenerative diseases associated with the prion protein some forms of the diseases are transmissible. The existence of familial forms of a number of amyloid diseases has provided significant clues to the origins of the pathologies. For example, there are increasingly strong links between the age at onset of familial forms of disease and the effects of the mutations involved on the propensity of the affected proteins to aggregate in vitro. Such findings also support the link between the process of aggregation and the clinical manifestations of disease [24, 25].

The presence in cells of misfolded or aggregated proteins triggers a complex biological response. In the cytosol, this is referred to as the ‘heat shock response’ and in the endoplasmic reticulum (ER) it is known as the ‘unfolded protein response’. These responses lead to the expression, among others, of the genes for heat shock proteins (Hsp, or molecular chaperone proteins) and proteins involved in the ubiquitin-proteasome pathway [26]. The evolution of such complex biochemical machinery testifies to the fact that it is necessary for cells to isolate and clear rapidly and efficiently any unfolded or incorrectly folded protein as soon as it appears. In itself this fact suggests that these species could have a generally adverse effect on cellular components and cell viability. Indeed, it was a major step forward in understanding many aspects of cell biology when it was recognised that proteins previously associated only with stress, such as heat shock, are in fact crucial in the normal functioning of living systems. This advance, for example, led to the discovery of the role of molecular chaperones in protein folding and in the normal ‘housekeeping’ processes that are inherent in healthy cells [27, 28]. More recently a number of degenerative diseases, both neurological and systemic, have been linked to, or shown to be affected by, impairment of the ubiquitin-proteasome pathway (Table 2). The diseases are primarily associated with a reduction in either the expression or the biological activity of Hsps, ubiquitin, ubiquitinating or deubiquitinating enzymes and the proteasome itself, as we show below [29, 30, 31, 32], or even to the failure of the quality control mechanisms that ensure proper maturation of proteins in the ER. The latter normally leads to degradation of a significant proportion of polypeptide chains before they have attained their native conformations through retrograde translocation to the cytosol [33, 34].

….

It is now well established that the molecular basis of protein aggregation into amyloid structures involves the existence of ‘misfolded’ forms of proteins, i.e. proteins that are not in the structures in which they normally function in vivo or of fragments of proteins resulting from degradation processes that are inherently unable to fold [4, 7, 8, 36]. Aggregation is one of the common consequences of a polypeptide chain failing to reach or maintain its functional three-dimensional structure. Such events can be associated with specific mutations, misprocessing phenomena, aberrant interactions with metal ions, changes in environmental conditions, such as pH or temperature, or chemical modification (oxidation, proteolysis). Perturbations in the conformational properties of the polypeptide chain resulting from such phenomena may affect equilibrium 1 in Fig. 1 increasing the population of partially unfolded, or misfolded, species that are much more aggregation-prone than the native state.

Fig. 1 Overview of the possible fates of a newly synthesised polypeptide chain. The equilibrium ① between the partially folded molecules and the natively folded ones is usually strongly in favour of the latter except as a result of specific mutations, chemical modifications or partially destabilising solution conditions. The increased equilibrium populations of molecules in the partially or completely unfolded ensemble of structures are usually degraded by the proteasome; when this clearance mechanism is impaired, such species often form disordered aggregates or shift equilibrium ② towards the nucleation of pre-fibrillar assemblies that eventually grow into mature fibrils (equilibrium ③). DANGER! indicates that pre-fibrillar aggregates in most cases display much higher toxicity than mature fibrils. Heat shock proteins (Hsp) can suppress the appearance of pre-fibrillar assemblies by minimising the population of the partially folded molecules by assisting in the correct folding of the nascent chain and the unfolded protein response target incorrectly folded proteins for degradation.

……

Little is known at present about the detailed arrangement of the polypeptide chains themselves within amyloid fibrils, either those parts involved in the core βstrands or in regions that connect the various β-strands. Recent data suggest that the sheets are relatively untwisted and may in some cases at least exist in quite specific supersecondary structure motifs such as β-helices [6, 40] or the recently proposed µ-helix [41]. It seems possible that there may be significant differences in the way the strands are assembled depending on characteristics of the polypeptide chain involved [6, 42]. Factors including length, sequence (and in some cases the presence of disulphide bonds or post-translational modifications such as glycosylation) may be important in determining details of the structures. Several recent papers report structural models for amyloid fibrils containing different polypeptide chains, including the Aβ40 peptide, insulin and fragments of the prion protein, based on data from such techniques as cryo-electron microscopy and solid-state magnetic resonance spectroscopy [43, 44]. These models have much in common and do indeed appear to reflect the fact that the structures of different fibrils are likely to be variations on a common theme [40]. It is also emerging that there may be some common and highly organised assemblies of amyloid protofilaments that are not simply extended threads or ribbons. It is clear, for example, that in some cases large closed loops can be formed [45, 46, 47], and there may be specific types of relatively small spherical or ‘doughnut’ shaped structures that can result in at least some circumstances (see below).

…..

The similarity of some early amyloid aggregates with the pores resulting from oligomerisation of bacterial toxins and pore-forming eukaryotic proteins (see below) also suggest that the basic mechanism of protein aggregation into amyloid structures may not only be associated with diseases but in some cases could result in species with functional significance. Recent evidence indicates that a variety of micro-organisms may exploit the controlled aggregation of specific proteins (or their precursors) to generate functional structures. Examples include bacterial curli [52] and proteins of the interior fibre cells of mammalian ocular lenses, whose β-sheet arrays seem to be organised in an amyloid-like supramolecular order [53]. In this case the inherent stability of amyloid-like protein structure may contribute to the long-term structural integrity and transparency of the lens. Recently it has been hypothesised that amyloid-like aggregates of serum amyloid A found in secondary amyloidoses following chronic inflammatory diseases protect the host against bacterial infections by inducing lysis of bacterial cells [54]. One particularly interesting example is a ‘misfolded’ form of the milk protein α-lactalbumin that is formed at low pH and trapped by the presence of specific lipid molecules [55]. This form of the protein has been reported to trigger apoptosis selectively in tumour cells providing evidence for its importance in protecting infants from certain types of cancer [55]. ….

Amyloid formation is a generic property of polypeptide chains ….

It is clear that the presence of different side chains can influence the details of amyloid structures, particularly the assembly of protofibrils, and that they give rise to the variations on the common structural theme discussed above. More fundamentally, the composition and sequence of a peptide or protein affects profoundly its propensity to form amyloid structures under given conditions (see below).

Because the formation of stable protein aggregates of amyloid type does not normally occur in vivo under physiological conditions, it is likely that the proteins encoded in the genomes of living organisms are endowed with structural adaptations that mitigate against aggregation under these conditions. A recent survey involving a large number of structures of β-proteins highlights several strategies through which natural proteins avoid intermolecular association of β-strands in their native states [65].  Other surveys of protein databases indicate that nature disfavours sequences of alternating polar and nonpolar residues, as well as clusters of several consecutive hydrophobic residues, both of which enhance the tendency of a protein to aggregate prior to becoming completely folded [66, 67].

……

Precursors of amyloid fibrils can be toxic to cells

It was generally assumed until recently that the proteinaceous aggregates most toxic to cells are likely to be mature amyloid fibrils, the form of aggregates that have been commonly detected in pathological deposits. It therefore appeared probable that the pathogenic features underlying amyloid diseases are a consequence of the interaction with cells of extracellular deposits of aggregated material. As well as forming the basis for understanding the fundamental causes of these diseases, this scenario stimulated the exploration of therapeutic approaches to amyloidoses that focused mainly on the search for molecules able to impair the growth and deposition of fibrillar forms of aggregated proteins. ….

Structural basis and molecular features of amyloid toxicity

The presence of toxic aggregates inside or outside cells can impair a number of cell functions that ultimately lead to cell death by an apoptotic mechanism [95, 96]. Recent research suggests, however, that in most cases initial perturbations to fundamental cellular processes underlie the impairment of cell function induced by aggregates of disease-associated polypeptides. Many pieces of data point to a central role of modifications to the intracellular redox status and free Ca2+ levels in cells exposed to toxic aggregates [45, 89, 97, 98, 99, 100, 101]. A modification of the intracellular redox status in such cells is associated with a sharp increase in the quantity of reactive oxygen species (ROS) that is reminiscent of the oxidative burst by which leukocytes destroy invading foreign cells after phagocytosis. In addition, changes have been observed in reactive nitrogen species, lipid peroxidation, deregulation of NO metabolism [97], protein nitrosylation [102] and upregulation of heme oxygenase-1, a specific marker of oxidative stress [103]. ….

Results have recently been reported concerning the toxicity towards cultured cells of aggregates of poly(Q) peptides which argues against a disease mechanism based on specific toxic features of the aggregates. These results indicate that there is a close relationship between the toxicity of proteins with poly(Q) extensions and their nuclear localisation. In addition they support the hypotheses that the toxicity of poly(Q) aggregates can be a consequence of altered interactions with nuclear coactivator or corepressor molecules including p53, CBP, Sp1 and TAF130 or of the interaction with transcription factors and nuclear coactivators, such as CBP, endowed with short poly(Q) stretches ([95] and references therein)…..

Concluding remarks
The data reported in the past few years strongly suggest that the conversion of normally soluble proteins into amyloid fibrils and the toxicity of small aggregates appearing during the early stages of the formation of the latter are common or generic features of polypeptide chains. Moreover, the molecular basis of this toxicity also appears to display common features between the different systems that have so far been studied. The ability of many, perhaps all, natural polypeptides to ‘misfold’ and convert into toxic aggregates under suitable conditions suggests that one of the most important driving forces in the evolution of proteins must have been the negative selection against sequence changes that increase the tendency of a polypeptide chain to aggregate. Nevertheless, as protein folding is a stochastic process, and no such process can be completely infallible, misfolded proteins or protein folding intermediates in equilibrium with the natively folded molecules must continuously form within cells. Thus mechanisms to deal with such species must have co-evolved with proteins. Indeed, it is clear that misfolding, and the associated tendency to aggregate, is kept under control by molecular chaperones, which render the resulting species harmless assisting in their refolding, or triggering their degradation by the cellular clearance machinery [166, 167, 168, 169, 170, 171, 172, 173, 175, 177, 178].

Misfolded and aggregated species are likely to owe their toxicity to the exposure on their surfaces of regions of proteins that are buried in the interior of the structures of the correctly folded native states. The exposure of large patches of hydrophobic groups is likely to be particularly significant as such patches favour the interaction of the misfolded species with cell membranes [44, 83, 89, 90, 91, 93]. Interactions of this type are likely to lead to the impairment of the function and integrity of the membranes involved, giving rise to a loss of regulation of the intracellular ion balance and redox status and eventually to cell death. In addition, misfolded proteins undoubtedly interact inappropriately with other cellular components, potentially giving rise to the impairment of a range of other biological processes. Under some conditions the intracellular content of aggregated species may increase directly, due to an enhanced propensity of incompletely folded or misfolded species to aggregate within the cell itself. This could occur as the result of the expression of mutational variants of proteins with decreased stability or cooperativity or with an intrinsically higher propensity to aggregate. It could also occur as a result of the overproduction of some types of protein, for example, because of other genetic factors or other disease conditions, or because of perturbations to the cellular environment that generate conditions favouring aggregation, such as heat shock or oxidative stress. Finally, the accumulation of misfolded or aggregated proteins could arise from the chaperone and clearance mechanisms becoming overwhelmed as a result of specific mutant phenotypes or of the general effects of ageing [173, 174].

The topics discussed in this review not only provide a great deal of evidence for the ‘new view’ that proteins have an intrinsic capability of misfolding and forming structures such as amyloid fibrils but also suggest that the role of molecular chaperones is even more important than was thought in the past. The role of these ubiquitous proteins in enhancing the efficiency of protein folding is well established [185]. It could well be that they are at least as important in controlling the harmful effects of misfolded or aggregated proteins as in enhancing the yield of functional molecules.


Nutritional Status is Associated with Faster Cognitive Decline and Worse Functional Impairment in the Progression of Dementia: The Cache County Dementia Progression Study1

Sanders, Chelseaa | Behrens, Stephaniea | Schwartz, Sarahb | Wengreen, Heidic | Corcoran, Chris D.b; d | Lyketsos, Constantine G.e | Tschanz, JoAnn T.a; d;
Journal of Alzheimer’s Disease 2016; 52(1):33-42,     http://content.iospress.com/articles/journal-of-alzheimers-disease/jad150528   http://dx.doi.org:/10.3233/JAD-150528

Nutritional status may be a modifiable factor in the progression of dementia. We examined the association of nutritional status and rate of cognitive and functional decline in a U.S. population-based sample. Study design was an observational longitudinal study with annual follow-ups up to 6 years of 292 persons with dementia (72% Alzheimer’s disease, 56% female) in Cache County, UT using the Mini-Mental State Exam (MMSE), Clinical Dementia Rating Sum of Boxes (CDR-sb), and modified Mini Nutritional Assessment (mMNA). mMNA scores declined by approximately 0.50 points/year, suggesting increasing risk for malnutrition. Lower mMNA score predicted faster rate of decline on the MMSE at earlier follow-up times, but slower decline at later follow-up times, whereas higher mMNA scores had the opposite pattern (mMNA by time β= 0.22, p = 0.017; mMNA by time2 β= –0.04, p = 0.04). Lower mMNA score was associated with greater impairment on the CDR-sb over the course of dementia (β= 0.35, p <  0.001). Assessment of malnutrition may be useful in predicting rates of progression in dementia and may provide a target for clinical intervention.


Shared Genetic Risk Factors for Late-Life Depression and Alzheimer’s Disease

Ye, Qing | Bai, Feng* | Zhang, Zhijun
Journal of Alzheimer’s Disease 2016; 52(1): 1-15.                                      http://dx.doi.org:/10.3233/JAD-151129

Background: Considerable evidence has been reported for the comorbidity between late-life depression (LLD) and Alzheimer’s disease (AD), both of which are very common in the general elderly population and represent a large burden on the health of the elderly. The pathophysiological mechanisms underlying the link between LLD and AD are poorly understood. Because both LLD and AD can be heritable and are influenced by multiple risk genes, shared genetic risk factors between LLD and AD may exist. Objective: The objective is to review the existing evidence for genetic risk factors that are common to LLD and AD and to outline the biological substrates proposed to mediate this association. Methods: A literature review was performed. Results: Genetic polymorphisms of brain-derived neurotrophic factor, apolipoprotein E, interleukin 1-beta, and methylenetetrahydrofolate reductase have been demonstrated to confer increased risk to both LLD and AD by studies examining either LLD or AD patients. These results contribute to the understanding of pathophysiological mechanisms that are common to both of these disorders, including deficits in nerve growth factors, inflammatory changes, and dysregulation mechanisms involving lipoprotein and folate. Other conflicting results have also been reviewed, and few studies have investigated the effects of the described polymorphisms on both LLD and AD. Conclusion: The findings suggest that common genetic pathways may underlie LLD and AD comorbidity. Studies to evaluate the genetic relationship between LLD and AD may provide insights into the molecular mechanisms that trigger disease progression as the population ages.


Association of Vitamin B12, Folate, and Sulfur Amino Acids With Brain Magnetic Resonance Imaging Measures in Older Adults: A Longitudinal Population-Based Study

B Hooshmand, F Mangialasche, G Kalpouzos…, et al.
AMA Psychiatry. Published online April 27, 2016.    http://dx.doi.org:/10.1001/jamapsychiatry.2016.0274

Importance  Vitamin B12, folate, and sulfur amino acids may be modifiable risk factors for structural brain changes that precede clinical dementia.

Objective  To investigate the association of circulating levels of vitamin B12, red blood cell folate, and sulfur amino acids with the rate of total brain volume loss and the change in white matter hyperintensity volume as measured by fluid-attenuated inversion recovery in older adults.

Design, Setting, and Participants  The magnetic resonance imaging subsample of the Swedish National Study on Aging and Care in Kungsholmen, a population-based longitudinal study in Stockholm, Sweden, was conducted in 501 participants aged 60 years or older who were free of dementia at baseline. A total of 299 participants underwent repeated structural brain magnetic resonance imaging scans from September 17, 2001, to December 17, 2009.

Main Outcomes and Measures  The rate of brain tissue volume loss and the progression of total white matter hyperintensity volume.

Results  In the multi-adjusted linear mixed models, among 501 participants (300 women [59.9%]; mean [SD] age, 70.9 [9.1] years), higher baseline vitamin B12 and holotranscobalamin levels were associated with a decreased rate of total brain volume loss during the study period: for each increase of 1 SD, β (SE) was 0.048 (0.013) for vitamin B12 (P < .001) and 0.040 (0.013) for holotranscobalamin (P = .002). Increased total homocysteine levels were associated with faster rates of total brain volume loss in the whole sample (β [SE] per 1-SD increase, –0.035 [0.015]; P = .02) and with the progression of white matter hyperintensity among participants with systolic blood pressure greater than 140 mm Hg (β [SE] per 1-SD increase, 0.000019 [0.00001]; P = .047). No longitudinal associations were found for red blood cell folate and other sulfur amino acids.

Conclusions and Relevance  This study suggests that both vitamin B12 and total homocysteine concentrations may be related to accelerated aging of the brain. Randomized clinical trials are needed to determine the importance of vitamin B12supplementation on slowing brain aging in older adults.


Notes from Kurzweill

This vitamin stops the aging process in organs, say Swiss researchers

A potential breakthrough for regenerative medicine, pending further studies

http://www.kurzweilai.net/this-vitamin-stops-the-aging-process-in-organs-say-swiss-researchers

Improved muscle stem cell numbers and muscle function in NR-treated aged mice: Newly regenerated muscle fibers 7 days after muscle damage in aged mice (left: control group; right: fed NR). (Scale bar = 50 μm). (credit: Hongbo Zhang et al./Science) http://www.kurzweilai.net/images/improved-muscle-fibers.png

EPFL researchers have restored the ability of mice organs to regenerate and extend life by simply administering nicotinamide riboside (NR) to them.

NR has been shown in previous studies to be effective in boosting metabolism and treating a number of degenerative diseases. Now, an article by PhD student Hongbo Zhang published in Science also describes the restorative effects of NR on the functioning of stem cells for regenerating organs.

As in all mammals, as mice age, the regenerative capacity of certain organs (such as the liver and kidneys) and muscles (including the heart) diminishes. Their ability to repair them following an injury is also affected. This leads to many of the disorders typical of aging.

Mitochondria —> stem cells —> organs

To understand how the regeneration process deteriorates with age, Zhang teamed up with colleagues from ETH Zurich, the University of Zurich, and universities in Canada and Brazil. By using several biomarkers, they were able to identify the molecular chain that regulates how mitochondria — the “powerhouse” of the cell — function and how they change with age. “We were able to show for the first time that their ability to function properly was important for stem cells,” said Auwerx.

Under normal conditions, these stem cells, reacting to signals sent by the body, regenerate damaged organs by producing new specific cells. At least in young bodies. “We demonstrated that fatigue in stem cells was one of the main causes of poor regeneration or even degeneration in certain tissues or organs,” said Zhang.

How to revitalize stem cells

Which is why the researchers wanted to “revitalize” stem cells in the muscles of elderly mice. And they did so by precisely targeting the molecules that help the mitochondria to function properly. “We gave nicotinamide riboside to 2-year-old mice, which is an advanced age for them,” said Zhang.

“This substance, which is close to vitamin B3, is a precursor of NAD+, a molecule that plays a key role in mitochondrial activity. And our results are extremely promising: muscular regeneration is much better in mice that received NR, and they lived longer than the mice that didn’t get it.”

Parallel studies have revealed a comparable effect on stem cells of the brain and skin. “This work could have very important implications in the field of regenerative medicine,” said Auwerx. This work on the aging process also has potential for treating diseases that can affect — and be fatal — in young people, like muscular dystrophy (myopathy).

So far, no negative side effects have been observed following the use of NR, even at high doses. But while it appears to boost the functioning of all cells, it could include pathological ones, so further in-depth studies are required.

Abstract of NAD+ repletion improves mitochondrial and stem cell function and enhances life span in mice

Adult stem cells (SCs) are essential for tissue maintenance and regeneration yet are susceptible to senescence during aging. We demonstrate the importance of the amount of the oxidized form of cellular nicotinamide adenine dinucleotide (NAD+) and its impact on mitochondrial activity as a pivotal switch to modulate muscle SC (MuSC) senescence. Treatment with the NAD+ precursor nicotinamide riboside (NR) induced the mitochondrial unfolded protein response (UPRmt) and synthesis of prohibitin proteins, and this rejuvenated MuSCs in aged mice. NR also prevented MuSC senescence in the Mdx mouse model of muscular dystrophy. We furthermore demonstrate that NR delays senescence of neural SCs (NSCs) and melanocyte SCs (McSCs), and increased mouse lifespan. Strategies that conserve cellular NAD+ may reprogram dysfunctional SCs and improve lifespan in mammals.

references:

Hongbo Zhang, Dongryeol Ryu, Yibo Wu, Karim Gariani, Xu Wang, Peiling Luan, Davide D’amico, Eduardo R. Ropelle, Matthias P. Lutolf, Ruedi Aebersold, Kristina Schoonjans, Keir J. Menzies, Johan Auwerx. NAD repletion improves mitochondrial and stem cell function and enhances lifespan in mice. Science, 2016 DOI: 10.1126/science.aaf2693


Enhancer–promoter interactions are encoded by complex genomic signatures on looping chromatin

Sean WhalenRebecca M Truty & Katherine S Pollard
Nature Genetics 2016; 48:488–496
    
    doi:10.1038/ng.3539

Discriminating the gene target of a distal regulatory element from other nearby transcribed genes is a challenging problem with the potential to illuminate the causal underpinnings of complex diseases. We present TargetFinder, a computational method that reconstructs regulatory landscapes from diverse features along the genome. The resulting models accurately predict individual enhancer–promoter interactions across multiple cell lines with a false discovery rate up to 15 times smaller than that obtained using the closest gene. By evaluating the genomic features driving this accuracy, we uncover interactions between structural proteins, transcription factors, epigenetic modifications, and transcription that together distinguish interacting from non-interacting enhancer–promoter pairs. Most of this signature is not proximal to the enhancers and promoters but instead decorates the looping DNA. We conclude that complex but consistent combinations of marks on the one-dimensional genome encode the three-dimensional structure of fine-scale regulatory interactions.

Read Full Post »

A Reconstructed View of Personalized Medicine

Author: Larry H. Bernstein, MD, FCAP


There has always been Personalized Medicine if you consider the time a physician spends with a patient, which has dwindled. But the current recognition of personalized medicine refers to breakthrough advances in technological innovation in diagnostics and treatment that differentiates subclasses within diagnoses that are amenable to relapse eluding therapies.  There are just a few highlights to consider:

  1. We live in a world with other living beings that are adapting to a changing environmental stresses.
  2. Nutritional resources that have been available and made plentiful over generations are not abundant in some climates.
  3. Despite the huge impact that genomics has had on biological progress over the last century, there is a huge contribution not to be overlooked in epigenetics, metabolomics, and pathways analysis.

A Reconstructed View of Personalized Medicine

There has been much interest in ‘junk DNA’, non-coding areas of our DNA are far from being without function. DNA has two basic categories of nitrogenous bases: the purines (adenine [A] and guanine [G]), and the pyrimidines (cytosine [C], thymine [T], and  no uracil [U]),  while RNA contains only A, G, C, and U (no T).  The Watson-Crick proposal set the path of molecular biology for decades into the 21st century, culminating in the Human Genome Project.

There is no uncertainty about the importance of “Junk DNA”.  It is both an evolutionary remnant, and it has a role in cell regulation.  Further, the role of histones in their relationship the oligonucleotide sequences is not understood.  We now have a large output of research on noncoding RNA, including siRNA, miRNA, and others with roles other than transcription. This requires major revision of our model of cell regulatory processes.  The classic model is solely transcriptional.

  • DNA-> RNA-> Amino Acid in a protein.

Redrawn we have

  • DNA-> RNA-> DNA and
  • DNA->RNA-> protein-> DNA.

Neverthess, there were unrelated discoveries that took on huge importance.  For example, since the 1920s, the work of Warburg and Meyerhoff, followed by that of Krebs, Kaplan, Chance, and others built a solid foundation in the knowledge of enzymes, coenzymes, adenine and pyridine nucleotides, and metabolic pathways, not to mention the importance of Fe3+, Cu2+, Zn2+, and other metal cofactors.  Of huge importance was the work of Jacob, Monod and Changeux, and the effects of cooperativity in allosteric systems and of repulsion in tertiary structure of proteins related to hydrophobic and hydrophilic interactions, which involves the effect of one ligand on the binding or catalysis of another,  demonstrated by the end-product inhibition of the enzyme, L-threonine deaminase (Changeux 1961), L-isoleucine, which differs sterically from the reactant, L-threonine whereby the former could inhibit the enzyme without competing with the latter. The current view based on a variety of measurements (e.g., NMR, FRET, and single molecule studies) is a ‘‘dynamic’’ proposal by Cooper and Dryden (1984) that the distribution around the average structure changes in allostery affects the subsequent (binding) affinity at a distant site.

What else do we have to consider?  The measurement of free radicals has increased awareness of radical-induced impairment of the oxidative/antioxidative balance, essential for an understanding of disease progression.  Metal-mediated formation of free radicals causes various modifications to DNA bases, enhanced lipid peroxidation, and altered calcium and sulfhydryl homeostasis. Lipid peroxides, formed by the attack of radicals on polyunsaturated fatty acid residues of phospholipids, can further react with redox metals finally producing mutagenic and carcinogenic malondialdehyde, 4-hydroxynonenal and other exocyclic DNA adducts (etheno and/or propano adducts). The unifying factor in determining toxicity and carcinogenicity for all these metals is the generation of reactive oxygen and nitrogen species. Various studies have confirmed that metals activate signaling pathways and the carcinogenic effect of metals has been related to activation of mainly redox sensitive transcription factors, involving NF-kappaB, AP-1 and p53.

I have provided mechanisms explanatory for regulation of the cell that go beyond the classic model of metabolic pathways associated with the cytoplasm, mitochondria, endoplasmic reticulum, and lysosome, such as, the cell death pathways, expressed in apoptosis and repair.  Nevertheless, there is still a missing part of this discussion that considers the time and space interactions of the cell, cellular cytoskeleton and extracellular and intracellular substrate interactions in the immediate environment.

There is heterogeneity among cancer cells of expected identical type, which would be consistent with differences in phenotypic expression, aligned with epigenetics.  There is also heterogeneity in the immediate interstices between cancer cells.  Integration with genome-wide profiling data identified losses of specific genes on 4p14 and 5q13 that were enriched in grade 3 tumors with high microenvironmental diversity that also substratified patients into poor prognostic groups. In the case of breast cancer, there is interaction with estrogen , and we refer to an androgen-unresponsive prostate cancer.

Finally,  the interaction between enzyme and substrates may be conditionally unidirectional in defining the activity within the cell.  The activity of the cell is dynamically interacting and at high rates of activity.  In a study of the pyruvate kinase (PK) reaction the catalytic activity of the PK reaction was reversed to the thermodynamically unfavorable direction in a muscle preparation by a specific inhibitor. Experiments found that in there were differences in the active form of pyruvate kinase that were clearly related to the environmental condition of the assay – glycolitic or glyconeogenic. The conformational changes indicated by differential regulatory response were used to present a dynamic conformational model functioning at the active site of the enzyme. In the model, the interaction of the enzyme active site with its substrates is described concluding that induced increase in the vibrational energy levels of the active site decreases the energetic barrier for substrate induced changes at the site. Another example is the inhibition of H4 lactate dehydrogenase, but not the M4, by high concentrations of pyruvate. An investigation of the inhibition revealed that a covalent bond was formed between the nicotinamide ring of the NAD+ and the enol form of pyruvate.  The isoenzymes of isocitrate dehydrogenase, IDH1 and IDH2 mutations occur in gliomas and in acute myeloid leukemias with normal karyotype. IDH1 and IDH2 mutations are remarkably specific to codons that encode conserved functionally important arginines in the active site of each enzyme. In this case, there is steric hindrance by Asp279 where the isocitrate substrate normally forms hydrogen bonds with Ser94.

Personalized medicine has been largely viewed from a lens of genomics.  But genomics is only the reading frame.  The living activities of cell processes are dynamic and occur at rapid rates.  We have to keep in mind that personalized in reference to genotype is not complete without reconciliation of phenotype, which is the reference to expressed differences in outcomes.


Read Full Post »

Irreconciliable Dissonance in Physical Space and Cellular Metabolic Conception

Irreconciliable Dissonance in Physical Space and Cellular Metabolic Conception

Curator: Larry H. Bernstein, MD, FCAP

Pasteur Effect – Warburg Effect – What its history can teach us today. 

José Eduardo de Salles Roselino

The Warburg effect, in reality the “Pasteur-effect” was the first example of metabolic regulation described. A decrease in the carbon flux originated at the sugar molecule towards the end of the catabolic pathway, with ethanol and carbon dioxide observed when yeast cells were transferred from an anaerobic environmental condition to an aerobic one. In Pasteur´s studies, sugar metabolism was measured mainly by the decrease of sugar concentration in the yeast growth media observed after a measured period of time. The decrease of the sugar concentration in the media occurs at great speed in yeast grown in anaerobiosis (oxygen deficient) and its speed was greatly reduced by the transfer of the yeast culture to an aerobic condition. This finding was very important for the wine industry of France in Pasteur’s time, since most of the undesirable outcomes in the industrial use of yeast were perceived when yeasts cells took a very long time to create, a rather selective anaerobic condition. This selective culture media was characterized by the higher carbon dioxide levels produced by fast growing yeast cells and by a higher alcohol content in the yeast culture media.

However, in biochemical terms, this finding was required to understand Lavoisier’s results indicating that chemical and biological oxidation of sugars produced the same calorimetric (heat generation) results. This observation requires a control mechanism (metabolic regulation) to avoid burning living cells by fast heat released by the sugar biological oxidative processes (metabolism). In addition, Lavoisier´s results were the first indications that both processes happened inside similar thermodynamics limits. In much resumed form, these observations indicate the major reasons that led Warburg to test failure in control mechanisms in cancer cells in comparison with the ones observed in normal cells.

[It might be added that the availability of O2 and CO2 and climatic conditions over 750 million years that included volcanic activity, tectonic movements of the earth crust, and glaciation, and more recently the use of carbon fuels and the extensive deforestation of our land masses have had a large role in determining the biological speciation over time, in sea and on land. O2 is generated by plants utilizing energy from the sun and conversion of CO2. Remove the plants and we tip the balance. A large source of CO2 is from beneath the earth’s surface.]

Biology inside classical thermodynamics places some challenges to scientists. For instance, all classical thermodynamics must be measured in reversible thermodynamic conditions. In an isolated system, increase in P (pressure) leads to increase in V (volume), all this occurring in a condition in which infinitesimal changes in one affects in the same way the other, a continuum response. Not even a quantic amount of energy will stand beyond those parameters.

In a reversible system, a decrease in V, under same condition, will led to an increase in P. In biochemistry, reversible usually indicates a reaction that easily goes either from A to B or B to A. For instance, when it was required to search for an anti-ischemic effect of Chlorpromazine in an extra hepatic obstructed liver, it was necessary to use an adequate system of increased biliary system pressure in a reversible manner to exclude a direct effect of this drug over the biological system pressure inducer (bile secretion) in Braz. J. Med. Biol. Res 1989; 22: 889-893. Frequently, these details are jumped over by those who read biology in ATGC letters.

Very important observations can be made in this regard, when neutral mutations are taken into consideration since, after several mutations (not affecting previous activity and function), a last mutant may provide a new transcript RNA for a protein and elicit a new function. For an example, consider a Prion C from lamb getting similar to bovine Prion C while preserving  its normal role in the lamb when its ability to change Human Prion C is considered (Stanley Prusiner).

This observation is good enough, to confirm one of the most important contributions of Erwin Schrodinger in his What is Life:

“This little book arose from a course of public lectures, delivered by a theoretical physicist to an audience of about four hundred which did not substantially dwindle, though warned at the outset that the subject matter was a difficult one and that the lectures could not be termed popular, even though the physicist’s most dreaded weapon, mathematical deduction, would hardly be utilized. The reason for this was not that the subject was simple enough to be explained without mathematics, but rather that it was much too involved to be fully accessible to mathematics.”

After Hans Krebs, description of the cyclic nature of the citrate metabolism and after its followers described its requirement for aerobic catabolism two major lines of research started the search for the understanding of the mechanism of energy transfer that explains how ADP is converted into ATP. One followed the organic chemistry line of reasoning and therefore, searched for a mechanism that could explain how the breakdown of carbon-carbon link could have its energy transferred to ATP synthesis. One of the major leaders of this research line was Britton Chance. He took into account that relatively earlier in the series of Krebs cycle reactions, two carbon atoms of acetyl were released as carbon dioxide ( In fact, not the real acetyl carbons but those on the opposite side of citrate molecule). In stoichiometric terms, it was not important whether the released carbons were or were not exactly those originated from glucose carbons. His research aimed at to find out an intermediate proteinaceous intermediary that could act as an energy reservoir. The intermediary could store in a phosphorylated amino acid the energy of carbon-carbon bond breakdown. This activated amino acid could transfer its phosphate group to ADP producing ATP. A key intermediate involved in the transfer was identified by Kaplan and Lipmann at John Hopkins as acetyl coenzyme A, for which Fritz Lipmann received a Nobel Prize.

Alternatively, under possible influence of the excellent results of Hodgkin and Huxley a second line of research appears. The work of Hodgkin & Huxley indicated that the storage of electrical potential energy in transmembrane ionic asymmetries and presented the explanation for the change from resting to action potential in excitable cells. This second line of research, under the leadership of Peter Mitchell postulated a mechanism for the transfer of oxide/reductive power of organic molecules oxidation through electron transfer as the key for the energetic transfer mechanism required for ATP synthesis.
This diverted the attention from high energy (~P) phosphate bond to the transfer of electrons. During most of the time the harsh period of the two confronting points of view, Paul Boyer and followers attempted to act as a conciliatory third party, without getting good results, according to personal accounts (in L. A. or Latin America) heard from those few of our scientists who were able to follow the major scientific events held in USA, and who could present to us later. Paul  Boyer could present how the energy was transduced by a molecular machine that changes in conformation in a series of 3 steps while rotating in one direction in order to produce ATP and in opposite direction in order to produce ADP plus Pi from ATP (reversibility).

However, earlier, a victorious Peter Mitchell obtained the result in the conceptual dispute, over the Britton Chance point of view, after he used E. Coli mutants to show H+ gradients in the cell membrane and its use as energy source, for which he received a Nobel Prize. Somehow, this outcome represents such a blow to Chance’s previous work that somehow it seems to have cast a shadow over very important findings obtained during his earlier career that should not be affected by one or another form of energy transfer mechanism.  For instance, Britton Chance got the simple and rapid polarographic assay method of oxidative phosphorylation and the idea of control of energy metabolism that brings us back to Pasteur.

This metabolic alternative result seems to have been neglected in the recent years of obesity epidemics, which led to a search for a single molecular mechanism required for the understanding of the accumulation of chemical (adipose tissue) reserve in our body. It does not mean that here the role of central nervous system is neglected. In short, in respiring mitochondria the rate of electron transport linked to the rate of ATP production is determined primarily by the relative concentrations of ADP, ATP and phosphate in the external media (cytosol) and not by the concentration of respiratory substrate as pyruvate. Therefore, when the yield of ATP is high as it is in aerobiosis and the cellular use of ATP is not changed, the oxidation of pyruvate and therefore of glycolysis is quickly (without change in gene expression), throttled down to the resting state. The dependence of respiratory rate on ADP concentration is also seen in intact cells. A muscle at rest and using no ATP has a very low respiratory rate.   [When skeletal muscle is stressed by high exertion, lactic acid produced is released into the circulation and is metabolized aerobically by the heart at the end of the activity].

This respiratory control of metabolism will lead to preservation of body carbon reserves and in case of high caloric intake in a diet, also shows increase in fat reserves essential for our biological ancestors survival (Today for our obesity epidemics). No matter how important this observation is, it is only one focal point of metabolic control. We cannot reduce the problem of obesity to the existence of metabolic control. There are numerous other factors but on the other hand, we cannot neglect or remove this vital process in order to correct obesity. However, we cannot explain obesity ignoring this metabolic control. This topic is so neglected in modern times that we cannot follow major research lines of the past that were interrupted by the emerging molecular biology techniques and the vain belief that a dogmatic vision of biology could replace all previous knowledge by a new one based upon ATGC readings. For instance, in order to display bad consequences derived from the ignorance of these old scientific facts, we can take into account, for instance, how ion movements across membranes affects membrane protein conformation and therefore contradicts the wrong central dogma of molecular biology. This change in protein conformation (with unchanged amino acid sequence) and/or the lack of change in protein conformation is linked to the factors that affect vital processes as the heart beats. This modern ignorance could also explain some major pitfalls seen in new drugs clinical trials and in a small scale on bad medical practices.

The work of Britton Chance and of Peter Mitchell have deep and sound scientific roots that were made with excellent scientific techniques, supported by excellent scientific reasoning and that were produced in a large series of very important intermediary scientific results. Their sole difference was to aim at very different scientific explanations as their goals (They have different Teleology in their minds made by their previous experiences). When, with the use of mutants obtained in microorganisms P Mitchell´s goal was found to survive and B Chance to succumb to the experimental evidence, all those excellent findings of B Chance and followers were directed to the dustbin of scientific history as an example of lack of scientific consideration.  [On the one hand, the Mitchell model used a unicellular organism; on the other, Chance’s work was with eukaryotic cells, quite relevant to the discussion.]

We can resume the challenge faced by these two great scientists in the following form: The first conceptual unification in bioenergetics, achieved in the 1940s, is inextricably bound up with the name of Fritz Lipmann. Its central feature was the recognition that adenosine triphosphate, ATP, serves as a universal energy  “currency” much as money serves as economic currency. In a nutshell, the purpose of metabolism is to support the synthesis of ATP. In microorganisms, this is perfect! In humans or mammals, or vertebrates, by the same reason that we cannot consider that gene expression is equivalent to protein function (an acceptable error in the case of microorganisms) this oversimplifies the metabolic requirement with a huge error. However, in case our concern is ATP chemistry only, the metabolism produces ATP and the hydrolysis of ATP pays for the performance of almost, all kinds of works. It is possible to presume that to find out how the flow of metabolism (carbon flow) led to ATP production must be considered a major focal point of research of the two contenders. Consequently, what could be a minor fall of one of the contenders, in case we take into account all that was found during their entire life of research, the real failure in B Chance’s final goal was amplified far beyond what may be considered by reason!

Another aspect that must be taken into account: Both contenders have in the scientific past a very sound root. Metabolism may produce two forms of energy currency (I personally don´t like this expression*) and I use it here because it was used by both groups in order to express their findings. Together with simplistic thermodynamics, this expression conveys wrong ideas): The second kind of energy currency is the current of ions passing from one side of a membrane to the other. The P. Mitchell scientific root undoubtedly have the work of Hodgkin & Huxley, Huxley &  Huxley, Huxley & Simmons

*ATP is produced under the guidance of cell needs and not by its yield. When glucose yields only 2 ATPs per molecule it is oxidized at very high speed (anaerobiosis) as is required to match cellular needs. On the other hand, when it may yield (thermodynamic terms) 38 ATP the same molecule is oxidized at low speed. It would be similar to an investor choice its least money yield form for its investment (1940s to 1972) as a solid support. B. Chance had the enzymologists involved in clarifying how ATP could be produced directly from NADH + H+ oxidative reductive metabolic reactions or from the hydrolysis of an enolpyruvate intermediary. Both competitors had their work supported by different but, sound scientific roots and have produced very important scientific results while trying to present their hypothetical point of view.

Before the winning results of P. Mitchell were displayed, one line of defense used by B. Chance followers was to create a conflict between what would be expected by a restrictive role of proteins through its specificity ionic interactions and the general ability of ionic asymmetries that could be associated with mitochondrial ATP production. Chemical catalyzed protein activities do not have perfect specificity but an outstanding degree of selective interaction was presented by the lock and key model of enzyme interaction. A large group of outstanding “mitochondriologists” were able to show ATP synthesis associated with Na+, K+, Ca2+… asymmetries on mitochondrial membranes and any time they did this, P. Mitchell have to display the existence of antiporters that exchange X for hydrogen as the final common source of chemiosmotic energy used by mitochondria for ATP synthesis.

This conceptual battle has generated an enormous knowledge that was laid to rest, somehow discontinued in the form of scientific research, when the final E. Coli mutant studies presented the convincing final evidence in favor of P. Mitchell point of view.

Not surprisingly, a “wise anonymous” later, pointed out: “No matter what you are doing, you will always be better off in case you have a mutant”

(Principles of Medical Genetics T D Gelehrter & F.S. Collins chapter 7, 1990).

However, let’s take the example of a mechanical wristwatch. It clearly indicates when the watch is working in an acceptable way, that its normal functioning condition is not the result of one of its isolated components – or something that can be shown by a reductionist molecular view.  Usually it will be considered that it is working in an acceptable way, in case it is found that its accuracy falls inside a normal functional range, for instance, one or two standard deviations bellow or above the mean value for normal function, what depends upon the rigor wisely adopted. While, only when it has a faulty component (a genetic inborn error) we can indicate a single isolated piece as the cause of its failure (a reductionist molecular view).

We need to teach in medicine, first the major reasons why the watch works fine (not saying it is “automatic”). The functions may cross the reversible to irreversible regulatory limit change, faster than what we can imagine. Latter, when these ideas about normal are held very clear in the mind set of medical doctors (not medical technicians) we may address the inborn errors and what we may have learn from it. A modern medical technician may cause admiration when he uses an “innocent” virus to correct for a faulty gene (a rather impressive technological advance). However, in case the virus, later shows signals that indicate that it was not so innocent, a real medical doctor will be called upon to put things in correct place again.

Among the missing parts of normal evolution in biochemistry a lot about ion fluxes can be found. Even those oscillatory changes in Ca2+ that were shown to affect gene expression (C. De Duve) were laid to rest since, they clearly indicate a source of biological information that despite the fact that it does not change nucleotides order in the DNA, it shows an opposing flux of biological information against the dogma (DNA to RNA to proteins). Another, line has shown a hierarchy, on the use of mitochondrial membrane potential: First the potential is used for Ca2+ uptake and only afterwards, the potential is used for ADP conversion into ATP (A. L. Lehninger). In fact, the real idea of A. L. Lehninger was by far, more complex since according to him, mitochondria works like a buffer for intracellular calcium releasing it to outside in case of a deep decrease in cytosol levels or capturing it from cytosol when facing transient increase in Ca2+ load. As some of Krebs cycle dehydrogenases were activated by Ca2+, this finding was used to propose a new control factor in addition to the one of ADP (B. Chance). All this was discontinued with the wrong use of calculus (today we could indicate bioinformatics in a similar role) in biochemistry that has established less importance to a mitochondrial role after comparative kinetics that today are seen as faulty.

It is important to combat dogmatic reasoning and restore sound scientific foundations in basic medical courses that must urgently reverse the faulty trend that tries to impose a view that goes from the detail towards generalization instead of the correct form that goes from the general finding well understood towards its molecular details. The view that led to curious subjects as bioinformatics in medical courses as training in sequence finding activities can only be explained by its commercial value. The usual form of scientific thinking respects the limits of our ability to grasp new knowledge and relies on reproducibility of scientific results as a form to surpass lack of mathematical equation that defines relationship of variables and the determination of its functional domains. It also uses old scientific roots, as its sound support never replaces existing knowledge by dogmatic and/or wishful thinking. When the sequence of DNA was found as a technical advance to find amino acid sequence in proteins it was just a technical advance. This technical advance by no means could be considered a scientific result presented as an indication that DNA sequences alone have replaced the need to study protein chemistry, its responses to microenvironmental changes in order to understand its multiple conformations, changes in activities and function. As E. Schrodinger correctly describes the chemical structure responsible for the coded form stored of genetic information must have minimal interaction with its microenvironment in order to endure hundreds and hundreds years as seen in Hapsburg’s lips. Only magical reasoning assumes that it is possible to find out in non-reactive chemical structures the properties of the reactive ones.

For instance, knowledge of the reactions of the Krebs cycle clearly indicate a role for solvent that no longer could be considered to be an inert bath for catalytic activity of the enzymes when the transfer of energy include a role for hydrogen transport. The great increase in understanding this change on chemical reaction arrived from conformational energy.

Again, even a rather simplistic view of this atomic property (Conformational energy) is enough to confirm once more, one of the most important contribution of E. Schrodinger in his What is Life:

“This little book arose from a course of public lectures, delivered by a theoretical physicist to an audience of about four hundred which did not substantially dwindle, though warned at the outset that the subject matter was a difficult one and that the lectures could not be termed popular, even though the physicist’s most dreaded weapon, mathematical deduction, would hardly be utilized. The reason for this was not that the subject was simple enough to be explained without mathematics, but rather that it was much too involved to be fully accessible to mathematics.”

In a very simplistic view, while energy manifests itself by the ability to perform work conformational energy as a property derived from our atomic structure can be neutral, positive or negative (no effect, increased or decreased reactivity upon any chemistry reactivity measured as work)

Also:

“I mean the fact that we, whose total being is entirely based on a marvelous interplay of this very kind, yet if all possess the power of acquiring considerable knowledge about it. I think it possible that this knowledge may advance to little just a short of a complete understanding -of the first marvel. The second may well be beyond human understanding.”

In fact, scientific knowledge allows us to understand how biological evolution may have occurred or have not occurred and yet does not present a proof about how it would have being occurred. It will be always be an indication of possible against highly unlike and never a scientific proven fact about the real form of its occurrence.

As was the case of B. Chance in its bioenergetics findings, we may get very important findings that indicates wrong directions in the future as was his case, or directed toward our past.

The Skeleton of Physical Time – Quantum Energies in Relative Space of S-labs

By Radoslav S. Bozov  Independent Researcher

WSEAS, Biology and BioSystems of Biomedicine

Space does not equate to distance, displacement of an object by classically defined forces – electromagnetic, gravity or inertia. In perceiving quantum open systems, a quanta, a package of energy, displaces properties of wave interference and statistical outcomes of sums of paths of particles detected by a design of S-labs.

The notion of S-labs, space labs, deals with inherent problems of operational module, R(i+1), where an imagination number ‘struggles’ to work under roots of a negative sign, a reflection of an observable set of sums reaching out of the limits of the human being organ, an eye or other foundational signal processing system.

While heavenly bodies, planets, star systems, and other exotic forms of light reflecting and/or emitting objects, observable via naked eye have been deduced to operate under numerical systems that calculate a periodic displacement of one relative to another, atomic clocks of nanospace open our eyes to ever expanding energy spaces, where matrices of interactive variables point to the problem of infinity of variations in scalar spaces, however, defining properties of minute universes as a mirror image of an astronomical system. The first and furthermost problem is essentially the same as those mathematical methodologies deduced by Isaac Newton and Albert Einstein for processing a surface. I will introduce you to a surface interference method by describing undetermined objective space in terms of determined subjective time.

Therefore, the moment will be an outcome of statistical sums of a numerical system extending from near zero to near one. Three strings hold down a dual system entangled via interference of two waves, where a single wave is a product of three particles (today named accordingly to either weak or strong interactions) momentum.

The above described system emerges from duality into trinity the objective space value of physical realities. The triangle of physical observables – charge, gravity and electromagnetism, is an outcome of interference of particles, strings and waves, where particles are not particles, or are strings strings, or  are waves waves of an infinite character in an open system which we attempt to define to predict outcomes of tomorrow’s parameters, either dependent or independent as well as both subjective to time simulations.

We now know that aging of a biological organism cannot be defined within singularity. Thereafter, clocks are subjective to apparatuses measuring oscillation of defined parameters which enable us to calculate both amplitude and a period, which we know to be dependent on phase transitions.

The problem of phase was solved by the applicability of carbon relative systems. A piece of diamond does not get wet, yet it holds water’s light entangled property. Water is the dark force of light. To formulate such statement, we have been searching truth by examining cooling objects where the Maxwell demon is translated into information, a data complex system.

Modern perspectives in computing quantum based matrices, 0+1 =1 and/or 0+0=1, and/or 1+1 =0, will be reduced by applying a conceptual frame of Aladdin’s flying anti-gravity carpet, unwrapping both past and future by sending a photon to both, placing present always near zero. Thus, each parallel quantum computation of a natural system approaching the limit of a vibration of a string defining 0 does not equal 0, and 1 does not equal 1. In any case, if our method 1+1 = 1, yet, 1 is not 1 at time i+1. This will set the fundamentals of an operational module, called labris operator or in simplicity S-labs. Note, that 1 as a result is an event predictable to future, while interacting parameters of addition 1+1 may be both, 1 as an observable past, and 1 as an imaginary system, or 1+1 displaced interactive parameters of past observable events. This is the foundation of Future Quantum Relative Systems Interference (QRSI), taking analytical technologies of future as a result of data matrices compressing principle relative to carbon as a reference matter rational to water based properties.

Goedel’s concept of loops exist therefore only upon discrete relative space uniting to parallel absolute continuity of time ‘lags’. ( Goedel, Escher and Bach: An Eternal Golden Braid. A Metaphorical Fugue on Minds and Machines in the Spirit of Lewis Carroll. D Hofstadter.  Chapter XX: Strange Loops, Or Tangled Hierarchies. A grand windup of many of the ideas about hierarchical systems and self-reference. It is concerned with the snarls which arise when systems turn back on themselves-for example, science probing science, government investigating governmental wrongdoing, art violating the rules of art, and finally, humans thinking about their own brains and minds. Does Gödel’s Theorem have anything to say about this last “snarl”? Are free will and the sensation of consciousness connected to Gödel’s Theorem? The Chapter ends by tying Gödel, Escher, and Bach together once again.)  The fight struggle in-between time creates dark spaces within which strings manage to obey light properties – entangled bozons of information carrying future outcomes of a systems processing consciousness. Therefore, Albert Einstein was correct in his quantum time realities by rejecting a resolving cube of sugar within a cup of tea (Henri Bergson 19th century philosopher. Bergson’s concept of multiplicity attempts to unify in a consistent way two contradictory features: heterogeneity and continuity. Many philosophers today think that this concept of multiplicity, despite its difficulty, is revolutionary.) However, the unity of time and space could not be achieved by deducing time to charge, gravity and electromagnetic properties of energy and mass.

Charge is further deduced to interference of particles/strings/waves, contrary to the Hawking idea of irreducibility of chemical energy carrying ‘units’, and gravity is accounted for by intrinsic properties of   anti-gravity carbon systems processing light, an electromagnetic force, that I have deduced towards ever expanding discrete energy space-energies rational to compressing mass/time. The role of loops seems to operate to control formalities where boundaries of space fluctuate as a result of what we called above – dark time-spaces.

Indeed, the concept of horizon is a constant due to ever expanding observables. Thus, it fails to acquire a rational approach towards space-time issues.

Richard Feynman has touched on issues of touching of space, sums of paths of particle traveling through time. In a way he has resolved an important paradigm, storing information and possibly studying it by opening a black box. Schroedinger’s cat is alive again, but incapable of climbing a tree when chased by a dog. Every time a cat climbs a garden tree, a fruit falls on hedgehogs carried away parallel to living wormholes whose purpose of generating information lies upon carbon units resolving light.

In order to deal with such a paradigm, we will introduce i+1 under square root in relativity, therefore taking negative one ( -1 = sqrt (i+1), an operational module R dealing with Wheelers foam squeezed by light, releasing water – dark spaces. Thousand words down!

What is a number? Is that a name or some kind of language or both? Is the issue of number theory possibly accountable to the value of the concept of entropic timing? Light penetrating a pyramid holding bean seeds on a piece of paper and a piece of slice of bread, a triple set, where a church mouse has taken a drop of tear, but a blood drop. What an amazing physics! The magic of biology lies above egoism, above pride, and below Saints.

We will set up the twelve parameters seen through 3+1 in classic realities:

–              discrete absolute energies/forces – no contradiction for now between Newtonian and Albert Einstein mechanics

–              mass absolute continuity – conservational law of physics in accordance to weak and strong forces

–              quantum relative spaces – issuing a paradox of Albert Einstein’s space-time resolved by the uncertainty principle

–              parallel continuity of multiple time/universes – resolving uncertainty of united space and energy through evolving statistical concepts of scalar relative space expansion and vector quantum energies by compressing relative continuity of matter in it, ever compressing flat surfaces – finding the inverse link between deterministic mechanics of displacement and imaginary space, where spheres fit within surface of triangles as time unwraps past by pulling strings from future.

To us, common human beings, with an extra curiosity overloaded by real dreams, value happens to play in the intricate foundation of life – the garden of love, its carbon management in mind, collecting pieces of squeezed cooling time.

The infinite interference of each operational module to another composing ever emerging time constrains unified by the Solar system, objective to humanity, perhaps answers that a drop of blood and a drop of tear is united by a droplet of a substance separating negative entropy to time courses of a physical realities as defined by an open algorithm where chasing power subdue to space becomes an issue of time.

Jose Eduardo de Salles Roselino

Some small errors: For intance an increase i P leads to a decrease in V ( not an increase in V)..


Radoslav S. Bozov  Independent Researcher

If we were to use a preventative measures of medical science, instruments of medical science must predict future outcomes based on observable parameters of history….. There are several key issues arising: 1. Despite pinning a difference on genomic scale , say pieces of information, we do not know how to have changed that – that is shift methylome occupying genome surfaces , in a precise manner.. 2. Living systems operational quo DO NOT work as by vector gravity physics of ‘building blocks. That is projecting a delusional concept of a masonry trick, who has not worked by corner stones and ever shifting momenta … Assuming genomic assembling worked, that is dealing with inferences through data mining and annotation, we are not in a position to read future in real time, and we will never be, because of the rtPCR technology self restriction into data -time processing .. We know of existing post translational modalities… 3. We don’t know what we don’t know, and that foundational to future medicine – that is dealing with biological clocks, behavior, and various daily life inputs ranging from radiation to water systems, food quality, drugs…

Read Full Post »

Metabolic Genomics and Pharmaceutics, Vol. 1 of BioMed Series D available on Amazon Kindle

Metabolic Genomics and Pharmaceutics, Vol. 1 of BioMed Series D available on Amazon Kindle

Reporter: Stephen S Williams, PhD

Article ID #180: Metabolic Genomics and Pharmaceutics, Vol. 1 of BioMed Series D available on Amazon Kindle. Published on 8/15/2015

WordCloud Image Produced by Adam Tubman

Leaders in Pharmaceutical Business Intelligence would like to announce the First volume of their BioMedical E-Book Series D:

Metabolic Genomics & Pharmaceutics, Vol. I

SACHS FLYER 2014 Metabolomics SeriesDindividualred-page2

which is now available on Amazon Kindle at

http://www.amazon.com/dp/B012BB0ZF0.

This e-Book is a comprehensive review of recent Original Research on  METABOLOMICS and related opportunities for Targeted Therapy written by Experts, Authors, Writers. This is the first volume of the Series D: e-Books on BioMedicine – Metabolomics, Immunology, Infectious Diseases.  It is written for comprehension at the third year medical student level, or as a reference for licensing board exams, but it is also written for the education of a first time baccalaureate degree reader in the biological sciences.  Hopefully, it can be read with great interest by the undergraduate student who is undecided in the choice of a career. The results of Original Research are gaining value added for the e-Reader by the Methodology of Curation. The e-Book’s articles have been published on the Open Access Online Scientific Journal, since April 2012.  All new articles on this subject, will continue to be incorporated, as published with periodical updates.

We invite e-Readers to write an Article Reviews on Amazon for this e-Book on Amazon.

All forthcoming BioMed e-Book Titles can be viewed at:

http://pharmaceuticalintelligence.com/biomed-e-books/

Leaders in Pharmaceutical Business Intelligence, launched in April 2012 an Open Access Online Scientific Journal is a scientific, medical and business multi expert authoring environment in several domains of  life sciences, pharmaceutical, healthcare & medicine industries. The venture operates as an online scientific intellectual exchange at their website http://pharmaceuticalintelligence.com and for curation and reporting on frontiers in biomedical, biological sciences, healthcare economics, pharmacology, pharmaceuticals & medicine. In addition the venture publishes a Medical E-book Series available on Amazon’s Kindle platform.

Analyzing and sharing the vast and rapidly expanding volume of scientific knowledge has never been so crucial to innovation in the medical field. WE are addressing need of overcoming this scientific information overload by:

  • delivering curation and summary interpretations of latest findings and innovations on an open-access, Web 2.0 platform with future goals of providing primarily concept-driven search in the near future
  • providing a social platform for scientists and clinicians to enter into discussion using social media
  • compiling recent discoveries and issues in yearly-updated Medical E-book Series on Amazon’s mobile Kindle platform

This curation offers better organization and visibility to the critical information useful for the next innovations in academic, clinical, and industrial research by providing these hybrid networks.

Table of Contents for Metabolic Genomics & Pharmaceutics, Vol. I

Chapter 1: Metabolic Pathways

Chapter 2: Lipid Metabolism

Chapter 3: Cell Signaling

Chapter 4: Protein Synthesis and Degradation

Chapter 5: Sub-cellular Structure

Chapter 6: Proteomics

Chapter 7: Metabolomics

Chapter 8:  Impairments in Pathological States: Endocrine Disorders; Stress

                   Hypermetabolism and Cancer

Chapter 9: Genomic Expression in Health and Disease 


Summary 

Epilogue


Read Full Post »

Therapeutic Implications for Targeted Therapy from the Resurgence of Warburg ‘Hypothesis’

Writer and Curator: Larry H. Bernstein, MD, FCAP 

(Note that each portion of the discussion is followed by a reference)

It is now a time to pause after almost a century of a biological scientific discoveries that have transformed the practice of medicine and impacted the lives of several generations of young minds determined to probe the limits of our knowledge.  In the century that we have entered into the scientific framework of medicine has brought together a difficult to grasp evolution of the emergence of human existence from wars, famine, droughts, storms, infectious diseases, and insect born pestilence with betterment of human lives, only unevenly divided among societal classes that have existed since time immemorial. In this short time span there have emerged several generations of physicians who have benefited from a far better medical education that their forebears could have known. In this expansive volume on cancer, we follow an incomplete and continuing challenge to understand cancer, a disease that has become associated with longer life spans in developed nations.

While there are significant improvements in the diagnosis and treatment of cancers, there is still a personal as well as locality factor in the occurrence of this group of diseases, which has been viewed incorrectly as a “dedifferentiation” of mature tissue types and the emergence of a cell phenotype that is dependent on glucose, reverts to a cancer “stem cell type” (loss of stemness), loses cell to cell adhesion, loses orderly maturation, and metastasizes to distant sites. At the same time, physician and nurses are stressed in the care of patients by balancing their daily lives and maintaining a perspective.

The conceptual challenge of cancer diagnosis and management has seemed insurmountable, but owes much to the post World War I activities of Otto Heinrich Warburg. It was Warburg who made the observation that cancer cells metabolize glucose by fermentation in much the way Pasteur 60 years earlier observed fermentation of yeast cells. This metabolic phenomenon occurs even in the presence of an oxygen supply, which would provide a huge deficit in ATP production compared with respiration. The cancer cell is “addicted to glucose” and produced lactic acid. Warburg was awarded the Nobel Prize in Medicine for this work in 1931.

In the last 15 years there has been a resurgence of work on the Warburg effect that sheds much new light on the process that was not previously possible, with significant therapeutic implications.  In the first place, the metabolic mechanism for the Warburg effect was incomplete even at the beginning of the 21st century.  This has been partly rectified with the enlightening elucidation of genome modifications, cellular metabolic regulation, and signaling pathways.

The following developments have become central to furthering our understanding of malignant transformation.

  1. There is usually an identifiable risk factor, such as, H. pylori, or of a chronic inflammatory state, as in the case of Barrett’s esophagus.
  2. There are certain changes in glucose metabolism that have been unquestionably been found in the evolution of this disease. The changes are associated with major changes in metabolic pathways, miRN signaling, and the metabolism geared to synthesis of cells with an impairment of the cell death cycle. In these changes, mitochondrial function is central to both the impaired respiration and the autophagy geared to the synthesis of cancer cells.

The emergence of this cell prototype is characterized by the following, again related to the Warburg effect:

  1. Cancer cells oxidize a decreased fraction of the pyruvate generated from glycolysis
  2. The mitochondrial pyruvate carrier (MPC), composed of the products of the MPC1 and MPC2 genes, modulates fractional pyruvate oxidation. MPC1 is deleted or underexpressed in multiple cancers and correlates with poor prognosis.
  3. Cancer cells tend to express a partially inhibited splice variant of pyruvate kinase (PK-M2), leading to decreased pyruvate production.
  4. The two proteins that mediate pyruvate conversion to lactate and its export, M-type lactate dehydrogenase and the monocarboxylate transporter MCT-4, are commonly upregulated in cancer cells leading to decreased pyruvate oxidation.
  5. The enzymatic step following mitochondrial entry is the conversion of pyruvate to acetyl-CoA by the pyruvate dehydrogenase (PDH) complex. Cancer cells frequently exhibit increased expression of the PDH kinase PDK1, which phosphorylates and inactivates PDH. This PDH regulatory mechanism is required for oncogene induced transformation and reversed in oncogene-induced senescence.
  6. The PDK inhibitor dichloroacetate has shown some clinical efficacy, which correlates with increased pyruvate oxidation. One of the simplest mechanisms to explain decreased mitochondrial pyruvate oxidation in cancer cells, a loss of mitochondrial pyruvate import, has been observed repeatedly over the past 40 years. This process has been impossible to study at a molecular level until recently, however, as the identities of the protein(s) that mediate mitochondrial pyruvate uptake were unknown.
  7. The mitochondrial pyruvate carrier (MPC) as a multimeric complex that is necessary for efficient mitochondrial pyruvate uptake. The MPC contains two distinct proteins, MPC1 and MPC2; the absence of either leads to a loss of mitochondrial pyruvate uptake and utilization in yeast, flies, and mammalian cells.

A Role for the Mitochondrial Pyruvate Carrier as a Repressor of the Warburg Effect and Colon Cancer Cell Growth

John C. Schell, Kristofor A. Olson, Lei Jiang, Amy J. Hawkins, et al.
Molecular Cell Nov 6, 2014; 56: 400–413.
http://dx.doi.org/10.1016/j.molcel.2014.09.026

In addition to the above, the following study has therapeutic importance:

Glycolysis has become a target of anticancer strategies. Glucose deprivation is sufficient to induce growth inhibition and cell death in cancer cells. The increased glucose transport in cancer cells has been attributed primarily to the upregulation of glucose transporter 1 (Glut1),  1 of the more than 10 glucose transporters that are responsible for basal glucose transport in almost all cell types. Glut1 has not been targeted until very recently due to the lack of potent and selective inhibitors.

First, Glut1 antibodies were shown to inhibit cancer cell growth. Other Glut1 inhibitors and glucose transport inhibitors, such as fasentin and phloretin, were also shown to be effective in reducing cancer cell growth. A group of inhibitors of glucose transporters has been recently identified with IC50 values lower than 20mmol/L for inhibiting cancer cell growth. However, no animal or detailed mechanism studies have been reported with these inhibitors.

Recently, a small molecule named STF-31 was identified that selectively targets the von Hippel-Lindau (VHL) deficient kidney cancer cells. STF-31 inhibits VHL deficient cancer cells by inhibiting Glut1. It was further shown that daily intraperitoneal injection of a soluble analogue of STF-31 effectively reduced the growth of tumors of VHL-deficient cancer cells grafted on nude mice. On the other hand, STF-31 appears to be an inhibitor with a narrow cell target spectrum.

These investigators recently reported the identification of a group of novel small compounds that inhibit basal glucose transport and reduce cancer cell growth by a glucose deprivation–like mechanism. These compounds target Glut1 and are efficacious in vivo as anticancer agents. A novel representative compound WZB117 not only inhibited cell growth in cancer cell lines but also inhibited cancer growth in a nude mouse model. Daily intraperitoneal injection of WZB117 resulted in a more than 70% reduction in the size of human lung cancer of A549 cell origin. Mechanism studies showed that WZB117 inhibited glucose transport in human red blood cells (RBC), which express Glut1 as their sole glucose transporter. Cancer cell treatment with WZB117 led to decreases in levels of Glut1 protein, intracellular ATP, and glycolytic enzymes. All these changes were followed by increase in ATP sensing enzyme AMP-activated protein kinase (AMPK) and declines in cyclin E2 as well as phosphorylated retinoblastoma, resulting in cell-cycle arrest, senescence, and necrosis. Addition of extracellular ATP rescued compound-treated cancer cells, suggesting that the reduction of intracellular ATP plays an important role in the anticancer mechanism of the molecule.

A Small-Molecule Inhibitor of Glucose Transporter 1 Downregulates Glycolysis, Induces Cell-Cycle Arrest, and Inhibits Cancer Cell Growth In Vitro and In Vivo

Yi Liu, Yanyan Cao, Weihe Zhang, Stephen Bergmeier, et al.
Mol Cancer Ther Aug 2012; 11(8): 1672–82
http://dx.doi.org://10.1158/1535-7163.MCT-12-0131

Alterations in cellular metabolism are among the most consistent hallmarks of cancer. These investigators have studied the relationship between increased aerobic lactate production and mitochondrial physiology in tumor cells. To diminish the ability of malignant cells to metabolize pyruvate to lactate, M-type lactate dehydrogenase levels were knocked down by means of LDH-A short hairpin RNAs. Reduction in LDH-A activity resulted in stimulation of mitochondrial respiration and decrease of mitochondrial membrane potential. It also compromised the ability of these tumor cells to proliferate under hypoxia. The tumorigenicity of the LDH-A-deficient cells was severely diminished, and this phenotype was reversed by complementation with the human ortholog LDH-A protein. These results demonstrate that LDH-A plays a key role in tumor maintenance.

The results are consistent with a functional connection between alterations in glucose metabolism and mitochondrial physiology in cancer. The data also reflect that the dependency of tumor cells on glucose metabolism is a liability for these cells under limited-oxygen conditions. Interfering with LDH-A activity as a means of blocking pyruvate to lactate conversion could be exploited therapeutically. Because individuals with complete deficiency of LDH-A do not show any symptoms under ordinary circumstances, the genetic data suggest that inhibition of LDH-A activity may represent a relatively nontoxic approach to interfere with tumor growth.

Attenuation of LDH-A expression uncovers a link between glycolysis, mitochondrial physiology, and tumor maintenance

Valeria R. Fantin Julie St-Pierre and Philip Leder
Cancer Cell Jun 2006; 9: 425–434.
http://dx.doi.org:/10.1016/j.ccr.2006.04.02

The widespread clinical use of positron-emission tomography (PET) for the detection of aerobic glycolysis in tumors and recent findings have rekindled interest in Warburg’s theory. Studies on the physiological changes in malignant conversion provided a metabolic signature for the different stages of tumorigenesis; during tumorigenesis, an increase in glucose uptake and lactate production have been detected. The fully transformed state is most dependent on aerobic glycolysis and least dependent on the mitochondrial machinery for ATP synthesis.

Tumors ferment glucose to lactate even in the presence of oxygen (aerobic glycolysis; Warburg effect). The pentose phosphate pathway (PPP) allows glucose conversion to ribose for nucleic acid synthesis and glucose degradation to lactate. The nonoxidative part of the PPP is controlled by transketolase enzyme reactions. We have detected upregulation of a mutated transketolase transcript (TKTL1) in human malignancies, whereas transketolase (TKT) and transketolase-like-2 (TKTL2) transcripts were not upregulated. Strong TKTL1 protein expression was correlated to invasive colon and urothelial tumors and to poor patients outcome. TKTL1 encodes a transketolase with unusual enzymatic properties, which are likely to be caused by the internal deletion of conserved residues. We propose that TKTL1 upregulation in tumors leads to enhanced, oxygen-independent glucose usage and a lactate based matrix degradation. As inhibition of transketolase enzyme reactions suppresses tumor growth and metastasis, TKTL1 could be the relevant target for novel anti-transketolase cancer therapies. We suggest an individualized cancer therapy based on the determination of metabolic changes in tumors that might enable the targeted inhibition of invasion and metastasis.

Other important links between cancer-causing genes and glucose metabolism have been already identified. Activation of the oncogenic kinase Akt has been shown to stimulate glucose uptake and metabolism in cancer cells and renders these cells susceptible to death in response to glucose withdrawal. Such tumor cells have been shown to be dependent on glucose because the ability to induce fatty acid oxidation in response to glucose deprivation is impaired by activated Akt. In addition, AMP-activated protein kinase (AMPK) has been identified as a link between glucose metabolism and the cell cycle, thereby implicating p53 as an essential component of metabolic cell-cycle control.

Expression of transketolase TKTL1 predicts colon and urothelial cancer patient survival: Warburg effect reinterpreted

S Langbein, M Zerilli, A zur Hausen, W Staiger, et al.
British Journal of Cancer (2006) 94, 578–585.
http://dx.doi.org:/10.1038/sj.bjc.6602962

The unique metabolic profile of cancer (aerobic glycolysis) might confer apoptosis resistance and be therapeutically targeted. Compared to normal cells, several human cancers have high mitochondrial membrane potential (DJm) and low expression of the K+ channel Kv1.5, both contributing toapoptosis resistance. Dichloroacetate (DCA) inhibits mitochondrial pyruvate dehydrogenase kinase (PDK), shifts metabolism from glycolysis to glucose oxidation, decreases DJm, increases mitochondrial H2O2, and activates Kv channels in all cancer, but not normal, cells; DCA upregulates Kv1.5 by an NFAT1-dependent mechanism. DCA induces apoptosis, decreases proliferation, and inhibits tumor growth, without apparent toxicity. Molecular inhibition of PDK2 by siRNA mimics DCA. The mitochondria-NFAT-Kv axis and PDK are important therapeutic targets in cancer; the orally available DCA is a promising selective anticancer agent.

Cancer progression and its resistance to treatment depend, at least in part, on suppression of apoptosis. Although mitochondria are recognized as regulators of apoptosis, their importance as targets for cancer therapy has not been adequately explored or clinically exploited. In 1930, Warburg suggested that mitochondrial dysfunction in cancer results in a characteristic metabolic phenotype, that is, aerobic glycolysis (Warburg, 1930). Positron emission tomography (PET) imaging has now confirmed that most malignant tumors have increased glucose uptake and metabolism. This bioenergetic feature is a good marker of cancer but has not been therapeutically pursued..

The small molecule DCA is a metabolic modulator that has been used in humans for decades in the treatment of lactic acidosis and inherited mitochondrial diseases. Without affecting normal cells, DCA reverses the metabolic electrical remodeling that we describe in several cancer lines (hyperpolarized mitochondria, activated NFAT1, downregulated Kv1.5), inducing apoptosis and decreasing tumor growth. DCA in the drinking water at clinically relevant doses for up to 3 months prevents and reverses tumor growth in vivo, without apparent toxicity and without affecting hemoglobin, transaminases, or creatinine levels. The ease of delivery, selectivity, and effectiveness  make DCA an attractive candidate for proapoptotic cancer therapy which can be rapidly translated into phase II–III clinical trials.

A Mitochondria-K+ Channel Axis Is Suppressed in Cancer and Its Normalization Promotes Apoptosis and Inhibits Cancer Growth

Sebastien Bonnet, Stephen L. Archer, Joan Allalunis-Turner, et al.

Cancer Cell Jan 2007; 11: 37–51.
http://dx.doi.org:/10.1016/j.ccr.2006.10.020

Tumor cells, just as other living cells, possess the potential for proliferation, differentiation, cell cycle arrest, and apoptosis. There is a specific metabolic phenotype associated with each of these conditions, characterized by the production of both energy and special substrates necessary for the cells to function in that particular state. Unlike that of normal living cells, the metabolic phenotype of tumor cells supports the proliferative state. Aim: To present the metabolic hypothesis that (1) cell transformation and tumor growth are associated with the activation of metabolic enzymes that increase glucose carbon utilization for nucleic acid synthesis, while enzymes of the lipid and amino acid synthesis pathways are activated in tumor growth inhibition, and (2) phosphorylation and allosteric and transcriptional regulation of intermediary metabolic enzymes and their substrate availability together mediate and sustain cell transformation from one condition to another. Conclusion: Evidence is presented that demonstrates opposite changes in metabolic phenotypes induced by TGF-β, a cell transforming agent, and tumor growth-inhibiting phytochemicals such as genistein and Avemar, or novel synthetic antileukemic drugs such as STI571 (Gleevec).  Intermediary metabolic enzymes that mediate the growth signaling pathways and promote malignant cell transformation may serve as high efficacy nongenetic novel targets for cancer therapies.

A Metabolic Hypothesis of Cell Growth and Death in Pancreatic Cancer

Laszlo G. Boros, Wai-Nang Paul Lee, and Vay Liang W. Go
Pancreas 2002; 24(1):26–33

Clear cell renal cell carcinoma (ccRCC) is the most common pathological subtype of kidney cancer. Here, we integrated an unbiased genome-wide RNA interference screen for ccRCC survival regulators with an analysis of recurrently overexpressed genes in ccRCC to identify new therapeutic targets in this disease. One of the most potent survival regulators, the monocarboxylate transporter MCT4 (SLC16A3), impaired ccRCC viability in all eight ccRCC lines tested and was the seventh most overexpressed gene in a meta-analysis of five ccRCC expression datasets.

MCT4 silencing impaired secretion of lactate generated through glycolysis and induced cell cycle arrest and apoptosis. Silencing MCT4 resulted in intracellular acidosis, and reduction in intracellular ATP production together with partial reversion of the Warburg effect in ccRCC cell lines. Intra-tumoral heterogeneity in the intensity of MCT4 protein expression was observed in primary ccRCCs.

MCT4 protein expression analysis based on the highest intensity of expression in primary ccRCCs was associated with poorer relapse-free survival, whereas modal intensity correlated with Fuhrman nuclear grade. Consistent with the potential selection of subclones enriched for MCT4 expression during disease progression, MCT4 expression was greater at sites of metastatic disease. These data suggest that MCT4 may serve as a novel metabolic target to reverse the Warburg effect and limit disease progression in ccRCC.

Clear cell carcinoma (ccRCC) is the commonest subtype of renal cell carcinoma, accounting for 80% of cases. These tumors are highly resistant to cytotoxic chemotherapy and until recently, systemic treatment options for advanced ccRCC were limited to cytokine based therapies, such as interleukin-2 and interferon-α. Recently, anti-angiogenic drugs and mTOR inhibitors, all targeting the HIF–VEGF axis which is activated in up to 91% of ccRCCs through loss of the VHL tumor suppressor gene [1], have been shown to be effective in metastatic ccRCC [2–5]. Although these drugs increase overall survival to more than 2 years [6], resistance invariably occurs, making the identification of new molecular targets a major clinical need to improve outcomes in patients with metastatic ccRCC.

Genome-wide RNA interference analysis of renal carcinoma survival regulators identifies MCT4 as a Warburg effect metabolic target

Marco Gerlinger, Claudio R Santos, Bradley Spencer-Dene, et al.
J Pathol 2012; 227: 146–156
http://dx.doi.org:/10.1002/path.4006

Hypoxia-inducible factor 1 (HIF-1) plays a key role in the reprogramming of cancer metabolism by activating transcription of genes encoding glucose transporters and glycolytic enzymes, which take up glucose and convert it to lactate; pyruvate dehydrogenase kinase 1, which shunts pyruvate away from the mitochondria; and BNIP3, which triggers selective mitochondrial autophagy. The shift from oxidative to glycolytic metabolism allows maintenance of redox homeostasis and cell survival under conditions of prolonged hypoxia. Many metabolic abnormalities in cancer cells increase HIF-1 activity. As a result, a feed-forward mechanism can be activated that drives HIF-1 activation and may promote tumor progression.

Metastatic cancer is characterized by reprogramming of cellular metabolism leading to increased uptake of glucose for use as both an anabolic and a catabolic substrate. Increased glucose uptake is such a reliable feature that it is utilized clinically to detect metastases by positron emission tomography using 18F-fluorodeoxyglucose (FDG-PET) with a sensitivity of >90% [1]. As with all aspects of cancer biology, the details of metabolic reprogramming differ widely among individual tumors. However, the role of specific signaling pathways and transcription factors in this process is now understood in considerable detail. This review will focus on the involvement of hypoxia-inducible factor 1 (HIF-1) in both mediating metabolic reprogramming and responding to metabolic alterations. The placement of HIF-1 both upstream and downstream of cancer metabolism results in a feed-forward mechanism that may play a major role in the development of the invasive, metastatic, and lethal cancer phenotype.

O2 concentrations are significantly reduced in many human cancers compared with the surrounding normal tissue. The median PO2 in breast cancers is 10 mmHg, as compared with65 mmHg in normal breast tissue. Reduced O2 availability induces HIF-1, which regulates the transcription of hundreds of genes that encode proteins involved in every aspect of cancer biology, including: cell immortalization and stem cell maintenance; genetic instability; glucose and energy metabolism; vascularization; autocrine growth factor signaling; invasion and metastasis; immune evasion; and resistance to chemotherapy and radiation therapy.

HIF-1 is a transcription factor that consists of an O2 regulated HIF-1a and a constitutively expressed HIF-1b subunit. In well-oxygenated cells, HIF-1a is hydroxylated on proline residue 402 (Pro-402) and/or Pro-564 by prolyl hydroxylase domain protein 2 (PHD2), which uses O2 and a-ketoglutarate as substrates in a reaction that generates CO2 and succinate as byproducts. Prolylhydroxylated HIF-1a is bound by the von Hippel–Lindau tumor suppressor protein (VHL), which recruits an E3-ubiquitin ligase that targets HIF-1a for proteasomal degradation (Figure 1a). Asparagine 803 in the transactivation domain is hydroxylated in well-oxygenated cells by factor inhibiting HIF-1 (FIH-1), which blocks the binding of the coactivators p300 and CBP. Under hypoxic conditions, the prolyl and asparaginyl hydroxylation reactions are inhibited by substrate (O2) deprivation and/or the mitochondrial generation of reactive oxygen species (ROS), which may oxidize Fe(II) present in the catalytic center of the hydroxylases.

The finding that acute changes in PO2 increase mitochondrial ROS production suggests that cellular respiration is optimized at physiological PO2 to limit ROS generation and that any deviation in PO2 – up or down – results in increased ROS generation. If hypoxia persists, induction of HIF-1 leads to adaptive mechanisms to reduce ROS and re-establish homeostasis, as described below. Prolyl and asparaginyl hydroxylation provide a molecular mechanism by which changes in cellular oxygenation can be transduced to the nucleus as changes in HIF-1 activity.

HIF-1: upstream and downstream of cancer metabolism

Gregg L Semenza
Current Opinion in Genetics & Development 2010, 20:51–56

This review comes from a themed issue on Genetic and cellular mechanisms of oncogenesis Edited by Tony Hunter and Richard Marais

http://dx.doi.org:/10.1016/j.gde.2009.10.009

Hypoxia-inducible factor 1 (HIF-1) regulates the transcription of many genes involved in key aspects of cancer biology, including immortalization, maintenance of stem cell pools, cellular dedifferentiation, genetic instability, vascularization, metabolic reprogramming, autocrine growth factor signaling, invasion/metastasis, and treatment failure. In animal models, HIF-1 overexpression is associated with increased tumor growth, vascularization, and metastasis, whereas HIF-1 loss-of-function has the opposite effect, thus validating HIF-1 as a target. In further support of this conclusion, immunohistochemical detection of HIF-1a overexpression in biopsy sections is a prognostic factor in many cancers. A growing number of novel anticancer agents have been shown to inhibit HIF-1 through a  variety of molecular mechanisms. Determining which combination of drugs to administer to any given patient remains a major obstacle to improving cancer treatment outcomes.

Intratumoral hypoxia The majority of locally advanced solid tumors contain regions of reduced oxygen availability. Intratumoral hypoxia results when cells are located too far from a functional blood vessel for diffusion of adequate amounts of O2 as a result of rapid cancer cell proliferation and the formation of blood vessels that are structurally and functionally abnormal. In the most extreme case, O2 concentrations are below those required for survival, resulting in cell death and establishing a selection for cancer cells in which apoptotic pathways are inactivated, anti-apoptotic pathways are activated, or invasion/metastasis pathways that promote escape from the hypoxic microenvironment are activated. This hypoxic adaptation may arise by alterations in gene expression or by mutations in the genome or both and is associated with reduced patient survival.

Hypoxia-inducible factor 1 (HIF-1) The expression of hundreds of genes is altered in each cell exposed to hypoxia. Many of these genes are regulated by HIF-1. HIF-1 is a heterodimer formed by the association of an O2-regulated HIF1a subunit with a constitutively expressed HIF-1b subunit. The structurally and functionally related HIF-2a protein also dimerizes with HIF-1b and regulates an overlapping battery of target genes. Under nonhypoxic conditions, HIF-1a (as well as HIF-2a) is subject to O2-dependent prolyl hydroxylation and this modification is required for binding of the von Hippel–Lindau tumor suppressor protein (VHL), which also binds to Elongin C and thereby recruits a ubiquitin ligase complex that targets HIF-1a for ubiquitination and proteasomal degradation. Under hypoxic conditions, the rate of hydroxylation and ubiquitination declines, resulting in accumulation of HIF-1a. Immunohistochemical analysis of tumor biopsies has revealed high levels of HIF-1a in hypoxic but viable tumor cells surrounding areas of necrosis.

Genetic alterations in cancer cells increase HIF-1 activity In the majority of clear-cell renal carcinomas, VHL function is lost, resulting in constitutive activation of HIF-1. After re-introduction of functional VHL, renal carcinoma cell lines are no longer tumorigenic, but can be made tumorigenic by expression of HIF2a in which the prolyl residues that are subject to hydroxylation have been mutated. In addition to VHL loss-of-function, many other genetic alterations that inactivate tumor suppressors

Evaluation of HIF-1 inhibitors as anticancer agents

Gregg L. Semenza
Drug Discovery Today Oct 2007; 12(19/20).
http://dx.doi.org:/10.1016/j.drudis.2007.08.006

Hypoxia-inducible factor-1 (HIF-1), which is present at high levels in human tumors, plays crucial roles in tumor promotion by upregulating its target genes, which are involved in anaerobic energy metabolism, angiogenesis, cell survival, cell invasion, and drug resistance. Therefore, it is apparent that the inhibition of HIF-1 activity may be a strategy for treating cancer. Recently, many efforts to develop new HIF-1-targeting agents have been made by both academic and pharmaceutical industry laboratories. The future success of these efforts will be a new class of HIF-1-targeting anticancer agents, which would improve the prognoses of many cancer patients. This review focuses on the potential of HIF-1 as a target molecule for anticancer therapy, and on possible strategies to inhibit HIF-1 activity. In addition, we introduce YC-1 as a new anti-HIF-1, anticancer agent. Although YC-1 was originally developed as a potential therapeutic agent for thrombosis and hypertension, recent studies demonstrated that YC-1 suppressed HIF-1 activity and vascular endothelial growth factor expression in cancer cells. Moreover, it halted tumor growth in immunodeficient mice without serious toxicity during the treatment period. Thus, we propose that YC-1 is a good lead compound for the development of new anti-HIF-1, anticancer agents.

Although many anticancer regimens have been introduced to date, their survival benefits are negligible, which is the reason that a more innovative treatment is required. Basically, the identification of the specific molecular features of tumor promotion has allowed for rational drug discovery in cancer treatment, and drugs have been screened based upon the modulation of specific molecular targets in tumor cells. Target-based drugs should satisfy the following two conditions.

First, they must act by a described mechanism.

Second, they must reduce tumor growth in vivo, associated with this mechanism.

Many key factors have been found to be involved in the multiple steps of cell growth signal-transduction pathways. Targeting these factors offers a strategy for preventing tumor growth; for example, competitors or antibodies blocking ligand–receptor interaction, and receptor tyrosine kinase inhibitors, downstream pathway inhibitors (i.e., RAS farnesyl transferase inhibitors, mitogen-activated protein kinase and mTOR inhibitors), and cell-cycle arresters (i.e., cyclin-dependent kinase inhibitors) could all be used to inhibit tumor growth.

In addition to the intracellular events, tumor environmental factors should be considered to treat solid tumors. Of these, hypoxia is an important cancer-aggravating factor because it contributes to the progression of a more malignant phenotype, and to the acquisition of resistance to radiotherapy and chemotherapy. Thus, transcription factors that regulate these hypoxic events are good targets for anticancer therapy and in particular HIF-1 is one of most compelling targets. In this paper, we introduce the roles of HIF-1 in tumor promotion and provide a summary of new anticancer strategies designed to inhibit HIF-1 activity.

New anticancer strategies targeting HIF-1

Eun-Jin Yeo, Yang-Sook Chun, Jong-Wan Park
Biochemical Pharmacology 68 (2004) 1061–1069
http://dx.doi.org:/10.1016/j.bcp.2004.02.040

Classical work in tumor cell metabolism focused on bioenergetics, particularly enhanced glycolysis and suppressed oxidative phosphorylation (the ‘Warburg effect’). But the biosynthetic activities required to create daughter cells are equally important for tumor growth, and recent studies are now bringing these pathways into focus. In this review, we discuss how tumor cells achieve high rates of nucleotide and fatty acid synthesis, how oncogenes and tumor suppressors influence these activities, and how glutamine metabolism enables macromolecular synthesis in proliferating cells.

Otto Warburg’s demonstration that tumor cells rapidly use glucose and convert the majority of it to lactate is still the most fundamental and enduring observation in tumor metabolism. His work, which ushered in an era of study on tumor metabolism focused on the relationship between glycolysis and cellular bioenergetics, has been revisited and expanded by generations of tumor biologists. It is now accepted that a high rate of glucose metabolism, exploited clinically by 18FDGPET scanning, is a metabolic hallmark of rapidly dividing cells, correlates closely with transformation, and accounts for a significant percentage of ATP generated during cell proliferation. A ‘metabolic transformation’ is required for tumorigenesis. Research over the past few years has reinforced this idea, revealing the conservation of metabolic activities among diverse tumor types, and proving that oncogenic mutations can promote metabolic autonomy by driving nutrient uptake to levels that often exceed those required for cell growth and proliferation.

In order to engage in replicative division, a cell must duplicate its genome, proteins, and lipids and assemble the components into daughter cells; in short, it must become a factory for macromolecular biosynthesis. These activities require that cells take up extracellular nutrients like glucose and glutamine and allocate them into metabolic pathways that convert them into biosynthetic precursors (Figure 1). Tumor cells can achieve this phenotype through changes in the expression of enzymes that determine metabolic flux rates, including nutrient transporters and enzymes [8– 10]. Current studies in tumor metabolism are revealing novel mechanisms for metabolic control, establishing which enzyme isoforms facilitate the tumor metabolic phenotype, and suggesting new targets for cancer therapy.

The ongoing challenge in tumor cell metabolism is to understand how individual pathways fit together into the global metabolic phenotype of cell growth. Here we discuss two biosynthetic activities required by proliferating tumor cells: production of ribose-5 phosphate for nucleotide biosynthesis and production of fatty acids for lipid biosynthesis. Nucleotide and lipid biosynthesis share three important characteristics.

  • First, both use glucose as a carbon source.
  • Second, both consume TCA cycle intermediates, imposing the need for a mechanism to replenish the cycle.
  • Third, both require reductive power in the form of NADPH.

In this Essay, we discuss the possible drivers, advantages, and potential liabilities of the altered metabolism of cancer cells (Figure 1, not shown). Although our emphasis on the Warburg effect reflects the focus of the field, we would also like to encourage a broader approach to the study of cancer metabolism that takes into account the contributions of all interconnected small molecule pathways of the cell.

The Tumor Microenvironment Selects for Altered Metabolism One compelling idea to explain the Warburg effect is that the altered metabolism of cancer cells confers a selective advantage for survival and proliferation in the unique tumor microenvironment. As the early tumor expands, it outgrows the diffusion limits of its local blood supply, leading to hypoxia and stabilization of the hypoxia-inducible transcription factor, HIF. HIF initiates a transcriptional program that provides multiple solutions to hypoxic stress (reviewed in Kaelin and Ratcliffe, 2008). Because a decreased dependence on aerobic respiration becomes advantageous, cell metabolism is shifted toward glycolysis by the increased expression of glycolytic enzymes, glucose transporters, and inhibitors of mitochondrial metabolism. In addition, HIF stimulates angiogenesis (the formation of new blood vessels) by upregulating several factors, including most prominently vascular endothelial growth factor (VEGF).

Blood vessels recruited to the tumor microenvironment, however, are disorganized, may not deliver blood effectively, and therefore do not completely alleviate hypoxia (reviewed in Gatenby and Gillies, 2004). The oxygen levels within a tumor vary both spatially and temporally, and the resulting rounds of fluctuating oxygen levels potentially select for tumors that constitutively upregulate glycolysis. Interestingly, with the possible exception of tumors that have lost the von Hippel-Lindau protein (VHL), which normally mediates degradation of HIF, HIF is still coupled to oxygen levels, as evident from the heterogeneity of HIF expression within the tumor microenvironment. Therefore, the Warburg effect—that is, an uncoupling of glycolysis from oxygen levels—cannot be explained solely by upregulation of HIF. Other molecular mechanisms are likely to be important, such as the metabolic changes induced by oncogene activation and tumor suppressor loss.

Oncogene Activation Drives Changes in Metabolism Not only may the tumor microenvironment select for a deranged metabolism, but oncogene status can also drive metabolic changes. Since Warburg’s time, the biochemical study of cancer metabolism has been overshadowed by efforts to identify the mutations that contribute to cancer initiation and progression. Recent work, however, has demonstrated that the key components of the Warburg effect—

  • increased glucose consumption,
  • decreased oxidative phosphorylation, and
  • accompanying lactate production—
  • are also distinguishing features of oncogene activation.

The signaling molecule Ras, a powerful oncogene when mutated, promotes glycolysis (reviewed in Dang and Semenza, 1999; Ramanathan et al., 2005). Akt kinase, a well-characterized downstream effector of insulin signaling, reprises its role in glucose uptake and utilization in the cancer setting (reviewed in Manning and Cantley, 2007), whereas the Myc transcription factor upregulates the expression of various metabolic genes (reviewed in Gordan et al., 2007). The most parsimonious route to tumorigenesis may be activation of key oncogenic nodes that execute a proliferative program, of which metabolism may be one important arm. Moreover, regulation of metabolism is not exclusive to oncogenes.

Cancer Cell Metabolism: Warburg & Beyond

Hsu PP & Sabatini DM
Cell  Sep 5, 2008; 134, 703-705
http://dx.doi.org:/10.1016/j.cell.2008.08.021

Tumor cells respond to growth signals by the activation of protein kinases, altered gene expression and significant modifications in substrate flow and redistribution among biosynthetic pathways. This results in a proliferating phenotype with altered cellular function. These transformed cells exhibit unique anabolic characteristics, which includes increased and preferential utilization of glucose through the non-oxidative steps of the pentose cycle for nucleic acid synthesis but limited de novo fatty  acid   synthesis   and   TCA   cycle   glucose   oxidation. This  primarily nonoxidative anabolic profile reflects an undifferentiated highly proliferative aneuploid cell phenotype and serves as a reliable metabolic biomarker to determine cell proliferation rate and the level of cell transformation/differentiation in response to drug treatment.

Novel drugs effective in particular cancers exert their anti-proliferative effects by inducing significant reversions of a few specific non-oxidative anabolic pathways. Here we present evidence that cell transformation of various mechanisms is sustained by a unique disproportional substrate distribution between the two branches of the pentose cycle for nucleic acid synthesis, glycolysis and the TCA cycle for fatty acid synthesis and glucose oxidation. This can be demonstrated by the broad labeling and unique specificity of [1,2-13C2]glucose to trace a large number of metabolites in the metabolome. Stable isotope-based dynamic metabolic profiles (SIDMAP) serve the drug discovery process by providing a powerful new tool that integrates the metabolome into a functional genomics approach to developing new drugs. It can be used in screening kinases and their metabolic targets, which can therefore be more efficiently characterized, speeding up and improving drug testing, approval and labeling processes by saving trial and error type study costs in drug testing.

Metabolic Biomarker and Kinase Drug Target Discovery in Cancer Using Stable Isotope-Based Dynamic Metabolic Profiling (SIDMAP)

László G. Boros, Daniel J. Brackett and George G. Harrigan
Current Cancer Drug Targets, 2003, 3, 447-455 447

Pyruvate constitutes a critical branch point in cellular carbon metabolism. We have identified two proteins, Mpc1 and Mpc2, as essential for mitochondrial pyruvate transport in yeast, Drosophila, and humans. Mpc1 and Mpc2 associate to form an ~150 kilodalton complex in the inner mitochondrial membrane. Yeast and Drosophila mutants lacking MPC1 display impaired pyruvate metabolism, with an accumulation of upstream metabolites and a depletion of tricarboxylic acid cycle intermediates. Loss of yeast Mpc1 results in defective mitochondrial pyruvate uptake, while silencing of MPC1 or MPC2 in mammalian cells impairs pyruvate oxidation. A point mutation in MPC1 provides resistance to a known inhibitor of the mitochondrial pyruvate carrier. Human genetic studies of three families with children suffering from lactic acidosis and hyperpyruvatemia revealed a causal locus that mapped to MPC1, changing single amino acids that are conserved throughout eukaryotes. These data demonstrate that Mpc1 and Mpc2 form an essential part of the mitochondrial pyruvate carrier.

A Mitochondrial Pyruvate Carrier Required for Pyruvate Uptake in Yeast, Drosophila , and Humans

Daniel K. Bricker, Eric B. Taylor, John C. Schell, Thomas Orsak, et al.
Science Express 24 May 2012
http://dx.doi.org:/10.1126/science.1218099

Adenosine deaminase acting on RNA (ADAR) enzymes convert adenosine (A) to inosine (I) in double-stranded (ds) RNAs. Since Inosine is read as Guanosine, the biological consequence of ADAR enzyme activity is an A/G conversion within RNA molecules. A-to-I editing events can occur on both coding and non-coding RNAs, including microRNAs (miRNAs), which are small regulatory RNAs of ~20–23 nucleotides that regulate several cell processes by annealing to target mRNAs and inhibiting their translation. Both miRNA precursors and mature miRNAs undergo A-to-I RNA editing, affecting the miRNA maturation process and activity. ADARs can also edit 3′ UTR of mRNAs, further increasing the interplay between mRNA targets and miRNAs. In this review, we provide a general overview of the ADAR enzymes and their mechanisms of action as well as miRNA processing and function. We then review the more recent findings about the impact of ADAR-mediated activity on the miRNA pathway in terms of biogenesis, target recognition, and gene expression regulation.

Review ADAR Enzyme and miRNA Story: A Nucleotide that Can Make the Difference 

Sara Tomaselli, Barbara Bonamassa, Anna Alisi, Valerio Nobili, Franco Locatelli and Angela Gallo
Int. J. Mol. Sci. 19 Nov 2013; 14, 22796-22816 http://dx.doi.org:/10.3390/ijms141122796

The fermented wheat germ extract (FWGE) nutraceutical (Avemar™), manufactured under “good manufacturing practice” conditions and, fulfilling the self-affirmed “generally recognized as safe” status in the United States, has been approved as a “dietary food for special medical purposes for cancer patients” in Europe. In this paper, we report the adjuvant use of this nutraceutical in the treatment of high-risk skin melanoma patients. Methods: In a randomized, pilot, phase II clinical trial, the efficacy of dacarbazine (DTIC)-based adjuvant chemotherapy on survival parameters of melanoma patients was compared to that of the same treatment supplemented with a 1-year long administration of FWGE. Results: At the end of an additional 7-year-long follow-up period, log-rank analyses (Kaplan-Meier estimates) showed significant differences in both progression-free (PFS) and overall survival (OS) in favor of the FWGE group. Mean PFS: 55.8 months (FWGE group) versus 29.9 months (control group), p  0.0137. Mean OS: 66.2 months (FWGE group) versus 44.7 months (control group), p < 0.0298. Conclusions: The inclusion of Avemar into the adjuvant protocols of high-risk skin melanoma patients is highly recommended.

Adjuvant Fermented Wheat Germ Extract (Avemar™) Nutraceutical Improves Survival of High-Risk Skin Melanoma Patients: A Randomized, Pilot, Phase II Clinical Study with a 7-Year Follow-Up

LV Demidov, LV Manziuk, GY Kharkevitch, NA Pirogova, and EV Artamonova
Cancer Biotherapy & Radiopharmaceuticals 2008; 23(4)
http://dx.doi.org:/10.1089/cbr.2008.0486

Cancer cells possess unique metabolic signatures compared to normal cells, including shifts in aerobic glycolysis, glutaminolysis, and de novo biosynthesis of macromolecules. Targeting these changes with agents (drugs and dietary components) has been employed as strategies to reduce the complications associated with tumorigenesis. This paper highlights the ability of several food components to suppress tumor-specific metabolic pathways, including increased expression of glucose transporters, oncogenic tyrosine kinase, tumor-specific M2-type pyruvate kinase, and fatty acid synthase, and the detection of such effects using various metabonomic technologies, including liquid chromatography/mass spectrometry (LC/MS) and stable isotope-labeled MS. Stable isotope-mediated tracing technologies offer exciting opportunities for defining specific target(s) for food components. Exposures, especially during the early transition phase from normal to cancer, are critical for the translation of knowledge about food components into effective prevention strategies. Although appropriate dietary exposures needed to alter cellular metabolism remain inconsistent and/or ill-defined, validated metabonomic biomarkers for dietary components hold promise for establishing effective strategies for cancer prevention.

Bioactive Food Components and Cancer-Specific Metabonomic Profiles

Young S. Kim and John A. Milner
Journal of Biomedicine and Biotechnology 2011, Art ID 721213, 9 pages
http://dx.doi.org:/10.1155/2011/721213

This reviewer poses the following observation.  The importance of the pyridine nucleotide reduced/oxidized ratio has not been alluded to here, but the importance cannot be understated. It has relevance to the metabolic functions of anabolism and catabolism of the visceral organs.  The importance of this has ties to the pentose monophosphate pathway. The importance of the pyridine nucleotide transhydrogenase reaction remains largely unexplored.  In reference to the NAD-redox state, the observation was made by Nathan O. Kaplan that the organs may be viewed with respect to their primary functions in anabolic or high energy catabolic activities. Thus we find that the endocrine organs are largely tied to anabolic functioning, and to NADP, whereas cardiac and skeletal muscle are highly dependent on NAD. The consequence of this observed phenomenon appears to be related to a difference in the susceptibility to malignant transformation.  In the case of the gastrointestinal tract, the rate of turnover of the epithelium is very high. However, with the exception of the liver, there is no major activity other than cell turnover. In the case of the liver, there is a major commitment to synthesis of lipids, storage of fuel, and synthesis of proteins, which is largely anabolic, but there is also a major activity in detoxification, which is not.  In addition, the liver has a double circulation. As a result, a Zahn infarct is uncommon.  Now we might also consider the heart.  The heart is a muscle syncytium with a high need for oxygen.  Cutting of the oxygen supply makes the myocytes vulnerable to ischemic insult and abberant rhythm abnormalities.  In addition, the cardiomyocyte can take up lactic acid from the circulation for fuel, which is tied to the utilization of lactate from vigorous skeletal muscle activity.  The skeletal muscle is tied to glycolysis in normal function, which has a poor generation of ATP, so that the recycling of excess lactic acid is required by cardiac muscle and hepatocytes.  This has not been a part of the discussion, but this reviewer considers it important to remember in considering the organ-specific tendencies to malignant transformation.

Comment (Aurelian Udristioiu):

Otto Warburg observed that many cancers lose their capacity for mitochondrial respiration, limiting ATP production to anaerobic glycolytic pathways. The phenomenon is particularly prevalent in aggressive malignancies, most of which are also hypoxic [1].
Hypoxia induces a stochastic imbalance between the numbers of reduced mitochondrial species vs. available oxygen, resulting in increased reactive oxygen species (ROS) whose toxicity can lead to apoptotic cell death.
Mechanism involves inhibition of glycolytic ATP production via a Randle-like cycle while increased uncoupling renders cancers unable to produce compensatory ATP from respiration-.generation in the presence of intact tricarboxylic acid (TCA) enzyme.
One mitochondrial adaptation to increased ROS is over-expression of the uncoupling protein 2 (UCP2) that has been reported in multiple human cancer cell lines [2-3]. Increased UCP2 expression was also associated with reduced ATP production in malignant oxyphilic mouse leukemia and human lymphoma cell lines [4].
Hypoxia reduces the ability of cells to maintain their energy levels, because less ATP is obtained from glycolysis than from oxidative phosphorylation. Cells adapt to hypoxia by activating the expression of mutant genes in glycolysis.
-Severe hypoxia causes a high mutation rate, resulting in point mutations that may be explained by reduced DNA mismatch repairing activity.
The most direct induction of apoptosis caused by hypoxia is determined by the inhibition of the electron carrier chain from the inner membrane of the mitochondria. The lack of oxygen inhibits the transport of protons and thereby causes a decrease in membrane potential. Cell survival under conditions of mild hypoxia is mediated by phosphoinositide-3 kinase (PIK3) using severe hypoxia or anoxia, and then cells initiate a cascade of events that lead to apoptosis [5].
After DNA damage, a very important regulator of apoptosis is the p53 protein. This tumor suppressor gene has mutations in over 60% of human tumors and acts as a suppressor of cell division. The growth-suppressive effects of p53 are considered to be mediated through the transcriptional trans-activation activity of the protein. In addition to the maturational state of the clonal tumor, the prognosis of patients with CLL is dependent of genetic changes within the neoplastic cell population.

1.Warburg O. On the origin of cancer cells. Science 1956; 123 (3191):309-314
PubMed Abstract ; Publisher Full Text

2.Giardina TM, Steer JH, Lo SZ, Joyce DA. Uncoupling protein-2 accumulates rapidly in the inner mitochondrial membrane during mitochondrial reactive oxygen stress in macrophages. Biochim Biophys Acta 2008, 1777(2):118-129. PubMed Abstract | Publisher Full Text

3. Horimoto M, Resnick MB, Konkin TA, Routhier J, Wands JR, Baffy G. Expression of uncoupling protein-2 in human colon cancer. Clin Cancer Res 2004; 10 (18 Pt1):6203-6207. PubMed Abstract | Publisher Full Text

4. Randle PJ, England PJ, Denton RM. Control of the tricarboxylate cycle and it interactions with glycolysis during acetate utilization in rat heart. Biochem J 1970; 117(4):677-695. PubMed Abstract | PubMed Central Full Text

5. Gillies RJ, Robey I, Gatenby RA. Causes and consequences of increased glucose metabolism of cancers. J Nucl Med 2008; 49(Suppl 2):24S-42S. PubMed Abstract | Publisher Full Text

Shortened version of Comment –

Hypoxia induces a stochastic imbalance between the numbers of reduced mitochondrial species vs. available oxygen, resulting in increased reactive oxygen species (ROS) whose toxicity can lead to apoptotic cell death.
Mechanism involves inhibition of glycolytic ATP production via a Randle-like cycle while increased uncoupling renders cancers unable to produce compensatory ATP from respiration-.generation in the presence of intact tricarboxylic acid (TCA) enzyme.
One mitochondrial adaptation to increased ROS is over-expression of the uncoupling protein 2 (UCP2) that has been reported in multiple human cancer cell lines. Increased UCP2 expression was also associated with reduced ATP production in malignant oxyphilic mouse leukemia and human lymphoma cell lines.
Severe hypoxia causes a high mutation rate, resulting in point mutations that may be explained by reduced DNA mismatch repairing activity.

Read Full Post »

Hypoxia Inducible Factor 1 (HIF-1)

Writer and Curator: Larry H Bernstein, MD, FCAP

7.9  Hypoxia Inducible Factor 1 (HIF-1)

7.9.1 Hypoxia and mitochondrial oxidative metabolism

7.9.2 Hypoxia promotes isocitrate dehydrogenase-dependent carboxylation of α-ketoglutarate to citrate to support cell growth and viability

7.9.3 Hypoxia-Inducible Factors in Physiology and Medicine

7.9.4 Hypoxia-inducible factor 1. Regulator of mitochondrial metabolism and mediator of ischemic preconditioning

7.9.5 Regulation of cancer cell metabolism by hypoxia-inducible factor 1

7.9.6 Coming up for air. HIF-1 and mitochondrial oxygen consumption

7.9.7 HIF-1 mediates adaptation to hypoxia by actively downregulating mitochondrial oxygen consumption

7.9.8 HIF-1. upstream and downstream of cancer metabolism

7.9.9 In Vivo HIF-Mediated Reductive Carboxylation

7.9.10 Evaluation of HIF-1 inhibitors as anticancer agents


7.9.1 Hypoxia and mitochondrial oxidative metabolism

Solaini G1Baracca ALenaz GSgarbi G.
Biochim Biophys Acta. 2010 Jun-Jul; 1797(6-7):1171-7
http://dx.doi.org/10.1016/j.bbabio.2010.02.011

It is now clear that mitochondrial defects are associated with a large variety of clinical phenotypes. This is the result of the mitochondria’s central role in energy production, reactive oxygen species homeostasis, and cell death. These processes are interdependent and may occur under various stressing conditions, among which low oxygen levels (hypoxia) are certainly prominent. Cells exposed to hypoxia respond acutely with endogenous metabolites and proteins promptly regulating metabolic pathways, but if low oxygen levels are prolonged, cells activate adapting mechanisms, the master switch being the hypoxia-inducible factor 1 (HIF-1). Activation of this factor is strictly bound to the mitochondrial function, which in turn is related with the oxygen level. Therefore in hypoxia, mitochondria act as [O2] sensors, convey signals to HIF-1directly or indirectly, and contribute to the cell redox potential, ion homeostasis, and energy production. Although over the last two decades cellular responses to low oxygen tension have been studied extensively, mechanisms underlying these functions are still indefinite. Here we review current knowledge of the mitochondrial role in hypoxia, focusing mainly on their role in cellular energy and reactive oxygen species homeostasis in relation with HIF-1 stabilization. In addition, we address the involvement of HIF-1 and the inhibitor protein of F1F0 ATPase in the hypoxia-induced mitochondrial autophagy.

Over the last two decades a defective mitochondrial function associated with hypoxia has been invoked in many diverse complex disorders, such as type 2 diabetes [1] and [2], Alzheimer’s disease [3] and [4], cardiac ischemia/reperfusion injury [5] and [6], tissue inflammation [7], and cancer [8][9][10],[11] and [12].

The [O2] in air-saturated aqueous buffer at 37 °C is approx. 200 μM [13]; however, mitochondria in vivo are exposed to a considerably lower [O2] that varies with tissue and physiological state. Under physiological conditions, most human resting cells experience some 5% oxygen tension, however the [O2] gradient occurring between the extracellular environment and mitochondria, where oxygen is consumed by cytochrome c oxidase, results in a significantly lower [O2] exposition of mitochondria. Below this oxygen level, most mammalian tissues are exposed to hypoxic conditions  [14]. These may arise in normal development, or as a consequence of pathophysiological conditions where there is a reduced oxygen supply due to a respiratory insufficiency or to a defective vasculature. Such conditions include inflammatory diseases, diabetes, ischemic disorders (cerebral or cardiovascular), and solid tumors. Mitochondria consume the greatest amount (some 85–90%) of oxygen in cells to allow oxidative phosphorylation (OXPHOS), which is the primary metabolic pathway for ATP production. Therefore hypoxia will hamper this metabolic pathway, and if the oxygen level is very low, insufficient ATP availability might result in cell death [15].

When cells are exposed to an atmosphere with reduced oxygen concentration, cells readily “respond” by inducing adaptive reactions for their survival through the AMP-activated protein kinase (AMPK) pathway (see for a recent review [16]) which inter alia increases glycolysis driven by enhanced catalytic efficiency of some enzymes, including phosphofructokinase-1 and pyruvate kinase (of note, this oxidative flux is thermodynamically allowed due to both reduced phosphorylation potential [ATP]/([ADP][Pi]) and the physiological redox state of the cell). However, this is particularly efficient only in the short term, therefore cells respond to prolonged hypoxia also by stimulation of hypoxia-inducible factors (HIFs: HIF-1 being the mostly studied), which are heterodimeric transcription factors composed of α and β subunits, first described by Semenza and Wang [17]. These HIFs in the presence of hypoxic oxygen levels are activated through a complex mechanism in which the oxygen tension is critical (see below). Afterwards HIFs bind to hypoxia-responsive elements, activating the transcription of more than two hundred genes that allow cells to adapt to the hypoxic environment [18] and [19].

Several excellent reviews appeared in the last few years describing the array of changes induced by oxygen deficiency in both isolated cells and animal tissues. In in vivo models, a coordinated regulation of tissue perfusion through vasoactive molecules such as nitric oxide and the action of carotid bodies rapidly respond to changes in oxygen demand [20][21][22][23] and [24]. Within isolated cells, hypoxia induces significant metabolic changes due to both variation of metabolites level and activation/inhibition of enzymes and transporters; the most important intracellular effects induced by different pathways are expertly described elsewhere (for recent reviews, see [25][26] and [27]). It is reasonable to suppose that the type of cells and both the severity and duration of hypoxia may determine which pathways are activated/depressed and their timing of onset [3][6][10][12][23] and [28]. These pathways will eventually lead to preferential translation of key proteins required for adaptation and survival to hypoxic stress. Although in the past two decades, the discovery of HIF-1 by Gregg Semenza et al. provided a molecular platform to investigate the mechanism underlying responses to oxygen deprivation, the molecular and cellular biology of hypoxia has still to be completely elucidated. This review summarizes recent experimental data concerned with mitochondrial structure and function adaptation to hypoxia and evaluates it in light of the main structural and functional parameters defining the mitochondrial bioenergetics. Since mitochondria contain an inhibitor protein, IF1, whose action on the F1F0 ATPase has been considered for decades of critical importance in hypoxia/ischemia, particular notice will be dedicated to analyze molecular aspects of IF1 regulation of the enzyme and its possible role in the metabolic changes induced by low oxygen levels in cells.

Mechanism(s) of HIF-1 activation

HIF-1 consists of an oxygen-sensitive HIF-1α subunit that heterodimerizes with the HIF-1β subunit to bind DNA. In high O2 tension, HIF-1α is oxidized (hydroxylated) by prolyl hydroxylases (PHDs) using α-ketoglutarate derived from the tricarboxylic acid (TCA) cycle. The hydroxylated HIF-1α subunit interacts with the von Hippel–Lindau protein, a critical member of an E3 ubiquitin ligase complex that polyubiquitylates HIF. This is then catabolized by proteasomes, such that HIF-1α is continuously synthesized and degraded under normoxic conditions [18]. Under hypoxia, HIF-1α hydroxylation does not occur, thereby stabilizing HIF-1 (Fig. 1). The active HIF-1 complex in turn binds to a core hypoxia response element in a wide array of genes involved in a diversity of biological processes, and directly transactivates glycolytic enzyme genes [29]. Notably, O2 concentration, multiple mitochondrial products, including the TCA cycle intermediates and reactive oxygen species, can coordinate PHD activity, HIF stabilization, hence the cellular responses to O2 depletion [30] and [31]. Incidentally, impaired TCA cycle flux, particularly if it is caused by succinate dehydrogenase dysfunction, results in decreased or loss of energy production from both the electron-transport chain and the Krebs cycle, and also in overproduction of free radicals [32]. This leads to severe early-onset neurodegeneration or, as it occurs in individuals carrying mutations in the non-catalytic subunits of the same enzyme, to tumors such as phaeochromocytoma and paraganglioma. However, impairment of the TCA cycle may be relevant also for the metabolic changes occurring in mitochondria exposed to hypoxia, since accumulation of succinate has been reported to inhibit PHDs [33]. It has to be noticed that some authors believe reactive oxygen species (ROS) to be essential to activate HIF-1 [34], but others challenge this idea [35], therefore the role of mitochondrial ROS in the regulation of HIF-1 under hypoxia is still controversial [36]. Moreover, the contribution of functional mitochondria to HIF-1 regulation has also been questioned by others [37][38] and [39].

http://ars.els-cdn.com/content/image/1-s2.0-S0005272810000575-gr1.jpg

Major mitochondrial changes in hypoxia

Major mitochondrial changes in hypoxia

Fig. 1. Major mitochondrial changes in hypoxia. Hypoxia could decrease electron-transport rate determining Δψm reduction, increased ROS generation, and enhanced NO synthase. One (or more) of these factors likely contributes to HIF stabilization, that in turn induces metabolic adaptation of both hypoxic cells and mitophagy. The decreased Δψm could also induce an active binding of IF1, which might change mitochondrial morphology and/or dynamics, and inhibit mitophagy. Solid lines indicate well established hypoxic changes in cells, whilst dotted lines indicate changes not yet stated. Inset, relationships between extracellular O2concentration and oxygen tension.

Oxygen is a major determinant of cell metabolism and gene expression, and as cellular O2 levels decrease, either during isolated hypoxia or ischemia-associated hypoxia, metabolism and gene expression profiles in the cells are significantly altered. Low oxygen reduces OXPHOS and Krebs cycle rates, and participates in the generation of nitric oxide (NO), which also contributes to decrease respiration rate [23] and [40]. However, oxygen is also central in the generation of reactive oxygen species, which can participate in cell signaling processes or can induce irreversible cellular damage and death [41].

As specified above, cells adapt to oxygen reduction by inducing active HIF, whose major effect on cells energy homeostasis is the inactivation of anabolism, activation of anaerobic glycolysis, and inhibition of the mitochondrial aerobic metabolism: the TCA cycle, and OXPHOS. Since OXPHOS supplies the majority of ATP required for cellular processes, low oxygen tension will severely reduce cell energy availability. This occurs through several mechanisms: first, reduced oxygen tension decreases the respiration rate, due first to nonsaturating substrate for cytochrome c oxidase (COX), secondarily, to allosteric modulation of COX[42]. As a consequence, the phosphorylation potential decreases, with enhancement of the glycolysis rate primarily due to allosteric increase of phosphofructokinase activity; glycolysis however is poorly efficient and produces lactate in proportion of 0.5 mol/mol ATP, which eventually drops cellular pH if cells are not well perfused, as it occurs under defective vasculature or ischemic conditions  [6]. Besides this “spontaneous” (thermodynamically-driven) shift from aerobic to anaerobic metabolism which is mediated by the kinetic changes of most enzymes, the HIF-1 factor activates transcription of genes encoding glucose transporters and glycolytic enzymes to further increase flux of reducing equivalents from glucose to lactate[43] and [44]. Second, HIF-1 coordinates two different actions on the mitochondrial phase of glucose oxidation: it activates transcription of the PDK1 gene encoding a kinase that phosphorylates and inactivates pyruvate dehydrogenase, thereby shunting away pyruvate from the mitochondria by preventing its oxidative decarboxylation to acetyl-CoA [45] and [46]. Moreover, HIF-1 induces a switch in the composition of cytochrome c oxidase from COX4-1 to COX4-2 isoform, which enhances the specific activity of the enzyme. As a result, both respiration rate and ATP level of hypoxic cells carrying the COX4-2 isoform of cytochrome c oxidase were found significantly increased with respect to the same cells carrying the COX4-1 isoform [47]. Incidentally, HIF-1 can also increase the expression of carbonic anhydrase 9, which catalyses the reversible hydration of CO2 to HCO3 and H+, therefore contributing to pH regulation.

Effects of hypoxia on mitochondrial structure and dynamics

Mitochondria form a highly dynamic tubular network, the morphology of which is regulated by frequent fission and fusion events. The fusion/fission machineries are modulated in response to changes in the metabolic conditions of the cell, therefore one should expect that hypoxia affect mitochondrial dynamics. Oxygen availability to cells decreases glucose oxidation, whereas oxygen shortage consumes glucose faster in an attempt to produce ATP via the less efficient anaerobic glycolysis to lactate (Pasteur effect). Under these conditions, mitochondria are not fueled with substrates (acetyl-CoA and O2), inducing major changes of structure, function, and dynamics (for a recent review see [48]). Concerning structure and dynamics, one of the first correlates that emerge is that impairment of mitochondrial fusion leads to mitochondrial depolarization, loss of mtDNA that may be accompanied by altered respiration rate, and impaired distribution of the mitochondria within cells [49][50] and [51]. Indeed, exposure of cortical neurons to moderate hypoxic conditions for several hours, significantly altered mitochondrial morphology, decreased mitochondrial size and reduced mitochondrial mean velocity. Since these effects were either prevented by exposing the neurons to inhibitors of nitric oxide synthase or mimicked by NO donors in normoxia, the involvement of an NO-mediated pathway was suggested [52]. Mitochondrial motility was also found inhibited and controlled locally by the [ADP]/[ATP] ratio [53]. Interestingly, the author used an original approach in which mitochondria were visualized using tetramethylrhodamineethylester and their movements were followed by applying single-particle tracking.

Of notice in this chapter is that enzymes controlling mitochondrial morphology regulators provide a platform through which cellular signals are transduced within the cell in order to affect mitochondrial function [54]. Accordingly, one might expect that besides other mitochondrial factors [30] and [55] playing roles in HIF stabilization, also mitochondrial morphology might reasonably be associated with HIF stabilization. In order to better define the mechanisms involved in the morphology changes of mitochondria and in their dynamics when cells experience hypoxic conditions, these pioneering studies should be corroborated by and extended to observations on other types of cells focusing also on single proteins involved in both mitochondrial fusion/fission and motion.

Effects of hypoxia on the respiratory chain complexes

O2 is the terminal acceptor of electrons from cytochrome c oxidase (Complex IV), which has a very high affinity for it, being the oxygen concentration for half-maximal respiratory rate at pH 7.4 approximately 0.7 µM [56]. Measurements of mitochondrial oxidative phosphorylation indicated that it is not dependent on oxygen concentration up to at least 20 µM at pH 7.0 and the oxygen dependence becomes markedly greater as the pH is more alkaline [56]. Similarly, Moncada et al. [57] found that the rate of O2 consumption remained constant until [O2] fell below 15 µM. Accordingly, most reports in the literature consider hypoxic conditions occurring in cells at 5–0.5% O2, a range corresponding to 46–4.6 µM O2 in the cells culture medium (see Fig. 1 inset). Since between the extracellular environment and mitochondria an oxygen pressure gradient is established [58], the O2 concentration experienced by Complex IV falls in the range affecting its kinetics, as reported above.

Under these conditions, a number of changes on the OXPHOS machinery components, mostly mediated by HIF-1 have been found. Thus, Semenza et al. [59] and others thereafter [46] reported that activation of HIF-1α induces pyruvate dehydrogenase kinase, which inhibits pyruvate dehydrogenase, suggesting that respiration is decreased by substrate limitation. Besides, other HIF-1 dependent mechanisms capable to affect respiration rate have been reported. First, the subunit composition of COX is altered in hypoxic cells by increased degradation of the COX4-1 subunit, which optimizes COX activity under aerobic conditions, and increased expression of the COX4-2 subunit, which optimizes COX activity under hypoxic conditions [29]. On the other hand, direct assay of respiration rate in cells exposed to hypoxia resulted in a significant reduction of respiration [60]. According with the evidence of Zhang et al., the respiration rate decrease has to be ascribed to mitochondrial autophagy, due to HIF-1-mediated expression of BNIP3. This interpretation is in line with preliminary results obtained in our laboratory where the assay of the citrate synthase activity of cells exposed to different oxygen tensions was performed. Fig. 2 shows the citrate synthase activity, which is taken as an index of the mitochondrial mass [11], with respect to oxygen tension: [O2] and mitochondrial mass are directly linked.

Citrate synthase activity

Citrate synthase activity

http://ars.els-cdn.com/content/image/1-s2.0-S0005272810000575-gr2.jpg

Fig. 2. Citrate synthase activity. Human primary fibroblasts, obtained from skin biopsies of 5 healthy donors, were seeded at a density of 8,000 cells/cm2 in high glucose Dulbecco’s Modified Eagle Medium, DMEM (25 mM glucose, 110 mg/l pyruvate, and 4 mM glutamine) supplemented with 15% Foetal Bovine Serum (FBS). 18 h later, cell culture dishes were washed once with Hank’s Balanced Salt Solution (HBSS) and the medium was replaced with DMEM containing 5 mM glucose, 110 mg/l pyruvate, and 4 mM glutamine supplemented with 15% FBS. Cell culture dishes were then placed into an INVIVO2 humidified hypoxia workstation (Ruskinn Technologies, Bridgend, UK) for 72 h changing the medium at 48 h, and oxygen partial pressure (tension) conditions were: 20%, 4%, 2%, 1% and 0.5%. Cells were subsequently collected within the workstation with trypsin-EDTA (0.25%), washed with PBS and resuspended in a buffer containing 10 mM Tris/HCl, 0.1 M KCl, 5 mM KH2PO4, 1 mM EGTA, 3 mM EDTA, and 2 mM MgCl2 pH 7.4 (all the solutions were preconditioned to the appropriate oxygen tension condition). The citrate synthase activity was assayed essentially by incubating 40 µg of cells with 0.02% Triton X-100, and monitoring the reaction by measuring spectrophotometrically the rate of free coenzyme A released, as described in [90]. Enzymatic activity was expressed as nmol/min/mg of protein. Three independent experiments were carried out and assays were performed in either duplicate or triplicate.

However, the observations of Semenza et al. must be seen in relation with data reported by Moncada et al.[57] and confirmed by others [61] in which it is clearly shown that when cells (various cell lines) experience hypoxic conditions, nitric oxide synthases (NOSs) are activated, therefore NO is released. As already mentioned above, NO is a strong competitor of O2 for cytochrome c oxidase, whose apparent Km results increased, hence reduction of mitochondrial cytochromes and all the other redox centres of the respiratory chain occurs. In addition, very recent data indicate a potential de-activation of Complex I when oxygen is lacking, as it occurs in prolonged hypoxia [62]. According to Hagen et al. [63] the NO-dependent inhibition of cytochrome c oxidase should allow “saved” O2 to redistribute within the cell to be used by other enzymes, including PHDs which inactivate HIF. Therefore, unless NO inhibition of cytochrome c oxidase occurs only when [O2] is very low, inhibition of mitochondrial oxygen consumption creates the paradox of a situation in which the cell may fail to register hypoxia. It has been tempted to solve this paradox, but to date only hypotheses have been proposed [23] and [26]. Interestingly, recent observations on yeast cells exposed to hypoxia revealed abnormal protein carbonylation and protein tyrosine nitration that were ascribed to increased mitochondrially generated superoxide radicals and NO, two species typically produced at low oxygen levels, that combine to form ONOO [64]. Based on these studies a possible explanation has been proposed for the above paradox.

Finally, it has to be noticed that the mitochondrial respiratory deficiency observed in cardiomyocytes of dogs in which experimental heart failure had been induced lies in the supermolecular assembly rather than in the individual components of the electron-transport chain [65]. This observation is particularly intriguing since loss of respirasomes is thought to facilitate ROS generation in mitochondria [66], therefore supercomplexes disassembly might explain the paradox of reduced [O2] and the enhanced ROS found in hypoxic cells. Specifically, hypoxia could reduce mitochondrial fusion by impairing mitochondrial membrane potential, which in turn could induce supercomplexes disassembly, increasing ROS production[11].

Complex III and ROS production

It has been estimated that, under normoxic physiological conditions, 1–2% of electron flow through the mitochondrial respiratory chain gives rise to ROS [67] and [68]. It is now recognized that the major sites of ROS production are within Complexes I and III, being prevalent the contribution of Complex I [69] (Fig. 3). It might be expected that hypoxia would decrease ROS production, due to the low level of O2 and to the diminished mitochondrial respiration [6] and [46], but ROS level is paradoxically increased. Indeed, about a decade ago, Chandel et al. [70] provided good evidence that mitochondrial reactive oxygen species trigger hypoxia-induced transcription, and a few years later the same group [71] showed that ROS generated at Complex III of the mitochondrial respiratory chain stabilize HIF-1α during hypoxia (Fig. 1 and Fig. 3). Although others have proposed mechanisms indicating a key role of mitochondria in HIF-1α regulation during hypoxia (for reviews see [64] and [72]), the contribution of mitochondria to HIF-1 regulation has been questioned by others [35][36] and [37]. Results of Gong and Agani [35] for instance show that inhibition of electron-transport Complexes I, III, and IV, as well as inhibition of mitochondrial F0F1 ATPase, prevents HIF-1α expression and that mitochondrial reactive oxygen species are not involved in HIF-1α regulation during hypoxia. Concurrently, Tuttle et al. [73], by means of a non invasive, spectroscopic approach, could find no evidence to suggest that ROS, produced by mitochondria, are needed to stabilize HIF-1α under moderate hypoxia. The same authors found the levels of HIF-1α comparable in both normal and ρ0 cells (i.e. cells lacking mitochondrial DNA). On the contrary, experiments carried out on genetic models consisting of either cells lacking cytochrome c or ρ0 cells both could evidence the essential role of mitochondrial respiration to stabilize HIF-1α [74]. Thus, cytochrome c null cells, being incapable to respire, exposed to moderate hypoxia (1.5% O2) prevented oxidation of ubiquinol and generation of the ubisemiquinone radical, thus eliminating superoxide formation at Complex III [71]. Concurrently, ρ0 cells lacking electron transport, exposed 4 h to moderate hypoxia failed to stabilize HIF-1α, suggesting the essential role of the respiratory chain for the cellular sensing of low O2 levels. In addition, recent evidence obtained on genetic manipulated cells (i.e. cytochrome b deficient cybrids) showed increased ROS levels and stabilized HIF-1α protein during hypoxia [75]. Moreover, RNA interference of the Complex III subunit Rieske iron sulfur protein in the cytochrome b deficient cells, abolished ROS generation at the Qo site of Complex III, preventing HIF-1α stabilization. These observations, substantiated by experiments with MitoQ, an efficient mitochondria-targeted antioxidant, strongly support the involvement of mitochondrial ROS in regulating HIF-1α. Nonetheless, collectively, the available data do not allow to definitely state the precise role of mitochondrial ROS in regulating HIF-1α, but the pathway stabilizing HIF-1α appears undoubtedly mitochondria-dependent [30].

Overview of mitochondrial electron and proton flux in hypoxia

Overview of mitochondrial electron and proton flux in hypoxia

Overview of mitochondrial electron and proton flux in hypoxia

http://ars.els-cdn.com/content/image/1-s2.0-S0005272810000575-gr3.jpg

Fig. 3. Overview of mitochondrial electron and proton flux in hypoxia. Electrons released from reduced cofactors (NADH and FADH2) under normoxia flow through the redox centres of the respiratory chain (r.c.) to molecular oxygen (blue dotted line), to which a proton flux from the mitochondrial matrix to the intermembrane space is coupled (blue arrows). Protons then flow back to the matrix through the F0 sector of the ATP synthase complex, driving ATP synthesis. ATP is carried to the cell cytosol by the adenine nucleotide translocator (blue arrows). Under moderate to severe hypoxia, electrons escape the r.c. redox centres and reduce molecular oxygen to the superoxide anion radical before reaching the cytochrome c (red arrow). Under these conditions, to maintain an appropriate Δψm, ATP produced by cytosolic glycolysis enters the mitochondria where it is hydrolyzed by the F1F0ATPase with extrusion of protons from the mitochondrial matrix (red arrows).

Hypoxia and ATP synthase

The F1F0 ATPase (ATP synthase) is the enzyme responsible of catalysing ADP phosphorylation as the last step of OXPHOS. It is a rotary motor using the proton motive force across the mitochondrial inner membrane to drive the synthesis of ATP [76]. It is a reversible enzyme with ATP synthesis or hydrolysis taking place in the F1 sector at the matrix side of the membrane, chemical catalysis being coupled to H+transport through the transmembrane F0 sector.

Under normoxia the enzyme synthesizes ATP, but when mitochondria experience hypoxic conditions the mitochondrial membrane potential (Δψm) decreases below its endogenous steady-state level (some 140 mV, negative inside the matrix [77]) and the F1F0 ATPase may work in the reversal mode: it hydrolyses ATP (produced by anaerobic glycolysis) and uses the energy released to pump protons from the mitochondrial matrix to the intermembrane space, concurring with the adenine nucleotide translocator (i.e. in hypoxia it exchanges cytosolic ATP4− for matrix ADP3−) to maintain the physiological Δψm ( Fig. 3). Since under conditions of limited oxygen availability the decline in cytoplasmic high energy phosphates is mainly due to hydrolysis by the ATP synthase working in reverse [6] and [78], the enzyme must be strictly regulated in order to avoid ATP dissipation. This is achieved by a natural protein, the H+ψm-dependent IF1, that binds to the catalytic F1 sector at low pH and low Δψm (such as it occurs in hypoxia/ischemia) [79]. IF1 binding to the ATP synthase results in a rapid and reversible inhibition of the enzyme [80], which could reach about 50% of maximal activity (for recent reviews see [6] and [81]).

Besides this widely studied effect, IF1 appears to be associated with ROS production and mitochondrial autophagy (mitophagy). This is a mechanism involving the catabolic degradation of macromolecules and organelles via the lysosomal pathway that contributes to housekeeping and regenerate metabolites. Autophagic degradation is involved in the regulation of the ageing process and in several human diseases, such as myocardial ischemia/reperfusion [82], Alzheimer’s Disease, Huntington diseases, and inflammatory diseases (for recent reviews see [83] and [84], and, as mentioned above, it promotes cell survival by reducing ROS and mtDNA damage under hypoxic conditions.

Campanella et al. [81] reported that, in HeLa cells under normoxic conditions, basal autophagic activity varies in relation to the expression levels of IF1. Accordingly, cells overexpressing IF1 result in ROS production similar to controls, conversely cells in which IF1 expression is suppressed show an enhanced ROS production. In parallel, the latter cells show activation of the mitophagy pathway (Fig. 1), therefore suggesting that variations in IF1 expression level may play a significant role in defining two particularly important parameters in the context of the current review: rates of ROS generation and mitophagy. Thus, the hypoxia-induced enhanced expression level of IF1[81] should be associated with a decrease of both ROS production and autophagy, which is in apparent conflict with the hypoxia-induced ROS increase and with the HIF-1-dependent mitochondrial autophagy shown by Zhang et al. [60] as an adaptive metabolic response to hypoxia. However, in the experiments of Zhang et al. the cells were exposed to hypoxia for 48 h, whereas the F1F0-ATPase inhibitor exerts a prompt action on the enzyme and to our knowledge, it has never been reported whether its action persists during prolonged hypoxic expositions. Pertinent with this problem is the very recent observation that IEX-1 (immediate early response gene X-1), a stress-inducible gene that suppresses production of ROS and protects cells from apoptosis [85], targets the mitochondrial F1F0-ATPase inhibitor for degradation, reducing ROS by decreasing Δψm. It has to be noticed that the experiments described were carried out under normal oxygen availability, but it does not seem reasonable to rule out IEX-1 from playing a role under stress conditions as those induced by hypoxia in cells, therefore this issue might deserve an investigation also at low oxygen levels.

In conclusion, data are still emerging regarding the regulation of mitochondrial function by the F1F0 ATPase within hypoxic responses in different cellular and physiological contexts. Given the broad pathophysiological role of hypoxic cellular modulation, an understanding of the subtle tuning among different effectors of the ATP synthase is desirable to eventually target future therapeutics most effectively. Our laboratory is actually involved in carrying out investigations to clarify this context.

Conclusions and perspectives

The mitochondria are important cellular platforms that both propagate and initiate intracellular signals that lead to overall cellular and metabolic responses. During the last decades, a significant amount of relevant data has been obtained on the identification of mechanisms of cellular adaptation to hypoxia. In hypoxic cells there is an enhanced transcription and synthesis of several glycolytic pathway enzymes/transporters and reduction of synthesis of proteins involved in mitochondrial catabolism. Although well defined kinetic parameters of reactions in hypoxia are lacking, it is usually assumed that these transcriptional changes lead to metabolic flux modification. The required biochemical experimentation has been scarcely addressed until now and only in few of the molecular and cellular biology studies the transporter and enzyme kinetic parameters and flux rate have been determined, leaving some uncertainties.

Central to mitochondrial function and ROS generation is an electrochemical proton gradient across the mitochondrial inner membrane that is established by the proton pumping activity of the respiratory chain, and that is strictly linked to the F1F0-ATPase function. Evaluation of the mitochondrial membrane potential in hypoxia has only been studied using semiquantitative methods based on measurements of the fluorescence intensity of probes taken up by cells experiencing normal or hypoxic conditions. However, this approach is intrinsically incorrect due to the different capability that molecular oxygen has to quench fluorescence [86] and [87] and to the uncertain concentration the probe attains within mitochondria, whose mass may be reduced by a half in hypoxia [60]. In addition, the uncertainty about measurement of mitochondrial superoxide radical and H2O2 formation in vivo [88] hampers studies on the role of mitochondrial ROS in hypoxic oxidative damage, redox signaling, and HIF-1 stabilization.

The duration and severity of hypoxic stress differentially activate the responses discussed throughout and lead to substantial phenotypic variations amongst tissues and cell models, which are not consistently and definitely known. Certainly, understanding whether a hierarchy among hypoxia response mechanisms exists and which are the precise timing and conditions of each mechanism to activate, will improve our knowledge of the biochemical mechanisms underlying hypoxia in cells, which eventually may contribute to define therapeutic targets in hypoxia-associated diseases. To this aim it might be worth investigating the hypoxia-induced structural organization of both the respiratory chain enzymes in supramolecular complexes and the assembly of the ATP synthase to form oligomers affecting ROS production [65] and inner mitochondrial membrane structure [89], respectively.

7.9.2 Hypoxia promotes isocitrate dehydrogenase-dependent carboxylation of α-ketoglutarate to citrate to support cell growth and viability

DR WisePS WardJES ShayJR CrossJJ Gruber, UM Sachdeva, et al.
Proc Nat Acad Sci Oct 27, 2011; 108(49):19611–19616
http://dx.doi.org:/10.1073/pnas.1117773108

Citrate is a critical metabolite required to support both mitochondrial bioenergetics and cytosolic macromolecular synthesis. When cells proliferate under normoxic conditions, glucose provides the acetyl-CoA that condenses with oxaloacetate to support citrate production. Tricarboxylic acid (TCA) cycle anaplerosis is maintained primarily by glutamine. Here we report that some hypoxic cells are able to maintain cell proliferation despite a profound reduction in glucose-dependent citrate production. In these hypoxic cells, glutamine becomes a major source of citrate. Glutamine-derived α-ketoglutarate is reductively carboxylated by the NADPH-linked mitochondrial isocitrate dehydrogenase (IDH2) to form isocitrate, which can then be isomerized to citrate. The increased IDH2-dependent carboxylation of glutamine-derived α-ketoglutarate in hypoxia is associated with a concomitant increased synthesis of 2-hydroxyglutarate (2HG) in cells with wild-type IDH1 and IDH2. When either starved of glutamine or rendered IDH2-deficient by RNAi, hypoxic cells are unable to proliferate. The reductive carboxylation of glutamine is part of the metabolic reprogramming associated with hypoxia-inducible factor 1 (HIF1), as constitutive activation of HIF1 recapitulates the preferential reductive metabolism of glutamine-derived α-ketoglutarate even in normoxic conditions. These data support a role for glutamine carboxylation in maintaining citrate synthesis and cell growth under hypoxic conditions.

Citrate plays a critical role at the center of cancer cell metabolism. It provides the cell with a source of carbon for fatty acid and cholesterol synthesis (1). The breakdown of citrate by ATP-citrate lyase is a primary source of acetyl-CoA for protein acetylation (2). Metabolism of cytosolic citrate by aconitase and IDH1 can also provide the cell with a source of NADPH for redox regulation and anabolic synthesis. Mammalian cells depend on the catabolism of glucose and glutamine to fuel proliferation (3). In cancer cells cultured at atmospheric oxygen tension (21% O2), glucose and glutamine have both been shown to contribute to the cellular citrate pool, with glutamine providing the major source of the four-carbon molecule oxaloacetate and glucose providing the major source of the two-carbon molecule acetyl-CoA (45). The condensation of oxaloacetate and acetyl-CoA via citrate synthase generates the 6 carbon citrate molecule. However, both the conversion of glucose-derived pyruvate to acetyl-CoA by pyruvate dehydrogenase (PDH) and the conversion of glutamine to oxaloacetate through the TCA cycle depend on NAD+, which can be compromised under hypoxic conditions. This raises the question of how cells that can proliferate in hypoxia continue to synthesize the citrate required for macromolecular synthesis.

This question is particularly important given that many cancers and stem/progenitor cells can continue proliferating in the setting of limited oxygen availability (67). Louis Pasteur first highlighted the impact of hypoxia on nutrient metabolism based on his observation that hypoxic yeast cells preferred to convert glucose into lactic acid rather than burning it in an oxidative fashion. The molecular basis for this shift in mammalian cells has been linked to the activity of the transcription factor HIF1 (810). Stabilization of the labile HIF1α subunit occurs in hypoxia. It can also occur in normoxia through several mechanisms including loss of the von Hippel-Lindau tumor suppressor (VHL), a common occurrence in renal carcinoma (11). Although hypoxia and/or HIF1α stabilization is a common feature of multiple cancers, to date the source of citrate in the setting of hypoxia or HIF activation has not been determined.

Here, we study the sources of hypoxic citrate synthesis in a glioblastoma cell line that proliferates in profound hypoxia (0.5% O2). Glucose uptake and conversion to lactic acid increased in hypoxia. However, glucose conversion into citrate dramatically declined. Glutamine consumption remained constant in hypoxia, and hypoxic cells were addicted to the use of glutamine in hypoxia as a source of α-ketoglutarate. Glutamine provided the major carbon source for citrate synthesis during hypoxia. However, the TCA cycle-dependent conversion of glutamine into citric acid was significantly suppressed. In contrast, there was a relative increase in glutamine-dependent citrate production in hypoxia that resulted from carboxylation of α-ketoglutarate. This reductive synthesis required the presence of mitochondrial isocitrate dehydrogenase 2 (IDH2). In confirmation of the reverse flux through IDH2, the increased reductive metabolism of glutamine-derived α-ketoglutarate in hypoxia was associated with increased synthesis of 2HG. Finally, constitutive HIF1α-expressing cells also demonstrated significant reductive-carboxylation-dependent synthesis of citrate in normoxia and a relative defect in the oxidative conversion of glutamine into citrate. Collectively, the data demonstrate that mitochondrial glutamine metabolism can be rerouted through IDH2-dependent citrate synthesis in support of hypoxic cell growth.

Some Cancer Cells Can Proliferate at 0.5% O2 Despite a Sharp Decline in Glucose-Dependent Citrate Synthesis.

At 21% O2, cancer cells have been shown to synthesize citrate by condensing glucose-derived acetyl-CoA with glutamine-derived oxaloacetate through the activity of the canonical TCA cycle enzyme citrate synthase (4). In contrast, less is known regarding the synthesis of citrate by cells that can continue proliferating in hypoxia. The glioblastoma cell line SF188 is able to proliferate at 0.5% O2 (Fig. 1A), a level of hypoxia that is sufficient to stabilize HIF1α (Fig. 1B) and predicted to limit respiration (1213). Consistent with previous observations in hypoxic cells, we found that SF188 cells demonstrated increased lactate production when incubated in hypoxia (Fig. 1C), and the ratio of lactate produced to glucose consumed increased demonstrating an increase in the rate of anaerobic glycolysis. When glucose-derived carbon in the form of pyruvate is converted to lactate, it is diverted away from subsequent metabolism that can contribute to citrate production. However, we observed that SF188 cells incubated in hypoxia maintain their intracellular citrate to ∼75% of the level maintained under normoxia (Fig. 1D). This prompted an investigation of how proliferating cells maintain citrate production under hypoxia.

SF188 glioblastoma cells proliferate at 0.5% O2 despite a profound reduction in glucose-dependent citrate synthesis.

SF188 glioblastoma cells proliferate at 0.5% O2 despite a profound reduction in glucose-dependent citrate synthesis.

http://www.pnas.org/content/108/49/19611/F1.medium.gif

Fig. 1. SF188 glioblastoma cells proliferate at 0.5% O2 despite a profound reduction in glucose-dependent citrate synthesis. (A) SF188 cells were plated in complete medium equilibrated with 21% O2 (Normoxia) or 0.5% O2 (Hypoxia), total viable cells were counted 24 h and 48 h later (Day 1 and Day 2), and population doublings were calculated. Data are the mean ± SEM of four independent experiments. (B) Western blot demonstrates stabilized HIF1α protein in cells cultured in hypoxia compared with normoxia. (C) Cells were grown in normoxia or hypoxia for 24 h, after which culture medium was collected. Medium glucose and lactate levels were measured and compared with the levels in fresh medium. (D) Cells were cultured for 24 h as in C. Intracellular metabolism was then quenched with 80% MeOH prechilled to −80 °C that was spiked with a 13C-labeled citrate as an internal standard. Metabolites were then extracted, and intracellular citrate levels were analyzed with GC-MS and normalized to cell number. Data for C and D are the mean ± SEM of three independent experiments. (E) Model depicting the pathway for cit+2 production from [U-13C]glucose. Glucose uniformly 13C-labeled will generate pyruvate+3. Pyruvate+3 can be oxidatively decarboxylated by PDH to produce acetyl-CoA+2, which can condense with unlabeled oxaloacetate to produce cit+2. (F) Cells were cultured for 24 h as in C and D, followed by an additional 4 h of culture in glucose-deficient medium supplemented with 10 mM [U-13C]glucose. Intracellular metabolites were then extracted, and 13C-enrichment in cellular citrate was analyzed by GC-MS and normalized to the total citrate pool size. Data are the mean ± SD of three independent cultures from a representative of two independent experiments. *P < 0.05, ***P < 0.001.

Increased glucose uptake and glycolytic metabolism are critical elements of the metabolic response to hypoxia. To evaluate the contributions made by glucose to the citrate pool under normoxia or hypoxia, SF188 cells incubated in normoxia or hypoxia were cultured in medium containing 10 mM [U-13C]glucose. Following a 4-h labeling period, cellular metabolites were extracted and analyzed for isotopic enrichment by gas chromatography-mass spectrometry (GC-MS). In normoxia, the major 13C-enriched citrate species found was citrate enriched with two 13C atoms (cit+2), which can arise from the NAD+-dependent decarboxylation of pyruvate+3 to acetyl-CoA+2 by PDH, followed by the condensation of acetyl-CoA+2 with unenriched oxaloacetate (Fig. 1 E and F). Compared with the accumulation of cit+2, we observed minimal accumulation of cit+3 and cit+5 under normoxia. Cit+3 arises from pyruvate carboxylase (PC)-dependent conversion of pyruvate+3 to oxaloacetate+3, followed by the condensation of oxaloacetate+3 with unenriched acetyl-CoA. Cit+5 arises when PC-generated oxaloacetate+3 condenses with PDH-generated acetyl-CoA+2. The lack of cit+3 and cit+5 accumulation is consistent with PC activity not playing a major role in citrate production in normoxic SF188 cells, as reported (4).

In hypoxic cells, the major citrate species observed was unenriched. Cit+2, cit+3, and cit+5 all constituted minor fractions of the total citrate pool, consistent with glucose carbon not being incorporated into citrate through either PDH or PC-mediated metabolism under hypoxic conditions (Fig. 1F). These data demonstrate that in contrast to normoxic cells, where a large percentage of citrate production depends on glucose-derived carbon, hypoxic cells significantly reduce their rate of citrate production from glucose.

Glutamine Carbon Metabolism Is Required for Viability in Hypoxia.

In addition to glucose, we have previously reported that glutamine can contribute to citrate production during cell growth under normoxic conditions (4). Surprisingly, under hypoxic conditions, we observed that SF188 cells retained their high rate of glutamine consumption (Fig. 2A). Moreover, hypoxic cells cultured in glutamine-deficient medium displayed a significant loss of viability (Fig. 2B). In normoxia, the requirement for glutamine to maintain viability of SF188 cells can be satisfied by α-ketoglutarate, the downstream metabolite of glutamine that is devoid of nitrogenous groups (14). α-ketoglutarate cannot fulfill glutamine’s roles as a nitrogen source for nonessential amino acid synthesis or as an amide donor for nucleotide or hexosamine synthesis, but can be metabolized through the oxidative TCA cycle to regenerate oxaloacetate, and subsequently condense with glucose-derived acetyl-CoA to produce citrate. To test whether the restoration of carbon from glutamine metabolism in the form of α-ketoglutarate could rescue the viability defect of glutamine-starved SF188 cells even under hypoxia, SF188 cells incubated in hypoxia were cultured in glutamine-deficient medium supplemented with a cell-penetrant form of α-ketoglutarate (dimethyl α-ketoglutarate). The addition of dimethyl α-ketoglutarate rescued the defect in cell viability observed upon glutamine withdrawal (Fig. 2B). These data demonstrate that, even under hypoxic conditions, when the ability of glutamine to replenish oxaloacetate through oxidative TCA cycle metabolism is diminished, SF188 cells retain their requirement for glutamine as the carbon backbone for α-ketoglutarate. This result raised the possibility that glutamine could be the carbon source for citrate production through an alternative, nonoxidative, pathway in hypoxia.

Glutamine carbon is required for hypoxic cell viability

Glutamine carbon is required for hypoxic cell viability

Glutamine carbon is required for hypoxic cell viability

http://www.pnas.org/content/108/49/19611/F2.medium.gif

Fig. 2. Glutamine carbon is required for hypoxic cell viability and contributes to increased citrate production through reductive carboxylation relative to oxidative metabolism in hypoxia. (A) SF188 cells were cultured for 24 h in complete medium equilibrated with either 21% O2 (Normoxia) or 0.5% O2(Hypoxia). Culture medium was then removed from cells and analyzed for glutamine levels which were compared with the glutamine levels in fresh medium. Data are the mean ± SEM of three independent experiments. (B) The requirement for glutamine to maintain hypoxic cell viability can be satisfied by α-ketoglutarate. Cells were cultured in complete medium equilibrated with 0.5% O2 for 24 h, followed by an additional 48 h at 0.5% O2 in either complete medium (+Gln), glutamine-deficient medium (−Gln), or glutamine-deficient medium supplemented with 7 mM dimethyl α-ketoglutarate (−Gln +αKG). All medium was preconditioned in 0.5% O2. Cell viability was determined by trypan blue dye exclusion. Data are the mean and range from two independent experiments. (C) Model depicting the pathways for cit+4 and cit+5 production from [U-13C]glutamine (glutamine+5). Glutamine+5 is catabolized to α-ketoglutarate+5, which can then contribute to citrate production by two divergent pathways. Oxidative metabolism produces oxaloacetate+4, which can condense with unlabeled acetyl-CoA to produce cit+4. Alternatively, reductive carboxylation produces isocitrate+5, which can isomerize to cit+5. (D) Glutamine contributes to citrate production through increased reductive carboxylation relative to oxidative metabolism in hypoxic proliferating cancer cells. Cells were cultured for 24 h as in A, followed by 4 h of culture in glutamine-deficient medium supplemented with 4 mM [U-13C]glutamine. 13C enrichment in cellular citrate was quantitated with GC-MS. Data are the mean ± SD of three independent cultures from a representative of three independent experiments. **P < 0.01.

Cells Proliferating in Hypoxia Maintain Levels of Additional Metabolites Through Reductive Carboxylation.

Previous work has documented that, in normoxic conditions, SF188 cells use glutamine as the primary anaplerotic substrate, maintaining the pool sizes of TCA cycle intermediates through oxidative metabolism (4). Surprisingly, we found that, when incubated in hypoxia, SF188 cells largely maintained their levels of aspartate (in equilibrium with oxaloacetate), malate, and fumarate (Fig. 3A). To distinguish how glutamine carbon contributes to these metabolites in normoxia and hypoxia, SF188 cells incubated in normoxia or hypoxia were cultured in medium containing 4 mM [U-13C]glutamine. After a 4-h labeling period, metabolites were extracted and the intracellular pools of aspartate, malate, and fumarate were analyzed by GC-MS.

In normoxia, the majority of the enriched intracellular asparatate, malate, and fumarate were the +4 species, which arise through oxidative metabolism of glutamine-derived α-ketoglutarate (Fig. 3 B and C). The +3 species, which can be derived from the citrate generated by the reductive carboxylation of glutamine-derived α-ketoglutarate, constituted a significantly lower percentage of the total aspartate, malate, and fumarate pools. By contrast, in hypoxia, the +3 species constituted a larger percentage of the total aspartate, malate, and fumarate pools than they did in normoxia. These data demonstrate that, in addition to citrate, hypoxic cells preferentially synthesize oxaloacetate, malate, and fumarate through the pathway of reductive carboxylation rather than the oxidative TCA cycle.

IDH2 Is Critical in Hypoxia for Reductive Metabolism of Glutamine and for Cell Proliferation.

We hypothesized that the relative increase in reductive carboxylation we observed in hypoxia could arise from the suppression of α-ketoglutarate oxidation through the TCA cycle. Consistent with this, we found that α-ketoglutarate levels increased in SF188 cells following 24 h in hypoxia (Fig. 4A). Surprisingly, we also found that levels of the closely related metabolite 2-hydroxyglutarate (2HG) increased in hypoxia, concomitant with the increase in α-ketoglutarate under these conditions. 2HG can arise from the noncarboxylating reduction of α-ketoglutarate (Fig. 4B). Recent work has found that specific cancer-associated mutations in the active sites of either IDH1 or IDH2 lead to a 10- to 100-fold enhancement in this activity facilitating 2HG production (1517), but SF188 cells lack IDH1/2 mutations. However, 2HG levels are also substantially elevated in the inborn error of metabolism 2HG aciduria, and the majority of patients with this disease lack IDH1/2 mutations. As 2HG has been demonstrated to arise in these patients from mitochondrial α-ketoglutarate (18), we hypothesized that both the increased reductive carboxylation of glutamine-derived α-ketoglutarate to citrate and the increased 2HG accumulation we observed in hypoxia could arise from increased reductive metabolism by wild-type IDH2 in the mitochondria.

Reductive carboxylation of glutamine-derived α-ketoglutarate to citrate in hypoxic cancer cells is dependent on mitochondrial IDH2

Reductive carboxylation of glutamine-derived α-ketoglutarate to citrate in hypoxic cancer cells is dependent on mitochondrial IDH2

Reductive carboxylation of glutamine-derived α-ketoglutarate to citrate in hypoxic cancer cells is dependent on mitochondrial IDH2

http://www.pnas.org/content/108/49/19611/F4.medium.gif

Fig. 4. Reductive carboxylation of glutamine-derived α-ketoglutarate to citrate in hypoxic cancer cells is dependent on mitochondrial IDH2. (A) α-ketoglutarate and 2HG increase in hypoxia. SF188 cells were cultured in complete medium equilibrated with either 21% O2 (Normoxia) or 0.5% O2 (Hypoxia) for 24 h. Intracellular metabolites were then extracted, cell extracts spiked with a 13C-labeled citrate as an internal standard, and intracellular α-ketoglutarate and 2HG levels were analyzed with GC-MS. Data shown are the mean ± SEM of three independent experiments. (B) Model for reductive metabolism from glutamine-derived α-ketoglutarate. Glutamine+5 is catabolized to α-ketoglutarate+5. Carboxylation of α-ketoglutarate+5 followed by reduction of the carboxylated intermediate (reductive carboxylation) will produce isocitrate+5, which can then isomerize to cit+5. In contrast, reductive activity on α-ketoglutarate+5 that is uncoupled from carboxylation will produce 2HG+5. (C) IDH2 is required for reductive metabolism of glutamine-derived α-ketoglutarate in hypoxia. SF188 cells transfected with a siRNA against IDH2 (siIDH2) or nontargeting negative control (siCTRL) were cultured for 2 d in complete medium equilibrated with 0.5% O2. (Upper) Cells were then cultured at 0.5% O2 for an additional 4 h in glutamine-deficient medium supplemented with 4 mM [U-13C]glutamine. 13C enrichment in intracellular citrate and 2HG was determined and normalized to the relevant metabolite total pool size. (Lower) Cells transfected and cultured in parallel at 0.5% O2 were counted by hemacytometer (excluding nonviable cells with trypan blue staining) or harvested for protein to assess IDH2 expression by Western blot. Data shown for GC-MS and cell counts are the mean ± SD of three independent cultures from a representative experiment. **P < 0.01, ***P < 0.001.

In an experiment to test this hypothesis, SF188 cells were transfected with either siRNA directed against mitochondrial IDH2 (siIDH2) or nontargeting control, incubated in hypoxia for 2 d, and then cultured for another 4 h in hypoxia in media containing 4 mM [U-13C]glutamine. After the labeling period, metabolites were extracted and analyzed by GC-MS (Fig. 4C). Hypoxic SF188 cells transfected with siIDH2 displayed a decreased contribution of cit+5 to the total citrate pool, supporting an important role for IDH2 in the reductive carboxylation of glutamine-derived α-ketoglutarate in hypoxic conditions. The contribution of cit+4 to the total citrate pool did not decrease with siIDH2 treatment, consistent with IDH2 knockdown specifically affecting the pathway of reductive carboxylation and not other fundamental TCA cycle-regulating processes. In confirmation of reverse flux occurring through IDH2, the contribution of 2HG+5 to the total 2HG pool decreased in siIDH2-treated cells. Supporting the importance of citrate production by IDH2-mediated reductive carboxylation for hypoxic cell proliferation, siIDH2-transfected SF188 cells displayed a defect in cellular accumulation in hypoxia. Decreased expression of IDH2 protein following siIDH2 transfection was confirmed by Western blot. Collectively, these data point to the importance of mitochondrial IDH2 for the increase in reductive carboxylation flux of glutamine-derived α-ketoglutarate to maintain citrate levels in hypoxia, and to the importance of this reductive pathway for hypoxic cell proliferation.

Reprogramming of Metabolism by HIF1 in the Absence of Hypoxia Is Sufficient to Induce Increased Citrate Synthesis by Reductive Carboxylation Relative to Oxidative Metabolism.

The relative increase in the reductive metabolism of glutamine-derived α-ketoglutarate at 0.5% O2 may be explained by the decreased ability to carry out oxidative NAD+-dependent reactions as respiration is inhibited (1213). However, a shift to preferential reductive glutamine metabolism could also result from the active reprogramming of cellular metabolism by HIF1 (810), which inhibits the generation of mitochondrial acetyl-CoA necessary for the synthesis of citrate by oxidative glucose and glutamine metabolism (Fig. 5A). To better understand the role of HIF1 in reductive glutamine metabolism, we used VHL-deficient RCC4 cells, which display constitutive expression of HIF1α under normoxia (Fig. 5B). RCC4 cells expressing either a nontargeting control shRNA (shCTRL) or an shRNA directed at HIF1α (shHIF1α) were incubated in normoxia and cultured in medium with 4 mM [U-13C]glutamine. Following a 4-h labeling period, metabolites were extracted and the cellular citrate pool was analyzed by GC-MS. In shCTRL cells, which have constitutive HIF1α expression despite incubation in normoxia, the majority of the total citrate pool was constituted by the cit+5 species, with low levels of all other species including cit+4 (Fig. 5C). By contrast, in HIF1α-deficient cells the contribution of cit+5 to the total citrate pool was greatly decreased, whereas the contribution of cit+4 to the total citrate pool increased and was the most abundant citrate species. These data demonstrate that the relative enhancement of the reductive carboxylation pathway for citrate synthesis can be recapitulated by constitutive HIF1 activation in normoxia.

Reprogramming of metabolism by HIF1 in the absence of hypoxia

Reprogramming of metabolism by HIF1 in the absence of hypoxia

http://www.pnas.org/content/108/49/19611/F5.medium.gif

Reprogramming of metabolism by HIF1 in the absence of hypoxia is sufficient to induce reductive carboxylation of glutamine-derived α-ketoglutarate.

Fig. 5. Reprogramming of metabolism by HIF1 in the absence of hypoxia is sufficient to induce reductive carboxylation of glutamine-derived α-ketoglutarate. (A) Model depicting how HIF1 signaling’s inhibition of pyruvate dehydrogenase (PDH) activity and promotion of lactate dehydrogenase-A (LDH-A) activity can block the generation of mitochondrial acetyl-CoA from glucose-derived pyruvate, thereby favoring citrate synthesis from reductive carboxylation of glutamine-derived α-ketoglutarate. (B) Western blot demonstrating HIF1α protein in RCC4 VHL−/− cells in normoxia with a nontargeting shRNA (shCTRL), and the decrease in HIF1α protein in RCC4 VHL−/− cells stably expressing HIF1α shRNA (shHIF1α). (C) HIF1-induced reprogramming of glutamine metabolism. Cells from B at 21% O2 were cultured for 4 h in glutamine-deficient medium supplemented with 4 mM [U-13C]glutamine. Intracellular metabolites were then extracted, and 13C enrichment in cellular citrate was determined by GC-MS. Data shown are the mean ± SD of three independent cultures from a representative of three independent experiments. ***P < 0.001.

Compared with glucose metabolism, much less is known regarding how glutamine metabolism is altered under hypoxia. It has also remained unclear how hypoxic cells can maintain the citrate production necessary for macromolecular biosynthesis. In this report, we demonstrate that in contrast to cells at 21% O2, where citrate is predominantly synthesized through oxidative metabolism of both glucose and glutamine, reductive carboxylation of glutamine carbon becomes the major pathway of citrate synthesis in cells that can effectively proliferate at 0.5% O2. Moreover, we show that in these hypoxic cells, reductive carboxylation of glutamine-derived α-ketoglutarate is dependent on mitochondrial IDH2. Although others have previously suggested the existence of reductive carboxylation in cancer cells (1920), these studies failed to demonstrate the intracellular localization or specific IDH isoform responsible for the reductive carboxylation flux. Recently, we identified IDH2 as an isoform that contributes to reductive carboxylation in cancer cells incubated at 21% O2 (16), but remaining unclear were the physiological importance and regulation of this pathway relative to oxidative metabolism, as well as the conditions where this reductive pathway might be advantageous for proliferating cells.

Here we report that IDH2-mediated reductive carboxylation of glutamine-derived α-ketoglutarate to citrate is an important feature of cells proliferating in hypoxia. Moreover, the reliance on reductive glutamine metabolism can be recapitulated in normoxia by constitutive HIF1 activation in cells with loss of VHL. The mitochondrial NADPH/NADP+ ratio required to fuel the reductive reaction through IDH2 can arise from the increased NADH/NAD+ ratio existing in the mitochondria under hypoxic conditions (2122), with the transfer of electrons from NADH to NADP+ to generate NADPH occurring through the activity of the mitochondrial transhydrogenase (23). Our data do not exclude a complementary role for cytosolic IDH1 in impacting reductive glutamine metabolism, potentially through its oxidative function in an IDH2/IDH1 shuttle that transfers high energy electrons in the form of NADPH from mitochondria to cytosol (1624).

In further support of the increased mitochondrial reductive glutamine metabolism that we observe in hypoxia, we report here that incubation in hypoxia can lead to elevated 2HG levels in cells lacking IDH1/2 mutations. 2HG production from glutamine-derived α-ketoglutarate significantly decreased with knockdown of IDH2, supporting the conclusion that 2HG is produced in hypoxia by enhanced reverse flux of α-ketoglutarate through IDH2 in a truncated, noncarboxylating reductive reaction. However, other mechanisms may also contribute to 2HG elevation in hypoxia. These include diminished oxidative activity and/or enhanced reductive activity of the 2HG dehydrogenase, a mitochondrial enzyme that normally functions to oxidize 2HG back to α-ketoglutarate (25). The level of 2HG elevation we observe in hypoxic cells is associated with a concomitant increase in α-ketoglutarate, and is modest relative to that observed in cancers with IDH1/2 gain-of-function mutations. Nonetheless, 2HG elevation resulting from hypoxia in cells with wild-type IDH1/2 may hold promise as a cellular or serum biomarker for tissues undergoing chronic hypoxia and/or excessive glutamine metabolism.

The IDH2-dependent reductive carboxylation pathway that we propose in this report allows for continued citrate production from glutamine carbon when hypoxia and/or HIF1 activation prevents glucose carbon from contributing to citrate synthesis. Moreover, as opposed to continued oxidative TCA cycle functioning in hypoxia which can increase reactive oxygen species (ROS), reductive carboxylation of α-ketoglutarate in the mitochondria may serve as an electron sink that decreases the generation of ROS. HIF1 activity is not limited to the setting of hypoxia, as a common feature of several cancers is the normoxic stabilization of HIF1α through loss of the VHL tumor suppressor or other mechanisms. We demonstrate here that altered glutamine metabolism through a mitochondrial reductive pathway is a central aspect of hypoxic proliferating cell metabolism and HIF1-induced metabolic reprogramming. These findings are relevant for the understanding of numerous constitutive HIF1-expressing malignancies, as well as for populations, such as stem progenitor cells, which frequently proliferate in hypoxic conditions.

7.9.3 Hypoxia-Inducible Factors in Physiology and Medicine

Gregg L. Semenza
Cell. 2012 Feb 3; 148(3): 399–408.
http://dx.doi.org/10.1016%2Fj.cell.2012.01.021

Oxygen homeostasis represents an organizing principle for understanding metazoan evolution, development, physiology, and pathobiology. The hypoxia-inducible factors (HIFs) are transcriptional activators that function as master regulators of oxygen homeostasis in all metazoan species. Rapid progress is being made in elucidating homeostatic roles of HIFs in many physiological systems, determining pathological consequences of HIF dysregulation in chronic diseases, and investigating potential targeting of HIFs for therapeutic purposes. Oxygen homeostasis represents an organizing principle for understanding metazoan evolution, development, physiology, and pathobiology. The hypoxia-inducible factors (HIFs) are transcriptional activators that function as master regulators of oxygen homeostasis in all metazoan species. Rapid progress is being made in elucidating homeostatic roles of HIFs in many physiological systems, determining pathological consequences of HIF dysregulation in chronic diseases, and investigating potential targeting of HIFs for therapeutic purposes.


Oxygen is central to biology because of its utilization in the process of respiration. O2 serves as the final electron acceptor in oxidative phosphorylation, which carries with it the risk of generating reactive oxygen species (ROS) that react with cellular macromolecules and alter their biochemical or physical properties, resulting in cell dysfunction or death. As a consequence, metazoan organisms have evolved elaborate cellular metabolic and systemic physiological systems that are designed to maintain oxygen homeostasis. This review will focus on the role of hypoxia-inducible factors (HIFs) as master regulators of oxygen homeostasis and, in particular, on recent advances in understanding their roles in physiology and medicine. Due to space limitations and the remarkably pleiotropic effects of HIFs, the description of such roles will be illustrative rather than comprehensive.

O2 and Evolution, Part 1

Accumulation of O2 in Earth’s atmosphere starting ~2.5 billion years ago led to evolution of the extraordinarily efficient system of oxidative phosphorylation that transfers chemical energy stored in carbon bonds of organic molecules to the high-energy phosphate bond in ATP, which is used to power physicochemical reactions in living cells. Energy produced by mitochondrial respiration is sufficient to power the development and maintenance of multicellular organisms, which could not be sustained by energy produced by glycolysis alone (Lane and Martin, 2010). The modest dimensions of primitive metazoan species were such that O2 could diffuse from the atmosphere to all of the organism’s thousand cells, as is the case for the worm Caenorhabditis elegans. To escape the constraints placed on organismal growth by diffusion, systems designed to conduct air to cells deep within the body evolved and were sufficient for O2delivery to organisms with hundreds of thousands of cells, such as the fly Drosophila melanogaster. The final leap in body scale occurred in vertebrates and was associated with the evolution of complex respiratory, circulatory, and nervous systems designed to efficiently capture and distribute O2 to hundreds of millions of millions of cells in the case of the adult Homo sapiens.

Hypoxia-Inducible Factors

Hypoxia-inducible factor 1 (HIF-1) is expressed by all extant metazoan species analyzed (Loenarz et al., 2011). HIF-1 consists of HIF-1α and HIF-1β subunits, which each contain basic helix-loop-helix-PAS (bHLH-PAS) domains (Wang et al., 1995) that mediate heterodimerization and DNA binding (Jiang et al., 1996a). HIF-1β heterodimerizes with other bHLH-PAS proteins and is present in excess, such that HIF-1α protein levels determine HIF-1 transcriptional activity (Semenza et al., 1996).

Under well-oxygenated conditions, HIF-1α is bound by the von Hippel-Lindau (VHL) protein, which recruits an ubiquitin ligase that targets HIF-1α for proteasomal degradation (Kaelin and Ratcliffe, 2008). VHL binding is dependent upon hydroxylation of a specific proline residue in HIF-1α by the prolyl hydroxylase PHD2, which uses O2 as a substrate such that its activity is inhibited under hypoxic conditions (Epstein et al., 2001). In the reaction, one oxygen atom is inserted into the prolyl residue and the other atom is inserted into the co-substrate α-ketoglutarate, splitting it into CO2 and succinate (Kaelin and Ratcliffe, 2008). Factor inhibiting HIF-1 (FIH-1) represses HIF-1α transactivation function (Mahon et al., 2001) by hydroxylating an asparaginyl residue, using O2 and α-ketoglutarate as substrates, thereby blocking the association of HIF-1α with the p300 coactivator protein (Lando et al., 2002). Dimethyloxalylglycine (DMOG), a competitive antagonist of α-ketoglutarate, inhibits the hydroxylases and induces HIF-1-dependent transcription (Epstein et al., 2001). HIF-1 activity is also induced by iron chelators (such as desferrioxamine) and cobalt chloride, which inhibit hydroxylases by displacing Fe(II) from the catalytic center (Epstein et al., 2001).

Studies in cultured cells (Jiang et al., 1996b) and isolated, perfused, and ventilated lung preparations (Yu et al., 1998) revealed an exponential increase in HIF-1α levels at O2 concentrations less than 6% (~40 mm Hg), which is not explained by known biochemical properties of the hydroxylases. In most adult tissues, O2concentrations are in the range of 3-5% and any decrease occurs along the steep portion of the dose-response curve, allowing a graded response to hypoxia. Analyses of cultured human cells have revealed that expression of hundreds of genes was increased in response to hypoxia in a HIF-1-dependent manner (as determined by RNA interference) with direct binding of HIF-1 to the gene (as determined by chromatin immunoprecipitation [ChIP] assays); in addition, the expression of hundreds of genes was decreased in response to hypoxia in a HIF-1-dependent manner but binding of HIF-1 to these genes was not detected (Mole et al., 2009), indicating that HIF-dependent repression occurs via indirect mechanisms, which include HIF-1-dependent expression of transcriptional repressors (Yun et al., 2002) and microRNAs (Kulshreshtha et al., 2007). ChIP-seq studies have revealed that only 40% of HIF-1 binding sites are located within 2.5 kb of the transcription start site (Schödel et al., 2011).

In vertebrates, HIF-2α is a HIF-1α paralog that is also regulated by prolyl and asparaginyl hydroxylation and dimerizes with HIF-1β, but is expressed in a cell-restricted manner and plays important roles in erythropoiesis, vascularization, and pulmonary development, as described below. In D. melanogaster, the gene encoding the HIF-1α ortholog is designated similar and its paralog is designated trachealess because inactivating mutations result in defective development of the tracheal tubes (Wilk et al., 1996). In contrast, C. elegans has only a single HIF-1α homolog (Epstein et al., 2001). Thus, in both invertebrates and vertebrates, evolution of specialized systems for O2 delivery was associated with the appearance of a HIF-1α paralog.

O2 and Metabolism

The regulation of metabolism is a principal and primordial function of HIF-1. Under hypoxic conditions, HIF-1 mediates a transition from oxidative to glycolytic metabolism through its regulation of: PDK1, encoding pyruvate dehydrogenase (PDH) kinase 1, which phosphorylates and inactivates PDH, thereby inhibiting the conversion of pyruvate to acetyl coenzyme A for entry into the tricarboxylic acid cycle (Kim et al., 2006Papandreou et al., 2006); LDHA, encoding lactate dehydrogenase A, which converts pyruvate to lactate (Semenza et al. 1996); and BNIP3 (Zhang et al. 2008) and BNIP3L (Bellot et al., 2009), which mediate selective mitochondrial autophagy (Figure 1). HIF-1 also mediates a subunit switch in cytochrome coxidase that improves the efficiency of electron transfer under hypoxic conditions (Fukuda et al., 2007). An analogous subunit switch is also observed in Saccharomyces cerevisiae, although it is mediated by a completely different mechanism (yeast lack HIF-1), suggesting that it may represent a fundamental response of eukaryotic cells to hypoxia.

Regulation of Glucose Metabolism nihms-350382-f0001

Regulation of Glucose Metabolism nihms-350382-f0001

Regulation of Glucose Metabolism

http://www.ncbi.nlm.nih.gov/pmc/articles/PMC3437543/bin/nihms-350382-f0001.gif
Figure 1
Regulation of Glucose Metabolism

It is conventional wisdom that cells switch to glycolysis when O2 becomes limiting for mitochondrial ATP production. Yet, HIF-1α-null mouse embryo fibroblasts, which do not down-regulate respiration under hypoxic conditions, have higher ATP levels at 1% O2 than wild-type cells at 20% O2, demonstrating that under these conditions O2 is not limiting for ATP production (Zhang et al., 2008). However, the HIF-1α-null cells die under prolonged hypoxic conditions due to ROS toxicity (Kim et al. 2006Zhang et al., 2008). These studies have led to a paradigm shift with regard to our understanding of the regulation of cellular metabolism (Semenza, 2011): the purpose of this switch is to prevent excess mitochondrial generation of ROS that would otherwise occur due to the reduced efficiency of electron transfer under hypoxic conditions (Chandel et al., 1998). This may be particularly important in stem cells, in which avoidance of DNA damage is critical (Suda et al., 2011).

Role of HIFs in Development

Much of mammalian embryogenesis occurs at O2 concentrations of 1-5% and O2 functions as a morphogen (through HIFs) in many developmental systems (Dunwoodie, 2009). Mice that are homozygous for a null allele at the locus encoding HIF-1α die by embryonic day 10.5 with cardiac malformations, vascular defects, and impaired erythropoiesis, indicating that all three components of the circulatory system are dependent upon HIF-1 for normal development (Iyer et al., 1998Yoon et al., 2011). Depending on the genetic background, mice lacking HIF-2α: die by embryonic day 12.5 with vascular defects (Peng et al., 2000) or bradycardia due to deficient catecholamine production (Tian et al., 1998); die as neonates due to impaired lung maturation (Compernolle et al., 2002); or die several months after birth due to ROS-mediated multi-organ failure (Scortegagna et al., 2003). Thus, while vertebrate evolution was associated with concomitant appearance of the circulatory system and HIF-2α, both HIF-1 and HIF-2 have important roles in circulatory system development. Conditional knockout of HIF-1α in specific cell types has demonstrated important roles in chondrogenesis (Schipani et al., 2001), adipogenesis (Yun et al., 2002), B-lymphocyte development (Kojima et al., 2002), osteogenesis (Wang et al., 2007), hematopoiesis (Takubo et al., 2010), T-lymphocyte differentiation (Dang et al., 2011), and innate immunity (Zinkernagel et al., 2007). While knockout mouse experiments point to the adverse effects of HIF-1 loss-of-function on development, it is also possible that increased HIF-1 activity, induced by hypoxia in embryonic tissues as a result of abnormalities in placental blood flow, may also dysregulate development and result in congenital malformations. For example, HIF-1α has been shown to interact with, and stimulate the transcriptional activity of, Notch, which plays a key role in many developmental pathways (Gustafsson et al., 2005).

Translational Prospects

Drug discovery programs have been initiated at many pharmaceutical and biotech companies to develop prolyl hydroxylase inhibitors (PHIs) that, as described above for DMOG, induce HIF activity for treatment of disorders in which HIF mediates protective physiological responses. Local and/or short term induction of HIF activity by PHIs, gene therapy, or other means are likely to be useful novel therapies for many of the diseases described above. In the case of ischemic cardiovascular disease, local therapy is needed to provide homing signals for the recruitment of BMDACs. Chronic systemic use of PHIs must be approached with great caution: individuals with genetic mutations that constitutively activate the HIF pathway (described below) have increased incidence of cardiovascular disease and mortality (Yoon et al., 2011). On the other hand, the profound inhibition of HIF activity and vascular responses to ischemia that are associated with aging suggest that systemic replacement therapy might be contemplated as a preventive measure for subjects in whom impaired HIF responses to hypoxia can be documented. In C. elegans, VHL loss-of-function increases lifespan in a HIF-1-dependent manner (Mehta et al., 2009), providing further evidence for a mutually antagonistic relationship between HIF-1 and aging.

Cancer

Cancers contain hypoxic regions as a result of high rates of cell proliferation coupled with the formation of vasculature that is structurally and functionally abnormal. Increased HIF-1α and/or HIF-2α levels in diagnostic tumor biopsies are associated with increased risk of mortality in cancers of the bladder, brain, breast, colon, cervix, endometrium, head/neck, lung, ovary, pancreas, prostate, rectum, and stomach; these results are complemented by experimental studies, which demonstrate that genetic manipulations that increase HIF-1α expression result in increased tumor growth, whereas loss of HIF activity results in decreased tumor growth (Semenza, 2010). HIFs are also activated by genetic alterations, most notably, VHL loss of function in clear cell renal carcinoma (Majmunder et al., 2010). HIFs activate transcription of genes that play key roles in critical aspects of cancer biology, including stem cell maintenance (Wang et al., 2011), cell immortalization, epithelial-mesenchymal transition (Mak et al., 2010), genetic instability (Huang et al., 2007), vascularization (Liao and Johnson, 2007), glucose metabolism (Luo et al., 2011), pH regulation (Swietach et al., 2007), immune evasion (Lukashev et al., 2007), invasion and metastasis (Chan and Giaccia, 2007), and radiation resistance (Moeller et al., 2007). Given the extensive validation of HIF-1 as a potential therapeutic target, drugs that inhibit HIF-1 have been identified and shown to have anti-cancer effects in xenograft models (Table 1Semenza, 2010).

Table 1  Drugs that Inhibit HIF-1

Process Inhibited Drug Class Prototype
HIF-1 α synthesis Cardiac glycosidemTOR inhibitorMicrotubule targeting agent

Topoisomerase I inhibitor

DigoxinRapamycin2-Methoxyestradiol

Topotecan

HIF-1 α protein stability HDAC inhibitorHSP90 inhibitorCalcineurin inhibitor

Guanylate cyclase activator

LAQ82417-AAGCyclosporine

YC-1

Heterodimerization Antimicrobial agent Acriflavine
DNA binding AnthracyclineQuinoxaline antibiotic DoxorubicinEchinomycin
Transactivation Proteasome inhibitorAntifungal agent BortezomibAmphotericin B
Signal transduction BCR-ABL inhibitorCyclooxygenase inhibitorEGFR inhibitor

HER2 inhibitor

ImatinibIbuprofenErlotinib, Gefitinib

Trastuzumab

Over 100 women die every day of breast cancer in the U.S. The mean PO2 is 10 mm Hg in breast cancer as compared to > 60 mm Hg in normal breast tissue and cancers with PO2 < 10 mm Hg are associated with increased risk of metastasis and patient mortality (Vaupel et al., 2004). Increased HIF-1α protein levels, as identified by immunohistochemical analysis of tumor biopsies, are associated with increased risk of metastasis and/or patient mortality in unselected breast cancer patients and in lymph node-positive, lymph node-negative, HER2+, or estrogen receptor+ subpopulations (Semenza, 2011). Metastasis is responsible for > 90% of breast cancer mortality. The requirement for HIF-1 in breast cancer metastasis has been demonstrated for both autochthonous tumors in transgenic mice (Liao et al., 2007) and orthotopic transplants in immunodeficient mice (Zhang et al., 2011Wong et al., 2011). Primary tumors direct the recruitment of bone marrow-derived cells to the lungs and other sites of metastasis (Kaplan et al., 2005). In breast cancer, hypoxia induces the expression of lysyl oxidase (LOX), a secreted protein that remodels collagen at sites of metastatic niche formation (Erler et al., 2009). In addition to LOX, breast cancers also express LOX-like proteins 2 and 4. LOX, LOXL2, and LOXL4 are all HIF-1-regulated genes and HIF-1 inhibition blocks metastatic niche formation regardless of which LOX/LOXL protein is expressed, whereas available LOX inhibitors are not effective against all LOXL proteins (Wong et al., 2011), again illustrating the role of HIF-1 as a master regulator that controls the expression of multiple genes involved in a single (patho)physiological process.

Translational Prospects

Small molecule inhibitors of HIF activity that have anti-cancer effects in mouse models have been identified (Table 1). Inhibition of HIF impairs both vascular and metabolic adaptations to hypoxia, which may decrease O2 delivery and increase O2 utilization. These drugs are likely to be useful (as components of multidrug regimens) in the treatment of a subset of cancer patients in whom high HIF activity is driving progression. As with all novel cancer therapeutics, successful translation will require the development of methods for identifying the appropriate patient cohort. Effects of combination drug therapy also need to be considered. VEGF receptor tyrosine kinase inhibitors, which induce tumor hypoxia by blocking vascularization, have been reported to increase metastasis in mouse models (Ebos et al., 2009), which may be mediated by HIF-1; if so, combined use of HIF-1 inhibitors with these drugs may prevent unintended counter-therapeutic effects.

HIF inhibitors may also be useful in the treatment of other diseases in which dysregulated HIF activity is pathogenic. Proof of principle has been established in mouse models of ocular neovascularization, a major cause of blindness in the developed world, in which systemic or intraocular injection of the HIF-1 inhibitor digoxin is therapeutic (Yoshida et al., 2010). Systemic administration of HIF inhibitors for cancer therapy would be contraindicated in patients who also have ischemic cardiovascular disease, in which HIF activity is protective. The analysis of SNPs at the HIF1A locus described above suggests that the population may include HIF hypo-responders, who are at increased risk of severe ischemic cardiovascular disease. It is also possible that HIF hyper-responders, such as individuals with hereditary erythrocytosis, are at increased risk of particularly aggressive cancer.

O2 and Evolution, Part 2

When lowlanders sojourn to high altitude, hypobaric hypoxia induces erythropoiesis, which is a relatively ineffective response because the problem is not insufficient red cells, but rather insufficient ambient O2. Chronic erythrocytosis increases the risk of heart attack, stroke, and fetal loss during pregnancy. Many high-altitude Tibetans maintain the same hemoglobin concentration as lowlanders and yet, despite severe hypoxemia, they also maintain aerobic metabolism. The basis for this remarkable evolutionary adaptation appears to have involved the selection of genetic variants at multiple loci encoding components of the oxygen sensing system, particularly HIF-2α (Beall et al., 2010Simonson et al., 2010Yi et al., 2010). Given that hereditary erythrocytosis is associated with modest HIF-2α gain-of-function, the Tibetan genotype associated with absence of an erythrocytotic response to hypoxia may encode reduced HIF-2α activity along with other alterations that increase metabolic efficiency. Delineating the molecular mechanisms underlying these metabolic adaptations may lead to novel therapies for ischemic disorders, illustrating the importance of oxygen homeostasis as a nexus where evolution, biology, and medicine converge.

7.9.4 Hypoxia-inducible factor 1. Regulator of mitochondrial metabolism and mediator of ischemic preconditioning

Semenza GL1.
Biochim Biophys Acta. 2011 Jul; 1813(7):1263-8.
http://dx.doi.org/10.1016%2Fj.bbamcr.2010.08.006

Hypoxia-inducible factor 1 (HIF-1) mediates adaptive responses to reduced oxygen availability by regulating gene expression. A critical cell-autonomous adaptive response to chronic hypoxia controlled by HIF-1 is reduced mitochondrial mass and/or metabolism. Exposure of HIF-1-deficient fibroblasts to chronic hypoxia results in cell death due to excessive levels of reactive oxygen species (ROS). HIF-1 reduces ROS production under hypoxic conditions by multiple mechanisms including: a subunit switch in cytochrome c oxidase from the COX4-1 to COX4-2 regulatory subunit that increases the efficiency of complex IV; induction of pyruvate dehydrogenase kinase 1, which shunts pyruvate away from the mitochondria; induction of BNIP3, which triggers mitochondrial selective autophagy; and induction of microRNA-210, which blocks assembly of Fe/S clusters that are required for oxidative phosphorylation. HIF-1 is also required for ischemic preconditioning and this effect may be due in part to its induction of CD73, the enzyme that produces adenosine. HIF-1-dependent regulation of mitochondrial metabolism may also contribute to the protective effects of ischemic preconditioning.

The story of life on Earth is a tale of oxygen production and utilization. Approximately 3 billion years ago, primitive single-celled organisms evolved the capacity for photosynthesis, a biochemical process in which photons of solar energy are captured by chlorophyll and used to power the reaction of CO2 and H2O to form glucose and O2. The subsequent rise in the atmospheric O2 concentration over the next billion years set the stage for the ascendance of organisms with the capacity for respiration, a process that consumes glucose and O2 and generates CO2, H2O, and energy in the form of ATP. Some of these single-celled organisms eventually took up residence within the cytoplasm of other cells and devoted all of their effort to energy production as mitochondria. Compared to the conversion of glucose to lactate by glycolysis, the complete oxidation of glucose by respiration provided such a large increase in energy production that it made possible the evolution of multicellular organisms. Among metazoan organisms, the progressive increase in body size during evolution was accompanied by progressively more complex anatomic structures that function to ensure the adequate delivery of O2 to all cells, ultimately resulting in the sophisticated circulatory and respiratory systems of vertebrates.

All metazoan cells can sense and respond to reduced O2 availability (hypoxia). Adaptive responses to hypoxia can be cell autonomous, such as the alterations in mitochondrial metabolism that are described below, or non-cell-autonomous, such as changes in tissue vascularization (reviewed in ref. 1). Primary responses to hypoxia need to be distinguished from secondary responses to sequelae of hypoxia, such as the adaptive responses to ATP depletion that are mediated by AMP kinase (reviewed in ref 2). In contrast, recent data suggest that O2 and redox homeostasis are inextricably linked and that changes in oxygenation are inevitably associated with changes in the levels of reactive oxygen species (ROS), as will be discussed below.

HIF-1 Regulates Oxygen Homeostasis in All Metazoan Species

A key regulator of the developmental and physiological networks required for the maintenance of O2homeostasis is hypoxia-inducible factor 1 (HIF-1). HIF-1 is a heterodimeric transcription factor that is composed of an O2-regulated HIF-1α subunit and a constitutively expressed HIF-1β subunit [3,4]. HIF-1 regulates the expression of hundreds of genes through several major mechanisms. First, HIF-1 binds directly to hypoxia response elements, which are cis-acting DNA sequences located within target genes [5]. The binding of HIF-1 results in the recruitment of co-activator proteins that activate gene transcription (Fig. 1A). Only rarely does HIF-1 binding result in transcriptional repression [6]. Instead, HIF-1 represses gene expression by indirect mechanisms, which are described below. Second, among the genes activated by HIF-1 are many that encode transcription factors [7], which when synthesized can bind to and regulate (either positively or negatively) secondary batteries of target genes (Fig. 1B). Third, another group of HIF-1 target genes encode members of the Jumonji domain family of histone demethylases [8,9], which regulate gene expression by modifying chromatin structure (Fig. 1C). Fourth, HIF-1 can activate the transcription of genes encoding microRNAs [10], which bind to specific mRNA molecules and either block their translation or mediate their degradation (Fig. 1D). Fifth, the isolated HIF-1α subunit can bind to other transcription factors [11,12] and inhibit (Fig. 1E) or potentiate (Fig. 1F) their activity.

Mechanisms by which HIF-1 regulates gene expression. nihms232046f1

Mechanisms by which HIF-1 regulates gene expression. nihms232046f1

Mechanisms by which HIF-1 regulates gene expression.

http://www.ncbi.nlm.nih.gov/pmc/articles/PMC3010308/bin/nihms232046f1.gif

Fig. 1 Mechanisms by which HIF-1 regulates gene expression. (A) Top: HIF-1 binds directly to target genes at a cis-acting hypoxia response element (HRE) and recruits coactivator proteins such as p300 to increase gene transcription.

HIF-1α and HIF-1β are present in all metazoan species, including the simple roundworm Caenorhabitis elegans [13], which consists of ~103 cells and has no specialized systems for O2 delivery. The fruit flyDrosophila melanogaster evolved tracheal tubes, which conduct air into the interior of the body from which it diffuses to surrounding cells. In vertebrates, the development of the circulatory and respiratory systems was accompanied by the appearance of HIF-2α, which is also O2-regulated and heterodimerizes with HIF-1β [14] but is only expressed in a restricted number of cell types [15], whereas HIF-1α and HIF-1β are expressed in all human and mouse tissues [16]. In Drosophila, the ubiquitiously expressed HIF-1α ortholog is designatedSimilar [17] and the paralogous gene that is expressed specifically in tracheal tubes is designated Trachealess[18].

HIF-1 Activity is Regulated by Oxygen

In the presence of O2, HIF-1α and HIF-2α are subjected to hydroxylation by prolyl-4-hydroxylase domain proteins (PHDs) that use O2 and α-ketoglutarate as substrates and generate CO2 and succinate as by-products [19]. Prolyl hydroxylation is required for binding of the von Hipple-Lindau protein, which recruits a ubiquitin-protein ligase that targets HIF-1α and HIF-2α for proteasomal degradation (Fig. 2). Under hypoxic conditions, the rate of hydroxylation declines and the non-hydroxylated proteins accumulate. HIF-1α transactivation domain function is also O2-regulated [20,21]. Factor inhibiting HIF-1 (FIH-1) represses transactivation domain function [22] by hydroxylating asparagine residue 803 in HIF-1α, thereby blocking the binding of the co-activators p300 and CBP [23].

Negative regulation of HIF-1 activity by oxygen nihms232046f2

Negative regulation of HIF-1 activity by oxygen nihms232046f2

Negative regulation of HIF-1 activity by oxygen

http://www.ncbi.nlm.nih.gov/pmc/articles/PMC3010308/bin/nihms232046f2.gif

Fig. 2 Negative regulation of HIF-1 activity by oxygen. Top: In the presence of O2: prolyl hydroxylation of HIF-1a leads to binding of the von Hippel-Lindau protein (VHL), which recruits a ubiquitin protein-ligase that targets HIF-1a for proteasomal degradation;

When cells are acutely exposed to hypoxic conditions, the generation of ROS at complex III of the mitochondrial electron transport chain (ETC) increases and is required for the induction of HIF-1α protein levels [24]. More than a decade after these observations were first made, the precise mechanism by which hypoxia increases ROS generation and by which ROS induces HIF-1α accumulation remain unknown. However, the prolyl and asparaginyl hydroxylases contain Fe2+ in their active site and oxidation to Fe3+would block their catalytic activity. Since O2 is a substrate for the hydroxylation reaction, anoxia also results in a loss of enzyme activity. However, the concentration at which O2 becomes limiting for prolyl or asparaginyl hydroxylase activity in vivo is not known.

HIF-1 Regulates the Balance Between Oxidative and Glycolytic Metabolism

All metazoan organisms depend on mitochondrial respiration as the primary mechanism for generating sufficient amounts of ATP to maintain cellular and systemic homeostasis. Respiration, in turn, is dependent on an adequate supply of O2 to serve as the final electron acceptor in the ETC. In this process, electrons are transferred from complex I (or complex II) to complex III, then to complex IV, and finally to O2, which is reduced to water. This orderly transfer of electrons generates a proton gradient across the inner mitochondrial membrane that is used to drive the synthesis of ATP. At each step of this process, some electrons combine with O2 prematurely, resulting in the production of superoxide anion, which is reduced to hydrogen peroxide through the activity of mitochondrial superoxide dismutase. The efficiency of electron transport appears to be optimized to the physiological range of O2 concentrations, such that ATP is produced without the production of excess superoxide, hydrogen peroxide, and other ROS at levels that would result in the increased oxidation of cellular macromolecules and subsequent cellular dysfunction or death. In contrast, when O2levels are acutely increased or decreased, an imbalance between O2 and electron flow occurs, which results in increased ROS production.

MEFs require HIF-1 activity to make two critical metabolic adaptations to chronic hypoxia. First, HIF-1 activates the gene encoding pyruvate dehydrogenase (PDH) kinase 1 (PDK1), which phosphorylates and inactivates the catalytic subunit of PDH, the enzyme that converts pyruvate to acetyl coenzyme A (AcCoA) for entry into the mitochondrial tricarboxylic acid (TCA) cycle [25]. Second, HIF-1 activates the gene encoding BNIP3, a member of the Bcl-2 family of mitochondrial proteins, which triggers selective mitochondrial autophagy [26]. Interference with the induction of either of these proteins in hypoxic cells results in increased ROS production and increased cell death. Overexpression of either PDK1 or BNIP3 rescues HIF-1α-null MEFs. By shunting pyruvate away from the mitochondria, PDK1 decreases flux through the ETC and thereby counteracts the reduced efficiency of electron transport under hypoxic conditions, which would otherwise increase ROS production. PDK1 functions cooperatively with the product of another HIF-1 target gene, LDHA [27], which converts pyruvate to lactate, thereby further reducing available substrate for the PDH reaction.

PDK1 effectively reduces flux through the TCA cycle and thereby reduces flux through the ETC in cells that primarily utilize glucose as a substrate for oxidative phosphorylation. However, PDK1 is predicted to have little effect on ROS generation in cells that utilize fatty acid oxidation as their source of AcCoA. Hence another strategy to reduce ROS generation under hypoxic conditions is selective mitochondrial autophagy [26]. MEFs reduce their mitochondrial mass and O2 consumption by >50% after only two days at 1% O2. BNIP3 competes with Beclin-1 for binding to Bcl-2, thereby freeing Beclin-1 to activate autophagy. Using short hairpin RNAs to knockdown expression of BNIP3, Beclin-1, or Atg5 (another component of the autophagy machinery) phenocopied HIF-1α-null cells by preventing hypoxia-induced reductions in mitochondrial mass and O2 consumption as a result of failure to induce autophagy [26]. HIF-1-regulated expression of BNIP3L also contributes to hypoxia-induced autophagy [28]. Remarkably, mice heterozygous for the HIF-1α KO allele have a significantly increased ratio of mitochondrial:nuclear DNA in their lungs (even though this is the organ that is exposed to the highest O2 concentrations), indicating that HIF-1 regulates mitochondrial mass under physiological conditions in vivo [26]. In contrast to the selective mitochondrial autophagy that is induced in response to hypoxia as described above, autophagy (of unspecified cellular components) induced by anoxia does not require HIF-1, BNIP3, or BNIP3L, but is instead regulated by AMP kinase [29].

The multiplicity of HIF-1-mediated mechanisms identified so far by which cells regulate mitochondrial metabolism in response to changes in cellular O2 concentration (Fig. 3) suggests that this is a critical adaptive response to hypoxia. The fundamental nature of this physiological response is underscored by the fact that yeast also switch COX4 subunits in an O2-dependent manner but do so by an entirely different molecular mechanism [33], since yeast do not have a HIF-1α homologue. Thus, it appears that by convergent evolution both unicellular and multicellular eukaryotes possess mechanisms by which they modulate mitochondrial metabolism to maintain redox homeostasis despite changes in O2 availability. Indeed, it is the balance between energy, oxygen, and redox homeostasis that represents the key to life with oxygen.

Regulation of mitochondrial metabolism by HIF-1  nihms232046f3

Regulation of mitochondrial metabolism by HIF-1 nihms232046f3

Regulation of mitochondrial metabolism by HIF-1α

http://www.ncbi.nlm.nih.gov/pmc/articles/PMC3010308/bin/nihms232046f3.gif

Fig. 3 Regulation of mitochondrial metabolism by HIF-1α. Acute hypoxia leads to increased mitochondrial generation of reactive oxygen species (ROS). Decreased O2 and increased ROS levels lead to decreased HIF-1α hydroxylation (see Fig. 2) and increased HIF-1-dependent 


7.9.5 Regulation of cancer cell metabolism by hypoxia-inducible factor 1

Semenza GL1.
Semin Cancer Biol. 2009 Feb; 19(1):12-6.

The Warburg Effect: The Re-discovery of the Importance of Aerobic Glycolysis in Tumor Cells
http://dx.doi.org:/10.1016/j.semcancer.2008.11.009

The induction of hypoxia-inducible factor 1 (HIF-1) activity, either as a result of intratumoral hypoxia or loss-of-function mutations in the VHL gene, leads to a dramatic reprogramming of cancer cell metabolism involving increased glucose transport into the cell, increased conversion of glucose to pyruvate, and a concomitant decrease in mitochondrial metabolism and mitochondrial mass. Blocking these adaptive metabolic responses to hypoxia leads to cell death due to toxic levels of reactive oxygen species. Targeting HIF-1 or metabolic enzymes encoded by HIF-1 target genes may represent a novel therapeutic approach to cancer.

http://ars.els-cdn.com/content/image/1-s2.0-S1044579X08001065-gr1.sml

http://ars.els-cdn.com/content/image/1-s2.0-S1044579X08001065-gr2.sml

7.9.6 Coming up for air. HIF-1 and mitochondrial oxygen consumption

Simon MC1.
Cell Metab. 2006 Mar;3(3):150-1.
http://dx.doi.org/10.1016/j.cmet.2006.02.007

Hypoxic cells induce glycolytic enzymes; this HIF-1-mediated metabolic adaptation increases glucose flux to pyruvate and produces glycolytic ATP. Two papers in this issue of Cell Metabolism (Kim et al., 2006; Papandreou et al., 2006) demonstrate that HIF-1 also influences mitochondrial function, suppressing both the TCA cycle and respiration by inducing pyruvate dehydrogenase kinase 1 (PDK1). PDK1 regulation in hypoxic cells promotes cell survival.

Comment on

Oxygen deprivation (hypoxia) occurs in tissues when O2 supply via the cardiovascular system fails to meet the demand of O2-consuming cells. Hypoxia occurs naturally in physiological settings (e.g., embryonic development and exercising muscle), as well as in pathophysiological conditions (e.g., myocardial infarction, inflammation, and solid tumor formation). For over a century, it has been appreciated that O2-deprived cells exhibit increased conversion of glucose to lactate (the “Pasteur effect”). Activation of the Pasteur effect during hypoxia in mammalian cells is facilitated by HIF-1, which mediates the upregulation of glycolytic enzymes that support an increase in glycolytic ATP production as mitochondria become starved for O2, the substrate for oxidative phosphorylation (Seagroves et al., 2001). Thus, mitochondrial respiration passively decreases due to O2 depletion in hypoxic tissues. However, reports by Kim et al. (2006) and Papandreou et al. (2006) in this issue of Cell Metabolism demonstrate that this critical metabolic adaptation is more complex and includes an active suppression of mitochondrial pyruvate catabolism and O2consumption by HIF-1.

Mitochondrial oxidative phosphorylation is regulated by multiple mechanisms, including substrate availability. Major substrates include O2 (the terminal electron acceptor) and pyruvate (the primary carbon source). Pyruvate, as the end product of glycolysis, is converted to acetyl-CoA by the pyruvate dehydrogenase enzymatic complex and enters the tricarboxylic acid (TCA) cycle. Pyruvate conversion into acetyl-CoA is irreversible; this therefore represents an important regulatory point in cellular energy metabolism. Pyruvate dehydrogenase kinase (PDK) inhibits pyruvate dehydrogenase activity by phosphorylating its E1 subunit (Sugden and Holness, 2003). In the manuscripts by Kim et al. (2006) and Papandreou et al. (2006), the authors find that PDK1 is a HIF-1 target gene that actively regulates mitochondrial respiration by limiting pyruvate entry into the TCA cycle. By excluding pyruvate from mitochondrial metabolism, hypoxic cells accumulate pyruvate, which is then converted into lactate via lactate dehydrogenase (LDH), another HIF-1-regulated enzyme. Lactate in turn is released into the extracellular space, regenerating NAD+ for continued glycolysis by O2-starved cells (see Figure 1). This HIF-1-dependent block to mitochondrial O2 consumption promotes cell survival, especially when O2 deprivation is severe and prolonged.

multiple-hypoxia-induced-cellular-metabolic-changes-are-regulated-by-hif-1

multiple-hypoxia-induced-cellular-metabolic-changes-are-regulated-by-hif-1

http://ars.els-cdn.com/content/image/1-s2.0-S1550413106000672-gr1.jpg

Figure 1. Multiple hypoxia-induced cellular metabolic changes are regulated by HIF-1

By stimulating the expression of glucose transporters and glycolytic enzymes, HIF-1 promotes glycolysis to generate increased levels of pyruvate. In addition, HIF-1 promotes pyruvate reduction to lactate by activating lactate dehydrogenase (LDH). Pyruvate reduction to lactate regenerates NAD+, which permits continued glycolysis and ATP production by hypoxic cells. Furthermore, HIF-1 induces pyruvate dehydrogenase kinase 1 (PDK1), which inhibits pyruvate dehydrogenase and blocks conversion of pyruvate to acetyl CoA, resulting in decreased flux through the tricarboxylic acid (TCA) cycle. Decreased TCA cycle activity results in attenuation of oxidative phosphorylation and excessive mitochondrial reactive oxygen species (ROS) production. Because hypoxic cells already exhibit increased ROS, which have been shown to promote HIF-1 accumulation, the induction of PDK1 prevents the persistence of potentially harmful ROS levels.

Papandreou et al. demonstrate that hypoxic regulation of PDK has important implications for antitumor therapies. Recent interest has focused on cytotoxins that target hypoxic cells in tumor microenvironments, such as the drug tirapazamine (TPZ). Because intracellular O2 concentrations are decreased by mitochondrial O2 consumption, HIF-1 could protect tumor cells from TPZ-mediated cell death by maintaining intracellular O2 levels. Indeed, Papandreou et al. show that HIF-1-deficient cells grown at 2% O2 exhibit increased sensitivity to TPZ relative to wild-type cells, presumably due to higher rates of mitochondrial O2 consumption. HIF-1 inhibition in hypoxic tumor cells should have multiple therapeutic benefits, but the use of HIF-1 inhibitors in conjunction with other treatments has to be carefully evaluated for the most effective combination and sequence of drug delivery. One result of HIF-1 inhibition would be a relative decrease in intracellular O2 levels, making hypoxic cytotoxins such as TPZ more potent antitumor agents. Because PDK expression has been detected in multiple human tumor samples and appears to be induced by hypoxia (Koukourakis et al., 2005), small molecule inhibitors of HIF-1 combined with TPZ represent an attractive therapeutic approach for future clinical studies.

Hypoxic regulation of PDK1 has other important implications for cell survival during O2 depletion. Because the TCA cycle is coupled to electron transport, Kim et al. suggest that induction of the pyruvate dehydrogenase complex by PDK1 attenuates not only mitochondrial respiration but also the production of mitochondrial reactive oxygen species (ROS) in hypoxic cells. ROS are a byproduct of electron transfer to O2, and cells cultured at 1 to 5% O2 generate increased mitochondrial ROS relative to those cultured at 21% O2 (Chandel et al., 1998 and Guzy et al., 2005). In fact, hypoxia-induced mitochondrial ROS have also been shown to be necessary for the stabilization of HIF-1 in hypoxic cells (Brunelle et al., 2005Guzy et al., 2005 and Mansfield et al., 2005). However, the persistence of ROS could ultimately be lethal to tissues during chronic O2 deprivation, and PDK1 induction by HIF-1 should promote cell viability during long-term hypoxia. Kim et al. present evidence that HIF-1-deficient cells exhibit increased apoptosis after 72 hr of culture at 0.5% O2 compared to wild-type cells and that cell survival is rescued by enforced expression of exogenous PDK1. Furthermore, PDK1 reduces ROS production by the HIF-1 null cells. These findings support a novel prosurvival dimension of cellular hypoxic adaptation where PDK1 inhibits the TCA cycle, mitochondrial respiration, and chronic ROS production.

The HIF-1-mediated block to mitochondrial O2 consumption via PDK1 regulation also has implications for O2-sensing pathways by hypoxic cells. One school of thought suggests that perturbing mitochondrial O2consumption increases intracellular O2 concentrations and suppresses HIF-1 induction by promoting the activity of HIF prolyl hydroxylases, the O2-dependent enzymes that regulate HIF-1 stability (Hagen et al., 2003 and Doege et al., 2005). This model suggests that mitochondria function as “O2 sinks.” Although Papandreou et al. demonstrate that increased mitochondrial respiration due to PDK1 depletion results in decreased intracellular O2 levels (based on pimonidazole staining), these changes failed to reduce HIF-1 levels in hypoxic cells. Another model for hypoxic activation of HIF-1 describes a critical role for mitochondrial ROS in prolyl hydroxylase inhibition and HIF-1 stabilization in O2-starved cells (Brunelle et al., 2005Guzy et al., 2005 and Mansfield et al., 2005) (see Figure 1). The mitochondrial “O2 sink” hypothesis can account for some observations in the literature but fails to explain the inhibition of HIF-1 stabilization by ROS scavengers (Chandel et al., 1998Brunelle et al., 2005Guzy et al., 2005 and Sanjuán-Pla et al., 2005). While the relationship between HIF-1 stability, mitochondrial metabolism, ROS, and intracellular O2 redistribution will continue to be debated for some time, these most recent findings shed new light on findings by Louis Pasteur over a century ago.

Selected reading

Brunelle et al., 2005

J.K. Brunelle, E.L. Bell, N.M. Quesada, K. Vercauteren, V. Tiranti, M. Zeviani, R.C. Scarpulla, N.S. Chandel

Cell Metab., 1 (2005), pp. 409–414

Article  PDF (324 K) View Record in Scopus Citing articles (357)

Chandel et al., 1998

N.S. Chandel, E. Maltepe, E. Goldwasser, C.E. Mathieu, M.C. Simon, P.T. Schumacker

Proc. Natl. Acad. Sci. USA, 95 (1998), pp. 11715–11720

View Record in Scopus Full Text via CrossRef Citing articles (973)

Doege et al., 2005Doege, S. Heine, I. Jensen, W. Jelkmann, E. Metzen

Blood, 106 (2005), pp. 2311–2317

View Record in Scopus Full Text via CrossRef Citing articles (84)

Guzy et al., 2005

R.D. Guzy, B. Hoyos, E. Robin, H. Chen, L. Liu, K.D. Mansfield, M.C. Simon, U. Hammerling, P.T. Schumacker

Cell Metab., 1 (2005), pp. 401–408

Article  PDF (510 K) View Record in Scopus Citing articles (593)

Hagen et al., 2003

Hagen, C.T. Taylor, F. Lam, S. Moncada

Science, 302 (2003), pp. 1975–1978

View Record in Scopus Full Text via CrossRef Citing articles (450)

7.9.7 HIF-1 mediates adaptation to hypoxia by actively downregulating mitochondrial oxygen consumption

Papandreou I1Cairns RAFontana LLim ALDenko NC.
Cell Metab. 2006 Mar; 3(3):187-97.
http://dx.doi.org/10.1016/j.cmet.2006.01.012

The HIF-1 transcription factor drives hypoxic gene expression changes that are thought to be adaptive for cells exposed to a reduced-oxygen environment. For example, HIF-1 induces the expression of glycolytic genes. It is presumed that increased glycolysis is necessary to produce energy when low oxygen will not support oxidative phosphorylation at the mitochondria. However, we find that while HIF-1 stimulates glycolysis, it also actively represses mitochondrial function and oxygen consumption by inducing pyruvate dehydrogenase kinase 1 (PDK1). PDK1 phosphorylates and inhibits pyruvate dehydrogenase from using pyruvate to fuel the mitochondrial TCA cycle. This causes a drop in mitochondrial oxygen consumption and results in a relative increase in intracellular oxygen tension. We show by genetic means that HIF-1-dependent block to oxygen utilization results in increased oxygen availability, decreased cell death when total oxygen is limiting, and reduced cell death in response to the hypoxic cytotoxin tirapazamine.

Comment in

Tissue hypoxia results when supply of oxygen from the bloodstream does not meet demand from the cells in the tissue. Such a supply-demand mismatch can occur in physiologic conditions such as the exercising muscle, in the pathologic condition such as the ischemic heart, or in the tumor microenvironment (Hockel and Vaupel, 2001 and Semenza, 2004). In either the physiologic circumstance or pathologic conditions, there is a molecular response from the cell in which a program of gene expression changes is initiated by the hypoxia-inducible factor-1 (HIF-1) transcription factor. This program of gene expression changes is thought to help the cells adapt to the stressful environment. For example, HIF-1-dependent expression of erythropoietin and angiogenic compounds results in increased blood vessel formation for delivery of a richer supply of oxygenated blood to the hypoxic tissue. Additionally, HIF-1 induction of glycolytic enzymes allows for production of energy when the mitochondria are starved of oxygen as a substrate for oxidative phosphorylation. We now find that this metabolic adaptation is more complex, with HIF-1 not only regulating the supply of oxygen from the bloodstream, but also actively regulating the oxygen demand of the tissue by reducing the activity of the major cellular consumer of oxygen, the mitochondria.

Perhaps the best-studied example of chronic hypoxia is the hypoxia associated with the tumor microenvironment (Brown and Giaccia, 1998). The tumor suffers from poor oxygen supply through a chaotic jumble of blood vessels that are unable to adequately perfuse the tumor cells. The oxygen tension within the tumor is also a function of the demand within the tissue, with oxygen consumption influencing the extent of tumor hypoxia (Gulledge and Dewhirst, 1996 and Papandreou et al., 2005b). The net result is that a large fraction of the tumor cells are hypoxic. Oxygen tensions within the tumor range from near normal at the capillary wall, to near zero in the perinecrotic regions. This perfusion-limited hypoxia is a potent microenvironmental stress during tumor evolution (Graeber et al., 1996 and Hockel and Vaupel, 2001) and an important variable capable of predicting for poor patient outcome. (Brizel et al., 1996Cairns and Hill, 2004Hockel et al., 1996 and Nordsmark and Overgaard, 2004).

The HIF-1 transcription factor was first identified based on its ability to activate the erythropoetin gene in response to hypoxia (Wang and Semenza, 1993). Since then, it is has been shown to be activated by hypoxia in many cells and tissues, where it can induce hypoxia-responsive target genes such as VEGF and Glut1 (Airley et al., 2001 and Kimura et al., 2004). The connection between HIF-regulation and human cancer was directly linked when it was discovered that the VHL tumor suppressor gene was part of the molecular complex responsible for the oxic degradation of HIF-1α (Maxwell et al., 1999). In normoxia, a family of prolyl hydroxylase enzymes uses molecular oxygen as a substrate and modifies HIF-1α and HIF2α by hydroxylation of prolines 564 and 402 (Bruick and McKnight, 2001 and Epstein et al., 2001). VHL then recognizes the modified HIF-α proteins, acts as an E3-type of ubiquitin ligase, and along with elongins B and C is responsible for the polyubiquitination of HIF-αs and their proteosomal degradation (Bruick and McKnight, 2001Chan et al., 2002Ivan et al., 2001 and Jaakkola et al., 2001). Mutations in VHL lead to constitutive HIF-1 gene expression, and predispose humans to cancer. The ability to recognize modified HIF-αs is at least partly responsible for VHL activity as a tumor suppressor, as introduction of nondegradable HIF-2α is capable of overcoming the growth–inhibitory activity of wild-type (wt) VHL in renal cancer cells (Kondo et al., 2003).

Mitochondrial function can be regulated by PDK1 expression. Mitochondrial oxidative phosphorylation (OXPHOS) is regulated by several mechanisms, including substrate availability (Brown, 1992). The major substrates for OXPHOS are oxygen, which is the terminal electron acceptor, and pyruvate, which is the primary carbon source. Pyruvate is the end product of glycolysis and is converted to acetyl-CoA through the activity of the pyruvate dehydrogenase complex of enzymes. The acetyl-CoA then directly enters the TCA cycle at citrate synthase where it is combined with oxaloacetate to generate citrate. In metazoans, the conversion of pyruvate to acetyl-CoA is irreversible and therefore represents a critical regulatory point in cellular energy metabolism. Pyruvate dehydrogenase is regulated by three known mechanisms: it is inhibited by acetyl-CoA and NADH, it is stimulated by reduced energy in the cell, and it is inhibited by regulatory phosphorylation of its E1 subunit by pyruvate dehydrogenase kinase (PDK) (Holness and Sugden, 2003 and Sugden and Holness, 2003). There are four members of the PDK family in vertebrates, each with specific tissue distributions (Roche et al., 2001). PDK expression has been observed in human tumor biopsies (Koukourakis et al., 2005), and we have reported that PDK3 is hypoxia-inducible in some cell types (Denko et al., 2003). In this manuscript, we find that PDK1 is also a hypoxia-responsive protein that actively regulates the function of the mitochondria under hypoxic conditions by reducing pyruvate entry into the TCA cycle. By excluding pyruvate from mitochondrial consumption, PDK1 induction may increase the conversion of pyruvate to lactate, which is in turn shunted to the extracellular space, regenerating NAD for continued glycolysis.

Identification of HIF-dependent mitochondrial proteins through genomic and bioinformatics approaches

In order to help elucidate the role of HIF-1α in regulating metabolism, we undertook a genomic search for genes that were regulated by HIF-1 in tumor cells exposed to hypoxia in vitro. We used genetically matched human RCC4 cells that had lost VHL during tumorigenesis and displayed constitutive HIF-1 activity, and a cell line engineered to re-express VHL to establish hypoxia-dependent HIF activation. These cells were treated with 18 hr of stringent hypoxia (<0.01% oxygen), and microarray analysis performed. Using a strict 2.5-fold elevation as our cutoff, we identified 173 genes that were regulated by hypoxia and/or VHL status (Table S1 in the Supplemental Data available with this article online). We used the pattern of expression in these experiments to identify putative HIF-regulated genes—ones that were constitutively elevated in the parent RCC4s independent of hypoxia, downregulated in the RCC4VHL cells under normoxia, and elevated in response to hypoxia. Of the 173 hypoxia and VHL-regulated genes, 74 fit the putative HIF-1 target pattern. The open reading frames of these genes were run through a pair of bioinformatics engines in order to predict subcellular localization, and 10 proteins scored as mitochondrial on at least one engine. The genes, fold induction, and mitochondrial scores are listed in Table 1.

HIF-1 downregulates mitochondrial oxygen consumption

Having identified several putative HIF-1 responsive gene products that had the potential to regulate mitochondrial function, we then directly measured mitochondrial oxygen consumption in cells exposed to long-term hypoxia. While other groups have studied mitochondrial function under acute hypoxia (Chandel et al., 1997), this is one of the first descriptions of mitochondrial function after long-term hypoxia where there have been extensive hypoxia-induced gene expression changes. Figure 1A is an example of the primary oxygen trace from a Clark electrode showing a drop in oxygen concentration in cell suspensions of primary fibroblasts taken from normoxic and hypoxic cultures. The slope of the curve is a direct measure of the total cellular oxygen consumption rate. Exposure of either primary human or immortalized mouse fibroblasts to 24 hr of hypoxia resulted in a reduction of this rate by approximately 50% (Figures 1A and 1B). In these experiments, the oxygen consumption can be stimulated with the mitochondrial uncoupling agent CCCP (carbonyl cyanide 3-chloro phenylhydrazone) and was completely inhibited by 2 mM potassium cyanide. We determined that the change in total cellular oxygen consumption was due to changes in mitochondrial activity by the use of the cell-permeable poison of mitochondrial complex 3, Antimycin A. Figure 1C shows that the difference in the normoxic and hypoxic oxygen consumption in murine fibroblasts is entirely due to the Antimycin-sensitive mitochondrial consumption. The kinetics with which mitochondrial function slows in hypoxic tumor cells also suggests that it is due to gene expression changes because it takes over 6 hr to achieve maximal reduction, and the reversal of this repression requires at least another 6 hr of reoxygenation (Figure 1D). These effects are not likely due to proliferation or toxicity of the treatments as these conditions are not growth inhibitory or toxic to the cells (Papandreou et al., 2005a).

Since we had predicted from the gene expression data that the mitochondrial oxygen consumption changes were due to HIF-1-mediated expression changes, we tested several genetically matched systems to determine what role HIF-1 played in the process (Figure 2). We first tested the cell lines that had been used for microarray analysis and found that the parental RCC4 cells had reduced mitochondrial oxygen consumption when compared to the VHL-reintroduced cells. Oxygen consumption in the parental cells was insensitive to hypoxia, while it was reduced by hypoxia in the wild-type VHL-transfected cell lines. Interestingly, stable introduction of a tumor-derived mutant VHL (Y98H) that cannot degrade HIF was also unable to restore oxygen consumption. These results indicate that increased expression of HIF-1 is sufficient to reduce oxygen consumption (Figure 2A). We also investigated whether HIF-1 induction was required for the observed reduction in oxygen consumption in hypoxia using two genetically matched systems. We measured normoxic and hypoxic oxygen consumption in murine fibroblasts derived from wild-type or HIF-1α null embryos (Figure 2B) and from human RKO tumor cells and RKO cells constitutively expressing ShRNAs directed against the HIF-1α gene (Figures 2C and 4C). Neither of the HIF-deficient cell systems was able to reduce oxygen consumption in response to hypoxia. These data from the HIF-overexpressing RCC cells and the HIF-deficient cells indicate that HIF-1 is both necessary and sufficient for reducing mitochondrial oxygen consumption in hypoxia.

HIF-dependent mitochondrial changes are functional, not structural

Because addition of CCCP could increase oxygen consumption even in the hypoxia-treated cells, we hypothesized that the hypoxic inhibition was a regulated activity, not a structural change in the mitochondria in response to hypoxic stress. We confirmed this interpretation by examining several additional mitochondrial characteristics in hypoxic cells such as mitochondrial morphology, quantity, and membrane potential. We examined morphology by visual inspection of both the transiently transfected mitochondrially localized DsRed protein and the endogenous mitochondrial protein cytochrome C. Both markers were indistinguishable in the parental RCC4 and the RCC4VHL cells (Figure 3A). Likewise, we measured the mitochondrial membrane potential with the functional dye rhodamine 123 and found that it was identical in the matched RCC4 cells and the matched HIF wt and knockout (KO) cells when cultured in normoxia or hypoxia (Figure 3B). Finally, we determined that the quantity of mitochondria per cell was not altered in response to HIF or hypoxia by showing that the amount of the mitochondrial marker protein HSP60 was identical in the RCC4 and HIF cell lines (Figure 3C)

PDK1 is a HIF-1 inducible target protein

After examination of the list of putative HIF-regulated mitochondrial target genes, we hypothesized that PDK1 could mediate the functional changes that we observed in hypoxia. We therefore investigated PDK1 protein expression in response to HIF and hypoxia in the genetically matched cell systems. Figure 4A shows that in the RCC4 cells PDK1 and the HIF-target gene BNip3 (Greijer et al., 2005 and Papandreou et al., 2005a) were both induced by hypoxia in a VHL-dependent manner, with the expression of PDK1 inversely matching the oxygen consumption measured in Figure 1 above. Likewise, the HIF wt MEFs show oxygen-dependent induction of PDK1 and BNip3, while the HIF KO MEFs did not show any expression of either of these proteins under any oxygen conditions (Figure 4B). Finally, the parental RKO cells were able to induce PDK1 and the HIF target gene BNip3L in response to hypoxia, while the HIF-depleted ShRNA RKO cells could not induce either protein (Figure 4C). Therefore, in all three cell types, the HIF-1-dependent regulation of oxygen consumption seen in Figure 2, corresponds to the HIF-1-dependent induction of PDK1 seen in Figure 4.

In order to determine if PDK1 was a direct HIF-1 target gene, we analyzed the genomic sequence flanking the 5′ end of the gene for possible HIF-1 binding sites based on the consensus core HRE element (A/G)CGTG (Caro, 2001). Several such sites exist within the first 400 bases upstream, so we generated reporter constructs by fusing the genomic sequence from −400 to +30 of the start site of transcription to the firefly luciferase gene. In transfection experiments, the chimeric construct showed significant induction by either cotransfection with a constitutively active HIF proline mutant (P402A/P564G) (Chan et al., 2002) or exposure of the transfected cells to 0.5% oxygen (Figure 4D). Most noteworthy, when the reporter gene was transfected into the HIF-1α null cells, it did not show induction when the cells were cultured in hypoxia, but it did show induction when cotransfected with expression HIF-1α plasmid. We then generated deletions down to the first 36 bases upstream of transcription and found that even this short sequence was responsive to HIF-1 (Figure 4D). Analysis of this small fragment showed only one consensus HRE site located in an inverted orientation in the 5′ untranslated region. We synthesized and cloned a mutant promoter fragment in which the core element ACGTG was replaced with AAAAG, and this construct lost over 90% of its hypoxic induction. These experiments suggest that it is this HRE within the proximal 5′ UTR that HIF-1 uses to transactivate the endogenous PDK1 gene in response to hypoxia.

PDK1 is responsible for the HIF-dependent mitochondrial oxygen consumption changes

In order to directly test if PDK1 was the HIF-1 target gene responsible for the hypoxic reduction in mitochondrial oxygen consumption, we generated RKO cell lines with either knockdown or overexpression of PDK1 and measured the oxygen consumption in these derivatives. The PDK1 ShRNA stable knockdown line was generated as a pool of clones cotransfected with pSUPER ShPDK1 and pTK-hygro resistance gene. After selection for growth in hygromycin, the cells were tested by Western blot for the level of PDK1 protein expression. We found that normoxic PDK1 is reduced by 75%, however, there was measurable expression of PDK1 in these cells in response to hypoxia (Figure 5A). When we measured the corresponding oxygen consumption in these cells, we found a change commensurate with the level of PDK1. The knockdown cells show elevated baseline oxygen consumption, and partial reduction in this activity in response to hypoxia. Therefore, reduction of PDK1 expression by genetic means increased mitochondrial oxygen consumption in both normoxic and hypoxic conditions. Interestingly, these cells still induced HIF-1α (Figure 5A) and HIF-1 target genes such as BNip3L in response to hypoxia (data not shown), suggesting that altered PDK1 levels do not alter HIF-1α function.

pdk1-expression-directly-regulates-cellular-oxygen-consumption-rate

pdk1-expression-directly-regulates-cellular-oxygen-consumption-rate

PDK1 expression directly regulates cellular oxygen consumption rate

http://ars.els-cdn.com/content/image/1-s2.0-S155041310600060X-gr5.jpg

Figure 5. PDK1 expression directly regulates cellular oxygen consumption rate

  1. A)Western blot of RKO cell and ShRNAPDK1RKO cell lysates after exposure to 24 hr of normoxia or 0.5% O2. Blots were probed for HIF 1α, PDK1, and tubulin as a loading control.
  2. B)Oxygen consumption rate in RKO and ShRNAPDK1RKO cells after exposure to 24 hr of normoxia or 0.5% O2.
  3. C)Western blot of RKOiresGUS cell and RKOiresPDK1 cell lysates after exposure to 24 hr of normoxia or 0.5% O2. Blots were probed for HIF 1α, PDK1, and tubulin as a loading control.
  4. D)Oxygen consumption rate in RKOiresGUS and RKOiresPDK1 cells after exposure to 24 hr of normoxia or 0.5% O2.
  5. E)Model describing the interconnected effects of HIF-1 target gene activation on hypoxic cell metabolism. Reduced oxygen conditions causes HIF-1 to coordinately induce the enzymes shown in boxes. HIF-1 activation results in increased glucose transporter expression to increase intracellular glucose flux, induction of glycolytic enzymes increases the conversion of glucose to pyruvate generating energy and NADH, induction of PDK1 decreases mitochondrial utilization of pyruvate and oxygen, and induction of LDH increases the removal of excess pyruvate as lactate and also regenerates NAD+ for increased glycolysis.

For all graphs, the error bars represent the standard error of the mean.

We also determined if overexpression of PDK1 could lead to reduced mitochondrial oxygen consumption. A separate culture of RKO cells was transfected with a PDK1-IRES-puro expression plasmid and selected for resistance to puromycin. The pool of puromycin resistant cells was tested for PDK1 expression by Western blot. These cells showed a modest increase in PDK1 expression under control conditions when compared to the cells transfected with GUS-IRES-puro, with an additional increase in PDK1 protein in response to hypoxia (Figure 5C). The corresponding oxygen consumption measurements showed that the mitochondria is very sensitive to changes in the levels of PDK1, as even this slight increase was able to significantly reduce oxygen consumption in the normoxic PDK1-puro cultures. Further increase in PDK1 levels with hypoxia further reduced oxygen consumption in both cultures (Figure 5D). The model describing the relationship between hypoxia, HIF-1, PDK1, and intermediate metabolism is described inFigure 5E.

Altering oxygen consumption alters intracellular oxygen tension and sensitivity to hypoxia-dependent cell killing

The intracellular concentration of oxygen is a net result of the rate at which oxygen diffuses into the cell and the rate at which it is consumed. We hypothesized that the rate at which oxygen was consumed within the cell would significantly affect its steady-state intracellular concentrations. We tested this hypothesis in vitro using the hypoxic marker drug pimonidazole (Bennewith and Durand, 2004). We plated high density cultures of HIF wild-type and HIF knockout cells and placed these cultures in normoxic, 2% oxygen, and anoxic incubators for overnight treatment. The overnight treatment gives the cells time to adapt to the hypoxic conditions and establish altered oxygen consumption profiles. Pimonidozole was then added for the last 4 hr of the growth of the culture. Pimonidazole binding was detected after fixation of the cells using an FITC labeled anti-pimonidazole antibody and it was quantitated by flow cytometry. The quantity of the bound drug is a direct indication of the oxygen concentration within the cell (Bennewith and Durand, 2004). The histograms in Figure 6A show that the HIF-1 knockout and wild-type cells show similar staining in the cells grown in 0% oxygen. However, the cells treated with 2% oxygen show the consequence of the genetic removal of HIF-1. The HIF-proficient cells showed relatively less pimonidazole binding at 2% when compared to the 0% culture, while the HIF-deficient cells showed identical binding between the cells at 2% and those at 0%. We interpret these results to mean that the HIF-deficient cells have greater oxygen consumption, and this has lowered the intracellular oxygenation from the ambient 2% to close to zero intracellularly. The HIF-proficient cells reduced their oxygen consumption rate so that the rate of diffusion into the cell is greater than the rate of consumption.

Figure 6. HIF-dependent decrease in oxygen consumption raises intracellular oxygen concentration, protects when oxygen is limiting, and decreases sensitivity to tirapazamine in vitro

  1. A)Pimonidazole was used to determine the intracellular oxygen concentration of cells in culture. HIF wt and HIF KO MEFs were grown at high density and exposed to 2% O2or anoxia for 24 hr in glass dishes. For the last 4 hr of treatment, cells were exposed to 60 μg/ml pimonidazole. Pimonidazole binding was quantitated by flow cytometry after binding of an FITC conjugated anti-pimo mAb. Results are representative of two independent experiments.
  2. B)HIF1α reduces oxygen consumption and protects cells when total oxygen is limited. HIF wt and HIF KO cells were plated at high density and sealed in aluminum jigs at <0.02% oxygen. At the indicated times, cells were harvested, and dead cells were quantitated by trypan blue exclusion. Note both cell lines are equally sensitive to anoxia-induced apoptosis, so the death of the HIF null cells indicates that the increased oxygen consumption removed any residual oxygen in the jig and resulted in anoxia-induced death.
  3. C)PDK1 is responsible for HIF-1’s adaptive response when oxygen is limiting. A similar jig experiment was performed to measure survival in the parental RKO, the RKO ShRNAHIF1α, and the RKOShPDK1 cells. Cell death by trypan blue uptake was measured 48 hr after the jigs were sealed.
  4. D)HIF status alters sensitivity to TPZ in vitro. HIF wt and HIF KO MEFs were grown at high density in glass dishes and exposed to 21%, 2%, and <0.01% O2conditions for 18 hr in the presence of varying concentrations of Tirapazamine. After exposure, cells were harvested and replated under normoxia to determine clonogenic viability. Survival is calculated relative to the plating efficiency of cells exposed to 0 μM TPZ for each oxygen concentration.
  5. E)Cell density alters sensitivity to TPZ. HIF wt and HIF KO MEFs were grown at varying cell densities in glass dishes and exposed to 2% O2in the presence of 10 μM TPZ for 18 hr. After the exposure, survival was determined as described in (C).

For all graphs, the error bars represent the standard error of the mean.

HIF-induced PDK1 can reduce the total amount of oxygen consumed per cell. The reduction in the amount of oxygen consumed could be significant if there is a finite amount of oxygen available, as would be the case in the hours following a blood vessel occlusion. The tissue that is fed by the vessel would benefit from being economical with the oxygen that is present. We experimentally modeled such an event using aluminum jigs that could be sealed with defined amounts of cells and oxygen present (Siim et al., 1996). We placed 10 × 106 wild-type or HIF null cells in the sealed jig at 0.02% oxygen, waited for the cells to consume the remaining oxygen, and measured cell viability. We have previously shown that these two cell types are resistant to mild hypoxia and equally sensitive to anoxia-induced apoptosis (Papandreou et al., 2005a). Therefore, any death in this experiment would be the result of the cells consuming the small amount of remaining oxygen and dying in response to anoxia. We found that in sealed jigs, the wild-type cells are more able to adapt to the limited oxygen supply by reducing consumption. The HIF null cells continued to consume oxygen, reached anoxic levels, and started to lose viability within 36 hr (Figure 6B). This is a secondary adaptive effect of HIF1. We confirmed that PDK1 was responsible for this difference by performing a similar experiment using the parental RKO cells, the RKOShRNAHIF1α and the RKOShRNAPDK1 cells. We found similar results in which both the cells with HIF1α knockdown and PDK1 knockdown were sensitive to the long-term effects of being sealed in a jig with a defined amount of oxygen (Figure 6c). Note that the RKOShPDK1 cells are even more sensitive than the RKOShHIF1α cells, presumably because they have higher basal oxygen consumption rates (Figure 5B).

Because HIF-1 can help cells adapt to hypoxia and maintain some intracellular oxygen level, it may also protect tumor cells from killing by the hypoxic cytotoxin tirapazamine (TPZ). TPZ toxicity is very oxygen dependent, especially at oxygen levels between 1%–4% (Koch, 1993). We therefore tested the relative sensitivity of the HIF wt and HIF KO cells to TPZ killing in high density cultures (Figure 6D). We exposed the cells to the indicated concentrations of drug and oxygen concentrations overnight. The cells were then harvested and replated to determine reproductive viability by colony formation. Both cell types were equally resistant to TPZ at 21% oxygen, while both cell types are equally sensitive to TPZ in anoxic conditions where intracellular oxygen levels are equivalent (Figure 6A). The identical sensitivity of both cell types in anoxia indicates that both cell types are equally competent in repairing the TPZ-induced DNA damage that is presumed to be responsible for its toxicity. However, in 2% oxygen cultures, the HIF null cells displayed a significantly greater sensitivity to the drug than the wild-type cells. This suggests that the increased oxygen consumption rate in the HIF-deficient cells is sufficient to lower the intracellular oxygen concentration relative to that in the HIF-proficient cells. The lower oxygen level is significant enough to dramatically sensitize these cells to killing by TPZ.

If the increased sensitivity to TPZ in the HIF ko cells is determined by intracellular oxygen consumption differences, then this effect should also be cell-density dependent. We showed that this is indeed the case in Figure 6E where oxygen and TPZ concentrations were held constant, and increased cell density lead to increased TPZ toxicity. The effect was much more pronounced in the HIF KO cells, although the HIF wt cells showed some increased toxicity in the highest density cultures, consistent with the fact they were still consuming some oxygen, even with HIF present (Figure 1). The in vitro TPZ survival data is therefore consistent with our hypothesis that control of oxygen consumption can regulate intracellular oxygen concentration, and suggests that increased oxygen consumption could sensitize cells to hypoxia-dependent therapy.

Discussion

The findings presented here show that HIF-1 is actively responsible for regulating energy production in hypoxic cells by an additional, previously unrecognized mechanism. It has been shown that HIF-1 induces the enzymes responsible for glycolysis when it was presumed that low oxygen did not support efficient oxidative phosphorylation (Iyer et al., 1998 and Seagroves et al., 2001). The use of glucose to generate ATP is capable of satisfying the energy requirements of a cell if glucose is in excess (Papandreou et al., 2005a). We now find that at the same time that glycolysis is increasing, mitochondrial respiration is decreasing. However, the decreased respiration is not because there is not enough oxygen present to act as a substrate for oxidative phosphorylation, but because the flow of pyruvate into the TCA cycle has been reduced by the activity of pyruvate dehydrogenase kinase. Other reports have suggested that oxygen utilization is shifted in cells exposed to hypoxia, but these reports have focused on other regulators such as nitric oxide synthase (Hagen et al., 2003). NO can reduce oxygen consumption through direct inhibition of cytochrome oxidase, but this effect seems to be more significant at physiologic oxygen concentrations, not at severe levels seen in the tumor (Palacios-Callender et al., 2004).

7.9.8 HIF-1. upstream and downstream of cancer metabolism

Semenza GL1.
Curr Opin Genet Dev. 2010 Feb; 20(1):51-6
http://dx.doi.org/10.1016%2Fj.gde.2009.10.009

Hypoxia-inducible factor 1 (HIF-1) plays a key role in the reprogramming of cancer metabolism by activating transcription of genes encoding glucose transporters and glycolytic enzymes, which take up glucose and convert it to lactate; pyruvate dehydrogenase kinase 1, which shunts pyruvate away from the mitochondria; and BNIP3, which triggers selective mitochondrial autophagy. The shift from oxidative to glycolytic metabolism allows maintenance of redox homeostasis and cell survival under conditions of prolonged hypoxia. Many metabolic abnormalities in cancer cells increase HIF-1 activity. As a result, a feed-forward mechanism can be activated that drives HIF-1 activation and may promote tumor progression. Hypoxia-inducible factor 1 (HIF-1) plays a key role in the reprogramming of cancer metabolism by activating transcription of genes encoding glucose transporters and glycolytic enzymes, which take up glucose and convert it to lactate; pyruvate dehydrogenase kinase 1, which shunts pyruvate away from the mitochondria; and BNIP3, which triggers selective mitochondrial autophagy. The shift from oxidative to glycolytic metabolism allows maintenance of redox homeostasis and cell survival under conditions of prolonged hypoxia. Many metabolic abnormalities in cancer cells increase HIF-1 activity. As a result, a feed-forward mechanism can be activated that drives HIF-1 activation and may promote tumor progression.

Metastatic cancer is characterized by reprogramming of cellular metabolism leading to increased uptake of glucose for use as both an anabolic and catabolic substrate. Increased glucose uptake is such a reliable feature that it is utilized clinically to detect metastases by positron emission tomography using 18F-fluorodeoxyglucose (FDG-PET) with a sensitivity of ~90% [1]. As with all aspects of cancer biology, the details of metabolic reprogramming differ widely among individual tumors. However, the role of specific signaling pathways and transcription factors in this process is now understood in considerable detail. This review will focus on the involvement of hypoxia-inducible factor 1 (HIF-1) in both mediating metabolic reprogramming and responding to metabolic alterations. The placement of HIF-1 both upstream and downstream of cancer metabolism results in a feed-forward mechanism that may play a major role in the development of the invasive, metastatic, and lethal cancer phenotype.

O2 concentrations are significantly reduced in many human cancers compared to the surrounding normal tissue. The median PO2 in breast cancers is ~10 mm Hg, as compared to ~65 mm Hg in normal breast tissue [2]. Reduced O2 availability induces HIF-1, which regulates the transcription of hundreds of genes [3*,4*] that encode proteins involved in every aspect of cancer biology, including: cell immortalization and stem cell maintenance; genetic instability; glucose and energy metabolism; vascularization; autocrine growth factor signaling; invasion and metastasis; immune evasion; and resistance to chemotherapy and radiation therapy [5].

HIF-1 is a transcription factor that consists of an O2-regulated HIF-1α and a constitutively expressed HIF-1β subunit [6]. In well-oxygenated cells, HIF-1α is hydroxylated on proline residue 402 (Pro-402) and/or Pro-564 by prolyl hydroxylase domain protein 2 (PHD2), which uses O2 and α-ketoglutarate as substrates in a reaction that generates CO2 and succinate as byproducts [7]. Prolyl-hydroxylated HIF-1α is bound by the von Hippel-Lindau tumor suppressor protein (VHL), which recruits an E3-ubiquitin ligase that targets HIF-1α for proteasomal degradation (Figure 1A). Asparagine 803 in the transactivation domain is hydroxylated in well-oxygenated cells by factor inhibiting HIF-1 (FIH-1), which blocks the binding of the coactivators p300 and CBP [7]. Under hypoxic conditions, the prolyl and asparaginyl hydroxylation reactions are inhibited by substrate (O2) deprivation and/or the mitochondrial generation of reactive oxygen species (ROS), which may oxidize Fe(II) present in the catalytic center of the hydroxylases [8].

HIF-1 and metabolism  nihms156580f1

HIF-1 and metabolism nihms156580f1

HIF-1 and metabolism

http://www.ncbi.nlm.nih.gov/pmc/articles/PMC2822127/bin/nihms156580f1.gif

Figure 1 HIF-1 and metabolism. (A) Regulation of HIF-1α protein synthesis and stability and HIF-1-dependent metabolic reprogramming. The rate of translation of HIF-1α mRNA into protein in cancer cells is dependent upon the activity of the mammalian 

The finding that acute changes in PO2 increase mitochondrial ROS production suggests that cellular respiration is optimized at physiological PO2 to limit ROS generation and that any deviation in PO2 — up or down — results in increased ROS generation. If hypoxia persists, induction of HIF-1 leads to adaptive mechanisms to reduce ROS and re-establish homeostasis, as described below. Prolyl and asparaginyl hydroxylation provide a molecular mechanism by which changes in cellular oxygenation can be transduced to the nucleus as changes in HIF-1 activity. This review will focus on recent advances in our understanding of the role of HIF-1 in controlling glucose and energy metabolism, but it should be appreciated that any increase in HIF-1 activity that leads to changes in cell metabolism will also affect many other critical aspects of cancer biology [5] that will not be addressed here.

HIF-1 target genes involved in glucose and energy metabolism

HIF-1 activates the transcription of SLC2A1 and SLC2A3, which encode the glucose transporters GLUT1 and GLUT3, respectively, as well as HK1 and HK2, which encode hexokinase, the first enzyme of the Embden-Meyerhoff (glycolytic) pathway [9]. Once taken up by GLUT and phosphorylated by HK, FDG cannot be metabolized further; thus, FDG-PET signal is determined by FDG delivery to tissue (i.e. perfusion) and GLUT/HK expression/activity. Unlike FDG, glucose is further metabolized to pyruvate by the action of the glycolytic enzymes, which are all encoded by HIF-1 target genes (Figure 1A). Glycolytic intermediates are also utilized for nucleotide and lipid synthesis [10]. Lactate dehydrogenase A (LDHA), which converts pyruvate to lactate, and monocarboxylate transporter 4 (MCT4), which transports lactate out of the cell (Figure 1B), are also regulated by HIF-1 [9,11]. Remarkably, lactate produced by hypoxic cancer cells can be taken up by non-hypoxic cells and used as a respiratory substrate [12**].

Pyruvate represents a critical metabolic control point, as it can be converted to acetyl coenzyme A (AcCoA) by pyruvate dehydrogenase (PDH) for entry into the tricarboxylic acid (TCA) cycle or it can be converted to lactate by LDHA (Figure 1B). Pyruvate dehydrogenase kinase (PDK), which phosphorylates and inactivates the catalytic domain of PDH, is encoded by four genes and PDK1 is activated by HIF-1 [13,14]. (Further studies are required to determine whether PDK2PDK3, or PDK4 is regulated by HIF-1.) As a result of PDK1 activation, pyruvate is actively shunted away from the mitochondria, which reduces flux through the TCA cycle, thereby reducing delivery of NADH and FADH2 to the electron transport chain. This is a critical adaptive response to hypoxia, because in HIF-1α–null mouse embryo fibroblasts (MEFs), PDK1 expression is not induced by hypoxia and the cells die due to excess ROS production, which can be ameliorated by forced expression of PDK1 [13]. MYC, which is activated in ~40% of human cancers, cooperates with HIF-1 to activate transcription of PDK1, thereby amplifying the hypoxic response [15]. Pharmacological inhibition of HIF-1 or PDK1 activity increases O2 consumption by cancer cells and increases the efficacy of a hypoxia-specific cytotoxin [16].

Hypoxia also induces mitochondrial autophagy in many human cancer cell lines through HIF-1-dependent expression of BNIP3 and a related BH3 domain protein, BNIP3L [19**]. Autocrine signaling through the platelet-derived growth factor receptor in cancer cells increases HIF-1 activity and thereby increases autophagy and cell survival under hypoxic conditions [21]. Autophagy may also occur in a HIF-1-independent manner in response to other physiological stimuli that are associated with hypoxic conditions, such as a decrease in the cellular ATP:AMP ratio, which activates AMP kinase signaling [22].

In clear cell renal carcinoma, VHL loss of function (LoF) results in constitutive HIF-1 activation, which is associated with impaired mitochondrial biogenesis that results from HIF-1-dependent expression of MXI1, which blocks MYC-dependent expression of PGC-1β, a coactivator that is required for mitochondrial biogenesis [23]. Inhibition of wild type MYC activity in renal cell carcinoma contrasts with the synergistic effect of HIF-1 and oncogenic MYC in activating PDK1 transcription [24].

Genetic and metabolic activators of HIF-1

Hypoxia plays a critical role in cancer progression [2,5] but not all cancer cells are hypoxic and a growing number of O2-independent mechanisms have been identified by which HIF-1 is induced [5]. Several mechanisms that are particularly relevant to cancer metabolism are described below.

Activation of mTOR

Alterations in mitochondrial metabolism

NAD+ levels

It is of interest that the NAD+-dependent deacetylase sirtuin 1 (SIRT1) was found to bind to, deacetylate, and increase transcriptional activation by HIF-2α but not HIF-1α [42**]. Another NAD+-dependent enzyme is poly(ADP-ribose) polymerase 1 (PARP1), which was recently shown to bind to HIF-1α and promote transactivation through a mechanism that required the enzymatic activity of PARP1 [43]. Thus, transactivation mediated by both HIF-1α and HIF-2α can be modulated according to NAD+ levels.

Nitric oxide

Increased expression of nitric oxide (NO) synthase isoforms and increased levels of NO have been shown to increase HIF-1α protein stability in human oral squamous cell carcinoma [44]. In prostate cancer, nuclear co-localization of endothelial NO synthase, estrogen receptor β, HIF-1α, and HIF-2α was associated with aggressive disease and the proteins were found to form chromatin complexes on the promoter of TERT gene encoding telomerase [45**]. The NOS2 gene encoding inducible NO synthase is HIF-1 regulated [5], suggesting another possible feed-forward mechanism.

7.9.9 In Vivo HIF-Mediated Reductive Carboxylation

Gameiro PA1Yang JMetelo AMPérez-Carro R, et al.
Cell Metab. 2013 Mar 5; 17(3):372-85.
http://dx.doi.org/10.1016%2Fj.cmet.2013.02.002

Hypoxic and VHL-deficient cells use glutamine to generate citrate and lipids through reductive carboxylation (RC) of α-ketoglutarate. To gain insights into the role of HIF and the molecular mechanisms underlying RC, we took advantage of a panel of disease-associated VHL mutants and showed that HIF expression is necessary and sufficient for the induction of RC in human renal cell carcinoma (RCC) cells. HIF expression drastically reduced intracellular citrate levels. Feeding VHL-deficient RCC cells with acetate or citrate or knocking down PDK-1 and ACLY restored citrate levels and suppressed RC. These data suggest that HIF-induced low intracellular citrate levels promote the reductive flux by mass action to maintain lipogenesis. Using [1–13C] glutamine, we demonstrated in vivo RC activity in VHL-deficient tumors growing as xenografts in mice. Lastly, HIF rendered VHL-deficient cells sensitive to glutamine deprivation in vitro, and systemic administration of glutaminase inhibitors suppressed the growth of RCC cells as mice xenografts.

Cancer cells undergo fundamental changes in their metabolism to support rapid growth, adapt to limited nutrient resources, and compete for these supplies with surrounding normal cells. One of the metabolic hallmarks of cancer is the activation of glycolysis and lactate production even in the presence of adequate oxygen. This is termed the Warburg effect, and efforts in cancer biology have revealed some of the molecular mechanisms responsible for this phenotype (Cairns et al., 2011). More recently, 13C isotopic studies have elucidated the complementary switch of glutamine metabolism that supports efficient carbon utilization for anabolism and growth (DeBerardinis and Cheng, 2010). Acetyl-CoA is a central biosynthetic precursor for lipid synthesis, being generated from glucose-derived citrate in well-oxygenated cells (Hatzivassiliou et al., 2005). Warburg-like cells, and those exposed to hypoxia, divert glucose to lactate, raising the question of how the tricarboxylic acid (TCA) cycle is supplied with acetyl-CoA to support lipogenesis. We and others demonstrated, using 13C isotopic tracers, that cells under hypoxic conditions or defective mitochondria primarily utilize glutamine to generate citrate and lipids through reductive carboxylation (RC) of α-ketoglutarate by isocitrate dehydrogenase 1 (IDH1) or 2 (IDH2) (Filipp et al., 2012Metallo et al., 2012;Mullen et al., 2012Wise et al., 2011).

The transcription factors hypoxia inducible factors 1α and 2α (HIF-1α, HIF-2α) have been established as master regulators of the hypoxic program and tumor phenotype (Gordan and Simon, 2007Semenza, 2010). In addition to tumor-associated hypoxia, HIF can be directly activated by cancer-associated mutations. The von Hippel-Lindau (VHL) tumor suppressor is inactivated in the majority of sporadic clear-cell renal carcinomas (RCC), with VHL-deficient RCC cells exhibiting constitutive HIF-1α and/or HIF-2α activity irrespective of oxygen availability (Kim and Kaelin, 2003). Previously, we showed that VHL-deficient cells also relied on RC for lipid synthesis even under normoxia. Moreover, metabolic profiling of two isogenic clones that differ in pVHL expression (WT8 and PRC3) suggested that reintroduction of wild-type VHL can restore glucose utilization for lipogenesis (Metallo et al., 2012). The VHL tumor suppressor protein (pVHL) has been reported to have several functions other than the well-studied targeting of HIF. Specifically, it has been reported that pVHL regulates the large subunit of RNA polymerase (Pol) II (Mikhaylova et al., 2008), p53 (Roe et al., 2006), and the Wnt signaling regulator Jade-1. VHL has also been implicated in regulation of NF-κB signaling, tubulin polymerization, cilia biogenesis, and proper assembly of extracellular fibronectin (Chitalia et al., 2008Kim and Kaelin, 2003Ohh et al., 1998Thoma et al., 2007Yang et al., 2007). Hypoxia inactivates the α-ketoglutarate-dependent HIF prolyl hydroxylases, leading to stabilization of HIF. In addition to this well-established function, oxygen tension regulates a larger family of α-ketoglutarate-dependent cellular oxygenases, leading to posttranslational modification of several substrates, among which are chromatin modifiers (Melvin and Rocha, 2012). It is therefore conceivable that the effect of hypoxia on RC that was reported previously may be mediated by signaling mechanisms independent of the disruption of the pVHL-HIF interaction. Here we (1) demonstrate that HIF is necessary and sufficient for RC, (2) provide insights into the molecular mechanisms that link HIF to RC, (3) detected RC activity in vivo in human VHL-deficient RCC cells growing as tumors in nude mice, (4) provide evidence that the reductive phenotype ofVHL-deficient cells renders them sensitive to glutamine restriction in vitro, and (5) show that inhibition of glutaminase suppresses growth of VHL-deficient cells in nude mice. These observations lay the ground for metabolism-based therapeutic strategies for targeting HIF-driven tumors (such as RCC) and possibly the hypoxic compartment of solid tumors in general.

Functional Interaction between pVHL and HIF Is Necessary to Inhibit RC

Figure 1  HIF Inactivation Is Necessary for Downregulation of Reductive Carboxylation by pVHL

We observed a concurrent regulation in glucose metabolism in the different VHL mutants. Reintroduction of wild-type or type 2C pVHL mutant, which can meditate HIF-α destruction, stimulated glucose oxidation via pyruvate dehydrogenase (PDH), as determined by the degree of 13C-labeled TCA cycle metabolites (M2 enrichment) (Figures 1D and 1E). In contrast, reintroduction of an HIF nonbinding Type 2B pVHL mutant failed to stimulate glucose oxidation, resembling the phenotype observed in VHL-deficient cells (Figures 1D and 1E). Additional evidence for the overall glucose utilization was obtained from the enrichment of M3 isotopomers using [U13-C6]glucose (Figure S1A), which shows a lower contribution of glucose-derived carbons to the TCA cycle in VHL-deficient RCC cells (via pyruvate carboxylase and/or continued TCA cycling).

To test the effect of HIF activation on the overall glutamine incorporation in the TCA cycle, we labeled an isogenic pair of VHL-deficient and VHL-reconstituted UMRC2 cells with [U-13C5]glutamine, which generates M4 fumarate, M4 malate, M4 aspartate, and M4 citrate isotopomers through glutamine oxidation. As seen in Figure S1BVHL-deficient/VHL-positive UMRC2 cells exhibit similar enrichment of M4 fumarate, M4 malate, and M4 asparate (but not citrate) showing that VHL-deficient cells upregulate reductive carboxylation without compromising oxidative metabolism from glutamine. …  Labeled carbon derived from [5-13C1]glutamine can be incorporated into fatty acids exclusively through RC, and the labeled carbon cannot be transferred to palmitate through the oxidative TCA cycle (Figure 1B, red carbons). Tracer incorporation from [5-13C1]glutamine occurs in the one carbon (C1) of acetyl-CoA, which results in labeling of palmitate at M1, M2, M3, M4, M5, M6, M7, and M8 mass isotopomers. In contrast, lipogenic acetyl-CoA molecules originating from [U-13C6]glucose are fully labeled, and the labeled palmitate is represented by M2, M4, M6, M8, M10, M12, M14, and M16 mass isotopomers.

Figure 2 HIF Inactivation Is Necessary for Downregulation of Reductive Lipogenesis by pVHL

To determine the specific contribution from glucose oxidation or glutamine reduction to lipogenic acetyl-CoA, we performed isotopomer spectral analysis (ISA) of palmitate labeling patterns. ISA indicates that wild-type pVHL or pVHL L188V mutant-reconstituted UMRC2 cells relied mainly on glucose oxidation to produce lipogenic acetyl-CoA, while UMRC2 cells reconstituted with a pVHL mutant defective in HIF inactivation (Y112N or Y98N) primarily employed RC. Upon disruption of the pVHL-HIF interaction, glutamine becomes the preferred substrate for lipogenesis, supplying 70%–80% of the lipogenic acetyl-CoA (Figure 2C). This is not a cell-line-specific phenomenon, but it applies to VHL-deficient human RCC cells in general; the same changes are observed in 786-O cells reconstituted with wild-type pVHL or mutant pVHL or infected with vector only as control (Figure S2).

HIF Is Sufficient to Induce RC (reductive carboxylation) from Glutamine in RCC Cells

As shown in Figure 3C, reintroduction of wild-type VHLinto 786-O cells suppressed RC, whereas the expression of the constitutively active HIF-2α mutant was sufficient to stimulate this reaction, restoring the M1 enrichment of TCA cycle metabolites observed in VHL-deficient 786-O cells. Expression of HIF-2α P-A also led to a concomitant decrease in glucose oxidation, corroborating the metabolic alterations observed in glutamine metabolism (Figures 3D and 3E).

Figure 3 Expression of HIF-2α Is Sufficient to Induce Reductive Carboxylation and Lipogenesis from Glutamine in RCC Cells

Expression of HIF-2α P-A in 786-O cells phenocopied the loss-of-VHL with regards to glutamine reduction for lipogenesis (Figure 3G), suggesting that HIF-2α can induce the glutamine-to-lipid pathway in RCC cells per se. Although reintroduction of wild-type VHL restored glucose oxidation in UMRC2 and UMRC3 cells (Figures S3B–S3I), HIF-2α P-A expression did not measurably affect the contribution of each substrate to the TCA cycle or lipid synthesis in these RCC cells (data not shown). UMRC2 and UMRC3 cells endogenously express both HIF-1α and HIF-2α, whereas 786-O cells exclusively express HIF-2α. There is compelling evidence suggesting, at least in RCC cells, that HIF-α isoforms have overlapping—but also distinct—functions and their roles in regulating bioenergetic processes remain an area of active investigation. Overall, HIF-1α has an antiproliferative effect, and its expression in vitro leads to rapid death of RCC cells while HIF-2α promotes tumor growth (Keith et al., 2011Raval et al., 2005).

Metabolic Flux Analysis Shows Net Reversion of the IDH Flux upon HIF Activation

To determine absolute fluxes in RCC cells, we employed 13C metabolic flux analysis (MFA) as previously described (Metallo et al., 2012). Herein, we performed MFA using a combined model of [U-13C6]glucose and [1-13C1]glutamine tracer data sets from the 786-O derived isogenic clones PRC3 (VHL−/ −)/WT8 (VHL+) cells, which show a robust metabolic regulation by reintroduction of pVHL. To this end, we first determined specific glucose/glutamine consumption and lactate/glutamate secretion rates. As expected, PRC3 exhibited increased glucose consumption and lactate production when compared to WT8 counterparts (Figure 4A). While PRC3 exhibited both higher glutamine consumption and glutamate production rates than WT8 (Figure 4A), the net carbon influx was higher in PRC3 cells (Figure 4B). Importantly, the fitted data show that the flux of citrate to α-ketoglutarate was negative in PRC3 cells (Figure 4C). This indicates that the net (forward plus reverse) flux of isocitrate dehydrogenase and aconitase (IDH + ACO) is toward citrate production. The exchange flux was also higher in PRC3 than WT8 cells, whereas the PDH flux was lower in PRC3 cells. In agreement with the tracer data, these MFA results strongly suggest that the reverse IDH + ACO fluxes surpass the forward flux in VHL-deficient cells. The estimated ATP citrate lyase (ACLY) flux was also lower in PRC3 than in WT8 cells. Furthermore, the malate dehydrogenase (MDH) flux was negative, reflecting a net conversion of oxaloacetate into malate in VHL-deficient cells (Figure 4C). This indicates an increased flux through the reductive pathway downstream of IDH, ACO, and ACLY. Additionally, some TCA cycle flux estimates downstream of α-ketoglutarate were not significantly different between PRC and WT8 (Table S1). This shows that VHL-deficient cells maintain glutamine oxidation while upregulating reductive carboxylation (Figure S1B). This finding is in agreement with the higher glutamine uptake observed in VHL-deficient cells. Table S1 shows the metabolic network and complete MFA results. …

Addition of citrate in the medium, in contrast to acetate, led to an increase in the citrate-to-α-ketoglutarate ratio (Figure 5L) and absolute citrate levels (Figure S4H) not only in VHL-deficient but alsoVHL-reconstituted cells. The ability of exogenous citrate, but not acetate, to also affect RC in VHL-reconstituted cells may be explained by compartmentalization differences or by allosteric inhibition of citrate synthase (Lehninger, 2005); that is, the ability of acetate to raise the intracellular levels of citrate may be limited in (VHL-reconstituted) cells that exhibit high endogenous levels of citrate. Whatever the mechanism, the results imply that increasing the pools of intracellular citrate has a direct biochemical effect in cells with regards to their reliance on RC. Finally, we assayed the transcript and protein levels of enzymes involved in the reductive utilization of glutamine and did not observe significant differences between VHL-deficient andVHL-reconstituted UMRC2 cells (Figures S4I and S4J), suggesting that HIF does not promote RC by direct transactivation of these enzymes. The IDH1/IDH2 equilibrium is defined as follows:

[α−ketoglutrate][NADPH][CO2]/[Isocitrate][NADP+]=K(IDH)

Figure 5 Regulation of HIF-Mediated Reductive Carboxylation by Citrate Levels

We sought to investigate whether HIF could affect the driving force of the IDH reaction by also enhancing NADPH production. We did not observe a significant alteration of the NADP+/NADPH ratio between VHL-deficient and VHL-positive cells in the cell lysate (Figure S4I). Yet, we determined the ratio of the free dinucleotides using the measured ratios of suitable oxidized (α-ketoglutarate) and reduced (isocitrate/citrate) metabolites that are linked to the NADP-dependent IDH enzymes. The determined ratios (Figure S4J) are in close agreement with the values initially reported by the Krebs lab (Veech et al., 1969) and showed that HIF-expressing UMRC2 cells exhibit a higher NADP+/NADPH ratio. Collectively, these data strongly suggest that HIF-regulated citrate levels modulate the reductive flux to maintain adequate lipogenesis.

Reductive Carboxylation from Glutamine Is Detectable In Vivo

Figure 6 Evidence for Reductive Carboxylation Activity In Vivo

Loss of VHL Renders RCC Cells Sensitive to Glutamine Deprivation

We hypothesized that VHL deficiency results in cell addiction to glutamine for proliferation. We treated the isogenic clones PRC3 (VHL-deficient cells) and WT8 (VHL-reconstituted cells) with the glutaminase inhibitor 968 (Wang et al., 2010a). VHL-deficient PRC3 cells were more sensitive to treatment with 968, compared to the VHL-reconstituted WT8 cells (Figure 7A). To confirm that this is not only a cell-line-specific phenomenon, we also cultured UMRC2 cells in the presence of 968 or diluent control and showed selective sensitivity of VHL-deficient cells (Figure 7B).

Figure 7 VHL-Deficient Cells and Tumors Are Sensitive to Glutamine Deprivation

(A–E) Cell proliferation is normalized to the corresponding cell type grown in 1 mM glutamine-containing medium. Effect of treatment with glutaminase (GLS) inhibitor 968 in PRC3/WT8 (A) and UMRC2 cells (B). Rescue of GLS inhibition with dimethyl alpha-ketoglutarate (DM-Akg; 4 mM) or acetate (4 mM) in PRC3/WT8 clonal cells (C) and polyclonal 786-O cells (D). Effect of GLS inhibitor BPTES in UMRC2 cells (E). Student’s t test compares VHL-reconstituted cells to control cells in (A), (B), and (E) and DM-Akg or acetate-rescued cells to correspondent control cells treated with 968 only in (C) and (D) (asterisk in parenthesis indicates comparison between VHL-reconstituted to control cells). Error bars represent SEM.

(F) GLS inhibitor BPTES suppresses growth of human UMRC3 RCC cells as xenografts in nu/nu mice. When the tumors reached 100mm3, injections with BPTES or vehicle control were carried out daily for 14 days (n = 12). BPTES treatment decreases tumor size and mass (see insert). Student’s t test compares control to BPTES-treated mice (F). Error bars represent SEM.

(G) Diagram showing the regulation of reductive carboxylation by HIF.

http://www.ncbi.nlm.nih.gov/pmc/articles/PMC4003458/bin/nihms449661f7.jpg

In summary, our findings show that HIF is necessary and sufficient to promote RC from glutamine. By inhibiting glucose oxidation in the TCA cycle and reducing citrate levels, HIF shifts the IDH reaction toward RC to support citrate production and lipogenesis (Figure 7G). The reductive flux is active in vivo, fuels tumor growth, and can potentially be targeted pharmacologically. Understanding the significance of reductive glutamine metabolism in tumors may lead to metabolism-based therapeutic strategies.

Along with others, we reported that hypoxia and loss of VHL engage cells in reductive carboxylation (RC) from glutamine to support citrate and lipid synthesis (Filipp et al., 2012Metallo et al., 2012Wise et al., 2011). Wise et al. (2011) suggested that inactivation of HIF in VHL-deficient cells leads to reduction of RC. These observations raise the hypothesis that HIF, which is induced by hypoxia and is constitutively active inVHL-deficient cells, mediates RC. In our current work, we provide mechanistic insights that link HIF to RC. First, we demonstrate that polyclonal reconstitution of VHL in several human VHL-deficient RCC cell lines inhibits RC and restores glucose oxidation. Second, the VHL mutational analysis demonstrates that the ability of pVHL to mitigate reductive lipogenesis is mediated by HIF and is not the outcome of previously reported, HIF-independent pVHL function(s). Third, to prove our hypothesis we showed that constitutive expression of a VHL-independent HIF mutant is sufficient to phenocopy the reductive phenotype observed in VHL-deficient cells. In addition, we showed that RC is not a mere in vitro phenomenon, but it can be detected in vivo in human tumors growing as mouse xenografts. Lastly, treatment of VHL-deficient human xenografts with glutaminase inhibitors led to suppression of their growth as tumors.

7.9.10 Evaluation of HIF-1 inhibitors as anticancer agents

Semenza GL1.
Drug Discov Today. 2007 Oct; 12(19-20):853-9
http://dx.doi.org/10.1016/j.drudis.2007.08.006

Hypoxia-inducible factor 1 (HIF-1) regulates the transcription of many genes involved in key aspects of cancer biology, including immortalization, maintenance of stem cell pools, cellular dedifferentiation, genetic instability, vascularization, metabolic reprogramming, autocrine growth factor signaling, invasion/metastasis, and treatment failure. In animal models, HIF-1 overexpression is associated with increased tumor growth, vascularization, and metastasis, whereas HIF-1 loss-of-function has the opposite effect, thus validating HIF-1 as a target. In further support of this conclusion, immunohistochemical detection of HIF-1α overexpression in biopsy sections is a prognostic factor in many cancers. A growing number of novel anticancer agents have been shown to inhibit HIF-1 through a variety of molecular mechanisms. Determining which combination of drugs to administer to any given patient remains a major obstacle to improving cancer treatment outcomes.

Aurelian Udristioiu

Aurelian

Aurelian Udristioiu

Lab Director at Emergency County Hospital Targu Jiu

Mechanisms that control T cell metabolic reprogramming are now coming to light, and many of the same oncogenes importance in cancer metabolism are also crucial to drive T cell metabolic transformations, most notably Myc, hypoxia inducible factor (HIF)1a, estrogen-related receptor (ERR) a, and the mTOR pathway.
The proto-oncogenic transcription factor, Myc, is known to promote transcription of genes for the cell cycle, as well as aerobic glycolysis and glutamine metabolism. Recently, Myc has been shown to play an essential role in inducing the expression of glycolytic and glutamine metabolism genes in the initial hours of T cell activation. In a similar fashion, the transcription factor (HIF)1a can up-regulate glycolytic genes to allow cancer cells to survive under hypoxic conditions

Read Full Post »

Sirtuins

Writer and Curator: Larry H. Bernstein, MD, FCAP 

7.8  Sirtuins

7.8.1 Function and regulation of the mitochondrial Sirtuin isoform Sirt5 in Mammalia

7.8.2 Substrates and Regulation Mechanisms for the Human Mitochondrial Sirtuins- Sirt3 and Sirt5

7.8.3 The mTORC1 Pathway Stimulates Glutamine Metabolism and Cell Proliferation by Repressing SIRT4

7.8.4  Rab1A and small GTPases Activate mTORC1

7.8.5 PI3K.Akt signaling in osteosarcoma

7.8.6 The mTORC1-S6K1 Pathway Regulates Glutamine Metabolism through the eIF4B-Dependent Control of c-Myc Translation

7.8.7 Localization of mouse mitochondrial SIRT proteins

7.8.8 SIRT4 Has Tumor-Suppressive Activity and Regulates the Cellular Metabolic Response to DNA Damage by Inhibiting Mitochondrial Glutamine Metabolism

7.8.9 Mitochondrial sirtuins and metabolic homeostasis

7.8.10 Mitochondrial sirtuins

7.8.11 Sirtuin regulation of mitochondria: energy production, apoptosis, and signaling


7.8.1 Function and regulation of the mitochondrial Sirtuin isoform Sirt5 in Mammalia

Gertz M1Steegborn C.
Biochim Biophys Acta. 2010 Aug; 1804(8):1658-65
http://dx.doi.org:/10.1016/j.bbapap.2009.09.011

Sirtuins are a family of protein deacetylases that catalyze the nicotinamide adenine dinucleotide (NAD(+))-dependent removal of acetyl groups from modified lysine side chains in various proteins. Sirtuins act as metabolic sensors and influence metabolic adaptation but also many other processes such as stress response mechanisms, gene expression, and organismal aging. Mammals have seven Sirtuin isoforms, three of them – Sirt3, Sirt4, and Sirt5 – located to mitochondria, our centers of energy metabolism and apoptosis initiation. In this review, we shortly introduce the mammalian Sirtuin family, with a focus on the mitochondrial isoforms. We then discuss in detail the current knowledge on the mitochondrial isoform Sirt5. Its physiological role in metabolic regulation has recently been confirmed, whereas an additional function in apoptosis regulation remains speculative. We will discuss the biochemical properties of Sirt5 and how they might contribute to its physiological function. Furthermore, we discuss the potential use of Sirt5 as a drug target, structural features of Sirt5 and of an Sirt5/inhibitor complex as well as their differences to other Sirtuins and the current status of modulating Sirt5 activity with pharmacological compounds.

removal of acetyl groups from modified lysine side chain

removal of acetyl groups from modified lysine side chain

http://ars.els-cdn.com/content/image/1-s2.0-S1570963909002593-gr1.sml
removal of acetyl groups from modified lysine side chain

sirtuin structure

sirtuin structure

http://ars.els-cdn.com/content/image/1-s2.0-S1570963909002593-gr2.sml
sirtuin structure

7.8.2 Substrates and Regulation Mechanisms for the Human Mitochondrial Sirtuins- Sirt3 and Sirt5

Schlicker C1Gertz MPapatheodorou PKachholz BBecker CFSteegborn C
J Mol Biol. 2008 Oct 10; 382(3):790-801
http://dx.doi.org/10.1016/j.jmb.2008.07.048

The enzymes of the Sirtuin family of nicotinamide-adenine-dinucleotide-dependent protein deacetylases are emerging key players in nuclear and cytosolic signaling, but also in mitochondrial regulation and aging. Mammalian mitochondria contain three Sirtuins, Sirt3, Sirt4, and Sirt5. Only one substrate is known for Sirt3 as well as for Sirt4, and up to now, no target for Sirt5 has been reported. Here, we describe the identification of novel substrates for the human mitochondrial Sirtuin isoforms Sirt3 and Sirt5. We show that Sirt3 can deacetylate and thereby activate a central metabolic regulator in the mitochondrial matrix, glutamate dehydrogenase. Furthermore, Sirt3 deacetylates and activates isocitrate dehydrogenase 2, an enzyme that promotes regeneration of antioxidants and catalyzes a key regulation point of the citric acid cycle. Sirt3 thus can regulate flux and anapleurosis of this central metabolic cycle. We further find that the N- and C-terminal regions of Sirt3 regulate its activity against glutamate dehydrogenase and a peptide substrate, indicating roles for these regions in substrate recognition and Sirtuin regulation. Sirt5, in contrast to Sirt3, deacetylates none of the mitochondrial matrix proteins tested. Instead, it can deacetylate cytochrome c, a protein of the mitochondrial intermembrane space with a central function in oxidative metabolism, as well as apoptosis initiation. Using a mitochondrial import assay, we find that Sirt5 can indeed be translocated into the mitochondrial intermembrane space, but also into the matrix, indicating that localization might contribute to Sirt5 regulation and substrate selection.

Mitochondria are central organelles in cellular energy metabolism, but also in processes such as apoptosis, cellular senescence, and lifespan regulation.1 and 2 Failures in mitochondrial function and regulation contribute to aging-related diseases, such as atherosclerosis3 and Parkinson’s disease,4 likely by increasing cellular levels of reactive oxygen species and the damage they cause.1 Emerging players in metabolic regulation and cellular signaling are members of the Sirtuin family of homologs of “silent information regulator 2” (Sir2), a yeast protein deacetylase.5 and 6 Sir2 was found to be involved in aging processes and lifespan determination in yeast,7 and 8 and its homologs were subsequently identified as lifespan regulators in various higher organisms.89 and 10 Sirtuins form class III of the protein deacetylase superfamily and hydrolyze one nicotinamide adenine dinucleotide (NAD +) as cosubstrate for each lysine residue they deacetylate.11 and 12 The coupling of deacetylation to NAD + was proposed to link changes in cellular energy levels to deacetylation activity,13 and 14 which would indicate Sirtuins as metabolic sensors. Other known regulation mechanisms for Sirtuin activity are the modulation of the expression levels of their genes6 and the autoinhibitory effect of an N-terminal region on the yeast Sirtuin “homologous to SIR2 protein 2” (Hst2).15

The seven mammalian Sirtuin proteins (Sirt1–Sirt7) have various substrate proteins that mediate functions in genetic, cellular, and mitochondrial regulation.5 and 6 The best-studied mammalian Sir2 homolog, Sirt1, was shown to regulate, among others, transcription factor p53, nuclear factor-kappa B, and peroxisome proliferator-activated receptor gamma coactivator-1-alpha.6 Three human Sirtuin proteins are known to be located in the mitochondria, Sirt3, Sirt4, and Sirt5,161718 and 19 although Sirt3 was reported to change its localization to nuclear when coexpressed with Sirt5.20 The recent identification of the first substrates for mitochondrial Sirtuins—acetyl coenzyme A synthetase 221 and 22 and glutamate dehydrogenase (GDH)16—as targets of Sirtuins 3 and 4, respectively, revealed that these Sirtuins control a regulatory network that has implications for energy metabolism and the mechanisms of caloric restriction (CR) and lifespan determination.23 Sirt3 regulates adaptive thermogenesis and decreases mitochondrial membrane potential and reactive oxygen species production, while increasing cellular respiration.24 Furthermore, Sirt3 is down-regulated in several genetically obese mice,24 and variability in the human SIRT3 gene has been linked to survivorship in the elderly. 25 In contrast to the deacetylases Sirt3 and Sirt5, Sirt4 appears to be an ADP ribosyltransferase. 16 Through this activity, Sirt4 inhibits GDH and thereby down-regulates insulin secretion in response to amino acids. 16 For Sirt5, however, there is no report yet on its physiological function or any physiological substrate. It is dominantly expressed in lymphoblasts and heart muscle cells,17 and 26 and its gene contains multiple repetitive elements that might make it a hotspot for chromosomal breaks. 26 Interestingly, the Sirt5 gene has been located to a chromosomal region known for abnormalities associated with malignant diseases. 26

A proteomics study found 277 acetylation sites in 133 mitochondrial proteins;27 many of them should be substrates for the mitochondrial Sirtuins mediating their various functions, but up to now, only one physiological substrate could be identified for Sirt3,21 and 22 and none could be identified for Sirt5. Our understanding of substrate selection by Sirtuins is incomplete, and knowledge of specific Sirtuin targets would be essential for a better understanding of Sirtuin-mediated processes and Sirtuin-targeted therapy. A first study on several Sirtuins showed varying preferences among acetylated peptides.28 Structural and thermodynamic analysis of peptides bound to the Sirtuin Sir2Tm from Thermatoga maritima indicated that positions − 1 and + 2 relative to the acetylation site play a significant role in substrate binding. 29 However, these studies were conducted with nonphysiological Sirtuin/substrate pairs, and other studies indicated little sequence specificity; instead, the yeast Sirtuin Hst2 was described to display contextual and conformational specificity: Hst2 deacetylated acetyl lysine only in the context of a protein, and it preferentially deacetylated within flexible protein regions. 30 Finally, statistical analysis of a proteomics study on acetylated proteins identified preferences at various positions such as + 1, − 2, and − 3, and deacetylation sites appeared to occur preferentially in helical regions. 27 Thus, our present knowledge of Sirtuin substrates and of factors determining Sirtuin specificity is incomplete and insufficient for sequence-based identification of physiological substrates.

Here, we describe the identification of novel targets for the mitochondrial deacetylases Sirt3 and Sirt5. We show that Sirt3 can deacetylate and thereby activate the enzymes GDH and isocitrate dehydrogenase (ICDH) 2—two key metabolic regulators in the mitochondrial matrix. We find that the N- and C-terminal regions of Sirt3 influence its activity against GDH and a peptide substrate, indicating roles in regulation and substrate recognition for these regions. Furthermore, we find that Sirt5 can deacetylate cytochrome c, a protein of the mitochondrial intermembrane space (IMS) with a central function in oxidative metabolism and apoptosis.

The upstream sequence contributes to the target specificity of Sirt3 and Sirt5

Sirtuins have been reported to have little sequence specificity,30 but other studies indicated a sequence preference dominated by positions − 1 and + 2.29 We tested the importance of the amino acid pattern preceding the acetylation site for recognition by the mitochondrial Sirtuins Sirt3 and Sirt5 through a fluorescence assay. First, the fluorogenic and commercially available modified p53-derived tetrapeptide QPK-acetylK, originally developed for Sirt2 assays but also efficiently used by Sirt3, was tested. Even 60 μg of Sirt5 did not lead to any deacetylation signal, whereas 0.35 μg of Sirt3 efficiently deacetylated the peptide (Fig. 1a). We then tested Sirt3 and Sirt5 on a second modified p53-derived tetrapeptide, RHK-acetylK. Sirt3 (0.5 μg) showed a slightly increased activity against this substrate as compared to QPK-acetylK (Fig. 1b); more importantly, 0.5 μg of Sirt5 showed significant activity against this peptide. These results show that the mitochondrial Sirtuins Sirt3 and, especially, Sirt5 indeed recognize the local target sequence, and target positions further upstream of − 1 seem to be involved in substrate recognition. For identification of novel substrates for the mitochondrial Sirtuins and further characterization of their target recognition mechanisms, we then turned to testing full-length proteins, as the downstream sequence and the larger protein context of the deacetylation site might also contribute to substrate selection.

Sirtuin substrate specificity

Sirtuin substrate specificity

Fig. 1. Testing the substrate specificity of Sirt3 and Sirt5 with peptides. (a) Sirt3, but not Sirt5, deacetylates the fluorogenic peptide QPK-acetylK. (b) Sirt3 efficiently deacetylates the fluorogenic peptide RHK-acetylK, and Sirt5 also significantly deacetylates this substrate.
http://ars.els-cdn.com/content/image/1-s2.0-S0022283608009029-gr1.jpg

Sirt3 deacetylates and activates GDH

In order to identify novel physiological substrates of the mitochondrial Sirtuins, we used proteins isolated in their partly acetylated form from natural sources (i.e., from mammalian mitochondria). These proteins, carrying physiological acetylations, were tested as Sirt3 and Sirt5 substrates in vitro in an ELISA system using an antibody specific for acetylated lysine. In a recent proteomics study, 27 GDH, a central regulator of mitochondrial metabolism, was identified to be acetylated in a feeding-dependent manner. With our ELISA, we found that Sirt3 and Sirt5 can both deacetylate pure GDH isolated from mitochondria, but with very different efficiencies ( Fig. 2a). Sirt3 significantly deacetylated GDH, but even large amounts of Sirt5 decreased the acetylation level of this substrate only slightly. We next tested the effect of GDH deacetylation on its activity. Deacetylation of GDH through incubation with Sirt3 and NAD + before its examination in a GDH activity assay increased its activity by 10%, and a stronger stimulation of GDH activity was seen when larger amounts of Sirt3 were used for deacetylation ( Fig. 2b). GDH is colocalized with Sirt3 in the mitochondrial matrix 1618 and 19 and, thus, likely could be a physiological substrate of this Sirtuin. Indeed, GDH from a Sirt3 knockout mouse was recently shown to be hyperacetylated compared to protein from wild-type mice. 31 Thus, Sirt3 deacetylates GDH in vivo, and our results show that this direct deacetylation of GDH by Sirt3 leads to GDH activation.

sirtuin structure

sirtuin structure

Fig. 2. Sirt3 can deacetylate and thereby activate GDH. (a) Deacetylation of GDH tested in ELISA. Sirt3 efficiently deacetylates GDH, whereas Sirt5 has only a small effect on the acetylation state. (b) GDH activity is increased after deacetylation of the enzyme by Sirt3. The increase in GDH activity depends on the amount of Sirt3 activity used for deacetylation.
http://ars.els-cdn.com/content/image/1-s2.0-S0022283608009029-gr2.jpg

Sirt3 can deacetylate and thereby activate ICDH2

In the proteomics study by Kim et al., the mitochondrial citric acid cycle enzymes fumarase and ICDH2 (a key regulator of this metabolic cycle) were found to be acetylated in a feeding-dependent manner. 27 In our ELISA system, we found that Sirt3 efficiently deacetylated the ICDH2 substrate isolated from mitochondria ( Fig. 3a). Western blot analysis (data not shown) and mass spectrometry confirmed that, indeed, the ICDH2 fraction of the partially purified protein was deacetylated by Sirt3. In contrast, even large amounts of Sirt5 did not significantly decrease the acetylation level of this substrate ( Fig. 3a). As expected, deacetylation of ICDH2 by Sirt3 was dependent on NAD +. Fumarase, in contrast, could not be deacetylated as efficiently as ICDH2 through treatment with either Sirt3 or Sirt5 ( Fig. 3b). The low absolute values over background for the ELISA with fumarase, however, might indicate low acetylation levels of the natively purified protein, and a stronger effect might be attainable when testing fumarase with a higher acetylation level.

Fig. 3. Sirt3 deacetylates ICDH2, but not fumarase. (a) Deacetylation of ICDH2 by Sirt3 and Sirt5 tested in ELISA. Sirt3, but not Sirt5, deacetylates ICDH2 in a NAD +-dependent manner. (b) Fumarase acetylation determined through ELISA cannot be significantly decreased by incubation with recombinant Sirt3 or Sirt5. (c) ICDH2 activity measured in a spectrophotometric assay based on the formation of NADPH. ICDH2 activity (continuous line) is increased after deacetylation of the enzyme by Sirt3 (dashed line). (d) The stimulatory effect of deacetylation on ICDH2 activity depends on the amount of deacetylase activity added during pretreatment. (e) ICDH2 with and without Sirt3 treatment analyzed by mass spectrometry after proteolytic digest. The decrease in the signal at 962.3 Da and the increase in signal at 903.5 Da indicate deacetylation at either K211 or K212.

In order to analyze the potential physiological function of ICDH2 deacetylation, we tested the effect of Sirt3-mediated ICDH2 deacetylation on its activity. Incubation of ICDH2 with Sirt3 and NAD + prior to its analysis in an ICDH activity assay increased its activity (Fig. 3c). The stimulation of ICDH2 activity was further increased when larger amounts of Sirt3 were used for deacetylation (Fig. 3d), and no significant increase in ICDH2 activity was observed when the Sirtuin inhibitor dihydrocoumarin was present during incubation with Sirt3 (data not shown). Sirt3 and ICDH2 are colocalized in the mitochondrial matrix,1619 and 32 and we therefore assume that ICDH2 is likely a physiological substrate for Sirt3, which activates ICDH2 by deacetylation.
http://ars.els-cdn.com/content/image/1-s2.0-S0022283608009029-gr3.jpg

Sirt3 can deacetylate KK motifs in substrate proteins

In order to identify the site of ICDH2 deacetylation upon treatment with Sirt3, we analyzed ICDH2 by mass spectrometry. For analyzing pure ICDH2, we excised its band from an SDS gel before mass spectrometry analysis. In the proteomics study by Kim et al., two acetylation sites were reported for ICDH2: K75 and K241 (numbering of the partial sequence of the unprocessed precursor; SwissProt entry P33198). 27 After digest of ICDH2, we could not detect peptides comprising K75 and, therefore, could not determine its acetylation status, and we only observed the deacetylated form of K241. We identified an additional acetylation site, however, by detecting signals at m/z = 903.5 and m/z = 962.3 for the peptide QYAIQKK (residues 206–212) carrying one and two acetyl groups, respectively ( Fig. 3e; calculated m/z = 903.5 and 962.5). Sirt3 treatment decreased the signal for the double-acetylated form and increased the signal for the single-acetylated form as compared to internal peptides [e.g., m/z = 890.5 (calculated m/z = 890.5) andm/z = 1041.4 (calculated m/z = 1041.5)]. These data indicate that Sirt3 deacetylates either position K211 or K212 of this KK motif located at a surface-exposed end of a helix that flanks the active site of ICDH2. 33Deacetylation of a KK motif by Sirt3 is consistent with the efficient use of the tested peptide substrates (see above) that both carry KK motifs.

Fig. 4. Increased activity of N- and C-terminally truncated Sirt3. (a) Specific activity against a peptide substrate of the longest Sirt3 form after proteolytic processing that covers residues 102–399. N-terminal truncation increases the specific activity dramatically, and an additional C-terminal truncation activates the catalytic core further. (b) Homology model of Sirt3 based on the crystal structure of Sirt2. The part comprising the catalytic core is shown in red. The NAD + and peptide ligands were manually placed into their binding sides based on the crystal structure of their complex with a bacterial Sir2 homolog from T. maritima. Parts removed in N- and C-terminal truncation constructs are shown in cyan and blue, respectively. (c) Level of acetylation of GDH tested in ELISA. The shortest Sirt3 form Sirt3(114–380) deacetylates more efficiently than Sirt3(114–399) and Sirt3(102–399), which show activities comparable to each other.

Sirt5 can deacetylate cytochrome c

Sirt5 can deacetylate cytochrome c

http://ars.els-cdn.com/content/image/1-s2.0-S0022283608009029-gr4.jpg

Sirt5 can deacetylate cytochrome c

The Sirt5 protein that we used for our study comprises residues 34–302, corresponding to the fully active catalytic core determined for Sirt3 (see above). This protein is indeed active against a peptide substrate, but it showed no significant activity against the acetylated mitochondrial matrix proteins tested so far: GDH, ICDH2, and fumarase. We thus picked cytochrome c, a central protein in energy metabolism and apoptosis localized in the mitochondrial IMS, from the list of acetylated mitochondrial proteins 27 for testing as deacetylation substrate. Sirt5 showed deacetylation activity against pure cytochrome c in our ELISA system, whereas Sirt3 had almost no activity against this substrate ( Fig. 5a). Even the more active shortened form of Sirt3(114–380) showed no considerable activity against this substrate.

Fig. 5.  Sirt5 can deacetylate cytochrome c. (a) Deacetylation of cytochrome c tested in ELISA. Sirt5 uses cytochrome c as substrate for deacetylation, whereas Sirt3 treatment leaves the acetylation level of cytochrome c unchanged. (b) Model of the action of the mammalian Sirtuins Sirt3, Sirt4, and Sirt5 in mitochondria. CAC: citric acid cycle. (c) Digest of Sirt5 synthesized in vitro with PK. The protein is fully degraded at proteinase concentrations of 25 μg/ml and above. (d) Import of Sirt5 into isolated yeast mitochondria. Sirt5 reaches an inner mitochondrial compartment in the presence and in the absence of the mitochondrial membrane potential (ΔΨ), whereas Sirt3, as a control for a matrix-targeted protein, is not imported into uncoupled mitochondria. (e) Intramitochondrial localization of Sirt5. Part of the imported Sirt5 is sensitive to PK after swelling (SW) and thus localized in the IMS, but another part of the protein remains protease-resistant and therefore appears to be localized to the matrix. Atp3, a protein localized at the matrix site of the mitochondrial inner membrane, and an IMS-located domain of translocase of inner membrane 23 detected by Western blot analysis served as controls for matrix transport and swelling, respectively. aTim23: anti-Tim23. (f) Scheme of the domain organizations of Sirt3 and Sirt5. Numbers in brackets are residue numbers for boundaries of protein parts. NLS: nuclear localization sequence; MLS: mitochondrial localization sequence; R1, regulatory region 1; R2: regulatory region 2.
http://ars.els-cdn.com/content/image/1-s2.0-S0022283608009029-gr5.jpg

Cytochrome c might be a physiological substrate of Sirt5 if this Sirtuin is localized to the mitochondrial IMS (Fig. 5b). A recent study on overexpressed tagged mouse Sirt5 in COS7 cells 20 indeed indicated that Sirt5, at least from mouse, is localized in the IMS. In order to test whether human Sirt5 can be localized to the IMS, we performed import experiments with human Sirt3 and Sirt5 using isolated yeast mitochondria as a model system. 3 Sirt3 and Sirt5 proteins were incubated with mitochondria, followed by PK treatment for degradation of nonimported protein ( Fig. 5d). In a parallel reaction, mitochondria were uncoupled prior to the import reaction by addition of valinomycin (− ΔΨ). Sirt3, a protein known to be located in the mitochondrial matrix, 19 was only efficiently imported in the presence of a membrane potential. Dependence on the mitochondrial potential is a hallmark of matrix import, 38 and the results thus show that Sirt3 is imported into the correct compartment in our experimental system. Sirt5, in contrast, reaches an inner-mitochondrial compartment both in the presence and in the absence of the membrane potential, suggesting that Sirt5 may accumulate in the IMS.

In order to further test the localization of Sirt5, we removed the outer mitochondrial membrane after the import reaction by osmotic swelling, followed by PK digest of then accessible proteins (Fig. 5e). Rupture of the outer membrane was confirmed by monitoring the accessibility of an IMS-exposed domain of endogenous translocase of inner membrane 23 (detected by Western blot analysis). Part of the imported Sirt5 was degraded by PK, indicating its localization in the IMS.

Sirtuins are involved in central physiological regulation mechanisms, many of them with relevance to metabolic regulation and aging processes.5 and 6 Therefore, the seven mammalian Sirtuin isoforms are emerging targets for the treatment of metabolic disorders and aging-related diseases.39 For most Sirtuin effects, however, the specific signaling mechanisms and molecular targets are not yet known. We have identified novel potential targets for Sirtuins in mitochondria, the major metabolic centers in cells. We found that Sirt3 can deacetylate and thereby activate ICDH2, a key regulation point for flux throughout the citric acid cycle. Interestingly, the ICDH isoform regulated by Sirt3 forms NADPH instead of the NADH used for ATP synthesis. This activity is assumed to be important for the NADPH-dependent regeneration of antioxidants,40 and its stimulation by Sirt3 should thus help to slow oxidative damage and cellular aging processes. Furthermore, Sirt3 deacetylates GDH in vitro (this study) and in vivo31 and we find that this modification also stimulates GDH activity that promotes glucose and ATP synthesis by enabling amino acids to be used as fuels for citric acid cycle and gluconeogenesis. 41 Consistently, Sirt3 was reported to increase respiration, 24 which is needed for ATP synthesis but also for conversion of amino acids into glucose and urea. 41 The enzyme previously identified to be activated by Sirt3, acetyl coenzyme A synthetase 2, 21 and 22 also fuels the citric acid cycle independently of glycolysis by activating free acetate (Fig. 5b). Interestingly, a shift away from liver glycolysis is one of the metabolic changes observed under CR, a feeding regimen with 20–40% fewer calories than consumed ad libitum that is found to extend the lifespan of a variety of organisms. 6 CR was previously reported to increase GDH activity in the liver, 42where Sirt3 is highly expressed, 17 and Sirt3 activity is known to be increased by CR. 6 and 24 It thus appears that Sirt3 mediates some of the effects of CR and lifespan regulation, consistent with its implication in survivorship in the elderly 25 and 43 and the prominent role of Sirtuins in CR found for various organisms,6 and 44 and it also appears that GDH activation likely contributes to the Sirt3-dependent effects.

Little is known about additional factors regulating the activity and specificity of Sirtuin enzymes. Their requirement for NAD + indicates that the NAD +/NADH ratio should regulate Sirtuins,13 and 14 but even changes to ratios observed under extreme conditions such as CR appear to influence Sirtuin activity only slightly.35 Furthermore, NAD + levels would influence all Sirtuins similarly, but a more specific tuning of individual Sirtuin activities appears necessary in order to orchestrate the many effects mediated by Sirtuins (see, e.g., discussion above).6 and 45 A deeper insight into the regulation of Sirtuin enzymes would also be required for the development of more specific Sirtuin inhibitors—a prerequisite for Sirtuin-targeted therapy.39 The regulatory parts flanking the catalytic cores might be interesting target sites (Fig. 5f). N-terminal extensions between ∼ 30 and 120 residues are present in all human Sirtuins but show little conservation, indicating that they might respond to various regulators. Our results indicate that the corresponding N-terminal region in Sirt3 also blocks productive binding for small peptides (Fig. 4a), but enables access for entire protein substrates (Fig. 4c). The C-terminal truncated part in our experiments (Sirt3 residues 380–399) is formed by α14 (secondary structure numbering for Sirt236) whose end corresponds to the N-terminus of Hst2 α13 that partly occupies the NAD +binding site.15 In Sirt3, however, the C-terminal truncation alone lowers activity only slightly, and we assume that it has no regulatory function on its own but might instead assist the N-terminal autoinhibitory region. This module of the N-terminus and the C-terminus (Figs. 4b and 5f) appears to contribute to the substrate specificity of the enzyme, and ligands binding to it might enable or block rearrangements opening up the active site and thereby regulate the enzyme’s activity. Alternatively, the flanking parts might be removed by proteolytic processing or alternative splicing, thereby changing Sirtuin activity and specificity.

7.8.3 The mTORC1 Pathway Stimulates Glutamine Metabolism and Cell Proliferation by Repressing SIRT4

Csibi A1Fendt SMLi CPoulogiannis GChoo AYChapski DJ, et al.
Cell. 2013 May 9; 153(4):840-54.
http://dx.doi.org:/10.1016/j.cell.2013.04.023

Proliferating mammalian cells use glutamine as a source of nitrogen and as a key anaplerotic source to provide metabolites to the tricarboxylic acid cycle (TCA) for biosynthesis. Recently, mTORC1 activation has been correlated with increased nutrient uptake and metabolism, but no molecular connection to glutaminolysis has been reported. Here, we show that mTORC1 promotes glutamine anaplerosis by activating glutamate dehydrogenase (GDH). This regulation requires transcriptional repression of SIRT4, the mitochondrial-localized sirtuin that inhibits GDH. Mechanistically, mTORC1 represses SIRT4 by promoting the proteasome-mediated destabilization of cAMP response element binding-2 (CREB2). Thus, a relationship between mTORC1, SIRT4 and cancer is suggested by our findings. Indeed, SIRT4 expression is reduced in human cancer, and its overexpression reduces cell proliferation, transformation and tumor development. Finally, our data indicate that targeting nutrient metabolism in energy-addicted cancers with high mTORC1 signaling may be an effective therapeutic approach.

Proliferating mammalian cells use glutamine as a source of nitrogen and as a key anaplerotic source to provide metabolites to the tricarboxylic acid cycle (TCA) for biosynthesis. Recently, mTORC1 activation has been correlated with increased nutrient uptake and metabolism, but no molecular connection to glutaminolysis has been reported. Here, we show that mTORC1 promotes glutamine anaplerosis by activating glutamate dehydrogenase (GDH). This regulation requires transcriptional repression of SIRT4, the mitochondrial-localized sirtuin that inhibits GDH. Mechanistically, mTORC1 represses SIRT4 by promoting the proteasome-mediated destabilization of cAMP response element binding-2 (CREB2). Thus, a relationship between mTORC1, SIRT4 and cancer is suggested by our findings. Indeed, SIRT4 expression is reduced in human cancer, and its overexpression reduces cell proliferation, transformation and tumor development. Finally, our data indicate that targeting nutrient metabolism in energy-addicted cancers with high mTORC1 signaling may be an effective therapeutic approach.

Nutrient availability plays a pivotal role in the decision of a cell to commit to cell proliferation. In conditions of sufficient nutrient sources and growth factors (GFs), the cell generates enough energy and acquires or synthesizes essential building blocks at a sufficient rate to meet the demands of proliferation. Conversely, when nutrients are scarce, the cell responds by halting the biosynthetic machinery and by stimulating catabolic processes such as fatty acid oxidation and autophagy to provide energy maintenance (Vander Heiden et al., 2009). Essential to the decision process between anabolism and catabolism is the highly conserved, atypical Serine/Threonine kinase mammalian Target of Rapamycin Complex 1 (mTORC1), whose activity is deregulated in many cancers (Menon and Manning, 2008). This complex, which consists of mTOR, Raptor, and mLST8, is activated by amino acids (aa), GFs (insulin/IGF-1) and cellular energy to drive nutrient uptake and subsequently proliferation (Yecies and Manning, 2011). The molecular details of these nutrient-sensing processes are not yet fully elucidated, but it has been shown that aa activate the Rag GTPases to regulate mTORC1 localization to the lysosomes (Kim et al., 2008Sancak et al., 2008); and GFs signal through the PI3K-Akt or the extracellular signal-regulated kinase (ERK)-ribosomal protein S6 kinase (RSK) pathways to activate mTORC1 by releasing the Ras homolog enriched in brain (RHEB) GTPase from repression by the tumor suppressors, tuberous sclerosis 1 (TSC1)– TSC2 (Inoki et al., 2002Manning et al., 2002Roux et al., 2004). Finally, low energy conditions inhibit mTORC1 by activating AMPK and by repressing the assembly of the TTT-RUVBL1/2 complex. (Inoki et al., 2003Gwinn et al., 2008Kim et al., 2013).

Glutamine, the most abundant amino acid in the body plays an important role in cellular proliferation. It is catabolized to α-ketoglutarate (αKG), an intermediate of the tricarboxylic acid (TCA) cycle through two deamination reactions in a process termed glutamine anaplerosis (DeBerardinis et al., 2007). The first reaction requires glutaminase (GLS) to generate glutamate, and the second occurs by the action of either glutamate dehydrogenase (GDH) or transaminases. Incorporation of αKG into the TCA cycle is the major anaplerotic step critical for the production of biomass building blocks including nucleotides, lipids and aa (Wise and Thompson, 2010). Recent studies have demonstrated that glutamine is also an important signaling molecule. Accordingly, it positively regulates the mTORC1 pathway by facilitating the uptake of leucine (Nicklin et al., 2009) and by promoting mTORC1 assembly and lysosomal localization (Duran et al., 2012;Kim et al., 2013).

Commonly occurring oncogenic signals directly stimulate nutrient metabolism, resulting in nutrient addiction. Oncogenic levels of Myc have been linked to increased glutamine uptake and metabolism through a coordinated transcriptional program (Wise et al., 2008Gao et al., 2009). Hence, it is not surprising that cancer cells are addicted to glutamine (Wise and Thompson, 2010). Thus, considering the prevalence of mTORC1 activation in cancer and the requirement of nutrients for cell proliferation, understanding how mTORC1 activation regulates nutrient levels and metabolism is critical. Activation of the mTORC1 pathway promotes the utilization of glucose, another nutrient absolutely required for cell growth. However, no study has yet investigated if and how the mTORC1 pathway regulates glutamine uptake and metabolism. Here, we discover a novel role of the mTORC1 pathway in the stimulation of glutamine anaplerosis by promoting the activity of GDH. Mechanistically, mTORC1 represses the transcription of SIRT4, an inhibitor of GDH. SIRT4 is a mitochondrial-localized member of the sirtuin family of NAD-dependent enzymes known to play key roles in metabolism, stress response and longevity (Haigis and Guarente, 2006). We demonstrate that the mTORC1 pathway negatively controls SIRT4 by promoting the proteasome-mediated degradation of cAMP-responsive element-binding (CREB) 2. We reveal that SIRT4 levels are decreased in a variety of cancers, and when expressed, SIRT4 delays tumor development in a Tsc2−/− mouse embryonic fibroblasts (MEFs) xenograft model. Thus, our findings provide new insights into how mTORC1 regulates glutamine anaplerosis, contributing therefore to the metabolic reprogramming of cancer cells, an essential hallmark to support their excessive needs for proliferation.

The mTORC1 pathway regulates glutamine metabolism via GDH

The activation of the mTORC1 pathway has recently been linked to glutamine addiction of cancer cells (Choo et al., 2010), yet it remains to be resolved if mTORC1 serves as a regulator of glutamine anaplerosis. To investigate this possibility, we first determined the effect of mTORC1 activity on glutamine uptake. We measured glutamine uptake rates in Tsc2 wild-type (WT) and Tsc2−/− MEFs. We found that Tsc2−/− MEFs consumed significantly more glutamine (Figure 1A), showing that mTORC1 activation stimulates the uptake of this nutrient. In addition, re-expression of Tsc2 in Tsc2−/− cells reduced glutamine uptake (Figure S1A). Similarly, mTORC1 inhibition with rapamycin resulted in decreased glutamine uptake in MEFs (Figure 1A). The decreased on glutamine uptake was significantly reduced after 6h of rapamycin treatment when compared to control (data not shown). To further confirm the role of mTORC1 on glutamine uptake, we used human embryonic kidney (HEK) 293T cells stably expressing either WT-RHEB or a constitutively active mutant (S16H) of RHEB. Increased mTORC1 signaling, as evidenced by sustained phosphorylation of S6K1 and its target rpS6, was observed in RHEB-expressing cells (Figure S1B). The activation of the mTORC1 pathway nicely correlated with an increase in glutamine consumption, therefore confirming that changes in mTORC1 signaling are reflected in cellular glutamine uptake (Figure S1B). To determine whether the modulation of glutamine uptake by the mTORC1 pathway occurs in cancer cells, we examined glutamine uptake rates in conditions of mTORC1 inhibition in human epithelial tumor cell lines, including the colon carcinoma DLD1, and the prostate cancer DU145. Rapamycin treatment resulted in decreased proliferation (data not shown) and yielded a decreased glutamine uptake in both cell lines (Figure 1B & data not shown). Glutamine is the major nitrogen donor for the majority of ammonia production in cells (Figure 1C) (Shanware et al., 2011). Consistent with decreased glutamine uptake, we found that ammonia levels were also diminished after rapamycin treatment (Figure S1C).

Figure 1  The mTORC1 pathway regulates glutamine metabolism via glutamate dehydrogenase

We next examined the fate of glutamine in conditions of mTORC1 inhibition, using gas chromatography/mass spectrometry (GC/MS) analysis to monitor the incorporation of uniformly labeled [U-13C5]-Glutamine into TCA cycle intermediates. Direct glutamine contribution to I̧KG (m+5), succinate (m+4), malate (m+4) and citrate (m+4) was decreased in rapamycin treated cells (Figure S1D) indicating that rapamycin impaired glutamine oxidation and subsequent carbon contribution into the TCA cycle.

To test whether glutamine uptake or glutamine conversion is limiting, we measured the intracellular levels of glutamine and glutamate in DLD1 cells. Increased levels of glutamine and/or glutamate will show that the catalyzing enzyme activity is limiting and not glutamine transport itself (Fendt et al., 2010). Rapamycin treatment resulted in increased intracellular levels of both glutamine and glutamate, showing that glutamate to αKG conversion is the critical limiting reaction (Figures 1D & 1E). To further confirm the implication of the glutamate catalyzing reaction we also measured αKG levels. If glutamate conversion is indeed critical we expect no alteration in αKG levels. This is expected because αKG is downstream of the potentially limiting glutamate conversion step, and it has been shown that product metabolite concentrations of limiting metabolic enzymes stay unaltered, while the substrate metabolite concentrations change to keep metabolic homeostasis (Fendt et al., 2010). We found that αKG levels were unaltered after rapamycin treatment, corroborating that the limiting enzymatic step is glutamate conversion (Figure 1F). To further confirm the limitation in glutamate-to-αKG conversion, we measured flux through this reaction. Strikingly, this flux was significantly reduced during rapamycin treatment (Figure 1G). Additionally, the inhibition of mTORC1 resulted in increased glutamate secretion (Figure 1H), thus confirming that the glutamate-to-αKG conversion step is a major bottleneck in the glutamine pathway during rapamycin treatment.

Glutamate conversion can be conducted by GDH (Figure 1C), suggesting that the mTORC1 pathway potentially regulates this enzyme. In agreement, rapamycin treatment resulted in decreased GDH activity in DLD1 cells (Figure 1I). To exclude that transaminases play a role in the mTORC1-induced regulation of glutamine metabolism, we used amin ooxyacetate (AOA) at a concentration shown to effectively inhibit the two predominant transaminases, alanine aminotransferase (ALT) and aspartate aminotransferase (AST) (Figure 1C) (Wise et al., 2008), or rapamycin in the presence of α-15N-labeled glutamine. Subsequently, we measured 15N-labeling patterns and metabolite levels of alanine, an amino acid that is predominately produced by a transaminase-catalyzed reaction (Possemato et al., 2011). We found that AOA dramatically decreased 15N contribution and metabolite levels of alanine, while rapamycin only mildly affected the 15N contribution to this amino acid and showed no effect on alanine levels compared to the control condition (Figures 1J & S1E). In conclusion, these data demonstrate that GDH, not transaminases, plays a major role in the regulation of glutamine metabolism downstream of mTORC1.

mTORC1 controls GDH activity by repressing SIRT4

As our results show that mTORC1 regulates glutamate dehydrogenase, we sought to identify the molecular mechanism. SIRT4 is a negative regulator of GDH activity through ADP-ribosylation (Haigis et al., 2006), thus suggesting that mTORC1 potentially controls this step of glutamine metabolism via SIRT4. To test this possibility, we first assessed the ADP-ribosylation status of GDH by introducing biotin-labeled NAD followed by immunoprecipitation using avidin-coated beads. Rapamycin treatment led to an increase in the mono-ADP-ribosylation status of GDH, similar to that observed in cells stably expressing SIRT4 (Figure 2A). Importantly, we found that the knockdown of SIRT4 abrogated the rapamycin-induced decrease in the activity of GDH (Figures 2B & S2A). Strikingly, SIRT4 protein levels were increased upon mTORC1 inhibition in MEFs (Figures 2C). This regulation was confirmed in both DLD1 and DU145 cells (Figures 2D). Remarkably, rapamycin potently increased SIRT4 levels after 6h of treatment (Figure S2B), correlating with reduced glutamine consumption at the same time point (data not shown). In contrast, SIRT4 levels were not influenced by the treatment of MEFs with U0216, an inhibitor of MEK1/2 in the MAPK pathway (Figure S2C). All other mTOR catalytic inhibitors tested in Tsc2−/− MEFs also resulted in increased SIRT4 protein levels (Figure S2D). To evaluate a potential regulation of SIRT4 by mTORC2, we performed RNA interference (RNAi) experiments of either raptor or the mTORC2 component, rictor, in Tsc2−/− MEFs. The knockdown of raptor, but not rictor, was sufficient to increase SIRT4 protein levels, confirming the role of the mTORC1 pathway in the regulation of SIRT4 (Figure 2E). To investigate whether mTORC1 regulation of SIRT4 occurs in tumor samples, a TSC-xenograft model was used. We injected a TSC2−/− rat leiomyoma cell line; ELT3 cells, expressing either an empty vector (V3) or TSC2 (T3), in the flank of nude mice. SIRT4 levels were dramatically increased in TSC2-expressing tumors compared to empty vector samples (Figure S2E). In addition, we assessed the levels of SIRT4 in both ELT3 xenograft tumors and in mouse Tsc2+/− liver tumors after rapamycin treatment. As expected, these tumor samples exhibited robust elevation of SIRT4 after rapamycin treatment (Figures 2F & S2F). Thus, these data demonstrate that the mTORC1 pathway represses SIRT4 in several tumor systems.

Figure 2  mTORC1 controls glutamate dehydrogenase activity by repressing SIRT4

CREB2 regulates the transcription of SIRT4 in an mTORC1-dependent fashion

We next asked whether the mTORC1-dependent regulation of SIRT4 occurred at the mRNA level. Quantitative RT-PCR results show that rapamycin treatment significantly increased the expression of SIRT4mRNA in Tsc2−/− MEFs (Figure 3A). SIRT4 mRNA levels were dramatically reduced in Tsc2−/− MEFs compared to their WT counterpart (Figure 3B). Similar results were obtained from transcriptional profiling analysis of the SIRT4 gene from a previously published dataset (GSE21755) (Figure 3C) (Duvel et al. 2010). Altogether, our data demonstrate that mTORC1 negatively regulates the transcription of SIRT4. To determine whether CREB2 is involved in the mTORC1-dependent regulation of SIRT4, we performed RNAi experiments. The silencing of CREB2 abolished the rapamycin-induced expression of SIRT4 (Figures 3E & S3A). The knockdown of CREB1 did not affect the upregulation of SIRT4 upon mTORC1 inhibition, thus demonstrating the specificity of CREB2 to induce SIRT4 (Figure S3B), and the knockdown of CREB2 significantly abrogated the rapamycin-induced increase in the activity of the SIRT4 promoter.

Figure 3  SIRT4 is regulated at the mRNA level in an mTORC1-dependent fashion

mTORC1 regulates the stability of CREB2

We next investigated whether the mTORC1 pathway regulates CREB2. Although we did not observe major changes in Creb2 mRNA in normal growth conditions (Figure S4A), mTORC1 inhibition resulted in accumulation of CREB2 protein levels by 2h of rapamycin treatment (Figure 4A). U0126 failed to cause the accumulation of CREB2 (Figure S4B). In contrast, CREB1 protein levels were not affected after 24h rapamycin treatment (Figure S4C). As observed for SIRT4, mTOR catalytic inhibitors, and the specific knockdown of mTOR, resulted in upregulation of CREB2 protein levels (Figures S4D & S4E). CREB2 is upregulated in diverse cell types as a response to a variety of stresses, including hypoxia, DNA damage, and withdrawal of GFs, glucose, and aa (Cherasse et al., 2007Rouschop et al., 2010Yamaguchi et al., 2008;Whitney et al., 2009). Interestingly, mTORC1 is negatively regulated by all of these environmental inputs (Zoncu et al., 2011). Since mTORC1 signaling in Tsc2−/− MEFs is insensitive to serum deprivation, we assessed the role of aa withdrawal and re-stimulation on CREB2 levels. As shown in Fig. 4B, CREB2 accumulated upon aa deprivation, and was decreased following aa re-addition. This phenomenon required the action of the proteasome as MG132 efficiently blocked CREB2 degradation following aa re-addition. Importantly, we found that mTORC1 inhibition abrogated the aa-induced decrease of CREB2 (Figure 4B).

Figure 4  mTORC1 regulates the stability of CREB2

mTORC1 activation promotes the binding of CREB2 to βTrCP and modulates CREB2 ubiquitination

Next, we attempted to identify the E3 ubiquitin ligase that might be responsible for CREB2 turnover. Consistent with a recent study, we found CREB2 to bind the E3 ligase, βTrCP (Frank et al., 2010). However, other related E3 ligases including Fbxw2, Fbxw7a, and Fbxw9 did not bind to CREB2 (data not shown). The interaction of CREB2 with Flag-βTrCP1 was enhanced in the presence of insulin, and was abolished by rapamycin pretreatment (Figure 4D). Importantly, insulin treatment promoted the ubiquitination of CREB2 in an mTORC1-dependent fashion (Figure 4E). Altogether, our results support the notion that the mTORC1 pathway regulates the targeting of CREB2 for proteasome-mediated degradation. βTrCP binds substrates via phosphorylated residues in conserved degradation motifs (degrons), typically including the consensus sequence DpSGX(n)pS or similar variants. We found an evolutionary conserved putative βTrCP binding site (DSGXXXS) in CREB2 (Figure 4F). Interestingly, we noted a downward mobility shift in CREB2 protein with mTORC1 inhibition, consistent with a possible decrease in the phosphorylation of CREB2. (Figure 4A). Frank et al. (2010) showed that phosphorylation of the first serine in the degron motif corresponding to Ser218 is required for the CREB2/βTrCP interaction, and this modification acts as a priming site for a gradient of phosphorylation events on five proline-directed residues codons (T212, S223, S230, S234, and S247) that is required for CREB2 degradation during the cell cycle progression (Frank et al., 2010). Consistent with these observations, we found that the mutation of the five residues to alanine (5A mutant) resulted in strong stabilization of CREB2, comparable to the serine-to-alanine mutation on the priming Ser218 phosphorylation site (Figure S4G).

SIRT4 represses bioenergetics and cell proliferation

We observed that glutamine utilization is repressed by rapamycin treatment (Figure 1) and SIRT4 is induced by mTORC1 inhibition (Figure 2). Thus, we tested whether SIRT4 itself directly regulates cellular glutamine uptake. The stable expression of SIRT4 resulted in the repression of glutamine uptake in Tsc2−/− MEFs and DLD1 cells (Figures 5A & 5B). Glucose uptake was not affected by SIRT4 expression (data not shown). Because glutamine can be an important nutrient for energy production, we examined ATP levels in SIRT4 expressing cells. Consistent with reduced glutamine consumption, the expression of SIRT4 in Tsc2−/− cells resulted in decreased ATP/ADP ratio compared to control cells (Figure 5C). Cells produce ATP via glycolysis and oxidative phosphorylation (OXPHOS). To test the contribution of mitochondrial metabolism versus glycolysis to ATP, we measured the ATP/ADP ratio after the treatment with oligomycin, an inhibitor of ATP synthesis from OXPHOS. Importantly, the difference of the ATP/ADP ratio between control and SIRT4 expressing cells was abrogated by oligomycin (Figure 5C), further demonstrating that SIRT4 may repress the ability of cells to generate energy from mitochondrial glutamine catabolism. Mitochondrial glutamine catabolism is essential for energy production and viability in the absence of glucose (Yang et al., 2009Choo et al., 2010). Thus, we examined the effect of SIRT4 on the survival of Tsc2−/− MEFs during glucose deprivation. Control cells remained viable following 48h of glucose deprivation. Conversely, SIRT4 expressing cells showed a dramatic increase in cell death under glucose-free conditions, which was rescued by the addition of the cell permeable dimethyl-I̧KG (DM-I̧KG) (Figure 5D). Conversely, the expression of SIRT4 did not affect the viability of glucose-deprived Tsc2 WT MEFs (Figure S5A). Glucose deprivation also induced death of the human DU145 cancer cell line stably expressing SIRT4 (data not shown).

Figure 5  SIRT4 represses bioenergetics and proliferation

Glutamine is an essential metabolite for proliferating cells, and many cancer cells exhibit a high rate of glutamine consumption (DeBerardinis et al., 2007). Thus, decreased glutamine uptake in DLD1 and DU145 cancer cells expressing SIRT4 might result in decreased proliferation. Indeed, these cells grew significantly slower than did control cells. Remarkably, DM-I̧KG completely abrogated the decreased proliferation of SIRT4 expressing cells (Figure 5E & 5F), suggesting that repressed glutamine metabolism drove the reduced proliferation of cells expressing SIRT4. The expression of SIRT4 also slowed the proliferation of Tsc2−/− MEFs but did not affect Tsc2 WT MEFs (Figures S5B & S5C). Finally, to rule out that the effect on proliferation was due to aberrant localization and to off-target effects of the overexpressed protein, we examined the localization of HA-SIRT4. We found that SIRT4 is co-localized with the MitoTracker, a mitochondrial-selective marker (Figure S5D). Taken together, these data demonstrate that SIRT4 is a critical negative regulator of mitochondrial glutamine metabolism and cell proliferation.

SIRT4 represses TSC-tumor development

Recent studies have demonstrated a major role of glutamine metabolism in driving oncogenic transformation of many cell lines (Gao et al., 2009Wang et al., 2011). Since SIRT4 expression represses glutamine uptake and cell proliferation (Figure 5), we hypothesized that it could affect tumorigenesis. To test this idea, we assessed the role of SIRT4 in cell transformation by using an anchorage-independent growth assay. SIRT4 expression reduced the ability of Tsc2−/−p53−/− MEFs to grow in soft agar. However, the expression of SIRT4 in Tsc2+/+p53−/− did not impair their colony formation properties (Figure 6A). Tumor incidence in mice injected with Tsc2+/+p53−/− MEFs was not affected by SIRT4 (data not shown). Conversely, in the Tsc2−/−p53−/− cohort, SIRT4 reduced tumor incidence by 20 days at median (Figure 6B). SIRT4 expression inTsc2−/−p53−/− MEFs resulted in reduction of Ki-67 positivity by 60% (Figure 6E), consistent with the finding that SIRT4 inhibits the proliferation of these cells in vitro (Figure S5B). Finally, we performed a comprehensive meta-analysis of SIRT4 expression in human tumors and found significantly lower expression levels of SIRT4, relative to normal tissue, in bladder, breast, colon, gastric, ovarian and thyroid carcinomas (Figure 6F). Interestingly, loss of SIRT4 expression showed a strong association with shorter time to metastasis in patients with breast cancer (Figures 6G & 6H). Altogether, these data strongly suggest that SIRT4 delays tumorigenesis regulated by the mTORC1 pathway.

Figure 6
SIRT4 suppresses TSC-tumor development

The pharmacologic inhibition of glutamine anaplerosis synergizes with glycolytic inhibition to induce the specific death of mTORC1 hyperactive cells

The activation of mTORC1 leads to glucose and glutamine addiction as a result of increased uptake and metabolism of these nutrients (Choo et al., 2010Duvel et al., 2010 & Figure 1). These observations suggest that targeting this addiction offers an interesting therapeutic approach for mTORC1-driven tumors. The alkylating agent, mechlorethamine (Mechlo), incites cell toxicity in part by the inhibition of the GAPDH step of glycolysis via poly-ADP ribose polymerase (PARP)-dependent cellular consumption of cytoplasmic NAD+. The ultimate consequence is glycolytic inhibition, thus mimicking glucose deprivation (Zong et al., 2004). Treatment of Tsc2−/− MEFs with Mechlo decreased both NAD levels and lactate production (Figure 7A and data not shown). The decrease in NAD+ levels was rescued by addition of DPQ (Figure 7A), a PARP inhibitor (Zong et al., 2004). We next tested the ability of glutamine inhibition to determine the sensitivity of Tsc2−/− MEFs to Mechlo. As shown in Figure 7B, the treatment with EGCG, a GDH inhibitor (Figure 1G), potently synergized with Mechlo to kill Tsc2−/− MEFs with the greatest effect observed at 30μM (Figure 7B). As a result, this combination dramatically increased the cleavage of PARP, an apoptotic marker (Figure 7E). Similarly, glutamine deprivation sensitized Tsc2−/− MEFs to Mechlo (data not shown). The RNAi-mediated knockdown of GDH also synergized with Mechlo to induce death of Tsc2−/− MEFs (Figure 7D). Importantly, at these concentrations the combination did not induce death of a Tsc2-rescued cell line (Figure 7C).

Figure 7 The combination of glutamine metabolism inhibitors with glycolytic inhibition is an effective therapy to kill Tsc2−/− and PTEN−/− cells

http://www.ncbi.nlm.nih.gov/pmc/articles/PMC3684628/bin/nihms-474527-f0007.gif

Because the metabolic properties of cells with activated mTORC1 by Tsc2– deficiency can be efficiently targeted, we also examined other cell types in which mTORC1 is hyperactive by the loss of PTEN. We found that the combination of Mechlo and EGCG was also effective to induce specific toxicity of PTEN−/− MEFs, while PTEN+/+ MEFs were not affected (Figures S7A & S7B). In addition, the PTEN-deficient human prostate adenocarcinoma cell line, LNCaP, was also sensitive to treatment with Mechlo and EGCG (Figure 7F). This effect was specifically due to lack of TCA cycle replenishment as pyruvate supplementation completely reversed the synergistic effect (Figure 7F). The combination of Mechlo with the GLS1 inhibitor, BPTES (Figure 1G), also resulted in decreased viability of Tsc2−/− cells but not of Tsc2-reexpressing cells (Figures S7C & S7D). Again, death in Tsc2−/− cells was rescued with pyruvate or OAA (Figure S7E). To further investigate if the potent cell death in Tsc2−/− was restricted to Mechlo, we used 2-DG, a glycolytic inhibitor. The combination of 2-DG with either EGCG or BPTES resulted in enhanced cell death of Tsc2−/− MEFs compared to single agent treatments (Figure S7F). This effect was also specific to Tsc2−/− cells, since this combination was less toxic in Tsc2-reexpressing MEFs (Figure S7G). Taken together, our results demonstrate that the combination treatments aimed at inhibiting glycolysis and glutaminolysis potently synergize to kill cells with hyperactive mTORC1 signaling.

Here, we define a novel mTORC1-regulated pathway that controls glutamine-dependent anaplerosis and energy metabolism (Figure 7G). We discovered that the mTORC1 pathway regulates glutamine metabolism by promoting the activity of GDH (Figures 1​-3).3). We show that this regulation occurs by repressing the expression of SIRT4, an inhibitor of GDH (Figures 2 & 3). Molecularly, this is the result of mTORC1-dependent proteasome-mediated degradation of the SIRT4 transcriptional regulator, CREB2 (Figure 4). Interestingly, the modulation of CREB2 levels correlates with increased sensitivity to glutamine deprivation (Ye et al., 2010Qing et al., 2012), fitting with our model of glutamine addiction as a result of mTORC1 activation (Choo et al., 2010). Our data suggest that mTORC1 promotes the binding of the E3 ligase, βTrCP, to CREB2 (Figure 4D), promoting CREB2 degradation by the proteasome (Figure 4E). A previous study has demonstrated that five residues in CREB2 located next to the βTrCP degron are required for its stability (Frank et al., 2010). Accordingly, the mutation of these residues to alanine resulted in stabilization of CREB2 and SIRT4 following insulin and aa-dependent mTORC1 activation (Figure 4G). Future work is aimed at determining if mTORC1 and/or downstream kinases are directly responsible for the multisite phosphorylation of CREB2.

The identification of CREB2 as an mTORC1-regulated transcription factor increases the repertoire of transcriptional regulators modulated by this pathway including HIF1α (glycolysis), Myc (glycolysis) and SREBP1 (lipid biosynthesis) (Duvel et al., 2010Yecies and Manning, 2011). The oncogene Myc has also been linked to the regulation of glutamine metabolism by increasing the expression of the surface transporters ASCT2 and SN2, and the enzyme GLS. Thus, enhanced activity of Myc correlates with increased glutamine uptake and glutamate production (Wise et al., 2008Gao et al., 2009). Our findings describe a new level of control to this metabolic node as shown by the modulation of the glutamate-to-αKG flux (Figure 2). This regulation is particularly relevant as some cancer cells produce more than 50% of their ATP by oxidizing glutamine-derived αKG in the mitochondria (Reitzer et al JBC, 1979). Therefore, these studies support the notion that Myc and CREB2/SIRT4 cooperate to regulate the metabolism of glutamine to αKG.

7.8.4  Rab1A and small GTPases Activate mTORC1

7.8.4.1 Rab1A Is an mTORC1 Activator and a Colorectal Oncogene

Thomas JD1Zhang YJ2Wei YH3Cho JH3Morris LE3Wang HY4Zheng XF5.
Cancer Cell. 2014 Nov 10; 26(5):754-69.
http://dx.doi.org:/10.1016/j.ccell.2014.09.008.

Highlights

  • Rab1A mediates amino acid signaling to activate mTORC1 independently of Rag
  • Rab1A regulates mTORC1-Rheb interaction on the Golgi apparatus
  • Rab1A is an oncogene that is frequently overexpressed in human cancer
  • Hyperactive amino acid signaling is a common driver for cancer

Amino acid (AA) is a potent mitogen that controls growth and metabolism. Here we describe the identification of Rab1 as a conserved regulator of AA signaling to mTORC1. AA stimulates Rab1A GTP binding and interaction with mTORC1 and Rheb-mTORC1 interaction in the Golgi. Rab1A overexpression promotes mTORC1 signaling and oncogenic growth in an AA- and mTORC1-dependent manner. Conversely, Rab1A knockdown selectively attenuates oncogenic growth of Rab1-overexpressing cancer cells. Moreover, Rab1A is overexpressed in colorectal cancer (CRC), which is correlated with elevated mTORC1 signaling, tumor invasion, progression, and poor prognosis. Our results demonstrate that Rab1 is an mTORC1 activator and an oncogene and that hyperactive AA signaling through Rab1A overexpression drives oncogenesis and renders cancer cells prone to mTORC1-targeted therapy.

7.8.4.2 Regulation of TOR by small GTPases

Raúl V Durán1 and Michael N Halla,1
EMBO Rep. 2012 Feb; 13(2): 121–128.
http://dx.doi.org/10.1038%2Fembor.2011.257

TOR is a conserved serine/threonine kinase that responds to nutrients, growth factors, the bioenergetic status of the cell and cellular stress to control growth, metabolism and ageing. A diverse group of small GTPases including Rheb, Rag, Rac1, RalA and Ryh1 play a variety of roles in the regulation of TOR. For example, while Rheb binds to and activates TOR directly, Rag and Rac1 regulate its localization and RalA activates it indirectly through the production of phosphatidic acid. Here, we review recent findings on the regulation of TOR by small GTPases.

The growth-controlling TOR signalling pathway is structurally and functionally conserved from unicellular eukaryotes to humans. TOR, an atypical serine/threonine kinase, was originally discovered inSaccharomyces cerevisiae as the target of rapamycin (Heitman et al, 1991). It was later described in many other organisms including the protozoan Trypanosoma brucei, the yeast Schizosaccharomyces pombe, photosynthetic organisms such as Arabidopsis thaliana and Chlamydomonas reinhardtii, and in metazoans such as Caenorhabditis elegansDrosophila melanogaster and mammals. TOR integrates various stimuli to control growth, metabolism and ageing (Avruch et al, 2009Kim & Guan, 2011Soulard et al, 2009;Wullschleger et al, 2006Zoncu et al, 2011a). In mammals, mTOR is activated by nutrients, growth factors and cellular energy, and is inhibited by stress. Thus, the molecular regulation of TOR is complex and diverse. Among the increasing number of TOR regulators, small GTPases are currently garnering much attention. Small GTPases (20–25 kDa) are either in an inactive GDP-bound form or an active GTP-bound form (Bos et al, 2007). GDP–GTP exchange is regulated by GEFs, which mediate the replacement of GDP by GTP, and by GAPs, which stimulate the intrinsic GTPase activity of a cognate GTPase to convert GTP into GDP (Fig 1). Upon activation, small GTPases interact with effector proteins, thereby stimulating downstream signalling pathways. Small GTPases constitute a superfamily that comprises several subfamilies, such as the Rho, Ras, Rab, Ran and Arf families. Rheb, Rag, RalA, Rac1 and Ryh1, all members of the small GTPase superfamily, play a role in the concerted regulation of TOR by different stimuli. This review summarizes recent advances in the understanding of TOR regulation by these small GTPases.

Regulation of small GTPases by GEFs and GAPs

Regulation of small GTPases by GEFs and GAPs

http://www.ncbi.nlm.nih.gov/pmc/articles/PMC3271343/bin/embor2011257f1.gif

Figure 1 Regulation of small GTPases by GEFs and GAPs. A guanine nucleotide exchange factor (GEF) replaces GDP with GTP to activate the signalling function of the GTPase. Conversely, a GTPase-activating protein (GAP) stimulates hydrolysis of GTP into GDP

The TOR complexes

TOR is found in two functionally and structurally distinct multiprotein complexes, named TORC1 and TORC2 (Avruch et al, 2009Kim & Guan, 2011Soulard et al, 2009Wullschleger et al, 2006Zoncu et al, 2011a). TORC1 regulates several cellular processes including protein synthesis, ribosome biogenesis, nutrient uptake and autophagy. TORC2, in turn, regulates actin cytoskeleton organization, cell survival, lipid synthesis and probably other processes. TORC1 and TORC2 are rapamycin-sensitive and rapamycin-insensitive, respectively, although in some organisms, for example A. thaliana and T. brucei, this rule does not apply (Barquilla et al, 2008Mahfouz et al, 2006). Nevertheless, long-term treatment with rapamycin can also indirectly inhibit TORC2 in mammalian cell lines (Sarbassov et al, 2006). Furthermore, there is accumulating evidence that not all TORC1 readouts are rapamycin-sensitive (Choo & Blenis, 2009Dowling et al, 2010Peterson et al, 2011).

Upstream of TOR

Four main inputs regulate mTORC1: nutrients, growth factors, the bioenergetic status of the cell and oxygen availability. It is well established that growth factors activate mTORC1 through the PI3K–AKT pathway. Once activated, AKT phosphorylates and inhibits the heterodimeric complex TSC1–TSC2, a GAP for Rheb and thus an inhibitor of mTORC1 (Avruch et al, 2009). The TSC1–TSC2 heterodimer is a ‘reception centre’ for various stimuli that are then transduced to mTORC1, including growth factor signals transduced through the AKT and ERK pathways, hypoxia through HIF1 and REDD1, and energy status through AMPK (Wullschleger et al, 2006). In addition to the small GTPases Rheb and Rag (see below), PA also binds to and activates mTORC1 (Fang et al, 2001). Pharmacological or genetic inhibition of PA production, through the inhibition of PLD, impairs activation of mTORC1 by nutrients and growth factors (Fang et al, 2001). Moreover, elevated PLD activity leads to rapamycin resistance in human breast cancer cells (Chen et al, 2003), further supporting a role for PA as an mTORC1 regulator. As discussed below, the small GTPase RalA participates in the mechanism by which PA activates mTORC1 (Maehama et al, 2008Xu et al, 2011).

In the case of nutrients, amino acids in particular, several elements mediate the activation of TORC1. As discussed below, the Rag GTPases are necessary to activate TORC1 in response to amino acids (Binda et al, 2009Kim et al, 2008Sancak et al, 2008). In mammals, it has also been proposed that amino acids stimulate an increase in intracellular calcium concentration, which in turn activates mTORC1 through the class III PI3K Vps34 (Gulati et al, 2008).

Downstream of TOR

TORC1 regulates growth-related processes such as transcription, ribosome biogenesis, protein synthesis, nutrient transport and autophagy (Wullschleger et al, 2006). In mammals, the best-characterized substrates of mTORC1 are S6K and 4E-BP1, through which mTORC1 stimulates protein synthesis. mTORC1 activates S6K, which is a positive regulator of protein synthesis, and inhibits 4E-BP1, which is a negative regulator of protein synthesis. Upon phosphorylation by mTORC1, 4E-BP1 releases eIF4E. Once released from 4E-BP1, eIF4E interacts with the eIF4G subunit of the eIF4F complex, allowing initiation of translation. In mammals, 4E-BP1 participates mainly in the regulation of cell proliferation and metabolism (Dowling et al, 2010). In S. cerevisiae, the main substrate of TORC1 is the S6K orthologue Sch9 (Urban et al, 2007). Sch9 is required for the activation of ribosome biogenesis and translation initiation stimulated by TORC1. Furthermore, it participates in TORC1-dependent inhibition of G0 phase entry.

Regulation of TOR by Rheb

The small GTPase Rheb was first identified in 1994 in a screen for genes induced in neurons in response to synaptic activity (Yamagata et al, 1994), and was first described to interact with the Raf1 kinase (Yee & Worley, 1997). A later report showed that loss of Rhb1, the Rheb orthologue in S. pombe, causes a starvation-like growth arrest (Mach et al, 2000). In 2003, several independent groups working with mammalian cells in vitro and Drosophila in vivo demonstrated that Rheb is the target of the TSC1–TSC2 GAP and a TORC1 activator (Avruch et al, 2009).

Interestingly, the Rheb–mTOR interaction both in vivo and in vitro does not depend on GTP loading of Rheb. This is unusual for GTPases as GTP loading usually regulates effector binding. However, GTP loading of Rheb is crucial for the activation of mTOR kinase activity (Sancak et al, 2007). Conversely, mTOR becomes inactive after association with a nucleotide-deficient Rheb (Long et al, 2005a; Fig 2). Similar results were obtained in S. pombe, making use of mutations that hyperactivate Rheb by increasing its overall GTP : GDP binding ratio (Urano et al, 2005). In contrast to the situation in mammals, interaction of Rheb with SpTOR2 in fission yeast is detected only with a hyperactive Rheb mutant. This suggests that, in S. pombe, Rheb binds to SpTOR2 in a GTP-dependent manner.

Rheb activates TORC1

Rheb activates TORC1

http://www.ncbi.nlm.nih.gov/pmc/articles/PMC3271343/bin/embor2011257f2.gif

Figure 2 Rheb activates TORC1 both directly and indirectly. GTP-bound Rheb interacts directly with TORC1 to activate TORC1 kinase. GTP-bound Rheb also activates RalA, which activates PLD to increase production of PA. PA in turn interacts with TORC1

In addition to the direct interaction between mTOR and Rheb, activation of PA production by Rheb is an additional mechanism by which Rheb might regulate mTORC1. Rheb binds to and activates PLD in a GTP-dependent manner (Sun et al, 2008). PLD produces PA, which binds directly to and upregulates mTORC1. This finding reveals cross-talk between the TSC–Rheb and the PA pathways in the regulation of mTORC1 signalling. A recent study by Yoon and colleagues further demonstrated the role of PLD in mTORC1 regulation (Yoon et al, 2011). They showed that amino acids activate PLD through translocation of PLD to the lysosomal compartment. This translocation is positively regulated by human Vps34 and is necessary for the activation of mTORC1 by amino acids. These authors propose the existence of a Vps34–PLD1 pathway that activates mTORC1 in parallel to the Rag pathway (Yoon et al, 2011).

Although Rheb is required for the activation of mTORC1 by amino acids, Rheb itself does not participate in amino acid sensing, and GTP-loading of Rheb is not affected by amino acid depletion (Long et al, 2005b). Furthermore, amino acid depletion inhibits mTORC1 even in TSC2−/− fibroblasts (Roccio et al, 2006). Nevertheless, interaction of mTORC1 with Rheb depends on amino acid availability (Long et al, 2005b). As discussed below, the current model proposes that amino acids mediate translocation of mTORC1 to the lysosomal surface where mTORC1 interacts with and is activated by GTP-loaded Rheb (Sancak et al, 2008).

Regulation of TOR by Rag

Rag GTPases have unique features among the Ras GTPase subfamily members: they form heterodimers and lack a membrane-targeting sequence (Nakashima et al, 1999Sekiguchi et al, 2001). Gtr1 in S. cerevisiaewas the first member of this GTPase subfamily to be identified (Bun-Ya et al, 1992). The mammalian RagA and RagB GTPases were later described as Gtr1 orthologues (Hirose et al, 1998). Gtr2 in yeast (Nakashima et al, 1999) and its mammalian orthologues RagC and RagD (Sekiguchi et al, 2001) were subsequently discovered due to their ability to form heterodimers with Gtr1 in yeast and RagA and RagB in mammals, respectively. The crystal structure of the Gtr1–Gtr2 complex has been determined recently (Gong et al, 2011). Gtr1 and Gtr2 have similar structures, organized in two domains: an amino-terminal GTPase domain (designated as the G domain) and a carboxy-terminal domain. The Gtr1–Gtr2 heterodimer presents a pseudo-twofold symmetry resembling a horseshoe. The crystal structure reveals that Gtr1–Gtr2 dimerization results from extensive contacts between the C-terminal domains of both proteins, while the G domains do not contact each other (Gong et al, 2011).

Rag proteins mediate the activation of TORC1 in response to amino acids.

Rag proteins mediate the activation of TORC1 in response to amino acids.

http://www.ncbi.nlm.nih.gov/pmc/articles/PMC3271343/bin/embor2011257f3.gif

Figure 3 Rag proteins mediate the activation of TORC1 in response to amino acids. The RagA/B–RagC/D heterodimer is anchored to the MP1–p14–p18 complex on the surface of the lysosome.

Overexpressed Rheb is mislocalized throughout the cell, and therefore interaction of mTORC1 with Rheb does not require amino-acid-induced translocation of mTORC1 to the lysosome. The model is further supported by observations in Drosophila showing that expression of a constitutively active mutant of RagA significantly increases the size of individual cells, whereas expression of a dominant negative mutant of RagA reduces cell size (Kim et al, 2008). Moreover, Rag plays a role in TORC1-mediated inhibition of autophagy both in Drosophila (Kim et al, 2008) and in human cells (Narita et al, 2011).

mTOR and small GTPases are therapeutic targets in the treatment of cancer (Berndt et al, 2011Dazert & Hall, 2011). Aberrant activation of GTPases, including Ras, Rho, Rab or Ran GTPases, promotes cell transformation and cancer (Agola et al, 2011Ly et al, 2010Pylayeva-Gupta et al, 2011), in some cases by acting in the mTOR pathway. Targeting GTPases by using farnesyltransferase inhibitors or geranylgeranyltransferase inhibitors affects signal transduction pathways, cell cycle progression, proliferation and cell survival. Both types of inhibitor are currently under investigation for cancer therapy, although only a small subset of patients responds to these inhibitors (Berndt et al, 2011). A better understanding of the relationship between GTPases and mTOR is essential for the design of combined therapies.

From a mechanistic point of view, research on TOR in different systems is continually adding new insight on the role of TOR in cell biology. However, what is lacking is an integration of the various proposed regulators of TOR, in particular small GTPases (see Sidebar A).

Sidebar A | In need of answers

  1. How are amino acids sensed by the cell?
  2. What is the mechanism by which amino acids regulate the GTP-loading of Rag proteins? What are the GEF and GAP for the Rag proteins?
  3. Is there a GEF that regulates the GTP-loading of Rheb?
  4. What is the molecular mechanism by which Rheb activates TORC1?
  5. How is the dual effect of Rac1 being both upstream and downstream from TOR regulated?
  6. How are the diverse GTPases that impinge on TOR integrated?

7.8.5 PI3K.Akt signaling in osteosarcoma

Zhang J1Yu XH2Yan YG1Wang C1Wang WJ3.
Clin Chim Acta. 2015 Apr 15; 444:182-192.
http://dx.doi.org:/10.1016/j.cca.2014.12.041

Highlights

  • Activation of the PI3K/Akt signaling regulates various cellular functions.
  • The PI3K/Akt signaling may play a key role in the progression of osteosarcoma.
  • Targeting the PI3K/Akt signaling has therapeutic potential for osteosarcoma.

Osteosarcoma (OS) is the most common nonhematologic bone malignancy in children and adolescents. Despite the advances of adjuvant chemotherapy and significant improvement of survival, the prognosis remains generally poor. As such, the search for more effective anti-OS agents is urgent. The phosphatidylinositol 3-kinase (PI3K)/Akt pathway is thought to be one of the most important oncogenic pathways in human cancer. An increasing body of evidence has shown that this pathway is frequently hyperactivated in OS and contributes to disease initiation and development, including tumorigenesis, proliferation, invasion, cell cycle progression, inhibition of apoptosis, angiogenesis, metastasis and chemoresistance. Inhibition of this pathway through small molecule compounds represents an attractive potential therapeutic approach for OS. The aim of this review is to summarize the roles of the PI3K/Akt pathway in the development and progression of OS, and to highlight the therapeutic potential of targeting this signaling pathway. Knowledge obtained from the application of these compounds will help in further understanding the pathogenesis of OS and designing subsequent treatment strategies.

PK.Akt signaling

PK.Akt signaling

http://ars.els-cdn.com/content/image/1-s2.0-S0009898115001059-gr1.sml

PI3K/Akt signaling

PI3K.Akt signaling pathway

PI3K.Akt signaling pathway

http://ars.els-cdn.com/content/image/1-s2.0-S0009898115001059-gr2.sml

PI3K/Akt signaling pathway

PK.Akt therapeutic target

PK.Akt therapeutic target

http://ars.els-cdn.com/content/image/1-s2.0-S0009898115001059-gr3.sml

PK/Akt therapeutic target

7.8.6 The mTORC1-S6K1 Pathway Regulates Glutamine Metabolism through the eIF4B-Dependent Control of c-Myc Translation

Csibi A1Lee G1Yoon SO1Tong H2,…, Fendt SM4Roberts TM2Blenis J5.
Curr Biol. 2014 Oct 6; 24(19):2274-80.
http://dx.doi.org:/10.1016/j.cub.2014.08.007

Growth-promoting signaling molecules, including the mammalian target of rapamycin complex 1 (mTORC1), drive the metabolic reprogramming of cancer cells required to support their biosynthetic needs for rapid growth and proliferation. Glutamine is catabolyzed to α-ketoglutarate (αKG), a tricarboxylic acid (TCA) cycle intermediate, through two deamination reactions, the first requiring glutaminase (GLS) to generate glutamate and the second occurring via glutamate dehydrogenase (GDH) or transaminases. Activation of the mTORC1 pathway has been shown previously to promote the anaplerotic entry of glutamine to the TCA cycle via GDH. Moreover, mTORC1 activation also stimulates the uptake of glutamine, but the mechanism is unknown. It is generally thought that rates of glutamine utilization are limited by mitochondrial uptake via GLS, suggesting that, in addition to GDH, mTORC1 could regulate GLS. Here we demonstrate that mTORC1 positively regulates GLS and glutamine flux through this enzyme. We show that mTORC1 controls GLS levels through the S6K1-dependent regulation of c-Myc (Myc). Molecularly, S6K1 enhances Myc translation efficiency by modulating the phosphorylation of eukaryotic initiation factor eIF4B, which is critical to unwind its structured 5′ untranslated region (5’UTR). Finally, our data show that the pharmacological inhibition of GLS is a promising target in pancreatic cancers expressing low levels of PTEN.

Highlights

  • The mTORC1 pathway positively regulates GLS and glutamine flux
  • mTORC1 controls the translation efficiency of Myc mRNA
  • S6K1 regulates Myc translation through eIF4B phosphorylation
  • Inhibition of GLS decreases the growth of pancreatic cancer cells

Figure 1. The mTORC1 Pathway Regulates GLS1 (A–C and E) GLS protein levels in whole cell lysates from Tsc2 WT and Tsc22/2 MEFs treated with rapamycin (Rapa) for 8 hr (A); HEK293T cells stably expressing Rheb WT, the mutant S16H Rheb, or EV and treated with rapamycin for 24 hr (B); Tsc22/2 MEFs treated with rapamycin at the indicated time points (C); and Tsc2 WT and Tsc22/2 MEFs treated with the indicated compounds for 8 hr (E). The concentrations of the compounds were as follows: rapamycin, 20 ng/ml; LY294002 (LY), 20 mM; and BEZ235, 10 mM. (D) Time course of glutamine consumption in Tsc22/2 MEFs incubated with or without 20ng/ml rapamycin for 24 hr. Each time data point is an average of triplicate experiments. (F) Intracellular glutamine levels in Tsc22/2 MEFs treated with rapamycin for 24 hr. (G) Glutamineflux inTsc22/2 MEFs expressing an EV or re-expressingTSC2 treated with theindicated compounds for 24hr.The concentrations of the compounds were as follows: rapamycin 20 ng/ml; LY294002, 20 mM; BEZ235, 10 mM; BPTES, 10 mM; and 6-diazo-5-oxo-l-norleucine, 1mM. The mean is shown. Error bars represent the SEM from at least three biological replicates. Numbers below the immunoblot image represent quantification normalized to the loading control. See also Figure S1.

Figure2. The mTORC1 Pathway Regulates GLS1 via Myc GLS and Myc protein levels in whole cell lysates from BxPC3 cells transfected with a nontargeting control (NTC) siRNA or four independent siRNAs against Myc for 72 hr (A), Tsc2 WT and Tsc22/2 MEFs treated with rapamycin (20 ng/ml) for 8 hr (B), and Tsc22/2 MEFs stably expressing Myc or EV and treated with rapamycin (20 ng/ml) for 24 hr (C).

Figure 3. The mTORC1 Substrate S6K1 Controls GLS through Myc mRNA Translation (A) Normalized luciferase light units of Tsc22/2 MEFs stably expressing a Myc-responsive firefly luciferase construct (Myc-Luc) or vector control (pCignal Lenti-TRE Reporter). Myc transcriptional activity was measured after treatment with rapamycin (20 ng/ml) or PF4708671 (10 mM) for 8 hr. (B) GLS and Myc protein levels in whole cell lysates from HEK293T cells expressing HA-S6K1-CA (F5A-R3A-T389E) or EV treated with rapamycin (20 ng/ml) for 24 hr. HA, hemagglutinin. (CandD) Intracellular glutamine levels of Tsc22/2 MEFs stably expressing S6K-CA(F5A/R5A/T389E, mutating either the three arginines or all residues within the RSPRR motif to alanines shows the same effect; [10]) or empty vector and treated with rapamycin (20 ng/ml) or DMSO for 48 hr (C) or transfected with NTC siRNA or siRNA against both S6K1/2 (D). 24 hr posttransfection, cells transfected with NTC siRNA were treated with PF4708671 (10 mM) or DMSO for 48 hr. (E) Glutamine consumption of Tsc22/2 MEFs transfected with NTC siRNA or siRNA against both S6K1/2. 72 hr posttransfection, media were collected, and levels of glutamine in the media were determined. (F) Normalized luciferase light units of Tsc2WTMEFs transfected with thepDL-N reporter construct containing the 50 UTR of Myc under the control of Renilla luciferase. Firefly luciferase was used as an internal control. 48hr posttransfection, cells were treated with rapamycin (20ng/ml) or PF4708671 (10mM) for 8h. (G) Relative levels of Myc, Gls, and Actin mRNA in each polysomal gradient fraction. mRNA levels were measured by quantitative PCR and normalized to the 5S rRNA level. HEK293T cells were treated with rapamycin (20 ng/ml) for 24 hr, and polysomes were fractionated on sucrose density gradients. The values are averaged from two independent experiments performed in duplicate, and the error bars denote SEM (n = 4). (Hand I) GLS and Myc protein levels in whole cell lysates from Tsc22/2 MEFs transfected with NTC siRNA or two independent siRNAs against eIF4B for 72hr (H) and Tsc22/2 MEFs stably expressing eIF4B WT, mutant S422D, or EV) and treated with rapamycin for 24 hr (I). The mean is shown. Error bars represent the SEM from at least three biological replicates. The asterisk denotes a nonspecific band. The numbers below the immunoblot image represent quantification normalized to the loading control. See also Figures S2 and S3.

Figure 4. Inhibition of GLS Reduces the Growth of Pancreatic Cancer Cells (A) GLS and Myc protein levels in whole cell lysates from BxPC3, MIAPaCa-2, or AsPC-1 cells treated with rapamycin (20 ng/ml) or BEZ235 (1 mM) for 24 hr. (B) Glutamine consumption of BxPC3 or AsPC-1 cells 48 hr after plating. (Cand D) Soft agar assays with BxPC3 or AsPC-1 cells treated with BPTES (10 mM), the combination of BPTES (10 mM) + OAA (2 mM) (C) and BxPC3 or AsPC-1 cells treated with BPTES, and the combination of BPTES (10 mM) + NAC (10 mM) (D). NS, not significant. The mean is shown. Error bars represent the SEM from at least three biological replicates.

7.8.7 Localization of mouse mitochondrial SIRT proteins

Nakamura Y1Ogura MTanaka DInagaki N.
Biochem Biophys Res Commun. 2008 Feb 1; 366(1):174-9
http://www.ncbi.nlm.nih.gov/pubmed/18054327#

Yeast silent information regulator 2 (SIR2) is involved in extension of yeast longevity by calorie restriction, and SIRT3, SIRT4, and SIRT5 are mammalian homologs of SIR2 localized in mitochondria. We have investigated the localization of these three SIRT proteins of mouse. SIRT3, SIRT4, and SIRT5 proteins were localized in different compartments of the mitochondria. When SIRT3 and SIRT5 were co-expressed in the cell, localization of SIRT3 protein changed from mitochondria to nucleus. These results suggest that the SIRT3, SIRT4, and SIRT5 proteins exert distinct functions in mitochondria. In addition, the SIRT3 protein might function in nucleus

Fig. 1. Localization of SIRT3, SIRT4, and SIRT5 in mitochondria. (A) Confocal microscopy. SIRT3-myc (upper panels), SIRT4-myc (middle panels), and SIRT5-FLAG (lower panels) were expressed in COS7 cells and immunostained with anti-myc antibody or anti-FLAG antibody. Mitochondria and nuclei were stained by MitoTracker Red and DAPI, respectively, and fluorescent images were obtained using a confocal microscope. (B) Fractionation of post-nuclear supernatant. SIRT3-myc, SIRT4-myc, and SIRT5-FLAG proteins each was expressed in COS7 cells, and the obtained PNS was fractionated into mitochondria-enriched precipitate (P1), microsome-enriched precipitate (P2), and supernatant (S) fractions. The three fractions were separated by SDS–PAGE and then analyzed by Western blotting using anti-myc antibody for SIRT3-myc and SIRT4-myc or anti-FLAG antibody for SIRT5-FLAG. Hsp60, calnexin, and GAPDH were used as endogenous markers for mitochondria, microsome, and cytosol, respectively. (C) Alkaline treatment of mitochondria. Mitochondria prepared from the COS7 cells expressing each of the SIRT3-myc, SIRT4-myc, and SIRT5-FLAG proteins were treated with Na2CO3. The reaction mixture was centrifuged to separate the precipitate and supernatant fractions, containing membrane-integrated proteins and soluble proteins, respectively. The two fractions were analyzed by Western blotting. Cytochrome c (cytc) and hsp60 were used as endogenous protein markers for mitochondrial soluble protein. (D) Submitochondrial fractionation. The mitochondria from COS7 cells expressing one of three SIRT proteins were treated with either H2O (hypotonic) or TX-100, and then treated with trypsin. The reaction mixtures were analyzed by Western blotting. Cytochrome c and hsp60 were used as endogenous markers for mitochondrial intermembrane space protein and matrix protein, respectively.

Fig. 2. Localization of SIRT3 when co-expressed with SIRT5. (A) Confocal microscopic analysis of COS7 cells expressing two of the three mitochondrial SIRT proteins. SIRT3-myc and SIRT5-FLAG (upper panels), SIRT3-myc and SIRT4-FLAG (middle panels), and SIRT4-myc and SIRT5-FLAG (lower panels) were co-expressed in COS7 cells, and immunostained using antibodies against myc tag and FLAG tag. Nuclei were stained by DAPI. (B) Subcellular fractionation of PNS. PNS of COS7 cells co-expressing SIRT3-myc and SIRT5-FLAG was fractionated into mitochondria-enriched precipitate (P1), microsome-enriched precipitate (P2), and supernatant (S) fractions, and these fractions along with whole cell lysate were analyzed by Western blotting. (C) Subcellular fractionation using digitonin. COS7 cells expressing either SIRT3-myc (left) or SIRT5-FLAG (middle) or both (right) were solubilized by digitonin, and the obtained lysate was centrifuged and fractionated into nuclear-enriched insoluble (INS), and soluble (SOL) fractions. Hsp60 and laminA/C were used as endogenous markers for mitochondria protein and nucleus protein, respectively.

Because the segment containing amino acid residues 66– 88 potentially forms a basic amphiphilic a-helical structure, it could serve as a MTS. To examine the role of this segment, SIRT3 mutant SIRT3mt, in which the four amino acid residues 72–75 were replaced by four alanine residues, was constructed (Fig. 3A). When SIRT3mt alone was expressed in COS7 cells, SIRT3mt protein was not detected in mitochondria but was widely distributed in the cell in confocal microscopic analysis (Fig. 3B, upper panels). In addition, when SIRT3mt and SIRT5 were co-expressed, the distribution of SIRT3mt protein was not changed compared to that expressed alone (Fig. 3B, lower panels). In fractionation of PNS, SIRT3mt protein was fractionated into S fraction both when SIRT3mt was expressed alone and when SIRT3mt and SIRT5 were co-expressed. SIRT5 protein was localized in mitochondria when SIRT3mt and SIRT5 were co-expressed (Fig. 3C). These results indicate that the MTS is necessary not only for targeting SIRT3 to mitochondria in the absence of SIRT5 but also for targeting SIRT3 to nucleus in the presence of SIRT5.

Fig. 3. Effect of disruption of putative mitochondrial targeting signal of SIRT3. (A) Alanine replacement of putative MTS of SIRT3. Four residues of the putative MTS of SIRT3 (amino acid residues 72–75) were replaced with four alanine residues. In the SIRT3mt sequence, amino acid residues identical with wild-type SIRT3 protein are indicated with dots. (B) Confocal microscopy. Immunofluorescent images of COS7 cells expressing SIRT3mt-myc alone (upper panels) or both SIRT3mt-myc and SIRT5-FLAG (lower panels) are shown. Mitochondria and nuclei were stained by MitoTracker Red and DAPI, respectively. (C) Subcellular fractionation of PNS. PNSs of COS7 cells expressing SIRT3mt-myc alone (an upper panel) or co-expressing SIRT3mt-myc and SIRT5-FLAG (middle and lower panels) were centrifuged and fractionated into mitochondria-enriched precipitate (P1), microsome-enriched precipitate (P2), and supernatant (S) fractions. The fractions were analyzed by Western blotting.

Fig. 4. Effect of disruption of putative nuclear localization signal of SIRT3. (A) Comparison of the amino acid sequences of putative NLS of SIRT3, SIRT3nu, and SV40 large T antigen. Three basic amino acid residues of the putative NLS of SIRT3 (amino acid residues 214–216) were replaced with three alanine residues. In the SIRT3nu sequence, amino acid residues identical with wild-type SIRT3 protein are indicated with dots. The classical NLS of SV40 large T antigen also is shown (SV40). (B) Confocal microscopy. Immunofluorescent images of COS7 cells expressing SIRT3nu-myc alone (upper panels) or both SIRT3nu-myc and SIRT5-FLAG (lower panels) are shown. Mitochondria and nuclei were stained by MitoTracker Red and DAPI, respectively. (C) Subcellular fractionation of PNS. PNSs of the COS7 cells expressing SIRT3nu-myc alone (an upper panel) or co-expressing SIRT3numyc and SIRT5-FLAG (middle and lower panels) were fractionated into mitochondria-enriched precipitate (P1), microsome-enriched precipitate (P2), and supernatant (S) fractions. The fractions were analyzed by Western blotting.

The sequence containing amino acid sequence 213-219 of the SIRT3 closely resembles the putative protein classical NLS of the SV40 T antigen (Fig. 4A). To examine whether this sequence functions as a NLS, the mutant SIRT3 protein SIRT3nu, in which the three basic amino acid residues (214–216) in the putative NLS of SIRT3 were replaced by three alanine residues (Fig. 4A), was constructed. When SIRT3nu alone was expressed in COS7 cells, it was localized in mitochondria (Fig. 4B, upper panels). In the cells co-expressing SIRT3nu and SIRT5, a shift of SIRT3nu protein to the nucleus was not observed, and SIRT3nu protein and a part of SIRT5 protein were scattered widely in the cell in confocal microscopic analysis (Fig. 4B, lower panels). In fractionation of PNS, all of the SIRT3nu protein and nearly half of the SIRT5 protein were shifted from P1 fraction to S fraction by co-expression (Figs. 1B and 4C). These results suggest that the segment containing amino acid residues 213–219 of SIRT3 plays an important role in the localization shift of SIRT3 protein to nucleus when co-expressed with SIRT5. Furthermore, SIRT5 may well hamper SIRT3nu localization in mitochondria through interaction with SIRT3nu. However, further study is required to elucidate the mechanism of the localization shift of SIRT3 protein. Interestingly, recent study has reported that human prohibitin 2 (PHB2), known as a repressor of estrogen receptor (ER) activity, is localized in the mitochondrial inner membrane, and translocates to the nucleus in the presence of ER and estradiol [18]. Although the mechanism of regulation of the expression level of SIRT5 remains unknown, SIRT3 might play a role in communication between nucleus and mitochondria in a SIRT5-dependent manner. The function of mitochondrial SIRT proteins is still not well known. In the present study, we determined the exact localization of mouse SIRT3, SIRT4, and SIRT5 proteins in mitochondria. In addition, we demonstrated that SIRT3 can be present in nucleus in the presence of SIRT5. It has been reported that SIRT3 deacetylates proteins that are not localized in mitochondria in vitro such as histone-4 peptide and tubulin [14]. Thus, if SIRT3 is present in nucleus in vivo, SIRT3 protein might well deacetylate nuclear proteins. These results provide useful information for the investigation of the function of these proteins.

References

[1] J.C. Tanny, G.J. Dowd, J. Huang, H. Hilz, D. Moazed, An enzymatic activity in the yeast Sir2 protein that is essential for gene silencing, Cell 99 (1999) 735–745.
[2] S. Imai, C.M. Armstrong, M. Kaeberlein, L. Guarente, Transcriptional silencing and longevity protein Sir2 is an NAD-dependent histone deacetylase, Nature 403 (2000) 795–800.
[3] M. Gotta, S. Strahl-Bolsinger, H. Renauld, T. Laroche, B.K. Kennedy, M. Grunstein, S.M. Gasser, Localization of Sir2p: the nucleolus as a compartment for silent information regulators, EMBO J. 16 (1997) 3243–3255.
[4] I. Muller, M. Zimmermann, D. Becker, M. Flomer, Calendar life span versus budding life span of Saccharomyces cerevisiae, Mech. Aging Dev. 12 (1980) 47–52.
[5] S.J. Lin, M. Kaeberlein, A.A. Andalis, L.A. Sturtz, P.A. Defossez, V.C. Culotta, G.R. Fink, L. Guarente, Calorie restriction extends Saccharomyces cerevisiae lifespan by increasing respiration, Nature 418 (2002) 344–348.
[6] S.J. Lin, P.A. Defossez, L. Guarente, Requirement of NAD and SIR2 for life-span extension by calorie restriction in Saccharomyces cerevisiae, Science 289 (2000) 2126–2128.

7.8.8 SIRT4 Has Tumor-Suppressive Activity and Regulates the Cellular Metabolic Response to DNA Damage by Inhibiting Mitochondrial Glutamine Metabolism

Jeong SM1Xiao CFinley LWLahusen TSouza ALPierce KLi YH, et al.
Cancer Cell. 2013 Apr 15; 23(4):450-63.
http://www.ncbi.nlm.nih.gov/pubmed/23562301#
http://dx.doi.org:/10.1016/j.ccr.2013.02.024

DNA damage elicits a cellular signaling response that initiates cell cycle arrest and DNA repair. Here we find that DNA damage triggers a critical block in glutamine metabolism, which is required for proper DNA damage responses. This block requires the mitochondrial SIRT4, which is induced by numerous genotoxic agents and represses the metabolism of glutamine into TCA cycle. SIRT4 loss leads to both increased glutamine-dependent proliferation and stress-induced genomic instability, resulting in tumorigenic phenotypes. Moreover, SIRT4 knockout mice spontaneously develop lung tumors. Our data uncover SIRT4 as an important component of the DNA damage response pathway that orchestrates a metabolic block in glutamine metabolism, cell cycle arrest and tumor suppression.

DNA damage initiates a tightly coordinated signaling response to maintain genomic integrity by promoting cell cycle arrest and DNA repair. Upon DNA damage, ataxia telangiectasia mutated (ATM) and ataxia telangiectasia and RAD3-related protein (ATR) are activated and induce phosphorylation of Chk1, Chk2 and γ-H2AX to trigger cell cycle arrest and to initiate assembly of DNA damage repair machinery (Abraham, 2001Ciccia and Elledge, 2010Su, 2006). Cell cycle arrest is a critical outcome of the DNA damage response (DDR) and defects in the DDR often lead to increased incorporation of mutations into newly synthesized DNA, the accumulation of chromosomal instability and tumor development (Abbas and Dutta, 2009Deng, 2006Negrini et al., 2010).

The cellular metabolic response to DNA damage is not well elucidated. Recently, it has been shown that DNA damage causes cells to upregulate the pentose phosphate pathway (PPP) to generate nucleotide precursors needed for DNA repair (Cosentino et al., 2011). Intriguingly, a related metabolic switch to increase anabolic glucose metabolism has been observed for tumor cells and is an important component of rapid generation of biomass for cell growth and proliferation (Jones and Thompson, 2009Koppenol et al., 2011). Hence, cells exposed to genotoxic stress face a metabolic challenge; they must be able to upregulate nucleotide biosynthesis to facilitate DNA repair, while at the same time limiting proliferation and inducing cell cycle arrest to limit the accumulation of damaged DNA. The molecular events that regulate this specific metabolic program in response to DNA damage are still unclear.

Sirtuins are a highly conserved family of NAD+-dependent deacetylases, deacylases, and ADP-ribosyltransferases that play various roles in metabolism, stress response and longevity (Finkel et al., 2009;Haigis and Guarente, 2006). In this study, we studied the role of SIRT4, a mitochondria-localized sirtuin, in cellular metabolic response to DNA damage and tumorigenesis.

DNA damage represses glutamine metabolism

To investigate how cells might balance needs for continued nucleotide synthesis, while also preparing for cell cycle arrest, we assessed the metabolic response to DNA damage by monitoring changes in the cellular consumption of two important fuels, glucose and glutamine, after DNA-damage. Strikingly, treatment of primary mouse embryonic fibroblasts (MEFs) with camptothecin (CPT), a topoisomerase 1 inhibitor that causes double-stranded DNA breaks (DSBs), resulted in a pronounced reduction in glutamine consumption (Figure 1A). Glutamine metabolism in mammalian cells is complex and contributes to a number of metabolic pathways. Glutamine is the primary nitrogen donor for protein and nucleotide synthesis, which are essential for cell proliferation (Wise and Thompson, 2010). Additionally, glutamine provides mitochondrial anaplerosis. Glutamine can be metabolized via glutaminase (GLS) to glutamate and NH4+, and further converted to the tricarboxylic acid (TCA) cycle intermediate α-ketoglutarate via glutamate dehydrogenase (GDH) or aminotransferases. This metabolism of glutamine provides an important entry point of carbon to fuel the TCA cycle (Jones and Thompson, 2009), and accounts for the majority of ammonia production in cells (Yang et al., 2009). CPT-induced reduction of glutamine consumption was accompanied by a reduction in ammonia secretion from cells (Figure 1B). Notably, under these conditions, we observed no obvious decrease in glucose uptake and lactate production (Figures 1C and 1D), consistent with previous studies showing that intact glucose utilization through the PPP is important for a normal DNA damage response (Cosentino et al., 2011). Preservation of glucose uptake also suggests that repression of glutamine consumption may be a specific metabolic response to genotoxic stress and not reflective of a non-specific metabolic crisis.

Figure 1 Glutamine metabolism is repressed by genotoxic stress

To examine the metabolic response to other forms of genotoxic stress, we monitored the metabolic response to ultra-violet (UV) exposure in primary MEFs. Similar to CPT treatment, UV exposure reduced glutamine uptake, without significant changes in glucose consumption (Figures 1E and 1F). Similarly two human cell lines, HepG2 and HEK293T, also demonstrated marked reductions in glutamine uptake in response to DNA damaging agents without comparable changes in glucose uptake (Figures 1G and 1HFigures S1A and S1B). Taken together, these results suggest that a variety of primary and tumor cell lines (from mouse or human) respond to genotoxic stress by down-regulating glutamine metabolism.

To examine in more detail the changes in cellular glutamine metabolism after genotoxic stress, we performed a global metabolomic analysis with transformed MEFs before and after DNA damage. As previously reported, we observed that PPP intermediates were increased in response to DNA damage (Figures 1I and 1J). Remarkably, we observed a decrease in measured TCA cycle intermediates after UV exposure (Figures 1I and 1K). Moreover, we found that HepG2 cells showed a similar metabolomic shift in response to DNA damage (Figure S1D). We did not observe a clear, coordinated repression of nucleotides or glutamine-derived amino acids after exposure to DNA damage (Figure S1C).

To determine whether reduction in TCA cycle metabolites was the consequence of reduced glutamine metabolism, we performed a time-course tracer study to monitor the incorporation of [U-13C5]glutamine into TCA cycle intermediates at 0, 2 and 4 hr after UV treatment. We observed that after UV exposure, cells reduced contribution of glutamine to TCA cycle intermediates in a time-dependent manner (Figure 1L). Moreover, the vast majority of the labeled fumarate and malate contained four carbon atoms derived from [U-13 C5]glutamine (Figure S1F, M+3 versus M+4), indicating that most glutamine was used in the non-reductive direction towards succinate, fumarate and malate production. We were able to observe little contribution of glutamine flux into nucleotides or glutathione in control or UV-treated cells at these time points (data not shown), suggesting that the mitochondrial metabolism of glutamine accounts for the majority of glutamine consumption in these cells. Taken together, the metabolic flux analysis demonstrates that DNA damage results in a reduction of mitochondrial glutamine anaplerosis, thus limiting the critical refueling of carbons into the TCA cycle.

To assess the functional relevance of decreased glutamine metabolism after DNA damage, we deprived cells of glucose, thereby shifting cellular dependence to glutamine to maintain viability (Choo et al., 2011Dang, 2010). If DNA damage represses glutamine usage, we reasoned that cells would be more sensitive to glucose deprivation. Indeed, following 72 hr of glucose deprivation, cell death in primary MEFs was significantly elevated at 10 hr after UV exposure (Figure S1E). However, cells cultured with glucose remained viable in these conditions. Thus, these data demonstrate that genotoxic stress limits glutamine entry into the central mitochondrial metabolism of the TCA cycle.

SIRT4 is induced in response to genotoxic stress

Because sirtuins regulate both cellular metabolism and stress responses (Finkel et al., 2009Schwer and Verdin, 2008), we examined whether sirtuins were involved in the metabolic adaptation to DNA damage. We first examined the expression of sirtuins in the response to DNA damage. Specifically, we probed SIRT1, which is involved in stress responses (Haigis and Guarente, 2006), as well as mitochondrial sirtuins (SIRT3–5), which have been shown to regulate amino acid metabolism (Haigis et al., 2006Hallows et al., 2011Nakagawa et al., 2009). Remarkably, SIRT4 mRNA levels were induced by nearly 15-fold at 15 hr after CPT treatment and 5-fold after etoposide (ETS), a topoisomerase 2 inhibitor, in HEK293T cells (Figure 2A). Interestingly, the induction of SIRT4 was significantly higher than the induction of SIRT1 and mitochondrial SIRT3 (~2-fold), sirtuins known to be induced by DNA damage and regulate cellular responses to DNA damage (Sundaresan et al., 2008Vaziri et al., 2001Wang et al., 2006). Moreover, overall mitochondrial mass was increased by only 10% in comparison with control cells (Figure S2A), indicating that the induction of SIRT4 is not an indirect consequence of mitochondrial biogenesis. These data hint that SIRT4 may have an important, previously undetermined role in the DDR.

Figure 2 SIRT4 is induced by DNA damage stimuli

To test the induction of SIRT4 in the general genotoxic stress response, we treated cells with other types of DNA damage, including UV and gamma-irradiation (IR). SIRT4 mRNA levels were also increased by these genotoxic agents (Figures S2B and S2C) and low doses of CPT and UV treatment also induced SIRT4expression (Figures S2D and S2E). We observed similar results with MEFs (Figures 2B and 2DFigure S2F) and HepG2 cells (Figure S2G). DNA damaging agents elevated SIRT4 in p53-inactive HEK293T cells (Figures 2A and 2C) and in p53-null PC3 human prostate cancer cells (Figure S2H), suggesting that SIRT4can be induced in a p53-independent manner.

To examine whether the induction of SIRT4 occurred as a result of cell cycle arrest, we measured SIRT4levels after the treatment of nocodazole, which inhibits microtubule polymerization to block mitosis. While treatment with nocodazole completely inhibited cell proliferation (data not shown), SIRT4 expression was not elevated (Figure S2I). In addition, we analyzed SIRT4 expression in distinct stages of the cell cycle in HepG2 cells synchronized with thymidine block (Figure S2J, Left). SIRT4 mRNA levels were measured at different times after release and were not elevated during G1 or G2/M phases (Figure S2J, Right), suggesting thatSIRT4 is not induced as a general consequence of cell cycle arrest. Next, we re-examined the localization of SIRT4 after DNA damage. SIRT4 localizes to the mitochondria of human and mouse cells under basal, unstressed conditions (Ahuja et al., 2007Haigis et al., 2006). Following CPT treatment, SIRT4 colocalized with MitoTracker, a mitochondrial-selective marker, indicating that SIRT4 retains its mitochondrial localization after exposure to DNA damage (Figure S2K). Taken together, our findings demonstrate that SIRT4 is induced by multiple forms of DNA damage in numerous cell types, perhaps to coordinate the mitochondrial response to genotoxic stress.

SIRT4 represses glutamine anaplerosis

We observed that glutamine anaplerosis is repressed by genotoxic stress (Figure 1) and SIRT4 is induced by DNA damage (Figure 2). Additionally, previous studies reported that SIRT4 represses glutamine anaplerosis (Haigis et al., 2006). We next tested whether SIRT4 directly regulates cellular glutamine metabolism and contribution of glutamine to the TCA cycle. Like DNA damage, SIRT4 overexpression (SIRT4-OE) in HepG2, HeLa or HEK293T cells resulted in the repression of glutamine consumption (Figure 3AFigures S3A–C). Conversely, SIRT4 knockout (KO) MEFs consumed more glutamine than did wild-type (WT) cells (Figure 3B).

Figure 3 SIRT4 represses mitochondrial glutamine metabolism in response to DNA damage

Mitochondrial glutamine catabolism refuels the TCA cycle and is essential for viability in the absence of glucose (Choo et al., 2011Yang et al., 2009). Thus, we examined the effect of SIRT4 on cell survival during glucose deprivation. Overexpression of SIRT4 in HEK293T or HeLa cells increased cell death in glucose-free media compared to control cells (Figure 3CFigure S3D). Importantly, this cell death was completely rescued by the addition of pyruvate or cell permeable dimethyl α-ketoglutarate (DM-KG), demonstrating that SIRT4 overexpression reduced the ability of cells to utilize glutamine for mitochondrial energy production. Moreover, cell death was equally maximized in the absence of glucose and presence of the mitochondrial ATPase inhibitor oligomycin (Figure 3C). These findings are in line with the model that SIRT4 induction with DNA damage limits glutamine metabolism and utilization by the TCA cycle

We next utilized a metabolomic approach to interrogate glutamine usage in the absence of SIRT4. SIRT4 KO MEFs demonstrated elevated levels of TCA cycle intermediates (Figure 3J, WT versus KO), whereas intermediates of glycolysis were comparable with WT cells (data not shown). Nucleotides and other metabolites downstream of glutamine metabolism were not coordinately regulated by SIRT4 loss (Figure S3E and data not shown). Next, we analyzed glutamine flux in WT and SIRT4 KO MEFs in medium containing [U-13C5]glutamine for 2 or 4 hours and measured isotopic enrichment of TCA cycle intermediates. Loss of SIRT4 promoted a higher rate of incorporation of 13C-labeled metabolites derived from [U-13C5]glutamine in all TCA cycle intermediates measured (Figure 3D). These data provide direct evidence that SIRT4 loss drives increased entry of glutamine-derived carbon into the TCA cycle.

Next, we examined the mechanisms involved in this repression of glutamine anaplerosis. GLS is the first required enzyme for mitochondrial glutamine metabolism (Curthoys and Watford, 1995) and its inhibition limits glutamine flux into the TCA cycle (Wang et al., 2010; Le et al., 2012; Yuneva et al., 2012). Treatment with bis-2-(5-phenylacetoamido-1,2,4-thiadiazol-2-yl)ethyl sulfide (BPTES) (Robinson et al., 2007), an inhibitor of GLS1, repressed glutamine uptake and completely rescued the increased glutamine consumption of SIRT4 KO cells (Figure 3E). Moreover, SIRT4 overexpression no longer inhibited glutamine uptake when GLS1 was reduced by using short hairpin RNAs (shRNAs) (Figures 3F and 3G), demonstrating that SIRT4 regulates mitochondrial glutamine metabolism. SIRT4 is a negative regulator of GDH activity (Haigis et al., 2006) and SIRT4 KO MEFs exhibited increased GDH activity in comparison with WT MEFs (Figure S3F). To test whether SIRT4 regulates mitochondrial glutamine metabolism via inhibiting GDH activity, we measured glutamine uptake in WT and SIRT4 KO cells in the presence of EGCG, a GDH inhibitor (Choo et al., 2011Li et al., 2006). The treatment of EGCG partially rescued the increased glutamine uptake of KO cells (Figure S3G), suggesting that GDH contributes to the role of SIRT4 in glutamine metabolism.

SIRT4 represses mitochondrial glutamine metabolism after DNA damage

SIRT4 regulates cell cycle progression and genomic fidelity in response to DNA damage

Figure 4 SIRT4 is involved in cellular DNA damage responses

SIRT4 represses tumor proliferation

Figure 5 SIRT4 has tumor suppressive function

(A and B) Growth curves of WT and SIRT4 KO MEFs (n = 3) cultured in standard media (A) or media supplemented with BPTES (10 μM) (B). Data are means ±SD.

(C and D) Growth curves of Vector and SIRT4-OE HeLa cells (n = 3) cultured in standard media (C) or media supplemented with BPTES (10 μM) (D). Data are means ±SD.

(E) Focus formation assays with transformed WT and SIRT4 KO MEFs (left). Cells were cultured with normal medium or medium without glucose or glutamine for 10 days and stained with crystal violet. The number of colonies was counted (right) (n =3 samples of each condition). n.d., not determined.

(F) Focus formation assays with transformed KO MEFs reconstituted with SIRT4 or a catalytic mutant of SIRT4 (n = 3). Cells were cultured for 8 days and stained with crystal violet.

(G) Contact inhibited cell growth of transformed WT and SIRT4 KO MEFs cultured in the presence of DMSO or BPTES (10 μM) for 14 days (left). The number of colonies was counted (right). Data are means ±SEM. n.s., not significant. *p < 0.05, **p < 0.005. See also Figure S5.

http://www.ncbi.nlm.nih.gov/pmc/articles/PMC3650305/bin/nihms451579f5.jpg

SIRT4 represses tumor formation in vivo

To investigate SIRT4 function in human cancers, we examined changes in SIRT4 expression. SIRT4 mRNA level was reduced in several human cancers, such as small cell lung carcinoma (Garber et al., 2001), gastric cancer (Wang et al., 2012), bladder carcinoma (Blaveri et al., 2005), breast cancer (TCGA) and leukemia (Choi et al., 2007) (Figure 6A). Of note, lower SIRT4 expression associated with shorter time to death in lung tumor patients (Shedden et al., 2008) (Figure 6B). Overall the expression data is consistent with the model that SIRT4 may play a tumor suppressive role in human cancers.

Figure 6 SIRT4 is a mitochondrial tumor suppressor

SIRT4 regulates glutamine metabolism in lung tissue

To test further the biological relevance of this pathway in lung, we examined whether SIRT4 is induced in vivo after exposure to DNA damaging IR treatment. Remarkably, Sirt4 was significantly induced in lung tissue after IR exposure (Figure 7A). We next examined whether IR repressed glutamine metabolism in vivo, as observed in cell culture by examining GDH activity in lung tissue from WT and SIRT4 KO mice with or without IR exposure. GDH activity was elevated in lung tissue extracts from SIRT4 KO mice compared with WT lung tissue (Figure 7B). Importantly, GDH activity was significantly decreased in lung tissue from WT mice after IR exposure, whereas not in lung tissue from KO mice (Figure 7C). Thus, these findings recapitulate our cellular studies and are in line with the model that SIRT4 induction with DNA damage limits mitochondrial glutamine metabolism and utilization.

SIRT4 inhibits mitochondria glutamine metabolism in vivo

SIRT4 inhibits mitochondria glutamine metabolism in vivo

http://www.ncbi.nlm.nih.gov/pmc/articles/PMC3650305/bin/nihms451579f7.gif

Figure 7 SIRT4 inhibits mitochondria glutamine metabolism in vivo

To assess whether the functions of SIRT4 can be reproduced in these lung tumors, cells derived from SIRT4 KO lung tumors were reconstituted with wild type SIRT4 (Figure S7A). As expected, SIRT4 reconstitution reduced glutamine uptake, but not glucose uptake (Figures 7D and 7E) and repressed proliferation (Figure S7B) of lung tumor cells.

Here, we report that SIRT4 has an important role in cellular metabolic response to DNA damage by regulating mitochondrial glutamine metabolism with important implication for the DDR and tumorigenesis. First, we discovered that DNA damage represses cellular glutamine metabolism (Figure 1). Next, we found that SIRT4 is induced by genotoxic stress (Figure 2) and is required for the repression of mitochondrial glutamine metabolism (Figure 3). This metabolic response contributes to the control of cell cycle progression and the maintenance of genomic integrity in response to DNA damage (Figure 4). Loss of SIRT4 increased glutamine-dependent tumor cell proliferation and tumorigenesis (Figure 5). In mice, SIRT4 loss resulted in spontaneous tumor development (Figure 6). We demonstrate that SIRT4 is induced in normal lung tissue in response to DNA damage where it represses GDH activity. Finally, the glutamine metabolism-genomic fidelity axis is recapitulated in lung tumor cells derived from SIRT4 KO mice via SIRT4 reconstitution (Figure 7). Our studies therefore uncover SIRT4 as a important regulator of cellular metabolic response to DNA damage that coordinates repression of glutamine metabolism, genomic stability and tumor suppression.

The DDR is a highly orchestrated and well-studied signaling response that detects and repairs DNA damage. Upon sensing DNA damage, the ATM/ATR protein kinases are activated to phosphorylate target proteins, leading to cell cycle arrest, DNA repair, transcriptional regulation and initiation of apoptosis (Ciccia and Elledge, 2010Su, 2006). Dysregulation of this pathway is frequently observed in many tumors. Emerging evidence has suggested that cell metabolism also plays key roles downstream of the DDR-induced pathways.


7.8.9 Mitochondrial sirtuins and metabolic homeostasis

Pirinen E1Lo Sasso GAuwerx J.
Best Pract Res Clin Endocrinol Metab. 2012 Dec; 26(6):759-70. http://dx.doi.org:/10.1016/j.beem.2012.05.001

The maintenance of metabolic homeostasis requires the well-orchestrated network of several pathways of glucose, lipid and amino acid metabolism. Mitochondria integrate these pathways and serve not only as the prime site of cellular energy harvesting but also as the producer of many key metabolic intermediates. The sirtuins are a family of NAD+-dependent enzymes, which have a crucial role in the cellular adaptation to metabolic stress. The mitochondrial sirtuins SIRT3, SIRT4 and SIRT5 together with the nuclear SIRT1 regulate several aspects of mitochondrial physiology by controlling posttranslational modifications of mitochondrial protein and transcription of mitochondrial genes. Here we discuss current knowledge how mitochondrial sirtuins and SIRT1 govern mitochondrial processes involved in different metabolic pathways.

Mitochondria are organelles composed of a matrix enclosed by a double (inner and outer) membrane (1). Major cellular functions, such as nutrient oxidation, nitrogen metabolism, and especially ATP production, take place in the mitochondria. ATP production occurs in a process referred to as oxidative phosphorylation (OXPHOS), which involves electron transport through a chain of protein complexes (I-IV), located in the inner mitochondrial membrane. These complexes carry electrons from electron donors (e.g. NADH) to electron acceptors (e.g. oxygen), generating a chemiosmotic gradient between the mitochondrial intermembrane space and matrix. The energy stored in this gradient is then used by ATP synthase to produce ATP (1). One well-known side effect of the OXPHOS process is the production of reactive oxygen species (ROS) that can generate oxidative damage in biological macromolecules (1). However, to neutralize the harmful effects of ROS, cells have several antioxidant enzymes, including superoxide dismutase, catalase, and peroxidases (1). The sirtuin silent information regulator 2 (Sir2), the founding member of the sirtuin protein family, was identified in 1984 (2). Sir2 was subsequently characterized as important in yeast replicative aging (3) and shown to posses NAD+-dependent histone deacetylase activity (4), suggesting it could play a role as an energy sensor. A family of conserved Sir2-related proteins was subsequently identified. Given their involvement in basic cellular processes and their potential contribution to the pathogenesis of several diseases (5), the sirtuins became a widely studied protein family.

In mammals the sirtuin family consists of seven proteins (SIRT1-SIRT7), which show different functions, structure, and localization. SIRT1 is mostly localized in the nucleus but, under specific physiological conditions, it shuttles to the cytosol (6). Similar to SIRT1, also SIRT6 (7) and SIRT7 (8) are localized in the nucleus. On the contrary, SIRT2 is mainly present in the cytosol and shuttles into the nucleus during G2/M cell cycle transition (9). Finally, SIRT3, SIRT4, and SIRT5, are mitochondrial proteins (10).

The main enzymatic activity catalyzed by the sirtuins is NAD+-dependent deacetylation, as known for the progenitor Sir2 (4,11). Along with histones also many transcription factors and enzymes were identified as targets for deacetylation by the sirtuins. Remarkably, mammalian sirtuins show additional interesting enzymatic activities. SIRT4 has an important ADP-ribosyltransferase activity (12), while SIRT6 can both deacetylate and ADP-ribosylate proteins (13,14). Moreover, SIRT5 was recently shown to demalonylate and desuccinylate proteins (15,16), in particular the urea cycle enzyme carbamoyl phosphate synthetase 1 (CPS1) (16). The (patho-)physiological context in which the seven mammalian sirtuins exert their functions, as well as their biochemical characteristics, are extensively discussed in the literature (17,18) and will not be addressed in this review; here we will focus on the emerging roles of the mitochondrial sirtuins, and their involvement in metabolism. Moreover, SIRT1 will be discussed as an important enzyme that indirectly affects mitochondrial physiology.

Sirtuins are regulated at different levels. Their subcellular localization, but also transcriptional regulation, post-translational modifications, and substrate availability, all impact on sirtuin activity. Moreover, nutrients and other molecules could affect directly or indirectly sirtuin activity. As sirtuins are NAD+-dependent enzymes, the availability of NAD+ is perhaps one of the most important mechanisms to regulate their activity. Changes in NAD+ levels occur as the result of modification in both its synthesis or consumption (19). Increase in NAD+ amounts during metabolic stress, as prolonged fasting or caloric restriction (CR) (2022), is well documented and tightly connected with sirtuin activation (4,19). Furthermore, the depletion and or inhibition of poly-ADP-ribose polymerase (PARP) 1 (23) or cADP-ribose synthase 38 (24), two NAD+consuming enzymes, increase SIRT1 action.

Analysis of the SIRT1 promoter region identified several transcription factors involved in up- or down-regulation of SIRT1 expression. FOXO1 (25), peroxisome proliferator-activated receptors (PPAR) α/β (26,27), and cAMP response element-binding (28) induce SIRT1 transcription, while PPARγ (29), hypermethylated in cancer 1 (30), PARP2 (31), and carbohydrate response element-binding protein (28) repress SIRT1 transcription. Of note, SIRT1 is also under the negative control of miRNAs, like miR34a (32) and miR199a (33). Furthermore, the SIRT1 protein contains several phosphorylation sites that are targeted by several kinases (34,35), which may tag the SIRT1 protein so that it only exerts activity towards specific targets (36,37). The beneficial effects driven by the SIRT1 activation – discussed below- led the development of small molecules modulators of SIRT1. Of note, resveratrol, a natural plant polyphenol, was shown to increase SIRT1 activity (38), most likely indirectly (22,39,40), inducing lifespan in a range of species ranging from yeast (38) to high-fat diet fed mice (41). The beneficial effect of SIRT1 activation by resveratrol on lifespan, may involve enhanced mitochondrial function and metabolic control documented both in mice (42) and humans (43). Subsequently, several powerful synthetic SIRT1 agonists have been identified (e.g. SRT1720 (44)), which, analogously to resveratrol, improve mitochondrial function and metabolic diseases (45). The precise mechanism of action of these compounds is still under debate; in fact, it may well be that part of their action is mediated by AMP-activated protein kinase (AMPK) activation (21,22,46), as resveratrol was shown to inhibit ATP synthesis by directly inhibiting ATP synthase in the mitochondrial respiratory chain (47), leading to an energy stress with subsequent activation of AMPK. However, at least in β-cells, resveratrol-mediated SIRT1 activation and AMPK activation seem to regulate glucose response in the opposite direction, pointing to the existence of alternative molecular targets (48).

Another hypothesis to explain the pleitropic effects of resveratrol suggests it inhibits cAMP-degrading phosphodiesterase 4 (PDE4), resulting in the cAMP-dependent activation of exchange proteins activated by cyclic AMP (Epac1) (40). The consequent Epac1-mediated increase of intracellular Ca2+ levels may then activate of CamKKβ-AMPK pathway (40), which ultimately will result in an increase in NAD+ levels and SIRT1 activation (21). Interestingly, also PDE4 inhibitors reproduce some of the metabolic benefits of resveratrol representing yet another putative way to activate SIRT1.

The regulation of the activity of the mitochondrial sirtuins is at present poorly understood. SIRT3 expression is induced in white adipose (WAT) and brown adipose tissues upon CR (49), while it is down-regulated in the liver of high-fat fed mice (50). SIRT3 activity changes also in the muscle after fasting (51) and chronic contraction (52). All these processes are associated with increase (20,53) or decrease (50) in NAD+ levels. From a transcriptional point of view, SIRT3 gene expression in brown adipocytes seems under the control of peroxisome proliferator-activated receptor gamma coactivator-1α (PGC-1α) -estrogen-related receptor α (ERRα) axis, and this effect is crucial for full brown adipocyte differentiation (54,55). SIRT4 expression is reported to be reduced during CR (12), while the impact of resveratrol on SIRT4 is still under debate (56). Finally, upon ethanol exposure, SIRT5 gene expression was shown to be decreased together with the NAD+levels (57), probably explaining the protein hyperacetylation caused by alcohol exposure (58).

Metabolic homeostasis

The maintenance of metabolic homeostasis is critical for the survival of all species to sustain body structure and function. Metabolic homeostasis is achieved through complicated interactions between metabolic pathways that govern glucose, lipid and amino acid metabolism. Mitochondria are organelles, which integrate these metabolic pathways by serving a physical site for the production and recycling of metabolic intermediates.

Glucose metabolism

Overview

Glucose homeostasis is regulated through various complex processes including hepatic glucose output, glucose uptake, glucose utilization and storage. The main hormones regulating glucose homeostasis are insulin and glucagon, and the balance between these hormones determines glucose homeostasis. Insulin promotes glucose uptake in peripheral tissues (muscle and WAT), glycolysis and storage of glucose as glycogen in the fed state, while glucagon stimulates hepatic glucose production during fasting. Sirtuins influence many aspects of glucose homeostasis in several tissues such as muscle, WAT, liver and pancreas.

Gluconeogenesis

The body’s ability to synthesise glucose is vital in order to provide an uninterrupted supply of glucose to the brain and survive during starvation. Gluconeogenesis is a cytosolic process, in which glucose is formed from non-carbohydrate sources, such as amino acids, lactate, the glycerol portion of fats and tricarboxylic acid (59) cycle intermediates, during energy demand. This process, which occurs mainly in liver and kidney, shares some enzymes with glycolysis but it employs phosphoenolpyruvate carboxykinase, fructose-1,6-bisphosphatase and glucose-6-phosphatase to control the flow of metabolites towards glucose production. These three enzymes are stimulated by glucagon, epinephrine and glucocorticoids, whereas their activity is suppressed by insulin.

The role of mitochondrial sirtuins in the control of gluconeogenesis is not well established. SIRT3 is suggested to induce fasting-dependent hepatic glucose production from amino acids by deacetylating and activating the mitochondrial conversion of glutamate into the TCA cycle intermediate α-ketoglutarate, via the enzyme glutamate dehydrogenase (GDH) (Fig. 1A) (60,61). As SIRT3−/− mice do not display changes in GDH activity (62), the mechanism requires further clarification. In contrast to SIRT3, SIRT4 inhibits GDH via ADP-ribosylation under basal dietary conditions (Fig. 1A-B) (12). Conversely, SIRT4 activity is suppressed during CR resulting in activation of GDH, which fuels the TCA cycle and possibly also gluconeogenesis (12). Therefore, mitochondrial sirtuins may function to support gluconeogenesis during energy limitation, but further research is required to understand the exact roles of mitochondrial sirtuins in gluconeogenesis.

Summary of mitochondrial sirtuins’ role in mitochondrial pathways

Summary of mitochondrial sirtuins’ role in mitochondrial pathways

Figure 1 Summary of mitochondrial sirtuins’ role in mitochondrial pathways

http://www.ncbi.nlm.nih.gov/pmc/articles/PMC3621019/bin/emss-52490-f0001.gif

Glucose utilization

 Lipid metabolism

Urea metabolism

The recent discoveries in the biology of mitochondria have shed light on the metabolic regulatory roles of the sirtuin family. To maintain proper metabolic homeostasis, sirtuins sense cellular NAD+ levels, which reflect the nutritional status of the cells, and translate this information to adapt the activity of mitochondrial processes via posttranslational modifications and transcriptional regulation. SIRT1 and SIRT3 function to stimulate proper energy production via FAO and SIRT3 also protects from oxidative stress and ammonia accumulation during nutrient deprivation. SIRT4 seems to play role in the regulation of gluconeogenesis, insulin secretion and fatty acid utilization during times of energy limitation, while SIRT5 detoxifies excess ammonia that can accumulate during fasting. However, we are only at the beginning of our understanding of the roles of the mitochondrial sirtuins, SIRT3, SIRT4 and SIRT5 in complex metabolic processes. In the coming years, further research should identify and verify novel sirtuin targets in vivo and in vitro. We need also to elucidate the regulation and tissue-specific functions of these mitochondrial sirtuins, as well as to understand the potential crosstalk and synchrony between the different sirtuins in different subcellular compartments. Ultimately, the understanding of mitochondrial sirtuin functions may open new possibilities, not only for treatment of cancer and metabolic diseases characterized by mitochondrial dysfunction, but also for disease prevention and health maintenance.

7.8.10 Mitochondrial sirtuins

Huang JY1Hirschey MDShimazu THo LVerdin E.
Biochim Biophys Acta. 2010 Aug; 1804(8):1645-51. http://dx.doi.org:/10.1016/j.bbapap.2009.12.021

Sirtuins have emerged as important proteins in aging, stress resistance and metabolic regulation. Three sirtuins, SIRT3, 4 and 5, are located within the mitochondrial matrix. SIRT3 and SIRT5 are NAD(+)-dependent deacetylases that remove acetyl groups from acetyllysine-modified proteins and yield 2′-O-acetyl-ADP-ribose and nicotinamide. SIRT4 can transfer the ADP-ribose group from NAD(+) onto acceptor proteins. Recent findings reveal that a large fraction of mitochondrial proteins are acetylated and that mitochondrial protein acetylation is modulated by nutritional status. This and the identification of targets for SIRT3, 4 and 5 support the model that mitochondrial sirtuins are metabolic sensors that modulate the activity of metabolic enzymes via protein deacetylation or mono-ADP-ribosylation. Here, we review and discuss recent progress in the study of mitochondrial sirtuins and their targets.

mitochondrial sirtuins

mitochondrial sirtuins

http://www.sciencedirect.com/science/article/pii/S1570963909003902

mitochondrial sirtuins
Fig.1 .NAD+ -dependent deacetylation of sirtuins. The two step catalytic reaction mechanism. In this diagram ADPR = acetyl-ADP-ribose, NAM = nicotinamide, 1-O-AADPR = 1-O-acetyl ADP-ribose and βNAD = beta nicotinamide adenine dinucleotide.

Table 1 Shows subcellular localization, substrates and functions of different types of sirtuins.

Fig.2. Sirt3 regulated pathways in mitochondrial metabolism. Schematic diagram demonstrating the different roles of Sirt3 in the regulation of the main metabolic pathways of mitochondria.In this diagram LCAD = long-chain acyl-CoA dehydrogenase, ACeS2 = acetyl coenzyme synthetase 2, Mn SOD = manganese superoxide dismutase, CypD = cyclophilin D, ICDH2 = isocitrate dehydrogenase 2, OTC = ornithine transcarbomylase,TCA = tricaboxylic acid, ROS = reactive oxygen species, mPTP = membrane permeability transition pore, I–V = respiratory chain complex I–V

Fig. 3.(A) Schematic diagram showing different roles of Sirt4 in the regulation of various metabolic pathways. The diagram shows the Sirt4 regulated decrease in insulin level and the increase in availability of ATP inside mitochondria via upregulation of insulin degrading enzyme (IDE) and adenine translocator (ANT). The diagram also shows the Sirt4 regulated decrease in the efficiency of fatty acid oxidation and tricarboxylic acid cycle (TCA) via inhibition of glutamate dehydrogenase (GDH) and malonyl CoA decarboxylase (MCoAD). (B) Schematic diagram indicating the different roles of Sirt5 in regulation of various metabolic pathways. Sirt5 regulates urea production, fatty acid oxidation, tricarboxylic acid cycle (TCA), glycolysis, reactive oxygen species (ROS) metabolism, purine metabolism via regulating carbamoyl phosphate synthetase (CPS), hydroxyl-coenzyme A dehydrogenase (HADH), pyruvate dehydrogenase (PDH), pyruvate kinase (PK), succinate dehydrogenase(SDH) andurate oxidase (UO) respectively

Conclusion and future perspectives

Sirtuins are highly conserved NAD+-dependent protein deacetylases or ADP ribosyl transferases involved in many cellular processes including genome stability, cell survival, oxidative stress responses, metabolism, and aging. Mitochondrial sirtuins, Sirt3, Sirt4 and Sirt5 are important energy sensors and thus can be regarded as master regulators of mitochondrial metabolism. But it is still not known whether specific sirtuins can only function within particular metabolic pathways or two or more sirtuins could affect the same pathways. One of the mitochondrial sirtuins, Sirt3 is a major mitochondrial deacetylase that plays a pivotal role in the acetylation based regulation of numerous mitochondrial proteins. However, the question how mitochondrial proteins become acetylated is still unsolved and the identity of mitochondrial acetyltransferases is mysterious. Although the predominant function of the sirtuins is NAD+ dependent lysine deacetylation, but along with this major function another less characterized activity of these sirtuins includes ADP ribosylation which is mainly done by Sirt4. Moreover, in the case when the mitochondrial sirtuins exhibit both deacetylase and ADP ribosyl transferase activity, the conditions that determine the relative contribution of both of these activities in same or different metabolic pathways require further investigation. Sirt5 another mitochondrial sirtuin, was a puzzle until the recent finding as it possesses unique demalonylase and desuccinylase activities. However, most of the malonylated or succinylated proteins are important metabolic enzymes but as the significance of lysine malonylation and succinylation is still unknown thus it would be interesting to know how lysine malonylation and succinylation alter the functions of various metabolic enzymes. The mitochondrial sirtuins Sirt3, Sirt4 and Sirt5 serve as critical junctions and are required to exert many of the beneficial effect in mitochondrial metabolism. The emerging multidimensional role of mitochondrial sirtuins in regulation of mitochondrial metabolism and bioenergetics may have far-reaching consequences for many diseases associated with mitochondrial dysfunctions. However it is very important to fully elucidate the functions of mitochondrial sirtuins in different tissues to achieve the goal of therapeutic intervention in different metabolic diseases. Although several proteomic studies have provided detailed information that how mitochondrial sirtuin driven modification takes place on various targets in response to different environmental conditions, still the role of sirtuins in mitochondrial physiology and human diseases requires further exploration. Hopefully the progress in the field of sirtuin biology will soon provide insight into the therapeutic applications for targeting mitochondrial sirtuins by bioactive compounds to treat various human age-related diseases.

References

Ahn B.H.,et al.,2008. A role for the mitochondrial deacetylase Sirt3 in regulating energy homeostasis. Proc. Natl. Acad. Sci. U. S. A. 105 (38), 14447–14452. http://dx.doi.org/10.1073/pnas.0803790105.

Ahuja N.,et al., 2007. Regulation of insulin secretion by SIRT4, a mitochondrial ADP ribosyltransferase. J. Biol. Chem. 282 (46), 33583–33592. http://dx.doi.org/10.1074/jbc.M705488200.

Allison, S.J., Milner, J., 2007. SIRT3 is pro-apoptotic and participates in distinct basal apoptotic pathways. Cell Cycle 6, 2669–2677. http://dx.doi.org/10.4161/cc.6.21.4866.

Ashraf, N., et al., 2006. Altered sirtuin expression is associated with node-positive breast cancer. Br. J. Cancer 95, 1056–1061. http://dx.doi.org/10.1038/sj.bjc.6603384.

Bao, J.,et al.,2010. SIRT3 is regulated by nutrient excess and modulates hepatic susceptibility to lipotoxicity. Free Radic. Biol. Med. 49, 1230–1237.

Beal, M.F., 2005. Less stress, longer life. Nat. Med. 11 (6), 598–599. http://dx.doi.org/10.1038/nm0605-598.

Bell, E.L., Guarente,L., 2011. The SirT3 divining rod points to oxidative stress. Mol.Cell 42 (5), 561–568. http://dx.doi.org/10.1016/j.molcel.2011.05.008
(Review).

Bell,E.L., Emerling,B.M., Ricoult,S.J.H., Guarente,L., 2011. SirT3 suppresses hypoxia inducible factor 1α and tumor growth by inhibiting mitochondrial ROS production. Oncogene 30, 2986–2996. http://dx.doi.org/10.1038/onc.2011.37.

Bellizzi,D.,Rose,G.,Cavalcante,P.,Covello,G.,et al., 2005. A novel VNTR enhancer within the SIRT3 gene, a human homologue of SIR2, is associated with survival at oldest ages. Genomics 85, 258–263.
http://dx.doi.org/10.1016/j.ygeno.2004.11.003.

7.8.11 Sirtuin regulation of mitochondria: energy production, apoptosis, and signaling

Verdin E1Hirschey MDFinley LWHaigis MC.
Trends Biochem Sci. 2010 Dec; 35(12):669-75.
http://dx.doi.org:/10.1016/j.tibs.2010.07.003

Sirtuins are a highly conserved family of proteins whose activity can prolong the lifespan of model organisms such as yeast, worms and flies. Mammals contain seven sirtuins (SIRT1-7) that modulate distinct metabolic and stress response pathways. Three sirtuins, SIRT3, SIRT4 and SIRT5, are located in the mitochondria, dynamic organelles that function as the primary site of oxidative metabolism and play crucial roles in apoptosis and intracellular signaling. Recent findings have shed light on how the mitochondrial sirtuins function in the control of basic mitochondrial biology, including energy production, metabolism, apoptosis and intracellular signaling.

Mitochondria play critical roles in energy production, metabolism, apoptosis, and intracellular signaling [13]. These highly dynamic organelles have the ability to change their function, morphology and number in response to physiological conditions and stressors such as diet, exercise, temperature, and hormones [4]. Proper mitochondrial function is crucial for maintenance of metabolic homeostasis and activation of appropriate stress responses. Not surprisingly, changes in mitochondrial number and activity are implicated in aging and age-related diseases, including diabetes, neurodegenerative diseases, and cancer [1]. Despite the important link between mitochondrial dysfunction and human diseases, in most cases, the molecular causes for dysfunction have not been identified and remain poorly understood.

One of the principal bioenergetic functions of mitochondria is to generate ATP through the process of oxidative phosphorylation (OXPHOS), which occurs in the inner-mitochondrial membrane. Mitochondria are unique bi-membrane organelles that contain their own circular genome (mtDNA) encoding 13 protein subunits involved in electron transport. The remainder of the estimated 1000-1500 mitochondrial proteins are encoded by the nuclear genome and imported into mitochondria from the cytoplasm [56]. These imported proteins can be found either in the matrix, associated with inner or outer mitochondrial membranes or in the inner membrane space (Figure 1). Dozens of nuclear-encoded protein subunits form complexes with the mtDNA-encoded subunits to form electron transport complexes I-IV and ATP synthase, again highlighting the need for precise coordination between these two genomes. The transcriptional coactivator PGC-1α, a master regulator of mitochondrial biogenesis and function, is responsive to a variety of metabolic stresses, ensuring that the number and capacity of mitochondria keeps pace with the energetic demands of tissues [7].

Network of mitochondrial sirtuins

Network of mitochondrial sirtuins

http://www.ncbi.nlm.nih.gov/pmc/articles/instance/2992946/bin/nihms239607f1.gif

Network of mitochondrial sirtuins. Mitochondria can metabolize fuels, such as fatty acids, amino acids, and pyruvate, derived from glucose. Electrons pass through electron transport complexes (I-IV; red) generating a proton gradient, which is used to drive ATP synthase (AS; red) to generate ATP. SIRT3 (gold) binds complexes I and II, regulating cellular energy levels in the cell [4355]. Moreover, SIRT3 binds and deacetylates acetyl-CoA synthetase 2 (AceCS2) [3940] and glutamate dehydrogenase (GDH) [3347], thereby activating their enzymatic activities. SIRT3 also binds and activates long-chain acyl-CoA dehydrogenase (LCAD) [46]. SIRT4 (light purple) binds and represses GDH activity via ADP-ribosylation [21]. In the rate-limiting step of the urea cycle, SIRT5 (light blue) deacetylates and activates carbamoyl phosphate synthetase 1 (CPS1) [4849].

As high-energy electrons derived from glucose, amino acids or fatty acids fuels are passed through a series of protein complexes (I-IV), their energy is used to pump protons from the mitochondrial matrix through the inner membrane into the inner-membrane space, generating a proton gradient known as the mitochondrial membrane potential (Dψm) (Figure 1). Ultimately, the electrons reduce oxygen to form water, and the protons flow down their gradient through ATP synthase, driving the formation of ATP from ADP. Protons can also flow through uncoupling proteins (UCPs), dissipating their potential energy as heat. Reactive oxygen species (ROS) are a normal side-product of the respiration process [18]. In addition, an increase in Dψm, whether caused by impaired OXPHOS or by an overabundance of nutrients relative to ADP, will result in aberrant electron migration in the electron transport chain and elevated ROS production [1]. ROS react with lipids, protein and DNA, generating oxidative damage. Consequently, cells have evolved robust mechanisms to guard against an increase in oxidative stress accompanying ROS production [9].

Mitochondria are the primary site of ROS production within the cell, and increased oxidative stress is proposed to be one of the causes of mammalian aging [1210]. Major mitochondrial age-related changes are observed in multiple tissues and include decreased Dψm, increased ROS production and an increase in oxidative damage to mtDNA, proteins, and lipids [1114]. As a result, mitochondrial bioenergetic changes that occur with aging have been extensively reviewed [1517].

Silent information regulator (SIR) 2 protein and its orthologs in other species, termed sirtuins, promote an increased lifespan in model organisms such as yeast, worms and flies. Mammals contain seven sirtuins (SIRT1–7) that are characterized by an evolutionary conserved sirtuin core domain [1819]. This domain contains the catalytic activity and invariant amino acid residues involved in binding NAD+, a metabolic co-substrate. All sirtuins exhibit two major enzymatic activities in vitro: NAD+-dependent protein deacetylase activity and ADP-ribosyltransferase activity. Except for SIRT4, well-defined acetylated substrates have been identified for the other sirtuins. So far, only ADP-ribosyltransferase activity has been described for SIRT4 [2021]. Thus, these enzymes couple their biochemical and biological functions to an organism’s energetic state via their dependency on NAD+. A decade of research, largely focused on SIRT1, has revealed that mammalian sirtuins regulate metabolism and cellular survival. In brief, SIRT1–7 target distinct acetylated protein substrates and are localized in distinct subcellular compartments. SIRT1, SIRT6 and SIRT7 are found in nucleus, SIRT2 is primarily cytosolic and SIRT3, 4 and 5 are found in the mitochondria. The mitochondrial-only localization of SIRT3 is controversial and other groups have reported non-mitochondrial localization of this sirtuin [2223]. The biology and biochemistry of the seven mammalian sirtuins have been extensively discussed in the literature [2426] and is not the topic of this review. Instead, we focus on the mitochondrial sirtuins, their substrates, and their impact on mitochondrial biology.

The mitochondrial sirtuins, SIRT3–5 [212729], participate in the regulation of ATP production, metabolism, apoptosis and cell signaling. Unlike SIRT1, a 100 kDa protein, the mitochondrial sirtuins are small, ranging from 30–40 kDa. Thus, their amino acid sequence consists mostly of an N-terminal mitochondrial targeting sequence and the sirtuin core domain, with small flanking regions. Whereas, SIRT3 and SIRT5 function as NAD+-dependent deacetylases on well defined substrates, SIRT4 has no identified acetylated substrate and only shows ADP-ribosyltransferase activity. It is likely, however, that SIRT4 possesses substrate-specific NAD+-dependent deacetylase activity, as has been demonstrated for SIRT6 [30,31]. The three-dimensional structures for the core domains of human SIRT3 and human SIRT5 have been solved and reveal remarkable structural conservation with other sirtuins, such as the ancestral yeast protein and human SIRT2 (Figure 2) [3234]. Given its sequence conservation with the other sirtuins [18], it is likely that SIRT4 adopts a similar three-dimensional conformation.

Figure 2 Structure and alignment of sirtuins

Role of mitochondrial sirtuins in metabolism and energy production

The NAD+ dependence of sirtuins provided the first clue that these enzymes function as metabolic sensors. For instance, sirtuin activity can increase when NAD+ levels are abundant, such as times of nutrient deprivation. In line with this model, mass spectrometry studies have revealed that metabolic proteins, such as tricarboxylic acid (TCA) cycle enzymes, fatty acid oxidation enzymes and subunits of oxidative phosphorylation complexes are acetylated in response to metabolic stress [3537].

Fatty acid oxidation

Consistent with the hypothesis that nutrient stress alters sirtuin activity, a recent report identified significant metabolic abnormalities in Sirt3-/- mice during fasting [38]. In this study, hepatic SIRT3 protein expression increased during fasting, suggesting that both its levels and enzymatic activity are elevated during nutrient deprivation. SIRT3 activates hepatic lipid catabolism via deacetylation of long-chain acyl-CoA dehydrogenase (LCAD), a central enzyme in the fatty acid oxidation pathway. Sirt3-/- mice have diminished fatty acid oxidation, develop fatty liver, have low ATP production, and show a defect in thermogenesis and hypoglycemia during a cold test [38].

Surprisingly, many of the phenotypes observed in Sirt3-/- mice were also observed in mice lacking acetyl-CoA synthetase 2 (AceCS2), a previously identified substrate of SIRT3 [3940]. For example, fasting ATP levels were reduced by 50% in skeletal muscle of AceCS2-/- mice, in comparison to wild type (WT) mice. As a result, fasted AceCS2-/- mice were hypothermic and had reduced capacity for exercise. By converting acetate into acetyl CoA, AceCS2 provides an alternate energy source during times of metabolic challenges, such as thermogenesis or fasting. Interestingly, Acadl-deficient mice (Acadl encodes LCAD) also show cold intolerance, reduced ATP, and hypoglycemia under fasting conditions [41]. These overlapping phenotypes between Sirt3-/-AceCS2-/- and Acadl-/- mice indicate that the regulation of LCAD and AceCS2 acetylation by SIRT3 represents an important adaptive signal during the fasting response (Figure 2).

Electron transport chain

Of all mitochondrial proteins, oxidative phosphorylation complexes are among the most heavily acetylated. One study reported that 511 lysine residues in complexes I-IV and ATP synthase are modified by acetylation [37], hinting that a mitochondrial sirtuin might deacetylate these residues. Indeed, SIRT3 interacts with and deacetylates complex I subunits (including NDUFA9) [42], succinate dehydrogenase (complex II) [43]. SIRT3 has also been shown to bind ATP synthase in a proteomic analysis [44]. SIRT3 also regulates mitochondrial translation, a process which can impact electron transport [45]. Mice lacking SIRT3 demonstrate reduced ATP levels in many tissues [42 46]; however, additional work is required to determine if reduced ATP levels in Sirt3-/- mice is a direct result of OX PHOS hyperacetylation or an indirect effect, via decreased fatty acid oxidation, or a combination of both effects.

Less is known about the roles of SIRT4 and SIRT5 in electron transport. SIRT4 binds adenine nucleotide translocator (ANT), which transports ATP into the cytosol and ADP into the mitochondrial matrix, thereby providing a substrate for ATP synthase [20]. SIRT5 physically interacts with cytochrome C. The biological significance of these interactions, however, remains unknown [21].

TCA cycle

Enzymes for the TCA cycle (also called the Kreb’s cycle) are located in the mitochondrial matrix; this compartmentalization provides a way for cells to utilize metabolites from carbohydrates, fats and proteins. Numerous TCA cycle enzymes are modified by acetylation, although the functional consequences of acetylation have been examined for only a few of these proteins. SIRT3 interacts with several TCA cycle enzymes, including succinate dehydrogenase (SDH, see above [43]) and isocitrate dehydrogenase 2 (ICDH2) [33]. ICDH2 catalyzes the irreversible oxidative decarboxylation of isocitrate to form alpha-ketoglutarate and CO2, while converting NAD+ to NADH. Although the biological significance of these interactions is not yet known, it seems possible that SIRT3 might regulate flux through the TCA cycle.

Role of mitochondrial sirtuins in signaling

During cellular stress or damage, mitochondria release a variety of signals to the cytosol and the nucleus to alert the cell of changes in mitochondrial function. In response, the nucleus generates transcriptional changes to activate a stress response or repair the damage. For example, mitochondrial biogenesis requires a sophisticated transcriptional program capable of responding to the energetic demands of the cell by coordinating expression of both nuclear and mitochondrial encoded genes [4]. Unlike anterograde transcriptional control of mitochondria from nuclear transcription regulators such as PGC-1α, the retrograde signaling pathway, from the mitochondria to the nucleus is poorly understood in mammals. Although there is no evidence directly linking sirtuins to a mammalian retrograde signaling pathway, changes in mitochondrial sirtuin activity could influence signals transmitted from the mitochondria. Interestingly, the nuclear sirtuin SIRT1 deacetylates and activates PGC-1α, a key factor in the transcriptional regulation of genes involved in fatty acid oxidation and oxidative phosphorylation (Figure 3) [5051]. Thus, mitochondrial and nuclear sirtuins might exist in a signaling communication loop to control metabolism.

mitochondria-at-nexus-of-cellular-signaling-nihms239607f3

mitochondria-at-nexus-of-cellular-signaling-nihms239607f3

http://www.ncbi.nlm.nih.gov/pmc/articles/instance/2992946/bin/nihms239607f3.gif

Mitochondria at nexus of cellular signaling. Mitochondria and mitochondrial sirtuins play a central role in intra- and extra-cellular signaling. Circulating fatty acids and acetate provide whole body energy homeostasis. The mitochondrial metabolites NAD+, NADH, ATP, Ca2+, ROS, ketone bodies, and acetyl-CoA participate in intracellular signaling.

Numerous signaling pathways are activated by changes in mitochondrial release of metabolites and molecules, such as Ca2+, ATP, NAD+, NADH, nitric oxide (NO), and ROS (Figure 3). Of these, Ca2+ is the best studied as a mitochondrial messenger. Mitochondria are important regulators of Ca2+ storage and homeostasis, and mitochondrial Ca2+ uptake is directly tied to the membrane potential of the organelle. Membrane potential serves as a gauge of mitochondrial function: disruption of OXPHOS, interruption in the supply or catabolism of nutrients or loss of structural integrity generally result in a fall in membrane potential, and, in turn, decreased mitochondrial Ca2+ uptake. Subsequent increases in cytosolic free Ca2+ will activate calcineurin and several Ca2+-dependent kinases [52] and affect a wide variety of transcription factors to produce appropriate cell-specific transcriptional responses [53]. Through regulation of nutrient oxidation and electron transport or yet to be identified target(s), mitochondrial sirtuins could influence mAlthough the effect of sirtuins on intracellular calcium signaling has not been studied directly, sirtuin effects on ATP production have been shown. ANT facilitates the exchange of mitochondrial ATP with cytosolic ADP. As a result the cytosolic ATP:ADP ratio reflects changes in mitochondrial energy production. A fall in ATP production activates AMP-activated protein kinase (AMPK), which directly stimulates mitochondrial energy production, inhibits protein synthesis through regulation of mammalian target of rapamycin (mTOR), and influences mitochondrial transcriptional programs [54]. SIRT3 regulates ATP levels in a variety of tissues, suggesting that its activity could have an important role in ATP-mediated retrograde signaling [46,55]. Indeed, recent studies have shown that SIRT3 regulates AMPK activation [5658]. Furthermore, SIRT4 interacts with ANT [20], raising the possibility that SIRT4 activity also influences the ATP:ADP ratio or membrane potential and modulates important mitochondrial signals.

NAD+ and NADH levels are intimately connected with mitochondrial energy production and regulate mitochondrial sirtuin activity. Unlike NAD+, however, NADH is not a sirtuin co-substrate. Indeed, changes in the NAD+:NADH ratio can change the redox state of the cell and alter the activity of enzymes such as poly-ADP-ribose polymerases and sirtuins, with subsequent effects on signaling cascades and gene expression [5961]. Changes in mitochondrial sirtuin activity could change the balance of these metabolites within the mitochondria. For example, fatty acid oxidation reduces NAD+ to NADH, which is oxidized back to NAD+ by OXPHOS. However, it is unclear whether changes in NAD+/NADH can be transmitted outside the organelle. The inner mitochondrial membrane is impermeable to NAD+ and NADH; however, the mitochondrial malate-aspartate shuttle could transfer reducing equivalents across the mitochondrial membranes.

Mitochondrial sirtuin control of apoptosis

Apoptosis is a cellular process of programmed cell death. Mitochondria play an important role in apoptosis by the activation of mitochondrial outer membrane permeabilization, which represents the irrevocable point of no return in committing a cell to death. Outer membrane permeabilization leads to the release of caspase-activating molecules, caspase-independent death effectors, and disruption of ATP production. Despite the central role for mitochondria in the control of apoptosis, surprisingly little is known about how mitochondrial sirtuins participate in apoptotic programs. SIRT3 plays a pro-apoptotic role in both BCL2-53- and JNK-regulated apoptosis [63]. Additionally, cells lacking SIRT3 show decreased stress-induced apoptosis, lending further support for a pro-apoptotic role for SIRT3 [62]. Furthermore, recent work points to a tumor suppressive role for SIRT3: SIRT3 levels are decreased in human breast cancers and Sirt3 null mice develop mammary tumors after 12 months [62]. The mechanism for the tumor suppressive function of SIRT3 is incompletely understood, but involves repression of ROS and protection against DNA damage [62]. In conflicting studies, SIRT3 has been shown to be anti-apoptotic. For example, in the cellular response to DNA damage when mitochondrial NAD+ levels fall below critical levels, SIRT3 and SIRT4 display anti-apoptotic activity, protecting cells from death [64]. SIRT3 has also been shown to be cardioprotective, in part by activation of ROS clearance genes [65]. In future studies, it will be important to elucidate the balance achieved by SIRT3 between stress resistance (anti-apoptosis) and tumor suppression (pro-apoptosis). Additionally, the role of SIRT4 and SIRT5 in regulating metabolism suggests that these mitochondrial sirtuins could also contribute to apoptosis in tumor suppressive or stress resistant manners.

Concluding remarks

An elegant coordination of metabolism by mitochondrial sirtuins is emerging where SIRT3, SIRT4 and SIRT5 serve at critical junctions in mitochondrial metabolism by acting as switches to facilitate energy production during nutrient adaptation and stress. Rather than satisfy, these studies lead to more questions. How important are changes in global mitochondrial acetylation to mitochondrial biology and is acetylation status a readout for sirtuin activity? What are other substrates for SIRT4 and SIRT5? What molecular factors dictate substrate specificity for mitochondrial sirtuins? Moreover, further studies will provide insight into the therapeutic applications for targeting mitochondrial sirtuins to treat human diseases. It is clear that many discoveries have yet to be made in this exciting area of biology.

Body of review in energetic metabolic pathways in malignant T cells

Antigen stimulation of T cell receptor (TCR) signaling to nuclear factor (NF)-B is required for T cell proliferation and differentiation of effector cells.
The TCR-to-NF-B pathway is generally viewed as a linear sequence of events in which TCR engagement triggers a cytoplasmic cascade of protein-protein interactions and post-translational modifications, ultimately culminating in the nuclear translocation of NF-B.
Activation of effect or T cells leads to increased glucose uptake, glycolysis, and lipid synthesis to support growth and proliferation.
Activated T cells were identified with CD7, CD5, CD3, CD2, CD4, CD8 and CD45RO. Simultaneously, the expression of CD95 and its ligand causes apoptotic cells death by paracrine or autocrine mechanism, and during inflammation, IL1-β and interferon-1α. The receptor glucose, Glut 1, is expressed at a low level in naive T cells, and rapidly induced by Myc following T cell receptor (TCR) activation. Glut1 trafficking is also highly regulated, with Glut1 protein remaining in intracellular vesicles until T cell activation.

Dr. Aurel,
Targu Jiu

  1. sjwilliamspa

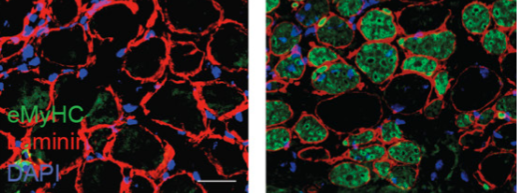
    Wouldn’t then the preferred target be mTORC instead of Sirtuins if mTORC represses Sirtuin activity?

  2. The answer may not be so simple, perhaps a conundrum.

    In conflicting studies, SIRT3 has been shown to be anti-apoptotic. For example, in the cellular response to DNA damage when mitochondrial NAD+ levels fall below critical levels, SIRT3 and SIRT4 display anti-apoptotic activity, protecting cells from death [64].

    For anti-cancer activity, apoptosis is a desired effect. This reminds me of the problem 15 years ago with the drug that would be effective against sepsis, the best paper of the year in NEJM. It failed.

    We tend to not appeciate the intricacies of biological interactions and fail to see bypass reactions. Pleotropy comes up again and again. The seminal work from Britton Chances lab on the NAD+/NADH ratio have been overlooked.

Read Full Post »

Mitochondrial Pyridine Nucleotides and Electron Transport Chain

Larry H Bernstein, MD, FCAP, writer and curator

http://pharmaceuticalinnovation.com/2015/04/03/larryhbern/Mitochondrial_Pyridine_Nucleotides_and_Electron_Transport_Chain

2.1.5 Mitochondrial Pyridine Nucleotides and Electron Transport Chain

2.1.5.1 Mitochondrial function in vivo evaluated by NADH fluorescence

Mayevsky A1, Rogatsky GG.
Am J Physiol Cell Physiol. 2007 Feb; 292(2):C615-40
http://dx.doi.org:/10.1152/ajpcell.00249.2006

Normal mitochondrial function is a critical factor in maintaining cellular homeostasis in various organs of the body. Due to the involvement of mitochondrial dysfunction in many pathological states, the real-time in vivo monitoring of the mitochondrial metabolic state is crucially important. This type of monitoring in animal models as well as in patients provides real-time data that can help interpret experimental results or optimize patient treatment. The goals of the present review are the following: 1) to provide an historical overview of NADH fluorescence monitoring and its physiological significance; 2) to present the solid scientific ground underlying NADH fluorescence measurements based on published materials; 3) to provide the reader with basic information on the methodologies used in the past and the current state of the art fluorometers; and 4) to clarify the various factors affecting monitored signals, including artifacts. The large numbers of publications by different groups testify to the valuable information gathered in various experimental conditions. The monitoring of NADH levels in the tissue provides the most important information on the metabolic state of the mitochondria in terms of energy production and intracellular oxygen levels. Although NADH signals are not calibrated in absolute units, their trend monitoring is important for the interpretation of physiological or pathological situations. To understand tissue function better, the multiparametric approach has been developed where NADH serves as the key parameter. The development of new light sources in UV and visible spectra has led to the development of small compact units applicable in clinical conditions for better diagnosis of patients.

UNDERSTANDING THE MITOCHONDRIAL function has been a challenge for many investigators, including cytologists, biochemists, and physiologists, since its discovery more than 120 years ago. In addition to many books regarding the mitochondria, Ernster and Schatz (79) reviewed the history of mitochondrial structure and function studies. In the past two decades, several studies have reported mitochondrial involvement in pathological processes such as stroke (225) or cytoprotection (77). Most of the information on the mitochondrial function has been accumulated from in vitro studies. A relatively small portion of published papers dealt with the monitoring of mitochondrial function in vivo and in real time. Presently, examination of the involvement of the mitochondrial function in many pathological states, such as sepsis, requires monitoring of patients treated in intensive care units. Unfortunately, real-time monitoring of the mitochondrial function in patients has rarely been performed. The current study presents a review of this issue. To evaluate the activity of the respiratory chain in vivo, it is possible to monitor the mitochondrial NADH, FAD, or the cytochrome oxidase oxidation-reduction state. The interference of blood with the monitoring of FAD and cytochrome oxidase is much higher than with NADH (48); therefore, we invest our effort into the monitoring of the mitochondrial NADH redox state. We do not know of any publication showing clearly that Fp fluorescence could be monitored in vivo in blood-perfused organs. In our preliminary report, we showed that in specific brain areas, one can see the fluorescence of Fp but we were not sure how to validate the results. During the past 33 years, we have published >140 papers in this very significant area, including the largest number of studies using NADH redox state monitoring in patients.

Since the discovery of pyridine nucleotides by Harden and Young (94), >1,000 papers have been published on the use of NADH (Fig. 1A) as a marker for mitochondrial function. In 2000, Schleffler et al. (217) reviewed mitochondrial research methods over the past century. A major aspect of mitochondrial function, namely monitoring the energy state of tissues in vivo, was not discussed in that review. Therefore, the present review will summarize 50 years of research, started in 1955 by Chance and Williams (5657), by defining the mitochondrial metabolic state in vitro. To understand mitochondrial function in vivo and under various pathophysiological conditions, it is important to monitor the redox state of the respiratory chain in real time. The present review will discuss the monitoring principles for one of the electron carriers, namely, nicotinamide adenine dinucleotide (NADH). It is well known that mitochondrial dysfunction is involved in many diseases, such as ischemia, hypoxemia, Parkinson’s disease, Alzheimer’s disease, and in the apoptotic process. Therefore, the possibility of monitoring the mitochondrial NADH redox state in experimental animals and patients is of great importance.

inter-conversion of NAD+ and NADH & difference in the absorption spectra of NAD+ and NADH

inter-conversion of NAD+ and NADH & difference in the absorption spectra of NAD+ and NADH

http://dtch1d7nhw92g.cloudfront.net/content/292/2/C615/F1.medium.gif

Fig. 1. A: molecular structure of NAD+ and the inter-conversion of NAD+ and NADH. B: difference in the absorption spectra of NAD+ and NADH. C: emission spectra of brain NADH excited by 366 nm light (A1, A2, B1, B2, C1) or 324 nm laser light (C2). C1 and C2 show measurements from a dead brain, for comparison of NADH spectra using two different light sources.

To assess the energy demand, it is necessary to measure different organ-specific parameters. In the brain, the energy demand can be evaluated by measuring the extracellular levels of K+ that reflect the activity of the major ATP consumer: Na+-K+-ATPase (152161). In the heart, most of the energy is consumed by the muscle contraction activity. On the other hand, the energy supply mechanism is the same in all tissues: oxygenated blood reaching the capillary bed releases O2that diffuses into the cells. Therefore, it is possible to evaluate tissue energy supply by monitoring the same four different parameters in all tissues.

The main function of the mitochondria is to convert the potential energy stored in various substrates (e.g., glucose) into ATP. The inner membrane of the mitochondria contains 5 complexes of integral membrane proteins, including NADH dehydrogenase (complex 1). Three of those proteins are involved in the respiratory chain activity. The main function of the respiratory chain is to gradually transfer electrons from NADH and FADH2 (originating from the TCA cycle) to O2. With the addition of protons (H+), H2O is generated in complex 4. NADH (Fig. 1Aright side) is a substrate or a coenzyme for the enzymatic activity of dehydrogenases that form part of the respiratory chain and reside in the inner membrane of the mitochondria.

Spectroscopic Monitoring of NADH: An Historical Overview

The discovery of the optical properties of reduced nicotinamide adenine dinucleotide (NADH; previously known as diphosphopyridine nucleotide or pyridine nucleotide) has led to a very intensive research since the early 1950s. The reduced form of this molecule, NADH, absorbs light at 320–380 nm (Fig. 1B) and emits fluorescent light at the 420–480 nm range (Fig. 1C).

Because the oxidized form NAD+ does not absorb light in this range, it was possible to evaluate the redox state of the mitochondria by monitoring the UV absorbance (see Monitoring UV absorbance by NADH) or blue fluorescence of NADH (see Monitoring NADH fluorescence).

Undoubtedly, the pioneering work of Britton Chance of the Johnson Research Foundation at the University of Pennsylvania in Philadelphia led to the establishment and development of the unique measurement technology and theoretical conceptualization of the mitochondrial function based on NADH redox state monitoring in vitro as well as in vivo.

The foundations for future NADH monitoring in vitro and in vivo were established mainly in the 1950s; thus this period will be discussed in this section.

Monitoring of NADH UV absorbance

In 1951, Theorell and Bonnichsen found a shift in the absorption spectrum of DPNH upon addition of alcohol dehydrogenase (238). In the same year, Theorell and Chance described a new spectrophotometric technique for measuring the formation and disappearance of the compound of alcohol dehydrogenase and NADH (239). In 1952, Chance showed the applicability of this new technique to the measurements of pyridine nucleotide enzymes of muscle homogenate or intact cells (25). In 1954, Chance and Williams briefly described new sensitive differential spectrophotometric methods applied to the study of reduced NADH in isolated rat liver mitochondria and the same approach was used by Connelly and Chance (61) in monitoring NADH in stimulated frog nerve and muscle preparations. The oxidation of NADH in the muscle was similar to its oxidation in isolated mitochondria upon addition of ADP. In a comprehensive paper, “Enzyme mechanisms in living cells,” Chance described in detail the measurements of the respiratory enzymes, including NADH (26).

A major milestone in NADH monitoring was the technique presented in 1954 by Chance (27) using a double beam spectrophotometer to determine the appropriate wavelengths in measurements of respiratory enzymes.

The detailed descriptions of the respiratory chain and oxidative phosphorylation in the mitochondria (published in 1955 by Chance and Williams) established our basic knowledge of the mitochondrial function (57). Chance and Williams defined, for the first time, the metabolic states of isolated mitochondria in vitro, depending on the substrate, oxygen, and ADP levels. In addition, they correlated those metabolic states to the oxidation-reduction levels of the respiratory enzymes. The physiological significance of those metabolic states was discussed in 1956 by Chance and Williams (58).

Monitoring NADH fluorescence

The fact that NADH was monitored by the difference in the absorption spectrum of its reduced form, limited the use of that technique to the study of mitochondria in vitro, and in very thin tissue samples (e.g., muscle) or in cell suspension. To provide a method more specific than absorption spectroscopy, fluorescence spectrophotometry in the near-ultraviolet range was applied for NADH measurement. The initial model of fluorescence recorder was described by Theorell and Nygaard in 1954 (240). The first detailed study using fluorescence spectrophotometry of NADH in intact Baker’s yeast cells and algae cells was published in 1957 by Duysens and Amesz (75).

In the next 5 years (1958–1962), the monitoring of NADH fluorescence was significantly expanded, led by Chance and collaborators. In a first preliminary study, Chance et al. (37) performed simultaneous fluorometric and spectrophotometric measurements of the reaction kinetics of bound pyridine nucleotides (PN) in the mitochondria. In the same year (1958), Chance and Baltscheffsky presented preliminary results of measuring the fluorescence of intramitochondrial PN (34). In this study, they proved the connection between the mitochondrial metabolic state and the redox state of NADH as measured by spectral fluorometry in mitochondria isolated from rat liver (57). The correlation between the enzymatic assay of PN and sensitive spectrophotometry was investigated by Klingeberger et al. (120) by using the rat liver, heart, kidney, and brain.

In 1959, Chance and collaborators were able to expand the use of NADH fluorometry to various experimental models, from isolated mitochondria to intact tissue. To monitor NADH localization in intact cells, Chance and Legallais (42) developed a unique differential microfluorimeter with a very high spatial resolution. This approach was used in various cells to identify the intracellular localization of NADH fluorescence signals (54201). The next step was to apply the fluorometric technique to the higher organization level of animal tissues. Together with Jobsis, Chance measured in vitro changes in muscle NADH fluorescence following stimulation (41). In another paper published by Chance and Theorell (55) the authors came to the very significant conclusion that “The oxidation and reduction state of mitochondrial pyridine nucleotide without a measurable change of cytoplasmic fluorescence suggest that compartmentalization of mitochondrial and cytoplasmic pyridine nucleotide occurs in vivo, at least in the grasshopper spermatid.”

An intensive use of the in vivo NADH monitoring approach started in 1962. The “classic” paper on in vivo monitoring of NADH was published in 1962 by Chance et al. (36). They were able to simultaneously monitor the brain and kidney of anesthetized rats using two microfluorometers. In 1962, Chance and collaborators elaborated on this kind of in vivo monitoring and used it in other rat organs (4350).

Scientific Background And Technological Aspects

The absorption and fluorescence spectra of NADH (the reduced form) have been well characterized at different levels of organization, i.e., in solution, mitochondria and cell suspensions, tissue slices, and organs in vitro and in vivo. NADH has an optical absorption band at about 300 to 380 nm and a fluorescence emission band at 420 to 480 nm (Fig. 1B and C). The spectra are considered the same, although there are small differences in the shape and maxima of the spectra for different environments and measurement conditions. However, there is a universal agreement that the intensity of the fluorescence band, independent of the organization level of the environment, is proportional to the concentration of mitochondrial NADH (the reduced form), particularly when measured in vivo from a tissue.

The biochemical and physiological significance of these spectral qualities is also universally accepted, that is, an increase in the fluorescence intensity indicates a more reduced state of NADH and of the rest of the mitochondrial electron transfer chain. Under various circumstances, changes in the redox state of the electron transport chain can be associated with various conditions.

To monitor NADH fluorescence, it is possible to use one of the two principles available. At the early stage, it was necessary to measure and identify the fluorescence spectrum of NADH. Fluorescence spectra were compared in different in vitro and in vivo preparations. In parallel, the second approach was adopted, namely, measuring the total fluorescence signal accumulated and integrated into a single intensity using appropriate filters. This approach was necessary to measure NADH fluorescence continuously. The following parts of this section describe the fluorescence spectra of NADH measured in various in vitro and in vivo models by different investigators. We present this review of the reported spectra to describe the foundations for the second monitoring approach, namely, the continuous monitoring of integrated spectra.

Fluorescence Emission Spectra of NADH

NADH in solution.

Several investigators have measured NADH fluorescence in solution. Very recently, Alfano’s group (62) performed a calibration test of pure β-NADH in solution, compared it to porcine myocutaneous flap, and found a very significant correlation. The NADH solution spectrum and mitochondrial spectrum were also compared by Chance and Baltscheffsky (34).

Similar spectra of NADH in solution were recorded by Schomacker et al. (219) using 337-nm excitation light for colonic tissue diagnosis.

NADH spectra in isolated mitochondria.

The excitation and emission spectra of NADH (PN) and flavoprotein were measured in frozen samples of pigeon heart mitochondria (52). Using rat liver mitochondria, Chance and Baltscheffsky (34) measured the fluorescence spectra in the three metabolic states defined by Chance and Williams (58). The 330-nm light excitation resulted in a fluorescence peak at 440–450 nm. The same kind of spectra was obtained by other investigators using different fluorometers or mitochondria isolated from various organs. Galeotti et al. (87) measured similar spectra from rat liver mitochondria. Using Rhodamine B as an internal standard for system calibration, Koretsky and Balaban (125) found the same spectra emitted from isolated rat liver mitochondria. Koretsky et al. (126) compared the emitted spectrum from heart homogenates (similar to isolated mitochondria) with that of dissolved heart homogenates (126).

Intact cells.

The use of microfluorimetry to study intact cell metabolism was described in several publications by Kohen and collaborators (see, for example, Ref. 123).

The typical NADH fluorescence spectrum was measured in suspension of ascite tumor cells (87). This study demonstrated that the spectrum of intact cells was similar to that of NADH solution.

Using isolated myocytes, Eng et al. (78) compared the spectra measured under various conditions of the mitochondria. They found that cyanide induced an increase in the spectrum difference, whereas FCCP, used as a typical uncoupler of oxidative phosphorylation, produced a marked decrease in the spectrum.

….

Principles of NADH monitoring.

As described in the introductory section, NADH can be measured by utilizing its absorption spectrum in the UV range, as well as by the blue fluorescence spectrum under UV illumination. In the early stages, NADH monitoring was based on the difference in the absorption of NADH and NAD+. At the range of 320 to 380 nm, only the reduced form; NADH absorbs light, while NAD+does not (Fig. 1B). Therefore, when a mixture of NADH and NAD+ is illuminated in a cuvette by 320–380 nm, only NADH will affect the absorption spectrum peak at 340 nm. This property of NADH was used in the early 1950s by several investigators, as reviewed in Spectroscopic Monitoring of NADH–Historical Overview. Chance and collaborators utilized this technique to measure NADH in muscle homogenates or intact cells (25) and published many papers concerning the unique absorption spectrum of NADH.

The absorption approach is not practical for measuring NADH in a thick tissue; hence, another property of NADH was used. Since the early 1950s, fluorescence spectrophotometry of NADH has been employed in various in vitro and in vivo models. The emission of NADH fluorescence, under illumination at 320–380 nm, has a very wide spectrum (420–480) with a peak at 450–460 nm (Fig. 1C). NADH fluorescence has been identified by Chance and his collaborators as a good indicator of the intramitochondrial oxidation-reduction state (48).

The review article on in vivo NADH fluorescence monitoring, published in 1992 by Ince et al. (102) included many other technical aspects of the methodology. Nevertheless, here we will elaborate on the historical development of the various models of NADH fluorometers. We recently (155) reported on a new type of NADH fluorometer based on a very small and stable UV light source: a 375-nm light-emitting diode.

….

In 1959, Chance and Legallais (42) described a differential fluorometer that heralded a new era in monitoring NADH fluorescence in vivo as an indicator of mitochondrial function. They used a microscope, serving as the fluorometer basis, with two light sources: tungsten and mercury lamps with appropriate filters. In 1959, Chance and Jobsis (41) proved that mechanical muscle activity is associated with NADH oxidation measured in excised muscle. This study was the bridge from the subcellular (mitochondria) and cellular (intact cell) monitoring approaches toward actual in vivo applications.

The first in vivo NADH monitoring device was presented in the early 1960s. At that stage, the effects of scattered light and tissue absorption due to blood were not taken into consideration when monitoring NADH fluorescence. The first detailed results of in vivo NADH fluorescence measurements were published in 1962 (36).

These classic papers described two microfluorometers that were modifications of previous designs (4254). This microfluorimeter type employed Leitz “Ultrapack” illumination, which had been used for many years by various groups until the appearance of UV transmitting optical fibers. To avoid movement artifacts, rats were anesthetized deeply and their heads were fixated in a special holder attached to the operation table. Numerous studies utilized the principles of the “Ultrapack” illumination system. The same instrumentation was used in other in vivo studies, including those of Chance’s group (38434459), Dora and Kovach’s group (7192), Rievich’s group (93), Jobsis and collaborators (108110111213), Gosalvez et al. (89), and Anderson and Sundt (5232). This is only a partial list.

Monitoring NADH fluorescence and reflectance.

The effect of blood on NADH fluorescence was discussed early by Chance et al. (36). To monitor NADH in vivo, Chance’s group had to avoid areas containing large blood vessels, which interfere with the emission and excitation light. The monitoring of a second channel in tissue fluorometry in vivo was reported by Chance and Legallais in 1963 (44). They showed that “changes due to the deoxygenation of oxyhemaglobin do not interfere with measurement of the time course of fluorescence changes in the tissue studies.”

The addition of a second monitoring signal, namely, tissue reflectance at the excitation wavelength was reported in 1968 by Jobsis and Stansby (112). It was based on a previous model described by Jobsis et al. in 1966 (107). In two more papers by Jobsis and collaborators (110,111), the measurement of 366-nm reflectance was used for the correction of the NADH fluorescence signal from the brain. The reflectance signal was subtracted from the fluorescence signal. The same type of instrumentation was used by various groups for the measurement of NADH in single cells (124) or in vitro preparations (1319).

Fiber optic fluorometer/reflectometer.

To enable the monitoring of NADH fluorescence in unanesthetized animals or other in vivo preparations, a flexible means was needed to connect the fluorometer with the tested organ, for example the brain. This was achieved in 1972, when UV transmitting quartz fibers became available (Schott Jena Glass). We have used the light guide-based fluorometer for in vivo monitoring of the brain (48157) subjected to anoxia or cortical spreading depression. The historical development of light guide-based fluorometery-reflectometry is shown in Fig. 2. The original device functioned on the time-sharing principle (Fig. 2A), where four filters were placed in front of a two-arms light guide. Filters 1 and 3 enabled the measurement of NADH fluorescence, while filters 2 and 4 were used to measure tissue reflectance at the excitation wavelength. The reflectance trace was used to correct the NADH signal for hemodynamic artifacts, and to indicate changes in the blood volume of the sampled tissue.

Fig. 2. The three stages in the development of the fiber optic fluorometer/reflectometer (started in the early 1970s).


development of the fiber optic fluorometer_reflectometer

development of the fiber optic fluorometer_reflectometer

http://dtch1d7nhw92g.cloudfront.net/content/292/2/C615/F2.medium.gif

Factors Affecting NADH Fluorescence and Reflectance Signals

The excitation and emission spectra of NADH are affected by the redox state of this fluorochrome and by other factors, leading to artifacts in the fluorescence measurements. This section will discuss various NADH-unrelated factors, affecting the measured signal. Since most fluorometers involve the measurement of the total backscattered light at the excitation wavelength (i.e., 366 nm), the discussion will concern changes in NADH fluorescence as well as in tissue reflectance.

The following factors may affect the two measured signals, 366-nm reflectance and 450-nm fluorescence: 1) tissue movement due to mechanical or intracranial pressure changes; 2) extracellular space events, such as volume changes or ion shifts between intra- and extracellular space; 3) vascular and intravascular events, for example, oxy-deoxy Hb changes, and blood volume changes due to autoregulatory vasoconstriction under pathological conditions; and 4) intracellular space factors, such as O2 level, ATP turnover rate, substrate availability, and mitochondrial redox state.

Fig. 3. Comparison between the mitochondrial metabolic state, defined by Chance and Williams (56, 57) and responses of the in vivo brain to changes in O2 supply and brain activation.

mitochondrial metabolic state, defined by Chance and Williams (56, 57) and responses of the in vivo brain to changes in O2 supply

mitochondrial metabolic state, defined by Chance and Williams (56, 57) and responses of the in vivo brain to changes in O2 supply

http://dtch1d7nhw92g.cloudfront.net/content/292/2/C615/F3.medium.gif

Changes in mitochondrial NADH and tissue metabolic state

The pioneering work of Chance and Williams in the 1950s, led to the definition of the metabolic state of isolated mitochondria in vitro. The foundations for the use of NADH fluorescence as a marker of mitochondrial activity have been posited in detail by Chance and Williams (5657). The left portion of Fig. 6 is a modification of a published table, while the right hand segment demonstrates the responses of NADH fluorescence measured in the brain in vivo under various perturbations. The “resting state” of the mitochondria in vitro was defined as state 4, where NADH was 99% in the reduced form, and ADP was the rate limiting substance. If ADP is added to a suspension of mitochondria, ATP synthesis will be stimulated, O2 consumption will increase, and the rate limit will be determined by the activity of the respiratory chain. During this state 3, or the “active state,” the NADH redox state will decrease or become more oxidized (∼50%). When the resting mitochondria are deprived of O2, the activity of the mitochondria will stop and NADH will reach its maximum redox state (state 5).

A definitive description of the mitochondrial metabolic state has never been given for in vivo conditions. Therefore, we described the in vivo mitochondria conditions as recorded by NADH fluorescence in a representative tissue or organ; e.g., the brain. While the range between minimal NADH (∼0) and its maximal level was determined in vitro, it is almost impossible to determine in the intact brain or other organs in vivo. For example, state 2, with a substrate free medium, could not be achieved in vivo since the tissue would die. On the other hand, the maximal level of NADH (state 5) could be monitored in vivo under complete deprivation of O2 by anoxia or complete ischemia.

We used changes in NADH levels monitored in vivo to create a new scale ranging from a maximal definite point to the minimal level recorded in vivo. Details of this approach have been published (152). As shown in Fig. 3, the maximal NADH level is achieved under complete O2 deprivation that can be induced both under in vitro and in vivo conditions. This signifies that this definitive point can be used to determine state 5 in vivo as well. The problem is to determine the metabolic state of a tissue in an in vivo situation. If we adopt the in vitro value of a resting state (state 4), this would signify that the increase in NADH during state 5, induced by anoxia (0% O2), would be only 1%. According to all in vivo studies, this is not the case, and during anoxia the increase in NADH is lager than the decrease under state 4 to 3 transition. Figure 3right, illustrates that the observed level of NADH increase is indeed larger than the decrease. Therefore, we concluded that, under in vivo conditions, the “resting” metabolic state of the brain is found between states 4 and 3 rather than in state 4 as defined in vitro (152). To determine the maximal and minimal levels of NADH in vivo it is almost impossible to use cyanide or uncoupler (FCCP). Nevertheless, we were able to determine the maximal level by anoxia and the “minimal” level by nonfluorescing uncoupler. We injected the uncoupler pentachlorophenol into the ventricles of the rat’s brain while monitoring the NADH responses to anoxia and spreading depression (146). To perform a reliable study with cyanide, the animal would have to die and the results will not be helpful; therefore, we used the anoxia response to measure the maximal level of NADH. Using fiber optic fluorometry, we were able to monitor both anesthetized and awake rats. This figure will be discussed later on in this review. It is important to note that most of the published data on NADH monitoring, have been accumulated in brain studies. Therefore, we will present our data mainly relating to the brain, though results on other organs will be presented as well. Table 1 lists studies published by various investigators as well as our publications. The papers are classified according to the organ monitored and the type of perturbation used. This table does not include rarely studied types of organs or perturbations. Such studies are cited individually in the text.

Table 1. Effect of O2 delivery and consumption on NADH redox state measured in various intact organs by various investigators

Table 2. Historical milestones in monitoring NADH fluorescence in vivo

….

Anoxia and Hypoxia.

The responses to hypoxia and anoxia are very similar; therefore, they will be discussed together. According to the definition of Chance and Williams (5657), a shift toward state 5 involves an increase in NADH proportional to a decrease in O2 supply.

It is assumed that the response of NADH fluorescence to hypoxia or anoxia, induced in vivo, should be very similar to the response of isolated mitochondria. As shown in Fig. 4B, when the blood-free brain was exposed to N2, the fluorescence showed a clear increase-decrease cycle depending on the availability of O2. The reflectance trace was not affected at all. In autoregulated blood-perfused organs, it is expected that the lack of O2 will trigger compensation mechanisms that may lead to an increase in the blood flow and volume, or a decrease in thereflectancesignal. We tested, in the same rats, the response to anoxia of the normoxic blood-perfused brain. The results are shown in Fig. 4A. Indeed, reflectance exhibited a large decrease due to the increase in blood volume (vasodilatation of brain vessels). Figure 4C and D, presents the responses to anoxia measured via 2 mm and 1 mm light guides. A small variation can be seen in the reflectance response between the two light guides.

Ischemia, Or Decreased Blood Flow.

Under partial or complete ischemia, blood flow to the monitored organ is decreased and, as a result, O2 delivery is limited or even abolished. The use of ischemia in animal models provides information relevant to critical clinical situations such as brain stroke or heart attack. The primary factor starting the pathological state is the decrease in O2 supply, making the tissue energy balance negative, and preventing the tissue from performing its function. Figure 7 illustrates the effects of ischemia and anoxia on the NADH level in the brain of an anesthetized gerbil. The measurements of NADH in the cerebral hemispheres were correlated to the brain electrical activity (ECoG; electrocorticogram). To test and compare the measurements done in the two hemispheres, we exposed the gerbil to short-term anoxia. As shown, the two responses are very similar and correlate to the depression of the ECoG signal measured in the two hemispheres.

….

After the introduction of the light guide-based fluorometry, we were able to expose the awake brain to hyperbaric conditions. A clear decrease in NADH (oxidation) was recorded during the shift from 21% to 100% O2, as well as during compression of up to 10 atmospheres 100% O2 (150,152153167177). A similar oxidation was found upon CO2 addition to the gas mixture (94–99% O2) (149). We also found a correlation between the elevated brain PO2 and the oxidation of NADH in awake rats (151). The oxidation of NADH was also recorded under normobaric hyperoxia (113). Furthermore, we tested the effects of hyperbaric oxygenation on carbon monoxide intoxication (212) or cyanide exposure (235).

….

Responses to energy consumption changes

As shown by Chance and Williams (57, 58), the activation of the mitochondria by increased ADP is coupled with oxidation of NADH (decreased NADH levels) and is known as the state 4 to state 3 transition in isolated mitochondria. Most of the investigations in this field of tissue activation were made on neuronal tissue in vivo. However, studies of other organs, such as the heart or skeletal muscle, were conducted as well. The demand for energy (ATP) by various tissues is dependent on the specific tasks of each organ or tissue. Nevertheless, the stimulation of mitochondrial function is common in all tissues in the body. We will describe the effects of tissue activation on NADH fluorescence under normoxic conditions as well as during limitation of O2 supply in the tissue (hypoxia, ischemia).

….

Responses to energy consumption changes

As shown by Chance and Williams (5758), the activation of the mitochondria by increased ADP is coupled with oxidation of NADH (decreased NADH levels) and is known as the state 4 to state 3 transition in isolated mitochondria. Most of the investigations in this field of tissue activation were made on neuronal tissue in vivo. However, studies of other organs, such as the heart or skeletal muscle, were conducted as well. The demand for energy (ATP) by various tissues is dependent on the specific tasks of each organ or tissue. Nevertheless, the stimulation of mitochondrial function is common in all tissues in the body. We will describe the effects of tissue activation on NADH fluorescence under normoxic conditions as well as during limitation of O2 supply in the tissue (hypoxia, ischemia).

….

The effects of pharmacological agents on NADH redox state in various organs were published as well. Kedem et al. researched the influence of various inotropic agents (1) as well as nitroprusside (2), nitroglycerin (76), and propranolol (86).

Osbakken and collaborators (194195) also monitored NADH under various drug exposures. Baron et al. (17) described the effects of lidocaine on NADH, during ischemia in the dog heart. The effects of blood substitute emulsion on NADH in the kidney were reported (260). The influence of radioprotective chemicals on NADH in rat tissue was described in the 1960s (103). The action of various drugs (e.g., the uncoupler Amytal) was studied in the liver exposed to hyperbaric oxygenation (3140).

Monitoring Human Body Organs

The first attempt to apply NADH fluorometry to human tissues in vivo was made in 1971 by Jobsis et al. (111). Using NADH fluorescence microfluorometry, they monitored the exposed brain of neurosurgical patients undergoing treatments for focal cerebral seizures. They correlated the electrocorticographic data to the NADH redox state under direct cortical stimulation of the monitored area. The clear decrease in the NADH signal was interpreted as a change in oxidation. The recorded changes were very similar to those obtained in analogous procedures in the cat brain (213). A few years later, the collaboration between Austin and Chance (8) led to the recording of NADH in the brain of patients subjected to microanastomosis of the superficial temporal artery to the middle cerebral artery. The same group found an improvement of cerebral oxidative metabolism after the anastomosis, which was correlated to the elevated blood flow and increased tissue PO2 (9).

The next step was taken by Barlow et al. (16), who expanded this technique to monitor the heart and the brain. Using a different type of fluorometer, Van Buren et al. showed a decrease in NADH (oxidation) due to cortical stimulation in epileptic patients (251). In 1979, Fein and Jobsis (81) studied the changes in brain energetics in patients undergoing superficial temporal arterial-middle cerebral artery microanastomosis. Fein and Olinger (8283) monitored patients after transient ischemic attacks. The brain of these patients, who had undergone an extracranial-intracranial bypass, was stimulated, and changes in NADH were recorded.

….

The laser-based fluorimeter developed by Renault (207) was used to monitor NADH redox state in the heart muscle during pharmacological treatments (207), as well as in skeletal muscle (91). Attempts to apply NADH fluorometry in clinical practice (reported in a dozen short publications) did not lead to the development of a proper medical device applicable on a daily basis.

In 1990, our team started developing a unique multiparametric monitoring system that included the measurement of NADH fluorescence, using a light guide-based device. This system was initially applied to monitor neurosurgical patients undergoing brain surgery or those treated in the intensive care unit. In the first paper on the subject (published in 1991), we showed the feasibility of our approach. After a transient short occlusion of one common carotid artery, the increase in NADH was correlated to a decrease in cerebral blood flow (164). It took another 5 years to restart organized clinical testing of our monitoring system.

Monitoring Nadh And The Multiparametric Approach

The need for multiparametric monitoring of other parameters, additional to NADH, results from the basic understanding that NADH is affected by two major factors. The redox state of NADH reflects not only the availability of O2 inside the mitochondria but also the turnover rate of the ATP-ADP cycling activity (state 4 to state 3 transition). The interaction between these two factors affects the nature of NADH response to various conditions. For example, an increase in energy consumption (e.g., cortical spreading depression) under O2 restriction will be manifested as an increase in NADH rather than a decrease (oxidation) measured in normal well-oxygenated tissue. According to Chance and Williams, an increase in ATP production is always recorded as a decrease in NADH (5758). Therefore, the “reduction cycle” measured by the NADH signal in response to CSD can be interpreted as an artifact of some kind. This phenomenon and the fact that the mitochondrial NADH signal cannot yet be calibrated in absolute values prompted us to develop a multiparametric monitoring approach and a probe that could be used in various tissues exposed to different pathophysiological conditions. By this approach, two major advantages were gained. First, it provided the possibility of a better interpretation of the recorded results; second, nonphysiological responses could also be more easily detected. To elaborate on these points, we will consider the following typical example. In the early stage of NADH monitoring using a time sharing fluorometer, we found that a few minutes after complete ischemia was induced by decapitation in a rat model, a large increase in the reflectance signal was recorded in parallel to a clear NADH decrease in the dead monitored brain, apparently indicative of NADH oxidation. We termed this event “the Secondary Reflectance Increase-SRI” (147). It was clear to us that this late “oxidation” of NADH in the dead animal was an artifact of the monitoring system. The same response was recorded also when partial ischemia was induced in a gerbil’s brain. The “oxidation” of NADH in a dead or partially ischemic brain did not have any physiological or biochemical interpretation, so we suspected that this “oxidation” is due to the large increase in the reflectance signal, and to a failure of the fluorescence signal’s correction method. We speculated that the large increase in the reflectance trace (SRI) after ischemia or brain death, resulted from a spasm of blood vessels. Such spasms are known to occur in this type of conditions, namely during cortex depolarization. Only when monitoring other parameters, in addition to NADH, such as extracellular K+ and DC steady potential, were we able to give a substantial explanation for the SRI event (85). On the basis of these experiments, we concluded that the SRI phenomenon is always associated with a negative shift in the DC potential and a large increase in extracellular potassium when energy is not available.

….

NADH and electrical activity

The first attempt to combine NADH and electrical measurements was made by Chance and Schoener in 1962 (50). They showed the time relationship between the increase in NADH due to anoxia or hypoxia, and the disappearance of electrical activity (ECoG) in rat cerebral cortex. The same type of correlation was reported later by Jobsis et al. (110) for epileptic activity, and by Rosenthal and Somjen (163) and Mayevsky and Chance (157) for CSD. The accumulated results have made it clear that under limited energy or O2 supply, NADH becomes elevated in the brain, while the spontaneous ECoG activity is depressed. The ECoG begins to decelerate when NADH reaches 70%-80% of its maximal increase upon death (157159) or decapitation (160259). The recovery of ECoG after anoxia is completed much later than NADH oxidation, suggesting that energy availability is a prerequisite condition but not the only condition needed for a complete ECoG recovery. Depression of the ECoG is also recorded when the brain is exposed to depolarization due to CSD; however, it is not caused by a lack of O2. Similar correlations between NADH and ECoG were described in cat cerebral cortex exposed to seizures and hemorrhagic hypotension (100).

NADH and respiratory chain components

Since the activities of various respiratory chain components are strongly coupled, the tissue respiratory rate can be better evaluated by monitoring several such components. Very few attempts have been made to correlate NADH responses in vivo, with other components of the respiratory chain. The main reason for this was the stronger interference of blood with Fp or cytochrome oxidase measurements, compared with NADH. The effects of hypotension and anoxia on NADH and cytochrome aa3, were measured in the brain in vivo (99). LaManna et al. showed the effects of Ethanol on brain NADH and cytochrome aa3 in rats and cats (137). Therefore, almost all correlations between Fp and NADH were studied in blood-free organs (49). In 1976, we presented preliminary results indicating that in certain morphological areas of the brain, containing less blood vessels, a good correlation is recorded between NADH and Fp responses to anoxia in vivo (146). The only practical way to measure these two signals together was to freeze the tissue and then analyze the two parameters in the frozen state (168183). Another approach to correlating NADH and Fp redox state was suggested by Paddle et al. (198). They used a NADH/Fp scanning fluorometer to monitor the muscle (198) or rat diaphragm (197). A few papers have been published on the use of flying spot fluorometer to monitor the two fluorescent signals in the brain and other organs (35). Most of the data published in this field have been acquired in vitro (3349) or in blood-free organs such as the liver (218).

In this review, we tried to summarize the scientific background and technological aspects of in vivo NADH fluometry approach for the monitoring of mitochondrial functions. This technology still has some limitations including the need for better correction technique for hemodynamic artefacts as well as a new approach for quantitative calibration of the signals. During the past decade, the preliminary application of the NADH fluorometry to clinical environment was very promising. This stimulates us to improve the technology to provide a practical medical device that will be used by many clinicians after approval by the regulatory agencies around the world.

2.1.5.2 A microscale mathematical model for metabolic symbiosis: Investigating the effects of metabolic inhibition on ATP turnover in tumors

Colin Phipps, Hamid Molavian, Mohammad Kohandel
J Theoret Biol 2015; 366: 103-114
http://dx.doi.org/10.1016/j.jtbi.2014.11.016

Cancer cells are notorious for their metabolic adaptations to hypoxic and acidic conditions, and especially for highly elevated glycolytic rates in tumor tissues. An end product of glycolysis is lactate, a molecule that cells can utilize instead of glucose to fuel respiration in the presence of oxygen. This could be beneficial to those cells that do not have sufficient oxygen as it conserves glucose for glycolysis. To better quantify this phenomenon we develop a diffusion-reaction mathematical model for nutrient concentrations in cancerous tissue surrounding a single cylindrical microvessel. We use our model to analyze the interdependence between cell populations’ metabolic behaviors on a microscopic scale, specifically the emerging paradigm of metabolic symbiosis that exists between aerobic and glycolytic cells. The ATP turnover rates are calculated as a function of distance from the blood vessel, which exhibit a lactate-consuming population at intermediate distances from the vessel. We also consider the ramifications of the Warburg effect where cells utilize aerobic glycolysis along with this lactate consuming respiration. We also investigate the effect of inhibiting metabolic pathways on cancer cells since insufficient ATP can trigger cell apoptosis. Effects that could be induced by metabolic inhibitors are analyzed by calculating the total ATP turnover in a unit tissue annulus in various parameter regimes that correspond to treatment conditions where specific metabolic pathways are knocked out. We conclude that therapies that target glycolysis, e.g. lactate dehydrogenase inhibitors or glycolytic enzyme inhibition, are the keys to successful metabolic repression.

The extensive metabolic requirements for cancer cell proliferation coupled with the harsh microenvironment in solid tumors culminate in a highly adaptive and complex network for cellular energy production. The genetically altered metabolic behavior of cancer cells has led to a number of emerging metabolic paradigms, in addition to those that are universally exhibited in both cancerous and normal cells. We will investigate this complex metabolic behavior by formulating a minimal mathematical model that includes the essential metabolites of glucose, lactate and oxygen in the tissue surrounding a microvessel. The cylindrical geometry used here has been used in a similar context to consider interactions between metabolites and tumor cells with treatment effects in a simplified setting (e.g. Bertuzzi et al., 2000, 2007a). The model presented here will enable the quantification of various behaviors, such as the symbiotic relationship that exists between lactate producing glycolytic cells and lactate-consuming respiratory cells, and the analysis of metabolic dependence on various physiological conditions such as hypoxia and induced metabolic inhibition. Metabolic inhibition including glycolytic inhibitors among many others targets could be very important for cancer treatment since an ATP deficit can induce apoptosis (Izyumov et al., 2004). The key consideration for addressing this problem with mathematics is the formulation of nutrient consumption rates that encompass the various primary facets of cancer cell metabolism and their corresponding ATP yields. In normal well-oxygenated tissues the primary source of ATP is the process of cellular respiration. The complete conversion of glucose to carbon dioxide and water has an ideal yield of about 29 ATP, although realistically the yield is substantially lower (Brand, 2005). The preliminary stage of cellular respiration is glycolysis, the conversion of glucose to pyruvate; this process directly produces 2 ATP. In hypoxic conditions this pyruvate is preferentially converted into lactate via the enzyme lactate dehydrogenase (LDH) to regenerate the essential cofactor NAD+. In oxygenated conditions this pyruvate is transported across the inner mitochondrial matrix where it is decarboxylated and enters the citric acid cycle; the citric acid cycle directly generates 2 more ATP per glucose. The primary energy payoff is a result of cofactor oxidization that enables the electron transport chain to establish a proton gradient across the inner mitochondrial matrix. ATP synthase utilizes this electrochemical gradient to drive the phosphorylation of approximately 25 additional ATP per glucose molecule.

The aforementioned universal traits that cancer cells and normal cells share include cellular responses to various levels of oxygen, lactate or glucose. Examples include a Crabtree-like effect and a Pasteur-like effect (Casciari et al., 1992a). The Crabtree-like effect is when oxygen consumption decreases as glucose concentration increases. This can be explained by an increasing reliance on glycolysis for ATP when hyperglycemic conditions are encountered. The Pasteur-like effect is decreased glucose consumption as oxygen increases. This is due primarily to the inhibition of various metabolic steps by the presence of elevated ATP and other intermediaries. However, cancer cells are unique in that they preferentially utilize glycolysis, even in the presence of oxygen, coined aerobic glycolysis. This phenomenon is generally referred to as the Warburg effect whereby cells rely primarily on glycolysis even in the presence of sufficient oxygen to perform respiration (Warburg, 1956). There is a perceived inefficiency of this metabolic strategy, namely the dramatically reduced ATP yield, just 2 per glucose instead of 29, however, it has the benefits of faster ATP production and it is likely that much of this glucose is being consumed for proliferative (Vander Heiden et al., 2009) (e.g. by the pentose phosphate pathway) purposes. In addition to the typical glycolytic phenotype exhibited in many cancers, there is also a developing story of a co-operative relationship existing between aerobic and anaerobic  cancer cells. The lactate necessarily produced by glycolytic cells is being pushed back into the respiratory cycle by being converted into pyruvate (summarized in Feron, 2009; Nakajima and Van Houten, 2012); this spatial relationship is shown in Fig. 1. Lactate consumption has been observed in vitro in various models (Bouzier et al.,1998; Katz et al., 1974) as well as in vivo as early as the early 1980s (Sauer et al., 1982). However, a renewed interest in the topic was piqued when Sonveaux et al. (2008) showed that reducing lactate uptake by cancer cells led to hypoxic cell death, a particularly difficult subpopulation to target using traditional methods.

Metabolic phenomena have been studied in great detail by mathematical models, but models of tumor metabolism rarely include the interaction of the transport mechanisms of microvessels with the localized metabolic behavior of cells (with one recent exception McGillen et al., 2013). In the section to follow, we will develop a mathematical model that describes the concentrations of molecules that are important to cellular metabolism in the tissue around a single three-dimensional vessel that exhibits diffusion dominated interstitial transport. We will then use this model to demonstrate how the properties of the tumor cell population, such as glucose, lactate and oxygen consumption rates, affect tumor hypoxia and ATP production around a single vessel. The effects of metabolic inhibitors will be investigated by parameter changes that could be elicited by the application of glycolysis inhibitors, lactate dehydrogenase (LDH) inhibitors or respiratory inhibitors. We are interested in those metabolic inhibitors that could cripple the cells’ ability to produce ATP.

Fig.1. The spatial relationship between the cell populations in the model indicating dominant metabolism as we move away from the vessel. When the glucose and oxygen concentrations are highest near the vessel wall, the cells preferentially utilize glucose-fuelled respiration. When the oxygen supply is depleted far from the vessel, the cells rely on glycolysis. The glycolytic cells produce large quantities of lactate which are consumed by cells at intermediary distances and hypoxic oxygen concentrations. These cells are participating in a behavior that we will refer to as metabolic symbiosis.

A model to describe the concentrations of the major players in the metabolic pathways of respiration and glycolysis, will be outlined here. Its origins lie in a metabolic model developed by Casciari et al. (1992b) that was subsequently applied on the microscale by Molavian et al. (2009). The functional forms for the production rates are similar to those proposed by MendozaJuez et al. (2012) and subsequently extended to a spatial model by McGillen et al. (2013). In hypoxic and anoxic conditions, cells must partially or exclusively rely on metabolic pathways, such as glycolysis, that do not require oxygen for ATP production. In glycolysis, the preliminary stage of respiration, a single glucose molecule (C6H12O6) yields 2 ATP, which we will denote under the reaction arrow with a boxed ATP yield number, with the byproducts of lactate and a proton. Denoting glucose by G and lactate by L C3H5O3, the net reaction is G kG> 2L + 2H+; [2]

where kG (mM/s) is the rate of glucose consumption by glycolysis that results in lactate formation. The accumulation of these hydrogen ions in a solid tumor is a primary contributor to tumor acidosis. In the presence of oxygen (O2), glycolysis is typically followed by the rest of the respiratory process with an ideal energy yield of approximately 29 ATP molecules with carbon dioxide (CO2) and water (H2O) as the only byproducts. The simplified summary reaction is given by G kO à 6O2 6CO2 + 6H2O; [29]

where kO is the rate of glucose consumption that results in cellular respiration. To represent the metabolic symbiosis between cells primarily producing energy via glycolysis and those consuming lactate in well-oxygenated areas, we will link the above two reactions with the lactate-consuming net reaction: L+ H+ + 3O2 kLà  3CO2 + 3H2O; [13.5]

where kL is the rate of lactate consumption. This summarizes the re-entry of lactate, via conversion to pyruvate, into aerobic respiration that yields 13.5 ATP per lactate molecule. The relationships between the summary reactions included in the model are given in Fig. 2.

Fig. 2. The summary reactions included in the metabolism model. Glycolysis proceeds at rate kG and produces 2 ATP from the conversion of glucose to pyruvate. Glucose-fuelled respiration occurs at rate kO in the presence of oxygen, while lactate-fuelled respiration occurs at rate kL (2 kL is present in the diagram to remain consistent with the glycolytic yield of 2 lactate molecules).

Fig. 3. Solution to base case boundary value problem. Nondimensional oxygen o and glucose g concentrations decrease due to metabolic consumption. Lactate  ℓ  increases to almost double its vessel concentration since it is produced by glycolysis at a higher rate than it is consumed by respiration due to a limiting oxygen concentration. This image has been spatially truncated to 300 μm since the concentrations are approximately constant after this point.

Fig. 4. Consumption rates of oxygen, lactate and glucose (QO, QL and QG for the concentrations given in Fig. 3). The glucose and oxygen consumption rates are strictly positive while the consumption rate of lactate is predominantly negative. This indicates that even in regions where lactate is being consumed, it is being produced at a higher rate by glycolysis.

Fig. 5. The base case for ATP turnover (consumption/production) rates corresponding to consumption rates given in Fig. 4. The contributions of the pathways are bounded by the total ATP turnover rate  PATP . Glycolysis dominates in hypoxic/ anoxic regions while glucose-fuelled respiration occurs sparingly near the blood vessel. Lactate-fuelled cells are consuming the byproduct of the glycolytic cells where there is oxygen present.

Warburg effect

In the base case considered above glycolysis is inhibited until the oxygen consumption drops to values that prevent the production of sufficient ATP to maintain cell survival. However, cancer cells will commonly utilize glycolysis as a primary energy source even when there is enough oxygen to ensure cell survival. In the model we characterize the cell’s ability to hold off on utilizing glycolysis in oxygenated areas by the parameter ΛO. Reducing it 400-fold from the base case above (from 4000 to 100) results in spatial ATP turnover rate as given in Fig. 6. Cells near the vessel greedily consume the available resources leaving cells further from the vessel to die from insufficient ATP supply. The ATP production breakdown corresponds to the second bar in Fig. 8 and is slightly higher than the whole tissue considered in the base case above.

Fig. 6. ATP turnover (consumption/production) rates for cells exhibiting the Warburg effect (differs from base case because ΛO = 100 instead of 4000). The contributions of the pathways are bounded by the total ATP turnover rate PATP. Glycolysis is dominant in all regions of the tumor, however, glucose and lactate fueled respiration occur sparingly near the blood vessel where there is oxygen present.

Fig. 7. The optimal metabolic behavior on the microscale given an ATP turnover maximum of X mM=s. This shows glucose-fuelled respiration near the vessel, glycolysis far from the vessel and a lactate-consuming population in between these two

Instead of fixing all of the parameters to the values given in Table 1, we could leave some of the parameters free and optimize the amount of ATP generated from the given metabolites by imposing a maximum constraint on ATP production. For instance, setting all of the parameters initially to those given in Table 1, and then minimizing some function of Z¼PATP θ where θ is the maximum allowed ATP turnover rate would theoretically ensure that the available resources were not being selfishly consumed by oxidative cells near the vessel. Allowing cells to alter their glycolytic parameters: βg, δ and κg along with their lactate–glucose switch parameter λ yields the results shown in Fig. 7. While there was still enough constraint that the system still exhibited a non-constant ATP turnover where it could, this reinforces the suggested optimal strategy of glucose-fuelled respiration near the vessel, glycolysis far from the vessel and a lactate-consuming population in between these two. This optimization procedure most notably resulted in a reduced δ enabling the switch to glycolysis to happen closer to the vessel and a lower κg enabling a later and more drastic shut off of glycolysis; the parameter results of this simulation are presented in Table C1.

The mathematical model presented here can give insight into the effects of blocking various metabolic pathways. The three metabolic pathways that we have considered, namely (i) glucosefuelled respiration, (ii) lactate-fuelled respiration and (iii) glycolysis, could be inhibited by various agents, and the effects on local ATP production will be outlined below. For illustrative purposes we will consider complete inhibition of these pathways, but this will be followed by consideration of the more realistic scenario where these pathways are only partially inhibited. Entirely knocking out lactate metabolism could be achieved by inhibiting lactate dehydrogenase (LDH) which is responsible for the reentry of lactate into respiratory pathways by converting lactate into pyruvate. Successful inhibition would concurrently prevent the conversion of pyruvate to lactate as well, a crucial step for regenerating NAD+ in glycolytic cells. This has been shown to reduce ATP levels and consequently induce cell death in tumors (Le et al., 2010). The complete inhibition of lactate dehydrogenase would eliminate two of the three pathways considered here: lactate-fuelled respiration and glycolysis. Complete inhibition can be reflected in the model by setting BL¼0 and BG¼0, leaving only glucose-fuelled respiration to produce ATP, a physiologically normal condition. However, the hypoxic and hypoglycaemic conditions considered here do not leave enough fuel for cell survival. This scenario corresponds to the third bar in Fig. 8. We could also target glucose transport into the cell, an intermediary of glycolysis or one of the critical enzymes responsible for converting glucose to pyruvate. This is distinct from the strategy noted above of inhibiting LDH which prevents the conversion of lactate to pyruvate and vice versa. This has also been noted as a prime target for cancer therapy (Pelicano et al., 2006; Gatenby and Gillies, 2007) and there are currently many potential targets (Granchi and Minutolo, 2012). Here we will consider the shutdown of glycolysis as preventing both glucose-fuelled respiration and glycolysis since both of these require glucose to be converted into pyruvate. However, it leaves the lactate-fuelled respiratory pathway intact. This could be considered in the model by taking BO¼0 and BG¼0.Similar tothe caseof LDH inhibition this leads to a significant decrease in ATP production as shown in the fourth bar of Fig. 8. The final scenario that we consider corresponds to full inhibition of respiration somewhere along the chain between pyruvate transport into the mitochondria and the electron transport chain. There are numerous potential targets in the mitochondria (Costantini et al., 2000) and we will consider the complete shutdown of respiration by setting BL¼0 and BO¼0. This would result in negligible oxygen consumption and with our base case of ΛO 100-4000 this would lead to repressed glycolysis in the tissue.

Fig. 9. The effects of metabolic repression on total ATP production in a unit annulus of tumor tissue ðΦÞ. Cell metabolism is fully functioning when the relative rate is 1, while the cell metabolism is fully inhibited when the relative rateis 0. Intermediary values correspond to partial inhibition of both affected metabolic rates, e.g. for LDH half-inhibition: BG and BL are half the base case value, and BO remains at its base case value. The legend abbreviations are the same as those used in bars 3–6 in Fig. 8: LDH inhibition (LDH), glycolytic inhibition (Glyc), respiratory inhibition (Resp), and respiratory inhibition with Warburg effect (R-W). The total ATP production begins to significantly decrease for LDH and glycolytic inhibition only once more than half inhibition is reached. For respiratory inhibition, significant decreases are not detected until metabolic rates drop to one-tenth of the base case value.

The functional form for glycolysis given in (8) is similar to that used in McGillen et al. (2013), except where our form uses oxygen as the inhibitory molecule, they use lactate. McGillen et al. (2013) do not include glucose-fuelled respiration at all (as it was deemed to occur at negligible rates), and they use a similar lactate-fuelled respiratory term as used here, that was originally formulated by Mendoza-Juez et al. (2012). Instead of including a Michaelis– Menten oxygen dependence, they introduce a switch parameter that turns oxygen-fuelled metabolism on and off at a threshold oxygen concentration. However, they did enable the cells to use combinations of respiration and glycolysis as opposed to the strict switching between these two pathways modelled by Mendoza Juez et al. (2012). The novel aspects of our model include the introduction of a glycolytic inhibition parameter that can prevent or enable the Warburg effect, an explicit and smoothly defined oxygen dependence for the respiratory pathways, and the inclusion of an accurate ATP yield formula. While our results focus on the energetic consequences of metabolic inhibition, McGillen et al. (2013) focus on the interaction between metabolite consumption and tumor growth.

Conclusions

The mathematical model formulated and analyzed above can give insight into the metabolic behaviors of cancer cells on the microscale. The tumor microenvironment characterized by hypoxia and nutrient deprivation leads to the utilization of highly unregulated glycolytic pathways and the consumption by respiring cells of the lactate produced by these cells. These metabolic scenarios are encompassed by the functional forms proposed for glucose, lactate and oxygen consumption. To consider the effect of altering parameters in the model to the efficiency of energy production we must also consider the rate of ATP turnover in the tissue. To this end a detailed biochemical summary was performed in order to calculate estimates for ATP yields. These energetic landscapes were considered in tissues that utilize anaerobic glycolysis, thus keeping more cells alive, and those that experience the Warburg effect, performing glycolysis in oxygenated areas. The analysis shows that the latter does confer a proliferative advantage by producing more ATP. The effects of metabolic inhibition were taken into account by knocking out the pathways considered in our model. Glycolytic inhibition blocked glycolysis and glucose-fuelled respiration, LDH inhibition blocked glycolysis and lactate-fuelled respiration while respiration inhibition blocked both forms of respiration. Both strategies that block glycolysis lead to appreciable decreases in total ATP production, while those that block respiration are only effective in the base case where the cells are unable to elevate glycolytic rates due to the repressive effect of oxygen in the model. However, when considering a more realistic scenario where cells can adapt to blocked respiratory pathways by upregulating glycolysis via the Warburg effect, we observe that this treatment strategy allows sufficient ATP for cell survival. The work presented here should lead to a reconsideration of the importance of the spatial relationships between cells performing under specific metabolic regimes and provides a minimally parameterized and straightforward basis for future phenomenological metabolite consumption models.

2.1.5.3 Localization and Kinetics of Reduced Pyridine Nucleotide in Living Cells by Microfluorometry J. Biol. Chem.-1959-Chance-3044-50

Britton Chance and Bo Thorell

J Biological Chemistry Nov 1959; 234(11)
On the basis of early studies of the blue fluorescence of living cells and tissues before chemical treatment, l Sjiistrand (1) suggested its association with the mitochondrial bodies. Microspectroscopic observations of prepared tissue sections revealed emission bands of the fluorescent material of axons (1) and acid treated groups of kidney cells; (2) critical evaluations of available spectrograms of purified materials lead to the identification of thiamin and riboflavin, respectively. Although some of the  of the kidney sections, before acid treatment, showed fluorescence bands in the spectrograms that are now regarded as suggestive of reduced pyridine nucleotide, the fluorescence of which was first observed by Warburg (2), insufficient data were available at that time to consider reduced pyridine nucleotide as a possible cause of the tissue fluorescence. Recent studies by Boyer and Theorell (3) and Duysens and Kronenberg (4) on alcohol dehydrogenase show clearly the great enhancement of DPNH fluorescence that is caused by a binding of the coenzyme to the enzyme surface. Furthermore, Duysens and Amesz (5) demonstrate that the intact yeast cell shows a fluorescence characteristic of bound reduced pyridine nucleotide. In more recent experiments, it has been found that intramitochondrial reduced pyridine nucleotide also exhibits the same characteristic fluorescence, calling attention to the possibility of a close relationship between this effect and the blue fluorescence of living cells and tissues (6). The fluorometric result agrees with the spectrophotometrically determined large RPN3 content of mitochondria (7). Furthermore, its binding to a mitochondrial component has been suggested by kinetic studies (7). More recent data show that the fluorescence of intact muscle diminishes upon electrically induced contraction, in agreement with the spectrophotometrically observed oxidation of RPN (8). Thus, there is good evidence that a considerable amount of tissue fluorescence is due to this component. To study the fluorescence of mitochondrial RPN independently of that of the cytoplasm, it has been desirable to develop a microfluorometric method, which, in conjunction with suitable biological materials showing isolation of the mitochondrial bodies, could be used to investigate cytoplasmic-mitochondrial interactions and also to permit the assay of RPN localized in different
1 The term “autofluorescence” is used by Sjostrand and other workers to indicate the fluorescence of a tissue before its treatment with stains, acids, and so forth.
2 F. S. Sjiistrand, unpublished experiments.
* The abbreviation used is: RPN, reduced pyridine nucleotide.

This paper describes such an instrument and its application to the observation of mitochondrial RPN, particularly in highly localized mitochondrial bodies such as the nebenkern4 of the grasshopper spermatid (11). It is now possible to investigate in viva the independent changes of mitochondrial and cytoplasmic pyridine nucleotide in the aerobic-anaerobic transition. In other cells, where mitochondrial localization is not sufficient for independent characterization of cytoplasmic and mitochondrial components of the fluorescence, assays of the oxidation-reduction state of the total pyridine nucleotide in individual cells in different states of metabolism and growth are possible. The combination of this differential fluorometer with the spectrophotometer described elsewhere (12, 13) for the localization of activities of respiratory and glycolytic enzymes in cells affords a new approach to the dynamic aspects of metabolic reactions.

The closure of the switch contacts and the wave form of the photocurrent and light intensity for an AC-operated light source (see below) are indicated in Fig. 1. The fluctuations of the light intensity (~100 per cent modulation) indicated on the top line cause synchronous variations which result in an asymmetrical wave form for the photocurrent, provided the fluorescent object coincides with the extremes of the excursions of the vibrating diaphragm. To measure the fluorescence intensity of the object (M) and that of a nearby “free space” (R), the switch circuit is adjusted so that it closes for a brief interval at the peaks of the photocurrent wave form (Fig. 1). The portions of the photocurrent selected by this switch are used to charge a condenser so that its potential represents the difference of the photocurrents at the two times. This potential is amplified by a “Millivac,” type 17C, and by an Esterline-Angus l-ma. recorder.

FIQ. 1. Wave forms of light intensity and photocurrent relative to the times of switch closure (alternating current operated by lamp). The vibrating diaphragm operates synchronously with the fluctuations in light intensity so that the extremes of its vibration correspond to maxima of light intensity

Fig. 2. Relative fluorescence maxima for suspensions of diploid bakers’ yeast, pentaploid yeast, and ascites tumor cells. These fluorescence emission spectra are obtained with excitation of the cell suspensions by the 366-rnr mercury line passed through the same filter used in the microfluorometer. The energy obtained through the Wratten 2A filter is analyzed by means of a grating monochromator and is plotted as a function of wave length. Significant features of the record are that no measurable energy at 366, 436, or 546 mp is received by the photocell. The cell suspensions are relatively concentrated (60 mg. per cc. for the yeast cell suspensions). The close correspondence of the amplitudes of the peaks is a consequence of adjusting the photocell dynode voltage appropriately (928).

Studies of mitochondria treated with ADP to cause the disappearance of RPN fluorescence show that a relatively small contribution of the flavoprotein of the respiratory chain remains and that flavoprotein fluorescence does not measurably change with its oxidation-reduction state. Thus, it is felt justified in these preliminary studies to attribute the major portion of the fluorescence observed to RPN. Evidence in favor of this view is indicated below, where chemical transitions affecting the oxidation-reduction state and hence the fluorescence of reduced pyridine nucleotide show that most of the fluorescence localized in the mitochondria is affected by this transition and hence is not a “fixed” background fluorescence.

Relative Intensities of Signals-A survey of various biological materials has been made to determine the relative intensities of the signals obtained and to demonstrate the feasibility of studies of their fluorescence. This study is largely incomplete, but the preliminary results summarized in Table I are rather encouraging. These fluorescence intensities range from a small value for the aerobic nebenkern of the grasshopper spermatid to a large value for the anaerobic pentaploid yeast cell. The larger currents give a signal-to-noise ratio of such magnitude that delicate indications are given, not only of the magnitude of the fluorescence, but also of changes that may occur in different metabolic states or in different parts of the cells. At higher currents, accuracies > 100 : 1 are possible. Localization of Fluorescence-The inadequate resolution of the optical microscope and the uniform distribution of the mitochondria throughout the cytoplasm of such cells as bakers’ or pentaploid yeast or ascites tumor cells offer little possibility for localizing the mitochondrial fluorescence as opposed to the cytoplasmic fluorescence.

Table I Summary of fluorescence intensities for various cell types and metabolic states

FIG. 7. Time course of the fluorescence changes of the nebenkern and of the cytoplasm in the aerobic-anaerobic transition. A, the ratio of nebenkern to cytoplasmic fluorescence, plotted as determined by records similar to those of Fig. 6. The numbers in the diagram refer to the cell studied. The abrupt upward discontinuity of the record at approximately 45 minutes occurs when anaerobiosis is expected. B, the individual measurements of the cytoplasmic (0-O) and nebenkern (0-C) fluorescence. The number of the cell used for measurement is also indicated along the scale of the abscissa (922a, b).

A fluorescence with spectral characteristics that are similar to those of reduced pyridine nucleotide of isolated mitochondria has been demonstrated to be localized in three cell configurations which cytologically show mitochondrial aggregation. The oxidation and reduction of mitochondrial pyridine nucleotide without a measurable change of cytoplasmic fluorescence suggest that compartmentalization of mitochondrial and cytoplasmic pyridine nucleotide occurs in viva, at least in the grasshopper spermatid. Studies of other material, particularly pentaploid yeast cells and ascites tumor cells, indicate that similar changes of fluorescence of the single cell are observed in the aerobic-anaerobic transition. In such cells, optical resolution does not permit localization of mitochondrial bodies. Nevertheless, the state of pyridine nucleotide in the individual cell can be investigated.

Discussion:

Radoslav S. Bozov (@Radobozov)

Your interpretations approximates wrong conclusions: 1. Oxygen is processed via mitochondrial Cu2+/3+ metalloproteins , H2O2 (King’s water) electro-negativity processing). 2. Lactate formation is an effect of cancerogenesis, a Lewis base., you lack fundamental understanding pKa issues in science and more accurately in moderns science. Such thing as protons have never been observed directly, that is a concept for explaining pH. All organic acids in bio systems are deprotonated carboxyl functional groups entering resonance state , which allows interpretation of spectra: There i s no way in real chemical science to have measured pH of a compartment and especially nano space! The physiological charge is -1: http://www.hmdb.ca/metabolites/HMDB00190
Biophysical concepts might be applied in a wrong direction! which is the case of perceiving NADH/Pyruavte/Lactate triangle , you lack conceptual frames of systems applicability in expanded biological space/energies – proteins, nucleotides, and meta states! Pyridines have nothing to do with energy states, pyridines are nitrogen capacitors , they have nothing to do with origin and implications of mutation/evolution, regulation! You lack fundamental understanding of physical implications today!
Lactate is a compensatory mechanism of the genome for copying with disregulated supply of pyruvate for synthesizing negative methyl groups, energy processed in biospaces via compression/decompressing bio systems! Remember, quantum chemistry and implications of quantum physics is not one and the same! General Relativity is applied only towards statistical cloud delocalization, that implicates induction vs deductive reasoning! Classic mechanics of optics is a neat way to do math, nothing more than that of accepting reality of none observable parameters! Lactic acid was considered an end product of metabolism and physiological fatigue for a long time! Now, we know that is not true! To contrary lactic acid is used to have healthy pluripotecy differentiation of bone marrow derived cell lines. LDH proteins demonstrate high similarity motif selection with a range of transcriprion factors via blast studies. In general DATA IS MESSED UP and likely WRONGLY INTERPRETED!

Larry H Bernstein,

I am quite sure that what I presented is the best that science has produced.  Whether there is a theoretical issue in physical interpretation is another matter.  Two key papers are by Mayekovsky and by Britton Chance.  Britton Chance only died recently at nearly 100, but he was a giant in biochemistry, and my final exam question in freshman biochemistry was – should B Chance get the Nobel Prize.  His conception was then controversial, and the ETC won out.  Nevertheless, his contributions went far beyond the explanation for the H+ transfer role in ETC.  When I was a resident in pathology, my mentor (who identified the difference between myokinase and liver AK) commented that  the only reason that Chance had not been awarded was because his work was so technologically focused. I had studied the malate dehydrogenase reaction in Nate Kaplan’s lab, and I carried out stop-flow studies of the inhibition of the mitochondrial isoenzyme by oxaloacetate.  When I went to Washington, DC at the end of the Vietnam War and the time of Watergate, I had the good fortune to be introduced to Chance in a visit to Philadelphia.  I think that I do understand acidemia, cationic and anionic balance, which is not a simple matter – after some 35 years in pathology, with a main focus on clinical pathology.   If you could step back and give a point by point elucidation of where the experimental interpretation is in error, and a point by point highlight of your explanation, it would be very helpful. I know that I am quite knowledgable about the mechanism of reactions of the pyridine nucleotide linked dehydrogenases, and the isoenzymes, and the abortive ternary complexes.  I also published in the Brit J Cancer in the 1970’s on an abnormality in the cytoplasmic MDH in fast growing murine hepatomas, and in human cancer.  I spent many months purifying the heart mitochondrial MDH to purity, and established that there was no histidine residue at the active site.

Read Full Post »

Mitochondrial Isocitrate Dehydrogenase and Variants

Writer and Curator: Larry H. Bernstein, MD, FCAP 

2.1.4      Mitochondrial Isocitrate Dehydrogenase (IDH) and variants

2.1.4.1 Accumulation of 2-hydroxyglutarate is not a biomarker for malignant progression of IDH-mutated low grade gliomas

Juratli TA, Peitzsch M, Geiger K, Schackert G, Eisenhofer G, Krex D.
Neuro Oncol. 2013 Jun;15(6):682-90
http://dx.doi.org:/10.1093/neuonc/not006

Low-grade gliomas (LGG) occur in the cerebral hemispheres and represent 10%–15% of all astrocytic brain tumors.1 Despite long-term survival in many patients, 50%–75% of patients with LGG eventually die of either progression of a low-grade tumor or transformation to a malignant glioma.2 The time to progression can vary from a few months to several years,35 and the median survival among patients with LGG ranges from 5 to 10 years.6,7 Among several risk factors, only age, histology, tumor location, and Karnofsky performance index have generally been accepted as prognostic factors for patients with LGG.8,9 As a prognostic molecular marker, only 1p19q codeletion was identified as such in pure oligodendrogliomas. However, this association was not seen in either astrocytomas or oligoastrocytomas.10

Somatic mutations in human cytosolic isocitrate dehydrogenases 1 (IDH1) were first described in 2008 in ∼12% of glioblastomas11 and later in acute myeloid leukemia, in which the reported mutations were missense and specific for a single R132 residue.11,12 Some gliomas lacking cytosolic IDH1 mutations were later observed to have mutations in IDH2, the mitochondrial homolog of IDH1.12 IDH mutations are the most commonly mutated genes in many types of gliomas, with incidences of up to 75% in grade II and grade III gliomas.13,14 Further frequent mutations in patients with LGG were recently identified, including inactivating alterations in alpha thalassemia/mental retardation syndrome X-linked (ATRX), inactivating mutations in 2 suppressor genes, homolog of Drosophila capicua (CIC) and far-upstream binding protein 1 (FUBP1), in about 70% of grade II gliomas and 57% of sGBM.1517 The association between ATRX mutations with IDHmutations and the association between CIC/FUBP1 mutations and IDH mutations and 1p/19q loss are especially common among the grade II-III gliomas and remarkably homogeneous in terms of genetic alterations and clinical characteristics.16

It was thought that IDH mutations might be a prognostic factor in LGG, predicting a prolonged survival from the beginning of the disease.1823 However, this assumption, as shown in our and other earlier studies, had to be corrected because survival among patients who have LGG with IDH mutations is only improved after transformation to secondary high-grade gliomas.18,19,24 Furthermore, it had already been demonstrated that an IDH mutation is not a biomarker for further malignant transformation in LGG.18 IDH1 and IDH2 catalyze the oxidative decarboxylation of isocitrate to α-ketoglutarate (α-KG) and reduce NADP to NADPH.25 The mutations inactivate the standard enzymatic activity of IDH112 and confer novel activity on IDH1 for conversion of α-KG and NADPH to 2-hydroxyglutarate (2HG) and NADP+, supporting the evidence thatIDH1 and 2 are proto-oncogenes. This gain of function causes an accumulation of 2HG in glioma and acute myeloid leukemia samples.26,27 The 2HG levels in cancers with IDH mutations are found to be consistently elevated by 10–100-fold, compared with levels in samples lacking mutations of IDH1 or IDH2.26,28Nevertheless, how exactly the production or accumulation of 2HG by mutant IDH might drive cancer development is not well understood.

In the present study, we postulate that intratumoral 2HG could be a useful biomarker that predicts the malignant transformation of WHO grade II LGG. We therefore screened for IDH mutations in patients with LGG and measured the accumulation of 2HG in 2 populations of patients, patients with LGG with and without malignant transformation, with use of liquid chromatography–tandem mass spectrometry (LC-MS/MS). Furthermore, we compared the concentrations of 2HG in LGG and their consecutive secondary glioblastomas (sGBM) to evaluate changes in metabolite levels during the malignant progression.

Objectives: To determine whether accumulation of 2-hydroxyglutarate in IDH-mutated low-grade gliomas (LGG; WHO grade II) correlates with their malignant transformation and to evaluate changes in metabolite levels during malignant progression. Methods: Samples from 54 patients were screened for IDH mutations: 17 patients with LGG without malignant transformation, 18 patients with both LGG and their consecutive secondary glioblastomas (sGBM; n = 36), 2 additional patients with sGBM, 10 patients with primary glioblastomas (pGBM), and 7 patients without gliomas. The cellular tricarboxylic acid cycle metabolites, citrate, isocitrate, 2-hydroxyglutarate, α-ketoglutarate, fumarate, and succinate were profiled by liquid chromatography-tandem mass spectrometry. Ratios of 2-hydroxyglutarate/isocitrate were used to evaluate differences in 2-hydroxyglutarate accumulation in tumors from LGG and sGBM groups, compared with pGBM and nonglioma groups. Results: IDH1 mutations were detected in 27 (77.1%) of 37 patients with LGG. In addition, in patients with LGG with malignant progression (n = 18), 17 patients were IDH1 mutated with a stable mutation status during their malignant progression. None of the patients with pGBM or nonglioma tumors had an IDH mutation. Increased 2-hydroxyglutarate/isocitrate ratios were seen in patients with IDH1-mutated LGG and sGBM, in comparison with those with IDH1-nonmutated LGG, pGBM, and nonglioma groups. However, no differences in intratumoral 2-hydroxyglutarate/isocitrate ratios were found between patients with LGG with and without malignant transformation. Furthermore, in patients with paired samples of LGG and their consecutive sGBM, the 2-hydroxyglutarate/isocitrate ratios did not differ between both tumor stages. Conclusion: Although intratumoral 2-hydroxyglutarate accumulation provides a marker for the presence of IDH mutations, the metabolite is not a useful biomarker for identifying malignant transformation or evaluating malignant progression.

LC-MS/MS Analysis of Tricarboxylic Acid Cycle (TCA) Metabolites

Instrumentation included an AB Sciex QTRAP 5500 triple quadruple mass spectrometer coupled to a high-performance liquid chromatography (HPLC) system from Shimadzu containing a binary pump system, an autosampler, and a column oven. Targeted analyses of citrate, isocitrate, α-ketoglutarate (α-KG), succinate, fumarate (Sigma-Aldrich), and 2-hydroxyglutarate (2HG; SiChem GmbH) were performed in multiple reaction monitoring (MRM) scan mode with use of negative electrospray ionization (-ESI). Expected mass/charge ratios (m/z), assumed as [M-H+], were m/z 190.9, m/z 191.0, m/z 145.0, m/z 116.9, m/z 114.8, and m/z 147.0 for citrate, isocitrate, α-KG, succinate, fumarate, and 2HG, respectively. For quantification, ratios of analytes and respective stable isotope-labeled internal standards (IS) (Table 2) were used. For quantification of isocitrate and 2HG, stable isotope-labeled succinate was used as IS because of unavailability of labeled analogs. MRM transitions are summarized in Table 2.

IDH1 Mutation and Outcome

An IDH1 mutation was detected in 27 of 35 patients with LGG (77.1%), in 10 of 17 patients in LGG1 (59%), and in 17 of 18 patients in LGG2 (95%). In all cases, IDH1 mutations were found on R132. IDH2mutations were not detected in any of the patients. The IDH1 mutation status was stable during progression from LGG to sGBM in all patients in LGG2. None of the patients with pGBM or nonglioma had an IDH mutation. Patients with LGG with an IDH1 mutation had a median PFS of 3.3 years, which was comparable to that among patients with wild-type LGG (2.8 years; P > .05). Furthermore, the OS among patients with LGG with an IDH1 mutation was not statistically different at 13.0 years compared with that among patients with LGG without an IDH1 mutation, who had an OS of 9.3 years (P = .66).

LC-MS/MS Profiling of TCA Metabolites

TCA metabolites, citrate, isocitrate, α-ketoglutarate, succinate, fumarate, and 2-hydroxyglutarate were measured in glioma samples with and without an IDH1 mutation, in samples identified as primary GBM, and in nonglioma brain tumor specimens (Fig. 1). No differences in citrate, isocitrate, α-KG, succinate, and fumarate concentrations were found when comparing all of the latter groups. Concentrations of 2HG, a side product in IDH1-mutated gliomas, were 20–34-fold higher in IDH1-mutated gliomas (0.64–0.81 µmol/g), compared with non–IDH1-mutated LGG1 (P ≤ .001). No differences were observed between IDH1-mutated gliomas and IDH1-nonmutated LGG2 and sGBM, caused by strongly elevated 2HG levels in either 1 or 2 samples in these groups, respectively. Furthermore, in IDH1-mutated gliomas, 2HG concentrations were a mean of 20 times higher than in pGBM and nongliomas (P ≤ .001) (Fig. 1). No differences were observed between the single groups of IDH1-mutated gliomas LGG1, LGG2, and sGBM in relation to 2HG concentration.

Fig. 1.  Dot-box and whisker plots show concentration ranges for TCA metabolites measured in IDH1-nonmutated (IDH1wt) and IDH1-mutated (IDH1mut) LGG and sGBM and in pGBM and nonglioma tumor specimens

http://www.ncbi.nlm.nih.gov/pmc/articles/PMC3661092/bin/not00601.gif

To detect possible differences among the IDH1-mutated LGG1, LGG2, and sGBM, the α-KG/isocitrate and 2HG/isocitrate ratios were used in additional tests. Therefore, the direct precursor-product relation would correct for all differences possibly expected during pre-analytical processing. To prove this, analyte ratios ofIDH1-mutated and nonmutated gliomas were compared. IDH1-mutated gliomas showed a 2HG/isocitrate ratio that was 13 times higher (P ≤ .001) (Fig. 2A), which corresponds to a lower accumulation of 2HG inIDH1-nonmutated gliomas. α-KG/isocitrate ratios were determined to be approximately 10-fold higher inIDH1-mutated gliomas than in IDH1-nonmutated gliomas (P = .005) (Fig. 2B), which also implies lower accumulation of α-KG in IDH1-nonmutated gliomas.

2-hydroxyglutarate-to-isocitrate-ratios

2-hydroxyglutarate-to-isocitrate-ratios

http://www.ncbi.nlm.nih.gov/pmc/articles/PMC3661092/bin/not00602.jpg

Fig. 2.  2-Hydroxyglutarate to isocitrate ratios (A) and α-ketoglutarate to isocitrate ratios (B) for IDH1-nonmutated (IDH1wt) and IDH1-mutated (IDH1mut) gliomas (LGG and sGBM); boxes span the 25th and 75th percentiles with median, and whiskers represent the 10th and 90th percentiles with points as outliers. Abbreviations: LGG, low-grade gliomas; sGBM, secondary glioblastomas.

2HG/isocitrate and α-KG/isocitrate ratios, respectively, were calculated in all 8 specimen groups (Fig. 3). In addition to the differences in 2HG/isocitrate ratios of IDH1-mutated and nonmutated gliomas (Fig. 2A), the ratios in IDH1-mutated gliomas were 4–9 times higher, compared with those in pGBM (P ≤ .001), and 3–6 times higher, compared with those in non-glioma tumor specimens, which was not statistically significant (Fig. 3A). In detail, ratios of 2HG and isocitrate were established to be 13, 9.4, and 22 times higher in IDH1-mutated LGG1, LGG2, and their consecutive sGBM, respectively, than in IDH1-nonmutated LGG1 (Fig. 3A). No significant differences were observed between IDH1-mutated gliomas and IDH1-nonmutated LGG2 and sGBM. The comparison of 2HG/isocitrate ratios between IDH1-nonmutated gliomas and IDH1-mutated LGG2 and sGBM showed no statistically significant differences. However, a trend toward higher ratios inIDH1-mutated LGG1/2 was seen. Furthermore, no differences could be determined by comparing 2HG/isocitrate ratios measured in the groups of IDH1-mutated LGG1 and LGG2. Although 2HG/isocitrate ratios in IDH1-mutated secondary glioblastomas are 1.7 and 2.3 times higher than in the LGG1 and LGG2 groups, respectively, no statistically significant differences were observed.   Fig. 3.

http://www.ncbi.nlm.nih.gov/pmc/articles/PMC3661092/bin/not00603.gif

The absence of a straight trend to higher 2HG/isocitrate ratios during malignant progression is shown by paired analysis of IDH1-mutated LGG2 and their consecutive sGBM (Fig. 3C). Similar findings were observed using the α-KG/isocitrate ratios. Although significant differences were found, with ratios approximately 10 times higher in IDH1-mutated glioblastomas than in IDH1-nonmutated glioblastomas (Fig. 2B), it was not possible to differentiate among the 3 IDH1-mutated glioblastoma groups LGG1, LGG2, and their consecutive sGBM with use of this analyte ratio (Fig. 3B and D).

On the basis of a comprehensive analysis of cellular TCA metabolites from several cohorts of patients with glioma and nonglioma, our study provides evidence that the level of 2HG accumulation is not suitable as an early biomarker for distinguishing patients with LGG in relation to their course of malignancy. To our knowledge, this is the first report of a paired analysis of 2HG levels in LGG and their consecutive sGBM showing stable 2HG accumulation during malignant progression. This fact assumes that malignant transformation of IDH-mutated LGG appears to be independent of their intracellular 2HG accumulation. Considering these results, we could not stratify patients with LGG into subgroups with distinct survival.

2.1.4.2 An Inhibitor of Mutant IDH1 Delays Growth and Promotes Differentiation of Glioma Cells

Rohle D1, Popovici-Muller J, Palaskas N, Turcan S, Grommes C, et al.
Science. 2013 May 3; 340(6132):626-30
http://dx.doi.org:/10.1126/science.1236062

The recent discovery of mutations in metabolic enzymes has rekindled interest in harnessing the altered metabolism of cancer cells for cancer therapy. One potential drug target is isocitrate dehydrogenase 1 (IDH1), which is mutated in multiple human cancers. Here, we examine the role of mutant IDH1 in fully transformed cells with endogenous IDH1 mutations. A selective R132H-IDH1 inhibitor (AGI-5198) identified through a high-throughput screen blocked, in a dose-dependent manner, the ability of the mutant enzyme (mIDH1) to produce R-2-hydroxyglutarate (R-2HG). Under conditions of near-complete R-2HG inhibition, the mIDH1 inhibitor induced demethylation of histone H3K9me3 and expression of genes associated with gliogenic differentiation. Blockade of mIDH1 impaired the growth of IDH1-mutant–but not IDH1-wild-type–glioma cells without appreciable changes in genome-wide DNA methylation. These data suggest that mIDH1 may promote glioma growth through mechanisms beyond its well-characterized epigenetic effects.

Somatic mutations in the metabolic enzyme isocitrate dehydrogenase (IDH) have recently been identified in multiple human cancers, including glioma (12), sarcoma (34), acute myeloid leukemia (56), and others. All mutations map to arginine residues in the catalytic pockets of IDH1 (R132) or IDH2 (R140 and R172) and confer on the enzymes a new activity: catalysis of alpha-ketoglutarate (2-OG) to the (R)-enantiomer of 2-hydroxyglutarate (R-2HG) (78). R-2HG is structurally similar to 2-OG and, due to its accumulation to millimolar concentrations in IDH1-mutant tumors, competitively inhibits 2-OG–dependent dioxygenases (9).

The mechanism by which mutant IDH1 contributes to the pathogenesis of human glioma remains incompletely understood. Mutations in IDH1 are found in 50 to 80% of human low-grade (WHO grade II) glioma, a disease that progresses to fatal WHO grade III (anaplastic glioma) and WHO grade IV (glioblastoma) tumors over the course of 3 to 15 years. IDH1 mutations appear to precede the occurrence of other mutations (10) and are associated with a distinctive gene-expression profile (“proneural” signature), DNA hypermethylation [CpG island methylator phenotype (CIMP)], and certain clinicopathological features (1113). When ectopically expressed in immortalized human astrocytes, R132H-IDH1 promotes the growth of these cells in soft agar (14) and induces epigenetic alterations found in IDH1-mutant human gliomas (15,16). However, no tumor formation was observed when R132H-IDH1 was expressed from the endogenousIDH1 locus in several cell types of the murine central nervous system (17).

To explore the role of mutant IDH1 in tumor maintenance, we used a compound that was identified in a high-throughput screen for compounds that inhibit the IDH1-R132H mutant homodimer (fig. S1 and supplementary materials) (18). This compound, subsequently referred to as AGI-5198 (Fig. 1A), potently inhibited mutant IDH1 [R132H-IDH1; half-maximal inhibitory concentration (IC50), 0.07 µM) but not wild-type IDH1 (IC50 > 100 µM) or any of the examined IDH2 isoforms (IC50 > 100 µM) (Fig. 1B). We observed no induction of nonspecific cell death at the highest examined concentration of AGI-5198 (20 µM).

Fig. 1 An R132H-IDH1 inhibitor blocks R-2HG production and soft-agar growth of IDH1-mutant glioma cells

http://www.ncbi.nlm.nih.gov/pmc/articles/PMC3985613/bin/nihms504357f1.jpg

an-r132h-idh1-inhibitor-blocks-r-2hg-production-and-soft-agar-growth-of-idh1-mutant-glioma-cells

an-r132h-idh1-inhibitor-blocks-r-2hg-production-and-soft-agar-growth-of-idh1-mutant-glioma-cells

(A) Chemical structure of AGI-5198. (B) IC50 of AGI-5198 against different isoforms of IDH1 and IDH2, measured in vitro. (C) Sanger sequencing chromatogram (top) and comparative genomic hybridization profile array (bottom) of TS603 glioma cells. (D) AGI-5198 inhibits R-2HG production in R132H-IDH1 mutant TS603 glioma cells. Cells were treated for 2 days with AGI-5198, and R-2HG was measured in cell pellets. R-2HG concentrations are indicated above each bar (in mM). Error bars, mean ± SEM of triplicates. (E and F) AGI-5198 impairs soft-agar colony formation of (E) IDH1-mutant TS603 glioma cells [*P < 0.05, one-way analysis of variance (ANOVA)] but not (F) IDH1–wild-type glioma cell lines (TS676 and TS516). Error bars, mean ± SEM of triplicates.

We next explored the activity of AGI-5198 in TS603 glioma cells with an endogenous heterozygous R132H-IDH1 mutation, the most common IDH mutation in glioma (2). TS603 cells were derived from a patient with anaplastic oligodendroglioma (WHO grade III) and harbor another pathognomomic lesion for this glioma subtype, namely co-deletion of the short arm of chromosome 1 (1p) and the long arm of chromosome 19 (19q) (19) (Fig. 1C). Measurements of R-2HG concentrations in pellets of TS603 glioma cells demonstrated dose-dependent inhibition of the mutant IDH1 enzyme by AGI-5198 (Fig. 1D). When added to TS603 glioma cells growing in soft agar, AGI-5198 inhibited colony formation by 40 to 60% (Fig. 1E). AGI-5198 did not impair colony formation of two patient-derived glioma lines that express only the wild-type IDH1allele (TS676 and TS516) (Fig. 1F), further supporting the selectivity of AGI-5198.

After exploratory pharmacokinetic studies in mice (fig. S2), we examined the effects of orally administered AGI-5198 on the growth of human glioma xenografts. When given daily to mice with established R132H-IDH1 glioma xenografts, AGI-5198 [450 mg per kg of weight (mg/kg) per os] caused 50 to 60% growth inhibition (Fig. 2A). Treatment was tolerated well with no signs of toxicity during 3 weeks of daily treatment (fig. S3). Tumors from AGI-5198– treated mice showed reduced staining with an antibody against the Ki-67 protein, a marker used for quantification of tumor cell proliferation in human brain tumors. In contrast, staining with an antibody against cleaved caspase-3 showed no differences between tumors from vehicle and AGI-5198–treated mice (fig. S4), suggesting that the growth-inhibitory effects of AGI-5198 were primarily due to impaired tumor cell proliferation rather than induction of apoptotic cell death. AGI-5198 did not affect the growth of IDH1 wild-type glioma xenografts (Fig. 2B).

Fig. 2 AGI-5198 impairs growth of IDH1-mutant glioma xenografts in mice

http://www.ncbi.nlm.nih.gov/corecgi/tileshop/tileshop.fcgi?p=PMC3&id=735048&s=43&r=3&c=2

AGI-5198 impairs growth of IDH1-mutant glioma xenografts in mice

AGI-5198 impairs growth of IDH1-mutant glioma xenografts in mice

Given the likely prominent role of R-2HG in the pathogenesis of IDH-mutant human cancers, we investigated whether intratumoral depletion of this metabolite would have similar growth inhibitory effects onR132H-IDH1-mutant glioma cells as AGI-5198. We engineered TS603 sublines in which IDH1–short hairpin RNA (shRNA) targeting sequences were expressed from a doxycycline-inducible cassette. Doxycycline had no effect on IDH1 protein levels in cells expressing the vector control but depleted IDH1 protein levels by 60 to 80% in cells infected with IDH1-shRNA targeting sequences (Fig. 2C). We next injected these cells into the flanks of mice with severe combined immunodeficiency and, after establishment of subcutaneous tumors, randomized the mice to receive either regular chow or doxycycline-containing chow. As predicted from our experiments with AGI-5198, doxycycline impaired the growth of TS603 glioma cells expressing inducible IDH1-shRNAs in soft agar (fig. S5) and in vivo (Fig. 2D) but had no effect on the growth of tumors expressing the vector control (fig. S6). Immunohistochemistry (IHC) with a mutant-specific R132H-IDH1 antibody confirmed depletion of the mutant IDH1 protein in IDH1-shRNA tumors treated with doxycycline. This was associated with an 80 to 90% reduction in intratumoral R-2HG levels, similar to the levels observed in TS603 glioma xenografts treated with AGI-5198 (fig. S7). Knockdown of the IDH1 protein in R132C-IDH1-mutant HT1080 sarcoma cells similarly impaired the growth of these cells in vitro and in vivo (fig. S8).

Fig. 3 AGI-5198 promotes astroglial differentiation in R132H-IDH1  mutant cells
http://www.ncbi.nlm.nih.gov/pmc/articles/PMC3985613/bin/nihms504357f3.jpg

The gene-expression data suggested that treatment of IDH1-mutant glioma xenografts with AGI-5198 promotes a gene-expression program akin to gliogenic (i.e., astrocytic and oligodendrocytic) differentiation. To examine this question further, we treated TS603 glioma cells ex vivo with AGI-5198 and performed immunofluorescence for glial fibrillary acidic protein (GFAP) and nestin (NES) as markers for astrocytes and undifferentiated neuroprogenitor cells, respectively. .. We investigated whether blockade of mutant IDH1 could restore this ability, and this was indeed the case (Fig. 3D). These results indicate that mIDH1 plays an active role in restricting cellular differentiation potential, and this defect is acutely reversible by blockade of the mutant enzyme.

In the developing central nervous system, gliogenic differentiation is regulated through changes in DNA and histone methylation (24). Mutant IDH1 can affect both epigenetic processes through R-2HG mediated suppression of TET (ten-eleven translocation) methyl cytosine hydroxylases and Jumonji-C domain histone demethylases (JHDMs). We therefore sought to define the epigenetic changes that were associated with the acute growth-inhibitory effects of AGI-5198 in vivo. .. Treatment of mice with AGI-5198 resulted in dose-dependent reduction of intratumoral R-2HG with partial R-2HG reduction at the 150 mg/kg dose (0.85 ± 0.22 mM) and near-complete reduction at the 450 mg/kg dose (0.13 ± 0.03 mM) (Fig. 4A).

Fig. 4 Dose-dependent inhibition of histone methylation in IDH1-mutant gliomas after short term treatment with AGI-5198

http://www.ncbi.nlm.nih.gov/pmc/articles/PMC3985613/bin/nihms504357f4.gif

We next examined whether acute pharmacological blockade of the mutant IDH1 enzyme reversed the CIMP, which is strongly associated with IDH1-mutant human gliomas (12). ..  On a genome-wide scale, we observed no statistically significant change in the distribution of β values between AGI-5198– and vehicle-treated tumors (Fig. 4B) (supplementary materials).
We next examined the kinetics of histone demethylation after inhibition of the mutant IDH1 enzyme. The histone demethylases JMJD2A and JMJD2C, which remove bi- and trimethyl marks from H3K9, are significantly more sensitive to inhibition by the R-2HG oncometabolite than other 2-OG–dependent oxygenases (891425). Restoring their enzymatic activity in IDH1-mutant cancer cells would thus be expected to require near-complete inhibition of R-2HG production. Consistent with this prediction, tumors from the 450 mg/kg AGI-5198 cohort showed a marked decrease in H3K9me3 staining, but there was no decrease in H3K9me3 staining in tumors from the 150 mg/kg AGI-5198 cohort (Fig. 4C) (fig. S11). Of note, AGI-5198 did not decrease H3K9 trimethylation in IDH1–wild-type glioma xenografts (fig. S12A) or in normal astrocytes (fig. S12B), demonstrating that the effect of AGI-5198 on histone methylation was not only dose-dependent but also IDH1-mutant selective.

Because the inability to erase repressive H3K9 methylation can be sufficient to impair cellular differentiation of nontransformed cells (16), we examined the TS603 xenograft tumors for changes in the RNA expression of astrocytic (GFAP, AQP4, and ATP1A2) and oligodendrocytic (CNP and NG2) differentiation markers by real-time polymerase chain reaction (RT-PCR). Compared with vehicletreated tumors, we observed an increase in the expression of astroglial differentiation genes only in tumors treated with 450 mg/kg AGI-5198 (Fig. 4D).

In summary, we describe a tool compound (AGI-5198) that impairs the growth of R132H-IDH1-mutant, but not IDH1 wild-type, glioma cells. This data demonstrates an important role of mutant IDH1 in tumor maintenance, in addition to its ability to promote transformation in certain cellular contexts (1426). Effector pathways of mutant IDH remain incompletely understood and may differ between tumor types, reflecting clinical differences between these disorders. Although much attention has been directed toward TET-family methyl cytosine hydroxylases and Jumonji-C domain histone demethylases, the family of 2-OG–dependent dioxygenases includes more than 50 members with diverse functions in collagen maturation, hypoxic sensing, lipid biosynthesis/metabolism, and regulation of gene expression (27).

2.1.4.3 Detection of oncogenic IDH1 mutations using MRS

OC Andronesi, O Rapalino, E Gerstner, A Chi, TT Batchelor, et al.
J Clin Invest. 2013;123(9):3659–3663
http://dx.doi.org:/10.1172/JCI67229

The investigation of metabolic pathways disturbed in isocitrate dehydrogenase (IDH) mutant tumors revealed that the hallmark metabolic alteration is the production of D-2-hydroxyglutarate (D-2HG). The biological impact of D-2HG strongly suggests that high levels of this metabolite may play a central role in propagating downstream the effects of mutant IDH, leading to malignant transformation of cells. Hence, D-2HG may be an ideal biomarker for both diagnosing and monitoring treatment response targeting IDH mutations. Magnetic resonance spectroscopy (MRS) is well suited to the task