Mitochondrial Isocitrate Dehydrogenase and Variants
Writer and Curator: Larry H. Bernstein, MD, FCAP
2.1.4 Mitochondrial Isocitrate Dehydrogenase (IDH) and variants
2.1.4.1 Accumulation of 2-hydroxyglutarate is not a biomarker for malignant progression of IDH-mutated low grade gliomas
Juratli TA, Peitzsch M, Geiger K, Schackert G, Eisenhofer G, Krex D.
Neuro Oncol. 2013 Jun;15(6):682-90
http://dx.doi.org:/10.1093/neuonc/not006
Low-grade gliomas (LGG) occur in the cerebral hemispheres and represent 10%–15% of all astrocytic brain tumors.1 Despite long-term survival in many patients, 50%–75% of patients with LGG eventually die of either progression of a low-grade tumor or transformation to a malignant glioma.2 The time to progression can vary from a few months to several years,3–5 and the median survival among patients with LGG ranges from 5 to 10 years.6,7 Among several risk factors, only age, histology, tumor location, and Karnofsky performance index have generally been accepted as prognostic factors for patients with LGG.8,9 As a prognostic molecular marker, only 1p19q codeletion was identified as such in pure oligodendrogliomas. However, this association was not seen in either astrocytomas or oligoastrocytomas.10
Somatic mutations in human cytosolic isocitrate dehydrogenases 1 (IDH1) were first described in 2008 in ∼12% of glioblastomas11 and later in acute myeloid leukemia, in which the reported mutations were missense and specific for a single R132 residue.11,12 Some gliomas lacking cytosolic IDH1 mutations were later observed to have mutations in IDH2, the mitochondrial homolog of IDH1.12 IDH mutations are the most commonly mutated genes in many types of gliomas, with incidences of up to 75% in grade II and grade III gliomas.13,14 Further frequent mutations in patients with LGG were recently identified, including inactivating alterations in alpha thalassemia/mental retardation syndrome X-linked (ATRX), inactivating mutations in 2 suppressor genes, homolog of Drosophila capicua (CIC) and far-upstream binding protein 1 (FUBP1), in about 70% of grade II gliomas and 57% of sGBM.15–17 The association between ATRX mutations with IDHmutations and the association between CIC/FUBP1 mutations and IDH mutations and 1p/19q loss are especially common among the grade II-III gliomas and remarkably homogeneous in terms of genetic alterations and clinical characteristics.16
It was thought that IDH mutations might be a prognostic factor in LGG, predicting a prolonged survival from the beginning of the disease.18–23 However, this assumption, as shown in our and other earlier studies, had to be corrected because survival among patients who have LGG with IDH mutations is only improved after transformation to secondary high-grade gliomas.18,19,24 Furthermore, it had already been demonstrated that an IDH mutation is not a biomarker for further malignant transformation in LGG.18 IDH1 and IDH2 catalyze the oxidative decarboxylation of isocitrate to α-ketoglutarate (α-KG) and reduce NADP to NADPH.25 The mutations inactivate the standard enzymatic activity of IDH112 and confer novel activity on IDH1 for conversion of α-KG and NADPH to 2-hydroxyglutarate (2HG) and NADP+, supporting the evidence thatIDH1 and 2 are proto-oncogenes. This gain of function causes an accumulation of 2HG in glioma and acute myeloid leukemia samples.26,27 The 2HG levels in cancers with IDH mutations are found to be consistently elevated by 10–100-fold, compared with levels in samples lacking mutations of IDH1 or IDH2.26,28Nevertheless, how exactly the production or accumulation of 2HG by mutant IDH might drive cancer development is not well understood.
In the present study, we postulate that intratumoral 2HG could be a useful biomarker that predicts the malignant transformation of WHO grade II LGG. We therefore screened for IDH mutations in patients with LGG and measured the accumulation of 2HG in 2 populations of patients, patients with LGG with and without malignant transformation, with use of liquid chromatography–tandem mass spectrometry (LC-MS/MS). Furthermore, we compared the concentrations of 2HG in LGG and their consecutive secondary glioblastomas (sGBM) to evaluate changes in metabolite levels during the malignant progression.
Objectives: To determine whether accumulation of 2-hydroxyglutarate in IDH-mutated low-grade gliomas (LGG; WHO grade II) correlates with their malignant transformation and to evaluate changes in metabolite levels during malignant progression. Methods: Samples from 54 patients were screened for IDH mutations: 17 patients with LGG without malignant transformation, 18 patients with both LGG and their consecutive secondary glioblastomas (sGBM; n = 36), 2 additional patients with sGBM, 10 patients with primary glioblastomas (pGBM), and 7 patients without gliomas. The cellular tricarboxylic acid cycle metabolites, citrate, isocitrate, 2-hydroxyglutarate, α-ketoglutarate, fumarate, and succinate were profiled by liquid chromatography-tandem mass spectrometry. Ratios of 2-hydroxyglutarate/isocitrate were used to evaluate differences in 2-hydroxyglutarate accumulation in tumors from LGG and sGBM groups, compared with pGBM and nonglioma groups. Results: IDH1 mutations were detected in 27 (77.1%) of 37 patients with LGG. In addition, in patients with LGG with malignant progression (n = 18), 17 patients were IDH1 mutated with a stable mutation status during their malignant progression. None of the patients with pGBM or nonglioma tumors had an IDH mutation. Increased 2-hydroxyglutarate/isocitrate ratios were seen in patients with IDH1-mutated LGG and sGBM, in comparison with those with IDH1-nonmutated LGG, pGBM, and nonglioma groups. However, no differences in intratumoral 2-hydroxyglutarate/isocitrate ratios were found between patients with LGG with and without malignant transformation. Furthermore, in patients with paired samples of LGG and their consecutive sGBM, the 2-hydroxyglutarate/isocitrate ratios did not differ between both tumor stages. Conclusion: Although intratumoral 2-hydroxyglutarate accumulation provides a marker for the presence of IDH mutations, the metabolite is not a useful biomarker for identifying malignant transformation or evaluating malignant progression.
LC-MS/MS Analysis of Tricarboxylic Acid Cycle (TCA) Metabolites
Instrumentation included an AB Sciex QTRAP 5500 triple quadruple mass spectrometer coupled to a high-performance liquid chromatography (HPLC) system from Shimadzu containing a binary pump system, an autosampler, and a column oven. Targeted analyses of citrate, isocitrate, α-ketoglutarate (α-KG), succinate, fumarate (Sigma-Aldrich), and 2-hydroxyglutarate (2HG; SiChem GmbH) were performed in multiple reaction monitoring (MRM) scan mode with use of negative electrospray ionization (-ESI). Expected mass/charge ratios (m/z), assumed as [M-H+], were m/z 190.9, m/z 191.0, m/z 145.0, m/z 116.9, m/z 114.8, and m/z 147.0 for citrate, isocitrate, α-KG, succinate, fumarate, and 2HG, respectively. For quantification, ratios of analytes and respective stable isotope-labeled internal standards (IS) (Table 2) were used. For quantification of isocitrate and 2HG, stable isotope-labeled succinate was used as IS because of unavailability of labeled analogs. MRM transitions are summarized in Table 2.
IDH1 Mutation and Outcome
An IDH1 mutation was detected in 27 of 35 patients with LGG (77.1%), in 10 of 17 patients in LGG1 (59%), and in 17 of 18 patients in LGG2 (95%). In all cases, IDH1 mutations were found on R132. IDH2mutations were not detected in any of the patients. The IDH1 mutation status was stable during progression from LGG to sGBM in all patients in LGG2. None of the patients with pGBM or nonglioma had an IDH mutation. Patients with LGG with an IDH1 mutation had a median PFS of 3.3 years, which was comparable to that among patients with wild-type LGG (2.8 years; P > .05). Furthermore, the OS among patients with LGG with an IDH1 mutation was not statistically different at 13.0 years compared with that among patients with LGG without an IDH1 mutation, who had an OS of 9.3 years (P = .66).
LC-MS/MS Profiling of TCA Metabolites
TCA metabolites, citrate, isocitrate, α-ketoglutarate, succinate, fumarate, and 2-hydroxyglutarate were measured in glioma samples with and without an IDH1 mutation, in samples identified as primary GBM, and in nonglioma brain tumor specimens (Fig. 1). No differences in citrate, isocitrate, α-KG, succinate, and fumarate concentrations were found when comparing all of the latter groups. Concentrations of 2HG, a side product in IDH1-mutated gliomas, were 20–34-fold higher in IDH1-mutated gliomas (0.64–0.81 µmol/g), compared with non–IDH1-mutated LGG1 (P ≤ .001). No differences were observed between IDH1-mutated gliomas and IDH1-nonmutated LGG2 and sGBM, caused by strongly elevated 2HG levels in either 1 or 2 samples in these groups, respectively. Furthermore, in IDH1-mutated gliomas, 2HG concentrations were a mean of 20 times higher than in pGBM and nongliomas (P ≤ .001) (Fig. 1). No differences were observed between the single groups of IDH1-mutated gliomas LGG1, LGG2, and sGBM in relation to 2HG concentration.
Fig. 1. Dot-box and whisker plots show concentration ranges for TCA metabolites measured in IDH1-nonmutated (IDH1wt) and IDH1-mutated (IDH1mut) LGG and sGBM and in pGBM and nonglioma tumor specimens
http://www.ncbi.nlm.nih.gov/pmc/articles/PMC3661092/bin/not00601.gif
To detect possible differences among the IDH1-mutated LGG1, LGG2, and sGBM, the α-KG/isocitrate and 2HG/isocitrate ratios were used in additional tests. Therefore, the direct precursor-product relation would correct for all differences possibly expected during pre-analytical processing. To prove this, analyte ratios ofIDH1-mutated and nonmutated gliomas were compared. IDH1-mutated gliomas showed a 2HG/isocitrate ratio that was 13 times higher (P ≤ .001) (Fig. 2A), which corresponds to a lower accumulation of 2HG inIDH1-nonmutated gliomas. α-KG/isocitrate ratios were determined to be approximately 10-fold higher inIDH1-mutated gliomas than in IDH1-nonmutated gliomas (P = .005) (Fig. 2B), which also implies lower accumulation of α-KG in IDH1-nonmutated gliomas.

2-hydroxyglutarate-to-isocitrate-ratios
http://www.ncbi.nlm.nih.gov/pmc/articles/PMC3661092/bin/not00602.jpg
Fig. 2. 2-Hydroxyglutarate to isocitrate ratios (A) and α-ketoglutarate to isocitrate ratios (B) for IDH1-nonmutated (IDH1wt) and IDH1-mutated (IDH1mut) gliomas (LGG and sGBM); boxes span the 25th and 75th percentiles with median, and whiskers represent the 10th and 90th percentiles with points as outliers. Abbreviations: LGG, low-grade gliomas; sGBM, secondary glioblastomas.
2HG/isocitrate and α-KG/isocitrate ratios, respectively, were calculated in all 8 specimen groups (Fig. 3). In addition to the differences in 2HG/isocitrate ratios of IDH1-mutated and nonmutated gliomas (Fig. 2A), the ratios in IDH1-mutated gliomas were 4–9 times higher, compared with those in pGBM (P ≤ .001), and 3–6 times higher, compared with those in non-glioma tumor specimens, which was not statistically significant (Fig. 3A). In detail, ratios of 2HG and isocitrate were established to be 13, 9.4, and 22 times higher in IDH1-mutated LGG1, LGG2, and their consecutive sGBM, respectively, than in IDH1-nonmutated LGG1 (Fig. 3A). No significant differences were observed between IDH1-mutated gliomas and IDH1-nonmutated LGG2 and sGBM. The comparison of 2HG/isocitrate ratios between IDH1-nonmutated gliomas and IDH1-mutated LGG2 and sGBM showed no statistically significant differences. However, a trend toward higher ratios inIDH1-mutated LGG1/2 was seen. Furthermore, no differences could be determined by comparing 2HG/isocitrate ratios measured in the groups of IDH1-mutated LGG1 and LGG2. Although 2HG/isocitrate ratios in IDH1-mutated secondary glioblastomas are 1.7 and 2.3 times higher than in the LGG1 and LGG2 groups, respectively, no statistically significant differences were observed. Fig. 3.
http://www.ncbi.nlm.nih.gov/pmc/articles/PMC3661092/bin/not00603.gif
The absence of a straight trend to higher 2HG/isocitrate ratios during malignant progression is shown by paired analysis of IDH1-mutated LGG2 and their consecutive sGBM (Fig. 3C). Similar findings were observed using the α-KG/isocitrate ratios. Although significant differences were found, with ratios approximately 10 times higher in IDH1-mutated glioblastomas than in IDH1-nonmutated glioblastomas (Fig. 2B), it was not possible to differentiate among the 3 IDH1-mutated glioblastoma groups LGG1, LGG2, and their consecutive sGBM with use of this analyte ratio (Fig. 3B and D).
On the basis of a comprehensive analysis of cellular TCA metabolites from several cohorts of patients with glioma and nonglioma, our study provides evidence that the level of 2HG accumulation is not suitable as an early biomarker for distinguishing patients with LGG in relation to their course of malignancy. To our knowledge, this is the first report of a paired analysis of 2HG levels in LGG and their consecutive sGBM showing stable 2HG accumulation during malignant progression. This fact assumes that malignant transformation of IDH-mutated LGG appears to be independent of their intracellular 2HG accumulation. Considering these results, we could not stratify patients with LGG into subgroups with distinct survival.
2.1.4.2 An Inhibitor of Mutant IDH1 Delays Growth and Promotes Differentiation of Glioma Cells
Rohle D1, Popovici-Muller J, Palaskas N, Turcan S, Grommes C, et al.
Science. 2013 May 3; 340(6132):626-30
http://dx.doi.org:/10.1126/science.1236062
The recent discovery of mutations in metabolic enzymes has rekindled interest in harnessing the altered metabolism of cancer cells for cancer therapy. One potential drug target is isocitrate dehydrogenase 1 (IDH1), which is mutated in multiple human cancers. Here, we examine the role of mutant IDH1 in fully transformed cells with endogenous IDH1 mutations. A selective R132H-IDH1 inhibitor (AGI-5198) identified through a high-throughput screen blocked, in a dose-dependent manner, the ability of the mutant enzyme (mIDH1) to produce R-2-hydroxyglutarate (R-2HG). Under conditions of near-complete R-2HG inhibition, the mIDH1 inhibitor induced demethylation of histone H3K9me3 and expression of genes associated with gliogenic differentiation. Blockade of mIDH1 impaired the growth of IDH1-mutant–but not IDH1-wild-type–glioma cells without appreciable changes in genome-wide DNA methylation. These data suggest that mIDH1 may promote glioma growth through mechanisms beyond its well-characterized epigenetic effects.
Somatic mutations in the metabolic enzyme isocitrate dehydrogenase (IDH) have recently been identified in multiple human cancers, including glioma (1, 2), sarcoma (3, 4), acute myeloid leukemia (5, 6), and others. All mutations map to arginine residues in the catalytic pockets of IDH1 (R132) or IDH2 (R140 and R172) and confer on the enzymes a new activity: catalysis of alpha-ketoglutarate (2-OG) to the (R)-enantiomer of 2-hydroxyglutarate (R-2HG) (7, 8). R-2HG is structurally similar to 2-OG and, due to its accumulation to millimolar concentrations in IDH1-mutant tumors, competitively inhibits 2-OG–dependent dioxygenases (9).
The mechanism by which mutant IDH1 contributes to the pathogenesis of human glioma remains incompletely understood. Mutations in IDH1 are found in 50 to 80% of human low-grade (WHO grade II) glioma, a disease that progresses to fatal WHO grade III (anaplastic glioma) and WHO grade IV (glioblastoma) tumors over the course of 3 to 15 years. IDH1 mutations appear to precede the occurrence of other mutations (10) and are associated with a distinctive gene-expression profile (“proneural” signature), DNA hypermethylation [CpG island methylator phenotype (CIMP)], and certain clinicopathological features (11–13). When ectopically expressed in immortalized human astrocytes, R132H-IDH1 promotes the growth of these cells in soft agar (14) and induces epigenetic alterations found in IDH1-mutant human gliomas (15,16). However, no tumor formation was observed when R132H-IDH1 was expressed from the endogenousIDH1 locus in several cell types of the murine central nervous system (17).
To explore the role of mutant IDH1 in tumor maintenance, we used a compound that was identified in a high-throughput screen for compounds that inhibit the IDH1-R132H mutant homodimer (fig. S1 and supplementary materials) (18). This compound, subsequently referred to as AGI-5198 (Fig. 1A), potently inhibited mutant IDH1 [R132H-IDH1; half-maximal inhibitory concentration (IC50), 0.07 µM) but not wild-type IDH1 (IC50 > 100 µM) or any of the examined IDH2 isoforms (IC50 > 100 µM) (Fig. 1B). We observed no induction of nonspecific cell death at the highest examined concentration of AGI-5198 (20 µM).
Fig. 1 An R132H-IDH1 inhibitor blocks R-2HG production and soft-agar growth of IDH1-mutant glioma cells
http://www.ncbi.nlm.nih.gov/pmc/articles/PMC3985613/bin/nihms504357f1.jpg

an-r132h-idh1-inhibitor-blocks-r-2hg-production-and-soft-agar-growth-of-idh1-mutant-glioma-cells
(A) Chemical structure of AGI-5198. (B) IC50 of AGI-5198 against different isoforms of IDH1 and IDH2, measured in vitro. (C) Sanger sequencing chromatogram (top) and comparative genomic hybridization profile array (bottom) of TS603 glioma cells. (D) AGI-5198 inhibits R-2HG production in R132H-IDH1 mutant TS603 glioma cells. Cells were treated for 2 days with AGI-5198, and R-2HG was measured in cell pellets. R-2HG concentrations are indicated above each bar (in mM). Error bars, mean ± SEM of triplicates. (E and F) AGI-5198 impairs soft-agar colony formation of (E) IDH1-mutant TS603 glioma cells [*P < 0.05, one-way analysis of variance (ANOVA)] but not (F) IDH1–wild-type glioma cell lines (TS676 and TS516). Error bars, mean ± SEM of triplicates.
We next explored the activity of AGI-5198 in TS603 glioma cells with an endogenous heterozygous R132H-IDH1 mutation, the most common IDH mutation in glioma (2). TS603 cells were derived from a patient with anaplastic oligodendroglioma (WHO grade III) and harbor another pathognomomic lesion for this glioma subtype, namely co-deletion of the short arm of chromosome 1 (1p) and the long arm of chromosome 19 (19q) (19) (Fig. 1C). Measurements of R-2HG concentrations in pellets of TS603 glioma cells demonstrated dose-dependent inhibition of the mutant IDH1 enzyme by AGI-5198 (Fig. 1D). When added to TS603 glioma cells growing in soft agar, AGI-5198 inhibited colony formation by 40 to 60% (Fig. 1E). AGI-5198 did not impair colony formation of two patient-derived glioma lines that express only the wild-type IDH1allele (TS676 and TS516) (Fig. 1F), further supporting the selectivity of AGI-5198.
After exploratory pharmacokinetic studies in mice (fig. S2), we examined the effects of orally administered AGI-5198 on the growth of human glioma xenografts. When given daily to mice with established R132H-IDH1 glioma xenografts, AGI-5198 [450 mg per kg of weight (mg/kg) per os] caused 50 to 60% growth inhibition (Fig. 2A). Treatment was tolerated well with no signs of toxicity during 3 weeks of daily treatment (fig. S3). Tumors from AGI-5198– treated mice showed reduced staining with an antibody against the Ki-67 protein, a marker used for quantification of tumor cell proliferation in human brain tumors. In contrast, staining with an antibody against cleaved caspase-3 showed no differences between tumors from vehicle and AGI-5198–treated mice (fig. S4), suggesting that the growth-inhibitory effects of AGI-5198 were primarily due to impaired tumor cell proliferation rather than induction of apoptotic cell death. AGI-5198 did not affect the growth of IDH1 wild-type glioma xenografts (Fig. 2B).
Fig. 2 AGI-5198 impairs growth of IDH1-mutant glioma xenografts in mice
http://www.ncbi.nlm.nih.gov/corecgi/tileshop/tileshop.fcgi?p=PMC3&id=735048&s=43&r=3&c=2

AGI-5198 impairs growth of IDH1-mutant glioma xenografts in mice
Given the likely prominent role of R-2HG in the pathogenesis of IDH-mutant human cancers, we investigated whether intratumoral depletion of this metabolite would have similar growth inhibitory effects onR132H-IDH1-mutant glioma cells as AGI-5198. We engineered TS603 sublines in which IDH1–short hairpin RNA (shRNA) targeting sequences were expressed from a doxycycline-inducible cassette. Doxycycline had no effect on IDH1 protein levels in cells expressing the vector control but depleted IDH1 protein levels by 60 to 80% in cells infected with IDH1-shRNA targeting sequences (Fig. 2C). We next injected these cells into the flanks of mice with severe combined immunodeficiency and, after establishment of subcutaneous tumors, randomized the mice to receive either regular chow or doxycycline-containing chow. As predicted from our experiments with AGI-5198, doxycycline impaired the growth of TS603 glioma cells expressing inducible IDH1-shRNAs in soft agar (fig. S5) and in vivo (Fig. 2D) but had no effect on the growth of tumors expressing the vector control (fig. S6). Immunohistochemistry (IHC) with a mutant-specific R132H-IDH1 antibody confirmed depletion of the mutant IDH1 protein in IDH1-shRNA tumors treated with doxycycline. This was associated with an 80 to 90% reduction in intratumoral R-2HG levels, similar to the levels observed in TS603 glioma xenografts treated with AGI-5198 (fig. S7). Knockdown of the IDH1 protein in R132C-IDH1-mutant HT1080 sarcoma cells similarly impaired the growth of these cells in vitro and in vivo (fig. S8).
Fig. 3 AGI-5198 promotes astroglial differentiation in R132H-IDH1 mutant cells
http://www.ncbi.nlm.nih.gov/pmc/articles/PMC3985613/bin/nihms504357f3.jpg
The gene-expression data suggested that treatment of IDH1-mutant glioma xenografts with AGI-5198 promotes a gene-expression program akin to gliogenic (i.e., astrocytic and oligodendrocytic) differentiation. To examine this question further, we treated TS603 glioma cells ex vivo with AGI-5198 and performed immunofluorescence for glial fibrillary acidic protein (GFAP) and nestin (NES) as markers for astrocytes and undifferentiated neuroprogenitor cells, respectively. .. We investigated whether blockade of mutant IDH1 could restore this ability, and this was indeed the case (Fig. 3D). These results indicate that mIDH1 plays an active role in restricting cellular differentiation potential, and this defect is acutely reversible by blockade of the mutant enzyme.
In the developing central nervous system, gliogenic differentiation is regulated through changes in DNA and histone methylation (24). Mutant IDH1 can affect both epigenetic processes through R-2HG mediated suppression of TET (ten-eleven translocation) methyl cytosine hydroxylases and Jumonji-C domain histone demethylases (JHDMs). We therefore sought to define the epigenetic changes that were associated with the acute growth-inhibitory effects of AGI-5198 in vivo. .. Treatment of mice with AGI-5198 resulted in dose-dependent reduction of intratumoral R-2HG with partial R-2HG reduction at the 150 mg/kg dose (0.85 ± 0.22 mM) and near-complete reduction at the 450 mg/kg dose (0.13 ± 0.03 mM) (Fig. 4A).
Fig. 4 Dose-dependent inhibition of histone methylation in IDH1-mutant gliomas after short term treatment with AGI-5198
http://www.ncbi.nlm.nih.gov/pmc/articles/PMC3985613/bin/nihms504357f4.gif
We next examined whether acute pharmacological blockade of the mutant IDH1 enzyme reversed the CIMP, which is strongly associated with IDH1-mutant human gliomas (12). .. On a genome-wide scale, we observed no statistically significant change in the distribution of β values between AGI-5198– and vehicle-treated tumors (Fig. 4B) (supplementary materials).
We next examined the kinetics of histone demethylation after inhibition of the mutant IDH1 enzyme. The histone demethylases JMJD2A and JMJD2C, which remove bi- and trimethyl marks from H3K9, are significantly more sensitive to inhibition by the R-2HG oncometabolite than other 2-OG–dependent oxygenases (8, 9, 14, 25). Restoring their enzymatic activity in IDH1-mutant cancer cells would thus be expected to require near-complete inhibition of R-2HG production. Consistent with this prediction, tumors from the 450 mg/kg AGI-5198 cohort showed a marked decrease in H3K9me3 staining, but there was no decrease in H3K9me3 staining in tumors from the 150 mg/kg AGI-5198 cohort (Fig. 4C) (fig. S11). Of note, AGI-5198 did not decrease H3K9 trimethylation in IDH1–wild-type glioma xenografts (fig. S12A) or in normal astrocytes (fig. S12B), demonstrating that the effect of AGI-5198 on histone methylation was not only dose-dependent but also IDH1-mutant selective.
Because the inability to erase repressive H3K9 methylation can be sufficient to impair cellular differentiation of nontransformed cells (16), we examined the TS603 xenograft tumors for changes in the RNA expression of astrocytic (GFAP, AQP4, and ATP1A2) and oligodendrocytic (CNP and NG2) differentiation markers by real-time polymerase chain reaction (RT-PCR). Compared with vehicletreated tumors, we observed an increase in the expression of astroglial differentiation genes only in tumors treated with 450 mg/kg AGI-5198 (Fig. 4D).
In summary, we describe a tool compound (AGI-5198) that impairs the growth of R132H-IDH1-mutant, but not IDH1 wild-type, glioma cells. This data demonstrates an important role of mutant IDH1 in tumor maintenance, in addition to its ability to promote transformation in certain cellular contexts (14, 26). Effector pathways of mutant IDH remain incompletely understood and may differ between tumor types, reflecting clinical differences between these disorders. Although much attention has been directed toward TET-family methyl cytosine hydroxylases and Jumonji-C domain histone demethylases, the family of 2-OG–dependent dioxygenases includes more than 50 members with diverse functions in collagen maturation, hypoxic sensing, lipid biosynthesis/metabolism, and regulation of gene expression (27).
2.1.4.3 Detection of oncogenic IDH1 mutations using MRS
OC Andronesi, O Rapalino, E Gerstner, A Chi, TT Batchelor, et al.
J Clin Invest. 2013;123(9):3659–3663
http://dx.doi.org:/10.1172/JCI67229
The investigation of metabolic pathways disturbed in isocitrate dehydrogenase (IDH) mutant tumors revealed that the hallmark metabolic alteration is the production of D-2-hydroxyglutarate (D-2HG). The biological impact of D-2HG strongly suggests that high levels of this metabolite may play a central role in propagating downstream the effects of mutant IDH, leading to malignant transformation of cells. Hence, D-2HG may be an ideal biomarker for both diagnosing and monitoring treatment response targeting IDH mutations. Magnetic resonance spectroscopy (MRS) is well suited to the task of noninvasive D-2HG detection, and there has been much interest in developing such methods. Here, we review recent efforts to translate methodology using MRS to reliably measure in vivo D-2HG into clinical research.
Recurrent heterozygous somatic mutations of the isocitrate dehydrogenase 1 and 2 (IDH1 and IDH2) genes were recently found by genome-wide sequencing to be highly frequent (50%–80%) in human grade II–IV gliomas (1, 2). IDH mutations are also often observed in several other cancers, including acute myeloid leukemia (3), central/periosteal chondrosarcoma and enchondroma (4), and intrahepatic cholangiocarcinoma (5). The identification of frequent IDH mutations in multiple cancers suggests that this pathway is involved in oncogenesis. Indeed, increasing evidence demonstrates that IDH mutations alter downstream epigenetic and genetic cellular signal transduction pathways in tumors (6, 7). In gliomas, IDH1 mutations appear to define a distinct clinical subset of tumors, as these patients have a 2- to 4-fold longer median survival compared with patients with wild-type IDH1 gliomas (8). IDH1 mutations are especially common in secondary glioblastoma (GBM) arising from lower-grade gliomas, arguing that these mutations are early driver events in this disease (9). Despite aggressive therapy with surgery, radiation, and cytotoxic chemotherapy, average survival of patients with GBM is less than 2 years, and less than 10% of patients survive 5 years or more (10).
The discovery of cancer-related IDH1 mutations has raised hopes that this pathway can be targeted for therapeutic benefit (11, 12). Methods that can rapidly and noninvasively identify patients for clinical trials and determine the pharmacodynamic effect of candidate agents in patients enrolled in trials are particularly important to guide and accelerate the translation of these treatments from bench to bedside. Magnetic resonance spectroscopy (MRS) can play an important role in clinical and translational research because IDH mutated tumor cells have such a distinct molecular phenotype (13,14).
The family of IDH enzymes includes three isoforms: IDH1, which localizes in peroxisomes and cytoplasm, and IDH2 and IDH3, which localize in mitochondria as part of the tricarboxylic acid cycle (11). All three wild-type enzymes catalyze the oxidative decarboxylation of isocitrate to α-ketoglutarate (αKG), using the cofactor NADP+ (IDH1 and IDH2) or NAD+(IDH3) as the electron acceptor. To date, only mutations of IDH1 and IDH2 have been identified in human cancers (11), and only one allele is mutated. In gliomas, about 90% of IDH mutations involve a substitution in IDH1 in which arginine 132 (R132) from the catalytic site is replaced by a histidine (IDH1 R132H), known as the canonical IDH1 mutation (8). A number of noncanonical mutations such as IDH1 R132C, IDH1 R132S, IDH1 R132L, and IDH1 R132G are less frequently present. Arginine R172 in IDH2 is the corresponding residue to R132 in IDH1, and the most common mutation is IDH2 R172K. In addition to IDH2 R172K, IDH2 R140Q has also been observed in acute myeloid leukemia. Although most IDH1 mutations occur at R132, a small number of mutations producing D-2-hydroxyglutarate (D-2HG) occur at R100, G97, and Y139 (15). However, only a single residue is mutated in either IDH1 or IDH2 in a given tumor.
IDH mutations result in a very high accumulation of the oncometabolite D-2HG in the range of 5- to 35-mM levels, which is 2–3 orders of magnitude higher than D-2HG levels in tumors with wild-type IDH or in healthy tissue (13). All IDH1 G97, R100, R132, and Y139 and IDH2 R140 and R172 mutations confer a neomorphic activity to the IDH1/2 enzymes, switching their activity toward the reduction of αKG to D-2HG, using NADPH as a cofactor (15). The gain of function conferred by these mutations is possible because in each tumor cell a copy of the wild-type allele exists to supply the αKG substrate and NADPH cofactor for the mutated allele.
A cause and effect relationship between IDH mutation and tumorigenesis is probable, and D-2HG appears to play a pivotal role as the relay agent. Evidence is mounting that high levels of D-2HG alter the biology of tumor cells toward malignancy by influencing the activity of enzymes critical for regulating the metabolic (14) and epigenetic state of cells (6, 7, 16–18). D-2HG may act as an oncometabolite via competitive inhibition of αKG-dependent dioxygenases (16). This includes inhibition of histone demethylases and 5-methlycytosine hydroxylases (e.g., TET2), leading to genome-wide alterations in histone and DNA hypermethylation as well as inhibition of hydroxylases, resulting in upregulation of HIF-1 (19). The effects of D-2HG have been shown to be reversible in leukemic transformation (18), which gives further evidence that treatments that lower D-2HG could be a valid therapeutic approach for IDH-mutant tumors. In addition to increased D-2HG, widespread metabolic disturbances of the cellular metabolome have been measured in cells with IDH mutations, including changes in amino acid concentration (increased levels of glycine, serine, threonine, among others, and decreased levels of aspartate and glutamate), N-acetylated amino acids (N-acetylaspartate, N-acetylserine, N-acetylthreonine), glutathione derivatives, choline metabolites, and TCA cycle intermediates (fumarate, malate) (14). These metabolic changes might be exploited for therapy. For example, IDH mutations cause a depletion of NADPH, which lowers the reductive capabilities of tumor cells (20) and perhaps makes them more susceptible to treatments that create free radicals (e.g., radiation) (21).
In vivo MRS of D-2HG in IDH mutant tumors
D-2HG may be an optimal biomarker for tumors with IDH mutations, as it ideally fulfills several important requirements: (a) there is virtually no normal D-2HG background — in cells without IDH mutations, D-2HG is produced as an error product of normal metabolism and is only present at trace levels; (b) 99% of tumors with IDH mutations have increased levels of D-2HG by several orders of magnitude; (c) the only other known cause of elevated 2HG is hydroxyglutaric aciduria (in this case, high L-2HG caused by a mutation in 2HG dehydrogenase), which is a rare inborn error of metabolism that presents with a different clinical phenotype and marked developmental anomalies in early childhood. Hence, tumors displaying increased levels of D-2HG are unlikely to represent false-positive cases for IDH mutations. Furthermore, this raises the possibility that D-2HG levels could also be used to quantify and predict the efficacy of drugs targeting mutant IDH1 for antitumor therapy (11, 15). In fact, it is hard to find a similar example of another tumor biomarker metabolite that is so well supported by the underlying biology.
The high levels of D-2HG observed in IDH1-mutant gliomas are amenable to detection by in vivo MRS. Given that the detection threshold of in vivo MRS is around 1 mM (1 μmol/g, wet tissue), D-2HG should be measurable only in situations in which it accumulates due to IDH1 mutations. Conversely, D-2HG is not expected to be detectable in tumors in which IDH1 is not mutated or in healthy tissues. In addition, ex vivo MRS measurements of intact biopsies (22) or extracts reach higher sensitivity 0.1–0.01 mM (0.1–0.01 μmol/g) and can be used as a cheaper and faster alternative to mass spectrometry.
Recently, reliable detection of D-2HG using in vivo 1H MRS was demonstrated in glioma patients (29, 30). Andronesi et al. reported the unambiguous detection of D-2HG in mutant IDH1 glioma in vivo using 2D correlation spectroscopy (COSY) and J-difference spectroscopy (29). In 2D COSY the overlapping signals are resolved along a second orthogonal chemical shift dimension (31, 32), and in the case of D-2HG, the cross-peaks resulting from the scalar coupling of Hα-Hβ protons show up in a region that is free of the contribution of other metabolites in both healthy and wild-type tumors. While 2D COSY retains all the metabolites in the spectrum, J-difference spectroscopy (25, 33) takes the opposite approach instead by focusing on the metabolite of interest, such as D-2HG, and selectively applying a narrow-band radiofrequency pulse to selectively refocus the Hα-Hβ scalar coupling evolution, then removing the contribution of overlapping metabolites. In this case a 1D difference spectrum with the Hα signal of D-2HG is detected at 4.02 ppm. Both methods have strengths and weaknesses: 2D COSY has the highest resolving power to disentangle overlapping metabolites, but has less sensitivity and quantification is more complex; J-difference spectroscopy has increased sensitivity, and quantification is straightforward, but it is susceptible to subtraction errors.
In Table 1, a comparison is made among the published methods for D-2HG detection. Results selected from the literature are shown in Figure 1. Besides the approaches discussed thus far, other methods are available in the in vivo MRS armamentarium that could be perhaps explored for reliable detection of 2D-HG, such as multiple-quantum filtering sequences (34, 35) and a variety of 2D spectroscopic methods (36–39).
Table 1 Summary of in vivo 1H MRS methods used in the literature for detection of D-2HG in patients with mutant IDH glioma
http://dm5migu4zj3pb.cloudfront.net/manuscripts/67000/67229/small/JCI67229.t1.gif
Figure 1 In vivo D-2HG measurements: (A) J-difference spectroscopy with MEGA-LASER sequence in a patient with GBM with mutant IDH1. Adapted with permission from Science Translational Medicine (29). (B) Spectral editing with PRESS sequence of TE 97 ms (TE1: 32 ms, TE2: 65 ms) in a patient with mutant IDH1 oligodendroglioma. Adapted with permission from Nature Medicine (30). (C) Spectra acquired with PRESS sequence of TE 30 ms in a patient with mutant IDH1 anaplastic astrocytoma. Adapted with permission from Journal of Neuro-Oncology (24). Cho, choline; Cre, creatine; Gln, glutamine; Glu, glutamate; Lac, lactate; MM, macromolecules; NAA, N-acetyl- aspartate.
http://dm5migu4zj3pb.cloudfront.net/manuscripts/67000/67229/small/JCI67229.f1.gif
Ex vivo MRS of D-2HG in tumors with IDH mutations
The panoply of methods and ability of ex vivo MRS (50) to detect D-2HG in patient samples is far superior to in vivo MRS because the above list of limitations and artifacts is not of concern.
Metabolic profiling of intact tumor biopsies as small as 1 mg can be performed with high-resolution magic angle spinning (HRMAS) (51–53). HRMAS preserves the integrity of the samples that can be further analyzed with immunohistochemistry, genomics, or other metabolic profiling tools such as mass spectrometry. Detection of D-2HG in mutant IDH1 glioma was confirmed by ex vivo HRMAS experiments (29, 54, 55). In addition to D-2HG, ex vivo HRMAS studies can detect quantitative and qualitative changes for a large number of metabolites in IDH mutated tumors (54, 55).
The example of IDH1 mutations is a perfect illustration of the rapid pace of progress brought to the medical sciences by the power and advances of modern technology: genome-wide sequencing, metabolomics, and imaging.
In vivo MRS has the unique ability to noninvasively probe IDH mutations by measuring the endogenously produced oncometabolite D-2HG. As an imaging-based technique, it has the benefit of posing minimal risk to the patients, can be performed repeatedly as many times as necessary, and can probe tumor heterogeneity without disturbing the internal milieu. To date, in vivo MRS is the only imaging method that is specific to IDH mutations — existing PET or SPECT radiotracers are not specific (56, 57), IDH-targeted agents for in vivo molecular imaging do not yet exist, and the prohibitive cost of radiotracers will likely limit their clinical development.
2.1.4.4 Hypoxia promotes IDH-dependent carboxylation of α-KG to citrate to support cell growth and viability
DR Wise, PS Ward, JES Shay, JR Cross, Joshua J Grube, et al.
PNAS | Dec 6, 2011; 108(49):19611–19616
http://www.pnas.org/cgi/doi/10.1073/pnas.1117773108
Citrate is a critical metabolite required to support both mitochondrial bioenergetics and cytosolic macromolecular synthesis. When cells proliferate under normoxic conditions, glucose provides the acetyl-CoA that condenses with oxaloacetate to support citrate production. Tricarboxylic acid (TCA) cycle anaplerosis is maintained primarily by glutamine. Here we report that some hypoxic cells are able to maintain cell proliferation despite a profound reduction in glucose-dependent citrate production. In these hypoxic cells, glutamine becomes a major source of citrate. Glutamine-derived α-ketoglutarate is reductively carboxylated by the NADPH-linked mitochondrial isocitrate dehydrogenase (IDH2) to form isocitrate, which can then be isomerized to citrate. The increased IDH2-dependent carboxylation of glutamine-derived α-ketoglutarate in hypoxia is associated with a concomitantincreased synthesisof2-hydroxyglutarate (2HG) in cells with wild-type IDH1 and IDH2. When either starved of glutamine or rendered IDH2-deficient by RNAi, hypoxic cells areunable toproliferate.The reductive carboxylation ofglutamine is part of the metabolic reprogramming associated with hypoxia-inducible factor 1 (HIF1), as constitutive activation of HIF1 recapitulates the preferential reductive metabolism of glutamine derived α-ketoglutarate even in normoxic conditions. These data support a role for glutamine carboxylation in maintaining citrate synthesis and cell growth under hypoxic conditions.
Citrate plays a critical role at the center of cancer cell metabolism. It provides the cell with a source of carbon for fatty acid and cholesterol synthesis (1). The breakdown of citrate by ATP-citrate lyase is a primary source of acetyl-CoA for protein acetylation (2). Metabolism of cytosolic citrate by aconitase and IDH1 can also provide the cell with a source of NADPH for redox regulation and anabolic synthesis. Mammalian cells depend on the catabolism of glucose and glutamine to fuel proliferation (3). In cancer cells cultured at atmospheric oxygen tension (21% O2), glucose and glutamine have both been shown to contribute to the cellular citrate pool, with glutamine providing the major source of the four-carbon molecule oxaloacetate and glucose providing the major source of the two-carbon molecule acetyl-CoA (4, 5). The condensation of oxaloacetate and acetyl-CoA via citrate synthase generates the 6 carbon citrate molecule. However, both the conversion of glucose-derived pyruvate to acetyl-CoA by pyruvate dehydrogenase (PDH) and the conversion of glutamine to oxaloacetate through the TCA cycle depend on NAD+, which can be compromised under hypoxic conditions. This raises the question of how cells that can proliferate in hypoxia continue to synthesize the citrate required for macromolecular synthesis.
This question is particularly important given that many cancers and stem/progenitor cells can continue proliferating in the setting of limited oxygen availability (6, 7). Louis Pasteur first highlighted the impact of hypoxia on nutrient metabolism based on his observation that hypoxic yeast cells preferred to convert glucose into lactic acid rather than burning it in an oxidative fashion. The molecular basis forthis shift in mammalian cells has been linked to the activity of the transcription factor HIF1 (8–10). Stabilization of the labile HIF1α subunit occurs in hypoxia. It can also occur in normoxia through several mechanisms including loss of the von Hippel-Lindau tumor suppressor (VHL), a common occurrence in renal carcinoma(11). Although hypoxia and/or HIF1α stabilization is a common feature of multiple cancers, to date the source of citrate in the setting of hypoxia or HIF activation has not been determined. Here, we study the sources of hypoxic citrate synthesis in a glioblastoma cell line that proliferates in profound hypoxia (0.5% O2). Glucose uptake and conversion to lactic acid increased in hypoxia. However, glucose conversion into citrate dramatically declined. Glutamine consumption remained constant in hypoxia, and hypoxic cells were addicted to the use of glutamine in hypoxia as a source of α-ketoglutarate. Glutamine provided the major carbon source for citrate synthesis during hypoxia. However, the TCA cycle-dependent conversion of glutamine into citric acid was significantly suppressed. In contrast, there was a relative increase in glutamine-dependent citrate production in hypoxia that resulted from carboxylation of α-ketoglutarate. This reductive synthesis required the presence of mitochondrial isocitrate dehydrogenase 2 (IDH2). In confirmation of the reverse flux through IDH2, the increased reductive metabolism of glutamine-derived α-ketoglutarate in hypoxia was associated with increased synthesis of 2HG. Finally, constitutive HIF1α-expressing cells also demonstrated significant reductive carboxylation-dependent synthesis of citrate in normoxia and a relative defect in the oxidative conversion of glutamine into citrate. Collectively, the data demonstrate that mitochondrial glutaminemetabolismcanbereroutedthroughIDH2-dependent citrate synthesis in support of hypoxic cell growth.
Some Cancer Cells Can Proliferate at 0.5% O2 Despite a Sharp Decline in Glucose-Dependent Citrate Synthesis. At 21% O2, cancer cells have been shown to synthesize citrate by condensing glucose-derived acetyl-CoA with glutamine-derived oxaloacetate through the activity of the canonical TCA cycle enzyme citrate synthase (4). In contrast, less is known regarding the synthesis of citrate by cells that can continue proliferating in hypoxia. The glioblastoma cellline SF188 is able to proliferate at 0.5% O2 (Fig.1A),a level of hypoxia that is sufficient to stabilize HIF1α (Fig. 1B) and predicted to limit respiration (12, 13). Consistent with previous observations in hypoxic cells, we found that SF188 cells demonstrated increased lactate production when incubated in hypoxia
(Fig. 1C), and the ratio of lactate produced to glucose consumed increased demonstrating an increase in the rate of anaerobic glycolysis. When glucose-derived carbon in the form of pyruvate is converted to lactate, it is diverted away from subsequent metabolism that can contribute to citrate production. However, we observed that SF188 cells incubated in hypoxia maintain their intracellular citrate to ∼75% of the level maintained under normoxia (Fig. 1D). This prompted an investigation of how proliferating cells maintain citrate production under hypoxia. Increased glucose uptake and glycolytic metabolism are critical elements of the metabolic response to hypoxia. To evaluate the contributions made by glucose to the citrate pool under normoxia or hypoxia, SF188 cells incubated in normoxia or hypoxia were cultured in medium containing 10 mM [U-13C] glucose. Following a 4-h labeling period, cellular metabolites were extracted and analyzed for isotopic enrichment.
Fig. 1. SF188 glioblastoma cells proliferate at 0.5% O2 despite a profound reduction in glucose-dependent citrate synthesis. (A) SF188 cells were plated in complete medium equilibrated with 21% O2 (Normoxia) or 0.5% O2 (Hypoxia), total viable cells were counted 24 h and 48 h later (Day 1 and Day 2), and population doublings were calculated. Data are the mean ± SEM of four independent experiments. (B) Western blot demonstrates stabilized HIF1α protein in cells cultured in hypoxia compared with normoxia. (C) Cells were grown in normoxia or hypoxia for 24 h, after which culture medium was collected. Medium glucose and lactate levels were measured and compared with the levels in fresh medium. (D) Cells were cultured for 24 h as in C. Intracellular metabolism was then quenched with 80% MeOH prechilled to −80 °C that was spiked with a 13C-labeled citrate as an internal standard. Metabolites were then extracted, and intracellular citrate levels were analyzed with GC-MS and normalized to cell number. Data for C and D are the mean ± SEM of three independent experiments. (E) Model depicting the pathway for cit+2 production from [U-13C] glucose. Glucose uniformly 13Clabeled will generate pyruvate+3. Pyruvate+3 can be oxidatively decarboxylated by PDH to produce acetyl-CoA+2, which can condense with unlabeled oxaloacetate to produce cit+2. (F) Cells were cultured for 24 h as in C and D, followed by an additional 4 h of culture in glucose-deficient medium supplemented with 10 mM [U-13C]glucose. Intracellular metabolites were then extracted, and 13C-enrichment in cellular citrate was analyzed by GCMS and normalized to the total citrate pool size. Data are the mean ± SD of three independent cultures from a representative of two independent experiments. *P < 0.05, ***P < 0.001
Fig. 2. Glutamine carbon is required for hypoxic cell viability and contributes to increased citrate production through reductive carboxylation relative to oxidative metabolism in hypoxia. (A) SF188 cells were cultured for 24 h in complete medium equilibrated with either 21% O2 (Normoxia) or 0.5% O2 (Hypoxia). Culture medium was then removed from cells and analyzed for glutamine levels which were compared with the glutamine levels in fresh medium. Data are the mean ± SEM of three independent experiments. (B) The requirement for glutamine to maintain hypoxic cell viability can be satisfied by α-ketoglutarate. Cells were cultured in complete medium equilibrated with 0.5% O2 for 24 h, followed by an additional 48 h at 0.5% O2 in either complete medium (+Gln), glutamine-deficient medium (−Gln), or glutamine-deficient medium supplemented with 7 mM dimethyl α-ketoglutarate (−Gln +αKG). All medium was preconditioned in 0.5% O2. Cell viability was determined by trypan blue dye exclusion. Data are the mean and range from two independent experiments. (C) Model depicting the pathways for cit+4 and cit+5 production from [U-13C]glutamine (glutamine+5). Glutamine+5 is catabolized to α-ketoglutarate+5, which can then contribute to citrate production by two divergent pathways. Oxidative metabolism produces oxaloacetate+4, which can condense with unlabeled acetyl-CoA to produce cit+4. Alternatively, reductive carboxylation produces isocitrate+5, which can isomerize to cit+5. (D) Glutamine contributes to citrate production through increased reductive carboxylation relative to oxidative metabolism in hypoxic proliferating cancer cells. Cells were cultured for 24 h as in A, followed by 4 h of culture in glutamine-deficient medium supplemented with 4 mM [U-13C]glutamine. 13C enrichment in cellular citrate was quantitated with GC-MS. Data are the mean ± SD of three independent cultures from a representative of three independent experiments. **P < 0.01.
Fig. 3. Cancer cells maintain production of other metabolites in addition to citrate through reductive carboxylation in hypoxia. (A) SF188 cells were cultured in complete medium equilibrated with either 21% O2 (Normoxia) or 0.5% O2 (Hypoxia) for 24 h. Intracellular metabolism was then quenched with 80% MeOH prechilled to −80 °C that was spiked with a 13C-labeled citrate as an internal standard. Metabolites were extracted, and intracellular aspartate (asp), malate (mal), and fumarate (fum) levels were analyzed with GC-MS. Data are the mean± SEM of three independent experiments. (B) Model for the generation of aspartate, malate, and fumarate isotopomers from [U-13C] glutamine (glutamine+5). Glutamine+5 is catabolized to α-ketoglutarate+5. Oxidative metabolism of α-ketoglutarate+5 produces fumarate+4, malate+4, and oxaloacetate (OAA)+4 (OAA+ 4 is in equilibrium with aspartate+4 via transamination). Alternatively, α-ketoglutarate+5 can be reductively carboxylated to generate isocitrate+5 and citrate+5. Cleavage of citrate+5 in the cytosol by ATP-citrate lyase (ACL) will produce oxaloacetate+3 (in equilibrium with aspartate+3). Oxaloacetate+3 can be metabolized to malate+3 and fumarate+3. (C) SF188 cells were cultured for 24 h as in A, and then cultured for an additional 4 h in glutamine-deficient medium supplemented with 4 mM [U-13C] glutamine. 13C enrichment in cellular aspartate, malate, and fumarate was determined by GC-MS and normalized to the relevant metabolite total pool size. Data shown are the mean ± SD of three independent cultures from a representative of three independent experiments. **P < 0.01, ***P < 0.001.
Glutamine Carbon Metabolism Is Required for Viability in Hypoxia. In addition to glucose, we have previously reported that glutamine can contribute to citrate production during cell growth under normoxic conditions (4). Surprisingly, under hypoxic conditions, we observed that SF188 cells retained their high rate of glutamine consumption (Fig. 2A). Moreover, hypoxic cells cultured in glutamine-deficient medium displayed a significant loss of viability (Fig. 2B). In normoxia, the requirement for glutamine to maintain viability of SF188 cells can be satisfied by α-ketoglutarate, the downstream metabolite of glutamine that is devoid of nitrogenous groups (14). α-ketoglutarate cannot fulfill glutamine’s roles as a nitrogen source for nonessential amino acid synthesis or as an amide donor for nucleotide or hexosamine synthesis, but can be metabolized through the oxidative TCA cycle to regenerate oxaloacetate, and subsequently condense with glucose-derived acetyl-CoA to produce citrate. To test whether the restoration of carbon from glutamine metabolism in the form of α-ketoglutarate could rescue the viability defect of glutamine-starved SF188 cells even under hypoxia, SF188 cells incubated in hypoxia were cultured in glutamine-deficient medium supplemented with a cell-penetrant form of α-ketoglutarate (dimethyl α-ketoglutarate). The addition of dimethyl α-ketoglutarate rescued the defect in cell viability observed upon glutamine withdrawal (Fig. 2B). These data demonstrate that, even under hypoxic conditions, when the ability of glutamine to replenish oxaloacetate through oxidative TCA cycle metabolism is diminished, SF188 cells retain their requirement for glutamine as the carbon backbone for α-ketoglutarate. This result raised the possibility that glutamine could be the carbon source for citrate production through an alternative, nonoxidative, pathway in hypoxia.
Cells Proliferating in Hypoxia Preferentially Produce Citrate Through Reductive Carboxylation Rather than Oxidative Metabolism. To distinguish the pathways by which glutamine carbon contributes to citrate production in normoxia and hypoxia, SF188 cells were incubated in normoxia or hypoxia and cultured in medium containing 4 mM [U-13C] glutamine. After 4 h of labeling, intracellular metabolites were extracted and analyzed by GC-MS. In normoxia,the cit+4 pool constituted the majority of the enriched citrate in the cell. Cit+4 arises from the oxidative metabolism of glutamine-derived α-ketoglutarate+5 to oxaloacetate+4 and its subsequent condensation with unenriched, glucose-derived acetyl-CoA (Fig.2C and D). Cit+5 constituted a significantly smaller pool than cit+4 in normoxia. Conversely, in hypoxia, cit+5 constituted the majority of the enriched citrate in the cell. Cit+5 arises from the reductive carboxylation of glutamine-derived α-ketoglutarate+5 to isocitrate+5, followed by the isomerization of isocitrate+5 to cit+5 by aconitase. The contribution of cit+4 to the total citrate pool was significantly lower in hypoxia than normoxia, and the accumulation of other enriched citrate species in hypoxia remained low. These data support the role of glutamine as a carbon source for citrate production in normoxia and hypoxia.
Cells Proliferating in Hypoxia Maintain Levels of Additional Metabolites Through Reductive Carboxylation. Previous work has documented that, in normoxic conditions, SF188 cells use glutamine as the primary anaplerotic substrate, maintaining the pool sizes of TCA cycle intermediates through oxidative metabolism (4). Surprisingly, we found that, when incubated in hypoxia, SF188 cells largely maintained their levels of aspartate (in equilibrium with oxaloacetate), malate, and fumarate (Fig. 3A). To distinguish how glutamine carbon contributes to these metabolites in normoxia and hypoxia, SF188 cells incubated in normoxia or hypoxia were cultured in medium containing 4 mM [U-13C] glutamine. After a 4-h labeling period, metabolites were extracted and the intracellular pools of aspartate, malate, and fumarate were analyzed by GC-MS. In normoxia, the majority of the enriched intracellular asparatate, malate, and fumarate were the +4 species, which arise through oxidative metabolism of glutamine-derived α-ketoglutarate (Fig. 3 B and C). The +3 species, which can be derived from the citrate generated by the reductive carboxylation of glutamine derived α-ketoglutarate, constituted a significantly lower percentage of the total aspartate, malate, and fumarate pools. By contrast, in hypoxia, the +3 species constituted a larger percentage of the total aspartate, malate, and fumarate pools than they did in normoxia. These data demonstrate that, in addition to citrate, hypoxic cells preferentially synthesize oxaloacetate, malate, and fumarate through the pathway of reductive carboxylation rather than the oxidative TCA cycle.
IDH2 Is Critical in Hypoxia for Reductive Metabolism of Glutamine and for Cell Proliferation.We hypothesized that the relative increase in reductive carboxylation we observed in hypoxia could arise from the suppression of α-ketoglutarate oxidation through the TCA cycle. Consistent with this, we found that α-ketoglutarate levels increased in SF188 cells following 24 h in hypoxia (Fig. 4A). Surprisingly, we also found that levels of the closely related metabolite 2-hydroxyglutarate (2HG) increased in hypoxia, concomitant with the increase in α-ketoglutarate under these conditions. 2HG can arise from the noncarboxylating reduction of α-ketoglutarate (Fig. 4B). Recent work has found that specific cancer-associated mutations in the active sites of either IDH1 or IDH2 lead to a 10- to 100-fold enhancement in this activity facilitating 2HG production (15–17), but SF188 cells lack IDH1/2 mutations. However, 2HG levels are also substantially elevated in the inborn error of metabolism 2HG aciduria, and the majority of patients with this disease lack IDH1/2 mutations. As 2HG has been demonstrated to arise in these patients from mitochondrial α-ketoglutarate (18), we hypothesized that both the increased reductive carboxylation of glutamine-derived α-ketoglutarate to citrate and the increased 2HG accumulation we observed in hypoxia could arise from increased reductive metabolism by wild-type IDH2 in the mitochondria.
Fig. 4. Reductive carboxylation of glutamine-derived α-ketoglutarate to citrate in hypoxic cancer cells is dependent on mitochondrial IDH2. (A) α-ketoglutarate and 2HG increase in hypoxia. SF188 cells were cultured in complete medium equilibrated with either 21% O2 (Normoxia) or 0.5% O2 (Hypoxia) for 24 h. Intracellular metabolites were then extracted, cell extracts spiked with a 13C-labeled citrate as an internal standard, and intracellular α-ketoglutarate and 2HG levels were analyzed with GC-MS. Data shown are the mean ± SEM of three independent experiments. (B) Model for reductive metabolism from glutamine-derived α-ketoglutarate. Glutamine+5 is catabolized to α-ketoglutarate+5. Carboxylation of α-ketoglutarate+5 followed by reduction of the carboxylated intermediate (reductive carboxylation) will produce isocitrate+5, which can then isomerize to cit+5. In contrast, reductive activity on α-ketoglutarate+5 that is uncoupled from carboxylation will produce 2HG+5. (C) IDH2 is required for reductive metabolism of glutamine-derived α-ketoglutarate in hypoxia. SF188 cells transfected with a siRNA against IDH2 (siIDH2) or nontargeting negative control (siCTRL) were cultured for 2 d in complete medium equilibrated with 0.5% O2.(Upper) Cells were then cultured at 0.5% O2 for an additional 4 h in glutamine-deficient medium supplemented with 4 mM [U-13C]glutamine. 13C enrichment in intracellular citrate and 2HG was determined and normalized to the relevant metabolite total pool size. (Lower) Cells transfected and cultured in parallel at 0.5% O2 were counted by hemocytometer (excluding nonviable cells with trypan blue staining) or harvested for protein to assess IDH2 expression by Western blot. Data shown for GC-MS and cell counts are the mean ± SD of three independent cultures from a representative experiment. **P < 0.01, ***P < 0.001.
Reprogramming of Metabolism by HIF1 in the Absence of Hypoxia Is Sufficient to Induce Increased Citrate Synthesis by Reductive Carboxylation Relative to Oxidative Metabolism. The relative increase in the reductive metabolism of glutamine-derived α-ketoglutarate at 0.5% O2 may be explained by the decreased ability to carry out oxidative NAD+-dependent reactions as respiration is inhibited (12, 13). However, a shift to preferential reductive glutamine metabolism could also result from the active reprogramming of cellular metabolism by HIF1 (8–10), which inhibits the generation of mitochondrial acetyl-CoA necessary for the synthesis of citrate by oxidative glucose and glutamine metabolism (Fig. 5A). To better understand the role of HIF1 in reductive glutamine metabolism, we used VHL-deficient RCC4 cells, which display constitutive expression of HIF1α under normoxia (Fig. 5B).
Fig. 5. Reprogramming of metabolism by HIF1 in the absence of hypoxia is sufficient to induce reductive carboxylation of glutamine-derived α-ketoglutarate. (A) Model depicting how HIF1 signaling’s inhibition of pyruvate dehydrogenase (PDH) activity and promotion of lactate dehydrogenase-A (LDH-A) activity can block the generation of mitochondrial acetyl-CoA from glucose-derived pyruvate, thereby favoring citrate synthesis from reductive carboxylation of glutamine-derived α-ketoglutarate. (B) Western blot demonstrating HIF1α protein in RCC4 VHL−/− cells in normoxia with a nontargeting shRNA (shCTRL), and the decrease in HIF1α protein in RCC4 VHL−/− cells stably expressing HIF1α shRNA (shHIF1α). (C) HIF1-induced reprogramming of glutamine metabolism. Cells from B at 21% O2 were cultured for 4 h in glutamine-deficient medium supplemented with 4 mM [U-13C]glutamine. Intracellular metabolites were then extracted, and 13C enrichment in cellular citrate was determined by GC-MS. Data shown are the mean ± SD of three independent cultures from a representative of three independent experiments. ***P < 0.001.
Compared with glucose metabolism, much less is known regarding how glutamine metabolism is altered under hypoxia. It has also remained unclear how hypoxic cells can maintain the citrate production necessary for macromolecular biosynthesis. In this report, we demonstrate that in contrast to cells at 21% O2, where citrate is predominantly synthesized through oxidative metabolism of both glucose and glutamine, reductive carboxylation of glutamine carbon becomes the major pathway of citrate synthesis in cells that can effectively proliferate at 0.5% O2. Moreover, we show that in these hypoxic cells, reductive carboxylation of glutamine-derived α-ketoglutarate is dependent on mitochondrial IDH2. Although others have previously suggested the existence of reductive carboxylation in cancer cells (19, 20), these studies failed to demonstrate the intracellular localization or specific IDH isoform responsible for the reductive carboxylation flux. Recently, we identified IDH2 as an isoform that contributes to reductive carboxylation in cancer cells incubated at 21% O2 (16), but remaining unclear were the physiological importance and regulation of this pathway relative to oxidative metabolism, as well as the conditions where this reductive pathway might be advantageous for proliferating cells. Here we report that IDH2-mediated reductive carboxylation of glutamine-derived α-ketoglutarate to citrate is an important feature of cells proliferating in hypoxia. Moreover, the reliance on reductive glutamine metabolism can be recapitulated in normoxia by constitutive HIF1 activation in cells with loss of VHL. The mitochondrial NADPH/NADP+ ratio required to fuel the reductive reaction through IDH2 can arise from the increased NADH/NAD+ ratio existing in the mitochondria under hypoxic conditions (21, 22), with the transfer of electrons from NADH to NADP+ to generate NADPH occurring through the activity of the mitochondrial transhydrogenase (23).
In further support of the increased mitochondrial reductive glutamine metabolism that we observe in hypoxia, we report here that incubation in hypoxia can lead to elevated 2HG levels in cells lacking IDH1/2 mutations. 2HG production from glutamine-derived α-ketoglutarate significantly decreased with knockdown of IDH2, supporting the conclusion that 2HG is produced in hypoxia by enhanced reverse flux of α-ketoglutarate through IDH2in a truncated, noncarboxylating reductive reaction. However,other mechanisms may also contribute to 2HG elevation in hypoxia. These include diminished oxidative activity and/or enhanced reductive activity of the 2HG dehydrogenase, a mitochondrial enzyme that normally functions to oxidize 2HG back to α-ketoglutarate (25). The level of 2HG elevation we observe in hypoxic cells is associated with a concomitant increase in α-ketoglutarate, and is modest relative to that observed in cancers with IDH1/2 gain-of-function mutations. Nonetheless, 2HG elevation resulting from hypoxia in cells with wild-type IDH1/2 may hold promise as a cellular or serum biomarker for tissues undergoing chronic hypoxia and/or excessive glutamine metabolism.
2.1.4.5 IDH mutation impairs histone demethylation and results in a block to cell differentiation.
C Lu, PS Ward, GS Kapoor, D Rohle, S Turcan, et al.
Nature 483, 474–478 (22 Mar 2012)
http://dx.doi.org:/10.1038/nature10860
Recurrent mutations in isocitrate dehydrogenase 1 (IDH1) and IDH2 have been identified in gliomas, acute myeloid leukaemias (AML) and chondrosarcomas, and share a novel enzymatic property of producing 2-hydroxyglutarate (2HG) from α-ketoglutarate1, 2, 3, 4, 5, 6. Here we report that 2HG-producing IDH mutants can prevent the histone demethylation that is required for lineage-specific progenitor cells to differentiate into terminally differentiated cells. In tumour samples from glioma patients, IDH mutations were associated with a distinct gene expression profile enriched for genes expressed in neural progenitor cells, and this was associated with increased histone methylation. To test whether the ability of IDH mutants to promote histone methylation contributes to a block in cell differentiation in non-transformed cells, we tested the effect of neomorphic IDH mutants on adipocyte differentiation in vitro. Introduction of either mutant IDH or cell-permeable 2HG was associated with repression of the inducible expression of lineage-specific differentiation genes and a block to differentiation. This correlated with a significant increase in repressive histone methylation marks without observable changes in promoter DNA methylation. Gliomas were found to have elevated levels of similar histone repressive marks. Stable transfection of a 2HG-producing mutant IDH into immortalized astrocytes resulted in progressive accumulation of histone methylation. Of the marks examined, increased H3K9 methylation reproducibly preceded a rise in DNA methylation as cells were passaged in culture. Furthermore, we found that the 2HG-inhibitable H3K9 demethylase KDM4C was induced during adipocyte differentiation, and that RNA-interference suppression of KDM4C was sufficient to block differentiation. Together these data demonstrate that 2HG can inhibit histone demethylation and that inhibition of histone demethylation can be sufficient to block the differentiation of non-transformed cells.
Figure 1: IDH mutations are associated with dysregulation of glial differentiation and global histone methylation.
http://www.nature.com/nature/journal/v483/n7390/carousel/nature10860-f1.2.jpg
Figure 2: Differentiation arrest induced by mutant IDH or 2HG is associated with increased global and promoter-specific H3K9 and H3K27 methylation.
http://www.nature.com/nature/journal/v483/n7390/carousel/nature10860-f2.2.jpg
Figure 3: IDH mutation induces histone methylation increase in CNS-derived cells and can alter cell lineage gene expression.
http://www.nature.com/nature/journal/v483/n7390/carousel/nature10860-f3.2.jpg
2.1.4.6 Isocitrate dehydrogenase mutations in leukemia
McKenney AS, Levine RL.
J Clin Invest. 2013 Sep; 123(9):3672-7
http://dx.doi.org:/1172/JCI67266
Recent genome-wide discovery studies have identified a spectrum of mutations in different malignancies and have led to the elucidation of novel pathways that contribute to oncogenic transformation. The discovery of mutations in the genes encoding isocitrate dehydrogenase (IDH) has uncovered a critical role for altered metabolism in oncogenesis, and the neomorphic, oncogenic function of IDH mutations affects several epigenetic and gene regulatory pathways. Here we discuss the relevance of IDH mutations to leukemia pathogenesis, therapy, and outcome and how mutations in IDH1 and IDH2 affect the leukemia epigenome, hematopoietic differentiation, and clinical outcome.
Mutations in isocitrate dehydrogenase (IDH) have been identified in a spectrum of human malignancies. Mutations in IDH1 were first identified in an exome resequencing analysis of patients with colorectal cancer (1). Shortly thereafter, recurrent IDH1 and IDH2 mutations were found in patients with glioma, most commonly in patients who present with lower-grade gliomas (2). IDH1 mutations were subsequently discovered in patients with acute myeloid leukemia (AML) through whole genome sequencing (3), which was followed by the identification of somatic IDH2 mutations in patients with AML (4–6). Further studies revealed that IDH mutations induce a neomorphic function to produce the oncometabolite 2-hydroxyglutarate (2HG) (7, 8), which can inhibit many cellular processes (9, 10). In particular, the ability of 2HG to alter the epigenetic landscape makes IDH a prototypical target for prognostic studies and drug targeting in leukemias.
IDH proteins catalyze the oxidative decarboxylation of isocitrate to α-ketoglutarate (αKG, also known as 2-oxoglutarate). IDH3 primarily functions as the allosterically regulated, rate-limiting enzymatic step in the TCA cycle, while the other two isoforms, which are mutated in cancer, utilize this catalytic process in additional contexts including metabolism and glucose sensing (IDH1) and regulation of oxidative respiration (IDH2) (11, 12). Loss-of-function mutations in other TCA cycle components have previously been identified in other types of cancer, specifically in mutations in fumarate hydratase (FH) and succinate dehydrogenase (SDH). As such, many hypothesized that IDH1/2 mutations would result in loss of metabolic activity, and indeed, enzymatic studies confirmed that the mutant protein’s ability to perform its native function is markedly attenuated, as measured by reduced production of αKG or NADPH (13, 14).
However, the genetic data relating to these mutations were more consistent with gain-of-function mutation: all of the observed alterations are somatic, heterozygous mutations that occur at highly conserved positions, which appear to be functionally equivalent between different isoforms. This discrepancy was resolved when metabolic profiling showed that the IDH1 mutant protein catalyzes a neomorphic reaction that converts αKG to 2HG. 2HG can be detected at high levels in gliomas harboring these mutations (4), and the accumulation of 2HG was further found to be common to oncogenic IDH mutations (8). This finding indicated that 2HG may serve as a potential functional biomarker of IDH mutation, and later, metabolomics analysis of 2HG content in patient samples led to the identification of IDH2 mutations in leukemias (6). IDH mutant proteins have been proposed to form a heterodimer with the remaining wild-type IDH isoform (7, 8, 14), which is consistent with genetic data showing retention of the wild-type allele in IDH-mutant cancers.
The discovery of the neomorphic function of IDH opened the doors for true investigation into the implications of these mutations and the resultant intracellular accumulation of 2HG. 2HG is thought to competitively inhibit the activity of a broad spectrum of αKG-dependent enzymes with known and postulated roles in oncogenic transformation. Some targets, such as the prolyl 4-hydroxylases, have unclear implications in leukemia pathogenesis. However, the recent demonstration that alterations in epigenetic factors occur in the majority of acute leukemias led to investigations of the effects of 2HG on the jumonji C domain histone-modifying enzymes and the newly characterized tet methylcytosine dioxygenase (TET) family of methylcytosine hydroxylases. Importantly, expression of IDH or exposure to chemically modified, cell-permeable 2HG affects hematopoietic differentiation, likely due to changes in epigenetic regulation that induce reversible alterations in differentiation states (15).
TET1 was initially discovered as a binding partner of mixed-lineage leukemia (MLL) in patients with MLL-translocated AML (16, 17). However, the function of the TET gene family and its role in leukemogenesis remained unknown until TET1 was shown to catalyze αKG-dependent addition of a hydroxyl group to methylated cytosines (18), which precedes DNA demethylation and results in altered epigenetic control (10,18–24). TET enzymes have further been shown to catalyze conversion of 5-methylcytosine (5mC) to 5-formylcytosine (5fC) or 5-carboxylcytosine (5cC) (25, 26). These data suggest that loss of TET2 enzymatic function can lead to aberrant cytosine methylation and epigenetic silencing in malignant settings. TET2mutations were initially found in array-comparative genomic hybridization and genome-wide SNP arrays, which identified microdeletions containing this gene in a patient with myeloproliferative neoplasm (MPN) and myelodysplastic syndrome (MDS) (27). This discovery was followed by the identification of somatic missense, nonsense, and frameshift TET2 mutations in patients with MDS, MPN, AML, and other myeloid malignancies (27–30). Most TET2 alleles result in nonsense/frameshift mutations, which result in loss of TET2 catalytic function (31), consistent with a tumor suppressor function in myeloid malignancies.
When 2HG was hypothesized to affect specific enzymatic processes in oncogenesis, AML patients were observed to harbor IDH1/2 and TET mutations in a mutually exclusive manner (9). Of note, exploration into the functional relationship between these mutant IDH proteins and the function of TET2 ultimately suggested a role for 2HG in inhibiting TET enzymatic function. IDH- or TET2-mutant patient samples are characterized by increased global hypermethylation of DNA and transcriptional silencing of genes with hypermethylated promoters. Expression of these IDH-mutant alleles in experimental models was further observed to result in increased methylation, reduced hydroxymethylation, and impaired TET2 function (9). Finally, in biochemical assays, 2HG was shown to directly inhibit TET2 as well as other αKG-dependent enzymes (10). These data demonstrate that a key feature of IDH1/2 mutations in hematopoietic cells is to impair TET2 function and disrupt DNA methylation (Figure1).
Figure 1 Normal IDH functions to convert isocitrate to αKG in the Krebs cycle.
http://www.ncbi.nlm.nih.gov/pmc/articles/PMC3754251/bin/JCI67266.f1.gif

mutations have been observed with IDH1_2 mutations leukemias
Many mutations have been observed in conjunction with IDH1/2 mutations in different types of leukemia.
In de novo adult AML, these mutations should be observed in the context of other prognostic indicators such as CEBPA, NPM1, and DNMT3A mutation. In AML that progresses from MPN, IDH1/2 mutations can be examined separately from the mutations responsible for MPN (such as JAK2 or MPL mutations) using paired pre- and post-transformation samples. Evidence supports a role for IDH1/2 hotspot mutations in leukemic transformation.
http://www.ncbi.nlm.nih.gov/pmc/articles/instance/3754251/bin/JCI67266.f2.gif
Conditional loss of Tet2 expression in mice results in a chronic myelomonocytic leukemia (CMML) phenotype and in increased hematopoietic self-renewal in vivo (32). Of note, in vitro systems have shown that TET2 silencing and expression of IDH1/2 mutant alleles leads to impaired hematopoietic differentiation and expansion of stem/progenitor cells (9). More recently, IDH1 (R132H) conditional knockin mice with hematopoietic-specific recombination were analyzed and found to have myeloid expansion, although they did not develop overt AML. This suggests that IDH mutations by themselves cannot promote overt transformation, and that additional genetic, epigenetic, and/or microenvironmental factors are needed to cooperate with mutant IDH alleles to promote hematologic malignancies. The hematopoietic defects included increased numbers of hematopoietic stem cells and myeloid progenitor cells, and a DNA methylation signature that was similar to observed patterns in primary AML patients with IDH1 mutations (33). While many models of IDH-mutant leukemia have shown potential, future models that incorporate the complexity seen in human patients are needed, as discussed below. More recently, the effects of IDH1/2 mutations on hematopoietic cell lines were replicated using exogenously applied 2HG, which was rendered permeable to the cell membrane by esterification. The Kaelin group used this system to dissect the role of 2HG in the αKG-dependent pathways that may be affected in IDH mutation, and to show that the effects are reversible (34). Tools such as these will help advance our understanding of the biology of IDH mutations and, by extension, the potential therapies that may affect mutant IDH and the downstream pathways. Indeed, given the recent description of mutant-selective IDH1/2 inhibitors (34–37), the development of genetically accurate models of IDH mutant–mediated leukemogenesis will be critical to evaluate the effects of targeted therapies in mice with AML and subsequently in the clinical context.
2.1.4.7 The Common Feature of Leukemia-Associated IDH1 and IDH2 Mutations – a Neomorphic Enzyme Activity Converting α-Ketoglutarate to 2-Hydroxyglutarate
PS Ward, J Patel, DR Wise, O Abdel-Wahab, BD Bennett, HA Coller, et al.
Cancer Cell 2010 Mar 16; 17(3):225–234
http://dx.doi.org/10.1016/j.ccr.2010.01.020
Highlights
- All IDH mutations reported in cancer share a common neomorphic enzymatic activity
- Both wild-type IDH1 and IDH2 are required for cell proliferation
- IDH2 R140Q mutations occur in 9% of AML cases
- Overall, IDH2 mutations appear more common than IDH1 mutations in AML
Summary
The somatic mutations in cytosolic isocitrate dehydrogenase 1 (IDH1) observed in gliomas can lead to the production of 2-hydroxyglutarate (2HG). Here, we report that tumor 2HG is elevated in a high percentage of patients with cytogenetically normal acute myeloid leukemia (AML). Surprisingly, less than half of cases with elevated 2HG possessed IDH1 mutations. The remaining cases with elevated 2HG had mutations in IDH2, the mitochondrial homolog of IDH1. These data demonstrate that a shared feature of all cancer-associated IDH mutations is production of the oncometabolite 2HG. Furthermore, AML patients with IDH mutations display a significantly reduced number of other well characterized AML-associated mutations and/or associated chromosomal abnormalities, potentially implicating IDH mutation in a distinct mechanism of AML pathogenesis.
Significance
Most cancer-associated enzyme mutations result in either catalytic inactivation or constitutive activation. Here we report that the common feature of IDH1 and IDH2 mutations observed in AML and glioma is the acquisition of an enzymatic activity not shared by either wild-type enzyme. The product of this neomorphic enzyme activity can be readily detected in tumor samples, and we show that tumor metabolite analysis can identify patients with tumor-associated IDH mutations. Using this method, we discovered a 2HG-producing IDH2 mutation, IDH2 R140Q, that was present in 9% of serial AML samples. Overall, IDH1 and IDH2 mutations were observed in over 23% of AML patients.
Mutations in human cytosolic isocitrate dehydrogenase I (IDH1) occur somatically in > 70% of grade II-III gliomas and secondary glioblastomas, and in 8.5% of acute myeloid leukemias (AML) (Mardis et al., 2009 and Yan et al., 2009). Mutations have also been reported in cancers of the colon and prostate (Kang et al., 2009 and Sjoblom et al., 2006). To date, all reported IDH1 mutations result in an amino acid substitution at a single arginine residue in the enzyme’s active site, R132. A subset of intermediate grade gliomas lacking mutations in IDH1 has been found to harbor mutations in IDH2, the mitochondrial homolog of IDH1. The IDH2 mutations that have been identified in gliomas occur at the analogous residue to IDH1 R132, IDH2 R172. Both IDH1 R132 and IDH2 R172 mutants lack the wild-type enzyme’s ability to convert isocitrate to α-ketoglutarate (Yan et al., 2009). To date, all reported IDH1 or IDH2 mutations are heterozygous, with the cancer cells retaining one wild-type copy of the relevant IDH1 or IDH2 allele. No patient has been reported with both an IDH1 and IDH2 mutation. These data argue against the IDH mutations resulting in a simple loss of function.
Normally both cytosolic IDH1 and mitochondrial IDH2 exist as homodimers within their respective cellular compartments, and the mutant proteins retain the ability to bind to their respective wild-type partner. Therefore, it has been proposed that mutant IDH1 can act as a dominant negative against wild-type IDH1 function, resulting in a decrease in cytosolic α-ketoglutarate levels and leading to an indirect activation of the HIF-1α pathway (Zhao et al., 2009). However, recent work has provided an alternative explanation. The R132H IDH1 mutation observed in gliomas was found to display a gain of function for the NADPH-dependent reduction of α-ketoglutarate to R(–)-2-hydroxyglutarate (2HG) ( Dang et al., 2009). This in vitro activity was confirmed when 2HG was found to be elevated in IDH1-mutated gliomas. Whether this neomorphic activity is a common feature shared by IDH2 mutations was not determined.
IDH1 R132 mutations identical to those reported to produce 2HG in gliomas were recently reported in AML (Mardis et al., 2009). These IDH1 R132 mutations were observed in 8.5% of AML patients studied, and a significantly higher percentage of mutation was observed in the subset of patients whose tumors lacked cytogenetic abnormalities. IDH2 R172 mutations were not observed in this study. However, during efforts to confirm and extend these findings, we found an IDH2 R172K mutation in an AML sample obtained from a 77-year-old woman. This finding confirmed that both IDH1 and IDH2 mutations can occur in AML and prompted us to more comprehensively investigate the role of IDH2 in AML.
The present study was undertaken to see if IDH2 mutations might share the same neomorphic activity as recently reported for glioma-associated IDH1 R132 mutations. We also determined whether tumor-associated 2HG elevation could prospectively identify AML patients with mutations in IDH. To investigate the lack of reduction to homozygosity for either IDH1 or IDH2 mutations in tumor samples, the ability of wild-type IDH1 and/or IDH2 to contribute to cell proliferation was examined.
IDH2 Is Mutated in AML
A recent study employing a whole-genome sequencing strategy in an AML patient resulted in the identification of somatic IDH1 mutations in AML (Mardis et al., 2009). Based on the report that IDH2 mutations were also observed in the other major tumor type in which IDH1 mutations were implicated (Yan et al., 2009), we sequenced the IDH2 gene in a set of de-identified AML DNA samples. Several cases with IDH2 R172 mutations were identified. In the initial case, the IDH2 mutation found, R172K, was the same mutation reported in glioma samples. It has been recently reported that cancer-associated IDH1 R132 mutants display a loss-of-function for the use of isocitrate as substrate, with a concomitant gain-of-function for the reduction of α-ketoglutarate to 2HG (Dang et al., 2009). This prompted us to determine if the recurrent R172K mutation in IDH2 observed in both gliomas and leukemias might also display the same neomorphic activity. In IDH1, the role of R132 in determining IDH1 enzymatic activity is consistent with the stabilizing charge interaction of its guanidinium moiety with the β-carboxyl group of isocitrate (Figure 1A). This β-carboxyl is critical for IDH’s ability to catalyze the interconversion of isocitrate and α-ketoglutarate, with the overall reaction occurring in two steps through a β-carboxyl-containing intermediate (Ehrlich and Colman, 1976). Proceeding in the oxidative direction, this β-carboxyl remains on the substrate throughout the IDH reaction until the final decarboxylating step which produces α-ketoglutarate.

IDH1 R132 and IDH2 R172 Are Analogous Residues
http://ars.els-cdn.com/content/image/1-s2.0-S153561081000036X-gr1.jpg
Figure 1. IDH1 R132 and IDH2 R172 Are Analogous Residues that Both Interact with the β-Carboxyl of Isocitrate
(A) Active site of crystallized human IDH1 with isocitrate.
(B) Active site of human IDH2 with isocitrate, modeled based on the highly homologous and crystallized pig IDH2 structure. For (A) and (B), carbon 6 of isocitrate containing the β-carboxyl is highlighted in cyan, with remaining isocitrate carbons shown in yellow. Carbon atoms of amino acids (green), amines (blue), and oxygens (red) are also shown. Hydrogen atoms are omitted from the figure for clarity. Dashed lines depict interactions < 3.1 Å, corresponding to hydrogen and ionic bonds. Residues coming from the other monomer of the IDH dimer are denoted with a prime (′) symbol.
To understand how R172 mutations in IDH2 might relate to the R132 mutations in IDH1 characterized for gliomas, we modeled human IDH2 based on the pig IDH2 structure containing bound isocitrate (Ceccarelli et al., 2002). Human and pig IDH2 protein share over 97% identity and all active site residues are identical. The active site of human IDH2 was structurally aligned with human IDH1 (Figure 1). Similar to IDH1, in the active site of IDH2 the isocitrate substrate is stabilized by multiple charge interactions throughout the binding pocket. Moreover, like R132 in IDH1, the analogous R172 in IDH2 is predicted to interact strongly with the β-carboxyl of isocitrate. This raised the possibility that cancer-associated IDH2 mutations at R172 might affect enzymatic interconversion of isocitrate and α-ketoglutarate similarly to IDH1 mutations at R132.
Mutation of IDH2 R172K Enhances α-Ketoglutarate-Dependent NADPH Consumption
To test whether cancer-associated IDH2 R172K mutations shared the gain of function in α-ketoglutarate reduction observed for IDH1 R132 mutations (Dang et al., 2009), we overexpressed wild-type or R172K mutant IDH2 in cells with endogenous wild-type IDH2 expression, and then assessed isocitrate-dependent NADPH production and α-ketoglutarate-dependent NADPH consumption in cell lysates. As reported previously (Yan et al., 2009), extracts from cells expressing the R172K mutant IDH2 did not display isocitrate-dependent NADPH production above the levels observed in extracts from vector-transfected cells. In contrast, extracts from cells expressing a comparable amount of wild-type IDH2 markedly increased isocitrate-dependent NADPH production (Figure 2A). However, when these same extracts were tested for NADPH consumption in the presence of α-ketoglutarate, R172K mutant IDH2 expression was found to correlate with a significant enhancement to α-ketoglutarate-dependent NADPH consumption. Vector-transfected cell lysates did not demonstrate this activity (Figure 2B). Although not nearly to the same degree as with the mutant enzyme, wild-type IDH2 overexpression also reproducibly enhanced α-ketoglutarate-dependent NADPH consumption under these conditions.

Expression of R172K Mutant IDH2 Results in Enhanced α-Ketoglutarate-Dependent Consumption of NADPH
http://ars.els-cdn.com/content/image/1-s2.0-S153561081000036X-gr2.jpg
Figure 2. Expression of R172K Mutant IDH2 Results in Enhanced α-Ketoglutarate-Dependent Consumption of NADPH
(A) 293T cells transfected with wild-type or R172K mutant IDH2, or empty vector, were lysed and subsequently assayed for their ability to generate NADPH from NADP+ in the presence of 0.1 mM isocitrate.
(B) The same cell lysates described in (A) were assayed for their consumption of NADPH in the presence of 0.5 mM α-ketoglutarate. Data for (A) and (B) are each representative of three independent experiments. Data are presented as the mean and standard error of the mean (SEM) from three independent measurements at the indicated time points.
(C) Expression of wild-type and R172K mutant IDH2 was confirmed by western blotting of the lysates assayed in (A) and (B). Reprobing of the same blot with IDH1 antibody as a control is also shown.
Mutation of IDH2 R172K Results in Elevated 2HG Levels
R172K mutant IDH2 lacks the guanidinium moiety in residue 172 that normally stabilizes β-carboxyl addition in the interconversion of α-ketoglutarate and isocitrate. Yet R172K mutant IDH2 exhibited enhanced α-ketoglutarate-dependent NADPH consumption in cell lysates (Figure 2B). A similar enhancement of α-ketoglutarate-dependent NADPH consumption has been reported for R132 mutations in IDH1, resulting in conversion of α-ketoglutarate to 2HG (Dang et al., 2009). To determine whether cells expressing IDH2 R172K shared this property, we expressed IDH2 wild-type or IDH2 R172K in cells. The accumulation of organic acids, including 2HG, both within cells and in culture medium of the transfectants was then assessed by gas-chromatography mass spectrometry (GC-MS) after MTBSTFA derivatization of the organic acid pool. We observed a metabolite peak eluting at 32.5 min on GC-MS that was of minimal intensity in the culture medium of IDH2-wild-type-expressing cells, but that in the medium of IDH2-R172K-expressing cells had a markedly higher intensity approximating that of the glutamate signal (Figures 3A and 3B). Mass spectra of this metabolite peak fit that predicted for MTBSTFA-derivatized 2HG, and the peak’s identity as 2HG was additionally confirmed by matching its mass spectra with that obtained by derivatization of commercial 2HG standards (Figure 3C). Similar results were obtained when the intracellular organic acid pool was analyzed. IDH2 R172K expressing cells were found to have an approximately 100-fold increase in the intracellular levels of 2HG compared with the levels detected in vector-transfected and IDH2-wild-type-overexpressing cells (Figure 3D). Consistent with previous work, IDH1-R132H-expressing cells analyzed in the same experiment had comparable accumulation of 2HG in both cells and in culture medium. 2HG accumulation was not observed in cells overexpressing IDH1 wild-type (data not shown).
Figure 3. Expression of R172K Mutant IDH2 Elevates 2HG Levels within Cells and in Culture Medium
(A and B) 293T cells transfected with IDH2 wild-type (A) or IDH2 R172K (B) were provided fresh culture medium the day after transfection. Twenty-four hours later, the medium was collected, from which organic acids were extracted, purified, and derivatized with MTBSTFA. Shown are representative gas chromatographs for the derivatized organic acids eluting between 30 to 34 min, including aspartate (Asp) and glutamate (Glu). The arrows indicate the expected elution time of 32.5 min for MTBSTFA-derivatized 2HG, based on similar derivatization of a commercial R(-)-2HG standard. Metabolite abundance refers to GC-MS signal intensity.
(C) Mass spectrum of the metabolite peak eluting at 32.5 min in (B), confirming its identity as MTBSTFA-derivatized 2HG. The structure of this derivative is shown in the inset, with the tert-butyl dimethylsilyl groups added during derivatization highlighted in green. m/e– indicates the mass (in atomic mass units) to charge ratio for fragments generated by electron impact ionization.
(D) Cells were transfected as in (A) and (B), and after 48 hr intracellular metabolites were extracted, purified, MTBSTFA-derivatized, and analyzed by GC-MS. Shown is the quantitation of 2HG signal intensity relative to glutamate for a representative experiment. See also Figure S1.
http://ars.els-cdn.com/content/image/1-s2.0-S153561081000036X-gr3.jpg
Mutant IDH2 Produces the (R) Enantiomer of 2HG
Cancer-associated mutants of IDH1 produce the (R) enantiomer of 2HG ( Dang et al., 2009). To determine the chirality of the 2HG produced by mutant IDH2 and to compare it with that produced by R132H mutant IDH1, we used a two-step derivatization method to distinguish the stereoisomers of 2HG by GC-MS: an esterification step with R-(−)-2-butanolic HCl, followed by acetylation of the 2-hydroxyl with acetic anhydride ( Kamerling et al., 1981). Test of this method on commercial S(+)-2HG and R(−)-2HG standards demonstrated clear separation of the (S) and (R) enantiomers, and mass spectra of the metabolite peaks confirmed their identity as the O-acetylated di-(−)-2-butyl esters of 2HG (see Figures S1A and S1B available online). By this method, we confirmed the chirality of the 2HG found in cells expressing either R132H mutant IDH1 or R172K mutant IDH2 corresponded exclusively to the (R) enantiomer ( Figures S1C and S1D).
Leukemic Cells Bearing Heterozygous R172K IDH2 Mutations Accumulate 2HG
IDH2 Is Critical for Proliferating Cells and Contributes to the Conversion of α-Ketoglutarate into Citrate in the Mitochondria
A peculiar feature of the IDH-mutated cancers described to date is their lack of reduction to homozygosity. All tumors with IDH mutations retain one IDH wild-type allele. To address this issue we examined whether wild-type IDH1 and/or IDH2 might play a role in either cell survival or proliferation. Consistent with this possibility, we found that siRNA knockdown of either IDH1 or IDH2 can significantly reduce the proliferative capacity of a cancer cell line expressing both wild-type IDH1 and IDH2 ( Figure 4A).

Both IDH1 and IDH2 Are Critical for Cell Proliferation
http://ars.els-cdn.com/content/image/1-s2.0-S153561081000036X-gr4.jpg
Figure 4. Both IDH1 and IDH2 Are Critical for Cell Proliferation
(A) SF188 cells were treated with either of two unique siRNA oligonucleotides against IDH1 (siIDH1-A and siIDH1-B), either of two unique siRNA oligonucleotides against IDH2 (siIDH2-A and siIDH2-B), or control siRNA (siCTRL), and total viable cells were counted 5 days later. Data are the mean ± SEM of four independent experiments. In each case, both pairs of siIDH nucleotides gave comparable results. A representative western blot from one of the experiments, probed with antibody specific for either IDH1 or IDH2 as indicated, is shown on the right-hand side.
(B) Model depicting the pathways for citrate +4 (blue) and citrate +5 (red) formation in proliferating cells from [13C-U]-L-glutamine (glutamine +5).
(C) Cells were treated with two unique siRNA oligonucleotides against IDH2 or control siRNA, labeled with [13C-U]-L-glutamine, and then assessed for isotopic enrichment in citrate by LC-MS. Citrate +5 and Citrate +4 refer to citrate with five or four 13C-enriched atoms, respectively. Reduced expression of IDH2 from the two unique oligonucleotides was confirmed by western blot. Blotting with actin antibody is shown as a loading control.
(D) Cells were treated with two unique siRNA oligonucleotides against IDH3 (siIDH3-A and siIDH3-B) or control siRNA, and then labeled and assessed for isotopic citrate enrichment by GC-MS. Shown are representative data from three independent experiments. Reduced expression of IDH3 from the two unique oligonucleotides was confirmed by western blot. In (C) and (D), data are presented as mean and standard deviation of three replicates per experimental group.
The genetic analysis of these tumor samples revealed two neomorphic IDH mutations that produce 2HG. Among the IDH1 mutations, tumors with IDH1 R132C or IDH1 R132G accumulated 2HG. This result is not unexpected, as a number of mutations of R132 to other residues have also been shown to accumulate 2HG in glioma samples (Dang et al., 2009).
The other neomorphic allele was unexpected. All five of the IDH2 mutations producing 2HG in this sample set contained the same mutation, R140Q. As shown in Figure 1, both R140 in IDH2 and R100 in IDH1 are predicted to interact with the β-carboxyl of isocitrate. Additional modeling revealed that despite the reduced ability to bind isocitrate, the R140Q mutant IDH2 is predicted to maintain its ability to bind and orient α-ketoglutarate in the active site (Figure 6). This potentially explains the ability of cells with this neomorph to accumulate 2HG in vivo. As shown in Figure 5, samples containing IDH2 R140Q mutations were found to have accumulated 2HG to levels 10-fold to 100-fold greater than the highest levels detected in IDH wild-type samples.
Figure 5. Primary Human AML Samples with IDH1 or IDH2 Mutations Display Marked Elevations of 2HG
http://ars.els-cdn.com/content/image/1-s2.0-S153561081000036X-gr5.jpg

Structural Modeling of R140Q Mutant IDH2
Figure 6. Structural Modeling of R140Q Mutant IDH2
(A) Active site of human wild-type IDH2 with isocitrate replaced by α-ketoglutarate (α-KG). R140 is well positioned to interact with the β-carboxyl group that is added as a branch off carbon 3 when α-ketoglutarate is reductively carboxylated to isocitrate.
(B) Active site of R140Q mutant IDH2 complexed with α-ketoglutarate, demonstrating the loss of proximity to the substrate in the R140Q mutant. This eliminates the charge interaction from residue 140 that stabilizes the addition of the β-carboxyl required to convert α-ketoglutarate to isocitrate.
IDH2 Mutations Are More Common Than IDH1 Mutations in AML
- Neomorphic Enzymatic Activity to Produce 2HG Is the Shared Feature of IDH1 and IDH2 Mutations
- 2HG as a Screening and Diagnostic Marker
- Maintaining At Least One IDH1 and IDH2 Wild-Type Allele May Be Essential for Transformed Cells
- 2HG as an Oncometabolite
Like this:
Like Loading...
Read Full Post »


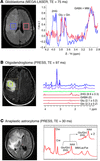
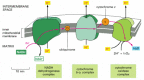
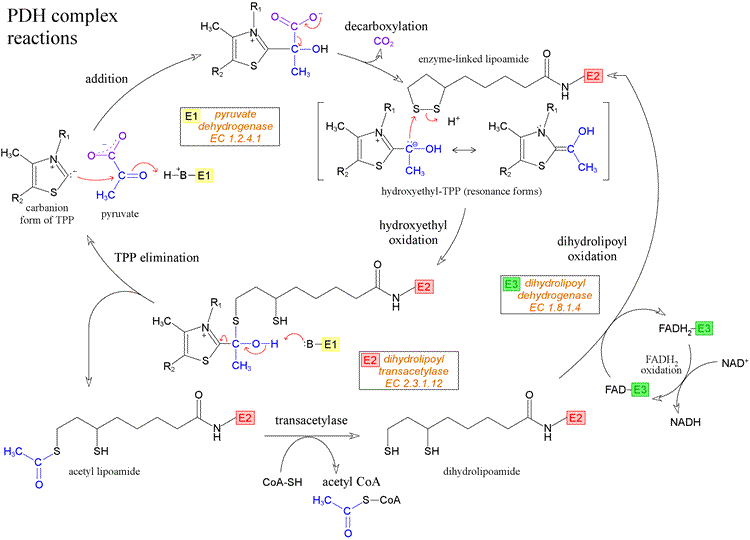