RNA and the Transcription the Genetic Code
Curator: Larry H. Bernstein, MD, FCAP
This portion of the series is a followup on the series on the replication of the genetic code (DNA). It may be considered alone, or as a tenth article. Just as DNA has become far more than it was envisioned 60 years ago, the RNA, which was opened to further investigation by Roger Kornberg, Nobel Laureate, and son of the Nobel Laureate, Arthur Kornberg, who studied DNA polymerase, and with his Nobel Associate, attracted the finest minds in biochemistry and built the best academic department of Biochemistry at Stanford University. RNA is associated with RNA polymerase as DNA is associated with DNA polymerase. We have already highlighted the several critical reactions involved in the step-by-step replication of DNA. The classic model has dictated DNA-RNA-protein. We shall here look at the amazing view that RNA is heterogeneous, and is involved in living processes in health and disease.
Transcription (Wikipedia)
Transcription is the first step of gene expression, in which a particular segment of DNA is copied into RNA
Both RNA and DNA are nucleic acids, which use base pairs of nucleotides as a complementary language
- that can be converted back and forth from DNA to RNA by the action of the correct enzymes.
During transcription, a DNA sequence is read by an RNA polymerase,
As opposed to DNA replication, transcription results in
- an RNA complement that includes the nucleotide uracil (U) in all instances
- where thymine (T) would have occurred in a DNA complement.
Also unlike DNA replication where DNA is synthesized, transcription does not involve an RNA primer to initiate RNA synthesis.
Eukaryotic transcription is the elaborate process that eukaryotic cells use to copy genetic information stored in DNA into units of RNA replica. Gene transcription occurs in both eukaryotic and prokaryotic cells.
A eukaryotic cell has a nucleus that separates the processes of transcription and translation. Eukaryotic transcription occurs
The complexity of the eukaryotic genome necessitates a great variety and complexity of gene expression control.
Transcription can be reduced to the following steps, each moving like a wave along the DNA.
- One or more sigma factors initiate transcription of a gene by enabling binding of RNA polymerase to promoter DNA.
- RNA polymerase moves a transcription bubble, like the slider of a zipper, which splits the double helix DNA molecule into two strands of unpaired DNA nucleotides, by breaking the hydrogen bonds between complementary DNA nucleotides.
- RNA polymerase adds matching RNA nucleotides that are paired with complementary DNA nucleotides of one DNA strand.
- RNA sugar-phosphate backbone forms with assistance from RNA polymerase to form an RNA strand.
- Hydrogen bonds of the untwisted RNA + DNA helix break, freeing the newly synthesized RNA strand.
- If the cell has a nucleus, the RNA may be further processed (with the addition of a 3’UTR poly-A tail and a 5’UTR cap) and exits to the cytoplasm through the nuclear pore complex.
The stretch of DNA transcribed into an RNA molecule is called a transcription unit and encodes at least one gene. If the gene transcribed encodes a protein, the result of transcription is messenger RNA (mRNA), which will then be used to create that protein via the process of translation. Alternatively, the transcribed gene may encode for either non-coding RNA genes (such as microRNA, lincRNA, etc.) or ribosomal RNA (rRNA) or transfer RNA (tRNA), other components of the protein-assembly process, or other ribozymes.[1]
Making RNA replication of gene in eukaryotic cells
Transcription is the process of copying genetic information stored in a DNA strand into a transportable complementary strand of RNA.[1] Eukaryotic transcription takes place in the nucleus of the cell and proceeds in three sequential stages: initiation, elongation, and termination.[1] The transcriptional machinery that catalyzes this complex reaction has at its core three multi-subunit RNA polymerases.[1]
Protein coding genes are transcribed into messenger RNAs (mRNAs) that carry the information from DNA to the site of protein synthesis.[1] Although mRNAs possess great diversity, they are not the most abundant RNA species made in the cell. The so-called non-coding RNAs account for the large majority of the transcriptional output of a cell.[2] These non-coding RNAs perform a variety of important cellular functions.[2]
RNA Polymerase
Eukaryotes have three nuclear RNA polymerases, each with distinct roles and properties
| Name |
Location |
Product |
| RNA Polymerase I (Pol I, Pol A) |
nucleolus |
larger ribosomal RNA (rRNA) (28S, 18S, 5.8S) |
| RNA Polymerase II (Pol II, Pol B) |
nucleus |
messenger RNA (mRNA), most small nuclear RNAs (snRNAs), small interfering RNA (siRNAs) and micro RNA (miRNA). |
| RNA Polymerase III (Pol III, Pol C) |
nucleus (and possibly the nucleolus-nucleoplasm interface) |
transfer RNA (tRNA), other small RNAs (including the small 5S ribosomal RNA (5s rRNA), snRNA U6, signal recognition particle RNA (SRP RNA) and other stable short RNAs |
RNA polymerase I (Pol I)
- catalyzes the transcription of all rRNA genes except 5S.[3][4]
These rRNA genes are organized into a single transcriptional unit and are transcribed into a continuous transcript. This precursor is then processed into
- three rRNAs: 18S, 5.8S, and 28S.
The transcription of rRNA genes
- takes place in a specialized structure of the nucleus called the nucleolus,[5] where
- the transcribed rRNAs are combined with proteins to form ribosomes.[6]
RNA polymerase II (Pol II)
- is responsible for the transcription of all mRNAs, some snRNAs, siRNAs, and all miRNAs.[3][4]
Many Pol II transcripts exist transiently as single strand precursor RNAs (pre-RNAs) that
- are further processed to generate mature RNAs.[1]
- precursor mRNAs (pre-mRNAs)are extensively processed
- before exiting into the cytoplasm through the nuclear pore for protein translation.
RNA polymerase III (Pol III) transcribes small non-coding RNAs, including tRNAs, 5S rRNA, U6 snRNA, SRP RNA, and other stable short RNAs such as ribonuclease P RNA.[7]

Structure of eukaryotic RNA polymerase II (light blue) in complex with α-amanitin (red), a strong poison found in death cap mushrooms that targets this vital enzyme
RNA Polymerases I, II, and III contain 14, 12, and 17 subunits, respectively.[8] All three eukaryotic polymerases have five core subunits that exhibit
- homology with the β, β’, αI, αII, and ω subunits of E. coli RNA polymerase.
An identical ω-like subunit (RBP6) is used by all three eukaryotic polymerases,
- while the same α-like subunits are used by Pol I and III.
The three eukaryotic polymerases share four other common subunits among themselves. The remaining subunits are unique to each RNA polymerase.
The additional subunits found in Pol I and Pol III relative to Pol II, are
- homologous to Pol II transcription factors.[8]
Crystal structures of RNA polymerases I[9] and II [10] provide an opportunity to understand the interactions among the subunits and the molecular mechanism of eukaryotic transcription in atomic detail.
The carboxyl terminal domain (CTD) of RPB1, the largest subunit of RNA polymerase II,
- plays an important role in bringing together the machinery necessary for the synthesis and processing of Pol II transcripts.[11]
Long and structurally disordered, the CTD
- contains multiple repeats of heptapeptide sequence YSPTSPS
- that are subject to phosphorylation and
- other posttranslational modifications during the transcription cycle.
These modifications and their regulation constitute
- the operational code for the CTD to control
- transcription initiation,
- elongation and
- termination and
- to couple transcription and RNA processing.[11]
A DNA transcription unit encoding for a protein contains
- not only the sequence that will eventually be directly translated into the protein (the coding sequence)
- but also regulatory sequences that direct and regulate the synthesis of that protein.
The regulatory sequence before (i.e., upstream from) the coding sequence is called
the sequence following (downstream from) the coding sequence is called
Initiation
The initiation of gene transcription in eukaryotes occurs in specific steps.[1]
First, an RNA polymerase along with general transcription factors binds to the promoter region of the gene
The subsequent transition of the complex from the closed state to the open state results in
- the melting or separation of the two DNA strands and
- the positioning of the template strand to the active site of the RNA polymerase.
Without the need of a primer
- RNA polymerase can initiate the synthesis of a new RNA chain using the template DNA strand
- to guide ribonucleotide selection and polymerization chemistry.[1]
However, many of the initiated syntheses are aborted
- before the transcripts reach a significant length (~10 nucleotides).
During these abortive cycles, the polymerase keeps making and releasing short transcripts
- until it is able to produce a transcript that surpasses ten nucleotides in length.
Once this threshold is attained, RNA polymerase escapes the promoter and
- transcription proceeds to the elongation phase.[1]
Eukaryotic promoters and general transcription factors
Pol II-transcribed genes contain a region
- in the immediate vicinity of the transcription start site (TSS) that binds and positions the preinitiation complex.
This region is called the core promoter because of its essential role in transcription initiation.[12][13] Different classes
- of sequence elements are found in the promoters. For example,
- the TATA box is the highly conserved DNA recognition sequence for the TATA box binding protein,
- TBP, whose binding initiates transcription complex assembly at many genes.
Eukaryotic genes
- contain regulatory sequences beyond the core promoter.
These cis-acting control elements
- bind transcriptional activators or repressors to increase or decrease transcription from the core promoter.
Well-characterized regulatory elements include
These regulatory sequences
- can be spread over a large genomic distance, sometimes located
- hundreds of kilobases from the core promoters.[1]
General transcription factors are
- a group of proteins involved in transcription initiation and regulation.[1]
These factors typically have DNA-binding domains that bind
- specific sequence elements of the core promoter and
- help recruit RNA polymerase to the transcriptional start site.
General transcription factors for RNA polymerase II include TFIID, TFIIA, TFIIB, TFIIF, TFIIE, and TFIIH.[1][14][15]
Transcription has some proofreading mechanisms
- but they are fewer and less effective than the controls for copying DNA; therefore, transcription has a lower copying fidelity than DNA replication.[2]
As in DNA replication, DNA is read from 3′ end → 5′ end during transcription. Meanwhile,
- the complementary RNA is created from the 5′ end → 3′ end direction.
This means its 5′ end is created first in base pairing. Although DNA is arranged as two antiparallel strands in a double helix, only
one of the two DNA strands, called the template strand, is used for transcription.
This is because RNA is only single-stranded, as opposed to double-stranded DNA. The other DNA strand (the non-template strand) is called the coding strand,
- because its sequence is the same as the newly created RNA transcript (except for the substitution of uracil for thymine).
The use of only the 3′ end → 5′ end strand eliminates the need for the Okazaki fragments seen in DNA replication.[1]
In virology, the term may also be used when referring to mRNA synthesis from a RNA molecule (i.e. RNA replication). For instance,
- the genome of an negative-sense single-stranded RNA (ssRNA -) virus
- may serve as a template to transcribe a positive-sense single-stranded RNA (ssRNA +) molecule,
- since the positive-sense strand contains the information needed
- to translate the viral proteins for viral replication afterwards.
This process is catalysed by a viral RNA replicase.
Transcription is divided into pre-initiation, initiation, promoter clearance, elongation and termination.
Pre-initiation
In eukaryotes, RNA polymerase, and therefore the initiation of transcription, requires
- the presence of a core promoter sequence in the DNA.
Promoters are regions of DNA that promote transcription and, in eukaryotes, are found at -30, -75, and -90 base pairs
- upstream from the transcription start site (abbreviated to TSS).
Core promoters are sequences within the promoter that are essential for transcription initiation. RNA polymerase is able to
The most characterized type of core promoter in eukaryotes is
- a short DNA sequence known as a TATA box, found 25-30 base pairs upstream from the TSS.
The TATA box, as a core promoter, is the binding site for
- a transcription factor known as TATA-binding protein (TBP), which
- is itself a subunit of another transcription factor, called Transcription Factor II D (TFIID).
After TFIID binds to the TATA box via the TBP,
- five more transcription factors and RNA polymerase combine around the TATA box
- in a series of stages to form a preinitiation complex.
One transcription factor, Transcription factor II H, has two components
- with helicase activity and so
- is involved in the separating of opposing strands of double-stranded DNA
- to form the initial transcription bubble.
However, only a low, or basal, rate of transcription is driven by the preinitiation complex alone. Other proteins known as
- activators and repressors,
- along with any associated coactivators or corepressors,
- are responsible for modulating transcription rate.
Thus, preinitiation complex contains:
- Core Promoter Sequence
- Transcription Factors
- RNA Polymerase
- Activators and Repressors.
The transcription preinitiation in archaea is, in essence, homologous to that of eukaryotes, but is much less complex.[3]
The archaeal preinitiation complex assembles at a TATA-box binding site; however,
- in archaea, this complex is composed of only RNA polymerase II, TBP, and TFB (the archaeal homologue of eukaryotic transcription factor II B (TFIIB)).[4][5]
Initiation

Simple diagram of transcription initiation. RNAP = RNA polymerase
In bacteria, transcription begins with the binding of RNA polymerase to the promoter in DNA. RNA polymerase is a core enzyme consisting of five subunits: 2 α subunits, 1 β subunit, 1 β’ subunit, and 1 ω subunit. At the start of initiation,
- the core enzyme is associated with a sigma factor that
- aids in finding the appropriate -35 and -10 base pairs downstream of promoter sequences.[6]
When the sigma factor and RNA polymerase combine, they form a holoenzyme.
Transcription initiation is more complex in eukaryotes. Eukaryotic RNA polymerase
- does not directly recognize the core promoter sequences. Instead,
- a collection of proteins called transcription factors mediate
- the binding of RNA polymerase and the initiation of transcription.
Only after certain transcription factors are attached to the promoter does the RNA polymerase bind to it. The completed assembly of
- transcription factors and RNA polymerase bind to the promoter,
- forming a transcription initiation complex.
Transcription in the archaea domain is similar to transcription in eukaryotes.[7]
Promoter clearance
After the first bond is synthesized, the RNA polymerase must clear the promoter. During this time
- there is a tendency to release the RNA transcript and produce truncated transcripts. This is called
- abortive initiation and is common for both eukaryotes and prokaryotes.[8]
In prokaryotes, abortive initiation continues to occur
- until an RNA product of a threshold length of approximately 10 nucleotides is synthesized,
- at which point promoter escape occurs and a transcription elongation complex is formed.
The σ factor is released according to a stochastic model.[9] Mechanistically, promoter escape occurs through a scrunching mechanism, where
- the energy built up by DNA scrunching provides the energy needed to break interactions between RNA polymerase holoenzyme and the promoter.[10]
In eukaryotes, after several rounds of 10nt abortive initiation,
- promoter clearance coincides with the TFIIH’s phosphorylation of serine 5 on the carboxy terminal domain of RNAP II,
- leading to the recruitment of capping enzyme (CE).[11][12]
The exact mechanism of how CE induces promoter clearance in eukaryotes is not yet known.
Elongation

Simple diagram of transcription elongation
One strand of the DNA, the template strand (or noncoding strand), is used as a template for RNA synthesis. As transcription proceeds,
- RNA polymerase traverses the template strand and uses base pairing complementarity with the DNA template to create an RNA copy.
Although RNA polymerase traverses the template strand from 3′ → 5′, the coding (non-template) strand and newly formed RNA can also be used as reference points,
- so transcription can be described as occurring 5′ → 3′.
This produces an RNA molecule from 5′ → 3′, an exact copy of the coding strand (except that thymines are replaced with uracils, and the nucleotides are composed of a ribose (5-carbon) sugar where DNA has deoxyribose (one fewer oxygen atom) in its sugar-phosphate backbone).
mRNA transcription can involve multiple RNA polymerases on a single DNA template and multiple rounds of transcription (amplification of particular mRNA),
- so many mRNA molecules can be rapidly produced from a single copy of a gene.
Elongation also involves a proofreading mechanism
- that can replace incorrectly incorporated bases.
In eukaryotes,
- short pauses during transcription allow appropriate RNA editing factors to bind.
These pauses may be intrinsic to the RNA polymerase or due to chromatin structure.
Termination
Bacteria use two different strategies for transcription termination –
- Rho-independent termination and
- Rho-dependent termination.
In Rho-independent transcription termination, also called intrinsic termination,
RNA transcription stops when the newly synthesized RNA molecule forms
- a G-C-rich hairpin loop followed by a run of Us. When the hairpin forms,
- the mechanical stress breaks the weak rU-dA bonds,
- now filling the DNA-RNA hybrid. This pulls the poly-U transcript out of the active site of the RNA polymerase,
- in effect, terminating transcription.
In the “Rho-dependent” type of termination, a protein factor called “Rho”
- destabilizes the interaction between the template and the mRNA, thus
- releasing the newly synthesized mRNA from the elongation complex.[13]
Transcription termination in eukaryotes is less understood but involves cleavage of the new transcript followed by template-independent addition of As at its new 3′ end, in a process called polyadenylation.[14]
Inhibitors
Transcription inhibitors can be used as antibiotics against, for example, pathogenic bacteria (antibacterials) and fungi (antifungals). An example of such an antibacterial is
8-Hydroxyquinoline is an antifungal transcription inhibitor.[15] The effects of histone methylation may also work to inhibit the action of transcription.
Transcription factories
Active transcription units are clustered in the nucleus, in discrete sites called transcription factories or euchromatin. Such sites can be visualized by allowing engaged polymerases to extend their transcripts in tagged precursors (Br-UTP or Br-U) and immuno-labeling the tagged nascent RNA. Transcription factories can also be localized using fluorescence in situ hybridization or marked by antibodies directed against polymerases. There are ~10,000 factories in the nucleoplasm of a HeLa cell, among which are ~8,000 polymerase II factories and ~2,000 polymerase III factories. Each polymerase II factory contains ~8 polymerases. As most active transcription units are associated with only one polymerase, each factory usually contains ~8 different transcription units. These units might be associated through promoters and/or enhancers, with loops forming a ‘cloud’ around the factor.[16]
History
A molecule that allows the genetic material to be realized as a protein was first hypothesized by François Jacob and Jacques Monod. Severo Ochoa won a Nobel Prize in Physiology or Medicine in 1959 for developing a process for synthesizing RNA in vitro with polynucleotide phosphorylase, which was useful for cracking the genetic code. RNA synthesis by RNA polymerase was established in vitro by several laboratories by 1965; however, the RNA synthesized by these enzymes had properties that suggested the existence of an additional factor needed to terminate transcription correctly.
In 1972, Walter Fiers became the first person to actually prove the existence of the terminating enzyme.
Roger D. Kornberg won the 2006 Nobel Prize in Chemistry “for his studies of the molecular basis of eukaryotic transcription”.
Reverse transcription
Some viruses (such as HIV, the cause of AIDS), have the ability to transcribe RNA into DNA. HIV has an RNA genome that is reverse transcribed into DNA. The resulting DNA can be merged with the DNA genome of the host cell. The main enzyme responsible for synthesis of DNA from an RNA template is called reverse transcriptase.
Some eukaryotic cells contain an enzyme with reverse transcription activity called telomerase. Telomerase is a reverse transcriptase that lengthens the ends of linear chromosomes. Telomerase carries an RNA template from which it synthesizes a repeating sequence of DNA, or “junk” DNA. This repeated sequence of DNA is called a telomere and can be thought of as a “cap” for a chromosome. It is important because every time a linear chromosome is duplicated, it is shortened. With this “junk” DNA or “cap” at the ends of chromosomes, the shortening eliminates some of the non-essential, repeated sequence rather than the protein-encoding DNA sequence, that is farther away from the chromosome end.
Telomerase is often activated in cancer cells to enable cancer cells to duplicate their genomes indefinitely without losing important protein-coding DNA sequence. Activation of telomerase could be part of the process that allows cancer cells to become immortal. The immortalizing factor of cancer via telomere lengthening due to telomerase has been proven to occur in 90% of all carcinogenic tumors in vivo with the remaining 10% using an alternative telomere maintenance route called ALT or Alternative Lengthening of Telomeres.[20]
RNA-Seq Dissects the Transcriptome
Transcript Targeting Kathy Liszewski
GEN Jul 1, 2014 (Vol. 34, No. 13)
With the rapid rise of next-generation sequencing (NGS), one of its technologies, RNA sequencing (RNA-Seq), has taken center stage for analyzing whole transcriptomes.
Although RNA-Seq is still the new kid on the block,
- this technology has the potential to revolutionize transcriptomics,
- revealing the architecture of gene expression in unprecedented detail.
RNA-Seq applications are proliferating and include
- the elucidation of disease processes,
- targeted drug development, and
- personalized medicine.
To orient researchers who are unfamiliar with the differences between RNA-Seq platforms, Kelli Bramlett, R&D scientist, Life Technologies, poses two key questions:
1. Are you interested in pure discovery, in a nonguided fashion, of every RNA species present in your test samples?
2. Are you mainly focused on measuring expression levels of well-annotated coding RNA transcripts?
You might have a set of genes crucial to
- identifying a disease state, or
- profiling the stage of a specific type of cancer, or
- monitoring development in your experimental system,
You then would want to employ a system that
- “allows you to quickly and efficiently focus on just your genes of interest and screen through many different samples in a short amount of time.”
RNA-Seq allows for true discovery but
- “requires sequencing depth and
- requires significant additional time for analysis
- If a focused panel targeting specific RNAs will better meet your needs, this can be accomplished on systems with
- much faster turnaround time and less sequencing depth.”( according to Dr. Bramlett)
Enhancing Sensitivity
RNA-Seq has advanced our ability to characterize transcriptomes at high resolution, and the laboratory and data analysis techniques used for this NGS application continue to mature, notes John Tan, Ph.D., senior scientist, Roche NimbleGen. “High sequencing costs combined with the omnipresence of pervasive, abundant transcripts decrease our power to study rare transcripts, decrease throughput, and limit the routine use of this technology.”
For example, notes Dr. Tan, a small number of
- highly expressed housekeeping genes can be responsible for a large fraction of total sequence reads in an experiment, thus
- increasing the amount of sequencing required to characterize less abundant transcripts of interest.
To improve the cost-effectiveness, throughput, and sensitivity of RNA-Seq, Dr. Tan and colleagues are developing methods to perform targeted RNA-Seq.
“Targeted enrichment of transcripts of interest
- circumvents the need to perform separate rRNA depletion or polyA enrichment steps on input RNA,” explains Dr. Tan.
“By targeting their sequencing, researchers can avoid wasting resources on
- housekeeping transcripts and focus instead on genes or genomic regions of interest.”
Targeted RNA-Seq can allow deeper sequence coverage, increased sensitivity for low-abundance transcripts, less total sequencing per sample, and more samples processed per sequencing instrument run. “Significantly, we observe that the enrichment step also preserves quantitative information very well,” adds Dr. Tan. “These advances will facilitate a more routine use of RNA-Seq technology.”
“Formalin-fixed, paraffin-embedded (FFPE) patient tissue archives and the clinical data associated with them may provide only limited amounts of sample that may also be degraded,” comments Gary Schroth, Ph.D., distinguished scientist, Illumina. Dr. Schroth says that most labs currently gauge RNA integrity via the RIN (RNA integrity number). but the RIN number from FFPE samples is not a sensitive measure of RNA quality or a good predictor for library preparation. A better predictor is RNA fragment size. We developed the DV200 metric, the percentage of RNA fragments greater than 200 nucleotides, a size needed for accurate construction of libraries.”
Illumina offers its TruSeq® RNA Access Library Preparation Kit especially for FFPE samples. This kit, when used with the DV200 metric, provides cleaner and more accurate library preparation. This new approach allows researchers to start with five-to tenfold less material when making libraries from FFPE samples.
Most NGS requires initial construction of libraries that may not provide the specificity desired even when prepared from mRNA. “Traditional RNA-Seq library preparation loses the strandedness of transcripts—information that is critical in understanding cellular transcription,” says Jungsoo Park, senior marketing and sales manager, Lexogen.
According to Park, Lexogen tackled this problem
- by developing a method to generate libraries with greater than 99.9% strand specificity with a simplified process that takes 4.5 hours to complete.
Lexogen’s SENSE mRNA-Seq library kit initially isolates mRNA via
- the poly A tail and utilizes random hybridization of the transcripts that
- are bound to the magnetic beads without transcript fragmentation.
“This is a revolutionary method, which keeps high strandedness of the transcripts,” asserts Park.
One of the novel aspects of this approach is the use of starter/stopper heterodimers containing platform-specific linkers that hybridize to the mRNA.
“The starters serve as primers for reverse transcription, which then
- terminates once the stopper from the next heterodimer is reached,
“At this point, the newly synthesized cDNA and the stopper are ligated while still bound to the RNA template.” According to Park,
- there is no need for a time-consuming fragmentation step, and library size is determined simply by the protocol itself.
For researchers only intending to see the expression levels, sequencing of the entire mRNA transcript will require subsequent bioinformatics processes such as RPKM, a measure of relative molar RNA concentration.
RNA-Seq Libraries
| NuGEN Technologies offers its Ovation Human Blood RNA-Seq Library System as an end-to-end solution for strand-specific RNA-Seq library construction. NuGEN’s Insert Dependent Adaptor Cleavage (InDA-C) technology can provide targeted depletion of unwanted high-abundance transcripts. |
- Cells possess many thousands of transcripts.
- uninformative transcript species that can compromise data quality and the cost-effectiveness of sequencing
- NuGEN Technologies has developed a method for targeted depletion of unwanted transcripts following construction of RNA-Seq libraries. (Insert Dependent Adaptor Cleavage (InDA-C),
employs customized primers that target specific transcripts, such as ribosomal and globin RNAs, to exclude from final RNA-Seq libraries. (hemoglobin RNA derived from blood accounts for at least 60% of transcripts) “By depleting these two transcript classes, InDA-C quadruples informative reads. and it avoids off-target mRNA cross-hybridization events that can potentially introduce bias. The species and transcript specificity of the workflow relies on the design of InDA-C primers, which can be constructed
- to target virtually any class of unwanted transcripts for targeted depletion,” according to Dr. Kain.
NuGEN has developed Single Primer Enrichment Technology, which can be used to prepare targeted NGS libraries from both gDNA or cDNA,
- used to identify gene fusion products and alternative splicing patterns from enriched cDNA libraries.
platforms automate the RNA sequencing sample preparation process [Beckman Coulter]
Preparation of libraries for RNA-Seq entails an intensive workflow. according to Alisa Jackson, senior marketing manager, Genomic Solutions, Beckman Coulter, automation provides four key advantages:
- Creation of high-quality mRNA libraries. Initial steps in this process include depleting samples of ribosomal RNA. Although it has the greatest abundance, rRNA gives the least amount of information.
- “We’ve automated this process on our Biomek instruments using popular sample preparation kits from Illumina and New England Biolabs,” notes Jackson. “Accurate pipetting and thorough mixing are critical for this process. The Biomek liquid handler’s 96-channel pipetting head is used in combination with an on-deck orbital shaker to vigorously mix samples. Results show this ‘mix and shake’ approach works well.”
- Limited exposure to RNAses from human contact. Every scientist’s nemesis when working with RNA is the universal presence of RNA-degrading RNAses. To help overcome this problem, says Jackson, “Biomek consumables such as pipette tips are DNase and RNase-free.”
- Reduced exposure to toxic chemicals. “An instrument dispenses all reagents involved in the various steps of process.”
- Enhanced reproducibility. “This is still a very expensive process,” asserts Jackson. “Obtaining accurate results the first time prevents costly repetitions. For this reason, we provide Biomek methods for many NGS library preparation kits. By fully testing these methods with real-life samples, we ensure reliable and repeatable creation of sequence-ready RNA libraries, whether stranded or nonstranded, mRNA or total RNA.”
- What’s Next?
RNA-seq data analysis
RNA-seq data analysis for target identification. [Boehringer Ingelheim]
- “With RNA-Seq, we are closing in on personalized medicine,” suggests Qichao Zhu, Ph.D., principal scientist, Boehringer Ingelheim. “This technology allows more exact identification of patient subgroups. Instead of ‘one drug fits all,’ we can now begin to more appropriately define which drugs will work in which patients. Diseases such as cancer and cystic fibrosis as well as neurodegenerative illnesses have many patient subcategories. Future pharmaceutical drug discovery will be better able to develop targeted therapeutics with the help of RNA-Seq.
- ”There are still many challenges in the field, however. “A critical aspect is accuracy. Given the large scale set of RNA-Seq, even 99.99% accuracy is not good enough for diagnostics,” insists Dr. Zhu. “Further, as we move forward, we will need to improve many aspects of the technology including
- disease tissue sample isolation,
- library construction methodologies, as well as
- analysis of massive datasets.
“In the future, a patient will go into the doctor’s office and have a whole transcriptome profile test performed.“When PCR technology was discovered, no one knew just how powerful it would become or how many applications it would generate. Now, it is used everywhere. NGS technology and RNA-Seq have a similar potential. ”
Gene Paces microRNAs to Set Developmental Rhythms
Kevin Mayer Jul 18, 2014 GEN News Highlights
http:/www.genengnews.com/gen-news-highlights/gene-paces-micrornas-to-set-developmental-rhythms/81250124/
Using C. elegans as a model researchers identified LIN-42, a gene that is found in animals across the evolutionary tree, as a potent regulator of numerous developmental processes. [C. Hammell, Cold Spring Harbor Laboratory]
- Although the how of a gene’s function is important, the when, too, is crucial. The ebb and flow ofgene expression can influence a cell’s fate during development, the maturation of entire organisms, and even the evolution of species—helping to explain how species with very similar gene content can differ so dramatically.
Nature’s developmental clockwork
- depends on the activation or repression of a specific and unique complement of genes. And these genes, in turn,
- are regulated by microRNA molecules. And, finally,
- the microRNAs are also subject to regulation.
- one must then study the regulators of the regulators of the regulators.
Little is known of the ultimate regulators—the elements that determine the activities of microRNAs. These elements, however, are presumably as subtle as they are powerful—
- subtle because microRNAs defined temporal gene expression and cell lineage patterns in a dosage-dependent manner;
- powerful because a single microRNA gene can control hundreds of other genes at once.
- as always, timing is everything: If a microRNA turns off genes too early or too late, the organism that depends on them will likely suffer severe developmental defects.
To undertake a search for genes that control developmental timing through microRNAs, a team of researchers at Cold Spring Harbor Laboratory relied on a tried-and-true model of animal development, Caenorhabditis elegans. These worms have a fixed number of cells, and each cell division is precisely timed. “It enables us to understand
- exactly how a mutation affects development,
- whether maturation is precocious or delayed,
- by directly observing defects in the timing of gene expression.” (said team leader Christopher Hammell, Ph.D.)
The researchers described their work in an article entitled, “LIN-42, the Caenorhabditis elegans PERIOD homolog, Negatively Regulates MicroRNA Transcription,” which appeared July 17 in PLoS Genetics.
the goal to unveil factors that regulate the expression of microRNAs that control developmental timing –
- they identified LIN-42, the C. elegans homolog of the human and Drosophila period gene implicated in circadian gene regulation, as a negative regulator of microRNA expression
“By analyzing the transcriptional expression patterns of representative microRNAs, we found that the transcription of many microRNAs is normally highly dynamic and coupled aspects of post-embryonic growth and behavior.”
“LIN-42 shares a significant amount of similarity to the genes that control circadian rhythms in organisms such as mice and humans,” explained Roberto Perales, Ph.D., one of the lead authors of the study. “These are genes that control the timing of cellular processes on a daily basis for you and me. In the worm, these same genes and mechanisms control development, growth, and behavior. This system will provide us with leverage to understand how all of these things are coordinated.”
- LIN-42 controls the repression of numerous genes in addition to microRNAs.
- levels of the protein encoded by LIN-42 tend to
- oscillate over the course of development and form a part of a developmental clock.
“LIN-42 provides the organism with a kind of cadence or temporal memory, so that
- it can remember that it has completed one developmental step before it moves on to the next,” emphasized Dr. Hammell. “This way, LIN-42 coordinates optimal levels of the genes required throughout development.”
Intracellular RNA-Seq
This literature review highlights a study led by George Church describing FISSEQ, or fluorescent in situ RNA sequencing.
Anton Simeonov, Ph.D. Jul 25, 2014
http://www.genengnews.com/insight-and-intelligence/intracellular-rna-seq/77900207/
FISSEQ appears to be sensitive to genes associated with cell type and function, and this in turn could be used for cell typing. [© Alila Medicinal Media – Fotolia.com]
- Methods such as fluorescence in situ hybridization (FISH) allow gene expression to be observed at the tissue and cellular level; however, only a limited number of genes can be monitored in this manner, making transcriptome-wide studies impractical. George Church’s group* is presenting the further development of their original approach called
- fluorescent in situ sequencing (FISSEQ) to incorporate a spatially structured sequencing library and an imaging method capable of resolving the amplicons (see Figure 1).
In fixed cells, RNA was reverse transcribed with tagged random hexamers to produce cDNA amplicons.
- Aminoallyl deoxyuridine 5-triphosphate (dUTP) was incorporated during reverse transcription and
- after the cDNA fragments were circularized before rolling circle amplification (RCA),
- an amine-reactive linker was used to cross-link the RCA amplicons containing aminoallyl dUTP.
The team generated RNA sequencing libraries in different cell types, tissue sections, and whole-mount embryos for three-dimensional (3D) visualization that spanned multiple resolution scales (see Figure 1).
| Click Image To Enlarge + |
| Figure 1 |
- Figure 1. Construction of 3D RNA-seq libraries in situ. After RT using random hexamers with an adapter sequence in fixed cells, the cDNA is amplified and cross-linked in situ. (A) A fluorescent probe is hybridized to the adapter sequence and imaged by confocal microscopy in human iPS cells (hiPSCs; scale bar: 10 μm) and fibroblasts (scale bar: 25 μm). (B) FISSEQ can localize the total RNA transcriptome in mouse embryo and adult brain sections (scale bar: 1 mm) and whole-mount Drosophila embryos (scale bar: 5 μm), although we have not sequenced these samples. (C) 3D rendering of gene-specific or adapter-specific probes hybridized to cDNA amplicons. 3D, three-dimensional; RT, reverse transcription; FISSEQ, fluorescent in situ sequencing; FISH, fluorescence in situ hybridization.
- In a proof-of-concept experiment (see Figure 2) the authors sequenced primary fibroblasts in situ after simulating a response to injury, which yielded 156,762 reads, mapped to 8,102 annotated genes. When the 100 highest ranked genes were clustered, cells kept in fetal bovine serum medium were enriched for fibroblast-associated gene hits, while the rapidly dividing cells in epidermal growth factor medium were less fibroblast-like, reaffirming that the FISSEQ platform output reflects the change in transcription status as a function of the cellular environment and stress factors.
- Figure 2. Overcoming resolution limitations and enhancing the signal-to-noise ratio. Ligation of fluorescent oligonucleotides occurs when the sequencing primer ends are perfectly complementary to the template. Extending sequencing primers by one or more bases, one can randomly sample amplicons at 1/4th, 1/16th, and 1/256th of the original density in fibroblasts (scale bar: 5 μm). N, nucleus; C, cytoplasm.
- The authors further noted that FISSEQ appears to be sensitive to genes associated with cell type and function, and this in turn could be used for cell typing. It was also speculated that FISSEQ might allow for a combined transcriptome profiling and mutation detection in situ.
- *Abstract from Science 2014, Vol. 343:1360–1363
Understanding the spatial organization of gene expression with single-nucleotide resolution requires
- localizing the sequences of expressed RNA transcripts within a cell in situ.
Here, we describe fluorescent in situ RNA sequencing (FISSEQ), in which stably cross-linked complementary DNA (cDNA) amplicons are sequenced within a biological sample.
- Using 30-base reads from 8102 genes in situ, we examined RNA expression and localization in human primary fibroblasts with a simulated wound-healing assay.
- FISSEQ is compatible with tissue sections and whole-mount embryos and
- reduces the limitations of optical resolution and noisy signals on single-molecule detection.
Our platform enables massively parallel detection of genetic elements, including
- gene transcripts and molecular barcodes, and can be used
- to investigate cellular phenotype, gene regulation, and environment in situ.
Anton Simeonov, Ph.D., works at the NIH.
ASSAY & Drug Development Technologies, is published by Mary Ann Liebert, Inc.
GEN presents here one article that was analyzed in the “Literature Search and Review” column, a paper published in Science titled “Highly multiplexed subcellular RNA sequencing in situ.” Authors of the paper are Lee JH, Daugharthy ER, Scheiman J, Kalhor R, Yang JL, Ferrante TC, Terry R, … and Church GM.
Completely ablate microRNA genes on the genomic level
- miR-KOs are transcription activator-like effector (TALE) nucleases that
- precisely edit specific miRNAs in mammalian cells.
- SBI designed miR-TALE-nucleases to cleave within the miRNA seed region.
In the absence of HR donor vectors, the cellular machinery repairs such breaks via
- non-homologous end joining (NHEJ).
This is an error-prone system that typically generates small deletions or insertions (indels) at or near the site of cleavage. Since the seed region (defined as bases 2-8 of the microRNA) directs miRNA binding to its target DNA, indels within the seed region completely abolish miRNA function.
Design of miR-KO TALE Nucleases
The miR-KOs are designed to disrupt the miRNA seed region. Pairing miR-KOs with an HR donor
- replaces the entire miRNA hairpin structure with an insulated selectable marker cassette.
Sample data for miR-KO 21 Knockout
Selection for HR events by puromycin or by FACS-based sorting for RFP can enrich for properly knocked-out alleles. The enriched cell populations are then
- genotyped to determine whether the knockout is at a single allele or bi-allelic (as in the case of hsa-miR-21).
Genotyping for HR events is performed via junction PCR of genomic DNA-insert junctions at 5′ and/or 3′ ends of an HR site. PCR primer pairs are designed with one of the primer sequences corresponding to the targeted genomic DNA region and the other corresponding to the HR vector.
Primer design strategy for HR-directed genotyping
Genomic DNA PCR was used to to detect HR integration in one or both alleles of hsa-miR-21. Individual cellular clones that display one HR event typically display mutated seed regions in the other allele. miR-KOs, when combined with HR donor vectors have been shown to be highly efficient in generating double miRNA knockouts. For example, a miR-KO strategy against human miR-21 in HEK293T cells resulted in 30 puromycin-resistant lines out of 96 single cell-derived clones. Subsequent PCR-based genotyping of 23 successful PCR amplifications revealed that ~96% (22/23) were mono-allelic (i.e. one allele with HR and other with NHEJ or WT) and ~4% (1/23) were bi-allelic (e.g. both alleles undergone HR) for HR-induced miR-21 deletion. Furthermore, sequencing of PCR products spanning the targeted seed region of miR-21 revealed that 91% (10/11) were NHEJ-modified.
Taken together, these results show a 87% bi-allelic modification rate (20 out of 23 clones)
- when the miR-KOs are combined with an HR donor vector.
Validation and phenotypic analysis of miR-KO of hsa-miR-21
To confirm complete loss of miRNA-21 expression, we quantified miR-21 expression in three independent miR-21 double knockouts by qPCR.
- Clone #1 and #7 carry one deletion of the miR-21 hairpin structure (via HR) and
- one indel within the seed region (via NHEJ);
- clone #5 carries bi-allelic deletions of the hairpin structure (bi-allelic HR).
We found complete abolishment of miR-21 expression in all three cell lines.
Growth phenotype uncovered in miR-21 KO cell lines
MicroRNA-21 has been characterized as a cell-promoting OncomiR. The abalation of the genomic hsa-miR-21 in human cells resulted in reduced proliferation in all three miR-21 knockout lines tested. Growth curves were plotted for the parental HEK293 cells as well as the three independent knockout lines.
Increase the ease and efficiency of obtaining KOs with matched HR vectors
While the use of miR-KOs alone can successfully abolish miRNA function,
- screening for bi-allelic indels can be laborious.
Due to the small changes seen with indels, many clonal lines have to be established through limited dilution or single-cell sorting techniques, and
- subsequently genomic DNA is PCR-amplified,
- cloned into vectors and
- subjected to genotyping by Sanger sequencing.
Since many cells will only have either zero or one alleles modified, tremendous work is often required to obtain bi-allelic indels.
To facilitate the screening process,
- one may combine miRNA-specific TALE-nucleases with HR donor vectors, which enables positive selection and convenient screening of targeted cells.
Because NHEJ occurs more frequently than HR donor integration,
- the majority of cells that undergo HR integration on one allele carry an indel in the miRNA seed region of the second allele.
This strategy has been shown to be highly efficient in generating bi-allelic miRNA knockouts. A positive selection strategy reveals puromycin-resistant and RFP-positive single-cell derived colonies, majority of which are double knockouts (i.e. HR event on one allele and indel in seed region of second allele).
Shown above is an overview of miR-KO strategies with miR-KOs alone and in combination with an HR donor vector. The HR donor vector enables positive selection, which allows for simple and efficient generation of cells harboring double knockouts.
Gene Described as Critical to Stem Cell Development
GEN News Highlights Jul 18, 2014
http://www.genengnews.com/gen-news-highlights/gene-described-as-critical-to-stem-cell-development/81250121/
- Scientists at Michigan State University say they have found that a gene known as ASF1A could be critical to the development of stem cells. ASF1A is at least one of the genes responsible for the mechanism of cellular reprogramming, a phenomenon that can turn one cell type into another, which is key to the making of stem cells, according to the researchers.
In a paper (“Histone chaperone ASF1A is required for maintenance of pluripotency and cellular reprogramming”) published in Science, the MSU team describes
- how they analyzed more than 5,000 genes from a human oocyte before determining that
- the ASF1A, along with another gene known as OCT4 and a helper soluble molecule, were the ones responsible for the reprogramming.
In 2006, an MSU team identified the thousands of genes that reside in the oocyte. In 2007, a team of Japanese researchers found that
- by introducing four other genes into cells, induced pluripotent stem cells (iPSCs) could be created without the use of a human egg.
The researchers say that the genes ASF1A and OCT4 work in tandem with a ligand,
- a hormone-like substance that also is produced in the oocyte called GDF9, to facilitate the reprogramming process.
- overexpression of just ASF1A and OCT4 in hADFs exposed to the oocyte-specific paracrine growth factor GDF9 can reprogram hADFs into pluripotent cells
The report underscores the importance of studying the unfertilized MII [metaphase II human] as a means
- to understand the molecular pathways governing somatic cell reprogramming.
“We believe that ASF1A and GDF9 are two players among many others that remain to be discovered, which are part of the cellular-reprogramming process,” noted Dr. Cibelli. “We hope that in the near future, with what we have learned here, we will be able to test new hypotheses that will reveal more secrets the oocyte is hiding from us. In turn, we will be able to develop new and safer cell therapy strategies.”
- Although the how of a gene’s function is important, the when, too, is crucial. The ebb and flow of gene expression can influence a cell’s fate during development, the maturation of entire organisms, and even the evolution of species—helping to explain how species with very similar gene content can differ so dramatically.
Identification and Insilico Analysis of Retinoblastoma Serum microRNA Profile and Gene Targets Towards Prediction of Novel Serum Biomarkers
M Beta, A Venkatesan, M Vasudevan, U Vetrivel, et al. Identification and Insilico Analysis of Retinoblastoma Serum microRNA Profile and Gene Targets Towards Prediction of Novel Serum Biomarkers.
Bioinformatics and Biology Insights 2013:7 21–34. http://dx.doi.org:/10.4137/BBI.S10501
This study was undertaken
- to identify the differentially expressed miRNAs in the serum of children with RB in comparison with the normal age matched serum,
- to analyze its concurrence with the existing RB tumor miRNA profile,
- to identify its novel gene targets specific to RB, and
- to study the expression of a few of the identified oncogenic miRNAs in the advanced stage primary RB patient’s serum sample.
MiRNA profiling performed on 14 pooled serum from children with advanced RB and 14 normal age matched serum samples
- 21 miRNAs found to be upregulated (fold change > 2.0, P < 0.05) and
- 24 downregulated (fold change > 2.0, P < 0.05).
Intersection of 59 significantly deregulated miRNAs identified from RB tumor profiles with that of miRNAs detected in serum profile revealed that
- 33 miRNAs had followed a similar deregulation pattern in RB serum.
Later we validated a few of the miRNAs (miRNA 17-92) identified by microarray in the RB patient serum samples (n = 20) by using qRT-PCR.
Expression of the oncogenic miRNAs, miR-17, miR-18a, and miR-20a by qRT-PCR was significant in the serum samples
- exploring the potential of serum miRNAs identification as noninvasive diagnosis.
Moreover, from miRNA gene target prediction, key regulatory genes of
- cell proliferation,
- apoptosis, and
- positive and negative regulatory networks
involved in RB progression were identified in the gene expression profile of RB tumors.
Therefore, these identified miRNAs and their corresponding target genes could give insights on
- potential biomarkers and key events involved in the RB pathway.
Prediction of Breast Cancer Metastasis by Gene Expression Profiles: A Comparison of Metagenes and Single Genes
(M Burton, M Thomassen, Q Tan, and TA Kruse.) Cancer Informatics 2012:11 193–217
http://dx.doi.org:/10.4137/CIN.S10375
The popularity of a large number of microarray applications has in cancer research led to the development of predictive or prognostic gene expression profiles. However, the diversity of microarray platforms has made the full validation of such profiles and their related gene lists across studies difficult and, at the level of classification accuracies, rarely validated in multiple independent datasets. Frequently, while the individual genes between such lists may not match, genes with same function are included across such gene lists. Development of such lists does not take into account the fact that
- genes can be grouped together as metagenes (MGs) based on common characteristics such as pathways, regulation, or genomic location.
In this study we compared the performance of either metagene- or single gene-based feature sets and classifiers using random forest and two support vector machines for classifier building. The performance
- within the same dataset,
- feature set validation performance, and
- validation performance of entire classifiers in strictly independent datasets
were assessed by
- 10 times repeated 10-fold cross validation,
- leave-one-out cross validation, and
- one-fold validation, respectively.
To test the significance of the performance difference between MG- and SG-features/classifiers, we used a repeated down-sampled binomial test approach.
MG- and SG-feature sets are transferable and perform well for training and testing prediction of metastasis outcome
- in strictly independent data sets, both
- between different and
- within similar microarray platforms, while
- classifiers had a poorer performance when validated in strictly independent datasets.
The study showed that MG- and SG-feature sets perform equally well in classifying independent data. Furthermore, SG-classifiers significantly outperformed MG-classifier
- when validation is conducted between datasets using similar platforms, while
- no significant performance difference was found when validation was performed between different platforms.
Prediction of metastasis outcome in lymph node–negative patients by MG- and SG-classifiers showed that SG-classifiers performed significantly better than MG-classifiers when validated in independent data based on the same microarray platform as used for developing the classifier. However, the MG- and SG-classifiers had similar performance when conducting classifier validation in independent data based on a different microarray platform. The latter was also true when only validating sets of MG- and SG-features in independent datasets, both between and within similar and different platforms.
Molecular basis of transcription pausing
Jeffrey W. Roberts
Science 13 June 2014; 344(6189), pp. 1226-1227 http://dx.doi.org:/10.1126/science.1255712
+Author Affiliations
- Department of Molecular Biology and Genetics, Cornell University, Ithaca, NY 14853, USA.
- E-mail: jwr7@cornell.edu
During RNA synthesis, RNA polymerase moves erratically along DNA,
- frequently resting as it produces an RNA copy of the DNA sequence.
Such pausing helps coordinate the appearance of a transcript with its utilization by cellular processes; to this end,
- the movement of RNA polymerase is modulated by mechanisms that determine its rate. For example,
- pausing is critical to regulatory activities of the enzyme such as the termination of transcription. It is also essential
- during early modifications of eukaryotic RNA polymerase II that activate the enzyme for elongation.
Two reports analyzing transcription pausing on a global scale in Escherichia coli, by Larson et al. (1) and by Vvedenskaya et al. (2) on page 1285 of this issue, suggest new functions of pausing and reveal important aspects of its molecular basis.
The studies of Larson et al. and Vvedenskaya et al. follow decades of analysis of bacterial transcription that has illuminated
- the molecular basis of polymerase pausing events that serve critical regulatory functions.
A transcription pause specified by the DNA sequence
- synchronizes the translation of RNA into protein with
- the transcription of leader regions of operons (groups of genes transcribed together) for amino acid biosynthesis;
- this coordination controls amino acid synthesis in response to amino acid availability (3).
A protein-induced pause occurs when the E. coli initiation factor σ70 restrains RNA polymerase
- by binding a second occurrence of the “−10” promoter element.
This paused polymerase provides a structure for
- engaging a transcription antiterminator (the bacteriophage λ Q protein) (4) that,
- inhibits transcription pauses, including those essential for transcription termination.
Knowledge about the interactions between nucleic acids and RNA polymerase that induce pausing
- comes partly from studies on the E. coli histidine biosynthesis operon.
RNA polymerase pauses at the leader region of this cluster of genes (the “his pause”),
- allowing an essential RNA hairpin structure to form just upstream of the RNA-DNA hybrid
- where RNA synthesis is templated in the polymerase’s catalytic cleft.
Importantly, however, other sequence elements are required to induce and stabilize the his pause—particularly
- the nucleotide at the newly formed, growing end of the RNA (pausing is favored by pyrimidines rather than purines) (5), and
- at the incoming nucleotide position [pausing is favored particularly by guanine (G)] (6), as well as surrounding elements.
Biochemical and structural analyses have identified an endpoint of the pausing process called the “elemental pause” in which
- the catalytic structure in the active site is distorted, preventing further nucleotide addition (7).
The elemental paused state also involves distinct conformational changes in the polymerase
- that may favor transcription termination and
- allow the his and related pauses to be stabilized by RNA hairpins (8).
ILLUSTRATION: V. ALTOUNIAN/SCIENCE
Single-molecule analysis of transcribing RNA polymerase, at nearly single-nucleotide resolution, identified many specific pause sites in the E. coli genome (9). Pausing occurs on essentially any DNA, and very frequently—every 100 nucleotides or so. These “ubiquitous” pauses are only partly efficient (i.e., not always recognized as the enzyme transits), and mostly have not been associated with specific functions. However, their existence is consistent with biochemical experiments showing that the progress of RNA polymerase is generally erratic. A consensus sequence for ubiquitous pauses was identified, with two important elements:
- a preference for pyrimidine [mostly cytosine (C)] at the newly formed RNA end,
- followed by G to be incorporated next—just as found for the his pause; and
- a preference for G at position −10 of the RNA (10 nucleotides before the 3′ end), which is
- at the upstream boundary of the RNA-DNA templating hybrid.
Remarkably, the tendency of a G in this position to induce pausing was recognized earlier, when DNA could be sequenced only through its transcript (10); it was thought that inhibited unwinding of the RNA-DNA hybrid underlies the pause.
Polyymerase, paused.
During transcription, RNA exists in two states as RNA polymerase progresses:
- pretranslocated, just after the addition of the last nucleotide [here, cytosine (C)]; and
- posttranslocated, after all nucleic acids have shifted in register by one nucleotide relative to the enzyme,
- exposing the active site for binding of the next substrate molecule [here, guanine (G)].
The pretranslocated state is dominant in the pause. The critical G-C base (RNA-DNA) pair at position −10 in pretranslocated state and
- the nontemplate DNA strand G bound in the polymerase in the posttranslocated state are marked with an asterisk.
ILLUSTRATION: V. ALTOUNIAN/SCIENCE
This ubiquitous pausing consensus sequence now has been refined and mapped exhaustively in the E. coligenome by Larson et al. and Vvedenskaya et al. (see the figure). In an analysis called native elongating transcript sequencing (NET-Seq) (11), transcripts associated with the whole cellular population of RNA polymerase are isolated from abruptly frozen cells and their growing ends are sequenced, giving a snapshot at nucleotide resolution of global transcription activity; DNA sites that are highly populated by RNA polymerase represent pauses. Larson et al. identified ∼20,000 transcription pause sites in the E. coli genome, including those expected from previous analysis of known sites like the his pause. Their analysis raises interesting questions about the role of such abundant pausing sequences.
Primarily, Larson et al. note that pauses frequently occur
- exactly at the site of translation initiation, suggesting an important role in gene expression.
This coincidence of events is understandable when you examine the sequences. The consensus sequence in RNA for RNA polymerase pausing is G−10Y−1G+1 [G at position −10 and at the site after the pause; Y denotes either C or uracil (U) at the RNA end] according to Larson et al. and Vvedenskaya et al. The Shine-Dalgarno consensus sequence in RNA that the small-subunit ribosome recognizes is AGGAGG [adenine (A)] providing the G at the −10 position;
- the downstream initiation codon for RNA translation is AUG, providing (for E. coli) the U at the pause end at position −1, with a following G at position +1.
A slightly modified pausing consensus sequence in the bacterium Bacillus subtilis accommodates the difference in spacing between the Shine-Dalgarno sequence and the initiation codon. What might be the role of a pause exactly at the translation initiation site? Because the ribosome binding site is physically concealed by RNA at the pause,
- pausing may enable some process that prepares the RNA for translation once RNA polymerase transits the pause site.
Larson et al. suggest that the pause allows upstream RNA secondary structure to resolve in order to present the initiation region properly to the ribosome.
A particularly informative application of NET-Seq that provides new mechanistic information about pausing is based on the discovery of a specific binding site in RNA polymerase [the core recognition element (CRE)] for G in the non-template DNA strand (the strand not transcribed), at position +1 in the “posttranslocated” structure (12).
- It could be that specific binding of a nucleotide to the enzyme in this position enhances pausing by slowing translocation;
surprisingly, however, Vvedenskaya et al. find the opposite. Cells altered to destroy the G binding site have up to twice as many sites of pausing as in wild-type cells, with
- a greater preference for G as the incoming nucleotide.
However, this result is understandable in terms of the translocation cycle of RNA polymerase and the ubiquitous pausing sequence that has G at position +1. Binding of G at position +1 to CRE only occurs in the posttranslocated state, which would thus be favored over the pretranslocated state. Hence,
- if G binding inhibits pausing, then the rate-limiting paused structure must be in the pretranslocated state (a conclusion also made by Larson et al. from biochemical experiments).
This is an important insight into the sequence of protein–nucleic acid interactions that occur in pausing. Vvedenskaya et al. suggest that the actual role of the G binding site is to promote translocation and thus inhibit pausing, to smooth out adventitious pauses in genomic DNA.
The studies by Larson et al. and Vvedenskaya et al. provide a refined and detailed analysis of DNA sequence–induced transcription pausing. As a core process in gene expression, this understanding is relevant not only for the basic biology of transcription, but also has applications in synthetic biology and the design of genetic circuits.
References
- ↵
- H. Larson
- et al
., Science 344, 1042 (2014).
Abstract/FREE Full Text
O. Vvedenskaya et al.
,Science 344, 1285 (2014).
Abstract/FREE Full Text
- Landick, Turnbough, , C. Yanofsky
, in Escherichia coli and Salmonella, F. Neidhardt , Ed. (American Society for Microbiology, Washington, DC, 1996), vol. 1, pp. 1263–1286.
Google Scholar
- A. Perdue, W. Roberts
, J. Mol. Biol. 412, 782 (2011).
CrossRefMedlineGoogle Scholar
- L. Chan Landick
, J. Mol. Biol. 233, 25 (1993)
CrossRefMedlineWeb of ScienceGoogle Scholar
- N. Lee, Phung,Stewart, Landick
, J. Biol. Chem. 265, 15145 (1990).
Abstract/FREE Full Text
- Toulokhonov, Zhang,Palangat, Landick
, Mol. Cell 27, 406 (2007).
CrossRefMedlineWeb of ScienceGoogle Scholar
- Weixlbaumer, Leon, Landick, A. Darst
, Cell 152, 431 (2013).
CrossRefMedlineWeb of ScienceGoogle Scholar
9. M. Herbert, et al
., Cell 125, 1083 (2006).
CrossRefMedlineWeb of ScienceGoogle Scholar
10. Gilbert
, in RNA Polymerase, R. L. a. M. J. Chamberl1n , Ed. (Cold Spring Harbor Laboratory, Cold Spring Harbor, NY, 1976), pp. 193–205.
Google Scholar
10. Churchman,, S. Weissman
, Nature 469, 368 (2011).
CrossRefMedlineWeb of ScienceGoogle Scholar
12.Zhan et al
., Science 338, 1076 (2012).
The editors suggest the following Related Resources on Science sites
In Science Magazine
REPORT Interactions between RNA polymerase and the “core recognition element” counteract pausing
Irina O. Vvedenskaya, Hanif Vahedian-Movahed, Jeremy G. Bird, Jared G. Knoblauch, Seth R. Goldman,
Yu Zhang, Richard H. Ebright, and Bryce E. Nickels
Science 13 June 2014: 1285-1289.
“miR”roring Lupus Control
Angela Colmone
Sci.Signal., 29 July 2014;; 7(336),, p. ec202 http://dx.doi.org:/10.1126/scisignal.2005732
Decreased expression of the B cell signaling inhibitor PTEN may contribute to lupus pathology. Wu et al. found that microRNA (miR)–mediated regulation of PTEN is altered in patients with the autoimmune disease systemic lupus erythematosus (SLE). Patients with SLE have hyperactivated B cells, which results in the production of autoantibodies. The authors found that decreased expression of PTEN in B cells from SLE patients contributes to this B cell hyperactivation. What’s more, they found that PTEN expression in these cells was regulated by miRs and that blocking miR-7 could restore PTEN expression and function to that of healthy controls. These data support exploring miR-7 and PTEN as therapeutic targets for SLE.
X-n. Wu, Y-x. Ye, J-w. Niu, Y. Li, X. Li, X. You, H. Chen, L-d. Zhao, X-f. Zeng, F-c. Zhang, F-l. Tang, W. He, X-t. Cao, X. Zhang, P. E. Lipsky, Defective PTEN regulation contributes to B cell hyperresponsiveness in systemic lupus erythematosus. Sci. Transl. Med. 6, 246ra99 (2014). [Full Text]
Citation:
- Colmone, “miR”roring Lupus Control. Sci. Signal.7, ec202 (2014).
Long Noncoding RNA Regulating Apoptosis Discovered
Source: © Dmitry Sunagatov – Fotolia.com
- Scientists from the University of São Paulo (USP) have identified an RNA molecule known as INXS that, although containing no instructions for the production of a protein, modulates the action of an important gene that impactsapoptosis.
According to Sergio Verjovski-Almeida, Ph.D., professor at the USP Chemistry Institute, INXS expression is generally diminished in cancer cells, and methods that are capable of stimulating the production of this noncoding RNA can be used to treat tumors. In experiments on mice, the USP scientists were able to effect a 10-fold reduction in the volume of subcutaneous malignant tumors by administering local injections of a plasmid containing INXS.
The team’s findings (“Long noncoding RNA INXS is a critical mediator of BCL-XS induced apoptosis”) were published in Nucleic Acids Research.
The group headed by Dr. Verjovski-Almeida at USP has been investigating the regulatory role of so-called intronic nonprotein-coding genes—those found in the same region of the genome as a coding gene but on the opposite DNA strand. INXS, for example, is an RNA expressed on the opposite strand of a gene coding for the BCL-X protein.
“We were studying several protein-coding genes involved in cell death in search of evidence that one of them was regulated by intronic noncoding RNA. That was when we found the gene for BCL-X, which is located on chromosome 20,” he explained.
BCL-X is present in cells in two different forms: one that inhibits apoptosis (BCL-XL) and one that induces the process of cell death (BCL-XS). The two isoforms act on the mitochondria but in opposite ways. The BCL-XS isoform is considered a tumor suppressor because it activates caspases, which are required for the activation of other genes that cause cell death.
“In a healthy cell, there is a balance between the two BCL-X isoforms. Normally, there is already a smaller number of the pro-apoptotic form (BCL-XS). However, in comparing tumor cells to nontumor cells, we observed that tumor cells contain even fewer of the pro-apoptotic form, as well as reduced levels of INXS. We suspect that one thing affects the other,” continued Dr. Verjovski-Almeida.
To confirm the hypothesis, the group silenced INXS expression in a normal cell lineage and the result, as expected, was an increase in the BCL-XL (anti-apoptotic) isoform. “The rate between the two—which was 0.25—decreased to 0.15; in other words, the pro-apoptotic form that previously represented one fourth of the total began to represent only one sixth,” noted Dr. Verjovski-Almeida.
The opposite occurred when the researchers artificially increased the amount of INXS using plasmid expression in a kidney cancer cell line, with the noncoding RNA being reduced. “The pro-apoptotic form increased, and the anti-apoptotic form decreased,” he added.
“In a mouse xenograft model, intra-tumor injections of an INXS-expressing plasmid caused a marked reduction in tumor weight, and an increase in BCL-XS isoform, as determined in the excised tumors,” wrote the investigators. “We revealed an endogenous lncRNA that induces apoptosis, suggesting that INXS is a possible target to be explored in cancer therapies.
Scientists map one of the most important proteins in life—and cancer
Mon, 07/21/2014
Scientists have revealed the structure of one of the most important and complicated proteins in cell division—a fundamental process in life and the development of cancer—in research published in Nature.
Images of the gigantic protein in unprecedented detail will transform scientists’ understanding of exactly how cells copy their chromosomes and divide, and could reveal binding sites for future cancer drugs.
A team from The Institute of Cancer Research, London, and the Medical Research Council Laboratory of Molecular Biology in Cambridge produced the first detailed images of the anaphase-promoting complex (APC/C).
The APC/C performs a wide range of vital tasks associated with mitosis,
- the process during which a cell copies its chromosomes and
- pulls them apart into two separate cells.
- Mitosis is used in cell division by all animals and plants.
Discovering its structure could ultimately lead to new treatments for cancer, which
- hijacks the normal process of cell division to make thousands of copies of harmful cancer cells.
In the study, which was funded by Cancer Research UK,
the researchers reconstituted human APC/C and used a combination of electron microscopy and imaging software to visualize it at a resolution of less than a billionth of a meter.
The resolution was so fine that it allowed the researchers to see the secondary structure—
- the set of basic building blocks which combine to form every protein.
Alpha-helix rods and folded beta-sheet constructions were clearly visible within the 20 subunits of the APC/C, defining the overall architecture of the complex.
Previous studies led by the same research team had shown
- a globular structure for APC/C in much lower resolution, but
- the secondary structure had not previously been mapped.
The new study could identify binding sites for potential cancer drugs.
Each of the APC/C’s subunits bond and mesh with other units at different points in the cell cycle,
- allowing it to control a range of mitotic processes including the initiation of DNA replication,
- the segregation of chromosomes along protein ‘rails’ called spindles, and
- the ultimate splitting of one cell into two, called cytokinesis.
Disrupting each of these processes could
- selectively kill cancer cells or prevent them from dividing.
Dr David Barford, who led the study as Professor of Molecular Biology at The Institute of Cancer Research, London, before taking up a new position at the Medical Research Council Laboratory of Molecular Biology in Cambridge, said:
“It’s very rewarding to finally tie down the detailed structure of this important protein, which is both
- one of the most important and most complicated found in all of nature.
We hope our discovery will open up whole new avenues of research that increase our understanding of the process of mitosis, and ultimately lead to the discovery of new cancer drugs.”
Professor Paul Workman, Interim Chief Executive of The Institute of Cancer Research, London, said: “The fantastic insights into molecular structure
- provided by this study are a vivid illustration of the critical role played by fundamental cell biology in cancer research.
“The new study is a major step forward in our understanding of cell division. When this process goes awry
- it is a critical difference that separates cancer cells from their healthy counterparts.
Understanding exactly how cancer cells divide inappropriately is crucial to
- the discovery of innovative cancer treatments to improve outcomes for cancer patients.”
Dr Kat Arney, Science Information Manager at Cancer Research UK, said “Figuring out how the fundamental molecular ‘nuts and bolts’ of cells work is vital
- if we’re to make progress understanding what goes wrong in cancer cells and how to tackle them more effectively.
Revealing the intricate details of biological shapes is a hugely important step towards identifying targets for future cancer drugs.”
Source: The Institute of Cancer Research, London
A cell death avenue evolved from a life-saving path
- Harm H. Kampinga
+Author Affiliations
- Department of Cell Biology, University Medical Center Groningen, University of Groningen, Groningen, Netherlands.
- E-mail: h.kampinga@umcg.nl
Related Resources
In Science Magazine
Science 20 June 2014: 1389-1392.Published online 22 May 2014
In Science Signaling
Sci. Signal. 24 June 2014: ec175.
Yeast metacaspases are the ancestral enzymes of caspases that execute cellular suicide (“programmed cell death”) in multicellular organisms. Studies on metacaspase 1 (Mca1)
- have suggested that single-cell eukaryotes can also commit programmed cell death (1, 2). However,
on page 1389 of this issue, Malmgren Hill et al. (3) show that
- Mca1 has positive rather than negative effects on the life span of the budding yeast Saccharomyces cerevisiae,
- especially when protein homeostasis is impaired.
Mca1 helps to degrade misfolded proteins that accumulate during aging or that are generated by acute stress, and
- thereby ensures the continuous and healthy generation of daughter cells
- that are free of insoluble aggregates that otherwise would limit life span.
View larger version:
ILLUSTRATION: V. ALTOUNIAN/SCIENCE
Loss of Mca1 activity has been associated with a reduced appearance of programmed cell death markers (1, 4),
- implying that its overexpression should decrease the replicative life span of yeast (the number of daughter cells a mother cell can produce throughout its life). Cells lacking Mca1
- have increased amounts of protein aggregates and oxidized proteins (4, 5).
Malmgren Hill et al. not only show that this is related to decreased survival,
- but also provide mechanistic insights into the mode of action of Mca1.
Its pro-life action depends on the chaperone heat shock protein 104 (Hsp104), a protein that
- can disentangle protein aggregates and
- is crucial for the asymmetric segregation of protein aggregates in dividing cells.
Mca1 deficiency does not affect life span of wild-type strains, but
- further decreases life span in strains already compromised in protein quality control. In particular,
- replicative aging is accelerated in strains lacking the Hsp70 co-chaperone Ydj1.
Mca1 does not improve protein folding but supports
- degradation of terminally misfolded proteins.
Malmgren Hill et al. show that Mca1 requires proteasomes (protein structures that break down proteins) for all its effects.
The study by Malmgren Hill et al. challenges the idea that
- caspases are activated as an altruistic suicide mechanism in single-cell eukaryotes
- as a means to provide nutrients for younger and fitter cells in the population (2). Rather,
- the data suggest that from an evolutionary perspective, caspase activation is an integrated part of a protective response
- to help cells survive toxic stress caused by the accumulation of misfolded proteins.
When, however, activated incorrectly (e.g., in the absence of proteotoxic stress) or too strongly (e.g., in the case of excessive damage to the cell),
- the caspase activity may become nonselective and thus
- lead to the typical Mca1-dependent hallmarks of programmed cell death (1, 2, 4). Also,
- caspase activation in metazoa may function primarily in cell-autonomous protection and cellular remodeling or
- pruning. Its role in programmed cell death may also simply reflect overactivation upon severe cellular damage or
- hijacking of the caspases in the absence of stress to serve in non–cell-autonomous regulated tissue homeostasis.
View larger version:
Defense against protein damage.
Stress-damaged proteins that form aggregates in cells can be reactivated with the Hsp104-Ssa-Ydj1 chaperone machinery. Mca1 may act
- in parallel by binding to misfolded proteins during early stages of aggregation for proteasomal degradation (this is independent of Mca1’s enzymatic activity). Alternatively,
- Mca1 may associate with misfolded proteins formed at late stages of aggregation (together with Hsp104 and Ssa), helping to disentangle
- the aggregates by its protease cleavage activity before shunting them to the proteasome for degradation.
ILLUSTRATION: V. ALTOUNIAN/SCIENCE
The results of Malmgren Hill et al. also highlight the importance of protein quality control for cellular aging. A collapse of protein homeostasis
- has been implicated mostly in chronological aging of differentiated cells and, for example,
- as a cause of neurodegenerative diseases (6).
The authors show that it also plays a prominent role in replicative aging.
- This supports early findings in yeast (7) and may also be relevant to metazoa,
- in which stem cells have extremely efficient protein degradation mechanisms (8) and
- also use asymmetric segregation of protein damage for rejuvenation (9).
The data of Malmgren Hill et al. also suggest the existence of an additional layer of control of protein homeostasis. Beyond the
- activation and induction of chaperones that assist in protein sorting, refolding, and protein degradation via proteasomes and
- autophagosomes (membrane structures that deliver proteins to lysosomes for enzymatic destruction) (10),
- Malmgren Hill et al. show that activation of caspases also belongs to the cell’s repertoire of defense mechanisms against protein damage.
- Mca1 might act in parallel to the Ssa-Ydj1 machinery. Although
- Ssa-Ydj1 collaborates with Hsp104 to refold proteins after their aggregation (11),
- Mca1 primarily supports protein degradation, as its actions require not only Hsp104 but also proteasomal activity (3).
Precisely how Mca1 exerts its effect is yet unclear. It can associate with aggregates independent of other chaperones (3, 5) and
- independent of its catalytic activity (5), suggesting that
- it binds directly to misfolded proteins [likely through its amino-terminal “pro-domain”
- that is rich in glutamine and asparagine repeats].
This interaction may exert chaperone-like activity by keeping unfolded proteins
- in a proteasome-competent form, which explains why part of Mca1’s protective actions in wild-type strains is independent of its protease activity.
However, the caspase activity of Mca1 is required for protein homeostasis and control of life span in Ydj1-deficient strains. It could be that
- for more terminally misfolded proteins that accumulate in the absence of Ydj1,
- protease cleavage may help to dismantle such aggregates in concert with Ssa and Hsp104 (see the figure).
This would also explain why the strongest phenotypes of Mca1 are seen under conditions in which Ydj1 is absent. More biochemical data with purified proteins will be needed to test these ideas.
The study of Malmgren Hill et al. suggests that altruism may not exist among cells. However, life and death seem to be close neighbors, and the things that are life saving may also become lethal. It will therefore be a challenge
- to make use of these insights into caspase function in order to treat diseases by selectively tipping the balance toward life (e.g., in neurodegenerative diseases) or death (e.g., in cancer).
References
- Madeo et al
., Mol. Cell 9, 911 (2002).
CrossRefMedlineWeb of ScienceGoogle Scholar
- Herker et al
., J. Cell Biol. 164, 501 (2004).
Abstract/FREE Full Text
- Malmgren Hill et al
., Science 344, 1389 (2014).
Abstract/FREE Full Text
- A. Khan, . Chock, R. Stadtman
, Proc. Natl. Acad. Sci. U.S.A. 102, 17326 (2005).
Abstract/FREE Full Text
- E. Lee, Brunette, G. Puente, A. Megeney
, Proc. Natl. Acad. Sci. U.S.A. 107, 13348(2010).
Abstract/FREE Full Text
- E. Balch, I. Morimoto, Dillin, W. Kelly
, Science 319, 916 (2008).
Abstract/FREE Full Text
- Aguilaniu, Gustafsson, Rigoulet, Nyström
, Science 299, 1751 (2003).
Abstract/FREE Full Text
- Vilchez et al
., Nature 489, 304 (2012).
CrossRefMedlineWeb of ScienceGoogle Scholar
- A. Rujano et al
., PLOS Biol. 4, e417 (2006).
CrossRefMedlineGoogle Scholar
- H. Kampinga, A. Craig
, Nat. Rev. Mol. Cell Biol. 11, 579 (2010).
CrossRefMedlineWeb of ScienceGoogle Scholar
- R. Glover, Lindquist
, Cell 94, 73 (1998).
CrossRefMedlineWeb of ScienceGoogle Scholar
the following Related Report
Life-span extension by a metacaspase in the yeast Saccharomyces cerevisiae
Sandra Malmgren Hill, Xinxin Hao, Beidong Liu, and Thomas Nyström
Science 20 June 2014: 1389-1392.
Synthetic biology: the many facets of T7 RNA polymerase
David L Shis, Matthew R Bennett
Molecular Systems Biology(2014)10:745 30.07.2014
http://dx.doi.org:/10.15252/msb.20145492
Added 8-2-2014
Split T7 RNA polymerase provides new avenues for creating synthetic gene circuits that are decoupled from host regulatory processes—but how many times can this enzyme be split, yet retain function? New research by Voigt and colleagues (Segall‐Shapiro et al, 2014) indicates that it may be more than you think.
See also: TH Segall‐Shapiro et al (July 2014)
Synthetic gene circuits have become an invaluable tool for studying the design principles of native gene networks and facilitating new biotechnologies (Wayet al, 2014). Synthetic biologists often strive to build circuits within a framework that enables their consistent and robust operation across a range of hosts and conditions. Currently, however, each circuit must be fastidiously tuned and retuned in order to properly function within a particular host, leading to costly design cycles and esoteric conclusions. As a result, researchers have invested a great deal in developing strategies that
- decouple synthetic gene circuits from host metabolism and regulation.
In their recent work, Segall‐Shapiro et al (2014) address this problem by
- expanding the capabilities of orthogonal transcriptional systems in Escherichia coli using fragmented mutants of bacteriophage‐T7 RNA polymerase (T7 RNAP).
T7 RNAP has had a long relationship with biotechnology and
- is renowned for its compactness and transcriptional activity.
This single subunit polymerase strongly
- drives transcription from a miniscule 17‐bp promoter
- that is orthogonally regulated inE. coli.
In this context, orthogonal means that
- T7 RNAP will not transcribe genes driven by native E. coli promoters, and
- native polymerases in E. coli will not recognize T7 RNAP’s special promoter—that is
- the two transcriptional systems leave each other alone.
Interestingly, T7 RNAP drives transcription so strongly that,
- if left unregulated, it can quickly exhaust cellular resources and lead to cell death.
Because of this, T7 RNAP
- has been leveraged in many situations calling for protein over‐expression (Studier & Moffatt, 1986).
Additionally, studies examining the binding of T7 RNAP to its promoter have identified
- a specificity loop within the enzyme that makes direct contact with the promoter
- between base pairs −11 and −8.
This has led to a number of efforts that have generated T7 RNAP mutants
- with modified specificities to promoters orthogonal to the original (Chelliserrykattil et al, 2001).
Given the growing interest in the development of synthetic gene circuits, researchers have taken a renewed interest in T7 RNAP. The orthogonality,
- transcriptional activity and promoter malleability of T7 RNAP make the enzyme uniquely suited for use in synthetic gene circuits. Importantly,
- any modifications made to the enzyme increase the possible functionality of circuits. For instance, we recently utilized
- a split version of T7 RNAP in conjunction with promoter specificity mutants to create a library of transcriptional AND gates (Shis & Bennett, 2013).
The split version of T7 RNAP was originally discovered during purification and shown to be active in vitro (Ikeda & Richardson, 1987). While the catalytic core and DNA‐binding domain
- are both located on the C‐terminal fragment of split T7 RNAP,
- the N‐terminal fragment is needed for transcript elongation.
Therefore, if the two halves of split T7 RNAP are placed behind two different inducible promoters,
- both inputs must be active in order to form a functional enzyme and
- activate a downstream gene.
When the split mutant is combined with promoter specificity mutants,
- a library of transcriptional AND gates is created.
Segall‐Shapiro et al take the idea of splitting T7 RNAP for novel regulatory architectures one step further. Instead of settling for the one split site already discovered,
- the authors first streamlined a transposon mutagenesis strategy (Segall‐Shapiro et al, 2011) to identify four novel cut sites within T7 RNAP.
By expressing T7 RNAP split at two different sites,
- they create a tripartite T7 RNAP—a polymerase
- that requires all three subunits for activity.
The authors suggestively designate the fragments of the tripartite enzyme as ‘core’, ‘alpha’, and ‘sigma’ (Fig 1) and they go on to show that
- tripartite T7 RNAP can not only be used to create 3‐input AND gates, but
- it also works as a ‘resource allocator’.
In other words, the transcriptional activity of the split polymerase can be regulated
- by limiting the availability of core and/or alpha fragment, or
- by expressing additional sigma fragments.
The authors demonstrate strategies to account for common pitfalls in synthetic gene networks
- such as host toxicity and plasmid copy number variability.
Figure 1. Segall‐Shapiro et al extend previous efforts to engineer split T7 RNAP by fragmenting the enzyme at two novel locations to create a tripartite transcription complex.
Co‐expressing different sigma fragments with the alpha and core fragments enables a network of multi‐input transcriptional AND gates.
The tripartite T7 RNAP presented by Segall‐Shapiro et al
- expands the utility of T7 RNAP in orthogonal gene circuits.
Until now, while T7 RNAP has been attractive for use in synthetic gene circuits,
- the inability to regulate its activity has often prevented its use.
Splitting the protein into fragments and regulating the transcription complex by fragment availability
- brings the regulation of T7 RNAP closer to the regulation of multi‐subunit prokaryotic RNA polymerases.
Sigma fragments direct the activity of the transcription complex much like σ‐factors, and the alpha fragment helps activate transcription
- in the same way as α‐fragments of prokaryotic polymerases.
For additional regulation, the authors note that the tripartite T7 RNAP can be further split at the previously discovered split site to create a four‐fragment enzyme.
More nuanced regulation using split T7 RNAP may be possible
- with the addition of heterodimerization domains
- that can drive the specific association of fragments.
This strategy has been successfully applied to engineer specificity and signal diversity
- in two‐component signaling pathways (Whitaker et al, 2012).
The activity of T7 RNAP might also be directed to various promoters
- by using multiple sigma fragments simultaneously,
- just as σ‐factors do in E. coli.
Finally, synthetic gene circuits driven primarily by T7 RNAP create the possibility of easily transplantable gene circuits. A synthetic gene circuit driven entirely by fragmented T7 RNAP
- would depend more on fragment availability than unknown interactions with host metabolism.
This would enable rapid prototyping of synthetic gene circuits in laboratory‐friendly strains or cell‐free systems (Shin & Noireaux, 2012) before transplantation into the desired host.
References
- ↵Chelliserrykattil J, Cai G, Ellington AD (2001) A combined in vitro/in vivo selection for polymerases with novel promoter specificities. BMC Biotechnol 1: 13
CrossRefMedline
- ↵Ikeda RA, Richardson CC (1987) Interactions of a proteolytically nicked RNA‐polymerase of bacteriophage‐T7 with its promoter. J Biol Chem 262: 3800–3808
Abstract/FREE Full Text
- ↵Segall‐Shapiro TH, Meyer AJ, Ellington AD, Sontag ED, Voigt CA (2014) A “resource allocator” for transcription based on a highly fragmented T7 RNA polymerase.Mol Syst Biol 10: 742
Abstract/FREE Full Text
- ↵Segall‐Shapiro TH, Nguyen PQ, Dos Santos ED, Subedi S, Judd J, Suh J, Silberg JJ(2011) Mesophilic and hyperthermophilic adenylate kinases differ in their tolerance to random fragmentation. J Mol Biol 406: 135–148
CrossRefMedline
- ↵Shin J, Noireaux V (2012) An coli cell‐free expression toolbox: application to synthetic gene circuits and artificial cells. Acs Synth Biol 1: 29–41
CrossRefMedlineWeb of Science
- ↵Shis DL, Bennett MR (2013) Library of synthetic transcriptional AND gates built with split T7 RNA polymerase mutants. Proc Natl Acad Sci USA 110: 5028–5033
Abstract/FREE Full Text
- ↵Studier FW, Moffatt BA (1986) Use of bacteriophage‐T7 RNA‐polymerase to direct selective high‐level expression of cloned genes. J Mol Biol 189: 113–130
CrossRefMedlineWeb of Science
- ↵Way JC, Collins JJ, Keasling JD, Silver PA (2014) Integrating biological redesign: where synthetic biology came from and where it needs to go. Cell 157: 151–161
- ↵Whitaker WR, Davis SA, Arkin AP, Dueber JE (2012) Engineering robust control of two‐component system phosphotransfer using modular scaffolds. Proc Natl Acad Sci USA 109: 18090–18095
Abstract/FREE Full Text
© 2014 The Authors. Published under the terms of the CC BY 4.0 license
MicroRNA References
Plasma microRNAs serve as biomarkers of therapeutic efficacy and disease progression in hypertension-induced heart failure. Dickinson BA, Semus HM, Montgomery RL, Stack C, Latimer PA, et al. Eur J Heart Fail. 2013 Jun; 15(6):650-9. http://dx.doi.org:/10.1093/eurjhf/hft018
Circulating microRNAs – Biomarkers or mediators of cardiovascular disease? S Fichtlscherer, AM Zeiher, S Dimmeler. Arteriosclerosis, Thrombosis, and Vascular Biology. 2011; 31:2383-2390.
http://dx.doi.org:/10.1161/ATVBAHA.111.226696
Circulating microRNAs as diagnostic biomarkers for cardiovascular diseases. AJ Tijsen, YM Pinto, and EE Creemers. Am J Physiol Heart Circ Physiol 303: H1085–H1095, 2012. http://dx.doi.org:/10.1152/ajpheart.00191.2012.
MicroRNAs in Patients on Chronic Hemodialysis (MINOS Study). Emilian C, Goretti E, Prospert F, Pouthier D, Duhoux P, et al. Clin J Am Soc Nephrol (CJASN)2012; 7: 619-623. http://dx.doi.org:/10.2215/CJN.10471011
Plasma microRNAs serve as biomarkers of therapeutic efficacy and disease progression in hypertension-induced heart failure. BA Dickinson, HM Semus, RL Montgomery, C Stack, PA Latimer, et al. Eur J Heart Fail 2013 Jun 6;15(6):650-9. http://www.pubfacts.com/detail/23388090/Plasma-microRNAs-serve-as-biomarkers-of-therapeutic-efficacy-and-disease-progression-in-hypertension
Circulating MicroRNAs: Novel Biomarkers and Extracellular Communicators in Cardiovascular Disease? Esther E. Creemers, Anke J. Tijsen, Yigal M. Pinto. Circulation Research. 2012; 110: 483-495 http://dx.doi.org:/10.1161/CIRCRESAHA.111.247452
Novel techniques and targets in cardiovascular microRNA research. Dangwal S, Bang C, Thum T. Cardiovasc Res. 2012 Mar 15; 93(4):545-54. http://dx.doi.org:/10.1093/cvr/cvr297
Microparticles: major transport vehicles for distinct microRNAs in circulation. Diehl P, Fricke A, Sander L, Stamm J, Bassler N, Htun N, et al. Cardiovasc Res. 2012 Mar 15; 93(4):633-44. http://dx.doi.org:/10.1093/cvr/cvs007.
Profiling of circulating microRNAs: from single biomarkers to re-wired networks. A Zampetaki, P Willeit, I Drozdov, S Kiechl and M Mayr. Cardiovasc Res 2012; 93 (4): 555-562. http://dx.doi.org:/10.1093/cvr/cvr266
Small but smart–microRNAs in the centre of inflammatory processes during cardiovascular diseases, the metabolic syndrome, and ageing. Schroen B, Heymans S.
Cardiovasc Res. 2012; 93(4):605-613. http://dx.doi.org:/10.1093/cvr/cvr268
Therapeutic Inhibition of miR-208a Improves Cardiac Function and Survival During Heart Failure. RL Montgomery, TG Hullinger, HM Semus, BA Dickinson, AG Seto, et al.
http://dx.doi.org:/10.1161/CIRCULATIONAHA.111.030932
Circulating microRNAs to identify human heart failure. Seto AG, van Rooij E.
Eur J Heart Fail. 2012;14(2):118-119. http://dx.doi.org:/10.1093/eurjhf/hfr179.
Use of Circulating MicroRNAs to Diagnose Acute Myocardial Infarction. Y Devaux,
M Vausort, E Goretti, PV Nazarov, F Azuaje. Clin Chem. 2012; 58:559-567. http://dx.doi.org:/10.1373/clinchem.2011.173823
Next Steps in Cardiovascular Disease Genomic Research–Sequencing, Epigenetics, and Transcriptomics RB Schnabel, A Baccarelli, H Lin, PT Ellinor, and EJ Benjamin.
Clin Chem . 2012 Jan; 58(1): 113–126. http://dx.doi.org:/10.1373/clinchem.2011.170423
MicroRNA-133 Modulates the {beta}1-Adrenergic Receptor Transduction Cascade. A Castaldi, T Zaglia, V Di Mauro, P Carullo, G Viggiani, et al. Circ. Res.. 2014; 115:273-283.
http://dx.doi.org:/10.1161/CIRCRESAHA.115.303252
Development of microRNA therapeutics is coming of age. E van Rooij, S Kauppinen. EMBO Mol Med.. 2014; 6:851-864. http://dx.doi.org:/10.15252/emmm.201100899
Pitx2-microRNA pathway that delimits sinoatrial node development and inhibits predisposition to atrial fibrillation. J Wang, Y Bai, N Li, W Ye, M Zhang,et al. PNAS 2014; 111: 9181-9186.
MicroRNA-126 modulates endothelial SDF-1 expression and mobilization of Sca-1+/Lin- progenitor cells in ischaemia Cardiovasc Res. 2011; 92:449-455,
The use of genomics for treatment is another matter, and has several factors, e.g., age, residual function after AMI, comorbidities
Read Full Post »


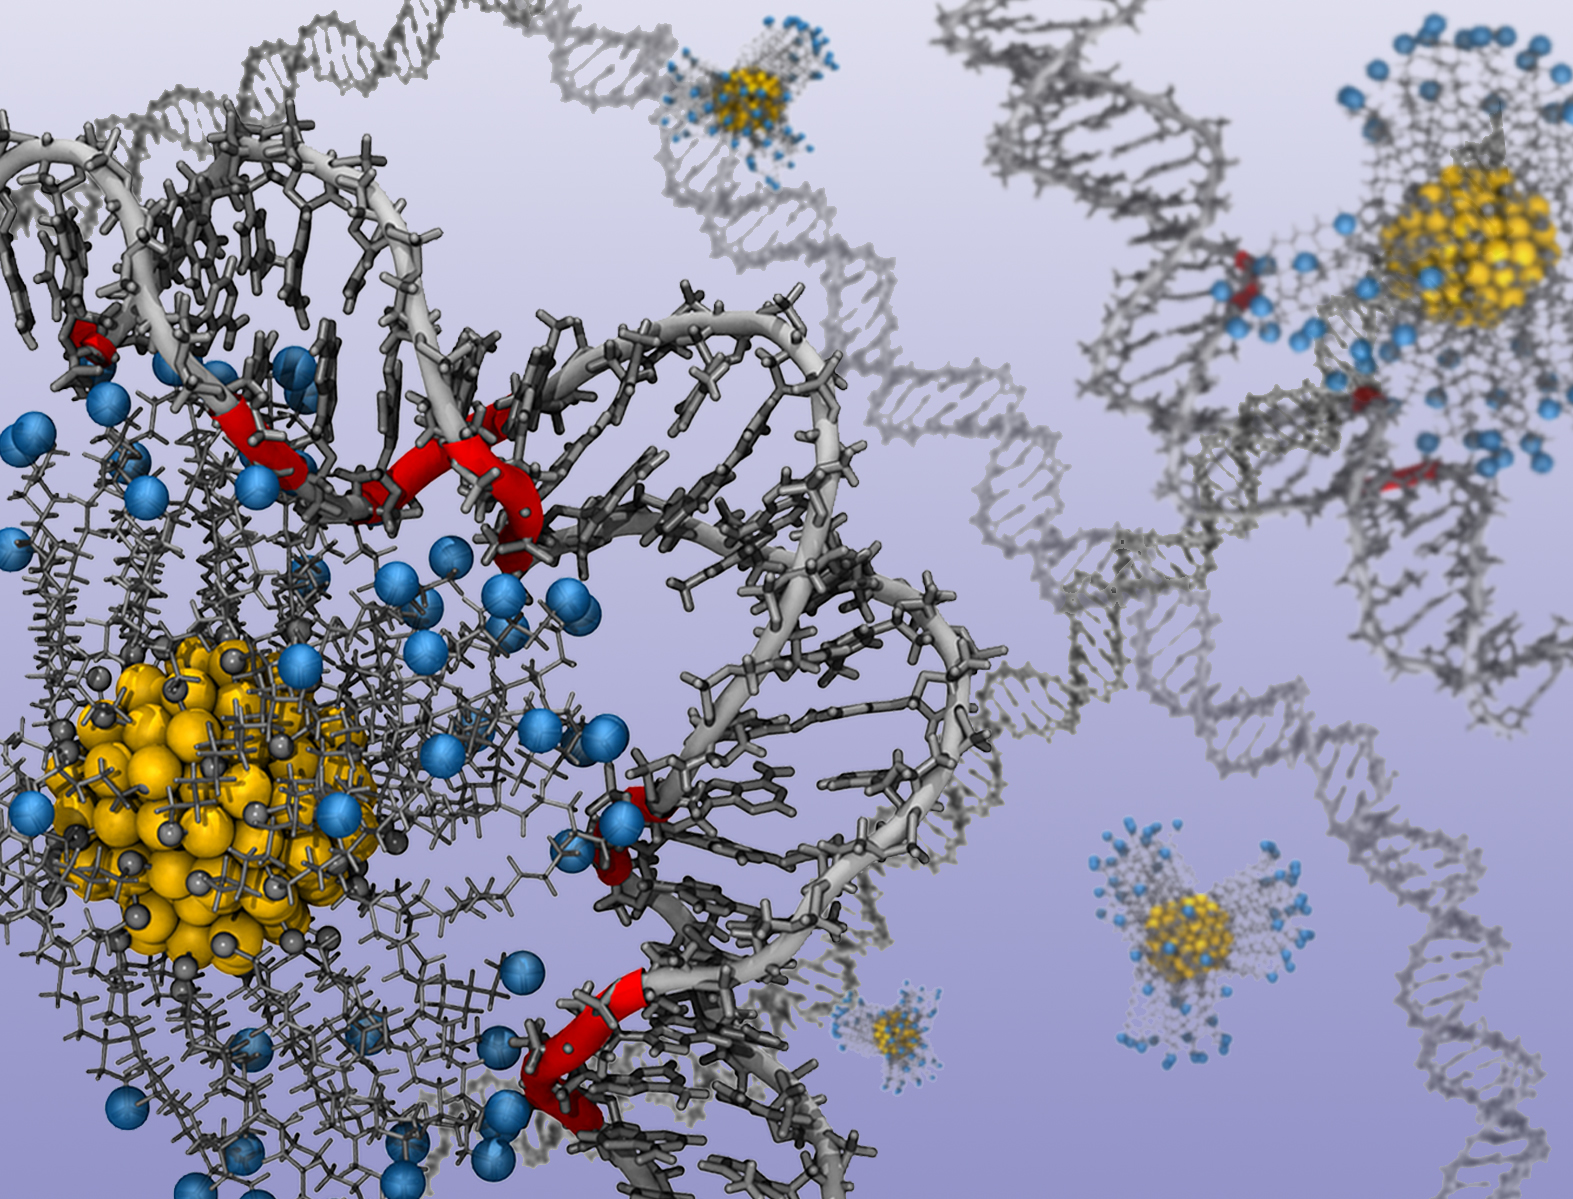
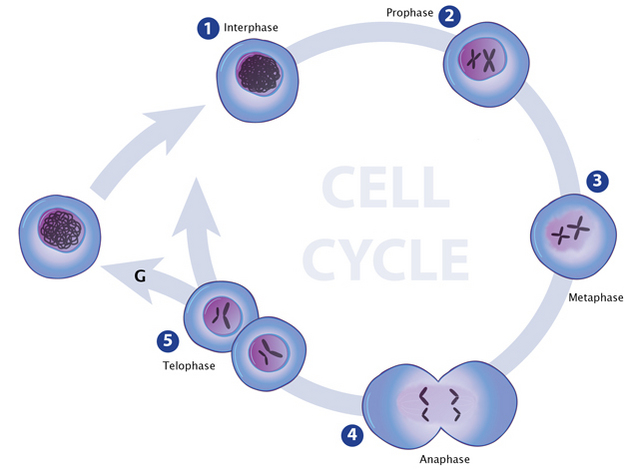
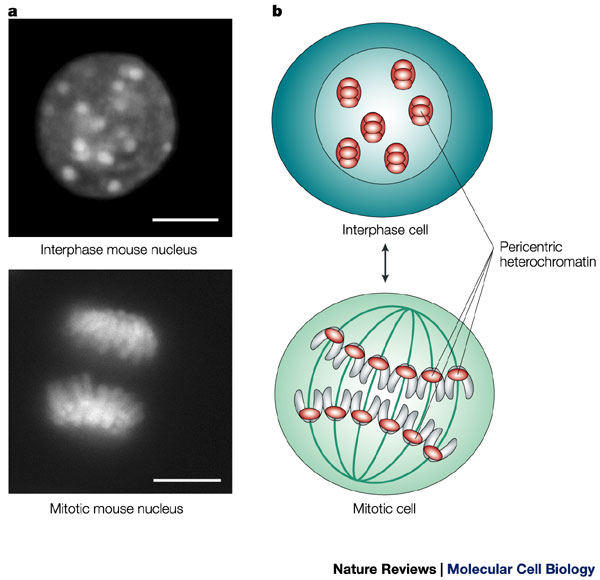