Healthcare analytics, AI solutions for biological big data, providing an AI platform for the biotech, life sciences, medical and pharmaceutical industries, as well as for related technological approaches, i.e., curation and text analysis with machine learning and other activities related to AI applications to these industries.
Single-cell RNA-seq helps in finding intra-tumoral heterogeneity in pancreatic cancer
Reporter and Curator: Dr. Sudipta Saha, Ph.D.
4.3.6 Single-cell RNA-seq helps in finding intra-tumoral heterogeneity in pancreatic cancer, Volume 2 (Volume Two: Latest in Genomics Methodologies for Therapeutics: Gene Editing, NGS and BioInformatics, Simulations and the Genome Ontology), Part 4: Single Cell Genomics
Pancreatic cancer is a significant cause of cancer mortality; therefore, the development of early diagnostic strategies and effective treatment is essential. Improvements in imaging technology, as well as use of biomarkers are changing the way that pancreas cancer is diagnosed and staged. Although progress in treatment for pancreas cancer has been incremental, development of combination therapies involving both chemotherapeutic and biologic agents is ongoing.
Cancer is an evolutionary disease, containing the hallmarks of an asexually reproducing unicellular organism subject to evolutionary paradigms. Pancreatic ductal adenocarcinoma (PDAC) is a particularly robust example of this phenomenon. Genomic features indicate that pancreatic cancer cells are selected for fitness advantages when encountering the geographic and resource-depleted constraints of the microenvironment. Phenotypic adaptations to these pressures help disseminated cells to survive in secondary sites, a major clinical problem for patients with this disease.
The immune system varies in cell types, states, and locations. The complex networks, interactions, and responses of immune cells produce diverse cellular ecosystems composed of multiple cell types, accompanied by genetic diversity in antigen receptors. Within this ecosystem, innate and adaptive immune cells maintain and protect tissue function, integrity, and homeostasis upon changes in functional demands and diverse insults. Characterizing this inherent complexity requires studies at single-cell resolution. Recent advances such as massively parallel single-cell RNA sequencing and sophisticated computational methods are catalyzing a revolution in our understanding of immunology.
PDAC is the most common type of pancreatic cancer featured with high intra-tumoral heterogeneity and poor prognosis. In the present study to comprehensively delineate the PDAC intra-tumoral heterogeneity and the underlying mechanism for PDAC progression, single-cell RNA-seq (scRNA-seq) was employed to acquire the transcriptomic atlas of 57,530 individual pancreatic cells from primary PDAC tumors and control pancreases. The diverse malignant and stromal cell types, including two ductal subtypes with abnormal and malignant gene expression profiles respectively, were identified in PDAC.
The researchers found that the heterogenous malignant subtype was composed of several subpopulations with differential proliferative and migratory potentials. Cell trajectory analysis revealed that components of multiple tumor-related pathways and transcription factors (TFs) were differentially expressed along PDAC progression. Furthermore, it was found a subset of ductal cells with unique proliferative features were associated with an inactivation state in tumor-infiltrating T cells, providing novel markers for the prediction of antitumor immune response. Together, the findings provided a valuable resource for deciphering the intra-tumoral heterogeneity in PDAC and uncover a connection between tumor intrinsic transcriptional state and T cell activation, suggesting potential biomarkers for anticancer treatment such as targeted therapy and immunotherapy.
The retina is responsible for capturing images from the visual field. Retinitis pigmentosa, which refers to a group of inherited diseases that cause retinal degeneration, causes a gradual decline in vision because retinal photoreceptor cells (rods and cones) die. Images on the left are courtesy of the National Eye Institute, NIH; image on the right is courtesy of Robert Fariss, Ph.D., and Ann Milam, Ph.D., National Eye Institute, NIH.
Metabolomics, the comprehensive evaluation of the products of cellular processes, can provide new findings and insight in a vast array of diseases and dysfunctions. Though promising, metabolomics lacks the standing of genomics or proteomics. It is, in a manner of speaking, the new kid on the “omics” block.
Even though metabolomics is still an emerging discipline, at least some quarters are giving it a warm welcome. For example, metabolomics is being advanced by the Common Fund, an initiate of the National Institutes of Health (NIH). The Common Fund has established six national metabolomics cores. In addition, individual agencies within NIH, such as the National Institute of Environmental Health Sciences (NIEHS), are releasing solicitations focused on growing more detailed metabolomics programs.
Whether metabolomic studies are undertaken with or without public support, they share certain characteristics and challenges. Untargeted or broad-spectrum studies are used for hypotheses generation, whereas targeted studies probe specific compounds or pathways. Reproducibility is a major challenge in the field; many studies cannot be reproduced in larger cohorts. Carefully defined guidance and standard operating procedures for sample collection and processing are needed.
While these challenges are being addressed, researchers are patiently amassing metabolomic insights in several areas, such as retinal diseases, neurodegenerative diseases, and autoimmune diseases. In addition, metabolomic sleuths are availing themselves of a growing selection of investigative tools.
A Metabolomic Eye on Retinal Degeneration
The retina has one of the highest metabolic activities of any tissue in the body and is composed of multiple cell types. This fact suggests that metabolomics might be helpful in understanding retinal degeneration. At least, that’s what occurred to Ellen Weiss, Ph.D., a professor of cell biology and physiology at the University of North Carolina School of Medicine at Chapel Hill. To explore this possibility, Dr. Weiss began collaborating with Susan Sumner, Ph.D., director of systems and translational sciences at RTI International.
Retinal degeneration is often studied through the use of genetic-mouse models that mimic the disease in humans. In the model used by Dr. Weiss, cells with a disease-causing mutation are the major light-sensing cells that degenerate during the disease. Individuals with the same or a similar genetic mutation will initially lose dim-light vision then, ultimately, bright-light vision and color vision.
Wild-type and mutant phenotypes, as well as dark- and light-raised animals, were compared, since retinal degeneration is exacerbated by light in this genetic model. Retinas were collected as early as day 18, prior to symptomatic disease, and analyzed. Although data analysis is ongoing, distinct differences have emerged between the phenotypes as well as between dark- and light-raised animals.
“There is a clear increase in oxidative stress in both light-raised groups but to a larger extent in the mutant phenotype,” reports Dr. Weiss. “There are global changes in metabolites that suggest mitochondrial dysfunction, and dramatic changes in lipid profiles. Now we need to understand how these metabolites are involved in this eye disease and the relevance of these perturbations.”
For example, the glial cells in the retina that upregulate a number of proteins in response to stress to attempt to save the retina are as likely as the light-receptive neurons to undergo metabolic changes.
“One of the challenges in metabolomics studies is assigning the signals that represent the metabolites or compounds in the samples,” notes Dr. Sumner. “Signals may be ‘unknown unknowns,’ compounds that have never been identified before, or ‘known unknowns,’ compounds that are known but that have not yet been assigned in the biological matrix.”
Internal and external libraries, such as the Human Metabolome Dictionary, are used to match signals. Whether or not a match exists, fragmentation patterns are used to characterize the metabolite, and when possible a standard is obtained to confirm identity. To assist with this process, the NIH Common Fund supports Metabolite Standard Synthesis Cores (MSSCs). RTI International holds an MSSC contract in addition to being a NIH-designated metabolomics core.
Mitochondrial Dysfunction in Alzheimer’s Disease
Alzheimer’s disease (AD) is difficult to diagnose early due to its asymptomatic phase; accurate diagnosis occurs only in postmortem brain tissue. To evaluate familial AD, a rare inherited form of the disease, the laboratory of Eugenia Trushina, Ph.D., associate professor of neurology and associate professor of pharmacology at the Mayo Clinic, uses mouse models to study the disease’s early molecular mechanisms.
Synaptic loss underlies cognitive dysfunction. The length of neurons dictates that mitochondria move within the cell to provide energy at the site of the synapses. An initial finding was that very early on mitochondrial trafficking was affected reducing energy supply to synapses and distant parts of the cell.
During energy production, the major mitochondrial metabolite is ATP, but the organelle also produces many other metabolites, molecules that are implicated in many pathways. One can assume that changes in energy utilization, production, and delivery are associated with some disturbance.
“Our goal,” explains Dr. Trushina, “was to get a proof of concept that we could detect in the blood of AD patients early changes of mitochondria dysfunction or other changes that could be informative of the disease over time.”
A Mayo Clinic aging study involves a cohort of patients, from healthy to those with mild cognitive impairment (MCI) through AD. Patients undergo an annual battery of tests including cognitive function along with blood and cerebrospinal fluid sampling. Metabolic signatures in plasma and cerebrospinal fluid of normal versus various disease stages were compared, and affected mitochondrial and lipid pathways identified in MCI patients that progressed to AD.
“Last year we published on a new compound that goes through the blood/brain barrier, gets into mitochondria, and very specifically, partially inhibits mitochondrial complex I activity, making the cell resistant to oxidative damage,” details Dr. Trushina. “The compound was able to either prevent or slow the disease in the animal familial models.
“Treatment not only reduced levels of amyloid plaques and phosphorylated tau, it also restored mitochondrial transport in neurons. Now we have additional compounds undergoing investigation for safety in humans, and target selectivity and engagement.”
“Mitochondria play a huge role in every aspect of our lives,” Dr. Trushina continues. “The discovery seems counterintuitive, but if mitochondria function is at the heart of AD, it may provide insight into the major sporadic form of the disease.”
Distinguishing Types of Asthma
In children, asthma generally manifests as allergy-induced asthma, or allergic asthma. And allergic asthma has commonalities with allergic dermatitis/eczema, food allergies, and allergic rhinitis. In adults, asthma is more heterogeneous, and distinct and varied subpopulations emerge. Some have nonallergic asthma; some have adult-onset asthma; and some have obesity-, occupational-, or exercise-induced asthma.
Adult asthmatics may have markers of TH2 high verus TH2 low asthma (T helper 2 cell cytokines) and they may respond to various triggers—environmental antigens, occupational antigens, irritants such as perfumes and chlorine, and seasonal allergens. Exercise, too, can trigger asthma.
One measure that can phenotype asthmatics is nitric oxide, an exhaled breath biomarker. Nitric oxide is a smooth muscle relaxant, vasodilator, and bronchodilator that can have anti-inflammatory properties. There is a wide range of values in asthmatics, and a number of values are needed to understand the trend in a particular patient. L-arginine is the amino acid that produces nitric oxide when converted to L-citrulline, a nonessential amino acid.
According to Nicholas Kenyon, M.D., a pulmonary and critical care specialist who is co-director of the University of California, Davis Asthma Network (UCAN), some metabolomic studies suggest that there is a state of L-arginine depletion during asthma attacks or in severe asthma suggesting a lack of substrate to produce nitric oxide. Dr. Kenyon is conducting clinical work on L-arginine supplementation in a double-blind cross-over intervention trial of L-arginine versus placebo. The 50-subject study in severe asthmatics should be concluded in early 2017.
Many new biologic therapies are coming to market to treat asthma; it will be challenging to determine which advanced therapy to provide to which patient. Therapeutics mostly target severe asthma populations and are for patients with evidence of higher numbers of eosinophils in the blood and lung, which include anti-IL-5 and (soon) anti-IL-13, among others.
Tools Development
Waters is developing metabolomics applications that use multivariate statistical methods to highlight compounds of interest. Typically these applications combine separation procedures, accomplished by means of liquid chromatography or gas chromatography (LC or GC), with detection methods that rely on mass spectrometry (MS). To support the identification, quantification, and analysis of LC-MS data, the company provides bioinformatics software. For example, Progenesis QI software can interrogate publicly available databases and process information about isotopic patterns, retention times, and collision cross-sections.
Mass spectrometry (MS) is the gold standard in metabolomics and lipidomics. But there is a limit to what accurate mass and resolution can achieve. For example, neither isobaric nor isomeric species are resolvable solely by MS. New orthogonal analytical tools will allow more confident identifications.
To improve metabolomics separations before MS detection, a post-ionization separation tool, like ion mobility, which is currently used to support traditional UPLC-MS and MS imaging metabolomics protocols, becomes useful. The collision-cross section (CCS), which measures the shape of molecules, can be derived, and it can be used as an additional identification coordinate.
Other new chromatographic tools are under development, such as microflow devices and UltraPerformance Convergence Chromatography (UPC2), which uses liquid CO2 as its mobile phase, to enable new ways of separating chiral metabolites. Both UPC2 and microflow technologies have decreased solvent consumption and waste disposal while maintaining UPLC-quality performance in terms of chromatographic resolution, robustness, and reproducibility.
Informatics tools are also improving. In the latest versions of Waters’ Progenesis software, typical metabolomics identification problems are resolved by allowing interrogation of publicly available databases and scoring according to accurate mass, isotopic pattern, retention time, CCS, and either theoretical or experimental fragments.
MS imaging techniques, such as MALDI and DESI, provide spatial information about the metabolite composition in tissues. These approaches can be used to support and confirm traditional analyses without sample extraction, and they allow image generation without the use of antibodies, similar to immunohistochemistry.
“Ion-mobility tools will soon be implemented for routine use, and the use of extended CCS databases will help with metabolite identification,” comments Giuseppe Astarita Ph.D., principal scientist, Waters. “More applications of ambient ionization MS will emerge, and they will allow direct-sampling analyses at atmospheric pressure with little or no sample preparation, generating real-time molecular fingerprints that can be used to discriminate among phenotypes.”
Microflow Technology
Microflow technology offers sensitivity and robustness. For example, at the Proteomics and Metabolomics Facility, Colorado State University, peptide analysis was typically performed using nanoflow chromatography; however, nanoflow chromatography is slow and technically challenging. Moving to microflow offered significant improvements in robustness and ease-of-use and resulted in improved chromatography without sacrificing sensitivity.
Conversely, small molecule applications were typically performed with analytical-scale chromatography. While this flow regime is extremely robust and fast, it can sometimes be limited in sensitivity. Moving to microflow offered significant improvements in sensitivity, 5- to 10-fold depending on the compound, without sacrificing robustness.
But broad-scale microflow adoption is hampered by a lack of available column chemistries and legacy HPLC or UPLC infrastructure that is not conducive to low-flow operation.
“We utilize microflow technology on all of our tandem quadrupole instruments for targeted quantitative assays,” says Jessica Prenni, Ph.D., director, Proteomics and Metabolomics Facility, Colorado State University. “All of our peptide quantitation is exclusively performed with microflow technology, and many of our small molecule assays. Application examples include endocannabinoids, bile acids and plant phytohormone panels.”
Compound annotation and comparability and transparency in data processing and reporting is a challenge in metabolomics research. Multiple groups are actively working on developing new tools and strategies; common best practices need to be adopted.
The continued growth of open-source spectral databases and new tools for spectral prediction from compound databases will dramatically impact the ability for metabolomics to result in novel discoveries. The move to a systems-level understanding through the combination of various omics data also will have a huge influence and be enabled by the continued development of open-source and user-friendly pathway-analysis tools.
Where Trackless Terrain Once Challenged Biomarker Development, Clearer Paths Are Emerging
Fusion detection can be carried out with traditional opposing primer-based library preparation methods, which require target- and fusion-specific primers that define the region to be sequenced. With these methods, primers are needed that flank the target region and the fusion partner, so only known fusions can be detected. An alternative method, ArcherDX’ Anchored Multiplex PCR (AMP), can be used to detect the target of interest, plus any known and unknown fusion partners. This is because AMP uses target-specific unidirectional primers, along with reverse primers, that hybridize to the sequencing adapter that is ligated to each fragment prior to amplification.
In time, the narrow, tortuous paths followed by pioneers become wider and straighter, whether the pioneers are looking to settle new land or bring new biomarkers to the clinic.
In the case of biomarkers, we’re still at the stage where pioneers need to consult guides and outfitters or, in modern parlance, consultants and technology providers. These hardy souls tend to congregate at events like the Biomarker Conference, which was held recently in San Diego.
At this event, biomarker experts discussed ways to avoid unfortunate detours on the trail from discovery and development to clinical application and regulatory approval. Of particular interest were topics such as the identification of accurate biomarkers, the explication of disease mechanisms, the stratification of patient groups, and the development of standard protocols and assay platforms. In each of these areas, presenters reported progress.
Another crucial subject is the integration of techniques such as next-generation sequencing (NGS). This particular technique has been instrumental in advancing clinical cancer genomics and continues to be the most feasible way of simultaneously interrogating multiple genes for driver mutations.
Enriching nucleic acid libraries for target genes of interest prior to NGS greatly enhances the sensitivity of detecting mutations, as the enriched regions are sequenced multiple times. This is particularly useful when analyzing clinical samples, which generate low amounts of poor-quality nucleic acids.
Most target-enrichment strategies require prior knowledge of both ends of the target region to be sequenced. Therefore, only gene fusions with known partners can be amplified for downstream NGS assays.
Archer’s Anchored Multiplex PCR (AMP™) technology overcomes this limitation, as it can enrich for novel fusions, while only requiring knowledge of one end of the fusion pair. At the heart of the AMP chemistry are unique Molecular Barcode (MBC) adapters, ligated to the 5′ ends of DNA fragments prior to amplification. The MBCs contain universal primer binding sites for PCR and a molecular barcode for identifying unique molecules. When combined with 3′ gene-specific primers, MBCs enable amplification of target regions with unknown 5′ ends.
“Tagging each molecule of input nucleic acid with a unique molecular barcode allows for de-duplication, error correction, and quantitative analysis, resulting in high sequencing consensus. With its low error rate and low limits of detection, AMP is revolutionizing the field of cancer genomics.”
In a proof-of-concept study, a single-tube 23-plex panel was designed to amplify the kinase domains of ALK, RET, ROS1, and MUSK genes by AMP. This enrichment strategy enabled identification of gene fusions with multiple partners and alternative splicing events in lung cancer, thyroid cancer, and glioblastoma specimens by NGS.
Over the last decade, the Biomarker/Translational Research Laboratory has focused on developing clinical genotyping and fluorescent in situ hybridization (FISH) assays for rapid personalized genomic testing.
“Initially, we analyzed the most prevalent hotspot mutations, about 160 in 25 cancer genes,” continued Dr. Borger. “However, this approach revealed mutations in only half of our patients. With the advent of NGS, we are able to sequence 190 exons in 39 cancer genes and obtain significantly richer genetic fingerprints, finding genetic aberrations in 92% of our cancer patients.”
Using multiplexed approaches, Dr. Borger’s team within the larger Center for Integrated Diagnostics (CID) program at MGH has established high-throughput genotyping service as an important component of routine care. While only a few susceptible molecular alterations may currently have a corresponding drug, the NGS-driven analysis may supply new information for inclusion of patients into ongoing clinical trials, or bank the result for future research and development.
“A significant impediment to discovery of clinically relevant genomic signatures is our current inability to interconnect the data,” explained Dr. Borger. “On the local level, we are striving to compile the data from clinical observations, including responses to therapy and genotyping. Globally, it is imperative that comprehensive public databases become available to the research community.”
This image, from the Massachusetts General Hospital Cancer Center, shows multicolor fluorescence in situ hybridization (FISH) analysis of cells from a patient with esophagogastric cancer. Remarkably, the FISH analysis revealed that co-amplification of the MET gene (red signal) and the EGFR gene (green signal) existed simultaneously in the same tumor cells. A chromosome 7 control probe is shown in blue.
Tumor profiling at MGH have already yielded significant discoveries. Dr. Borger’s lab, in collaboration with oncologists at the MGH Cancer Center, found significant correlations between mutations in the genes encoding the metabolic enzymes isocitrate dehydrogenase (IDH1 and IDH2) and certain types of cancers, such as cholangiocarcinoma and acute myelogenous leukemia (AML).
Historically, cancer signatures largely focus on signaling proteins. Discovery of a correlative metabolic enzyme offered a promise of diagnostics based on metabolic byproducts that may be easily identified in blood. Indeed, the metabolite 2-hydroxyglutarate accumulates to high levels in the tissues of patients carrying IDH1 and IDH2 mutations. They have reported that circulating 2-hydroxyglutarate as measured in the blood correlates with tumor burden, and could serve as an important surrogate marker of treatment response. …..
Researchers Uncover How ‘Silent’ Genetic Changes Drive Cancer
“Traditionally, it has been hard to use standard methods to quantify the amount of tRNA in the cell,” says Tavazoie. The lead authors of the article, Hani Goodarzi, formerly a postdoc in the lab and now a new assistant professor at UCSF, and research assistant Hoang Nguyen, devised and applied a new method that utilizes state-of-the-art genomic sequencing technology to measure the amount of tRNAs in different cell types.
The team chose to compare breast tissue from healthy individuals with tumor samples taken from breast cancer patients–including both primary tumors that had not spread from the breast to other body sites, and highly aggressive, metastatic tumors.
They found that the levels of two specific tRNAs were significantly higher in metastatic cells and metastatic tumors than in primary tumors that did not metastasize or healthy samples. “There are four different ways to encode for the protein building block arginine,” explains Tavazoie. “Yet only one of those–the tRNA that recognizes the codon CGG–was associated with increased metastasis.”
The tRNA that recognizes the codon GAA and encodes for a building block known as glutamic acid was also elevated in metastatic samples.
The team hypothesized that the elevated levels of these tRNAs may in fact drive metastasis. Working in mouse models of primary, non-metastatic tumors, the researchers increased the production of the tRNAs, and found that these cells became much more invasive and metastatic.
They also did the inverse experiment, with the anticipated results: reducing the levels of these tRNAs in metastatic cells decreased the incidence of metastases in the animals.
How do two tRNAs drive metastasis? The researchers teamed up with members of the Rockefeller University proteomics facility to see how protein expression changes in cells with elevated levels of these two tRNAs.
“We found global increases in many dozens of genes,” says Tavazoie, “so we analyzed their sequences and found that the majority of them had significantly increased numbers of these two specific codons.”
According to the researchers, two genes stood out among the list. Known as EXOSC2 and GRIPAP1, these genes were strongly and directly induced by elevated levels of the specific glutamic acid tRNA.
“When we mutated the GAA codons to GAG– a “silent” mutation because they both spell out the protein building block glutamic acid–we found that increasing the amount of tRNA no longer increased protein levels,” explains Tavazoie. These proteins were found to drive breast cancer metastasis.
The work challenges previous assumptions about how tRNAs function and suggests that tRNAs can modulate gene expression, according to the researchers. Tavazoie points out that “it is remarkable that within a single cell type, synonymous changes in genetic sequence can dramatically affect the levels of specific proteins, their transcripts, and the way a cell behaves.”
Testing Blood Metabolites Could Help Tailor Cancer Treatment
Scientists have found that measuring how cancer treatment affects the levels of metabolites – the building blocks of fats and proteins – can be used to assess whether the drug is hitting its intended target.
This new way of monitoring cancer therapy could speed up the development of new targeted drugs – which exploit specific genetic weaknesses in cancer cells – and help in tailoring treatment for patients.
Scientists at The Institute of Cancer Research, London, measured the levels of 180 blood markers in 41 patients with advanced cancers in a phase I clinical trial conducted with The Royal Marsden NHS Foundation Trust.
They found that investigating the mix of metabolic markers could accurately assess how cancers were responding to the targeted drug pictilisib.
Their study was funded by the Wellcome Trust, Cancer Research UK and the pharmaceutical company Roche, and is published in the journal Molecular Cancer Therapeutics.
Pictilisib is designed to specifically target a molecular pathway in cancer cells, called PI3 kinase, which has key a role in cell metabolism and is defective in a range of cancer types.
As cancers with PI3K defects grow, they can cause a decrease in the levels of metabolites in the bloodstream.
The new study is the first to show that blood metabolites are testable indicators of whether or not a new cancer treatment is hitting the correct target, both in preclinical mouse models and also in a trial of patients.
Using a sensitive technique called mass spectrometry, scientists at The Institute of Cancer Research (ICR) initially analysed the metabolite levels in the blood of mice with cancers that had defects in the PI3K pathway.
They found that the blood levels of 26 different metabolites, which were low prior to therapy, had risen considerably following treatment with pictilisib. Their findings indicated that the drug was hitting its target, and reversing the effects of the cancer on mouse metabolites.
Similarly, in humans the ICR researchers found that almost all of the metabolites – 22 out of the initial 26 – once again rose in response to pictilisib treatment, as seen in the mice.
Blood levels of the metabolites began to increase after a single dose of pictilisib, and were seen to drop again when treatment was stopped, suggesting that the effect was directly related to the drug treatment.
Metabolites vary naturally depending on the time of day or how much food a patient has eaten. But the researchers were able to provide the first strong evidence that despite this variation metabolites can be used to test if a drug is working, and could help guide decisions about treatment.
New Metabolic Pathway Reveals Aspirin-Like Compound’s Anti-Cancer Properties
Researchers at the Gladstone Institutes say they have found a new pathway by which salicylic acid, a key compound in the nonsteroidal anti-inflammatory drugs aspirin and diflunisal, stops inflammation and cancer.
In a study (“Salicylate, Diflunisal and Their Metabolites Inhibit CBP/p300 and Exhibit Anticancer Activity”) published in eLife, the investigators discovered that both salicylic acid and diflunisal suppress two key proteins that help control gene expression throughout the body. These sister proteins, p300 and CREB-binding protein (CBP), are epigenetic regulators that control the levels of proteins that cause inflammation or are involved in cell growth.
By inhibiting p300 and CBP, salicylic acid and diflunisal block the activation of these proteins and prevent cellular damage caused by inflammation. This study provides the first concrete demonstration that both p300 and CBP can be targeted by drugs and may have important clinical implications, according to Eric Verdin, M.D., associate director of the Gladstone Institute of Virology and Immunology .
“Salicylic acid is one of the oldest drugs on the planet, dating back to the Egyptians and the Greeks, but we’re still discovering new things about it,” he said. “Uncovering this pathway of inflammation that salicylic acid acts upon opens up a host of new clinical possibilities for these drugs.”
Earlier research conducted in the laboratory of co-author Stephen D. Nimer, M.D., director of Sylvester Comprehensive Cancer Center at the University of Miami Miller School of Medicine, and a collaborator of Verdin’s, established a link between p300 and the leukemia-promoting protein AML1-ETO. In the current study, scientists at Gladstone and Sylvester worked together to test whether suppressing p300 with diflunisal would suppress leukemia growth in mice. As predicted, diflunisal stopped cancer progression and shrunk the tumors in the mouse model of leukemia. ……
Novel Protein Agent Targets Cancer and Host of Other Diseases
Researchers at Georgia State University have designed a new protein compound that can effectively target the cell surface receptor integrin v3, mutations in which have been linked to a number of diseases. Initial results using this new molecule show its potential as a therapeutic treatment for an array of illnesses, including cancer.
The novel protein molecule targets integrin v3 at a novel site that has not been targeted by other scientists. The researchers found that the molecule induces apoptosis, or programmed cell death, of cells that express integrin v3. This integrin has been a focus for drug development because abnormal expression of v3 is linked to the development and progression of various diseases.
“This integrin pair, v3, is not expressed in high levels in normal tissue,” explained senior study author Zhi-Ren Liu, Ph.D., professor in the department of biology at Georgia State. “In most cases, it’s associated with a number of different pathological conditions. Therefore, it constitutes a very good target for multiple disease treatment.”
“Here we use a rational design approach to develop a therapeutic protein, which we call ProAgio, which binds to integrin αvβ3 outside the classical ligand-binding site,” the authors wrote. “We show ProAgio induces apoptosis of integrin αvβ3-expressing cells by recruiting and activating caspase 8 to the cytoplasmic domain of integrin αvβ3.”
The findings from this study were published recently in Nature Communications in an article entitled “Rational Design of a Protein That Binds Integrin αvβ3 Outside the Ligand Binding Site.” …..
“We took a unique angle,” Dr. Lui noted. “We designed a protein that binds to a different site. Once the protein binds to the site, it directly triggers cell death. When we’re able to kill pathological cells, then we’re able to kill the disease.”
The investigators performed extensive cell and molecular testing that confirmed ProAgio interacts and binds well with integrin v3. Interestingly, they found that ProAgio induces apoptosis by recruiting caspase 8—an enzyme that plays an essential role in programmed cell death—to the cytoplasmic area of integrin v3. ProAgio was much more effective in inducing cell death than other agents tested.
Noncoding RNAs Not So Noncoding
Bits of the transcriptome once believed to function as RNA molecules are in fact translated into small proteins.
In 2002, a group of plant researchers studying legumes at the Max Planck Institute for Plant Breeding Research in Cologne, Germany, discovered that a 679-nucleotide RNA believed to function in a noncoding capacity was in fact a protein-coding messenger RNA (mRNA).1 It had been classified as a long (or large) noncoding RNA (lncRNA) by virtue of being more than 200 nucleotides in length. The RNA, transcribed from a gene called early nodulin 40 (ENOD40), contained short open reading frames (ORFs)—putative protein-coding sequences bookended by start and stop codons—but the ORFs were so short that they had previously been overlooked. When the Cologne collaborators examined the RNA more closely, however, they found that two of the ORFs did indeed encode tiny peptides: one of 12 and one of 24 amino acids. Sampling the legumes confirmed that these micropeptides were made in the plant, where they interacted with a sucrose-synthesizing enzyme.
Five years later, another ORF-containing mRNA that had been posing as a lncRNA was discovered inDrosophila.2,3 After performing a screen of fly embryos to find lncRNAs, Yuji Kageyama, then of the National Institute for Basic Biology in Okazaki, Japan, suppressed each transcript’s expression. “Only one showed a clear phenotype,” says Kageyama, now at Kobe University. Because embryos missing this particular RNA lacked certain cuticle features, giving them the appearance of smooth rice grains, the researchers named the RNA “polished rice” (pri).
Turning his attention to how the RNA functioned, Kageyama thought he should first rule out the possibility that it encoded proteins. But he couldn’t. “We actually found it was a protein-coding gene,” he says. “It was an accident—we are RNA people!” The pri gene turned out to encode four tiny peptides—three of 11 amino acids and one of 32—that Kageyama and colleagues showed are important for activating a key developmental transcription factor.4
Since then, a handful of other lncRNAs have switched to the mRNA ranks after being found to harbor micropeptide-encoding short ORFs (sORFs)—those less than 300 nucleotides in length. And given the vast number of documented lncRNAs—most of which have no known function—the chance of finding others that contain micropeptide codes seems high.
Overlooked ORFs
From the late 1990s into the 21st century, as species after species had their genomes sequenced and deposited in databases, the search for novel genes and their associated mRNAs duly followed. With millions or even billions of nucleotides to sift through, researchers devised computational shortcuts to hunt for canonical gene and mRNA features, such as promoter regions, exon/intron splice sites, and, of course, ORFs.
ORFs can exist in practically any stretch of RNA sequence by chance, but many do not encode actual proteins. Because the chance that an ORF encodes a protein increases with its length, most ORF-finding algorithms had a size cut-off of 300 nucleotides—translating to 100 amino acids. This allowed researchers to “filter out garbage—that is, meaningless ORFs that exist randomly in RNAs,” says Eric Olsonof the University of Texas Southwestern Medical Center in Dallas.
Of course, by excluding all ORFs less than 300 nucleotides in length, such algorithms inevitably missed those encoding genuine small peptides. “I’m sure that the people who came up with [the cut-off] understood that this rule would have to miss anything that was shorter than 100 amino acids,” saysNicholas Ingolia of the University of California, Berkeley. “As people applied this rule more and more, they sort of lost track of that caveat.” Essentially, sORFs were thrown out with the computational trash and forgotten.
Aside from statistical practicality and human oversight, there were also technical reasons that contributed to sORFs and their encoded micropeptides being missed. Because of their small size, sORFs in model organisms such as mice, flies, and fish are less likely to be hit in random mutagenesis screens than larger ORFs, meaning their functions are less likely to be revealed. Also, many important proteins are identified based on their conservation across species, says Andrea Pauli of the Research Institute of Molecular Pathology in Vienna, but “the shorter [the ORF], the harder it gets to find and align this region to other genomes and to know that this is actually conserved.”
As for the proteins themselves, the standard practice of using electrophoresis to separate peptides by size often meant micropeptides would be lost, notes Doug Anderson, a postdoc in Olson’s lab. “A lot of times we run the smaller things off the bottom of our gels,” he says. Standard protein mass spectrometry was also problematic for identifying small peptides, says Gerben Menschaert of Ghent University in Belgium, because “there is a washout step in the protocol so that only larger proteins are retained.”
But as researchers take a deeper dive into the function of the thousands of lncRNAs believed to exist in genomes, they continue to uncover surprise micropeptides. In February 2014, for example, Pauli, then a postdoc in Alex Schier’s lab at Harvard University, discovered a hidden code in a zebrafish lncRNA. She had been hunting for lncRNAs involved in zebrafish development because “we hadn’t really anticipated that there would be any coding regions out there that had not been discovered—at least not something that is essential,” she says. But one lncRNA she identified actually encoded a 58-amino-acid micropeptide, which she called Toddler, that functioned as a signaling protein necessary for cell movements that shape the early embryo.5
Then, last year, Anderson and his colleagues reported another. Since joining Olson’s lab in 2010, Anderson had been searching for lncRNAs expressed in the heart and skeletal muscles of mouse embryos. He discovered a number of candidates, but one stood out for its high level of sequence conservation—suggesting to Anderson that it might have an important function. He was right, the RNA was important, but for a reason that neither Anderson nor Olson had considered: it was in fact an mRNA encoding a 46-amino-acid-long micropeptide.6
“When we zeroed in on the conserved region [of the gene], Doug found that it began with an ATG [start] codon and it terminated with a stop codon,” Olson says. “That’s when he looked at whether it might encode a peptide and found that indeed it did.” The researchers dubbed the peptide myoregulin, and found that it functioned as a critical calcium pump regulator for muscle relaxation.
With more and more overlooked peptides now being revealed, the big question is how many are left to be discovered. “Were there going to be dozens of [micropeptides]? Were there going to be hundreds, like there are hundreds of microRNAs?” says Ingolia. “We just didn’t know.”
Little things mean a lot. To any biologist, this time-worn maxim is old news. But it’s worth revisiting. As several articles in this issue of The Scientist illustrate, how researchers define and examine the “little things” does mean a lot.
Consider this month’s cover story, “Noncoding RNAs Not So Noncoding,” by TS correspondent Ruth Williams. Combing the human genome for open reading frames (ORFs), sequences bracketed by start and stop codons, yielded a protein-coding count somewhere in the neighborhood of 24,000. That left a lot of the genome relegated to the category of junk—or, later, to the tens of thousands of mostly mysterious long noncoding RNAs (lncRNAs). But because they had only been looking for ORFs that were 300 nucleotides or longer (i.e., coding for proteins at least 100 amino acids long), genome probers missed so-called short ORFs (sORFs), which encode small peptides. “Their diminutive size may have caused these peptides to be overlooked, their sORFs to be buried in statistical noise, and their RNAs to be miscategorized, but it does not prevent them from serving important, often essential functions, as the micropeptides characterized to date demonstrate,” writes Williams.
How little things work definitely informs another field of life science research: synthetic biology. As the functions of genes and gene networks are sussed out, bioengineers are using the information to design small, synthetic gene circuits that enable them to better understand natural networks. In “Synthetic Biology Comes into Its Own,” Richard Muscat summarizes the strides made by synthetic biologists over the last 15 years and offers an optimistic view of how such networks may be put to use in the future. And to prove him right, just as we go to press, a collaborative group led by one of syn bio’s founding fathers, MIT’s James Collins, has devised a paper-based test for Zika virus exposure that relies on a freeze-dried synthetic gene circuit that changes color upon detection of RNAs in the viral genome. The results are ready in a matter of hours, not the days or weeks current testing takes, and the test can distinguish Zika from dengue virus. “What’s really exciting here is you can leverage all this expertise that synthetic biologists are gaining in constructing genetic networks and use it in a real-world application that is important and can potentially transform how we do diagnostics,” commented one researcher about the test.
Moving around little things is the name of the game when it comes to delivering a package of drugs to a specific target or to operating on minuscule individual cells. Mini-scale delivery of biocompatible drug payloads often needs some kind of boost to overcome fluid forces or size restrictions that interfere with fine-scale manipulation. To that end, ingenious solutions that motorize delivery by harnessing osmotic changes, magnets, ultrasound, and even bacterial flagella are reviewed in “Making Micromotors Biocompatible.”
Cilengitide, a cyclic RGD pentapeptide, is currently in clinical phase III for treatment of glioblastomas and in phase II for several other tumors. This drug is the first anti-angiogenic small molecule targeting the integrins αvβ3, αvβ5 and α5β1. It was developed by us in the early 90s by a novel procedure, the spatial screening. This strategy resulted in c(RGDfV), the first superactive αvβ3 inhibitor (100 to 1000 times increased activity over the linear reference peptides), which in addition exhibited high selectivity against the platelet receptor αIIbβ3. This cyclic peptide was later modified by N-methylation of one peptide bond to yield an even greater antagonistic activity in c(RGDf(NMe)V). This peptide was then dubbed Cilengitide and is currently developed as drug by the company Merck-Serono (Germany).
This article describes the chemical development of Cilengitide, the biochemical background of its activity and a short review about the present clinical trials. The positive anti-angiogenic effects in cancer treatment can be further increased by combination with “classical” anti-cancer therapies. Several clinical trials in this direction are under investigation.
Integrins are heterodimeric receptors that are important for cell-cell and cell-extracellular matrix (ECM) interactions and are composed of one α and one β-subunit [1, 2]. These cell adhesion molecules act as transmembrane linkers between their extracellular ligands and the cytoskeleton, and modulate various signaling pathways essential in the biological functions of most cells. Integrins play a crucial role in processes such as cell migration, differentiation, and survival during embryogenesis, angiogenesis, wound healing, immune and non-immune defense mechanisms, hemostasis and oncogenic transformation [1]. The fact that many integrins are also linked with pathological conditions has converted them into very promising therapeutic targets [3]. In particular, integrins αvβ3, αvβ5 and α5β1 are involved in angiogenesis and metastasis of solid tumors, being excellent candidates for cancer therapy [4–7].
There are a number of different integrin subtypes which recognize and bind to the tripeptide sequence RGD (arginine, glycine, aspartic acid), which represents the most prominent recognition motif involved in cell adhesion. For example, the pro-angiogenic αvβ3 integrin binds various RGD-containing proteins, including fibronectin (Fn), fibrinogen (Fg), vitronectin (Vn) and osteopontin [8]. It is therefore not surprising that this integrin has been targeted for cancer therapy and that RGD-containing peptides and peptidomimetics have been designed and synthesized aiming to selectively inhibit this receptor [9, 10].
One classical strategy used in drug design is based on the knowledge about the structure of the receptor-binding pocket, preferably in complex with the natural ligand. However, this strategy, the so-called “rational structure-based design”, could not be applied in the field of integrin ligands since the first structures of integrin’s extracellular head groups were not described until 2001 for αvβ3 [11] (one year later, in 2002 the structure of this integrin in complex with Cilengitide was also reported [12]) and 2004 for αIIbβ3 [13]. Therefore, initial efforts in this field focused on a “ligand-oriented design”, which concentrated on optimizing RGD peptides by means of different chemical approaches in order to establish structure-activity relationships and identify suitable ligands.
We focused our interest in finding ligands for αvβ3 and based our approach on three chemical strategies pioneered in our group: 1) Reduction of the conformational space by cyclization; 2) Spatial screening of cyclic peptides; and 3)N-Methyl scan.
The combination of these strategies lead to the discovery of the cyclic peptidec(RGDf(NMe)V) in 1995. This peptide showed subnanomolar antagonistic activity for the αvβ3 receptor, nanomolar affinities for the closely related integrins αvβ5 and α5β1, and high selectivity towards the platelet receptor αIIbβ3. The peptide was patented together with Merck in 1997 (patent application submitted in 15.9.1995, opened in 20.3.1997) [14] and first presented with Merck’s agreement at the European Peptide Symposium in Edinburgh (September 1996) [15]. The synthesis and activity of this molecule was finally published in 1999 [16]. This peptide is now developed by Merck-Serono, (Darmstadt, Germany) under the name “Cilengitide” and has recently entered Phase III clinical trials for treating glioblastoma [17]. …..
The discovery 30 years ago of the RGD motif in Fn was a major breakthrough in science. This tripeptide sequence was also identified in other ECM proteins and was soon described as the most prominent recognition motif involved in cell adhesion. Extensive research in this direction allowed the description of a number of bidirectional proteins, the integrins, which were able to recognize and bind to the RGD sequence. Integrins are key players in the biological function of most cells and therefore the inhibition of RGD-mediated integrin-ECM interactions became an attractive target for the scientific community.
However, the lack of selectivity of linear RGD peptides represented a major pitfall which precluded any clinical application of RGD-based inhibitors. The control of the molecule’s conformation by cyclization and further spatial screening overcame these limitations, showing that it is possible to obtain privileged bioactive structures, which enhance the biological activity of linear peptides and significantly improve their receptor selectivity. Steric control imposed in RGD peptides together with their biological evaluation and extensive structural studies yielded the cyclic peptide c(RGDfV), the first small selective anti-angiogenic molecule described. N-Methylation of this cyclic peptide yielded the much potentc(RGDf(NMe)V), nowadays known as Cilengitide.
The fact that brain tumors, which are highly angiogenic, are more susceptible to the treatment with integrin antagonists, and the positive synergy observed for Cilengitide in combination with radio-chemotherapy in preclinical studies, encouraged subsequent clinical trials. Cilengitide is currently in phase III for GBM patients and in phase II for other types of cancers, with to date a promising therapeutic outcome. In addition, the absence of significant toxicity and excellent tolerance of this drug allows its combination with classical therapies such as RT or cytotoxic agents. The controlled phase III study CENTRIC was launched in 2008, with primary outcome measures due on September 2012. The results of this and other clinical studies are expected with great hope and interest.
Integrins are heterodimeric, transmembrane receptors that function as mechanosensors, adhesion molecules and signal transduction platforms in a multitude of biological processes. As such, integrins are central to the etiology and pathology of many disease states. Therefore, pharmacological inhibition of integrins is of great interest for the treatment and prevention of disease. In the last two decades several integrin-targeted drugs have made their way into clinical use, many others are in clinical trials and still more are showing promise as they advance through preclinical development. Herein, this review examines and evaluates the various drugs and compounds targeting integrins and the disease states in which they are implicated.
Integrins are heterodimeric cell surface receptors found in nearly all metazoan cell types, composed of non-covalently linked α and β subunits. In mammals, eighteen α-subunits and eight β-subunits have been identified to date 1. From this pool, 24 distinct heterodimer combinations have been observed in vivo that confer cell-to-cell and cell-to-ligand specificity relevant to the host cell and the environment in which it functions 2. Integrin-mediated interactions with the extracellular matrix (ECM) are required for the attachment, cytoskeletal organization, mechanosensing, migration, proliferation, differentiation and survival of cells in the context of a multitude of biological processes including fertilization, implantation and embryonic development, immune response, bone resorption and platelet aggregation. Integrins also function in pathological processes such as inflammation, wound healing, angiogenesis, and tumor metastasis. In addition, integrin binding has been identified as a means of viral entry into cells 3. ….
Combination of cilengitide and radiation therapy and temozolomide. The addition of cilengitide to radiotherapy and temozolomide based treatment regimens has shown promising preliminary results in ongoing Phase II trials in both newly diagnosed and progressive glioblastoma multiforme 139–140. In addition to the Phase II objectives sought, these trials are significant in that they represent progress that has made in determining tumor drug uptake and in identifying a subset of patients that may benefit from treatment. In a Phase II trial enrolling 52 patients with newly diagnosed glioblastoma multiforme receiving 500 mg cilengitide twice weekly during radiotherapy and in combination with temozolomide for 6 monthly cycles following radiotherapy, 69% achieved 6 months progression free survival compared to 54 % of patients receiving radiotherapy followed by temozolomide alone. The one-year overall survival was 67 and 62 % of patients for the cilengitide combination group and the radiotherapy and temozolomide group, respectively. Non-hematological grade 3-4 toxcities were limited, and included symptoms of fatigue, asthenia, anorexia, elevated liver function tests, deep vein thrombosis and pulmonary embolism in across a total of 5.7% of the patients. Grade 3-4 hematological malignancies were more common and included lymphopenia (53.8%), thrombocytopenia (13.4%) and neutropenia (9.6%). This trial is significant in the fact that is has provided the first evidence correlating a molecular biomarker with response to treatment. Decreased methylguanine methyltransferase (MGMT) expression was associated with favorable outcome. Patients harboring increased MGMT promoter methylation appeared to benefit more from combined treatment with cilengitide than did patients lacking promoter methylation. The significance of the MGMT promoter methylation in predicting response is likely due to inclusion of temozolomide in the treatment combination.
A similar Phase II study evaluating safety and differences in overall survival among newly diagnosed glioblastoma multiforme patients receiving radiation therapy combined with temozolomide and varying doses of cilengitide is nearing completion. Preliminary reports specify that initial safety run-in studies in 18 patients receiving doses 500, 1000 and 2000 mg cilengitide found no dose limiting toxicities. Subsequently 94 patients were randomized to receive standard therapy plus 500 or 2000 mg cilengitide. Median survival time in both cohorts was 18.9 months. At 12 months the overall survival was 79.5 % (89/112 patients).
In the last two decades great progress has been made in the discovery and development of integrin targeted therapeutics. Years of intense research into integrin function has provided an understanding of the potential applications for the treatment of disease. Advances in structural characterization of integrin-ligand interactions has proved beneficial in the design and development of potent, selective inhibitors for a number of integrins involved in platelet aggregation, inflammatory responses, angiongenesis, neovascularization and tumor growth.
The αIIbβ3 integrin antagonists were the first inhibitors to make their way into clinical use and have proven to be effective and safe drugs, contributing to the reduction of mortality and morbidity associated with acute coronary syndromes. Interestingly, the prolonged administration of small molecules targeting this integrin for long-term prevention of thrombosis related complications have not been successful, for reasons that are not yet fully understood. This suggests that modulating the intensity, duration and temporal aspects of integrin function may be more effective than simply shutting off integrin signaling in some instances. Further research into the dynamics of platelet activation and thrombosis formation may elucidate the mechanisms by which integrin activation is modulated.
The introduction of α4 targeted therapies held great promise for the treatment of inflammatory diseases. The development of Natalizumab greatly improved the quality of life for multiple sclerosis patients and those suffering with Crohn’s Disease compared to previous treatments, but the role in asthma related inflammation could not be validated. Unfortunately for MS and Crohn’s patients, immune surveillance in the central nervous system was also compromised as a direct effect α4β7 antagonism, with potentially lethal effects. Thus Natalizumab and related α4β7 targeting drugs are now limited to patients refractory to standard therapies. The design and development of α4β1 antagonists for the treatment of Crohn’s Disease may offer benefit with decreased risks. The involvement of these integrins in fetal development also raises concerns for widespread clinical use.
Integrin antagonists that target angiogenesis are progressing through clinical trials. Cilengitide has shown promising results for the treatment of glioblastomas and recurrent gliomas, cancers with notoriously low survival and cure rates. The greatest challenge facing the development of anti-angiogenic integrin targeted therapies is the overall lack of biomarkers by which to measure treatment efficacy.
Mapping the ligand-binding pocket of integrin α5β1 using a gain-of-function approach
Integrin α5β1 is a key receptor for the extracellular matrix protein fibronectin. Antagonists of human α5β1 have therapeutic potential as anti-angiogenic agents in cancer and diseases of the eye. However, the structure of the integrin is unsolved and the atomic basis of fibronectin and antagonist binding by α5β1 is poorly understood. Here we demonstrate that zebrafish α5β1 integrins do not interact with human fibronectin or the human α5β1 antagonists JSM6427 and cyclic peptide CRRETAWAC. Zebrafish α5β1 integrins do bind zebrafish fibronectin-1, and mutagenesis of residues on the upper surface and side of the zebrafish α5 subunit β-propeller domain shows that these residues are important for the recognition of RGD and synergy sites in fibronectin. Using a gain-of-function analysis involving swapping regions of the zebrafish α5 subunit with the corresponding regions of human α5 we show that blades 1-4 of the β-propeller are required for human fibronectin recognition, suggesting that fibronectin binding involves a broad interface on the side and upper face of the β-propeller domain. We find that the loop connecting blades 2 and 3 of the β-propeller (D3-A3 loop) contains residues critical for antagonist recognition, with a minor role played by residues in neighbouring loops. A new homology model of human α5β1 supports an important function for D3-A3 loop residues Trp-157 and Ala-158 in the binding of antagonists. These results will aid the development of reagents that block α5β1 functions in vivo.
Structural Basis of Integrin Regulation and Signaling
Integrins are cell adhesion molecules that mediate cell-cell, cell-extracellular matrix, and cellpathogen interactions. They play critical roles for the immune system in leukocyte trafficking and migration, immunological synapse formation, costimulation, and phagocytosis. Integrin adhesiveness can be dynamically regulated through a process termed inside-out signaling. In addition, ligand binding transduces signals from the extracellular domain to the cytoplasm in the classical outside-in direction. Recent structural, biochemical, and biophysical studies have greatly advanced our understanding of the mechanisms of integrin bidirectional signaling across the plasma membrane. Large-scale reorientations of the ectodomain of up to 200 Å couple to conformational change in ligand-binding sites and are linked to changes in α and β subunit transmembrane domain association. In this review, we focus on integrin structure as it relates to affinity modulation, ligand binding, outside-in signaling, and cell surface distribution dynamics.
The immune system relies heavily on integrins for (a) adhesion during leukocyte trafficking from the bloodstream, migration within tissues, immune synapse formation, and phagocytosis; and (b) signaling during costimulation and cell polarization. Integrins are so named because they integrate the extracellular and intracellular environments by binding to ligands outside the cell and cytoskeletal components and signaling molecules inside the cell. Integrins are noncovalently associated heterodimeric cell surface adhesion molecules. In vertebrates, 18 α subunits and 8 β subunits form 24 known αβ pairs (Figure 1). This diversity in subunit composition contributes to diversity in ligand recognition, binding to cytoskeletal components and coupling to downstream signaling pathways. Immune cells express at least 10 members of the integrin family belonging to the β2, β7, and β1 subfamilies (Table 1). The β2 and β7 integrins are exclusively expressed on leukocytes, whereas the β1 integrins are expressed on a wide variety of cells throughout the body. Distribution and ligand-binding properties of the integrins on leukocytes are summarized in Table 1. For reviews, see References 1 and 2. Mutations that block expression of the β2 integrin subfamily lead to leukocyte adhesion deficiency, a disease associated with severe immunodeficiency (3).
As adhesion molecules, integrins are unique in that their adhesiveness can be dynamically regulated through a process termed inside-out signaling or priming. Thus, stimuli received by cell surface receptors for chemokines, cytokines, and foreign antigens initiate intracellular signals that impinge on integrin cytoplasmic domains and alter adhesiveness for extracellular ligands. In addition, ligand binding transduces signals from the extracellular domain to the cytoplasm in the classical outside-in direction (outside-in signaling). These dynamic properties of integrins are central to their proper function in the immune system. Indeed, mutations or small molecules that stabilize either the inactive state or the active adhesive state—and thereby block the adhesive dynamics of leukocyte integrins—inhibit leukocyte migration and normal immune responses.
A new periodic table presents a systematic, ordered view of protein assembly, providing a visual tool for understanding biological function. [EMBL-EBI / Spencer Phillips]
Move over Mendeleev, there’s a new periodic table in science. Unlike the original periodic table, which organized the chemical elements, the new periodic table organizes protein complexes, or more precisely, quaternary structure topologies. Though there are other differences between the old and new periodic tables, they share at least one important feature—predictive power.
When Mendeleev introduced his periodic table, he predicted that when new chemical elements were discovered, they would fill his table’s blank spots. Analogous predictions are being ventured by the scientific team that assembled the new periodic table. This team, consisting of scientists from the Wellcome Genome Campus and the University of Cambridge, asserts that its periodic table reveals the regions of quaternary structure space that remain to be populated.
The periodic table of protein complexes not only offers a new way of looking at the enormous variety of structures that proteins can build in nature, it also indicates which structures might be discovered next. Moreover, it could point protein engineers toward entirely novel structures that never occurred in nature, but could be engineered.
The new table appeared December 11 in the journal Science, in an article entitled, “Principles of assembly reveal a periodic table of protein complexes.” The “principles of assembly” referenced in this title amount to three basic assembly types: dimerization, cyclization, and heteromeric subunit addition. In dimerization, one protein complex subunit doubles, and becomes two; in cyclization, protein complex subunits from a ring of three or more; and in heteromeric subunit addition, two different proteins bind to each other.
These steps, repeated in different combinations, gives rise to enormous number of proteins of different kinds. “Evolution has given rise to a huge variety of protein complexes, and it can seem a bit chaotic,” explained Joe Marsh, Ph.D., formerly of the Wellcome Genome Campus and now of the MRC Human Genetics Unit at the University of Edinburgh. “But if you break down the steps proteins take to become complexes, there are some basic rules that can explain almost all of the assemblies people have observed so far.”
The authors of the Science article noted that many protein complexes assemble spontaneously via ordered pathways in vitro, and these pathways have a strong tendency to be evolutionarily conserved. “[There] are strong similarities,” the authors added, “between protein complex assembly and evolutionary pathways, with assembly pathways often being reflective of evolutionary histories, and vice versa. This suggests that it may be useful to consider the types of protein complexes that have evolved from the perspective of what assembly pathways are possible.”
To explore this rationale, the authors examined the fundamental steps by which protein complexes can assemble, using electrospray mass spectrometry experiments, literature-curated assembly data, and a large-scale analysis of protein complex structures. Ultimately, they derived their approach to explaining the observed distribution of known protein complexes in quaternary structure space. This approach, they insist, provides a framework for understanding their evolution.
“In addition, it can contribute considerably to the prediction and modeling of quaternary structures by specifying which topologies are most likely to be adopted by a complex with a given stoichiometry, potentially providing constraints for multi-subunit docking and hybrid methods,” the authors concluded. “Lastly, it could help in the bioengineering of protein complexes by identifying which topologies are most likely to be stable, and thus which types of essential interfaces need to be engineered.”
The rows and columns of the periodic table of the elements, called periods and groups, were originally determined by each element’s atomic mass and chemical properties, later by atomic number and electron configuration. In contrast, the rows and columns of the periodic table of protein complexes correspond to the number of different subunit types and the number of times these subunits are repeated. The new table is not, it should be noted, periodic in the same sense as the periodic table of the elements. It is in principle open-ended.
Although there are no theoretical limitations to quaternary structure topology space in either dimension, the abridged version of the table presented in the Science article can accommodate the vast majority of known structures. Moreover, when the table’s creators compared the large variety of countenanced topologies to observed structures, they found that about 92% of known protein complex structures were compatible with their model.
“Despite its strong predictive power, the basic periodic table model does not account for about 8% of known protein complex structures,” the authors conceded. “More than half of these exceptions arise as a result of quaternary structure assignment errors.
“A benefit of this approach is that it highlights likely quaternary structure misassignments, particularly by identifying nonbijective complexes with even subunit stoichiometry. However, this still leaves about 4% of known structures that are correct but are not compatible with the periodic table.” The authors added that the exceptions to their model are interesting in their own right, and are the subject of ongoing studies.
The Periodic Table of Protein Complexes, published today in Science, offers a new way of looking at the enormous variety of structures that proteins can build in nature, which ones might be discovered next, and predicting how entirely novel structures could be engineered. Created by an interdisciplinary team led by researchers at the Wellcome Genome Campus and the University of Cambridge, the Table provides a valuable tool for research into evolution and protein engineering.
Different ballroom dances can be seen as an endless combination of a small number of basic steps. Similarly, the ‘dance’ of protein complex assembly can be seen as endless variations on dimerization (one doubles, and becomes two), cyclisation (one forms a ring of three or more) and subunit addition (two different proteins bind to each other). Because these happen in a fairly predictable way, it’s not as hard as you might think to predict how a novel protein would form.
“We’re bringing a lot of order into the messy world of protein complexes,” explains Sebastian Ahnert of the Cavendish Laboratory at the University of Cambridge, a physicist who regularly tangles with biological problems. “Proteins can keep go through several iterations of these simple steps, , adding more and more levels of complexity and resulting in a huge variety of structures. What we’ve made is a classification based on these underlying principles that helps people get a handle on the complexity.”
The exceptions to the rule are interesting in their own right, adds Sebastian, as are the subject of on-going studies.
“By analysing the tens of thousands of protein complexes for which three-dimensional structures have already been experimentally determined, we could see repeating patterns in the assembly transitions that occur – and with new data from mass spectrometry we could start to see the bigger picture,” says Joe.
“The core work for this study is in theoretical physics and computational biology, but it couldn’t have been done without the mass spectrometry work by our colleagues at Oxford University,” adds Sarah Teichmann, Research Group Leader at the European Bioinformatics Institute (EMBL-EBI) and the Wellcome Trust Sanger Institute. “This is yet another excellent example of how extremely valuable interdisciplinary research can be.”
The assembly of proteins into complexes is crucial for most biological processes. The three-dimensional structures of many thousands of homomeric and heteromeric protein complexes have now been determined, and this has had a broad impact on our understanding of biological function and evolution. Despite this, the organizing principles that underlie the great diversity of protein quaternary structures observed in nature remain poorly understood, particularly in comparison with protein folds, which have been extensively classified in terms of their architecture and evolutionary relationships.
RATIONALE
In this work, we sought a comprehensive understanding of the general principles underlying quaternary structure organization. Our approach was to consider protein complexes in terms of their assembly. Many protein complexes assemble spontaneously via ordered pathways in vitro, and these pathways have a strong tendency to be evolutionarily conserved. Furthermore, there are strong similarities between protein complex assembly and evolutionary pathways, with assembly pathways often being reflective of evolutionary histories, and vice versa. This suggests that it may be useful to consider the types of protein complexes that have evolved from the perspective of what assembly pathways are possible.
RESULTS
We first examined the fundamental steps by which protein complexes can assemble, using electrospray mass spectrometry experiments, literature-curated assembly data, and a large-scale analysis of protein complex structures. We found that most assembly steps can be classified into three basic types: dimerization, cyclization, and heteromeric subunit addition. By systematically combining different assembly steps in different ways, we were able to enumerate a large set of possible quaternary structure topologies, or patterns of key interfaces between the proteins within a complex. The vast majority of real protein complex structures lie within these topologies. This enables a natural organization of protein complexes into a “periodic table,” because each heteromer can be related to a simpler symmetric homomer topology. Exceptions are mostly the result of quaternary structure assignment errors, or cases where sequence-identical subunits can have different interactions and thus introduce asymmetry. Many of these asymmetric complexes fit the paradigm of a periodic table when their assembly role is considered. Finally, we implemented a model based on the periodic table, which predicts the expected frequencies of each quaternary structure topology, including those not yet observed. Our model correctly predicts quaternary structure topologies of recent crystal and electron microscopy structures that are not included in our original data set.
CONCLUSION
This work explains much of the observed distribution of known protein complexes in quaternary structure space and provides a framework for understanding their evolution. In addition, it can contribute considerably to the prediction and modeling of quaternary structures by specifying which topologies are most likely to be adopted by a complex with a given stoichiometry, potentially providing constraints for multi-subunit docking and hybrid methods. Lastly, it could help in the bioengineering of protein complexes by identifying which topologies are most likely to be stable, and thus which types of essential interfaces need to be engineered.
Protein assembly steps lead to a periodic table of protein complexes and can predict likely quaternary structure topologies.
Three main assembly steps are possible: cyclization, dimerization, and subunit addition. By combining these in different ways, a large set of possible quaternary structure topologies can be generated. These can be arranged on a periodic table that describes most known complexes and that can predict previously unobserved topologies.
Classification of protein structure has had a broad impact on our understanding of biological function and evolution, yet this work has largely focused on individual protein domains and their pairwise interactions. In contrast, the assembly of individual polypeptides into protein complexes, which are ubiquitous in cells, has received comparatively little attention. The periodic table of protein complexes is a new framework for analysis of complexes based on the principles of self-assembly. This reveals that sequence-identical subunits almost always have identical assembly roles within a complex and allows us to unify the vast majority of complexes of known structure (~32,000) into about 120 topologies. This facilitates the exhaustive enumeration of unobserved protein complex topologies and has significant practical applications for quaternary structure prediction, modelling and engineering.
Chloroplast genomes encode ∼37 proteins that integrate into the thylakoid membrane. The mechanisms that target these proteins to the membrane are largely unexplored. We used ribosome profiling to provide a comprehensive, high-resolution map of ribosome positions on chloroplast mRNAs in separated membrane and soluble fractions in maize seedlings. The results show that translation invariably initiates off the thylakoid membrane and that ribosomes synthesizing a subset of membrane proteins subsequently become attached to the membrane in a nucleaseresistant fashion. The transition from soluble to membraneattached ribosomes occurs shortly after the first transmembrane segment in the nascent peptide has emerged from the ribosome. Membrane proteins whose translation terminates before emergence of a transmembrane segment are translated in the stroma and targeted to the membrane posttranslationally. These results indicate that the first transmembrane segment generally comprises the signal that links ribosomes to thylakoid membranes for cotranslational integration. The sole exception is cytochrome f, whose cleavable N-terminal cpSecA-dependent signal sequence engages the thylakoid membrane cotranslationally. The distinct behavior of ribosomes synthesizing the inner envelope protein CemA indicates that sorting signals for the thylakoid and envelope membranes are distinguished cotranslationally. In addition, the fractionation behavior of ribosomes in polycistronic transcription units encoding both membrane and soluble proteins adds to the evidence that the removal of upstream ORFs by RNA processing is not typically required for the translation of internal genes in polycistronic chloroplast mRNAs.
Significance Proteins in the chloroplast thylakoid membrane system are derived from both the nuclear and plastid genomes. Mechanisms that localize nucleus-encoded proteins to the thylakoid membrane have been studied intensively, but little is known about the analogous issues for plastid-encoded proteins. This genome-wide, high-resolution analysis of the partitioning of chloroplast ribosomes between membrane and soluble fractions revealed that approximately half of the chloroplast encoded thylakoid proteins integrate cotranslationally and half integrate posttranslationally. Features in the nascent peptide that underlie these distinct behaviors were revealed by analysis of the position on each mRNA at which elongating ribosomes first become attached to the membrane.
Structures of the HIN Domain:DNA Complexes Reveal Ligand Binding and Activation Mechanisms of the AIM2 Inflammasome and IFI16 Receptor
Electrostatic attraction underlies innate dsDNA recognition by the HIN domains
Both OB folds and the linker between them engage the dsDNA backbone
An autoinhibited state of AIM2 is activated by DNA that liberates the PYD domain
DNA serves as an oligomerization platform for the inflammasome assembly
Summary
Recognition of DNA by the innate immune system is central to antiviral and antibacterial defenses, as well as an important contributor to autoimmune diseases involving self DNA. AIM2 (absent in melanoma 2) and IFI16 (interferon-inducible protein 16) have been identified as DNA receptors that induce inflammasome formation and interferon production, respectively. Here we present the crystal structures of their HIN domains in complex with double-stranded (ds) DNA. Non-sequence-specific DNA recognition is accomplished through electrostatic attraction between the positively charged HIN domain residues and the dsDNA sugar-phosphate backbone. An intramolecular complex of the AIM2 Pyrin and HIN domains in an autoinhibited state is liberated by DNA binding, which may facilitate the assembly of inflammasomes along the DNA staircase. These findings provide mechanistic insights into dsDNA as the activation trigger and oligomerization platform for the assembly of large innate signaling complexes such as the inflammasomes.
James E. Darnell Jr. (1930— )
Vincent Astor Professor Emeritus
2002 Albert Lasker Award for Special Achievement in Medical Science
Responsible for the various tasks required in turning genetic information into working proteins, ribonucleic acids are one of the most essential players in the life of a cell. First discovered in 1868, RNA today remains the subject of intense scientific scrutiny. Over the course of a career dedicated to understanding the intricate workings of gene transcription, Rockefeller University scientist James E. Darnell Jr. has revealed some of RNA’s most secretive and surprising mechanisms. For his half-century of illuminating research, Dr. Darnell received the 2002 Albert Lasker Award for Special Achievement in Medical Science.
In 1963, Dr. Darnell described a phenomenon he termed “RNA processing,” a step in the process of gene transcription, which had only recently been elucidated in bacterial systems. Working with mammalian cells — which differ from bacterial cells in that they contain a nucleus, where RNA is created — Dr. Darnell observed that very long strings of RNA disappear from the cell nucleus and that subsequently, shorter RNAs resembling the absent longer ones appear in the cytoplasm. Mammalian cells, he concluded, must distill their massive, immature nuclear RNA into shorter, mature forms that are individually coded for specific purposes by specific segments of the genome.
Dr. Darnell carried the principles of his finding — which he made in ribosomal RNA, part of the construction crew that builds cellular proteins — to other long nuclear RNA, including the longest one, which he named heterogeneous nuclear RNA (hnRNA). His hypothesis, that hnRNA is the precursor of the better known messenger RNA — which carries the genetic blueprint for protein building — soon bore fruit when he found a structural correlation between the two. Certain hnRNAs and nearly all messenger RNAs have a “tail” of adenine nucleotides at one end. Dr. Darnell followed this discovery with the observation that when an hnRNA string with an adenine tail disappears from the nucleus, a messenger RNA with the same tail then appears in the cytoplasm, suggesting a causal link between the two. When he found a second similarity — a cap at the end of the string opposite the adenine tail — he faced a conundrum. Scientific dogma had it that the order of nucleotides in any RNA mirrors that of DNA, whether the RNA is modeled from somewhere in the middle of the DNA or from one of the ends. The matching of a nuclear RNA to its cytoplasmic product by two end pieces glued together was surprising, but the concept was soon proven by colleagues at other institutions and called RNA splicing.
After a brief sojourn in Paris to work in François Jacob’s lab, Darnell worked at MIT, the Albert Einstein College of Medicine, and Rockefeller University on the relationship between mRNA and hnRNA. hnRNA was believed to be the precursor to mRNA, and despite making some key discoveries, Darnell admits that he could not free his imagination from the idea of colinearity and envision an hnRNA spliced to produce a smaller mRNA.
At this time, Darnell turned his attention to the question he had pondered since Paris: how were genes regulated in animal cells? This led to the discovery of the STAT and the Jak-STAT pathway of transcription control.
With the knowledge of RNA processing and splicing, Dr. Darnell next examined how cells begin the process of transcription and how they activate particular segments of DNA. Having moved to Rockefeller University in 1974, he found in the early 1980s that cells retain their specificity only in the context of their natural environment. Away from other liver cells, for example, a single liver cell stops producing liver-specific RNA, though it continues to make RNA for more generic cellular tasks. To pinpoint the signals responsible, which he believed must be coming from outside the cell, Dr. Darnell took a closer look at interferons (IFN), proteins that warn a cell when it’s time to raise its genetic defenses against harmful microbes.
Dr. Darnell’s laboratory studies how signals from the cell surface affect transcription of genes in the nucleus. Originally using interferon as a model cytokine, the Darnell group discovered that cell transcription was quickly changed by binding of cytokines to the cell surface. Introducing IFNβ into cell cultures, he watched as a particular type of mRNA accumulated in the cytoplasm, unaccompanied by any new protein synthesis. Analyzing the mRNA led him to the segment of DNA that had been activated, and the lack of new proteins told him that the cell contained its own, usually dormant, IFN-responsive transcription factor. By isolating a particular stretch of DNA from IFN-treated cells, he was able to call out of hiding the proteins that make up that factor, which, partly because they respond to signals very quickly, he called “STATs.” Dr. Darnell then traced the chemical relay that activates the STATs after IFN contact, called the Jak-Stat pathway.
The bound interferon led to the tyrosine phosphorylation of latent cytoplasmic proteins now called STATs (signal transducers and activators of transcription) that dimerize by reciprocal phosphotyrosine-SH2 interchange. They accumulate in the nucleus, bind DNA and drive transcription. This pathway has proved to be of wide importance, with seven STATs now known in mammals that take part in a wide variety of developmental and homeostatic events in all multicellular animals. Crystallographic analysis defined functional domains in the STATs, and current attention is focused on two areas: how the STATs complete their cycle of activation and inactivation, which requires regulated tyrosine dephosphorylation; and how persistent activation of STAT3 that occurs in a high proportion of many human cancers contributes to blocking apoptosis in cancer cells. Current efforts are devoted to inhibiting STAT3 with modified peptides that can enter cells.
Dr. Darnell received his M.D. in 1955 from the Washington University School of Medicine. His career has included poliovirus research with Harry Eagle at the National Institute of Allergy and Infectious Diseases, research with François Jacob at the Pasteur Institute in Paris and academic appointments at the Massachusetts Institute of Technology, the Albert Einstein College of Medicine and Columbia University. In 1974 Dr. Darnell joined Rockefeller as Vincent Astor Professor, and from 1990 to 1991 he was vice president for academic affairs.
A member of the National Academy of Sciences since 1973, he has received numerous awards, including the 2012 Albany Medical Center Prize in Medicine and Biomedical Research, the 2003 National Medal of Science, the 2002 Albert Lasker Award for Special Achievement in Medical Science, the 1997 Passano Award, the 1994 Paul Janssen Prize in Advanced Biotechnology and Medicine and the 1986 Gairdner Foundation International Award.
He is the coauthor with S.E. Luria of General Virology and the founding author with Harvey Lodish and David Baltimore of Molecular Cell Biology, now in its seventh edition. His book RNA, Life’s Indispensable Molecule was published in July 2011 by Cold Spring Harbor Laboratory Press. He is a member of the American Academy of Arts and Sciences and a foreign member of The Royal Society and The Royal Swedish Academy of Sciences.
As the molecular processes that control mRNA translation and ribosome biogenesis in the eukaryotic cell are extremely complex and multilayered, their deregulation can in principle occur at multiple levels, leading to both disease and cancer pathogenesis. For a long time, it was speculated that disruption of these processes may participate in tumorigenesis, but this notion was, until recently, solely supported by correlative studies. Strong genetic support is now being accrued, while new molecular links between tumor-suppressive and oncogenic pathways and the control of protein synthetic machinery are being unraveled. The importance of aberrant protein synthesis in tumorigenesis is further underscored by the discovery that compounds such as Rapamycin, known to modulate signaling pathways regulatory of this process, are effective anticancer drugs. A number of fundamental questions remain to be addressed and a number of novel ones emerge as this exciting field evolves.
mRNA Translation and Energy Metabolism in Cancer
I. Topisirovic and N. Sonenberg
Cold Spring Harbor Symposia on Quantitative Biology, Volume LXXVI http://dx.doi.org:/10.1101/sqb.2011.76.010785
A prominent feature of cancer cells is the use of aerobic glycolysis under conditions in which oxygen levels are sufficient to support energy production in the mitochondria (Jones and Thompson 2009; Cairns et al. 2010). This phenomenon, named the “Warburg effect,” after its discoverer Otto Warburg, is thought to fuel the biosynthetic requirements of the neoplastic growth (Warburg 1956; Koppenol et al. 2011) and has recently been acknowledged as one of the hallmarks of cancer (Hanahan and Weinberg 2011). mRNA translation is the most energy-demanding process in the cell (Buttgereit and Brand 1995).In mammalian cells it consumes >20% of cellular ATP, not considering the energy that is required for the biosynthesis of the components of the translational machinery (e.g., ribosome biogenesis; Buttgereit and Brand 1995). Control of mRNA translation plays a pivotal role in the regulation of gene expression (Sonenberg and Hinnebusch 2009). In fact, a recent study demonstrated that mammalian proteome is mostly governed at the mRNA translation level (Schwanhausser et al. 2011). Malfunction of mRNA translation critically contributes to human disease, including diabetes, heart disease, blood disorders, and, most notably, cancer (Fig. 1; Crozier et al. 2006; Narla and Ebert 2010; Silvera et al. 2010; Spriggs et al. 2010). The first account of changes in the translational apparatus in cancer dates back to 1896, showing enlarged and irregularly shaped nucleoli that are the site of ribosome biogenesis (Pianese 1896). Rapidly proliferating cancer cells have more ribosomes than normal cells.
Figure 1. Dysregulated mRNA translation plays a pivotal role in cancer. Malignant cells are characterized by enlarged nucleoli and a larger number of ribosomes than their normal counterparts. Mutations and/or altered expression of ribosomal proteins (e.g., RPS19, RPS 24), rRNA-modifying enzymes (e.g., dyskerin), translation initiation factors (e.g., eIF4E), or the initiator tRNA (tRNAiMet) result in malignant transformation. Signaling pathways whose dysfunction is frequent in cancer (e.g., MAPK, PI3K/AKT) affect mRNA translation. Perturbations in the translatome result in aberrant cellular growth, proliferation, and survival characteristic of tumorigenesis.
In stark contrast to normal cells, in cancer cells ribosomal biogenesis is uncoupled from cell proliferation (Stanners et al. 1979). Accordingly, cancer cells exhibit abnormally high rates of protein synthesis (Silvera et al. 2010). That ribosomal dysfunction plays a central role in cancer is further corroborated by the findings that genetic alterations, which encompass the components of the ribosome machinery (i.e., “ribosomopathies”), are characterized by elevated cancer risk (Narla and Ebert 2010).
mRNA translation is the most energy-consuming process in the cell and strongly correlates with cellular metabolic activity. Translation and energy metabolism play important roles in homeostatic cell growth and proliferation, and when dysregulated lead to cancer. eIF4E is a key regulator of translation, which promotes oncogenesis by selectively enhancing translation of a subset of tumor-promoting mRNAs (e.g., cyclins and c-myc). PI3K/AKT and mitogen-activated protein kinase (MAPK) pathways, which are strongly implicated in cancer etiology, exert a number of their biological effects by modulating translation. The PI3K/AKT pathway regulates eIF4E function by inactivating the inhibitory 4E-BPs via mTORC1, whereas MAPKs activate MAP kinase signal-integrating kinases 1 and 2, which phosphorylate eIF4E. In addition, AMP-activated protein kinase, which is a central sensor of the cellular energy balance, impairs translation by inhibiting mTORC1. Thus, eIF4E plays a major role in mediating the effects of PI3K/AKT, MAPK, and cellular energetics on mRNA translation.Figure 2. eIF4E is regulated by multiple mechanisms. The expression of eIF4E is regulated by several transcription factors (e.g., c-myc, hnRNPK, p53) and adenine-uracil-rich element binding proteins (i.e., HuR and AUF1). eIF4E is suppressed by 4E-BPs, which are regulated by mTORC1. MAP kinase signal integrating kinases 1 and 2 (MNKs) phosphorylate eIF4E.
Figure 3. Ras/MAPK and PI3K/AKT/mTORC1 regulate the activity of eIF4E. Various stimuli activate phosphoinositide-3-kinase (PI3K) through the receptor tyrosine kinases (RTKs). Upon activation, PI3K converts phosphatidylinositol 4,5-bisphosphate (PIP2) into phosphatidylinositol-3,4,5-triphosphate (PIP3). This reaction is reversed by PTEN. Phosphoinositide-dependent protein kinase 1 (PDK1) and AKT bind to PIP3 via their pleckstrin homology domains, which allows for the phosphorylation and activation of AKT by PDK1. In addition, the mammalian target of rapamycin complex 2 (mTORC2) modulates the activity of AKT by phosphorylating its hydrophobic motif. AKT phosphorylates tuberous sclerosis complex 2 (TSC2) at multiple sites, which results in its inhibition and consequent activation of Ras homolog enriched in brain (Rheb), which is a small GTPase that activates mTORC1. mTORC1 phosphorylates 4E-BPs leading to their dissociation from eIF4E. In addition to the PI3K/AKT pathway, the activity of mTORC1 is regulated by the serine/threonine kinase 11/LKB1/AMP-kinase (LKB1/AMPK) pathway, regulated in development and DNA damage response 1 (REDD1) and Rag GTPases in response to the changes in cellular energy balance, oxygen and amino acid availability, respectively. Ras and the MAPK pathways are activated by various stimuli through receptor tyrosine kinases (RTKs). In addition the MAPK pathway isactivatedthrough theGprotein–coupled receptors(GPCRs) and byproteinkinaseC (PKC;notshown).TheMAPK pathways encompass an initial GTPase-regulated kinase (MAPKKK), which activates an effector kinase (MAPK) via an intermediate kinase (MAPKK). In response to stimuli such as growth factors, hormones, and phorbol-esters, Ras GTPase stimulates Raf kinase (MAPKKK), which activates extracellular signal-regulated kinases 1 and 2 (ERK 1 and 2) via extracellular signal-regulated kinase activator kinases MEK1 and 2 (MAPKK). Cellular stresses, including osmotic shock, inflammatory cytokines, and UV light, activate p38 MAPKs via multiple mechanisms including Rac kinase (MAPKKK) and MKK3 and 6 (MAPKK). p38 MAPK and ERK activate the MAPK signal–integrating kinases 1 and 2 (MNK1/2), which phosphorylate eIF4E. Additional abbreviations are provided in the text.
Breast cancer cells secrete exosomes with specific capacity for cell-independent miRNA biogenesis, while normal cellderivedexosomes lack thisability. Exosomes derivedfrom cancer cellsand serum frompatients withbreast cancer contain the RISC loading complex proteins, Dicer, TRBP, and AGO2, which process pre-miRNAs into mature miRNAs. Cancer exosomes alter the transcriptome of target cells in a Dicer-dependent manner, which stimulate nontumorigenic epithelial cells to form tumors.This study identifies a mechanism whereby cancer cells impart an oncogenic field effect by manipulating the surrounding cells via exosomes. Presence of Dicer in exosomes may serve as biomarker for detection of cancer.
Dicers at RISC. The Mechanism of RNAi
Marcel Tijsterman and Ronald H.A. Plasterk
Cell, Apr 2014; 117:1–4
Figure 1. Model for RNA Silencing in Drosophila In an ordered biochemical pathway, miRNAs (left panel) and siRNAs (right panel) are processed from double-stranded precursor molecules by Dcr-1and Dcr-2, respectively, and stay attached to Dicer-containing complexes, which assemble into RISC. The degree of complementarity between the RNA silencing molecule (in red) and its cognate target determines the fate of the mRNA: blocked translation or immediate destruction.
Fig. 1. Domain organization of RNaseIII gene family. Three classes of RNaseIII genes are shown. The PAZ domain in Dm-Dicer-2 contains mutations in several residues required for RNA binding and may not be functional.
Fig. 2. Model for Dicer catalysis. The PAZ domain binds the 2 nt 30 overhang of a dsRNA terminus. The RNaseIII domains form a pseudo-dimer. Each domain hydrolyzes one strand of the substrate. The binding site of the dsRBD is not defined. The function of the helicase domain is not known.
Fig. 3. Biogenesis pathway of microRNAs. MicroRNA genes are transcribed by RNA polymerase II. The primary transcript is referred to as ‘‘primicroRNA’’. Drosha processing occurs in the nucleus. The resulting precursor, ‘‘pre-microRNA’’, is exported to the cytoplasm for Dicer processing. In a coordinated manner, the mature microRNA is transferred to RISC and unwound by a helicase. mRNA targets that duplex in the Slicer scissile site are cleaved and degraded, if the microRNA is loaded into an Ago2 RISC. Mismatched targets are translationally suppressed. All Ago family members are believed to function in translational suppression.
Fig. 4. Model for Slicer catalysis. The siRNA guide strand is bound at the 50 end by the PIWI domain and at the 30 end by the PAZ domain. The 50 phosphate is coordinated by conserved basic residues. mRNA targets are initially bound by the seed region of the siRNA and pairing is extended to the 30 end. The RNaseH fold hydrolyzes the target in a cation dependent manner. Slicer cleavage is measured from the 50 end of the siRNA. Product is released by an unknown mechanism and the enzyme recycles.
RNA interference (RNAi) is a biological process in which RNA molecules inhibit gene expression, typically by causing the destruction of specific mRNA molecules. Historically, it was known by other names, including co-suppression, post transcriptional gene silencing (PTGS), and quelling. Only after these apparently unrelated processes were fully understood did it become clear that they all described the RNAi phenomenon. Andrew Fire and Craig C. Mello shared the 2006 Nobel Prize in Physiology or Medicine for their work on RNA interference in the nematode worm Caenorhabditis elegans, which they published in 1998.
Two types of small ribonucleic acid (RNA) molecules – microRNA (miRNA) and small interfering RNA (siRNA) – are central to RNA interference. RNAs are the direct products of genes, and these small RNAs can bind to other specific messenger RNA (mRNA) molecules and either increase or decrease their activity, for example by preventing an mRNA from producing a protein. RNA interference has an important role in defending cells against parasitic nucleotide sequences – viruses and transposons. It also influences development.
The RNAi pathway is found in many eukaryotes, including animals, and is initiated by the enzyme Dicer, which cleaves long double-stranded RNA (dsRNA) molecules into short double stranded fragments of ~20 nucleotide siRNAs. Each siRNA is unwound into two single-stranded RNAs (ssRNAs), the passenger strand and the guide strand. The passenger strand is degraded and the guide strand is incorporated into the RNA-induced silencing complex (RISC). The most well-studied outcome is post-transcriptional gene silencing, which occurs when the guide strand pairs with a complementary sequence in a messenger RNA molecule and induces cleavage by Argonaute, the catalytic component of the RISC complex. In some organisms, this process spreads systemically, despite the initially limited molar concentrations of siRNA. http://en.wikipedia.org/wiki/RNA_interference
The enzyme dicer trims double stranded RNA, to form small interfering RNA or microRNA. These processed RNAs are incorporated into the RNA-induced silencing.
MiRNA biogenesis and function. (A) The canonical miRNA biogenesis pathway is Drosha- and Dicer-dependent. It begins with RNA Pol II-mediated transcription..
Dicer Promotes Transcription Termination
Dicer Promotes Transcription Termination at Sites of Replication Stress to Maintain Genome Stability
Cell Oct 2014; 159(3): 572–583 http://dx.doi.org/10.1016/j.cell.2014.09.031
18-13 miRNA- protein complex (a) Primary miRNA transcript Translation blocked Hydrogen bond (b) Generation and function of miRNAs Hairpin miRNA miRNA Dicer …
Fig. 1. Small RNA cloning procedure. Outline of the small RNA cloning procedure. RNA is dephosphorylated (step 1) for joining the 30 adapter by T4 RNA ligase 1 in the presence of ATP (step 2). The use of a chemically adenylated adapter and truncated form of T4 RNA ligase 2 (Rnl2) allows eliminating the dephosphorylation step (step 4). If the RNA was dephosphorylated, it is re-phosphorylated (step 3) prior to 50 adapter ligation with T4 RNA ligase 1 and ATP (step 5). After 50 adapter ligation, a standard reverse transcription is performed (step 6). Alternatively, after 30 adapter ligation, the RNA is used directly for reverse transcription simultaneously with 50 adaptor joining (step 7). In this case, the property of reverse transcriptase to add non-templated cytidine residues at the 50 end of synthesized DNA is used to facilitate template switch of the reverse transcriptase to the 30 guanosine residues of the 50 adapter (SMART technology, Invitrogen). Abbreviations: P and OH indicate phosphate and hydroxyl ends of the RNA; App indicates 50 chemically adenylated adapter; L, 30 blocking group; CIP, calf alkaline phosphatase and PNK, polynucleotide kinase.
Fig. 1. Schematic representation of gene silencing by an shRNA-expression vector. The shRNA is processed by Dicer. The processed siRNA enters the RNA-induced silencing complex (RISC), where it targets mRNA for degradation.
Fig. 2. Schematic representation of a transcription system for production of siRNA
Fig. 3. (A) Schematic representation of the proposed siRNA-expression system. Three or four C to U or A to G mutations are introduced into the sense strand. (B) Schematic representation of the discovery of a novel gene using an siRNA library.
Imperfect centered miRNA binding sites are common and can mediate repression of target mRNAs
Martin et al. Genome Biology 2014, 15:R51 http://genomebiology.com/2014/15/3/R51
Table 1 Number of inferred targets for each miRNA tested
miRNA
Probes
Transcripts
Genes
miR-10a
2,206
5,963
1,887
miR-10a-iso
1,648
1,468
4,211
miR-10b
1,588
3,940
1,365
miR-10b-iso
963
2,235
889
miR-17-5p
1,223
2,862
1,137
miR-17-5p-iso
1,656
3,731
1,461
miR-182
2,261
6,423
2,008
miR-182-iso
1,569
4,316
1,444
miR-23b
2,248
5,383
1,990
miR-27a
2,334
5,310
2,069
Probes: number of probes significantly enriched in pull-downs compared to controls (5% FDR). Transcripts: number of transcripts to which those probes map exactly. Genes: number of genes from which those transcripts originate
Figure 2 Biotin pull-downs identify bone fide miRNA targets. (A) Volcano plot showing the significance of the difference in expression between the miR-17-5p pull-down and the mock-transfected control, for all transcripts expressed in HEK293T cells. Both targets predicted by TargetScan or validated previously via luciferase assay were significantly enriched in the pull-down compared to the controls. (B) Results from luciferase assays on previously untested targets predicted using TargetScan and uncovered using the biotin pull-down. The plot indicates mean luciferase activity from either the empty plasmid or from pMIR containing a miRNA binding site in the 3′ UTR, relative to a negative control. Asterisks indicate a significant reduction in luciferase activity (one-sided t-test; P<0.05) and error bars the standard error of the mean over three replicates. (C-E) Targets identified through PAR-CLIP or through miRNA over-expression studies show greater enrichment in the pull-down. Cumulative distribution of log fold-change in the pull-down for transcripts identified as targets by the indicated miRNA over-expression study or not. Red, canonical transcripts found to be miR-17-5p targets in the indicated study (Table S5 in Additional file 1); black, all other canonical transcripts; p, one-sided P-value from Kolmogorov-Smirnov test for a difference in distributions. (F) To confirm that our results were dependent on RISC association, cells were transfected with either single or double-stranded synthetic miRNAs, then subjected to AGO2 immunoprecipitation. The biotin pull-down was performed in the AGO2-enriched and AGO2-depleted fractions. (G-H) Quantitative RT-PCR revealed that, with double-stranded (ds) miRNA (G), four out of five known targets were enriched relative to input mRNA (*P≤0.05, **P<0.01, ***P<0.001) in the AGO2-enriched but not in the AGO2-depleted fractions, but this enrichment was not seen for the cells transfected with a single-stranded (ss) miRNA (H). The numbers on the x-axis correspond to those in Figure 2F. Error bars represent the standard error of mean (sem).
Figure 5 IsomiRs and canonical miRNAs target many of the same transcripts.
Figure 1. Features of hammerhead ribozymes. A generic diagram of a hammerhead ribozyme bound to its target substrate: NUH is the cleavage triplet on target sequence, stems I and III are sites of the specific interactions between ribozyme and target, stem II is the structural element connecting separate parts of the catalytic core. Arrows represent the cleavage site, numbering system according to Hertel et al. [60].
Figure 1 Schematic (A) and ribbon (B) diagrams depicting the crystal structure of the full-length hammerhead ribozyme. The sequence and secondary structure
TABLE 1 Typical examples of successful applications of hammerhead ribozymes. Most of the data are derived from [10] and [11], the others are expressly specified.
Growth factors, receptors, transduction elements
Oncogenes, protoncogenes, fusion genes
Apoptosis, survival factors, drug resistance
Transcription factors
Extracellular matrix, matrix modulating factors
Circulating factors
Viral genome, viral genes
Figure 2.Target–ribozyme interactions. (a) As cheme of ribozyme binding to full substrate. The calculated energy of this binding ensures the formation of a stable complex. At the denaturating temperature, Tm, will allow this complex to survive to biological conditions. Conversely, after cleavage, binding energies calculated on single, (b) and (c), ribozyme arms are very low and no longer stable. These properties will ensure both the efficient release of cleavage fragments and the prevention of binding to unrelated targets. RNAs complementary to one binding arm only will not be bound or cleaved by the hammerhead catalytic sequence.
Figure 3. ‘Chemical omics’ approach. According to this target discovery strategy: (1) a first round of ‘omic’ study (proteomic, genomic, metabolomic, …) will enable the discovery of a set of (2) putative markers. A series of hammerhead ribozymes will then be prepared in order to target each marker. (4) A second ‘omic’ study round will be performed on (3) knocked down samples obtained after ribozymes administration. (5) A new series of markers will then be produced. An expanding analytical process of this type may be further repeated. Finally, a robust bioinformatic algorithm will make it possible to connect the different markers and draw new hypothetical links and pathways.
miRNA
ADAR Enzyme and miRNA Story Sara Tomaselli, Barbara Bonamassa, Anna Alisi, et al.
Int. J. Mol. Sci. 2013, 14, 22796-22816; http://dx.doi.org:/10.3390/ijms141122796
Adenosine deaminase acting on RNA (ADAR) enzymes convert adenosine (A) to inosine (I) in double-stranded (ds) RNAs. Since Inosine is read as Guanosine, the biological consequence of ADAR enzyme activity is an A/G conversion within RNA molecules. A-to-I editing events can occur on both coding and non-coding RNAs, including microRNAs (miRNAs), which are small regulatory RNAs of ~20–23 nucleotides that regulate several cell processes by annealing to target mRNAs and inhibiting their translation. Both miRNA precursors and mature miRNAs undergo A-to-I RNA editing, affecting the miRNA maturation process and activity. ADARs can also edit 3′ UTR of mRNAs, further increasing the interplay between mRNA targets and miRNAs. In this review, we provide a general overview of the ADAR enzymes and their mechanisms of action as well as miRNA processing and function. We then review the more recent findings about the impact of ADAR-mediated activity on the miRNA pathway in terms of biogenesis, target recognition, and gene expression regulation.
Figure 1. Structure of ADAR family proteins: ADAR1, ADAR2, and ADAR3. The ADAR enzymes contain a C-terminal conserved catalytic deaminase domain (DM), two or three dsRBDs in the N-terminal portion. ADAR1 full-length protein also contains a N-terminal Zα domain with a nuclear export signal (NES) and a Zβ domain, while ADAR3 has a R-domain. A nuclear localization signal is also indicated.
Comprehensive modeling of microRNA targets predicts functional non-conserved and non-canonical sites
Doron Betel, Anjali Koppal, Phaedra Agius, Chris Sander, Christina Leslie
Genome Biology 2010, 11:R90 http://genomebiology.com/2010/11/8/R90
microRNAs are a class of small regulatory RNAs that are involved in post-transcriptional gene silencing. These small (approximately 22 nucleotide) single-strand RNAs guide a gene silencing complex to an mRNA by complementary base pairing, mostly at the 3′ untranslated region (3′ UTR). The association of the RNAinduced silencing complex (RISC) to the conjugate mRNA results in silencing the gene either by translational repression or by degradation of the mRNA. Reliable microRNA target prediction is an important and still unsolved computational challenge, hampered both by insufficient knowledge of microRNA biology as well as the limited number of experimentally validated targets.
mirSVR is a new machine learning method for ranking microRNA target sites by a down-regulation score. The algorithm trains a regression model on sequence and contextual features extracted from miRanda-predicted target sites. In a large-scale evaluation, miRanda-mirSVR is competitive with other target prediction methods in identifying target genes and predicting the extent of their downregulation at the mRNA or protein levels. Importantly, the method identifies a significant number of experimentally determined non-canonical and non-conserved sites. Human RISC – MicroRNA Biogenesis and Posttranscriptional Gene Silencing
Cell 2005; 123:631-640 http://dx.doi.org:/10.1016/j.cell.2005.10.022 Development of microRNA therapeutics
Eva van Rooij & Sakari Kauppinen
EMBO Mol Med (2014) 6: 851–864 http://dx.doi.org:/10.15252/emmm.20110089
MicroRNAs (miRNAs) play key regulatory roles in diverse biological processes and are frequently dysregulated in human diseases. Thus, miRNAs have emerged as a class of promising targets for therapeutic intervention. Here, we describe the current strategies for therapeutic modulation of miRNAs and provide an update on the development of miRNA-based therapeutics for the treatment of cancer, cardiovascular disease and hepatitis C virus (HCV) infection.
Figure 1. miRNA biogenesis and modulation of miRNA activity by miRNA mimics and antimiR oligonucleotides. MiRNA genes are transcribed by RNA polymerase II from intergenic, intronic or polycistronic loci to long primary miRNA transcripts (pri-miRNAs) and processed in the nucleus by the Drosha–DGCR8 complex to approximately 70 nt pre-miRNA hairpin structures. The most common alternative miRNA biogenesis pathway involves short intronic hairpins, termed mirtrons, that are spliced and debranched to form pre-miRNA hairpins. Pre-miRNAs are exported into the cytoplasm and then cleaved by the Dicer–TRBP complex to imperfect miRNA: miRNA* duplexes about 22 nucleotides in length. In the cytoplasm, miRNA duplexes are incorporated into Argonaute-containing miRNA induced silencing complex (miRISC), followed by unwinding of the duplex and retention of the mature miRNA strand in miRISC, while the complementary strand is released and degraded. The mature miRNA functions as a guide molecule for miRISC by directing it to partially complementary sites in the target mRNAs, resulting in translational repression and/or mRNA degradation. Currently, two strategies are employed to modulate miRNA activity: restoring the function of a miRNA using double-stranded miRNA mimics, and inhibition of miRNA function using single-stranded anti-miR oligonucleotides.
Figure 2. Design of chemically modified miRNA modulators. (A) Structures of chemical modifications used in miRNA modulators. A number of different sugar modifications are used to increase the duplex melting temperature (Tm) of anti-miR oligonucleotides. The20-O-methyl(20-O-Me), 20-O-methoxyethyl(20-MOE )and 20-fluoro(20-F) nucleotides are modified at the 20 position of the sugar moiety, whereas locked nucleic acid (LNA) is a bicyclic RNA analogue in which the ribose is locked in a C30-endo conformation by introduction of a 20-O,40-C methylene bridge. To increase nuclease resistance and enhance the pharmacokinetic properties, most anti-miR oligonucleotides harbor phosphorothioate (PS) backbone linkages, in which sulfur replaces one of the non-bridging oxygen atoms in the phosphate group. In morpholino oligomers, a six-membered morpholine ring replaces the sugar moiety. Morpholinos are uncharged and exhibit a slight increase in binding affinity to their cognate miRNAs. PNA oligomers are uncharged oligonucleotide analogues, in which the sugar–phosphate backbone has been replaced by a peptide-like backbone consisting of N-(2-aminoethyl)-glycine units. (B) An example of a synthetic double-stranded miRNA mimic described in this review. One way to therapeutically mimic a miRNA is by using synthetic RNA duplexes that harbor chemical modifications for improved stability and cellular uptake. In such constructs, the antisense (guide) strand is identical to the miRNA of interest, while the sense (passenger) strand is modified and can be linked to a molecule, such as cholesterol, for enhanced cellular uptake. The sense strand contains chemical modifications to prevent mi-RISC loading. Several mismatches can be introduced to prevent this strand from functioning as an anti-miR, while it is further left unmodified to ensure rapid degradation.The20-F modification helps to protect the antisense strand against exonucleases, hence making the guide strand more stable, while it does not interfere with mi-RISC loading. (C) Design of chemically modified anti-miR oligonucleotides described in this review. Antagomirs are30 cholesterol-conjugated,20-O-Me oligonucleotides fully complementary to the mature miRNA sequence with several PS moieties to increase their in vivo stability. The use of unconjugated 20-F/MOE-, 20-MOE- or LNA-modified anti-miR oligonucleotides harboring a complete PS backbone represents another approach for inhibition of miRNA function in vivo. The high duplex melting temperature of LNA-modified oligonucleotides allows efficient miRNA inhibition using truncated, high-affinity 15–16-nucleotide LNA/DNA anti-miR oligonucleotides targeting the 50 region of the mature miRNA. Furthermore, the high binding affinity of fully LNA-modified 8-mer PS oligonucleotides, designated as tiny LNAs, facilitates simultaneous inhibition of entire miRNA seed families by targeting the shared seed sequence.
Human MicroRNA Targets
Bino John, Anton J. Enright, Alexei Aravin, Thomas Tuschl,.., Debora S. Mark
PLoS Biol 2004; 2(11): e363 http://www.plosbiology.org
More than ten years after the discovery of the first miRNA gene, lin-4 (Chalfie et al. 1981; Lee et al. 1993), we know that miRNA genes constitute about 1%–2% of the known genes in eukaryotes. Investigation of miRNA expression combined with genetic and molecular studies in Caenorhabditis elegans, Drosophila melanogaster, and Arabidopsis thaliana have identified the biological functions of several miRNAs (recent review, Bartel 2004). In C. elegans, lin-4 and let-7 were first discovered as key regulators of developmental timing in early larval developmental transitions (Ambros 2000; Abrahante et al. 2003; Lin et al. 2003; Vella et al. 2004). More recently lsy-6 was shown to determine the left–right asymmetry of chemoreceptor expression (Johnston and Hobert 2003). In D. melanogaster, miR-14 has a role in apoptosis and fat metabolism (Xu et al. 2003) and the bantam miRNA targets the gene hid involved in apoptosis and growth control (Brennecke et al. 2003).
MicroRNAs (miRNAs) interact with target mRNAs at specific sites to induce cleavage of the message or inhibit translation. The specific function of most mammalian miRNAs is unknown. We have predicted target sites on the 39 untranslated regions of human gene transcripts for all currently known 218 mammalian miRNAs to facilitate focused experiments. We report about 2,000 human genes with miRNA target sites conserved in mammals and about 250 human genes conserved as targets between mammals and fish. The prediction algorithm optimizes sequence complementarity using position-specific rules and relies on strict requirements of interspecies conservation. Experimental support for the validity of the method comes from known targets and from strong enrichment of predicted targets in mRNAs associated with the fragile X mental retardation protein in mammals. This is consistent with the hypothesis that miRNAs act as sequence-specific adaptors in the interaction of ribonuclear particles with translationally regulated messages. Overrepresented groups of targets include mRNAs coding for transcription factors, components of the miRNA machinery, and other proteins involved in translational regulation, as well as components of the ubiquitin machinery, representing novel feedback loops in gene regulation. Detailed information about target genes, target processes, and open-source software for target prediction (miRanda) is available at http://www.microrna.org. Our analysis suggests that miRNA genes, which are about 1% of all human genes, regulate protein production for 10% or more of all human genes.
Figure 1. Target Prediction Pipeline for miRNA Targets in Vertebrates The mammalian (human, mouse, and rat) and fish (zebra and fugu) 39 UTRs were first scanned for miRNA target sites using position specific rules of sequence complementarity. Next, aligned UTRs of orthologous genes were used to check for conservation of miRNA– target relationships (‘‘target conservation’’) between mammalian genomes and, separately, between fish genomes. The main results (bottom) are the conserved mammalian and conserved fish targets, for each miRNA,as well as a smaller set of super-conserved vertebrate targets. http://dx.doi.org:/10.1371/journal.pbio.0020363.g00
Figure 2. Distribution of Transcripts with Cooperativity of Target Sites and Estimated Number of False Positives Each bar reflects the number of human transcripts with a given number of target sites on their UTR. Estimated rate of false positives(e.g., 39%for2 targets) is given by the number of target sites predicted using shuffled miRNAs processed in a way identical to real miRNAs, including the use of interspecies conservation filter. http://dx.doi.org:/10.1371/journal.pbio.0020363.g002
Conserved Seed Pairing, Often improved an-Flanked by Adenosines, Indicates Thousands of Human Genes are MicroRNA Targets Cell, Jan 2005; 120: 15–20 http://dx.doi.org:/10.1016/j.cell.2004.12.035
Integrated analysis of microRNA and mRNA expression. adding biological significance to microRNA target predictions.
Maarten van Iterson, Sander Bervoets, Emile J. de Meijer, et al.
Nucleic Acids Research, 2013; 41(15), e146 http://dx.doi.org:/10.1093/nar/gkt525
Current microRNA target predictions are based on sequence information and empirically derived rules but do not make use of the expression of microRNAs and their targets. This study aimed to improve microRNA target predictions in a given biological context, using in silico predictions, microRNA and mRNA expression. We used target prediction tools to produce lists of predicted targets and used a gene set test designed to detect consistent effects of microRNAs on the joint expression of multiple targets. In a single test, association between microRNA expression and target gene set expression as well as the contribution of the individual target genes on the association are determined. The strongest negatively associated mRNAs as measured by the test were prioritized. We applied our integration method to a well-defined muscle differentiation model. Validation of our predictions in C2C12 cells confirmed predicted targets of known as well as novel muscle-related microRNAs. We further studied associations between microRNA–mRNA pairs in human prostate cancer, finding some pairs that have been recently experimentally validated by others. Using the same study, we showed the advantages of the global test over Pearson correlation and lasso. We conclude that our integrated approach successfully identifies regulated microRNAs and their targets.
Fig. 1. A ‘‘Domain-centric’’ view of RNAi. (A) The conserved pathways of RNA silencing. The domain structure of each protein in (hypothetical) interaction with its RNA is shown. For clarity, the second column lists domains in order N- to C-terminal. Figures are not to scale. In brief, Drosha, an RNase III enzyme, and its obligate binding partner, Pasha recognize pri-mRNA loops, and cut these into 70 nt hairpin pre-miRNAs. Dicer utilizes a PAZ domain to sense the 30 2-nt overhang created, and further processes these, and dsRNAs into miRNAs and siRNAs. Argonaute binds the 50 end of guide RNAs via its PIWI domain, and the 30 end via a PAZ domain, yielding RISCs that effect RNA silencing through several mechanisms. A Viral protein, VP19 can suppress RNA silencing by sequestering siRNAs. (B) A summary of known siRNA structural biology. Listed by domain are solved structures, their protein/organism of origin, and ligands, where applicable. Also shown are PDB codes.
Fig. 2. Novel modes of RNA recognition. (A) A typical dsRBD: Xenopus binding protein A (1DI2). A RNA helix is modeled pink, and the protein is rendered in transparent electrostatic contours (blue is basic, red acidic). Note the interaction of helices along the major groove, and the position of helix 1. A second dsRBD protein is visible, in the lower right. (B) A dsRBD, Saccharomyces Rnt1P (1T4L), recognizes hairpin loops. A novel third helix (top) pushes helix one into the loop of a hairpin RNA. (C) 30-OH recognition by PAZ. Human Eif2c1 (1SI3) bound to RNA (pink) is shown. PAZ is green, with transparent electrostatic surface plot. The OB-fold (nucleotide binding fold) and the insertion domain are labeled. Note the glove-and-thumb like cleft they form, that the 30-OH is inserted into. A basic groove (blue) the RNA binds along outside the cleft is visible. (D) A close-up view of PAZ, as in C (surface not-transparent, slightly rotated). See white arrows for orientation, and location of 30-OH binding site. RNA is shown red in sticks. The terminal –OH is barely visible, buried in a cleft. It and the carbon it bonds have been colored yellow for clarity. (E) The PIWI domain (2BGG). Note the insertion of the 50P red (labeled) into the binding site. Its complimentary strand (pink) is not annealed to it, and the 30 overhang and first complimentary bases sit on the protein surface. (F) An enlarged view of (E), with protein in slate and RNA modeled as red sticks. The coordinated magnesium is a grey sphere, which is coordinated by the terminal carboxylate of the protein, protein side chains, and RNA phosphate oxygens. The 50 base stacks against a conserved Tyr. Several other sidechain contacts are shown.
Fig. 3. Argonaute/RISC. (A) P. furiosus Argonaute (PDB 1Z26). A color-guided key to the domains is presented. PAZ sits over the PIWI/N/MID bowl and active site. The liganding atoms for the catalytic metal are depicted as yellow balls for clarity. The tungstate binding site (50P surrogate) is shown as tan spheres. (B) A guide strand channel. Looking down from the PAZ domain towards the active site, Z-sections are clipped off. Colors of domains are as in the key in (A). Wrapping down along a basic cleft from the PAZ 30OH binding site (approximate position labeled), a RNA binding groove passes the active site (yellow), and runs down to the 50P binding site (tan balls). A second cleft running perpendicular to this one at its entry may accommodate target strand RNA. For more detail, and models of siRNA placed into the grooves, see [27,29].
Fig. 4. VP19 sequestration of siRNA. (A) CIRV VP19 (1RPU, RNA removed). Two monomers (blue and cyan) form an 8 strand, concave b-sheet with bracketing helices at the ends. (B) Tombus viral VP19 bound to siRNA (1 monomer shown). RNA strands are modeled as sticks, with one strand pink and one red. The bracketing helix places two tryptophans in position to stack over the terminal RNA bases. On the b-sheet surface, and Arg and a Lys interact with the phosphate backbone, and at the center of the RNA binding surface, a number of Ser and Thr mediate an extensive hydrogen bond network. Both the Trp brackets and RNA binding by an extended b-sheet are unique.
Figure 1. Noncoding RNAs Function in Diverse Contexts Noncoding RNAs function in all domains of life, regulating gene expression from transcription to splicing to translation and contributing to genome organization and stability. Self-splicing RNAs, ribosomes, and riboswitches function in both eukaryotes and bacteria. Archaea (not shown) also utilize ncRNA systems including ribosomes, riboswitches, snoRNPs, and CRISPR. Orange strands, ncRNA performing the action indicated; red strands, the RNA acted upon by the ncRNA. Blue strands, DNA. Triangle, small-molecule metabolite bound by a riboswitch. Ovals indicate protein components of an RNP, such as the spliceosome (white oval), ribosome (two purple subunits), or other RNPs (yellow ovals). Because of the importance of RNA structure in these ncRNAs, some structures are shown but they are not meant to be realistic.
miRNAs and cancer targeting
Table 1 of targets
miRNA
Cancer type
reference
NA
GI cancer
Current status of miRNA-targeting therapeutics and preclinical studies against gastroenterological carcinoma
NA
Renal cell
Differential expression profiling of microRNAs and their potential involvement in renal cell carcinoma pathogenesis
NA
urothelial
cancer
A microRNA expression ratio defining the invasive phenotype in bladder tumors
miR-31
breast
A Pleiotropically Acting MicroRNA, miR-31, inhibits breast cancer growth
miR-512-3p
NSCLC
Inhibition of RAC1-GEF DOCK3 by miR-512-3p contributes to suppression of metastasis in non-small cell lung cancer
miR-495
gastric
Methylation-associated silencing of miR-495 inhibit the migration and invasion of human gastric cancer cells
microRNA-218
prostate
microRNA-218 inhibits prostate cancer cell growth and promotes apoptosis by repressing TPD52 expression
MicroRNA-373
cervical cancer
MicroRNA-373 functions as an oncogene and targets YOD1 gene in cervical cancer
miR-92a. upregulated in cervical cancer & promotes cell proliferation and invasion by targeting FBXW7
MiR-153
NSCLC
MiR-153 inhibits migration and invasion of human non-small-cell lung cancer by targeting ADAM19
miR-203
melanoma
miR-203 inhibits melanoma invasive and proliferative abilities by targeting the polycomb group gene BMI1
miR-204-5p
Papillary thyroid
miR-204-5p suppresses cell proliferation by inhibiting IGFBP5 in papillary thyroid carcinoma
miR-342-3p
Hepato-cellular
miR-342-3p affects hepatocellular carcinoma cell proliferation via regulating NF-κB pathway
miR-1271
NSCLC
miR-1271 promotes non-small-cell lung cancer cell proliferation and invasion via targeting HOXA5
miR-203
pancreas
Pancreatic cancer derived exosomes regulate the expression of TLR4 in dendritic cells via miR-203
miR-203
metastatic SCC
Rewiring of an Epithelial Differentiation Factor, miR-203, to Inhibit Human SCC Metastasis
miR-204
RCC
TRPM3 and miR-204 Establish a Regulatory Circuit that Controls Oncogenic Autophagy in Clear Cell Renal Cell Carcinoma
NA
urologic
MicroRNAs and cancer. Current and future perspectives in urologic oncology
NA
RCC
MicroRNAs and their target gene networks in renal cell carcinoma
NA
osteoSA
MicroRNAs in osteosarcoma
NA
urologic
MicroRNA in Prostate, Bladder, and Kidney Cancer
NA
urologic
Micro-RNA profiling in kidney and bladder cancers
Current status of miRNA-targeting therapeutics and preclinical studies against gastroenterological carcinoma
Shibata et al. Molecular and Cellular Therapies 2013, 1:5 http://www.molcelltherapies.com/content/1/1/5
Differential expression profiling of microRNAs and their potential involvement in renal cell carcinoma pathogenesis
Clinical Biochemistry 43 (2010) 150–158 http://dx.doi.org:/10.1016/j.clinbiochem.2009.07.020
A microRNA expression ratio defining the invasive phenotype in bladder tumors
Urologic Oncology: Seminars and Original Investigations 28 (2010) 39–48 http://dx.doi.org:/10.1016/j.urolonc.2008.06.006
Inhibition of RAC1-GEF DOCK3 by miR-512-3p contributes to suppression of metastasis in non-small cell lung cancer
Intl JBiochem & Cell Biol 2015; 61:103-114 http://dx.doi.org/10.1016/j.biocel.2015.02.005
Methylation-associated silencing of miR-495 inhibit the migration and invasion of human gastric cancer cells by directly targeting PRL-3
Biochem Biochem Res Commun 2014; 456:344-350 http://dx.doi.org/10.1016/j.bbrc.2014.11.083
microRNA-218 inhibits prostate cancer cell growth and promotes apoptosis by repressing TPD52 expression
Biochem Biophys Res Commun 2015; 456:804-809 http://dx.doi.org/10.1016/j.bbrc.2014.12.026
Rewiring of an Epithelial Differentiation Factor, miR-203, to Inhibit Human Squamous Cell Carcinoma Metastasis
Cell Reports 2014; 9:104-117 http://dx.doi.org/10.1016/j.celrep.2014.08.062
TRPM3 and miR-204 Establish a Regulatory Circuit that Controls Oncogenic Autophagy in Clear Cell Renal Cell Carcinoma
Cancer Cell Nov 10, 2014; 26: 738–753 http://dx.doi.org/10.1016/j.ccell.2014.09.015
MicroRNAs and cancer. Current and future perspectives in urologic oncology
Urologic Oncology: Seminars and Original Investigations 2010; 28:4–13 http://dx.doi.org:/10.1016/j.urolonc.2008.10.021
miRNA and mRNA cancer signatures determined by analysis of expression levels in large cohorts of patients
| PNAS | Nov 19, 2013; 110(47): 19160–19165 http://www.pnas.org/cgi/doi/10.1073/pnas.1316991110The study of mRNA and microRNA (miRNA) expression profiles of cells and tissue has become a major tool for therapeutic development. The results of such experiments are expected to change the methods used in the diagnosis and prognosis of disease. We introduce surprisal analysis, an information-theoretic approach grounded in thermodynamics, to compactly transform the information acquired from microarray studies into applicable knowledge about the cancer phenotypic state. The analysis of mRNA and miRNA expression data from ovarian serous carcinoma, prostate adenocarcinoma, breast invasive carcinoma, and lung adenocarcinoma cancer patients and organ specific control patients identifies cancer-specific signatures. We experimentally examine these signatures and their respective networks as possible therapeutic targets for cancer in single cell experiments.
RNA editing is vital to provide the RNA and protein complexity to regulate the gene expression. Correct RNA editing maintains the cell function and organism development. Imbalance of the RNA editing machinery may lead to diseases and cancers. Recently,RNA editing has been recognized as a target for drug discovery although few studies targeting RNA editing for disease and cancer therapy were reported in the field of natural products. Therefore, RNA editing may be a potential target for therapeutic natural products
Aberrant microRNA (miRNA) expression is implicated in tumorigenesis. The underlying mechanisms are unclear because the regulations of each miRNA on potentially hundreds of mRNAs are sample specific.
We describe a novel approach to infer Probabilistic Mi RNA–mRNA Interaction Signature (‘ProMISe’) from a single pair of miRNA–mRNA expression profile. Our model considers mRNA and miRNA competition as a probabilistic function of the expressed seeds (matches). To demonstrate ProMISe, we extensively exploited The Cancer Genome Atlas data. As a target predictor, ProMISe identifies more confidence/validated targets than other methods. Importantly, ProMISe confers higher cancer diagnostic power than using expression profiles alone.
Gene set enrichment analysis on averaged ProMISe uniquely revealed respective target enrichments of oncomirs miR-21 and 145 in glioblastoma and ovarian cancers. Moreover, comparing matched breast (BRCA) and thyroid (THCA) tumor/normal samples uncovered thousands of tumor-related interactions. For example, ProMISe– BRCA network involves miR-155/183/21, which exhibits higher ProMISe coupled with coherently higher miRNA expression and lower target expression; oncomirs miR-221/222 in the ProMISe–THCA network engage with many downregulated target genes. Together, our probabilistic approach of integrating expression and sequence scores establishes a functional link between the aberrant miRNA and mRNA expression, which was previously under-appreciated due to the methodological differences.
The following chapter of the metabolism/transcriptomics/proteomics/metabolomics series deals with the subcellular structure of the cell. This would have to include the cytoskeleton, which has a key role in substrate and ion efflux and influx, and in cell movement mediated by tubulins. It has been extensively covered already. Much of the contributions here are concerned with the mitochondrion, which is also covered in metabolic pathways. The ribosome is the organelle that we have discussed with respect to the transcription and translation of the genetic code through mRNA and tRNA, and the therapeutic implications of SiRNA as well as the chromatin regulation of lncRNA.
We have also encountered the mitochondrion and the lysosome in the discussion of apoptosis and autophagy, maintaining the balance between cell regeneration and cell death.
Found within the cytoplasm of both plant and animal cells, the Golgi is composed of stacks of membrane-bound structures known as cisternae (singular: cisterna). An individual stack is sometimes called a dictyosome (from Greek dictyon: net + soma: body), especially in plant cells. A mammalian cell typically contains 40 to 100 stacks. Between four and eight cisternae are usually present in a stack; however, in some protists as many as sixty have been observed. Each cisterna comprises a flat, membrane-enclosed disc that includes special Golgi enzymes which modify or help to modify cargo proteins that travel through it.
The cisternae stack has four functional regions: the cis-Golgi network, medial-Golgi, endo-Golgi, and trans-Golgi network. Vesicles from the endoplasmic reticulum (via the vesicular-tubular clusters) fuse with the network and subsequently progress through the stack to the trans-Golgi network, where they are packaged and sent to their destination.
The Golgi apparatus is integral in modifying, sorting, and packaging these macromolecules for cell secretion (exocytosis) or use within the cell. It primarily modifies proteins delivered from the rough endoplasmic reticulum, but is also involved in the transport of lipids around the cell, and the creation of lysosomes. Enzymes within the cisternae are able to modify the proteins by addition of carbohydrates (glycosylation) and phosphates (phosphorylation). In order to do so, the Golgi imports substances such as nucleotide sugars from the cytosol. These modifications may also form a signal sequence which determines the final destination of the protein. For example, the Golgi apparatus adds a mannose-6-phosphate label to proteins destined for lysosomes.
The Golgi plays an important role in the synthesis of proteoglycans, which are molecules present in the extracellular matrix of animals. It is also a major site of carbohydrate synthesis. This includes the production of glycosaminoglycans (GAGs), long unbranched polysaccharides which the Golgi then attaches to a protein synthesised in the endoplasmic reticulum to form proteoglycans. Enzymes in the Golgi polymerize several of these GAGs via a xylose link onto the core protein. Another task of the Golgi involves the sulfation of certain molecules passing through its lumen via sulfotranferases that gain their sulfur molecule from a donor called PAPS. This process occurs on the GAGs of proteoglycans as well as on the core protein. Sulfation is generally performed in the trans-Golgi network. The level of sulfation is very important to the proteoglycans’ signalling abilities, as well as giving the proteoglycan its overall negative charge.
The phosphorylation of molecules requires that ATP is imported into the lumen of the Golgi and utilised by resident kinases such as casein kinase 1 and casein kinase 2. One molecule that is phosphorylated in the Golgi is apolipoprotein, which forms a molecule known as VLDL that is found in plasma. It is thought that the phosphorylation of these molecules labels them for secretion into the blood.
The Golgi has a putative role in apoptosis, with several Bcl-2 family members localised there, as well as to the mitochondria. A newly characterized protein, GAAP (Golgi anti-apoptotic protein), almost exclusively resides in the Golgi and protects cells from apoptosis by an as-yet undefined mechanism.
The vesicles that leave the rough endoplasmic reticulum are transported to the cis face of the Golgi apparatus, where they fuse with the Golgi membrane and empty their contents into the lumen. Once inside the lumen, the molecules are modified, then sorted for transport to their next destinations. The Golgi apparatus tends to be larger and more numerous in cells that synthesize and secrete large amounts of substances; for example, the plasma B cells and the antibody-secreting cells of the immune system have prominent Golgi complexes.
Those proteins destined for areas of the cell other than either the endoplasmic reticulum or Golgi apparatus are moved towards the trans face, to a complex network of membranes and associated vesicles known as the trans-Golgi network (TGN). This area of the Golgi is the point at which proteins are sorted and shipped to their intended destinations by their placement into one of at least three different types of vesicles, depending upon the molecular marker they carry.
Nucleus_ER_golgi
Diagram of secretory process from endoplasmic reticulum (orange) to Golgi apparatus (pink). 1. Nuclear membrane; 2. Nuclear pore; 3. Rough endoplasmic reticulum (RER); 4. Smooth endoplasmic reticulum (SER); 5. Ribosome attached to RER; 6. Macromolecules; 7. Transport vesicles; 8. Golgi apparatus; 9. Cis face of Golgi apparatus; 10. Trans face of Golgi apparatus; 11. Cisternae of the Golgi Apparatus
Exocytotic vesicles
After packaging, the vesicles bud off and immediately move towards the plasma membrane, where they fuse and release the contents into the extracellular space in a process known as constitutive secretion. (Antibody release by activated plasma B cells)
Secretory vesicles
After packaging, the vesicles bud off and are stored in the cell until a signal is given for their release. When the appropriate signal is received they move towards the membrane and fuse to release their contents. This process is known as regulated secretion. (Neurotransmitter release from neurons)
Lysosomal vesicles
Vesicle contains proteins and ribosomes destined for the lysosome, an organelle of degradation containing many acid hydrolases, or to lysosome-like storage organelles. These proteins include both digestive enzymes and membrane proteins. The vesicle first fuses with the late endosome, and the contents are then transferred to the lysosome via unknown mechanisms.
Enzymes of the lysosomes are synthesised in the rough endoplasmic reticulum. The enzymes are released from Golgi apparatus in small vesicles which ultimately fuse with acidic vesicles called endosomes, thus becoming full lysosomes. In the process the enzymes are specifically tagged with mannose 6-phosphate to differentiate them from other enzymes. Lysosomes are interlinked with three intracellular processes namely phagocytosis, endocytosis and autophagy. Extracellular materials such as microorganisms taken up by phagocytosis, macromolecules by endocytosis, and unwanted cell organelles are fused with lysosomes in which they are broken down to their basic molecules. Thus lysosomes are the recycling units of a cell.
The endoplasmic reticulum (ER) is a type of organelle in the cells of eukaryotic organisms that forms an interconnected network of flattened, membrane-enclosed sacs or tubes known as cisternae. The membranes of the ER are continuous with the outer membrane of the nuclear envelope. Endoplasmic reticulum occurs in most types of eukaryotic cells, including the most primitive Giardia, but is absent from red blood cells and spermatozoa. There are two types of endoplasmic reticulum, rough endoplasmic reticulum (RER) and smooth endoplasmic reticulum (SER). The outer (cytosolic) face of the rough endoplasmic reticulum is studded with ribosomes that are the sites of protein synthesis. The rough endoplasmic reticulum is especially prominent in cells such as hepatocytes where active smooth endoplasmic reticulum lacks ribosomes and functions in lipid metabolism, carbohydrate metabolism, and detoxificationand is especially abundant in mammalian liver and gonad cells. The lacey membranes of the endoplasmic reticulum were first seen in 1945 by Keith R. Porter, Albert Claude, Brody Meskers and Ernest F. Fullam, using electron microscopy.
The Effects of Actomyosin Tension on Nuclear Pore Transport
Rachel Sammons
Undergraduate Honors Thesis
Spring 2011
The cytoskeleton maintains cellular structure and tension through a force balance with the nucleus, where actomyosin is anchored to the nuclear envelope by nesprin integral proteins. It is hypothesized that the presence or absence of this tension alters the transport of molecules through the nuclear pore complex. We tested the effects of cytoskeletal tension on nuclear transport in human umbilical vein endothelial cells (HUVECs) by performing fluorescence recovery after photo-bleaching (FRAP) experiments on the nuclei to monitor the passive transport of the molecules through nuclear pores.
Using myosin inhibitors, as well as siRNA transfections to reduce the expression of nesprin-1, we altered the nucleo-cytoskeletal force balance and monitored the effect of each on the nuclear pore. FRAP data was fit to a diffusion model by assuming pseudo-steady state inside the nuclear pore, perfect mixing within both the cytoplasm and the nucleus, and no intracellular binding of the fluorescent probes. From these results and a model from the current literature relating diffusion rate constants to nuclear pore radii, we were able to determine that changing cytoskeletal tension alters nuclear pore size and passive transport.
nuclear pores in nuclear envelope
image of nuclear pores on the external surface of the nuclear envelope
nuclear envelope and FG filaments
nuclear envelope and FG filaments
Figure 1: The structure and location of the nuclear pore, shown by (a) AFM image of nuclear pores on the external surface of the nuclear envelope[5] and (b) computer model cross-section. The nuclear envelope is shown in cyan, and FG filaments in blue can be seen throughout the channel. The nuclear basket extends into the nucleoplasm.
Fusion-pore expansion during syncytium formation is restricted by an actin network
A Chen, E Leikina, K Melikov, B Podbilewicz, MM. Kozlov and LV. Chernomordik,*
J Cell Sci 1 Nov 2008;121: 3619-3628. http://dx.doi.org:/10.1242/jcs.032169
Effects of actin-modifying agents indicate that the actin cortex slows down pore expansion. We propose that the growth of the strongly bent fusion-pore rim is restricted by a dynamic resistance of the actin network and driven by membrane-bending proteins that are involved in the generation of highly curved intracellular membrane compartments.
Summary of Transcription, Translation ond Transcription Factors
Author and Curator: Larry H. Bernstein, MD, FCAP
Article ID #158: Summary of Transcription, Translation and Transcription Factors. Published on 11/5/2014
WordCloud Image Produced by Adam Tubman
Proteins are integral to the composition of the cytoskeleton, and also to the extracellular matrix. Many proteins are actually enzymes, carrying out the transformation of some substrate, a derivative of the food we ingest. They have a catalytic site, and they function with a cofactor – either a multivalent metal or a nucleotide. Proteins also are critically involved in the regulation of cell metabolism, and they are involved in translation of the DNA code, as they make up transcription factors (TFs). There are 20 essential amino acids that go into protein synthesis that are derived from animal or plant protein. Protein synthesis is carried out by the transport of mRNA out of the nucleus to the ribosome, where tRNA is paired with a matching amino acid, and the primary sequence of a protein is constructed as a linear string of amino acids.
This is illustrated in the following three pictures:
protein synthesis
mcell-transcription-translation
transcription_translation
Proteins synthesized at distal locations frequently contain intrinsically disordered segments. These regions are generally rich in assembly-promoting modules and are often regulated by post-translational modifications. Such proteins are tightly regulated but display distinct temporal dynamics upon stimulation with growth factors. Thus, proteins synthesized on-site may rapidly alter proteome composition and act as dynamically regulated scaffolds to promote the formation of reversible cellular assemblies.
RJ Weatheritt, et al. Nature Structural & Molecular Biology 24 Aug, 2014; 21: 833–839 http://dx.do.orgi:/10.1038/nsmb.2876
An overview of the potential advantages conferred by distal-site protein synthesis
Turquoise and red filled circle represents off-target and correct interaction partners, respectively. Wavy lines represent a disordered region within a distal site synthesis protein. Grey and red line in graphs represents profiles of t… http://www.nature.com/nsmb/journal/v21/n9/carousel/nsmb.2876-F5.jpg
In the the transcription process an RNA sequence is read. This is essential for protein synthesis through the ordering of the amino acids in the primary structure. However, there are microRNAs and noncoding RNAs, and there are transcription factors. The transcription factors bind to chromatin, and the RNAs also have some role in regulating the transcription process. (see picture above)
Transcription factors (TFs) interact dynamically in vivo with chromatin binding sites. Four different techniques are currently used to measure their kinetics in live cells,
fluorescence recovery after photobleaching (FRAP),
fluorescence correlation spectroscopy (FCS),
single molecule tracking (SMT) and
competition ChIP (CC).
A comparison of data from each of these techniques raises an important question:
do measured transcription kinetics reflect biologically functional interactions at specific sites (i.e. working TFs) or
do they reflect non-specific interactions (i.e. playing TFs)?
There are five key unresolved biological questions related to
the functionality of transient and prolonged binding events at both
specific promoter response elements as well as non-specific sites.
In support of functionality,
there are data suggesting that TF residence times are tightly regulated, and
that this regulation modulates transcriptional output at single genes.
In addition to this site-specific regulatory role, TF residence times
also determine the fraction of promoter targets occupied within a cell
thereby impacting the functional status of cellular gene networks.
TF residence times, then, are key parameters that could influence transcription in multiple ways.
Dr. Virginie Mattot works in the team “Angiogenesis, endothelium activation and Cancer” directed by Dr. Fabrice Soncin at the Institut de Biologie de Lille in France where she studies the roles played by microRNAs in endothelial cells during physiological and pathological processes such as angiogenesis or endothelium activation. She has been using Target Site Blockers to investigate the role of microRNAs on putative targets.
A few years ago, the team identified
an endothelial cell-specific gene which
harbors a microRNA in its intronic sequence.
They have since been working on understanding the functions of
both this new gene and its intronic microRNA in endothelial cells.
While they were searching for the functions of the intronic microRNA,
theye identified an unknown gene as a putative target.
The aim of my project was to investigate if this unknown gene was actually a genuine target and
if regulation of this gene by the microRNA was involved in endothelial cell function.
They had already shown the endothelial cell phenotype is associated with the inhibition of the intronic microRNA.
They then used miRCURY LNA™ Target Site Blockers to demonstrate
the expression of this unknown gene is actually controlled by this microRNA.
the microRNA regulates specific endothelial cell properties through regulation of this unknown gene.
MicroRNA function in endothelial cells – Solving the mystery of an unknown target gene using Target Site Blockers to investigate the role of microRNAs on putative targets
We first verified that this TSB was functional by analyzing
the expression of the miRNA target against which the TSB was directed
we then showed the TSB induced similar phenotypes as those when we inhibited the microRNA in the same cells.
Target Site Blockers were shown to be efficient tools to demonstrate the specific involvement of
putative microRNA targets
in the function played by this microRNA.
Some genes are known to have several different alternatively spliced protein variants, but the Scripps Research Institute’s Paul Schimmel and his colleagues have uncovered almost 250 protein splice variants of an essential, evolutionarily conserved family of human genes. The results were published July 17 in Science.
Focusing on the 20-gene family of aminoacyl tRNA synthetases (AARSs),
the team captured AARS transcripts from human tissues—some fetal, some adult—and showed that
many of these messenger RNAs (mRNAs) were translated into proteins.
Previous studies have identified several splice variants of these enzymes that have novel functions, but uncovering so many more variants was unexpected, Schimmel said. Most of these new protein products
lack the catalytic domain but retain other AARS non-catalytic functional domains.
This study fundamentally effects how we view protein-synthesis, according to Michael Ibba (who was not involved in the work), The Scientist reported. “The unexpected and potentially vast expanded functional networks that emerge from this study have the potential to influence virtually any aspect of cell growth.”
The team—comprehensively captured and sequenced the AARS mRNAs from six human tissue types using high-throughput deep sequencing. They next showed that a proportion of these transcripts, including those missing the catalytic domain, indeed resulted in stable protein products:
48 of these splice variants associated with polysomes.
In vitro translation assays and the expression of more than 100 of these variants in cells confirmed that
many of these variants could be made into stable protein products.
The AARS enzymes—of which there’s one for each of the 20 amino acids—bring together an amino acid with its appropriate transfer RNA (tRNA) molecule. This reaction allows a ribosome to add the amino acid to a growing peptide chain during protein translation. AARS enzymes can be found in all living organisms and are thought to be among the first proteins to have originated on Earth.
One goal of human genetics is to understand how the information for precise and dynamic gene expression programs is encoded in the genome. The interactions of transcription factors (TFs) with DNA regulatory elements clearly
play an important role in determining gene expression outputs, yet
the regulatory logic underlying functional transcription factor binding is poorly understood.
An important question in genomics is to understand how a class of proteins called ‘‘transcription factors’’ controls the expression level of other genes in the genome in a cell type-specific manner – a process that is essential to human development. One major approach to this problem is to study where these transcription factors bind in the genome, but this does not tell us about the effect of that binding on gene expression levels and
it is generally accepted that much of the binding does not strongly influence gene expression.
High-throughput technologies notoriously generate large datasets often including data from different omics platforms. Each dataset contains data for several thousand experimental markers, e.g., mass-to-charge ratios in mass spectrometry or spots in DNA microarray analysis. An experimental marker is associated with an intensity profile which may include several measurements according to different experimental conditions (Dettmer, Aronov & Hammock, 2007).
The combined analysis and visualization of data from different high-throughput technologies remains a key challenge in bioinformatics.We present here theMarVis-Graph software for integrative analysis of metabolic and transcriptomic data. All experimental data is investigated in terms of the full metabolic network obtained from a reference database. The reactions of the network are scored based on the associated data, and
sub-networks, according to connected high-scoring reactions, are identified.
Finally, MarVis-Graph scores the detected sub-networks,
evaluates them by means of a random permutation test and
presents them as a ranked list.
Furthermore, MarVis-Graph features an interactive network visualization that provides researchers with a convenient view on the results.
The key advantage ofMarVis-Graph is the analysis of reactions detached from their pathways so that
it is possible to identify new pathways or
to connect known pathways by previously unrelated reactions.
Significant differences or clusters may be explained by associated annotations, e.g., in terms of metabolic pathways or biological functions. During recent years, numerous specialized tools have been developed to aid biological researchers in automating all these steps (e.g., Medina et al., 2010; Kaever et al., 2009; Waegele et al., 2012). Comprehensive studies can be performed by combining technologies from different omics fields. The combination of transcriptomic and proteomic data sets revealed a strong
correlation between both kinds of data (Nie et al., 2007) and supported the detection of complex interactions, e.g., in RNA silencing (Haq et al., 2010). Moreover, correlations
were detected between RNA expression levels and metabolite abundances (Gibon et al., 2006). Therefore, tools that integrate, analyze and visualize experimental markers from different platforms are needed. To cope with the complexity of genome-wide studies, pathway models are utilized extensively as a simple abstraction of the underlying complex mechanisms. Set Enrichment Analysis (Subramanian et al., 2005) and Over-Representation Analysis (Huang, Sherman & Lempicki, 2009) have become state-of-the-art tools for analyzing large-scale datasets: both methods evaluate predefined sets of entities, e.g., the accumulation of differentially expressed genes in a pathway.
While manually curated pathways are convenient and easy to interpret, experimental studies have shown that all metabolic and signaling pathways are heavily interconnected (Kunkel & Brooks, 2002; Laule et al., 2003). Data from biomolecular databases support these studies: the metabolic network of Arabidopsis thaliana in the KEGG database (Kanehisa et al., 2012; Kanehisa & Goto, 2000) contains 1606 reactions from which 1464 are connected in a single sub-network (>91%), i.e., they
share a metabolite as product or substrate. In the AraCyc 10.0 database (Mueller, Zhang & Rhee, 2003; Rhee et al., 2006), more than 89% of the reactions are counted in a single sub-network. In both databases, most other reactions are completely disconnected. Additionally, Set Enrichment Analyses can not identify links between the predefined sets easily. This becomes even more important when analyzing smaller pathways as provided by the MetaCyc (Caspi et al., 2008; Caspi et al., 2012) database. Moreover, methods that utilize pathways as predefined sets ignore reactions and related biomolecular entities (e.g., metabolites, genes) which are not associated with a single pathway. For example, this affects 4000 reactions in MetaCyc and 2500 in KEGG, respectively (Altman et al., 2013). Therefore, it is desirable to develop additional methods
that do not require predefined sets but may detect enriched sub-networks in the full metabolic network.
While several tools support the statistical analysis of experimental markers from one or more omics technologies and then utilize variants of Set Enrichment Analysis (Xia et al., 2012; Chen et al., 2013; Howe et al., 2011),
no tool is able to explicitly search for connected reactions that include
most of the metabolites, genes, and enyzmes with experimental evidence.
However, the automatic identification of sub-networks has been proven useful in other contexts, e.g., in the analysis of protein–protein-interaction networks (Alcaraz et al., 2012; Baumbach et al., 2012; Maeyer et al., 2013).
MarVis-Graph imports experimental markers from different high-throughput experiments and
analyses them in the context of reaction-chains in full metabolic networks.
Then, MarVis-Graph scores the reactions in the metabolic network
according to the number of associated experimental markers and
identifies sub-networks consisting of subsequent, high-scoring reactions.
The resulting sub-networks are
ranked according to a scoring method and visualized interactively.
Hereby, sub-networks consisting of reactions from different pathways may be identified to be important
whereas the single pathways may not be found to be significantly enriched.
MarVis-Graph may also connect reactions without an assigned pathway
to reactions within a particular pathway.
TheMarVis-Graph tool was applied in a case-study investigating the wound response in Arabidopsis thaliana to analyze combined metabolomic and transcriptomic high-throughput data.
Figure 1 Schema of the metabolic network representation in MarVis-Graph. Metabolite markers are shown in gray, metabolites in red, reactions in blue, enzymes in green, genes in yellow, transcript markers in pink, and pathways in turquoise color. The edges are shown in black with labels that comply with the biological meaning. The orange arrows depict the flow of score for the initial scoring (described in section “Initial Scoring”). (not shown)
In MarVis-Graph, metabolite markers obtained from mass-spectrometry experiments additionally contain the experimental mass. The experimental mass has to be
calculated based on the mass-to-charge ratio (m/z-value) and specific isotope- or adduct-corrections (Draper et al., 2009) by means of specialized tools, e.g.,MarVis-Filter
(Kaever et al., 2012).
For each transcript marker the corresponding annotation has to be given. In DNA microarray experiments, each spot (transcript marker) is specific for a gene and can
therefore be used for annotation. For other technologies an annotation has to be provided by external tools.
In MarVis-Graph, each reaction is scored initially based on the associated experimental data (see “Initial scoring”). This initial scoring is refined (see “Refining the scoring”) and afterwards reactions with a score below a user-defined threshold are removed. The network is
decomposed into subsequent high-scoring reactions that constitute the sub-networks.
The weight of each experimental marker (see “Experimental markers”) is equally distributed over all metabolites and genes associated with the metabolite marker or
transcript marker, respectively. For all vertices, this is repeated as illustrated in Fig. 1 until the weights are accumulated by the reactions.
The initial reaction scores are used as input scoring for the random walk algorithm. The algorithm is performed as described by Glaab et al. (2012) with a user-defined
restart-probability r (default value 0.8). After convergence of the algorithm, reactions with a score lower than the user-defined threshold t (default value t = 1−r) are removed from the reaction network. During the removal process,
the network is decomposed into pairwise disconnected sub-networks containing only high-scoring reactions.
In the following, a resulting sub-network is denoted by a prime: G′ = (V′,L′) with V′ = M′ ∪C′ ∪R′ ∪E′ ∪G′ ∪T′ ∪P′.
The scores of the identified sub-networks can be assessed using a random permutation test, evaluating the marker annotations under the null hypothesis of being connected
randomly. Here, the assignments
from metabolite markers to metabolites and from transcript markers to genes are randomized.
For each association between a metabolite marker and a metabolite,
this connection is replaced by a connection between a randomly chosen metabolite marker and a randomly chosen metabolite.
The random metabolite marker is chosen from the pool of formerly connected metabolite markers. Each connected transcript marker
is associated with a randomly chosen gene.
Choosing from the list of already connected experimental markers ensures that
the sum of weights from the original and the permuted network are equal.
This method differs from the commonly utilized XSwap permutation (Hanhij¨arvi, Garriga & Puolam¨aki, 2009) that is based on swapping endpoints of two random edges. The main difference of our permutation method is that it results in a network with different topological structure, i.e., different degree of the metabolite and gene nodes.
Finally, the sub-networks are detected and scored with the same parameters applied for the original network. Based on the scores of the networks identified in the random
permutations, the family-wise-error-rate (FWER) and false-discovery-rate (FDR) are calculated for each originally identified sub-network.
MarVis-Graph was applied in a case study investigating the A. thaliana wound response. Data from a metabolite fingerprinting (Meinicke et al., 2008) and a DNA microarray
experiment (Yan et al., 2007) were imported into a metabolic network specific for A. thaliana created from the AraCyc 10.0 database (Lamesch et al., 2011). The metabolome
and transcriptome have been measured before wounding as control and at specific time points after wounding in wild-type and in the allene oxide synthase (AOS) knock-out
mutant dde-2-2 (Park et al., 2002) of A. thaliana Columbia (see Table 1). The AOS mutant was chosen, because AOS catalyzes the first specific step in the biosynthesis of the hormone jasmonic acid, which is the key regulator in wound response of plants (Wasternack & Hause, 2013).
Both datasets have been preprocessed with theMarVis-Filter tool (Kaever et al., 2012) utilizing the Kruskal–Wallis p-value calculation on the intensity profiles. Based on the ranking of ascending p-values,
the first 25% of the metabolite markers and 10% of the transcript markers have been selected for further investigation (Data S2).
The filtered metabolite and transcript markers were imported into the metabolic network. For metabolite markers, metabolites were associated
if the metabolite marker’s detected mass differs from the metabolites monoisotopic mass by a maximum of 0.005u.
Transcript markers were linked to the genes whose ID equaled the ID given in the CATMA database (Sclep et al., 2007) for that transcript marker.
Table 2 Vertices in the A. thaliana specific metabolic network after import of experimental markers. Number of objects in the metabolic network
in absolute counts and relative abundances. For experimental markers, the with annotation column gives the number of metabolite markers and
transcript markers that were annotated with a metabolite or gene, respectively. The direct evidence column contains the number of metabolites
and genes, that are associated with a metabolite marker or transcript marker. For enzymes, this is the number of enzymes encoded by a gene with
direct evidence. The number of vertices with an association to a reaction is given in the with reaction column. In the last column, this is given for
associations to metabolic pathways. (not shown)
MarVis-Graph detected a total of 133 sub-networks. The sub-networks were ranked according to size Ss, diameter Sd, and sum-of-weights Ssow
scores (Table S4). Interestingly, the different rankings show a high correlation with all pairwise correlations higher than 0.75 (Pearson correlation
coefficient) and 0.6 (Spearman rank correlation).
Allene-oxide cyclase sub-network
In all rankings, the sub-network allene-oxide cyclase (named after the reaction with the highest score in this sub-network) appeared as top candidate.
This sub-network is constituted of reactions from different pathways related to fatty acids. Figure 2 shows a visualization of the sub-network.
Jasmonic acid biosynthesis. The main part of the sub-network is formed by reactions from the “jasmonic acid biosynthesis” (PlantMetabolic Network, 2013)
resulting in jasmonic acid (jasmonate). The presence of this pathway is very well established because of its central role in mediating the plants wound response
(Reymond & Farmer, 1998; Creelman, Tierney & Mullet, 1992). Additionally, metabolites and transcripts from this pathway were expected to show prominent
expression profiles because AOS, a key enzyme in this pathway, is knocked-out in themutant plant. Jasmonic acid derivatives and hormones.
Jasmonic acid derivatives and hormones. Jasmonate is a precursor for a broad variety of plant hormones (Wasternack & Hause, 2013), e.g., the derivative (-)-
jasmonic acid methyl ester (also Methyl Jasmonic Acid; MeJA) is a volatile, airborne signal mediating wound response between plants (Farmer&Ryan, 1990).
Reactions from the jasmonoyl-amino acid conjugates biosynthesis I (PMN, 2013a) pathway connect jasmonate to different amino acids, including L-valine,
L-leucine, and L-isoleucine. Via these amino acids, this sub-network is connected to the indole-3-acetylamino acid biosynthesis (PMN, 2013b) (IAA biosynthesis).
Again, this pathway produces a well known plant hormone: Auxine (Woodward & Bartel, 2005). Even though, jasmonate and auxin are both plant hormones, their
connection in this subnetwork is of minor relevance because amino acid conjugates are often utilized as active or storage forms of signaling molecules.While
jasmonoyl-amino acid conjugates represent the active signaling form of jasmonates, IAA amino acid conjugates are the storage form of this hormone (Staswick et al.,
2005).
polyhydroxy fatty acids synthesis
Figure 2 Schema of the allene-oxide cyclase sub-network. Metabolites are shown in red, reactions in blue, and enzymes in green color. Metabolites and reactions without direct experimental evidence are marked by a dashed outline and a brighter color while enzymes without experimental evidence are hidden. The metabolic pathways described in section “Resulting sub-networks” are highlighted with different colors. The orange and green parts indicate the reaction chains required to build jasmonate and its amino acid conjugates. The coloring of pathways was done manually after export from MarVis-Graph.
The ω-3-fatty acid desaturase should catalyze a reaction from linoleate to α-linolenate. Metabolite markers that match the mass of crepenynic acid do also match α-linolenate
because both molecules have the same sum-formula and monoisotopic mass. As mentioned above, MarVis-Graph compiled the metabolic network for this study
from the AraCyc database version 10.0. On June 4th, a curator changed the database to remove theΔ12-fatty acid dehydrogenase prior to the release of AraCyc version 11.0.
The presented new software tool MarVis-Graph supports the investigation and visualization of omics data from different fields of study. The introduced algorithm for
identification of sub-networks is able to identify reaction-chains across different pathways and includes reactions that are not associated with a single pathway. The application of MarVis-Graph in the case study on A. thaliana wound response resulted in a convenient graphical representation of high-throughput data which allows the analysis of the complex dynamics in a metabolic network.
This portion of the transcription series deals with transcription factors and the effects of their binding on metabolism. This also has implications for pharmaceutical target identification.
The Functional Consequences of Variation in Transcription Factor Binding
DA. Cusanovich, B Pavlovic, JK. Pritchard*, Y Gilad*
1 Department of Human Genetics, 2 Howard Hughes Medical Institute, University of Chicago, Chicago, IL 3 Departments of Genetics and Biology and Howard Hughes Medical Institute, Stanford University, Stanford, CA.
PLoS Genet 2014;10(3):e1004226. http://dx.doi.org:/10.1371/journal.pgen.1004226
One goal of human genetics is to understand how the information for precise and dynamic gene expression programs is encoded in the genome. The interactions of transcription factors (TFs) with DNA regulatory elements clearly
play an important role in determining gene expression outputs, yet
the regulatory logic underlying functional transcription factor binding is poorly understood.
An important question in genomics is to understand how a class of proteins called ‘‘transcription factors’’ controls the expression level of other genes in the genome in a cell type-specific manner – a process that is essential to human development. One major approach to this problem is to study where these transcription factors bind in the genome, but this does not tell us about the effect of that binding on gene expression levels and
it is generally accepted that much of the binding does not strongly influence gene expression.
To address this issue, we artificially reduced the concentration of 59 different transcription factors in the cell and then
examined which genes were impacted by the reduced transcription factor level.
Our results implicate some attributes
that might influence what binding is functional, but they also suggest that
a simple model of functional vs. non-functional binding may not suffice.
Many studies have focused on characterizing the genomic locations of TF binding, but
it is unclear whether TF binding at any specific locus has
functional consequences with respect to gene expression output.
We knocked down 59 TFs and chromatin modifiers in one HapMap lymphoblastoid cell line
to evaluate the context of functional TF binding.
We then identified genes whose expression was affected by the knockdowns
by intersecting the gene expression data with transcription factor binding data
(based on ChIP-seq and DNase-seq)
within 10 kb of the transcription start sites of expressed genes.
This combination of data allowed us to infer functional TF binding.
Only a small subset of genes bound by a factor were
differentially expressed following the knockdown of that factor,
suggesting that most interactions between TF and chromatin
do not result in measurable changes in gene expression levels
of putative target genes.
We found that functional TF binding is enriched
in regulatory elements that harbor a large number of TF binding sites,
at sites with predicted higher binding affinity, and
at sites that are enriched in genomic regions annotated as ‘‘active enhancers.’’
We aim to be able to predict the expression pattern of a gene based on its regulatory
sequence alone. However, the regulatory code of the human genome is much more complicated than
the triplet code of protein coding sequences, and is highly context-specific,
depending on cell-type and other factors.
Moreover, regulatory regions are not necessarily organized into
discrete, easily identifiable regions of the genome and
may exert their influence on genes over large genomic distances
Genomic studies addressing questions of the regulatory logic of the human genome have largely taken one of two approaches.
collecting transcription factor binding maps using techniques such as ChIPseq
and DNase-seq
mapping various quantitative trait loci (QTL), such as gene expression levels
(eQTLs) [7], DNA methylation (meQTLs) [8] and chromatin accessibility (dsQTLs)
Cumulatively, binding map studies and QTL map studies have
led to many insights into the principles and mechanisms of gene regulation.
However, there are questions that neither mapping approach on its own is well equipped to address. One outstanding issue is
the fraction of factor binding in the genome that is ‘‘functional’’,
which we define here to mean that
disturbing the protein-DNA interaction leads to a measurable
downstream effect on gene regulation.
Transcription factor knockdown could be used to address this problem, whereby
the RNA interference pathway is employed to greatly reduce
the expression level of a specific target gene by using small interfering RNAs (siRNAs).
The response to the knockdown can then be measured by collecting RNA after the knockdown and
measuring global changes in gene expression patterns
after specifically attenuating the expression level of a given factor.
Combining a TF knockdown approach with TF binding data can help us to
distinguish functional binding from non-functional binding
This approach has previously been applied to the study of human TFs, although for the most part studies have only focused on
the regulatory relationship of a single factor with its downstream targets.
The FANTOM consortium knocked down 52 different transcription factors in
the THP-1 cell line, an acute monocytic leukemia-derived cell line, and
used a subset of these to validate certain regulatory predictions based on binding motif enrichments.
We and others previously studied the regulatory architecture of gene expression in
the model system of HapMap lymphoblastoid cell lines (LCLs) using both
binding map strategies and QTL mapping strategies.
We now sought to use knockdown experiments targeting transcription factors in a HapMap LCL
to refine our understanding of the gene regulatory circuitry of the human genome.
Therefore, We integrated the results of the knockdown experiments with previous data on TF binding to
better characterize the regulatory targets of 59 different factors and
to learn when a disruption in transcription factor binding
is most likely to be associated with variation in the expression level of a nearby gene.
Gene expression levels following the knockdown were compared to
expression data collected from six samples that were transfected with negative control siRNA.
The expression data from all samples were normalized together using
quantile normalization followed by batch correction using the RUV-2 method.
We then performed several quality control analyses to confirm
that the quality of the data was high,
that there were no outlier samples, and
that the normalization methods reduced the influence of confounders
In order to identify genes that were expressed at a significantly different level
in the knockdown samples compared to the negative controls,
we used likelihood-ratio tests within the framework of a fixed effect linear model.
Following normalization and quality control of the arrays,
we identified genes that were differentially expressed between
the three knockdown replicates of each factor and the six controls.
Depending on the factor targeted, the knockdowns resulted in
between 39 and 3,892 differentially expressed genes at an FDR of 5%
(Figure 1B; see Table S3 for a summary of the results).
The knockdown efficiency for the 59 factors ranged
from 50% to 90% (based on qPCR; Table S1).
The qPCR measurements of the knockdown level were significantly
correlated with estimates of the TF expression levels
based on the microarray data (P =0.001; Figure 1C).
Reassuringly, we did not observe a significant correlation between
the knockdown efficiency of a given factor and
the number of genes classified as differentially expressed foci.
Because we knocked down 59 different factors in this experiment
we were able to assess general patterns associated with the perturbation of transcription factors
beyond merely the number of affected target genes.
Globally, despite the range in the number of genes we identified as
differentially expressed in each knockdown,
the effect sizes of the differences in expression were relatively modest and
consistent in magnitude across all knockdowns.
The median effect size following the knockdown experiment for genes classified as
differentially expressed at an FDR of 5% in any knockdown was
a 9.2% difference in expression level between the controls and the knockdown (Figure 2),
while the median effect size for any individual knockdown experiment ranged between 8.1% and 11.0%.
(this was true whether we estimated the knockdown effect based on qPCR (P = 0.10; Figure 1D) or microarray (P = 0.99; not shown) data.
Nor did we observe a correlation between
variance in qPCR-estimated knockdown efficiency (between replicates) and
the number of genes differentially expressed (P = 0.94; Figure 1E).
We noticed that the large variation in the number of differentially expressed genes
extended even to knockdowns of factors from the same gene family.
Figure 1. Differential expression analysis.
(a) Examples of differential expression analysis results for the genes HCST and IRF4. The top two panels are ‘MA plots’ of the mean Log2(expression level) between the knockdown arrays and the controls for each gene (x-axis) to the Log2(Fold-Change) between the knockdowns and controls (y-axis). Differentially expressed genes at an FDR of 5% are plotted in yellow (points 50% larger). The gene targeted by the siRNA is highlighted in red. The bottom two panels are ‘volcano plots’ of the Log2(Fold-Change) between the knockdowns and controls (x-axis) to the P-value for differential expression (y-axis). The dashed line marks the 5% FDR threshold. Differentially expressed genes at an FDR of 5% are plotted in yellow (points 50% larger). The red dot marks the gene targeted by the siRNA.
(b) Barplot of number of differentially expressed genes in each knockdown experiment.
(c) Comparison of the knockdown level measured by qPCR (RNA sample collected 48 hours posttransfection) and the knockdown level measured by microarray.
(d) Comparison of the level of knockdown of the transcription factor at 48 hrs (evaluated by qPCR; x-axis) and the number of genes differentially expressed in the knockdown experiment (y-axis). (e) Comparison of the variance in knockdown efficiency between replicates for each transcription factor (evaluated by qPCR; x-axis) and the number of differentially expressed genes in the knockdown experiment (y-axis).
Figure 2. Effect sizes for differentially expressed genes.
Boxplots of absolute Log2(fold-change) between knockdown arrays and control arrays for all genes identified as differentially expressed in each experiment. Outliers are not plotted. The gray bar indicates the interquartile range across all genes differentially expressed in all knockdowns. Boxplots are ordered by the number of genes differentially expressed in each experiment. Outliers were not plotted.
Knocking down SREBF2 (1,286 genes differentially expressed), a key regulator of cholesterol homeostasis,
results in changes in the expression of genes that are
significantly enriched for cholesterol and sterol biosynthesis annotations.
While not all factors exhibited striking enrichments for relevant functional categories and pathways,
the overall picture is that perturbations of many of the factors
primarily affected pathways consistent with their known biology.
In order to assess functional TF binding, we next incorporated
binding maps together with the knockdown expression data.
We combined binding data based on DNase-seq footprints in 70 HapMap LCLs, reported by Degner et al. (Table S5)
and from ChIP-seq experiments in LCL GM12878, published by ENCODE.
We were thus able to obtain genome wide binding maps for a total of 131 factors that were either
directly targeted by an siRNA in our experiment (29 factors) or were
differentially expressed in one of the knockdown experiments.
We classified a gene as a bound target of a particular factor when
binding of that factor was inferred within 10kb of the transcription start site (TSS) of the target gene.
Using this approach, we found that the 131 TFs were bound
in proximity to a median of 1,922 genes per factor (range 11 to 7,053 target genes).
We considered binding of a factor to be functional if the target gene
was differentially expressed after perturbing the expression level the bound transcription factor.
We then asked about the concordance between
the transcription factor binding data and the knockdown expression data.
the extent to which differences in gene expression levels following the knockdowns
might be predicted by binding of the transcription factors
within the putative regulatory regions of the responsive genes. and also
what proportion of putative target (bound) genes of a given TF were
differentially expressed following the knockdown of the factor.
Focusing only on the binding sites classified using the DNase-seq data
(which were assigned to a specific instance of the binding motif, unlike the ChIP data),
we examined sequence features that might distinguish functional binding.
In particular, whether binding at conserved sites was more likely to be functional and
whether binding sites that better matched the known PWM for the factor were more likely to be functional.
We did not observe a significant shift in the conservation of functional binding sites (Wilcoxon rank sum P = 0.34),
but we did observe that binding around differentially expressed genes occurred at sites
that were significantly better matches to the canonical binding motif.
Figure 3. Intersecting binding data and expression data for each knockdown.
(a) Example Venn diagrams showing the overlap of binding and differential expression for the knockdowns of HCST and IRF4 (the same genes as in Figure 1).
(b) Boxplot summarizing the distribution of the fraction of all expressed genes that are bound by the targeted gene or downstream factors.
(c) Boxplot summarizing the distribution of the fraction of bound genes that are classified as differentially expressed, using an FDR of either 5% or 20%.
Intersecting binding data and expression data for each knockdown
Considering bound targets determined from either the ChIP-seq or DNase-seq data, we observed that
differentially expressed genes were associated with both
a higher number of binding events for the relevant factors within 10 kb of the TSS (P,10216; Figure 4A)
as well as with a larger number of different binding factors
(considering the siRNA-targeted factor and any TFs that were DE in the knockdown; P,10216; Figure 4B).
Figure 4. Degree of binding correlated with function. Boxplots comparing
(a) the number of sites bound, and
(b) the number of differentially expressed transcription factors binding events near functionally or non-functionally bound genes. We considered binding for siRNA-targeted factor and any factor differentially expressed in the knockdown.
(c) Focusing only on genes differentially expressed in common between each pairwise set of knockdowns we tested for enrichments of functional binding (y-axis). Pairwise comparisons between knockdown experiments were binned by the fraction of differentially expressed transcription factors in common between the two experiments. For these boxplots, outliers were not plotted.
We examined the distribution of binding about the TSS. Most factor binding was concentrated
near the TSS whether or not the genes were classified as differentially expressed (Figure 5A).
the distance from the TSS to the binding sites was significantly longer for differentially expressed genes (P,10216; Fig. 5B).
Figure 5. Distribution of functional binding about the TSS.
(a) A density plot of the distribution of bound sites within 10 kb of the TSS for both functional and non-functional genes. Inset is a zoom-in of the region +/21 kb from the TSS (b) Boxplots comparing the distances from the TSS to the binding sites for functionally bound genes and non-functionally bound genes. For the boxplots, 0.001 was added before log10 transforming the distances and outliers were not plotted.
We investigated the distribution of factor binding across various chromatin states, as defined by Ernst et al. This dataset lists
regions of the genome that have been assigned to different activity states
based on ChIP-seq data for various histone modifications and CTCF binding.
For each knockdown, we separated binding events
by the genomic state in which they occurred and then
tested whether binding in that state was enriched around differentially expressed genes.
After correcting for multiple testing of genes that were differentially expressed.
19 knockdowns showed significant enrichment for binding in ‘‘strong enhancers’’
four knockdowns had significant enrichments for ‘‘weak enhancers’’,
eight knockdowns showed significant depletion of binding in ‘‘active promoters’’ ,
six knockdowns had significant depletions for ‘‘transcription elongation’’,
Did the factors tended to have a consistent effect (either up- or down-regulation)
on the expression levels of genes they purportedly regulated?
All factors we tested are associated with both up- and down-regulation of downstream targets (Figure 6).
A slight majority of downstream target genes were expressed at higher levels
following the knockdown for 15 of the 29 factors for which we had binding information (Figure 6B).
The factor that is associated with the largest fraction (68.8%) of up-regulated target genes following the knockdown is EZH2,
the enzymatic component of the Polycomb group complex.
On the other end of the spectrum was JUND, a member of the AP-1 complex, for which
66.7% of differentially expressed targets were down-regulated following the knockdown.
Figure 6. Magnitude and direction of differential expression after knockdown.
(a) Density plot of all Log2(fold-changes) between the knockdown arrays and controls for genes that are differentially expressed at 5% FDR in one of the knockdown experiments as well as bound by the targeted transcription factor.
(b) Plot of the fraction of differentially expressed putative direct targets that were up-regulated in each of the knockdown experiments.
Magnitude and direction of differential expression after knockdown
We found no correlation between the number of paralogs and the fraction of bound targets that were differentially expressed. We also did not observe a significant correlation when we considered whether
the percent identity of the closest paralog might be predicative of
the fraction of bound genes that were differentially expressed following the knockdown (Figure S8).
While there is compelling evidence for our inferences, the current chromatin functional annotations
do not fully explain the regulatory effects of the knockdown experiments.
For example, the enrichments for binding in ‘‘strong enhancer’’ regions of the genome range from 7.2% to 50.1% (median = 19.2%),
much beyond what is expected by chance alone, but far from accounting for all functional binding.
In addition to considering
the distinguishing characteristics of functional binding, we also examined
the direction of effect that perturbing a transcription factor had on the expression level of its direct targets.
We specifically addressed whether
knocking down a particular factor tended to drive expression of its putatively direct (namely, bound) targets up or down,
which can be used to infer that the factor represses or activates the target, respectively.
Transcription factors have traditionally been thought of primarily as activators, and previous work from our group is consistent with that notion. Surprisingly, the most straightforward inference from the present study is that
many of the factors function as repressors at least as often as they function as activators.
EZH2 had a negative regulatory relationship with the largest fraction of direct targets (68.8%),
consistent with – the known role of EZH2 as the active member of the Polycomb group complex PC2
while JUND seemed to have a positive regulatory relationship with the largest fraction of direct targets (66.7%),
and with – the biochemical characterization of the AP-1 complex (of which JUND is a component) as a transactivator.
More generally, however, our results, combined with the previous work from our group and others make for a complicated view
of the role of transcription factors in gene regulation as
it seems difficult to reconcile the inference from previous work that
many transcription factors should primarily act as activators with the results presented here.
One somewhat complicated hypothesis, which nevertheless can resolve the apparent discrepancy, is that
the ‘‘repressive’’ effects we observe for known activators may be
at sites in which the activator is acting as a weak enhancer of transcription and
that reducing the cellular concentration of the factor
releases the regulatory region to binding by an alternative, stronger activator.
To more explicitly address the effect that our proximity-based definition of target genes might have on our analyses, we reanalyzed
the overlap between factor binding and differential expression following the knockdowns
using an independent, empirically determined set of target genes.
Thurman et al. used correlations in DNase hypersensitivity between
intergenic hypersensitive sites and promoter hypersensitive sites across diverse tissues
to assign intergenic regulatory regions to specific genes,
independently of proximity to a particular promoter.
We performed this alternative analysis in which we
assigned binding events to genes based on the classification of Thurman et al.
We then considered the overlap between binding and differential expression in this new data set. The results were largely
consistent with our proximity-based observations.
A median of 9.5% of genes that were bound by a factor were
also differentially expressed following the knockdown of that factor
(compared to 11.1% when the assignment of binding sites to genes is based on proximity).
From the opposite perspective, a median of 28.0% of differentially expressed genes were bound by that factor
(compared to 32.3% for the proximity based definition). The results of this analysis are summarized in Table S7.
Our results should not be considered a comprehensive census of regulatory events in the human genome. Instead, we adopted a gene-centric approach,
focusing only on binding events near the genes for which we could measure expression
to learn some of the principles of functional transcription factor binding.
In light of our observations a reassessment of our estimates of binding may be warranted. In particular, because functional binding is skewed away from promoters (our system is apparently not well-suited to observe functional promoter binding, perhaps because of protection by large protein complexes),
a more conservative estimate of the fraction of binding that is indeed functional would not consider data within the promoter.
Importantly, excluding the putative promoter region from our analysis (i.e. only considering a window .1 kb from the TSS and ,10 kb from the TSS)
does not change our conclusions.
Considering this smaller window,
a median of 67.0% of expressed genes are still classified as bound by
either the knocked down transcription factor or
a downstream factors that is differentially expressed in each experiment,
yet a median of only 8.1% of the bound genes are
also differentially expressed after the knockdowns.
Much of what distinguishes functional binding (as we define it) has yet to be explained. We are unable to explain much of the differential expression observed in our experiments by the presence of least one relevant binding event. This may not be altogether surprising, as
we are only considering binding in a limited window around the transcription start site.
To address these issues, more factors should be perturbed to further evaluate the robustness of our results and to add insight. Together, such studies will help us develop a more sophisticated understanding of functional transcription factor binding in particular, the gene regulatory logic more generally.
Assessing quality and completeness of human transcriptional regulatory pathways on a genome-wide scale
Recently the biological pathways have become a common and probably the most popular form of representing biochemical information for hypothesis generation and validation. These maps store wide knowledge of complex molecular interactions and regulations occurring in the living organism in a simple and obvious way, often using intuitive graphical notation. Two major types of biological pathways could be distinguished.
Metabolic pathways incorporate complex networks of protein-based interactions and modifications, while
signal transduction and transcriptional regulatory pathways are usually considered to provide information on mechanisms of transcription
While there are a lot of data collected on human metabolic processes,
the content of signal transduction and transcriptional regulatory pathways varies greatly in quality and completeness.
An indicative comparison of MYC transcriptional targets reported in ten different pathway databases reveals that these databases differ greatly from each other (Figure 1). Given that MYC is involved
in the transcriptional regulation of approximately 15% of all genes,
one cannot argue that the majority of pathway databases that contain
less than thirty putative transcriptional targets of MYC are even close to complete.
More importantly, to date there have been no prior genome-wide evaluation studies (that are based on genome-wide binding and gene expression assays) assessing pathway databases
Background: While pathway databases are becoming increasingly important in most types of biological and translational research, little is known about the quality and completeness of pathways stored in these databases. The present study conducts a comprehensive assessment of transcriptional regulatory pathways in humans for seven well-studied transcription factors:
MYC,
NOTCH1,
BCL6,
TP53,
AR,
STAT1,
RELA.
The employed benchmarking methodology first involves integrating
genome-wide binding with functional gene expression data
to derive direct targets of transcription factors.
Then the lists of experimentally obtained direct targets
are compared with relevant lists of transcriptional targets from 10 commonly used pathway databases.
Results: The results of this study show that for the majority of pathway databases,
the overlap between experimentally obtained target genes and
targets reported in transcriptional regulatory pathway databases is
surprisingly small and often is not statistically significant.
The only exception is MetaCore pathway database which
yields statistically significant intersection with experimental results in 84% cases.
The lists of experimentally derived direct targets obtained in this study can be used
to reveal new biological insight in transcriptional regulation, and we
suggest novel putative therapeutic targets in cancer.
Conclusions: Our study opens a debate on validity of using many popular pathway databases to obtain transcriptional regulatory targets. We conclude that the choice of pathway databases should be informed by
solid scientific evidence and rigorous empirical evaluation.
In the current study we perform
(1) an evaluation of ten commonly used pathway databases,
assessing the transcriptional regulatory pathways, considered in the current study as
the interactions of the type ‘transcription factor-transcriptional targets’.
This involves integration of human genome wide functional microarray or RNA-seq gene expression data with
protein-DNA binding data from ChIP-chip, ChIP-seq, or ChIP-PET platforms
to find direct transcriptional targets of the seven well known transcription factors:
MYC, NOTCH1, BCL6, TP53, AR, STAT1, and RELA.
The choice of transcription factors is based on their important role in oncogenesis and availability of binding and expression data in the public domain.
(2) the lists of experimentally derived direct targets are used to assess the quality and completeness of 84 transcriptional regulatory pathways from four publicly available (BioCarta, KEGG, WikiPathways and Cell Signaling Technology) and six commercial (MetaCore, Ingenuity Pathway Analysis, BKL TRANSPATH, BKL TRANSFAC, Pathway Studio and GeneSpring Pathways) pathway databases.
(3) We measure the overlap between pathways and experimentally obtained target genes and assess statistical significance of this overlap, and we demonstrate that experimentally derived lists of direct transcriptional targets
can be used to reveal new biological insight on transcriptional regulation.
We show this by analyzing common direct transcriptional targets of
MYC, NOTCH1 and RELA
that act in interconnected molecular pathways.
Detection of such genes is important as it could reveal novel targets of cancer therapy.
Figure 1 Number of genes in common between MYC transcriptional targets derived from ten different pathway databases. Cells are colored according to their values from white (low values) to red (high values). (not shown)
statistical methodology for comparison
Figure 2 Illustration of statistical methodology for comparison between a gold-standard and a pathway database
Since we are seeking to compare gene sets from different studies/databases, it is essential to transform genes to standard identifiers. That is why we transformed all
gene sets to the HUGO Gene Nomenclature Committee approved gene symbols and names. In order to assess statistical significance of the overlap between the resulting gene sets, we used the hypergeometric test at 5% a-level with false discovery rate correction for multiple comparisons by the method of Benjamini and Yekutieli. The alternative hypothesis of this test is that two sets of genes (set A from pathway
database and set B from experiments) have greater number of genes in common than two randomly selected gene sets with the same number of genes as in sets A and B. For example, consider that for some transcription factor there are 300 direct targets in the pathway database #1 and 700 in the experimentally derived list (gold-standard), and their intersection is 16 genes (Figure 2a). If we select on random from a total of
20,000 genes two sets with 300 and 700 genes each, their overlap would be greater or equal to 16 genes in 6.34% times. Thus, this overlap will not be statistically significant at 5% a-level (p = 0.0634). On the other hand, consider that for the pathway database #2, there are 30 direct targets of that transcription factor, and their intersection with the 700-gene gold-standard is only 6 genes. Even though the size of this intersection is rather small, it is unlikely to randomly select 30 genes (out of 20,000) with an overlap greater or equal to 6 genes with a 700-gene gold-standard (p = 0.0005, see Figure 2a). This overlap is statistically significant at 5% a-level.
We also calculate an enrichment fold change ratio (EFC) for every intersection between a gold-standard and a pathway database. For a given pair of a gold-standard and a pathway database, EFC is equal to the observed number of genes in their intersection, divided by the expected size of intersection under the null hypothesis (plus machine epsilon, to avoid division by zero). Notice however that larger values of EFC may correspond to databases that are highly incomplete and contain only a few relations. For example, consider that for some transcription factor there are 300 direct targets in the pathway database #1 and 50 in the experimentally derived list (gold-standard), and their intersection is 30 genes (Figure 2b). If we select on random from a total of 20,000 genes two sets with 300 and 50 genes each, their expected overlap under the null hypothesis will be equal to 0.75. Thus, the EFC ratio will be equal to 40 (= 30/0.75). On the other hand, consider that for the pathway database #2, there are 2 direct
targets of that transcription factor, and their intersection with the 50-gene gold-standard is only 1 gene. Even though the expected overlap under the null hypothesis will be equal to 0.005 and EFC equal to 200 (5 times bigger than for the database #1), the size of this intersection with the gold-standard is 30 times less than for database #1 (Figure 2b).
Figure 3 Comparison between different pathway databases and experimentally derived gold-standards for all considered transcription factors. Value in a given cell is a number of overlapping genes between a gold-standard and a pathway-derived gene set. Cells
are colored according to their values from white (low values) to red (high values). Underlined values in red represent statistically significant intersections. (not shown)
Figure 4 Summary of the pathway databases assessment. Green cells represent statistically significant intersections between experimentally derived gold-standards and transcriptional regulatory pathways. White cells denote results that are not statistically significant. Numbers are the enrichment fold change ratios (EFC) calculated for each intersection. (not shown)
At the core of this study was creation of gold-standards of transcriptional regulation in humans that can be compared with target genes reported in transcriptional regulatory pathways. We focused on seven well known transcription factors and obtained gold-standards
by integrating genome-wide transcription factor-DNA binding data (from ChIP-chip, ChIP-seq, or ChIP-PET platforms)
with functional gene expression microarray and RNA-seq data.
The latter data allows to survey changes in the transcriptomes on a genome-wide scale
after the inhibition or over-expression of the transcription factor in question.
However, change in the expression of a particular gene could be caused either by the direct effect of the removal or introduction of a given transcription factor, as well as by an indirect effect, through the change in expression level of some other gene(s). It is essential
to integrate data from these two sources to
obtain an accurate list of gene targets that are directly regulated by a transcription factor.
It is worth noting that tested pathway databases typically do not give distinction between cell-lines, experimental conditions, and other details relevant to experimental systems in which data were obtained. These databases in a sense propose a ‘universal’ list of transcriptional targets. However, it is known that
transcriptional regulation in a cell is dynamic and works differently for different systems and stimuli.
This accentuates the major limitation of pathway databases and emphasizes
importance of deriving a specific list of transcriptional targets for the current experimental system.
In this study we followed the latter approach by developing gold-standards for specific cell characterized biological systems and experimental conditions.
The approach used here for building gold-standards of direct mechanistic knowledge has several limitations. (see article). Nevertheless, our results suggest that multiple transcription factors can co-operate and control both physiological differentiation and malignant transformation, as demonstrated utilizing combinatorial gene-profiling for
NOTCH1, MYC and RELA targets.
These studies might lead us to multi-pathway gene expression “signatures”
essential for the prediction of genes that could be targeted in cancer treatments.
In agreement with this hypothesis, several of the genes identified in our analysis have been suggested to be putative therapeutic targets in leukemia, with either preclinical or clinical trials underway (CDK4, CDK6, GSK3b, MYC, LCK, NFkB2, BCL2L1, NOTCH1).
Single-molecule tracking in live cells reveals distinct target-search strategies of transcription factors in the nucleus
I Izeddin†, V Récamier†‡, L Bosanac, II Cissé, L Boudarene, et al.
1Functional Imaging of Transcription, Institut de Biologie de l’Ecole Normale Supérieure (IBENS), Inserm, and CNRS UMR; 2Laboratoire Kastler Brossel, CNRS UMR, Departement de Physique et Institut de Biologie
de l’Ecole Normale Supérieure (IBENS), Paris, Fr; 3Transcription Imaging Consortium, Janelia Farm Research Campus, Howard Hughes Medical Institute, Ashburn, US; + more.
Biophysics and structural biology | Cell biology eLife 2014;3:e02230. http://dx.doi.org:/10.7554/eLife.02230
Transcription factors are
proteins that control the expression of genes in the nucleus, and
they do this by binding to other proteins or DNA.
First, however, these regulatory proteins need to overcome the challenge of
finding their targets in the nucleus, which is crowded with other proteins and DNA.
Much research to date has focused on measuring how fast proteins can diffuse and spread out throughout the nucleus. However these measurements only make sense if these proteins have access to the same space within the nucleus.
Now, Izeddin, Récamier et al. have developed a new technique to track
single protein molecules in the nucleus of mammalian cells.
A transcription factor called c-Myc and another protein called P-TEFb
were tracked and while they diffused at similar rates,
they ‘explored’ the space inside the nucleus in very different ways.
Izeddin, Récamier et al. found that c-Myc explores the nucleus in a so-called ‘non-compact’ manner: this means that it
can move almost everywhere inside the nucleus, and has an equal chance
of reaching any target regardless of its position in this space.
P-TEFb, on the other hand, searches
the nucleus in a ‘compact’ way.
This means that it is constrained to follow a specific path
through the nucleus and is therefore guided to its potential targets.
Izeddin, Récamier et al. explain that
the different ‘search strategies’ used by these two proteins
influence how long it takes them to find their targets and
how far they can travel in a given time.
These findings, together with information about
where and when different proteins interact in the nucleus,
will be essential to understand how the organization of the genome within the nucleus
can control the expression of genes.
The next challenge will now be to
uncover what determines a
protein’s search strategy in the nucleus, as well as
the potential ways that this strategy might be regulated.
Mueller et al., 2010; Normanno et al., 2012). These transient interactions are essential to ensure a fine regulation of binding site occupancy—by competition or by altering the TF concentration—but must also be persistent enough to enable the assembly of multicomponent complexes (Dundr, 2002; Darzacq and Singer, 2008; Gorski et al., 2008; Cisse et al., 2013).
In parallel to the experimental evidence of the fast diffusive motion of nuclear factors, our understanding of the intranuclear space has evolved from a homogeneous environment to an organelle where spatial arrangement among genes and regulatory sequences play an important role in transcriptional control (Heard and Bickmore, 2007). The nucleus of eukaryotes displays a hierarchy of organized structures (Gibcus and Dekker, 2013) and is often referred to as a
crowded environment.
How crowding influences transport properties of macromolecules and organelles in the cell is a fundamental question in quantitative molecular biology. While a restriction of the available space for diffusion can slow down transport processes, it can also channel molecules towards their targets increasing their chance to meet interacting partners. A widespread observation in quantitative cell biology is that the diffusion of molecules is anomalous, often attributed to crowding in the nucleoplasm, cytoplasm, or in the membranes of the cell (Höfling and Franosch, 2013). An open debate remains on how to determine whether diffusion is anomalous or normal (Malchus and Weiss, 2009; Saxton, 2012), and the mechanisms behind anomalous diffusion (Saxton, 2007). The answer to these questions bears important consequences for the understanding of the biochemical reactions of the cell.
The problem of diffusing molecules in non-homogenous media has been investigated in different fields. Following the seminal work of de Gennes (1982a), (1982b) in polymer physics, the study of diffusivity of particles and their reactivity has been generalized to random or disordered media (Kopelman, 1986; Lindenberg et al., 1991). These works have set a framework to interpret the mobility of macromolecular complexes in the cell, and recently in terms of kinetics of biochemical reactions (Condamin et al., 2007). Experimental evidence has also been found, showing the influence
of the glass-like properties of the bacterial cytoplasm in the molecular dynamics of intracellular processes (Parry et al., 2014). These studies demonstrate that the geometry of the medium in which diffusion takes place has important repercussions for the search kinetics of molecules. The notion of compact and non-compact exploration was introduced by de Gennes (1982a) in the context of dense polymers and describes two fundamental types of diffusive behavior. While a non-compact explorer leaves a significant number of available sites unvisited, a compact explorer performs a redundant
exploration of the space. In chemistry, the influence of compactness is well established to describe dimensional effects on reaction rates (Kopelman, 1986).
In this study, we aim to elucidate the existence of different types of mobility of TFs in the eukaryotic nucleus, as well as the principles governing nuclear exploration of factors relevant to transcriptional control. To this end, we used single-molecule (SM) imaging to address the relationship between the nuclear geometry and the search dynamics of two nuclear factors having distinct functional roles: the proto-oncogene c-Myc and the positive transcription elongation factor (P-TEFb). c-Myc is a basic helix-loop-helix DNA-binding transcription factor that binds to E-Boxes; 18,000 E-boxes are found in the genome, and c-Myc affects the transcription of numerous genes (Gallant and Steiger, 2009).
Recently, c-Myc has been demonstrated to be a general transcriptional activator upregulating transcription of nearly all genes (Lin et al., 2012; Nie et al., 2012). P-TEFb is an essential actor in the transcription regulation driven by RNA Polymerase II. P-TEFb is a cyclin-dependent kinase, comprising a CDK9 and a Cyclin T subunit. It phosphorylates the elongation control factors SPT5 and NELF to allow productive elongation of class II gene transcription (Wada et al., 1998). The carboxy-terminal domain (CTD) of the catalytic subunit RPB1 of polymerase II is also a major target of P-TEFb (Zhou et al., 2012). c-Myc and P-TEFb are therefore two good examples of transcriptional regulators binding to numerous sites in the nucleus; the latter binds to the transcription machinery itself and the former directly to DNA.
Single particle tracking (SPT) constitutes a powerful method to probe the mobility of molecules in living cells (Lord et al., 2010). In the nucleus, SPT has been first employed to investigate the dynamics of mRNAs (Fusco et al., 2003; Shav-Tal et al., 2004) or for rheological measurements of the nucleoplasm using inert probes (Bancaud et al., 2009). Recently, the tracking of single nuclear factors has been facilitated by the advent of efficient in situ tagging methods such as Halo
tags (Mazza et al., 2012). An alternative approach takes advantage of photoconvertible tags (Lippincott-Schwartz and Patterson, 2009) and photoactivated localization microscopy (PALM) (Betzig et al., 2006; Hess et al., 2006). Single particle tracking PALM (sptPALM) was first used to achieve high-density diffusion maps of membrane proteins (Manley et al., 2008). However, spt-PALM experiments have typically been limited to proteins with slow mobility (Manley et al., 2008) or those that undergo restricted motions (Frost et al., 2010; English et al., 2011).
Recently, by inclusion of light-sheet illumination, it has been used to determine the binding characteristics of TFs to DNA (Gebhardt et al., 2013). In this study, we developed a new sptPALM procedure adapted for the recording of individual proteins rapidly diffusing in the nucleus of mammalian cells. We used the photoconvertible fluorophore Dendra2 (Gurskaya et al., 2006) and took advantage of tilted illumination (Tokunaga et al., 2008). A careful control of the photoconversion rate minimized the background signal due to out-of-focus activated molecules, and we could thus follow the motion of individual proteins freely diffusing within the nuclear volume. With this sptPALM technique, we recorded large data sets (on the order of 104 single translocations in a single imaging session), which were essential for a proper statistical analysis of the search dynamics.
We applied our technique to several nuclear proteins and found that diffusing factors do not sense a unique nucleoplasmic architecture: c-Myc and P-TEFb adopt different nuclear space-exploration strategies, which drastically change the way they reach their specific targets. The differences observed between the two factors were not due to their diffusive kinetic parameters but to the geometry of their exploration path. c-Myc and our control protein, ‘free’ Dendra2, showed free diffusion in a three-dimensional nuclear space. In contrast, P-TEFb explored the nuclear volume by sampling a space of reduced dimensionality, displaying characteristics of exploration constrained in fractal structures.
The role of the space-sampling mode in the search strategy has long been discussed from a theoretical point of view (de Gennes, 1982a; Kopelman, 1986; Lindenberg et al., 1991). Our experimental results support the notion that it could indeed be a key parameter for diffusion-limited chemical reactions in the closed environment of the nucleus (Bénichou et al., 2010). We discuss the implications of our observations in terms of gene expression control, and its relation to the spatial organization of genes within the nucleus.
This chapter I made to follow signaling, rather than to precede it. I had already written much of the content before reorganizing the contents. The previous chapters on carbohydrate and on lipid metabolism have already provided much material on proteins and protein function, which was persuasive of the need to introduce signaling, which entails a substantial introduction to conformational changes in proteins that direct the trafficking of metabolic pathways, but more subtly uncovers an important role for microRNAs, not divorced from transcription, but involved in a non-transcriptional role. This is where the classic model of molecular biology lacked any integration with emerging metabolic concepts concerning regulation. Consequently, the science was bereft of understanding the ties between the multiple convergence of transcripts, the selective inhibition of transcriptions, and the relative balance of aerobic and anaerobic metabolism, the weight of the pentose phosphate shunt, and the utilization of available energy source for synthetic and catabolic adaptive responses.
The first subchapter serves to introduce the importance of transcription in translational science. The several subtitles that follow are intended to lay out the scope of the transcriptional activity, and also to direct attention toward the huge role of proteomics in the cell construct. As we have already seen, proteins engage with carbohydrates and with lipids in important structural and signaling processes. They are integrasl to the composition of the cytoskeleton, and also to the extracellular matrix. Many proteins are actually enzymes, carrying out the transformation of some substrate, a derivative of the food we ingest. They have a catalytic site, and they function with a cofactor – either a multivalent metal or a nucleotide.
The amino acids that go into protein synthesis include “indispensable” nutrients that are not made for use, but must be derived from animal protein, although the need is partially satisfied by plant sources. The essential amino acids are classified into well established groups. There are 20 amino acids commonly found in proteins. They are classified into the following groups based on the chemical and/or structural properties of their side chains :
Aliphatic Amino Acids
Cyclic Amino Acid
AAs with Hydroxyl or Sulfur-containing side chains
Inosine triphosphate pyrophosphatase – Pyrophosphatase that hydrolyzes the non-canonical purine nucleotides inosine triphosphate (ITP), deoxyinosine triphosphate (dITP) as well as 2′-deoxy-N-6-hydroxylaminopurine triposphate (dHAPTP) and xanthosine 5′-triphosphate (XTP) to their respective monophosphate derivatives. The enzyme does not distinguish between the deoxy- and ribose forms. Probably excludes non-canonical purines from RNA and DNA precursor pools, thus preventing their incorporation into RNA and DNA and avoiding chromosomal lesions.
Genetic variation of inosine triphosphatase (ITPA) causing an accumulation of inosine triphosphate (ITP) has been shown to protect patients against ribavirin (RBV)-induced anemia during treatment for chronic hepatitis C infection by genome-wide association study (GWAS). However, the biologic mechanism by which this occurs is unknown.
Although ITP is not used directly by human erythrocyte ATPase, it can be used for ATP biosynthesis via ADSS in place of guanosine triphosphate (GTP). With RBV challenge, erythrocyte ATP reduction was more severe in the wild-type ITPA genotype than in the hemolysis protective ITPA genotype. This difference also remains after inhibiting adenosine uptake using nitrobenzylmercaptopurine riboside (NBMPR).
ITP confers protection against RBV-induced ATP reduction by substituting for erythrocyte GTP, which is depleted by RBV, in the biosynthesis of ATP. Because patients with excess ITP appear largely protected against anemia, these results confirm that RBV-induced anemia is due primarily to the effect of the drug on GTP and consequently ATP levels in erythrocytes.
Determination of inosine triphosphate pyrophosphatase phenotype in human red blood cells using HPLC.
Citterio-Quentin A1, Salvi JP, Boulieu R.
Thiopurine drugs, widely used in cancer chemotherapy, inflammatory bowel disease, and autoimmune hepatitis, are responsible for common adverse events. Only some of these may be explained by genetic polymorphism of thiopurine S-methyltransferase. Recent articles have reported that inosine triphosphate pyrophosphatase (ITPase) deficiency was associated with adverse drug reactions toward thiopurine drug therapy. Here, we report a weak anion exchange high-performance liquid chromatography method to determine ITPase activity in red blood cells and to investigate the relationship with the occurrence of adverse events during azathioprine therapy.
The chromatographic method reported allows the analysis of IMP, inosine diphosphate, and ITP in a single run in <12.5 minutes. The method was linear in the range 5-1500 μmole/L of IMP. Intraassay and interassay precisions were <5% for red blood cell lysates supplemented with 50, 500, and 1000 μmole/L IMP. Km and Vmax evaluated by Lineweaver-Burk plot were 677.4 μmole/L and 19.6 μmole·L·min, respectively. The frequency distribution of ITPase from 73 patients was investigated.
The method described is useful to determine the ITPase phenotype from patients on thiopurine therapy and to investigate the potential relation between ITPase deficiency and the occurrence of adverse events.
System wide analyses have underestimated protein abundances and the importance of transcription in mammals
Jingyi Jessica Li1, 2, Peter J Bickel1 and Mark D Biggin3
Using individual measurements for 61 housekeeping proteins to rescale whole proteome data from Schwanhausser et al. (2011), we find that the median protein detected is expressed at 170,000 molecules per cell and that our corrected protein abundance estimates show a higher correlation with mRNA abundances than do the uncorrected protein data. In addition, we estimated the impact of further errors in mRNA and protein abundances using direct experimental measurements of these errors. The resulting analysis suggests that mRNA levels explain at least 56% of the differences in protein abundance for the 4,212 genes detected by Schwanhausser et al. (2011), though because one major source of error could not be estimated the true percent contribution should be higher.We also employed a second, independent strategy to determine the contribution of mRNA levels to protein expression.We show that the variance in translation rates directly measured by ribosome profiling is only 12% of that inferred by Schwanhausser et al. (2011), and that the measured and inferred translation rates correlate poorly (R2 D 0.13). Based on this, our second strategy suggests that mRNA levels explain 81% of the variance in protein levels. We also determined the percent contributions of transcription, RNA degradation, translation and protein degradation to the variance in protein abundances using both of our strategies. While the magnitudes of the two estimates vary, they both suggest that transcription plays a more important role than the earlier studies implied and translation a much smaller role. Finally, the above estimates only apply to those genes whose mRNA and protein expression was detected. Based on a detailed analysis by Hebenstreit et al. (2012), we estimat that approximately 40% of genes in a given cell within a population express no mRNA. Since there can be no translation in the ab-sence of mRNA, we argue that differences in translation rates can play no role in determining the expression levels for the 40% of genes that are non-expressed.
Related studies that reveal issues that are not part of this chapter:
Ubiquitylation in relationship to tissue remodeling
Post-translational modification of proteins
Glycosylation
Phosphorylation
Methylation
Nitrosylation
Sulfation – sulfotransferases
cell-matrix communication
Acetylation and histone deacetylation (HDAC)
Connecting Protein Phosphatase to 1α (PP1α)
Acetylation complexes (such as CBP/p300 and PCAF)
Sirtuins
Rel/NF-kB Signal Transduction
Homologous Recombination Pathway of Double-Strand DNA Repair
Glycination
cyclin dependent kinases (CDKs)
lyase
transferase
This year, the Lasker award for basic medical research went to Kazutoshi Mori (Kyoto University) and Peter Walter (University of California, San Francisco) for their “discoveries concerning the unfolded protein response (UPR) — an intracellular quality control system that
detects harmful misfolded proteins in the endoplasmic reticulum and signals the nucleus to carry out corrective measures.”
About UPR: Approximately a third of cellular proteins pass through the Endoplasmic Reticulum (ER) which performs stringent quality control of these proteins. All proteins need to assume the proper 3-dimensional shape in order to function properly in the harsh cellular environment. Related to this is the fact that cells are under constant stress and have to make rapid, real time decisions about survival or death.
A major indicator of stress is the accumulation of unfolded proteins within the Endoplasmic Reticulum (ER), which triggers a transcriptional cascade in order to increase the folding capacity of the ER. If the metabolic burden is too great and homeostasis cannot be achieved, the response shifts from
damage control to the induction of pro-apoptotic pathways that would ultimately cause cell death.
This response to unfolded proteins or the UPR is conserved among all eukaryotes, and dysfunction in this pathway underlies many human diseases, including Alzheimer’s, Parkinson’s, Diabetes and Cancer.
The discovery of a new class of human proteins with previously unidentified activities
In a landmark study conducted by scientists at the Scripps Research Institute, The Hong Kong University of Science and Technology, aTyr Pharma and their collaborators, a new class of human proteins has been discovered. These proteins [nearly 250], called Physiocrines belong to the aminoacyl tRNA synthetase gene family and carry out novel, diverse and distinct biological functions.
The aminoacyl tRNA synthetase gene family codes for a group of 20 ubiquitous enzymes almost all of which are part of the protein synthesis machinery. Using recombinant protein purification, deep sequencing technique, mass spectroscopy and cell based assays, the team made this discovery. The finding is significant, also because it highlights the alternate use of a gene family whose protein product normally performs catalytic activities for non-catalytic regulation of basic and complex physiological processes spanning metabolism, vascularization, stem cell biology and immunology
Muscle maintenance and regeneration – key player identified
Muscle tissue suffers from atrophy with age and its regenerative capacity also declines over time. Most molecules discovered thus far to boost tissue regeneration are also implicated in cancers. During a quest to find safer alternatives that can regenerate tissue, scientists reported that the hormone Oxytocin is required for proper muscle tissue regeneration and homeostasis and that its levels decline with age.
Oxytocin could be an alternative to hormone replacement therapy as a way to combat aging and other organ related degeneration.
Oxytocin is an age-specific circulating hormone that is necessary for muscle maintenance and regeneration (June 2014)
Role of forkhead box protein A3 in age-associated metabolic decline.
Ma X1, Xu L1, Gavrilova O2, Mueller E3.
Aging is associated with increased adiposity and diminished thermogenesis, but the critical transcription factors influencing these metabolic changes late in life are poorly understood. We recently demonstrated that the winged helix factor forkhead box protein A3 (Foxa3) regulates the expansion of visceral adipose tissue in high-fat diet regimens; however, whether Foxa3 also contributes to the increase in adiposity and the decrease in brown fat activity observed during the normal aging process is currently unknown. Here we report that during aging, levels of Foxa3 are significantly and selectively up-regulated in brown and inguinal white fat depots, and that midage Foxa3-null mice have increased white fat browning and thermogenic capacity, decreased adipose tissue expansion, improved insulin sensitivity, and increased longevity. Foxa3 gain-of-function and loss-of-function studies in inguinal adipose depots demonstrated a cell-autonomous function for Foxa3 in white fat tissue browning. Furthermore, our analysis revealed that the mechanisms of Foxa3 modulation of brown fat gene programs involve the suppression of peroxisome proliferator activated receptor γ coactivtor 1 α (PGC1α) levels through interference with cAMP responsive element binding protein 1-mediated transcriptional regulation of the PGC1α promoter.
Asymmetric mRNA localization contributes to fidelity and sensitivity of spatially localized systems
Although many proteins are localized after translation, asymmetric protein distribution is also achieved by translation after mRNA localization. Why are certain mRNA transported to a distal location and translated on-site? Here we undertake a systematic, genome-scale study of asymmetrically distributed protein and mRNA in mammalian cells. Our findings suggest that asymmetric protein distribution by mRNA localization enhances interaction fidelity and signaling sensitivity. Proteins synthesized at distal locations frequently contain intrinsically disordered segments. These regions are generally rich in assembly-promoting modules and are often regulated by post-translational modifications. Such proteins are tightly regulated but display distinct temporal dynamics upon stimulation with growth factors. Thus, proteins synthesized on-site may rapidly alter proteome composition and act as dynamically regulated scaffolds to promote the formation of reversible cellular assemblies. Our observations are consistent across multiple mammalian species, cell types and developmental stages, suggesting that localized translation is a recurring feature of cell signaling and regulation.
An overview of the potential advantages conferred by distal-site protein synthesis, inferred from our analysis.
An overview of the potential advantages conferred by distal-site protein synthesis
Turquoise and red filled circle represents off-target and correct interaction partners, respectively. Wavy lines represent a disordered region within a distal site synthesis protein. Grey and red line in graphs represents profiles of t…
Tweaking transcriptional programming for high quality recombinant protein production
Since overexpression of recombinant proteins in E. coli often leads to the formation of inclusion bodies, producing properly folded, soluble proteins is undoubtedly the most important end goal in a protein expression campaign. Various approaches have been devised to bypass the insolubility issues during E. coli expression and in a recent report a group of researchers discuss reprogramming the E. coli proteostasis [protein homeostasis] network to achieve high yields of soluble, functional protein. The premise of their studies is that the basal E. coli proteostasis network is insufficient, and often unable, to fold overexpressed proteins, thus clogging the folding machinery.
By overexpressing a mutant, negative-feedback deficient heat shock transcription factor [σ32 I54N] before and during overexpression of the protein of interest, reprogramming can be achieved, resulting in high yields of soluble and functional recombinant target protein. The authors explain that this method is better than simply co-expressing/over-expressing chaperones, co-chaperones, foldases or other components of the proteostasis network because reprogramming readies the folding machinery and up regulates the essential folding components beforehand thus maintaining system capability of the folding machinery.
The Heat-Shock Response Transcriptional Program Enables High-Yield and High-Quality Recombinant Protein Production in Escherichia coli (July 2014)
Unfolded proteins collapse when exposed to heat and crowded environments
Proteins are important molecules in our body and they fulfil a broad range of functions. For instance as enzymes they help to release energy from food and as muscle proteins they assist with motion. As antibodies they are involved in immune defence and as hormone receptors in signal transduction in cells. Until only recently it was assumed that all proteins take on a clearly defined three-dimensional structure – i.e. they fold in order to be able to assume these functions. Surprisingly, it has been shown that many important proteins occur as unfolded coils. Researchers seek to establish how these disordered proteins are capable at all of assuming highly complex functions.
Ben Schuler’s research group from the Institute of Biochemistry of the University of Zurich has now established that an increase in temperature leads to folded proteins collapsing and becoming smaller. Other environmental factors can trigger the same effect.
Measurements using the “molecular ruler”
“The fact that unfolded proteins shrink at higher temperatures is an indication that cell water does indeed play an important role as to the spatial organisation eventually adopted by the molecules”, comments Schuler with regard to the impact of temperature on protein structure. For their studies the biophysicists use what is known as single-molecule spectroscopy. Small colour probes in the protein enable the observation of changes with an accuracy of more than one millionth of a millimetre. With this “molecular yardstick” it is possible to measure how molecular forces impact protein structure.
With computer simulations the researchers have mimicked the behaviour of disordered proteins.
(Courtesy of Jose EDS Roselino, PhD.
MLKL compromises plasma membrane integrity
Necroptosis is implicated in many diseases and understanding this process is essential in the search for new therapies. While mixed lineage kinase domain-like (MLKL) protein has been known to be a critical component of necroptosis induction, how MLKL transduces the death signal was not clear. In a recent finding, scientists demonstrated that the full four-helical bundle domain (4HBD) in the N-terminal region of MLKL is required and sufficient to induce its oligomerization and trigger cell death.
They also found a patch of positively charged amino acids on the surface of the 4HBD that bound to phosphatidylinositol phosphates (PIPs) and allowed the recruitment of MLKL to the plasma membrane that resulted in the formation of pores consisting of MLKL proteins, due to which cells absorbed excess water causing them to explode. Detailed knowledge about how MLKL proteins create pores offers possibilities for the development of new therapeutic interventions for tolerating or preventing cell death.
MLKL compromises plasma membrane integrity by binding to phosphatidylinositol phosphates (May 2014)
Mitochondrial and ER proteins implicated in dementia
Mitochondria and the endoplasmic reticulum (ER) form tight structural associations that facilitate a number of cellular functions. However, the molecular mechanisms of these interactions aren’t properly understood.
A group of researchers showed that the ER protein VAPB interacted with mitochondrial protein PTPIP51 to regulate ER-mitochondria associations and that TDP-43, a protein implicated in dementia, disturbs this interaction to regulate cellular Ca2+ homeostasis. These studies point to a new pathogenic mechanism for TDP-43 and may also provide a potential new target for the development of new treatments for devastating neurological conditions like dementia.
ER-mitochondria associations are regulated by the VAPB-PTPIP51 interaction and are disrupted by ALS/FTD-associated TDP-43. Nature (June 2014)
A novel strategy to improve membrane protein expression in Yeast
Membrane proteins play indispensable roles in the physiology of an organism. However, recombinant production of membrane proteins is one of the biggest hurdles facing protein biochemists today. A group of scientists in Belgium showed that,
by increasing the intracellular membrane production by interfering with a key enzymatic step of lipid synthesis,
enhanced expression of recombinant membrane proteins in yeast is achieved.
Specifically, they engineered the oleotrophic yeast, Yarrowia lipolytica, by
deleting the phosphatidic acid phosphatase, PAH1 gene,
which led to massive proliferation of endoplasmic reticulum (ER) membranes.
For all 8 tested representatives of different integral membrane protein families, they obtained enhanced protein accumulation.
An unconventional method to boost recombinant protein levels
MazF is an mRNA interferase enzyme in E.coli that functions as and degrades cellular mRNA in a targeted fashion, at the “ACA” sequence. This degradation of cellular mRNA causes a precipitous drop in cellular protein synthesis. A group of scientists at the Robert Wood Johnson Medical School in New Jersey, exploited the degeneracy of the genetic code to modify all “ACA” triplets within their gene of interest in a way that the corresponding amino acid (Threonine) remained unchanged. Consequently, induction of MazF toxin caused degradation of E.coli cellular mRNA but the recombinant gene transcription and protein synthesis continued, causing significant accumulation of high quality target protein. This expression system enables unparalleled signal to noise ratios that could dramatically simplify structural and functional studies of difficult-to-purify, biologically important proteins.
Tandem fusions and bacterial strain evolution for enhanced functional membrane protein production
Membrane protein production remains a significant challenge in its characterization and structure determination. Despite the fact that there are a variety of host cell types, E.coli remains the popular choice for producing recombinant membrane proteins. A group of scientists in Netherlands devised a robust strategy to increase the probability of functional membrane protein overexpression in E.coli.
By fusing Green Fluorescent Protein (GFP) and the Erythromycin Resistance protein (ErmC) to the C-terminus of a target membrane protein they wer e able to track the folding state of their target protein while using Erythromycin to select for increased expression. By increasing erythromycin concentration in the growth media and testing different membrane targets, they were able to identify four evolved E.coli strains, all of which carried a mutation in the hns gene, whose product is implicated in genome organization and transcriptional silencing. Through their experiments the group showed that partial removal of the transcriptional silencing mechanism was related to production of proteins that were essential for functional overexpression of membrane proteins.
The role of an anti-apoptotic factor in recombinant protein production
In a recent study, scientists at the Johns Hopkins University and Frederick National Laboratory for Cancer Research examined an alternative method of utilizing the benefits of anti-apoptotic gene expression to enhance the transient expression of biotherapeutics, specifically, through the co-transfection of Bcl-xL along with the product-coding target gene.
Chinese Hamster Ovary(CHO) cells were co-transfected with the product-coding gene and a vector containing Bcl-xL, using Polyethylenimine (PEI) reagent. They found that the cells co-transfected with Bcl-xL demonstrated reduced apoptosis, increased specific productivity, and an overall increase in product yield.
B-cell lymphoma-extra-large (Bcl-xL) is a mitochondrial transmembrane protein and a member of the Bcl-2 family of proteins which are known to act as either pro- or anti-apoptotic proteins. Bcl-xL itself acts as an anti-apoptotic molecule by preventing the release of mitochondrial contents such as cytochrome c, which would lead to caspase activation. Higher levels of Bcl-xL push a cell toward survival mode by making the membranes pores less permeable and leaky.
Introduction to Protein Synthesis and DegradationUpdated 8/31/2019
N-Terminal Degradation of Proteins: The N-End Rule and N-degrons
In both prokaryotes and eukaryotes mitochondria and chloroplasts, the ribosomal synthesis of proteins is initiated with the addition of the N-formyl methionine residue. However in eukaryotic cytosolic ribosomes, the N terminal was assumed to be devoid of the N-formyl group. The unformylated N-terminal methionine residues of eukaryotes is then often N-acetylated (Ac) and creates specific degradation signals, the Ac N-end rule. These N-end rule pathways are proteolytic systems which recognize these N-degrons resulting in proteosomal degradation or autophagy. In prokaryotes this system is stimulated by certain amino acid deficiencies and in eukaryotes is dependent on the Psh1 E3 ligase.
Two papers in the journal Science describe this N-degron in more detail.
In both bacteria and eukaryotic mitochondria and chloroplasts, the ribosomal synthesis of proteins is initiated with the N-terminal (Nt) formyl-methionine (fMet) residue. Nt-fMet is produced pretranslationally by formyltransferases, which use 10-formyltetrahydrofolate as a cosubstrate. By contrast, proteins synthesized by cytosolic ribosomes of eukaryotes were always presumed to bear unformylated N-terminal Met (Nt-Met). The unformylated Nt-Met residue of eukaryotic proteins is often cotranslationally Nt-acetylated, a modification that creates specific degradation signals, Ac/N-degrons, which are targeted by the Ac/N-end rule pathway. The N-end rule pathways are a set of proteolytic systems whose unifying feature is their ability to recognize proteins containing N-degrons, thereby causing the degradation of these proteins by the proteasome or autophagy in eukaryotes and by the proteasome-like ClpAP protease in bacteria. The main determinant of an N‑degron is a destabilizing Nt-residue of a protein. Studies over the past three decades have shown that all 20 amino acids of the genetic code can act, in cognate sequence contexts, as destabilizing Nt‑residues. The previously known eukaryotic N-end rule pathways are the Arg/N-end rule pathway, the Ac/N-end rule pathway, and the Pro/N-end rule pathway. Regulated degradation of proteins and their natural fragments by the N-end rule pathways has been shown to mediate a broad range of biological processes.
RATIONALE
The chemical similarity of the formyl and acetyl groups and their identical locations in, respectively, Nt‑formylated and Nt-acetylated proteins led us to suggest, and later to show, that the Nt-fMet residues of nascent bacterial proteins can act as bacterial N-degrons, termed fMet/N-degrons. Here we wished to determine whether Nt-formylated proteins might also form in the cytosol of a eukaryote such as the yeast Saccharomyces cerevisiae and to determine the metabolic fates of Nt-formylated proteins if they could be produced outside mitochondria. Our approaches included molecular genetic techniques, mass spectrometric analyses of proteins’ N termini, and affinity-purified antibodies that selectively recognized Nt-formylated reporter proteins.
RESULTS
We discovered that the yeast formyltransferase Fmt1, which is imported from the cytosol into the mitochondria inner matrix, can generate Nt-formylated proteins in the cytosol, because the translocation of Fmt1 into mitochondria is not as efficacious, even under unstressful conditions, as had previously been assumed. We also found that Nt‑formylated proteins are greatly up-regulated in stationary phase or upon starvation for specific amino acids. The massive increase of Nt-formylated proteins strictly requires the Gcn2 kinase, which phosphorylates Fmt1 and mediates its retention in the cytosol. Notably, the ability of Gcn2 to retain a large fraction of Fmt1 in the cytosol of nutritionally stressed cells is confined to Fmt1, inasmuch as the Gcn2 kinase does not have such an effect, under the same conditions, on other examined nuclear DNA–encoded mitochondrial matrix proteins. The Gcn2-Fmt1 protein localization circuit is a previously unknown signal transduction pathway. A down-regulation of cytosolic Nt‑formylation was found to increase the sensitivity of cells to undernutrition stresses, to a prolonged cold stress, and to a toxic compound. We also discovered that the Nt-fMet residues of Nt‑formylated cytosolic proteins act as eukaryotic fMet/N-degrons and identified the Psh1 E3 ubiquitin ligase as the recognition component (fMet/N-recognin) of the previously unknown eukaryotic fMet/N-end rule pathway, which destroys Nt‑formylated proteins.
CONCLUSION
The Nt-formylation of proteins, a long-known pretranslational protein modification, is mediated by formyltransferases. Nt-formylation was thought to be confined to bacteria and bacteria-descended eukaryotic organelles but was found here to also occur at the start of translation by the cytosolic ribosomes of a eukaryote. The levels of Nt‑formylated eukaryotic proteins are greatly increased upon specific stresses, including undernutrition, and appear to be important for adaptation to these stresses. We also discovered that Nt-formylated cytosolic proteins are selectively destroyed by the eukaryotic fMet/N-end rule pathway, mediated by the Psh1 E3 ubiquitin ligase. This previously unknown proteolytic system is likely to be universal among eukaryotes, given strongly conserved mechanisms that mediate Nt‑formylation and degron recognition.
(Top) Under undernutrition conditions, the Gcn2 kinase augments the cytosolic localization of the Fmt1 formyltransferase, and possibly also its enzymatic activity. Consequently, Fmt1 up-regulates the cytosolic fMet–tRNAi (initiator transfer RNA), and thereby increases the levels of cytosolic Nt-formylated proteins, which are required for the adaptation of cells to specific stressors. (Bottom) The Psh1 E3 ubiquitin ligase targets the N-terminal fMet-residues of eukaryotic cytosolic proteins, such as Cse4, Pgd1, and Rps22a, for the polyubiquitylation-mediated, proteasome-dependent degradation.
(Top) Under undernutrition conditions, the Gcn2 kinase augments the cytosolic localization of the Fmt1 formyltransferase, and possibly also its enzymatic activity. Consequently, Fmt1 up-regulates the cytosolic fMet–tRNAi (initiator transfer RNA), and thereby increases the levels of cytosolic Nt-formylated proteins, which are required for the adaptation of cells to specific stressors. (Bottom) The Psh1 E3 ubiquitin ligase targets the N-terminal fMet-residues of eukaryotic cytosolic proteins, such as Cse4, Pgd1, and Rps22a, for the polyubiquitylation-mediated, proteasome-dependent degradation.
The second paper describes a glycine specific N-degron pathway in humans. Specifically the authors set up a screen to identify specific N-terminal degron motifs in the human. Findings included an expanded repertoire for the UBR E3 ligases to include substrates with arginine and lysine following an intact initiator methionine and a glycine at the extreme N-terminus, which is a potent degron.
Glycine N-degron regulation revealed
For more than 30 years, N-terminal sequences have been known to influence protein stability, but additional features of these N-end rule, or N-degron, pathways continue to be uncovered. Timms et al. used a global protein stability (GPS) technology to take a broader look at these pathways in human cells. Unexpectedly, glycine exposed at the N terminus could act as a potent degron; proteins bearing N-terminal glycine were targeted for proteasomal degradation by two Cullin-RING E3 ubiquitin ligases through the substrate adaptors ZYG11B and ZER1. This pathway may be important, for example, to degrade proteins that fail to localize properly to cellular membranes and to destroy protein fragments generated during cell death.
The ubiquitin-proteasome system is the major route through which the cell achieves selective protein degradation. The E3 ubiquitin ligases are the major determinants of specificity in this system, which is thought to be achieved through their selective recognition of specific degron motifs in substrate proteins. However, our ability to identify these degrons and match them to their cognate E3 ligase remains a major challenge.
RATIONALE
It has long been known that the stability of proteins is influenced by their N-terminal residue, and a large body of work over the past three decades has characterized a collection of N-end rule pathways that target proteins for degradation through N-terminal degron motifs. Recently, we developed Global Protein Stability (GPS)–peptidome technology and used it to delineate a suite of degrons that lie at the extreme C terminus of proteins. We adapted this approach to examine the stability of the human N terminome, allowing us to reevaluate our understanding of N-degron pathways in an unbiased manner.
RESULTS
Stability profiling of the human N terminome identified two major findings: an expanded repertoire for UBR family E3 ligases to include substrates that begin with arginine and lysine following an intact initiator methionine and, more notably, that glycine positioned at the extreme N terminus can act as a potent degron. We established human embryonic kidney 293T reporter cell lines in which unstable peptides that bear N-terminal glycine degrons were fused to green fluorescent protein, and we performed CRISPR screens to identify the degradative machinery involved. These screens identified two Cul2 Cullin-RING E3 ligase complexes, defined by the related substrate adaptors ZYG11B and ZER1, that act redundantly to target substrates bearing N-terminal glycine degrons for proteasomal degradation. Moreover, through the saturation mutagenesis of example substrates, we defined the composition of preferred N-terminal glycine degrons specifically recognized by ZYG11B and ZER1.
We found that preferred glycine degrons are depleted from the native N termini of metazoan proteomes, suggesting that proteins have evolved to avoid degradation through this pathway, but are strongly enriched at annotated caspase cleavage sites. Stability profiling of N-terminal peptides lying downstream of all known caspase cleavages sites confirmed that Cul2ZYG11Band Cul2ZER1 could make a substantial contribution to the removal of proteolytic cleavage products during apoptosis. Last, we identified a role for ZYG11B and ZER1 in the quality control of N-myristoylated proteins. N-myristoylation is an important posttranslational modification that occurs exclusively on N-terminal glycine. By profiling the stability of the human N-terminome in the absence of the N-myristoyltransferases NMT1 and NMT2, we found that a failure to undergo N-myristoylation exposes N-terminal glycine degrons that are otherwise obscured. Thus, conditional exposure of glycine degrons to ZYG11B and ZER1 permits the selective proteasomal degradation of aberrant proteins that have escaped N-terminal myristoylation.
CONCLUSION
These data demonstrate that an additional N-degron pathway centered on N-terminal glycine regulates the stability of metazoan proteomes. Cul2ZYG11B– and Cul2ZER1-mediated protein degradation through N-terminal glycine degrons may be particularly important in the clearance of proteolytic fragments generated by caspase cleavage during apoptosis and in the quality control of protein N-myristoylation.
Stability profiling of the human N-terminome revealed that N-terminal glycine acts as a potent degron. CRISPR screening revealed two Cul2 complexes, defined by the related substrate adaptors ZYG11B and ZER1, that recognize N-terminal glycine degrons. This pathway may be particularly important for the degradation of caspase cleavage products during apoptosis and the removal of proteins that fail to undergo N-myristoylation.
Stability profiling of the human N-terminome revealed that N-terminal glycine acts as a potent degron. CRISPR screening revealed two Cul2 complexes, defined by the related substrate adaptors ZYG11B and ZER1, that recognize N-terminal glycine degrons. This pathway may be particularly important for the degradation of caspase cleavage products during apoptosis and the removal of proteins that fail to undergo N-myristoylation.
Metabolomics is about Metabolic Systems Integration
Author and Curator: Larry H Bernstein, MD, FCAP
This is an exploration of biological thoughts in the series on metabolomics, putting enzymatic reactions, proteins and protein conformation, and subanatomic structure into a more complete perspective in order to realize normal and dysfunctional states
of eukaryoticcells and organ systems and prokaryotic organisms. There are structures and functions that have evolved in evolution that have concordance, even
if we find variation on themes. Moreover, these have to be understood in a systems oriented view to have any clarity, which is currently an ongoing proposal.
It is perhaps relevant to quote Radoslav Bosov on his observation:
“After finishing her portion of the work on DNA, Franklin led pioneering work on the tobacco mosaic virus and the polio virus. She died in 1958 at the age of 37 of ovarian cancer.” My job is to illuminate what is cancer, but serving structural identity issues.
DNA is not DNA, as RNA is not RNA as proteins are not Proteins, there is only time – interference of particles/strings/waves within ever emerging discrete relative spaces where energy transforms from one absolute form into another!
He adds the following: “A 2005 study showed methionine restriction without energy restriction extends mouse lifespan.” BUT balancing energy is not as same as balancing matter due quantum electrodynamics interference and transfromability – http://en.wikipedia.org/wiki/Methionine
I have made the following calculations!
1 – methyl groups = i Ln (1 – Lactate )/Ln (Oxygen) – K (O) =
i Ln (1/(Sqrt (1 – Acetate^2)) /Ln(Oxygen) – K(O) = i Ln (Glyoxylate)/Ln (Oxygen) – K(O)
where K(O) – mechanical electro magnetics pressure, with increase of T, increase of S (entropy), and 1-S = negative entropy
But don’t try to realize the path of derivation, it would get you in dark matter issues – water!
The problem seems to be:
Methionine is necessary to provide S for acetyl CoA
Insufficiency of this amino acid has consequences, which leads to increased homocysteine
This imbalance is also associated with a decrease in lewan body mass
Of course, the reality is that geographic location, proximity to volcanic ash, and temperate zone have relevance, as does food source, and they are relevant variables
JEDS Rosalino has referred to the important conclusion in Erwin Schroedinger’s “What is Life?”, and Schroedinger’s cat. It is impossible to come up with a predictive equation to explain life.
It had to come from a founder of “Quantum Mechanics” because, unlike economics, physics is a science based on experimental validation. In entering biology from Physics to make it more rigorous, as was the case for Max Delbruck, who was preceded by the Cori’s, Beadle and Tatum, Herschey, Luria, Dubecco, Kornberg and Ochoa, Lipmann, Watson and Crick, a discipline called “Molecular Biology and Biochemistry” emerged that would open the secrets of life. Beadle and Tatum gave us “one gene – one enzyme”, a formulation that led in medical teaching from William Osler’s edict to “Inherited Metabolic Disorders” – gene related disruption of the chemical reactions taking place in the body to convert or use energy. Physiological chemistry taught:
Breaking down the carbohydrates, proteins, and fats in food to release energy.
Transforming excess nitrogen into waste products excreted in urine.
Breaking down or converting chemicals into other substances and transporting them inside cells.
Metabolism is an organized but chaotic chemical assembly line. Raw materials, half-finished products, and waste materials are constantly being used, produced, transported, and excreted. The “workers” on the assembly line are enzymes and other proteins that make chemical reactions happen. – http://www.webmd.com/a-to-z-guides/inherited-metabolic-disorder-types-and-treatments
The original cause of most genetic metabolic disorders is a gene mutation that occurred many, many generations ago. Each inherited metabolic disorder is quite rare in the general population, affecting about 1 in 1,000 to 2,500 newborns. But the developments now refocused an emphasis on HOW – a gene mutation occurs that is passed on through generations. This had to be derived initially from methods developed in prokaryotes in order to relieve the complexity. However, complexity came from evolutionary events over a long time span.
Yeast cells display synchronized oscillation between
phases of high and low oxygen consumption
accompanied by a program of cyclical gene expression.
A study monitoring
mRNA levels,
histone modifications and
chromatin occupancy of histone modifiers
during the yeast metabolic cycle (YMC) at high temporal resolution reveals both
‘just-in-time’ supply of YMC gene products and
new patterns of chromatin reconfiguration
associated with transcriptional regulation.
Figure 1: The yeast metabolic cycle.
The YMC is divided into metabolic phases that correspond to periods of high and low oxygen concentration in the culture medium. The program of gene (mRNA) expression during the YMC is composed of successive reductive-charging (RC),… http://www.nature.com/nsmb/journal/v21/n10/carousel/nsmb.2898-F1.jpg
Figure 2: Modes of transcriptional regulation during the YMC.
Modes of transcriptional regulation during the YMC
(a) Previous work on cycling cells in batch culture revealed that H3K4me3 is typically limited to the promoter region of active genes (MET16 shown here 9, 10). (b) During the YMC, however, the OX gene RMT2 is marked by H3K4me3 regardles…
Under continuous, glucose-limited conditions, budding yeast exhibit
robust metabolic cycles
associated with major oscillations of gene expression.
We examine the correlated
genome-wide transcription and chromatin states
across the yeast metabolic cycle
at unprecedented temporal resolution,
revealing a ‘just-in-time supply chain’
by which components from specific cellular processes such as ribosome biogenesis become available in a highly coordinated manner. We identify
distinct chromatin and splicing patterns
associated with different gene categories and
determine the relative timing of chromatin modifications
relative to maximal transcription.
There is unexpected variation in the chromatin modification and expression relationship, with
histone acetylation peaks occurring with
varying timing and ‘sharpness’ relative to RNA expression
both within and between cycle phases.
Chromatin-modifier occupancy reveals subtly distinct spatial and temporal patterns compared to those of the modifications themselves.
Figure 1: High-temporal-resolution analysis of gene expression reveals meticulous temporal compartmentalization in yeast.
High-temporal-resolution analysis of gene expression
Oscillation of oxygen (dO2) in the YMC. The 16 time points of one cycle for RNA-seq are labeled. Metabolic phases are color coded throughout figures: magenta, OX phase; green, RB phase; blue, RC phase. (b–d) Subtly distinct tempor…
Figure 2: RNA-seq analysis at introns reveals transient accumulation of pre-mRNAs during OX phase.
RNA-seq analysis at introns reveals transient accumulation of pre-mRNAs
Relative RNA signals at intron-containing genes. Each track represents relative RNA levels at one of 16 time points, ordered sequentially from top to bottom. Signals are displayed as a percentage of the maximum value of the 16 time… http://www.nature.com/nsmb/journal/v21/n10/carousel/nsmb.2881-F2.jpg
Figure 3: Dynamic chromatin states across the YMC.
Dynamic chromatin states across the YMC
(a)Oscillation of oxygen in one YMC. Cycling cells were collected at 16 intentionally uneven time points over one cycle for ChIP-seq. (b,c) Temporal relationship between RNA level and histone modifications at the RMT2 locus. (b) RNA…
We present a quantitative model to demonstrate that
coclustering multiple enzymes into compact agglomerates
accelerates the processing of intermediates,
yielding the same efficiency benefits as direct channeling,
a well-known mechanism in which enzymes are funneled between enzyme active sites through a physical tunnel. The model predicts
the separation and size of coclusters that maximize metabolic efficiency,
and this prediction is in agreement with previously reported spacings between coclusters in mammalian cells.
For direct validation, we study a metabolic branch point in Escherichia coli and experimentally confirm the model prediction that enzyme agglomerates can
accelerate the processing of a shared intermediate by one branch, and thus
regulate steady-state flux division.
Our studies establish a quantitative framework to understand coclustering-mediated metabolic channeling
Figure 1: Different types of intermediate channeling in a two-step metabolic pathway, where a substrate is processed by enzyme E1 and turned into intermediate, which is then processed by enzyme E2 and turned into product.
two-step metabolic pathway
Direct channeling. The intermediate is funneled from enzyme E1 to enzyme E2 by means of a protein tunnel that connects the active sites of E1 and E2, thus preventing the intermediate from diffusing away. (b) Proximity channeling. http://www.nature.com/nbt/journal/v32/n10/carousel/nbt.3018-F1.jpg
Figure 2: Two-step metabolic pathway with an unstable intermediate.
Two-step metabolic pathway with an unstable intermediate
(a) The two-step metabolic pathway. Substrate S0 is processed by enzyme E1 and turned into intermediate S1, which is then processed by enzyme E2 and turned into product P. (b) Enzyme configurations in the two-step metabolic pathway. Le… http://www.nature.com/nbt/journal/v32/n10/carousel/nbt.3018-F2.jpg
Part 3. Antibiotics directed at specific DNA sequences
Sequence-specific antimicrobials using efficiently delivered RNA-guided nucleases
Current antibiotics tend to be broad spectrum, leading to
indiscriminate killing of commensal bacteria and
accelerated evolution of drug resistance.
Here, we use CRISPR-Cas technology to create antimicrobials
whose spectrum of activity is chosen by design.
RNA-guided nucleases (RGNs) targeting specific DNA sequences are delivered efficiently to microbial populations using bacteriophage or bacteria carrying plasmids transmissible by conjugation. The DNA targets of RGNs can be
undesirable genes or polymorphisms,
including antibiotic resistance and virulence determinants in
carbapenem-resistant Enterobacteriaceae and
enterohemorrhagic Escherichia coli.
Delivery of RGNs significantly improves survival in a Galleria mellonella infection model. We also show that
RGNs enable modulation of complex bacterial populations
by selective knockdown of targeted strains
based on genetic signatures.
RGNs constitute a class of highly discriminatory, customizable antimicrobials that enact
selective pressure at the DNA level to
reduce the prevalence of undesired genes,
minimize off-target effects and
enable programmable remodeling of microbiota.
Figure 1: RGN constructs delivered by bacteriophage particles (ΦRGN) exhibit efficient and specific antimicrobial effects against strains harboring plasmid or chromosomal target sequences
RGN constructs delivered by bacteriophage particles
(a) Bacteriophage-delivered RGN constructs differentially affect host cell physiology in a sequence-dependent manner. If the target sequence is: (i) absent, the RGN exerts no effect; (ii) chromosomal, RGN activity is cytotoxic; (iii) e…
Figure 3: ΦRGN particles elicit sequence-specific toxicity against enterohemorrhagic E. coli in vitroand in vivo.
ΦRGN particles elicit sequence-specific toxicity against enterohemorrhagic E. coli in vitro and in vivo.
(a) E. coli EMG2 wild-type (WT) cells or ATCC 43888 F′ (EHEC) cells were treated with SM buffer, ΦRGNndm-1 orΦRGNeae at a multiplicity of infection (MOI) ~100 and plated onto LB agar to enumerate total cell number or LB+kanamycin (Km)… http://www.nature.com/nbt/journal/vaop/ncurrent/carousel/nbt.3011-F3.jpg
Part 4. Structure and Isoform functions
Structures of human constitutive nitric oxide synthases.
H Li, J Jamal, C Plaza, SH Pineda, G Chreifi, Q Jing, MA Cinelli, RB Silverman, TLPoulos, [more]
Acta Crystallographica Section D Biological Crystallography (Impact Factor: 12.67). 10/2014; 70(Pt 10):2667-74. http://dx.doi.org:/10.1107/S1399004714017064
Mammals produce three isoforms of nitric oxide synthase (NOS):
neuronal NOS (nNOS),
inducible NOS (iNOS) and
endothelial NOS (eNOS).
The overproduction of NO by nNOS is associated with a number of neurodegenerative disorders; therefore, a desirable therapeutic goal is
the design of drugs that target nNOS
but not the other isoforms.
Crystallography, coupled with computational approaches and medicinal chemistry, has played a critical role in developing highly
selective nNOS inhibitors that
exhibit exceptional neuroprotective properties.
For historic reasons, crystallography has focused on rat nNOS and bovine eNOS because these were available in high quality; thus, their structures have been used in
structure-activity-relationship studies.
Although these constitutive NOSs share more than 90% sequence identity across mammalian species for each NOS isoform,
inhibitor-binding studies revealed that subtle differences near the heme active site
in the same NOS isoform across species still impact enzyme-inhibitor interactions.
Therefore, structures of the human constitutive NOSs are indispensible. Here, the first structure of human neuronal NOS at 2.03 Å resolution is reported and a different crystal form of human endothelial NOS is reported at 1.73 Å resolution.
“We are learning more about less and less” – PJ Russell. 1973.
Part 5. Global Metabolomics
Global Metabolomics Market (Technique, Application, Indication and Geography) – Size, Application Analysis, Regional Outlook, Competitive Strategies and Forecasts, 2014 – 2020
Metabolomics is
the study of chemical processes which involve metabolites.
Metabolites are small molecules present in the blood, tissues and urine. Metabolomics pertains to the study of the
unique chemical fingerprints left behind by cellular processes.
These metabolite fingerprints could be used to learn about the health of an organism. It is an upcoming technology in the field of analytical biochemistry. Metabolomics has become an experimental technique that can be applied in medicine, biology and environmental science. The incorporation of computers has enabled
the creation of computational metabolomics that has application in life sciences.
Metabolics finds application in other areas as well; for instance, it is used to identify the quality, taste and nutritional value of food in the food science field.
The metabolomics market is segmented based on its application in different fields such as
biomarkers discovery,
drug discovery,
toxicology testing,
nutrigenomics,
clinical studies etc.
The drug discovery segment holds the dominant share in the metabolomics market due to its crucial role in
drug target identification & validation and
optimization & prioritization of diagnostic approaches for oncology research.
The metabolomics market is expected to grow at a rapid rate due to the rise in the number of
pre clinical & clinical trials,
advancements in toxicological studies and
growing awareness about nutritional products.
The stellar growth of data analysis software & solutions in metabolomics and its use in the biomarker screening of diseases would fuel the growth of the metabolomics market. The metabolomics market is also segmented based on techniques into
gas chromatography,
high performance liquid chromatography (HPLC),
ultra performance liquid chromatography, and
capillary electrophoresis.
HPLC holds the dominant share in the metabolomics market.
KEY BENEFITS
In-depth analysis of various regions would enable a clear understanding of current and future trends so that companies can make region specific plans
Comprehensive analysis of the factors that drive and restrict the growth of the metabolomics market
Key regulatory guidelines in various regions which impact the metabolomics market
Quantitative analysis of the current market
Deep dive analysis of various regions
Value chain analysis enables a clear understanding of the roles of the stakeholders involved in the supply chain of the metabolomics market
Market Segmentation
The metabolomics market is segmented based on techniques, applications, indication and geography


 Thursday 15 October 2015, 12:00–13:00


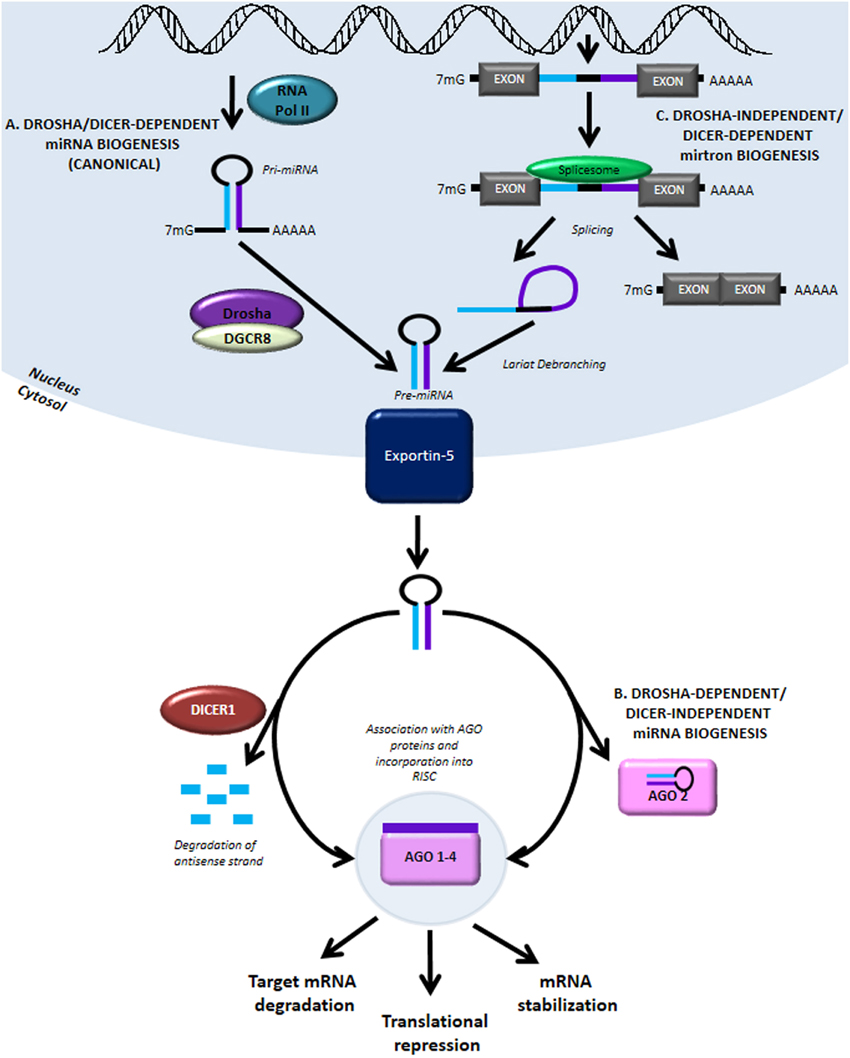
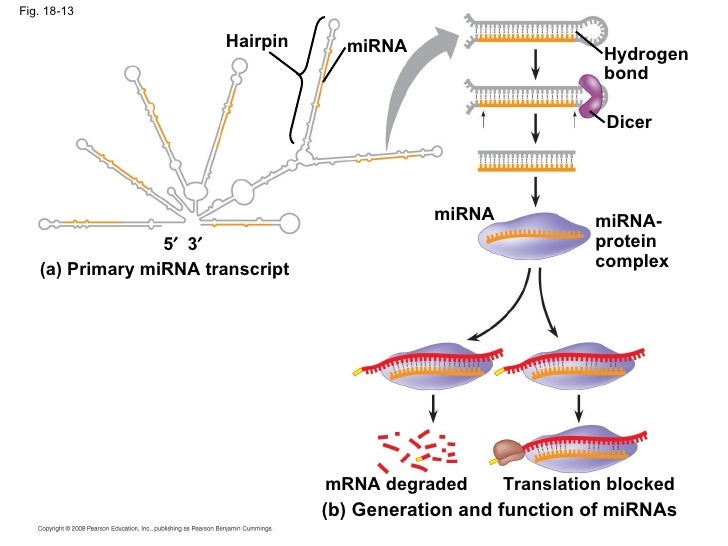
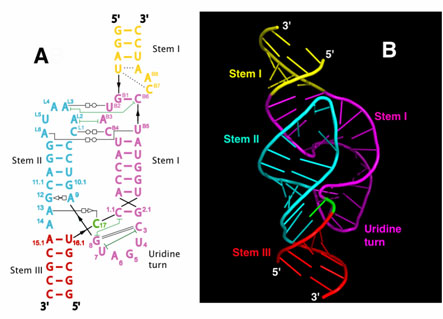
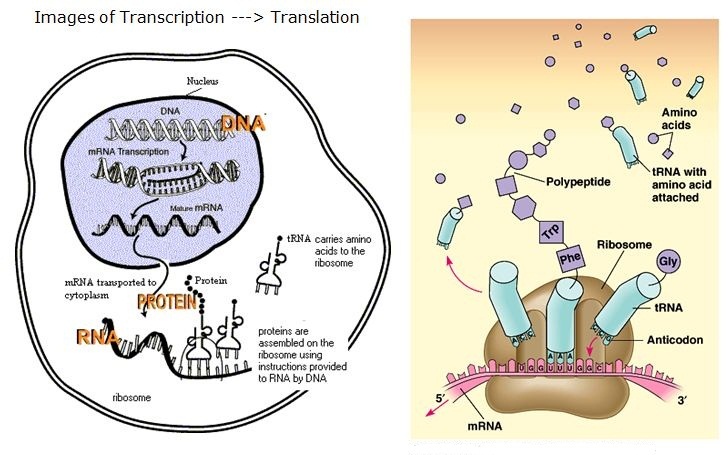