RNAi – On Transcription and Metabolic Control
Writer and Curator: Larry H Bernstein, MD, FCAP
RNAi
This is the third contribution to a series on transcription and metabolic control. It reveals the enormous complexity in this emerging research.
mRNA, small RNAs, long RNAs, RNAi and DicAR
Aberrant mRNA translation in cancer pathogenesis
Pier Paolo Pandolfi
Oncogene (2004) 23, 3134–3137
http://dx.doi.org:/10.1038/sj.onc.1207618
As the molecular processes that control mRNA translation and ribosome biogenesis in the eukaryotic cell are extremely complex and multilayered, their deregulation can in principle occur at multiple levels, leading to both disease and cancer pathogenesis. For a long time, it was speculated that disruption of these processes may participate in tumorigenesis, but this notion was, until recently, solely supported by correlative studies. Strong genetic support is now being accrued, while new molecular links between tumor-suppressive and oncogenic pathways and the control of protein synthetic machinery are being unraveled. The importance of aberrant protein synthesis in tumorigenesis is further underscored by the discovery that compounds such as Rapamycin, known to modulate signaling pathways regulatory of this process, are effective anticancer drugs. A number of fundamental questions remain to be addressed and a number of novel ones emerge as this exciting field evolves.
mRNA Translation and Energy Metabolism in Cancer
I. Topisirovic and N. Sonenberg
Cold Spring Harbor Symposia on Quantitative Biology, Volume LXXVI
http://dx.doi.org:/10.1101/sqb.2011.76.010785
A prominent feature of cancer cells is the use of aerobic glycolysis under conditions in which oxygen levels are sufficient to support energy production in the mitochondria (Jones and Thompson 2009; Cairns et al. 2010). This phenomenon, named the “Warburg effect,” after its discoverer Otto Warburg, is thought to fuel the biosynthetic requirements of the neoplastic growth (Warburg 1956; Koppenol et al. 2011) and has recently been acknowledged as one of the hallmarks of cancer (Hanahan and Weinberg 2011). mRNA translation is the most energy-demanding process in the cell (Buttgereit and Brand 1995).In mammalian cells it consumes >20% of cellular ATP, not considering the energy that is required for the biosynthesis of the components of the translational machinery (e.g., ribosome biogenesis; Buttgereit and Brand 1995). Control of mRNA translation plays a pivotal role in the regulation of gene expression (Sonenberg and Hinnebusch 2009). In fact, a recent study demonstrated that mammalian proteome is mostly governed at the mRNA translation level (Schwanhausser et al. 2011). Malfunction of mRNA translation critically contributes to human disease, including diabetes, heart disease, blood disorders, and, most notably, cancer (Fig. 1; Crozier et al. 2006; Narla and Ebert 2010; Silvera et al. 2010; Spriggs et al. 2010). The first account of changes in the translational apparatus in cancer dates back to 1896, showing enlarged and irregularly shaped nucleoli that are the site of ribosome biogenesis (Pianese 1896). Rapidly proliferating cancer cells have more ribosomes than normal cells.
| Figure 1. Dysregulated mRNA translation plays a pivotal role in cancer. Malignant cells are characterized by enlarged nucleoli and a larger number of ribosomes than their normal counterparts. Mutations and/or altered expression of ribosomal proteins (e.g., RPS19, RPS 24), rRNA-modifying enzymes (e.g., dyskerin), translation initiation factors (e.g., eIF4E), or the initiator tRNA (tRNAiMet) result in malignant transformation. Signaling pathways whose dysfunction is frequent in cancer (e.g., MAPK, PI3K/AKT) affect mRNA translation. Perturbations in the translatome result in aberrant cellular growth, proliferation, and survival characteristic of tumorigenesis. |
In stark contrast to normal cells, in cancer cells ribosomal biogenesis is uncoupled from cell proliferation (Stanners et al. 1979). Accordingly, cancer cells exhibit abnormally high rates of protein synthesis (Silvera et al. 2010). That ribosomal dysfunction plays a central role in cancer is further corroborated by the findings that genetic alterations, which encompass the components of the ribosome machinery (i.e., “ribosomopathies”), are characterized by elevated cancer risk (Narla and Ebert 2010).
| mRNA translation is the most energy-consuming process in the cell and strongly correlates with cellular metabolic activity. Translation and energy metabolism play important roles in homeostatic cell growth and proliferation, and when dysregulated lead to cancer. eIF4E is a key regulator of translation, which promotes oncogenesis by selectively enhancing translation of a subset of tumor-promoting mRNAs (e.g., cyclins and c-myc). PI3K/AKT and mitogen-activated protein kinase (MAPK) pathways, which are strongly implicated in cancer etiology, exert a number of their biological effects by modulating translation. The PI3K/AKT pathway regulates eIF4E function by inactivating the inhibitory 4E-BPs via mTORC1, whereas MAPKs activate MAP kinase signal-integrating kinases 1 and 2, which phosphorylate eIF4E. In addition, AMP-activated protein kinase, which is a central sensor of the cellular energy balance, impairs translation by inhibiting mTORC1. Thus, eIF4E plays a major role in mediating the effects of PI3K/AKT, MAPK, and cellular energetics on mRNA translation.Figure 2. eIF4E is regulated by multiple mechanisms. The expression of eIF4E is regulated by several transcription factors (e.g., c-myc, hnRNPK, p53) and adenine-uracil-rich element binding proteins (i.e., HuR and AUF1). eIF4E is suppressed by 4E-BPs, which are regulated by mTORC1. MAP kinase signal integrating kinases 1 and 2 (MNKs) phosphorylate eIF4E. |
| Figure 3. Ras/MAPK and PI3K/AKT/mTORC1 regulate the activity of eIF4E. Various stimuli activate phosphoinositide-3-kinase (PI3K) through the receptor tyrosine kinases (RTKs). Upon activation, PI3K converts phosphatidylinositol 4,5-bisphosphate (PIP2) into phosphatidylinositol-3,4,5-triphosphate (PIP3). This reaction is reversed by PTEN. Phosphoinositide-dependent protein kinase 1 (PDK1) and AKT bind to PIP3 via their pleckstrin homology domains, which allows for the phosphorylation and activation of AKT by PDK1. In addition, the mammalian target of rapamycin complex 2 (mTORC2) modulates the activity of AKT by phosphorylating its hydrophobic motif. AKT phosphorylates tuberous sclerosis complex 2 (TSC2) at multiple sites, which results in its inhibition and consequent activation of Ras homolog enriched in brain (Rheb), which is a small GTPase that activates mTORC1. mTORC1 phosphorylates 4E-BPs leading to their dissociation from eIF4E. In addition to the PI3K/AKT pathway, the activity of mTORC1 is regulated by the serine/threonine kinase 11/LKB1/AMP-kinase (LKB1/AMPK) pathway, regulated in development and DNA damage response 1 (REDD1) and Rag GTPases in response to the changes in cellular energy balance, oxygen and amino acid availability, respectively. Ras and the MAPK pathways are activated by various stimuli through receptor tyrosine kinases (RTKs). In addition the MAPK pathway isactivatedthrough theGprotein–coupled receptors(GPCRs) and byproteinkinaseC (PKC;notshown).TheMAPK pathways encompass an initial GTPase-regulated kinase (MAPKKK), which activates an effector kinase (MAPK) via an intermediate kinase (MAPKK). In response to stimuli such as growth factors, hormones, and phorbol-esters, Ras GTPase stimulates Raf kinase (MAPKKK), which activates extracellular signal-regulated kinases 1 and 2 (ERK 1 and 2) via extracellular signal-regulated kinase activator kinases MEK1 and 2 (MAPKK). Cellular stresses, including osmotic shock, inflammatory cytokines, and UV light, activate p38 MAPKs via multiple mechanisms including Rac kinase (MAPKKK) and MKK3 and 6 (MAPKK). p38 MAPK and ERK activate the MAPK signal–integrating kinases 1 and 2 (MNK1/2), which phosphorylate eIF4E. Additional abbreviations are provided in the text. |
Cancer Exosomes Perform Cell-Independent MicroRNA Biogenesis and Promote Tumorigenesis
Cancer Cell Nov, 2014; 26: 707–721.
http://dx.doi.org/10.1016/j.ccell.2014.09.005
Breast cancer cells secrete exosomes with specific capacity for cell-independent miRNA biogenesis, while normal cellderivedexosomes lack thisability. Exosomes derivedfrom cancer cellsand serum frompatients withbreast cancer contain the RISC loading complex proteins, Dicer, TRBP, and AGO2, which process pre-miRNAs into mature miRNAs. Cancer exosomes alter the transcriptome of target cells in a Dicer-dependent manner, which stimulate nontumorigenic epithelial cells to form tumors.This study identifies a mechanism whereby cancer cells impart an oncogenic field effect by manipulating the surrounding cells via exosomes. Presence of Dicer in exosomes may serve as biomarker for detection of cancer.
Dicers at RISC. The Mechanism of RNAi
Marcel Tijsterman and Ronald H.A. Plasterk
Cell, Apr 2014; 117:1–4
| Figure 1. Model for RNA Silencing in Drosophila In an ordered biochemical pathway, miRNAs (left panel) and siRNAs (right panel) are processed from double-stranded precursor molecules by Dcr-1and Dcr-2, respectively, and stay attached to Dicer-containing complexes, which assemble into RISC. The degree of complementarity between the RNA silencing molecule (in red) and its cognate target determines the fate of the mRNA: blocked translation or immediate destruction. |
Argonaute2 Cleaves the Anti-Guide Strand of siRNA during RISC Activation
Cell 2005; 123:621-629
http://www.cell.com/cgi/content/full/123/4/621/DC1/
Dicing and slicing- The core machinery of the RNA interference pathway
Scott C Hammond
FEBS Letters 579 (2005) 5822–5829
http://dx.doi.org:/10.1016/j.febslet.2005.08.079
Fig. 1. Domain organization of RNaseIII gene family. Three classes of RNaseIII genes are shown. The PAZ domain in Dm-Dicer-2 contains mutations in several residues required for RNA binding and may not be functional.
Fig. 2. Model for Dicer catalysis. The PAZ domain binds the 2 nt 30 overhang of a dsRNA terminus. The RNaseIII domains form a pseudo-dimer. Each domain hydrolyzes one strand of the substrate. The binding site of the dsRBD is not defined. The function of the helicase domain is not known.
Fig. 3. Biogenesis pathway of microRNAs. MicroRNA genes are transcribed by RNA polymerase II. The primary transcript is referred to as ‘‘primicroRNA’’. Drosha processing occurs in the nucleus. The resulting precursor, ‘‘pre-microRNA’’, is exported to the cytoplasm for Dicer processing. In a coordinated manner, the mature microRNA is transferred to RISC and unwound by a helicase. mRNA targets that duplex in the Slicer scissile site are cleaved and degraded, if the microRNA is loaded into an Ago2 RISC. Mismatched targets are translationally suppressed. All Ago family members are believed to function in translational suppression.
Fig. 4. Model for Slicer catalysis. The siRNA guide strand is bound at the 50 end by the PIWI domain and at the 30 end by the PAZ domain. The 50 phosphate is coordinated by conserved basic residues. mRNA targets are initially bound by the seed region of the siRNA and pairing is extended to the 30 end. The RNaseH fold hydrolyzes the target in a cation dependent manner. Slicer cleavage is measured from the 50 end of the siRNA. Product is released by an unknown mechanism and the enzyme recycles.
RNA interference (RNAi) is a biological process in which RNA molecules inhibit gene expression, typically by causing the destruction of specific mRNA molecules. Historically, it was known by other names, including co-suppression, post transcriptional gene silencing (PTGS), and quelling. Only after these apparently unrelated processes were fully understood did it become clear that they all described the RNAi phenomenon. Andrew Fire and Craig C. Mello shared the 2006 Nobel Prize in Physiology or Medicine for their work on RNA interference in the nematode worm Caenorhabditis elegans, which they published in 1998.
Two types of small ribonucleic acid (RNA) molecules – microRNA (miRNA) and small interfering RNA (siRNA) – are central to RNA interference. RNAs are the direct products of genes, and these small RNAs can bind to other specific messenger RNA (mRNA) molecules and either increase or decrease their activity, for example by preventing an mRNA from producing a protein. RNA interference has an important role in defending cells against parasitic nucleotide sequences – viruses and transposons. It also influences development.
The RNAi pathway is found in many eukaryotes, including animals, and is initiated by the enzyme Dicer, which cleaves long double-stranded RNA (dsRNA) molecules into short double stranded fragments of ~20 nucleotide siRNAs. Each siRNA is unwound into two single-stranded RNAs (ssRNAs), the passenger strand and the guide strand. The passenger strand is degraded and the guide strand is incorporated into the RNA-induced silencing complex (RISC). The most well-studied outcome is post-transcriptional gene silencing, which occurs when the guide strand pairs with a complementary sequence in a messenger RNA molecule and induces cleavage by Argonaute, the catalytic component of the RISC complex. In some organisms, this process spreads systemically, despite the initially limited molar concentrations of siRNA.
http://en.wikipedia.org/wiki/RNA_interference
http://upload.wikimedia.org/wikipedia/commons/thumb/e/e4/ShRNA_Lentivirus.svg/481px-ShRNA_Lentivirus.svg.png
http://www.frontiersin.org/files/Articles/66078/fnmol-06-00040-HTML/image_m/fnmol-06-00040-g001.jpg
http://dx.doi.org:/10.3389/fnmol.2013.00040
The enzyme dicer trims double stranded RNA, to form small interfering RNA or microRNA. These processed RNAs are incorporated into the RNA-induced silencing.
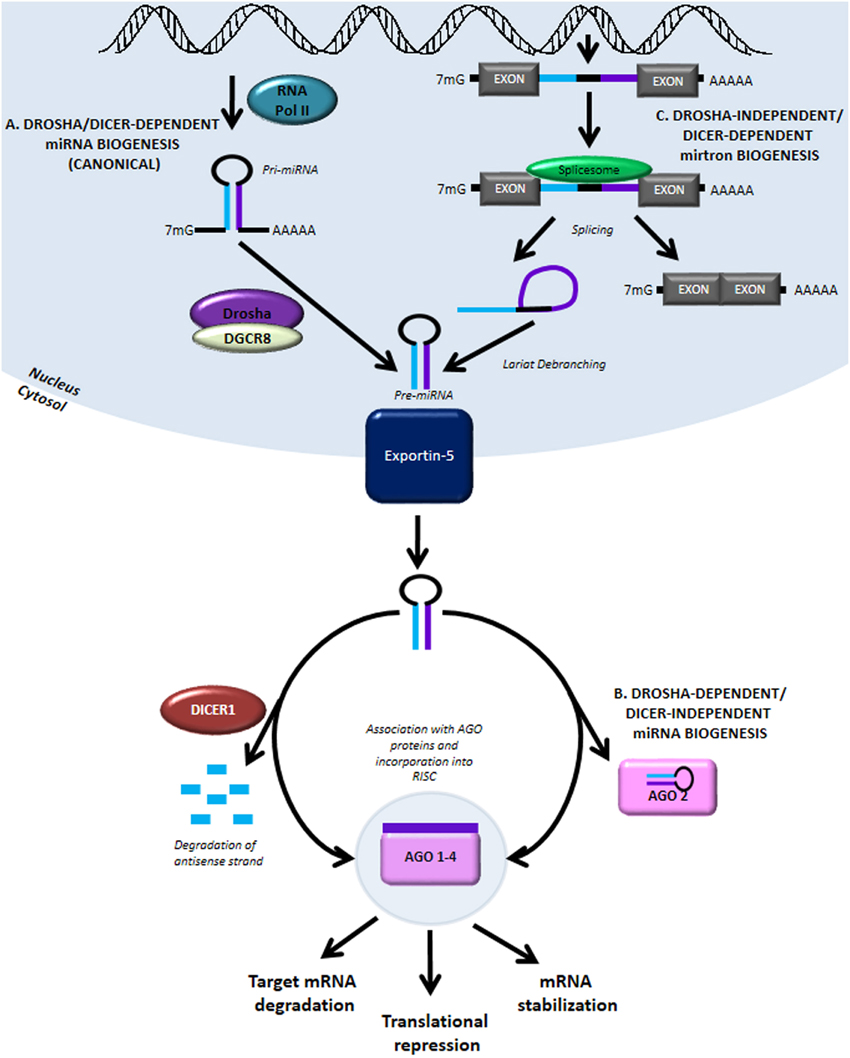
MiRNA biogenesis and function. (A) The canonical miRNA biogenesis pathway is Drosha- and Dicer-dependent. It begins with RNA Pol II-mediated transcription..

Dicer Promotes Transcription Termination
Dicer Promotes Transcription Termination at Sites of Replication Stress to Maintain Genome Stability
Cell Oct 2014; 159(3): 572–583
http://dx.doi.org/10.1016/j.cell.2014.09.031
http://www.cell.com/cms/attachment/2019646604/2039684570/fx1.jpg

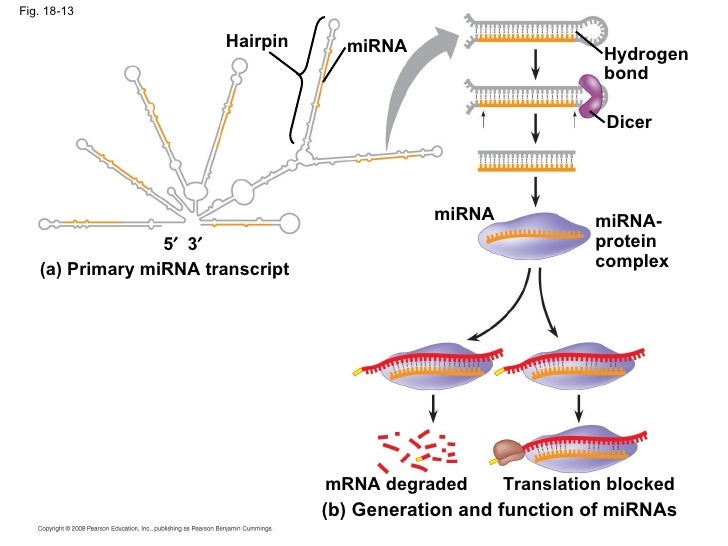
18-13 miRNA- protein complex ap-chap-18-pp-42-728
18-13 miRNA- protein complex (a) Primary miRNA transcript Translation blocked Hydrogen bond (b) Generation and function of miRNAs Hairpin miRNA miRNA Dicer …
http://image.slidesharecdn.com/ap-chap-18-pp-1229097198123780-1/95/ap-chap-18-pp-42-728.jpg?cb=1229090143
Identification and characterization of small RNAs involved in RNA silencing
FEBS Letters 579 (2005) 5830–5840
http://dx.doi.org:/10.1016/j.febslet.2005.08.009
Fig. 1. Small RNA cloning procedure. Outline of the small RNA cloning procedure. RNA is dephosphorylated (step 1) for joining the 30 adapter by T4 RNA ligase 1 in the presence of ATP (step 2). The use of a chemically adenylated adapter and truncated form of T4 RNA ligase 2 (Rnl2) allows eliminating the dephosphorylation step (step 4). If the RNA was dephosphorylated, it is re-phosphorylated (step 3) prior to 50 adapter ligation with T4 RNA ligase 1 and ATP (step 5). After 50 adapter ligation, a standard reverse transcription is performed (step 6). Alternatively, after 30 adapter ligation, the RNA is used directly for reverse transcription simultaneously with 50 adaptor joining (step 7). In this case, the property of reverse transcriptase to add non-templated cytidine residues at the 50 end of synthesized DNA is used to facilitate template switch of the reverse transcriptase to the 30 guanosine residues of the 50 adapter (SMART technology, Invitrogen). Abbreviations: P and OH indicate phosphate and hydroxyl ends of the RNA; App indicates 50 chemically adenylated adapter; L, 30 blocking group; CIP, calf alkaline phosphatase and PNK, polynucleotide kinase.
Transcriptional regulatory functions of nuclear long noncoding RNAs
Trends in Genetics, Aug 2014; 30(8):348-356
http://dx.doi.org/10.1016/j.tig.2014.06.001
| Cis-acting lncRNAEnhancer-associated lncRNAIntergenic lncRNA
lncRNA
Promoter-associated lncRNA
Proximity transfer
Trans-acting lncRNA |
Functional interactions among microRNAs and long noncoding RNAs
Sem Cell Dev Biol 2014; 34:9-14
http://dx.doi.org/10.1016/j.semcdb.2014.05.015
Genome-wide application of RNAi to the discovery of potential drug targets
FEBS Letters 579 (2005) 5988–599
http://dx.doi.org://10.1016/j.febslet.2005.08.015
Fig. 1. Schematic representation of gene silencing by an shRNA-expression vector. The shRNA is processed by Dicer. The processed siRNA enters the RNA-induced silencing complex (RISC), where it targets mRNA for degradation.
Fig. 2. Schematic representation of a transcription system for production of siRNA
Fig. 3. (A) Schematic representation of the proposed siRNA-expression system. Three or four C to U or A to G mutations are introduced into the sense strand. (B) Schematic representation of the discovery of a novel gene using an siRNA library.
Imperfect centered miRNA binding sites are common and can mediate repression of target mRNAs
Martin et al. Genome Biology 2014, 15:R51 http://genomebiology.com/2014/15/3/R51
Table 1 Number of inferred targets for each miRNA tested
| miRNA |
Probes |
Transcripts |
Genes |
| miR-10a |
2,206 |
5,963 |
1,887 |
| miR-10a-iso |
1,648 |
1,468 |
4,211 |
| miR-10b |
1,588 |
3,940 |
1,365 |
| miR-10b-iso |
963 |
2,235 |
889 |
| miR-17-5p |
1,223 |
2,862 |
1,137 |
| miR-17-5p-iso |
1,656 |
3,731 |
1,461 |
| miR-182 |
2,261 |
6,423 |
2,008 |
| miR-182-iso |
1,569 |
4,316 |
1,444 |
| miR-23b |
2,248 |
5,383 |
1,990 |
| miR-27a |
2,334 |
5,310 |
2,069 |
Probes: number of probes significantly enriched in pull-downs compared to controls (5% FDR). Transcripts: number of transcripts to which those probes map exactly. Genes: number of genes from which those transcripts originate
Figure 2 Biotin pull-downs identify bone fide miRNA targets. (A) Volcano plot showing the significance of the difference in expression between the miR-17-5p pull-down and the mock-transfected control, for all transcripts expressed in HEK293T cells. Both targets predicted by TargetScan or validated previously via luciferase assay were significantly enriched in the pull-down compared to the controls. (B) Results from luciferase assays on previously untested targets predicted using TargetScan and uncovered using the biotin pull-down. The plot indicates mean luciferase activity from either the empty plasmid or from pMIR containing a miRNA binding site in the 3′ UTR, relative to a negative control. Asterisks indicate a significant reduction in luciferase activity (one-sided t-test; P<0.05) and error bars the standard error of the mean over three replicates. (C-E) Targets identified through PAR-CLIP or through miRNA over-expression studies show greater enrichment in the pull-down. Cumulative distribution of log fold-change in the pull-down for transcripts identified as targets by the indicated miRNA over-expression study or not. Red, canonical transcripts found to be miR-17-5p targets in the indicated study (Table S5 in Additional file 1); black, all other canonical transcripts; p, one-sided P-value from Kolmogorov-Smirnov test for a difference in distributions. (F) To confirm that our results were dependent on RISC association, cells were transfected with either single or double-stranded synthetic miRNAs, then subjected to AGO2 immunoprecipitation. The biotin pull-down was performed in the AGO2-enriched and AGO2-depleted fractions. (G-H) Quantitative RT-PCR revealed that, with double-stranded (ds) miRNA (G), four out of five known targets were enriched relative to input mRNA (*P≤0.05, **P<0.01, ***P<0.001) in the AGO2-enriched but not in the AGO2-depleted fractions, but this enrichment was not seen for the cells transfected with a single-stranded (ss) miRNA (H). The numbers on the x-axis correspond to those in Figure 2F. Error bars represent the standard error of mean (sem).
Figure 5 IsomiRs and canonical miRNAs target many of the same transcripts.
Hammerhead ribozymes in therapeutic target discovery and validation
Drug Disc Today 2009; 14(15/16): 776-783
http://dx.doi.org/10.1016/j.drudis.2009.05.003
Figure 1. Features of hammerhead ribozymes. A generic diagram of a hammerhead ribozyme bound to its target substrate: NUH is the cleavage triplet on target sequence, stems I and III are sites of the specific interactions between ribozyme and target, stem II is the structural element connecting separate parts of the catalytic core. Arrows represent the cleavage site, numbering system according to Hertel et al. [60].
TABLE 1 Typical examples of successful applications of hammerhead ribozymes. Most of the data are derived from [10] and [11], the others are expressly specified.
- Growth factors, receptors, transduction elements
- Oncogenes, protoncogenes, fusion genes
- Apoptosis, survival factors, drug resistance
- Transcription factors
- Extracellular matrix, matrix modulating factors
- Circulating factors
- Viral genome, viral genes
Figure 2.Target–ribozyme interactions. (a) As cheme of ribozyme binding to full substrate. The calculated energy of this binding ensures the formation of a stable complex. At the denaturating temperature, Tm, will allow this complex to survive to biological conditions. Conversely, after cleavage, binding energies calculated on single, (b) and (c), ribozyme arms are very low and no longer stable. These properties will ensure both the efficient release of cleavage fragments and the prevention of binding to unrelated targets. RNAs complementary to one binding arm only will not be bound or cleaved by the hammerhead catalytic sequence.
Figure 3. ‘Chemical omics’ approach. According to this target discovery strategy: (1) a first round of ‘omic’ study (proteomic, genomic, metabolomic, …) will enable the discovery of a set of (2) putative markers. A series of hammerhead ribozymes will then be prepared in order to target each marker. (4) A second ‘omic’ study round will be performed on (3) knocked down samples obtained after ribozymes administration. (5) A new series of markers will then be produced. An expanding analytical process of this type may be further repeated. Finally, a robust bioinformatic algorithm will make it possible to connect the different markers and draw new hypothetical links and pathways.
miRNA
ADAR Enzyme and miRNA Story
Sara Tomaselli, Barbara Bonamassa, Anna Alisi, et al.
Int. J. Mol. Sci. 2013, 14, 22796-22816;
http://dx.doi.org:/10.3390/ijms141122796
Adenosine deaminase acting on RNA (ADAR) enzymes convert adenosine (A) to inosine (I) in double-stranded (ds) RNAs. Since Inosine is read as Guanosine, the biological consequence of ADAR enzyme activity is an A/G conversion within RNA molecules. A-to-I editing events can occur on both coding and non-coding RNAs, including microRNAs (miRNAs), which are small regulatory RNAs of ~20–23 nucleotides that regulate several cell processes by annealing to target mRNAs and inhibiting their translation. Both miRNA precursors and mature miRNAs undergo A-to-I RNA editing, affecting the miRNA maturation process and activity. ADARs can also edit 3′ UTR of mRNAs, further increasing the interplay between mRNA targets and miRNAs. In this review, we provide a general overview of the ADAR enzymes and their mechanisms of action as well as miRNA processing and function. We then review the more recent findings about the impact of ADAR-mediated activity on the miRNA pathway in terms of biogenesis, target recognition, and gene expression regulation.
Figure 1. Structure of ADAR family proteins: ADAR1, ADAR2, and ADAR3. The ADAR enzymes contain a C-terminal conserved catalytic deaminase domain (DM), two or three dsRBDs in the N-terminal portion. ADAR1 full-length protein also contains a N-terminal Zα domain with a nuclear export signal (NES) and a Zβ domain, while ADAR3 has a R-domain. A nuclear localization signal is also indicated.
Comprehensive modeling of microRNA targets predicts functional non-conserved and non-canonical sites
Doron Betel, Anjali Koppal, Phaedra Agius, Chris Sander, Christina Leslie
Genome Biology 2010, 11:R90 http://genomebiology.com/2010/11/8/R90
microRNAs are a class of small regulatory RNAs that are involved in post-transcriptional gene silencing. These small (approximately 22 nucleotide) single-strand RNAs guide a gene silencing complex to an mRNA by complementary base pairing, mostly at the 3′ untranslated region (3′ UTR). The association of the RNAinduced silencing complex (RISC) to the conjugate mRNA results in silencing the gene either by translational repression or by degradation of the mRNA. Reliable microRNA target prediction is an important and still unsolved computational challenge, hampered both by insufficient knowledge of microRNA biology as well as the limited number of experimentally validated targets.
mirSVR is a new machine learning method for ranking microRNA target sites by a down-regulation score. The algorithm trains a regression model on sequence and contextual features extracted from miRanda-predicted target sites. In a large-scale evaluation, miRanda-mirSVR is competitive with other target prediction methods in identifying target genes and predicting the extent of their downregulation at the mRNA or protein levels. Importantly, the method identifies a significant number of experimentally determined non-canonical and non-conserved sites.
Human RISC – MicroRNA Biogenesis and Posttranscriptional Gene Silencing
Cell 2005; 123:631-640
http://dx.doi.org:/10.1016/j.cell.2005.10.022
Development of microRNA therapeutics
Eva van Rooij & Sakari Kauppinen
EMBO Mol Med (2014) 6: 851–864
http://dx.doi.org:/10.15252/emmm.20110089
MicroRNAs (miRNAs) play key regulatory roles in diverse biological processes and are frequently dysregulated in human diseases. Thus, miRNAs have emerged as a class of promising targets for therapeutic intervention. Here, we describe the current strategies for therapeutic modulation of miRNAs and provide an update on the development of miRNA-based therapeutics for the treatment of cancer, cardiovascular disease and hepatitis C virus (HCV) infection.
Figure 1. miRNA biogenesis and modulation of miRNA activity by miRNA mimics and antimiR oligonucleotides. MiRNA genes are transcribed by RNA polymerase II from intergenic, intronic or polycistronic loci to long primary miRNA transcripts (pri-miRNAs) and processed in the nucleus by the Drosha–DGCR8 complex to approximately 70 nt pre-miRNA hairpin structures. The most common alternative miRNA biogenesis pathway involves short intronic hairpins, termed mirtrons, that are spliced and debranched to form pre-miRNA hairpins. Pre-miRNAs are exported into the cytoplasm and then cleaved by the Dicer–TRBP complex to imperfect miRNA: miRNA* duplexes about 22 nucleotides in length. In the cytoplasm, miRNA duplexes are incorporated into Argonaute-containing miRNA induced silencing complex (miRISC), followed by unwinding of the duplex and retention of the mature miRNA strand in miRISC, while the complementary strand is released and degraded. The mature miRNA functions as a guide molecule for miRISC by directing it to partially complementary sites in the target mRNAs, resulting in translational repression and/or mRNA degradation. Currently, two strategies are employed to modulate miRNA activity: restoring the function of a miRNA using double-stranded miRNA mimics, and inhibition of miRNA function using single-stranded anti-miR oligonucleotides.
Figure 2. Design of chemically modified miRNA modulators. (A) Structures of chemical modifications used in miRNA modulators. A number of different sugar modifications are used to increase the duplex melting temperature (Tm) of anti-miR oligonucleotides. The20-O-methyl(20-O-Me), 20-O-methoxyethyl(20-MOE )and 20-fluoro(20-F) nucleotides are modified at the 20 position of the sugar moiety, whereas locked nucleic acid (LNA) is a bicyclic RNA analogue in which the ribose is locked in a C30-endo conformation by introduction of a 20-O,40-C methylene bridge. To increase nuclease resistance and enhance the pharmacokinetic properties, most anti-miR oligonucleotides harbor phosphorothioate (PS) backbone linkages, in which sulfur replaces one of the non-bridging oxygen atoms in the phosphate group. In morpholino oligomers, a six-membered morpholine ring replaces the sugar moiety. Morpholinos are uncharged and exhibit a slight increase in binding affinity to their cognate miRNAs. PNA oligomers are uncharged oligonucleotide analogues, in which the sugar–phosphate backbone has been replaced by a peptide-like backbone consisting of N-(2-aminoethyl)-glycine units. (B) An example of a synthetic double-stranded miRNA mimic described in this review. One way to therapeutically mimic a miRNA is by using synthetic RNA duplexes that harbor chemical modifications for improved stability and cellular uptake. In such constructs, the antisense (guide) strand is identical to the miRNA of interest, while the sense (passenger) strand is modified and can be linked to a molecule, such as cholesterol, for enhanced cellular uptake. The sense strand contains chemical modifications to prevent mi-RISC loading. Several mismatches can be introduced to prevent this strand from functioning as an anti-miR, while it is further left unmodified to ensure rapid degradation.The20-F modification helps to protect the antisense strand against exonucleases, hence making the guide strand more stable, while it does not interfere with mi-RISC loading. (C) Design of chemically modified anti-miR oligonucleotides described in this review. Antagomirs are30 cholesterol-conjugated,20-O-Me oligonucleotides fully complementary to the mature miRNA sequence with several PS moieties to increase their in vivo stability. The use of unconjugated 20-F/MOE-, 20-MOE- or LNA-modified anti-miR oligonucleotides harboring a complete PS backbone represents another approach for inhibition of miRNA function in vivo. The high duplex melting temperature of LNA-modified oligonucleotides allows efficient miRNA inhibition using truncated, high-affinity 15–16-nucleotide LNA/DNA anti-miR oligonucleotides targeting the 50 region of the mature miRNA. Furthermore, the high binding affinity of fully LNA-modified 8-mer PS oligonucleotides, designated as tiny LNAs, facilitates simultaneous inhibition of entire miRNA seed families by targeting the shared seed sequence.
Human MicroRNA Targets
Bino John, Anton J. Enright, Alexei Aravin, Thomas Tuschl,.., Debora S. Mark
PLoS Biol 2004; 2(11): e363 http://www.plosbiology.org
More than ten years after the discovery of the first miRNA gene, lin-4 (Chalfie et al. 1981; Lee et al. 1993), we know that miRNA genes constitute about 1%–2% of the known genes in eukaryotes. Investigation of miRNA expression combined with genetic and molecular studies in Caenorhabditis elegans, Drosophila melanogaster, and Arabidopsis thaliana have identified the biological functions of several miRNAs (recent review, Bartel 2004). In C. elegans, lin-4 and let-7 were first discovered as key regulators of developmental timing in early larval developmental transitions (Ambros 2000; Abrahante et al. 2003; Lin et al. 2003; Vella et al. 2004). More recently lsy-6 was shown to determine the left–right asymmetry of chemoreceptor expression (Johnston and Hobert 2003). In D. melanogaster, miR-14 has a role in apoptosis and fat metabolism (Xu et al. 2003) and the bantam miRNA targets the gene hid involved in apoptosis and growth control (Brennecke et al. 2003).
MicroRNAs (miRNAs) interact with target mRNAs at specific sites to induce cleavage of the message or inhibit translation. The specific function of most mammalian miRNAs is unknown. We have predicted target sites on the 39 untranslated regions of human gene transcripts for all currently known 218 mammalian miRNAs to facilitate focused experiments. We report about 2,000 human genes with miRNA target sites conserved in mammals and about 250 human genes conserved as targets between mammals and fish. The prediction algorithm optimizes sequence complementarity using position-specific rules and relies on strict requirements of interspecies conservation. Experimental support for the validity of the method comes from known targets and from strong enrichment of predicted targets in mRNAs associated with the fragile X mental retardation protein in mammals. This is consistent with the hypothesis that miRNAs act as sequence-specific adaptors in the interaction of ribonuclear particles with translationally regulated messages. Overrepresented groups of targets include mRNAs coding for transcription factors, components of the miRNA machinery, and other proteins involved in translational regulation, as well as components of the ubiquitin machinery, representing novel feedback loops in gene regulation. Detailed information about target genes, target processes, and open-source software for target prediction (miRanda) is available at http://www.microrna.org. Our analysis suggests that miRNA genes, which are about 1% of all human genes, regulate protein production for 10% or more of all human genes.
Figure 1. Target Prediction Pipeline for miRNA Targets in Vertebrates The mammalian (human, mouse, and rat) and fish (zebra and fugu) 39 UTRs were first scanned for miRNA target sites using position specific rules of sequence complementarity. Next, aligned UTRs of orthologous genes were used to check for conservation of miRNA– target relationships (‘‘target conservation’’) between mammalian genomes and, separately, between fish genomes. The main results (bottom) are the conserved mammalian and conserved fish targets, for each miRNA,as well as a smaller set of super-conserved vertebrate targets. http://dx.doi.org:/10.1371/journal.pbio.0020363.g00
Figure 2. Distribution of Transcripts with Cooperativity of Target Sites and Estimated Number of False Positives Each bar reflects the number of human transcripts with a given number of target sites on their UTR. Estimated rate of false positives(e.g., 39%for2 targets) is given by the number of target sites predicted using shuffled miRNAs processed in a way identical to real miRNAs, including the use of interspecies conservation filter. http://dx.doi.org:/10.1371/journal.pbio.0020363.g002
Conserved Seed Pairing, Often improved an-Flanked by Adenosines, Indicates Thousands of Human Genes are MicroRNA Targets
Cell, Jan 2005; 120: 15–20
http://dx.doi.org:/10.1016/j.cell.2004.12.035
Integrated analysis of microRNA and mRNA expression. adding biological significance to microRNA target predictions.
Maarten van Iterson, Sander Bervoets, Emile J. de Meijer, et al.
Nucleic Acids Research, 2013; 41(15), e146
http://dx.doi.org:/10.1093/nar/gkt525
Current microRNA target predictions are based on sequence information and empirically derived rules but do not make use of the expression of microRNAs and their targets. This study aimed to improve microRNA target predictions in a given biological context, using in silico predictions, microRNA and mRNA expression. We used target prediction tools to produce lists of predicted targets and used a gene set test designed to detect consistent effects of microRNAs on the joint expression of multiple targets. In a single test, association between microRNA expression and target gene set expression as well as the contribution of the individual target genes on the association are determined. The strongest negatively associated mRNAs as measured by the test were prioritized. We applied our integration method to a well-defined muscle differentiation model. Validation of our predictions in C2C12 cells confirmed predicted targets of known as well as novel muscle-related microRNAs. We further studied associations between microRNA–mRNA pairs in human prostate cancer, finding some pairs that have been recently experimentally validated by others. Using the same study, we showed the advantages of the global test over Pearson correlation and lasso. We conclude that our integrated approach successfully identifies regulated microRNAs and their targets.
Long non-coding RNA and microRNAs might act in regulating the expression of BARD1 mRNAs
Int J Biol & Cell Biol 2014; 54:356-367
http://dx.doi.org/10.1016/j.biocel.2014.06.018
Passenger-Strand Cleavage Facilitates Assembly of siRNA into Ago2-Containing RNAi Enzyme Complexes
Cell 2006; 123:607-620
http://dx.doi.org:/10.1016/j.cell.2006.08.044
RNAi- RISC Gets Loaded
Cell 2005; 123:543-553
http://dx.doi.org:/10.1016/j.cell.2005.11.006
RNAi- The Nuts and Bolts of the RISC Machine
Cell 2005; 122:17-20
http://dx.doi.org:/10.1016/j.cell.2005.06.023
Structural domains in RNAi
FEBS Letters 579 (2005) 5841–5849
http://dx.doi.org:/10.1016/j.febslet.2005.07.072
Fig. 1. A ‘‘Domain-centric’’ view of RNAi. (A) The conserved pathways of RNA silencing. The domain structure of each protein in (hypothetical) interaction with its RNA is shown. For clarity, the second column lists domains in order N- to C-terminal. Figures are not to scale. In brief, Drosha, an RNase III enzyme, and its obligate binding partner, Pasha recognize pri-mRNA loops, and cut these into 70 nt hairpin pre-miRNAs. Dicer utilizes a PAZ domain to sense the 30 2-nt overhang created, and further processes these, and dsRNAs into miRNAs and siRNAs. Argonaute binds the 50 end of guide RNAs via its PIWI domain, and the 30 end via a PAZ domain, yielding RISCs that effect RNA silencing through several mechanisms. A Viral protein, VP19 can suppress RNA silencing by sequestering siRNAs. (B) A summary of known siRNA structural biology. Listed by domain are solved structures, their protein/organism of origin, and ligands, where applicable. Also shown are PDB codes.
Fig. 2. Novel modes of RNA recognition. (A) A typical dsRBD: Xenopus binding protein A (1DI2). A RNA helix is modeled pink, and the protein is rendered in transparent electrostatic contours (blue is basic, red acidic). Note the interaction of helices along the major groove, and the position of helix 1. A second dsRBD protein is visible, in the lower right. (B) A dsRBD, Saccharomyces Rnt1P (1T4L), recognizes hairpin loops. A novel third helix (top) pushes helix one into the loop of a hairpin RNA. (C) 30-OH recognition by PAZ. Human Eif2c1 (1SI3) bound to RNA (pink) is shown. PAZ is green, with transparent electrostatic surface plot. The OB-fold (nucleotide binding fold) and the insertion domain are labeled. Note the glove-and-thumb like cleft they form, that the 30-OH is inserted into. A basic groove (blue) the RNA binds along outside the cleft is visible. (D) A close-up view of PAZ, as in C (surface not-transparent, slightly rotated). See white arrows for orientation, and location of 30-OH binding site. RNA is shown red in sticks. The terminal –OH is barely visible, buried in a cleft. It and the carbon it bonds have been colored yellow for clarity. (E) The PIWI domain (2BGG). Note the insertion of the 50P red (labeled) into the binding site. Its complimentary strand (pink) is not annealed to it, and the 30 overhang and first complimentary bases sit on the protein surface. (F) An enlarged view of (E), with protein in slate and RNA modeled as red sticks. The coordinated magnesium is a grey sphere, which is coordinated by the terminal carboxylate of the protein, protein side chains, and RNA phosphate oxygens. The 50 base stacks against a conserved Tyr. Several other sidechain contacts are shown.
Fig. 3. Argonaute/RISC. (A) P. furiosus Argonaute (PDB 1Z26). A color-guided key to the domains is presented. PAZ sits over the PIWI/N/MID bowl and active site. The liganding atoms for the catalytic metal are depicted as yellow balls for clarity. The tungstate binding site (50P surrogate) is shown as tan spheres. (B) A guide strand channel. Looking down from the PAZ domain towards the active site, Z-sections are clipped off. Colors of domains are as in the key in (A). Wrapping down along a basic cleft from the PAZ 30OH binding site (approximate position labeled), a RNA binding groove passes the active site (yellow), and runs down to the 50P binding site (tan balls). A second cleft running perpendicular to this one at its entry may accommodate target strand RNA. For more detail, and models of siRNA placed into the grooves, see [27,29].
Fig. 4. VP19 sequestration of siRNA. (A) CIRV VP19 (1RPU, RNA removed). Two monomers (blue and cyan) form an 8 strand, concave b-sheet with bracketing helices at the ends. (B) Tombus viral VP19 bound to siRNA (1 monomer shown). RNA strands are modeled as sticks, with one strand pink and one red. The bracketing helix places two tryptophans in position to stack over the terminal RNA bases. On the b-sheet surface, and Arg and a Lys interact with the phosphate backbone, and at the center of the RNA binding surface, a number of Ser and Thr mediate an extensive hydrogen bond network. Both the Trp brackets and RNA binding by an extended b-sheet are unique.
Small RNA asymmetry in RNAi- Function in RISC assembly and gene regulation
FEBS Letters 579 (2005) 5850–5857
http://dx.doi.org:/10.1016/j.febslet.2005.08.071
The role of the oncofetal IGF2 mRNA-binding protein 3 (IGF2BP3) in cancer
Seminars in Cancer Biol 2014; 29:3-12
http://dx.doi.org/10.1016/j.semcancer.2014.07.006
Table 1 – Target mRNAs of IGF2BP3.
| Target |
cis-Element |
Regulation |
| CD44 |
3’ -utr |
Control of mRNA stability |
| IGF2 |
5’ -utr |
Translational control |
| H19 |
ncRNA |
Unknown |
| ACTB |
3’ -utr |
Unknown |
| MYC |
CRD |
Unknown |
| CD164 |
Unknown |
Control of mRNA stability |
| MMP9 |
Unknown |
Control of mRNA stability |
| ABCG2 |
Unknown |
Unknown |
| PDPN |
3’ -utr |
Control of mRNA stability |
| HMGA2 |
3’ -utr |
Protection from miR directed degradation |
| CCND1 |
3’ -utr |
translational control |
| CCND3 |
3’ -utr |
translational control |
| CCNG1 |
3’ -utr |
translationalcontrol |
Targeting glucose uptake with siRNA-based nanomedicine for cancer therapy
Biomaterials 2015; 51:1-11
http://dx.doi.org/10.1016/j.biomaterials.2015.01.068
The therapeutic potential of RNA interference
FEBS Letters 579 (2005) 5996–6007
http://dx.doi.og:/10.1016/j.febslet.2005.08.004
Table 1 Companies developing RNAi therapeutics that includes cancer
| Company name |
Primary areas of interest |
| Atugen AG |
Metabolic disease; cancer ocular disease; skin disease |
| Benitec Australia Limited |
Hepatitis C virus; HIV/AIDS; cancer; diabetes/obesity |
| Calando Pharmaceuticals |
Nanoparticle technology |
| Genta Incorporated |
Cancer |
| Intradigm Corporation |
Cancer; SARS; arthritis |
| Sirna Therapeutics, Inc. |
AMD; Hepatitis C virus; asthma; diabetes; cancer; Huntington s disease; hearing loss |
The Noncoding RNA Revolution—Trashing Old Rules to Forge New Ones
Cell 2014; 157:77-94
http://dx.doi.org/10.1016/j.cell.2014.03.008
Figure 1. Noncoding RNAs Function in Diverse Contexts Noncoding RNAs function in all domains of life, regulating gene expression from transcription to splicing to translation and contributing to genome organization and stability. Self-splicing RNAs, ribosomes, and riboswitches function in both eukaryotes and bacteria. Archaea (not shown) also utilize ncRNA systems including ribosomes, riboswitches, snoRNPs, and CRISPR. Orange strands, ncRNA performing the action indicated; red strands, the RNA acted upon by the ncRNA. Blue strands, DNA. Triangle, small-molecule metabolite bound by a riboswitch. Ovals indicate protein components of an RNP, such as the spliceosome (white oval), ribosome (two purple subunits), or other RNPs (yellow ovals). Because of the importance of RNA structure in these ncRNAs, some structures are shown but they are not meant to be realistic.
miRNAs and cancer targeting
Table 1 of targets
| miRNA |
Cancer type |
reference |
| NA |
GI cancer |
Current status of miRNA-targeting therapeutics and preclinical studies against gastroenterological carcinoma |
| NA |
Renal cell |
Differential expression profiling of microRNAs and their potential involvement in renal cell carcinoma pathogenesis |
| NA |
urothelial
cancer |
A microRNA expression ratio defining the invasive phenotype in bladder tumors |
| miR-31 |
breast |
A Pleiotropically Acting MicroRNA, miR-31, inhibits breast cancer growth |
| miR-512-3p |
NSCLC |
Inhibition of RAC1-GEF DOCK3 by miR-512-3p contributes to suppression of metastasis in non-small cell lung cancer |
| miR-495 |
gastric |
Methylation-associated silencing of miR-495 inhibit the migration and invasion of human gastric cancer cells |
| microRNA-218 |
prostate |
microRNA-218 inhibits prostate cancer cell growth and promotes apoptosis by repressing TPD52 expression |
| MicroRNA-373 |
cervical cancer |
MicroRNA-373 functions as an oncogene and targets YOD1 gene in cervical cancer |
| miR-25 |
NSCLC |
miR-25 modulates NSCLC cell radio-sensitivity – inhibiting BTG2 expression |
| miR-92a |
cervical cancer |
miR-92a. upregulated in cervical cancer & promotes cell proliferation and invasion by targeting FBXW7 |
| MiR-153 |
NSCLC |
MiR-153 inhibits migration and invasion of human non-small-cell lung cancer by targeting ADAM19 |
| miR-203 |
melanoma |
miR-203 inhibits melanoma invasive and proliferative abilities by targeting the polycomb group gene BMI1 |
| miR-204-5p |
Papillary thyroid |
miR-204-5p suppresses cell proliferation by inhibiting IGFBP5 in papillary thyroid carcinoma |
| miR-342-3p |
Hepato-cellular |
miR-342-3p affects hepatocellular carcinoma cell proliferation via regulating NF-κB pathway |
| miR-1271 |
NSCLC |
miR-1271 promotes non-small-cell lung cancer cell proliferation and invasion via targeting HOXA5 |
| miR-203 |
pancreas |
Pancreatic cancer derived exosomes regulate the expression of TLR4 in dendritic cells via miR-203 |
| miR-203 |
metastatic SCC |
Rewiring of an Epithelial Differentiation Factor, miR-203, to Inhibit Human SCC Metastasis |
| miR-204 |
RCC |
TRPM3 and miR-204 Establish a Regulatory Circuit that Controls Oncogenic Autophagy in Clear Cell Renal Cell Carcinoma |
| NA |
urologic |
MicroRNAs and cancer. Current and future perspectives in urologic oncology |
| NA |
RCC |
MicroRNAs and their target gene networks in renal cell carcinoma |
| NA |
osteoSA |
MicroRNAs in osteosarcoma |
| NA |
urologic |
MicroRNA in Prostate, Bladder, and Kidney Cancer |
| NA |
urologic |
Micro-RNA profiling in kidney and bladder cancers |
Current status of miRNA-targeting therapeutics and preclinical studies against gastroenterological carcinoma
Shibata et al. Molecular and Cellular Therapies 2013, 1:5 http://www.molcelltherapies.com/content/1/1/5
Differential expression profiling of microRNAs and their potential involvement in renal cell carcinoma pathogenesis
Clinical Biochemistry 43 (2010) 150–158
http://dx.doi.org:/10.1016/j.clinbiochem.2009.07.020
A microRNA expression ratio defining the invasive phenotype in bladder tumors
Urologic Oncology: Seminars and Original Investigations 28 (2010) 39–48
http://dx.doi.org:/10.1016/j.urolonc.2008.06.006
A Pleiotropically Acting MicroRNA, miR-31, inhibits breast cancer growth
Cell 137, 1032–1046, June 12, 2009
http://dx.doi.org:/10.1016/j.cell.2009.03.047
Inhibition of RAC1-GEF DOCK3 by miR-512-3p contributes to suppression of metastasis in non-small cell lung cancer
Intl JBiochem & Cell Biol 2015; 61:103-114
http://dx.doi.org/10.1016/j.biocel.2015.02.005
Methylation-associated silencing of miR-495 inhibit the migration and invasion of human gastric cancer cells by directly targeting PRL-3
Biochem Biochem Res Commun 2014; 456:344-350
http://dx.doi.org/10.1016/j.bbrc.2014.11.083
microRNA-218 inhibits prostate cancer cell growth and promotes apoptosis by repressing TPD52 expression
Biochem Biophys Res Commun 2015; 456:804-809
http://dx.doi.org/10.1016/j.bbrc.2014.12.026
MicroRNA-373 functions as an oncogene and targets YOD1 gene in cervical cancer
BBRC 2015; xx:1-6
http://dx.doi.org/10.1016/j.bbrc.2015.02.138
miR-25 modulates NSCLC cell radio-sensitivity – inhibiting BTG2 expression
BBRC 2015; 457:235-241
http://dx.doi.org/10.1016/j.bbrc.2014.12.094
miR-92a. upregulated in cervical cancer & promotes cell proliferation and invasion by targeting FBXW7
BBRC 2015; 458:63-69
http://dx.doi.org/10.1016/j.bbrc.2015.01.066
MiR-153 inhibits migration and invasion of human non-small-cell lung cancer by targeting ADAM19
BBRC 2015; 456:381-385
http://dx.doi.org/10.1016/j.bbrc.2014.11.093
miR-203 inhibits melanoma invasive and proliferative abilities by targeting the polycomb group gene BMI1
BBMC 2015; 456: 361-366
http://dx.doi.org/10.1016/j.bbrc.2014.11.087
miR-204-5p suppresses cell proliferation by inhibiting IGFBP5 in papillary thyroid carcinoma
BBRC 2015; 457:621-627
http://dx.doi.org/10.1016/j.bbrc.2015.01.037
miR-342-3p affects hepatocellular carcinoma cell proliferation via regulating NF-κB pathway
BBRC 2015; 457:370-377
http://dx.doi.org/10.1016/j.bbrc.2014.12.119
miR-1271 promotes non-small-cell lung cancer cell proliferation and invasion via targeting HOXA5
BBRC 2015; 458:714-719
http://dx.doi.org/10.1016/j.bbrc.2015.02.033
Pancreatic cancer derived exosomes regulate the expression of TLR4 in dendritic cells via miR-203
Cell Immunol 2014; 292:65-69
http://dx.doi.org/10.1016/j.cellimm.2014.09.004
Rewiring of an Epithelial Differentiation Factor, miR-203, to Inhibit Human Squamous Cell Carcinoma Metastasis
Cell Reports 2014; 9:104-117
http://dx.doi.org/10.1016/j.celrep.2014.08.062
TRPM3 and miR-204 Establish a Regulatory Circuit that Controls Oncogenic Autophagy in Clear Cell Renal Cell Carcinoma
Cancer Cell Nov 10, 2014; 26: 738–753
http://dx.doi.org/10.1016/j.ccell.2014.09.015
MicroRNA in Prostate, Bladder, and Kidney Cancer
Eur Urol 2011; 59:671-681
http://dx.doi.org/10.1016/j.eururo.2011.01.044
Micro-RNA profiling in kidney and bladder cancers
Urologic Oncology: Seminars and Original Investigations 2007; 25:387–392
http://dx.doi.org:/10.1016/j.urolonc.2007.01.019
MicroRNAs and cancer. Current and future perspectives in urologic oncology
Urologic Oncology: Seminars and Original Investigations 2010; 28:4–13
http://dx.doi.org:/10.1016/j.urolonc.2008.10.021
MicroRNAs and their target gene networks in renal cell carcinoma
BBRC 2011; 405:153-156
http://dx.doi.org/10.1016/j.bbrc.2011.01.019
MicroRNAs in osteosarcoma
Clin Chim Acta 2015; 444:9-17
http://dx.doi.org/10.1016/j.cca.2015.01.025
Table 2. miRNA cancer therapeutics
|
- miRNA and mRNA cancer signatures determined by analysis of expression levels in large cohorts of patients
| PNAS | Nov 19, 2013; 110(47): 19160–19165
http://www.pnas.org/cgi/doi/10.1073/pnas.1316991110The study of mRNA and microRNA (miRNA) expression profiles of cells and tissue has become a major tool for therapeutic development. The results of such experiments are expected to change the methods used in the diagnosis and prognosis of disease. We introduce surprisal analysis, an information-theoretic approach grounded in thermodynamics, to compactly transform the information acquired from microarray studies into applicable knowledge about the cancer phenotypic state. The analysis of mRNA and miRNA expression data from ovarian serous carcinoma, prostate adenocarcinoma, breast invasive carcinoma, and lung adenocarcinoma cancer patients and organ specific control patients identifies cancer-specific signatures. We experimentally examine these signatures and their respective networks as possible therapeutic targets for cancer in single cell experiments.
RNA editing is vital to provide the RNA and protein complexity to regulate the gene expression. Correct RNA editing maintains the cell function and organism development. Imbalance of the RNA editing machinery may lead to diseases and cancers. Recently,RNA editing has been recognized as a target for drug discovery although few studies targeting RNA editing for disease and cancer therapy were reported in the field of natural products. Therefore, RNA editing may be a potential target for therapeutic natural products
Aberrant microRNA (miRNA) expression is implicated in tumorigenesis. The underlying mechanisms are unclear because the regulations of each miRNA on potentially hundreds of mRNAs are sample specific.
We describe a novel approach to infer Probabilistic Mi RNA–mRNA Interaction Signature (‘ProMISe’) from a single pair of miRNA–mRNA expression profile. Our model considers mRNA and miRNA competition as a probabilistic function of the expressed seeds (matches). To demonstrate ProMISe, we extensively exploited The Cancer Genome Atlas data. As a target predictor, ProMISe identifies more confidence/validated targets than other methods. Importantly, ProMISe confers higher cancer diagnostic power than using expression profiles alone.
Gene set enrichment analysis on averaged ProMISe uniquely revealed respective target enrichments of oncomirs miR-21 and 145 in glioblastoma and ovarian cancers. Moreover, comparing matched breast (BRCA) and thyroid (THCA) tumor/normal samples uncovered thousands of tumor-related interactions. For example, ProMISe– BRCA network involves miR-155/183/21, which exhibits higher ProMISe coupled with coherently higher miRNA expression and lower target expression; oncomirs miR-221/222 in the ProMISe–THCA network engage with many downregulated target genes. Together, our probabilistic approach of integrating expression and sequence scores establishes a functional link between the aberrant miRNA and mRNA expression, which was previously under-appreciated due to the methodological differences.
|
Read Full Post »


