The role and importance of transcription factors
Larry H. Bernstein, MD, FCAP, Writer and Curator
http://pharmaceuticalintelligence.com/2014/8/05/The-role-and-importance-of-transcripton-factors
The following is a second in the 2nd series that is focused on the topic of the impact of genomics and transcriptomics in the evolution of 21st century of medicine, which shall have to be more efficient and more effective by the end of this decade, if the prediction for the funding of Medicare is expected to run out. Even so, Social Security was devised by none other than the Otto von Bismarck, who unified Germany, and United Kingdom has had a charity hospital care system begun to protect the widows of the ravages of war, and nursing was developed by Florence Nightengale as a result of the experience of war. It can only be concluded that the care for the elderly, the infirm, and those who have little resources to live on has a long history in western civilization, and it will not cease to exist as a public social obligation anytime soon. The 20th century saw an explosive development of physics; organic, inorganic, biochemistry, and medicinal chemistry, and the elucidation of the genetic code and its mechanism of translation in plants, microorganisms, and eukaryotes. All of which occurred irrespective of the most horrendous wars that have reshaped the world map.
The following are the second portions of a puzzle in construction that is intended to move into deeper complexities introduced by proteomics, cell metabolism, metabolomics, and signaling. This is the only manner by which I can begin to appreciate what a wonder it is to view and live in this world with all its imperfections.
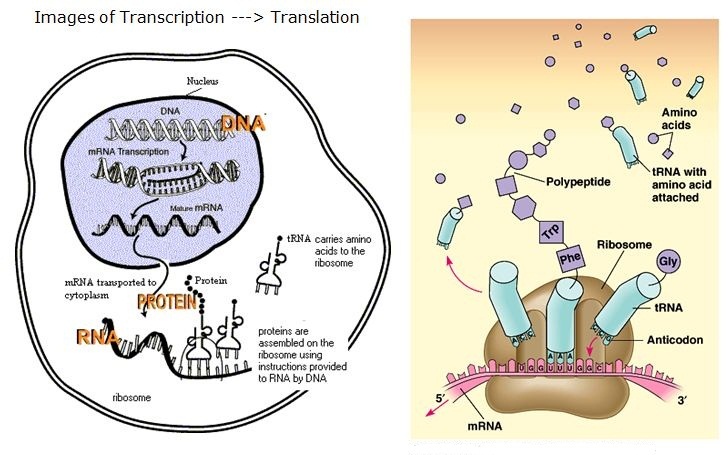
We have already visited the transcription process, by which an RNA sequence is read. This is essential for protein synthesis through the ordering of the amino acids in the primary structure. However, there are microRNAs and noncoding RNAs, and there are transcription factors. The transcription factors bind to chromatin, and the RNAs also have some role in regulating the transcription process. We shall examine this further.
- RNA and the transcription the genetic code
Larry H. Bernstein, MD, FCAP, Writer and Curator
http://pharmaceuticalintelligence.com/2014/08/02/rna-and-the-transcription-of-the-genetic-code/
- The role and importance of transcription factors?
Larry H. Bernstein, MD, FCAP, Writer and Curator
http://pharmaceuticalintelligence.com/2014/8/05/What-is-the-meaning-of-so-many-RNAs
- What is the meaning of so many RNAs?
Larry H. Bernstein, MD, FCAP, Writer and Curator
http://pharmaceuticalintelligence.com/2014/8/05/What-is-the-meaning-of-so-many-RNAs
- Pathology Emergence in the 21st Century
Larry Bernstein, MD, FCAP, Author and Curator
http://pharmaceuticalintelligence.com/2014/08/03/pathology-emergence-in-the-21st-century/
- The Arnold Relman Challenge: US HealthCare Costs vs US HealthCare Outcomes
Larry H. Bernstein, MD, FCAP, Reviewer and Curator; and
Aviva Lev-Ari, PhD, RN, Curator
http://pharmaceuticalintelligence.com/2014/08/05/the-relman-challenge/
Quantifying transcription factor kinetics: At work or at play?
Posted online on September 11, 2013. (doi:10.3109/10409238.2013.833891)
Florian Mueller1,2, Timothy J. Stasevich3, Davide Mazza4, and James G. McNally5
1Institut Pasteur, Computational Imaging and Modeling Unit, CNRS, Paris, Fr
2Functional Imaging of Transcription, Institut de Biologie de l’Ecole Normale Supérieure, Paris, Fr
3Graduate School of Frontier Biosciences, Osaka University, Osaka, Jp
4Istituto Scientifico Ospedale San Raffaele, Centro di Imaging Sperimentale e Università Vita-Salute
San Raffaele, Milano, It, and
5Fluorescence Imaging Group, National Cancer Institute, NIH, Bethesda, MD, USA
Read More: http://informahealthcare.com/doi/abs/10.3109/10409238.2013.833891?goback=%2Egde_3795224_member_273907669#%2EUjYZ8jMt8mo%2Elinkedin
Abstract
Transcription factors (TFs) interact dynamically in vivo with chromatin binding sites. Here we summarize and compare the four different techniques that are currently used to measure these kinetics in live cells, namely fluorescence recovery after photobleaching (FRAP), fluorescence correlation spectroscopy (FCS), single molecule tracking (SMT) and competition ChIP (CC). We highlight the principles underlying each of these approaches as well as their advantages and disadvantages. A comparison of data from each of these techniques raises an important question: do measured transcription kinetics reflect biologically functional interactions at specific sites (i.e. working TFs) or do they reflect non-specific interactions (i.e. playing TFs)? To help resolve this dilemma we discuss five key unresolved biological questions related to the functionality of transient and prolonged binding events at both specific promoter response elements as well as non-specific sites. In support of functionality, we review data suggesting that TF residence times are tightly regulated, and that this regulation modulates transcriptional output at single genes. We argue that in addition to this site-specific regulatory role, TF residence times also determine the fraction of promoter targets occupied within a cell thereby impacting the functional status of cellular gene networks. Thus, TF residence times are key parameters that could influence transcription in multiple ways.
Keywords: Competition-ChIP, kinetic modeling, live-cell imaging, non-specific binding, specific binding, transcription, transcription factor dynamics http://informahealthcare.com/doi/abs/10.3109/10409238.2013.833891?goback=%2Egde_3795224_member_273907669#%2EUjYZ8jMt8mo%2Elinkedin
The Transcription Factor Titration Effect Dictates Level of Gene ExpressionCalifornia Institute of Technology
Robert C. Brewster, Franz M. Weinert, Hernan G. Garcia, Dan Song, Mattias Rydenfelt, and Rob Phillips CalTech
Cell Mar 13, 2014; 156:1312–1323,.
Models of transcription are often built around a picture of RNA polymerase and transcription factors (TFs) acting on a single copy of a promoter. However, most TFs are shared between multiple genes with varying binding affinities. Beyond that, genes often exist at high copy number—in multiple identical copies on the chromosome or on plasmids or viral vectors with copy numbers in the hundreds. Using a thermodynamic model, we characterize the interplay between TF copy number and the demand for that TF. We demonstrate the parameter-free predictive power of this model as a function of the copy number of the TF and the number and affinities of the available specific binding sites; such predictive control is important for the understanding of transcription and the desire to quantitatively design the output of genetic circuits. Finally, we use these experiments to dynamically measure plasmid copy number through the cell cycle.
Optimal reference genes for normalization of qRT-PCR data from archival formalin-fixed, paraffin-embedded breast tumors controlling for tumor cell content and decay of mRNA.
Tramm T, Sørensen BS, Overgaard J, Alsner J.
Diagn Mol Pathol. 2013 Sep;22(3):181-7. http://dx.doi.org:/10.1097/PDM.0b013e318285651e
Gene-expression analysis is increasingly performed on degraded mRNA from formalin-fixed, paraffin-embedded tissue (FFPE), giving the option of examining retrospective cohorts. The aim of this study was to select robust reference genes showing stable expression over time in FFPE, controlling for various content of tumor tissue and decay of mRNA because of variable length of storage of the tissue.
Sixteen reference genes were quantified by qRT-PCR in 40 FFPE breast tumor samples, stored for 1 to 29 years. Samples included 2 benign lesions and 38 carcinomas with varying tumor content. Stability of the reference genes were determined by the geNorm algorithm. mRNA was successfully extracted from all samples, and the 16 genes quantified in the majority of samples.
Results showed 14% loss of amplifiable mRNA per year, corresponding to a half-life of 4.6 years. The 4 most stable expressed genes were CALM2, RPL37A, ACTB, and RPLP0. Several of the other examined genes showed considerably instability over time (GAPDH, PSMC4, OAZ1, IPO8).
In conclusion, we identified 4 genes robustly expressed over time and independent of neoplastic tissue content in the FFPE block. PMID:23846446
Structures of Cas9 Endonucleases Reveal RNA-Mediated Conformational Activation
Martin Jinek1,*,†, Fuguo Jiang2,*, David W. Taylor3,4,*, Samuel H. Sternberg5,*, Emine Kaya2, et al.
1Department of Biochemistry, University of Zurich, CH-8057 Zurich, Switzerland. 2Department of Molecular and Cell Biology,3Howard Hughes Medical Institute, 4California Institute for Quantitative Biosciences, 5Department of Chemistry, 6Physical Biosciences Division, Lawrence Berkeley National Laboratory, Berkeley, CA 94720,. 7The Laboratory for Molecular Infection Medicine Sweden, Umeå University, Umeå S-90187, Sweden. 8Helmholtz Centre for Infection Research, Department of Regulation in Infection Biology, D-38124 Braunschweig, Germany. 9Hannover Medical School, D-30625 Hannover, Germany. 10Life Sciences Division, Lawrence Berkeley National Laboratory, Berkeley, CA 94720.
↵‡ Present address: Friedrich Miescher Institute for Biomedical Research, Maulbeerstrasse 66 CH-4058 Basel, Switzerland.
↵§ Present address: Department of Agricultural and Biological Engineering, University of Florida, Gainesville, FL 32611, USA.
Science http://dx.doi.org:/10.1126/science.1247997
Type II CRISPR-Cas systems use an RNA-guided DNA endonuclease, Cas9,
- to generate double-strand breaks in invasive DNA during an adaptive bacterial immune response.
Cas9 has been harnessed as a powerful tool for genome editing and gene regulation in many eukaryotic organisms.
Here, we report 2.6 and 2.2 Å resolution crystal structures of two major Cas9 enzymes subtypes,
- revealing the structural core shared by all Cas9 family members.
The architectures of Cas9 enzymes define nucleic acid binding clefts, and
single-particle electron microscopy reconstructions show that the two structural lobes harboring these clefts undergo guide
- RNA-induced reorientation to form a central channel where DNA substrates are bound.
The observation that extensive structural rearrangements occur before target DNA duplex binding
- implicates guide RNA loading as a key step in Cas9 activation.
MicroRNA function in endothelial cells
Dr. Virginie Mattot
Angiogenesis, endothelium activation
Solving the mystery of an unknown target gene using microRNA Target Site Blockers
Dr. Virgine Mattot works in the team “Angiogenesis, endothelium activation and Cancer” directed by Dr. Fabrice Soncin at the Institut de Biologie de Lille in France where she studies the roles played by microRNAs in endothelial cells during physiological and pathological processes such as angiogenesis or endothelium activation. She has been using Target Site Blockers to investigate the role of microRNAs on putative targets which functions are yet unknown.
What is the main focus of the research conducted in your lab?
We are studying endothelial cell functions with a particular interest in angiogenesis and endothelium activation during physiological and tumoral vascular development.
How did your research lead to the study of microRNAs?
A few years ago, we identified
- an endothelial cell-specific gene which
- harbors a microRNA in its intronic sequence.
We have since been working on understanding the functions of
- both this new gene and its intronic microRNA in endothelial cells.
What is the aim of your current project?
While we were searching for the functions of the intronic microRNA,
- we identified an unknown gene as a putative target.
The aim of my project was to investigate if this unknown gene was actually a genuine target and if regulation of this gene by the microRNA was involved in endothelial cell function. We had already characterized the endothelial cell phenotype associated with the inhibition of our intronic microRNA. We then used miRCURY LNA™ Target Site Blockers to demonstrate
- the expression of this unknown gene is actually controlled by this microRNA.
- the microRNA regulates specific endothelial cell properties through regulation of this unknown gene.
How did you perform the experiments and analyze the results?
LNA™ enhanced target site blockers (TSB) for our microRNA were designed by Exiqon. We
- transfected the TSBs into endothelial cells using our standard procedure and
- analysed the induced phenotype.
As a control for these experiments, a mutated version of the TSB was designed by Exiqon and transfected into endothelial cells. We first verified that this TSB was functional by analyzing
- the expression of the miRNA target against which the TSB was directed
- we then showed the TSB induced similar phenotypes as those when we inhibited the microRNA in the same cells.
What do you find to be the main benefits/advantage of the LNA™ microRNA target site blockers from Exiqon?
Target Site Blockers are efficient tools to demonstrate the specific involvement of
- putative microRNA targets in the function played by this microRNA.
What would be your advice to colleagues about getting started with microRNA functional analysis?
- it is essential to perform both gain and loss of functions experiments.
Changing the core of transcription
Different members of the TAF family of proteins work in differentiated cells, such as motor neurons or brown fat cells, to control the expression of genes that are specific to each cell type.
Katherine A Jones
Jones. eLife 2014;3:e03575. http://dx.doi.org:/10.7554/eLife.03575
Related research articles: Herrera FJ, Yamaguchi T, Roelink H, Tjian R. 2014. Core promoter factor TAF9B regulates neuronal gene expression. eLife 3:e02559. http://dx.doi.org:/10.7554eLife.02559
Zhou H, Wan B, Grubisic I, Kaplan T, Tjian R. 2014. TAF7L modulates brown adipose tissue formation. eLife 3:e02811. Http://dx.doi.org:/10.7554/eLife.02811

Motor neurons (green) being grown in vitro
Image Motor neurons (green) being grown in vitro
In a developing organism, different genes are expressed at different times
- the pattern of gene expression can often change abruptly.
Expressing a gene involves multiple steps:
- the DNA must be transcribed into a molecule of messenger RNA,
- which is then translated into a protein.
The mechanisms that start the transcription of protein-coding genes in rapidly growing cells are reasonably well understood: two types of proteins—
- DNA-binding activators and general transcription factors—
cooperate to recruit an enzyme called RNA polymerase, which then transcribes the gene (Kadonaga, 2012).
These proteins bind to a region of the gene called the promoter, which is
- upstream from the protein-coding region of the gene.
TATA-binding protein is a general transcription factor that
- binds to certain sequences of DNA bases found within promoters
14 TATA-binding protein associated factors (TAFs) are included into two different protein complexes called TFIID and SAGA (Müller et al., 2010). which, in budding yeast, can recruit TATA-binding protein to gene promoters (Basehoar et al., 2004), but not all genes require all of the general transcription factors, and some genes require both TFIID and SAGA complexes.
Although the steps that are required to switch on genes when cells are rapidly dividing are fairly well known,
- the same is not true for cells that are differentiating into specialised cell types.
In these cells, many transcription factors are downregulated and
- the entire pattern of gene expression changes dramatically.
Moreover, certain TAFs are strongly up-regulated during differentiation. The core transcriptional machinery is essentially rebuilt at the genes that are expressed in differentiated cells.
Over the years Robert Tjian of the University of California Berkeley and co-workers have illuminated how individual TAFs can affect how a cell differentiates in different contexts (Figure 1). Now, in eLife, Francisco Herrera of UC Berkeley and co-workers—including Teppei Yamaguchi, Henk Roelink and Tjian—have identified a critical role for a TAF called TAF9B in the expression of genes in motor neurons (Herrera et al., 2014).
Herrera et al. found that TAF9B predominantly associates with the SAGA complex, rather than the TFIID complex, in the motor neuron cells. Mice in which the gene for TAF9B had been deleted had less neuronal tissue in the developing spinal cord. Moreover, the genes that are involved in forming the branches of neurons were not properly regu¬lated in these mice.
Recently, in another eLife paper, Tjian and co-workers at Berkeley, Fudan University and the Hebrew University of Jerusalem—including Haiying Zhou as first author, Bo Wan, Ivan Grubisic and Tommy Kaplan—reported that another TAF protein, called TAF7L, works as part of the TFIID complex to up-regulate genes that direct cells to become brown adipose tissue (Zhou et al., 2014).

TATA-binding protein associated factors
Figure 1. TATA-binding protein associated factors (TAFs) regulate transcription in specific cell types. TAF3, for example, works with another transcription factor to regulate the expression of genes that are critical for the differentiation of the endoderm in the early embryo (Liu et al., 2011). TAF3 also forms a complex with the TATA-related factor, TRF3, to regulate Myogenin and other muscle-specific genes to form myotubes (Deato et al., 2008). TAF7L interacts with another transcription factor to activate genes involved in the formation of adipocytes (‘fat cells’) and adipose tissue (Zhou et al., 2013; Zhou et al., 2014). Finally, TAF9B is a key regulator of transcription in motor neurons (Herrera et al., 2014). The names of some of the genes regulated by the TAFs are shown in brackets.
TAF9B
Deleting the gene for TAF9B in mouse embryonic stem cells revealed that this TAF
- is not needed for the growth of stem cells, or
- required for the expression of genes that prevent differentiation:
both of these processes are known to be highly-dependent upon the TFIID complex
(Pijnappel et al., 2013). However,
- genes that would normally be expressed specifically in neurons were not
- up-regulated when cells without the TAF9B gene started to specialise.
Herrera et al. identified numerous genes that can only be switched on when the TAF9B protein is present, which means that it joins a growing list of TAF proteins that are dedicated to controllingthe expression of genes in specialised cell types.
TAF9B activates neuron-specific genes by binding to sites that
- reside outside of these genes’ core promoters.
Further, many of these sites were also bound by a master regulator of motor neuron-specific genes.
TAF7L
Whilst most of the fat tissue in humans is white adipose tissue, which contains cells that store fatty molecules, some is brown adipose tissue, or ‘brown fat’, that instead generates heat. When TAF7L promotes the differentiation of brown fat, it up-regulates genes that are targeted by a transcription
factor called PPAR-γ; last year it was shown that this transcription factor also promotes the differentiation of white adipose tissue (Zhou et al., 2013).
Mice without the TAF7L gene had 40% less brown fat than wild-type mice, and also grew too much skeletal muscle tissue. TAF7L was specifically required to activate genes that control how brown fat develops and functions. Thus TAF7L expression appears to shift the fate of a stem cell towards brown adipose tissue, potentially at the expense of skeletal muscle, as both cell types develop from the same group of stem cells.
When stem cells with less TAF7L than normal are differentiated in vitro, they yield more muscle than fat cells. Conversely, cells with an excess of TAF7L express brown fat-specific genes and switch off muscle-specific genes.
The work of Herrera et al. and Zhou et al. reinforces the idea that different TAFs
- provide the flexibility needed to control gene expression in a tissue-specific manner, and
- enable differentiating cells to change which genes they express rapidly.
However many interesting questions remain:
Which signals lead to the destruction of core transcription factors?
Are core promoter elements at tissue-specific genes designed to recognise variant TAFs?
What determines whether variant TAFs are incorporated within TFIID, SAGA, or other complexes?
Shortly after RNA polymerase II starts to transcribe a gene, it briefly pauses. Interestingly, a DNA sequence associated with this pausing, called the pause button, closely matches the sequences that bind to two subunits of TFIID (TAF6 and TAF9; Kadonaga, 2012). Consequently, TAF6 and TAF9 might be involved in pausing transcription, and if so, the variant TAF9B could play a similar role at motor neuron genes.
Molecular basis of transcription pausing
Jeffrey W. Roberts
Science 344, 1226 (2014); http://dx.doi.org:/10.1126/science.1255712
http://www.sciencemag.org/content/344/6189/1226.full.html
During RNA synthesis, RNA polymerase moves erratically along DNA, frequently
resting as it produces an RNA copy of the DNA sequence. Such pausing helps coordinate the appearance of a transcript with its utilization by cellular processes; to this end,
- the movement of RNA polymerase is modulated by mechanisms that determine its rate. For example,
- pausing is critical to regulatory activities of the enzyme such as the termination of transcription. It is also
- essential during early modifications of eukaryotic RNA polymerase II that activate the enzyme for elongation.
Two reports analyzing transcription pausing on a global scale in Escherichia coli, by Larson et al. ( 1) and by Vvedenskaya et al. ( 2) on page 1285 of this issue, suggest
- new functions of pausing and important aspects of its molecular basis.
The studies of Larson et al. and Vvedenskaya et al. follow decades of analysis of
bacterial transcription that has illuminated the molecular basis of polymerase pausing
events that serve critical regulatory functions.
A transcription pause specified by the DNA sequence synchronizes the translation of RNA into protein
- with the transcription of leader regions of operons (groups of genes transcribed together) for amino acid biosynthesis;
- this coordination controls amino acid synthesis in response to amino acid availability ( 3).
A protein induced pause occurs when the E. coli initiation factor σ70 restrains RNA polymerase by binding a second occurrence of the “–10” promoter element.
This paused polymerase provides a structure for engaging a transcription antiterminator (the bacteriophage λ Q protein) ( 4) that, in turn, inhibits transcription
pauses, including those essential for transcription termination.
Biochemical and structural analyses have identified an endpoint of the pausing process called the “elemental pause” in which the catalytic structure in the active site is distorted,
- preventing further nucleotide addition ( 7).
The elemental paused state also involves distinct
- conformational changes in the polymerase that may favor transcription termination
- and allow the his and related pauses to be stabilized by RNA hairpins ( 8).
A consensus sequence for ubiquitous pauses was identified, with two important elements:
- a preference for pyrimidine [mostly cytosine (C)] at the newly formed RNA end
- followed by G to be incorporated next—just as found for the his pause; and a preference for G at position –10 of the RNA (10 nucleotides before the 3’ end)

Polymerase, paused
Polymerase, paused. During transcription, RNA exists in two states as RNA polymerase progresses: pretranslocated, just after the addition of the last nucleotide [here, cytosine (C)];
and posttranslocated, after all nucleic acids have shifted in register by one nucleotide relative
to the enzyme, exposing the active site for binding of the next substrate molecule [here, guanine (G)]. The pretranslocated state is dominant in the pause. The critical G-C base (RNA-DNA) pair at position –10 in the pretranslocated state and the nontemplate DNA strand G bound in the
polymerase in the posttranslocated state are marked with an asterisk.
Binding of G at position 1 to CRE only occurs in the posttranslocated state, which would thus
be favored over the pretranslocated state. Hence, if G binding inhibits pausing, then the rate-limiting paused structure must be in the pretranslocated state (a conclusion also made by Larson et al. from biochemical experiments).
This is an important insight into the sequence of protein–nucleic acid interactions that occur in pausing. Vvedenskaya et al. suggest that the actual role of the G binding site is to promote translocation and thus
inhibit pausing, to smooth out adventitious pauses in genomic DNA.
The studies by Larson et al. and Vvedenskaya et al. provide a refined and detailed analysis of DNA sequence–induced transcription pausing.
Processive Antitermination
Robert A. Weisberg1* and Max E. Gottesman2
Section on Microbial Genetics, Laboratory of Molecular Genetics, National Institute of Child Health and
Human Development, National Institutes of Health, Bethesda, Maryland 20892-2785,1 and
Institute of Cancer Research, Columbia University, New York, New York 100322
Journal Of Bacteriology, Jan. 1999; 181(2): 359–367.
After initiating synthesis of RNA at a promoter, RNA polymerase (RNAP) normally continues to elongate the transcript until it reaches a termination site. Important elements of termination sites are transcribed before polymerase translocation stops, and the resulting RNA is an active element of the termination pathway. Nascent transcripts of intrinsic sites can halt transcription without the assistance of additional factors, and
those of Rho-dependent sites recruit the Rho termination protein to the elongation complex. In both cases, RNAP, the transcript, and the template dissociate (reviewed in references 76 and 80).
Termination is rarely, if ever, completely efficient, and the expression of downstream genes can be controlled by altering the efficiency of terminator readthrough. Two distinct mechanisms of elongation control have been reported for bacterial RNA polymerases. In one, exemplified by attenuation of the his and trp operons of Salmonella typhimurium and Escherichia coli, respectively,
- a single terminator is inactivated by interaction with an upstream sequence in the transcript, with a terminator-specific protein, or with a translating ribosome that follows closely behind RNAP (reviewed in references 35 and 104).
In a second, whose prototype is antitermination of phage l early transcription,
- polymerase is stably modified to a terminator-resistant form after it leaves the promoter.
In this case, the modified enzyme not only transcribes through sequential downstream terminators,
- but also it is less sensitive to the pause sites that normally delay transcript elongation.
Both pathways are widespread in nature, but in this minireview we consider only the second,
- known as processive antitermination
(for previous reviews, see references 22, 23, 27, and 32).
The recent explosive growth in our understanding of transcription elongation (reviewed in references 57, 96, and 99) make this an especially appropriate time to survey regulatory elements that target the transcription elongation complex.
Antitermination in l is induced by two quite distinct mechanisms.
- the result of interaction between l N protein and its targets in the early phage transcripts,
- an interaction between the l Q protein and its target in the late phage promoter.
We describe the N mechanism first. Lambda N, a small basic protein of the arginine- rich motif (ARM) (Fig. 1) family of RNA binding proteins, binds to a 15-nucleotide (nt) stem-loop called BOXB (17) (Fig. 2).
FIG. 1. [not shown] (A) Alignment of phage N proteins and the HK022 Nun protein. The color groupings reflect the frequency of amino acid substitutions in evolutionarily related protein domains: an amino acid is more likely to be replaced by one in the same color group than by one in a different color group in related proteins (34).
The amino-proximal ARM regions were aligned by eye and according to the structures of the P22 and l ARMs complexed to their cognate nut sites (see text and Fig. 2), and the remainder of the proteins was aligned by ClustalW (38). The dots indicate gaps introduced to improve the alignment. Aside from the ARM regions, the
proteins fall into three very distantly related (or unrelated) families: (i) l and phage 21; (ii) P22, phage L, and HK97; and (iii) HK022 Nun.
FIG. 2. [not shown] BOXA and BOXB RNAs and their interaction with the ARM of their cognate N proteins. The amino acid-nucleotide interactions are shown to the left except for BOXB of phage 21, for which the structure of the complex is unknown. The sequences of BOXA and BOXA-BOXB spacer are shown to the right. The dots
to the left and right of the spacer sequences are for alignment. (A) l N-ARM-BOXB complex (adapted from reference 48 with permission of the publisher). Open circles, pentagons, and rectangles represent phosphates, riboses, and bases, respectively. Watson-Crick base pairs (????) are indicated. The zigzag line denotes a sheared
G z A base pair. Open circles, open rectangles, and arrowheads depict ionic, hydrophobic, and hydrogen-bonding interactions, respectively. Guanine-11, indicated by a bold rectangle, is extruded from the BOXB loop (see text). (B) P22 N-ARM-BOXB complex (adapted from reference 15 with permission of the publisher). Open
circles, pentagons, rectangles, and ovals represent phosphates, riboses, bases, and amino acids, respectively. The solid pentagons indicate riboses with a C29-endo pucker.
Base stacking ( ), intermolecular hydrogen bonding or electrostatic interactions (,—–), intermolecular hydrophobic or van der Waals interactions (4), intramolecular hydrogen bonds (– – – –) and Watson-Crick base pairs (?????) are indicated. Cytosine-11 is extruded from the loop (see text). Note that the amino-terminal amino acid
residue in the complex corresponds to Asn-14 in the complete protein (Fig. 1), and the displayed amino acids are numbered accordingly. (C) NUTL site of phage 21. The arrows indicate the inverted sequence repeats of BOXB.
FIG. 3. [not skown] HK022 put sites and folded PUT RNAs. (A) Alignment of putL and putR (43). The numbers give distances from the start sites of the PL and PR promoters, respectively, and the pairs of arrows indicate inverted sequence repeats. (B) Folded PUTL and PUTR RNAs. The structures, which were generated by energy
minimization as described (43), have been partially confirmed by genetic and biochemical studies (7, 43).
The active bacterial elongation complex consists of
- core RNAP,
- template, and
- RNA product.
The 39 end of the RNA
- is engaged in the active site of the enzyme,
- The following ;8 nt are hybridized to the template strand of the DNA, and
- the next ;9 nt remain closely associated with RNAP (64).
- About 17 nt of the nontemplate DNA strand are separated from the template strand in the transcription bubble.
Elongation complexes can also contain NusA and/or NusG. These proteins, which
- increase the stability of the N-mediated antitermination complex (see above),
- have different effects on elongation.
- NusA decreases and NusG increases the elongation rate, and
- both proteins alter termination efficiency in a terminator-specific manner (13, 14, 86; see reference 76).
An elongation complex, unless located at a terminator, is extraordinarily stable,
- even when translocation is prevented by removal of substrates.
Recent observations suggest that this stability depends mainly on
- interactions between RNAP and the RNA-DNA hybrid as well as
- between polymerase and the downstream duplex DNA template (63, 87).
Nascent RNA emerging from the hybrid region and upstream duplex DNA
- do not appear to be required.
The strength of the RNA-DNA hybrid is believed to
- assure the lateral stability of the complex.
Reducing the strength of the RNA-DNA bonds, for example
- by incorporation of nucleotide analogs,
- favors backsliding of RNAP on the template, with consequent
- disengagement of the 39 RNA end from the active site, and
- concerted retreat of the RNA-DNA hybrid region from the 39 end (65).
Such a disengaged complex retains its resistance to dissociation and
- is capable of resuming elongation if the original or a newly created 39 end reengages with the active site (10, 44, 45, 65, 71, 95).
Intrinsic terminators consist of a guanine- and cytosine-rich RNA hairpin stem
- immediately followed by a short uracil-rich segment
- within which termination can occur.
If termination does not occur at this point,
- polymerase continues to elongate the transcript with normal processivity
- until it reaches the next terminator.
Neither the stem nor the uracil-rich segment
- is sufficient for termination, although
- either can transiently slow elongation.
The weakness of base pairing between rU and dA
- destabilizes the RNA-DNA hybrid in the uracil-rich segment, and
- this probably contributes to termination.
Formation of the hairpin stem as nascent terminator RNA emerges from polymerase
- destabilizes the RNA-DNA hybrid and
- interrupts contacts between the emerging nascent RNA and RNAP (62a).
It might also interfere with the stabilizing interactions between
- RNAP and the hybrid or those between RNAP and
- the downstream region of the template.
Cross-linking of nucleic acid to RNAP suggests that
- both the downstream DNA and the nascent RNA
- that emerges from the hybrid region, and
- within which the terminator hairpin might form,
- are located close to the same regions of the enzyme (64).
Conversely, modifications that render RNAP termination resistant
- could prevent the terminator stem from destabilizing one or more of these targets,
- at least while the 39 end of the RNA is within the uracil rich segment of the terminator.
The l N and Q proteins and HK022 PUT RNA
- also suppress Rho-dependent terminators (43a, 79, 103) which,
- in contrast to intrinsic terminators, lack a precisely determined termination point.
Rho is an RNA-dependent ATPase that binds to cytosine-rich, unstructured regions in nascent RNA and acts preferentially
- to terminate elongation complexes that are paused at nearby downstream sites
(19, 29, 46, 47, 59, 60).
Rho possesses RNA-DNA helicase activity, and this activity is directional,
- unwinding DNA paired to the 39 end of the RNA molecule (11, 90).
- This corresponds to the location of the hybrid and of RNAP
in an active ternary elongation complex.
The ability of antiterminators to suppress Rho-dependent and -independent terminators
- suggests that they prevent a step that is common to both classes.
Given the helicase activity of Rho, a likely candidate for this step is disruption of the RNA-DNA
hybrid. However, other candidates, such as destabilization of RNAP-template or RNAP-hybrid interactions, are also plausible.
Alternatively, the ability of N, Q, and PUT to suppress RNAP pausing (31, 43, 54, 74)
- suggests that they prevent Rho-dependent termination
- by accelerating polymerase away from Rho bound at upstream RNA sites.
This explanation raises the problem of why NusG,
- which also accelerates polymerase,
- enhances rather than suppresses Rho-dependent termination (see above).
Clearly, the molecular details of processive antitermination remain poorly understood despite the 30 years that have elapsed since its discovery.
System wide analyses have underestimated protein abundances and the importance of transcription in mammals
OPEN ACCESS
Jingyi Jessica Li1, 2, Peter J Bickel1 and Mark D Biggin3
1Department of Statistics, University of California, Berkeley, CA, USA
2Departments of Statistics and Human Genetics, University of California, Los Angeles, CA, USA
3Genomics Division, Lawrence Berkeley National Laboratory, Berkeley, CA, USA
Academic editor – Barbara Engelhardt http://dx.doi.org:/10.7717/peerj.270
Distributed under Creative-Commons CC-0
ABSTRACT
Large scale surveys in mammalian tissue culture cells suggest that the protein ex-
pressed at the median abundance is present at 8,000_16,000 molecules per cell and
that differences in mRNA expression between genes explain only 10_40% of the dif-
ferences in protein levels. We find, however, that these surveys have significantly un-
derestimated protein abundances and the relative importance of transcription.
Using individual measurements for 61 housekeeping proteins to rescale whole proteome
data from Schwanhausser et al. (2011), we find that the median protein detected is
expressed at 170,000 molecules per cell and that our corrected protein abundance
estimates show a higher correlation with mRNA abundances than do the uncorrected
protein data. In addition, we estimated the impact of further errors in mRNA and
protein abundances using direct experimental measurements of these errors.
The resulting analysis suggests that mRNA levels explain at least
- 56% of the differences in protein abundance for the 4,212 genes
detected by Schwanhausser et al. (2011), though because one major source of error
could not be estimated the true percent contribution should be higher.
We also employed a second, independent strategy to
- determine the contribution of mRNA levels to protein expression.
The variance in translation rates directly measured by ribosome profiling is only 12%
of that inferred by Schwanhausser et al. (2011), and
- the measured and inferred translation rates correlate poorly (R2 D 13).
Based on this, our second strategy suggests that
- mRNA levels explain _81% of the variance in protein levels.
We also determined the percent contributions of
- transcription,
- RNA degradation,
- translation
- and protein degradation
to the variance in protein abundances using both of our strategies.
While the magnitudes of the two estimates vary, they both suggest that
- transcription plays a more important role than the earlier studies implied and
- translation a much smaller role.
Finally, the above estimates only apply to those genes whose mRNA and protein expression was detected. Based on a detailed analysis by Hebenstreit et al. (2012), we estimate that approximately
- 40% of genes in a given cell within a population express no mRNA.
Since there can be no translation in the absence of mRNA, we argue that
- differences in translation rates can play no role in determining the expression levels for the _40% of genes that are non-expressed.
Subjects Bioinformatics, Computational Biology
Keywords Transcription, Translation, Mass spectrometry, Gene expression, Protein abundance
How to cite this article Li et al. (2014), System wide analyses have underestimated protein abundances and the importance of transcription in mammals. PeerJ 2:e270;
http://dx.doi.org:/10.7717/peerj.270
Assessing quality and completeness of human transcriptional regulatory pathways on a genome-wide scale
Evgeny Shmelkov1,2, Zuojian Tang2, Iannis Aifantis3, Alexander Statnikov2,4
Shmelkov et al. Biology Direct 2011, 6:15 http://www.biology-direct.com/content/6/1/15
Background: Pathway databases are becoming increasingly important and almost omnipresent in most types of biological and translational research. However, little is known about the quality and completeness of pathways stored in these databases. The present study conducts a comprehensive assessment of transcriptional regulatory pathways in humans for seven well-studied transcription factors: MYC, NOTCH1, BCL6, TP53, AR, STAT1, and RELA.
The employed benchmarking methodology first
- involves integrating genome-wide binding with functional gene expression data to derive direct targets of transcription factors.
- Then the lists of experimentally obtained direct targets are compared with relevant lists of transcriptional targets from 10 commonly used pathway databases.
Results: The results of this study show that for the majority of pathway databases,
- the overlap between experimentally obtained target genes and targets reported in transcriptional regulatory pathway databases is surprisingly small and often is not statistically significant.
The only exception is MetaCore pathway database which yields statistically significant intersection with experimental results in 84% cases. Additionally, we suggest that
- the lists of experimentally derived direct targets obtained in this study can be used to reveal new biological insight in transcriptional regulation and
- suggest novel putative therapeutic targets in cancer.
Conclusions: Our study opens a debate on validity of using many popular pathway databases to obtain transcriptional regulatory targets. We conclude that the choice of pathway databases should be informed by solid scientific evidence and rigorous empirical evaluation.

Illustration of statistical methodology
Figure 2 Illustration of statistical methodology for comparison
between a gold-standard and a pathway database
Additional material
Additional file 1: Supplementary Information. Table S1: Functional gene expression data. Table 2: Transcription factor-DNA binding data. Table S3: Most confident direct transcriptional targets of each of the four transcription factors. These targets were obtained by overlapping several gold-standards obtained with different datasets for the same transcription factor. Table S4: Genes directly regulated by two or more of the three transcription factors: MYC, NOTCH1, and RELA. Figure S1: Comparison of gene sets of transcriptional targets derived from ten different pathway databases by Jaccard index. In case, where Jaccard index of an overlap could not be determined due to comparison of two empty gene lists, we assigned value 0. Cells are colored according to the Jaccard index, from white (Jaccard index equal to 0) to dark-orange (Jaccard index equal to 1). Each sub-figure gives results for a different transcription factor: (a) AR, (b) BCL6, (c) MYC, (d) NOTCH1, (e) RELA, (f) STAT1, (g) TP53
http://dx.doi.org:/10.1186/1745-6150-6-15
Cite this article as: Shmelkov et al.: Assessing quality and completeness of human transcriptional regulatory pathways on a genome-wide scale. Biology Direct 2011 6:15
The Functional Consequences of Variation in Transcription Factor Binding
Darren A. Cusanovich1, Bryan Pavlovic1,2, Jonathan K. Pritchard1,2,3*, Yoav Gilad1*
1 Department of Human Genetics, University of Chicago, 2 Howard Hughes Medical Institute, University of Chicago, Chicago,
Illinois, 3 Departments of Genetics and Biology and Howard Hughes Medical Institute, Stanford University, Stanford, California,
One goal of human genetics is to understand how the information for precise and dynamic gene expression programs is encoded in the genome. The interactions of transcription factors (TFs) with DNA regulatory elements clearly play an important role in determining gene expression outputs, yet the regulatory logic underlying functional transcription factor binding is poorly understood. Many studies have focused on characterizing the genomic locations of TF binding, yet it is unclear to what extent TF binding at any specific locus has functional consequences with respect to gene expression output.
To evaluate the context of functional TF binding we knocked down
- 59 TFs and chromatin modifiers in one HapMap lymphoblastoid cell line.
- We identified genes whose expression was affected by the knockdowns.
- We intersected the gene expression data with transcription factor binding data
(based on ChIP-seq and DNase-seq) within 10 kb of the transcription start sites
This combination of data allowed us to infer functional TF binding.
- we found that only a small subset of genes bound by a factor were differentially expressed following the knockdown of that factor, suggesting that
- most interactions between TF and chromatin do not result in measurable changes in gene expression levels of putative target genes.
- functional TF binding is enriched in regulatory elements that harbor
- a large number of TF binding sites,
- at sites with predicted higher binding affinity, and
- at sites that are enriched in genomic regions annotated as ‘‘active enhancers.’’
Author Summary
An important question in genomics is to understand how a class of proteins called ‘‘transcription factors’’ controls the expression level of other genes in the genome in a cell type-specific manner – a process that is essential to human development. One major approach to this problem is to
study where these transcription factors bind in the genome, but this does not tell us about the effect of that binding on gene expression levels and it is generally accepted that much of the binding does not strongly influence gene expression. To address this issue, we artificially reduced the concentration of 59 different transcription factors in the cell and then examined which genes were impacted by the reduced transcription factor level. Our results implicate some attributes that might
influence what binding is functional, but they also suggest that a simple model of functional vs. non-functional binding may not suffice.
Citation: Cusanovich DA, Pavlovic B, Pritchard JK, Gilad Y (2014) The Functional Consequences of Variation in Transcription Factor Binding. PLoS Genet 10(3):e1004226. http://dx.doi.org:/10.1371/journal.pgen.1004226
Editor: Yitzhak Pilpel, Weizmann Institute of Science, Israel

Effect sizes for differentially expressed genes
Figure 2. Effect sizes for differentially expressed genes.
Boxplots of absolute Log2(fold-change) between knockdown arrays
and control arrays for all genes identified as differentially expressed in
each experiment. Outliers are not plotted. The gray bar indicates the
interquartile range across all genes differentially expressed in all
knockdowns. Boxplots are ordered by the number of genes differentially
expressed in each experiment. Outliers were not plotted.
http://dx.doi.org:/10.1371/journal.pgen.1004226.g002

Intersecting binding data and expression data for each knockdown
Figure 3. Intersecting binding data and expression data for each knockdown. (a) Example Venn diagrams showing the overlap of binding and differential expression for the knockdowns of HCST and IRF4 (the same genes as in Figure 1). (b) Boxplot summarizing the distribution of the fraction of all expressed genes that are bound by the targeted gene or downstream factors. (c) Boxplot summarizing the distribution of the fraction of
bound genes that are classified as differentially expressed, using an FDR of either 5% or 20%.
http://dx.doi.org:/10.1371/journal.pgen.1004226.g003

Degree of binding correlated with function
Figure 4. Degree of binding correlated with function. Boxplots comparing (a) the number of sites bound, and (b) the number of differentially expressed transcription factors binding events near functionally or non-functionally bound genes. We considered binding for siRNA-targeted factor and any factor differentially expressed in the knockdown. (c) Focusing only on genes differentially expressed in common between each pairwise set of knockdowns we tested for enrichments of functional binding (y-axis). Pairwise comparisons between knock-down experiments were binned by the fraction of differentially expressed transcription factors in common between the two experiments. For these boxplots, outliers were not plotted.
http://dx.doi.org:/10.1371/journal.pgen.1004226.g004

Distribution of functional binding about the TSS
Figure 5. Distribution of functional binding about the TSS. (a) A density plot of the distribution of bound sites within 10 kb of the TSS for both functional and non-functional genes. Inset is a zoom-in of the region +/21 kb from the TSS (b) Boxplots comparing the distances from the TSS to the binding sites for functionally bound genes and non-functionally bound genes. For the boxplots, 0.001 was added before log10 transforming
the distances and outliers were not plotted.
http://dx.doi.org:/10.1371/journal.pgen.1004226.g005

Magnitude and direction of differential expression after knockdown
Figure 6. Magnitude and direction of differential expression after knockdown. (a) Density plot of all Log2(fold-changes) between the knockdown arrays and controls for genes that are differentially expressed at 5% FDR in one of the knockdown experiments as well as bound by the targeted transcription factor. (b) Plot of the fraction of differentially expressed putative direct targets that were up-regulated in each of the knockdown experiments.
http://dx.doi.org:/10.1371/journal.pgen.1004226.g006
To test whether the number of paralogs or the degree of similarity with the closest paralog for each transcription factor knocked down might influence the number of genes differentially expressed in our experiments, we obtained definitions of paralogy and the calculations of percent identity for 29 different factors from Ensembl’s BioMart (http://useast.ensembl.org/biomart/martview/) [31]. We used genome build GRCh37.p13.
For each gene, we counted the number of paralogs classified as a ‘‘within_species_paralog’’. After selecting only genes considered a ‘‘within_species_paralog’’, we also assigned the maximum percent identity as the closest paralog.
To evaluate the effect that an independent assignment of target genes to regulatory regions might have on our analyses, we used the definition of target genes defined by Thurman et al. (ftp://ftp.ebi.ac.uk/pub/databases/…)
which use correlations in DNase hypersensitivity between distal and proximal regulatory regions across different cell types to link distal elements to putative target genes [38].
We intersected the midpoints of our called binding events (defined above) with these regulatory elements in order to assign our binding events to specific target genes and then re-analyzed the overlap between
binding and differential expression in our experiments.
PLOS Genetics 6 Mar 2014; 10 (3), e1004226
The essential biology of the endoplasmic reticulum stress response
for structural and computational biologists
Sadao Wakabayashia, Hiderou Yoshidaa,*
aDepartment of Molecular Biochemistry, Graduate School of Life Science,
University of Hyogo, Hyogo 678-1297, Japan
CSBJ Mar 2013; 6(7), e201303010, http://dx.doi.org/10.5936/csbj.201303010
Abstract: The endoplasmic reticulum (ER) stress response is a cytoprotective mechanism that maintains homeostasis of the ER by
- upregulating the capacity of the ER in accordance with cellular demands.
If the ER stress response cannot function correctly, because of reasons such as aging, genetic mutation or environmental stress,
- unfolded proteins accumulate in the ER and cause ER stress-induced apoptosis,
- resulting in the onset of folding diseases,
- including Alzheimer’s disease and diabetes mellitus.
Although the mechanism of the ER stress response has been analyzed extensively by biochemists, cell biologists and molecular biologists, many aspects remain to be elucidated. For example,
- it is unclear how sensor molecules detect ER stress, or
- how cells choose the two opposite cell fates
(survival or apoptosis) during the ER stress response.
To resolve these critical issues, structural and computational approaches will be indispensable, although the mechanism of the ER stress response is complicated and difficult to understand holistically at a glance. Here, we provide a concise introduction to the mammalian ER stress response for structural and computational biologists.
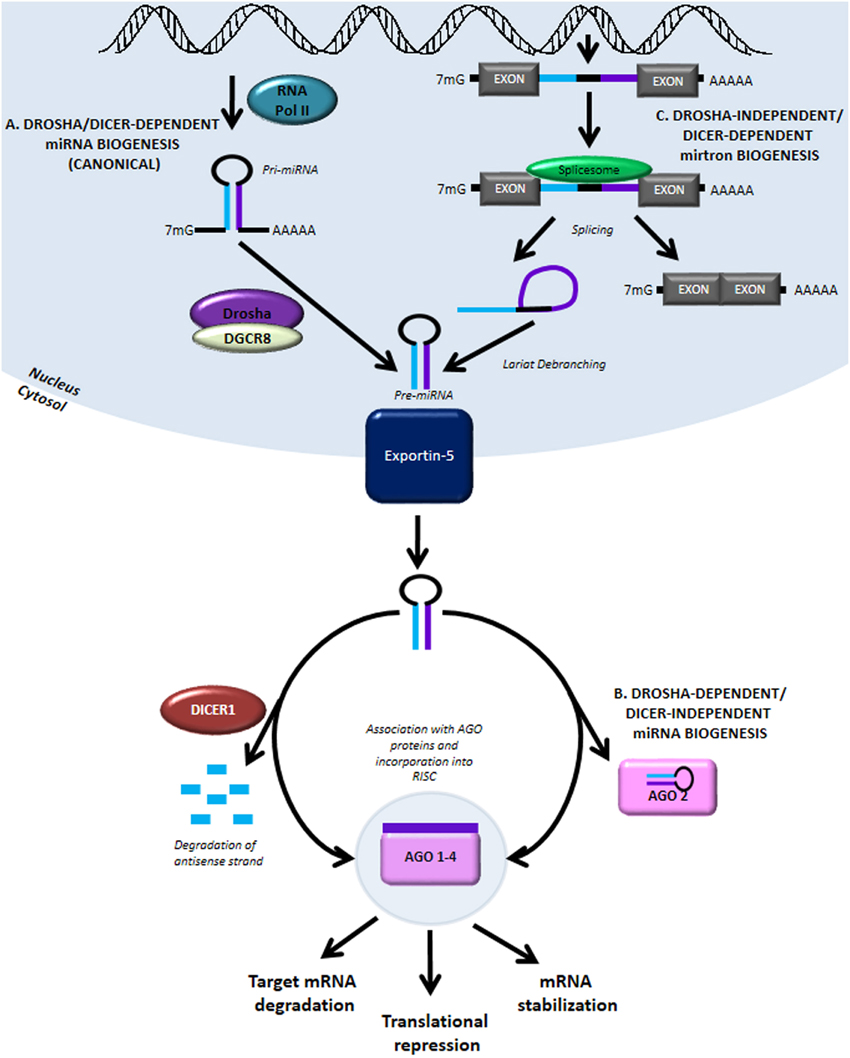
The basic mechanism of the mammalian ER stress response
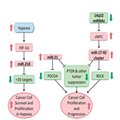
The mammalian ER stress response consists of three pathways: the ATF6, IRE1 and PERK pathways, of which the main functions are
- augmentation of folding and ERAD capacity, and
- translational attenuation, respectively.
Although these response pathways cross-talk with each other and have several branched subpathways, we focus on the main pathways in this section.
- The ATF6 pathway regulates the transcriptional induction of ER chaperone genes
- pATF6(P) is a sensor molecule comprising a type II transmembrane protein residing on the ER membrane (Figure 2).
When pATF6(P) detects ER stress,
- the protein is transported to the Golgi apparatus through vesicular transport in a COP-II vesicle
- and is sequentially cleaved by two proteases residing in the Golgi,
- namely site 1 protease (S1P) and site 2 protease (S2P)
The cytoplasmic portion of pATF6(P) (pATF6(N)) is
- released from the Golgi membrane,
- translocates into the nucleus,
- binds to an enhancer element called the ER stress response element (ERSE),
- and activates the transcription of ER chaperone genes,
- including BiP, GRP94, calreticulin and protein disulfide isomerase (PDI)
The consensus nucleotide sequence of ERSE is CCAAT(N9)CCACG, and pATF6(N) recognizes both the CCACG portion and another transcription factor NF-Y,
- which binds to the CCAAT portion
NF-Y is a general transcription factor required for
- the transcription of various human genes
Figure 2. The ATF6 pathway. The sensor molecule pATF6(P) located on the ER membrane is transported to the Golgi apparatus by transport vesicles in response to ER stress. In the Golgi apparatus, pATF6(P) is sequentially cleaved by two proteases, S1P and S2P, resulting in release of the cytoplasmic portion pATF6(N) from the ER membrane. pATF6(N) translocates into the nucleus and activates transcription of ER chaperone genes through binding to the cis-acting enhancer ERSE.
Figure 3. The IRE1 pathway. In normal growth conditions, the sensor molecule IRE1 is an inactive monomer, whereas IRE1 forms an active oligomer in response to ER stress. Activated IRE1 converts unspliced XBP1 mRNA to mature mRNA by the cytoplasmic mRNA splicing. From mature XBP1 mRNA, an active transcription factor pXBP1(S) is translated and activates the transcription of ERAD genes through binding to the enhancer UPRE.
Figure 4. The PERK pathway. When PERK detects unfolded proteins in the ER, PERK phosphorylates eIF2α, resulting in translational attenuation and translational induction of ATF4. ATF4 activates the transcription of target genes encoding translation factors, anti-oxidation factors and a transcription factor CHOP. Other kinases such as PKR, GCN2 and HRI also phosphorylate eIF2α, and phosphorylated eIF2α is dephosphorylated by CReP, PP1C-GADD34 and p58IPK
Figure 7. Three functions of pXBP1(U). pXBP1(U) translated from XBP1(U) mRNA binds to pXBP1(S) and enhances its degradation. The CTR region of pXBP1(U) interacts with the ribosome tunnel and slows translation, while the HR2 region anchors XBP1(U) mRNA to the ER membrane, in order to enhance splicing of XBP1(U) mRNA by IRE1.
Figure 8. Major pathways of ER stress-induced apoptosis. ER stress induces apoptosis through various pathways, including transcriptional induction of CHOP by the PERK and ATF6 pathways, the IRE1-TRAF2 pathway and the caspase-12 pathway.
If cells are damaged by strong and sustained ER stress that they cannot deal with and ER stress still persists and hampers the survival of the organism, the ER stress response activates the apoptotic pathways and disposes of damaged cells from the body.
Computational simulation of response pathways to analyze the decision mechanism that determines cell fate (survival or apoptosis) provides a valuable analysis tool, although there have been few such studies to date.
Like this:
Like Loading...
Read Full Post »


 #
# 

 Thursday 15 October 2015, 12:00–13:00


