Feeds:
Posts
Comments

Posts Tagged ‘Lung cancer’

Live Notes from Town Hall for Patients with Leading Oncologists on Lung Cancer and COVID19 3_28_20

Reporter: Stephen J. Williams, PhD

UPDATED 3/31/2020

Leading Thoracic Oncologists from the United States and Milan, Italy shared their opinions and views on treating lung cancer patients during this COVID-19 pandemic.  Included in the panel is a thoracic oncologist from Milan Italy who gave special insights into the difficulties and the procedures they are using to help control the spread of infection within this high at-risk patient population and changes to current treatment strategy in light of this current virus outbreak.  Please see live notes and can follow on Twitter at #LungCancerandCOVID19.  Included below is the recording of the Zoom session.


UPDATED 3/29/2020

Leading Lung Cancer Oncologists from around the world are meeting and discussing concerns for lung cancer patients and oncologist during the novel coronavirus (SARS-COV2; COVID19) pandemic.  The town hall “COVID-19 and the Impact on Thoracic Oncology” will be held on Zoom on Saturday March 28, 2020 at 10:00 – 11:30 AM EST. sponsored by Axiom Healthcare Strategies . You can register at

Please join this virtual Town Hall

Zoom link: https://us04web.zoom.us/j/846752048

Zoom Webinar ID: 846-752-048

eSpeakers

Anne Chiang, MD, PhD, Associate Professor; Chief Network Officer and Deputy Chief Medical Officer, Smilow Cancer Network

Roy S. Herbst, MD, PhD, Ensign Professor of Medicine (Medical Oncology) and Professor of Pharmacology; Chief of Medical Oncology, Yale Cancer Center and Smilow Cancer Hospital; Associate Cancer Center Director for Translational Research, Yale Cancer Center

 Kurt Schalper, MD, PhD Assistant Professor of Pathology; Director, Translational Immuno-oncology Laboratory

Martin J. Edelman, MD, Chair, Department of Hematology/Oncology, Fox Chase Cancer Center

Corey J. Langer, MD , Professor of Medicine, University of Pennsylvania

Hossain Borghaei, DO, MS , Chief of Thoracic Medical Oncology and Director of Lung Cancer Risk Assessment, Fox Chase Cancer Center

Marina Garassino, MD, Fondazione IRCCS Instituto Nazionale del Tumori

Kristen Ashley Marrone, MD, Thoracic Medical Oncologist. Johns Hopkins Bayview Medical Center

Taofeek Owonikoko, MD, PhD, MSCR, Medical Oncologist, Emory University School of Medicine

Jeffrey D. BradleyMD, FACR, FASTRO , Emory University School of Medicine

Brendon Stiles, M.D, Weil Cornell

@pharma_BI will be Live Tweeting in Real Time this Town Hall

Please follow at the following # (hashtags)

#LungCancerandCOVID19

#Livingwithcancer

#LungCancer

#NoOneAlone

and

UPDATED 3/29/2020

Below is a collection of live Tweets from this meeting as well as some notes and comments from each of the speakers and panelists.  The recording of this Town Hall will be posted on this site when available.  The Town Hall was well attended with over 250 participants

Town Hall Notes

The following represent some notes taken at this Town Hall.

Dr. Owonkiko: 1-2% lethality in China; for patients newly diagnosed with lung cancer 1) limit contact between patient, physician and healthcare facility = telemedicine and oral chemo suggested 2) for immunotherapy if i.v. must monitor health carefully

Dr. Kurt Schalper: on COVID19 testing: Three types of tests each having pros and cons.

  •     viral culture: not always practical as you need lots of specimen
  • ELISA: looking for circulating antibodies but not always specific for type of coronavirus
  • RT-PCR: most sensitive but right now not much clarity on best primers to use; he noted that there is a 15% variance in test results using different primers to different targeted COVID19 genes

Dr. Marina Garassino: The Lombardi outbreak was 1st in Italy and took them by surprise.  She admits they were about one month behind in preparation where they did not have enough masks as late as January 31.  It was impractical to socially distance given Italian customs in greeting each other.  In addition, they had to determine which facilities would be COVID negative and COVID positive an this required access to testing.  Right now they are only testing symptomatic patients and healthcare workers have to test negative multiple times.  As concerning therapy with lung cancer patients, they have been delaying as much as possible the initiation of therapy.  Patients that are on immunotherapy and immunosuppresive drugs are being monitored by CT scan more often during this pandemic so as instances of pneumotitis began increasing they were unsure if these patients are at increased risk of infection to COVID19 or just a bias in that they are screening more often so their risk to COVID 19 is unclear.  Dr. Garissino also felt we need to move from hospital based to community based measures of prevention against COVID infection (social distancing, citizens more vigilant).  She noted that usually the cancer patients are more careful with respect to preventative measures than the general populace.  Healthcare workers have to test negative twice in three days if they had been in close contact with a COVID postitive patient.  However her hospital is still running at 80% capacity so patients are getting treated. However there are ethical issues as to who gets treated, who gets respirators, and other ethical issues related to unfortunate rationing of care.

Dr. Anne Chiang: Scheduled visits have notably decreased.  They have seen patients visits decrease from 4500 down to 2300 in two weeks but telemedicine visits or virtual visits have increased to 1000 so are replacing the on site visits.  She also said they are trying to reduce or eliminate the extremely immuno-suppressive drugs from chemotherapy regimens.  For example they are removing pemetrexemed from standard regimens and also considering neoadjuvant chemotherapy.  As far as biopsies, liquid biopsies can be obtained in the home so more preferred as patients do not have to come in for biopsy.

Dr. Edelman: Fox Chase is somewhat unique in being an NCI center which only does oncology so they rely on neighboring Jeanes Hospital of the Temple University Health System for a lot of their outpatient and surgical and general medicine needs.  Patients who will be transferred back to Fox Chase are screened for COVID19.

Brenden Stiles: Lung cancer surgeries have ground to a halt.  He did only one last week.  The hospital wants to conserve resources and considers lung cancer surgery to great a COVID risk.  They have shut down elective surgeries and there are no clinical trials being conducted.  He said that lung cancer research will be negatively impacted by the pandemic as resources are shuttled to COVID research efforts.

 Live Tweets


Other article of note on Coronavirus (COVID19) please see our Coronavirus Portal at

https://pharmaceuticalintelligence.com/coronavirus-portal/


Read Full Post »

New Mutant KRAS Inhibitors Are Showing Promise in Cancer Clinical Trials: Hope For the Once ‘Undruggable’ Target, Volume 2 (Volume Two: Latest in Genomics Methodologies for Therapeutics: Gene Editing, NGS and BioInformatics, Simulations and the Genome Ontology), Part 1: Next Generation Sequencing (NGS)

New Mutant KRAS Inhibitors Are Showing Promise in Cancer Clinical Trials: Hope For the Once ‘Undruggable’ Target

Curator: Stephen J. Williams, Ph.D.

UPDATED 10/2/2021

A Newly Identified Mutant RAS G12C  GTPase Activating Protein (GAP) may lead to discovery of new class of RAS inhibitors 

From the journal Science in Filling in the GAPs in understanding RAS: A newly identified regulator increases the efficacy of a new class of targeted anti-RAS drugs.

Source:

SCIENCE•8 Oct 2021•Vol 374Issue 6564•pp. 152-153•DOI: 10.1126/science.abl3639

    According to canonical thinking, mutationally activated RAS (constitutive activation) is insensitive to GTPase-activating proteins (GAPs).  GAPs accelerated the conversion of GTP bound to RAS to GDP, a critical step in the inactivation of RAS signaling cycle.  However a small molecule has just been FDA approved, sotorasib, in cancer cells by binding only the GDP bound KRAS G12C mutant. A few non small cell lung cancers (NSCLC) are resistant to another such inhibitor, adagrasib.  In the same Science issue, another paper by Li et. al. explains the potential that a GAP, RGS3, may play in this conundrum and demonstrates that certain other inhibitors of the RAS cycle, mainly the GEF (guanine exchange factor) SOS1, in combination with MEK inhibitors may circumvent this resistance.

Inhibitors of mutant KRAS
The KRASG12C (Gly12→Cys) mutant is refractory to canonical GAPs, p120 RASGAP and neurofibromin, but not RGS3, which promotes GTP hydrolysis. The resulting GDP-bound KRASG12C is an anticancer drug target. Combination with inhibitors of SOS1 or with inhibitors of downstream signaling may further improve efficacy.
GRAPHIC: C. BICKEL/SCIENCE
 
First a discussion of the RAS signalling cycle is shown below in a good review of RAS activation and signal termination.
 
PMCID: PMC3124093
NIHMSID: NIHMS294865
PMID: 21102635
Ras superfamily GEFs and GAPs: validated and tractable targets for cancer therapy?

Abstract

There is now considerable and increasing evidence for a causal role of aberrant activity of the Ras superfamily of small GTPases in human cancers. These GTPases act as GDP-GTP-regulated binary switches that control many fundamental cellular processes. A common mechanism of GTPase deregulation in cancer is the deregulated expression and/or activity of their regulatory proteins, guanine nucleotide exchange factors (GEFs) that promote formation of the active GTP-bound state and GTPase activating proteins (GAPs) that return the GTPase to its GDP-bound inactive state. We assess the association of GEFs and GAPs with cancer and their druggability for cancer therapeutics.

Box 1

Ras superfamily of small GTPases

The human Ras superfamily comprised of over 150 members which is divided into five major branches on the basis of sequence and functional similarities. In addition to the three Ras isoforms, other members of the Ras family with important roles in cancer include Rheb and Ral proteins. The ~20 kDa core G domain (corresponding to Ras residues 4–166) is conserved among all Ras superfamily proteins and is involved in GTP binding and hydrolysis. This domain is comprised of five conserved guanine nucleotide consensus sequence elements (Ras residue numbering) involved in binding phosphate/Mg2+ (PM) or the guanine base (G). The switch I (Ras residues 30–38) and II (59–76) regions change in conformation during GDP-GTP cycling and contribute to preferential effector binding to the GTP-bound state and the core effector domain (E; Ras residues 32–40). Ras and Rho family proteins have additional C-terminal hypervariable (HV) sequences that commonly terminate with a CAAX motif that signals for farnesyl or geranylgeranyl isoprenoid addition to the cysteine residue, proteolytic removal of the AAX residues and carboxylmethylation of the prenylated cysteine. Some are modified additionally by a palmitate fatty acid to cysteine residues in the HV sequence that contributes to membrane association. Rab proteins also contain a C-terminal HV region that terminates with cysteine-containing motifs that are modified by addition of geranylgeranyl lipids, with some undergoing carboxylmethylation. Arf family proteins are characterized by an N-terminal extension involved in membrane interaction, with some cotranslationally modified by addition of a myristate fatty acid. Ran is not lipid modified but contains a C-terminal extension that is essential for function. Rho proteins are characterized by an up to 13 amino acid “Rho insert” sequence positioned between Ras residues 122 and 123 involved in effector regulation.


An external file that holds a picture, illustration, etc.
Object name is nihms294865u1a.jpg


The GDP-GTP cycle

Ras superfamily proteins possess intrinsic guanine nucleotide exchange and GTP hydrolysis activities. However, these activities are too low to allow efficient and rapid cycling between their active GTP-bound and inactive GDP-bound states. GEFs and GAPs accelerate and regulate these intrinsic activities. Members of the different branches of the superfamily are regulated by GEFs and GAPs with structurally distinct catalytic domains. Here we have utilized the Rho family as an example to illustrate the complexity of this process, where multiple GEFs and GAPs may regulate one specific GTPase. For the 20 human Rho GTPases there are 83 GEFs and 67 GAPs and a subset of Rho GTPases are not likely regulated by GEFs and GAPs (e.g., Rnd3/RhoE). Rho GTPases are activated by distinct RhoGEF families. Dbl family RhoGEFs (68) possesses a tandem Dbl homology (DH) catalytic and pleckstrin homology (PH) regulatory domain topology. DOCK family RhoGEFs (11) are characterized by two regions of high sequence conservation that are designated Dock-homology region regulatory DHR-1 and catalytic DHR-2 domains. Two other RhoGEFs have been described (SWAP70 and SLAT) contain a PH but no DH domain (2) and smgGDS (1) is an unusual GEF in that it functions as a GEF for some Rho as well as non-Rho family GTPases. At least 24 Dbl RhoGEFs have been reported to activate RhoA. Rho (and Rab) GTPases are also controlled by a third class of regulatory proteins, Rho dissociation inhibitors (RhoGDI) (of which there are 3) whose main function involves regulation of Rho GTPase membrane association by masking the isoprenoid group.


An external file that holds a picture, illustration, etc.
Object name is nihms294865u2.jpg

So GEFs like SOS 1,2,3 are responsible for activation of the G Protien RAS upon Receptor Tyrosine Kinase (RTK) activation by a multitude of growth factors.  The GAPs are responsible for termination of the activated RAS cycle and now RAS, in its normal unmuted version, can now be activated again.  The G12C mutant keeps RAS in its activated state as GAPs cannot fascilitate the hydroylsis of GTP.  

Li et al. (in this issue) theorized that there must be cellular factors that stimulate formation of GDP-bound KRAS G12C, enabling its vulnerability to KRAS G12C inhibitors, and discovered a regulator of G protein signaling 3 (RGS3), which had GAP activity previously for heterotrimeric G proteins GαI and Gαq with unexpected GAP activity for the KRAS G12C mutant.   They also found the fully activated GTP bound KRAS G12C is dependent on RTK-mediated activation of SOS1.  This suggested that SOS1 inhibitors with MEK inhibitors could be effective against mutant KRAS.

The paper by Li is summarized below:

The G protein signaling regulator RGS3 enhances the GTPase activity of KRAS

SCIENCE•8 Oct 2021•Vol 374Issue 6564•pp. 197-201•DOI: 10.1126/science.abf1730

Abstract

Recently reported to be effective in patients with lung cancer, KRASG12C inhibitors bind to the inactive, or guanosine diphosphate (GDP)–bound, state of the oncoprotein and require guanosine triphosphate (GTP) hydrolysis for inhibition. However, KRAS mutations prevent the catalytic arginine of GTPase-activating proteins (GAPs) from enhancing an otherwise slow hydrolysis rate. If KRAS mutants are indeed insensitive to GAPs, it is unclear how KRASG12C hydrolyzes sufficient GTP to allow inactive state–selective inhibition. Here, we show that RGS3, a GAP previously known for regulating G protein–coupled receptors, can also enhance the GTPase activity of mutant and wild-type KRAS proteins. Our study reveals an unexpected mechanism that inactivates KRAS and explains the vulnerability to emerging clinically effective therapeutics.

UPDATED 09/26/2021

The KRAS G12C Inhibitor MRTX849 Provides Insight toward Therapeutic Susceptibility of KRAS-Mutant Cancers in Mouse Models and Patients

Source: Hallin J, Engstrom LD, Hargis L, Calinisan A, Aranda R, Briere DM, Sudhakar N, Bowcut V, Baer BR, Ballard JA, Burkard MR, Fell JB, Fischer JP, Vigers GP, Xue Y, Gatto S, Fernandez-Banet J, Pavlicek A, Velastagui K, Chao RC, Barton J, Pierobon M, Baldelli E, Patricoin EF 3rd, Cassidy DP, Marx MA, Rybkin II, Johnson ML, Ou SI, Lito P, Papadopoulos KP, Jänne PA, Olson P, Christensen JG. The KRASG12C Inhibitor MRTX849 Provides Insight toward Therapeutic Susceptibility of KRAS-Mutant Cancers in Mouse Models and Patients. Cancer Discov. 2020 Jan;10(1):54-71. doi: 10.1158/2159-8290.CD-19-1167. Epub 2019 Oct 28. PMID: 31658955; PMCID: PMC6954325.

Abstract

Despite decades of research, efforts to directly target KRAS have been challenging. MRTX849 was identified as a potent, selective, and covalent KRASG12C inhibitor that exhibits favorable drug-like properties, selectively modifies mutant cysteine 12 in GDP-bound KRASG12C, and inhibits KRAS-dependent signaling. MRTX849 demonstrated pronounced tumor regression in 17 of 26 (65%) KRASG12C-positive cell line- and patient-derived xenograft models from multiple tumor types, and objective responses have been observed in patients with KRASG12C-positive lung and colon adenocarcinomas. Comprehensive pharmacodynamic and pharmacogenomic profiling in sensitive and partially resistant nonclinical models identified mechanisms implicated in limiting antitumor activity including KRAS nucleotide cycling and pathways that induce feedback reactivation and/or bypass KRAS dependence. These factors included activation of receptor tyrosine kinases (RTK), bypass of KRAS dependence, and genetic dysregulation of cell cycle. Combinations of MRTX849 with agents that target RTKs, mTOR, or cell cycle demonstrated enhanced response and marked tumor regression in several tumor models, including MRTX849-refractory models. SIGNIFICANCE: The discovery of MRTX849 provides a long-awaited opportunity to selectively target KRASG12C in patients. The in-depth characterization of MRTX849 activity, elucidation of response and resistance mechanisms, and identification of effective combinations provide new insight toward KRAS dependence and the rational development of this class of agents.

Introduction

KRAS is one of the most frequently mutated oncogenes in cancer; however, efforts to directly target KRAS have been largely unsuccessful due to its high affinity for GTP/GDP and the lack of a clear binding pocket (1–4). More recently, compounds were identified that covalently bind to KRASG12C at the cysteine 12 residue, lock the protein in its inactive GDP-bound conformation, inhibit KRAS-dependent signaling, and elicit antitumor responses in tumor models (5–7). Advances on early findings demonstrated that the binding pocket under the switch II region was exploitable for drug discovery, culminating in the identification of more potent KRASG12C inhibitors with improved physiochemical properties that are now entering clinical trials. The identification of KRASG12C inhibitors provides a renewed opportunity to develop a more comprehensive understanding of the role of KRAS as a driver oncogene and to explore the clinical utility of direct KRAS inhibition.

KRASG12C mutations are present in lung and colon adenocarcinomas as well as smaller fractions of other cancers. The genetic context of KRASG12C alteration can vary significantly among tumors and is predicted to affect response to KRAS inhibition. KRAS mutations are often enriched in tumors due to amplification of mutant or loss of wild-type allele (8, 9). In addition, KRAS mutations often co-occur with other key genetic alterations including TP53 and CDKN2A in multiple cancers, KEAP1 and/or STK11 in lung adenocarcinoma, or APC and PIK3CA in colon cancer (3, 8–12). Whether differences in KRAS-mutant allele fraction or co-occurrence with other mutations influence response to KRAS blockade is not yet well understood. In addition, due to the critical importance of the RAS pathway in normal cellular function, there is extensive pathway isoform redundancy and a comprehensive regulatory network in normal cells to ensure tight control of temporal pathway signaling. RAS pathway negative feedback signaling is mediated by ERK1/2 and receptor tyrosine kinases (RTK) as well as by ERK pathway target genes including dual-specificity phosphatases (DUSP) and Sprouty (SPRY) proteins (13–17). One important clinically relevant example is provided by the reactivation of ERK signaling observed following treatment of BRAFV600E-mutant cancers with selective BRAF inhibitors (18–20). The observed intertumoral heterogeneity and extensive feedback signaling network in KRAS-mutant cancers may necessitate strategies to more comprehensively block oncogenic signal transduction and deepen the antitumor response in concert with KRAS blockade (15, 21, 22).

Potential strategies to augment the response to KRASG12C inhibitor treatment are evident at multiple nodes of the signaling pathway regulatory machinery. RAS proteins are small GTPases that normally cycle between an active, GTP-bound state and an inactive, GDP-bound state. RAS proteins are loaded with GTP through guanine nucleotide exchange factors (e.g., SOS1) which are activated by upstream RTKs, triggering subsequent interaction with effector proteins that activate RAS-dependent signaling. RAS proteins hydrolyze GTP to GDP through their intrinsic GTPase activity, which is dramatically enhanced by GTPase-activating proteins (GAP). Mutations at codons 12 and 13 in RAS proteins impair GAP-stimulated GTP hydrolysis, leaving RAS predominantly in the GTP-bound, active state.

Potent covalent KRASG12C inhibitors described to date bind only GDP-bound KRAS (5–7). Although codon 12 and 13 mutations decrease the fraction of GDP-bound KRAS, recent biochemical analyses revealed that KRASG12C exhibits the highest intrinsic GTP hydrolysis rate and highest nucleotide exchange rate among KRAS mutants (23). Furthermore, the nucleotide-bound state of KRASG12C can be shifted toward the GDP-bound state by pharmacologically modulating upstream signaling with RTK inhibitors that increase the activity of KRASG12C inhibitors (7, 22, 24). Likewise, SHP2 is a phosphatase that positively transduces RTK signaling to KRAS. Accordingly, SHP2 inhibitors are active in cancers driven by KRAS mutations that are dependent on nucleotide cycling, including KRASG12C (25–27).

MRTX849 is among the first KRASG12C inhibitors to advance to clinical trials. The comprehensive and durable inhibition of KRASG12C by MRTX849 provides a unique opportunity to understand the extent to which KRAS functions as an oncogenic driver. In addition, the observation that the response to blockade of KRAS is markedly different in vitro and in vivo indicates that evaluation of the consequences of KRAS blockade in in vivo model systems is critical to understand the role of KRAS-driven tumor progression. The demonstration of partial responses in patients with lung and colon adenocarcinomas treated with MRTX849 in clinical trials indicates that results observed in tumor models extend to KRASG12C-positive human cancers. Our comprehensive molecular characterization of multiple tumor models at baseline and during response to KRAS inhibition has provided further insight toward the contextual role of KRAS mutation in the setting of genetic and tumoral heterogeneity. Finally, further interrogation of these genetic alterations and signaling pathways utilizing functional genomics strategies including CRISPR and combination approaches uncovered regulatory nodes that sensitize tumors to KRAS inhibition when cotargeted.

Results

MRTX849 Is a Potent and Selective Inhibitor of KRASG12C, KRAS-Dependent Signal Transduction, and Cell Viability In Vitro

A structure-based drug design approach, including optimization for favorable drug-like properties, led to the discovery of MRTX849 as a potent, covalent KRASG12C inhibitor (Fig. 1A; Supplementary Table S1). An LC/MS-based KRASG12C protein modification assay revealed that MRTX849 demonstrated much greater modification of KRASG12C when preloaded with GDP compared with GTP (Supplementary Table S2), supporting that MRTX849 binds to and stabilizes the inactive GDP-bound form of KRASG12C. Indeed, introducing a comutation that impairs the GTPase activity of KRASG12C (24) attenuated the inhibitory activity of MRTX1257, a close analogue of MRTX849 (Supplementary Fig. S1A). Secondary mutations that modulate the nucleotide exchange function of KRASG12C also affected inhibition by MRTX1257, supporting that the MRTX compound series is dependent on KRASG12C nucleotide cycling.

Figure 1.


MRTX849 is a potent, covalent KRASG12C inhibitor in vitroA, Structure of MRTX849. B, Immunoblot protein Western blot analyses of KRAS pathway targets in MIA PaCa-2 cells treated from 1 hours to 72 hours with MRTX849 at 100 nmol/L. C, Immunoblot protein Western blot analyses of KRAS pathway targets in MIA PaCa-2 cells treated for 24 hours with MRTX849 over a 13-point dose response. D, Left y-axis shows active RAS ELISA assay to determine the reduction in RAS-GTP abundance following MRTX849 treatment in MIA PaCa-2 cells for 24 hours. The vehicle value was normalized to 1 by dividing all average values by the vehicle value. Right y-axis shows quantitation of KRAS band shift by MRTX849 treatment in MIA PaCa-2 cells for 24 hours as assessed by Western blot and densitometry. E, In-cell Western blot assay to evaluate modulation of pERK in MIA PaCa-2 cells grown in standard tissue-culture conditions treated with MRTX849 over a time course. F, CellTiter-Glo assay to evaluate cell viability performed on seven KRASG12C-mutant cell lines and three non–KRASG12C-mutant cell lines grown in 2-D tissue-culture conditions in a 3-day assay (left plot) or 3-D conditions using 96-well, ULA plates in a 12-day assay (right plot).


We next determined the cellular activity of MRTX849 utilizing the KRASG12C-mutant H358 lung and MIA PaCa-2 pancreatic cancer cell lines. In both models, MRTX849 demonstrated an upward electrophoretic mobility shift of KRASG12C protein band migration by immunoblot, indicative of covalent modification of KRASG12C. A maximal mobility shift was observed by 1 hour, was maintained through 72 hours (Fig 1B; Supplementary Fig. S1B), and was evident at concentrations as low as 2 nmol/L with near-maximal modification observed at 15.6 nmol/L (Fig. 1C; Supplementary Fig. S1C). Comparable inhibition of active RAS was observed as determined by a RAF RAS-binding domain capture ELISA assay (Fig. 1D; 1D). MRTX849 also inhibited KRAS-dependent signaling targets including ERK1/2 phosphorylation (pERK; Thr202/Tyr204 ERK1), S6 phosphorylation (pS6; RSK-dependent Ser235/236), and expression of the ERK-regulated DUSP6, each with IC50 values in the single-digit nanomolar range in both cell lines (Fig. 1B and C; Supplementary Fig. S1B and S1C). The evaluation of pERK over a time course of 48 hours indicated maximal inhibition was observed at 24 hours (Fig. 1E; Supplementary Fig. S1E). Treatment with the des-acrylamide version of MRTX849, which is unable to covalently bind to KRASG12C, did not demonstrate significant inhibition of ERK phosphorylation (Supplementary Fig. S1F). The H358 cell line was selected for determination of MRTX849 cysteine selectivity utilizing an LC/MS-based proteomics approach able to detect approximately 6,000 cysteine-containing peptides. After treatment for 3 hours, decreased KRASG12C Cys12-free peptide was detected with treated-to-control ratios of 0.029 and 0.008 determined at 1 and 10 μmol/L, respectively, indicating near-complete engagement of the intended target (Supplementary Table S3). In contrast, the only other peptides identified were from lysine-tRNA ligase (KARS) at Cys209 near the detection limit, indicating a high degree of selectivity toward KRASCYS12.

To evaluate the breadth of MRTX849 activity, its effect on cell viability was determined across a panel of 17 KRASG12C-mutant and 3 non–KRASG12C-mutant cancer cell lines using 2-D (3-day, adherent cells) and 3-D (12-day, spheroids) cell-growth conditions. MRTX849 potently inhibited cell growth in the vast majority of KRASG12C-mutant cell lines with IC50 values ranging between 10 and 973 nmol/L in the 2-D format and between 0.2 and 1,042 nmol/L in the 3-D format (Supplementary Table S4; Fig. 1F). In agreement with prior KRASG12C inhibitor studies (5), MRTX849 demonstrated improved potency in the 3-D assay format, as all but one KRASG12C-mutant cell line exhibited an IC50 value below 100 nmol/L. Although MRTX849 was broadly effective in inhibiting viability of KRASG12C-mutant cell lines, IC50 values varied across the cell panel by 100-fold, suggesting a differential degree of sensitivity to treatment. All three non–KRASG12C-mutant cell lines tested demonstrated IC50 values greater than 1 μmol/L in 2-D conditions and greater than 3 μmol/L in 3-D conditions, suggesting the effect of MRTX849 on cell viability was dependent on the presence of KRASG12C.

To determine whether the difference in sensitivity across the cell panel correlated with the ability of MRTX849 to bind to KRAS or inhibit KRAS-dependent signal transduction, seven KRASG12C-mutant cancer cell lines were selected from the panel for further evaluation. In each cell line, MRTX849 demonstrated a very similar concentration-dependent electrophoretic mobility shift (IC50) for KRASG12C protein migration, suggesting that the ability to bind to and modify KRASG12C does not readily account for differences in response in viability studies (Fig. 1B and C; Supplementary Figs. S1B and S1C and S2A and S2B). The effect of MRTX849 on selected phosphoproteins implicated in mediating KRAS-dependent signaling was also evaluated across the cell panel by immunoblot and/or reverse-phase protein array (RPPA) following treatment for 6 or 24 hours. Notably, the concentration–response relationship and maximal effect of MRTX849 on inhibition of ERK and S6S235/236 phosphorylation varied across the cell panel (Supplementary Fig. S2A and S2C; Supplementary Table S7). MRTX849 demonstrated only partial inhibition of pERK in KYSE-410 and SW1573 cells and a minimal effect on pS6S235/236 in SW1573, H2030, and KYSE-410 cells (Supplementary Fig. S2A and S2C). Each of these cell lines were among those that exhibited a submaximal response to MRTX849 in both 2-D and 3-D viability assays (Fig. 1F). Although KRAS is implicated in mediating signal transduction through the PI3K and mTOR pathways, there was minimal evidence of a significant and/or durable effect of MRTX849 on AKT (S473, T308) or 4E-BP1 (T37/T46, S65, T70) phosphorylation at any time point in any cell lines evaluated (Supplementary Fig. S2D). However, MRTX849 demonstrated concentration-dependent partial inhibition of the mTOR-dependent signaling targets p70 S6 kinase (T412) and/or pS6 (S240/44) in the H358, MIA PaCa-2,H2122, and H1373 cell lines, each of which exhibited a maximal response to treatment. Together, these data suggest that maximizing inhibition of KRAS-dependent ERK and S6 signaling may be required to elicit a robust response in tumor-cell viability assays.

MRTX849 Treatment In Vivo Leads to Dose-Dependent KRASG12C Modification, KRAS Pathway Inhibition, and Antitumor Efficacy

Studies were conducted to evaluate MRTX849 antitumor activity along with its pharmacokinetic and pharmacodynamic properties in vivo, both to understand the clinical utility of this agent and to provide insight toward response to treatment. MRTX849 demonstrated moderate plasma clearance and prolonged half-life following oral administration (Supplementary Table S1; Supplementary Fig. S3). To evaluate the pharmacodynamic response to MRTX849 and to correlate drug exposure with target inhibition, MRTX849 was administered via oral gavage over a range of dose levels to H358 xenograft–bearing mice, and plasma and tumors were collected at defined time points. The fraction of covalently modified KRASG12C protein was proportional to the plasma concentration of MRTX849 (Fig. 2A). When evaluated over time after a single oral dose at 30 mg/kg, the modified fraction of KRASG12C was 74% at 6 hours after dose and gradually decreased to 47% by 72 hours (Fig. 2B). This extended pharmacodynamic effect, despite declining levels of MRTX849 in plasma, was consistent with the irreversible inhibition of KRASG12C by MRTX849 and the relatively long half-life for the KRASG12C protein (∼24–48 hours; Supplementary Table S5). The modification of KRASG12C was maximized after repeated daily dosing for 3 days at 30 mg/kg (Fig. 2B), and higher dose levels did not demonstrate additional KRASG12C modification in multiple tumor models (data not shown). The maximum level of modification of approximately 80%, despite increasing dose and plasma levels of MRTX849, suggests that accurate measurement of complete inhibition of KRASG12C utilizing LC/MS may not be attainable, potentially due to a pool of active, noncycling, or unfolded KRASG12C protein in tumors. Together, these studies demonstrated a dose-dependent increase in covalent modification of KRASG12C by MRTX849 and that the majority of targetable KRAS was covalently modified by MRTX849 over a repeated administration schedule at dose levels at or exceeding 30 mg/kg.

Figure 2.


MRTX849 modifies KRASG12C and inhibits KRAS signaling and tumor growth in vivoA, MRTX849 was administered orally as a single dose to mice bearing established H358 xenografts (average tumor volume ∼350 mm3) at 10, 30, and 100 mg/kg. KRAS modification and MRTX849 plasma concentration data from n = 3 mice are shown as mean ± SD. KRASG12C modification was statistically significant versus vehicle control using the two-tailed Student t test. **, P < 0.01. B, MRTX849 was administered orally as a single dose or daily (QD) for 3 days to mice bearing established H358 xenografts (average tumor volume ∼350 mm3) at 30 mg/kg. Plasma was collected at 0.5, 2, 6, 24, 48, and 72 hours after administration of the last dose, and tumors were collected at 6, 24, 48, and 72 hours after dose. KRASG12C modification and MRTX849 plasma concentration data are shown from n = 3 mice as mean ± SD. Induction of modified KRASG12C protein at all time points was determined to be statistically significant versus vehicle control using two-way ANOVA. In addition, induction of modified KRASG12C protein at 72 hours in day 1 samples and 48 and 72 hours in day 3 samples was statistically significant versus the 6-hour time point. Brackets indicate P < 0.05 as compared with left-most sample. C, MRTX849 was administered as in A. Tumors were collected 6 hours after dose, and total and phosphorylated ERK1/2 and total and phosphorylated S6 were analyzed by immunoblot and quantified by densitometric analysis. Relative fluorescence intensity of pERK1/2 and pS6 was normalized by dividing pERK1/2 and pS6 by total ERK1/2 and total S6, respectively. Vehicle-treated tumors were normalized to 1 by dividing all average values by the vehicle value. Average pERK1/2 and pS6 values were divided by the average value in vehicle-treated tumors. Data shown represent the average of 2 to 3 tumors per treatment group plus SD. Reduction of pS6 relative fluorescence intensity was determined to be statistically significant versus vehicle control using the two-tailed Student t test. Brackets indicate P < 0.05 compared with left-most sample. D, MRTX849 was administered as in B. Tumors were collected at 6, 24, 48, or 72 hours after administration of the last dose, and total and phosphorylated ERK1/2 and total and phosphorylated S6 were analyzed as in C. Data shown represent the average of 3 to 4 tumors per treatment group plus SD. Reduction of pS6 relative fluorescence intensity on day 3 was determined to be statistically significant versus vehicle control using two-way ANOVA. Brackets indicate P < 0.05 compared with left-most sample. E, MRTX849 was administered via daily oral gavage at the doses indicated to mice bearing established MIA PaCa-2 xenografts. Dosing was initiated when tumors were approximately 350 to 400 mm3.MRTX849 was administered to mice daily until day 16. Data are shown as mean tumor volume ± SEM. Tumor volumes at day 16 were determined to be statistically significant versus vehicle control via two-tailed Student t test. **, P < 0.01; *, P < 0.05.


To evaluate the effect of MRTX849 on KRAS-dependent signal transduction in vivo, a single dose of MRTX849 at 10, 30, or 100 mg/kg was administered to H358 tumor–bearing mice. Dose-dependent inhibition of ERK1/2 and pS6S235/36 phosphorylation was observed at 6 hours after dose based on immunoblot and densitometric analysis (Fig. 2C). MRTX849 also demonstrated marked inhibition of ERK1/2 and S6S235/36 phosphorylation after one or three daily doses at 6 or 24 hours, and levels gradually recovered by 72 hours after the final dose (Fig. 2D). pERK1/2 and pS6S235/36 were further evaluated in formalin-fixed, paraffin-embedded sections from vehicle-treated and MRTX849-treated xenografts in four tumor models utilizing IHC methods coupled with image analysis algorithms. These studies demonstrated increased pERK1/2 and pS6 in nontumor/stromal cells following MRTX849 administration, indicating that immunoblotting studies with bulk tumor lysate likely underrepresent the degree of pathway inhibition in tumor cells, whereas IHC-based evaluation may more accurately reflect both the degree and spatial impact of pathway inhibition. Maximal inhibition was observed for both ERK and S6S235/36 phosphorylation after a single dose at the 6-hour time point, with a rebound in signaling evident 24 hours after single dose in each model (Supplementary Fig. S4). Marked inhibition of ERK phosphorylation was observed at 6 hours after administration, with 89%, 94%, and 94% inhibition observed compared with vehicle controls in MIA PaCa-2, H1373, and H2122 tumors, respectively (H358 pERK not quantifiable). This indicates that dose levels at or exceeding 30 mg/kg dose maximized inhibition of ERK phosphorylation in multiple models (Supplementary Fig. S4A and S4B). Inhibition of S6 phosphorylation at 6 hours was more variable, with percent inhibition values of 76%, 50%, 86%, and 56% observed in MIA PaCa-2, H1373, H358, and H2122 tumors, respectively (Supplementary Fig. S4B). Together, these data indicate that consistent acute (6 hours) inhibition of KRAS-dependent ERK phosphorylation was maximized in all evaluated models, whereas inhibition of S6S235/36 was more variable, presumably due to varying degrees of KRAS-independent activation of this pathway in different tumor models.

MIA PaCa-2 and H358 were selected as MRTX849-responsive tumor models, thereby enabling a high-resolution understanding of dose–response relationships. Significant, dose-dependent, antitumor activity was observed at the 3, 10, 30, and 100 mg/kg dose levels in the MIA PaCa-2 model (Fig. 2E). Evidence of rapid tumor regression was observed at the earliest post-treatment tumor measurement, and animals in the 30 and 100 mg/kg cohorts exhibited evidence of a complete response at study day 15. Dosing was stopped at study day 16, and all 4 mice in the 100 mg/kg cohort and 2 of 7 mice in the 30 mg/kg cohort remained tumor-free through study day 70 (Supplementary Fig. S5A). In a second MIA PaCa-2 study, dose-dependent antitumor efficacy was observed at the 5, 10, and 20 mg/kg dose levels, and 2 of 5 mice at the 20 mg/kg dose level exhibited complete tumor regression (Supplementary Fig. S5B). Significant dose-dependent antitumor efficacy was also observed in the H358 model, including 61% and 79% tumor regression at the 30 and 100 mg/kg dose levels, respectively, at day 22 (Supplementary Fig. S5C). MRTX849 was well tolerated, and no effect on body weight was observed at all dose levels evaluated (Supplementary Fig. S5D). These studies indicated that MRTX849 demonstrated dose-dependent antitumor efficacy over a well-tolerated dose range and that the maximally efficacious dose of MRTX849 is between 30 and 100 mg/kg/day.

MRTX849 Demonstrates Broad-Spectrum Tumor Regression in KRASG12C Cell Line and Patient-Derived Xenograft Models

To evaluate the breadth of antitumor activity across genetically and histologically heterogeneous KRASG12C-mutant cancer models, MRTX849 was evaluated at a fixed dose of 100 mg/kg/day (a dose projected to demonstrate near-maximal target inhibition in most models) in a panel of human KRASG12C-mutant cell line–derived xenograft (CDX) and patient-derived xenograft (PDX) models. MRTX849 demonstrated tumor regression exceeding 30% volume reduction from baseline in 17 of 26 models (65%) at approximately 3 weeks of treatment (Fig. 3A; Supplementary Table S6). By comparison, MRTX849 did not exhibit significant antitumor activity at 100 mg/kg in three non–KRASG12C-mutant models (Fig. 3A; Supplementary Table S6). Together, these results indicate that KRASG12C-mutant tumors are broadly dependent upon mutant KRAS for tumor-cell growth and survival and that MRTX849 elicits antitumor activity through a KRASG12C-dependent mechanism.

Figure 3.


Antitumor activity of MRTX849 in KRASG12C-mutant and non–KRASG12C-mutant human tumor xenograft models. A, MRTX849 was administered via oral gavage at 100 mg/kg every day to mice bearing the CDX or PDX model indicated. Dosing was initiated when tumors were, on average, approximately 250 to 400 mm3. MRTX849 was formulated as a free base and resuspended as a solution in 10% Captisol and 50 mmol/L citrate buffer, pH 5.0. The percent change from baseline control was calculated at days 19 to 22 for most models. Statistical significance was determined for each model and is shown in Supplementary Table S6. Status of mutations and alterations in key genes is shown below each model. MAF (%), percent KRASG12C-mutant allele fraction by RNA-seq; CNV, copy-number variation; * denotes very high CDK4 expression by RNA-seq and possible amplification. HER family status was determined by averaging EGFRERBB2, and ERBB3 RNA-seq expression for CDX (CCLE) or PDX (Crown huBase) models. Positive HER family calls denote greater than the median expression of the models tested. CDX and PDX model HER family calls were determined independently. B, Tumor-growth inhibition plots from representative xenograft models that were categorized as sensitive, partially sensitive, or treatment refractory.


Although MRTX849 exhibited marked antitumor responses in the majority of models tested, a response pattern ranging from delayed tumor growth to complete regression was observed across the xenograft panel. The response to treatment was categorized as sensitive, partially sensitive, or treatment refractory (Fig. 3B). Rank order and Pearson statistical analyses were performed to evaluate the correlation between in vitro potency (IC50 in 2-D or 3-D viability assays) and antitumor response in vivo (% regression or progression on day 22), and a significant correlation between response in cell lines compared with tumor models was not observed (Supplementary Fig. S6A and S6B). Thus, we focused on a comprehensive analysis of correlates with MRTX849 tumor response in vivo, including tumor histology, co-occurring genetic alterations, as well as baseline or drug-induced changes in expression of KRAS-related genes [RNA sequencing (RNA-seq)] and/or protein signaling networks (RPPA in 18 models, ref. 28; Supplementary Fig. S7). No individual genetic alteration, including but not limited to KRAS-mutant allele frequency, TP53, STK11, or CDKN2A, predicted the antitumor activity of MRTX849. Interestingly, baseline gene and/or protein expression of selected members of the HER family of RTKs and of regulators of early cell-cycle transition did exhibit a trend with the degree of antitumor response, suggesting these pathways may influence the response to KRAS inhibitors (Supplementary Fig. S7A). Together, these data indicate that there are no individual binary biomarkers that clearly predict therapeutic response and that the molecular complexity and heterogeneity present in distinct KRAS-mutated tumors may contribute to the response to target blockade.

MRTX849 Antitumor Activity Translates to RECIST Responses in Patients with Cancer

A 45-year-old female former smoker diagnosed with stage IV lung adenocarcinoma and refractory to multiple lines of therapy including carboplatin/pemetrexed/pembrolizumab, docetaxel, and investigational treatment with binimetinib and palbociclib was enrolled onto the MRTX849-001 phase Ib clinical trial with two bilateral lung lesions and mediastinal lymph node as target lesions. Targeted next-generation sequencing (NGS) demonstrated a KRASG12C mutation (c.34G>T). In addition, loss-of-function KEAP1 (K97M) and STK11 (E223*) mutations were detected and are predicted to be deleterious to their respective proteins. The patient was administered MRTX849 (600 mg twice a day) and had marked clinical improvement within 2 weeks, including complete resolution of baseline cough and oxygen dependency. A RECIST-defined partial response of 33% reduction of target lesions was observed at cycle 3 day 1 (45 days), and the patient continues on study (Fig. 4A).

Figure 4.


Activity of MRTX849 in patients with lung and colon cancers. A, Pretreatment and 6-week scans of a heavily pretreated patient with a KRASG12C mutation–positive lung adenocarcinoma indicating 33% reduction of target lesions. Patient continues on study. The top plots show a coronal view, and bottom plots an axial view of CT chest images prior to MRTX849 treatment (left) and after two cycles of MRTX849 treatment (right). B, Baseline, 6-week (Cycle 2), and 12-week (Cycle 4) scans of a patient with a KRASG12C mutation–positive colon adenocarcinoma. Partial response (PR) was confirmed at Cycle 4, and patient continues on study. Four lesions (TL1–4) are shown with axial views of CT images prior to MRTX849 treatment (top), after two cycles of MRTX849 treatment (center), and after four cycles of MRTX849 treatment (bottom).


A 47-year-old female never-smoker with metastatic adenocarcinoma of the left colon who exhibited progressive disease after receiving multiple lines of systemic therapy, including FOLFOX plus bevacizumab, single-agent capecitabine, FOLFIRI plus bevacizumab, and an investigational antibody–drug conjugate, was enrolled into the MRTX849-001 phase Ib clinical trial. This patient had extensive metastases involving the liver, peritoneum, ovaries, and lymph nodes. Targeted NGS identified a KRASG12C mutation. The patient was administered MRTX849 (600 mg twice a day) and demonstrated marked clinical improvement within 3 weeks and a visible decrease in size of her umbilical Sister Mary Joseph nodule. Her carcinoembryonic antigen levels decreased from 77 ng/mLat baseline to 11 ng/mL at cycle 2 day 1 and 3 ng/mL by cycle 3 day 1 (normal range, 0–5 ng/mL). A RECIST-defined partial response with a 37% reduction of target lesions and complete response of a nontarget lesion was observed at cycle 3 day 1(day 42). Confirmatory CT scans were conducted at cycle 5, day 1 (day 84) and indicated a confirmed RECIST partial response with further reduction of target lesions at −47% from baseline (Fig. 4B). The patient remains on treatment through Cycle 6.

Temporal Effects of MRTX849 on KRAS-Dependent Signaling and Feedback Pathways and Relationship to Antitumor Activity Following Repeat Dosing in Xenograft Models

A comprehensive analysis was conducted to evaluate MRTX849-induced temporal molecular changes to further interrogate mechanisms of drug response across sensitive and partially sensitive models. To evaluate temporal changes in global gene expression, xenograft-bearing mice were administered vehicle or 100 mg/kg MRTX849, and RNA-seq was performed on tumors at 6 and 24 hours after treatment. Gene expression was evaluated at day 1 and day 5 for the sensitive models MIA PaCa-2 and H1373 to ensure sufficient tissue availability from regressing tumors, or at day 7 in the partially sensitive models H358, H2122, and H2030 to coordinate with tumor stasis plateau. The top differentially expressed gene set enrichment analysis (GSEA) hallmark gene sets, regardless of tumor response, in all five models were several KRAS-annotated gene sets confirming MRTX849 selectively inhibits multiple genes directly related to KRAS signaling. MYC, mTOR, cell cycle, and apoptosis/BCL2 pathway gene sets were also strongly differentially expressed, confirming MRTX849 broadly affected multiple well-established, KRAS-regulated pathways, several of which have proved difficult to directly inhibit with previous targeted therapies (Fig. 5A and B; Supplementary Fig. S8A—S8D). The marked impact of MRTX849 on a large number of genes that regulate cell cycle and apoptosis provides further insight into molecular mechanisms which mediate its antitumor activity.

Figure 5.


MRTX849 treatment in vivo regulates KRAS-dependent oncogenic signaling and feedback-inhibitory pathways. A, Volcano plots displaying differentially expressed genes in xenograft tumors 24 hours after oral administration of vehicle or 100 mg/kg MRTX849 in a representative MRTX849-sensitive (H1373) and MRTX849-partially sensitive (H358) model. Significance denoted in the legend (Padj < 0.01). B, GSEA heat maps depicting hallmark signature pathways differentially regulated in at least one model 24 hours following oral administration of a single 100 mg/kg MRTX849 dose compared with vehicle. Normalized enrichment score shown in all models 6 or 24 hours after a single dose (QD × 1) or 5 (QD × 5) or 7 (QD × 7) days dosing. C, Genes that feedback-inhibit MAP kinase signaling are downregulated following MRTX849 treatment in all five cell line xenografts assessed by RNA-seq. TPM, Transcripts Per Kilobase Million.


Targeted RNA-seq analysis was performed on genes implicated in the temporal regulation of external signaling inputs and feedback pathways which collectively temper signaling flux through the RAS–RAF–MEK–ERK MAP kinase (MAPK) pathway including DUSPSPRY, and PHLDA family genes (13, 18). These MAPK pathway–negative regulators were each ranked among the most strongly decreased genes following MRTX849 treatment, providing evidence that ERK-dependent transcriptional output is blocked and that pathways involved in reactivation of RTK- and ERK-dependent signaling were activated (Fig. 5C; Supplementary Fig. S4A).

On the basis of the observation of dynamic changes in transcriptional programs linked to KRAS pathway reactivation, IHC plus quantitative imaging of tumor cell–specific pERK and pS6 was evaluated over a range of time points. In the sensitive MIA PaCa-2 and H1373 tumor models, treatment with MRTX849 (100 mg/kg) demonstrated ≥90% inhibition of ERK phosphorylation at 6 and 24 hours on both days 1 and 5 (Supplementary Fig. S4). In contrast, in the partially sensitive H358 and H2122 models, robust inhibition of ERK phosphorylation was observed at 6 hours after a single dose; however, marked recovery of ERK phosphorylation was observed at 24 hours after single dose and at both 6 and 24 hours following 7 days of repeat-dose administration. Because DUSPSPRY, and ETV family transcripts remain downregulated through 5 to 7 days in all models, it is evident that other independent factors contribute to temporal reactivation of ERK (Fig. 5C). Similar to what was observed with single-dose administration, the effect of MRTX849 on pS6 was variable over time and did not track with the antitumor activity of MRTX849. Together, these results suggest that the extent and duration of inhibition of pERK may track with the magnitude of antitumor efficacy of KRASG12C inhibitors and that further evaluation of the role of S6 is required to understand if it plays a role in drug sensitivity.

The effect of MRTX849 on cell proliferation and apoptosis was characterized by IHC analysis of Ki-67 or cleaved caspase-3 after a single dose or repeat administration. The fraction of Ki-67–positive cells was significantly reduced in tumors after repeat administration in all four models tested, further supporting a broadly operative antiproliferative mechanism, independent of the magnitude of MRTX849 antitumor response (Supplementary Fig. S4). Induction of apoptosis as determined by cleaved caspase-3 immunostaining was also evident on day 1 of treatment (6 and/or 24 hours after treatment) in the sensitive H358, MIA PaCa-2, and H1373 models (79%–100% maximal regression) but not in the partially sensitive H2122 model (Supplementary Fig. S4). An expanded RPPA-based pathway analysis of several models also indicated a correlation between antitumor activity of MRTX849 and decreased survivin (statistically significant at days 5/7 in 7 models evaluated; Supplementary Fig. S7B) and a trend toward increased cleaved caspase-3 induction (day 1, P = 0.08, 16 models), supporting the induction of apoptosis as a key mediator of a cytoreductive antitumor response (Supplementary Fig. S7C). Interestingly, the magnitude of reduction of MYC and cyclin B1 protein levels at days 5/7 also closely correlated with MRTX849 antitumor activity, consistent with their roles as critical regulators of KRAS-mediated cell growth and survival pathways (Supplementary Fig. S7B). Collectively, these data support that durable inhibition of ERK activity and maximal inhibition of ERK-regulated outputs including MYC and E2F-mediated transcription are associated with induction of apoptosis and maximal response to MRTX849 treatment.

CRISPR/Cas9 Screen Identifies Vulnerabilities and Modifiers of Response to MRTX849 in KRASG12C-Mutant Cancer Cell Lines In Vitro and In Vivo

The correlative analysis of genomic or proteomic markers with response to MRTX849 in the defined panel of models provided only limited insight toward mechanism of therapeutic response or resistance. Therefore, we directly interrogated the role of selected genes in mediating therapeutic response utilizing a focused CRISPR/Cas9 knockout screen targeting approximately 400 genes including many genes involved in KRAS signaling. This was conducted in H358 and H2122 cells in vitro and in H2122 xenografts in vivo in the presence and absence of MRTX849 treatment (Supplementary Fig. S9A–S9F). In MRTX849-anchored screens in vitro, single guide RNAs (sgRNA) that target RAS signaling pathway genes including MYC, SHP2 (H2122), mTOR pathway (MTOR and RPS6), and cell-cycle genes (CDK1, CDK2, CDK4/6, and RB1) were identified to affect cell fitness. sgRNAs that target KEAP1 and CBL were enriched in the H2122 model, demonstrating cell-specific genetic routes toward improved fitness through loss of classic tumor-suppressor genes, including in the context of MRTX849 treatment. KRAS sgRNA dropout was less pronounced in the MRTX849-treated cells compared with DMSO control–treated cells, as would be expected with redundant depletion of the drug target (Supplementary Fig. S9C and S9D). To evaluate whether a distinct KRAS dependence or modulation of MRTX849 therapeutic response was observed in vitro versus in vivo, xenograft-bearing mice bearing H2122 cells (∼250 mm3) transduced with the sgRNA library were orally administered vehicle or MRTX849 for 2 weeks (Supplementary Fig. S9A, S9E, and S9F). In MRTX849-treated xenografts, sgRNAs targeting cell cycle, SHP2, MYC, and mTOR pathway genes remained among the top depleted sgRNAs, demonstrating that inhibition of these targets in vivo, in the context of KRAS inhibition, leads to further tumor-growth inhibition over and above the effects of KRAS inhibition alone (Supplementary Fig. S9E and S9F). sgRNAs targeting the tumor suppressor KEAP1 were enriched in MRTX849-treated xenografts, suggesting loss of KEAP1 may represent a mechanism of intrinsic or acquired resistance. Interestingly, NRAS was one of the top enriched genes in the vehicle-treated xenografts, suggesting NRAS functions as a tumor suppressor in this context; however, enrichment was not as pronounced in the MRTX849-treated xenografts, suggesting NRAS may compensate for KRAS in the context of KRAS inhibition (Supplementary Fig. S9F). Collectively, these data demonstrate the importance of selected proteins that regulate RTK- and RAS-dependent signaling and cell-cycle transition in mediating the oncogenic effects of mutant KRAS, and also provide a catalog of potentially druggable vulnerabilities that complement KRAS blockade.

Cancer Therapeutic Combination Screen to Identify Rational and Clinically Tractable Strategies to Address Feedback and Resistance Pathways

To further interrogate pathways that mediate the antitumor response to MRTX849 and to identify combinations capable of enhancing response to MRTX849, a combination screen was conducted in vitro using a focused library of small-molecule inhibitors across a panel of cell lines (Supplementary Fig. S10A and S10B; Supplementary Table S8). Approximately 70 compounds targeting relevant pathways (RTKs, MAPK/ERK, PI3K, mTOR, cell cycle) were tested in a 3- or 7-day viability assay, and synergistic combinations were identified and ranked. Multiple hits from this screen were then identified for additional evaluation in combination studies with MRTX849, including the HER family inhibitor afatinib, the CDK4/6 inhibitor palbociclib, the SHP2 inhibitor RMC-4550, and mTOR pathway inhibitors.

Combination Strategies That Target Upstream Signaling Pathways Implicated in Extrinsic Regulation of KRAS Nucleotide Cycling and Feedback/Bypass Pathways

MRTX849 in combination with HER family inhibitors synergistically inhibited tumor-cell viability in the majority of cell lines evaluated and were the top hit in the combination screen in vitro (Supplementary Fig. S10). Cell lines with the highest (top 50th percentile) average composite baseline RNA expression values of selected HER family members exhibited the highest synergy scores to these combinations (Supplementary Fig. S11A). Afatinib was selected as a prototype HER family inhibitor based on its broad in vitro combination activity. Combination studies were conducted with MRTX849 and afatinib in five tumor models that were partially sensitive or treatment refractory to single-agent MRTX849. The MRTX849 and afatinib combination demonstrated significantly greater antitumor efficacy compared with either single agent in all five models evaluated, including multiple models exhibiting complete or near-complete responses to the combination (Fig. 6A; Supplementary Fig. S11B).

Figure 6.


HER family and SHP2 inhibitor combinations further inhibit KRAS signaling and exhibit increased antitumor responses. A, MRTX849 at 100 mg/kg, afatinib at 12.5 mg/kg, or the combination was administered daily via oral gavage to mice bearing the H2122 or KYSE-410 cell line xenografts (n = 5). Combination treatment led to a statistically significant decrease in tumor growth compared with either single-agent treatment. *, Padj < 0.01. B, Quantification of KRAS mobility shift and pERK in H2122 cells treated for 24 hours with MRTX849 (0.1–73 nmol/L), afatinib (200 nmol/L), or the combination assessed by Western blot densitometry. C, MRTX849 at 100 mg/kg, afatinib at 12.5 mg/kg, or the combination was administered once or daily for 7 days via oral gavage to mice bearing H2122 cell line xenografts (n = 3/group). Tumors were harvested at 6 and 24 hours following the final dose. Tumor sections were stained for pERK and pS6 via IHC methods. Quantitation of images shown by H-score in tumor tissue. Reduction of pERK or pS6 staining intensity was determined to be statistically significant relative to vehicle or either single agent using one-way ANOVA. Brackets indicate P < 0.05 compared with left-most sample. D, Quantitation of KRAS band shift and pERK after 24-hour treatment with MRTX849 (0.1–73 nmol/L), RMC-4550 (1 μmol/L), or the combination in H358 cells assessed by Western blot densitometry. E, MRTX849 at 100 mg/kg, RMC-4550 at 30 mg/kg, or the combination was administered daily via oral gavage to mice bearing the KYSE-410 or H358 cell line xenografts (n = 5/group). Combination treatment led to a statistically significant reduction in tumor growth compared with either single agent on the last day of dosing. *, Padj < 0.05. F, MRTX849 at 100 mg/kg, RMC-4550 at 30 mg/kg, or the combination was administered via oral gavage to mice bearing KYSE-410 cell line xenografts (n = 3/group), and tumors were harvested at 6 and 24 hours post-dose. Tumor sections were stained with pERK or pS6 via IHC methods. Quantitation of images shown by H-score in tumor tissue. Reduction of pERK staining intensity was determined to be statistically significant relative to RMC-4550 alone using one-way ANOVA. Brackets indicate P < 0.05 compared with left-most sample.


To evaluate whether afatinib affected covalent modification of KRASG12C by MRTX849, partially sensitive H2122 cells were treated with increasing concentrations of MRTX849 alone or in the presence of afatinib (200 nmol/L, IC90), and the mobility shift in KRAS protein was densitometrically determined from immunoblots. A clear shift in the concentration response to MRTX849 was apparent in the presence of afatinib, indicating that the combination increased the fraction of modified KRASG12C consistent with the putative role of HER family receptors in extrinsic regulation of KRASG12C GTP loading (Fig. 6B). The concentration–response relationship for inhibition of ERK phosphorylation was also clearly shifted in the presence of afatinib. To further evaluate the effect of the combination on KRAS-dependent signaling, four cell lines (H2030, H2122, H358, and KYSE-410) were treated with a range of MRTX849 concentrations in the presence or absence of afatinib for 6 or 24 hours, and key signaling molecules were evaluated by RPPA. Afatinib demonstrated clear inhibition of EGFR (pY1068) and HER2 (pY1248) activity and partial inhibition of ERK, AKT (S473), and p70S6K phosphorylation at both time points (Supplementary Fig. S11C). The effect of afatinib on S6 (S235/236, S240/244) and p90 RSK (S380) phosphorylation was variable and exhibited only minimal inhibition in most of the cell lines evaluated. The combination of afatinib and MRTX849 demonstrated markedly enhanced concentration-dependent inhibition and/or a greater magnitude of effect on ERK, RSK, p70 S6K, and S6 (S235/236) phosphorylation compared with MRTX849 alone at both 6 and 24 hours. Of note, neither afatinib nor MRTX849 alone inhibited S6 phosphorylation at the S240/244 site regulated by mTOR/S6K, whereas the combination demonstrated marked inhibition at 24 hours.

In vivo, the combination also exhibited a trend toward increased pERK and pS6 (S235/236) inhibition in the partially sensitive H2122 model in combination groups as determined by quantitation of immunostaining after 1- or 7-day administration (Fig. 6C). Similar results were observed in the MRTX849-refractory KYSE-410 model, and the combination also increased the number of apoptotic cells in this model (Supplementary Fig. S12A–S12C). Collectively, these data indicate that upstream baseline HER family activation may limit the ability of MRTX849 to achieve robust inhibition of the ERK and mTOR–S6 signaling pathways. Accordingly, the combination of afatinib and MRTX849 can limit feedback reactivation of ERK and demonstrate complementary inhibition of AKT–mTOR–S6 signaling, resulting in significantly improved antitumor activity.

SHP2 inhibition has been shown to inhibit the growth of cells that harbor KRASG12C mutations, and this effect is likely mediated, in part, by decreasing KRAS GTP loading (25–27). To evaluate whether SHP2 inhibition enhanced covalent modification of KRASG12C by MRTX849, H358 and H2122 cells were incubated with increasing MRTX849 concentrations with or without the SHP2 inhibitor RMC-4550. In both cell lines, cotreatment with RMC-4550 (1 μmol/L, IC90) demonstrated a MRTX849 concentration-dependent increase in KRASG12C protein modification and a concomitant decrease in ERK phosphorylation compared with MRTX849 alone (Fig. 6D; Supplementary Fig. S13A). RPPA analysis of KRAS-dependent signaling was conducted at 6 or 24 hours after treatment in three cell lines (H358, H2030, H2122) over a range of MRTX849 concentrations in the presence or absence of RMC-4550. RMC-4550 demonstrated robust inhibition of ERK phosphorylation and partial inhibition of p90 RSK (S380) and p70 S6K (T412) at both time points (Supplementary Fig. S13B). The combination of RMC-4550 and MRTX849 demonstrated incrementally increased concentration-dependent inhibition of ERK and RSK phosphorylation in all cell lines at both 6 and 24 hours and markedly improved inhibition of S6 (S235/236) phosphorylation compared with MRTX849 alone in H2122 and H358 cells at 24 hours. In addition, the combination demonstrated near-complete inactivation of KRAS in MRTX849-refractory KYSE-410 xenografts as determined using an active RAS ELISA assay, and this was significant compared with single agents (Supplementary Fig. S13C). On the basis of these findings, combination studies were conducted with MRTX849 and RMC-4550 in six KRASG12C-mutated tumor models in vivo, and the combination demonstrated significantly greater antitumor efficacy compared with either single agent in 4 of 6 models evaluated (Fig. 6E; Supplementary Fig. S13D). Consistent with the in vitro data, the combination also demonstrated a significant decrease in ERK phosphorylation compared with either single agent in the KYSE-410 model as determined by quantitation of tumor-cell immunostaining on day 1 at 6 and 24 hours and day 7 at 6 hours after dose (Fig. 6F). Together, these data indicate that EGFR family and SHP2 blockade can augment the antitumor activity of KRASG12C inhibitors through enhancing covalent target modification and establishing a more comprehensive blockade of KRAS-dependent signaling.

Combinations That Inhibit Bypass Pathways Downstream of KRAS and Exhibit Increased Antitumor Activity in Xenograft Models

KRAS is implicated in regulation of the oncogenic S6 protein translation pathway through both ERK-dependent activation of RSK, which phosphorylates S6 at Ser235/236, and cross-talk with the PI3K and mTOR pathway that additionally phosphorylates S6 at Ser240/244 (29). However, the S6 pathway can also be activated independently of mutated KRAS in tumor cells through hyperactivated RTK signaling, PI3K activation, or STK11 mutations, each of which converge on mTOR-mediated activation of S6. In the in vitro combination screen, mTOR inhibitors demonstrated synergy in a subset of evaluated cell lines (Supplementary Fig. S14A). To further evaluate the effect of the combination on KRAS and mTOR pathway–dependent signaling, four cell lines were treated with MRTX849 in the presence or absence of the selective ATP-competitive mTOR inhibitor vistusertib (1 μmol/L), for 6 or 24 hours, and several signaling molecules were evaluated by RPPA. Vistusertib demonstrated clear and robust inhibition of several components of the PI3K–mTOR signaling pathway including AKT (S473), p70 S6K (T412), S6 (pS235/236, S240/244), and 4E-BP1 (S65, T70) phosphorylation in each cell line at both time points consistent with its mechanism of action (Supplementary Fig. S14B). MRTX849 alone did not affect 4E-BP1 or S6 (S240/244) activity, and it exhibited a variable and cell line–dependent effect on p70 S6K and S6 (pS235/236) phosphorylation in these cell lines. Vistusertib also demonstrated marked induction of ERK phosphorylation, often several-fold over vehicle control, at both time points in all four cell lines, consistent with prior reports (30). The combination of vistusertib and MRTX849 demonstrated a comparable level of inhibition of ERK phosphorylation compared with single-agent MRTX849, indicating that the activation of ERK signaling by vistusertib was impeded by the combination of the two agents. In addition, MRTX849 combined with vistusertib further inhibited p70 S6K and AKT S473 phosphorylation compared with either single agent. Near-complete inhibition of S6 (S235/236, S240/244) phosphorylation at limit of detection was observed for the combination in each cell line at evaluated time points.

Consequently, a cohort of tumor models was identified, and the combination of MRTX849 with the selective mTOR inhibitor vistusertib demonstrated marked tumor regression and significantly improved antitumor activity compared with either single agent in all six models evaluated (Fig. 7A; Supplementary Fig. S14C). MRTX849 in combination with a second, differentiated mTOR inhibitor, everolimus, which inhibits TORC1 but not TORC2, in the H2030 xenograft model also demonstrated a striking combination effect (Supplementary Fig. S14D). In the KRASG12C, STK11-mutant H2030 model, MRTX849 demonstrated marked inhibition of ERK phosphorylation through 24 hours, but exhibited only partial inhibition of pS6235/36 at 6 hours after dose, on days 1 and 7 (Fig. 7B and C). Vistusertib demonstrated marked inhibition of pS6235/36 at 6 hours after treatment with evidence of recovery by 24 hours. The combination of vistusertib and MRTX849 did not have a further effect on ERK phosphorylation but demonstrated a significant reduction in pS6235/36 on day 1 at 24 hours compared with vistusertib alone and a trend toward reduced pS6235/36 on both day 1 and day 7 at 6 hours compared with either single agent (Fig. 7B; Supplementary Fig. S14E). Together, these data indicate that MRTX849 and mTOR inhibitor combination demonstrates complementary inhibition of the ERK and mTOR–S6 signaling pathways, resulting in broad antitumor activity in KRASG12C-mutant tumor models.

Figure 7.


CDK4/6 and mTOR combinations suppress independently hyperactivated downstream pathways and exhibit increased antitumor responses. A, MRTX849 at 100 mg/kg, vistusertib at 15 mg/kg, or the combination was administered daily via oral gavage to mice bearing the H2122 or H2030 cell line xenografts (n = 5/group). Combination treatment led to a statistically significant decrease in tumor growth compared with either single-agent treatment. *, Padj < 0.05. B, MRTX849 at 100 mg/kg, vistusertib at 15 mg/kg, or the combination was administered once or daily for 7 days via oral gavage to mice bearing H2030 cell line xenografts (n = 3/group). Tumors were harvested at 6 and 24 hours following the final dose. Tumor sections were stained with pERK and pS6 via IHC methods. Quantitation of images shown by H-score in tumor tissue. Reduction of pERK or pS6 staining intensity was determined to be statistically significant relative to vehicle or either single agent using one-way ANOVA. Brackets indicate P < 0.05 compared with left-most sample. C, Protein Western blot analysis of KRAS pathway targets in H2030 xenografts treated with MRTX849 (100 mg/kg), vistusertib (15 mg/kg), or the combination, 6 or 24 hours after a single dose. D, Protein Western blot analysis of KRAS pathway and cell-cycle targets in H2122 cells treated for 24 hours with MRTX849, palbociclib, or the combination. E, Normalized RNA-seq gene-expression data on E2F targets in H2122 xenografts treated with MRTX849, palbociclib, or the combination, 6 and 24 hours after a single daily dose or seven daily doses. F, MRTX849 at 100 mg/kg, palbociclib at 130 mg/kg, or the combination was administered daily via oral gavage to mice bearing the H2122 or SW1573 cell line xenografts (n = 5). Combination treatment led to a statistically significant decrease in tumor growth compared with either single-agent treatment. *, Padj < 0.05.


Signaling through KRAS is known to mediate cell proliferation, at least in part, through the regulation of the cyclin D family and triggering RB/E2F-dependent entry of cells into cell cycle. Loss-of-function mutations and homozygous deletions in the cell-cycle tumor suppressor CDKN2A (p16) are coincident in a subset of KRAS-mutant non–small cell lung cancer (NSCLC) and hyperactivate CDK4/6-dependent RB phosphorylation and cell-cycle transition. In the CDKN2A-null H2122 and SW1573 cell lines in vitro, MRTX849 demonstrated concentration-dependent partial inhibition of RB phosphorylation (pRB pS807/811) and concurrent increase in p27 in H2122 cells, but not SW1573 cells, at 24 hours (Fig. 7D; Supplementary Fig. S15A). MRTX849 in combination with the CDK4/6 inhibitor palbociclib (1 μmol/L) demonstrated near-complete inhibition of pRB in both H2122 and SW1573 cells and further induced p27 in H2122 cells. Interestingly, pS6 (S235/236) was also much more effectively suppressed by the combination in both H2122 and SW1573 cells, which is consistent with a recent report (31). RNA expression of target genes and RPPA analysis of target protein signaling events were also used as a readout of cell-cycle inhibition in the H2122 tumor model in vivo, and the combination of MRTX849 and palbociclib significantly inhibited E2F1 and selected E2F family target genes, induced p27 protein expression to a greater degree compared with either single agent, and further reduced the number of Ki-67–positive cells after 7 days of administration (Fig. 7E; Supplementary Fig. S15B and S15C). In addition, the combination demonstrated a significant decrease in pRB (S780) compared with either single agent after 7 days of administration in SW1573 tumors in vivo (Supplementary Fig. S15D). This combination also induced tumor regression in five tumor xenograft models that was significant compared with either single-agent control (Fig. 7F; Supplementary Fig. S15E). Although not significant, a trend was noted in which models with CDKN2A homozygous deletion exhibited an increased antitumor response to the combination of MRTX849 and CDK4/6 inhibition compared with models lacking evidence of genetic dysregulation of key cell-cycle genes (Supplementary Fig. S15F and S15G).

Discussion

The identification of MRTX849 as a highly selective KRASG12C inhibitor capable of near-complete inhibition of KRAS in vivo provides a renewed opportunity to better understand the role of this mutation as an oncogenic driver in various cancers and to guide rational clinical trial design. The lack of a significant correlation between sensitivity to MRTX849 antitumor activity in in vitro versus in vivo model systems made it necessary to further study KRAS oncogene dependence in tumor models in vivo, a more clinically relevant setting. The demonstration that MRTX849 exhibited significant antitumor efficacy in all evaluated KRASG12C-mutated cancer models and demonstrated marked regression in the majority (65%) confirms that this mutation is a broadly operative oncogenic driver and that MRTX849 represents a compelling therapeutic opportunity. This evidence of activity extended to patients, as demonstrated by RECIST partial responses in 2 patients enrolled in a phase I clinical trial of MRTX849. Collectively however, these data also illustrate that the degree of dependence of cancer cells on the presence of a KRASG12C mutation for growth and survival can vary across tumors and that co-occurring genetic alterations observed in KRAS-mutated cancers may influence response to direct targeted therapy. The further observation that KRAS mutations occur across different cancers and that no single co-occurring genetic alteration predicted response to treatment illustrates the genetic heterogeneity of KRAS-driven cancers. Findings in the present studies are consistent with other functional genomics or therapeutic strategies to block KRAS function across panels of cell lines or models which demonstrated a highly significant response of KRAS-mutant cells to target knockdown, a heterogeneous magnitude of response, and no clear co-occurring aberrations that predict resistance to target blockade (5, 32, 33). Interestingly, despite the implication that certain mutations that co-occur with KRAS including TP53, STK11, and KEAP1 may limit therapeutic response in KRASG12C-positive lung cancers, none of these mutations correlated with response or resistance in the cell-line panel. In addition, the partial response we reported in the patient with lung adenocarcinoma was observed in a patient harboring deleterious comutations in both STK11 and KEAP1. Together, these data further illustrate the heterogeneity and complexity of KRAS-mutated cancers and suggest that no binary co-occurring genetic event may be predictive of therapeutic response.

Temporal and dose–response analysis indicated maximal modification of KRASG12C and durable inhibition of KRAS-dependent signaling was important in maximizing therapeutic response. The recovery of ERK signaling and the inability to inhibit mTOR–S6 signaling despite continued treatment were each associated with transient or submaximal response to MRTX849. ERK1/2 is implicated in direct phosphorylation and negative feedback regulation of EGFR (T669), FGFR1 (S777), and SOS1, and each of these targets may facilitate KRASG12C-independent resetting of ERK signaling flux (34–36). The rapid and remarkable suppression of ERK pathway–regulated transcripts such as DUSP and SPRY/SPRED family members by MRTX849 in all models evaluated is consistent with that observed for RAF inhibitors and is implicated in reactivation of ERK and RTK signaling (18, 19). The dual-specificity phosphatases DUSP4 and 6 were strongly suppressed by MRTX849 and are implicated in dephosphorylating and inactivating ERK1/2 (14, 18, 37), whereas SPRY family members are implicated in the negative regulation of RTKs and adaptor proteins (e.g., GRB2), and may participate in modifying RAS family nucleotide exchange and effector binding (e.g., RAF1; ref. 38). Although suppression of DUSP and SPRY/SPRED was broadly observed in all models, the magnitude of signaling reactivation and response to MRTX849 varied across models. This suggests some tumor models harbor additional factors that bypass KRAS dependence or affect RAS pathway signaling flux, such as expression or activation of selected RTKs (e.g., ERBB2 amplification in the KYSE-410 model) or STK11 loss-of-function mutations, and may be primed for feedback reactivation of RAS-dependent signaling and/or limit the degree of signaling inhibition by MRTX849. This phenomenon was observed for BRAFV600E-mutant colon cancer (but not melanoma) which exhibits high baseline EGFR expression, is primed for rapid feedback activation of this RTK, and is resistant to single-agent inhibition but highly responsive to cotargeting BRAF (and/or MEK) and EGFR (20). In addition, blockade of BRAF or MEK1/2 resulted in feedback-mediated activation of the PI3K–mTOR signaling pathway in concert with the coactivation of upstream RTKs (e.g., EGFR), resulting in bypass of ERK pathway dependence and therapeutic resistance (17, 20, 39). The observations that baseline expression of HER family RTKs trended with MRTX849 antitumor activity and that CRISPR-based drug-anchored screens implicated EGFR, SHP2, and mTOR–S6 pathways as cotargetable vulnerabilities both support the hypothesis that these targets act as conditional response modifiers.

Activation of RTK signaling in the context of KRASG12C-mutant cancer was predicted to limit MRTX849 therapeutic response both by enhancing extrinsic regulation of GTPase activity and initiating KRAS-independent ERK and mTOR–S6 pathway activation. Therefore, HER family and SHP2 inhibition were employed as strategies to either block the critical RTK family in KRAS-mutant cells or block collective RTK signaling downstream, respectively. As MRTX849 binds only GDP-KRASG12C, both HER family and SHP2 inhibition each enhanced KRASG12C modification by MRTX849 and significantly improved antitumor activity. This observation is consistent with the putative role of activated RTKs in the engagement of SHP2 to mediate SOS1-dependent RAS GTP loading and to diminish RAS GAP activity, each of which converge on enhanced RAS activation state (40). The afatinib combination demonstrated a clear and marked inhibition of both the ERK–RSK and AKT–mTOR–S6 signaling pathways, whereas the SHP2 inhibitor combination demonstrated a clear impact on ERK–RSK signaling and a relatively less prominent impact on mTOR–S6 signaling. Although afatinib may more effectively address mTOR–S6 bypass signaling, SHP2 inhibition should be an effective combinatorial strategy to combat other RTKs outside of the HER family, such as FGFRs or MET, that could affect KRAS dependence. To further address bypass signaling mediated by RTK activation or STK11 mutations, each of which activate the mTOR–S6 signaling pathway independently of KRAS, mTOR inhibition in combination with MRTX849 was also evaluated. MRTX849 in combination with vistusertib, in fact, demonstrated significantly improved antitumor activity in vivo compared with either single agent in all six tumor models evaluated, regardless of STK11 mutational status. Consistent with the mechanism of action of vistusertib, comprehensive inhibition of AKT–mTOR–S6 signaling was observed for vistusertib alone and near-complete inhibition of pS6S235–36 and pS6240–44 was observed in combination. In addition, the marked feedback reactivation of ERK by vistusertib was relieved by the combination. The induction of ERK activity has been observed in tumor cells following mTORC1 inhibition by rapalogs or ATP-competitive inhibitors and has been implicated in limiting antitumor activity of this class of agents (30, 41, 42), supporting the suppression of ERK signaling by MRTX849 as a key mechanism of response to the combination. Notably, all three combination strategies converge on more comprehensive inhibition of KRAS-dependent signaling, converging on ERK and S6 activity. In addition, although the inhibition of the AKT–mTOR–S6 pathway did not correlate with model response to MRTX849 (potentially due to tumor heterogeneity), the observations that both MTOR and RPS6 drop out in drug-anchored CRISPR screens and that effective combination strategies more comprehensively block this pathway illustrate its likely importance in maximizing therapeutic response in KRAS-mutated cancers.

Cell-cycle dysregulation due to genetic alterations in cell-cycle regulators identified additional factors that could modify the therapeutic response to MRTX849. In addition, CDKN2A, RB1, CDK4, and CDK6 were all identified as gene targets that affected cell fitness in CRISPR screens. Genetic alterations including homozygous deletion of CDKN2A or amplification of CDK4 or CCND1 comprise up to 20% of KRAS-mutated NSCLC (43). Combination studies with MRTX849 and palbociclib in vivo demonstrated more comprehensive inhibition of RB and E2F family target genes and increased antitumor activity compared with either single agent in NSCLC models. In addition, these studies indicated that the combination resulted in more effective inhibition of S6 (S235/236) phosphorylation, establishing a previously unappreciated connection between cell-cycle blockade and protein translation pathways. Notably, this combination was especially effective in CDKN2A-deleted models, suggesting that this combination strategy may be primarily beneficial in a molecularly defined subset of patients characterized by decoupling of cell-cycle regulation from KRAS.

Collectively, models exhibiting a cytoreductive response to single-agent MRTX849 demonstrated a more comprehensive and durable inhibition of KRAS-dependent signaling and induction of an apoptotic response. These data suggest that maintaining durable inhibition of KRAS-dependent signaling below a defined threshold is required to elicit tumor regression. The elucidation of mechanisms that limit the therapeutic response to single-agent KRAS inhibition has provided insight toward strategies to enhance therapeutic activity in KRAS-mutant tumors. Of the 35% of models (9/26) that did not exhibit durable regression with single-agent MRTX849 treatment, five models (KYSE410, SW1573, H2122, H2030, and LU6405) were selected for rational combination studies, and at least one combination demonstrated significant improvement in antitumor efficacy and elicited a >50% tumor regression in all five models evaluated. These results suggest that essentially all KRASG12C-mutated cancers can derive clinical benefit from direct KRAS inhibitor–directed therapy either alone or in combination. Furthermore, rational pathway-centric combination regimens directed at hallmark signaling nodes may be directed to genetically defined patient subsets. For example, KRAS-mutated NSCLC exhibits mutually exclusive, co-occurring genetic alterations in STK11 and CDKN2A (43). The present data suggest that KRASG12C/STK11-mutated NSCLC could be readily addressed by combining a KRASG12C inhibitor with an RTK or mTOR inhibitor, whereas KRASG12C/CDKN2A-mutated NSCLC could be more effectively addressed by combination with a CDK4/6 inhibitor. Collectively, the present studies support the broad utility of covalent KRASG12C inhibitors in treating KRASG12C-mutated cancers and provide defining strategies to identify patients likely to benefit from single-agent therapy or rationally directed combinations.


UPDATED 02/07/2021

The November 1st issue of Science highlights a series of findings which give cancer researchers some hope in finally winning a thirty year war with the discovery of drugs that target KRAS, one of the most commonly mutated oncogenes  (25% of cancers), and thought to be a major driver of tumorigenesis. Once considered an undruggable target, mainly because of the smooth surface with no obvious pockets to fit a drug in, as well as the plethora of failed attempts to develop such an inhibitor, new findings with recently developed candidates, highlighted in this article and other curated within, are finally giving hope to researchers and oncologists who have been hoping for a clinically successful inhibitor of this once considered elusive target.

For a great review on development of G12C KRas inhibitors please see Dr. Hobb’s and Channing Der’s review in Cell Selective Targeting of the KRAS G12C Mutant: Kicking KRAS When It’s Down

Figure 1Mechanism of Action of ARS853 showing that the inhibitors may not need bind to the active conformation of KRAS for efficacy

Abstract: Two recent studies evaluated a small molecule that specifically binds to and inactivates the KRAS G12C mutant. The new findings argue that the perception that mutant KRAS is persistently frozen in its active GTP-bound form may not be accurate.

Although the development of the KRASG12C-specific inhibitor, compound 12 (Ostrem et al., 2013), was groundbreaking, subsequent studies found that the potency of compound 12 in cellular assays was limited (Lito et al., 2016, Patricelli et al., 2016). A search for more-effective analogs led to the development of ARS853 (Patricelli et al., 2016), which exhibited a 600-fold increase of its reaction rate in vitro over compound 12 and cellular activities in the low micromolar range.

A Summary and more in-depth curation of the Science article is given below:

After decades, progress against an ‘undruggable’ cancer target

Summary

Cancer researchers are making progress toward a goal that has eluded them for more than 30 years: shrinking tumors by shutting off a protein called KRAS that drives growth in many cancer types. A new type of drug aimed at KRAS made tumors disappear in mice and shrank tumors in lung cancer patients, two companies report in papers published this week. It’s not yet clear whether the drugs will extend patients’ lives, but the results are generating a wave of excitement. And one company, Amgen, reports an unexpected bonus: Its drug also appears to stimulate the immune system to attack tumors, suggesting it could be even more powerful if paired with widely available immunotherapy treatments.

Jocelyn Kaiser. After decades, progress against an ‘undruggable’ cancer target. Science  01 Nov 2019: Vol. 366, Issue 6465, pp. 561 DOI: 10.1126/science.366.6465.561

The article highlights the development of three inhibitors: by Wellspring Biosciences, Amgen, and Mirati Therapeutics.

Wellspring BioSciences

In 2013, Dr. Kevan Shokat’s lab at UCSF discovered a small molecule that could fit in the groove of the KRAS mutant G12C.  The G12C as well as the G12D is a common mutation found in KRAS in cancers. KRAS p.G12C mutations predominate in NSCLC comprising 11%–16% of lung adenocarcinomas (45%–50% of mutant KRAS is p.G12C) (Campbell et al., 2016; Jordan et al., 2017), as well as 1%–4% of pancreatic and colorectal adenocarcinomas, respectively (Bailey et al., 2016; Giannakis et al., 2016).  This inhibitor was effective in shrinking, in mouse studies conducted by Wellspring Biosciences,  implanted tumors containing this mutant KRAS.

See Wellspring’s news releases below:

March, 2016 – Publication – Selective Inhibition of Oncogenic KRAS Output with Small Molecules Targeting the Inactive State


February, 2016 – Publication – Allele-specific inhibitors inactivate mutant KRAS G12C by a trapping mechanism


Amgen

Amgen press release on AMG510 Clinical Trial at ASCO 2019

THOUSAND OAKS, Calif., June 3, 2019 /PRNewswire/ — Amgen (NASDAQ: AMGN) today announced the first clinical results from a Phase 1 study evaluating investigational AMG 510, the first KRASG12C inhibitor to reach the clinical stage. In the trial, there were no dose-limiting toxicities at tested dose levels. AMG 510 showed anti-tumor activity when administered as a monotherapy in patients with locally-advanced or metastatic KRASG12C mutant solid tumors. These data are being presented during an oral session at the 55th Annual Meeting of the American Society of Clinical Oncology (ASCO) in Chicago.

“KRAS has been a target of active exploration in cancer research since it was identified as one of the first oncogenes more than 30 years ago, but it remained undruggable due to a lack of traditional small molecule binding pockets on the protein. AMG 510 seeks to crack the KRAS code by exploiting a previously hidden groove on the protein surface,” said David M. Reese, M.D., executive vice president of Research and Development at Amgen. “By irreversibly binding to cysteine 12 on the mutated KRAS protein, AMG 510 is designed to lock it into an inactive state. With high selectivity for KRASG12C, we believe investigational AMG 510 has high potential as both a monotherapy and in combination with other targeted and immune therapies.”

The Phase 1, first-in-human, open-label multicenter study enrolled 35 patients with various tumor types (14 non-small cell lung cancer [NSCLC], 19 colorectal cancer [CRC] and two other). Eligible patients were heavily pretreated with at least two or more prior lines of treatment, consistent with their tumor type and stage of disease. 

Canon, J., Rex, K., Saiki, A.Y. et al. The clinical KRAS(G12C) inhibitor AMG 510 drives anti-tumour immunity. Nature 575, 217–223 (2019) doi:10.1038/s41586-019-1694-1

Besides blocking tumor growth, AMG510 appears to stimulate T cells to attack the tumor, thus potentially supplying a two pronged attack to the tumor, inhibiting oncogenic RAS and stimulating anti-tumor immunity.

Mirati Therapeutics

Mirati’s G12C KRAS inhibitor (MRTX849) is being investigated in a variety of solid malignancies containing the KRAS mutation.

For recent publication on results in lung cancer see Patricelli M.P., et al. Cancer Discov. 2016; (Published online January 6, 2016)

For more information on Mirati’s KRAS G12C inhibitor see https://www.mirati.com/pipeline/kras-g12c/

KRAS G12C Inhibitor (MRTX849)

Study 849-001 – Phase 1b/2 of single agent MRTX849 for solid tumors with KRAS G12C mutation

Phase 1b/2 clinical trial of single agent MRTX849 in patients with advanced solid tumors that have a KRAS G12C mutation.

See details for this study at clinicaltrials.gov

UPDATED 02/07/2021

Amgen scientists’ rapid work to challenge the undruggable KRAS G12C mutation in cancer

Inside a 40-year quest to challenge the KRAS G12C mutation in cancer
By Amgen Oncology
Amgen’s sotorasib, an investigational lung cancer treatment, has been submitted to the FDA for review


Nearly four decades have passed since researchers first identified the RAS gene family, which includes HRASNRAS and KRASRAS is the most frequently mutated family of oncogenes – or potentially cancerous genes – in human cancers.1,2 While research  efforts have been able to identify and develop treatments for other driver gene mutations that contribute to cancer growth, success with treating KRAS, the most frequently mutated variant of the RAS family, has remained elusive.2 But now there is hope.

Amgen, a leading biotechnology company, has taken on one of the toughest challenges of the last 40 years in cancer research.3 Chemical biologist Kevan Shokat’s lab at the University of California, San Francisco, identified a small molecule that could slip into a groove on a KRAS mutation called G12C in 2013.4 Building on their own research strategies and this new insight, scientists at Amgen used structural biology and medicinal chemistry to identify an adjacent groove, and by November 2017, made the initial decision to advance the molecule that would become investigational sotorasib.5

KRAS G12C is the most common KRAS mutation in NSCLC.6,7 In the U.S., about 13% of patients with NSCLC harbor the KRAS G12C mutation.8 There is a high unmet need and poor outcomes in the second-line treatment of KRAS G12C-driven non-small cell lung cancer (NSCLC) and, currently, there are no KRASG12C targeted therapies approved.

According to Amgen’s head of research and development David Reese, “the company’s scientists had an idea some time ago that the future of oncology would be led by the marriage of immuno-oncology and precision therapy. We wanted to go after high value targets, and RAS proteins are one of them.”

Because of this effort to rapidly accelerate the speed of innovation, investigational sotorasib entered clinical trials in humans less than 12 months.


At the same time that scientists discovered investigational sotorasib, the team was undertaking a project to map out every step it takes to progress a potential new treatment from an idea in a lab to being made available for patients. The goal was to shrink timelines and eliminate gaps to develop drugs more rapidly in order to reach patients with serious illnesses like NSCLC as quickly as possible.

Because of this effort to rapidly accelerate the speed of innovation, sotorasib entered clinical trials in humans less than 12 months.5 Sotorasib was the first investigational KRASG12C inhibitor to enter the clinic, and is now being studied in the broadest clinical program exploring 10 combinations with global investigational sites spanning five continents.9 In a little more than two years, the sotorasib clinical program has established a clinical data set of more than 700 patients studied across 13 tumor types.9

The investigational treatment was recently submitted to the FDA for review and was granted Breakthrough Therapy designation, a distinction designed to expedite the development and review of drugs.5 It was also accepted into the FDA’s Real-Time Oncology Review pilot program, which aims to explore a more efficient review process.5

To learn more about Amgen and how the speed of innovation is bringing new oncology treatments to patients with high unmet needs, visit Amgen.com/KnowKRAS.  

______________________

1 Ryan MB, et al. Nat Rev Clin Oncol. 2018;15:709-720.

2 Cox AD, et al. Nat Rev Drug Discov. 2014;13:828-851.

3 Kim D, et al. Cell. 2020. doi:10.1016/j.cell.2020.09.044.

4 Ostrem JM, et al. Nature. 2013 ; 503 :548-551.

5 AMGEN, 2020. Retrieved January 8, 2021, from https://www.amgen.com/stories/2020/12/rapidly-advancing-development-of-amgens-investigational-kras-g12c-inhibitor

6 Pakkala S, et al. JCI Insight. 2018;3:e120858.

7 Arbour KC, et al. Clin Cancer Res. 2018;24:334-340.

8 Amgen, Data on File. 2020.

9 ClinicalTrials.gov. NCT04185883, NCT04380753, NCT03600883, NCT04303780. https://clinicaltrials.gov/ct2/. Accessed January 20, 2020.


Members of the editorial and news staff of the USA TODAY Network were not involved in the creation of this content.


Additional References:

Allele-specific inhibitors inactivate mutant KRAS G12C by a trapping mechanism.

Lito P et al. Science. (2016)

Targeting KRAS Mutant Cancers with a Covalent G12C-Specific Inhibitor.

Janes MR et al. Cell. (2018)

Potent and Selective Covalent Quinazoline Inhibitors of KRAS G12C.

Zeng M et al. Cell Chem Biol. (2017)

Campbell, J.D., Alexandrov, A., Kim, J., Wala, J., Berger, A.H., Pedamallu, C.S., Shukla, S.A., Guo, G., Brooks, A.N., Murray, B.A., et al.; Cancer Genome Atlas Research Network (2016). Distinct patterns of somatic genome alterations in lung adenocarcinomas and squamous cell carcinomas. Nat. Genet.48, 607–616

Jordan, E.J., Kim, H.R., Arcila, M.E., Barron, D., Chakravarty, D., Gao, J., Chang, M.T., Ni, A., Kundra, R., Jonsson, P., et al. (2017). Prospective comprehensive molecular characterization of lung adenocarcinomas for efficient patient matching to approved and emerging therapies. Cancer Discov. 7, 596–609.

Bailey, P., Chang, D.K., Nones, K., Johns, A.L., Patch, A.M., Gingras, M.C., Miller, D.K., Christ, A.N., Bruxner, T.J., Quinn, M.C., et al.; Australian Pancreatic Cancer Genome Initiative (2016). Genomic analyses identify molecular subtypes of pancreatic cancer. Nature 531, 47–52.

Giannakis, M., Mu, X.J., Shukla, S.A., Qian, Z.R., Cohen, O., Nishihara, R., Bahl, S., Cao, Y., Amin-Mansour, A., Yamauchi, M., et al. (2016). Genomic correlates of immune-cell infiltrates in colorectal carcinoma. Cell Rep. 15, 857–865.

Read Full Post »

AI System Used to Detect Lung Cancer

Reporter: Irina Robu, PhD

3.3.13

3.3.13   AI System Used to Detect Lung Cancer, Volume 2 (Volume Two: Latest in Genomics Methodologies for Therapeutics: Gene Editing, NGS and BioInformatics, Simulations and the Genome Ontology), Part 2: CRISPR for Gene Editing and DNA Repair

Lung cancer is characterized by uncontrolled cell growth in tissues of the lung. The growth spreads beyond the lung by metastasis into nearby tissues. The most common symptoms are coughing (including coughing up blood), weight loss, shortness of breath, and chest pains. The two main types of lung cancer are small-cell lung carcinoma(SCLC) and non-small-cell lung carcinoma (NSCLC). Lung cancer may be seen on chest radiographs and computed tomography(CT) scans. However, computers seem to be as good or better than regular doctors at detecting tiny lung cancers on CT scans according to scientists from Google.

The AI designed by Google was able to interpret images using the same skills as humans to read microscope slides, X-rays, M.R.I.s and other medical scans by feeding huge amounts of data from medical imaging into the systems. It seems that the researchers were able to train computers to recognize patterns linked to a specific condition.

In a new Google study, the scientists applied artificial intelligence to CT scans used to screen people for lung cancer. Current studies have shown that screening can reduce the risk of dying from lung cancer and can also identify spots that might later become malignant.

The researchers created a neural network with multiple layers of processing and trained the AI by giving it many CT scans from patients whose diagnoses were known. This allows radiologists to sort patients into risk groups and decide whether biopsies are needed or follow up to keep track of the suspected regions. Even though the technology seems promising, but it can have pitfalls such as missing tumors, mistaken benign spots for malignancies and push patients into risky procedures.

Yet, the ability to process vast amounts of data may make it imaginable for artificial intelligence to recognize subtle patterns that humans simply cannot see. It is well understood that the systems should be studied extensively before using them for general public use. The lung-screening neural network is not ready for the clinic yet.

SOURCE

A.I. Took Test To Detect Lung Cancer And Smashed It

Read Full Post »

What about PDL-1 in oncotherapy diagnostics for NSCLC?

Larry H. Bernstein, MD, FCAP, Curator

LPBI

UPDATED 5/15/2019

Questions on PD-L1 Diagnostics for Immunotherapy in NSCLC
Alexander M. Castellino, PhD
http://www.medscape.com/viewarticle/862275

Two immunotherapies that target the cell programmed death (PD) pathway are now available, and both nivolumab (Opdivo, Bristol-Myers Squibb Company) and pembrolizumab (Keytruda, Merck Sharp & Dohme Corp) are approved for treating advanced, refractory, non–small cell lung cancer (NSCLC). Across several studies in patients with NSCLC, response to these agents has been correlated with PD-L1 staining, which determines PD-L1 levels in the tumor tissue. How do the available assays for PD-L1 compare?

The linear correlation between three commercially available assays is good across a range of cutoff points, concluded a presentation at the 2016 American Association for Clinical Research Annual Meeting.

Cutoffs are defined as the percentage of cells expressing PD-L1 when analyzed histochemically. “The dataset builds confidence that the assays may be used according to the cutoff clinically validated for the drug in question,” Marianne J. Radcliffe, MD, diagnostic associate director at AstraZeneca, toldMedscape Medical News.

“The correlation is good between the assays across the range examined,” she added.

However, a recently published study showed a high rate of discordance between another set of PD-L1 assays that were tested.

Dr Marianne Radcliffe

“Different diagnostic tests yield different results, depending on the cutoff for each assay. We need to harmonize the assays so clinicians are talking about the same thing,” Brendon Stiles, MD, associate professor of cardiothoracic surgery at Weill Cornell Medicine and New York-Presbyterian Hospital, New York City, told Medscape Medical News.

For Dr Stiles, these studies raise the issue that it is difficult to compare results of diagnostic testing across the different drugs and even with the same drug that are derived from different assays. “More importantly, it raises confusion in clinical practice when a patient’s sample stains positive for PD-L1 with one assay and negative with another,” he said.

“The commercial strategy for developing companion diagnostics for each drug is not in the best interests of the patients. It generates confusion among both clinicians and patients,” Dr Stiles commented. “We need to know if these assays can be used interchangeably,” he said.

As new agents come into the clinic, Dr Stiles believes there should be a universal yes-or-no answer, so that clinicians can use the assay to help decide on the use of immunotherapy.

Three Assays Tested

The study presented by Dr Radcliffe and colleagues investigated three commercially available assays, Ventana SP263, Dako 22C3, and Dako 28-8, with regard to how they compare at different cutoffs. Different studies use different cutoffs to express positivity.

Ventana SP263 was developed as a companion diagnostic for durvalumab (under development by AstraZeneca) using a rabbit monoclonal antibody. Positivity is defined as ≥25% staining of tumor cells.

Dako 22C3 was developed, and is approved, as a companion diagnostic for pembrolizumab. It uses a mouse monoclonal antibody. Positivity is defined as ≥1% and ≥50% staining of tumor cells.

Dako 28-8 was developed as a companion diagnostic for nivolumab and uses a rabbit monoclonal antibody (different from the one used in the Ventana SP263). In clinical practice, this assay is used as a complementary diagnostic for nivolumab, but the drug is approved for use regardless of PD-L1 expression. Positivity is defined as ≥1%, ≥5%, or ≥10% staining of tumor cells.

Ventana SP142 was not included in the study because it is not commercially available, Dr Ratcliffe indicated.
The three assays were used on consecutive sections of 500 archival NSCLC tumor samples obtained from commercial vendors. A single pathologist trained by the manufacturer read all samples in batches on an assay-by-assay basis. Samples were assessed per package inserts provided by Ventana and Dako in a Clinical Laboratory Improvement Amendments program-certified laboratory.

Dr Ratcliffe indicated that between reads of samples from the same patient, there was a washout period for the pathologist to remove bias.

The NSCLC samples included patients with stage I (38%), II (39%), III (20%), and IV (<1%) disease. Histologies included nonsquamous (54%) and squamous (43%) cancers.

All three PD-L1 assays showed similar patterns of staining in the range of 0% to 100%, Dr Ratcliffe indicated.


The correlation between any two of the assays was determined from tumor cell membrane staining. The correlation was linear with Spearman correlation of 0.911 for Ventana SP263 vs Dako 22C3; 0.935 for Ventana SP263 vs Dako 28-8; and 0.954 for Dako 28-8 vs Dako 22C3.

“With an overall predictive value of >90%, the assays have closely aligned dynamic ranges, but more work is needed,” Dr Ratcliffe said. “In general, scoring of immunohistochemical assays can be more variable between 1% and 10%, and we plan to look at this in more detail,” she said. These samples need to be reviewed by an independent pathologist, she added.

Dr Radcliffe said that currently, “Direct clinical efficacy data supporting a specific diagnostic test should still be considered as the highest standard of proof for diagnostic clinical utility.”

Why Correlations Are Needed

Pembrolizumab is approved for use only in patients with PD-L1-positive, previously treated NSCLC. A similar patient profile is being considered for nivolumab, for which testing for PD-L1 expression is not required.

For new PD-immunotherapy agents in clinical development, it is not clear whether PD-L1 testing will be mandated.

However, in clinical practice, it is clear that some patients respond to therapy, even if they are PD-L1 negative, as defined from the study. “Is it a failure of the assay, tumor heterogeneity, or is there another time point when PD-L1 expression is turned on?” Dr Stiles asked.

Dr Stiles also pointed out that a recent publication from Yale researchers showed a high a rate of discordance. In this study, PD-L1 expression was determined using two rabbit monoclonal antibodies. Both of these were different from the ones used in the Ventana SP263 and Dako 28-8 assays.

In this study, whole-tissue sections from 49 NSCLC samples were used, and a corresponding tissue microarray was also used with the same 49 samples. Researchers showed that in 49 NSCLC tissue samples, there was intra-assay variability, with results showing fair to poor concordance with the two antibodies. “Assessment of 588 serial section fields of view from whole tissue showed discordant expression at a frequency of 25%.

“Objective determination of PD-L1 protein levels in NSCLC reveals heterogeneity within tumors and prominent interassay variability or discordance. This could be due to different antibody affinities, limited specificity, or distinct target epitopes. Efforts to determine the clinical value of these observations are under way,” the study authors conclude.

The Blueprint Proposal

Coincidentally, a blueprint proposal was announced here at the AACR meeting at a workshop entitled FDA-AACR-ASCO Complexities in Personalized Medicine: Harmonizing Companion Diagnostics across a Class of Targeted Therapies.

The blueprint proposal was developed by four pharmaceutical giants (Bristol-Myers Squibb Company, Merck & Co, Inc, AstraZeneca PLC, and Genentech, Inc) and two diagnostic companies (Agilent Technologies, Inc/Dako Corp and Roche/Ventana Medical Systems, Inc).

In this proposal, the development of an evidence base for PD-1/PD-L1 companion diagnostic characterization for NSCLC would be built into studies conducted in the preapproval stage. Once the tests are approved, the information will lay the foundation for postapproval studies to inform stakeholders (eg, patients, physicians, pathologists) on how the test results can best be used to make treatment decisions.

The blueprint proposal is available online.

Dr Ratcliffe is an employee and shareholder of AstraZeneca. Dr Stiles has disclosed no relevant financial relationships.

 American Association for Cancer Research (AACR) 2016 Annual Meeting: Abstract LB-094, presented April 18, 2016.
Quantitative Assessment of the Heterogeneity of PD-L1 Expression in Non–Small-Cell Lung Cancer
Joseph McLaughlin, 1,2; Gang Han, 3; Kurt A. Schalper, 2; ….,  Roy Herbst, 1; Patricia LoRusso, 1; David L. Rimm, 2

JAMA Oncol. 2016;2(1):46-54.       http://dx.doi.org:/10.1001/jamaoncol.2015.3638.

Importance  Early-phase trials with monoclonal antibodies targeting PD-1 (programmed cell death protein 1) and PD-L1 (programmed cell death 1 ligand 1) have demonstrated durable clinical responses in patients with non–small-cell lung cancer (NSCLC). However, current assays for the prognostic and/or predictive role of tumor PD-L1 expression are not standardized with respect to either quantity or distribution of expression.

Objective  To demonstrate PD-L1 protein distribution in NSCLC tumors using both conventional immunohistochemistry (IHC) and quantitative immunofluorescence (QIF) and compare results obtained using 2 different PD-L1 antibodies.

Design, Setting, and Participants  PD-L1 was measured using E1L3N and SP142, 2 rabbit monoclonal antibodies, in 49 NSCLC whole-tissue sections and a corresponding tissue microarray with the same 49 cases. Non–small-cell lung cancer biopsy specimens from 2011 to 2012 were collected retrospectively from the Yale Thoracic Oncology Program Tissue Bank. Human melanoma Mel 624 cells stably transfected with PD-L1 as well as Mel 624 parental cells, and human term placenta whole tissue sections were used as controls and for antibody validation. PD-L1 protein expression in tumor and stroma was assessed using chromogenic IHC and the AQUA (Automated Quantitative Analysis) method of QIF. Tumor-infiltrating lymphocytes (TILs) were scored in hematoxylin-eosin slides using current consensus guidelines. The association between PD-L1 protein expression, TILs, and clinicopathological features were determined.

Main Outcomes and Measures  PD-L1 expression discordance or heterogeneity using the diaminobenzidine chromogen and QIF was the main outcome measure selected prior to performing the study.

Results  Using chromogenic IHC, both antibodies showed fair to poor concordance. The PD-L1 antibodies showed poor concordance (Cohen κ range, 0.124-0.340) using conventional chromogenic IHC and showed intra-assay heterogeneity (E1L3N coefficient of variation [CV], 6.75%-75.24%; SP142 CV, 12.17%-109.61%) and significant interassay discordance using QIF (26.6%). Quantitative immunofluorescence showed that PD-L1 expression using both PD-L1 antibodies was heterogeneous. Using QIF, the scores obtained with E1L3N and SP142 for each tumor were significantly different according to nonparametric paired test (P < .001). Assessment of 588 serial section fields of view from whole tissue showed discordant expression at a frequency of 25%. Expression of PD-L1 was correlated with high TILs using both E1L3N (P = .007) and SP142 (P = .02).

Conclusions and Relevance  Objective determination of PD-L1 protein levels in NSCLC reveals heterogeneity within tumors and prominent interassay variability or discordance. This could be due to different antibody affinities, limited specificity, or distinct target epitopes. Efforts to determine the clinical value of these observations are under way.


Introduction We are in an era of rapid incorporation of basic scientific discoveries into the drug development pipeline. Currently, numerous sponsors are developing therapeutic products that may use similar or identical biomarkers for therapeutic selection, measured or detected by an in vitro companion diagnostic device. The current practice is to independently develop a companion diagnostic for each therapeutic. Thus, the matrix of therapeutics and companion diagnostics, if each therapeutic were approved in conjunction with a companion diagnostic, may present a complex challenge for testing and decision making in the clinic, potentially putting patients at risk if inappropriate diagnostic tests were used to make treatment decisions. To address this challenge, there is a desire to understand assay comparability and/or standardize analytical and clinical performance characteristics supporting claims that are shared across companion diagnostic devices. Pathologists and oncologists also need clarity on how to interpret test results to inform downstream treatment options for their patients.
Clearly using each of the companion diagnostics to select one of the several available targeted therapies in the same class is not practical and may be impossible. Likewise, having a single test or assay as a sole companion test for all of the multiple therapeutic options within a class is also impractical since the individual therapies have differing modes of action, intended use populations, specificities, safety and efficacy outcomes. Thus, a single assay or test may not adequately capture the appropriate patient population that may benefit (or not) from each individual therapeutic option within a class of therapies. Furthermore, aligning multiple sponsors’ study designs and timelines in order that they all adopt a single companion test may inadvertently slow down development of critical therapeutic products and delay patient access to these life-saving products.
Any solution to this challenge will be multifaceted and will, by necessity, involve multiple stakeholders. Thus, the US Food and Drug Administration (FDA), the American Association for Cancer Research (AACR) and American Society of Clinical Oncology (ASCO) convened a workshop titled “Complexities in Personalized Medicine: Harmonizing Companion Diagnostics Across a Class of Targeted Therapies” to draw out and assess possible solutions. Recognizing that the complex scientific, regulatory and market forces at play here require a collaborative effort, an industry workgroup volunteered to develop a blueprint proposal of potential solutions using nonsmall cell lung cancer (NSCLC) as the use case indication.
Goal and Scope of Blueprint The imminent arrival to the market of multiple PD1 / PD-L1 compounds and the possibility of one or more associated companion diagnostics is unprecedented in the field of oncology. Some may assume that since these products target the same biological pathway, they are interchangeable; however, each PD1/PD-L1 compound is unique with respect to its clinical pharmacology and each compound is being developed in the context of a unique biological scientific hypothesis and registration strategy. Similarly, each companion diagnostic has been optimized within the individual therapeutic development programs to meet specific development goals, e.g., 1) validation for patient selection, 2) subgroup analysis as a prognostic variable, or 3) enrichment.
Further, each companion diagnostic test is optimized for its specific therapy and with its own unique performance characteristics and scoring/interpretation guidelines.
The blueprint development group recognizes that to assume that any one of the available tests could be used for guiding the treatment decision with any one or all of the drugs available in this class presents a potential risk to patients that must be addressed.
The goal of this proposal is to agree and deliver, via cross industry collaboration, a package of information /data upon which analytic comparison of the various diagnostic assays may be conducted, potentially paving the way for post-market standardization and/or practice guideline development as appropriate.
A comparative study of PD-L1 diagnostic assays and the classification of patients as PD-L1 positive and PD-L1 negative
Presentation Time: Monday, Apr 18, 2016, 8:00 AM -12:00 PM
Location: Section 10
Poster Board Number: 18
Author Block: Marianne J. Ratcliffe1, Alan Sharpe2, Anita Midha1, Craig Barker2, Paul Scorer2, Jill Walker2. 1AstraZeneca, Alderley Park, United Kingdom; 2AstraZeneca, Cambridge, United Kingdom
Abstract Body: Background: PD-1/PD-L1 directed antibodies are emerging as effective therapeutics in multiple oncology settings. Keynote 001 and Checkmate 057 have shown more frequent response to PD-1 targeted therapies in NSCLC patients with high tumour PD-L1 expression than patients with low or no PD-L1 expression. Multiple diagnostic PD-L1 tests are available using different antibody clones, different staining protocols and diverse scoring algorithms. It is vital to compare these assays to allow appropriate interpretation of clinical outcomes. Such understanding will promote harmonization of PD-L1 testing in clinical practice.
Methods: Approximately 500 tumour biopsy samples from NSCLC patients, including squamous and non-squamous histologies, will be assessed using three leading PD-L1 diagnostics assays. PD-L1 assessment by the Ventana SP263 assay that is currently being used in Durvalumab clinical trials (positivity cut off: ≥25% tumour cells with membrane staining) will be compared with the Dako 28-8 assay (used in the Nivolumab Checkmate 057 trial at the 1%, 5% and 10% tumour membrane positivity cut offs), and the Dako 22C3 assay (used in the Pembrolizumab Keynote 001 trial) at the 1% and 50% cut offs).
Results: Preliminary data from 81 non-squamous patients indicated good concordance between the Ventana SP263 and Dako 28-8 assays. Optimal overall percent agreement (OPA) was observed between Dako 28-8 at the 10% cut off and the Ventana SP263 assay (OPA; 96%, Positive percent agreement (PPA); 91%, Negative percent agreement (NPA); 98%), where the Ventana SP263 assay was set as the reference. Data on the full cohort will be presented for all three assays, and a lower 95% confidence interval calculated using the Clopper-Pearson method.
Conclusions: This study indicates that the patient population defined by Ventana SP263 at the 25% cut off is similar to that identified by the Dako-28-8 assay at the 10% tumour membrane cut off. This, together with data on the 22C3 assay, will enable cross comparison of studies using different PD-L1 tests, and widen options for harmonization of PD-L1 diagnostic testing.

http://www.abstractsonline.com/Plan/ViewAbstract.aspx

Table 1
Reference: Ventana SP-263 (≥25% tumour membrane staining)
Dako 28-8 assay cut off PPA
(%)
NPA
(%)
OPA
(%)
>1% 58 100 81
>5% 72 100 90
>10% 91 98 96

UPDATED 5/19/2019

Incidence of Adverse Events for PD-1/PD-L1 Inhibitors Underscores Toxicity Risk

https://www.cancernetwork.com/immuno-oncology/incidence-adverse-events-pd-1pd-l1-inhibitors-underscores-toxicity-risk

May 7, 2019

Approximately two-thirds of cancer patients who received a programmed death 1 (PD-1) or programmed death ligand 1 (PD-L1) inhibitor in clinical trials experienced treatment-related adverse events, according to a systematic review and meta-analysis recently published in JAMA Oncology. The study findings may facilitate discussions with cancer patients who are considering PD-1 or PD-L1 therapy.

“The vast majority of patients with advanced cancer want to be on the [PD-1 or PD-L1] therapy,” Eric H. Bernicker, MD, a thoracic medical oncologist with Houston Methodist Cancer Center, told Cancer Network. Not involved in the current study, Bernicker explained that patients perceive these therapies to have “very different” side effects and risks from chemotherapy.

While they do, Bernicker explained, it’s important to underscore, which this study does, that these are not “completely innocuous” therapies. The study findings allow physicians to give numbers to patients and families when counseling them about the risks involved, he said.

The systematic review and meta-analysis is based on data from 125 clinical trials and 20,128 participants. Clinical trials were identified by systematically searching for published clinical trials that evaluated single-agent PD-1 and PD-L1 inhibitors and reported treatment-related adverse events in PubMed, Web of Science, Embase, and Scopus. The majority of trials evaluated nivolumab (n = 46) or pembrolizumab (n = 49), and the most common cancer types were lung cancer (n = 26), genitourinary cancer (n = 22), melanoma (n = 16), and gastrointestinal cancer (n = 14).

In all, 66.0% of clinical trial participants reported at least 1 adverse event of any grade, and 14.0% reported at least 1 grade 3 or higher adverse event. The most frequently reported adverse events of any grade were fatigue (18.26%), pruritus (10.61%), and diarrhea (9.47%). As for grade 3 or higher events, the most commonly reported were fatigue (0.89%), anemia (0.78%), and aspartate aminotransferase (AST) increase (0.75%).

Frequently reported immune-related adverse events of any grade included diarrhea (9.47%), AST increase (3.39%), vitiligo (3.26%), alanine aminotransferase (ALT) increase (3.14%), pneumonitis (2.79%), and colitis (1.24%). Grade 3 or higher immune-related adverse events included AST increase (0.75%), ALT increase (0.70%), pneumonitis (0.67%), diarrhea (0.59%), and colitis (0.47%).

If present, certain adverse events had increased likelihood of being grade 3 or higher, including hepatitis (risk ratio [RR], 50.59%), pneumonitis (RR, 24.01%), type 1 diabetes (RR, 41.86%), and colitis (RR, 37.90%).

“In terms of the rough percentage of side effects and the breadth of the side effects, this is pretty much what most of us see in the clinic,” Bernicker said, noting that none of the findings were particularly surprising.

Although no differences in adverse event incidence were found across different cancer types, differences were found between PD-1 and PD-L1 inhibitors in a subgroup analysis. Overall, compared with PD-L1 inhibitors, PD-1 inhibitors had a higher mean incidence of grade 3 or higher events (odds ratio [OR], 1.58; 95% CI, 1.00–2.54). Specifically, nivolumab had a higher mean incidence of grade 3 or higher events (OR, 1.81; 95% CI, 1.04–3.01) compared with PD-L1 inhibitors.

Bernicker commented that these incidence differences on the basis of drug type were “intriguing” but not clinically useful, given that PD-1 and PD-L1 inhibitors are not interchangeable. He said the finding “needs to be further looked at.”

Read Full Post »

PLD1 tests for Lung Cancer

Larry H. Bernstein, MD, FCAP, Curator

PLBI


AACR: Three PD-L1 Biomarker Tests Give Similar Results in Lung Cancer

http://www.oncotherapynetwork.com/lung-cancer-targets/aacr-three-pd-l1-biomarker-tests-give-similar-results-lung-cancer?GUID=08B7ACA4-07B7-4253-8ACC-0C9AAFF0371A&rememberme=1&ts=22042016#sthash.1sWQZ14d.dpuf


Three commercial tests that measure levels of PD-L1 on tumors showed similar results on non-small cell lung cancer (NSCLC) tumor samples, according to a study presented at the American Association of Cancer Research (AACR) Annual Meeting, being held April 16-20, 2016, in New Orleans.
Two anti-PD-1 immunotherapy antibodies are now approved for certain patients with metastatic NSCLC (see FDA Approves Keytruda for Metastatic Non-Small Cell Lung Cancer and FDA Approves Nivolumab (Opdivo) for NSCLC).

Several pharmaceutical companies are developing diagnostic tests to measure the levels of PD-L1 protein expression on patients’ tumors. Two clinical trials, with both nivolumab (Opdivo) and pembrolizumab (Keytruda), support the notion that those patients whose tumors have higher levels of PD-L1 on their surface are more likely to respond to anti-PD-1 treatment compared to those patients whose tumors have low or no PD-L1 expression.

“Before our study, we did not know whether the different assays identified the same patients,” said study author Marianne Ratcliffe, PhD, MA, a diagnostic associate director at AstraZeneca, which is developing durvalumab/MEDI4736, an anti-PD-L1 immunotherapy antibody.

The current study compared the Ventana SP263 assay (developed by Ventana) in collaboration with AstraZeneca for use in conjunction with patients treated with durvalumab, the Dako 22C3 assay (by Dako), approved for the US Food and Drug Administration (FDA) as a companion diagnostic to identify patients who are most likely to benefit from pembrolizumab, and the Dako 28-8 assay, approved by the FDA as a complementary diagnostic for nivolumab. All three tests measure the percentage of tumor cells within a sample that stain positive for the surface protein PD-L1. Each test sets a unique cut-off point of test positivity which corresponds to a greater likelihood of response to the immunotherapy among lung cancer patients.

The researchers evaluated the three tests on 500 patient biopsy samples, including both squamous and nonsquamous histologies. The comparison showed that a 25% cutoff using the Ventana SP263 test was similar to the results using the Dako 28-8 test at a 10% cutoff mark. There were similar results between the SP263 and the 22C3 tests at a 50% cut off mark.

The three tests achieved overall percentage agreement of more than 90%, according to Radcliffe. She also noted that this study points to the ability to extrapolate results from one test to another, which in the future, could allow physicians to use the tests interchangeably.


Comparison of Three Different PD-L1 Diagnostic Tests Shows a High Degree of Concordance

4/18/2016

NEW ORLEANS — Three commercially available diagnostic tests were similarly effective in measuring  PD-L1 protein expression on non-small cell lung cancer (NSCLC) tumor samples, indicating that health care providers may someday be able to use these tests interchangeably when determining which patients will respond best to anti-PD-L1/PD-1 immunotherapeutic drugs, according to research presented here at the AACR Annual Meeting 2016, April 16-20.Marianne Ratcliffe

“PD-L1-directed antibodies are emerging as effective therapeutics in monotherapy and in combination in multiple oncology settings,” said the study’s lead author, Marianne Ratcliffe, MA, PhD, diagnostic associate director at AstraZeneca. She explained that several different diagnostic tests, or assays, are effective in determining which patients’ tumors express high levels of PD-L1 and might, therefore, respond best to targeted treatment.

“Before our study, we did not know whether the different assays identified the same patients,” Ratcliffe said, adding that the tests were developed on different platforms and use different antibody clones and testing protocols.

“Clearly, for the oncology community, this presents a number of issues, including a lack of confidence in being able to identify appropriate patients for treatment with these targeted therapies,” Ratcliffe said. “Our current study complements the ongoing Blueprint initiative, which is also tackling the issue of PD-L1 assay harmonization.”

This study compared the Ventana SP263 assay, developed by Ventana in collaboration with AstraZeneca for use in evaluating patients for the immunotherapeutic drug durvalumab, an anti-PD-L1; the Dako 22C3 assay, made by Dako and approved for the U.S. Food and Drug Administration (FDA) as a companion diagnostic to identify patients for pembrolizumab (Keytruda), an anti-PD-1; and the Dako 28-8 assay, made by Dako and approved by the FDA as a complementary diagnostic for nivolumab (Opdivo), an anti-PD-1.

All three tests assess the percentage of tumor cells whose membranes stain positive for the PD-L1 protein. A cut-off point is set for each test, and patients whose tumors score above the cut-off point are determined to be more likely to respond to the corresponding therapy, Ratcliffe explained.

In this study, the largest to date, approximately 500 tumor biopsy samples from patients with NSCLC were assessed because all three tests have been previously validated for that disease.
The study determined that the patient population defined by Ventana SP263 at the 25 percent cutoff point is similar to the group identified by the Dako 28-8 at the 10 percent cutoff. The study also showed a high degree of concordance between the SP263 and 22C3 assays if a 50 percent cutoff point was applied in both cases.

Ratcliffe said that the three tests achieved overall percentage agreement of more than 90 percent.  The results also indicate which cutoff points should be used to optimize agreement between a positive or negative PD-L1 result, which will help the medical community to compare results from clinical studies that have used different tests.

Ratcliffe said the study results indicate that it may be possible to extrapolate the results from one test to that of another test, and could someday allow physicians to use the tests interchangeably, though she added that further research is needed to confirm the findings.


Read Full Post »


ATCC Announces First Isogenic Cell Line Produced by the CRISPR/Cas9 Technology

CellPassages-1-2016_cancer


Reporter: Stephen J. Williams, PhD.


EML4-ALK Isogenic Cells — New!

ATCC is proud to announce its first product developed using CRISPR/Cas9 technology, the EML4-ALK Fusion-A549 Isogenic Cell Line Human (ATCC® CCL-185IG™). This cell line was derived from the parental A549 (ATCC® CCL-185™) non-small cell lung cancer cell line. EML4-ALK Fusion-A549 Isogenic Cell Line has been intensively validated on the genome, transcript, and protein level, and is otherwise identical to the parental line. This isogenic cell line is more sensitive to ALK inhibitor crizotinib when compared to A549, and serves as a vital model to study cell signaling pathways in cancer as well as in drug screening when used side-by-side with A549 cells.

Further your lung cancer research with the EML4-ALK Fusion-A549 Isogenic Cell Line Human ATCC® CCL-185IG™ derived from A549 ATCC ® CCL-185™ today!

lunc cancer cells


Lung Cancer

Lung cancers are classified by type: small cell lung carcinoma (SCLC) and non-small cell lung carcinoma (NSCLC). SCLCs are associated with smoking and metastasize very early. By contrast, non-smokers usually present with NSCLC, which are further subdivided into squamous cell carcinomas, adenocarcinomas, and large cell carcinomas. Since both SCLC and NSCLC are usually diagnosed after the disease has spread beyond the primary site, the overall survival rates for lung cancers are poor. To breathe new life into your lung cancer research, ATCC provides numerous lung cancer cell lines, a new gene-edited isogenic NSCLC cell line, human primary cells, and h-TERT-immortalized cell lines. And to increase the throughput of your lung cancer experiments, ATCC has lung cancer cell lines organized into tumor cell panels.

Find out more about ATCC Lung Cancer Resources.

Physiologically Relevant Controls

All experiments should include physiologically relevant controls. ATCC provides both primary and hTERT-immortalized bronchial epithelial cells and small airway cells that may be used side-by-side with NSCLC or SCLC cells as normal controls. The primary and hTERT-immortalized cells may also be used to create 3D cell culture models to better represent an in vivo environment, ex vivo.

Browse the ATCC Primary Cells and hTERT Immortalized Cells to find physiological models relevant for your research needs.

Add new dimension to your research, read our application note Human Bronchial/Tracheal Epithelial Cells: Improving Functional Studies to find out how primary bronchial epithelial cells differentiate into mature airway tissue using a 3-D Air-Liquid Culture Interface model.


Read Full Post »


Multiple factors related to initial trial design may predict low patient accrual for cancer clinical trials

Reporter: Stephen J. Williams, Ph.D.

UPDATED 5/15/2019

A recently published paper in JCNI highlights results determining factors which may affect cancer trial patient accrual and the development of a predictive model of accrual issues based on those factors.

To hear a JCNI podcast on the paper click here

but below is a good posting from scienmag.com which describes their findings:

Factors predicting low patient accrual in cancer clinical trials

source: http://scienmag.com/factors-predicting-low-patient-accrual-in-cancer-clinical-trials/

Nearly one in four publicly sponsored cancer clinical trials fail to enroll enough participants to draw valid conclusions about treatments or techniques. Such trials represent a waste of scarce human and economic resources and contribute little to medical knowledge. Although many studies have investigated the perceived barriers to accrual from the patient or provider perspective, very few have taken a trial-level view and asked why certain trials are able to accrue patients faster than expected while others fail to attract even a fraction of the intended number of participants. According to a study published December 29 in the JNCI: Journal of the National Cancer Institute, a number of measurable trial characteristics are predictive of low patient accrual.

Caroline S. Bennette, M.P.H., Ph.D., of the Pharmaceutical Outcomes Research and Policy Program, University of Washington, Seattle, and colleagues from the University of Washington and the Fred Hutchinson Cancer Research Center analyzed information on 787 phase II/III clinical trials sponsored by the National Clinical Trials Network (NCTN; formerly the Cooperative Group Program) launched between 2000 and 2011. After excluding trials that closed because of toxicity or interim results, Bennette et al. found that 145 (18%) of NCTN trials closed with low accrual or were accruing at less than 50% of target accrual 3 years or more after opening.

The authors identified potential risk factors from the literature and interviews with clinical trial experts and found multiple trial-level factors that were associated with poor accrual to NCTN trials, such as increased competition for patients from currently ongoing trials, planning to enroll a higher proportion of the available patient population, and not evaluating a new investigational agent or targeted therapy. Bennette et al. then developed a multivariable prediction model of low accrual using 12 trial-level risk factors, which they reported had good agreement between predicted and observed risks of low accrual in a preliminary validation using 46 trials opened between 2012 and 2013.

The researchers conclude that “Systematically considering the overall influence of these factors could aid in the design and prioritization of future clinical trials…” and that this research provides a response to the recent directive from the Institute of Medicine to “improve selection, support, and completion of publicly funded cancer clinical trials.”

In an accompanying editorial, Derek Raghavan, M.D., Levine Cancer Institute, writes that the focus needs to be on getting more patients involved in trials, saying, “we should strive to improve trial enrollment, giving the associated potential for improved results. Whether the basis is incidental, because of case selection bias, or reflects the support available to trial patients has not been determined, but the fact remains that outcomes are better.”

###

Contact info:

Article: Caroline S. Bennette, M.P.H., Ph.D., cb11@u.washington.edu

Editorial: Derek Raghavan, M.D., derek.raghavan@carolinashealthcare.org

Other investigators also feel that initial trial design is of UTMOST importance for other reasons, especially in the era of “precision” or “personalized” medicine and why the “basket trial” or one size fits all trial strategy is not always feasible.

In Why the Cancer Research Paradigm Must Transition to “N-of-1” Approach

Dr. Maurie Markman, MD gives insight into why the inital setup of a trial and the multi-center basket type of  accrual can be a problematic factor in obtaining meaningful cohorts of patients with the correct mutational spectrum.

The anticancer clinical research paradigm has rapidly evolved so that subject selection is increasingly based on the presence or absence of a particular molecular biomarker in the individual patient’s malignancy. Even where eligibility does not mandate the presence of specific biological features, tumor samples are commonly collected and an attempt is subsequently made to relate a particular outcome (eg, complete or partial objective response rate; progression-free or overall survival) to the individual cancer’s molecular characteristics.

One important result of this effort has been the recognition that there are an increasing number of patient subsets within what was previously—and incorrectly—considered a much larger homogenous patient population; for example, non–small cell lung cancer (NSCLC) versus EGFR-mutation–positive NSCLC. And, while it may still be possible to conduct phase III randomized trials involving a relatively limited percentage of patients within a large malignant entity, extensive and quite expensive effort may be required to complete this task. For example, the industry-sponsored phase III trial comparing first-line crizotinib with chemotherapy (pemetrexed plus either carboplatin or cisplatin) in ALK-rearrangement–positive NSCLC, which constitutes 3% to 5% of NSCLCs, required an international multicenter effort lasting 2.5 years to accrue the required number of research subjects.1

But what if an investigator, research team, or biotech company desired to examine the clinical utility of an antineoplastic in a patient population representing an even smaller proportion of patients with NSCLC such as in the 1% of the patient population with ROS1 abnormalities,2 or in a larger percentage of patients representing 4%-6% of patients with a less common tumor type such as ovarian cancer? How realistic is it that such a randomized trial could ever be conducted?

Further, considering the resources required to initiate and successfully conduct a multicenter international phase III registration study, it is more than likely that in the near future only the largest pharmaceutical companies will be in a position to definitively test the clinical utility of an antineoplastic in a given clinical situation.

One proposal to begin to explore the benefits of targeted antineoplastics in the setting of specific molecular abnormalities has been to develop a socalled “basket trial” where patients with different types of cancers with varying treatment histories may be permitted entry, assuming a well-defined molecular target is present within their cancer. Of interest, several pharmaceutical companies have initiated such clinical research efforts.

Yet although basket trials represent an important research advance, they may not provide the answer to the molecular complexities of cancer that many investigators believe they will. The research establishment will have to take another step toward innovation to “N-of-1” designs that truly explore the unique nature of each individual’s cancer.

Trial Illustrates Weaknesses

A recent report of the results of one multicenter basket trial focused on thoracic cancers demonstrates both the strengths but also a major fundamental weakness of the basket trial approach.3

However, the investigators were forced to conclude that despite accrual of more than 600 patients onto a study conducted at two centers over a period of approximately 2 years, “this basket trial design was not feasible for many of the arms with rare mutations.”3

They concluded that they needed a larger number of participating institutions and the ability to adapt the design for different drugs and mutations. So the question to be asked is as follows: Is the basket-type approach the only alternative to evaluate the clinical relevance of a targeted antineoplastic in the presence of a specific molecular abnormality?

Of course, the correct answer to this question is surely: No!

– See more at: http://www.onclive.com/publications/Oncology-live/2015/July-2015/Why-the-Cancer-Research-Paradigm-Must-Transition-to-N-of-1-Approach#sthash.kLGwNzi3.dpuf

The following is a video on the website ClinicalTrials.gov which is a one-stop service called EveryClinicalTrial to easily register new clinical trials and streamline the process:


UPDATED 5/15/2019

Another possible roadblock to patient accrual has always been the fragmentation of information concerning the availability of clinical trails and coordinating access among the various trial centers, as well as performing analytics on trial data to direct new therapeutic directions.  The NIH has attempted to circumvent this problem with the cancer trials webpage trials.gov however going through the vast number of trials, patient accrual requirements, and finding contact information is a daunting task.  However certain clinical trial marketplaces are now being developed which may ease access problems to clinical trials as well as data analytic issues, as highlighted by the Scientist.com article below:

Scientist.com Launches Trial Insights, A Transformative Clinical Trials Data Analytics Solution

The world’s largest online marketplace rolls out first original service, empowering researchers with on demand insights into clinical trials to help drive therapeutic decisions

SAN DIEGO–(BUSINESS WIRE)–Scientist.com, the online marketplace for outsourced research, announced today the launch of Trial Insights, a digital reporting solution that simplifies data produced through clinical trial, biomarker and medical diagnostic studies into an intuitive and user-friendly dashboard. The first of its kind, Trial Insights curates publicly available data nightly from information hubs such as clinicaltrials.gov and customizes it to fit a researcher or research organization’s specific project needs.

Trial Insights, new clinical trial reporting solution, allows researchers to keep track of the evolving landscape of drugs, diseases, sponsors, investigators and medical devices important to their work.

Tweet this

“Trial Insights offers researchers an easy way to navigate the complexity of clinical trials information,” said Ron Ranauro, Founder of Incite Advisors. “Since Trial Insights’ content is digitally curated, researchers can continuously keep track of the evolving landscape of drugs, diseases, sponsors, investigators and medical devices important to their work.”

As the velocity, variety and veracity of data available on sites like clinicaltrials.gov continues to increase, the ability to curate it becomes more valuable to different audiences. With the advancement of personalized medicine, it is important to make the data accessible to the health care and patient communities. Information found on the Trial Insights platform can help guide decision making across the pharmaceutical, biotechnology and contract research organization industries as clinical trial data is a primary information source for competitive intelligence, research planning and clinical study planning.

“We are extremely excited to launch the first Scientist.com exclusive, original service offering to our clients in the life sciences,” said Mark Herbert, Scientist.com Chief Business Officer. “Our goal at Scientist.com is to help cure all diseases by 2050, and we believe solutions like Trial Insights, which greatly simplifies access to and reporting of clinical trial data, will get us one step closer to reaching that goal.”

source: https://www.businesswire.com/news/home/20190416005362/en/Scientist.com-Launches-Trial-Insights-Transformative-Clinical-Trials?utm_source=TrialIO+List


Other article on this Open Access Journal on Cancer Clinical Trial Design include:

Read Full Post »

Lung Cancer Therapy

Curator: Larry H. Bernstein, MD, FCAP


Lung Cancer Targets

http://www.oncotherapynetwork.com/lung-cancer-targets

The enzyme ephrin receptor A2 (EphA2) normally blocks KRAS mutation-driven lung adenocarcinoma tumorigenesis, but a new study shows that EphA2 deletion mutation allows aggressive tumor growth—providing “important therapeutic targets” for this deadly form of lung cancer.

Using shRNA-mediated screening of 4,700 candidate human genes with tumor suppression potential, the team subsequently identified 16 genes in animal models that inhibit or slow KRAS- or TP53-driven tumorigenesis. The loss of EphA2 enhanced KRASG12D-driven lung adenocarcinoma carcinogenesis, they found.1

“We identified several tumor suppressors, including EphA2, loss of which promotes adenocarcinoma in the context of KRASG12D mutation,” the coauthors reported.1EphA2 loss promotes cell proliferation by activating ERK MAP kinase signaling and hedgehog signaling pathways, leading to tumorigenesis.”

A KRAS mutation is associated with tumorigenesis in 300 days, in animal models, noted senior author Inder Verma, PhD, Professor of Genetics and the Salk Institute’s Irwin and Joan Jacobs Chair in Exemplary Life Science.

“But without EphA2, the KRAS mutation leads to tumors in half the time, 120 to 150 days,” Dr. Verma noted. “This molecule EphA2 is having a huge effect on restraining cancer growth when KRAS is mutated.”

Up to 20% of all cancers harbor KRAS mutations, and these aberrations are particularly common in lung and colon cancers. EphA2 gene mutations were found in 54 of 230 patients whose lung adenocarcinoma tumor genomes were sequenced in the Cancer Genome Atlas Project, the coauthors noted.

“Oddly, among human lung cancer patients with EPhA2 mutations, around 8% of patients actually have high EphA2 expression,” cautioned coauthor Yifeng Xia, PhD, also at the Salk Institute. “So, in some instances, EphA2 is not suppressing tumors and may be context-dependent. Therefore, we need to carefully evaluate the molecule’s function when designing new therapeutics.”

EphA2 activation suppresses both cell signaling and cell proliferation, the team noted.  “We believe that the enzyme might serve as a potential drug target in KRAS-dependent lung adenocarcinoma,” explained lead study author Narayana Yeddula, PhD, a Salk research associate.

Salk Institute for Biological Studies. (2015). Molecular “brake” stifles human lung cancer.


Molecular “brake” stifles human lung cancer  

By testing over 4,000 genes in human tumors, a Salk team uncovered an enzyme responsible for suppressing a common and deadly lung cancer


SMO Gene Amplification and Activation of the Hedgehog Pathway as Novel Mechanisms of Resistance to Anti-Epidermal Growth Factor Receptor Drugs in Human Lung Cancer

Carminia Maria Della Corte1Claudio Bellevicine2Giovanni Vicidomini3Donata Vitagliano1Umberto Malapelle2, et al.

Clin Cancer Res Oct 15, 2015; 21: 4686   http://dx.doi.org:/10.1158/1078-0432.CCR-14-3319   


Purpose: Resistance to tyrosine kinase inhibitors (TKI) of EGF receptor (EGFR) is often related to activation of other signaling pathways and evolution through a mesenchymal phenotype.

Experimental Design: Because the Hedgehog (Hh) pathway has emerged as an important mediator of epithelial-to-mesenchymal transition (EMT), we studied the activation of Hh signaling in models of EGFR-TKIs intrinsic or acquired resistance from both EGFR-mutated and wild-type (WT) non–small cell lung cancer (NSCLC) cell lines.

Results: Activation of the Hh pathway was found in both models of EGFR-mutated and EGFR-WT NSCLC cell line resistant to EGFR-TKIs. In EGFR-mutated HCC827-GR cells, we found SMO (the Hh receptor) gene amplification, MET activation, and the functional interaction of these two signaling pathways. In HCC827-GR cells, inhibition of SMO or downregulation of GLI1 (the most important Hh-induced transcription factor) expression in combination with MET inhibition exerted significant antitumor activity.

In EGFR-WT NSCLC cell lines resistant to EGFR inhibitors, the combined inhibition of SMO and EGFR exerted a strong antiproliferative activity with a complete inhibition of PI3K/Akt and MAPK phosphorylation. In addition, the inhibition of SMO by the use of LDE225 sensitizes EGFR-WT NSCLC cells to standard chemotherapy.

Conclusions:This result supports the role of the Hh pathway in mediating resistance to anti-EGFR-TKIs through the induction of EMT and suggests new opportunities to design new treatment strategies in lung cancer. Clin Cancer Res; 21(20); 4686–97. ©2015 AACR.

This article is featured in Highlights of This Issue, p. 4497

Translational Relevance

The amplification of SMO in non–small cell lung cancer (NSCLC) resistant to EGFR-TKIs opens new possibilities of treatment for those patients who failed first-line EGFR-targeted therapies. The synergistic interaction of the Hedgehog (Hh) and MET pathways further support the rationale for a combined therapy with specific inhibitors. In addition, Hh pathway activation is essential for the acquisition of mesenchymal properties and, as such, for the aggressiveness of the disease. Also, in EGFR wild-type NSCLC models, inhibition of Hh, along with inhibition of EGF receptor (EGFR), can revert the resistance to anti-EGFR targeted drugs. In addition, inhibition of the Hh pathway sensitizes EGFR wild-type NSCLC to standard chemotherapy. These data encourage further evaluation of Hh inhibitors as novel therapeutic agents to overcome tyrosine kinase inhibitor (TKI) resistance and to revert epithelial-to-mesenchymal transition (EMT) in NSCLC.

Tyrosine kinase inhibitors (TKI) against the EGF receptor (EGFR) represent the first example of molecularly targeted agents developed in the treatment of non–small cell lung cancer (NSCLC) and are, currently, useful treatments after failure of first-line chemotherapy and, more importantly, for the first-line treatment of patients whose tumors have EGFR-activating gene mutations (1). However, after an initial response, all patients experience disease progression as a result of resistance occurrence. Recognized mechanisms of acquired resistance to anti-EGFR-TKIs in EGFR-mutated NSCLC are METgene amplification or the acquisition of secondary mutations such as the substitution of a threonine with a methionine (T790M) in exon 20 of the EGFR gene itself (2). However, these molecular changes are able to identify only a portion of patients with cancer defined as “non-responders” to EGFR-targeted agents. A number of molecular abnormalities in cancer cells may partly contribute to resistance to anti-EGFR agents (2, 3). Our group and others have shown that epithelial-to-mesenchymal transition (EMT) is a critical event in the metastatic switch and is generally associated with resistance to molecularly targeted agents in NSCLC models (4, 5). EMT is a process characterized by loss of polarity and dramatic remodeling of cell cytoskeleton through loss of epithelial cell junction proteins, such as E-cadherin, and gain of mesenchymal markers, such as vimentin (6). The clinical relevance of EMT and drug insensitivity comes from studies showing an association between epithelial markers and sensitivity to erlotinib in NSCLC cell lines, suggesting that EMT-type cells are resistant to erlotinib (7). In particular, recent data suggest that cancer cells with EMT phenotype demonstrate stem cell–like features and strategies reverting EMT could enhance the therapeutic efficacy of EGFR inhibitors (4, 5).

The Hedgehog (Hh) signaling cascade has emerged as an important mediator of cancer development and metastatic progression. The Hh signaling pathway is composed of the ligands sonic, Indian, and desert hedgehog (Shh, Ihh, Dhh, respectively) and the cell surface molecules Patched (PTCH) and Smoothened (SMO). In the absence of Hh ligands, PTCH causes suppression of SMO; however, upon ligand binding to PTCH, SMO protein leads to activation of the transcription factor GLI1, which in turn translocates into the nucleus, leading to the expression of Hh induced genes (8). The Hh signaling pathway is normally active in human embryogenesis and in tissue repair, as well as in cancer stem cell renewal and survival. This pathway is critical for lung development and its aberrant reactivation has been implicated in cellular response to injury and cancer growth (9–11). Indeed, increased Hh signaling has been demonstrated in bronchial epithelial cells exposed to cigarette smoke extraction. In particular, the activation of this pathway happens at an early stage of carcinogenesis when cells acquire the ability to growth in soft agar and as tumors when xenografted in immunocompromised mice. Treatment with Hh inhibitors at this stage can cause complete regression of tumors (12). Overexpression of Hh signaling molecules has been demonstrated in NSCLC compared with adjacent normal lung parenchyma, suggesting an involvement in the pathogenesis of this tumor (13, 14).

Reactivation of the Hh pathway with induction of EMT has been implicated in the carcinogenesis of several cancer types (15). Inhibition of the Hh pathway can reverse EMT and is associated with enhanced tumor sensitivity to cytotoxic agents (16). Recently, upregulation of the Hh pathway has been demonstrated in the NSCLC cell line A549, concomitantly with the acquisition of a TGFβ1-induced EMT phenotype with increased cell motility and invasion (17).

The aim of the present work was to study the role of the Hh signaling pathway as mechanism of resistance to EGFR-TKIs in different models of NSCLC.


Activation of Hh signaling pathway in NSCLC cell lines with resistance to EGFR-TKIs

We established an in vitro model of acquired resistance to the EGFR-TKI gefitinib using the EGFR exon 19 deletion mutant (delE746-A750) HCC827 human NSCLC cell line by continuous culturing these cells in the presence of increasing doses of gefitinib. HCC827 cells, which were initially sensitive to gefitinib treatment (in vitro IC50 ∼ 80 nmol/L), became resistant (HCC827-GR cells) after 12 months of continuous treatment with IC50 > 20 μmol/L. This cell line was also cross-resistant to erlotinib and to the irreversible EGFR kinase inhibitor BIBW2992 (afatinib; data not shown). Sequencing of the EGFR gene in gefitinib-resistant HCC827-GR cells showed the absence of EGFRT790M mutation (data not shown). After the establishment of HCC827-GR cells, we characterized their resistant phenotype by protein expression analysis. While the activation of EGFR resulted efficiently inhibited by gefitinib treatment both in HCC827 and in HCC827-GR cells, phosphorylation of AKT and MAPK proteins persisted in HCC827-GR cells despite the inhibition of the upstream EGFR (Fig. 1A).

Figure 1.

Activation of Hh signaling pathway in NSCLC cell lines resistant to EGFR-TKIs. A, Western blot analysis of EGFR and of downstream signaling pathways in parental EGFR-mutated human lung adenocarcinoma HCC827 cells and in their gefitinib-resistant derivative (HCC827-GR). β-Actin was included as a loading control. B, Western blot analysis of Hh pathway, MET, and selected epithelial- and mesenchymal-related proteins in a panel of EGFR-TKI–sensitive (HCC827, H322, and Calu-3) and -resistant (HCC827-GR, H1299, Calu-3 ER, H460) NSCLC cell lines. β -Actin was included as a loading control. C, FISH analysis of gain in MET andSMO gene copy number in HCC827 and HCC827-GR. D, top, GLI-driven luciferase expression in HCC827 and HCC827-GR cells before and after depletion of GLI1 in both cell lines; bottom, evidence of GLI1 mRNA downregulation by siRNA. β-Actin was included as a loading control. E, MTT cell proliferation assays in HCC827-GR and PC9 cancer cell transfected with an empty vector or SMO expression plasmid with the indicated concentrations of gefitinib for 3 days. Bottom, Western blotting for evaluation of SMO after transfection.

HCC827-GR cells exhibited a mesenchymal phenotype with increased ability to invade, to migrate, and to grow in an anchorage-independent manner (Fig. 2A–C). Therefore, we next examined whether HCC827-GR cell line exhibits molecular changes known to occur during the EMT. Indeed, we found expression of vimentin and SLUG proteins and loss of E-cadherin protein expression in gefitinib-resistant cells as compared with gefitinib-sensitive cells (Fig. 1B). Although activation of the AXL kinase and NF-κB (20–22) have been described as known mechanisms of EGFR-TKI resistance, the analysis of their activation status resulted not significantly different among our cell lines. However, further studies are needed to explore a potential cooperation of AXL and NF-κB with Hh signaling.

Figure 2.

Activation of Hh signaling pathway mediates resistance to EGFR-TKIs in EGFR-dependent NSCLC cell lines. A, invasion assay. B, migration assay, C, anchorage-independent colony formation in soft agar. D, cell proliferation measured with the MTT assay in parental human lung adenocarcinoma HCC827 cells and in HCC827-GR derivative. The results are the average ± SD of 3 independent experiments, each done in triplicate.

Recently, expression of Shh and activation of the Hh pathway have been correlated to the TGFβ-induced EMT in A549 lung cancer cells (17). To investigate the expression profile of Hh signaling components in this in vitro model of acquired resistance to anti-EGFR–TKIs, we performed Western blot analysis for Shh, GLI1, 2, 3, SMO, and PTCH in HCC827-GR cells. While Shh levels did not differ between HCC827 and HCC827-GR cells, a significantly increased expression of SMO and GLI1 was found in HCC827-GR cells as compared with parental cells (Fig. 1B). No differences in the levels of GLI2 and 3 were observed (data not shown). Of interest, also PTCH protein levels resulted increased in HCC827-GR cells. This is of relevance, as PTCH is a target gene of GLI1 transcriptional activity and increased PTCH levels indicate activation of Hh signaling. We further analyzed expression and activation of MET, as a known mechanism of acquired resistance to anti-EGFR drugs in NSCLC. Indeed, MET phosphorylation resulted strongly activated in HCC827-GR cells (Fig. 1B). Analysis of the MET ligand levels, HGF, by ELISA assay, did not evidence any significant difference in conditioned media of our cells (data not shown). As previous studies have demonstrated MET gene amplification in NSCLC cell lines with acquired resistance to gefitinib (23), we evaluated MET gene copy number by FISH analysis and D-PCR in HCC827 and in HCC827-GR cell lines. The mean MET gene copy number was similar between gefitinib-sensitive and gefitinib-resistant HCC827 cell line (Fig. 1C).

Of interest, while we were working to these experiments, data on SMO gene amplification in EGFR-mutated NSCLC patients with acquired resistance to anti-EGFR targeted drugs were reported on rebiopsies performed at progression, revealing SMO amplification in 2 of 16 patients (12.5%; ref. 24). For this reason, we evaluated by FISH SMO gene copy number in HCC827-GR cells, in which the mean SMO gene copy number was 4-fold higher than that of parental HCC827 cells, indicating SMO gene amplification (Fig. 1C).

We further analyzed the expression and the activation of these molecules on a larger panel of EGFR-WT NSCLC cell lines, including NSCLC cells sensitive to EGFRTKIs, such as H322 and Calu-3 cells, NSCLC cell lines with intrinsic resistance to EGFR-TKIs, such as H1299 and H460 cells and Calu-3 ER (erlotinib-resistant) cells, which represents an in vitromodel of acquired resistance to erlotinib obtained from Calu-3 cells (refs. 4, 18; Supplementary Table S1). As shown in Fig. 1B, similarly to HCC827-GR cells, the Hh signaling pathway resulted in activation of these NSCLC models of intrinsic or acquired resistance to EGFR-TKI.

To further investigate the presence of specific mutations in the Hh pathway components, we sequenced DNA from our panel of NSCLC cell lines by Ion Torrent NGS; results indicated the absence of specific mutations in Hh-related genes (data not shown).

Because GLI1 is a transcription factor, we tested the functional significance of increased expression of this gene in the EGFR-sensitive and -resistant cell lines, using a GLI1-responsive promoter within a luciferase reporter expression vector (Fig. 1D). Analysis of luciferase activity of HCC827-GR cells revealed a 6- to 7-fold increase in GLI-responsive promoter activity as compared with HCC827 cells (P < 0.001), suggesting that transcriptional activity of GLI1 is significantly higher in gefitinib-resistant HCC827-GR cells. Furthermore, depletion of GLI1 protein expression by transfection with a GLI1-specific siRNA expression vector led to approximately 65% decrease in GLI1-driven promoter activity in HCC827-GR (P < 0.01; Fig. 1D). To determine whether SMO expression may promote resistance to gefitinib, 2 cell lines harboring the mutated EGFR gene, HCC827 and PC9 cells, and the sensitive EGFR-WT cell line Calu-3, were transiently transfected with an SMO expression plasmid. When treated with gefitinib, transfected cells exhibited a partial loss of sensitivity to the EGFR inhibition (Fig. 1E).

Activation of Hh signaling pathway mediates resistance to EGFR-TKIs in EGFR-dependent NSCLC cell lines

As previously mentioned, HCC827-GR cells acquired expression of vimentin and SLUG and loss of E-cadherin when compared with gefitinib-sensitive HCC827 cancer cells along with an increased ability to invade, migrate, and form colonies in semisolid medium (Fig. 2A–C). We next evaluated whether the Hh pathway activation was necessary for gefitinib acquired resistance by genetically or by pharmacologically inhibiting Hh components in the HCC827-GR cell line. Knockdown of GLI1 by a GLI1siRNA approach had a very little effect on HCC827-GR cells. However, when gefitinib treatment (1 μmol/L) was performed in HCC827-GR cells after GLI1 blockade, invasion, migration, and colony-forming capabilities were significantly inhibited (Fig. 2A–C). Next, we evaluated the effects of 2 small-molecule inhibitors of SMO, such as LDE225 and vismodegib. Treatment with LDE225 (1 μmol/L;Fig. 2A–D) or with vismodegib (1 μmol/L; data not shown) alone did not significantly affect the viability and the invasion and migration abilities of HCC827-GR cells. Combined treatment with gefitinib and LDE225 (1 μmol/L) or vismodegib (1 μmol/L) caused inhibition of these parameters in HCC827-GR cells (Fig. 2A–C).

Taken together, these data show that Hh activation is required for acquisition of gefitinib resistance in HCC827-GR cells.

As overexpression and activation of MET was found in HCC827-GR cells, we evaluated whether inhibition of MET phosphorylation by PHA-665752 could restore gefitinib sensitivity in this model. Although abrogation of MET signaling in combination with the inhibition of EGFR signaling marginally affected gefitinib sensitivity of HCC827-GR cells, surprisingly, inhibition of MET synergistically enhanced the effects of Hh inhibition in HCC827-GR cells (Fig. 2A–D) in terms of invasion, migration, colony-forming, and proliferation abilities, indicating a significant synergism between these 2 signaling pathways. The triple inhibition of EGFR, SMO, and MET did not result in any additional antiproliferative effects (data not shown).

Cooperation between Hh and MET signaling pathways in mediating resistance to EGFR-TKI in EGFR-dependent NSCLC cell lines

To study the role of Hh pathway in the regulation of key signaling mediators downstream of the EGFR and to explore the interaction between Hh and MET pathways, we further characterized the effects of Hh inhibition alone and in combination with EGFR or MET inhibitor on the intracellular signaling by Western blotting. As illustrated in Fig. 3A, treatment of HCC827-GR cells with the SMO inhibitor LDE225, gefitinib or with the MET inhibitor PHA-665772, for 72 hours, did not affect total MAPK and AKT protein levels and activation. A marked decrease of the activated form of both proteins was observed only when LDE225 was combined with PHA-665772, at greater level than inhibition of EGFR and MET, suggesting that the Hh pathway cooperates with MET to the activation of both MAPK and AKT signaling pathways. In addition, vimentin expression, induced during the acquisition of gefitinib resistance, was significantly decreased after Hh inhibition, suggesting that the Hh pathway represents a key mediator of EMT in this model. The combination of MET and Hh inhibitors strongly induced cleavage of the 113-kDa PARP to the 89-kDa fragment, indicating an enhanced programmed cell death.

Figure 3.

Cooperation between Hh and MET signaling pathways in mediating resistance to EGFR-TKIs in HCC827-GR cells. A, Western blot analysis of Hh, MET, and EGFR activation and their downstream pathways activation following treatment with the indicated concentration LDE225 and PHA-556752 on HCC827-GR NSCLC cell line. β-Actin was included as a loading control. B, co-immunoprecipitation for the interaction between MET and SMO. Whole-cell extracts from HCC827 and HCC827-GR cells untreated or treated with LDE225 or/and PHA556752 were immunoprecipitated (IP) with anti- SMO (top) or anti-MET (bottom). The immunoprecipitates were subjected to Western blot analysis (WB) with indicated antibodies. Control immunoprecipitation was done using control mouse preimmune serum (PS). C, GLI-driven luciferase expression in HCC827-GR cells during treatment with gefitinib, LDE225, PHA-556752, or their combinations. D, co-immunoprecipitation for the interaction between SUFU and GLI1. Whole-cell extracts from HCC827 and HCC827-GR cells untreated or treated with LDE225 or/and PHA556752 were immunoprecipitated (IP) with anti-GLI1 (top) or anti-SUFU (bottom) antibodies. The immunoprecipitates were subjected to Western blot analysis with indicated antibodies. Control immunoprecipitation was done using control mouse PS.

Of interest, the inhibition of SMO by LDE225 also reduced the activated, phosphorylated form of MET (Fig. 3A), revealing an interaction between SMO and MET receptors. To address this issue, we hypothesized a direct interplay between both receptors. SMO immunoprecipitates from HCC827-GR cells showed greater MET binding than that from the parental HCC827 cells (Fig. 3B). As MET has been demonstrated to interact with HER3 to mediate resistance to EGFR inhibitors (25), we explored the expression of HER3 in SMO immunoprecipitates. Protein expression analysis did not show any association with HER3; similar results were obtained with EGFR protein expression analysis in the immunoprecipitates (data not shown).

The increased SMO/MET heterodimerization observed in HCC827-GR cells was partially reduced by the inhibition of SMO or MET with LDE225 or PHA-665752, respectively, and to a greater extent with the combined treatment (Fig. 3B). These results support the hypothesis that Hh and MET pathways interplay at level of their receptors.

To study whether the cooperation between these 2 pathways appears also at a downstream level, and considering that, as shown in Fig. 3A, MET inhibition partially reduces the levels of GLI1 and PTCH proteins, we analyzed luciferase expression of GLI1 reporter vector in HCC827-GR cells after treatment with LDE225, PHA-665752, or both. As shown in Fig. 3C, transcriptional activity of GLI1 resulted strongly decreased by the combined treatment. In particular, treatment with single-agent LDE225 did not abrogate the transcriptional activity of GLI1 suggesting a GLI1 noncanonical activation. In addition, single-agent PHA-665752 reduced GLI1-dependent signal, suggesting a role for MET in GLI1 regulation. To better investigate these findings, we hypothesized that MET can regulate GLI1 activity through its nuclear translocation. We, therefore, analyzed the binding ability of SUFU, a known cytoplasmic negative regulator of GLI1, following treatment of HCC827-GR cells with LDE225 and/or PHA-665752. Indeed, interaction between SUFU and GLI1 was markedly decreased in HCC827-GR cells as compared with HCC827 cells (Fig. 3D), which further confirmed the role of the activation of Hh pathway in this gefitinib-resistant NSCLC model. Furthermore, while combined treatment with LDE225 and PHA-665752 strongly increased the binding between GLI1 and SUFU, suggesting an inhibitory effect on GLI1 activity, also treatment with the MET inhibitor PHA-665752 alone favored the interaction of GLI1 with SUFU (Fig. 3D), indicating a role of MET on the activation of GLI1. This phenomenon could be a consequence of the decreased interplay between SMO and MET receptors or the effect of a direct regulation of GLI1 by MET.

Effects of the combined treatment with LDE225 and gefitinib or PHA-665752 on HCC827-GR tumor xenografts

We finally investigated the in vivo antitumor activity of Hh inhibition by LDE225, alone and in combination with gefitinib or with the MET inhibitor in nude mice bearing HCC827-GR cells. Treatment with gefitinib, as single agent, did not cause any change in tumor size as compared with control untreated mice, confirming that the in vitro model of gefitinib resistance is valid also in vivo. Treatment with LDE225 or with PHA-665752 as single agents caused a decrease in tumor size even stronger than that observed in vitro, suggesting a major role of these drugs on tumor microenvironment. However, combined treatments, such as LDE225 plus gefitinib or LDE225 plus PHA-665752, significantly suppressed HCC827-GR tumor growth with a major activity of LDE225 plus PHA-665752 combination. Indeed at 21 days from the starting of treatment, the mean tumor volumes in mice bearing HCC827-GR tumor xenografts and treated with LDE225 plus gefitinib or with LDE225 plus PHA-665752 were 24% and 2%, respectively, as compared with control untreated mice (Fig. 4A). Figure 4B shows changes in tumor size from baseline in the 6 groups of treatment. A total of eight mice for each treatment group were considered. Combined treatment of LDE225 plus gefitinib caused objective responses in 5 of 8 mice (62.5%). Of interest, the most active treatment combination was LDE225 plus PHA-665752 with complete responses in 8 of 8 mice (100%).

Figure 4.

Effects of the combined treatment with LDE225 and gefitinib or PHA-665752 on HCC827-GR tumor xenografts. A, athymic nude mice were injected subcutaneously into the dorsal flank with 107 HCC827-GR cancer cells. After 7 to 10 days (average tumor size, 75 mm3), mice were treated as indicated in Materials and Methods for 3 weeks. HCC827-GR xenografted mice received only vehicle (control group), gefitinib (100 mg/kg daily orally by gavage), LDE225 (20 mg/kg intraperitoneally three times a week), PHA-665752 (25 mg/kg intraperitoneally twice a week), or their combination. Data represent the average (±SD). The Student t test was used to compare tumor sizes among different treatment groups at day 21 following the start of treatment. B, waterfall plot representing the change in tumor size from baseline in the 6 groups of treatment. A total of 8 mice for each treatment group were evaluated. C, effects of combined LDE225 and PHA-665752 on expression of MET, PTCH, and vimentin. Tissues were stained with hematoxylin and eosin (H&E). Representative section from each condition.

We then studied the effects of gefitinib, LDE225, PHA-665752, and their combinations on the expression of PTCH, MET, and vimentin in tumor xenografts biopsies from mice of each group of treatment (Fig. 4C and Supplementary Table S2). We measured PTCH expression, as it represents a direct marker of Hh activation. While vimentin staining was particularly intense in control and gefitinib-treated tumors, treatment with LDE225 alone and in combination with PHA-665752 significantly reduced the intensity of the staining further confirming the role of Hh inhibition on the reversal of mesenchymal phenotype. Of interest, MET immunostaining resulted in a consistent nuclear positivity: this particular localization has been described as a marker of poor outcome and tendency to a mesenchymal phenotype (26). Although the combination of LDE225 and gefitinib resulted in a significant reduction of tumor growth with a concomitant reduction in staining intensity of vimentin, the combination of LDE225 and PHA-665752 was the most effective treatment, with 8 of 8 (100%) mice having a complete response in their tumors. In fact, histologic evaluations of these tumors found only fibrosis and no viable cancer cells. According to Western blot analysis of protein extracts harvested from the HCC827-GR xenograft tumors, the levels of phospho-EGFR, phospho-MET, and GLI1 resulted in a decrease after treatment with the respective inhibitor. Interestingly, the combined treatment with LDE225 and PHA-665752 resulted in a stronger inhibition of phospho-MAPK and phospho-AKT (Supplementary Fig. S1).

Role of the Hh pathway in mediating resistance to EGFR inhibitors in EGFR-WT NSCLC

As shown in Fig. 1B, although H1299, H460, and Calu-3 ER lacked SMO amplification (data not shown), these cells displayed Hh pathway activation. We further conducted luciferase expression analysis that showed a 8- to 9-fold increase in GLI1-dependent promoter activity in these lines as compared with EGFR inhibitor–sensitive H322 and Calu-3 cells, suggesting that transcriptional activity of GLI1 is higher in EGFR-TKI–resistant EGFR-WT NSCLC lines (Supplementary Fig. S2A). Similar to HCC827-GR cells, these cells showed also activation of MET. However, as reported in previous studies (4), MET inhibition alone or in combination with EGFR inhibition or with SMO inhibition resulted ineffective in inhibiting cancer cell proliferation and survival (data not shown).

We therefore tested the effects of Hh inhibition, by silencing GLI1 or by using LDE225, alone and/or in combination with erlotinib. Although knockdown of GLI1 or treatment with LDE225 (1 μmol/L) did not significantly affect NSCLC cell viability, combined treatment with erlotinib restored sensitivity to erlotinib (Supplementary Fig. S2B).

In addition, H1299, Calu-3 ER, and H460 cells exhibited significantly higher invasive and migratory abilities than H322 and Calu-3 cells and inhibition of Hh pathway significantly reduced these abilities. Collectively, these results suggest that Hh pathway activation mediates the acquisition of mesenchymal properties in EGFR-WT lung adenocarcinoma cells with erlotinib resistance (Supplementary Fig. S2B–S2D).

We next evaluated the effects of LDE225 alone and/or in combination with erlotinib on the activation of downstream pathways. Erlotinib treatment result was unable to decrease the phosphorylation levels of AKT and MAPK in H1299 and Calu-3 ER cells (Fig. 5A). However, when LDE225 was combined with erlotinib, a strong inhibition of AKT and MAPK activation was observed in these EGFR inhibitor–resistant cells (Fig. 5A). Furthermore, flow cytometric analysis revealed that combined treatment with both erlotinib and LDE225 significantly enhanced the apoptotic cell percentage to 65% and 70% (P < 0.001) in H1299 and Calu-3 ER cells, respectively (Fig. 5B), confirmed by the induction of PARP cleavage after the combined treatment (Fig. 5A). These findings suggest that Hh pathway drives proliferation and survival signals in NSCLC cells in which EGFR is blocked by erlotinib, and only the inhibition of both pathways can induce strong antiproliferative and proapoptotic effects. The in vitro synergism between EGFR and SMO was confirmed alsoin vivo. Combination of erlotinib and LDE225 significantly suppressed growth of Calu-3 ER xenografted tumors in nude mice (Supplementary Fig. S1F).

Figure 5.

Activation of Hh signaling pathway mediates resistance to EGFR-TKI in EGFR-WT NSCLC cell lines. A, Western blot analysis of EGFR and its downstream pathways activation, including PARP cleaved form, following treatment with the indicated concentration LDE225 and erlotinib on Calu-3, Calu-3 ER, and H1299 NSCLC cell line. β-Actin was included as a loading control. B, apoptosis was evaluated as described in Supplementary Materials and Methods with annexin V staining in Calu-3, Calu-3-GR, and H1299 cancer cells, which were treated with the indicated concentration LDE225 and erlotinib. Columns, mean of 3 identical wells of a single representative experiment; bars, top 95% confidence interval; ***, P < 0.001 for comparisons between cells treated with drug combination and cells treated with single agent.

Hh pathway inhibition sensitizes EGFR-WT NSCLC cell lines to standard chemotherapy

To extend our preclinical observations, we further investigated the effects of Hh pathway inhibition on sensitivity of EGFR-WT NSCLC cells to standard chemotherapy used in this setting and mostly represented by cisplatin.

To investigate the role of the Hh pathway in mediating resistance also to chemotherapy, we evaluated the efficacy of cisplatin and Hh inhibition treatment alone or in combination on the colony-forming ability in semisolid medium of H1299 and H460 cell lines (Fig. 6). Treatment with cisplatin alone resulted in a dose-dependent inhibition of colony formation with an IC50 value of 13 and 11 μmol/L for H1299 and H460 cells, respectively. However, when combined with LDE225, the treatment resulted in a significant synergistic antiproliferative effect in both NSCLC cell lines (Fig. 6). Together, these results indicate that treatment of EGFR-WT NSCLC cells with Hh inhibitors could improve sensitivity of NSCLCs to standard chemotherapy.

Figure 6.

Hh pathway inhibition sensitizes EGFR-WT NSCLC cell lines to standard chemotherapy. Anchorage-independent colony formation in soft agar in human lung adenocarcinoma H1299 and H460. The results are the average ± SD of 3 independent experiments, each done in triplicate. For defining the effect of the combined drug treatments, any potentiation was estimated by multiplying the percentage of cells remaining by each individual agent. The synergistic index was calculated as previously described (19). In the following equations, A and B are the effects of each individual agent and AB is the effect of the combination. Subadditivity was defined as %AB/(%A%B) < 0.9; additivity was defined as %AB/(%A%B) = 0.9–1.0; and supra-additivity was defined as %AB/(%A%B) > 1.0.

Discussion

Resistance to currently available anticancer drugs represents a major clinical challenge for the treatment of patients with advanced NSCLC. Our previous works (4, 18) reported that whereas EGFR-TKI–sensitive NSCLC cell lines express the well-established epithelial markers, cancer cell lines with intrinsic or acquired resistance to anti-EGFR drugs express mesenchymal characteristics, including the expression of vimentin and a fibroblastic scattered morphology. This transition plays a critical role in tumor invasion, metastatic dissemination, and the acquisition of resistance to therapies such as EGFR inhibitors. Among the various molecular pathways, the Hh signaling cascade has emerged as an important mediator of cancer development and progression (8). The Hh signaling pathway is active in human embryogenesis and tissue repair in cancer stem cell renewal and survival and is critical for lung development. Its aberrant reactivation has been implicated in cellular response to injury and cancer growth (9–11). Indeed, increased Hh signaling has been demonstrated by cigarette smoke extraction exposure in bronchial epithelial cells (12). In particular, the activation of this pathway correlated with the ability to growth in soft agar and in mice as xenograft and treatment with Hh inhibitors showed regression of tumors at this stage (12). Overexpression of Hh signaling molecules has been demonstrated in NSCLC compared with adjacent normal lung parenchyma, suggesting an involvement in the pathogenesis of this tumor (13, 14).

Recently, alterations of the SMO gene (mutation, amplification, mRNA overexpression) were found in 12.2% of tumors of The Cancer Genome Atlas (TCGA) lung adenocarcinomas by whole-exome sequencing (27). The incidence of SMO mutations was 2.6% and SMO gene amplifications were found in 5% of cases. SMO mutations and amplification strongly correlated with SHH gene dysregulation (P < 0.0001). In a small case report series, 3 patients with NSCLC with Hh pathway activation had been treated with the SMO inhibitor LDE225 with a significant reduction in tumor burden, suggesting that Hh pathway alterations occur in NSCLC and could be an actionable and valuable therapeutic target (27). Recently, upregulation of Shh, both at the mRNA and at the protein levels, was demonstrated in the A549 NSCLC cell line, concomitantly with the acquisition of a TGFβ1-induced EMT phenotype (17, 28, 29) and mediated increased cell motility, invasion, and tumor cell aggressiveness (30, 31).

In the present study, SMO gene amplification has been identified for the first time as a novel mechanism of acquired resistance to EGFR-TKI in EGFR-mutant HCC827-GR NSCLC cells. These data are in agreement with the results of a cohort of patients with EGFR-mutant NSCLC that were treated with EGFR-TKIs (24). Giannikopoulus and colleagues have demonstrated the presence of SMO gene amplification in tumor biopsies taken at occurrence of resistance to EGFR-TKIs in 2 of 16 patients (24). In both cases, theMET gene was also amplified. In this respect, although the MET gene was not amplified in HCC827-GR cells, we found a significant functional and structural interaction between MET and Hh pathways in these cells. In fact, the combined inhibition of both SMO and MET exerted a significant antiproliferative and proapoptotic effect in this model, demonstrated by tumor regressions with complete response in 100% of HCC827-GR tumors xenografted in nude mice.

Several MET inhibitors have been evaluated in phase II/III clinical studies in patients with NSCLC, with controversial results. Most probably, blocking MET receptor alone is not enough to revert the resistant phenotype, as it is implicated in several intracellular interactions, and the best way to overcome resistance to anti-EGFR-TKIs is a combined approach, with Hh pathway inhibitors.

In the context of EMT, Zhang and colleagues demonstrated that AXL activation drives resistance in erlotinib-resistant subclones derived from HCC827, independently from MET activation in the same subclone, and that its inhibition is sufficient to restore erlotinib sensitivity by inhibiting downstream signal MAPK, AKT, and NF-κB (21). In addition, Bivona and colleagues described in 3 HCC827 erlotinib-resistant subclones increased RELA phosphorylation, a marker of NF-κB activation, in the absence of MET upregulation, and demonstrated that NF-κB inhibition enhanced erlotinib sensitivity, independently from AKT or MAPK inhibition (22). Differently, we detected Hh and MET hyperactivation in our resistance model HCC827-GR without a clear increase in AXL and NF-κB activation.

Although the level of activation of AXL and NF-κB did not result in contribution to resistance in our model, further studies are needed to explore a potential cooperation of AXL and NF-κB with Hh signaling.

In a preclinical model, the evolution of resistance can depend strictly from the selective activation of specific pathways, whereas different mechanisms can occur simultaneously in patients with NSCLC, due to tumor heterogeneity. Thus, all data regarding EFGFR-TKIs resistance have to be considered equally valid.

We further extended the evaluation of the Hh pathway to NSCLC cell lines harboring the wild-type EGFR gene and demonstrated that Hh is selectively activated in NSCLC cells with intrinsic or acquired resistance to EGFR inhibition and occurred in the context of EMT.

To further validate these data, we blocked SMO or downregulated GLI1 RNA expression in NSCLC cells that had undergone EMT, and this resulted in resensitization of NSCLC cells to erlotinib and loss of vimentin expression, indicating an mesenchymal-to-epithelial transition promoted by the combined inhibition of EGFR and Hh. Inhibition of the Hh pathway alone was not sufficient to reverse drug resistance but required concomitant EGFR inhibition to block AKT and MAPK activation and to restore apoptosis, indicating that the prosurvival PI3K/AKT pathway and the mitogenic RAS/RAF/MEK/MAPK pathways likely represent the level of interaction of EGFR and Hh signals.

In EGFR-WT NSCLC models, the role of MET amplification/activation is less clear, and in our experience, its inhibition did not increase the antitumor activity of SMO inhibitors.

In addition, Hh inhibition contributed to increase the response to cisplatin treatment which is the standard chemotherapeutic option used in EGFR-WT NSCLC patients and in EGFR-mutated patients after progression on first-line EGFR-TKI, thus representing a valid contribution to achieve a better disease control in those patients without oncogenic activation or after progression on molecularly targeted agents.

Collectively, the results of the present study provide experimental evidence that activation of the Hh pathway, through SMO amplification, is a potential novel mechanism of acquired resistance in EGFR-mutated NSCLC patients that occurs concomitantly with MET activation, and the combined inhibition of these 2 pathways exerts a significant antitumor activity. In light of these results, screening of SMO alteration is strongly recommended in EGFR-mutated NSCLC patients with acquired resistance to EGFR-TKIs at first progression.


Early-stage lung cancer patients considered to be high risk for surgery can achieve good clinical outcomes with surgical resection, according to a new study.

Pembrolizumab, a PD-1 inhibitor, demonstrated better overall survival and progression-free survival vs docetaxel in non–small-cell lung cancer patients.

A study looking at trends from 1985 to 2005 found that overall survival has increased in Medicare patients with small-cell lung cancer, and that treatment with chemotherapy is associated with improved survival.

Patients with ALK-rearranged non–small-cell lung cancer and brain metastases survive longer when treated with radiotherapy and tyrosine kinase inhibitors.

– See more at: http://www.cancernetwork.com/lung-cancer


Pembrolizumab Offers Survival Benefit in NSCLC

http://www.cancernetwork.com/lung-cancer/pembrolizumab-offers-survival-benefit-nsclc

The maker of pembrolizumab, a programmed death 1 (PD-1) inhibitor (Keytruda; Merck), announced phase II/III trial results showing that the drug resulted in better overall survival (OS) and progression-free survival (PFS) compared with docetaxel in patients with non–small-cell lung cancer (NSCLC). The study included only patients who had failed prior systemic therapy and whose tumors expressed programmed death ligand 1 (PD-L1). – See more at: http://www.cancernetwork.com/lung-cancer/pembrolizumab-offers-survival-benefit-nsclc#sthash.NUIqYKmi.dpuf

“The results from this trial provide part of a growing body of evidence supporting the potential of Keytruda in the treatment of NSCLC,” said Merck’s president, Roger M. Perlmutter, MD, PhD, in a press release.

The KEYNOTE-010 trial results have not yet been presented or published. The study compared two doses of pembrolizumab (2 mg/kg and 10 mg/kg) with docetaxel in 1,034 patients. All had progressed following treatment with platinum-containing systemic therapy, and all had tumors expressing PD-L1.

According to Merck’s release, pembrolizumab was associated with longer OS, in both the 2-mg/kg and 10-mg/kg dose groups, compared with docetaxel. This survival benefit was seen both in a subgroup of patients with PD-L1 expression tumor proportion scores of 50% or higher, as well as in all enrolled patients (all had a score of 1% or higher).

Both doses also resulted in longer PFS vs docetaxel in the 50% or higher group; this was not statistically significant in the full cohort of patients.

Pembrolizumab received an accelerated approval from the US Food and Drug Administration (FDA) in early October (at the 2-mg/kg dose level). The FDA noted in a press release that the most common side effects in a safety cohort of 550 patients included fatigue, dyspnea, and decreased appetite.

Earlier this year, results of a phase I study of pembrolizumab yielded promising survival outcomes. The median OS in that cohort of 495 patients was 12.0 months, and there was an overall response rate to the drug of 19.4%; this was higher in patients who had not received any previous treatment.

Pembrolizumab is not the first immunotherapy agent approved for the treatment of NSCLC. The FDA granted approval to nivolumab (Opdivo; Bristol-Myers Squibb) for the treatment of metastatic squamous NSCLC in March, and the indication was expanded to advanced non-squamous NSCLC in October.

– See more at: http://www.cancernetwork.com/lung-cancer/pembrolizumab-offers-survival-benefit-nsclc#sthash.NUIqYKmi.dpuf

Read Full Post »

Pathology Insights

Larry H Bernstein, MD, FCAP, Curator

LPBI


Predicting the Prognosis of Lung Cancer: The Evolution of Tumor, Node and Metastasis in the Molecular Age—Challenges and Opportunities

Ramón Rami-Porta; Hisao Asamura; Peter Goldstraw

Transl Lung Cancer Res. 2015;4(4):415-423.

http://www.medscape.com/viewarticle/852315


The tumor, node and metastasis (TNM) classification of malignant tumors was proposed by Pierre Denoit in the mid-20th century to code the anatomic extent of tumors. Soon after, it was accepted by the Union for International Cancer Control and by the American Joint Committee on Cancer, and published in their respective staging manuals. Till 2002, the revisions of the TNM classification were based on the analyses of a database that included over 5,000 patients, and that was managed by Clifton Mountain. These patients originated from North America and almost all of them had undergone surgical treatment. To overcome these limitations, the International Association for the Study of Lung Cancer proposed the creation of an international database of lung cancer patients treated with a wider range of therapeutic modalities. The changes introduced in the 7th edition of the TNM classification of lung cancer, published in 2009, derived from the analysis of an international retrospective database of 81,495 patients. The revisions for the 8th edition, to be published in 2016, will be based on a new retrospective and prospective international database of 77,156 patients, and will mainly concern tumor size, extrathoracic metastatic disease, and stage grouping. These revisions will improve our capacity to indicate prognosis and will make the TNM classification more robust. In the future the TNM classification will be combined with non-anatomic parameters to define prognostic groups to further refine personalized prognosis.

Introduction

Obvious as it may seem, it is important that the readers of this article keep in mind that the tumor, node and metastasis (TNM) classification of lung cancer is no more and no less than a system to code the anatomic extent of the disease. Therefore, by definition, the TNM classification does not include other elements that, while they can help improve our capacity to prognosticate the disease for a given patient, are unrelated to the anatomy of the tumor, i.e., parameters from blood analysis, tumor markers, genetic signatures, comorbidity index, environmental factors, etc. Prognostic indexes combining the TNM classification and other non-anatomic parameters are called, by consensus between the Union for International Cancer Control (UICC) and the American Joint Committee on Cancer (AJCC), prognostic groups to differentiate them from the anatomic stage groupings.

The TNM classification of lung cancer is applied to all histopathological subtypes of non-small cell carcinoma, to small cell carcinoma and to typical and atypical carcinoids. It is governed by general rules[1–3] (Table 1) that apply to all malignancies classified with this system, and by site-specific rules applicable to lung cancer exclusively.[4] There also are recommendations and requirements issued with the objective to classify tumors in a uniform way when their particular characteristics do not fit in the basic rules.[4]

The three components of the classification have several categories that are defined by different descriptors. For lung cancer, those for the T component are based on tumor size, tumor location and involved structures; those for the N, on the absence, presence and location of lymph node metastasis; and those for the M, on the absence, presence and location of distant metastasis. There are optional descriptors that add information on the local aggressiveness of the tumor (differentiation grade, perineural invasion, vascular invasion and lymphatic permeation) all of which have prognostic relevance;[5–8] assess the intensity of the investigation to determine the stage (certainty factor); and assess the residual tumor after therapy (residual tumor).

The TNM classification was developed by Pierre Denoit in a series of articles published from 1943 to 1952. It was soon adopted by the UICC that published brochures covering several anatomical sites, the lung being included in 1966. Two years later, the UICC published the first edition of the TNM Classification of Malignant Tumors and agreements were reached with the AJCC, created in 1959 as the American Joint Committee for Cancer Staging and End Results Reporting, to consult each other to avoid publication of differing classifications. Since then, the UICC and the AJCC have been responsible for updating and revising the TNM classifications of malignant tumors with the participation of national TNM committees of several countries and taking into account the published reports on the topic. The second to sixth editions of the UICC manual on the TNM Classification of Malignant Tumors and the first to sixth editions of the AJCC Staging Manual included classifications for lung cancer that had been informed by a progressively enlarging database initially collected by Mountain, Carr and Anderson, and subsequently managed by Mountain. Their database originally contained a little over 2,000 patients, but it had grown to more than 5,000 by the time the fifth edition of the TNM classification for lung cancer was published in 1997. The sixth edition was published in 2002 with no modifications.[9]

While the fifth edition of the classification was being printed, the International Workshop on Intrathoracic Staging took place in London, United Kingdom, in October 1996, sponsored by the International Association for the Study of Lung Cancer (IASLC).[10] At that meeting, in the presence of Dr. Mountain, the limitations of the database that had been used to revise the TNM classification for lung cancer were openly discussed. In essence, it was considered that, while the database consisted of a relatively large number of patients, all of them originated from the United States of America, and, therefore, the staging system could not really be called ‘international’, as it was called at that time; and, although all tumors had clinical and pathological classifications, the majority had been treated surgically. So, the database was thought not to be representative of the international community, as there were no patients from other countries; or of the current clinical practice, as there were no patients treated with other therapies. Therefore, an agreement was reached to issue a worldwide call to build a really international database of lung cancer patients treated by all therapeutic modalities. This required the constitution of an International Staging Committee that was approved and given a small amount of funding, to pump-prime, by the IASLC Board in 1998. Subsequently substantial financial support was secured by an unrestricted grant from Eli-Lilly. Cancer Research And Biostatistics (CRAB), a not-for-profit biosciences statistical center in Seattle, was appointed to collect, manage and analyze the new database. The proprietors and managers of known databases were subsequently summoned to attend a series of preparatory meetings to identify potential contributors to the IASLC international database for the purpose of revising the TNM classification of lung cancer.

The Future of the TNM Classification

The TNM classification of lung cancer is the most consistent and solid prognosticator of the disease, but it does not explain the whole prognosis because prognosis is multifactorial. In addition to the anatomic extent of the tumor, patient and environmental factors also count. Prognosis also is dynamic, as it may be different at the time of diagnosis, after treatment or at recurrence.[71] In the TNM classification, tumor resection plays an important role as it defines pathological staging and may modify the prognostic assessment based on clinical staging. Other than that, the TNM classification does not include blood analyses, tumor markers, genetic characteristic of the tumor or environmental factors that may account for the differences in survival among similar tumors in different geographic areas.

In order to make progress to indicate a more personalized prognosis, instead of a prognosis based on cohorts of patients with tumors of similar anatomic extent, the IASLC Staging and Prognosis Factors Committee decided to expand its activities to the study of non-anatomic prognostic factors. Therefore, in the third phase of the IASLC Lung Cancer Staging Project, the activities of the committee will be directed to further refine the TNM classification and to find available factors that can be combined with tumor staging to define prognostic groups. To some extent, this already was done with the analyses of the database used for the 7th edition. Prognostic groups with statistically significant differences were defined by combining anatomic tumor extent and very simple clinical variables, such as performance status, gender, and age. These prognostic groups were defined for clinically and pathologically staged tumors, and for small-cell and non-small cell lung cancers.[22,23]

The database used for the 8th edition includes several non-anatomical elements related to the patient, the tumor and the environment that may help refine prognosis at clinical and pathological staging.[69]Due to the limitations of the previous databases, future revisions of the TNM classification will need to be more balanced in terms of therapeutic modalities, and better populated with patients from underrepresented geographical areas, such as Africa, India, Indonesia, North, Central and South America, and South East Asia. The data contributed in the future will have to be complete regarding the TNM descriptors, and preferably prospective. The more robust the TNM, the more important its contribution to the prognostic groups.

To achieve all of the above, international collaboration is essential. Those interested in participating in this project should send an email expressing their interest to information@crab.org, stating ‘IASLC staging project’ in the subject of the email. The IASLC Staging and Prognostic Factors Committee has been very touched by the overwhelming generosity of colleagues around the world who have contributed cases to inform the 7th and the 8th editions of the TNM classification of lung cancer. We continue to count on their collaboration to further revise future editions and to define prognostic groups that will eventually allow a more personalized indication of prognosis.

MicroRNAs in the Pathobiology of Sarcomas

Anne E Sarver; Subbaya Subramanian

Lab Invest. 2015;95(9):987-984

http://www.medscape.com/viewarticle/852145


Sarcomas are a rare and heterogeneous group of tumors. The last decade has witnessed extensive efforts to understand the pathobiology of many aggressive sarcoma types. In parallel, we have also begun to unravel the complex gene regulation processes mediated by microRNAs (miRNAs) in sarcomas and other cancers, discovering that microRNAs have critical roles in the majority of both oncogenic and tumor suppressor signaling networks. Expression profiles and a greater understanding of the biologic roles of microRNAs and other noncoding RNAs have considerably expanded our current knowledge and provided key pathobiological insights into many sarcomas, and helped identify novel therapeutic targets. The limited number of sarcoma patients in each sarcoma type and their heterogeneity pose distinct challenges in translating this knowledge into the clinic. It will be critical to prioritize these novel targets and choose those that have a broad applicability. A small group of microRNAs have conserved roles across many types of sarcomas and other cancers. Therapies that target these key microRNA-gene signaling and regulatory networks, in combination with standard of care treatment, may be the pivotal component in significantly improving treatment outcomes in patients with sarcoma or other cancers.

Sarcomas are a heterogenous group of tumors that account for ~200 000 cancers worldwide each year (~1% of all human malignant tumors); however, they represent a disproportionately high 15% of all pediatric malignant tumors.[1,2] Sarcomas comprise over 50 subtypes that can broadly be classified into bone and soft-tissue sarcomas that are generally based on the cell and/or tissue type.[3] The vast majority of sarcomas fall into the soft-tissue group, primarily affecting connective tissues such as muscle (smooth and skeletal), fat, and blood vessels. Bone sarcomas are relatively rare, representing only ~20% of all diagnosed sarcomas (~0.2% of all cancers). Even within a specific subtype, sarcomas are highly heterogenous making them diagnostically and therapeutically challenging. Several sarcoma types are genetically characterized by chromosomal translocations or DNA copy number alterations, both of which are used as diagnostic markers.[2,4,5]

The four main types of bone sarcomas are defined by their histology, cell of origin (when known), clinical features, and site distribution—osteosarcoma, Ewing’s sarcoma, chondrosarcoma, and chordoma. The most common primary bone malignancy, osteosarcoma, predominantly affects children and young adults and is characterized by undifferentiated bone-forming proliferating cells.[6] Ewing’s sarcoma, another aggressive pediatric malignancy, usually arises in growing bone and is genetically characterized by a fusion of EWS–FLI1 oncoproteins that act as gain-of-function transcriptional regulators.[7] Chondrosarcoma is itself a heterogenous group of malignant bone tumors arising from the malignant transformation of cartilage-producing cells, frequently with mutations in IDH1/2 and COL2A1.[8,9] Chordoma is an aggressive, locally invasive cancer that typically arises from bones in the base of the skull and along the spine. It is characterized, in part, by its abnormal expression of transcription factor T, which is normally only expressed during embryonic development or in the testes.[10]

Soft-tissue sarcomas are also primarily defined by their histology, cell of origin, and, in some cases, by characteristic genetic translocation events. Rhabdomyosarcoma is a malignant skeletal-muscle derived tumor comprised of two main histological subtypes, embryonal and alveolar, is one of the most common childhood soft-tissue sarcomas, accounting for 6–8% of all pediatric tumors.[11] Liposarcoma is the most common soft-tissue cancer overall, accounting for 20% of adult sarcoma cases. It originates in deep-tissue fat cells and is characterized primarily by amplification of the 12q chromosomal region.[12] Other common soft-tissue sarcomas include angiosarcomas, fibrosarcomas, gastrointestinal stromal tumors, and synovial sarcomas, each with their own unique genetic signature.

Ever since the discovery of oncogenes, the primary emphasis in cancer research has been on understanding the role of proteins and protein-coding genes. However, the percent of the genome dedicated to coding genes is small compared with noncoding regions. The last decade has seen a surge of interest in these noncoding regions with small noncoding RNAs such as microRNAs (miRNAs) gaining particular prominence. These small RNAs have critical roles in tumor formation and progression. Understanding their roles in sarcoma will lead to new therapeutic targets and diagnostic biomarkers, opening the door to a greater understanding of the molecular mechanisms of all cancers.

miRNAs are evolutionarily conserved, small, noncoding RNA molecules of 18–24 nucleotides in length at maturity that can control gene function through mRNA degradation, translational inhibition, or chromatin-based silencing mechanisms.[13] Each miRNA can potentially regulate hundreds of targets via a ‘seed’ sequence of ~5–8 nucleotides at the 5′ end of the mature miRNA. miRNAs bind to complementary sequences in the 3′-untranslated regions (3′-UTRs) of target mRNA molecules, leading to either translational repression or transcriptional degradation.[14] The short seed sequence length and relatively low stringency requirement for these miRNA–3′-UTR interactions allow a single miRNA to potentially regulate hundreds of genes.[15] Small changes in the expression level of a few miRNAs can therefore have a dramatic biological impact, particularly when dysregulated. miRNA expression profiles can be used to distinguish between closely related soft-tissue sarcoma subtypes and may provide a more consistent diagnosis than histological inspection.[16–18]

miRNAs have critical roles in the majority of canonical cellular signaling networks and their dysregulation is implicated in many cancers including breast cancer, colon cancer, gastric cancer, lung cancer, and sarcomas.[19,20] Dysregulation of miRNA expression may result from a variety of factors, including abnormal cellular stimuli, genetic mutations, epigenetic alterations, copy number variations, and chromosomal fusions. Because miRNAs act as critical regulator molecules in a variety of signaling pathways and regulatory networks, their dysregulation can be amplified across the entire signaling network.[21–24] Selected miRNAs and targets that have critical regulatory roles in sarcoma and other cancers are summarized in Table 1 .
The p53 signaling pathway is one of the most highly studied cellular signaling networks. It actively induces apoptosis in response to DNA damage and oncogene activation and is therefore a key tumor suppressor pathway.[25] Germline mutations in TP53 are strongly associated with the development of soft-tissue sarcomas, osteosarcoma, and are the underlying cause of Li–Fraumeni Syndrome, a familial clustering of early-onset tumors including sarcomas.[26,27] It is estimated that over 50% of human tumors harbor a TP53 mutation but over 80% of tumors have dysfunctional p53 signaling.[28,29] It is only within the last 10 years that researchers have started uncovering the roles of miRNAs in mediating p53’s activity and resulting pro-apoptotic signals (Figure 1). miRNA dysregulation could be a key factor in the ~30% of tumors with dysfunctional p53 signaling that lack an apparent TP53 mutation.


Figure 1.

http://img.medscape.com/article/852/145/852145-fig1.jpg

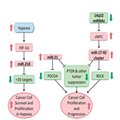
p53–miRNA interaction network. p53 interacts with the Drosha complex and promotes the processing of pri-miRNA to pre-miRNA. Although p53 directly or indirectly regulates hundreds of miRNAs, for clarity, only selected cancer-relevant miRNAs are shown. miRNAs and proteins in red are upregulated by p53. miRNAs and proteins in green are downregulated by p53. miRNAs in gray are not known to be directly regulated by p53, they are included because they target p53 regulators MDM2 and/or MDM4. miRNA, microRNA.

Like other transcription factors, p53 exerts its function primarily through transcriptional regulation of target genes that contain p53 response elements in their promoters. p53 also regulates the post-transcriptional maturation of miRNAs by interacting with the Drosha processing complex, promoting the processing of primary miRNAs to precursor miRNAs.[30] In addition to protein-coding genes, many miRNA genes also contain p53 regulatory sites in their promoter regions. Large-scale screens have revealed many different miRNAs directly regulated by p53 including miR-22-3p, miR-34a, miR-125a/b, miR-182, and miR-199a-3p.[31] Some of these miRNAs, such as miR-34a and miR-199a-3p, function themselves as tumor suppressors via the regulation of genes involved in cell cycle, cell proliferation, and even of itself.[32–34] Although some p53-targeted miRNAs form a feedback loop, translationally and transcriptionally inhibiting the TP53 gene (e.g., miR-22-3p, miR-34a, and miR-125b), others target, or are predicted to target, p53 repressors such as MDM2 and/or MDM4 (miR-199a-3p, miR-661).[31,33,35,36] It is impossible to fully understand the regulation of the p53 signaling network without considering the role of these miRNAs.

miR-34a has emerged as a critical and conserved member of the p53 signaling pathway. miR-34a is downregulated in osteosarcoma tumor samples and, in conjunction with other miRNAs, regulates p53-mediated apoptosis in human osteosarcoma cell lines.[32,33,37] The gene encoding miR-34a contains a conserved p53-binding site and is upregulated in response to cellular damage in a p53-dependent manner.[37,38] Protein-coding members of the p53 signaling pathway are well-liked targets for anticancer therapeutic development efforts and miRNAs may prove equally effective. In a preclinical model of lung cancer, therapeutic delivery of a miR-34a mimic specifically downregulated miR-34a-target genes and resulted in slower tumor growth. When combined with a siRNA targeting Kras, this small RNA combination therapy resulted in tumor regression.[39] miRNAs such as miR-34a, miR-125b, and miR-199a-3p also mediate p53’s regulation of other key signaling pathways such as the IGF-1/PI3K/AKT/mTOR signaling network. Activation of the AKT network due to downregulation of PTEN (a negative regulator of AKT) by miR-21 or miR-221 or by alternate activation of AKT is a common mechanism underlying many different types of cancer.[40–43] The induction of cell growth, migration, invasion, and metastasis resulting from the upregulation of either miR-21 or miR-221 is seen across different tumor types.[41,44–50] Dysregulation of these miRNAs is a common factor in sarcomas and other tumors. Understanding their mechanisms of action in sarcoma could lead to broadly useful cancer therapeutics.

In prospective analyses that could be models for other sarcoma studies with sufficient numbers of patient samples, Thayanithy et al[19] and Maire et al[23] each analyzed collections of osteosarcoma tissues and compared them with either normal bone or osteoblasts. They each found a set of consistently downregulated miRNAs localized to the 14q32 region.[19,23] Targeting predictions performed by Thayanithy et al[19] identified a subset of four miRNAs as potential regulators of cMYC. One of the many roles of cMYC is to promote the expression of the miR-17–92 family, a known oncogenic cluster that has been observed to be highly expressed in many cancer types including osteosarcoma, leiomyosarcoma, and alveolar rhabdomyosarcoma.[51–57] Restoring the expression of the four 14q32 miRNAs increased apoptosis of SAOS-2 cells, an effect that was attenuated either by overexpression of a cMYC construct lacking the 3′UTR or by ectopic expression of the miR-17–92 cluster.[19] Although the 14q32 region is dysregulated across many different cancer types, this pattern of dysregulation appears to be a hallmark of osteosarcoma, which is particularly interesting due to the heterogenous nature of osteosarcomas and provides an extremely attractive common therapeutic target.

One particular challenge with these types of expression profiling studies is that the cell-of-origin for a particular sarcoma subtype may not be definitely established. Another challenge is the scarcity of patient samples, particularly for the rare sarcoma subtypes. As a result, there have only been a limited number of studies designed to comprehensively profile miRNA expression in various sarcoma subtypes and to compare those expression profiles with the corresponding normal tissues or cell lines. These studies were reviewed recently in Drury et al[20] and Subramanian and Kartha.[58]

Owing to the scarcity of frozen sarcoma tissue samples, it is tempting to study sarcoma cells in vitro, using either primary or immortalized cell cultures. Studies performed in culture are less expensive and more accessible; however, the cell lines used must be chosen with care and may not truly represent the tumors. Any results derived from cultured cells must be interpreted with caution and validated in vivo when possible. A tumor cell’s microenvironment has a profound effect on gene expression and cell metabolism and culturing for even short periods of time can result in large changes in gene/miRNA expression.[59] Three-dimensional cultures can provide more physiological relevant in vitro models of individual tumors (eg, spheroid cultures) or multi-layered epithelial tissues (eg, organotypic cultures using extracellular matrix proteins, fibroblasts, and/or artificial matrix components) vs the previous standard two dimensional culture model.[60,61]

Complicating the analysis of these miRNA expression changes is the fact that many miRNAs showing differential expression in multiple different studies do not have a consistent direction of change and/or a consistent role (tumor suppressor vs tumor promoter). This likely reflects both random chance observational differences and different tissue biology reflected in different regulatory networks. Elucidation of the regulatory roles played by miRNAs in these networks in their appropriate biological contexts may provide suitable upstream targets for more effective treatment of sarcomas. Recent advances in sequencing and downstream bioinformatics techniques provide the tools to efficiently examine these questions.

For two decades, microarray gene chips containing synthetic oligonucleotides whose sequences are designed to be representative of thousands of genes have allowed researchers to perform simultaneous expression analysis of thousands of RNA transcripts in a single reaction.[62–65] Gene expression profiling has been used to characterize and classify a wide range of sarcomas, in some cases providing a diagnostic resolution more accurate than histological examination.[66–72] With the advent of high-throughput RNA-Seq, sarcoma researchers are now able to prospectively analyze the differential expression of small RNAs, such as miRNAs, without prior knowledge of their sequence.[73,74] RNA-Seq also allows for the prospective identification of novel genomic rearrangements resulting from gene fusions or premature truncations that may be of particular interest to cancer researchers.[75,76] These data are highly quantitative and digital in nature, allowing for a dynamic range that is theoretically only limited by the sequencing depth and approaches the estimated range within the cell itself.[77] Marguerat and Bähler[78] provide a basic overview of the different RNA-Seq technologies and their differences from array-based technologies.[78]

Several groups have taken advantage of these technologies to create miRNA expression profiles for a number of different sarcomas in an effort to find both common sarcoma oncomirs and to discover unique miRNA signatures that could be used in diagnosis, prognosis, and novel therapeutic development. Renner et al[18] used a microarray-based miRNA screen, followed by qRT-PCR verification, to analyze the expression of 1146 known miRNAs across a collection of 76 primary soft-tissue sarcoma samples representing eight different subtypes and across a panel of 15 sarcoma cell lines. In addition to identifying overrepresented miRNAs synovial sarcomas (miR-200 family) and liposarcomas (miR-9) compared with other sarcomas and adipose tissue, respectively, their results revealed a high degree of co-expression of 63 miRNAs clustering in the chromosomal region 14q32.[18] The most comprehensive sarcoma miRNA data set has been published by Sarver et al[79] who profiled miRNA expression in over 300 sarcoma primary tumor tissue samples representing 22 different sarcoma types. These data form the basis for the web-accessible comprehensive Sarcoma microRNA Expression Database (SMED) database, which has tools that allows users to query specific sarcoma types and/or specific miRNAs.[79]

Integrative miRNA–mRNA analysis using a tool such as Ingenuity Pathway Analysis (Qiagen) or GeneSpring (Agilent) allows for more biologically relevant results by highlighting miRNA–mRNA pairs that are linked not only by predicted targeting interactions but whose expression levels are inversely correlated (i.e., as miRNA expression increases one would expect the target mRNA levels to decrease). For example, out of 177 differentially expressed miRNAs in osteosarcoma cell lines vs normal bone, an integrated miRNA–mRNA analysis highlighted two particularly interesting miRNA/mRNA pairs (miR-9/TGFBR2 and miR-29/p85α regulatory subunit of PI3K) that were dysregulated.[44]

It is important to note that the general consensus is that there is often no single ‘correct’ method to analyze miRNA expression data. Different experimental and bioinformatics techniques may reveal different aspects in the data that can be further investigated and experimentally validated. All of these experiments, whether performed at the bench or systems biology, contribute to our greater understanding of sarcoma biology and the central role of dysregulated miRNA–gene networks as drivers of tumor formation and progression.

miRNAs are part of a larger family of noncoding RNAs including long noncoding RNAs (lncRNAs) and competing endogenous RNAs (ceRNAs) that deserve to be evaluated for therapeutic potential in sarcomas with broader applicability to other cancer types. Just like miRNAs, lncRNAs are widely expressed in tissue-specific patterns that are highly disrupted in cancer.[80] As their name implies, ceRNAs compete for their common miRNA targets and influence their expression, which has an indirect effect on the protein-coding genes, such as PTEN, regulated by those miRNAs.[81,82] We have just begun to unravel the role of lncRNAs and ceRNAs in cancer development and progression but recent results hint at yet another layer of complexity and genetic control in tumor biology.

The lessons learned from carcinomas, leukemias, and lymphomas will be helpful in understanding the pathobiology of sarcomas and the insights gained from sarcoma biology may form the foundation for therapeutics to treat a wide range of other cancers. Recent studies have shown miRNAs are very stable in blood serum and plasma, and extensive efforts are underway to develop circulating miRNA-based diagnostic and prognostic markers. Major technical challenges in developing circulating miRNA-based markers still need to be addressed, including standardization of pre-analytical, analytical, and post-analytical methods for effective reproducibility. For example, miR-16, which is used in the normalization of miRNA expression in serum/plasma is also found in red blood cells; thus, any hemolysis during sample collection could significantly affect the downstream expression data analysis.

Cancers do not exist in isolation inside the body and extensive research has been performed on how tumor-derived proteins adapt their microenvironment to provide more favorable conditions for tumor growth and development. Recent studies have shown that miRNAs also have a major role in modulating tumor microenvironment. Although most miRNAs are found inside the cell, a significant number of miRNAs are encapsulated in exosomes that can be used as a delivery system to send miRNAs from one cell to another, allowing tumor cells to modulate gene expression in surrounding tissues.[83,84] Exosome and miRNA-mediated cross talk between sarcoma tumor cells and the surrounding stromal cells is a new and exciting avenue of research and the potential for novel therapeutics is high.

Sarcomas are a diverse collection of rare cancers with proportionally limited resources for research and development of novel treatments. It is therefore crucial that potential therapeutic targets are prioritized and novel therapeutic agents carefully selected for clinical trials to succeed. Extensive studies in preclinical models will be required; however, there are also challenges in the development of appropriate in vitro and in vivo model systems that accurately reflect the different sarcoma types. Sarcomas, such as osteosarcoma, leiomyosarcoma, and angiosarcoma are very heterogeneous in nature, making it unlikely that therapies targeting specific genomic mutations will be successful. Even if specific targets were to be identified it would still be a challenge to develop clinical trials based on the small number of patients harboring those specific mutations. Coordinated efforts such as the Cancer Genome Atlas (TCGA, http://cancergenome.nih.gov/) and its associated preclinical and clinical trial consortiums will help unravel novel miRNA–mRNA interactions and their significance as potential therapeutic targets.

Targeting common miRNA–gene oncogenic or tumor suppressor networks goes after the common denominator underlying many of these cancers. Key regulatory molecules in sarcoma are highly likely to have similar roles in leukemias and lymphomas, for instance, and vice versa. For example, oncogenic activation of STAT3 strongly promotes the expression of miR-135b in lymphoma, resulting in increased angiogenesis and tumor growth.[85] miR-135b is widely overexpressed in sarcomas and STAT3 may be having a similar transcriptional regulatory role, indicating that STAT3 inhibitors could be an effective supplemental therapy in sarcomas.[86] Interestingly, p53 promotes the transcription of miR-125b, which can directly target both STAT3 and p53 transcription. This finely balanced regulatory network is frequently dysregulated in osteosarcoma and Ewing’s sarcoma.[87,88] In retinoblastoma, STAT3 activation is associated with upregulation of the miR-17-92 cluster via a positive feedback loop and inhibition of STAT3-suppressed retinoblastoma proliferation, providing further evidence that STAT3 may be an attractive therapeutic target in many cancers.[89] The dysregulation of key signaling molecules such as the p53 and STAT3 along with their associated signaling networks are a common feature across most cancer types implying that advances in understanding of sarcoma biology may be highly impactful in more frequently occurring solid tumors and lymphomas.

Certain miRNAs appear to be common players across many types of sarcomas and other cancers and their dysregulation contributes to the development of the hallmarks of cancer (Figure 2). miR-210, a key modulator of many downstream pathways involved in the hypoxic response, is upregulated under hypoxic conditions in most solid tumors, including soft-tissue sarcomas, osteosarcoma, renal cancer, and breast cancer.[90] A recent meta-analysis demonstrated that the elevated expression of miR-210 is a prognostic indicator for disease-free, progression-free, and relapse-free survival in a variety of cancer patients.[91] Perhaps the most consistently upregulated miRNA across all tumor types is the anti-apoptotic miR-21, which directly targets the tumor suppressor PDCD4.[92] Levels of miR-21 correlate with cancer progression and patient prognosis.[93]
Figure 2.

http://img.medscape.com/article/852/145/852145-thumb2.png

Conserved miRNA-tumor suppressor signaling networks in cancer. These miRNAs and tumor suppressors are involved in other network and signaling pathway interactions, such as the p53 signaling network; this figure highlights selected critical conserved pathways.


Human Papillomavirus Oncogenic mRNA Testing for Cervical Cancer Screening

Jennifer L. Reid, PhD; Thomas C. Wright Jr, MD; Mark H. Stoler, MD; Jack Cuzick, PhD; Philip E. Castle, PhD; Janel Dockter; Damon Getman, PhD; Cristina Giachetti, PhD

Am J Clin Pathol. 2015;144(3):473-483.

http://www.medscape.com/viewarticle/850740


Objectives: This study determined the longitudinal clinical performance of a high-risk human papillomavirus (HR-HPV) E6/E7 RNA assay (Aptima HPV [AHPV]; Hologic, San Diego, CA) compared with an HR-HPV DNA assay (Hybrid Capture 2 [HC2]; Qiagen, Gaithersburg, MD) as an adjunctive method for cervical cancer screening.

Methods: Women 30 years or older with a negative result for intraepithelial lesions or malignancy cytology (n = 10,860) positive by AHPV and/or HC2 assays and randomly selected women negative by both assays were referred to colposcopy at baseline. Women without baseline cervical intraepithelial neoplasia (CIN) grade 2 or higher (CIN2+) continued into the 3-year follow-up.

Results: The specificity of AHPV for CIN2 or lower was significantly greater at 96.3% compared with HC2 specificity of 94.8% (P < .001). Estimated sensitivities and risks for detection of CIN2+ were similar between the two assays. After 3 years of follow-up, women negative by either human papillomavirus test had a very low risk of CIN2+ (<0.3%) compared with CIN2+ risk in women with positive AHPV results (6.3%) or positive HC2 results (5.1%).

Conclusions: These results support the use of AHPV as a safe and effective adjunctive cervical cancer screening method.

Introduction

Cervical cancer is one of the most frequent cancers in women worldwide, accounting for approximately 530,000 new cases and 275,000 deaths annually.[1] Countries with well-organized screening programs using conventional Papanicolaou (Pap) stain cytology have experienced substantially reduced mortality from the disease in the past 5 decades.[2–4] Despite this advance, the relatively low sensitivity and reproducibility of both conventional Pap smear and liquid-based cytology screening methods have prompted investigation into identifying adjunctive methods with Pap cytology for improving detection of cervical neoplasia.[5–9]

Infection with 14 high-risk human papillomavirus (HR-HPV) genotypes (16, 18, 31, 33, 35, 39, 45, 51, 52, 56, 58, 59, 66, and 68) is associated with almost all cases of cervical precancer, defined as cervical intraepithelial neoplasia (CIN) grade 2 (CIN2), grade 3 (CIN3), and cancer.[10] Addition of HR-HPV nucleic acid testing to a cervical cytology screening regimen offers higher sensitivity and negative predictive value (NPV) for detection of cervical precancer and cancer compared with cytology alone, especially in older women.[11–15] For this reason, HR-HPV nucleic acid testing is recommended as an adjunctive test to cytology to assess the presence of HR-HPV types in women 30 years of age or older.[16] In this context, HR-HPV testing guides patient management by identifying women at elevated risk for CIN2 or higher (CIN2+) but, importantly, also reassures women who are negative for HR-HPV of their extremely low cancer risk.[17–19]
First-generation HR-HPV molecular tests used for adjunctive cervical cancer screening function by detecting viral genomic DNA in cellular samples from the uterine cervix. However, because the presence of HR-HPV in the female genital tract is common and often transient in nature,[20,21] and most cervical HPV infections resolve without becoming cancerous,[22,23] HR-HPV DNA-based test methods yield only moderate specificity for detection of high-grade cervical disease.[12,24] This leads to unnecessary follow-up and referral of patients to colposcopy, increasing the physical and emotional burdens on patients and elevating health care costs.

A test approved by the US Food and Drug Administration (FDA) for detection of HR-HPV E6/E7 messenger RNA (mRNA) (Aptima HPV [AHPV]; Hologic, San Diego, CA) has shown higher specificity with similar sensitivity for detection of CIN2+ compared with HPV DNA-based tests in patients referred for colposcopy due to an abnormal Pap smear result as well as in a screening setting.[25–30] Expression of mRNA from viral E6 and E7 oncogenes is highly associated with the development of CIN,[31,32] and extensive investigation into the role of E6 and E7 oncoproteins in the human papillomavirus (HPV) life cycle has revealed that the expression of the corresponding oncogenes is necessary and sufficient for cell immortalization, neoplastic transformation, and the development of invasive cancer.[33–35]

To confirm and extend the previous evidence on the clinical utility of HR-HPV oncogenic mRNA testing in a US population-based setting, the clinical performance of AHPV was evaluated as an adjunctive method for cervical cancer screening in women aged 30 years or older with negative for intraepithelial lesions or malignancy (NILM) cytology results from routine Pap testing in a pivotal, prospective, multicenter US clinical study including 3 years of follow-up (the Clinical Evaluation of Aptima mRNA [CLEAR] study). We report herein the results from this study.

1 of 4

Figure 1.

Clinical evaluation of Aptima mRNA study participant disposition. aReasons for withdrawal: did not meet eligibility criteria (70); Pap volume insufficient for AHPV testing (117); specimen expired or unsuitable for testing (190); specimen lost (58); noncompliant site (320); other reasons (26). bReasons for withdrawal: collection site did not participate in follow-up (243); subject terminated participation (37); participant had hysterectomy (22); participant not eligible (17); participant treated prior to CIN2+ diagnosis (8); other reasons (4). AHPV, Aptima HPV (Hologic, San Diego, CA); ASC-US, atypical squamous cells of unknown significance; CIN2+, cervical intraepithelial neoplasia grade 2 or higher; HC2, Hybrid Capture 2 (Qiagen, Gaithersburg, MD); HPV, human papillomavirus; NILM, negative for intraepithelial lesions or malignancy; Pap, Papanicolaou test.

HPV Testing

Baseline PreservCyt specimens (1-mL aliquot) were tested with the AHPV (Hologic) on both the automated Tigris DTS System and Panther System. Results from the two systems were similar; Panther System results are presented here. AHPV is a target amplification assay that uses transcription-mediated amplification to detect the E6/E7 oncogene mRNA of 14 HR-HPV genotypes (16, 18, 31, 33, 35, 39, 45, 51, 52, 56, 58, 59, 66, and 68).


HPV and Disease Prevalence

Cervical disease and HPV status are shown in Table 2 for the baseline evaluation and cumulatively after 3 years of follow-up. Of the 10,860 evaluable participants with NILM cytology at baseline, 512 were positive for AHPV, yielding a prevalence of 4.7% for HR-HPV E6/E7 oncogenic mRNA, whereas prevalence of HR-HPV DNA was 6.5% among 10,229 women with HC2 results. A total of 845 HPV RNA-positive or DNA-positive women and 556 randomly selected HPV-negative women were referred to colposcopy at baseline (Figure 1).

At baseline, the percentage of colposcopy attendance was similar between HPV-positive (62%, n = 526) and randomly selected HPV-negative (61%, n = 339) women with 29 cases of CIN1, nine cases of CIN2, eight cases of CIN3, and three cases of adenocarcinoma in situ (AIS) identified (Table 2). Four of the CIN2 cases and two of the AIS cases were identified based on an ECC biopsy specimen only.

In total, 6,271 women completed the 3-year follow-up with a known disease status (Table 2). Of these, 6,098 (97.2%) women had normal (negative) disease status, and 56 (0.9%) had low-grade lesions (CIN1). In addition to the 20 women with CIN2+ identified at baseline, 15 (0.2%) women had CIN2 and 12 (0.2%) women had CIN3 identified during follow-up, with two cases identified from an ECC biopsy specimen only.

Of the 27 women with CIN2+ identified during follow-up, two had CIN1 at baseline, with CIN3 identified during year 1. Ten women had no disease found at baseline, with five cases of CIN2+ identified during year 1, one case of CIN2+ identified during year 2, and four cases of CIN2+ identified during year 3. The remaining 15 women with CIN2+ identified during follow-up did not have a baseline colposcopy; among them, two cases of CIN2+ were identified during year 1, six cases of CIN2+ during year 2, and seven cases of CIN2+ during year 3.

AHPV Assay Performance

Baseline risk and prevalence estimates adjusted for verification bias are provided in Table 3. The prevalence of CIN2+ was 0.9% in the overall population. CIN2+ occurred in 4.5% (95% CI, 2.7%-7.4%) of women with positive AHPV results and in 0.6% (95% CI, 0.2%–1.9%) of women with negative AHPV results, yielding a relative risk of 7.5 (95% CI, 2.1–26.3). This indicates that women with a positive AHPV result are at significantly greater risk of CIN2+ than women with a negative AHPV result. The CIN2+ relative risk obtained for the HC2 test at baseline was similar (7.3; 95% CI, 1.6–33.5). For CIN3+ diagnosis, the overall prevalence was 0.4%. The AHPV relative risk was 24.9 (95% CI, 2.0–307.0), again with a similar relative risk for HC2 (21.0; 95% CI, 1.0–423.8).

Cumulative absolute and relative risks for AHPV and HC2 over the 3-year follow-up period for HPV-positive and HPV-negative women are shown in Table 4. Women with an HPV-negative result with either test had very low cervical disease risk after 3 years of follow-up (<0.3%). Comparatively, 5% to 6% of women with an HPV-positive result had CIN2+ and 3% to 4% had CIN3+, with overall cumulative absolute and relative risks slightly higher for the AHPV assay than for HC2. Younger women aged 30 to 39 years who were HPV positive had twice the prevalence of disease but a similar increase in relative risk of cervical disease compared with HPV-positive women 40 years and older (Table 4). Risk of cervical disease in HPV-negative women did not vary by age group.

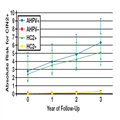
Figure 2 and Figure 3 show the cumulative absolute risk of CIN2+ and CIN3+, respectively, by year according to AHPV or HC2 positivity status at baseline. Both assays show a similar trend, with consistent slightly higher risk for the AHPV assay each year.

Figure 2.

Cumulative absolute risk of cervical intraepithelial neoplasia grade 2 or higher (CIN2+) by year. AHPV, Aptima HPV (Hologic, San Diego, CA); HC2, Hybrid Capture 2 (Qiagen, Gaithersburg, MD).

Figure 3.

Cumulative absolute risk of cervical intraepithelial neoplasia grade 3 or higher (CIN3+) by year. AHPV, Aptima HPV (Hologic, San Diego, CA); HC2, Hybrid Capture 2 (Qiagen, Gaithersburg, MD).

After 3 years of follow-up, the specificity of AHPV for CIN2 or lower was 96.3% (95% CI, 95.8%-96.7%), significantly greater (P < .001) compared with HC2 specificity of 94.8% (95% CI, 94.3%-95.4%) Table 5. AHPV specificity for CIN3 or lower (96.2%; 95% CI, 95.5%–96.5%) was also significantly greater (P < .001) than HC2 specificity (94.7%; 95% CI, 94.1%-95.2%). Estimated sensitivities for detection of CIN2+ and CIN3+ were similar between the two assays (P = .219 and P = 1.0, respectively). For detection of CIN2+, AHPV sensitivity was 55.3% (95% CI, 41.2%-68.6%), and HC2 sensitivity was 63.6% (95% CI, 48.9%-76.2%). For CIN3+ detection, AHPV sensitivity was 78.3% (95% CI, 58.1%-90.3%), and HC2 sensitivity was 81.8% (95% CI, 61.5%-92.7%) (Table 5).

Discussion

This study presents the results of a 3-year longitudinal evaluation of the AHPV assay as an adjunctive method for screening women 30 years and older who have NILM Pap cytology results. Consistent with previously published data,[28,29] these results demonstrate that HR-HPV oncogenic E6/E7 mRNA testing has a sensitivity similar to an HR-HPV DNA-based test for detection of CIN2+ and CIN3+ and slightly, but significantly, improved specificity compared with HR-HPV DNA testing for both end points. We found that use of AHPV as an adjunctive method for HPV-induced cervical disease screening provided disease detection capability similar to HC2 while reducing the false-positive rate (from 5.2% to 3.7%) relative to the HPV DNA-based test. Reduction of HPV detection in women without cervical disease minimizes the anxiety and burden associated with spurious positive HPV molecular test results in women with NILM cytology, decreases health care costs, and reduces unnecessary follow-up procedures, thereby improving the safety of cervical cancer screening (unnecessary colposcopy is considered a significant “harm” in the recent American Cancer Society guidelines[16]).

Importantly, we show that women with a NILM cytology result who also had a positive AHPV result are approximately 24 times more likely to have CIN2+ disease after 3 years than women with a negative AHPV result. This risk increased to approximately 68-fold for detection of CIN3+ disease. Similar but slightly lower risk estimates were obtained with HC2, demonstrating comparable accuracy of the AHPV and HC2 for identifying participants with CIN2+ and CIN3+ in this respect.

After 3 years of follow-up, women in this study who were HPV negative at baseline using any test method had very low risk for CIN2+ (<0.3%), a result similar to previously published studies with HC2.[42,43] These findings reinforce evidence from previous studies showing that HR-HPV nucleic acid testing should be performed as an adjunctive test to routine Pap for cervical cancer screening of women 30 years or older to increase sensitivity of disease detection.[28] Correspondingly, compared with annual cytology-only screening, this study supports longer screening intervals for women negative for both abnormal cytology and HPV E6/E7 mRNA, due to the high NPV and low risk of disease afforded by this screening algorithm for 3 years following a test-negative baseline visit. Extension of cervical cancer screening intervals following negative HPV and cytology test results in women 30 years or older is a key recommendation of current US screening guidelines from both the American Cancer Society and the US Preventive Services Task Force.[16]

Conversely, since the positive predictive value of any HPV test in women with NILM cytology is low, additional AHPV testing to detect persistent HR-HPV infection during follow-up care in women with an initial AHPV-positive result is likely a better option than direct referral to colposcopy. Alternatively, genotyping with referral for HPV 16– or HPV 18–positive women can optimize referral and minimize loss to follow-up.[44]

Read Full Post »

Imaging-guided cancer treatment

Imaging-guided cancer treatment

Writer & reporter: Dror Nir, PhD

It is estimated that the medical imaging market will exceed $30 billion in 2014 (FierceMedicalImaging). To put this amount in perspective; the global pharmaceutical market size for the same year is expected to be ~$1 trillion (IMS) while the global health care spending as a percentage of Gross Domestic Product (GDP) will average 10.5% globally in 2014 (Deloitte); it will reach ~$3 trillion in the USA.

Recent technology-advances, mainly miniaturization and improvement in electronic-processing components is driving increased introduction of innovative medical-imaging devices into critical nodes of major-diseases’ management pathways. Consequently, in contrast to it’s very small contribution to global health costs, medical imaging bears outstanding potential to reduce the future growth in spending on major segments in this market mainly: Drugs development and regulation (e.g. companion diagnostics and imaging surrogate markers); Disease management (e.g. non-invasive diagnosis, guided treatment and non-invasive follow-ups); and Monitoring aging-population (e.g. Imaging-based domestic sensors).

In; The Role of Medical Imaging in Personalized Medicine I discussed in length the role medical imaging assumes in drugs development.  Integrating imaging into drug development processes, specifically at the early stages of drug discovery, as well as for monitoring drug delivery and the response of targeted processes to the therapy is a growing trend. A nice (and short) review highlighting the processes, opportunities, and challenges of medical imaging in new drug development is: Medical imaging in new drug clinical development.

The following is dedicated to the role of imaging in guiding treatment.

Precise treatment is a major pillar of modern medicine. An important aspect to enable accurate administration of treatment is complementing the accurate identification of the organ location that needs to be treated with a system and methods that ensure application of treatment only, or mainly to, that location. Imaging is off-course, a major component in such composite systems. Amongst the available solution, functional-imaging modalities are gaining traction. Specifically, molecular imaging (e.g. PET, MRS) allows the visual representation, characterization, and quantification of biological processes at the cellular and subcellular levels within intact living organisms. In oncology, it can be used to depict the abnormal molecules as well as the aberrant interactions of altered molecules on which cancers depend. Being able to detect such fundamental finger-prints of cancer is key to improved matching between drugs-based treatment and disease. Moreover, imaging-based quantified monitoring of changes in tumor metabolism and its microenvironment could provide real-time non-invasive tool to predict the evolution and progression of primary tumors, as well as the development of tumor metastases.

A recent review-paper: Image-guided interventional therapy for cancer with radiotherapeutic nanoparticles nicely illustrates the role of imaging in treatment guidance through a comprehensive discussion of; Image-guided radiotherapeutic using intravenous nanoparticles for the delivery of localized radiation to solid cancer tumors.

 Graphical abstract

 Abstract

One of the major limitations of current cancer therapy is the inability to deliver tumoricidal agents throughout the entire tumor mass using traditional intravenous administration. Nanoparticles carrying beta-emitting therapeutic radionuclides [DN: radioactive isotops that emits electrons as part of the decay process a list of β-emitting radionuclides used in radiotherapeutic nanoparticle preparation is given in table1 of this paper.) that are delivered using advanced image-guidance have significant potential to improve solid tumor therapy. The use of image-guidance in combination with nanoparticle carriers can improve the delivery of localized radiation to tumors. Nanoparticles labeled with certain beta-emitting radionuclides are intrinsically theranostic agents that can provide information regarding distribution and regional dosimetry within the tumor and the body. Image-guided thermal therapy results in increased uptake of intravenous nanoparticles within tumors, improving therapy. In addition, nanoparticles are ideal carriers for direct intratumoral infusion of beta-emitting radionuclides by convection enhanced delivery, permitting the delivery of localized therapeutic radiation without the requirement of the radionuclide exiting from the nanoparticle. With this approach, very high doses of radiation can be delivered to solid tumors while sparing normal organs. Recent technological developments in image-guidance, convection enhanced delivery and newly developed nanoparticles carrying beta-emitting radionuclides will be reviewed. Examples will be shown describing how this new approach has promise for the treatment of brain, head and neck, and other types of solid tumors.

The challenges this review discusses

  • intravenously administered drugs are inhibited in their intratumoral penetration by high interstitial pressures which prevent diffusion of drugs from the blood circulation into the tumor tissue [1–5].
  • relatively rapid clearance of intravenously administered drugs from the blood circulation by kidneys and liver.
  • drugs that do reach the solid tumor by diffusion are inhomogeneously distributed at the micro-scale – This cannot be overcome by simply administering larger systemic doses as toxicity to normal organs is generally the dose limiting factor.
  • even nanoparticulate drugs have poor penetration from the vascular compartment into the tumor and the nanoparticles that do penetrate are most often heterogeneously distributed

How imaging could mitigate the above mentioned challenges

  • The inclusion of an imaging probe during drug development can aid in determining the clearance kinetics and tissue distribution of the drug non-invasively. Such probe can also be used to determine the likelihood of the drug reaching the tumor and to what extent.

Note: Drugs that have increased accumulation within the targeted site are likely to be more effective as compared with others. In that respect, Nanoparticle-based drugs have an additional advantage over free drugs with their potential to be multifunctional carriers capable of carrying both therapeutic and diagnostic imaging probes (theranostic) in the same nanocarrier. These multifunctional nanoparticles can serve as theranostic agents and facilitate personalized treatment planning.

  • Imaging can also be used for localization of the tumor to improve the placement of a catheter or external device within tumors to cause cell death through thermal ablation or oxidative stress secondary to reactive oxygen species.

See the example of Vintfolide in The Role of Medical Imaging in Personalized Medicine

vinta

Note: Image guided thermal ablation methods include radiofrequency (RF) ablation, microwave ablation or high intensity focused ultrasound (HIFU). Photodynamic therapy methods using external light devices to activate photosensitizing agents can also be used to treat superficial tumors or deeper tumors when used with endoscopic catheters.

  • Quality control during and post treatment

For example: The use of high intensity focused ultrasound (HIFU) combined with nanoparticle therapeutics: HIFU is applied to improve drug delivery and to trigger drug release from nanoparticles. Gas-bubbles are playing the role of the drug’s nano-carrier. These are used both to increase the drug transport into the cell and as ultrasound-imaging contrast material. The ultrasound is also used for processes of drug-release and ablation.

 HIFU

Additional example; Multifunctional nanoparticles for tracking CED (convection enhanced delivery)  distribution within tumors: Nanoparticle that could serve as a carrier not only for the therapeutic radionuclides but simultaneously also for a therapeutic drug and 4 different types of imaging contrast agents including an MRI contrast agent, PET and SPECT nuclear diagnostic imaging agents and optical contrast agents as shown below. The ability to perform multiple types of imaging on the same nanoparticles will allow studies investigating the distribution and retention of nanoparticles initially in vivo using non-invasive imaging and later at the histological level using optical imaging.

 multi

Conclusions

Image-guided radiotherapeutic nanoparticles have significant potential for solid tumor cancer therapy. The current success of this therapy in animals is most likely due to the improved accumulation, retention and dispersion of nanoparticles within solid tumor following image-guided therapies as well as the micro-field of the β-particle which reduces the requirement of perfectly homogeneous tumor coverage. It is also possible that the intratumoral distribution of nanoparticles may benefit from their uptake by intratumoral macrophages although more research is required to determine the importance of this aspect of intratumoral radionuclide nanoparticle therapy. This new approach to cancer therapy is a fertile ground for many new technological developments as well as for new understandings in the basic biology of cancer therapy. The clinical success of this approach will depend on progress in many areas of interdisciplinary research including imaging technology, nanoparticle technology, computer and robot assisted image-guided application of therapies, radiation physics and oncology. Close collaboration of a wide variety of scientists and physicians including chemists, nanotechnologists, drug delivery experts, radiation physicists, robotics and software experts, toxicologists, surgeons, imaging physicians, and oncologists will best facilitate the implementation of this novel approach to the treatment of cancer in the clinical environment. Image-guided nanoparticle therapies including those with β-emission radionuclide nanoparticles have excellent promise to significantly impact clinical cancer therapy and advance the field of drug delivery.

Read Full Post »

Older Posts »

%d