Feeds:
Posts
Comments

Posts Tagged ‘mammography’

False-Positive Mammogram Results May Be Linked to Higher Risk Later in Life

While screening mammograms aren’t perfect, they are the best way we have right now to detect breast cancer early, when it’s most treatable.

When a screening mammogram shows an abnormal area that looks like a cancer but turns out to be normal, it’s called a false positive. Ultimately the news is good: no breast cancer. But the suspicious area usually requires follow-up with more than one doctor, extra tests, and extra procedures, including a possible biopsy.

A large study suggests that women with false-positive mammogram results have a slightly higher risk of developing invasive breast cancer within the next 10 years.

The research was published online on Dec. 2, 2015 by the journal Cancer Epidemiology, Biomarkers & Prevention. Read the abstract of “Increased Risk of Developing Breast Cancer after a False-Positive Screening Mammogram.”

To do the study, the researchers looked at information from nearly 1.3 million women ages 40 to 70 with no family history of breast cancer who had screening mammograms from 1994 to 2009. The information came from the Breast Cancer Surveillance Consortium database, which is maintained by the National Cancer Institute.

The researchers found that the 1,297,906 women had a total of 2,207,942 screening mammograms. There were:

  • 159,448 false-positive results with a recommendation for more imaging
  • 22,892 false-positive results with a recommendation for biopsy
  • 2,025,602 negative mammograms

Women ages 40 to 49 made up the largest percentage of false-positive mammogram results with a recommendation for more imaging (33.1%). Women with dense breasts also were more likely to have false-positive results.

The researchers then compared the rates of invasive breast cancer between women who had false-positive mammogram results and women who had negative mammogram results:

  • there were 3.91 invasive breast cancers per 1,000 person-years of follow-up among women with negative mammogram results
  • there were 5.51 invasive breast cancers per 1,000 person-years of follow-up among women with false-positive mammogram results with a recommendation for more imaging
  • there were 7.01 invasive breast cancers per 1,000 person-years of follow-up among women with false-positive mammogram results with a recommendation for biopsy

The researchers said the 10-year risk of invasive breast cancer was:

  • 39% higher in women with false-positive results with a recommendation for more imaging
  • 76% higher in women with false-positive results with a recommendation for biopsy

compared to women with negative results.

It’s important to know that the increases above are increases in relative risk — the risk of a woman with a false-positive result relative to the risk of a woman with a negative result.

In terms of absolute risk, the increase is small:

  • women with false-positive results have about a 2% risk of developing invasive disease in the 10 years after the false-positive result
  • women with negative results have about a 1% risk of developing invasive disease in the 10 years after the negative result

The researchers didn’t offer an explanation about why false-positive mammogram results appear to be linked to a slightly higher risk of invasive disease. Many experts think that the subtle changes suggested on the mammogram may be an early clue to cancer before actual cancer exists.

It’s also important to know that this association has been suggested in other studies. But the large number of women in the study and the length of follow-up add more evidence that the link between false-positive results and a somewhat higher risk of invasive disease actually exists.

“The power of this study to show the association is very strong, particularly when you combine it with the results of the other studies that have been done,” said Richard Wender, M.D., chief of cancer control at the American Cancer Society, in an interview. “I think we can now say with confidence that women who have had a previous false-positive mammogram are at somewhat higher risk for breast cancer.”

The researchers who did this study want to incorporate false-positive mammogram results into models that predict breast cancer risk.

“Now that we have this information, our hope is that we can add it into existing risk-prediction models to improve their ability to discriminate between women who will go on to develop breast cancer and those who won’t,” said Louise Henderson, Ph.D., of the University of North Carolina Lineberger Comprehensive Cancer Center, who was the lead author of the study. “We should accept that a false-positive mammogram is a risk factor for predicting future risk of breast cancer.

“In clinical terms, that means women who have a false-positive mammogram need to be particularly vigilant about keeping up with regular mammographic screening,” she continued. “The clinicians caring for these women should have a way to track women who have had a false-positive and make sure that every effort is made to keep up to date with mammography.”

It’s important to know that a false-positive mammogram result doesn’t mean you will be diagnosed with breast cancer.

“Having any history of breast biopsies is associated with a higher risk,” said Breastcancer.org President and Founder Marisa Weiss, M.D. “Breast tissue that is dense or has proliferative changes tends to lead to questions on the breast imaging. Sometimes it leads to biopsies. In contrast, breast tissue that is boring, without any extra activity, rarely leads to any kind of biopsy. That kind of inactive breast tissue is less likely to develop breast cancer.”

“This study doesn’t suggest that having a false-positive leads to breast cancer,” said Brian Wojciechowski, M.D., Breastcancer.org’s medical adviser. “Rather, it reflects an association between breast cancer risk and abnormal breast imaging. Women should not worry that getting mammograms will increase their risk of breast cancer in the future.”

There’s only one of you and you deserve the best care possible. Don’t let any obstacles get in the way of your regular screening mammograms, especially if you’ve had a false-positive result.

  • If you’re worried about cost, talk to your doctor, a local hospital social worker, or staff members at a mammogram center. Ask about free programs in your area.
  • If you’re having problems scheduling a mammogram, call the National Cancer Institute (800-4-CANCER) or the American College of Radiology (800-227-5463) to find certified mammogram providers near you.
  • If you find mammograms painful, ask the mammography center staff members how the experience can be as easy and as comfortable as possible for you.
  • If you’re concerned about unknown results or being called back for more testing, talk to your doctor about what happens when mammogram results are unclear, as well as what to expect if you’re called back for more testing.

For more information on mammograms and other tests to detect and diagnose breast cancer, visit the Breastcancer.org Screening and Testing section.


Read Full Post »

Dense Breast Mammogram

Larry H. Bernstein, MD, FCAP, Curator

LPBI


The Problem With Mammograms

http://forward.com/culture/324003/the-problem-with-mammograms/#ixzz3queBnx00


Hallie Leighton had dense breasts — a fact she discovered only in her late 30s, via a mammogram. She grew up in an Ashkenazi family in New York, pursued a career in writing and worked with organizations promoting peace between Israelis and Arabs. By 2013 she was making a documentary on her father Jan Leighton, an actor who set the record as an actor for appearing in the most roles (2,407 according to the 1985 Guinness Book of World Records). She was never able to complete it. She died that year, at the age of 42.

Every woman in Leighton’s family had breast cancer, so she began getting annual mammograms at 35 — five years earlier than the recommended age. In 2009 the results of Leighton’s mammogram came in as “negative” or “normal”; by 2013 she was bedridden, undergoing her final days of chemotherapy.

When Leighton was first diagnosed in 2010, her doctor told her, “You have breast cancer, and it was there in 2009.” The tumor in Leighton’s breast went undiscovered until it was palpable — and at that point, the cancer was already in stage 4.

Happygram,” a documentary which exposes some of the shortcomings in mammography, chronicles Leighton’s struggle with cancer and the implications of having dense breasts.

“Most women simply aren’t informed that they have dense breast tissue,” said Leighton’s best friend Julie Marron. She wrote and directed the documentary, which is currently screening at film festivals around the country.

Breast density is defined by the relative amount of fat in relation to the amount of connective and epithelial tissue (tissue that lines blood vessels and cavities). When more than 50% of breast tissue is connective and epithelial tissue, instead of fatty tissue, the breasts are considered dense. Mammography is the only way to determine breast density.

“If you have dense breasts, what looks dense on a mammogram looks the same as a cancer would look. It tends to confuse or confound the physician, and reduces the sensitivity of the mammogram,” said Gerald Kolb, founder and president of The Breast Group, which counsels clients on different technologies in breast care. “Hallie Leighton’s breasts looked like snowballs; there was no chance they were going to find anything with the mammogram.”

Forty percent of women who are screened for breast cancer have dense breast tissue. These women also account for more than 70% of all invasive cancers. “Mammograms are not very effective screening tools for these women, as they miss between 50% and 75% of all invasive cancers in dense breast tissue,” Marron said. “This is obviously a very critical issue when you are dealing with a population that is more likely to develop cancer.”

Ashkenazi women are even more at risk. They are 1.6 times more likely than the general population to have dense breast tissue, according to Kolb. Moreover, one in 40 Ashkenazi women will test positive for one or both of BRCA gene mutations responsible for breast cancer. For the general population, that number is between one in 350 and one in 800.The BRCA 1 or 2 genes don’t cause cancer, they fight cancer, Kolb says. But if the gene is mutated, the body is not as well equipped to fight the cancer.

“A woman with a BRCA mutation has a lifetime risk of around 33% to 87%, depending on the gene and mutation,” Marron said. “Compare this to a lifetime risk of 12% for developing breast cancer for the overall population.” BRCA gene mutations can be inherited from either or both parents, and therefore they can be present in men as well as in women.

Breast density and BRCA gene mutations are not directly related, but both independently present an increased susceptibility to breast cancer.

“The biggest risk is that a doctor is not going to find the cancer when it’s really small,” Kolb said. When a tumor is detected at a centimeter or smaller, there’s a 95% cure rate. But if the cancer is the size of a golf ball by the time it’s detected, Kolb says, the woman has a 60% chance of living for five years, and then her mortality increases dramatically.

The good news is that mammography isn’t the only method of detecting breast cancer; the bad news is that very few people know this. “What we’re trying to do in the density movement is give women enough information so they can ask appropriate questions of a doctor,” Kolb said.

Kolb advises high-risk women to get a genetic risk analysis, which can be performed by a genetic counselor or a radiologist. He advises getting the risk analysis as early as age 25, but doing so is a personal decision. Not every woman is emotionally prepared to know the results.

“Mammography is a starting point,” said Dr. Dennis McDonald, a California-based women’s imager. Additionally, doctors recommend that women with dense breasts get an MRI, which McDonald says is reserved for high-risk women. It’s an expensive, invasive and time-consuming procedure that requires the injection of fluid in order to read the MRI. As of yet, doctors do not know the side effects of getting an annual MRI.

“A doctor should have started [Leighton] on an MRI right away. She was high risk and they chose to just monitor with a mammogram,” Kolb said. “That’s insufficient.”

Breast ultrasound is another alternative for women with dense breast tissue. “Most of the time, breast density doesn’t present a problem [with ultrasounds],” McDonald said. Though the ultrasound is effective in detecting cancer, he says the downside is that radiologists are often not that comfortable with the technology, simply because they have little experience with it. There are also a lot of false positives, he adds, which result in unnecessary exams or biopsies.

As “Happygram” documents, informing women of their breast density and of alternatives to mammography is a highly charged political issue.

“The whole breast cancer industry has grown up around mammograms,” Marron said. “Physicians weren’t educated on [breast density], deliberately so to a certain extent, and refused to inform patients on this issue, which is really outrageous if you think about it.” Marron says that doctors are required by law and ethical guidelines to inform patients of “material” medical information. “There is no legitimate reason that women have not been informed of this information,” she noted.

After Leighton’s diagnosis, she wanted to ensure that other women didn’t suffer the same misfortune of all-too-late tumor discovery on account of dense breast tissue. She gave media interviews, lobbied in Albany and starred in “Happygram,” all the while undergoing chemotherapy. She died four months after the Breast Density Information Bill passed in New York.

The law requires that every mammography report given to a patient with dense breasts inform the patient in plain language that she has dense breast tissue and that she should talk to her physician about the possible benefits of additional screenings. In New York, the first state in the nation to pass this kind of law, at least 2,500 women with dense breasts and invasive breast cancer received “normal” or “negative” results on their mammograms.

Similar legislation has been passed in more than 20 states throughout the country, but not without objection. Many well-intentioned radiologists, poorly informed about alternative screening options, feared that telling women the limitations of mammography would cause them to lose faith in it altogether and not get tested. Others argued that the information would make women anxious, and that it wouldn’t be fair for those who couldn’t afford additional testing. And still further arguments against informing women were possibly impacted by financial considerations, Marron added.

“Women aren’t getting the benefit of full notification across the board yet,” Marron said. “I think that has to change through education. That’s the primary reason we made this movie. There’s been so much resistance within the medical community to telling women. Change isn’t going to come from the medical community, it has to come from the patients.”

Ashkenazi women shouldn’t panic, Kolb says, but they need to carefully examine their breast density and alternative screening options: “Anytime you have a preventative tragedy like that, you have to do everything in your power to stop it from happening.”

Madison Margolin is a freelance writer based in New York. She writes frequently for the Village Voice.

Read more: http://forward.com/culture/324003/the-problem-with-mammograms/#ixzz3qufQOSmn

Read Full Post »

Imaging-guided cancer treatment

Imaging-guided cancer treatment

Writer & reporter: Dror Nir, PhD

It is estimated that the medical imaging market will exceed $30 billion in 2014 (FierceMedicalImaging). To put this amount in perspective; the global pharmaceutical market size for the same year is expected to be ~$1 trillion (IMS) while the global health care spending as a percentage of Gross Domestic Product (GDP) will average 10.5% globally in 2014 (Deloitte); it will reach ~$3 trillion in the USA.

Recent technology-advances, mainly miniaturization and improvement in electronic-processing components is driving increased introduction of innovative medical-imaging devices into critical nodes of major-diseases’ management pathways. Consequently, in contrast to it’s very small contribution to global health costs, medical imaging bears outstanding potential to reduce the future growth in spending on major segments in this market mainly: Drugs development and regulation (e.g. companion diagnostics and imaging surrogate markers); Disease management (e.g. non-invasive diagnosis, guided treatment and non-invasive follow-ups); and Monitoring aging-population (e.g. Imaging-based domestic sensors).

In; The Role of Medical Imaging in Personalized Medicine I discussed in length the role medical imaging assumes in drugs development.  Integrating imaging into drug development processes, specifically at the early stages of drug discovery, as well as for monitoring drug delivery and the response of targeted processes to the therapy is a growing trend. A nice (and short) review highlighting the processes, opportunities, and challenges of medical imaging in new drug development is: Medical imaging in new drug clinical development.

The following is dedicated to the role of imaging in guiding treatment.

Precise treatment is a major pillar of modern medicine. An important aspect to enable accurate administration of treatment is complementing the accurate identification of the organ location that needs to be treated with a system and methods that ensure application of treatment only, or mainly to, that location. Imaging is off-course, a major component in such composite systems. Amongst the available solution, functional-imaging modalities are gaining traction. Specifically, molecular imaging (e.g. PET, MRS) allows the visual representation, characterization, and quantification of biological processes at the cellular and subcellular levels within intact living organisms. In oncology, it can be used to depict the abnormal molecules as well as the aberrant interactions of altered molecules on which cancers depend. Being able to detect such fundamental finger-prints of cancer is key to improved matching between drugs-based treatment and disease. Moreover, imaging-based quantified monitoring of changes in tumor metabolism and its microenvironment could provide real-time non-invasive tool to predict the evolution and progression of primary tumors, as well as the development of tumor metastases.

A recent review-paper: Image-guided interventional therapy for cancer with radiotherapeutic nanoparticles nicely illustrates the role of imaging in treatment guidance through a comprehensive discussion of; Image-guided radiotherapeutic using intravenous nanoparticles for the delivery of localized radiation to solid cancer tumors.

 Graphical abstract

 Abstract

One of the major limitations of current cancer therapy is the inability to deliver tumoricidal agents throughout the entire tumor mass using traditional intravenous administration. Nanoparticles carrying beta-emitting therapeutic radionuclides [DN: radioactive isotops that emits electrons as part of the decay process a list of β-emitting radionuclides used in radiotherapeutic nanoparticle preparation is given in table1 of this paper.) that are delivered using advanced image-guidance have significant potential to improve solid tumor therapy. The use of image-guidance in combination with nanoparticle carriers can improve the delivery of localized radiation to tumors. Nanoparticles labeled with certain beta-emitting radionuclides are intrinsically theranostic agents that can provide information regarding distribution and regional dosimetry within the tumor and the body. Image-guided thermal therapy results in increased uptake of intravenous nanoparticles within tumors, improving therapy. In addition, nanoparticles are ideal carriers for direct intratumoral infusion of beta-emitting radionuclides by convection enhanced delivery, permitting the delivery of localized therapeutic radiation without the requirement of the radionuclide exiting from the nanoparticle. With this approach, very high doses of radiation can be delivered to solid tumors while sparing normal organs. Recent technological developments in image-guidance, convection enhanced delivery and newly developed nanoparticles carrying beta-emitting radionuclides will be reviewed. Examples will be shown describing how this new approach has promise for the treatment of brain, head and neck, and other types of solid tumors.

The challenges this review discusses

  • intravenously administered drugs are inhibited in their intratumoral penetration by high interstitial pressures which prevent diffusion of drugs from the blood circulation into the tumor tissue [1–5].
  • relatively rapid clearance of intravenously administered drugs from the blood circulation by kidneys and liver.
  • drugs that do reach the solid tumor by diffusion are inhomogeneously distributed at the micro-scale – This cannot be overcome by simply administering larger systemic doses as toxicity to normal organs is generally the dose limiting factor.
  • even nanoparticulate drugs have poor penetration from the vascular compartment into the tumor and the nanoparticles that do penetrate are most often heterogeneously distributed

How imaging could mitigate the above mentioned challenges

  • The inclusion of an imaging probe during drug development can aid in determining the clearance kinetics and tissue distribution of the drug non-invasively. Such probe can also be used to determine the likelihood of the drug reaching the tumor and to what extent.

Note: Drugs that have increased accumulation within the targeted site are likely to be more effective as compared with others. In that respect, Nanoparticle-based drugs have an additional advantage over free drugs with their potential to be multifunctional carriers capable of carrying both therapeutic and diagnostic imaging probes (theranostic) in the same nanocarrier. These multifunctional nanoparticles can serve as theranostic agents and facilitate personalized treatment planning.

  • Imaging can also be used for localization of the tumor to improve the placement of a catheter or external device within tumors to cause cell death through thermal ablation or oxidative stress secondary to reactive oxygen species.

See the example of Vintfolide in The Role of Medical Imaging in Personalized Medicine

vinta

Note: Image guided thermal ablation methods include radiofrequency (RF) ablation, microwave ablation or high intensity focused ultrasound (HIFU). Photodynamic therapy methods using external light devices to activate photosensitizing agents can also be used to treat superficial tumors or deeper tumors when used with endoscopic catheters.

  • Quality control during and post treatment

For example: The use of high intensity focused ultrasound (HIFU) combined with nanoparticle therapeutics: HIFU is applied to improve drug delivery and to trigger drug release from nanoparticles. Gas-bubbles are playing the role of the drug’s nano-carrier. These are used both to increase the drug transport into the cell and as ultrasound-imaging contrast material. The ultrasound is also used for processes of drug-release and ablation.

 HIFU

Additional example; Multifunctional nanoparticles for tracking CED (convection enhanced delivery)  distribution within tumors: Nanoparticle that could serve as a carrier not only for the therapeutic radionuclides but simultaneously also for a therapeutic drug and 4 different types of imaging contrast agents including an MRI contrast agent, PET and SPECT nuclear diagnostic imaging agents and optical contrast agents as shown below. The ability to perform multiple types of imaging on the same nanoparticles will allow studies investigating the distribution and retention of nanoparticles initially in vivo using non-invasive imaging and later at the histological level using optical imaging.

 multi

Conclusions

Image-guided radiotherapeutic nanoparticles have significant potential for solid tumor cancer therapy. The current success of this therapy in animals is most likely due to the improved accumulation, retention and dispersion of nanoparticles within solid tumor following image-guided therapies as well as the micro-field of the β-particle which reduces the requirement of perfectly homogeneous tumor coverage. It is also possible that the intratumoral distribution of nanoparticles may benefit from their uptake by intratumoral macrophages although more research is required to determine the importance of this aspect of intratumoral radionuclide nanoparticle therapy. This new approach to cancer therapy is a fertile ground for many new technological developments as well as for new understandings in the basic biology of cancer therapy. The clinical success of this approach will depend on progress in many areas of interdisciplinary research including imaging technology, nanoparticle technology, computer and robot assisted image-guided application of therapies, radiation physics and oncology. Close collaboration of a wide variety of scientists and physicians including chemists, nanotechnologists, drug delivery experts, radiation physicists, robotics and software experts, toxicologists, surgeons, imaging physicians, and oncologists will best facilitate the implementation of this novel approach to the treatment of cancer in the clinical environment. Image-guided nanoparticle therapies including those with β-emission radionuclide nanoparticles have excellent promise to significantly impact clinical cancer therapy and advance the field of drug delivery.

Read Full Post »

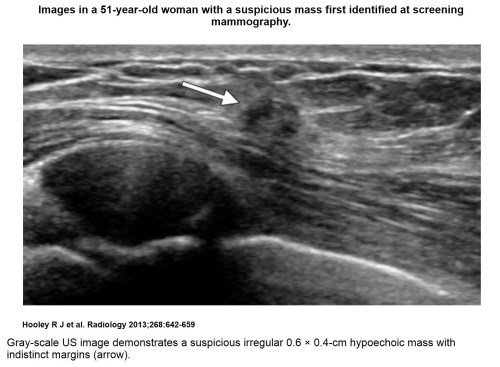
Recent comprehensive review on the role of ultrasound in breast cancer management

Writer, reporter and curator: Dror Nir, PhD

Breast Cancer Imaging

Word Cloud Created by Noam Steiner Tomer 8/10/2020

The paper below by R Hooley is a beautifully written review on how ultrasound could (and should) be practiced to better support breast cancer screening, staging, and treatment. The authors went as well into the effort of describing the benefits from combining ultrasonography with the other frequently used imaging modalities; i.e. mammography, tomosynthesis and MRI. Post treatment use of ultrasound is not discussed although this is a major task for this modality.

I would like to recommend giving attention to two very small (but for me very important) paragraphs: “Speed of Sound Imaging” and “Lesion Annotation”

Enjoy…

Breast Ultrasonography: State of the Art

Regina J. Hooley, MDLeslie M. Scoutt, MD and Liane E. Philpotts, MD

Department of Diagnostic Radiology, Yale University School of Medicine, 333 Cedar St, PO Box 208042, New Haven, CT 06520-8042.

Address correspondence to R.J.H. (e-mail: regina.hooley@yale.edu).

Ultrasonography (US) has become an indispensable tool in breast imaging. Breast US was first introduced in the 1950s by using radar techniques adapted from the U.S. Navy (1). Over the next several decades, US in breast imaging was primarily used to distinguish cystic from solid masses. This was clinically important, as a simple breast cyst is a benign finding that does not require further work-up. However, most solid breast lesions remained indeterminate and required biopsy, as US was not adequately specific in differentiating benign from malignant solid breast masses. However, recent advances in US technology have allowed improved characterization of solid masses.

In 1995, Stavros et al (2) published a landmark study demonstrating that solid breast lesions could be confidently characterized as benign or malignant by using high-resolution grays-cale US imaging. Benign US features include few (two or three) gentle lobulations, ellipsoid shape, and a thin capsule, as well as a homogeneously echogenic echotexture. Malignant US features include spiculation, taller-than-wide orientation, angular margins, microcalcifications, and posterior acoustic shadowing. With these sonographic features, a negative predictive value of 99.5% and a sensitivity of 98.4% for the diagnosis of malignancy were achieved. These results have subsequently been validated by others (3,4) and remain the cornerstone of US characterization of breast lesions today. These features are essential in the comprehensive US assessment of breast lesions, described by the Breast Imaging and Reporting Data System (BI-RADS) (5).

US is both an adjunct and a complement to mammography. Advances in US technology include harmonic imaging, compound imaging, power Doppler, faster frame rates, higher resolution transducers, and, more recently, elastography and three-dimensional (3D) US. Currently accepted clinical indications include evaluation of palpable abnormalities and characterization of masses detected at mammography and magnetic resonance (MR) imaging. US may also be used as an adjuvant breast cancer screening modality in women with dense breast tissue and a negative mammogram. These applications of breast US have broadened the spectrum of sonographic features currently assessed, even allowing detection of noninvasive disease, a huge advance beyond the early simplistic cyst-versus-solid assessment. In addition, US is currently the primary imaging modality recommended to guide interventional breast procedures.

The most subtle US features of breast cancers are likely to be best detected by physicians who routinely synthesize findings from multiple imaging modalities and clinical information, as well as perform targeted US to correlate with lesions detected at mammography or MR imaging. Having a strong understanding of the technical applications of US and image optimization, in addition to strong interpretive and interventional US skills, is essential for today’s breast imager.


Optimal Imaging Technique

US is operator dependent, and meticulous attention to scanning technique as well as knowledge of the various technical options available are imperative for an optimized and accurate breast US examination. US is an interactive, dynamic modality. Although breast US scanning may be performed by a sonographer or mammography technologist, the radiologist also benefits greatly from hands-on scanning (Fig 1). Berg et al (6) demonstrated that US interpretive performance was improved if the radiologist had direct experience performing breast US scanning, including rescanning after the technologist. Real-time scanning also provides the opportunity for thorough evaluation of lesions and permits detailed lesion analysis compared with analyzing static images on a workstation. Subtle irregular or indistinct margins, artifacts, and architectural distortions may be difficult to capture on static images. Real-time scanning also allows the operator to assess lesion mobility, location, and relationship to adjacent structures and allows direct assessment of palpable lesions and other clinical findings. Moreover, careful review of any prior imaging studies is imperative to ensure accurate lesion correlation.

Picture1

Picture1b

The US examination is generally well tolerated by the patient. Gentle but firm transducer pressure and optimal patient positioning are essential, with the patient’s arm relaxed and flexed behind the head. Medial lesions should generally be scanned in the supine position, and lateral lesions, including the axilla, should usually be scanned with the patient in the contralateral oblique position. This allows for elimination of potential artifact secondary to inadequate compression of breast tissue.


Gray-Scale Imaging

Typical US transducers used in breast imaging today have between 192 and 256 elements along the long axis. When scanning the breast, a linear 12–5-MHz transducer is commonly used. However, in small-breasted women (with breast thickness < 3 cm) or when performing targeted US to evaluate a superficial lesion, a linear 17–5-MHz transducer may be used. Such high-frequency transducers provide superb spatial and soft-tissue resolution, permitting substantially improved differentiation of subtle shades of gray, margin resolution, and lesion conspicuity in the background of normal breast tissue (Fig 2). However, the cost of such a high insonating frequency is decreased penetration due to attenuation of the ultrasound beam, making visualization of deep posterior tissue difficult (ie, greater than 3 cm in depth by using a linear 17–5-MHz transducer or greater than 5 cm in depth by using a linear 12–5-MHz transducer).

Picture2a

Picture2b

During the initial US survey of the region of interest in the breast, the depth should be set so that the pectoralis muscle is visualized along the posterior margin of the field of view. Initial gain settings should be adjusted so that fat at all levels is displayed as a midlevel gray. Simple cysts are anechoic. Compared with breast fat, most solid masses are hypoechoic, while the skin, Cooper ligaments, and fibrous tissue are echogenic. Time gain compensation, which adjusts image brightness at different depths from the skin to compensate for attenuation of the ultrasound beam as it penetrates into the breast tissue, may be set manually or, with appropriate equipment, may be adjusted automatically during real-time scanning or even during postprocessing of the image.

When searching for a lesion initially identified at mammography or MR imaging, careful correlation with lesion depth and surrounding anatomic structures is imperative. Lesion location may be affected by the patient’s position, which differs during mammography, US, and MR imaging examinations. Attention to surrounding background tissue may assist in accurate lesion correlation across multiple modalities. If a mass identified at mammography or MR imaging is surrounded entirely by fat or fibroglandular tissue, at US it should also be surrounded by hypoechoic fat or echogenic fibroglandular tissue, respectively. Similarly, careful attention to the region of clinical concern is necessary when scanning a palpable abnormality to ensure that the correct area is scanned. The examiner should place a finger on the palpable abnormality and then place the transducer directly over the region. Occasionally, the US examination may be performed in the sitting position if a breast mass can only be palpated when the patient is upright.

After a lesion is identified, or while searching for a subtle finding, the depth or field of view may be adjusted as needed. The depth should be decreased to better visualize more superficial structures or increased to better visualize deeper posterior lesions. The use of multiple focal zones also improves resolution at multiple depths simultaneously and should be used, if available. Although this reduces the frame rate, the reduction is typically negligible when scanning relatively superficial structures within the breast. If a single focal zone is selected to better evaluate a single lesion, the focal zone should be centered at the same level as the area of interest or minimally posterior to the area of interest, for optimal visualization.


Spatial Compounding, Speckle Reduction, and Harmonic Imaging

Spatial compound imaging and speckle reduction are available on most high-end US units and should be routinely utilized throughout the breast US examination. Unlike standard US imaging, in which ultrasound pulses are transmitted in a single direction perpendicular to the long axis of the transducer, spatial compounding utilizes electronic beam steering to acquire multiple images obtained from different angles within the plane of imaging (79). A single composite image is then obtained in real-time by averaging frames obtained by ultrasound beams acquired from these multiple angles (10). Artifactual echoes, including speckle and other spurious noise, as well as posterior acoustic patterns, including posterior enhancement (characteristic of simple cysts) and posterior acoustic shadowing (characteristic of some solid masses), are substantially reduced. However, returning echoes from real structures are enhanced, providing improved contrast resolution (9) so that ligaments, edge definition, and lesion margins, including spiculations, echogenic halos, posterior and lateral borders, as well as microcalcifications, are better defined. Speckle reduction is a real-time postprocessing technique that also enhances contrast resolution, improves border definition, is complementary to spatial compounding, and can be used simultaneously.

When a lesion is identified, harmonic imaging may also be applied—usually along with spatial compounding—to better characterize a cyst or a subtle solid mass. The simultaneous use of spatial compounding and harmonic imaging may decrease the frame rate, although this usually does not impair real-time evaluation. Harmonic imaging relies on filtering the multiple higher harmonic frequencies, which are multiples of the fundamental frequencies. All tissue is essentially nonlinear to sound propagation and the ultrasound pulse is distorted as it travels through breast tissue, creating harmonic frequencies (9). The returning ultrasound signal therefore contains both the original fundamental frequency and its multiples, or harmonics. Harmonic imaging allows the higher harmonic frequencies to be selected and used to create the gray-scale images (89). Lower-frequency superficial reverberation echoes are thereby reduced, allowing improved characterization of simple cysts (particularly if small) through the elimination of artifactual internal echoes often seen in fluid. Harmonic imaging also improves lateral resolution (10) and may also improve contrast between fatty tissue and subtle lesions, allowing better definition of subtle lesion margins and posterior shadowing (Fig 3).


Picture3a

Picture3b


Speed of Sound Imaging

Conventional US systems set the speed of sound in tissue at a uniform 1540 m/sec (10). However, the speed of sound in tissues of different composition is variable and this variability may compromise US image quality. Breast tissue usually contains fat, and the speed of sound in fat, of approximately 1430–1470 m/sec, is slower than the assumed standard (11). Accurate speed of sound imaging, in which the US transducer may be optimized for the presence of fat within breast tissue, has been shown to improve lateral resolution (12). Additionally, it can be used to better characterize tissue interfaces, lesion margins, and microcalcifications (13) and may also be useful to identify subtle hypoechoic lesions surrounded by fatty breast tissue. Speed of sound imaging is available on most high-end modern US units and is an optional adjustment, depending on whether predominately fatty, predominately dense, or mixed breast tissue is being scanned.


 Lesion Annotation

When a mass is identified and the US settings are optimized, the mass should be scanned with US “sweeps” through the entire lesion in multiple planes. Images of the lesion in the radial and antiradial views should be captured and annotated with “right” or “left,” clock face position, and centimeters from the nipple. Radial and anti-radial scanning planes are preferred over standard transverse and sagittal scanning planes because scanning the breast along the normal axis of the mammary ducts and lobar tissues allows improved understanding of the site of lesion origin and better visualization of ductal extension and helps narrow the differential diagnosis (14). Images should be captured with and without calipers to allow margin assessment on static images. Lesion size should be measured in three dimensions, reporting the longest horizontal diameter first, followed by the anteroposterior diameter, then the orthogonal horizontal.


 Extended-Field-of-View Imaging

Advanced US technology permits extended-field-of-view imaging beyond the footprint of the transducer. By using a freehand technique, the operator slides the transducer along the desired region to be imaged. The resultant images are stored in real-time and, by applying pattern recognition, a single large-field-of-view image is obtained (7). This can be helpful in measuring very large lesions as well as the distance between multiple structures in the breast and for assessing the relationship of multifocal disease (located in the same quadrant as the index cancer or within 4–5 cm of the index cancer, along the same duct system) and/or multicentric disease (located in a different quadrant than the index cancer, or at a distance greater than 4–5 cm, along a different duct system).


 Doppler US

Early studies investigating the use of color, power, and quantitative spectral Doppler US in the breast reported that the presence of increased vascularity, as well as changes in the pulsatility and resistive indexes, showed that these Doppler findings could be used to reliably characterize malignant lesions (15,16). However, other investigators have demonstrated substantial overlap of many of these Doppler characteristics in both benign and malignant breast lesions (17). Gokalp et al (18) also demonstrated that the addition of power Doppler US and spectral analysis to BI-RADS US features of solid breast masses did not improve specificity. While the current BI-RADS US lexicon recommends evaluation of lesion vascularity, it is not considered mandatory (5).

Power Doppler is generally more sensitive than color Doppler to low-flow volumes typical of breast lesions. Light transducer pressure is necessary to prevent occlusion of slow flow owing to compression of the vessel lumen. Currently both power and color Doppler are complementary tools to gray-scale imaging, and power Doppler may improve sensitivity in detecting malignant breast lesions (18,19). Demonstration of irregular branching central or penetrating vascularity within a solid mass raises suspicion of malignant neovascularity (20). Recently, the parallel artery and vein sign has been described as a reliable feature that has the potential to enable prediction of benignity in solid masses so that biopsy may be avoided. In a single study, a paired artery and vein was present in 13.2% of over 1000 masses at US-guided CNB and although an infrequent finding, the specificity for benignity was 99.3% and the false-negative rate was only 1.4%, with two malignancies among 142 masses in which the parallel artery and vein sign was identified (21).

Color and power Doppler US are also useful to evaluate cysts and complex cystic masses that contain a solid component. High-grade invasive cancer and metastatic lymph nodes may occasionally appear anechoic. Demonstration of flow within an otherwise simple appearing cyst, a complicated cyst, or a complex mass confirms the presence of a suspicious solid component, which requires biopsy. In addition, twinkle artifact seen with color Doppler US is useful to identify a biopsy marker clip or subtle echogenic microcalcifications (Fig 4). This Doppler color artifact occurs secondary to the presence of a strong reflecting granular surface and results in a rapidly changing mix of color adjacent to and behind the reflector (22). Care must be taken to avoid mistaking twinkle artifact for true vascular flow and, if in doubt, a spectral Doppler tracing can be obtained, as a normal vascular waveform will not be seen with a twinkle artifact.


picture4a

Picture4b

Picture4c


Elastography

At physical examination, it has long been recognized that malignant tumors tend to feel hard when compared with benign lesions. US elastography can be used to measure tissue stiffness with the potential to improve specificity in the diagnosis of breast masses. There are two forms of US elastography available today: strain and shear wave. With either technique, acoustic information regarding lesion stiffness is converted into a black-and-white or color-scaled image that can also be superimposed on top of a B-mode gray-scale image.

Strain elastography requires gentle compression with a US probe or natural motion (such as heart beat, vascular pulsation, or respiration) and results in tissue displacement, or strain. Strain (ie, tissue compression and motion) is decreased in hard tissues compared with soft tissue (23). The information obtained with strain elastography provides qualitative information, although strain ratios may be calculated by comparing the strain of a lesion to the surrounding normal tissue. Benign breast lesions generally have lower ratios in comparison to malignant lesions (24,25).

Shear-wave elastography is based on the principle of acoustic radiation force. With use of light transducer pressure, transient automatic pulses can be generated by the US probe, inducing transversely oriented shear waves in tissue. The US system captures the velocity of these shear waves, which travel faster in hard tissue compared with soft tissue (26). Shear-wave elastography provides quantitative information because the elasticity of the tissue can be measured in meters per second or in kilopascals, a unit of pressure.

Elastography features such as strain ratios, size ratios, shape, homogeneity, and maximum lesion stiffness may complement conventional US in the analysis of breast lesions. Malignant masses evaluated with elastography tend to be more irregular, heterogeneous, and typically appear larger at elastography than at grayscale imaging (Fig 5) (27,28). Although malignant lesions generally also exhibit maximum stiffness greater than 80–100 kPa (28,29), caution is necessary when applying these numerical values to lesion analysis. Berg et al (28) reported three cancers among 115 masses with maximum stiffness between 20 and 30 kPa, for a 2.6% malignancy rate; 25 cancers among 281 masses with maximum stiffness between 30 and 80 kPa, for an 8.9% malignancy rate; and 61 cancers among 153 masses with maximum stiffness between 80 and 160 kPa, for a 39.9% malignancy rate (28). Invasive cancers with high histologic grade, large tumor size, nodal involvement, and vascular invasion have also been shown to be significantly correlated with high mean stiffness at shear-wave elastography (30).

Picture5a

Picture5b

Elastography may be useful in improving the specificity of US evaluation of BI-RADS 3 and 4A lesions, including complicated cysts. Berg and colleagues (28) showed that by using qualitative shear-wave elastography and color assessment of lesion stiffness, oval shape, and a maximum elasticity value of less than 80 kPa, unnecessary biopsy of low-suspicion BI-RADS 4A masses could be reduced without a significant loss in sensitivity. Several investigators have proposed a variety of imaging classifications using strain elastography, mostly based on the color pattern (27,31,32). A “bull’s eye” artifact has also been described as a characteristic feature present in benign breast cysts, which may appear as a round or oval lesion with a stiff rim associated with two soft spots, one located centrally and the other posteriorly (33).

Despite these initial promising studies regarding the role of US elastography in the analysis of breast lesions, limitations do exist. Strain and shear-wave elastography are quite different methods of measuring breast tissue stiffness, and the application of these methods varies across different commercial manufacturers. Inter- and intraobserver variability may be relatively high because the elastogram may be affected by differences in degree and method of compression. With strain elastography, a quality indicator that is an associated color bar or numerical value may be helpful to ensure proper light compression. Shear-wave elastography has been shown to be less operator-dependent, as tissue compression is initiated by the US probe in a standard, reproducible fashion (34) and only light transducer pressure is necessary. In addition, there is currently no universal color-coding standard and, depending on the manufacturer and/or operator preference, stiff lesions may be arbitrarily coded to appear red while soft lesions appear blue, or vice versa. Some elastography features such as the “bull’s eye” artifact are only seen on specific US systems. Lesions deeper than 2 cm are less accurately characterized by means of elastography. Moreover, one must be aware that soft cancers and hard benign lesions exist. Therefore, careful correlation of elastography with B-mode US features and mammography is essential. Future studies and further technical advances, including the creation of more uniformity across different US manufacturers, will ultimately determine the usefulness of elastography in clinical practice.

Three-dimensional US

Both handheld and automated high-resolution linear 3D transducers are now available for use in breast imaging. With a single pass of the ultrasound beam, a 3D reconstructed image can be formed in the coronal, sagittal, and transverse planes, potentially allowing more accurate assessment of anatomic structures and tumor margins (Fig 6). Few studies regarding the performance of 3D US in the breast exist, but a preliminary study demonstrated improved characterization of malignant lesions (35). Automated supine whole-breast US using 3D technology is now widely available for use in the screening setting (see section on screening breast US). Three-dimensional US may also be used in addition to computed tomography for image-guided radiation therapy (36) and has a potential role in assessing tumor response to neoadjuvant chemotherapy.

Picture6


US Features of Benign and Malignant Breast Lesions

Cysts

Although for many years the main function of breast US was to differentiate cysts from solid masses, this differentiation can at times be problematic, particularly if the lesion is small or located deep in the breast. Simple cysts are defined as circumscribed, anechoic masses with a thin imperceptible wall and enhanced through transmission (provided spatial compounding is not used). By convention, simple cysts may also contain up to a single thin septation. Simple cysts are confidently characterized with virtually 100% accuracy at US (14,37), provided that they are not very small (< 5 mm in size) or not located in deep tissue. Complicated cysts are hypoechoic with no discernable Doppler flow, contain internal echoes, and may also exhibit indistinct margins, and/or lack posterior acoustic enhancement. Clustered microcysts consist of a cluster of tiny (<2–3 mm in size) anechoic foci with thin (< 0.5 mm in thickness) intervening septations.

Complicated cysts are very common sonographic findings and the majority are benign. In multiple studies, which evaluated over 1400 complicated cysts and microcysts, the malignancy rate ranged from 0% to 0.8% (3844). Most complicated cysts and clustered microcysts with a palpable or mammographic correlate are classified as BI-RADS 3 and require short-interval imaging follow-up or, occasionally, US-guided aspiration. However, in the screening US setting, if multiple and bilateral complicated and simple cysts are present (ie, at least three cysts with at least one cyst in each breast), these complicated cysts can be assessed as benign, BI-RADS 2, requiring no additional follow-up (38).

Complicated cysts should never demonstrate internal vascularity at color Doppler interrogation. The presence of a solid component, mural nodule, thickened septation, or thickened wall within a cystic mass precludes the diagnosis of a benign complicated cyst. These complex masses require biopsy, as some cancers may have cystic components. The application of compound imaging and harmonics, color Doppler, and potentially elastography may help differentiate benign complicated cysts from malignant cystic-appearing masses and reduce the need for additional follow-up or biopsy.

Solid Masses

Sonographic features of benign-appearing solid masses include an oval or ellipsoid shape, “wider-than-tall” orientation parallel to the skin, circumscribed margins, gentle and smooth (less than three) lobulations, as well as absence of any malignant features (2,45) (Fig 2b). Lesions with these features are commonly fibroadenomas or other benign masses and can often be safely followed, even if the mass is palpable (4648). Malignant features of solid masses include spiculations, angular margins, marked hypoechogenicity, posterior acoustic shadowing, microcalcifications, ductal extension, branching pattern, and 1–2-mm microlobulations (2,45) (Figs 1b,56). These are also often taller-than-wide lesions with a nonparallel orientation to the skin and may occasionally be associated with thickened Cooper ligaments and/or or skin thickening. Most cancers have more than one malignant feature, spiculation being the most specific and angular margins the most common (2).

There is, however, considerable overlap between these benign and malignant US features and careful scanning technique, as well as direct correlation with mammography, is essential. For example, some high-grade invasive ductal carcinomas with central necrosis, as well as the well-differentiated mucinous and medullary subtypes, may present as circumscribed, oval, hypoechoic masses that may look like complicated cysts with low-level internal echoes at US. Benign focal fibrous breast tissue or postoperative scars can appear as irregular shadowing masses on US images. Furthermore, while echogenic lesions are often benign and frequently represent lipomas or fibrous tissue, echogenic cancers do rarely occur (Figs 78) (49,50). The presence of a single malignant feature, despite the presence of multiple benign features, precludes a benign classification and mandates biopsy, with the exception of fat necrosis and postoperative scars exhibiting typical benign mammographic features. Likewise, a mass with a benign US appearance should be biopsied if it exhibits any suspicious mammographic features.

Picture7

Picture8


 Ductal Carcinoma in Situ

Ductal carcinoma in situ (DCIS) is characteristically associated with microcalcifications detected at mammography, but may also be detected at US since they are often associated with a subtle hypoechoic mass, which may indicate an invasive mammographically occult component. US features associated with DCIS most commonly include a hypoechoic mass with an irregular shape, microlobulated margins, no posterior acoustic features, and no internal vascularity. Ductal abnormalities, intracystic lesions, and architectural distortions may also be present (5153). Noncalcified DCIS manifesting as a solid mass at US is more frequently found in non–high-grade than high-grade DCIS, which is more often associated with microcalcifications and ductal changes (54). US can depict microcalcifications, particularly those in clusters greater than 10 mm in size and located in a hypoechoic mass or a ductlike structure (Fig 9) (55). Malignant calcifications are more likely to be detected sonographically than are benign calcifications, which may be obscured by surrounding echogenic breast tissue (55,56). Although US is inferior to mammography in the detection of suspicious microcalcifications, the main benefit of US detection of DCIS is to identify the invasive component and guide biopsy procedures.

Picture9a

Picture9b


Breast US in Clinical Practice

Current indications for breast US as recommended by the American College of Radiology Practice Guidelines include the evaluation of palpable abnormalities or other breast symptoms, assessment of mammographic or MR imaging–detected abnormalities, and evaluation of breast implants (57). Additionally, US is routinely used for guidance during interventional procedures, treatment planning for radiation therapy, screening in certain groups of women, and evaluation of axillary lymph nodes. Much literature has been written on these uses and a comprehensive discussion is beyond the scope of this article. A few important and timely topics, however, will be reviewed.


BI-RADS US

The BI-RADS US lexicon was introduced in 2003, and subsequently, there have been several studies assessing the accuracy of BI-RADS US classification of breast lesions. Low to moderate interobserver agreement has been found in the description of margins (especially noncircumscribed margins), echogenicity, and posterior acoustic features. Abdullah et al (58) reported low interobserver agreement especially for small masses and for malignant masses. Given the importance of margin analysis in the characterization of benign and malignant lesions, this variability is potentially problematic. Studies have also shown variable results in the use of the final assessment categories. In clinical settings, Raza et al (46) showed inconsistent use of the BI-RADS 3 (probably benign) category in 14.0% of cases when biopsy was recommended. Abdullah et al also demonstrated fair and poor interobserver agreement for BI-RADS 4 (suspicious for malignancy) a, b, and c subcategories (58). However, Henig et al (59) reported more promising results, with malignancy rates in categories 3, 4, and 5 to be similar to those seen with mammographic categorization (1.2%, 17%, and 94%, respectively).


 Evaluation of Mammographic Findings

Targeted US is complementary to diagnostic mammography because of its ability to differentiate cystic and solid lesions.US is also useful in the work up of subtle asymmetries, as it can help identify or exclude the presence of an underlying mass. True hypoechoic lesions can often be differentiated from prominent fat lobules by scanning in multiple planes, because true lesions usually do not blend or elongate into adjacent tissue. With the introduction of digital breast tomosynthesis for mammographic imaging, US will play yet another important role. As mammographic lesions can often be detected, localized, and have adequate margin assessment on 3D images, patients with lesions detected on digital breast tomosynthesis images at screening may often be referred directly to US, avoiding additional mammographic imaging and its associated costs and radiation exposure (Fig 10). This will place an even greater importance on high-quality US.

Picture10a

Picture10b

Picture10c


Evaluation of the Symptomatic Patient:Palpable Masses, Breast Pain, and Nipple Discharge

US is essential in the evaluation of patients with the common clinical complaint of either a palpable mass or focal persistent breast pain. Unlike focal breast pain, which may be occasionally associated with benign or malignant lesions, diffuse breast pain (bilateral or unilateral), as well as cyclic breast pain, requires only clinical follow-up, as it is usually physiologic with an extremely low likelihood of malignancy (60,61). In patients with isolated focal breast pain, the role of sonography may be limited to patient reassurance (61). In women younger than 30 years of age, with a palpable lump or focal breast pain, US is the primary imaging test, with a sensitivity and negative predictive value of nearly 100% (62). Symptomatic women older than 30 years usually require both US and mammography, and in these patients, the negative predictive value approaches 100% (63,64). Lehman et al (65) demonstrated that in symptomatic women aged 30–39 years, the risk of malignancy was 1.9% and the added value of adjunct mammography in addition to US was low. Identification of a benign-appearing solid lesion at US in a symptomatic woman can negate the need for needle biopsy, as many of these masses can safely be monitored with short-interval follow-up US (4648), usually performed at 6 months. A suspicious mass identified at US can promptly undergo biopsy with US guidance.

US can also be used as an alternative or an addition to ductography in patients who present with unilateral, spontaneous bloody, clear, or serosanguinous nipple discharge (66). Among women with worrisome nipple discharge, ductography can demonstrate an abnormality in 59%–82% of women (67,68), MR imaging may demonstrate a suspicious abnormality in 34% of women (68), and US has been shown to demonstrate a subareolar mass or an intraductal mass or filling defect in up to 14% of women (67). If US can be used to identify a retroareolar mass or an intraductal mass, US-guided biopsy can be performed and ductography may be avoided (Fig 11). US may be limited, however, as small peripherally located intraductal masses or masses without an associated dilated duct may not be identified. Therefore, galactography, MR imaging, and/or major duct excision may still be necessary in the symptomatic patient with a negative US examination.

Picture11

Finally, in the pregnant or lactating patient who presents with a palpable breast mass, focal breast pain, or bloody nipple discharge, US is also the initial imaging modality of choice. Targeted US examination in these patients can be used to identify most benign and malignant masses, including fibroadenomas, galactocoeles, lactating adenomas, abscesses, and invasive carcinomas. In a recent study by Robbins et al (69), a negative predictive value of 100% was found among 122 lesions evaluated with US in lactating, pregnant, or postpartum women. This is much higher than the pregnancy-associated breast cancer sensitivity of mammography, which has been reported in the range of 78%–87% (70,71). The diminished sensitivity of mammography is likely due to increased parenchymal density seen in these patients. However, since lactating breast parenchyma is more echogenic than most breast masses, hypoechoic breast cancers are more readily detected at US in pregnant patients.


Supplemental Screening Breast US

Because of the known limitations of mammography, particularly in women with dense breast tissue, supplemental screening with whole-breast US, in addition to mammography, is increasingly gaining widespread acceptance. Numerous independent studies have demonstrated that the addition of a single screening or whole-breast US examination in women with dense breast tissue at mammography will yield an additional 2.3–4.6 mammographically occult cancers per 1000 women (7280). Mammographically occult cancers detected on US images are generally small node-negative invasive cancers (Fig 12) (81). However, few studies have investigated the performance of incident screening breast US, and the optimal screening US interval is unknown. Berg and colleagues (82) recently demonstrated that incident annual supplemental screening US in intermediate- and high-risk women with mammographically dense breast tissue enabled detection of an additional 3.7 cancers per 1000 women screened.

Picture12

Handheld screening breast US is highly operator-dependent and the majority of screening breast US studies have relied on physician-performed examinations. As per the ACRIN 6666 protocol, a normal screening US examination should consist of a minimum of one image in each quadrant and one behind the nipple (83). Two studies have also demonstrated that technologist-performed handheld screening breast US can achieve similar cancer detection rates (76,78).

Automated whole-breast US is a recently developed alternative to traditional handheld screening breast US, in which standardized, uniform image sets may be readily obtained by a nonradiologist. Automated whole-breast US systems may utilize a standard US unit and a linear-array transducer attached to a computer-guided mechanical arm or a dedicated screening US unit with a 15-cm wide transducer (84,85). With these systems, over 3000 overlapping sagittal, transverse, and coronal images are obtained and available for later review by the radiologist, with associated 3D reconstruction. The advantages include less operator dependence, increased radiologist efficiency, and increased reproducibility, which could aid in follow-up of lesions.

A multi-institutional study has shown that supplemental automated whole-breast US can depict an additional 3.6 cancer per 1000 women screened, similar to physician-performed handheld screening US (85). However, disadvantages include the limited ability to scan the entire breast, particularly posterior regions in large breasts, time-consuming review of a large number of images by the radiologist, and the need to recall patients for a second US examination to re-evaluate indeterminate findings. Moreover, few investigators have compared the use of handheld with automated breast US screening. A single small recent study by Chang et al (86) demonstrated that of 14 cancers initially detected at handheld screening, only 57%–79% were also detected by three separate readers on automated whole-breast US images, with the two cancers missed by all three readers at automated whole-breast US, each less than 1 cm in size.

The use of supplemental screening breast US, performed in addition to mammography, remains controversial despite proof of the ability to detect small mammographically occult cancers. US has limited value for the detection of small clustered microcalcifications without an associated mass lesion. Low positive predictive values of biopsies performed of less than 12% have been consistently reported (77,87). No outcome study has been able to demonstrate a direct decrease in patient mortality due to the detection of these additional small and mammographically occult cancers. This would require a long, randomized screening trial, which is not feasible. Rationally, however, the early detection and treatment of additional small breast cancers should improve outcomes and reduce overall morbidity and mortality. Many insurance companies will not reimburse for screening breast US and historically, this examination has not been widely accepted in the United States.

Nevertheless, because of both the known efficacy of supplemental screening breast US and overall increased breast cancer awareness, more patients and clinicians are requesting this examination. In fact, some states now mandate that radiologists inform women of their breast density and advise them to discuss supplemental screening with their doctors. Although supplemental screening breast MR imaging is usually preferred for women who are at very high risk for breast cancer (ie, women with a lifetime risk of over 20%, for example those women who are BRCA positive or have multiple first-degree relatives with a history of premenopausal breast cancer), screening breast US should be considered in women at very high risk for breast cancer who cannot tolerate breast MR imaging, as well as those women with dense breast tissue and intermediate risk (ie, lifetime risk of 15%–20%, for example those women whose only risk factor is a personal history of breast cancer or previous biopsy of a high-risk lesion), or even average risk. Future studies are needed to establish strategies to reduce false-positive results and continue to optimize both technologist-performed handheld screening US and automated whole-breast US in women with mammographically dense breast tissue.


 Use of US for MR Imaging–depicted Abnormalities

MR imaging of the breast is now an integral part of breast imaging, most commonly performed to screen high-risk women and to further assess the stage in patients with newly diagnosed breast cancers. While MR has a higher sensitivity than mammography for detecting breast cancer, the specificity is relatively low (88). Lesions detected on MR images are often mammographically occult, but many can be detected with targeted US (Fig 13). Besides further US characterization of an MR imaging–detected lesion, US may be used to guide intervention for lesions initially detected at MR imaging. US-guided biopsies are considerably less expensive, less time consuming, and more comfortable for the patient than MR imaging–guided biopsies.

Picture13a

Picture13b

Some suspicious lesions detected at MR imaging will represent invasive ductal or lobular cancers, but many may prove to be intraductal disease, which can be challenging to detect at US. Meticulous scanning technique is required for an MR imaging–directed US examination, with knowledge of subtle sonographic signs and close correlation with the MR imaging findings and location. Precontrast T1 images are helpful to facilitate localization of lesions in relation to fibroglandular tissue (89). Because MR imaging abnormalities tend to be vascular, increased vascularity may also assist in detection of a subtle sonographic correlate (90). Having the MR images available for simultaneous review while performing the US examination will ideally permit such associative correlation. At the authors’ facility, computer monitors displaying images from the picture archiving and communication system are available in all US rooms for this purpose.

Recent studies have shown that 46%–71% of lesions at MR imaging can be detected with focused US (9094). Enhancing masses detected on MR images are identified on focused US images in 58%–65% of cases compared with nonmass enhancement, which is identified on focused US images in only 12%–32% of cases (9092). Some studies have shown that US depiction of an MR imaging correlate was independent of size (91,93,95). However, Meissnitzer et al (92) showed that size dependence is also important: For masses 5 mm or smaller, only 50% were seen, versus 56% for masses 6–10 mm, 73% for masses 11–15 mm, and 86% for masses larger than 15 mm. Likewise, this study also demonstrated that for nonmass lesions, a US correlate was found for 13% of those measuring 6–10 mm, 25% of those 11–15 mm, and 42% of those larger than 15 mm (92). In addition, many of these studies determined that when a sonographic correlate was discovered, the probability of malignancy was increased (9092). Since typical US malignant features such as spiculation and posterior shadowing may be absent and the pretest probability is higher for MR imaging–detected lesions, a lower threshold for biopsy should be considered when performing MR imaging–directed US compared with routine targeted US (90) or screening US.

Because lesions are often very subtle at MR-directed US examination and because of differences in patient positioning during the two examinations, careful imaging–histologic correlation is required when performing US-guided biopsy of MR imaging–detected abnormalities. For lesions sampled with a vacuum-assisted device and US guidance, Sakamoto et al (96) found a higher rate of false-negative biopsy results for MR imaging–detected lesions than for US-detected lesions, suggesting that precise US-MR imaging correlation may not have occurred. Meissnitzer et al (92) showed that although 91% of MR imaging–detected lesions had an accurate US correlate, 9% were found to be inaccurate. With ever-improving techniques and experience in breast US, the US visualization of MR imaging–detected abnormalities will likely continue to improve. Nevertheless, if a suspicious lesion is not identified sonographically, MR imaging–guided biopsy should still be performed, because the malignancy rate of sonographically occult MR imaging–detected lesions has been shown to range from 14% to 22% (91,95).


Preoperative Staging of Cancer with US

Breast MR imaging has been shown to be more sensitive than US in the detection of additional foci of mammographically occult disease in women with newly diagnosed breast cancer (9799). Nevertheless, when a highly suspicious mass is identified at mammography and US, immediate US evaluation of the remainder of the ipsilateral breast, the contralateral breast, and the axilla should be considered. If additional lesions are identified, preoperative staging with MR imaging can be avoided and US-guided biopsy can be promptly performed, saving the patient valuable time and expense (100). In a study by Moon et al (101), of 201 patients with newly diagnosed breast cancer, staging US demonstrated mammographically occult multifocal or multicentric disease in 28 patients (14%) and contralateral breast cancers in eight patients (4%), resulting in a change in therapy in 32 patients (16%).

US can also be used to identify abnormal axillary, supraclavicular, and internal mammary lymph nodes. Abnormal lymph nodes characteristically demonstrate focal or diffuse cortical thickening (≥3 mm in thickness), a round (rather than oval or reniform) shape, loss of the echogenic fatty hilum and/or nonhilar, disorganized, irregular blood vessels (102,103) (Fig 14). A positive US-guided CNB or fine-needle aspiration of a clinically abnormal axillary lymph node in a patient with a known breast cancer can aid patient management, by avoiding the need for sentinel node biopsy and allowing the patient instead to proceed directly to axillary lymph node dissection or neoadjuvant chemotherapy.

Picture14


 Interventional Breast US

US-guided interventional procedures have increased in volume in recent years and US is now the primary biopsy guidance technique used in many breast imaging centers. Most palpable lesions, as well as lesions detected at mammography, MR imaging, or screening US, can be sampled with US. With current high-resolution transducers, even suspicious intraductal microcalcifications may be detected and sampled.

While US-guided procedures require technical skills that must be developed and can be challenging, once mastered this technique allows precise real-time sampling of the lesion, which is not possible with either stereotactic or MR imaging–guided procedures. US-guided procedures do not require ionizing radiation or intravenous contrast material. US procedures are more tolerable for patients than stereotactic (104) or MR imaging–guided procedures because US-guided procedures are faster and more comfortable, as breast compression and uncomfortable biopsy coils or tables are not necessary and the procedure may be performed with the patient supine (104106).

Most literature has shown that automated 14-gauge CNB devices are adequate for the majority of US-guided biopsies (107115). Image-guided CNB is preferable to fine-needle aspiration cytology of breast masses because of superior sensitivity, specificity, and diagnostic accuracy (116). DCIS, malignant invasion, and hormone receptor status of invasive breast cancers can be determined with CNB samples, but not with fine-needle aspiration cytology. Fine-needle aspiration may be performed, however, in complicated cysts and symptomatic simple cysts. In these cases, the cyst aspirate fluid can often be discarded; cytology is usually only necessary if the fluid is frankly bloody (117).

The choice of performing fine-needle aspiration or CNB of a suspicious axillary lymph node depends on radiologist preference and the availability of an experienced cytopathologist, although CNB is usually more accurate than fine-needle aspiration biopsy (118,119). Fine-needle aspiration may be preferred for suspicious deep lymph nodes in proximity to the axillary vessels, whereas CNB may be preferred in large nodes with thickened cortices, particularly if determination of hormone receptor status or immunohistochemistry is desired, since more tissue is required for these assays. If lymphoma is suspected, a core should be placed in saline and also in conventional formalin.

While the underestimation rate of malignancy can be considerable for high-risk lesions such as atypical hyperplasia, such histology is not commonly found in lesions undergoing US-guided CNB. Multiple studies have shown a false-negative rate for US CNB biopsy of around 2%–3% (107115). Although the contiguous and larger samples obtained with a vacuum-assisted biopsy device undoubtedly reduce sampling error, the vacuum-assisted biopsy is a more expensive and more invasive procedure (109). In the authors’ experience, vacuum-assisted US biopsy is to be considered for small masses, intraductal or intracystic lesions, or lesions with subtle microcalcifications. These may be difficult to adequately sample with a spring-loaded automatic firing device. Alternatively, for more accurate sampling of such challenging cases, as well as some axillary lymph nodes and masses smaller than 1 cm in size, automated CNB needles designed to place the inner trough of the needle within a lesion before firing can be utilized (Fig 15). With this technique, the sampling trough of the CNB needle can be clearly visualized within the lesion before the overlying outer sheath is fired. Regardless of needle choice, a postbiopsy clip marker should be placed followed by a postbiopsy mammogram to document clip position. This will assist with follow-up imaging, facilitating mammography and/or MR imaging correlation.

Picture15a


Picture15b

There has been recent interest in the percutaneous removal of benign breast lesions by using US-guided vacuum-assisted biopsy. While in general, proved benign concordant lesions can safely remain in the breast, some patients desire removal. Percutaneous US-guided removal with a vacuum-assisted biopsy device can replace surgical removal in some cases, particularly for small lesions (1 cm in size or less). Several reports have shown promising results demonstrating rates of complete lesion excision, varying from 61% to 94% (120124). Dennis et al (125) demonstrated that vacuum-assisted US-guided biopsy could be used to excise intraductal lesions resulting in resolution of problematic nipple discharge in 97% of patients. Even on long-term follow-up, most studies show low rates of residual masses, more commonly observed in larger fibroadenomas.


 Intraoperative Breast US

The use of two-dimensional and 3D intraoperative US may decrease the incidence of positive margins and decrease re-excision rates (126130) particularly in the setting of lumpectomy for palpable cancers, when US is used to assess the adequacy of surgical margins to determine the need for additional tissue removal. Similarly, intraoperative US has also been utilized to improve detection and removal of metastatic lymph nodes during sentinel lymph node assessment (131).


Future Directions

Intravenous US microbubble contrast agents have been used to enhance US diagnosis by means of analysis, enhancement patterns, the rates of uptake and washout, and identification of tumor angiogenesis. In addition, preliminary research has shown that intravenous US contrast agents may be able to depict tissue function with the potential to deliver targeted gene therapy to selected tumor cells (132). However, there are currently no intravenous US contrast agents approved for use in breast imaging by the U.S. Food and Drug Administration. Other potential advances in breast US include fusion imaging, which involves the direct overlay of correlative MR imaging with targeted US. Another evolving area is that of US computer-aided detection, which may be of particular benefit when combined with automated whole-breast screening US.


 Summary

Technical advances in US now allow comprehensive US diagnosis, management, and treatment of breast lesions. Optimal use of US technology, meticulous scanning technique with careful attention to lesion morphology, and recognition and synthesis of findings from multiple imaging modalities are essential for optimal patient management. In the future, as radiologists utilize US for an ever-increasing scope of indications, become aware of the more subtle sonographic findings of breast cancer, and apply newly developing tools, the value of breast US will likely continue to increase and evolve.


Essentials

  • • Breast US is operator dependent; knowledge and understanding of the various technical options currently available are important for image optimization and accurate diagnosis.
  • • US is an interactive, dynamic modality and real-time scanning is necessary to assess subtle findings associated with malignancy.
  • • Ability to synthesize the information obtained from the breast US examination with concurrent mammography, MR imaging, and clinical breast examination is necessary for accurate diagnosis.
  • • The use of screening breast US in addition to mammography, particularly in women with dense breast tissue, is becoming more widely accepted in the United States.
  • • Breast US guidance is the primary biopsy method used in most breast imaging practices, and the radiologist should be familiar with various biopsy devices and techniques to adequately sample any breast mass identified at US.


Disclosures of Conflicts of Interest: R.J.H. No relevant conflicts of interest to disclose. L.M.S. Financial activities related to the present article: none to disclose. Financial activities not related to the present article: educational consultant in vascular US to Philips Healthcare; payment for lectures on breast US from Educational Symposia; payment for development of educational presentations from Philips Healthcare. Other relationships: none to disclose. L.E.P. Financial activities related to the present article: none to disclose. Financial activities not related to the present article: consultant to Hologic. Other relationships: none to disclose.

Abbreviations:

BI-RADS = Breast Imaging and Reporting Data System

CNB = core needle biopsy

DCIS = ductal carcinoma in situ

3D = three dimensional

References

    1. Dempsey PJ

    . The history of breast ultrasound. J Ultrasound Med2004;23(7):887–894.

    1. Stavros AT,
    2. Thickman D,
    3. Rapp CL,
    4. Dennis MA,
    5. Parker SH,
    6. Sisney GA

    . Solid breast nodules: use of sonography to distinguish between benign and malignant lesions. Radiology 1995;196(1):123–134.

    1. Mainiero MB,
    2. Goldkamp A,
    3. Lazarus E,
    4. et al

    . Characterization of breast masses with sonography: can biopsy of some solid masses be deferred? J Ultrasound Med 2005;24(2):161–167.

    1. Graf O,
    2. Helbich TH,
    3. Hopf G,
    4. Graf C,
    5. Sickles EA

    . Probably benign breast masses at US: is follow-up an acceptable alternative to biopsy? Radiology2007;244(1):87–93.

    1. Mendelson EB,
    2. Baum JK,
    3. Berg WA,
    4. Merritt CR,
    5. Rubin E

    . Breast Imaging Reporting Data System. BI-RADS: Ultrasound. Reston, Va: American College of Radiology, 2003.

    1. Berg WA,
    2. Blume JD,
    3. Cormack JB,
    4. Mendelson EB

    . Training the ACRIN 6666 Investigators and effects of feedback on breast ultrasound interpretive performance and agreement in BI-RADS ultrasound feature analysis. AJR Am J Roentgenol 2012;199(1):224–235.

    1. Stafford RJ,
    2. Whitman GJ

    . Ultrasound physics and technology in breast imaging. Ultrasound Clin 2011;6(3):299–312.

    1. Weinstein SP,
    2. Conant EF,
    3. Sehgal C

    . Technical advances in breast ultrasound imaging. Semin Ultrasound CT MR 2006;27(4):273–283.

    1. Athanasiou A,
    2. Tardivon A,
    3. Ollivier L,
    4. Thibault F,
    5. El Khoury C,
    6. Neuenschwander S

    . How to optimize breast ultrasound. Eur J Radiol2009;69(1):6–13.

    1. Kremkau FW

    . Sonography principles and instruments. 8th ed. St Louis, Mo: Elsevier-Saunders, 2011.

    1. Goss SA,
    2. Johnston RL,
    3. Dunn F

    . Comprehensive compilation of empirical ultrasonic properties of mammalian tissues. J Acoust Soc Am1978;64(2):423–457.

    1. Napolitano D,
    2. Chou CH,
    3. McLaughlin G,
    4. et al

    . Sound speed correction in ultrasound imaging. Ultrasonics 2006;44(Suppl 1):e43–e46.

    1. Barr RG,
    2. Rim A,
    3. Graham R,
    4. Berg W,
    5. Grajo JR

    . Speed of sound imaging: improved image quality in breast sonography. Ultrasound Q2009;25(3):141–144.

    1. Stavros AT

    . Breast ultrasound. Philadelphia, Pa: Lippincott, Williams & Wilkins, 2004.

    1. Cosgrove DO,
    2. Kedar RP,
    3. Bamber JC,
    4. et al

    . Breast diseases: color Doppler US in differential diagnosis. Radiology 1993;189(1):99–104.

    1. Sehgal CM,
    2. Arger PH,
    3. Rowling SE,
    4. Conant EF,
    5. Reynolds C,
    6. Patton JA

    .Quantitative vascularity of breast masses by Doppler imaging: regional variations and diagnostic implications. J Ultrasound Med 2000;19(7):427–440;quiz 441–442.

    1. Birdwell RL,
    2. Ikeda DM,
    3. Jeffrey SS,
    4. Jeffrey RB Jr.

    . Preliminary experience with power Doppler imaging of solid breast masses. AJR Am J Roentgenol1997;169(3):703–707.

    1. Gokalp G,
    2. Topal U,
    3. Kizilkaya E

    . Power Doppler sonography: anything to add to BI-RADS US in solid breast masses? Eur J Radiol 2009;70(1):77–85.

    1. Tozaki M,
    2. Fukuma E

    . Does power Doppler ultrasonography improve the BI-RADS category assessment and diagnostic accuracy of solid breast lesions?Acta Radiol 2011;52(7):706–710.

    1. Mehta TS,
    2. Raza S,
    3. Baum JK

    . Use of Doppler ultrasound in the evaluation of breast carcinoma. Semin Ultrasound CT MR 2000;21(4):297–307.

    1. Horvath E,
    2. Silva C,
    3. Fasce G,
    4. et al

    . Parallel artery and vein: sign of benign nature of breast masses. AJR Am J Roentgenol 2012;198(1):W76–W82.

    1. Campbell SC,
    2. Cullinan JA,
    3. Rubens DJ

    . Slow flow or no flow? Color and power Doppler US pitfalls in the abdomen and pelvis. RadioGraphics2004;24(2):497–506.

    1. Schaefer FK,
    2. Heer I,
    3. Schaefer PJ,
    4. et al

    . Breast ultrasound elastography: results of 193 breast lesions in a prospective study with histopathologic correlation. Eur J Radiol 2011;77(3):450–456.

    1. Zhao QL,
    2. Ruan LT,
    3. Zhang H,
    4. Yin YM,
    5. Duan SX

    . Diagnosis of solid breast lesions by elastography 5-point score and strain ratio method. Eur J Radiol2012;81(11):3245–3249.

    1. Stachs A,
    2. Hartmann S,
    3. Stubert J,
    4. et al

    . Differentiating between malignant and benign breast masses: factors limiting sonoelastographic strain ratio.Ultraschall Med 2013;34(2):131–136.

    1. Bercoff J,
    2. Tanter M,
    3. Fink M

    . Supersonic shear imaging: a new technique for soft tissue elasticity mapping. IEEE Trans Ultrason Ferroelectr Freq Control2004;51(4):396–409.

    1. Itoh A,
    2. Ueno E,
    3. Tohno E,
    4. et al

    . Breast disease: clinical application of US elastography for diagnosis. Radiology 2006;239(2):341–350.

    1. Berg WA,
    2. Cosgrove DO,
    3. Doré CJ,
    4. et al

    . Shear-wave elastography improves the specificity of breast US: the BE1 multinational study of 939 masses.Radiology 2012;262(2):435–449.

    1. Athanasiou A,
    2. Tardivon A,
    3. Tanter M,
    4. et al

    . Breast lesions: quantitative elastography with supersonic shear imaging—preliminary results. Radiology2010;256(1):297–303.

    1. Evans A,
    2. Whelehan P,
    3. Thomson K,
    4. et al

    . Invasive breast cancer: relationship between shear-wave elastographic findings and histologic prognostic factors.Radiology 2012;263(3):673–677.

    1. Fleury Ede F,
    2. Fleury JC,
    3. Piato S,
    4. Roveda D Jr.

    . New elastographic classification of breast lesions during and after compression. Diagn Interv Radiol 2009;15(2):96–103.

    1. Tozaki M,
    2. Fukuma E

    . Pattern classification of ShearWave™ Elastography images for differential diagnosis between benign and malignant solid breast masses. Acta Radiol 2011;52(10):1069–1075.

    1. Barr RG,
    2. Lackey AE

    . The utility of the “bull’s-eye” artifact on breast elasticity imaging in reducing breast lesion biopsy rate. Ultrasound Q2011;27(3):151–155.

    1. Cosgrove DO,
    2. Berg WA,
    3. Doré CJ,
    4. et al

    . Shear wave elastography for breast masses is highly reproducible. Eur Radiol 2012;22(5):1023–1032.

    1. Kalmantis K,
    2. Dimitrakakis C,
    3. Koumpis C,
    4. et al

    . The contribution of three-dimensional power Doppler imaging in the preoperative assessment of breast tumors: a preliminary report. Obstet Gynecol Int 2009;2009:530579.

    1. Chadha M,
    2. Young A,
    3. Geraghty C,
    4. Masino R,
    5. Harrison L

    . Image guidance using 3D-ultrasound (3D-US) for daily positioning of lumpectomy cavity for boost irradiation. Radiat Oncol 2011;6:45.

    1. Hilton SV,
    2. Leopold GR,
    3. Olson LK,
    4. Willson SA

    . Real-time breast sonography: application in 300 consecutive patients. AJR Am J Roentgenol1986;147(3):479–486.

    1. Berg WA,
    2. Sechtin AG,
    3. Marques H,
    4. Zhang Z

    . Cystic breast masses and the ACRIN 6666 experience. Radiol Clin North Am 2010;48(5):931–987.

    1. Kolb TM,
    2. Lichy J,
    3. Newhouse JH

    . Occult cancer in women with dense breasts: detection with screening US—diagnostic yield and tumor characteristics.Radiology 1998;207(1):191–199.

    1. Buchberger W,
    2. DeKoekkoek-Doll P,
    3. Springer P,
    4. Obrist P,
    5. Dünser M

    . Incidental findings on sonography of the breast: clinical significance and diagnostic workup. AJR Am J Roentgenol 1999;173(4):921–927.

    1. Berg WA,
    2. Campassi CI,
    3. Ioffe OB

    . Cystic lesions of the breast: sonographic-pathologic correlation. Radiology 2003;227(1):183–191.

    1. Chang YW,
    2. Kwon KH,
    3. Goo DE,
    4. Choi DL,
    5. Lee HK,
    6. Yang SB

    . Sonographic differentiation of benign and malignant cystic lesions of the breast. J Ultrasound Med 2007;26(1):47–53.

    1. Daly CP,
    2. Bailey JE,
    3. Klein KA,
    4. Helvie MA

    . Complicated breast cysts on sonography: is aspiration necessary to exclude malignancy? Acad Radiol2008;15(5):610–617.

    1. Venta LA,
    2. Kim JP,
    3. Pelloski CE,
    4. Morrow M

    . Management of complex breast cysts. AJR Am J Roentgenol 1999;173(5):1331–1336.

    1. Hong AS,
    2. Rosen EL,
    3. Soo MS,
    4. Baker JA

    . BI-RADS for sonography: positive and negative predictive values of sonographic features. AJR Am J Roentgenol2005;184(4):1260–1265.

    1. Raza S,
    2. Chikarmane SA,
    3. Neilsen SS,
    4. Zorn LM,
    5. Birdwell RL

    . BI-RADS 3, 4, and 5 lesions: value of US in management—follow-up and outcome. Radiology2008;248(3):773–781.

    1. Harvey JA,
    2. Nicholson BT,
    3. Lorusso AP,
    4. Cohen MA,
    5. Bovbjerg VE

    . Short-term follow-up of palpable breast lesions with benign imaging features: evaluation of 375 lesions in 320 women. AJR Am J Roentgenol 2009;193(6):1723–1730.

    1. Graf O,
    2. Helbich TH,
    3. Fuchsjaeger MH,
    4. et al

    . Follow-up of palpable circumscribed noncalcified solid breast masses at mammography and US: can biopsy be averted? Radiology 2004;233(3):850–856.

    1. Linda A,
    2. Zuiani C,
    3. Lorenzon M,
    4. et al

    . Hyperechoic lesions of the breast: not always benign. AJR Am J Roentgenol 2011;196(5):1219–1224.

    1. Soon PS,
    2. Vallentine J,
    3. Palmer A,
    4. Magarey CJ,
    5. Schwartz P,
    6. Morris DL

    .Echogenicity of breast cancer: is it of prognostic value? Breast2004;13(3):194–199.

    1. Moon WK,
    2. Myung JS,
    3. Lee YJ,
    4. Park IA,
    5. Noh DY,
    6. Im JG

    . US of ductal carcinoma in situ. RadioGraphics 2002;22(2):269–280; discussion 280–281.

    1. Yang WT,
    2. Tse GM

    . Sonographic, mammographic, and histopathologic correlation of symptomatic ductal carcinoma in situ. AJR Am J Roentgenol2004;182(1):101–110.

    1. Izumori A,
    2. Takebe K,
    3. Sato A

    . Ultrasound findings and histological features of ductal carcinoma in situ detected by ultrasound examination alone. Breast Cancer 2010;17(2):136–141.

    1. Park JS,
    2. Park YM,
    3. Kim EK,
    4. et al

    . Sonographic findings of high-grade and non-high-grade ductal carcinoma in situ of the breast. J Ultrasound Med2010;29(12):1687–1697.

    1. Moon WK,
    2. Im JG,
    3. Koh YH,
    4. Noh DY,
    5. Park IA

    . US of mammographically detected clustered microcalcifications. Radiology 2000;217(3):849–854.

    1. Soo MS,
    2. Baker JA,
    3. Rosen EL

    . Sonographic detection and sonographically guided biopsy of breast microcalcifications. AJR Am J Roentgenol2003;180(4):941–948.

  1. ACR Practice Guideline for the Performance of a Breast Ultrasound Examination. American College of Radiology. http://www.acr.org/Quality-Safety/Standards-Guidelines./Practice-Guidelines-by-Modality/Ultrasound. Published 2011.
    1. Abdullah N,
    2. Mesurolle B,
    3. El-Khoury M,
    4. Kao E

    . Breast imaging reporting and data system lexicon for US: interobserver agreement for assessment of breast masses. Radiology 2009;252(3):665–672.

    1. Heinig J,
    2. Witteler R,
    3. Schmitz R,
    4. Kiesel L,
    5. Steinhard J

    . Accuracy of classification of breast ultrasound findings based on criteria used for BI-RADS.Ultrasound Obstet Gynecol 2008;32(4):573–578.

    1. Mansel R

    . Management of breast pain. In: Harris JR, Lippman ME, MorrowM, Osborne CK, eds. Diseases of the breast. 4th ed. Philadelphia, Pa:Lippincott Williams & Wilkins, 2010; 52.

    1. Leung JW,
    2. Kornguth PJ,
    3. Gotway MB

    . Utility of targeted sonography in the evaluation of focal breast pain. J Ultrasound Med 2002;21(5):521–526; quiz 528–529.

    1. Loving VA,
    2. DeMartini WB,
    3. Eby PR,
    4. Gutierrez RL,
    5. Peacock S,
    6. Lehman CD

    .Targeted ultrasound in women younger than 30 years with focal breast signs or symptoms: outcomes analyses and management implications. AJR Am J Roentgenol 2010;195(6):1472–1477.

    1. Soo MS,
    2. Rosen EL,
    3. Baker JA,
    4. Vo TT,
    5. Boyd BA

    . Negative predictive value of sonography with mammography in patients with palpable breast lesions. AJR Am J Roentgenol 2001;177(5):1167–1170.

    1. Tumyan L,
    2. Hoyt AC,
    3. Bassett LW

    . Negative predictive value of sonography and mammography in patients with focal breast pain. Breast J2005;11(5):333–337.

    1. Lehman CD,
    2. Lee CI,
    3. Loving VA,
    4. Portillo MS,
    5. Peacock S,
    6. DeMartini WB

    .Accuracy and value of breast ultrasound for primary imaging evaluation of symptomatic women 30-39 years of age. AJR Am J Roentgenol2012;199(5):1169–1177.

    1. Ballesio L,
    2. Maggi C,
    3. Savelli S,
    4. et al

    . Role of breast magnetic resonance imaging (MRI) in patients with unilateral nipple discharge: preliminary study.Radiol Med (Torino) 2008;113(2):249–264.

    1. Sabel MS,
    2. Helvie MA,
    3. Breslin T,
    4. et al

    . Is duct excision still necessary for all cases of suspicious nipple discharge? Breast J 2012;18(2):157–162.

    1. Morrogh M,
    2. Morris EA,
    3. Liberman L,
    4. Borgen PI,
    5. King TA

    . The predictive value of ductography and magnetic resonance imaging in the management of nipple discharge. Ann Surg Oncol 2007;14(12):3369–3377.

    1. Robbins J,
    2. Jeffries D,
    3. Roubidoux M,
    4. Helvie M

    . Accuracy of diagnostic mammography and breast ultrasound during pregnancy and lactation. AJR Am J Roentgenol 2011;196(3):716–722.

    1. Liberman L,
    2. Giess CS,
    3. Dershaw DD,
    4. Deutch BM,
    5. Petrek JA

    . Imaging of pregnancy-associated breast cancer. Radiology 1994;191(1):245–248.

    1. Ahn BY,
    2. Kim HH,
    3. Moon WK,
    4. et al

    . Pregnancy- and lactation-associated breast cancer: mammographic and sonographic findings. J Ultrasound Med2003;22(5):491–497; quiz 498–499.

    1. Kolb TM,
    2. Lichy J,
    3. Newhouse JH

    . Comparison of the performance of screening mammography, physical examination, and breast US and evaluation of factors that influence them: an analysis of 27,825 patient evaluations. Radiology 2002;225(1):165–175.

    1. Buchberger W,
    2. Niehoff A,
    3. Obrist P,
    4. DeKoekkoek-Doll P,
    5. Dünser M

    . Clinically and mammographically occult breast lesions: detection and classification with high-resolution sonography. Semin Ultrasound CT MR 2000;21(4):325–336.

    1. Crystal P,
    2. Strano SD,
    3. Shcharynski S,
    4. Koretz MJ

    . Using sonography to screen women with mammographically dense breasts. AJR Am J Roentgenol2003;181(1):177–182.

    1. Gordon PB,
    2. Goldenberg SL

    . Malignant breast masses detected only by ultrasound: a retrospective review. Cancer 1995;76(4):626–630.

    1. Kaplan SS

    . Clinical utility of bilateral whole-breast US in the evaluation of women with dense breast tissue. Radiology 2001;221(3):641–649.

    1. Berg WA,
    2. Blume JD,
    3. Cormack JB,
    4. et al

    . Combined screening with ultrasound and mammography vs mammography alone in women at elevated risk of breast cancer. JAMA 2008;299(18):2151–2163.

    1. Hooley RJ,
    2. Greenberg KL,
    3. Stackhouse RM,
    4. Geisel JL,
    5. Butler RS,
    6. Philpotts LE

    . Screening US in patients with mammographically dense breasts: initial experience with Connecticut Public Act 09-41. Radiology2012;265(1):59–69.

    1. Leconte I,
    2. Feger C,
    3. Galant C,
    4. et al

    . Mammography and subsequent whole-breast sonography of nonpalpable breast cancers: the importance of radiologic breast density. AJR Am J Roentgenol 2003;180(6):1675–1679.

    1. Corsetti V,
    2. Houssami N,
    3. Ferrari A,
    4. et al

    . Breast screening with ultrasound in women with mammography-negative dense breasts: evidence on incremental cancer detection and false positives, and associated cost. Eur J Cancer2008;44(4):539–544.

    1. Bae MS,
    2. Han W,
    3. Koo HR,
    4. et al

    . Characteristics of breast cancers detected by ultrasound screening in women with negative mammograms. Cancer Sci2011;102(10):1862–1867.

    1. Berg WA,
    2. Zhang Z,
    3. Lehrer D,
    4. et al

    . Detection of breast cancer with addition of annual screening ultrasound or a single screening MRI to mammography in women with elevated breast cancer risk. JAMA 2012;307(13):1394–1404.

  2. ACRIN 6666: Screening Breast Ultrasound in High-Risk Women. American College of Radiology Imaging Network.http://acrin.org/Portals/0/Protocols/6666/Protocol-ACRIN%206666%20Admin%20Update%2011.30.07.pdf. Published November 9, 2007.
    1. Kelly KM,
    2. Richwald GA

    . Automated whole-breast ultrasound: advancing the performance of breast cancer screening. Semin Ultrasound CT MR2011;32(4):273–280.

    1. Kelly KM,
    2. Dean J,
    3. Lee SJ,
    4. Comulada WS

    . Breast cancer detection: radiologists’ performance using mammography with and without automated whole-breast ultrasound. Eur Radiol 2010;20(11):2557–2564.

    1. Chang JM,
    2. Moon WK,
    3. Cho N,
    4. Park JS,
    5. Kim SJ

    . Breast cancers initially detected by hand-held ultrasound: detection performance of radiologists using automated breast ultrasound data. Acta Radiol 2011;52(1):8–14.

    1. Berg WA

    . Supplemental screening sonography in dense breasts. Radiol Clin North Am 2004;42(5):845–851, vi.

    1. Morrow M,
    2. Waters J,
    3. Morris E

    . MRI for breast cancer screening, diagnosis, and treatment. Lancet 2011;378(9805):1804–1811.

    1. Hashimoto BE,
    2. Morgan GN,
    3. Kramer DJ,
    4. Lee M

    . Systematic approach to difficult problems in breast sonography. Ultrasound Q 2008;24(1):31–38.

    1. Abe H,
    2. Schmidt RA,
    3. Shah RN,
    4. et al

    . MR-directed (“second-look”) ultrasound examination for breast lesions detected initially on MRI: MR and sonographic findings. AJR Am J Roentgenol 2010;194(2):370–377.

    1. Demartini WB,
    2. Eby PR,
    3. Peacock S,
    4. Lehman CD

    . Utility of targeted sonography for breast lesions that were suspicious on MRI. AJR Am J Roentgenol 2009;192(4):1128–1134.

    1. Meissnitzer M,
    2. Dershaw DD,
    3. Lee CH,
    4. Morris EA

    . Targeted ultrasound of the breast in women with abnormal MRI findings for whom biopsy has been recommended. AJR Am J Roentgenol 2009;193(4):1025–1029.

    1. Candelaria R,
    2. Fornage BD

    . Second-look US examination of MR-detected breast lesions. J Clin Ultrasound 2011;39(3):115–121.

    1. Carbognin G,
    2. Girardi V,
    3. Calciolari C,
    4. et al

    . Utility of second-look ultrasound in the management of incidental enhancing lesions detected by breast MR imaging. Radiol Med (Torino) 2010;115(8):1234–1245.

    1. LaTrenta LR,
    2. Menell JH,
    3. Morris EA,
    4. Abramson AF,
    5. Dershaw DD,
    6. Liberman L

    .Breast lesions detected with MR imaging: utility and histopathologic importance of identification with US. Radiology 2003;227(3):856–861.

    1. Sakamoto N,
    2. Tozaki M,
    3. Higa K,
    4. Abe S,
    5. Ozaki S,
    6. Fukuma E

    . False-negative ultrasound-guided vacuum-assisted biopsy of the breast: difference with US-detected and MRI-detected lesions. Breast Cancer 2010;17(2):110–117.

    1. Hlawatsch A,
    2. Teifke A,
    3. Schmidt M,
    4. Thelen M

    . Preoperative assessment of breast cancer: sonography versus MR imaging. AJR Am J Roentgenol2002;179(6):1493–1501.

    1. Zhang Y,
    2. Fukatsu H,
    3. Naganawa S,
    4. et al

    . The role of contrast-enhanced MR mammography for determining candidates for breast conservation surgery.Breast Cancer 2002;9(3):231–239.

    1. Berg WA,
    2. Gutierrez L,
    3. NessAiver MS,
    4. et al

    . Diagnostic accuracy of mammography, clinical examination, US, and MR imaging in preoperative assessment of breast cancer. Radiology 2004;233(3):830–849.

    1. Yang W

    . Staging of breast cancer with ultrasound. Semin Ultrasound CT MR 2011;32(4):331–341.

    1. Moon WK,
    2. Noh DY,
    3. Im JG

    . Multifocal, multicentric, and contralateral breast cancers: bilateral whole-breast US in the preoperative evaluation of patients.Radiology 2002;224(2):569–576.

    1. Mainiero MB,
    2. Cinelli CM,
    3. Koelliker SL,
    4. Graves TA,
    5. Chung MA

    . Axillary ultrasound and fine-needle aspiration in the preoperative evaluation of the breast cancer patient: an algorithm based on tumor size and lymph node appearance. AJR Am J Roentgenol 2010;195(5):1261–1267.

    1. Bedi DG,
    2. Krishnamurthy R,
    3. Krishnamurthy S,
    4. et al

    . Cortical morphologic features of axillary lymph nodes as a predictor of metastasis in breast cancer: in vitro sonographic study. AJR Am J Roentgenol 2008;191(3):646–652.

    1. Mainiero MB,
    2. Gareen IF,
    3. Bird CE,
    4. Smith W,
    5. Cobb C,
    6. Schepps B

    . Preferential use of sonographically guided biopsy to minimize patient discomfort and procedure time in a percutaneous image-guided breast biopsy program. J Ultrasound Med 2002;21(11):1221–1226.

    1. Philpotts LE

    . Percutaneous breast biopsy: emerging techniques and continuing controversies. Semin Roentgenol 2007;42(4):218–227.

    1. Harvey JA,
    2. Moran RE,
    3. DeAngelis GA

    . Technique and pitfalls of ultrasound-guided core-needle biopsy of the breast. Semin Ultrasound CT MR2000;21(5):362–374.

    1. Parker SH,
    2. Jobe WE,
    3. Dennis MA,
    4. et al

    . US-guided automated large-core breast biopsy. Radiology 1993;187(2):507–511.

    1. Liberman L,
    2. Drotman M,
    3. Morris EA,
    4. et al

    . Imaging-histologic discordance at percutaneous breast biopsy. Cancer 2000;89(12):2538–2546.

    1. Philpotts LE,
    2. Hooley RJ,
    3. Lee CH

    . Comparison of automated versus vacuum-assisted biopsy methods for sonographically guided core biopsy of the breast.AJR Am J Roentgenol 2003;180(2):347–351.

    1. Shah VI,
    2. Raju U,
    3. Chitale D,
    4. Deshpande V,
    5. Gregory N,
    6. Strand V

    . False-negative core needle biopsies of the breast: an analysis of clinical, radiologic, and pathologic findings in 27 concecutive cases of missed breast cancer. Cancer2003;97(8):1824–1831.

    1. Crystal P,
    2. Koretz M,
    3. Shcharynsky S,
    4. Makarov V,
    5. Strano S

    . Accuracy of sonographically guided 14-gauge core-needle biopsy: results of 715 consecutive breast biopsies with at least two-year follow-up of benign lesions.J Clin Ultrasound 2005;33(2):47–52.

    1. Dillon MF,
    2. Hill AD,
    3. Quinn CM,
    4. O’Doherty A,
    5. McDermott EW,
    6. O’Higgins N

    . The accuracy of ultrasound, stereotactic, and clinical core biopsies in the diagnosis of breast cancer, with an analysis of false-negative cases. Ann Surg 2005;242(5):701–707.

    1. Povoski SP,
    2. Jimenez RE,
    3. Wang WP

    . Ultrasound-guided diagnostic breast biopsy methodology: retrospective comparison of the 8-gauge vacuum-assisted biopsy approach versus the spring-loaded 14-gauge core biopsy approach. World J Surg Oncol 2011;9:87.

    1. Bolívar AV,
    2. Alonso-Bartolomé P,
    3. García EO,
    4. Ayensa FG

    . Ultrasound-guided core needle biopsy of non-palpable breast lesions: a prospective analysis in 204 cases. Acta Radiol 2005;46(7):690–695.

    1. Youk JH,
    2. Kim EK,
    3. Kim MJ,
    4. Kwak JY,
    5. Son EJ

    . Analysis of false-negative results after US-guided 14-gauge core needle breast biopsy. Eur Radiol2010;20(4):782–789.

    1. Garg S,
    2. Mohan H,
    3. Bal A,
    4. Attri AK,
    5. Kochhar S

    . A comparative analysis of core needle biopsy and fine-needle aspiration cytology in the evaluation of palpable and mammographically detected suspicious breast lesions. Diagn Cytopathol2007;35(11):681–689.

    1. Ciatto S,
    2. Cariaggi P,
    3. Bulgaresi P

    . The value of routine cytologic examination of breast cyst fluids. Acta Cytol 1987;31(3):301–304.

    1. Rao R,
    2. Lilley L,
    3. Andrews V,
    4. Radford L,
    5. Ulissey M

    . Axillary staging by percutaneous biopsy: sensitivity of fine-needle aspiration versus core needle biopsy. Ann Surg Oncol 2009;16(5):1170–1175.

    1. Gong JZ,
    2. Snyder MJ,
    3. Lagoo AS,
    4. et al

    . Diagnostic impact of core-needle biopsy on fine-needle aspiration of non-Hodgkin lymphoma. Diagn Cytopathol2004;31(1):23–30.

    1. Ko ES,
    2. Han H,
    3. Lee BH,
    4. Choe H

    . Sonographic changes after removing all benign breast masses with sonographically guided vacuum-assisted biopsy.Acta Radiol 2009;50(9):968–974.

    1. Slanetz PJ,
    2. Wu SP,
    3. Mendel JB

    . Percutaneous excision: a viable alternative to manage benign breast lesions. Can Assoc Radiol J 2011;62(4):265–271.

    1. Yom CK,
    2. Moon BI,
    3. Choe KJ,
    4. Choi HY,
    5. Park YL

    . Long-term results after excision of breast mass using a vacuum-assisted biopsy device. ANZ J Surg2009;79(11):794–798.

    1. Kim MJ,
    2. Park BW,
    3. Kim SI,
    4. et al

    . Long-term follow-up results for ultrasound-guided vacuum-assisted removal of benign palpable breast mass. Am J Surg2010;199(1):1–7.

    1. Wang ZL,
    2. Liu G,
    3. Li JL,
    4. et al

    . Sonographically guided percutaneous excision of clinically benign breast masses. J Clin Ultrasound 2011;39(1):1–5.

    1. Dennis MA,
    2. Parker S,
    3. Kaske TI,
    4. Stavros AT,
    5. Camp J

    . Incidental treatment of nipple discharge caused by benign intraductal papilloma through diagnostic Mammotome biopsy. AJR Am J Roentgenol 2000;174(5):1263–1268.

    1. Bouton ME,
    2. Wilhelmson KL,
    3. Komenaka IK

    . Intraoperative ultrasound can facilitate the wire guided breast procedure for mammographic abnormalities.Am Surg 2011;77(5):640–646.

    1. Fisher CS,
    2. Mushawah FA,
    3. Cyr AE,
    4. Gao F,
    5. Margenthaler JA

    . Ultrasound-guided lumpectomy for palpable breast cancers. Ann Surg Oncol2011;18(11):3198–3203.

    1. Krekel NM,
    2. Lopes Cardozo AM,
    3. Muller S,
    4. Bergers E,
    5. Meijer S,
    6. van den Tol MP

    .Optimising surgical accuracy in palpable breast cancer with intra-operative breast ultrasound: feasibility and surgeons’ learning curve. Eur J Surg Oncol2011;37(12):1044–1050.

    1. Olsha O,
    2. Shemesh D,
    3. Carmon M,
    4. et al

    . Resection margins in ultrasound-guided breast-conserving surgery. Ann Surg Oncol 2011;18(2):447–452.

    1. DeJean P,
    2. Brackstone M,
    3. Fenster A

    . An intraoperative 3D ultrasound system for tumor margin determination in breast cancer surgery. Med Phys2010;37(2):564–570.

    1. Hsu GC,
    2. Ku CH,
    3. Yu JC,
    4. Hsieh CB,
    5. Yu CP,
    6. Chao TY

    . Application of intraoperative ultrasound to nonsentinel node assessment in primary breast cancer. Clin Cancer Res 2006;12(12):3746–3753.

    1. Kiessling F,
    2. Fokong S,
    3. Koczera P,
    4. Lederle W,
    5. Lammers T

    . Ultrasound microbubbles for molecular diagnosis, therapy, and theranostics. J Nucl Med2012;53(3):345–348.

Read Full Post »

Could Teleradiology contribute to “cross-borders” standardization of imaging protocols in cancer management?

Writer: Dror Nir, PhD

Teleradiology is accepted as a legitimate medical service for several years now.  It has many clinical utilities worldwide, ranging from services for expert or second opinions to comprehensive remote management of radiology departments in hospitals. Rapid advances in web-technologies infrastructure eliminated the barriers related to the transfer, reading and reporting of radiology images from remote locations. Today’s main controversies are related to issues that are relevant also to “in-house” radiology departments; e.g. clinical governance, quality assessment, work-flow and medico-legal issues.

The concept of Teleradiology is as simple as plotted in this chart.

fig1

Images are automatically uploaded from the imaging system itself or from the institution’s PACS. Reports are sent to the “client” within few hours.

The value for the users goes well beyond mere image interpretation, for example:

  • On-site physicians have more time to spend with patients.
  • Offering of additional subspecialty/multidisciplinary expertise.
  • Comprehensive image-interpretation and reporting service at reduced time-span and reduced cost
  • Sharing images and reports with referring physicians and patients with no effort.

As an example for “cross-border” standardization of a major existing radiology service, let’s consider the use-case of centralized review of mammography images. I know, quite ambitious! And; politically very challenging!

But; seem to be technologically and clinically feasible, at least according to the below quoted publication:

Teleradiology with uncompressed digital mammograms: Clinical assessment

Julia Fruehwald-Pallamar, Marion Jantsch, Katja Pinker, Ricarda Hofmeister, Friedrich Semturs, Kathrin Piegler, Daniel Staribacher, Michael Weber, Thomas H. Helbich

published online 13 April 2012.

Abstract 

Purpose

The purpose of our study was to demonstrate the feasibility of sending uncompressed digital mammograms in a teleradiologic setting without loss of information by comparing image quality, lesion detection, and BI-RADS assessment.

Materials and methods

CDMAM phantoms were sent bidirectionally to two hospitals via the network. For the clinical aspect of the study, 200 patients were selected based on the BI-RAD system: 50% BI-RADS I and II; and 50% BI-RADS IV and V. Two hundred digital mammograms (800 views) were sent to two different institutions via a teleradiology network. Three readers evaluated those 200 mammography studies at institution 1 where the images originated, and in the two other institutions (institutions 2 and 3) where the images were sent. The readers assessed image quality, lesion detection, and BI-RADS classification.

Results

Automatic readout showed that CDMAM image quality was identical before and after transmission. The image quality of the 200 studies (total 600 mammograms) was rated as very good or good in 90–97% before and after transmission. Depending on the institution and the reader, only 2.5–9.5% of all studies were rated as poor. The congruence of the readers with respect to the final BI-RADS assessment ranged from 90% and 91% at institution 1 vs. institution 2, and from 86% to 92% at institution 1 vs. institution 3. The agreement was even higher for conformity of content (BI-RADS I or II and BI-RADS IV or V). Reader agreement in the three different institutions with regard to the detection of masses and calcifications, as well as BI-RADS classification, was very good (κ: 0.775–0.884). Results for interreader agreement were similar.

Conclusion

Uncompressed digital mammograms can be transmitted to different institutions with different workstations, without loss of information. The transmission process does not significantly influence image quality, lesion detection, or BI-RADS rating.

Keywords: Breast cancerImagingDigital mammographyTeleradiologyComparative studies


What could be the benefits from centralizing mammography interpretation through Teleradiology?

  • A baseline protocol that could enable pulling together large number of cases from different populations without having to worry about differences in practice and experience of reporters. This will enable better epidemiology studies of this disease.
  • Quantified measure, in real-time, of the relative quality of imaging between institutions could contribute to bringing all screening services to a maximal level.
  • Development of comprehensive training program for radiologists involved in mammography based screening of breast cancer.
  • Better information sharing between all players involved in the pathway of each individual patient could improve clinical decision making and patient’s support.
  • Lower costs of screening programs, disease treatment and follow-up.

Who could organize and carry out such an operation?

There are many reputable large university hospitals already offering Teleradiology services. They are already supported by government’s funds in addition to the fact that the service itself is carrying profits. I’m not listing any of these for obvious reasons, but; google “teleradiology” will bring you many results.

Read Full Post »

Reporter: Aviva Lev-Ari, PhD, RN


Changes in breast density point to tamoxifen‘s effectiveness

By Kate Madden Yee, AuntMinnie.com staff writer

April 22, 2013 — If women being treated with tamoxifen for breast cancer see their breast density drop, they may have a 50% lower risk of dying from the disease, according to a new study by Swedish researchers published online April 22 in the Journal of Clinical Oncology.

Shaping the future of breast imaging technology
With a range of innovative breast imaging technologies: low-dose mammography, ultrasound, and MRI, all supported by leading-edge information management, Philips is setting new standards in breast care. Pick up lesions early, diagnose them quickly, enhance efficiency and productivity, and give patients physical comfort. Learn more.

In a study that hints at a role for breast density measurement in predicting therapy response, researchers at Karolinska Institutet in Stockholm found that women who had a relative reduction of more than 20% in the absolute dense area of their breast tissue during the course of tamoxifen treatment had a 50% reduction in breast cancer mortality over a span of 15 years, compared with women who had little or no change (JCO, April 22, 2013).

Tamoxifen is usually given over five years to prevent the recurrence of breast cancer in women who have completed their primary treatment. The researchers conducted the study to assess whether there was a link between reduced tissue density and the effectiveness of tamoxifen therapy.

Dr. Per Hall

Dr. Per Hall from Karolinska Institutet.

No method has been available for assessing which women are likely to respond to tamoxifen and not relapse with breast cancer, according to Dr. Per Hall and colleagues.

“To the best of our knowledge, this is the first time mammographic density change has been used as a prognostic marker of response to tamoxifen,” Hall and colleagues wrote. “We observed that women treated with tamoxifen who experienced mammographic density reduction were associated with substantially better long-term breast-cancer-specific survival. If validated, mammographic density change has the potential to be an early marker for therapy response.”

For the study, Hall and colleagues included data collected in Sweden between 1993 and 1995 from 974 postmenopausal patients with breast cancer who had both baseline and follow-up mammograms. Of these, 474 patients received tamoxifen treatment and 500 did not. The team measured mammographic density using a statistical method that expressed the data as absolute dense area.

During the follow-up period, 121 patients (12.4%) died from breast cancer. But women who were treated with tamoxifen and who experienced a relative density reduction of more than 20% had a 50% lower risk of death, compared with women whose breast density didn’t change, the team found.

In the group that was not treated with tamoxifen, there was no statistically significant association between mammographic density change and survival, and the survival advantage was not found when absolute dense areas at baseline or follow-up were evaluated separately.

The findings come on the heels of a recommendation issued on April 15 from the U.S. Preventive Services Task Force (USPSTF) regarding the use of tamoxifen and a related drug, raloxifene, as preventive measures against breast cancer in asymptomatic women. The USPSTF suggests that women who are at increased risk for breast cancer talk to their physician about the potential benefits and harms of the drugs to prevent breast cancer; women who are not at increased risk should not use them.

If further research confirms the Swedish group’s findings, mammographic density change has the potential to be an early marker for therapy response, Hall and colleagues wrote. In fact, given ongoing developments in automatic algorithms for mammographic density measurement, using density change to monitor the effectiveness of treatment could be a cost-effective clinical tool.

“What’s needed is accurate measurement of mammographic density,” Hall said in a statement released by the Karolinska Institutet. “Measuring changes in density can be a simple and cheap means of assessing the effect of the treatment. If a patient is not responding to tamoxifen, maybe they should be given a different drug.”

Related Reading

ARRS: Breast US spots missed cancers in dense breasts, April 18, 2013

AHRA backs Are You Dense Advocacy, April 10, 2013

Calif. breast density bill goes into effect, April 1, 2013

Rads judge breast density the same for digital, analog mammo, February 28, 2013

Yearly screening breast US benefits women with dense tissue, December 4, 2012
Copyright © 2013 AuntMinnie.com

http://www.auntminnie.com/index.aspx?sec=sup&sub=wom&pag=dis&ItemID=103197&wf=5401


Read Full Post »

Not applying evidence-based medicine drives up the costs of screening for breast-cancer in the USA

Author: Dror Nir


Costs for breast screening are being driven higher by increased use of new imaging technologies such as digital mammography and MRI, workflows incorporating 2nd and 3rd remote-readings as quality control measure, use of computer-aided detection (CAD) applications and growth in aged population.

According to recent publication in JAMA, 40% of the annual spending is for screening women ages 75 and older. Under existing guidelines routine screening is not recommended for this age group since “There is insufficient evidence to assess the benefits and harms of screening mammography”

The study population comprised women of 66 to 100 years old. “Forty-two percent of the women in the study were younger than age 75, and almost 60% of this group had one or more screening mammograms. Women ages 75 to 85 represented 40% of the total; 42% of this group had mammograms. Women 85 years and older represented 18% of the total; only 15% of this group had mammograms. Women with multiple chronic health conditions were much less likely to have a mammogram (26.6%) than healthy women (47.4%).”

“Abstract

The Cost of Breast Cancer Screening in the Medicare Population.

Cary P. Gross, MD; Jessica B. Long, MPH; Joseph S. Ross, MD, MHS; Maysa M. Abu-Khalaf, MD; Rong Wang, PhD; Brigid K. Killelea, MD, MPH; Heather T. Gold, PhD; Anees B. Chagpar, MD, MA, MPH, MSc; Xiaomei Ma, PhD

JAMA Intern Med. 2013;():1-7. doi:10.1001/jamainternmed.2013.1397. Published online January 7, 2013

Background  Little is known about the cost to Medicare of breast cancer screening or whether regional-level screening expenditures are associated with cancer stage at diagnosis or treatment costs, particularly because newer breast cancer screening technologies, like digital mammography and computer-aided detection (CAD), have diffused into the care of older women.

Methods Using the linked Surveillance, Epidemiology, and End Results–Medicare database, we identified 137 274 women ages 66 to 100 years who had not had breast cancer and assessed the cost to fee-for-service Medicare of breast cancer screening and workup during 2006 to 2007. For women who developed cancer, we calculated initial treatment cost. We then assessed screening-related cost at the Hospital Referral Region (HRR) level and evaluated the association between regional expenditures and workup test utilization, cancer incidence, and treatment costs.

Results In the United States, the annual costs to fee-for-service Medicare for breast cancer screening-related procedures (comprising screening plus workup) and treatment expenditures were $1.08 billion and $1.36 billion, respectively. For women 75 years or older, annual screening-related expenditures exceeded $410 million. Age-standardized screening-related cost per beneficiary varied more than 2-fold across regions (from $42 to $107 per beneficiary); digital screening mammography and CAD accounted for 65% of the difference in screening-related cost between HRRs in the highest and lowest quartiles of cost. Women residing in HRRs with high screening costs were more likely to be diagnosed as having early-stage cancer (incidence rate ratio, 1.78 [95% CI, 1.40-2.26]). There was no significant difference in the cost of initial cancer treatment per beneficiary between the highest and lowest screening cost HRRs ($151 vs $115; P = .20).

Conclusions The cost to Medicare of breast cancer screening exceeds $1 billion annually in the fee-for-service program. Regional variation is substantial and driven by the use of newer and more expensive technologies; it is unclear whether higher screening expenditures are achieving better breast cancer outcomes.”

The study is mainly addressing the difference in costs between different regions of referrals. It would be interesting to explore the situation in the age group of 40 to 66 years old.

Written by:  Dr. Dror Nir, PhD.

Read Full Post »

What could transform an underdog into a winner?

Author and Curator: Dror Nir, PhD

Many feedbacks to my last post reflected radiologists’ perception of ultrasound as a low-tech, unreliable imaging device.

Ultrasounds most manifested limitation by radiologists is that its performance is too-much user-dependent. This opinion finds support in numerous clinical studies concluding that ultrasound-based assessment of a cancer patient varies with the operator.

How come that an imaging technology that is not only  low-cost, simple to operate and risk-free to the patient, but has also gained a leading position in certain domain, like obstetrics,  is perceived as the underdog when it comes  to cancer assessment? Could it be because of its positioning as a “multi-purpose” system, which requires only very basic training?

If indeed this is the case, it doesn’t require “rocket-science” to turn it around. It only needs designing dedicated ultrasound machines who offer a comprehensive solution to one specific clinical need. Using such machines will require highly skilled operators who will enjoy a superior workflow, reporting tools and proven clinical guidelines.

The unsatisfactory reality of mammography-based breast cancer screening, as evident by epidemiology data and expert-panels’ reports, opens the opportunity to transform ultrasound into a winner in the niche-market of breast cancer screening and diagnosis. It’s a significant market that justifies the investment in ultrasound systems dedicated to detection and characterisation of breast cancer lesions.

No doubt, that the ability to provide accurate and standardized interpretation of such ultrasound systems’ scans is a pre-requisite. Ultrasound-based tissue characterisation is a must for any application aiming at standardized image interpretation. A sample out-of present ultrasound-based technologies aiming at providing some level of tissue-characterisation are listed below. Recent clinical studies show promising results using these technologies. It is worth watching carefully to see if any of those could be part of a future ultrasound-based solution to breast cancer screening.

Solid Breast Lesions: Clinical Experience with US-guided Diffuse Optical Tomography Combined with Conventional US

Results: Of the 136 biopsied lesions, 54 were carcinomas and 82 were benign. The average total hemoglobin concentration in the malignant group was 223.3 μmol/L ± 55.8 (standard deviation), and the average hemoglobin concentration in the benign group was 122.5 μmol/L ± 80.6 (P = .005). When the maximum hemoglobin concentration of 137.8 μmol/L was used as the threshold value, the sensitivity, specificity, positive predictive value, negative predictive value, and accuracy of DOT with US localization were 96.3%, 65.9%, 65.0%, 96.4%, and 76.5%, respectively. The sensitivity, specificity, positive predictive value, negative predictive value, and accuracy of conventional US were 96.3%, 92.6%, 89.7%, 97.4%, and 93.4%, respectively. The sensitivity, specificity, positive predictive value, negative predictive value, and accuracy of conventional US combined with DOT were 100%, 93.9%, 91.5%, 100%, and 96.3%, respectively.

Conclusion: US-guided DOT combined with conventional US improves accuracy compared with DOT alone.

Breast Lesions: Quantitative Elastography with Supersonic Shear Imaging—Preliminary Results


Results: All breast lesions were detected at Supersonic Shear Imaging. Malignant lesions exhibited a mean elasticity value of 146.6 kPa ± 40.05 (standard deviation), whereas benign ones had an elasticity value of 45.3 kPa ± 41.1 (P < .001). Complicated cysts were differentiated from solid lesions because they had elasticity values of 0 kPa (no signal was retrieved from liquid areas).

Conclusion: Supersonic Shear Imaging provides quantitative elasticity measurements, thus adding complementary information that potentially could help in breast lesion characterization with B-mode US.

 Distinguishing Benign from Malignant Masses at Breast US: Combined US Elastography and Color Doppler US—Influence on Radiologist Accuracy

Results: The Az of B-mode US, US elastography, and Doppler US (average, 0.844; range, 0.797–0.876) was greater than that of B-mode US alone (average, 0.771; range, 0.738–0.798) for all readers (P = .001 for readers 1, 2, and 3; P < .001 for reader 4; P = .002 for reader 5). When both elastography and Doppler scores were negative, leading to strict downgrading, the specificity increased for all readers from an average of 25.3% (75.4 of 298; range, 6.4%–40.9%) to 34.0% (101.2 of 298; range, 26.5%–48.7%) (P < .001 for readers 1, 2, 4, and 5; P = .016 for reader 3) without a significant change in sensitivity.

Conclusion: Combined use of US elastography and color Doppler US increases both the accuracy in distinguishing benign from malignant masses and the specificity in decision-making for biopsy recommendation at B-mode US.

Evaluation of breast lesions by contrast enhanced ultrasound: Qualitative and quantitative analysis

A 57-year-old woman with a no-palpable lesion in the outer upper quadrant of left breast. (a) Gray scale image show an indistinct, hypo-echoic lesion. (b) Contrast enhanced image obtained 35 s after contrast agent injection showing a homogeneously and hyper-enhanced lesion. (c) Micro flow image obtained 38 s after contrast agent injection showing the enhanced mass with several radial vessels (arrow). (d) The time-intensity curve analysis show the peak intensity is 145.69 (intensity/1000), time to peak is 15.08 s, ascending slope is 8.98, descending slope is 1.03, the area under the curve is 7783.34. Pathologic analyses show this is an invasive ductal carcinoma.


Results: Histopathologic analysis of the 91 lesions revealed 44 benign and 47 malignant. For qualitative analysis, benign and malignant lesions differ significantly in enhancement patterns (p < 0.05). Malignant lesions more often showed heterogeneous and centripetal enhancement, whereas benign lesions mainly showed homogeneous and centrifugal enhancement. The detectable rate of peripheral radial or penetrating vessels was significantly higher in malignant lesions than in benign ones (p < 0.001). For quantitative analysis, malignant lesions showed significantly higher (p = 0.031) and faster enhancement (p = 0.025) than benign ones, and its time to peak was significantly shorter (p = 0.002). The areas under the ROC curve for qualitative, quantitative and combined analysis were 0.910 (Az1), 0.768 (Az2) and 0.926(Az3) respectively. The values of Az1 and Az3 were significantly higher than that for Az2 (p = 0.024 and p = 0.008, respectively). But there was no significant difference between the values of Az1 and Az3 (p = 0.625).

Conclusions: The diagnostic performance of qualitative and combined analysis was significantly higher than that for quantitative analysis. Although quantitative analysis has the potential to differentiate benign from malignant lesions, it has not yet improved the final diagnostic accuracy.

 Breast HistoScanning: the development of a novel technique to improve tissue characterization during breast ultrasound

Results: In 17 normal testing volumes, 3% of isolated voxels were classified as abnormal. In 15 abnormal testing volumes, the subclassifiers differentiated between malignant and benign tissue. BHS in benign tissue showed <1% abnormal voxels in cyst, hamartoma, papilloma and benign fibrosis. The fibroadenomas differed showing <5% and <24% abnormal voxels. Abnormal voxels in cancers increased with the volume of cancer at pathology.

Conclusions: HistoScanning reliably discriminated normal from abnormal tissue and could distinguish between benign and malignant lesions.

Written by: Dror Nir, PhD

Read Full Post »

Automated Breast Ultrasound System (‘ABUS’) for full breast scanning: The beginning of structuring a solution for an acute need!

Writer: Dror Nir, PhD

Screen Shot 2021-07-19 at 7.26.58 PM

Word Cloud By Danielle Smolyar

GE Healthcare announced this week the acquisition of U-Systems, Inc. U-systems has developed the first and only Automated Breast Ultrasound System (ABUS) on the market – somo•v®, to receive FDA approval as an adjunct to mammography screening for breast cancer of; “asymptomatic women, with greater than 50 percent dense breast tissue and no prior breast interventions.”

somo•v® screen shot, showing mass in upper-outer quadrant of the left breast. Image courtesy of U-Systems.

I became aware of somo•v® already in 2004, when Prof. André Grivegnée, head of the breast screening unit at Jules Bordet – European oncology center in Brussels, Belgium, invited me to participate in a technology assessment of U-Systems’ somo•v® product. On that occasion, I also shared with U-System’s developers the idea of incorporating tissue characterisation into their product, an idea which they did not take on board. There is nothing more vivid to fully understand the meaning of this acquisition for breast cancer screening then the following quote from AuntMinnie’s report “GE taps interest in ABUS with U-Systems acquisition”:  “You know you’re onto something when the big boys come calling. GE Healthcare today announced its acquisition of automated breast ultrasound (ABUS) developer U-Systems, a move that highlights the rapid evolution of ABUS from a niche technology into a promising adjunct to screening mammography. “ First savvy: The reality of medical device startups is that it doesn’t matter how real and large is the need for your technology. Until one of the big boys will adopt it, it is prone to be considered as niche technology. I discussed the potential role of ABUS in future breast screening in my recent posts: Closing the Mammography gap; Introducing smart-imaging into radiologists’ daily practice.  As noted, in recent years, several ABUS systems were developed. An intriguing question is; why did GE choose to buy the somo•v® and not one of the other systems? Why now and not 2 or 3 years ago? The answer must have to do with the fact that in September 2012, somo•v® became the first ABUS system to receive premarket approval (PMA) for its application to use the system in a breast cancer screening environment. Until then, somo·v was indicated for use as an adjunct to mammography for B-mode ultrasonic imaging of a patient’s breast when used with an automatic scanning linear array transducer or a handheld transducer. The PMA has extended somo·v’s Indication For Use (IFU) allowing a claim that it increases breast cancer detection in a certain patients population. Second savvy: Having a PMA approval for a compelling indication for use, in a significant enough patient group, will dramatically increase “big boys” interest in your product. From the information available on the FDA site, one can get an insight into U-System’s regulatory strategy. They were smart enough to be satisfied with achieving a small step; increasing the detection rate of mammography-based screening. Therefore, the same radiologist who read the mammograms also read the ultrasound image. This increases the probability that your device’s sensitivity will not be worse than that of mammography. U-Systems did not try to go all the way to become an alternative to mammography. A claim that would significantly increase the complexity of the required clinical study; e.g. will require comparison of cancer detection-rates between modalities by independent, blinded-readers. Therefore, “the device is not intended to be used as a replacement for screening mammography”.   Third savvy: The most expensive component, in time and money, in a regulatory pathway are the clinical studies. A cost-effective regulatory strategy is linked to good understanding of the market segmentation. Identifying what kind of IFU differentiates your products from its competition in a large enough niche-market is key. It will also lead to the simplest clinical-study design possible. As an entrepreneur, I cannot help congratulating U-Systems’ team for pulling through continuous hurdles to reach the point all medical device startups are hoping for. They certainly picked up the right item to focus their efforts on: i.e. PMA approval for breast cancer screening. Finally, I will reiterate my vision that embedding real-time tissue characterization in an ultrasound system, capable of performing fast and standardized full breast scanning is: a. Technologically achievable; and b. in the long-term, will be an excellent alternative to mammography for breast cancer screening. Additional readings: Two studies related to  somo•v® will be discussed at the 2012 RSNA meeting: “ A study led by Dr. Rachel Brem of George Washington University Medical Center: ABUS plus mammography finds cancer early in women with dense tissue  Brem’s study found that ABUS enabled detection of early-stage cancers in women with dense breasts, giving healthcare providers time to start early treatment. In all, 88% of cancers found by ABUS alone in a group of 15,000 women were grade 1 or 2.” “A study presented by Maryellen Giger, PhD, of the University of Chicago: ABUS boosts mammography’s performance  this study results showthat adding ABUS to mammography for women with dense breast tissue improved sensitivity by 23.3 percentage points, from 38.8% for mammography alone to 63.1% for mammography plus ABUS.” As I mentioned already, there are other ultrasound modalities out there, some are ABUS and some are not. All are adjunct to mammography screening. Related studies will also be presented during that same meeting.

UPDATE (04-Aug-2013)

Here below is a recent publication on  the use of ABUS for better detection of breast cancer in patients presented with mammographically dense breast.

Improved breast cancer detection in asymptomatic women using 3D-automated breast ultrasound in mammographically dense breasts

  • Breast Cancer Research Institute, Nova Southeastern University College of Medicine, 5732 Canton Cove, Winter Springs, FL 32708, USA

Abstract

Automated breast ultrasound (ABUS)was performed in 3418 asymptomatic women with mammographically dense breasts. The addition of ABUS to mammography in women with greater than 50% breast density resulted in the detection of 12.3 per 1,000 breast cancers, compared to 4.6 per 1,000 by mammography alone. The mean tumor size was 14.3 mm and overall attributable risk of breast cancer was 19.92 (95% confidence level, 16.75 – 23.61) in our screened population. These preliminary results may justify the cost-benefit of implementing the judicious us of ABUS in conjunction with mammography in the dense breast screening population.

Keywords

  • Breast ultrasound;
  • 3-dimensional sonography;
  • Breast screening;
  • Dense breast;
  • Breast cancer;
  • Cancer detection

1. Introduction

Mammographic density as an independent risk factor for developing breast cancer has been documented since the 1970’s [1]. The appearance of breast tissue is variable among women. The appearance of density on mammography is the result of the relative proportion of breast stroma, which is less radiolucent compared to fat, accounting for increased breast density. Wolfe classified breast density as an independent risk factor for breast cancer in women [2] and [3]. Approximately 70 to 80% of breast cancers occur in women with no major predictors [4][5] and [6]. Population-based screening for early detection of breast cancer is therefore the primary strategy for reducing breast cancer mortality. Mammography has been used as the standard imaging method for breast cancer screening, with reduction in breast cancer mortality [7]. Breast density significantly reduces the ability to visualize cancers on mammography. The number of missed cancers is substantially increased in mammographically dense breasts, where the sensitivity is reported as low as 30 to 48%. [8]; and the odds of developing breast cancer 17.8 times higher [9]. Hand held ultrasound (HHUS) has been used to optimize the detection of cancers in mammographically dense breasts, but is limited due to technical factors, such as breast size, considerable user variability and reproducibility, technical skill, and time constraints, precluding HHUS as an effective screening modality for breast cancer [10][11] and [12]. Kelly described the use of 3D-automated breast ultrasound (ABUS) as an adjunct to mammography in the evaluation of non-palpable breast cancers in asymptomatic women. ABUS with mammography resulted in an increase in diagnostic yield from 3.6 per 1,000 with mammography alone, to 7.2 per 1,000 by adding ABUS, resulting in a mammography miss rate of 3.6 per 1,000 [13]. However, one of the limitations of the study was that it did not isolate dense breasts as an independent risk factor for developing breast cancer, where the detection rate should be expected to be higher. ABUS is FDA-approved in the United States for screening of women with dense breast parenchyma [14]. The purpose of this study was to demonstrate that ABUS increases the detection of non-palpable breast cancers in mammographically dense breasts when used as an adjunct diagnostic modality in asymptomatic women. This resulted in the subsequent detection of cancers missed by mammography of smaller size and stage, justifying the basis for the judicious use of implementing ABUS in conjunction with mammography in the dense breast screening population. The tabulated data was extrapolated based on known mammography screening utilization to show a cost-benefit of additional ABUS as a population based screening method.

2. Methods

2.1. Selection of participants

This study and the use of patient electronic health records were approved by an ethics committee appointed by the institute Board of Directors. The study design included two study groups, the control and test groups, in successive years. Each group was followed prospectively for 1 year. The control group consisted of women screened by digital mammography alone and stratified for breast density based on a Wolf classification of 50% or greater breast density (defined as the ‘mammographically dense breast’ for the purpose of this study). The second group consisted of women initially screening by digital mammography as having mammographically dense breasts, followed by automated breast ultrasound (ABUS). Each group was carefully selected on the basis of breast density and having no major pre-existing predictors of breast cancer, such personal or family history of breast cancer, or BRCA gene positive. In addition, the test group patients were not included in the screening group so as to eliminate impact on the results of the test group patients. The control group consisting of 4076 asymptomatic women designated as Wolf classification of 50% or greater breast density underwent stand-alone screening digital mammography between January 2009 and December 2009 using digital mammography (Selenia, Hologic Inc., Bedford, MA USA). The sensitivity, specificity, positive predictive value, and negative predictive value for biopsy recommendation were determined, in addition to data collection regarding the size and stage of cancers missed by mammography. The test group, consisting of 3418 asymptomatic women designated as Wolf classification of 50% or greater breast density, underwent stand-alone screening digital mammography between January 2010 and May 2011 using digital mammography (Selenia, Hologic Inc., Bedford, MA USA). This was followed by automated whole breast ultrasound (Somo-V. U-Systems, Sunnyvale, CA USA). The mammography-alone results were not used as control results in order to eliminate potential bias introduced by ABUS results on the mammography interpretations. In addition, mammography results were interpreted independently from ABUS results so as not to introduce bias. The sensitivity, specificity, positive predictive value, and negative predictive value for biopsy recommendation were determined, in addition to derived statistical data regarding the relative risk, and odds ratio for developing breast cancer.

2.2. Assessment of mammographic density

Mammographic density was assessed independently by radiologists on a dedicated mammography viewing workstation equipped with 5-Megapixel resolution. The radiologists were FDA-qualified in mammography, with at least 10 years experience in breast ultrasound, 24 months of which included ABUS. Two radiologists interpreted both the mammography and ABUS examinations under identical viewing conditions of 5-Megapixel resolution. The mammograms and ABUS studies were double read by two radiologists, with final consensus determination for each case. Mammograms were evaluated according to one of five categories of density (0%, 1 to 24%, 25 to 49%, 50 to 74%, and 75 to 100%) and only mammograms with breast density of 50% or greater were included in the control and test study groups.

2.3. 3D-Automated breast ultrasound evaluation

3D-Automated Breast Ultrasound (ABUS) is a computer-based system for evaluating the whole breast. The whole breast ultrasound system (Somo-V, U-Systems, Sunnyvale, CA USA) was used in combination with a 6 to 14 MHz broadband mechanical transducer attached to a rigid compression plate and arm, producing over 300 images per image acquisition obtained as coronal sweeps from the skin to the chest wall. The mechanical arm controls transducer speed and position, while a trained ultrasound technologist maintains appropriate contact pressure and vertical orientation to the skin. Interpretation and reporting time for an experienced radiologist is approximately 10 minutes per examination. The radiologist has cine functionality to simultaneously view breast images in the coronal, sagittal, and axial imaging planes.

2.4. Data collection

ABUS scan data was collected for location and size of breast masses and recorded in a radial or clock orientation consistent with American College of Radiology reporting lexicon. Studies were reported according to the American College of Radiology Breast Imaging Reporting and Data System (BI-RADS) six-point scale (0=incomplete, needs additional assessment; 1=normal; 2=benign; 3=probably benign; 4=suspicious; 5=highly suggestive of malignancy) [15] and [16]. For BI-RADS scores of 1, 2, and 3 on ABUS, patients were followed prospectively for 1 year to exclude cancers missed on both mammography and ABUS. For BI-RADS scores of 4 and 5, stereotactic hand held ultrasound (HHUS) biopsy was performed using 14 gauge or larger percutaneous biopsy. HHUS was employed because ABUS is presently not equipped with biopsy capability. If a benign non-high risk lesion was diagnosed, such as simple breast cysts, no further tissue sampling was performed. All non-cystic lesions were biopsied. Cystic lesions were identified as anechoic, thin walled lesions with posterior acoustic enhancement. All pathology proven breast malignancies were further staged using contrast volumetric/whole breast MR imaging (1.5T HDe Version 15.0/M4 with VIBRANT software, GE Medical Systems, Waukesha, WI USA.) with computer assisted detection (CADStream software, Merge Healthcare, Belleview WA USA). A final pathological stage was assigned by the pathologists in the usual manner in accordance with the American Joint Committee on Cancer (AJCC) TNM system guidelines. The pathologists were blinded to patient participation in the study and the method of cancer detection.

2.5. Statistical analysis

Calculations were made of the sensitivity, specificity, positive predictive value (PPV), negative predictive value (NPV), relative risk, odds risk, and attributable risk of breast cancer using MedCal version 12.2.1 software. Exact 95% confidence intervals (CI) were calculated for diagnostic yield. Statistical methods involved the Chi-square test statistic, which was used to compare the number of cancers detected by ABUS, based on the size of cancer. P-values of less than .05 were considered to indicate statistical significance. Attributable risk (AR) was calculated according to the following formula: AR=(RR − 1)Pc ÷ RR, where RR denotes relative risk of greater than 50%, and Pc prevalence of density of greater than 50% in case patients[17][18] and [19].

3. Results

Comparable interobserver diagnostic reliability (Kappa value of 0.98) was observed with mammography and ABUS examinations. In the control group (N=4076), the median age of participants with breast cancer (N=19) at the time of biopsy was 54 years, distributed as follows: 26% (5 out of 19) cancers occurred in women younger than age 50; 63% (12 out of 19) in women 50 to 69 years; and 11% (2 out of 19) over the age of 70 years. All cancers (N=19) were biopsy proven invasive ductal carcinoma. The sensitivity and specificity of stand-alone digital mammography were 76.00% (95% CI: 54.87% – 90.58%) and 98.2% (95% CI: 97.76% – 98.59%). The positive predictive value was 20.43% (95% CI: 12.78% – 30.05%) with a breast cancer prevalence rate of 0.60% (95% CI: 12.78% – 30.05%). The cancer detection rate was 4.6 per 1,000, with mean tumor size detected by mammography (N=19) of 21.3 mm. The average size of missed breast cancer (N=6) was 22.3 mm. The node positivity rate was 5% (1 of 19 cases). In the ABUS study group (N=3418), the median age of participants with breast cancer (N=42) at the time of biopsy was 57 years, distributed as follows: 17% (7 out of 42) cancers occurred in women younger than age 50; 64% (27 out of 42) in women 50 to 69 years; and 19% (8 out of 42) over the age of 70 years. The sensitivity and specificity of ABUS were 97.67% (95% CI: 87.67% – 99.61%) and 99.70%, (95% CI=99.46% – 99.86%), respectively, in mammographically dense breasts. The positive predictive value of ABUS was 80.77% (95% CI=67.46% – 90.36%), with a breast cancer prevalence rate of 1.25% (95% CI: 0.91% – 1.69%). The odds ratio of breast cancer in mammographically dense breasts determined by ABUS was 2.65 (95% CI: 1.54 – 4.57; P=0.0004). The cancer detection rate was 12.3 per 1,000. A 2.6-fold increase in cancer detection rate was observed between ABUS added to digital screening mammography compared to stand-alone digital screening mammography. Invasive breast cancer accounted for 81% (42 out of 52) solid breast masses detected by ABUS, of which 93% (39 out of 42) were invasive ductal carcinomas, and 7% (3 out of 42) were invasive lobular carcinomas. The mean tumor size detected by ABUS in patients with breast cancer (N=42) was 14.3 mm, distributed as follows: Stage 1A disease accounted for 83% (35 out of 42) of cases; 12% were Stage 2A (5 out of 42), and 5% were Stage 3A (2 out of 42). Stage 3A disease was associated with multifocal disease in both cases, one of which also was Level 1 axillary lymph node positive. The node positivity rate was 2% (1 in 42) of cases. The false positive rate of ABUS was 19.3%, with a negative predictive value of 99.97% (95% CI 99.83% – 100.00%). The pathologies associated with false positive results (N=10) were fibroadenomas and atypical epithelial neoplasms. We also used our data to extrapolate the theoretical cost-benefit of ABUS screening applied to a large screening population in the United States. Our analysis relied on the following assumptions: (1) Global Centers for Medicare and Medicaid reimbursement rate of breast ultrasound of $71 [20]; and (2) Estimated mean doubling time of a missed cancer of 250 days at the 95th percentile [21] and [22]. According to previously cited cancer kinetics models, a missed breast cancer should be clinically evident within 9 months[23]. When we considered the mean breast cancer size in our positive test subject group, 14.3 mm (N=42), we extrapolated a theoretical missed cancer size of 29.2 mm at 9 months in mammographically dense breasts, representative of Stage 2 or greater disease. In control subjects, a mean breast cancer size of 22.3 mm was consistent with stage 2 breast cancer. Incremental treatment cost assumptions, based on the global Centers for Medicare and Medicaid reimbursement rate between Stage 1 and Stage 2 breast cancer, were $24,002 and $34,469, respectively, for a cost differential of $10,467 [24]. Accordingly, the aggregate costs of screening 3418 ABUS patients in this study were $239,260, compared to the estimated aggregate costs of additional treatment in 26 potentially missed cancers (based on previously noted theoretical assumptions) of $275,557 based on a cancer miss rate of 0.77% (or 7.7 per 1,000).

4. Discussion

Table 1 shows the clinical indications for ordering an ABUS examination. Table 2 shows the distribution of breast cancer size according to age in the control and test study groups. The test group showed no statistical difference between size of the cancer and patient age at presentation. A significant increase in tumor size in the over 70 patients in control subjects was attributed to the more advanced tumor stage at presentation.Table 3 shows that stand-alone digital mammography was less sensitive than ABUS in breast cancer detection, with a 4-fold increase in positive predictive value of ABUS compared to stand-alone mammography in dense breasts. Our results showed that mammographic density of 50% or more was associated with an increased risk of breast cancer and resulted in a significant miss rate in asymptomatic women. Table 4 shows a statistically significant age-related attributable risk of developing breast cancer for mammographic density of 50% or greater. These observations are consistent with other studies which have shown an increased risk of breast cancer in dense breasts following negative mammography screening [2],[3][8] and [9]. We observed that breast cancer risk was highest in patients over age 70, where increased breast density was associated with an attributable risk of 29.6 (95% CI, 21.5 – 40.8). Fig. 1 shows box plots comparing case patients and control subjects according to age, with tumor sizes shown as a function of the odds ratio, relative risk, and attributable risk for each age category.

Table 1. Clinical criteria for ABUS screening
• As a supplement to mammography, screening for occult cancers in certain populations of women (such as those with dense fibroglandular breasts and/or with elevated risk of breast cancer);
• Imaging evaluation of non-palpable masses in women under 30 years of age who are not at high risk for development of breast cancer, and in lactating and pregnant women; and
• BI-RADS (American College of Radiology Breast Imaging Reporting and Data System) scoring classification class III, heterogeneously dense, with 50% to 74% or 75% to 100% breast density on mammography, without palpable mass.
Table 2. Breast cancer size according to method detection

T2

Table 3. Detection of breast cancer according to method
t3

Table 4. Risk of breast cancer according to method detection

t4
  1-s2.0-S0899707112002872-gr1

Fig. 1. Breast Cancer Staging and Risk Assessment by Screening Method Detection. Box plots comparing case patients and control subjects according to age (boxes A through D). Tumor sizes are shown as a function of the odds ratio, relative risk, and attributable risk for each age category. Bars represent the highest and lowest observed values with respect to individual variables (individually labeled with arrows).

Our study also showed that 3D-Automated Breast Ultrasound (ABUS) was an effective screening modality in mammographically dense breasts. Our extrapolated data suggest a breast cancer miss rate of 7.7 per 1,000 in mammographically dense breasts in asymptomatic women, which is higher compared to the cancer miss rate of 3.6 per 1,000 reported by Kelly using ABUS [13]. We attribute the increased breast cancer miss rate due to breast density, which was isolated as the principal risk factor in our study. Other studies have shown that the attributable risk of breast cancer for a mammographic density of 50% or greater was 40% for all cancers detected less than 12 months after a negative screening mammogram, and as high as 50% in women less than the age of 50. This marked increase in the risk of breast cancer associated with mammographic density of 50% or greater up to 12 months following screening directly reflects cancers that were present at the time of screening but went undetected due to masking by dense breast parenchyma [25],[26][27][28] and [29]. In the final analysis, there is the issue of the theoretical cost-benefit of adding ABUS screening to mammography in an otherwise healthy population. The importance of screening mammographically dense breasts with ABUS has particular relevance based on the small size and early stage of breast cancers. Our study showed a mean tumor size of 14.3 mm, representing stage 1 disease, which was present in 81% of patients. From our data, we derived theoretical population-based costs as a basis for the cost-benefit of ABUS in the United States population. Our study compared the incremental costs of screening versus the costs of added treatment related to a change in the staging of missed cancers from Stage 1 to Stage 2. The costs of additional treatment outweighed the costs of screening by $32,808, which calculated to $9.60 added healthcare cost per patient in the 3418 participants in the study. In the United States, 48 million mammograms were performed annually, with a reported estimated miss rate of 10% [30]. When comparing control versus test patients, our study suggests a theoretical miss rate of 7.7 cancers per 1,000 mammograms, or 0.77%, which is considerably lower than the reported missed rate of 10%. Based on these theoretical assumptions, annual added ABUS screening of the entire U.S. population would cost $3.40-billion. However, in actual practice, ABUS would be used only in the mammographically dense breast, which would potentially reduce the screening costs by at least a factor of 0.8, bringing the cost closer to $2.72-billion. By contrast, the incremental costs of added treatment associated with stage 2 compared to stage 1 breast cancer in the U.S. population would be $3.82-billion, assuming a conservative cost basis of $10,467 per patient.. The cost-benefit of early detection of stage 1 disease results in a theoretical per capital annual cost savings of $22.75 per screened patient in the U.S. population, according to our model. However, we have no actual or derived data to support improved breast cancer mortality with the addition of ABUS as a universal screening modality. This is one of the major limitations of our study because actuarial analyses used to justify screening modalities are typically based on mortality statistics. With respect to five year survival statistics between stage 1 and stage 2 breast cancers, of 98% and 80%, respectively, one could construe the potential for a theoretical quality-of-life benefit based on judicious ABUS screening. Another limitation of our study is the relatively small screening population used in our study, emphasizing the need for continued research in order to validate ABUS as a viable and cost-effective population-based screening modality, which should be stratified for other risk factors for breast cancer, such as: personal or family history of breast cancer, BRCA genetic results, environmental factors (late parity, previous exposure to ionizing radiation, exogenous estrogen, smoking, and alcohol use), early menarche/late menopause, and ethnic/racial differences. At most imaging centers, mammography is the only screening method for breast cancer detection. Our study corroborates with the data derived from other studies that the principal mechanism for breast cancer in dense breast parenchyma is not rapid growth, but rather, the masking of coincident cancers that are missed on screening mammograms [9]. These findings further suggest that the addition of mammographic screening in patients with dense breast parenchyma is likely not to increase diagnostic yield in the detection of breast cancers. Therefore, emphasis should be placed on alternative imaging techniques for such women. To conclude, our study of a small representative dense breast screening population showed that the addition of ABUS was more effective than digital mammography alone. This study provides a platform for using ABUS as cost-effective approach to breast cancer detection in the judicious screening of asymptomatic women with excessive mammographic density, in whom the greatest risk is between screening mammography examinations.

References

    • [2]
    • JN Wolfe
    • Breast patterns as an index of risk for developing breast cancer
    • AJR Am J Roentgenol, 126 (1976), pp. 1130–1137
    • [8]
    • MT Mandelson, N Oestreicher, PL Porter et al.
    • Breast density as a predictor of mammographicdetection: comparison of interval and screen detected cancers
    • J Natl Cancer Inst, 92 (2000), pp. 1081–1087
    • [9]
    • NF Boyd, H Guo, LJ Martin et al.
    • Mammographic density and the risk and detection of breast cancer
    • N Engl J Med, 356 (2007), pp. 227–236
    • [10]
    • W Buchberger, P DeKoekkoik-Doll, P Springer, P Obrist, M Dunser
    • Incidental findings on sonography of the breast: clinical significance and diagnostic workup
    • AJR Am J Roentgenol, 173 (1999), pp. 921–927
    • [11]
    • DB Kopans
    • Breast cancer screening with ultrasonography
    • Lancet, 354 (1999), pp. 2096–2097
    • [12]
    • WA Berg, JD Blume, JB Cormack et al.
    • Combined screening with ultrasound and mammography versus mammography alone in women at elevated risk of breast cancer
    • JAMA, 299 (2008), pp. 2151–2163
    • [13]
    • KM Kelly, J Dean, WS Comulada, SJ Lee
    • Breast cancer detection using automated whole breast ultrasound and mammography in radiographically dense breasts
    • Eur Radiol, 20 (2010), pp. 734–742
    • [14]
    • United States Food and Drug Organization. Breast transilluminators. 74 FR 16214, April 9, 2009; Docket No. FDA-2012-N-0001, April 12, 2012.
    • [15]
    • C D’Orsi, L Bassett, W Berg et al.
    • ACR Breast Imaging Reporting and Data System (BIRADS)
    • (4th ed.)American College of Radiology, Reston, VA (2003)
    • [16]
    • BM Geller, WE Barlow, R Ballard-Barbash et al.
    • Use of the American College of Radiology BI-RADS to report on the mammographic evaluation of women with signs and symptoms of breast disease
    • Radiology, 222 (2002), pp. 536–542
    • [17]
    • PF Griner, RJ Mayewski, AI Mushlin, P Greenland
    • Selection and interpretation of diagnostic tests and procedures
    • Ann Intern Med, 94 (1981), pp. 555–600
    • [18]
    • JA Hanley, BJ McNeil
    • The meaning and use of the area under a receiver operating characteristic (ROC) curve
    • Radiology, 143 (1982), pp. 29–36
    • [19]
    • CE Metz
    • Basic principles of ROC analysis
    • Semin Nucl Med, 1978 (1978), pp. 283–298
    • [20]
    • Centers for Medicare, Medicaid
    • Contracted intermediary carrier fee schedule
    • First Coast Service Options, Inc., St. Augustine, FL (2004)
    • [21]
    • T Kuroishi, S Tominaga, T Morimoto et al.
    • Tumor growth rate and prognosis of breast cancer mainly detected by mass screening
    • Jpn J Cancer Res, 81 (1990), pp. 454–462
    • [22]
    • L Heuser, JS Spratt, HC Polk
    • Growth rate of primary breast cancer
    • Cancer, 43 (1979), pp. 1888–1894
    • [23]
    • JS Michaelson, E Halpern, DB Kopans
    • Breast cancer computer simulation method for estimating optimal intervals for screening
    • Radiology, 212 (1999), pp. 551–560
Corresponding author. Breast Cancer Research Institute, Nova Southeastern University College of Medicine, 5732 Canton Cove, Winter Springs, FL 32708, USA. Tel.: 1 407 699 7787.

Copyright © 2013 Elsevier Inc. All rights reserved.

Read Full Post »

Closing the Mammography gap

Author and Curator: Dror Nir, PhD

There are 40 million women seeking mammography breast-screening every year in the USA, out of which 15 million are women with heterogeneously dense or extremely dense breasts. USA epidemiology statistics show that 6 out of 7 missed cancers at mammography occur in women with dense breasts. It is also known that the majority of women presenting with mammography-dense breasts are below 45 years old.

The Oct. 22 issue of the American Journal of Roentgenology ( AJR) publishes results of a study showing that ultrasound is superior to mammography in evaluating symptomatic women 30-39 years of age [1].

This study was conducted by researchers at the Seattle Cancer Alliance and University of Washington. Patients were recruited between January 2002 and August 2006.   954 women ranging from 30 to 39 years old who presented for diagnostic breast imaging evaluation were  examined, and it was found that sensitivity (probability for cancer detection) of ultrasound was 95.7 percent compared to 60.9 percent for mammography. A very important result of this study is the calculated Negative Predictive Value (the probability to have negative pathology if the imaging-test is negative) which was similar for both modalities: 99.9% for ultrasound and 99.2% for mammography.

Show case in images (All images courtesy of the American Roentgen Ray Society.):

35-year-old woman who presented with a palpable left breast lump. Whole-breast craniocaudal (above left) and mediolateral oblique (above right) and spot-magnification craniocaudal (below left) and mediolateral (below right) mammographic images show no abnormality at area of clinical concern, marked by BB.

Zoom-in on the region of interest

Targeted ultrasound image above reveals solid mass with irregular shape and indistinct and angular margins. BI-RADS 5 assessment was made. Histopathology from ultrasound-guided core needle biopsy showed invasive ductal carcinoma.

In regards to which imaging modality should be used when screening such a population, the conclusion of the investigators is very clear: “Ultrasound has high sensitivity (95.7%) and high NPV (99.9%) in this setting and should be the primary imaging modality of choice. The added value of adjunct mammography is low.”

When reading this article I noted a gap to overcome if we want to successfully replace mammography with ultrasound. The Positive Predictive Value (the probability of  detecting a cancer) calculated for ultrasound in these study settings was lower than that calculated for mammography: 13.2% for ultrasound and 18.4% for mammography. This is because mammography detected one additional malignancy in an asymptomatic area in a 32-year-old woman who was subsequently found to have a BRCA2 gene mutation. Mammography could do that because it scans the whole breast, whereas the investigators in this study used ultrasound just for scanning the suspicious lumps. A solution is offered in using the recently introduced ultrasound modalities, which are able to perform automatic full breast ultrasound scans [2], preferably enhanced by real-time tissue characterisation capability – a technology I’m working to develop.

References:

  1. Accuracy and Value of Breast Ultrasound for Primary Imaging Evaluation of Symptomatic Women 30-39 Years of Age,Constance D. Lehman1,2Christoph I. Lee1,2Vilert A. Loving1,2, Michael S. Portillo1,2Sue Peacock1,2 and Wendy B. DeMartini1,2, Oct. 22 issue of the American Journal of Roentgenology
1 Department of Radiology, University of Washington School of Medicine, Seattle WA.
2 Seattle Cancer Care Alliance, G2-600, 825 Eastlake Ave E, Seattle, WA 98109.

2. Using Automated Breast Sonography as Part of a Multimodality Approach to Dense Breast Screening, Vincenzo Giuliano, MD, RDMS, RVT1, Concetta Giuliano, DO1, Journal of Diagnostic Medical SonographyJuly/August 2012 28: 159-165,

1Novasoutheastern University, Winter Springs, FL, USA
 
 
Written by: Dror Nir, PhD.

Read Full Post »

Older Posts »

%d bloggers like this: