Feeds:
Posts
Comments

Archive for the ‘Curation methodology’ Category

Outline of Medical Discoveries between 1880 and 1980

Curator: Larry H Bernstein, MD, FCAP

This is the first of a two part series tracing the developments in medical diagnosis and treatment, and herein, tracing the scientific events of the 19th century that accelerated and created the emergent events that brought together physics, organic and physical chemistry, electronics, computational biology.

Part I. Anatomy and Physiology

The first Nobel Prize in Physiology was awarded to Ivan Pavlov for work on digestion in 1904.  The presentation speech refers to the groundbreaking work of Vesalius and Harvey in his presentation address, citing their passionate pursuit of knowledge.  He credits the work of a young American physician, William Beaumont, who served as the only doctor on Michigan’s Mackinac Island in the French and Indian war in 1822, and who observed the gastric secretion from the gastric fistula of a wounded soldier. (see John Karlawish, Open Wound, University of Michigan Press, 2011). This was the basis for the work by Pavlov on dogs that extends our understanding of the telationship of the central nervous system to the digestive processes.

The Nobel Prize in Physiology or Medicine 1906 was awarded jointly to Camillo Golgi and Santiago Ramón y Cajal “in recognition of their work on the structure of the nervous system”. Golgi first opened the field of neuroanatomy with the silver staining method, and Cajal contributed equally to establishing the foundation for this research of great complexity.

The Nobel Prize in Physiology or Medicine 1909 was awarded to Emil Theodor Kocher for his work on the physiology, pathology, and surgery  of the thyroid gland. It had already been established that the enlargement of the thyroid compresses the trachea, and that complete removal has morbid effects. It was expressed by Kocher in 1883 that removal of the thyroid as a consequence of surgery must leave behind a functioning portion of the gland.

This was later followed by the establishment of a great medical institution Dr. William Worrall Mayo, a frontier doctor, and his two sons, Dr. William J. Mayo and Dr. Charles H. Mayo, Mayo Clinic.

The elder Dr. Mayo emigrated from his native England to the United States in 1846. He became a doctor in 1850. In 1863 he was appointed a surgeon for the enrollment board in southern Minnesota, to examine recruits for the Union Army, and settled in Rochester, Minn. His dedication to medicine became a family tradition when his sons, Drs. William James Mayo and Charles Horace Mayo, joined his practice in 1883 and 1888, respectively.

In 1883, a tornado swept through Rochester leaving in its wake many deaths and injuries. Temporary hospital quarters were set up in offices and hotels. Nuns from the Sisters of St. Francis, a teaching order, were recruited as nurses. The experience inspired Mother Alfred Moes to request that the Drs. Mayo join with the Sisters to build the first general hospital in southeastern Minnesota. The 27-bed Saint Mary’s Hospital opened in 1889 as a result of this partnership.

mayo-brothers

mayo-brothers

As the demand for their services increased, they asked other doctors and basic science researchers to join them in the world’s first private integrated group practice. In 1919, the Mayo brothers dissolved their partnership and turned the clinic’s name and assets, including the bulk of their life savings, to a private, not-for-profit, charitable organization now known as Mayo Foundation. It is worth noting that the Mayo Clinic became a favored place to have thyroid surgery, as its location is in the “goiter belt”.

Patients discovered the advantages to a “pooled resource” of knowledge and skills among doctors. In fact, the group practice concept that the Mayo family originated has influenced the structure and function of medical practice throughout the world.

The Nobel Prize in Physiology or Medicine 1912 was awarded to Alexis Carrel “in recognition of his work on vascular suture and the transplantation of blood vessels and organs”. He demonstrated the technique used to suture together open vessels, and even to transplant whole organs from one animal to another with excellent results.

The Nobel Prize in Physiology or Medicine 1920 was awarded to August Krogh “for his discovery of the capillary motor regulating mechanism”.  Harvey had shown in 1628 that the blood traverses the circulation returning to the heart in one minute. Malpighi showed that blood passes from the artery to the vein by capillaries  in 1661.  Krogh demonstrated by very elegant experiments that the quantity of gas that diffuses across the pulmonary alveoli is the same amount of gas that is released to the alveolar space. The importance of this is that the investigations having the aim to determine the process by which the oxygen requirement of the tissues is satisfied.

The Nobel Prize in Physiology or Medicine 1922 was divided equally between Archibald Vivian Hill “for his discovery relating to the production of heat in the muscle” and Otto Fritz Meyerhof “for his discovery of the fixed relationship between the consumption of oxygen and the metabolism of lactic acid in the muscle”. One need not be a physiologist to recognize that muscular activity is essentially bound up with the development of heat, or even with combustion. AV Hill determined the time relationships of heat production in muscle contraction measured galvanometrically, and Otto Meyerhof determined the oxygen consumption in the production of lactic acid. The muscle is regarded as a machine that converts chemical energy to mechanical energy (tension) with the production of heat. The development of heat entirely fails to appear if the supply of oxygen to the muscle is cut off, while the development of heat during the actual twitch, is independent of the presence of oxygen (consistent with Meyerhof’s glycolysis). The relaxation phase is consistent with oxygen uptake during recovery.

Fletcher and Hopkins had shown earlier that muscle not only forms, but also uses lactic acid in the presence of oxygen. Meyerhof determined by parallel determination of the lactic acid metabolism and the oxygen consumption during the recovery of the muscle, which yielded the result that the oxygen consumption does not account for more than1/3 – 1/4 of the lactic acid formed. When lactic
acid is formed an equivalent amount of glycogen in muscle disappears, and when lactic acid disappears, the quantity of
carbohydrate increases by the difference between lactic acid and quantity used in oxygen consumption.

The Nobel Prize in Physiology or Medicine 1923 was awarded jointly to Frederick Grant Banting and John James Rickard
Macleod “for the discovery of insulin”.  In 1857, Claude Bernard discovered that the liver contains glycogen, which converted to glucose, enters the blood stream (and thereby, the urine). Glycosuria became a starting point for the study of diabetes. It is of interest that he could not produce glycosuria by ligation of the pancreatic duct. But in 1889 Mering and Minkowsky did an operation on dogs that removed the pancreas, resulting in glycosuria, and creating a disease comparable to diabetes in humans. If part of the pancreas was left behind, it failed to produce diabetes. Brown-Sequard had called attention to ductless organs in the 1880s that are glands. These were
endocrine glands secreting hormones. Langerhans had shown in 1869 that the pancreas has glands that have no secretion into the pancreatic ducts, and in the beginning of the 1890s Languese surmised that these glands were involved in diabetes mellitus. Schulze and Ssobolev had shown that ligation of the duct resulted in atrophy of the pancreas sparing the islets. Frederick Banting at this time postulated that trypsin degraded the hormone, and with Best and Collip, under MacLeod’s guidance, Banting pursued his idea, and the effective extract was obtained in 1921, and demonstrated in 1922.

Arch Anat Histol Embryol. 1993-1994;75:151-82.

[History of histology in Strasbourg].

Le Minor JM.

Since the cellular theory was formulated in 1839, the University of Strasbourg has held a pioneer place in histology. This new morphological science has had, since its origin, close relations with physiology, and from 1846 to 1871, an original histophysiological school was organized in Strasbourg. The microscope and the study of tissues were considered as a fundamental approach for the progress of biological and medical knowledge. After the German annexation of Alsace, the scientists from this school participated in the renewal of histology in Nancy, Montpellier, and Paris. In 1872, when the new German university was created, an anatomical institute regrouped all aspects of normal morphology: anatomy, histology, and embryology. This was the case until 1918. In 1919, when the Faculty of Medicine was reorganized after Alsace was restored to France, a specific chair and institute of histology were created. This was the beginning of a school of histophysiology which was internationally renowned in the rise of experimental endocrinology. Great discoveries followed one after another: folliculin in 1924 and demonstration of the duality of ovarian hormones, the prominent place of the anterior part of the hypophysis and the demonstration of prolactin in 1928, thyreostimulin in 1929, then study of the other stimulins. In 1946 a chair and institute of medical biology were created. In 1948, a service of electron microscopy was opened.
P. Bouin (1870-1962), M. Aron (1892-1974), J. Benoit (1896-1982), R. Courrier (1895-1986) et M. Klein (1905-1975), were among the famous scientists who worked in histology in Strasbourg in the
period after the French restoration.
The Nobel Prize in Physiology or Medicine 1947

Bernardo Alberto Houssay

“for his discovery of the part played by the hormone of the anterior pituitary lobe in the metabolism of sugar”

He had already begun studying medicine and, in 1907, before completing his studies, he took up a post in the Department of Physiology. He began here his research on the hypophysis which resulted in his M.D.-thesis (1911), a thesis which earned him a University prize.

In 1919 he became Professor of Physiology in the Medical School at Buenos Aires University. He also organized the Institute of Physiology at the Medical School, making it a center with an international reputation. He remained Professor and Director of the Institute until 1943.  He made a lifelong study of the hypophysis and his most important discovery concerns the role of the anterior lobe of the hypophysis in carbohydrate metabolism and the onset of diabetes.

The Nobel Prize in Physiology or Medicine 1950

Edward Calvin Kendall, Tadeus Reichstein and Philip Showalter Hench

“for their discoveries relating to the hormones of the adrenal cortex, their structure and biological effects”

As late as in 1854 the German anatomist, Kölliker, was able to claim in a review of the subject that although the function of the adrenals was still unknown, yet in certain respects great advances had been made. Two quite different parts were now distinguished, an outer part, a fairly firm cortex, and an inner, softer medulla. Kölliker classified the adrenal cortices as ductless glands, which we now call the endocrine organs.

Thomas Addison, the English doctor, observed a rare disease with a fatal course, which was characterized chiefly by anemia, general weakness and fatigue, disturbances in the digestive apparatus, enfeebled heart activity and a peculiar dark pigmentation of the skin. He published a paper 1n 1855, suggesting that this morbid picture made its appearance in persons the greater part of whose adrenals was destroyed. Subsequent experiments in animals showed that removal of the adrenals led to speedy death, the symptoms recalling those known from Addison’s disease.

In 1894 Oliver and Schäfer proved that the injection of a watery extract from the adrenals had extremely pronounced effects. Within a few years adrenaline had been produced from the extract, its composition had been ascertained, and its artificial production accomplished. The more detailed analysis showed effects of the same kind as those resulting on increased activity of the so-called sympathetic nervous system, which innervates internal organs such as the heart and vessels, the intestinal canal, etc.  Attempts to prevent by means of adrenaline the deficiency symptoms following on the removal of the adrenals failed completely. The explanation of this was given when Biedl and others showed that it is the cortex which is of vital importance, not the medulla.

The isolation of the cortin proved to be a difficult task, calling for the combined efforts of a number of research workers. Particularly important contributions were made in this field by Wintersteiner and Pfiffner, and also by Edward Kendall at the Mayo Clinic in Rochester, and Tadeus Reichstein in Basel, and their co-workers. As early as in 1934, Kendall and his group succeeded in preparing from cortex extract what was at first assumed to be pure cortin in crystalline form. They found that it contained carbon, hydrogen, and oxygen, and indicated its empirical formula. But that was only a beginning. There was no reason to suspect that the cortin was not homogeneous; as further experiments proved. In reality Kendall and his co-workers had produced a mixture of different substances closely related to one another, and their work represents the early steps in the crystallization of a whole series of cortin substances. There is at least one active cortical substance – the best known of them all, first named Compound E and now called cortisone or cortone – which was isolated at four different laboratories, among them Kendall’s and Reichstein’s.

As all the cortin substances are closely related to one another, Reichstein’s finding implies that, like the sex hormones, they belong to the large and important group of steroids. The D vitamins and the bile acids, like our most important heart remedies, the active substances in Digitalis leaves and Strophanthus seeds, are also intimately associated with the steroids

The six definitely active cortical hormones are characterized, inter alia, by a double bond in the steroid skeleton; if this double bond disappears, inactive substances are obtained. They differ very inconsiderably from each other chemically. They are built up of 21 carbon atoms, but the number of oxygen atoms in the molecule is three, four, or five. The position of the additional oxygen atoms in the molecule was first established by Reichstein and Kendall, and thus a way was opened for semisynthetic production e.g. from the more easily obtainable bile acids or material from a certain species of Strophanthus. This is of particular importance, since the yield from the adrenals is very poor, at most about 1:1,000,000.

Thanks to the work of Kendall and his school, it has emerged that the comparatively inconsiderable dissimilarities in the matter of the structure of the cortical hormones are accompanied by material differences in respect of the effect. Thus some act especially strongly on the metabolism of sugar, others on the salt and fluid balances, and there are also several other differences. This was illustrated when Compound E was first tested. Pfiffner and Wintersteiner, like the Reichstein group, found that the substance had no, or extremely inconsiderable, life-prolonging effects on animals deprived of the adrenals. On the other hand, Ingle, Kendall’s coworker, observed that it stimulated the muscular work of such animals very strongly.

In the April of 1949, Hench, Kendall, Slocumb and Polley published their experiences in respect of the dramatic effects of cortisone in cases of chronic rheumatoid arthritis. A rapid improvement set in, pains and tenderness in the joints abated or disappeared, mobility increased, so that patients who had previously been complete invalids could walk about freely, and their general condition was also favourably affected. Similar results were obtained with a preparation from the anterior lobe of the pituitary, the so-called ACTH (Adreno-Cortico-Tropic Hormone), which, as the name indicates, stimulates the adrenal cortex to increased activity.

The value of a discovery lies not only in the immediate practical results, but equally much in the fact that it points out new lines of research. This is strikingly illustrated by the research during the last few decades into the cortical hormones, which has already led to unexpected and important new results within widely different spheres.

Nobel Prize in Physiology or Medicine 1966

Charles Huggins

Endocrine-Induced Regression of Cancers

The net increment of mass of a cancer is a function of the interaction of the tumor and its soil. Self-control of cancers results from a highly advantageous competition of host with his tumor. There are multiple factors which restrain cancer – enzymatic, nutritional, immunologic, the genotype and others.Prominent among them is the endocrine status, both of tumor and host – the subjects of this discourse.

The second quarter of our century found the biological sciences much pre-occupied with two noble topics :

  • chemistry and physiology of steroids and
  • biochemistry of organo-phosphorus compounds.

The key to the puzzle of the steroid hormones in cancer was the isolation of crystalline estrone by Doisy et al.2 from extracts of urine of pregnant women. In the phosphorus field there were magnificent findings of hexose phosphates, nucleotides, coenzymes and high-energy phosphate intermediates. These wonderful discoveries provided the Zeitgeist for our work.

Through the portal of phosphorus metabolism we entered on a series of interconnected observations in steroid endocrinology. A program was not prepared in advance for this basic physiologic study. The work was fascinating and informative so that it provided its own momentum and served as an end in itself.

The prostatic cell does not die in the absence of testosterone, it merely shrivels. But the hormone-dependent cancer cell is entirely different. It grows in the presence of supporting hormones but it dies in their absence and for this reason it cannot participate in growth cycles.

A remarkable effect of testosterone is the promotion of growth of its target cells during complete deprival of food. Androstane derivatives conferred on the prostate of puppies a selective nutritional advantage during starvation of 3 weeks whereby abundant growth of this gland-occurred while there was serious cell breakdown in most of the tissues of the body.

At first it was vexatious to encounter a dog with a prostatic tumor during a metabolic study but before long such dogs were sought. It was soon observed that orchiectomy or the administration of restricted amounts of phenolic estrogens caused a rapid shrinkage of canine prostatic tumors.

The experiments on canine neoplasia proved relevant to human prostate cancer; there had been no earlier reports indicating any relationship of hormones to this malignant growth.

Kutscher and Wolbergs9 discovered that acid phosphatase is rich in concentration in the prostate of adult human males. Gutman and Gutman10 found that many patients with metastatic prostate cancer have significant increases of acid phosphatase in their blood serum. Cancer of the prostate frequently metastasizes to bone.

Human prostate cancer which had metastasized to bone was studied at first. The activities of acid and alkaline phosphatases in the blood were measured concurrently at frequent intervals. The methods are reproducible and not costly in time or materials; both enzymes were measured in duplicate in a small quantity (0.5 ml) of serum. The level of acid phosphatase indicated activity of the disseminated cancer cells in all metastatic loci. The titer of alkaline phosphatase revealed the function of the osteoblasts as influenced by the presence of the prostatic cancer cells that were their near neighbors. By periodic measurement of the two enzymes one obtains a view of overall activity of the cancer and the reaction of non-malignant cells of the host to the presence of that cancer. Thereby the great but opposing influences of, respectively, the administration or deprival of androgenic hormones upon prostate cancer cells were revealed with precision and simplicity. Orchiectomy or the administration of phenolic estrogens resulted in regression of cancer of the human prostate whereas, in untreated cases, testosterone enhanced the rate of growth of the neoplasm.

The first indication that advanced cancer can be induced to regress was the beneficial effect of oöphorectomy on cancer of the breast of two women. This empirical observation17 of Beatson in 1896 was remarkable since it was made before the concept of hormones had been developed. The beneficial action of removal of ovaries was not understood until steroid hormones had been isolated 4 decades later.

But why does breast cancer thrive in folks who do not possess ovarian function – in men, old women, and females who have had oöphorectomy?

Farrow and Adair observed that benefits of great magnitude frequently follow orchiectomy in mammary cancer in the human male. Thereby, they established that testis function can sustain mammary cancer.

A half century after the classic invention of Beatson it was found out that adrenal function can maintain and promote growth of human mammary cancer. The adrenal factor supporting growth of cancer was identified when it was shown that bilateral adrenalectomy (with glucocorticoids as substitution therapy) can result in profound and prolonged regression of mammary carcinoma in men and women who do not possess gonadal function. In developing the idea of adrenalectomy for treatment of advanced cancer in man we were considerably influenced by the discovery of Woolley et al. that adrenals can evoke cancer of the breast in the mouse.

Mammary cancers induced in the male rat by aromatics were not influenced by orchiectomy and hypophysectomy; by definition, these neoplasms are hormone-independent. In contrast to male rat, most mammary cancers of men wither impressively after deprival of supporting hormones.

The hormone-responsiveness of established mammary cancers induced in female rat by aromatics or ionizing radiation is identical; it was a newly recognized property of experimental breast cancers. Prior to this finding, clinical study of patients with mammary cancer was the only material available for investigation of hormonal-restraint of neoplasms of the breast.

In female rat, many but far from all of the induced mammary cancers vanished after removal of ovaries or the pituitary. In our experiments hypophysectomy was the most efficient of all methods to cure rat’s mammary cancer.

Malignant cells which succumb to hormone-deprival, by definition, are hormone-dependent. The quality of hormone-dependence resides in the tumor cells whereas their growth is determined by the host’s endocrine status.

Both man and the animals can have some of their cancer cells which are hormone-dependent while other neoplastic cells in the same organism are not endocrine-responsive.

The cure of a cancer after hormone-deprival results from death of the cancer cells whereas their normal analogues in the same animal shrivel but survive. It is a basic proposition in endocrine-restraint of malignant disease that cancer cells can differ in a crucial way from ancestral normal cells in response to modification of the hormonal milieu intérieur of the body.

Cancer is not necessarily autonomous and intrinsically self-perpetuating. Its growth can be sustained and propagated by hormonal function in the host which is not unusual in kind or exaggerated in rate but which is operating at normal or even subnormal levels.

The control of cancer by endocrine methods can be described in three propositions:

  • Some types of cancer cells differ in a cardinal way from the cells from which they arose in their response to change in their hormonal environment.
  • Certain cancers are hormone-dependent and these cells die when supporting hormones are eliminated.
  • Certain cancers succumb when large amounts of hormones are administered.

The Nobel Prize in Physiology or Medicine 1971

Earl W. Sutherland, Jr.

“for his discoveries concerning the mechanisms of the action of hormones”

Part II. Vitamins

The Nobel Prize in Physiology or Medicine 1929

Christiaan Eijkman “for his discovery of the antineuritic vitamin”

Sir Frederick Gowland Hopkins “for his discovery of the growth-stimulating vitamins”

When the 20th century began, the prevailing thought about nutrition rested on the importance of energy requirements, as elucidated by  Rubner, Benedict and others, in the United States, that entails the quantitative measurement of the food value of carbohydrates, fats, and proteins. But there was a misconception of the process in its detail. The quantitative studies of the energetics and of respiratory exchange were not sufficient to explain problems that arise as a result of deficiencies of micronutrients in food intake.  The complexity of these nutritional needs as we now view them is indeed astonishing.

There is a need for indispensable organic substances specific in nature and function of which the quantitative supply is so small as to contribute little or nothing to the energy factor in nutrition. These substances, following the suggestion of Casimir Funk, we have agreed to call vitamins.

In 1881, Lunin, and associate of Bungel noted that a diet of milk was not sufficient to sustain the life of mice, even if the caloric nutrients were adequate. The main lesson taken from the findings was concerned with inorganic nutrients had not been determined that would answer the question. A decade later, Socin, in Bunge’s group, concluded that the deficiency was in the quality of protein.  In an important paper by Professor Pekelharing in 1905 published an astonishing paper following on the work in Bungel’s lab. He noted that there is a substance in milk in small quantities that he was unable to identify that is essential for life.  It is noteworthy that Pekelharing records prolonged endeavours towards the isolation of a vitamin.

Eikman’s work came in the 1880s. He did not at first visualize beriberi clearly as a deficiency disease. The view that the cortical substance in rice supplied a need rather than neutralized a poison was soon after put forward by Grijns and ultimately accepted by Professor Eijkman himself.  The prevailing thinking about nutritional requirements was preoccupied by the methods of calorimetry at the turn of the century.  The idea of “deficiency diseases” was obscured as a result. There was no concept of an indispensable portion of the food supply other than calories, proteins and minerals until 1911-1912.  Hopkins was convinced that the science of nutrition had to come to terms with an explanation for scurvy and rickets, and he needed to use the new science of biochemistry, which was ongoing at Cambridge.

In 1906-1907, he carried out studies of feeding rats casein, along the lines of Bungel.s experiments, and he found variability in the results with different casein preparations.  He next washed the casein so that any soluble substance was extracted and the rats died, but if he added the extract they grew.  He also used butter, with results more favorable than casein, and lard, with unfavorable results.  At the same time he was studying polyneuritis in birds, which took up much time.  He know that he had to extract the substance, but was unaware of the fat solubility in 1910. He published his work in 1912. Soon after the publication of his work, and duting WWI, much research was done in US, by Osborn and Mendel at Harvard, and by McCollum at Johns Hopkins, and the vitamins were separated into “water soluble” and “fat soluble”.

The Nobel Prize in Physiology or Medicine 1937

Albert von Szent-Györgyi Nagyrápolt

“for his discoveries in connection with the biological combustion processes, with special reference to vitamin C and the catalysis of fumaric acid”

http://pharmaceuticalintelligence.com/2014/08/18/studies-of-respiration-lead-to-acetyl-coa/

Szent Gyorgyi was a biochemist who worked with Otto Warburg and others, and had a special interest in muscle metabolism. He delineated a portion of the Krebs cycle (Krebs was also associated with Warburg), that which involves the conversion of fumaric acid to succinate.  He also purified vitamin C (ascorbic acid) from paprika in his native region of Hungary. He later turned his interest to cancer research, for which he was honored by the MD Anderson Cancer Center.

The Nobel Prize in Physiology or Medicine 1934

George Hoyt Whipple, George Richards Minot and William Parry Murphy

“for their discoveries concerning liver therapy in cases of anaemia”

The Nobel Prize in Physiology or Medicine 1943

Henrik Carl Peter Dam “for his discovery of vitamin K”

Edward Adelbert Doisy “for his discovery of the chemical nature of vitamin K”

To further his studies of the metabolism of sterols, Dam obtained a Rockefeller Fellowship and worked in Rudolph Schoenheimer’s Laboratory in Freiburg, Germany, during 1932-1933, and later worked with P. Karrer, of Zurich, in 1935. He discovered vitamin K while studying the sterol metabolism of chicks in Copenhagen. When he returned to Denmark after WWII in 1946, Dam’s main research subjects were vitamin K, vitamin E, fats, cholesterol.

Part III.  Microbiology and Plague

The Nobel Prize in Physiology or Medicine 1901

Emil Adolf von Behring

“for his work on serum therapy, especially its application against diphtheria, by which he has opened a new road in the domain of medical science and thereby placed in the hands of the physician a victorious weapon against illness and deaths”

The Nobel Prize in Physiology or Medicine 1902

Ronald Ross

“for his work on malaria, by which he has shown how it enters the organism and thereby has laid the foundation for successful research on this disease and methods of combating it”

The Nobel Prize in Physiology or Medicine 1905

Robert Koch

“for his investigations and discoveries in relation to tuberculosis”

The Nobel Prize in Physiology or Medicine 1908

The Nobel Prize in Physiology or Medicine 1928

Charles Jules Henri Nicolle

“for his work on typhus”

The Nobel Prize in Physiology or Medicine 1939

Gerhard Domagk

“for the discovery of the antibacterial effects of prontosil”

The Nobel Prize in Physiology or Medicine 1945

Sir Alexander Fleming, Ernst Boris Chain and Sir Howard Walter Florey

“for the discovery of penicillin and its curative effect in various infectious diseases”

The Nobel Prize in Physiology or Medicine 1951

Max Theiler

“for his discoveries concerning yellow fever and how to combat it”

The Nobel Prize in Physiology or Medicine 1952

Selman Abraham Waksman

“for his discovery of streptomycin, the first antibiotic effective against tuberculosis”

The Nobel Prize in Physiology or Medicine 1954

John Franklin Enders, Thomas Huckle Weller and Frederick Chapman Robbins

“for their discovery of the ability of poliomyelitis viruses to grow in cultures of various types of tissue”

The Nobel Prize in Physiology or Medicine 1976

Baruch S. Blumberg and D. Carleton Gajdusek

“for their discoveries concerning new mechanisms for the origin and dissemination of infectious diseases”

Part IV.

Ilya Ilyich Mechnikov and Paul Ehrlich

“in recognition of their work on immunity”

The Nobel Prize in Physiology or Medicine 1919

Jules Bordet

“for his discoveries relating to immunity”

The Nobel Prize in Physiology or Medicine 1930 was awarded to Karl Landsteiner “for his discovery of human blood groups”.

In 1901, in the course of his serological studies Landsteiner observed that when, under normal physiological conditions, blood serum of a human was added to normal blood of another human the red corpuscles in some cases coalesced into larger or smaller clusters. This observation of Landsteiner was the starting-point of his discovery of the human blood groups. In the following year, i.e. 1901, Landsteiner published his discovery that in man, blood types could be classified into three groups according to their different agglutinating properties. These agglutinating properties were identified more closely by two specific blood-cell structures, which can occur either singly or simultaneously in the same individual.

Landsteiner’s discovery of the blood groups was immediately confirmed but it was a long time before anyone began to realize the great importance of the discovery. The first incentive to pay greater attention to this discovery was provided by von Dungern and Hirszfeld when in 1910 they published their investigations into the hereditary transmission of blood groups. Thereafter the blood groups became the subject of exhaustive studies, on a scale increasing year by year, in more or less all civilized countries. In order to avoid, in the publication of research on this subject, detailed descriptions which would otherwise be necessary – of the four blood groups and their appropriate cell structures, certain short designations for the blood groups and corresponding specific cell structures have been introduced. Thus, one of the two specific cell structures, characterizing the agglutinating properties of human blood is designated by the letter A and another by B, and accordingly we speak of «blood group A» and «blood group B». These two cell structures can also occur simultaneously in the same individual, and this structure as well as the corresponding blood group is described as AB.

The fourth blood-cell structure and the corresponding blood group is known as O, which is intended to indicate that people belonging to this group lack the specific blood characteristics typical of each of the other blood groups. Landsteiner had shown that under normal physiological conditions the blood serum will not agglutinate the erythrocytes of the same individual or those of other individuals with the same structure. Thus, the blood serum of people whose erythrocytes have group structure A will not agglutinate erythrocytes of this structure but it will agglutinate those of group structure B, and where the erythrocytes have group structure B the corresponding serum does not agglutinate these erythrocytes but it does agglutinate those with group structure A. Blood serum of persons whose erythrocytes have structures A as well as B, i.e. who have structure AB, does not agglutinate erythrocytes having structures A, B, or AB. Blood serum of persons belonging to blood group O agglutinates erythrocytes of persons belonging to any of the group.

The group characteristics are handed down in accordance with Mendel’s laws. The characteristics of blood groups A, B, and AB are dominant, and opposing these dominant characteristics are the recessive ones which characterize blood group O. An individual cannot belong to blood group A, B, or AB, unless the specific characteristics of these groups are present in the parents, whereas the recessive characteristics of blood group O can occur if the parents belong to any one of the four groups. If both parents belong to group O, then the children never have the characteristics of A, B, or AB. The children must then likewise belong to blood group O. If one of the parents belongs to group A and the other to group B, then the child may belong to group A or B or it may possess both characteristics and therefore belong to group AB. If one of the parents belongs to group AB and the other to group O, then in accordance with Mendel’s law of segregation the AB characteristic can be segregated and the components can occur as separate characteristics in the children.

Even while he was a student he had begun to do biochemical research and in 1891 he published a paper on the influence of diet on the composition of blood ash. To gain further knowledge of chemistry he spent the next five years in the laboratories of Hantzsch at Zurich, Emil Fischer at Wurzburg, and E. Bamberger at Munich.

In 1896 he became an assistant under Max von Gruber in the Hygiene Institute at Vienna. Even at this time he was interested in the mechanisms of immunity and in the nature of antibodies. From 1898 till 1908 he held the post of assistant in the University Department of Pathological Anatomy in Vienna, the Head of which was Professor A. Weichselbaum, who had discovered the bacterial cause of meningitis, and with Fraenckel had discovered the pneumococcus. Here Landsteiner worked on morbid physiology rather than on morbid anatomy. In this he was encouraged by Weichselbaum, in spite of the criticism of others in this Institute.

Up to the year 1919, after twenty years of work on pathological anatomy, Landsteiner with a number of collaborators had published many papers on his findings in morbid anatomy and on immunology. He discovered new facts about the immunology of syphilis, added to the knowledge of the Wassermann reaction, and discovered the immunological factors which he named haptens (it then became clear that the active substances in the extracts of normal organs used in this reaction were, in fact, haptens). He made fundamental contributions to our knowledge of paroxysmal haemoglobinuria.

He also showed that the cause of poliomyelitis could be transmitted to monkeys by injecting into them material prepared by grinding up the spinal cords of children who had died from this disease, and, lacking in Vienna monkeys for further experiments, he went to the Pasteur Institute in Paris, where monkeys were available. His work there, together with that independently done by Flexner and Lewis, laid the foundations of our knowledge of the cause and immunology of poliomyelitis.

http://www.nobelprize.org/nobel_prizes/medicine/laureates/1930/landsteiner-bio.html

His discovery of the differences and identification of the groups that were alike made it possible for blood transfusions to become a routine procedure.  This paved the way for many other medical procedures that we don’t even think twice about today, such as surgery, blood banks, and transplants.

While in medical school, Landsteiner began experimental work in chemistry, as he was greatly inspired by Ernst Ludwig, one of his professors. After receiving his medical degree, Landsteiner spent the next five years doing advanced research in organic chemistry for Emil Fischer, although medicine remained his chief interest. During 1886-1897, he combined these interests at the Institute of Hygiene at the University of Vienna where he researched immunology and serology. These fields were developing rapidly in the late 1800s as scientists explored numerous physiological changes associated with bacterial infection. Immunology and serology then became Landsteiner’s lifelong focus. Landsteiner was primarily interested in the lack of safety and effectiveness of blood transfusions.

Landsteiner is known as the “melancholy genius” because he was so sad and intense, yet he was so systematic, thorough, and dedicated. He wrote 346 papers during his long career contributing to many areas of scientific knowledge. He is considered the father of Hematology (the study of blood), Immunology (the study of the immune system), Polio research, and Allergy research.

The fundamental contribution of Robert A. Good to the discovery of the crucial role of thymus in mammalian immunity

Domenico Ribatti

Immunology. Nov 2006; 119(3): 291–295.

http://dx.doi.org:/10.1111/j.1365-2567.2006.02484.x

Robert Alan Good was a pioneer in the field of immunodeficiency diseases. He and his colleagues defined the cellular basis and functional consequences of many of the inherited immunodeficiency diseases. His was one of the groups that discovered the pivotal role of the thymus in the immune system development and defined the separate development of the thymus-dependent and bursa-dependent lymphoid cell lineages and their responsibilities in cell-mediated and humoral immunity.

Keywords: bursa of Fabricius, history of medicine, immunology, thymus

Robert A. Good (Fig. 1) began his intellectual and experimental queries related to the thymus in 1952 at the University of Minnesota, initially with paediatric patients. However, his interest in the plasma cell, antibodies and the immune response began in 1944, while still in Medical School at the University of Minnesota in Minneapolis, with his first publication appearing in 1945.

Robert Good

Robert Good

Figure 1

Robert A. Good with two young patients. Source: http://www.robertagoodarchives.com.

Good described a new syndrome that would carry his name: ‘Good syndrome: thymoma with immunodeficiency’.7 The clinical characteristics of Good syndrome are increased susceptibility to bacterial infections by encapsulated organisms and opportunistic viral and fungal infections. Subsequently, Good saw several patients with thymic tumours, which regularly presented with immunodeficiencies, leukopenia, lymphopenia and eosinophylopenia. Plasma cells, however, were not completely absent: the patient was severely hypogammaglobulinaemic rather than agammaglobulinaemic.

The association of thymoma with profound and broadly based immunodeficiency provoked Good’s group to ask what role the thymus plays in immunity.

Good and others found that the patients lacked all of the subsequently described immunoglobulins. These patients were found not to have plasma cells or germinal centres in their haematopoietic and lymphoid tissues. They possessed circulating lymphocytes in normal numbers.

In the mouse and other rodents, immunological depression is profound after thymectomy in neonatal animals, resulting in considerable depression of antibody production, plus deficient transplantation immunity and delayed-type hypersensitivity. Speculation on the reason for immunological failure following neonatal thymectomy has centred on the thymus as a source of cells or humoral factors essential to normal lymphoid development and immunological maturation.

Three independent groups of experiments showed that neonatal thymectomy has a significant effect on immunological reactivity: (i) the studies of Fichtelius et al. in young guinea-pigs showed that the depression of antibody response is slight, but significant; (ii) the experiments of Archer, Good and co-workers in rabbits and mice; and (iii) the studies by Miller at the Chester Beatty Research Institute in London.

Stutman, in Good’s laboratory, demonstrated that non-lymphoid thymomas induced the restoration of immunological functions in neonatally thymectomized mice and that when thymomas were grafted into allogenic hosts, immunological restoration was mediated by lymphoid cells of host type. Comparable results were obtained with free thymus grafts.

Cooper et al. postulated that a lymphoid stem cell population exists that is induced to differentiate along two distinct and separate cell lines related to two central lymphoid organs. In birds this developmental influence is exercised by the thymus and the bursa of Fabricius. Removal of one or both in the early post-hatching period has strikingly different influences on immunological function in the maturing animals. The thymus in the chicken functions exactly as does the thymus of the mouse. It represents the site of differentiation of a population of lymphocytes that subserve largely the functions of cell-mediated immunity.

The athymic children described by Di George, who lacked lymphoid cells in the deep cortical areas of the nodes but not at the peripheral areas, seemed the equivalent of the neonatally thymectomized mice and chickens. These patients had severe deficiencies of small T lymhocytes and profound deficiencies of all cell-mediated immunities, including delayed allergies, deficient allograft immunities and deficiencies in resistance to viruses, fungi and opportunistic infections.
http://www.ncbi.nlm.nih.gov/pmc/articles/PMC1819567/

The Nobel Prize in Physiology or Medicine 1960

Sir Frank Macfarlane Burnet and Peter Brian Medawar

“for discovery of acquired immunological tolerance”

The Nobel Prize in Physiology or Medicine 1980

Baruj Benacerraf, Jean Dausset and George D. Snell

“for their discoveries concerning genetically determined structures on the cell surface that regulate immunological reactions”

Part V.

Biochemistry and Molecular Biology

The Nobel Prize in Physiology or Medicine 1922

Archibald Vivian Hill

“for his discovery relating to the production of heat in the muscle”

Otto Fritz Meyerhof

“for his discovery of the fixed relationship between the consumption of oxygen and the metabolism of lactic acid in the muscle”

The Nobel Prize in Physiology or Medicine 1931

Otto Heinrich Warburg

“for his discovery of the nature and mode of action of the respiratory enzyme”

http://pharmaceuticalintelligence.com/2012/11/02/otto-warburg-a-giant-of-modern-cellular-biology/

http://pharmaceuticalintelligence.com/2013/11/28/warburg-effect-revisited/

http://pharmaceuticalintelligence.com/2013/03/12/ampk-is-a-negative-regulator-of-the-warburg-effect-and-suppresses-tumor-growth-in-vivo/

http://pharmaceuticalintelligence.com/2012/10/17/is-the-warburg-effect-the-cause-or-the-effect-of-cancer-a-21st-century-view/

The Nobel Prize in Physiology or Medicine 1933

Thomas Hunt Morgan

“for his discoveries concerning the role played by the chromosome in heredity”

The Nobel Prize in Physiology or Medicine 1947

Carl Ferdinand Cori and Gerty Theresa Cori, née Radnitz

“for their discovery of the course of the catalytic conversion of glycogen”

The Nobel Prize in Physiology or Medicine 1953

Hans Adolf Krebs

“for his discovery of the citric acid cycle”

http://pharmaceuticalintelligence.com/2014/10/22/introduction-to-metabolic-pathways/

Fritz Albert Lipmann

“for his discovery of co-enzyme A and its importance for intermediary metabolism”

http://pharmaceuticalintelligence.com/2014/10/22/introduction-to-metabolic-pathways/

http://pharmaceuticalintelligence.com/2014/11/07/summary-of-cell-structure-anatomic-correlates-of-metabolic-function-2/

http://pharmaceuticalintelligence.com/2014/08/18/studies-of-respiration-lead-to-acetyl-coa/

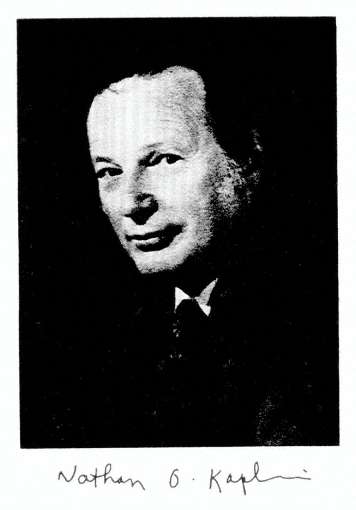
http://pharmaceuticalintelligence.com/2013/01/26/portrait-of-a-great-scientist-and-mentor-nathan-oram-kaplan/

The Nobel Prize in Physiology or Medicine 1955

Axel Hugo Theodor Theorell

“for his discoveries concerning the nature and mode of action of oxidation enzymes”

http://pharmaceuticalintelligence.com/2014/08/18/studies-of-respiration-lead-to-acetyl-coa/

The Nobel Prize in Physiology or Medicine 1958

George Wells Beadle and Edward Lawrie Tatum

“for their discovery that genes act by regulating definite chemical events”

The Nobel Prize in Physiology or Medicine 1959

Severo Ochoa and Arthur Kornberg

“for their discovery of the mechanisms in the biological synthesis of ribonucleic acid and deoxyribonucleic acid”

Joshua Lederberg

“for his discoveries concerning genetic recombination and the organization of the genetic material of bacteria”

The Nobel Prize in Physiology or Medicine 1962

Francis Harry Compton Crick, James Dewey Watson and Maurice Hugh Frederick Wilkins

“for their discoveries concerning the molecular structure of nucleic acids and its significance for information transfer in living material”

The Nobel Prize in Physiology or Medicine 1963

Sir John Carew Eccles, Alan Lloyd Hodgkin and Andrew Fielding Huxley

“for their discoveries concerning the ionic mechanisms involved in excitation and inhibition in the peripheral and central portions of the nerve cell membrane”

The Nobel Prize in Physiology or Medicine 1964

Konrad Bloch and Feodor Lynen

“for their discoveries concerning the mechanism and regulation of the cholesterol and fatty acid metabolism”
http://pharmaceuticalintelligence.com/2014/10/25/oxidation-and-synthesis-of-fatty-acids/

The Nobel Prize in Physiology or Medicine 1965

François Jacob, André Lwoff and Jacques Monod

“for their discoveries concerning genetic control of enzyme and virus synthesis”

http://pharmaceuticalintelligence.com/2014/10/06/isoenzymes-in-cell-metabolic-pathways/

The Nobel Prize in Physiology or Medicine 1967

Ragnar Granit, Haldan Keffer Hartline and George Wald

“for their discoveries concerning the primary physiological and chemical visual processes in the eye”

The Nobel Prize in Physiology or Medicine 1968

Robert W. Holley, Har Gobind Khorana and Marshall W. Nirenberg

“for their interpretation of the genetic code and its function in protein synthesis”

The Nobel Prize in Physiology or Medicine 1969

Max Delbrück, Alfred D. Hershey and Salvador E. Luria

“for their discoveries concerning the replication mechanism and the genetic structure of viruses”

The Nobel Prize in Physiology or Medicine 1970

Sir Bernard Katz, Ulf von Euler and Julius Axelrod

“for their discoveries concerning the humoral transmittors in the nerve terminals and the mechanism for their storage, release and inactivation”

The Nobel Prize in Physiology or Medicine 1972

Gerald M. Edelman and Rodney R. Porter

“for their discoveries concerning the chemical structure of antibodies”

The Nobel Prize in Physiology or Medicine 1974

Albert Claude, Christian de Duve and George E. Palade

“for their discoveries concerning the structural and functional organization of the cell”

The Nobel Prize in Physiology or Medicine 1975

David Baltimore, Renato Dulbecco and Howard Martin Temin

“for their discoveries concerning the interaction between tumour viruses and the genetic material of the cell”
The Nobel Prize in Physiology or Medicine 1977

Rosalyn Yalow

“for the development of radioimmunoassays of peptide hormones”

The Nobel Prize in Physiology or Medicine 1978

Werner Arber, Daniel Nathans and Hamilton O. Smith

“for the discovery of restriction enzymes and their application to problems of molecular genetics”

Read Full Post »

Twitter is Becoming a Powerful Tool in Science and Medicine

 Curator: Stephen J. Williams, Ph.D.

Article ID #159: Twitter is Becoming a Powerful Tool in Science and Medicine. Published on 11/6/2014

WordCloud Image Produced by Adam Tubman

Updated 4/2016

Life-cycle of Science 2

A recent Science article (Who are the science stars of Twitter?; Sept. 19, 2014) reported the top 50 scientists followed on Twitter. However, the article tended to focus on the use of Twitter as a means to develop popularity, a sort of “Science Kardashian” as they coined it. So the writers at Science developed a “Kardashian Index (K-Index) to determine scientists following and popularity on Twitter.

Now as much buzz Kim Kardashian or a Perez Hilton get on social media, their purpose is solely for entertainment and publicity purposes, the Science sort of fell flat in that it focused mainly on the use of Twitter as a metric for either promotional or public outreach purposes. A notable scientist was mentioned in the article, using Twitter feed to gauge the receptiveness of his presentation. In addition, relying on Twitter for effective public discourse of science is problematic as:

  • Twitter feeds are rapidly updated and older feeds quickly get buried within the “Twittersphere” = LIMITED EXPOSURE TIMEFRAME
  • Short feeds may not provide the access to appropriate and understandable scientific information (The Science Communication Trap) which is explained in The Art of Communicating Science: traps, tips and tasks for the modern-day scientist. “The challenge of clearly communicating the intended scientific message to the public is not insurmountable but requires an understanding of what works and what does not work.” – from Heidi Roop, G.-Martinez-Mendez and K. Mills

However, as highlighted below, Twitter, and other social media platforms are being used in creative ways to enhance the research, medical, and bio investment collaborative, beyond a simple news-feed.  And the power of Twitter can be attributed to two simple features

  1. Ability to organize – through use of the hashtag (#) and handle (@), Twitter assists in the very important task of organizing, indexing, and ANNOTATING content and conversations. A very great article on Why the Hashtag in Probably the Most Powerful Tool on Twitter by Vanessa Doctor explains how hashtags and # search may be as popular as standard web-based browser search. Thorough annotation is crucial for any curation process, which are usually in the form of database tags or keywords. The use of # and @ allows curators to quickly find, index and relate disparate databases to link annotated information together. The discipline of scientific curation requires annotation to assist in the digital preservation, organization, indexing, and access of data and scientific & medical literature. For a description of scientific curation methodologies please see the following links:

Please read the following articles on CURATION

The Methodology of Curation for Scientific Research Findings

Power of Analogy: Curation in Music, Music Critique as a Curation and Curation of Medical Research Findings – A Comparison

Science and Curation: The New Practice of Web 2.0

  1. Information Analytics –

Multiple analytic software packages have been made available to analyze information surrounding Twitter feeds, including Twitter feeds from #chat channels one can set up to cover a meeting, product launch etc.. Some of these tools include:

Twitter Analytics – measures metrics surrounding Tweets including retweets, impressions, engagement, follow rate, …

Twitter Analytics – Hashtags.org – determine most impactful # for your Tweets For example, meeting coverage of bioinvestment conferences or startup presentations using #startup generates automatic retweeting by Startup tweetbot @StartupTweetSF.


  1. Tweet Sentiment Analytics

Examples of Twitter Use

A. Scientific Meeting Coverage

In a paper entitled Twitter Use at a Family Medicine Conference: Analyzing #STFM13 authors Ranit Mishori, MD, Frendan Levy, MD, and Benjamin Donvan analyzed the public tweets from the 2013 Society of Teachers of Family Medicine (STFM) conference bearing the meeting-specific hashtag #STFM13. Thirteen percent of conference attendees (181 users) used the #STFM13 to share their thoughts on the meeting (1,818 total tweets) showing a desire for social media interaction at conferences but suggesting growth potential in this area. As we have also seen, the heaviest volume of conference-tweets originated from a small number of Twitter users however most tweets were related to session content.

However, as the authors note, although it is easy to measure common metrics such as number of tweets and retweets, determining quality of engagement from tweets would be important for gauging the value of Twitter-based social-media coverage of medical conferences.

Thea authors compared their results with similar analytics generated by the HealthCare Hashtag Project, a project and database of medically-related hashtag use, coordinated and maintained by the company Symplur.  Symplur’s database includes medical and scientific conference Twitter coverage but also Twitter usuage related to patient care. In this case the database was used to compare meeting tweets and hashtag use with the 2012 STFM conference.

These are some of the published journal articles that have employed Symplur (www.symplur.com) data in their research of Twitter usage in medical conferences.

B. Twitter Usage for Patient Care and Engagement

Although the desire of patients to use and interact with their physicians over social media is increasing, along with increasing health-related social media platforms and applications, there are certain obstacles to patient-health provider social media interaction, including lack of regulatory framework as well as database and security issues. Some of the successes and issues of social media and healthcare are discussed in the post Can Mobile Health Apps Improve Oral-Chemotherapy Adherence? The Benefit of Gamification.

However there is also a concern if social media truly engages the patient and improves patient education. In a study of Twitter communications by breast cancer patients Tweeting about breast cancer, authors noticed Tweeting was a singular event. The majority of tweets did not promote any specific preventive behavior. The authors concluded “Twitter is being used mostly as a one-way communication tool.” (Using Twitter for breast cancer prevention: an analysis of breast cancer awareness month. Thackeray R1, Burton SH, Giraud-Carrier C, Rollins S, Draper CR. BMC Cancer. 2013;13:508).

In addition a new poll by Harris Interactive and HealthDay shows one third of patients want some mobile interaction with their physicians.

Some papers cited in Symplur’s HealthCare Hashtag Project database on patient use of Twitter include:

C. Twitter Use in Pharmacovigilance to Monitor Adverse Events

Pharmacovigilance is the systematic detection, reporting, collecting, and monitoring of adverse events pre- and post-market of a therapeutic intervention (drug, device, modality e.g.). In a Cutting Edge Information Study, 56% of pharma companies databases are an adverse event channel and more companies are turning to social media to track adverse events (in Pharmacovigilance Teams Turn to Technology for Adverse Event Reporting Needs). In addition there have been many reports (see Digital Drug Safety Surveillance: Monitoring Pharmaceutical Products in Twitter) that show patients are frequently tweeting about their adverse events.

There have been concerns with using Twitter and social media to monitor for adverse events. For example FDA funded a study where a team of researchers from Harvard Medical School and other academic centers examined more than 60,000 tweets, of which 4,401 were manually categorized as resembling adverse events and compared with the FDA pharmacovigilance databases. Problems associated with such social media strategy were inability to obtain extra, needed information from patients and difficulty in separating the relevant Tweets from irrelevant chatter.  The UK has launched a similar program called WEB-RADR to determine if monitoring #drug_reaction could be useful for monitoring adverse events. Many researchers have found the adverse-event related tweets “noisy” due to varied language but had noticed many people do understand some principles of causation including when adverse event subsides after discontinuing the drug.

However Dr. Clark Freifeld, Ph.D., from Boston University and founder of the startup Epidemico, feels his company has the algorithms that can separate out the true adverse events from the junk. According to their web site, their algorithm has high accuracy when compared to the FDA database. Dr. Freifeld admits that Twitter use for pharmacovigilance purposes is probably a starting point for further follow-up, as each patient needs to fill out the four-page forms required for data entry into the FDA database.

D. Use of Twitter in Big Data Analytics

Published on Aug 28, 2012

http://blogs.ischool.berkeley.edu/i29…

Course: Information 290. Analyzing Big Data with Twitter
School of Information
UC Berkeley

Lecture 1: August 23, 2012

Course description:
How to store, process, analyze and make sense of Big Data is of increasing interest and importance to technology companies, a wide range of industries, and academic institutions. In this course, UC Berkeley professors and Twitter engineers will lecture on the most cutting-edge algorithms and software tools for data analytics as applied to Twitter microblog data. Topics will include applied natural language processing algorithms such as sentiment analysis, large scale anomaly detection, real-time search, information diffusion and outbreak detection, trend detection in social streams, recommendation algorithms, and advanced frameworks for distributed computing. Social science perspectives on analyzing social media will also be covered.

This is a hands-on project course in which students are expected to form teams to complete intensive programming and analytics projects using the real-world example of Twitter data and code bases. Engineers from Twitter will help advise student projects, and students will have the option of presenting their final project presentations to an audience of engineers at the headquarters of Twitter in San Francisco (in addition to on campus). Project topics include building on existing infrastructure tools, building Twitter apps, and analyzing Twitter data. Access to data will be provided.

Other posts on this site on USE OF SOCIAL MEDIA AND TWITTER IN HEALTHCARE and Conference Coverage include:

Methodology for Conference Coverage using Social Media: 2014 MassBio Annual Meeting 4/3 – 4/4 2014, Royal Sonesta Hotel, Cambridge, MA

Strategy for Event Joint Promotion: 14th ANNUAL BIOTECH IN EUROPE FORUM For Global Partnering & Investment 9/30 – 10/1/2014 • Congress Center Basel – SACHS Associates, London

REAL TIME Cancer Conference Coverage: A Novel Methodology for Authentic Reporting on Presentations and Discussions launched via Twitter.com @ The 2nd ANNUAL Sachs Cancer Bio Partnering & Investment Forum in Drug Development, 19th March 2014 • New York Academy of Sciences • USA

PCCI’s 7th Annual Roundtable “Crowdfunding for Life Sciences: A Bridge Over Troubled Waters?” May 12 2014 Embassy Suites Hotel, Chesterbrook PA 6:00-9:30 PM

CRISPR-Cas9 Discovery and Development of Programmable Genome Engineering – Gabbay Award Lectures in Biotechnology and Medicine – Hosted by Rosenstiel Basic Medical Sciences Research Center, 10/27/14 3:30PM Brandeis University, Gerstenzang 121

Tweeting on 14th ANNUAL BIOTECH IN EUROPE FORUM For Global Partnering & Investment 9/30 – 10/1/2014 • Congress Center Basel – SACHS Associates, London

http://pharmaceuticalintelligence.com/press-coverage/

Statistical Analysis of Tweet Feeds from the 14th ANNUAL BIOTECH IN EUROPE FORUM For Global Partnering & Investment 9/30 – 10/1/2014 • Congress Center Basel – SACHS Associates, London

1st Pitch Life Science- Philadelphia- What VCs Really Think of your Pitch

What VCs Think about Your Pitch? Panel Summary of 1st Pitch Life Science Philly

How Social Media, Mobile Are Playing a Bigger Part in Healthcare

Can Mobile Health Apps Improve Oral-Chemotherapy Adherence? The Benefit of Gamification.

Medical Applications and FDA regulation of Sensor-enabled Mobile Devices: Apple and the Digital Health Devices Market

E-Medical Records Get A Mobile, Open-Sourced Overhaul By White House Health Design Challenge Winners

Read Full Post »

Introduction to Signaling

Curator: Larry H. Bernstein, MD, FCAP


We have laid down a basic structure and foundation for the remaining presentations.  It was essential to begin with the genome, which changed the course of teaching of biology and medicine in the 20th century, and introduced a central dogma of translation by transcription.  Nevertheless, there were significant inconsistencies and unanswered questions entering the twenty first century, accompanied by vast improvements in technical advances to clarify these issues. We have covered carbohydrate, protein, and lipid metabolism, which function in concert with the development of cellular structure, organ system development, and physiology.  To be sure, the progress in the study of the microscopic and particulate can’t be divorced from the observation of the whole.  We were left in the not so distant past with the impression of the Sufi story of the elephant and the three blind men, who one at a time held the tail, the trunk, and the ear, each proclaiming that it was the elephant.

I introduce here a story from the Brazilian biochemist, Jose

Eduardo des Salles Rosalino, on a formativr experience he had with the Nobelist, Luis Leloir.

Just at the beginning, when phosphorylation of proteins is presented, I assume you must mention that some proteins are activated by phosphorylation. This is fundamental in order to present self –organization reflex upon fast regulatory mechanisms. Even from an historical point of view. The first observation arrived from a sample due to be studied on the following day of glycogen synthetase. It was unintended left overnight out of the refrigerator. The result was it has changed from active form of the previous day to a non-active form. The story could have being finished here, if the researcher did not decide to spent this day increasing substrate levels (it could be a simple case of denaturation of proteins that changes its conformation despite the same order of amino acids). He kept on trying and found restoration of maximal activity. This assay was repeated with glycogen phosphorylase and the result was the opposite – it increases its activity. This led to the discovery

  • of cAMP activated protein kinase and
  • the assembly of a very complex system in the glycogen granule
  • that is not a simple carbohydrate polymer.

Instead, it has several proteins assembled and

  • preserves the capacity to receive from a single event (rise in cAMP)
  • two opposing signals with maximal efficiency,
  • stops glycogen synthesis,
  • as long as levels of glucose 6 phosphate are low
  • and increases glycogen phosphorylation as long as AMP levels are high).

I did everything I was able to do by the end of 1970 in order to repeat the assays with PK I, PKII and PKIII of M. Rouxii and using the Sutherland route to cAMP failed in this case. I then asked Leloir to suggest to my chief (SP) the idea of AA, AB, BB subunits as was observed in lactic dehydrogenase (tetramer) indicating this as his idea. The reason was my “chief”(SP) more than once, had said to me: “Leave these great ideas for the Houssay, Leloir etc…We must do our career with small things.” However, as she also had a faulty ability for recollection she also used to arrive some time later, with the very same idea but in that case, as her idea.
Leloir, said to me: I will not offer your interpretation to her as mine. I think it is not phosphorylation, however I think it is glycosylation that explains the changes in the isoenzymes with the same molecular weight preserved. This dialogue explains why during the reading and discussing “What is life” with him he asked me if as a biochemist in exile, talking to another biochemist, I expressed myself fully. I had considered that Schrödinger would not have confronted Darlington & Haldane because he was in U.K. in exile. This might explain why Leloir could have answered a bad telephone call from P. Boyer, Editor of The Enzymes, in a way that suggested that the pattern could be of covalent changes over a protein. Our FEBS and Eur J. Biochemistry papers on pyruvate kinase of M. Rouxii is wrongly quoted in this way on his review about pyruvate kinase of that year (1971).


Another aspect I think you must call attention to the following. Show in detail with different colors what carbons belongs to CoA, a huge molecule in comparison with the single two carbons of acetate that will produce the enormous jump in energy yield

  • in comparison with anaerobic glycolysis.

The idea is

  • how much must have been spent in DNA sequences to build that molecule in order to use only two atoms of carbon.

Very limited aspects of biology could be explained in this way. In case we follow an alternative way of thinking, it becomes clearer that proteins were made more stable by interaction with other molecules (great and small). Afterwards, it’s rather easy to understand how the stability of protein-RNA complexes where transmitted to RNA (vibrational +solvational reactivity stability pair of conformational energy).

Millions of years later, or as soon as, the information of interaction leading to activity and regulation could be found in RNA, proteins like reverse transcriptase move this information to a more stable form (DNA). In this way it is easier to understand the use of CoA to make two carbon molecules more reactive.

The discussions that follow are concerned with protein interactions and signaling.

Read Full Post »

Metformin, Thyroid-Pituitary Axis, Diabetes Mellitus, and Metabolism

Metformin, Thyroid-Pituitary Axis, Diabetes Mellitus, and Metabolism

Larry H, Bernstein, MD, FCAP, Author and Curator
and Aviva Lev-Ari, PhD, RN

http://pharmaceuticalintelligence.com/9/27/2014/Metformin,_thyroid-pituitary_ axis,_diabetes_mellitus,_and_metabolism

The following article is a review of the central relationship between the action of
metformin as a diabetic medication and its relationship to AMPK, the important and
essential regulator of glucose and lipid metabolism under normal activity, stress, with
its effects on skeletal muscle, the liver, the action of T3 and more.

We start with a case study and a publication in the J Can Med Assoc.  Then we shall look
into key literature on these metabolic relationships.

Part I.  Metformin , Diabetes Mellitus, and Thyroid Function

Hypothyroidism, Insulin resistance and Metformin
May 30, 2012   By Janie Bowthorpe
The following was written by a UK hypothyroid patient’s mother –
Sarah Wilson.

My daughter’s epilepsy is triggered by unstable blood sugars. And since taking
Metformin to control her blood sugar, she has significantly reduced the number of
seizures. I have been doing research and read numerous academic medical journals,
which got me thinking about natural thyroid hormone and Hypothyroidism. My hunch
was that when patients develop hypothyroid symptoms, they are actually becoming
insulin resistant (IR). There are many symptoms in common between women with
polycystic ovaries and hypothyroidism–the hair loss, the weight gain, etc.
(http://insulinhub.hubpages.com/hub/PCOS-and-Hypothyroidism).

A hypothyroid person’s body behaves as if it’s going into starvation mode and so, to
preserve resources and prolong life, the metabolism changes. If hypothyroid is prolonged
or pronounced, then perhaps, chemical preservation mode becomes permanent even
with the reintroduction of thyroid hormones. To get back to normal, they need
a “jump-start” reinitiate a higher rate of metabolism. The kick start is initiated through
AMPK, which is known as the “master metabolic regulating enzyme.”
(http://en.wikipedia.org/wiki/AMP-activated protein kinase).

Guess what? This is exactly what happens to Diabetes patients when Metformin is
introduced. http://en.wikipedia.org/wiki/Metformin
Suggested articles: http://www.springerlink.com/content/r81606gl3r603167/  and
http://onlinelibrary.wiley.com/doi/10.1111/j.1365-2265.2011.04029.x/pdf

Note the following comments/partial statements:
“Hypothyroidism is characterized by decreased insulin responsiveness”;
“the pivotal regulatory role of T3 in major metabolic pathways”.

The community knows that T3/NTH (natural thyroid hormone [Armour]) makes
hypothyroid patients feel better – but the medical establishment is averse to T3/NTH
(treating subclinical hypoT (T3/T4 euthyroid) with natural dessicated thyroid (NDT).
The medical establishment might find an alternative view about impaired metabolism
more if shown real proof that the old NDT **was/is** having the right result –i.e., the
T3 is jump-starting the metabolism by re-activating
 AMPK.

If NDT also can be used for hypothyroidism without the surmised “dangers” of NTH,
then they should consider it. [The reality in the choice is actually recombinant TH
(Synthroid)]. Metformin is cheap, stable and has very few serious side effects. I use the
car engine metaphor, and refer to glucose as our petrol, AMPK as the spark plug and
both T3 and Metformin as the ignition switches. Sometimes if you have flat batteries in
the car, it doesn’t matter how much you turn the ignition switch or pump the petrol
pedal, all it does is flatten the battery and flood the engine.

Dr. Skinner in the UK has been treating “pre-hypothyroidism” the way that some
doctors treat “pre-diabetes”. Those hypothyroid patients who get treated early
might not have had their AMPK pathways altered and the T4-T3 conversion still works.
There seems to be no reason why thyroid hormone replacement therapy shouldn’t
logically be given to ward off a greater problem down the line.

It’s my belief that there is clear and abundant academic evidence that the AMPK/
Metformin research should branch out to also look at thyroid disease.

Point – direct T3 is kicking the closed -down metabolic process back into life,
just like Metformin does for insulin resistance.
http://www.hotthyroidology.com/editorial_79.html
There is serotonin resistance! http://www.ncbi.nlm.nih.gov/pubmed/17250776

Metformin Linked to Risk of Low Levels of Thyroid Hormone

CMAJ (Canadian Medical Association Journal) 09/22/2014

Metformin, the drug commonly for treating type 2 diabetes,

  • is linked to an increased risk of low thyroid-stimulating hormone
    (TSH) levels
  • in patients with underactive thyroids (hypothyroidism),

according to a study in CMAJ (Canadian Medical Association Journal).

Metformin is used to lower blood glucose levels

  • by reducing glucose production in the liver.

previous studies have raised concerns that

  • metformin may lower thyroid-stimulating hormone levels.

Study characteristics:

  1. Retrospective  long-term
  2. 74 300 patient who received metformin and sulfonylurea
  3. 25-year study period.
  4. 5689 had treated hypothyroidism
  5. 59 937 had normal thyroid function.

Metformin and low levels of thyroid-stimulating hormone in
patients with type 2 diabetes mellitus

Jean-Pascal Fournier,  Hui Yin, Oriana Hoi Yun Yu, Laurent Azoulay  +
Centre for Clinical Epidemiology (Fournier, Yin, Yu, Azoulay), Lady Davis Institute,
Jewish General Hospital; Department of Epidemiology, Biostatistics and Occupational
Health (Fournier), McGill University; Division of Endocrinology (Yu), Jewish General
Hospital; Department of Oncology (Azoulay), McGill University, Montréal, Que., Cananda

CMAJ Sep 22, 2014,   http://dx.doi.org:/10.1503/cmaj.140688

Background:

  • metformin may lower thyroid-stimulating hormone (TSH) levels.

Objective:

  • determine whether the use of metformin monotherapy, when compared with
    sulfonylurea monotherapy,
  • is associated with an increased risk of low TSH levels(< 0.4 mIU/L)
  • in patients with type 2 diabetes mellitus.

Methods:

  • Used the Clinical Practice Research Datalink,
  • identified patients who began receiving metformin or sulfonylurea monotherapy
    between Jan. 1, 1988, and Dec. 31, 2012.
  • 2 subcohorts of patients with treated hypothyroidism or euthyroidism,

followed them until Mar. 31, 2013.

  • Used Cox proportional hazards models to evaluate the association of low TSH
    levels with metformin monotherapy, compared with sulfonylurea monotherapy,
    in each subcohort.

Results:

  • 5689 patients with treated hypothyroidism and 59 937 euthyroid patients were
    included in the subcohorts.

For patients with treated hypothyroidism:

  1. 495 events of low TSH levels were observed (incidence rate 0.1197/person-years).
  2. 322 events of low TSH levels were observed (incidence rate 0.0045/person-years)
    in the euthyroid group.
  • metformin monotherapy was associated with a 55% increased risk of low TSH
    levels 
    in patients with treated hypothyroidism (incidence rate 0.0795/person-years
    vs.0.1252/ person-years, adjusted hazard ratio [HR] 1.55, 95% confidence
    interval [CI] 1.09– 1.20), compared with sulfonylurea monotherapy,
  • the highest risk in the 90–180 days after initiation (adjusted HR 2.30, 95% CI
    1.00–5.29).
  • No association was observed in euthyroid patients (adjusted HR 0.97, 95% CI 0.69–1.36).

Interpretation: The clinical consequences of this needs further investigation.


Crude and adjusted hazard ratios for suppressed thyroid-stimulating hormone
levels (< 0.1 mIU/L) associated with the use metformin monotherapy, compared
with sulfonylurea monotherapy, in patients with treated hypothyroidism or
euthyroidism and type 2 diabetes
Variable No. events
suppressed
TSH levels
Person-years of
exposure
Incidence rate,
per 1000 person-years (95% CI)
Crude
HR
Adjusted HR*(95% CI)
Patients with treated hypothyroidism, n = 5689
Sulfonylure,
n = 762
18 503 35.8
(21.2–56.6)
1.00 1.00
(reference)
Metformin,
n = 4927
130 3 633 35.8
(29.9–42.5)
1.05 0.99
(0.57–1.72)
Euthyroid patients, n = 59 937
Sulfonylurea,
n = 7980
12 8 576 1.4
(0.7–2.4)
1.00 1.00
(reference)
Metformin,
n = 51 957
75 63 047 1.2
(0.9–1.5)
0.85 1.03
(0.52–2.03)


Part II. Metabolic Underpinning 
(Source: Wikipedia, AMPK and thyroid)

5′ AMP-activated protein kinase or AMPK or 5′ adenosine monophosphate-activated protein kinase
is an enzyme that plays a role in cellular energy homeostasis.
It consists of three proteins (subunits) that

  1. together make a functional enzyme, conserved from yeast to humans.
  2. It is expressed in a number of tissues, including the liver, brain, and skeletal
    muscle.
  3. The net effect of AMPK activation is stimulation of
    1. hepatic fatty acid oxidation and ketogenesis,
    2. inhibition of cholesterol synthesis,
    3. lipogenesis, and triglyceride synthesis,
    4. inhibition of adipocyte lipolysis and lipogenesis,
    5. stimulation of skeletal muscle fatty acid oxidation and muscle
      glucose uptake, and
    6. modulation of insulin secretion by pancreatic beta-cells.

The heterotrimeric protein AMPK is formed by α, β, and γ subunits. Each of these three
subunits takes on a specific role in both the stability and activity of AMPK.

  • the γ subunit includes four particular Cystathionine beta synthase (CBS) domains
    giving AMPK its ability to sensitively detect shifts in the AMP:ATP ratio.
  • The four CBS domains create two binding sites for AMP commonly referred to as
    Bateman domains. Binding of one AMP to a Bateman domain cooperatively
    increases the binding affinity of the second AMP to the other Bateman domain.
  • As AMP binds both Bateman domains the γ subunit undergoes a conformational
    change which exposes the catalytic domain found on the α subunit.
  • It is in this catalytic domain where AMPK becomes activated when
    phosphorylation takes place at threonine-172by an upstream AMPK kinase
    (AMPKK). The α, β, and γ subunits can also be found in different isoforms.

AMPK acts as a metabolic master switch regulating several intracellular systems

  1. the cellular uptake of glucose,
  2. the β-oxidation of fatty acids and
  3. the biogenesis of glucose transporter 4 (GLUT4) and
  4. mitochondria

The energy-sensing capability of AMPK can be attributed to

  • its ability to detect and react to fluctuations in the AMP:ATP ratio that take
    place during rest and exercise (muscle stimulation).

During muscle stimulation,

  • AMP increases while ATP decreases, which changes AMPK into a good substrate
    for activation.
  • AMPK activity increases while the muscle cell experiences metabolic stress
    brought about by an extreme cellular demand for ATP.
  • Upon activation, AMPK increases cellular energy levels by
    • inhibiting anabolic energy consuming pathways (fatty acid synthesis,
      protein synthesis, etc.) and
    • stimulating energy producing, catabolic pathways (fatty acid oxidation,
      glucose transport, etc.).

A recent JBC paper on mice at Johns Hopkins has shown that when the activity of brain
AMPK was pharmacologically inhibited,

  • the mice ate less and lost weight.

When AMPK activity was pharmacologically raised (AICAR see below)

  • the mice ate more and gained weight.

Research in Britain has shown that the appetite-stimulating hormone ghrelin also
affects AMPK levels.

The antidiabetic drug metformin (Glucophage) acts by stimulating AMPK, leading to

  1. reduced glucose production in the liver and
  2. reduced insulin resistance in the muscle.

(Metformin usually causes weight loss and reduced appetite, not weight gain and
increased appetite, ..opposite of expected from the Johns Hopkins mouse study results.)

Triggering the activation of AMPK can be carried out provided two conditions are met.

First, the γ subunit of AMPK

  • must undergo a conformational change so as to
  • expose the active site(Thr-172) on the α subunit.

The conformational change of the γ subunit of AMPK can be accomplished

  • under increased concentrations of AMP.

Increased concentrations of AMP will

  • give rise to the conformational change on the γ subunit of AMPK
  • as two AMP bind the two Bateman domains located on that subunit.
  • It is this conformational change brought about by increased concentrations
    of  AMP that exposes the active site (Thr-172) on the α subunit.

This critical role of AMP is further substantiated in experiments that demonstrate

  • AMPK activation via an AMP analogue 5-amino-4-imidazolecarboxamide
    ribotide (ZMP) which is derived fromthe familiar
  • 5-amino-4-imidazolecarboxamide riboside (AICAR)

AMPK is a good substrate for activation via an upstream kinase complex, AMPKK
AMPKK is a complex of three proteins,

  1. STE-related adaptor (STRAD),
  2. mouse protein 25 (MO25), and
  3. LKB1 (a serine/threonine kinase).

The second condition that must be met is

  • the phosphorylation/activation of AMPK on its activating loop at
    Thr-172of the α subunit
  • brought about by an upstream kinase (AMPKK).

The complex formed between LKB1 (STK 11), mouse protein 25 (MO25), and the
pseudokinase STE-related adaptor protein (STRAD) has been identified as

  • the major upstream kinase responsible for phosphorylation of AMPK
    on its activating loop at Thr-172

Although AMPK must be phosphorylated by the LKB1/MO25/STRAD complex,

  • it can also be regulated by allosteric modulators which
  • directly increase general AMPK activity and
  • modify AMPK to make it a better substrate for AMPKK
  • and a worse substrate for phosphatases.

It has recently been found that 3-phosphoglycerate (glycolysis intermediate)

  • acts to further pronounce AMPK activation via AMPKK

Muscle contraction is the main method carried out by the body that can provide
the conditions mentioned above needed for AMPK activation

  • As muscles contract, ATP is hydrolyzed, forming ADP.
  • ADP then helps to replenish cellular ATP by donating a phosphate group to
    another ADP,

    • forming an ATP and an AMP.
  • As more AMP is produced during muscle contraction,
    • the AMP:ATP ratio dramatically increases,
  • leading to the allosteric activation of AMPK

For over a decade it has been known that calmodulin-dependent protein kinase
kinase-beta (CaMKKbeta) can phosphorylate and thereby activate AMPK,

  • but it was not the main AMPKK in liver.

CaMKK inhibitors had no effect on 5-aminoimidazole-4-carboxamide-1-beta-4-
ribofuranoside (AICAR) phosphorylation and activation of AMPK.

  • AICAR is taken into the celland converted to ZMP,
  • an AMP analogthat has been shown to activate AMPK.

Recent LKB1 knockout studies have shown that without LKB1,

  • electrical and AICAR stimulation of muscleresults in very little
    phosphorylation of AMPK and of ACC, providing evidence that
  • LKB1-STRAD-MO25 is the major AMPKK in muscle.

Two particular adipokines, adiponectin and leptin, have even been demonstrated
to regulate AMPK. A main functions of leptin in skeletal muscle is

  • the upregulation of fatty acid oxidation.

Leptin works by way of the AMPK signaling pathway, and adiponectin also
stimulates the oxidation of fatty acids via the AMPK pathway, and

  • Adiponectin also stimulates the uptake of glucose in skeletal muscle.

An increase in enzymes which specialize in glucose uptake in cells such as GLUT4
and hexokinase II are thought to be mediated in part by AMPK when it is activated.
Increases in AMPK activity are brought about by increases in the AMP:ATP ratio
during single bouts of exercise and long-term training.

One of the key pathways in AMPK’s regulation of fatty acid oxidation is the

  • phosphorylation and inactivation of acetyl-CoA carboxylase.
  1. Acetyl-CoA carboxylase (ACC) converts acetyl-CoA (ACA) to malonyl-CoA
    (MCA), an inhibitor of carnitine palmitoyltransferase 1 (CPT-1).
  2. CPT-1 transports fatty acids into the mitochondria for oxidation.
  3. Inactivation of ACC results in increased fatty acid transport and oxidation.
  4. the AMPK induced ACC inactivation  and reduced conversion to MCA
    may occur as a result of malonyl-CoA decarboxylase (MCD)
  5. MCD as an antagonist to ACC, decarboxylatesmalonyl-CoA to acetyl-CoA
    (reversal of ACC conversion of ACA to MCA)
  6. This resultsin decreased malonyl-CoA and increased CPT-1 and fatty acid oxidation.

AMPK also plays an important role in lipid metabolism in the liver. It has long been
known that hepatic ACC has been regulated in the liver.

  1. It phosphorylates and inactivates 3-hydroxy-3-methylglutaryl-CoA reductase (HMGCR)
  2. acetyl-CoA(ACA) is converted to mevalonic acid (MVA) by ACC
    with inhibition of CPT-1
  3. HMGR converts 3-hydroxy-3-methylglutaryl-CoA, which is made from MVA
  4. which then travels down several more metabolic steps to become cholesterol.

Insulin facilitates the uptake of glucose into cells via increased expression and
translocation of glucose transporter GLUT-4. In addition, glucose is phosphorylated
by hexokinase wheni iot enters the cell. The phosphorylated form keeps glucose from
leaving the cell,

  • The decreasedthe concentration of glucose molecules creates a gradient for more
    glucose to be transported into the cell.
AMPK and thyroid hormone regulate some similar processes. Knowing these similarities,
Winder and Hardie et al. designed an experiment to see if AMPK was influenced by thyroid
hormone. They found that all of the subunits of AMPK were increased in skeletal muscle,
especially in the soleus and red quadriceps, with thyroid hormone treatment. There was
also an increase in phospho-ACC, a marker of AMPK activity.
  •  Winder WW, Hardie DG (July 1999). “AMP-activated protein kinase,
    a metabolic master switch: possible roles in type 2 diabetes”. J. Physiol. 277
    (1 Pt 1): E1–10. PMID 10409121.
  • Winder WW, Hardie DG (February 1996). “Inactivation of acetyl-CoA
    carboxylase and activation of AMP-activated protein kinase in muscle
    during exercise”. J. Physiol. 270 (2 Pt 1): E299–304. PMID 8779952.
  • Hutber CA, Hardie DG, Winder WW (February 1997). “Electrical stimulation
    inactivates muscle acetyl-CoA carboxylase and increases AMP-activated
    protein kinase”. Am. J. Physiol. 272 (2 Pt 1): E262–6. PMID 9124333
  • Durante PE, Mustard KJ, Park SH, Winder WW, Hardie DG (July 2002).
    “Effects of endurance training on activity and expression of AMP-activated
    protein kinase isoforms in rat muscles”. Am. J. Physiol. Endocrinol.
    Metab. 283 (1): E178–86. doi:10.1152/ajpendo.00404.2001. PMID 12067859
  • Corton JM, Gillespie JG, Hardie DG (April 1994). “Role of the AMP-activated
    protein kinase in the cellular stress response”. Curr. Biol. 4 (4):
    315–24. doi:10.1016/S0960-9822(00)00070-1. PMID 7922340
  • Winder WW (September 2001). “Energy-sensing and signaling by
    AMP-activated protein kinase in skeletal muscle”. J. Appl. Physiol. 91 (3):
    1017–28. PMID 11509493
  • Suter M, Riek U, Tuerk R, Schlattner U, Wallimann T, Neumann D (October
    2006). “Dissecting the role of 5′-AMP for allosteric stimulation, activation,
    and deactivation of AMP-activated protein kinase”.  J. Biol. Chem.
    281 (43): 32207–6. doi:10.1074/jbc.M606357200. PMID 16943194


Part III. Pituitary-thyroid axis and diabetes mellitus
The Interface Between Thyroid and Diabetes Mellitus

Leonidas H. Duntas, Jacques Orgiazzi, Georg Brabant   Clin Endocrinol. 2011;75(1):1-9.
Interaction of Metformin and Thyroid Function

Metformin acts primarily by

  • suppressing hepatic gluconeogenesis via activation of AMPK
  • It has the opposite effects on hypothalamic AMPK,
    • inhibiting activity of the enzyme.
  • the metformin effects on hypothalamic AMPK activity will
    • counteractT3 effects at the hypothalamic level.
  • AMPK therefore represents a direct target for dual regulation
    • in the hypothalamic partitioning of energy homeostasis.
  • metformin crossesthe blood–brain barrier and
    • levels in the pituitary gland are substantially increased.
  • It convincinglysuppresses TSH

A recent study recruiting 66 patients with benign thyroid nodules furthermore
demonstrated that metformin significantly decreases nodule size in patients with
insulin resistance.[76] The effect of metformin, which was produced over a
6-month treatment period, parallelled a fall in TSH concentrations and achieved a
shrinkage amounting to 30% of the initial nodule size when metformin was
administered alone and up to 55% when it was added to ongoing LT4 treatment.

These studies reveal a

  • suppressive effect of metformin on TSH secretion patterns in
    hypothyroid patients, an effect that is apparently
  • independent of T4 treatment and does not alter the TH profile.
  • A rebound of TSH secretion occurs at about 3 months following metformin
    withdrawal.

It appears that recommendations for more frequent testing, on an annual to
biannual basis, seems justified in higher risk groups like patients over 50 or 55,
particularly with suggestive symptoms, raised antibody titres or dylipidaemia.
We thus would support the suggestion of an initial TSH and TPO antibody testing
which, as discussed, will help to predict the development of hypothyroidism in
patients with diabetes.

Hypothalamic AMPK and fatty acid metabolism mediate thyroid
regulation of energy 
balance
M López,  L Varela,  MJ Vázquez,  S Rodríguez-Cuenca, CR González, …, & Vidal-Puig
Nature Medicine  29 Aug 2010; 16: 1001–1008 http://dx.doi.org:/10.1038/nm.2207

Thyroid hormones have widespread cellular effects; however it is unclear whether
their effects on the central nervous system (CNS) contribute to global energy balance.
Here we demonstrate that either

  • whole-body hyperthyroidism or central administration of triiodothyronine
    (T3) decreases

    • the activity of hypothalamic AMP-activated protein kinase (AMPK),
    • increases sympathetic nervous system (SNS) activity and
    • upregulates thermogenic markers in brown adipose tissue (BAT).

Inhibition of the lipogenic pathway in the ventromedial nucleus of the hypothalamus
(VMH) prevents CNS-mediated activation of BAT by thyroid hormone and reverses
the weight loss associated with hyperthyroidism. Similarly, inhibition of thyroid
hormone receptors in the VMH reverses the weight loss associated with hyperthyroidism.

This regulatory mechanism depends on AMPK inactivation, as genetic inhibition of this
enzyme in the VMH of euthyroid rats induces feeding-independent weight loss and
increases expression of thermogenic markers in BAT. These effects are reversed by
pharmacological blockade of the SNS. Thus, thyroid hormone–induced modulation
of AMPK activity and lipid metabolism in the hypothalamus is a major regulator of
whole-body energy homeostasis.

Metabolic Basis for Thyroid Hormone Liver Preconditioning:
Upregulation of AMP-Activated Protein Kinase Signaling
  
LA Videla,1 V Fernández, P Cornejo, and R Vargas
1Molecular and Clinical Pharmacology Program, Institute of Biomedical Sciences,
Faculty of Medicine, University of Chile, 2Faculty of Medicine, Diego Portales University,
Santiago, Chile
Academic Editors: H. M. Abu-Soud and D. Benke
The Scientific World Journal 2012; 2012, ID 475675, 10 pp
http://dx.doi.org/10.1100/2012/475675

The liver is a major organ responsible for most functions of cellular metabolism and

  • a mediator between dietary and endogenous sources of energy for extrahepatic tissues.
  • In this context, adenosine-monophosphate- (AMP-) activated protein kinase (AMPK)
    constitutes an intrahepatic energy sensor
  • regulating physiological energy dynamics by limiting anabolism and stimulating
    catabolism, thus increasing ATP availability.
  • This is achieved by mechanisms involving direct allosteric activation and
    reversible phosphorylation of AMPK, in response to signals such as

    • energy status,
    • serum insulin/glucagon ratio,
    • nutritional stresses,
    • pharmacological and natural compounds, and
    • oxidative stress status.

Reactive oxygen species (ROS) lead to cellular AMPK activation and

  • downstream signaling under several experimental conditions.

Thyroid hormone (L-3,3′,5-triiodothyronine, T3) administration, a condition
that enhances liver ROS generation,

  • triggers the redox upregulation of cytoprotective proteins
    • affording preconditioning against ischemia-reperfusion (IR) liver injury.

Data discussed in this work suggest that T3-induced liver activation of AMPK

  • may be of importance in the promotion of metabolic processes
  • favouring energy supply for the induction and operation of preconditioning
    mechanisms.

These include

  1. antioxidant,
  2. antiapoptotic, and
  3. anti-inflammatory mechanisms,
  4. repair or resynthesis of altered biomolecules,
  5. induction of the homeostatic acute-phase response, and
  6. stimulation of liver cell proliferation,

which are required to cope with the damaging processes set in by IR.

The liver functions as a mediator between dietary and endogenous sources
of energy and extrahepatic organs that continuously require energy, mainly
the brain and erythrocytes, under cycling conditions between fed and fasted states.

In the fed state, where insulin action predominates, digestion-derived glucose is
converted to pyruvate via glycolysis, which is oxidized to produce energy, whereas
fatty acid oxidation is suppressed. Excess glucose can be either stored as hepatic
glycogen or channelled into de novo lipogenesis.

In the fasted state, considerable liver fuel metabolism changes occur due to decreased
serum insulin/glucagon ratio, with higher glucose production as a consequence of
stimulated glycogenolysis and gluconeogenesis (from alanine, lactate, and glycerol).

Major enhancement in fatty acid oxidation also occurs to provide energy for liver
processes and ketogenesis to supply metabolic fuels for extrahepatic tissues. For these
reasons, the liver is considered as the metabolic processing organ of the body, and
alterations in liver functioning affect whole-body metabolism and energy homeostasis.

In this context, adenosine-monophosphate- (AMP-) activated protein kinase (AMPK)
is the downstream component of a protein kinase cascade acting as an

  • intracellular energy sensor regulating physiological energy dynamics by
  • limiting anabolic pathways, to prevent excessive adenosine triphosphate (ATP)
    utilization, and
  • by stimulating catabolic processes, to increase ATP production.

Thus, the understanding of the mechanisms by which liver AMPK coordinates hepatic
energy metabolism represents a crucial point of convergence of regulatory signals
monitoring systemic and cellular energy status

Liver AMPK: Structure and Regulation

AMPK, a serine/threonine kinase, is a heterotrimeric complex comprising

  1. a catalytic subunit α and
  2. two regulatory subunits β and γ .

The α subunit has a threonine residue (Thr172) within the activation loop of the kinase
domain, with the C-terminal region being required for association with β and γ subunits.
The β subunit associates with α and γ by means of its C-terminal region , whereas

  • the γ subunit has four cystathionine β-synthase (CBS) motifs, which
  • bind AMP or ATP in a competitive manner.

75675.fig.001 (not shown)

Figure 1: Regulation of AMP-activated protein kinase (AMPK) by
(A) direct allosteric activation and
(B) reversible phosphorylation and downstream responses maintaining
intracellular energy balance.

Regulation of liver AMPK activity involves both direct allosteric activation and
reversible phosphorylation. AMPK is allosterically activated by AMP through

  • binding to the regulatory subunit-γ, which induces a conformational change in
    the kinase domain of subunit α that protects AMPK from dephosphorylation
    of Thr172, probably by protein phosphatase-2C.

Activation of AMPK requires phosphorylation of Thr172 in its α subunit, which can be
attained by either

(i) tumor suppressor LKB1 kinase following enhancement in the AMP/ATP ratio, a
kinase that plays a crucial role in AMPK-dependent control of liver glucose and
lipid metabolism;

(ii) Ca2+-calmodulin-dependent protein kinase kinase-β (CaMKKβ) that
phosphorylates AMPK in an AMP-independent, Ca2+-dependent manner;

(iii) transforming growth-factor-β-activated kinase-1 (TAK1), an important
kinase in hepatic Toll-like receptor 4 signaling in response to lipopolysaccharide.

Among these kinases, the relevance of CaMKKβ and TAK1 in liver AMPK activation
remains to be established in metabolic stress conditions. Both allosteric and
phosphorylation mechanisms are able to elicit

  • over 1000-fold increase in AMPK activity, thus allowing
  • the liver to respond to small changes in energy status in a highly sensitive fashion.

In addition to rapid AMPK regulation through allosterism and reversible phosphorylation

  • long-term effects of AMPK activation induce changes in hepatic gene expression.

This was demonstrated for

(i) the transcription factor carbohydrate-response element-binding protein (ChREBP),

  • whose Ser568 phosphorylation by activated AMPK
  • blocks its DNA binding capacity and glucose-induced gene transcription
  • under hyperlipidemic conditions;(ii) liver sterol regulatory element-binding
    protein-1c (SREBP-1c), whose mRNA and protein expression and those of
    its target gene for fatty acid synthase (FAS)
  • are reduced by metformin-induced AMPK activation,
  • decreasing lipogenesis and increasing fatty acid oxidation due to
    malonyl-CoA depletion;

(iii) transcriptional coactivator transducer of regulated CREB activity-2 (TORC2),
a crucial component of the hepatic gluconeogenic program, was reported
to be phosphorylated by activated AMPK.

This modification leads to subsequent cytoplasmatic sequestration of TORC2 and
inhibition of gluconeogenic gene expression, a mechanism underlying

  • the plasma glucose-lowering effects of adiponectin and metformin
  • through AMPK activation by upstream LKB1.

Activation of AMPK in the liver is a key regulatory mechanism controlling glucose
and lipid metabolism,

  1. inhibiting anabolic processes, and
  2. enhancing catabolic pathways in response to different signals, including
    1. energy status,
    2. serum insulin/glucagon ratio,
    3. nutritional stresses,
    4. pharmacological and natural compounds, and
    5. oxidative stress status

Reactive Oxygen Species (ROS) and AMPK Activation

The high energy demands required to cope with all the metabolic functions
of the liver are met by

  • fatty acid oxidation under conditions of both normal blood glucose levels and
    hypoglycemia, whereas
  • glucose oxidation is favoured in hyperglycemic states, with consequent
    generation of ROS.

Under normal conditions, ROS occur at relatively low levels due to their fast processing
by antioxidant mechanisms, whereas at acute or prolonged high ROS levels, severe
oxidation of biomolecules and dysregulation of signal transduction and gene expression
is achieved, with consequent cell death through necrotic and/or apoptotic-signaling
pathways.

Thyroid Hormone (L-3,3′,5-Triiodothyronine, T3), Metabolic Regulation,
and ROS Production

T3 is important for the normal function of most mammalian tissues, with major actions
on O2 consumption and metabolic rate, thus

  • determining enhancement in fuel consumption for oxidation processes
  • and ATP repletion.

T3 acts predominantly through nuclear receptors (TR) α and β, forming

  • functional complexes with retinoic X receptor that
  • bind to thyroid hormone response elements (TRE) to activate gene expression.

T3 calorigenesis is primarily due to the

  • induction of enzymes related to mitochondrial electron transport and ATP
    synthesis, catabolism, and
  • some anabolic processes via upregulation of genomic mechanisms.

The net result of T3 action is the enhancement in the rate of O2 consumption of target
tissues such as liver, which may be effected by secondary processes induced by T3

(i) energy expenditure due to higher active cation transport,

(ii) energy loss due to futile cycles coupled to increase in catabolic and anabolic pathways, and

(iii) O2 equivalents used in hepatic ROS generation both in hepatocytes and Kupffer cells

In addition, T3-induced higher rates of mitochondrial oxidative phosphorylation are
likely to induce higher levels of ATP, which are partially balanced by intrinsic uncoupling
afforded by induction of uncoupling proteins by T3. In agreement with this view, the
cytosolic ATP/ADP ratio is decreased in hyperthyroid tissues, due to simultaneous
stimulation of ATP synthesis and consumption.

Regulation of fatty acid oxidation is mainly attained by carnitine palmitoyltransferase Iα (CPT-Iα),

  • catalyzing the transport of fatty acids from cytosol to mitochondria for β-oxidation,
    and acyl-CoA oxidase (ACO),
  • catalyzing the first rate-limiting reaction of peroxisomal β-oxidation, enzymes that are
    induced by both T3 and peroxisome proliferator-activated receptor α (PPAR-α).

Furthermore, PPAR-α-mediated upregulation of CPT-Iα mRNA is enhanced by PPAR-γ
coactivator 1α (PGC-1α), which in turn

  • augments T3 induction of CPT-Iα expression.

Interestingly, PGC-1α is induced by

  1. T3,
  2. AMPK activation, and
  3. ROS,

thus establishing potential links between

  • T3 action, ROS generation, and AMPK activation

with the onset of mitochondrial biogenesis and fatty acid β-oxidation.

Liver ROS generation leads to activation of the transcription factors

  1. nuclear factor-κB (NF-κB),
  2. activating protein 1 (AP-1), and
  3. signal transducer and activator of transcription 3 (STAT3)

at the Kupffer cell level, with upregulation of cytokine expression (TNF-α, IL-1, IL-6),
which upon interaction with specific receptors in hepatocytes trigger the expression of

  1. cytoprotective proteins (Figure 3(A)).

These responses and the promotion of hepatocyte and Kupffer-cell proliferation
represent hormetic effects reestablishing

  1. redox homeostasis,
  2. promoting cell survival, and
  3. protecting the liver against ischemia-reperfusion injury.

T3 liver preconditioning also involves the activation of the

  1. Nrf2-Keap1 defense pathway
  • upregulating antioxidant proteins,
  • phase-2 detoxifying enzymes, and
  • multidrug resistance proteins, members of the ATP binding cassette (ABC)
    superfamily of transporters (Figure 3(B))

In agreement with T3-induced liver preconditioning, T3 or L-thyroxin afford
preconditioning against IR injury in the heart, in association with

  • activation of protein kinase C and
  • attenuation of p38 and
  • c-Jun-N-terminal kinase activation ,

and in the kidney, in association with

  • heme oxygenase-1 upregulation.

475675.fig.002

http://www.hindawi.com/journals/tswj/2012/floats/475675/thumbnails/475675.fig.002_th.jpg

Figure 2: Calorigenic response of thyroid hormone (T3) and its relationship with O2
consumption, reactive oxygen species (ROS) generation, and antioxidant depletion in the liver.
Abbreviations: CYP2E1, cytochrome P450 isoform 2E1; GSH, reduced glutathione; QO2, rate
of O2 consumption; SOD, superoxide dismutase.

475675.fig.003

genomic signaling in T3 calorigenesis and ROS production 475675.fig.003

genomic signaling in T3 calorigenesis and ROS production 475675.fig.003

http://www.hindawi.com/journals/tswj/2012/floats/475675/thumbnails/475675.fig.003_th.jpg

Figure 3: Genomic signaling mechanisms in T3 calorigenesis and liver reactive oxygen
species (ROS) production leading to
(A) upregulation of cytokine expression in Kupffer cells and hepatocyte activation of genes
conferring cytoprotection,
(B) Nrf2 activation controling expression of antioxidant and detoxication proteins, and
(C) activation of the AMPK cascade regulating metabolic functions.Abbreviations: AP-1, activating protein 1; ARE, antioxidant responsive element; CaMKKβ,
Ca2+-calmodulin-dependent kinase kinase-β; CBP, CREB binding protein; CRC, chromatin
remodelling complex; EH, epoxide hydrolase; HO-1, hemoxygenase-1; GC-Ligase,
glutamate cysteine ligase; GPx, glutathione peroxidase; G-S-T, glutathione-S-transferase;
HAT, histone acetyltransferase; HMT, histone arginine methyltransferase; IL1,
interleukin 1; iNOS, inducible nitric oxide synthase; LKB1, tumor suppressor LKB1 kinase;
MnSOD, manganese superoxide dismutase; MRPs, multidrug resistance proteins; NF-κB,
nuclear factor-κB; NQO1, NADPH-quinone oxidoreductase-1; NRF-1, nuclear respiratory
factor-1; Nrf2, nuclear receptor-E2-related factor 2; PCAF, p300/CBP-associated
factor; RXR, retinoic acid receptor; PGC-1, peroxisome proliferator-activated receptor-γ
coactivator-1; QO2, rate of O2 consumption; STAT3, signal transducer and activator
of transcription 3; TAK1, transforming-growth-factor-β-activated kinase-1; TNF-α, tumor
necrosis factor-α; TR, T 3 receptor; TRAP, T3-receptor-associated protein; TRE,  T3 responsive element; UCP, uncoupling proteins; (—), reported mechanisms;
(- - - -), proposed mechanisms.


T3 is a key metabolic regulator coordinating short-term and long-term energy needs,
with major actions on liver metabolism. These include promotion of

(i) gluconeogenesis and hepatic glucose production, and

(ii) fatty acid oxidation coupled to enhanced adipose tissue lipolysis, with

  • higher fatty acid flux to the liver and
  • consequent ROS production (Figure 2) and
  • redox upregulation of cytoprotective proteins

affording liver preconditioning (Figure 3).

Thyroid Hormone and AMPK Activation: Skeletal Muscle and Heart

In skeletal muscle, T3 increases the levels of numerous proteins involved in

  1. glucose uptake (GLUT4),
  2. glycolysis (enolase, pyruvate kinase, triose phosphate isomerase),
  3. fatty acid oxidation (carnitine palmitoyl transferase-1, mitochondrial thioesterase I),
    and uncoupling protein-3,

effects that are achieved through enhanced transcription of TRE-containing genes

Skeletal muscle AMPK activation is characterized by

(i) being a rapid and transient response,

(ii) upstream activation by Ca2+-induced mobilization and CaMKKβ activation,

(iii) upstream upregulation of LKB1 expression, which requires association with STRAD
and MO25 for optimal phosphorylation/activation of AMPK, and

(iv) stimulation of mitochondrial fatty acid β-oxidation.

T3-induced muscle AMPK activation was found to trigger two major downstream

signaling pathways, namely,

(i) peroxisome proliferator-activated receptor-γ coactivator-1α (PGC-1α) mRNA
expression and phosphorylation, a transcriptional regulator for genes related to

  • mitochondrial biogenesis,
  • fatty acid oxidation, and
  • gluconeogenesis and

(ii) cyclic AMP response element binding protein (CREB) phosphorylation, which

  • in turn induces PGC-1α expression in liver tissue, thus
  • reinforcing mechanism (i).

These data indicate that AMPK phosphorylation of PGC-1α initiates many of the
important gene regulatory functions of AMPK in skeletal muscle.

In heart, hyperthyroidism increased glycolysis and sarcolemmal GLUT4 levels by the
combined effects of AMPK activation and insulin stimulation, with concomitant increase
in fatty acid oxidation proportional to enhanced cardiac mass and contractile function.

Thyroid Hormone, AMPK Activation, and Liver Preconditioning

Recent studies by our group revealed that administration of a single dose of 0.1 mg T3/kg
to rats activates liver AMPK (Figure 4; unpublished work).

  1. enhancement in phosphorylated AMPK/nonphosphorylated AMPK ratios in T3-
    treated rats over control values thatis significant in the time period of 1 to 48
    hours after hormone treatment
  2. Administration of a substantially higher dose (0.4 mg T3/kg) resulted in
    decreased liver AMPK activation at 4 h to return to control values at 6 h
    after treatment

Activation of liver AMPK by T3 may be of relevance in terms of

  • promotion of fatty acid oxidation for ATP supply,
  • supporting hepatoprotection against IR injury (Figure 3(C)).

This proposal is based on the high energy demands underlying effective liver
preconditioning for full operation of hepatic

  • antioxidant, antiapoptotic, and anti-inflammatory mechanisms,
  • oxidized biomolecules repair or resynthesis,
  • induction of the homeostatic acute-phase response, and
  • promotion of hepatocyte and Kupffer cell proliferation,

mechanisms that are needed to cope with the damaging processes set in by IR.
T3 liver preconditioning , in addition to that afforded by

  • n-3 long-chain polyunsaturated fatty acids given alone or
  • combined with T3 at lower dosages, or
  • by iron supplementation,

constitutes protective strategies against hepatic IR injury.

Studies on the molecular mechanisms underlying T3-induced liver AMPK
activation (Figure 4) are currently under assessment in our laboratory.

References

Fernández and L. A. Videla, “Kupffer cell-dependent signaling in thyroid hormone
calorigenesis: possible applications for liver preconditioning,” Current Signal
Transduction Therapy 2009; 4(2): 144–151.

Viollet, B. Guigas, J. Leclerc et al., “AMP-activated protein kinase in the regulation
of  hepatic energy metabolism: from physiology to therapeutic perspectives,” Acta
Physiologica 2009; 196(1): 81–98.

Carling, “The AMP-activated protein kinase cascade – A unifying system
for energy control,” Trends in Biochemical Sciences, 2004;. 29(1): 18–24.

E. Kemp, D. Stapleton, D. J. Campbell et al., “AMP-activated protein kinase,
super 
metabolic regulator,” Biochemical Society Transactions 2003; 31(1):
162–168
.

G. Hardie, “AMP-activated protein kinase-an energy sensor that
regulates all ;aspects of cell function,” Genes and Development,
2011; 25(18): 1895–1908.

Woods, P. C. F. Cheung, F. C. Smith et al., “Characterization of AMP-activated
protein kinase βandγ subunits Assembly of the heterotrimeric complex in vitro,”
Journal of Biological Chemistry 1996;271(17): 10282–10290.

Xiao, R. Heath, P. Saiu et al., “Structural basis for AMP binding to mammalian AMP-
activated protein kinase,” Nature 2007; 449(7161): 496–500.

more…

Impact of Metformin and compound C on NIS expression and iodine uptake in vitro and in vivo: a role for CRE in AMPK modulation of thyroid function.
Abdulrahman RM1, Boon MR, Sips HC, Guigas B, Rensen PC, Smit JW, Hovens GC.
Author information 
Thyroid. 2014 Jan;24(1):78-87.  Epub 2013 Sep 25.  PMID: 23819433
http://dx.doi.org:/10.1089/thy.2013.0041.

Although adenosine monophosphate activated protein kinase (AMPK) plays a crucial role
in energy metabolism, a direct effect of AMPK modulation on thyroid function has only
recently been reported, and much of its function in the thyroid is currently unknown.

The aim of this study was

  1. to investigate the mechanism of AMPK modulation in iodide uptake.
  2. to investigate the potential of the AMPK inhibitor compound C as an enhancer of
    iodide uptake by thyrocytes.

Metformin reduced NIS promoter activity (0.6-fold of control), whereas compound C
stimulated its activity (3.4-fold) after 4 days. This largely coincides with

  • CRE activation (0.6- and 3.0-fold).

These experiments show that AMPK exerts its effects on iodide uptake, at least partly,
through the CRE element in the NIS promoter. Furthermore, we have used AMPK-alpha1
knockout mice to determine the long-term effects of AMPK inhibition without chemical compounds.
These mice have a less active thyroid, as shown by reduced colloid volume and reduced
responsiveness to thyrotropin.

NIS expression and iodine uptake in thyrocytes

  • can be modulated by metformin and compound C.

These compounds exert their effect by

  • modulation of AMPK, which, in turn, regulates
  • the activation of the CRE element in the NIS promoter.

Overall, this suggests that AMPK modulating compounds may be useful for the
enhancement of iodide uptake by thyrocytes, which could be useful for the
treatment of thyroid cancer patients with radioactive iodine.

AMPK: Master Metabolic Regulator

© 1996–2013 themedicalbiochemistrypage.org, LLC | info
@ themedicalbiochemistrypage.org

AMPK-activating drugs metformin or phenformin might provide protection against cancer 1741-7007-11-36-5

AMPK-activating drugs metformin or phenformin might provide protection against cancer 1741-7007-11-36-5


AMPK and AMPK-related kinase (ARK) family 1741-7007-11-36-4

AMPK and AMPK-related kinase (ARK) family 1741-7007-11-36-4


central role of AMPK in the regulation of metabolism


AMP-activated protein kinase (AMPK) was first discovered as an activity that

AMPK induces a cascade of events within cells in response to the ever changing energy
charge of the cell. The role of AMPK in regulating cellular energy charge places this
enzyme at a central control point in maintaining energy homeostasis.

More recent evidence has shown that AMPK activity can also be regulated by physiological stimuli, independent of the energy charge of the cell, including hormones and nutrients.


Once activated, AMPK-mediated phosphorylation events

These events are rapidly initiated and are referred to as

  • short-term regulatory processes.

The activation of AMPK also exerts

  • long-term effects at the level of both gene expression and protein synthesis.

Other important activities attributable to AMPK are

  1. regulation of insulin synthesis and
  2. secretion in pancreatic islet β-cells and
  3. modulation of hypothalamic functions involved in the regulation of satiety.

How these latter two functions impact obesity and diabetes will be discussed below.

Regulation of AMPK

In the presence of AMP the activity of AMPK is increased approximately 5-fold.
However, more importantly is the role of AMP in regulating the level of phosphorylation
of AMPK. An increased AMP to ATP ratio leads to a conformational change in the γ-subunit
leading to increased phosphorylation and decreased dephosphorylation of AMPK.

The phosphorylation of AMPK results in activation by at least 100-fold. AMPK is
phosphorylated by at least three different upstream AMPK kinases (AMPKKs).
Phosphorylation of AMPK occurs in the α subunit at threonine 172 (T172) which

  • lies in the activation loop.

One kinase activator of AMPK is

  • Ca2+-calmodulin-dependent kinase kinase β (CaMKKβ)
  • which phosphorylates and activates AMPK in response to increased calcium.

The distribution of CaMKKβ expression is primarily in the brain with detectable levels
also found in the testes, thymus, and T cells. As described for the Ca2+-mediated
regulation of glycogen metabolism,

  • increased release of intracellular stores of Ca2+ create a subsequent demand for
    ATP.

Activation of AMPK in response to Ca fluxes

  • provides a mechanism for cells to anticipate the increased demand for ATP.

Evidence has also demonstrated that the serine-threonine kinase, LKB1 (also called
serine-threonine kinase 11, STK11) which is encoded by the Peutz-Jeghers syndrome
tumor suppressor gene, is required for activation of AMPK in response to stress.

The active LKB1 kinase is actually a complex of three proteins:

  1. LKB1,
  2. Ste20-related adaptor (STRAD) and
  3. mouse protein 25 (MO25).

Thus, the enzyme complex is often referred to as LKB1-STRAD-MO25. Phosphorylation
of AMPK by LKB1 also occurs on T172. Unlike the limited distribution of CaMKKβ,

  • LKB1 is widely expressed, thus making it the primary AMPK-regulating kinase.

Loss of LKB1 activity in adult mouse liver leads to

  • near complete loss of AMPK activity and
  • is associated with hyperglycemia.

The hyperglycemia is, in part, due to an increase in the transcription of gluconeogenic
genes. Of particular significance is the increased expression of

  • the peroxisome proliferator-activated receptor-γ (PPAR-γ) coactivator 1α
    (PGC-1α), which drives gluconeogenesis.
  • Reduction in PGC-1α activity results in normalized blood glucose levels in
    LKB1-deficient mice.

The third AMPK phosphorylating kinase is transforming growth factor-β-activated
kinase 1 (TAK1). However, the normal physiological conditions under which TAK1
phosphorylates AMPK are currently unclear.

The effects of AMP are two-fold:

  1. a direct allosteric activation and making AMPK a poorer substrate for
    dephosphorylation.

Because AMP affects both
the rate of AMPK phoshorylation in the positive direction and
dephosphorylation in the negative direction,

the cascade is ultrasensitive. This means that

  1. a very small rise in AMP levels can induce a dramatic increase in the activity of
    AMPK.

The activity of adenylate kinase, catalyzing the reaction shown below, ensures that

  • AMPK is highly sensitive to small changes in the intracellular [ATP]/[ADP] ratio.

2 ADP ——> ATP + AMP

Negative allosteric regulation of AMPK also occurs and this effect is exerted by
phosphocreatine. As indicated above, the β subunits of AMPK have a glycogen-binding domain, GBD. In muscle, a high glycogen content

  • represses AMPK activity and
  • this is likely the result of interaction between the GBD and glycogen,
  • the GBD of AMPK allows association of the enzyme with the regulation of glycogen metabolism
  • by placing AMPK in close proximity to one of its substrates glycogen synthase.

AMPK has also been shown to be activated by receptors that are coupled to

  • phospholipase C-β (PLC-β) and by
  • hormones secreted by adipose tissue (termed adipokines) such as leptinand adiponectin (discussed below).

Targets of AMPK

The signaling cascades initiated by the activation of AMPK exert effects on

  • glucose and lipid metabolism,
  • gene expression and
  • protein synthesis.

These effects are most important for regulating metabolic events in the liver, skeletal
muscle, heart, adipose tissue, and pancreas.

Demonstration of the central role of AMPK in the regulation of metabolism in response
to events such as nutrient- or exercise-induced stress. Several of the known physiologic
targets for AMPK are included as well as several pathways whose flux is affected by
AMPK activation. Arrows indicate positive effects of AMPK, whereas, T-lines indicate
the resultant inhibitory effects of AMPK action.

The uptake, by skeletal muscle, accounts for >70% of the glucose removal from the
serum in humans. Therefore, it should be obvious that this event is extremely important
for overall glucose homeostasis, keeping in mind, of course, that glucose uptake by
cardiac muscle and adipocytes cannot be excluded from consideration. An important fact
related to skeletal muscle glucose uptake is that this process is markedly impaired in
individuals with type 2 diabetes.

The uptake of glucose increases dramatically in response to stress (such as ischemia) and
exercise and is stimulated by insulin-induced recruitment of glucose transporters
to the plasma membrane, primarily GLUT4. Insulin-independent recruitment of glucose
transporters also occurs in skeletal muscle in response to contraction (exercise).

The activation of AMPK plays an important, albeit not an exclusive, role in the induction of
GLUT4 recruitment to the plasma membrane. The ability of AMPK to stimulate
GLUT4 translocation to the plasma membrane in skeletal muscle is by a different mechanism
than that stimulated by insulin and insulin and AMPK effects are additive.

Under ischemic/hypoxic conditions in the heart the activation of AMPK leads to the
phosphorylation and activation of the kinase activity of phosphofructokinase-2, PFK-2
(6-phosphofructo-2-kinase). The product of the action of PFK-2 (fructose-2,6-bisphosphate,
F2,6BP) is one of the most potent regulators of the rate of flux through
glycolysis and gluconeogenesis.

In liver the PKA-mediated phosphorylation of PFK-2 results in conversion of the
enzyme from a kinase that generates F2,6BP to a phosphatase that removes the
2-phosphate thus reducing the levels of the potent allosteric activator of the glycolytic
enzyme 6-phosphfructo-1-kinase, PFK-1 and the potent allosteric inhibitor
of the gluconeogenic enzyme fructose-1,6-bisphosphatase (F1,-6BPase).

It is important to note that like many enzymes, there are multiple isoforms of PFK-2
(at least 4) and neither the liver or the skeletal muscle isoforms contain the AMPK
phosphorylation sites found in the cardiac and inducible (iPFK2) isoforms of PFK-2.

Inducible PFK-2 is expressed in the monocyte/macrophage lineage in response to pro-
inflammatory stimuli. The ability to activate the kinase activity by phosphorylation of
PFK-2 in cardiac tissue and macrophages in response to ischemic conditions allows these
cells to continue to have a source of ATP via anaerobic glycolysis. This phenomenon is
recognized as the Pasteur effect: an increased rate of glycolysis in response to hypoxia.

Of pathological significance is the fact that the inducible form of PFK-2 is commonly
expressed in many tumor cells and this may allow AMPK to play an important role in
protecting tumor cells from hypoxic stress. Indeed, techniques for depleting AMPK in
tumor cells have shown that these cells become sensitized to nutritional stress upon loss
of AMPK activity.

Whereas, stress and exercise are powerful inducers of AMPK activity in skeletal muscle,
additional regulators of its activity have been identified.

Insulin-sensitizing drugs of the thiazolidinedione family (activators of PPAR-γ, see
below) as well as the hypoglycemia drug metformin exert a portion of their effects
through regulation of the activity of AMPK.

As indicated above, the activity of the AMPK activating kinase, LKB1, is critical for
regulating gluconeogenic flux and consequent glucose homeostasis. The action of
metformin in reducing blood glucose levels

  • requires the activity of LKB1 in the liver for this function.

Also, several adipokines (hormones secreted by adipocytes) either stimulate or inhibit
AMPK activation:

  1. leptin and adiponectin have been shown to stimulate AMPK activation, whereas,
  2. resistininhibits AMPK activation.

Cardiac effects exerted by activation of AMPK also include

AMPK-mediated phosphorylation of eNOS leads to increased activity and consequent
NO production and provides a link between metabolic stresses and cardiac function.

In platelets, insulin action leads to an increase in eNOS activity that is

  • due to its phosphorylation by AMPK.

Activation of NO production in platelets leads to

  • a decrease in thrombin-induced aggregation, thereby,
  • limiting the pro-coagulant effects of platelet activation.

The response of platelets to insulin function clearly indicates why disruption in insulin
action is a major contributing factor in the development of the metabolic syndrome

Activation of AMPK leads to a reduction in the level of SREBP

  • a transcription factor &regulator of the expression of numerous
    lipogenic enzymes

Another transcription factor reduced in response to AMPK activation is

  • hepatocyte nuclear factor 4α, HNF4α
    • a member of the steroid/thyroid hormone superfamily.
    • HNF4α is known to regulate the expression of several liver and
      pancreatic β-cell genes such as GLUT2, L-PK and preproinsulin.
  • Of clinical significance is that mutations in HNF4α are responsible for
    • maturity-onset diabetes of the young, MODY-1.

Recent evidence indicates that the gene for the carbohydrate-response-element-
binding protein (ChREBP) is a target for AMPK-mediated transcriptional regulation
in the liver. ChREBP is rapidly being recognized as a master regulator of lipid
metabolism in liver, in particular in response to glucose uptake.

The target of the thiazolidinedione (TZD) class of drugs used to treat type 2 diabetes is
the peroxisome proliferator-activated receptor γ, PPARγ which

  • itself may be a target for the action of AMPK.

The transcription co-activator, p300, is phosphorylated by AMPK

  • which inhibits interaction of p300 with not only PPARγ but also
  • the retinoic acid receptor, retinoid X receptor, and
  • thyroid hormone receptor.

PPARγ is primarily expressed in adipose tissue and thus it was difficult to reconcile how
a drug that was apparently acting only in adipose tissue could lead to improved insulin
sensitivity of other tissues. The answer to this question came when it was discovered that the TZDs stimulated the expression and release of the adipocyte hormone (adipokine),
adiponectin. Adiponectin stimulates glucose uptake and fatty acid oxidation in skeletal
muscle. In addition, adiponectin stimulates fatty acid oxidation in liver while inhibiting
expression of gluconeogenic enzymes in this tissue.

These responses to adiponectin are exerted via activation of AMPK. Another
transcription factor target of AMPK is the forkhead protein, FKHR (now referred to as
FoxO1). FoxO1 is involved in the activation of glucose-6-phosphatase expression and,
therefore, loss of FoxO1 activity in response to AMPK activation will lead to reduced
hepatic output of glucose.

This concludes a very complicated perspective that ties together the thyroid hormone
activity, the hypophysis, diabetes mellitus, and AMPK tegulation of metabolism in the
liver, skeletal muscle, adipose tissue, and heart.  I also note at this time that there
nongenetic points to be made here:

  1. The tissue specificity of isoenzymes
  2. The modulatory role of AMP:ATP ratio in phosphorylation/dephosphorylation
    effects on metabolism tied to AMPK
  3. The tie in of stress or ROS with fast reactions to protect harm to tissues
  4. The relationship of cytokine activation and release to the above metabolic events
  5. The relationship of effective and commonly used diabetes medications to AMPK
    mediated processes
  6. The preceding presentation is notable for the importance of proteomic and
    metabolomic invetigations in elucidation common chronic and nongenetic diseases


Read Full Post »

Leaders in Pharmaceutical Business Intelligence Announced New Cardiovascular Series of e-Books at SACHS Associates 14th Annual Biotech In Europe Forum

Reporter: Aviva Lev-Ari, PhD, RN


Please see Further Titles at

http://pharmaceuticalintelligence.com/biomed-e-books/

Please see Further Information on the Sachs Associates 14th Annual Biotech in Europe Forum for Global Investing & Partnering at:

http://pharmaceuticalintelligence.com/2014/03/25/14th-annual-biotech-in-europe-forum-for-global-partnering-investment-930-1012014-%E2%80%A2-congress-center-basel-sachs-associates-london/

AND

http://www.sachsforum.com/basel14/index.html

why-is-twitter-s-logo-named-after-larry-bird--b8d70319daON TWITTER Follow at

@SachsAssociates

#Sachs14thBEF

@pharma_BI

@AVIVA1950 

Read Full Post »

Extracellular evaluation of intracellular flux in yeast cells

Larry H. Bernstein, MD, FCAP, Reviewer and Curator

Leaders in Pharmaceutical Intelligence

This is the fourth article in a series on metabolomics, which is a major development in -omics, integrating transcriptomics, proteomics,  genomics, metabolic pathways analysis, metabolic and genomic regulatory control using computational mapping.  In the previous two part presentation, flux analysis was not a topic for evaluation, but here it is the major focus.  It is a study of yeast cells, and bears some relationship to the comparison of glycemia, oxidative phosphorylation, TCA cycle, and ETC in leukemia cell lines.  In the previous study – system flux was beyond the scope of analysis, and explicitly stated.  The inferences made in comparing the two lymphocytic leukemia cells was of intracellular metabolism from extracellular measurements.  The study of yeast cells is aimed at looking at cellular effluxes, which is also an important method for studying pharmacological effects and drug resistance.

Metabolomic series

1.  Metabolomics, Metabonomics and Functional Nutrition: the next step in nutritional metabolism and biotherapeutics

http://pharmaceuticalintelligence.com/2014/08/22/metabolomics-metabonomics-and-functional-nutrition-the-next-step-in-nutritional-metabolism-and-biotherapeutics/

2.  Metabolomic analysis of two leukemia cell lines. I

http://pharmaceuticalintelligence.com/2014/08/23/metabolomic-analysis-of-two-leukemia-cell-lines-_i/

3.  Metabolomic analysis of two leukemia cell lines. II.

 http://pharmaceuticalintelligence.com/2014/08/24/metabolomic-analysis-of-two-leukemia-cell-lines-ii/

4.  Extracellular evaluation of intracellular flux in yeast cells

Q1. What is efflux?

Q2. What measurements were excluded from the previous study that would not allow inference about fluxes?

Q3. Would this study bear any relationship to the Pasteur effect?

Q4 What is a genome scale network reconstruction?

Q5 What type of information is required for a network prediction model?

Q6. Is there a difference between the metabolites profiles for yeast grown under aerobic and anaerobuc conditions – under the constrainsts?

Q7.  If there is a difference in the S metabolism, would there be an effect on ATP production?


Connecting extracellular metabolomic measurements to intracellular flux
states in yeast

Monica L Mo1, Bernhard Ø Palsson1 and Markus J Herrgård12*

Author Affiliations

1 Department of Bioengineering, University of California, San Diego, La Jolla, CA 92093, USA

2 Current address: Synthetic Genomics, Inc, 11149 N Torrey Pines Rd, La Jolla, CA 92037, USA

For all author emails, please log on.

BMC Systems Biology 2009, 3:37  doi:10.1186/1752-0509-3-37


The electronic version of this article is the complete one and can be found online at: http://www.biomedcentral.com/1752-0509/3/37


Received: 15 December 2008
Accepted: 25 March 2009
Published: 25 March 2009

© 2009 Mo et al; licensee BioMed Central Ltd.

This is an Open Access article distributed under the terms of the Creative Commons Attribution License (http://creativecommons.org/licenses/by/2.0), which permits unrestricted use, distribution, and reproduction in any medium, provided the original work is properly cited.

Abstract

Background

Metabolomics has emerged as a powerful tool in the

  • quantitative identification of physiological and disease-induced biological states.

Extracellular metabolome or metabolic profiling data, in particular,

  • can provide an insightful view of intracellular physiological states in a noninvasive manner.

Results

We used an updated genome-scale

  • metabolic network model of Saccharomyces cerevisiae, iMM904, to investigate
  1. how changes in the extracellular metabolome can be used
  2. to study systemic changes in intracellular metabolic states.

The iMM904 metabolic network was reconstructed based on

  • an existing genome-scale network, iND750,
  • and includes 904 genes and 1,412 reactions.

The network model was first validated by

  • comparing 2,888 in silico single-gene deletion strain growth phenotype predictions
  • to published experimental data.

Extracellular metabolome data measured

  • of ammonium assimilation pathways 
  • in response to environmental and genetic perturbations

was then integrated with the iMM904 network

  • in the form of relative overflow secretion constraints and
  • a flux sampling approach was used to characterize candidate flux distributions allowed by these constraints.

Predicted intracellular flux changes were

  • consistent with published measurements
  • on intracellular metabolite levels and fluxes.

Patterns of predicted intracellular flux changes

  • could also be used to correctly identify the regions of
  • the metabolic network that were perturbed.

Conclusion

Our results indicate that

  • integrating quantitative extracellular metabolomic profiles
  • in a constraint-based framework
  • enables inferring changes in intracellular metabolic flux states.

Similar methods could potentially be applied

  • towards analyzing biofluid metabolome variations
  • related to human physiological and disease states.

Background

“Omics” technologies are rapidly generating high amounts of data

  • at varying levels of biological detail.

In addition, there is a rapidly growing literature and

  • accompanying databases that compile this information.

This has provided the basis for the assembly of

  • genome-scale metabolic networks for various microbial and eukaryotic organisms [1–11].

These network reconstructions serve

  • as manually curated knowledge bases of
  • biological information as well as
  • mathematical representations of biochemical components and
  • interactions specific to each organism.

A genome-scale network reconstruction is

  • a structured collection of genes, proteins, biochemical reactions, and metabolites
  • determined to exist and operate within a particular organism.

This network can be converted into a predictive model

  • that enables in silico simulations of allowable network states based on
  • governing physico-chemical and genetic constraints [12,13].

A wide range of constraint-based methods have been developed and applied

  • to analyze network metabolic capabilities under
  • different environmental and genetic conditions [13].

These methods have been extensively used to

  • study genome-scale metabolic networks and have successfully predicted, for example,
  1. optimal metabolic states,
  2. gene deletion lethality, and
  3. adaptive evolutionary endpoints [14–16].

Most of these applications utilize

  • optimization-based methods such as flux balance analysis (FBA)
  • to explore the metabolic flux space.

However, the behavior of genome-scale metabolic networks can also be studied

  • using unbiased approaches such as
  • uniform random sampling of steady-state flux distributions [17].

Instead of identifying a single optimal flux distribution based on

  • a given optimization criterion (e.g. biomass production),

these methods allow statistical analysis of

  • a large range of possible alternative flux solutions determined by
  • constraints imposed on the network.

Sampling methods have been previously used to study

  1. global organization of E. coli metabolism [18] as well as
  2. to identify candidate disease states in the cardiomyocyte mitochondria [19].

Network reconstructions provide a structured framework

  • to systematically integrate and analyze disparate datasets
  • including transcriptomic, proteomic, metabolomic, and fluxomic data.

Metabolomic data is one of the more relevant data types for this type of analysis as

  1. network reconstructions define the biochemical links between metabolites, and
  2. recent advancements in analytical technologies have allowed increasingly comprehensive
  • intracellular and extracellular metabolite level measurements [20,21].

The metabolome is

  1. the set of metabolites present under a given physiological condition
  2. at a particular time and is the culminating phenotype resulting from
  • various “upstream” control mechanisms of metabolic processes.

Of particular interest to this present study are

  • the quantitative profiles of metabolites that are secreted into the extracellular environment
  • by cells under different conditions.

Recent advances in profiling the extracellular metabolome (EM) have allowed

  • obtaining insightful biological information on cellular metabolism
  • without disrupting the cell itself.

This information can be obtained through various

  • analytical detection,
  • identification, and
  • quantization techniques

for a variety of systems ranging from

  • unicellular model organisms to human biofluids [20–23].

Metabolite secretion by a cell reflects its internal metabolic state, and

  • its composition varies in response to
  • genetic or experimental perturbations
  • due to changes in intracellular pathway activities
  • involved in the production and utilization of extracellular metabolites [21].

Variations in metabolic fluxes can be reflected in EM changes which can

  • provide insight into the intracellular pathway activities related to metabolite secretion.

The extracellular metabolomic approach has already shown promise

  • in a variety of applications, including
  1. capturing detailed metabolite biomarker variations related to disease and
  2. drug-induced states and
  3. characterizing gene functions in yeast [24–27].

However, interpreting changes in the extracellular metabolome can be challenging

  • due to the indirect relationship between the proximal cause of the change
    (e.g. a mutation)
  • and metabolite secretion.

Since metabolic networks describe

  • mechanistic,
  • biochemical links between metabolites,

integrating such data can allow a systematic approach

  • to identifying altered pathways linked to
  • quantitative changes in secretion profiles.

Measured secretion rates of major byproduct metabolites

  • can be applied as additional exchange flux constraints
  • that define observed metabolic behavior.

For example, a recent study integrating small-scale EM data

  • with a genome-scale yeast model
  • correctly predicted oxygen consumption and ethanol production capacities
  • in mutant strains with respiratory deficiencies [28].

The respiratory deficient mutant study

  • used high accuracy measurements for a small number of
  • major byproduct secretion rates
  • together with an optimization-based method well suited for such data.

Here, we expand the application range of the model-based method used in [28]

  • to extracellular metabolome profiles,
  • which represent a temporal snapshot of the relative abundance
  • for a larger number of secreted metabolites.

Our approach is complementary to

  • statistical (i.e. “top-down”) approaches to metabolome analysis [29]
  • and can potentially be used in applications such as biofluid-based diagnostics or
  • large-scale characterization of mutants strains using metabolite profiles.

This study implements a constraint-based sampling approach on

  • an updated genome-scale network of yeast metabolism
  • to systematically determine how EM level variations

are linked to global changes in intracellular metabolic flux states.

By using a sampling-based network approach and statistical methods (Figure 1),

  • EM changes were linked to systemic intracellular flux perturbations
    in an unbiased manner
  • without relying on defining single optimal flux distributions
  • used in the previously mentioned study [28].

The inferred perturbations in intracellular reaction fluxes were further analyzed

  • using reporter metabolite and subsystem (i.e., metabolic pathway) approaches [30]
  • in order to identify dominant metabolic features that are collectively perturbed (Figure 2).

The sampling-based approach also has the additional benefit of

  • being less sensitive to inaccuracies in metabolite secretion profiles than
  • optimization-based methods and can effectively be used – in biofluid metabolome analysis.
integration of exometabolomic (EM) data

integration of exometabolomic (EM) data

Figure 1. Schematic illustrating the integration of exometabolomic (EM) data with the constraint-based framework.

(A) Cells are subjected to genetic and/or environmental perturbations to secrete metabolite patterns unique to that condition.
(B) EM is detected, identified, and quantified.
(C) EM data is integrated as required secretion flux constraints to define allowable solution space.
(D) Random sampling of solution space yields the range of feasible flux distributions for intracellular reactions.
(E) Sampled fluxes were compared to sampled fluxes of another condition to determine

  • which metabolic regions were altered between the two conditions (see Figure 2).

(F) Significantly altered metabolic regions were identified.

http://www.biomedcentral.com/content/figures/1752-0509-3-37-1.jpg


sampling and scoring analysis to determine intracellular flux changes

sampling and scoring analysis to determine intracellular flux changes

Figure 2. Schematic of sampling and scoring analysis to determine intracellular flux changes.

(A) Reaction fluxes are sampled for two conditions.
(B & C) Sample of flux differences is calculated by selecting random flux values from each condition

  • to obtain a distribution of flux differences for each reaction.

(D) Standardized reaction Z-scores are determined, which represent

  • how far the sampled flux differences deviates from a zero flux change.

Reaction scores can be used in

  1. visualizing perturbation subnetworks and
  2. analyzing reporter metabolites and subsystems.

http://www.biomedcentral.com/content/figures/1752-0509-3-37-2.jpg

This study was divided into two parts and describes:

(i) the reconstruction and validation of an expanded S. cerevisiae metabolic network, iMM904; and
(ii) the systematic inference of intracellular metabolic states from

  • two yeast EM data sets using a constraint-based sampling approach.

The first EM data set compares wild type yeast to the gdh1/GDH2 (glutamate dehydrogenase) strain [31],

  • which indicated good agreement between predicted metabolic changes
  • of intracellular metabolite levels and fluxes [31,32].

The second EM data set focused on secreted amino acid measurements

  • from a separate study of yeast cultured in different
    ammonium and potassium concentrations [33].

We analyzed the EM data to gain further insight into

  • perturbed ammonium assimilation processes as well as
  1. metabolic states relating potassium limitation and
  2. ammonium excess conditions to one another.

The model-based analysis of both

  • separately published extracellular metabolome datasets
  • suggests a relationship between
  1. glutamate,
  2. threonine and
  3. folate metabolism,
  • which are collectively perturbed when
    ammonium assimilation processes are broadly disrupted
  1. either by environmental (excess ammonia) or
  2. genetic (gene deletion/overexpression) perturbations.

The methods herein present an approach to

  • interpreting extracellular metabolome data and
  • associating these measured secreted metabolite variations
  • to changes in intracellular metabolic network states.

Additional file 1. iMM904 network content.

The data provided represent the content description of the iMM904 metabolic network and
detailed information on the expanded content.

Format: XLS Size: 2.7MB Download file

This file can be viewed with: Microsoft Excel Viewer

Additional file 2. iMM904 model files.

The data provided are the model text files of the iMM904 metabolic network
that is compatible with the available COBRA Toolbox [13]. The model structure
can be loaded into Matlab using the ‘SimPhenyPlus’ format with GPR and compound information.

Format: ZIP Size: 163KB Download file

Conversion of the network to a predictive model

The network reconstruction was converted to a constraint-based model using established procedures [13].

Network reactions and metabolites were assembled into a stoichiometric matrix S 

  • containing the stoichiometric coefficients of the reactions in the network.

The steady-state solution space containing possible flux distributions

  • is determined by calculating the null space of S: S . v = 0,

where v is the reaction flux vector.

Minimal media conditions were set through constraints on exchange fluxes

  • corresponding to the experimental measured substrate uptake rates.

All the model-based calculations were done using the Matlab COBRA Toolbox [13]

  • utilizing the glpk or Tomlab/CPLEX (Tomopt, Inc.) optimization solvers.

Chemostat growth simulations

The iMM904 model was initially validated by

  1. simulating wild type yeast growth in aerobic and anaerobic
    carbon-limited chemostat conditions
  2. and comparing the simulation results to published experimental data

on substrate uptake and byproduct secretion in these conditions [34].

The study was performed following the approach taken to validate the iFF708 model in a previous study [35].

The predicted glucose uptake rates were determined

  1. by setting the in silico growth rate to the measured dilution rate,
    – equivalent under continuous culture growth,
  2. and minimizing the glucose uptake rate.

The accuracy of in silico predictions of

  • substrate uptake and byproduct secretion by the iMM904 model
  • was similar to the accuracy obtained using the iFF708 model
  • and results are shown in Figure S1 [see Additional file 3].

Additional file 3. Supplemental figures. 

The file provides the supplemental figures and descriptions of S1, S2, S3, and S4.

Format: PDF Size: 513KB Download file

This file can be viewed with: Adobe Acrobat Reader

Genome-scale gene deletion phenotype predictions

The iMM904 network was further validated by

  • performing genome-scale gene lethality computations
  • following established procedures to determine growth phenotypes
  1. under minimal medium conditions and
  2. compared to published data.

A modified version of the biomass function used in previous iND750 studies

  1. was set as the objective to be maximized and
  2. gene deletions were simulated by

setting the flux through the corresponding reaction(s) to zero.

The biomass function was based on the experimentally measured

  1. composition of major cellular constituents
  2. during exponential growth of yeast cells and
  3. was reformulated to include trace amounts of
  4. additional cofactors and metabolites
  5. with the assumed fractional contribution of 10-.

These additional biomass compounds were included

according to the biomass formulation used in the iLL672 study

  • to improve lethality predictions through
  • the inclusion of additional essential biomass components [3].

The model was constrained by limiting

  1. the carbon source uptake to 10 mmol/h/gDW
  2. and oxygen uptake to 2 mmol/h/gDW.

Ammonia, phosphate, and sulfate were assumed to be non-limiting.

The experimental phenotyping data was obtained

  • using strains that were auxotrophic for
  1. methionine,
  2. leucine,
  3. histidine, and
  4. uracil.

These auxotrophies were simulated

  1. by deleting the appropriate genes from the model and
  2. supplementing the in silico strain with the appropriate supplements
  3. at non-limiting, but low levels.

Furthermore, trace amounts of essential nutrients that are present

  • in the experimental minimal media formulation
  1. 4-aminobenzoate,
  2. biotin,
  3. inositol,
  4. nicotinate,
  5. panthothenate,
  6. thiamin)
  • were supplied in the simulations [3].

Three distinct methods to simulate the outcome of gene deletions were utilized:

  1. Flux-balance analysis (FBA) [36-38],
  2. Minimization of Metabolic Adjustment (MoMA) [39], and
  3. a linear version of MoMA (linearMoMA).

In the linearMoMA method, minimization of the quadratic objective function
of the original MoMA algorithm

  • was replaced by minimization of the corresponding 1-norm objective function
    (i.e. sum of the absolute values of the differences of wild type FBA solution
    and the knockout strain flux solution).

The computed results were then compared to growth phenotype data
(viable/lethal) from a previously published experimental gene deletion study [3].

The comparison between experimental and in silico deletion phenotypes involved

  • choosing a threshold for the predicted relative growth rate of
  • a deletion strain that is considered to be viable.

We used standard ROC curve analysis

  • to assess the accuracy of different prediction methods and models
  • across the full range of the viability threshold parameter,
    results shown in Figure S2 [see Additional file 3].

The ROC curve plots the true viable rate against the false viable rate

  • allowing comparison of different models and methods
  • without requiring arbitrarily choosing this parameter a priori [40].

The optimal prediction performance corresponds to

  • the point closest to the top left corner of the ROC plot
    (i.e. 100% true viable rate, 0% false viable rate).

Table 1

Table 1 Comparison of iMM904 and iLL672 gene deletion predictions and experimental data under minimal media conditions
Media Model Method True viable False viable False lethal True lethal True viable % False viable % MCC
Glucose iMM904 full FBA 647 10 32 33 95.29 23.26 0.6
iMM904 full linMOMA 644 10 35 33 94.85 23.26 0.58
iMM904 full MOMA 644 10 35 33 94.85 23.26 0.58
iMM904 red FBA 440 9 28 33 94.02 21.43 0.61
iMM904 red linMOMA 437 9 31 33 93.38 21.43 0.6
iMM904 red MOMA 437 9 31 33 93.38 21.43 0.6
iLL672 full MOMA 433 9 35 33 92.52 21.43 0.57
Galactose iMM904 full FBA 595 32 36 59 94.29 35.16 0.58
iMM904 full linMOMA 595 32 36 59 94.29 35.16 0.58
iMM904 full MOMA 595 32 36 59 94.29 35.16 0.58
iMM904 red FBA 409 12 33 56 92.53 17.65 0.67
iMM904 red linMOMA 409 12 33 56 92.53 17.65 0.67
iMM904 red MOMA 409 12 33 56 92.53 17.65 0.67
iLL672 full MOMA 411 19 31 49 92.99 27.94 0.61
Glycerol iMM904 full FBA 596 43 36 47 94.3 47.78 0.48
iMM904 full linMOMA 595 44 37 46 94.15 48.89 0.47
iMM904 full MOMA 598 44 34 46 94.62 48.89 0.48
iMM904 red FBA 410 20 34 46 92.34 30.3 0.57
iMM904 red linMOMA 409 21 35 45 92.12 31.82 0.56
iMM904 red MOMA 412 21 32 45 92.79 31.82 0.57
iLL672 full MOMA 406 20 38 46 91.44 30.3 0.55
Ethanol iMM904 full FBA 593 45 29 55 95.34 45 0.54
iMM904 full linMOMA 592 45 30 55 95.18 45 0.54
iMM904 full MOMA 592 44 30 56 95.18 44 0.55
iMM904 red FBA 408 21 27 54 93.79 28 0.64
iMM904 red linMOMA 407 21 28 54 93.56 28 0.63
iMM904 red MOMA 407 20 28 55 93.56 26.67 0.64
iLL672 full MOMA 401 13 34 62 92.18 17.33 0.68
MCC, Matthews correlation coefficient (see Methods). Note that the iLL672 predictions were obtained directly from [3] and thus the viability threshold was not optimized using the maximum MCC approach.
Mo et al. BMC Systems Biology 2009 3:37  http://dx.doi.org:/10.1186/1752-0509-3-37


The values reported in Table 1 correspond to selecting

  • the optimal viability threshold based on this criterion.

We summarized the overall prediction accuracy of a model and method

  • using the Matthews Correlation Coefficient (MCC) [40].

The MCC ranges from -1 (all predictions incorrect) to +1 (all predictions correct) and

  • is suitable for summarizing overall prediction performance

in our case where there are substantially more viable than lethal gene deletions.

ROC plots were produced in Matlab (Mathworks, Inc.).


Table 1. Comparison of iMM904 and iLL672

  • gene deletion predictions and
  • experimental data

Inferring perturbed metabolic regions based on EM profiles

The method implemented in this study is shown schematically in Figures 1 and 2

Constraining the iMM904 network 

Relative levels of quantitative EM data were incorporated into the constraint-based framework

  • as overflow secretion exchange fluxes to simulate the required low-level production of
  • experimentally observed excreted metabolites.

The primary objective of this study is to associate

  • relative metabolite levels that are generally measured for metabonomic or biofluid analyses
  • to the quantitative ranges of intracellular reaction fluxes required to produce them.

However, without detailed kinetic information or dynamic metabolite measurements available,

  • we approximated EM datasets of relative quantitative metabolite levels
  • to be proportional to the rate in which they are secreted and detected
  • (at a steady state) – into the extracellular media.

This approach is analogous to approximating uptake rates based

  • on metabolite concentrations from a previous study performing sampling analysis
  • on a cardiomyocyte mitochondrial network
  • to identify differential flux distribution ranges

for various environmental (i.e. substrate uptake) conditions [19].

The raw data was normalized by the raw maximum value of the dataset
(thus the maximum secretion flux was 1 mmol/hr/gDW) with

  • an assumed error of 10%
  • to set the lower and upper bounds and thus
  • inherently accounting for sampling calculation sensitivity.

The gdh1/GDH2 strains were flask cultured under minimal glucose media conditions; thus,

  • glucose and oxygen uptake rates were set at 15 and 2 mmol/hr/gDW, respectively,
  • for the gdh1/GDH2 strain study.

In the anaerobic case the oxygen uptake rate was set to zero, and

  • sterols and fatty acids were provided as in silico supplements as described in [35].

For the potassium limitation/ammonium toxicity study

  • the growth rate was set at 0.17 1/h, and
  • the glucose uptake rate was minimized
  • to mimic experimental chemostat cultivation conditions.

These input constraints were constant for each perturbation and comparative wild-type condition

  • such that the calculated solution spaces between the conditions
  • differed based only on variations in the output secretion constraints.

FBA optimization of EM-constrained networks

A modified FBA method with minimization of the 1-norm objective function

  • between two optimal flux distributions was used
  • to determine optimal intracellular fluxes
  • based on the EM-constrained metabolic models.

This method determines two optimal flux distributions simultaneously

  • for two differently constrained models (e.g. wild type vs. mutant) –
  • these flux distributions maximize biomass production in each case and
  • the 1-norm distance between the distributions is as small as possible
  • given the two sets of constraints.

This approach avoids problems with

  • alternative optimal solutions when comparing two FBA-computed flux distributions
  • by assuming minimal rerouting of flux distibution between a perturbed network and its reference network.

Reaction flux changes from the FBA optimization results were determined

  • by computing the relative percentage fold change for each reaction
  • between the mutant and wild-type flux distributions.

Random sampling of the steady-state solution space

We utilized artificial centering hit-and-run (ACHR) Monte Carlo sampling [19,41]

  • to uniformly sample the metabolic flux solution space
  • defined by the constraints described above.

Reactions, and their participating metabolites, found to participate in intracellular loops [42]

  • were discarded from further analysis as these reactions can have arbitrary flux values.

The following sections describe the approaches used for the analysis of the different datasets.

Sampling approach used in the gdh1/GDH2 study

Due to the overall shape of the metabolic flux solution space,

  • most of the sampled flux distributions resided close to the minimally allowed growth rate
    (i.e. biomass production) and
  • corresponded to various futile cycles that utilized substrates but
  • did not produce significant biomass.

In order to study more physiologically relevant portions of the flux space

  • we restricted the sampling to the part of the solution space
  • where the growth rate was at least 50% of the maximum growth rate
  • for the condition as determined by FBA.

This assumes that cellular growth remains an important overall objective by the yeast cells

  • even in batch cultivation conditions, but
  • that the intracellular flux distributions
  • may not correspond to maximum biomass production [43].

To test the sensitivity of the results to the minimum growth rate threshold,

  • separate Monte Carlo samples were created for each minimum threshold
  • ranging from 50% to 100% at 5% increments.

We also tested the sensitivity of the results

  • to the relative magnitude of the extracellular metabolite secretion rates
  • by performing the sampling at three different relative levels

(0 corresponding to no extracellular metabolite secretion, maximum rate of 0.5 mmol/hr/gDW,
and maximum rate of 1.0 mmol/hr/gDW).

For each minimum growth rate threshold and extracellular metabolite secretion rate,

  • the ACHR sampler was run for 5 million steps and
  • a flux distribution was stored every 5000 steps.

The sensitivity analysis results are presented in Figures S3 and S4 [see Additional File 3], and

  • the results indicate that the reaction Z-scores (see below) are not significantly affected by
  1. either the portion of the solution space sampled or
  2. the exact scaling of secretion rates.

The final overall sample used was created by combining the samples for all minimum growth rate thresholds

  • for the highest extracellular metabolite secretion rate (maximum 1 mmol/hr/gDW).

This approach allowed biasing the sampling towards

  • physiologically relevant parts of the solution space
  • without imposing the requirement of strictly maximizing a predetermined objective function.

The samples obtained with no EM data were used as control samples

  • to filter reporter metabolites/subsystems whose scores were significantly high
  • due to only random differences between sampling runs.

Sampling approach used in the potassium limitation/ammonium toxicity study

Since the experimental data used in this study was generated in chemostat conditions, and

  • previous studies have indicated that chemostat flux patterns predicted by FBA are
  • close to the experimentally measured ones [43],
  • we assumed that sampling of the optimal solution space was appropriate for this study.

In order to sample a physiologically reasonable range of flux distributions,

  • samples for four different oxygen uptake rates
    (1, 2, 3, and 4 mmol/hr/gDW with 5 million steps each)
  • were combined in the final analysis.

Standardized scoring of flux differences between perturbation and control conditions

A Z-score based approach was implemented to quantify differences in flux samples between two conditions (Figure 2).
First, two flux vectors were chosen randomly,

  • one from each of the two samples to be compared and
  • the difference between the flux vectors was computed.

This approach was repeated to create a sample of 10,000 (n) flux difference vectors

  • for each pair of conditions considered (e.g. mutant or perturbed environment vs. wild type).

Based on this flux difference sample, the sample mean (μdiff,i) and standard deviation (σdiff,i)

  • between the two conditions was calculated for each reaction i. The reaction Z-score was calculated as:


reaction Z-score

reaction Z-score

which describes the sampled mean difference deviation

  • from a population mean change of zero (i.e. no flux difference
    between perturbation and wild type).

Note that this approach allows accounting for uncertainty in the

  • flux distributions inferred based on the extracellular metabolite secretion constraints.

This is in contrast to approaches such as FBA or MoMA that would predict

  • a single flux distribution for each condition and thus potentially
  • overestimate differences between conditions.

The reaction Z-scores can then be further used in analysis

  • to identify significantly perturbed regions of the metabolic network
  • based on reporter metabolite [44] or subsystem [30] Z-scores.

These reporter regions indicate, or “report”, dominant perturbation features

  • at the metabolite and pathway levels for a particular condition.

The reporter metabolite Z-score for any metabolite j can be derived from the reaction Z-scores

  • of the reactions consuming or producing j (set of reactions denoted as Rj) as:


reporter z-score for any metabolite j

reporter z-score for any metabolite j

where Nj is the number of reactions in Rj and mmet,j is calculated as


distributional correction for m_met,j SQRT

distributional correction for m_met,j SQRT

To account and correct for background distribution, the metabolite Z-score was normalized

  • by computing μmet,Nj and σmet,,Nj corresponding to the mean mmet and
  • its standard deviation for 1,000 randomly generated reaction sets of size Nj.

Z-scores for subsystems were calculated similarly by considering the set of reactions Rk 

  • that belongs to each subsystem k.

Hence, positive metabolite and subsystem scores indicate a significantly perturbed metabolic region

  • relative to other regions, whereas
  • a negative score indicate regions that are not perturbed
  • more significantly than what is expected by random chance.

Perturbation subnetworks of reactions and connecting metabolites were visualized using Cytoscape [45].

Results and discussion

  1. Reconstruction and validation of iMM904 network iMM904 network content 

A previously reconstructed S. cerevisiae network, iND750,

  • was used as the basis for the construction of the expanded iMM904 network.
  • Prior to its presentation here, the
    iMM904 network content was the basis for a consensus jamboree network that was recently published
  • but has not yet been adapted for FBA calculations [46].

The majority of iND750 content was carried over and

  • further expanded on to construct iMM904, which accounts for
  1. 904 genes,
  2. 1,228 individual metabolites, and
  3. 1,412 reactions of which
  •                       395 are transport reactions.

Both the number of gene-associated reactions and the number of metabolites

  • increased in iMM904 compared with the iND750 network.

Additional genes and reactions included in the network primarily expanded the

  • lipid,
  • transport, and
  • carbohydrate subsystems.

The lipid subsystem includes

  • new genes and
  • reactions involving the degradation of sphingolipids and glycerolipids.

Sterol metabolism was also expanded to include

  • the formation and degradation of steryl esters, the
  •                      storage form of sterols.

The majority of the new transport reactions were added

  • to connect network gaps between intracellular compartments
  • to enable the completion of known physiological functions.

We also added a number of new secretion pathways

  • based on experimentally observed secreted metabolites [31].

A number of gene-protein-reaction (GPR) relationships were modified

  • to include additional gene products that are required to catalyze a reaction.

For example, the protein compounds

  • thioredoxin and
  • ferricytochrome C

were explicitly represented as compounds in iND750 reactions, but

  • the genes encoding these proteins were not associated with their corresponding GPRs.

Other examples include glycogenin and NADPH cytochrome p450 reductases (CPRs),

  1. which are required in the assembly of glycogen and
  2. to sustain catalytic activity in cytochromes p450, respectively.

These additional proteins were included in iMM904 as

  • part of protein complexes to provide a more complete
  • representation of the genes and
  • their corresponding products necessary for a catalytic activity to occur.

Major modifications to existing reactions were in cofactor biosynthesis, namely in

  • quinone,
  • beta-alanine, and
  • riboflavin biosynthetic pathways.

Reactions from previous S. cerevisiae networks associated with

  • quinone,
  • beta-alanine, and
  • riboflavin biosynthetic pathways

were essentially inferred from known reaction mechanisms based on

  • reactions in previous network reconstructions of E. coli [2,47].

These pathways were manually reviewed

  • based on current literature and subsequently replaced by
  • reactions and metabolites specific to yeast.

Additional changes in other subsystems were also made, such as

  1. changes to the compartmental location of a gene and
  2. its corresponding reaction(s),
  3. changes in reaction reversibility and cofactor specificity, and
  4. the elucidation of particular transport mechanisms.

A comprehensive listing of iMM904 network contents as well as

  • a detailed list of changes between iND750 and iMM904 is included
    [see Additional file 1].

Predicting deletion growth phenotypes

The updated genome-scale iMM904 metabolic network was validated

  • by comparing in silico single-gene deletion predictions to
  • in vivo results from a previous study used
  • to analyze another S. cerevisiae metabolic model, iLL672 [3].

This network was constructed based on the iFF708 network [22],

  • which was also the starting point for
  • reconstructing the iND750 network [2].

The experimental data used to validate the iLL672 model consisted of

3,360 single-gene knockout strain phenotypes evaluated

  • under minimal media growth conditions with
  1. glucose,
  2. galactose,
  3. glycerol, and
  4. ethanol

as sole carbon sources. Growth phenotypes for the iMM904 network were predictedusing

  1. FBA [32–34],
  2. MoMA [35], and
  3. linear MoMA methods

as described in Methods and subsequently compared to the experimental data (Table 1).

Each deleted gene growth prediction comparison was classified as

  1. true lethal,
  2. true viable,
  3. false lethal, or
  4. false viable.

The growth rate threshold for considering a prediction viable was chosen

  • for each condition and method separately
  • to optimize the tradeoff between true viable and false viable predictions
    (maximum Matthews correlation coefficient, see Methods).

Since iMM904 has 212 more genes than iLL672 with experimental data, we also present results

  • for the subset of iMM904 predictions with genes included in iLL672 (reduced iMM904 set).

When the same gene sets are compared, iMM904 improves gene lethality predictions under

  • glucose,
  • galactose, and
  • glycerol conditions

over iLL672 somewhat, but is less accurate

  • at predicting growth phenotypes under the ethanol condition.

It should be noted that the iLL672 predictions were obtained directly from [3]

  • thus the growth rate threshold was not optimized similarly to iMM904 predictions.

Overall, when viability cutoff is chosen

  • as indicated above for each method separately,
  • the three prediction methods perform similarly
  1. FBA,
  2. MOMA, and
  3. linear MOMA) .

While the full gene complement in iMM904 greatly increased

  • the number of true viable predictions,
  • the full model also made significantly more false viable predictions
  • compared with reduced iMM904 and iLL672 predictions.

However, it is important to note that 143 reactions involved in dead-end biosynthetic pathways were actually

  • removed from iFF708 to build the iLL672 reconstruction [3].

These dead-ends are considered “knowledge gaps” in pathways

  • that have not been fully characterized and, as a result,
  • lead to false viable predictions when determining gene essentiality
  • if the pathway is in fact required for growth under a certain condition [2,26].

As more of these pathways are elucidated and

  • included in the model to
  • fill in existing network gaps,
  • we can expect false viable prediction rates to consequently decrease.

Thus, while a larger network has a temporarily reduced capacity to accurately predict gene deletion phenotypes,

  • it captures a more complete picture of currently known metabolic functions and
  • provides a framework for network expansion as new pathways are elucidated [48].


Inferring intracellular perturbation states from metabolic profiles – Aerobic and anaerobic gdh1/GDH2 mutant behavior

The gdh1/GDH2 mutant strain was previously developed [49,50]

  • to lower NADPH consumption in ammonia assimilation, which would
  • favor the NADPH-dependent fermentation of xylose.

In this strain, the NADPH-dependent glutamate dehydrogenase, Gdh1, was

  • deleted and the NADH-dependent form of the enzyme, Gdh2,
  •                     was overexpressed.

The net effect is to allow efficient assimilation of ammonia

  • into glutamate using NADH instead of NADPH as a cofactor.

While growth characteristics remained unaffected,

  • relative quantities of secreted metabolites differed between the wild-type and mutant strain
  • under aerobic and anaerobic conditions.

We analyzed EM data for the gdh1/GDH2 and wild-type strains reported

  • in [31] under aerobic and anaerobic conditions separately using
  • both FBA optimization and
  • sampling-based approaches as described in Methods.

43 measured extracellular and intracellular metabolites from the original dataset [31],

  • primarily of central carbon and amino acid metabolism,
  • were explicitly represented in the iMM904 network [see Additional file 4].

Extracellular metabolite levels were used

  • to formulate secretion constraints and
  • differential intracellular metabolites were used
  • to compare and validate the intracellular flux predictions.

Perturbed reactions from the FBA results were

  • determined by calculating relative flux changes, and
  • reaction Z-scores were calculated from the sampling analysis
  • to quantify flux changes between the mutant and wild-type strains,
  • with Z reaction > 1.96 corresponding to a two-tailed p-value < 0.05 and
  • considered to be significantly perturbed [see Additional file 4].

Additional file 4. Gdh mutant aerobic and anaerobic analysis results. 

The data provided are the full results for the exometabolomic analysis of aerobic and anerobic gdh1/GDH2 mutant.

Format: XLS Size: 669KB Download file

This file can be viewed with: Microsoft Excel Viewer

To validate the predicted results, reaction flux changes from both FBA and sampling methods were compared to differential intracellular metabolite level data measured from the same study. Intracellular metabolites involved in highly perturbed reactions (i.e. reactants and products) predicted from FBA and sampling analyses were identified and
compared to metabolites that were experimentally identified as significantly changed (p < 0.05) between mutant and wild-type. Statistical measures of recall, accuracy, and
precision were calculated and represent the predictive sensitivity, exactness, and reproducibility respectively. From the sampling analysis, a considerably larger number of
significantly perturbed reactions are predicted in the anaerobic case (505 reactions, or 70.7% of active reactions) than in aerobic (394 reactions, or 49.8% of active reactions). The top percentile of FBA flux changes equivalent to the percentage of significantly perturbed sampling reactions were compared to the intracellular data. Results from both analyses are summarized in Table 2. Sampling predictions were considerably higher in recall than FBA predictions for both conditions, with respective ranges of 0.83–1
compared to 0.48–0.96. Accuracy was also higher in sampling predictions; however, precision was slightly better in the FBA predictions as expected due to the smaller
number of predicted changes. Overall, the sampling predictions of perturbed intracellular metabolites are strongly consistent with the experimental data and significantly
outperforms that of FBA optimization predictions in accurately predicting differential metabolites involved in perturbed intracellular fluxes.

Table 2. Statistical comparison of the differential intracellular metabolite data set (p < 0.05) with metabolites involved in perturbed reactions predicted by FBA optimization and sampling analyses for aerobic and anaerobic gdh1/GDH2 mutant.


Table 2 Statistical comparison of the differential intracellular metabolite data set (p < 0.05)
with metabolites involved in perturbed reactions predicted by FBA optimization and
sampling analyses for aerobic and anaerobic gdh1/GDH2 mutant.
                           Aerobic                         Anaerobic                             Overall
FBA Sampling FBA Sampling FBA
Recall 0.48 0.83 0.96 1 0.71 0.91
Accuracy 0.55 0.62 0.64 0.64 0.6 0.63
Precision 0.78 0.69 0.64 0.63 0.68 0.66
Overall statistics indicate combined results of both conditions.
Mo et al. BMC Systems Biology 2009 3:37   http://dx.doi.org:/10.1186/1752-0509-3-37


Figure 3.
 Perturbation reaction subnetwork of gdh1/GDH2 mutant under aerobic conditions.

The network illustrates a simplified subset of highly perturbedPerturbation subnetworks can be drawn to visualize predicted significantly perturbed intracellular reactions and illustrate their connection to the observed secreted metabolites in the aerobic and anaerobic gdh1/GDH2 mutants.

Perturbation reaction subnetwork of gdh1.GDH2 mutant under aerobic conditions.

Perturbation reaction subnetwork of gdh1.GDH2 mutant under aerobic conditions.

Figure 3 shows an example of a simplified aerobic perturbation subnetwork consisting primarily of proximal pathways connected directly to a subset of major secreted
metabolites

  • glutamate,
  • proline,
  • D-lactate, and
  • 2-hydroxybuturate.

Figure 4 displays anaerobic reactions with Z-scores of similar magnitude to the perturbed reactions in Figure 3. The same subset of metabolites is also present in the
larger anaerobic perturbation network and indicates that the NADPH/NADH balance perturbation induced by the gdh1/GDH2 manipulation has widespread effects
beyond just altering glutamate metabolism anaerobically.

Interestingly, it is clear that the majority of the secreted metabolite pathways involve connected perturbed reactions that broadly converge on glutamate.

Note that Figures 3 and 4 only show the subnetworks that consisted of two or more connected reactions  for a number of secreted metabolites no contiguous perturbed pathway could be identified by the sampling approach. This indicates that the secreted metabolite pattern alone is not sufficient to determine which specific
production and secretion pathways are used by the cell for these metabolites.

Reactions connected to aerobically-secreted metabolites predicted from the sampling analysis of the gdh1/GDH2 mutant strain.
The major secreted metabolites

  • glutamate,
  • proline,
  • D-lactate, and
  • 2-hydroxybuturate

were also detected in the anaerobic condition. Metabolite abbreviations are found in Additional file 1.

Figure 4.

Perturbation reaction subnetwork of gdh1/GDH2 mutant under anaerobic conditions.

Perturbation reaction subnetwork of gdh1.GDH2 mutant under anaerobic conditions

Perturbation reaction subnetwork of gdh1.GDH2 mutant under anaerobic conditions

Subnetwork illustrates the highly perturbed anaerobic reactions of similar Z-reaction magnitude to the reactions in Figure 3.

A significantly larger number of reactions indicates mutant metabolic effects are more widespread in the anaerobic environment.
The network shows that perturbed pathways converge on glutamate, the main site in which the gdh1/GDH2 modification was introduced, which
suggests that the direct genetic perturbation effects are amplified under this environment. Metabolite abbreviations are found in Additional file 1.

To further highlight metabolic regions that have been systemically affected by the gdh1/GDH2 modification, reporter metabolite and subsystem methods [30] were used to
summarize reaction scores around specific metabolites and in specific metabolic subsystems. The top ten significant scores for metabolites/subsystems associated with more
than three reactions are summarized in Tables 3 (aerobic) and 4 (anaerobic), with Z > 1.64 corresponding to p < 0.05 for a one-tailed distribution. Full data for all reactions,
reporter metabolites, and reporter subsystems is included [see Additional file 4].

Table 3. List of the top ten significant reporter metabolite and subsystem scores for the gdh1/GDH2 vs. wild type comparison in aerobic conditions.

Table 3
List of the top ten significant reporter metabolite and subsystem scores for the gdh1/GDH2 vs. wild type comparison in aerobic conditions.
Reporter metabolite Z-score No of reactions*
L-proline [c] 2.71 4
Carbon dioxide [m] 2.51 15
Proton [m] 2.19 51
Glyceraldehyde 3-phosphate [c] 1.93 7
Ubiquinone-6 [m] 1.82 5
Ubiquinol-6 [m] 1.82 5
Ribulose-5-phosphate [c] 1.8 4
Uracil [c] 1.74 4
L-homoserine [c] 1.72 4
Alpha-ketoglutarate [m] 1.71 8
Reporter subsystem Z-score No of reactions
Citric Acid Cycle 4.58 7
Pentose Phosphate Pathway 3.29 12
Glycine and Serine Metabolism 2.69 17
Alanine and Aspartate Metabolism 2.65 6
Oxidative Phosphorylation 1.79 8
Thiamine Metabolism 1.54 8
Arginine and Proline Metabolism 1.44 20
Other Amino Acid Metabolism 1.28 5
Glycolysis/Gluconeogenesis 0.58 14
Anaplerotic reactions 0.19 9
*Number of reactions categorized in a subsystem or found to be neighboring each metabolite
Mo et al. BMC Systems Biology 2009 3:37   http://dx.doi.org:/10.1186/1752-0509-3-37

Table 4. List of top ten significant reporter metabolite and subsystem scores for the gdh1/GDH2 vs. wild type comparison in anaerobic conditions.


Table 4
List of top ten significant reporter metabolite and subsystem scores for the gdh1/GDH2 vs. wild type comparison in anaerobic conditions.
Reporter metabolite Z-score No of reactions
Glutamate [c] 4.52 35
Aspartate [c] 3.21 11
Alpha-ketoglutarate [c] 2.66 17
Glycine [c] 2.65 7
Pyruvate [m] 2.56 7
Ribulose-5-phosphate [c] 2.43 4
Threonine [c] 2.28 6
10-formyltetrahydrofolate [c] 2.27 5
Fumarate [c] 2.27 5
L-proline [c] 2.04 4
Reporter subsystem Z-score No of reactions
Valine, Leucine, and Isoleucine Metabolism 3.97 15
Tyrosine, Tryptophan, and Phenylalanine Metabolism 3.39 23
Pentose Phosphate Pathway 3.29 11
Purine and Pyrimidine Biosynthesis 3.08 40
Arginine and Proline Metabolism 2.96 19
Threonine and Lysine Metabolism 2.74 14
NAD Biosynthesis 2.66 7
Alanine and Aspartate Metabolism 2.65 6
Histidine Metabolism 2.24 10
Cysteine Metabolism 1.85 10
Mo et al. BMC Systems Biology 2009 3:37   http://dx.doi.org:/10.1186/1752-0509-3-37
Open Data

Perturbations under aerobic conditions largely consisted of pathways involved in mediating the NADH and NADPH balance. Among the highest scoring aerobic subsystems
are TCA cycle and pentose phosphate pathway – key pathways directly involved in the generation of NADH and NADPH. Reporter metabolites involved in these
subsystems –

  • glyceraldehyde-3-phosphate,
  • ribulose-5-phosphate, and
  • alpha-ketoglutarate – were also identified.

These results are consistent with flux and enzyme activity measurements

  • of the gdh1/GDH2 strain under aerobic conditions [32],
  1. which reported significant reduction in the pentose phosphate pathway flux
  2. with concomitant changes in other central metabolic pathways.

Levels of several TCA cycle intermediates (e.g. fumarate, succinate, malate) were also elevated

  • in the gdh1/GDH2 mutant according to the differential intracellular metabolite data.

Altered energy metabolism, as indicated by

  • reporter metabolites (i.e. ubiquinone- , ubiquinol, mitochondrial proton)
  • and subsystem (oxidative phosphorylation),

is certainly feasible as NADH is a primary reducing agent for ATP production.

Pentose phosphate pathway and NAD biosynthesis also appears

  • among the most perturbed anaerobic subsystems, further suggesting
  • perturbed cofactor balance as a common, dominant effect under both conditions.

Glutamate dehydrogenase is a critical enzyme of amino acid biosynthesis as it acts as

  • the entry point for ammonium assimilation via glutamate.

Consequently, metabolic subsystems involved in amino acid biosynthesis were broadly perturbed

  • as a result of the gdh1/GDH2 modification in both aerobic and anaerobic conditions.

For example, the proline biosynthesis pathway that uses glutamate as a precursor

  • was significantly perturbed in both conditions,
  • with significantly changed intracellular and extracellular levels.

There were differences, however, in that more amino acid related subsystems were

  • significantly affected in the anaerobic case (Table 4),
  • further highlighting that altered ammonium assimilation in the mutant
  • has a more widespread effect under anaerobic conditions.

This effect is especially pronounced for

  • threonine and nucleotide metabolism,
  • which were predicted to be significantly perturbed only in anaerobic conditions.

Intracellular threonine levels were amongst the most significantly reduced

  • relative to other differential intracellular metabolites in the anaerobically grown gdh1/GDH2 strain
    (see [31] and Additional file 4), and
  • the relationship between threonine and nucleotide biosynthesis is further supported

by threonine’s recently discovered role as a key precursor in yeast nucleotide biosynthesis [51].

Other key anaerobic reporter metabolites are

  • glycine and 10-formyltetrahydrofolate,
  • both of which are involved in the cytosolic folate cycle (one-carbon metabolism).

Folate is intimately linked to biosynthetic pathways of

  • glycine (with threonine as its precursor) and purines
  • by mediating one-carbon reaction transfers necessary in their metabolism and
  • is a key cofactor in cellular growth [52].

Thus, the anaerobic perturbations identified in the analysis emphasize the close relationship

  • between threonine, folate, and nucleotide metabolic pathways as well as
  • their potential connection to perturbed ammonium assimilation processes.

Interestingly, this association has been previously demonstrated at the transcriptional level

  • as yeast ammonium assimilation (via glutamine synthesis) was found to be
  • co-regulated with genes involved in glycine, folate, and purine synthesis [53].

In summary, the overall differences in predicted gdh1/GDH2 mutant behavior

  • under aerobic and anaerobic conditions show that changes in flux states
  • directly related to modified ammonium assimilation pathway
  1. are amplified anaerobically whereas the
  2. indirect effects through NADH/NADPH balance are more significant aerobically.

Perturbed metabolic regions under aerobic conditions were predominantly

  • in central metabolic pathways involved in responding to the changed NADH/NADPH demand
  • and did not necessarily emphasize that glutamate dehydrogenase was the site of the genetic modification.

The majority of affected anaerobic pathways were involved directly

  • in modified ammonium assimilation as evidenced by

1) significantly perturbed amino acid subsystems,

2) a broad perturbation subnetwork converging on glutamate (Figure 4), and

3) glutamate as the most significant reporter metabolite (Table 4).

Potassium-limited and excess ammonium environments

A recent study reported that potassium limitation resulted in significant

  • growth retardation effect in yeast due to excess ammonium uptake
  • when ammonium was provided as the sole nitrogen source [33].

The proposed mechanism for this effect was that ammonium

  • could to be freely transported through potassium channels
  • when potassium concentrations were low in the media environment, thereby
  • resulting in excess ammonium uptake [33].

As a result, yeast incurred a significant metabolic cost

  • in assimilating ammonia to glutamate and
  • secreting significant amounts of glutamate and other amino acids
  • in potassium-limited conditions as a means to detoxify the excess ammonium.

A similar effect was observed when yeast was grown

  • with no potassium limitation,
  • but with excess ammonia in the environment.

While the observed effect of both environments (low potassium or excess ammonia) was similar,

  • quantitatively unique amino acid secretion profiles suggested that
  • internal metabolic states in these conditions are potentially different.

In order to elucidate the differences in internal metabolic states, we utilized

  • the iMM904 model and the EM profile analysis method to analyze amino acid secretion profiles
  • for a range of low potassium and high ammonia conditions reported in [33].

As before, we utilized amino acid secretion patterns as constraints to the iMM904 model,

  1. sampled the allowable solution space,
  2. computed reaction Z-scores for changes from a reference condition (normal potassium and ammonia), and
  3. finally summarized the resulting changes using reporter metabolites.

Figure 5 shows a clustering of the most significant reporter metabolites (Z ≥ 1.96 in any of the four conditions studied)

  • obtained from this analysis across the four conditions studied.

Interestingly, the potassium-limited environment perturbed only a subset of

  • the significant reporter metabolites identified in the high ammonia environments.

Both low potassium environments shared a consistent pattern of

  • highly perturbed amino acids and related precursor biosynthesis metabolites
    (e.g. pyruvate, PRPP, alpha-ketoglutarate)
  • with high ammonium environments.

The amino acid perturbation pattern (indicated by red labels in Figure 5) was present in

  • the ammonium-toxic environments, although the pattern was
  • slightly weaker for the lower ammonium concentration.

Nevertheless, the results clearly indicate that a similar

  • ammonium detoxifying mechanism that primarily perturbs pathways
  • directly related to amino acid metabolism
  • exists under both types of media conditions.

Figure 5.

Clustergram of top reporter metabolites - y in ammonium-toxic and potassium-limited conditions

Clustergram of top reporter metabolites – y in ammonium-toxic and potassium-limited conditions

Clustergram of top reporter metabolites (i.e. in yellow) in ammonium-toxic and potassium-limited conditions.

Amino acid perturbation patterns (shown in red) were shown to be consistently scored across conditions, indicating that potassium-limited environments K1 (lowest
concentration) and K2 (low concentration) elicited a similar ammonium detoxification response as ammonium-toxic environments N1 (high concentration) and N2
(highest concentration). Metabolites associated with folate metabolism (highlighted in green) are also highly perturbed in ammonium-toxic conditions. Metabolite
abbreviations are found in Additional file 1.

In addition to perturbed amino acids, a secondary effect notably appears at high ammonia levels in which metabolic regions related to folate metabolism are significantly affected. As highlighted in green in Figure 3, we predicted significantly perturbed key metabolites involved in the cytosolic folate cycle. These include tetrahydrofolate derivatives and other metabolites connected to the folate pathway, namely glycine and the methionine-derived methylation cofactors S-adenosylmethionine and S-adenosyl-homocysteine. Additionally, threonine was identified to be a key perturbed metabolite in excess ammonium conditions. These results further illustrate the close
connection between threonine biosynthesis, folate metabolism involving glycine derived from its threonine precursor, and nucleotide biosynthesis [51] that was discussed in
conjunction with the gdh1/GDH2 strain data. Taken together with the anaerobic gdh1/GDH2 data, the results consistently suggest highly perturbed threonine and folate
metabolism when amino acid-related pathways are broadly affected.

In both ammonium-toxic and potassium-limited environments, impaired cellular growth was observed, which can be attributed to high energetic costs of increased
ammonium assimilation to synthesize and excrete amino acids. However, under high ammonium environments, reporter metabolites related to threonine and folate
metabolism indicated that their perturbation, and thus purine supply, may be an additional factor in decreasing cellular viability as there is a direct relationship between
intracellular folate levels and growth rate [54]. Based on these results, we concluded that while potassiumlimited growth in yeast indeed shares physiological features with
growth in ammonium excess, its effects are not as detrimental as actual ammonium excess. The effects on proximal amino acid metabolic pathways are similar in both
environments as indicated by the secretion of the majority of amino acids. However, when our method was applied to analyze the physiological basis behind differences in
secretion profiles between low potassium and high ammonium conditions, ammonium excess was predicted to likely disrupt physiological ammonium assimilation processes,
which in turn potentially impacts folate metabolism and associated cellular growth.

Conclusion

The method presented in this study presents an approach to connecting intracellular flux states to metabolites that are excreted under various physiological conditions. We
showed that well-curated genome-scale metabolic networks can be used to integrate and analyze quantitative EM data by systematically identifying altered intracellular
pathways related to measured changes in the extracellular metabolome. We were able to identify statistically significant metabolic regions that were altered as a result of
genetic (gdh1/GD2 mutant) and environmental (excess ammonium and limited potassium) perturbations, and the predicted intracellular metabolic changes were consistent
with previously published experimental data including measurements of intracellular metabolite levels and metabolic fluxes. Our reanalysis of previously published EM data
on ammonium assimilation-related genetic and environmental perturbations also resulted in testable hypotheses about the role of threonine and folate pathways in mediating
broad responses to changes in ammonium utilization. These studies also demonstrated that the samplingbased method can be readily applied when only partial secreted
metabolite profiles (e.g. only amino acids) are available.

With the emergence of metabolite biofluid biomarkers as a diagnostic tool in human disease [55,56] and the availability of genome-scale human metabolic networks [1],
extensions of the present method would allow identifying potential pathway changes linked to these biomarkers. Employing such a method for studying yeast metabolism was possible as the metabolomic data was measured under controllable environmental conditions where the inputs and outputs of the system were defined. Measured metabolite biomarkers in a clinical setting, however, is far from a controlled environment with significant variations in genetic, nutritional, and environmental factors between different
patients. While there are certainly limitations for clinical applications, the method introduced here is a progressive step towards applying genome-scale metabolic networks
towards analyzing biofluid metabolome data as it 1) avoids the need to only study optimal metabolic states based on a predetermined objective function, 2) allows dealing with noisy experimental data through the sampling approach, and 3) enables analysis even with limited identification of metabolites in the data. The ability to establish potential
connections between extracellular markers and intracellular pathways would be valuable in delineating the genetic and environmental factors associated with a particular
disease.

Authors’ contributions

Conceived and designed the experiments: MLM MJH BOP. Performed experiments: MLM MJH. Analyzed the data: MLM MJH. Wrote the paper: MLM MJH BOP. All authors have read and approved the final manuscript.

Acknowledgements

We thank Jens Nielsen for providing the raw metabolome data for the mutant strain, and Jan Schellenberger and Ines Thiele for valuable discussions. This work was supported by NIH grant R01 GM071808. BOP serves on the scientific advisory board of Genomatica Inc.


References

  1. Duarte NC, Becker SA, Jamshidi N, Thiele I, Mo ML, Vo TD, Srivas R, Palsson BO: Global reconstruction of the human metabolic network based on genomic and bibliomic data. 

Proc Natl Acad Sci USA 2007, 104(6):1777-1782. PubMed Abstract | Publisher Full Text | PubMed Central Full Text

  1. Duarte NC, Herrgard MJ, Palsson B: Reconstruction and Validation of Saccharomyces cerevisiae iND750, a Fully Compartmentalized Genome-Scale Metabolic Model. 

Genome Res 2004, 14(7):1298-1309. PubMed Abstract | Publisher Full Text | PubMed Central Full Text

  1. Kuepfer L, Sauer U, Blank LM: Metabolic functions of duplicate genes in Saccharomyces cerevisiae. 

Genome Res 2005, 15(10):1421-1430. PubMed Abstract | Publisher Full Text | PubMed Central Full Text

  1. Nookaew I, Jewett MC, Meechai A, Thammarongtham C, Laoteng K, Cheevadhanarak S, Nielsen J, Bhumiratana S: The genome-scale metabolic model iIN800 of Saccharomyces cerevisiae and its validation: a scaffold to query lipid metabolism. 

BMC Syst Biol 2008, 2:71. PubMed Abstract | BioMed Central Full Text | PubMed Central Full Text

  1. Edwards JS, Palsson BO: Systems properties of the Haemophilus influenzae Rd metabolic genotype. 

J biol chem 1999, 274(25):17410-17416. PubMed Abstract | Publisher Full Text

  1. Edwards JS, Palsson BO: The Escherichia coli MG1655 in silico metabolic genotype: Its definition, characteristics, and capabilities. 

Proc Natl Acad Sci USA 2000, 97(10):5528-5533. PubMed Abstract | Publisher Full Text | PubMed Central Full Text

  1. Thiele I, Vo TD, Price ND, Palsson B: An Expanded Metabolic Reconstruction of Helicobacter pylori (i IT341 GSM/GPR): An in silico genome-scale characterization of single and double deletion mutants. 

J Bacteriol 2005, 187(16):5818-5830. PubMed Abstract | Publisher Full Text | PubMed Central Full Text

  1. Vo TD, Greenberg HJ, Palsson BO: Reconstruction and functional characterization of the human mitochondrial metabolic network based on proteomic and biochemical data. 

J Biol Chem 2004, 279(38):39532-39540. PubMed Abstract | Publisher Full Text

  1. Reed JL, Vo TD, Schilling CH, Palsson BO: An expanded genome-scale model of Escherichia coli K-12 (iJR904 GSM/GPR). 

Genome Biology 2003, 4(9):R54.51-R54.12. BioMed Central Full Text

  1. Feist AM, Henry CS, Reed JL, Krummenacker M, Joyce AR, Karp PD, V H, Palsson BO: A genome-scale metabolic reconstruction for Escherichia coli K-12 MG1655 that accounts for 1261 ORFs and thermodynamic information. 

Molecular Systems Biology 2007, 3:121. PubMed Abstract | Publisher Full Text | PubMed Central Full Text

  1. Suthers PF, Dasika MS, Kumar VS, Denisov G, Glass JI, Maranas CD: A genome-scale metabolic reconstruction of Mycoplasma genitalium, iPS189. 

PLos Comp Biol 2009, 5(2):e1000285. Publisher Full Text

  1. Price ND, Reed JL, Palsson BO: Genome-scale models of microbial cells: evaluating the consequences of constraints. 

Nat Rev Microbiol 2004, 2(11):886-897. PubMed Abstract | Publisher Full Text

  1. Becker SA, Feist AM, Mo ML, Hannum G, Palsson BO, Herrgard MJ: Quantitative Prediction of Cellular Metabolism with Constraint-based Models: The COBRA Toolbox. 

Nature protocols 2007, 2(3):727-738. PubMed Abstract | Publisher Full Text

  1. Reed JL, Palsson BO: Genome-Scale In Silico Models of E. coli Have Multiple Equivalent Phenotypic States: Assessment of Correlated Reaction Subsets That Comprise Network States. 

Genome Res 2004, 14(9):1797-1805. PubMed Abstract | Publisher Full Text | PubMed Central Full Text

  1. Fong SS, Palsson BO: Metabolic gene deletion strains of Escherichia coli evolve to computationally predicted growth phenotypes. 

Nature Genetics 2004, 36(10):1056-1058. PubMed Abstract | Publisher Full Text

  1. Ibarra RU, Edwards JS, Palsson BO: Escherichia coli K-12 undergoes adaptive evolution to achieve in silico predicted optimal growth. 

Nature 2002, 420(6912):186-189. PubMed Abstract | Publisher Full Text

  1. Schellenberger J, Palsson BØ: Use of randomized sampling for analysis of metabolic networks. 

J Biol Chem 2009, 284(9):5457-5461. PubMed Abstract | Publisher Full Text

  1. Almaas E, Kovács B, Vicsek T, Oltvai ZN, Barabási AL: Global organization of metabolic fluxes in the bacterium Escherichia coli. 

Nature 2004, 427(6977):839-843. PubMed Abstract | Publisher Full Text

  1. Thiele I, Price ND, Vo TD, Palsson BO: Candidate metabolic network states in human mitochondria: Impact of diabetes, ischemia, and diet. 

J Biol Chem 2005, 280(12):11683-11695. PubMed Abstract | Publisher Full Text

  1. Kell DB: Metabolomics and systems biology: making sense of the soup. 

Curr Opin Microbiol 2004, 7(3):296-307. PubMed Abstract | Publisher Full Text

  1. Kell DB, Brown M, Davey HM, Dunn WB, Spasic I, Oliver SG: Metabolic footprinting and systems biology: the medium is the message. 

Nat Rev Microbiol 2005, 3(7):557-565. PubMed Abstract | Publisher Full Text

  1. Goodacre R, Vaidyanathan S, Dunn WB, Harrigan GG, Kell DB: Metabolomics by numbers: acquiring and understanding global metabolite data. 

Trends Biotechnol 2004, 22(5):245-252. PubMed Abstract | Publisher Full Text

  1. Lenz EM, Bright J, Wilson ID, Morgan SR, Nash AF: A 1H NMR-based metabonomic study of urine and plasma samples obtained from healthy human subjects. 

J Pharm Biomed Anal 2003, 33(5):1103-1115. PubMed Abstract | Publisher Full Text

  1. Allen J, Davey HM, Broadhurst D, Heald JK, Rowland JJ, Oliver SG, Kell DB: High-throughput classification of yeast mutants for functional genomics using metabolic footprinting. 

Nat Biotech 2003, 21(6):692-696. Publisher Full Text

  1. Nicholson JK, Connelly J, Lindon JC, Holmes E: Metabonomics: a platform for studying drug toxicity and gene function. 

Nat Rev Drug Discov 2002, 1(2):153-161. PubMed Abstract | Publisher Full Text

  1. Mortishire-Smith RJ, Skiles GL, Lawrence JW, Spence S, Nicholls AW, Johnson BA, Nicholson JK: Use of metabonomics to identify impaired fatty acid metabolism as the mechanism of a drug-induced toxicity. 

Chem Res Toxicol 2004, 17(2):165-173. PubMed Abstract | Publisher Full Text

  1. Sabatine MS, Liu E, Morrow DA, Heller E, McCarroll R, Wiegand R, Berriz GF, Roth FP, Gerszten RE: Metabolomic identification of novel biomarkers of myocardial ischemia. 

Circulation 2005, 112(25):3868-3875. PubMed Abstract | Publisher Full Text

  1. Cakir T, Efe C, Dikicioglu D, Hortaçsu AKB, Oliver SG: Flux balance analysis of a genome-scale yeast model constrained by exometabolomic data allows metabolic system identification of genetically different strains. 

Biotechnol Prog 2007, 23(2):320-326. PubMed Abstract | Publisher Full Text

  1. Bang JW, Crockford DJ, Holmes E, Pazos F, Sternberg MJ, Muggleton SH, Nicholson JK: Integrative top-down system metabolic modeling in experimental disease states via data-driven Bayesian methods. 

J Proteome Res 2008, 7(2):497-503. PubMed Abstract | Publisher Full Text

  1. Oliveira AP, Patil KR, Nielsen J: Architecture of transcriptional regulatory circuits is knitted over the topology of bio-molecular interaction networks. 

BMC Syst Biol 2008, 2:17. PubMed Abstract | BioMed Central Full Text | PubMed Central Full Text

  1. Villas-Boas SG, Moxley JF, Akesson M, Stephanopoulos G, Nielsen J: High-throughput metabolic state analysis: the missing link in integrated functional genomics of yeasts. 

Biochem J 2005, 388(Pt 2):669-677. PubMed Abstract | Publisher Full Text | PubMed Central Full Text

  1. Moreira dos Santos M, Thygesen G, Kötter P, Olsson L, Nielsen J: Aerobic physiology of redox-engineered Saccharomyces cerevisiae strains modified in the ammonium assimilation for increased NADPH availability. 

FEMS Yeast Res 2003, 4(1):59-68. PubMed Abstract | Publisher Full Text

  1. Hess DC, Lu W, Rabinowitz JD, Botstein D: Ammonium toxicity and potassium limitation in yeast. 

PLoS Biol 2006, 4(11):e351. PubMed Abstract | Publisher Full Text | PubMed Central Full Text

  1. Nissen TL, Schulze U, Nielsen J, Villadsen J: Flux distributions in anaerobic, glucose-limited continuous cultures of Saccharomyces cerevisiae. 

Microbiology 1997, 143(Pt 1):203-218. PubMed Abstract | Publisher Full Text

  1. Famili I, Forster J, Nielsen J, Palsson BO: Saccharomyces cerevisiae phenotypes can be predicted by using constraint-based analysis of a genome-scale reconstructed metabolic network. 

Proc Natl Acad Sci USA 2003, 100(23):13134-13139. PubMed Abstract | Publisher Full Text | PubMed Central Full Text

  1. Bonarius HPJ, Schmid G, Tramper J: Flux analysis of underdetermined metabolic networks: The quest for the missing constraints. 

Trends in Biotechnology 1997, 15(8):308-314. Publisher Full Text

  1. Edwards JS, Palsson BO: Metabolic flux balance analysis and the in silico analysis of Escherichia coli K-12 gene deletions. 

BMC Bioinformatics 2000, 1:1. PubMed Abstract | BioMed Central Full Text | PubMed Central Full Text

  1. Varma A, Palsson BO: Metabolic Flux Balancing: Basic concepts, Scientific and Practical Use. 

Nat Biotechnol 1994, 12:994-998. Publisher Full Text

  1. Segre D, Vitkup D, Church GM: Analysis of optimality in natural and perturbed metabolic networks. 

Proc Natl Acad Sci USA 2002, 99(23):15112-15117. PubMed Abstract | Publisher Full Text | PubMed Central Full Text

  1. Baldi P, Brunak S, Chauvin Y, Andersen CA, Nielsen H: Assessing the accuracy of prediction algorithms for classification: an overview. 

Bioinformatics 2000, 16(5):412-424. PubMed Abstract | Publisher Full Text

  1. Price ND, Schellenberger J, Palsson BO: Uniform Sampling of Steady State Flux Spaces: Means to Design Experiments and to Interpret Enzymopathies. 

Biophysical Journal 2004, 87(4):2172-2186. PubMed Abstract | Publisher Full Text | PubMed Central Full Text

  1. Price ND, Thiele I, Palsson BO: Candidate states of Helicobacter pylori’s genome-scale metabolic network upon application of “loop law” thermodynamic constraints. 

Biophysical J 2006, 90(11):3919-3928. Publisher Full Text

  1. Schuetz R, Kuepfer L, Sauer U: Systematic evaluation of objective functions for predicting intracellular fluxes in Escherichia coli. 

Mol Syst Biol 2007, 3:119. PubMed Abstract | Publisher Full Text | PubMed Central Full Text

  1. Patil KR, Nielsen J: Uncovering transcriptional regulation of metabolism by using metabolic network topology. 

Proc Natl Acad Sci USA 2005, 102(8):2685-2689. PubMed Abstract | Publisher Full Text | PubMed Central Full Text

  1. Shannon P, Markiel A, Ozier O, Baliga NS, Wang JT, Ramage D, Amin N, Schwikowski B, Ideker T: Cytoscape: a software environment for integrated models of biomolecular interaction networks. 

Genome Res 2003, 13(11):2498-2504. PubMed Abstract | Publisher Full Text | PubMed Central Full Text

  1. Herrgard MJ, Swainston N, Dobson P, Dunn WB, Arga KY, Arvas M, Bluthgen N, Borger S, Costenoble R, Heinemann M, et al.: A consensus yeast metabolic network reconstruction obtained from a community approach to systems biology. 

Nat Biotech 2008, 26:1155-1160. Publisher Full Text

  1. Forster J, Famili I, Fu PC, Palsson BO, Nielsen J: Genome-Scale Reconstruction of the Saccharomyces cerevisiae Metabolic Network. 

Genome Research 2003, 13(2):244-253. PubMed Abstract | Publisher Full Text | PubMed Central Full Text

  1. Reed JL, Patel TR, Chen KH, Joyce AR, Applebee MK, Herring CD, Bui OT, Knight EM, Fong SS, Palsson BO: Systems Approach to Genome Annotation: Prediction and Validation of Metabolic Functions. 

Proc Natl Acad Sci USA 2006, 103(46):17480-17484. PubMed Abstract | Publisher Full Text | PubMed Central Full Text

  1. Nissen TL, Kielland-Brandt MC, Nielsen J, Villadsen J: Optimization of ethanol production in Saccharomyces cerevisiae by metabolic engineering of the ammonium assimilation. 

Metab Eng 2000, 2(1):69-77. PubMed Abstract | Publisher Full Text

  1. Roca C, Nielsen J, Olsson L: Metabolic engineering of ammonium assimilation in xylose-fermenting Saccharomyces cerevisiae improves ethanol production. 

Appl Environ Microbiol 2003, 69(8):4732-4736. PubMed Abstract | Publisher Full Text | PubMed Central Full Text

  1. Hartman JL IV: Buffering of deoxyribonucleotide pool homeostasis by threonine metabolism. 

Proc Natl Acad Sci USA 2007, 104(28):11700-11705. PubMed Abstract | Publisher Full Text | PubMed Central Full Text

  1. Gelling CL, Piper MD, Hong SP, Kornfeld GD, Dawes IW: Identification of a novel one-carbon metabolism regulon in Saccharomyces cerevisiae. 

J Biol Chem 2004, 279(8):7072-7081. PubMed Abstract | Publisher Full Text

  1. Denis V, Daignan-Fornier B: Synthesis of glutamine, glycine and 10-formyl tetrahydrofolate is coregulated with purine biosynthesis in Saccharomyces cerevisiae. 

Mol Gen Genet 1998, 259(3):246-255. PubMed Abstract | Publisher Full Text

  1. Hjortmo S, Patring J, Andlid T: Growth rate and medium composition strongly affect folate content in Saccharomyces cerevisiae. 

Int J Food Microbiol 2008, 123(1–2):93-100. PubMed Abstract | Publisher Full Text

  1. Kussmann MRF, Affolter M: OMICS-driven biomarker discovery in nutrition and health. 

J Biotechnol 2006, 124(4):758-787. PubMed Abstract | Publisher Full Text

  1. Serkova NJ, Niemann CU: Pattern recognition and biomarker validation using quantitative 1H-NMR-based metabolomics. 

Expert Rev Mol Diagn 2006, 6(5):717-731. PubMed Abstract | Publisher Full Text


Read Full Post »

Metabolomic analysis of two leukemia cell lines. II.

Larry H. Bernstein, MD, FCAP, Reviewer and Curator

Leaders in Pharmaceutical Intelligence


In Part I of metabolomics of two leukemia cell lines, we have established a major premise for the study, an insight into the use of an experimental model, and some insight into questions raised.

I here return to examine these before pursuing more detail in the study.

Q1. What strong metabolic pathways come into focus in this study?

Answer – The aerobic and anaerobic glycolytic pathways, with a difference measured in the extent of participation of mitochondrial oxidative phosphorylation.

Q2. Would we expect to also gain insight into the effect, on balance, played by a suppressed ubiquitin pathway?

Answer – lets look into this in Part II.

Q3. Would the synthesis of phospholipid and the maintenance of membrane structures requires availability of NADPH, which would be a reversal of the TCA cycle at the cost of delta G in catabolic energy, be consistent with increased dependence of anaerobic glycolysis  with unchecked replication?

Answer: Part II might show this, as the direction and the difference between the cell lines is consistent with a Warburg (Pasteur) effect.

Recall the observation that the model is based on experimental results from  lymphocytic leukemia cell lines in cell culture.  The internal metabolic state is inferred from measurement of external metabolites.

The classification of the lymphocytic leukemias in humans is based on T-cell and B-cell lineages, but actually uses cell differentiation (CD) markers on the cytoskeleton for recognition.  It is only a conjecture that if the cells line were highly anaplastic, they might not be sustainable in cell culture in perpetuity.
The analogue of these cells to what I would expect to see in humans is the SLL having the characteristic marking: CD5, see http://www.pathologyoutlines.com/topic/lymphomaSLL.html

Micro description
=======================================================

● Effacement of nodal architecture by pale staining pseudofollicles or proliferation centers with ill-defined borders, containing small round mature lymphocytes, prolymphocytes (larger than small lymphocytes, abundant basophilic cytoplasm, prominent nucleoli), paraimmunoblasts (larger cells with distinct nucleoli) and many smudge cells
● Pseudofollicular centers are highlighted by decreasing light through the condenser at low power; cells have pale cytoplasm but resemble soccer balls or smudge cells on peripheral smear (cytoplasm is bubbly in mantle cell lymphoma); may have plasmacytoid features
● May have marginal zone, perifollicular or interfollicular patterns, but these cases also have proliferation centers (Mod Pathol 2000;13:1161)
● Interfollicular pattern: large, reactive germinal centers; resembles follicular lymphoma but germinal centers are bcl2 negative and tumor cells resemble SLL by morphology and immunostains
(Am J Clin Path 2000;114:41)
● Paraimmunoblastic variant: diffuse proliferation of paraimmunoblasts (normally just in pseudoproliferation centers); rare, <30 reported cases; usually multiple lymphadenopathies and rapid disease progression; case report in 69 year old man (Hum Pathol 2002;33:1145); consider as mantile cell lymphoma if t(11;14)(q13;q32) is present; may also represent CD5+ diffuse large B cell lymphoma
● Bone marrow: small focal aggregates of variable size with irregular, poorly circumscribed outlines; lymphocytes are well differentiated, small, round with minimal atypia; may have foci of transformation; rarely has granulomas (J Clin Pathol 2005;58:815)
● Marrow infiltrative patterns are also described as diffuse (unmutated IgH genes, ZAP-70+, more aggressive), nodular (associated with IgH hypermutation, ZAP-70 negative) or mixed (variable mutation of IgH, variable ZAP-70, Hum Pathol 2006;37:1153)


Positive stains
=======================================================

● CD5, CD19, CD20 (dim), CD23, surface Ig light chain, surface IgM (dim)
● Also CD43, CD79a, CD79b (dim in 20%, Arch Pathol Lab Med 2003;127:561), bcl2
● Variable CD11c, FMC7 (42%)
Negative stains
=======================================================

● CD10, cyclin D1
Molecular
=======================================================

● Trisomy 12 (30%, associated with atypical CLL and CD79b), deletion 13q14 (25-50%),
deletion of 11q23 (worse prognosis, 10-20%)


Results

We set up a pipeline that could be used to

  • infer intracellular metabolic states from semi-quantitative data
  • regarding metabolites exchanged between cells and their environment.

Our pipeline combined the following four steps:

  1. data acquisition,
  2. data analysis,
  3. metabolic modeling and
  4.  experimental validation of
  • the model predictions (Fig. 1A).

We demonstrated the pipeline and the predictive potential

  • to predict metabolic alternations in diseases such as cancer
  • based on two lymphoblastic leukemia cell lines.

The resulting Molt-4 and CCRF-CEM condition-specific cell line models were able

  • to explain metabolite uptake and secretion
  •  by predicting the distinct utilization of central metabolic pathways by the two cell lines.

Whereas the CCRF-CEM model

  • resembled more a glycolytic, commonly referred to as ‘Warburg’ phenotype,
  • our predictions suggested  a more respiratory phenotype for the Molt-4  model.

We found these predictions to be in agreement with measured gene expression differences

  • at key regulatory steps in the central metabolic pathways, and
  • they were also consistent with  data regarding the energy and redox states of the cells.

After a brief discussion of the data generation and analysis steps, the results

  • derived from model generation and analysis will be described in detail.


2.1 Pipeline for generation of condition-specific metabolic cell line models

2.1.1 Generation of experimental data

We monitored the growth and viability of lymphoblastic leukemia cell lines in
serum- free medium (File S2, Fig. S1). Multiple omics  data sets  were derived  from these cells.

Extracellular metabolomics (exo-metabolomic) data,

  • comprising measurements of the metabolites in the spent medium of the cell cultures
    (Paglia et al. 2012a),
  • were collected along with transcriptomic data, and
  • these data sets were used to construct the models.


2.1.4 Condition-specific models for CCRF-CEM and Molt-4 cells

To determine whether we had obtained two distinct models,

  • we evaluated the reactions, metabolites, and genes of the two models.

Both the Molt-4 and CCRF-CEM models contained approximately

  • half of the reactions and metabolites present in the global model (Fig. 1C).

They were very similar to each other in terms of their

  • reactions,
  • metabolites, and
  • genes (File S1, Table S5A–C).

The Molt– 4 model contained

  • seven reactions that were not present in the CCRF-CEM model
    (Co-A biosynthesis pathway and exchange reactions).

In contrast, the CCRF-CEM  contained

31 unique reactions

  • arginine and proline metabolism,
  • vitamin B6  metabolism,
  • fatty acid activation,
  • transport, and exchange reaction.
  • There  were 2 and 15 unique metabolites in the Molt-4 and CCRF-CEM models,  respectively
    (File S1, Table S5B).
    Approximately three quarters of the global  model  genesremained in the condition-specific cell line models  (Fig. 1C).

The Molt-4 model contained

  • 15 unique genes, and

the CCRF-CEM model had

  • 4 unique genes (File S1, Table S5C).

Both models lacked NADH dehydrogenase
(complex I of the electron transport chain—ETC),

  •  determined by  the  absence of expression of a mandatory subunit
    (NDUFB3, Entrez gene ID 4709).

The ETC was fueled by FADH2 originating from

  1. succinate dehydrogenase and
  2. from fatty acid oxidation, which
  • through flavoprotein electron transfer
  • could contribute to the same ubiquinone pool as
  • complex I and complex II (succinate dehydrogenase).

Despite their different in vitro growth rates
(which differed by 11 %, see File S2, Fig. S1) and

  • differences in exo-metabolomic data (Fig. 1B) and
  • transcriptomic data,
  • the internal networks were largely conserved
  • in the two condition-specific cell line models.


2.1.5 Condition-specific cell line models predict distinct metabolic strategies

Despite the overall similarity of the metabolic models,

  • differences in their cellular uptake and secretion patterns suggested
  • distinct metabolic states in the two cell lines
    (Fig. 1B and see “Materials and methods” section for more detail).

To interrogate the metabolic differences, we sampled the solution space

  • of each model  using an Artificial Centering Hit-and-Run (ACHR) sampler (Thiele et al. 2005).

For this  analysis, additional constraints were applied, emphasizing

  • the  quantitative differences in commonly uptaken and secreted metabolites.

The  maximum possible uptake and maximum possible secretion flux rates were

  • reduced according to the measured relative differences between the cell lines
    (Fig. 1D, see “Materials and methods” section).

We plotted the number of sample points containing a particular flux rate for each reaction. The resulting

  • binned histograms can be understood as representing the probability that
  • a particular reaction can have a certain flux value.

A comparison of the sample points obtained for the Molt-4 and CCRF-CEM models revealed

  • a  considerable shift in the distributions, suggesting
  • a higher utilization of  glycolysis by the CCRF-CEM model (File S2, Fig. S2).

This result  was further  supported by differences

  • in medians calculated from sampling points (File S1,  Table S6).

The shift persisted throughout all reactions of the pathway and

  • was  induced by the higher glucose uptake (35 %) from
  • the extracellular medium in CCRF-CEM cells.

The sampling median for glucose uptake was 34 % higher

  • in the  CCRF-CEM model than in Molt-4 model (File S2, Fig. S2).

The usage of the  TCA cycle was also distinct in the two condition-specific cell-line models (Fig. 2).

  • the models used succinate dehydrogenase differently (Figs. 2, 3).

The Molt-4 model utilized an associated reaction to generate FADH2, whereas

  • in  the CCRF-CEM model, the histogram was shifted in the opposite direction,
  • toward  the generation of succinate.

Additionally, there was a higher efflux of  citrate toward

  • amino acid and lipid metabolism in the CCRF-CEM model (Fig. 2).

There was higher flux through anaplerotic and cataplerotic reactions

  • in the CCRF-CEM model than in the Molt-4 model (Fig. 2);
  • these reactions include the efflux  of citrate through


  1. ATP-citrate lyase,
  2. uptake of glutamine,
  3. generation of  glutamate from glutamine,
  4. transamination of pyruvate and
  5.  glutamate to alanine  and to 2-oxoglutarate,
  6. secretion of nitrogen, and
  7. secretion of alanine.

The Molt-4 model showed higher utilization of oxidative phosphorylation (Fig. 3),

  • supported by elevated median flux through ATP synthase (36 %) and other  enzymes,
  • which contributed to higher oxidative metabolism.

The sampling  analysis therefore revealed different usage of

  • central metabolic pathways by the condition-specific models.


Fig. 2

Differences in the use of the TCA cycle by the CCRF-CEM

Differences in the use of the TCA cycle by the CCRF-CEM

Differences in the use of the TCA cycle by the CCRF-CEM model (red) and the Molt-4 model (blue).
The table provides the median values of the sampling results. Negative values in histograms and Table

  • describe reversible  reactions with flux in the reverse direction.

There are multiple reversible  reactions for the transformation of

  1. isocitrate and α-ketoglutarate,
  2. malate and  fumarate, and
  3. succinyl-CoA and succinate.

These reactions are  unbounded,  and therefore histograms are not shown.
The details of participating cofactors  have been removed.

Atp ATP, cit citrate, adp ADP, pi phosphate, oaa oxaloacetate, accoa acetyl-CoA, coa coenzyme-A,
icit isocitrate, αkg α-ketoglutarate, succ–coa succinyl-CoA, succ succinate, fumfumarate, mal malate,
oxa oxaloacetate,  pyr pyruvate, lac lactate, ala alanine, gln glutamine, ETC electron transport  chain.


Electronic supplementary material The online version of this article
http://dx.doi.org:/10.1007/s11306-014-0721-3 
contains supplementary material,  which  is available to authorized users.

  1.  K. Aurich _ G. Paglia _ O ´ . Rolfsson _ S. Hrafnsdo´ ttir _
  2. Magnu´sdo´ ttir _ B. Ø. Palsson _ R. M. T. Fleming _ I. Thiele. Center for Systems Biology,
    University of Iceland, Reykjavik, Iceland
  3.  K. Aurich _ R. M. T. Fleming _ I. Thiele (&). Luxembourg Centre for Systems Biomedicine,
    University of Luxembourg, Campus Belval, Esch-Sur-Alzette, Luxembourg
    e-mail: ines.thiele@uni.lu
  4. M. Stefaniak. School of Health Science, Faculty of Food Science and Nutrition,
    University of Iceland, Reykjavik, Iceland
  5. Ø. Palsson. Department of Bioengineering, University of California San Diego, La Jolla, CA, USA

http://link.springer.com/static-content/images/404/art%253A10.1007%252
Fs11306-014-0721-3/MediaObjects/11306_2014_721_Fig3_HTML.gif


Fig. 3

Fatty acid oxidation and ETC _Fig3

Fatty acid oxidation and ETC _Fig3


Sampling reveals different utilization of oxidative phosphorylation by the

  • generated models.

Different distributions are observed for the CCRF-CEM model (red) and the Molt-4 model (blue).

  • Molt-4 has higher  median  flux through ETC reactions II–IV.

The table provides the median values  of the sampling results. Negative values in the histograms and in the table describe

  • reversible reactions with flux in the reverse direction.

Both models lack Complex I of the ETC because of constraints

  • arising from the mapping of transcriptomic data.

Electron transfer flavoprotein and

  • electron transfer flavoprotein–ubiquinone oxidoreductase
  •  both also carry higher flux in the Molt-4 model


2.1.6 Experimental validation of energy and redox status of CCRF-CEM and Molt-4 cells

Cancer cells have to balance their needs

  •  for energy and biosynthetic precursors, and they have
  • to maintain redox homeostasis to proliferate (Cairns et al. 2011).

We conducted enzymatic assays of cell lysates to measure levels and/or ratios of

  • ATP,
  • NADPH + NADP,
  • NADH + NAD, and
  • glutathione.

These measurements were used to provide support for

  • the in silico predicted metabolic differences (Fig. 4).

Additionally, an Oxygen Radical Absorbance Capacity (ORAC) assay was used

  • to evaluate the cellular antioxidant status (Fig. 4B).

Total concentrations of NADH + NAD, GSH + GSSG, NADPH + NADP and ATP, were higher in Molt-4 cells  (Fig. 4A).

The higher ATP concentration in Molt-4 cells could either result from

  • high production rates, or intracellular  accumulation connected to high or
  • low reactions fluxes (Fig. 4A).

Our simplified view that oxidative Molt-4 produces less ATP and was contradicted by

  • the higher ATP concentrations measured (Fig. 4L).

Yet we want to emphasize that concentrations

  • cannot be compared to flux values,
  • since we are modeling at steady-state.

NADH/NAD+ ratios for both cell lines were shifted toward NADH (Fig. 4D, E), but

  • the shift toward NADH was more pronounced in CCRF-CEM (Fig. 4E),
  • which matched  our expectation based on the higher utilization of
  • glycolysis and 2-oxoglutarate  dehydrogenase in the CCRF-CEM model (Fig. 4L).


Fig. 4 (not shown)

A–K  Experimentally determined ATP, NADH + NAD, NADPH + NADP, and GSH + GSSG concentrations, and ROS detoxification in the CCRF-CEM and Molt-4 cells.

L Expectations for cellular energy and redox states. Expectations are based on predicted metabolic differences of the Molt-4 and CCRF-CEM models

2.1.7 Comparison of network utilization and alteration in gene expression

With the assumption that

  • differential expression of particular genes would cause reaction flux changes,

we determined how the differences in gene expression (between CCRF-CEM and Molt-4)

  • compared to the flux differences observed in the  models.

Specifically, we checked whether the reactions associated with genes upregulated
(significantly more expressed in CCRF-CEM cells compared to Molt-4  cells)

  • were indeed more utilized by the CCRF-CEM model,

and we  checked  whether downregulated genes

  • were associated with reactions more utilized by the Molt-4 model.

The set of downregulated genes was associated with 15 reactions, and

  • the set of 49 upregulated genes was associated with 113 reactions in the models.

Reactions were defined as differently utilized

  • if the difference in flux exceeded 10 % (considering only non-loop reactions).

Of the reactions associated with upregulated genes,

  • 72.57 % were more utilized by the CCRF-CEM model, and
  • 2.65 % were more utilized by the Molt-4 model (File S1, Table S7).

In contrast, all 15 reactions associated with the 12 downregulated genes

  • were more utilized in the CCRF-CEM model (File S1, Table S8).

After this initial analysis, we approached the question from a different angle, asking

  • whether the majority of the reactions associated with each individual gene
  • upregulated in CCRF-CEM were more utilized by the CCRF-CEM model.
  •  this was the case for 77.55 % of the upregulated genes.

The majority of reactions associated with two (16.67 %) downregulated genes

  • were more utilized by the Molt-4 model.

Taken together, our comparisons of the

  • direction of gene expression with the fluxes of the two cancer cell-line models
  • confirmed that reactions associated with upregulated genes in the CCRF-CEM
    cells were generally more utilized by the CCRF-CEM model.

2.1.8 Accumulation of DEGs and AS genes at key metabolic steps

After we confirmed that most reactions associated with upregulated genes

  • were more utilized by the CCRF-CEM model,

we checked the locations of DEGs within the network. In this analysis, we paid special attention to

  • the central metabolic pathways that we had found
  • to be distinctively utilized by the two models.

Several DEGs and AS events were associated with

  • glycolysis,
  • the ETC,
  • pyruvate metabolism, and
  • the PPP (Table 1).


Table 1

DEGs and AS events of central metabolic and cancer-related pathways

Full lists of DEGs and AS are provided in the supplementary material.

Upregulated significantly more expressed in CCRF-CEM compared to Molt-4 cells

PPP pentose phosphate pathway, OxPhos oxidative phosphorylation, Glycolysis/gluconglycolysis/gluconeogenesis, Pyruvate met. pyruvate metabolism

Moreover, in glycolysis, the DEGs and/or AS genes

  • were associated with all three rate-limiting steps, i.e., the steps mediated by
  1. hexokinase,
  2. pyruvate kinase, and
  3. phosphofructokinase.

Of these key enzymes,

  • hexokinase 1 (Entrez Gene ID: 3098) was alternatively spliced,
  • pyruvate kinase (PKM, Entrez gene ID: 5315) was significantly more
    expressed in the CCRF-CEM cells (Table 1),

in agreement with the higher in silico predicted flux.

However, in contrast to the observed

  • higher utilization of glycolysis in the CCRF-CEM model,
  • the gene associated with the rate-limiting glycolysis step, phosphofructokinase (Entrez Gene ID: 5213),
  • was significantly upregulated in Molt-4 cells relative to CCRF-CEM cells.

This higher expression was detected for only a single isozyme, however. Two of
the three genes associated with phosphofructokinase were also subject to
alternative splicing (Table 1). In addition to the key enzymes, fructose
bisphosphate aldolase (Entrez Gene ID: 230) was also significantly

  • upregulated in Molt-4 cells relative to CCRF-CEM cells,
  • in contrast to the predicted higher utilization of glycolysis in the CCRF-CEM model.

Additionally, glucose-6P-dehydrogenase (G6PD), which catalyzes

  • the first reaction and committed step of the PPP,
  • was an AS gene (Table 1).

A second AS gene associated with

  •  the PPP reaction of the deoxyribokinase
  • was RBKS (Entrez Gene ID: 64080).

This gene is also associated with ribokinase, but ribokinase was removed

  • because of the lack of ribose uptake or secretion.

Single AS genes were associated with different complexes of the ETC (Table 1).

Literature query revealed that at least 13 genes associated with alternative

  • splicing events were mentioned previously in connection with both alternative
    splicing and cancer (File S1, Table S14), and
  • 37 genes were associated with cancer, e.g., upregulated, downregulated at the
    level of mRNA or protein, or otherwise
  • connected to cancer metabolism and signaling.

One general observation was that there was a surprising

  • accumulation of metabolite transporters among the AS.

Overall, the high incidence of

  • differential gene expression events at metabolic control points
  • increases the plausibility of the in silico predictions.


2.1.9 Single gene deletion

Analyses of essential genes in metabolic models have been used

  • to predict candidate drug targets for cancer cells (Folger et al. 2011).

Here, we conducted an in silico gene deletion study for all model genes to identify

  • a unique set of knock-out (KO) genes
  • for each condition-specific cell line model.

The analysis yielded 63 shared lethal KO genes and

  • distinct sets of KO genes for the CCRF-CEM model (11 genes) and the Molt-4 model (3 genes).

For three of the unique CCRF-CEM KO genes,

  • the genes were only present in the CCRF-CEM model (File S1, Table S9).


The essential genes for both models were then

  • related to the cell-line-specific differences in metabolite uptake and secretion (Fig. 1B).

The CCRF-CEM model

  1. needed to generate putrescine from ornithine
    (ORNDC, Entrez Gene ID: 4953)
  2. to subsequently produce 5-methylthioadenosine for secretion (Fig. 1B).
  3. S-adenosylmethioninamine produced by adenosylmethionine decarboxylase
    (arginine and proline metabolism, associated with Entrez Gene ID: 262)
  • is a substrate required for generation of 5-methylthioadenosine.

Another example of a KO gene connected to an enforced exchange reaction was

  • glutamic-oxaloacetic transaminase 1 (GOT1, Entrez Gene ID: 2805).

Without GOT1, the CCRF-CEM model was forced to secrete

  • 4-hydroxyphenylpyruvate (Fig. 1B),
  • the second product of tyrosine transaminase,
  • which is produced only by that enzyme.


One KO gene in the Molt-4 model (Entrez Gene ID: 26227) was associated with

  • phosphoglycerate dehydrogenase (PGDH),
  • which catalyzes the conversion of 3-phospho-d-glycerate to 3-phosphohydroxypyruvate
  • while generating NADH from NAD+.

This KO gene is particularly interesting, given

  • the involvement of this reaction in a novel pathway for ATP generation in rapidly proliferating cells
    (Locasale et al. 2011; Vander Heiden 2011; Vazquez et al. 2011).

Reactions associated with unique KO genes were in many cases utilized more by the model, in which

  • the gene KO was lethal,
  • underlining the potential importance of these reactions for the models.

Thus, single gene deletion provided unique sets of lethal genes that could be

  • specifically targeted to kill these cells.


3 Discussion

In the current study, we explored the possibility of

  • semi-quantitatively integrating metabolomic data with
  • the human genome-scale reconstruction to facilitate analysis.

By constructing condition-specific cell line models

  • to provide a structured framework,
  • we derived insights that could not have been obtained from data analysis alone.

We derived condition-specific cell line models

  • for CCRF-CEM and
  • Molt-4 cells

that were able to explain the observed exo-metabolomic differences (Fig. 1B).

Despite the overall similarities between the models, the analysis revealed

  • distinct usage of central metabolic pathways (Figs. 2, 3, 4),
  • which we validated based on experimental data and
  • differential gene expression.

The additional data sufficiently supported

  • metabolic differences in the cell lines,
  • providing confidence in the generated models and the model-based predictions.

We used the validated models

  • to predict unique sets of lethal genes
  • to identify weak links in each model.

These weak links may represent potential drug targets.

Integrating omics data with the human genome-scale reconstruction

  • provides a structured framework (i.e., pathways)
  • that is based on careful consideration of the available biochemical literature
    (Thiele and Palsson2010).

This network context can simplify omics data analysis, and

  • it allows even non-biochemical experts
  • to gain fast and comprehensive insights
  • into the metabolic aspects of omics data sets.

Compared to transcriptomic data,

  • methods for the integration and analysis of metabolomic data
  • in the context of metabolic models are less well established,

although it is an active field of research (Li et al. 2013; Paglia et al. 2012b).
In contrast to other studies, our approach emphasizes

  • the representation of experimental conditions rather than
  • the reconstruction of a generic, cell-line-specific network,
  • which would require the combination of data sets from
  • many experimental conditions and extensive manual curation.

Rather, our way of model construction allowed us to efficiently

  • assess the metabolic characteristics of cells.

Despite the fact, that only a limited number of exchanged metabolites can be

  • measured by available metabolomics platforms and
  • at reasonable time-scale,

and that pathways of measured metabolites might still be unknown to date
(File S1, Tables S2–S3), our methods have the potential

  • to reveal metabolic characteristics of cells
  • which could be useful for biomedicine and personalized health.

The reasons why some cancers respond to certain treatments and not others
remain unclear, and choosing a treatment for a specific patient is often difficult
(Vander Heiden 2011). One potential application of our approach could be the
characterization of cancer phenotypes to explore how cancer cells or other cell
types

  • with particular metabolic characteristics respond to drugs.

The generation of our condition-specific cell line models involved

  • only limited manual curation,
  • making this approach a fast way to place metabolomic data
  • into a network context.

Model building mainly involves

  • the rigid reduction of metabolite exchanges
  • to match the observed metabolite exchange pattern
  • with as few additional metabolite exchanges as possible.

It should be noted that this reduction determines,

  • which pathways can be utilized by the model.

Our approach mostly conserved the internal network redundancy. However, a

  • more significant reduction may be achieved using different data.

Generally, a trade-off exists between the reduction of the internal network and

  • the increasing number of network gaps that need to be curated
  • by using additional omics data, such as transcriptomics and proteomics.

One way to prevent the emergence of network gaps would be

  • to use mapping algorithms that conserve network functionality,
    such as GIMME (Becker and Palsson 2008).

However, several additional methods exist for the integration of
transcriptomic data (Blazier and Papin 2012), and

  • which model-building method is best depends on the available data.

Interestingly, the lack of a significant contribution of our

  • gene expression data to the reduction of network size
  • suggests that the use of transcriptomic data is not necessary
  • to identify distinct metabolic strategies;
  • rather, the integration of exo-metabolomic data alone
    may provide sufficient insight.

However, sampling of the cell line models constrained

  • according to the exo-metabolomic profiles only, or
  • increasing the cutoff for the generation of absent and present calls (p < 0.01),
  • did not yield the same insights as presented herein (File S1, Table S18).

Only recently Gene Inactivation Moderated by Metabolism, Metabolomics and
Expression (GIM(3)E) became available, which

  • enforces minimum turnover of detected metabolites
  • based on intracellular metabolomics data as well as
  • gene expression microarray data (Schmidt et al. 2013).

In contrast to this approach, we emphasized our analysis on the

  • relative differences in the exo-metabolomic data of two cell lines.

GIM(3)E constitutes another integration method when the analysis should be

  • emphasized on intracellular metabolomics data (Schmidt et al. 2013).

The metabolic differences predicted by the models are generally plausible.
Cancers are known to be heterogeneous (Cairns et al. 2011), and

  • the contribution of oxidative phosphorylation to cellular ATP production
    may vary (Zu and Guppy 2004).

Moreover, leukemia cell lines have been shown

  • to depend on glucose, glutamine, and fatty acids to varying extents
  • to support proliferation.

Such dependence may cause the cells to adapt their metabolism

  • to the environmental conditions (Suganuma et al. 2010).

In addition to identifying supporting data in the literature, we performed

  • several analyses to validate the models and model predictions.

Our expectations regarding the levels and ratios of metabolites

  • relevant to energy and redox state were largely met (Fig. 4L).

The more pronounced shift of the NADH/NAD+ ratio

  • toward NADH in the CCRF-CEM cells
  • was in agreement with the predicted Warburg phenotype (Fig. 4),
  • and the higher lactate secretion in the CCRF-CEM cells (File S2, Fig. S2)
  • implies an increase in NADH relative to NAD+
    (Chiarugi et al. 2012; Nikiforov et al. 2011), again
  • matching the known Warburg phenotype.

ROS production is enhanced in certain types of cancer (Droge 2002; Ha et al. 2000), and

  • the generation of ROS is thought to contribute to
  1. mutagenesis,
  2. tumor promotion, and
  3. tumor progression (Dreher and Junod1996; Ha et al. 2000).

However, decreased mitochondrial glucose oxidation and

  • a transition to aerobic glycolysis
  • protect cells against ROS damage during biosynthesis and cell division
    (Brand and Hermfisse1997).

The higher ROS detoxification capability in Molt-4 cells, in combination with

  • higher spermidine dismutase utilization by the Molt-4 model (Fig. 4),
  • provided a consistent picture of the predicted respiratory phenotype (Fig. 4L).

Control of NADPH maintains the redox potential through GSH and

  • protects against oxidative stress, yet
  • changes in the NADPH ratio in response to oxidative damage
  • are not well understood (Ogasawara et al.2009).

Under stress conditions, as assumed for Molt-4 cells,

  • the NADPH/NADP+ ratio is expected to decrease because of
  • the continuous reduction of GSSG (Fig. 4L), and
  • this was confirmed in the Molt-4 cells (Fig. 4).

The higher amounts of GSH found in Molt-4 cells in vitro may demonstrate

  • an additional need for ROS scavengers because of
  • a greater reliance on oxidative metabolism.

Cancer is related to metabolic reprogramming, which results from

  • alterations of gene expression and
  • the expression of specific isoforms or
  • splice forms to support proliferation
    (Cortes-Cros et al. 2013; Marin-Hernandez et al. 2009).

The gene expression differences detected between the two cell lines in this study
supported the existence of

  • metabolic differences in these cell lines, particularly because
  • key steps of the metabolic pathways central to cancer metabolism
  • seemed to be differentially regulated (Table 1).

The detailed analysis of the respective

  • differences on the pathway fluxes exceeds the scope of this study, which was to
  • demonstrate the potential of the integration of exo-metabolomic data into the network context.

We found discrepancies between differential gene regulation and

  • the flux differences between the two models as well as
  • the utilization AS gene-associated reaction.

This is not surprising, since analysis of the detailed system is required

  • to make any further assumptions on the impact that
  • the differential regulation or splicing might have on the reaction flux,
  • given that for many of the concerned enzymes isozymes exist, or
  • only one of multiple subunits of a protein complex was concerned.

Additionally, reaction fluxes are regulated by numerous post-translational factors, e.g.,

  • protein modification,
  • inhibition through proteins or metabolites,
  • alter reaction fluxes (Lenzen 2014),

which are out of the scope of constraint-based steady-state modeling.

Rather, the results of the presented  approach

  • demonstrate how the models can be used to generate
  • informed hypothesis that can guide experimental work.

The combination of our tailored metabolic models and

  • differential gene expression analysis seems well-suited
  • to determine the potential drivers
  • involved in metabolic differences between cells.

Such information could be valuable for drug discovery, especially when more

  • peripheral metabolic pathways are considered.

Statistical comparisons of gene expression data with sampling-derived flux data

  • could be useful in future studies (Mardinoglu et al. 2013).

A single-gene-deletion analysis revealed that PGDH was

  • a lethal KO gene for the Molt-4 model only.

Differences in PGDH protein levels

  • correspond to the amount of glycolytic carbon
  • diverted into glycine biosynthesis.

Rapidly proliferating cells may use an

  • alternative glycolytic pathway for ATP generation,
  • which may provide an advantage in the case of
  • extensive oxidative phosphorylation and proliferation
    (Locasale et al.2011; Vander Heiden 2011; Vazquez et al. 2011).

For breast cancer cell lines, variable dependency on

  • the expression of PGDH has already been demonstrated
    (Locasale et al. 2011).

This example of a unique KO gene demonstrates how

  • in silico gene deletion in metabolomics-driven models
  • can identify the metabolic pathways used by cancer cells.

This approach can provide valuable information for drug discovery.

In conclusion, our contextualization method produced

  • metabolic models that agreed in many ways with the validation data sets.

The analyses described in this study have great potential to reveal

  • the mechanisms of metabolic reprogramming,
  • not only in cancer cells but also in other cells affected by diseases, and
  • for drug discovery in general.


…

4.3 Analysis of the extracellular metabolome

Mass spectrometry analysis of the exo-metabolome was performed by
Metabolon®, Inc. (Durham, NC, USA) using a standardized analytical platform.
In total, 75 extracellular metabolites were detected in the initial data set for at
least 1 of the 2 cell lines (Paglia et al. 2012a). Of these metabolites, 15 were not
part of our global model and were discarded. Apart from being absent in our
global model, an independent search in HMDB (Wishart et al. 2013) revealed no
pathway information was available for most of these metabolites (File S1, Tables S2–S3).
It should be noted that metabolites e.g.,

  • N-acetylisoleucine,
  • N-acetyl-methionine or pseudouridine,

constitute protein and RNA degradation products, which were out of the scope
of the metabolic network.

Thiamin (Vitamin B1) was part of the minimal medium of essential compounds
supplied to both models.Riboflavin (Vitamin B2) and Trehalose were excluded
since these compounds cannot be produced by human cells. Erythrose and
fructose were also excluded. In contrast 46 metabolites that were part of the
global model. The data set included two different time points, which allowed us
to treat the increase/decrease of a metabolite signal between time points as

  • evidence for uptake or secretion when the change was greater than 5 %
    from what was observed in the control (File S1, Tables S2–S3).

We found 12 metabolites that were taken up by both cell lines and
10 metabolites that were commonly secreted by both cell lines over
the course of the experiment.

Molt-4 cells took up three metabolites not taken up by CCRF-CEM cells, and
secreted one metabolite not secreted by CCRF-CEM cells. Two of the three
uniquely uptaken metabolites were essential amino acids:

  1. valine and
  2. methionine.

It is unlikely that these metabolites were not taken up by the CCRF-CEM cells,
and the CCRF-CEM model was allowed to take up this metabolite. Therefore,
no quantitative constraints were applied for the sampling analysis either.
CCRF-CEM cells had

  • four unique uptaken
  • and seven unique secreted metabolites
    (exchange not detected in Molt-4 cells).


4.4 Network refinement based on exo-metabolic data

Despite its comprehensiveness, the human metabolic reconstruction is

  • not complete with respect to extracellular metabolite transporters
    (Sahoo et al. 2014; Thiele et al. 2013).

Accordingly, we identified metabolite transport systems

  • from the literature for metabolites that were already part of the global model,
  • but whose extracellular transport was not yet accounted for.

Diffusion reactions were included whenever a respective transporter could not be identified.

In total, 34 reactions [11 exchange reactions, 16 transport reactions and 7 demand reactions
(File S1, Table S11)] were added to Recon 2 (Thiele et al. 2013), and 2 additional reactions
were added to the global model (File S1, Table S10).

4.5 Expression profiling

Molt-4 and CCRF-CEM cells were grown in advanced RPMI 1640 and 2 mM
GlutaMax, and the cells were resuspended in medium containing DMSO
(0.67 %) at a concentration of 5 × 105 cells/mL. The cell suspension (2 mL)
was seeded in 12-well plates in triplicate. After 48 h of growth, the cells
were collected by centrifugation at 201×g for 5 min. Cell pellets were snap-frozen
in liquid N2 and kept frozen until RNA extraction and analysis by Aros
(Aarhus, Denmark).

4.6 Analysis of transcriptomic data

We used the Affymetrix GeneChip Human Exon 1.0 ST Array to measure whole
genome exon expression. We generated detection above background (DABG) calls
using ROOT (version 22) and the XPS package for R (version 11.1), with Robust
Multi-array Analysis summarization. Calls for data mapping were assigned based
on p < 0.05 as the cutoff probability to distinguish presence versus absence for
the 1,278 model genes (File S1, Table S12).

Differential gene expression and alternative splicing analyses were performed by
using AltAnalyse software (v2.02beta) with default options on the raw data files
(CEL files). The Homo sapiens Ensemble 65 database was used, probe set filtering
was kept as DABG p < 0.05, and non-log expression < 70 was used for
constitutive probe sets to determine gene expression levels. For the comparison,
CCRF-CEM was the experimental group and Molt-4 was the baseline group. The
set of DEGs between cell lines was identified based on a p < 0.05 FDR cutoff
(File S1, Table S13A–B). Alternative splicing analysis was performed on core probe sets
with a minimum alternative exon score of 2 and a maximum absolute gene
expression change of 3 because alternative splicing is a less critical factor among
highly DEGs (File S1, Table S14). Gene expression data, complete lists of DABG p-values,
DEGs and alternative splicing events have been deposited in the Gene
Expression Omnibus
 (GEO) database (Accession number: GSE53123).


4.7 Deriving cell-type-specific subnetworks

Transcriptomic data were mapped to the model in a manual fashion (COBRA
function: deleteModelGenes). Specifically, reactions dependent on gene products
that were called as “absent” were constrained to zero, such that fluxes through
these reactions were disabled. Submodels were extracted based on the set of
reactions carrying flux (network pruning) by running fastFVA
(Gudmundsson and Thiele 2010) after mapping the metabolomic and
transcriptomic data using the COBRA toolbox (Schellenberger et al. 2011).


…..


Electronic supplementary material

Below is the link to the electronic supplementary material.

File S1. Supplementary material 1 (XLSX 915 kb)

File S2. Supplementary material 2 (DOCX 448 kb)

References

Antonucci, R., Pilloni, M. D., Atzori, L., & Fanos, V. (2012). Pharmaceutical research and metabolomics in the newborn. Journal of Maternal-Fetal and Neonatal Medicine, 25, 22–26.PubMedCrossRef

Barrett, T., Troup, D. B., Wilhite, S. E., Ledoux, P., Evangelista, C., Kim, I. F., et al. (2011). NCBI GEO: archive for functional genomics data sets—10 years on. Nucleic Acids Research, 39, D1005–D1010.PubMedCentralPubMedCrossRef

Beck, M., Schmidt, A., Malmstroem, J., Claassen, M., Ori, A., Szymborska, A., et al. (2011). The quantitative proteome of a human cell line.Molecular Systems Biology, 7, 549.PubMedCentralPubMedCrossRef

Becker, S. A., & Palsson, B. O. (2008). Context-specific metabolic networks are consistent with experiments. PLoS Computational Biology, 4, e1000082.PubMedCentralPubMedCrossRef

Blazier, A. S., & Papin, J. A. (2012). Integration of expression data in genome-scale metabolic network reconstructions. Frontiers in Physiology, 3, 299.PubMedCentralPubMedCrossRef

Bordbar, A., Lewis, N. E., Schellenberger, J., Palsson, B. O., & Jamshidi, N. (2010). Insight into human alveolar macrophage and M. tuberculosisinteractions via metabolic reconstructions. Molecular Systems Biology, 6, 422.PubMedCentralPubMedCrossRef

Bordbar, A., & Palsson, B. O. (2012). Using the reconstructed genome-scale human metabolic network to study physiology and pathology. Journal of Internal Medicine, 271, 131–141.PubMedCentralPubMedCrossRef

Brand, K. A., & Hermfisse, U. (1997). Aerobic glycolysis by proliferating cells: a protective strategy against reactive oxygen species. FASEB Journal, 11, 388–395.PubMed

Cairns, R. A., Harris, I. S., & Mak, T. W. (2011). Regulation of cancer cell metabolism. Nature Reviews Cancer, 11, 85–95.PubMedCrossRef

Chance, B., Sies, H., & Boveris, A. (1979). Hydroperoxide metabolism in mammalian organs. Physiological Reviews, 59, 527–605.PubMed

Chapman, E. H., Kurec, A. S., & Davey, F. R. (1981). Cell volumes of normal and malignant mononuclear cells. Journal of Clinical Pathology, 34, 1083–1090.PubMedCentralPubMedCrossRef

Chiarugi, A., Dolle, C., Felici, R., & Ziegler, M. (2012). The NAD metabolome—a key determinant of cancer cell biology. Nature Reviews Cancer, 12, 741–752.PubMedCrossRef

Cortes-Cros, M., Hemmerlin, C., Ferretti, S., Zhang, J., Gounarides, J. S., Yin, H., et al. (2013). M2 isoform of pyruvate kinase is dispensable for tumor maintenance and growth. Proceedings of the National Academy of Sciences of the United States of America, 110, 489–494.PubMedCentralPubMedCrossRef

Dreher, D., & Junod, A. F. (1996). Role of oxygen free radicals in cancer development. European Journal of Cancer, 32a, 30–38.PubMedCrossRef

Droge, W. (2002). Free radicals in the physiological control of cell function. Physiological Reviews, 82, 47–95.PubMed

Duarte, N. C., Becker, S. A., Jamshidi, N., Thiele, I., Mo, M. L., Vo, T. D., et al. (2007). Global reconstruction of the human metabolic network based on genomic and bibliomic data. Proceedings of the National Academy of Sciences of the United States of America, 104, 1777–1782.PubMedCentralPubMedCrossRef

Durot, M., Bourguignon, P. Y., & Schachter, V. (2009). Genome-scale models of bacterial metabolism: Reconstruction and applications. FEMS Microbiology Reviews, 33, 164–190.PubMedCentralPubMedCrossRef

Fleming, R. M., Thiele, I., & Nasheuer, H. P. (2009). Quantitative assignment of reaction directionality in constraint-based models of metabolism: Application to Escherichia coli. Biophysical Chemistry, 145, 47–56.PubMedCentralPubMedCrossRef

Folger, O., Jerby, L., Frezza, C., Gottlieb, E., Ruppin, E., & Shlomi, T. (2011). Predicting selective drug targets in cancer through metabolic networks. Molecular Systems Biology, 7, 501.PubMedCentralPubMedCrossRef

Frezza, C., Zheng, L., Folger, O., Rajagopalan, K. N., MacKenzie, E. D., Jerby, L., et al. (2011). Haem oxygenase is synthetically lethal with the tumour suppressor fumarate hydratase. Nature, 477, 225–228.PubMedCrossRef

Ganske, F., & Dell, E. J. (2006). ORAC assay on the FLUOstar OPTIMA to determine antioxidant capacity. BMG LABTECH.

Gudmundsson, S., & Thiele, I. (2010). Computationally efficient flux variability analysis. BMC Bioinformatics, 11, 489.PubMedCentralPubMedCrossRef

Ha, H. C., Thiagalingam, A., Nelkin, B. D., & Casero, R. A, Jr. (2000). Reactive oxygen species are critical for the growth and differentiation of medullary thyroid carcinoma cells. Clinical Cancer Research, 6, 3783–3787.PubMed

Hyduke, D. R., Lewis, N. E., & Palsson, B. O. (2013). Analysis of omics data with genome-scale models of metabolism. Molecular BioSystems, 9, 167–174.PubMedCentralPubMedCrossRef

Jerby, L., & Ruppin, E. (2012). Predicting drug targets and biomarkers of cancer via genome-scale metabolic modeling. Clinical Cancer Research,18, 5572–5584.PubMedCrossRef

Jerby, L., Shlomi, T., & Ruppin, E. (2010). Computational reconstruction of tissue-specific metabolic models: Application to human liver metabolism.Molecular Systems Biology, 6, 401.PubMedCentralPubMedCrossRef

Jerby, L., Wolf, L., Denkert, C., Stein, G. Y., Hilvo, M., Oresic, M., et al. (2012). Metabolic associations of reduced proliferation and oxidative stress in advanced breast cancer. Cancer Research, 72, 5712–5720.PubMedCrossRef

Lenzen, S. (2014). A fresh view of glycolysis and glucokinase regulation: History and current status. Journal of Biological Chemistry, 289, 12189–12194.PubMedCrossRef

Lewis, N. E., Nagarajan, H., & Palsson, B. O. (2012). Constraining the metabolic genotype–phenotype relationship using a phylogeny of in silico methods. Nature Reviews Microbiology, 10, 291–305.PubMedCentralPubMed

Lewis, N. E., Schramm, G., Bordbar, A., Schellenberger, J., Andersen, M. P., Cheng, J. K., et al. (2010). Large-scale in silico modeling of metabolic interactions between cell types in the human brain. Nature Biotechnology, 28, 1279–1285.PubMedCentralPubMedCrossRef

Li, S., Park, Y., Duraisingham, S., Strobel, F. H., Khan, N., Soltow, Q. A., et al. (2013). Predicting network activity from high throughput metabolomics. PLoS Computational Biology, 9, e1003123.PubMedCentralPubMedCrossRef

Locasale, J. W., Grassian, A. R., Melman, T., Lyssiotis, C. A., Mattaini, K. R., Bass, A. J., et al. (2011). Phosphoglycerate dehydrogenase diverts glycolytic flux and contributes to oncogenesis. Nature Genetics, 43, 869–874.PubMedCentralPubMedCrossRef

Mardinoglu, A., Agren, R., Kampf, C., Asplund, A., Nookaew, I., Jacobson, P., et al. (2013). Integration of clinical data with a genome-scale metabolic model of the human adipocyte. Molecular Systems Biology, 9, 649.PubMedCentralPubMedCrossRef

Marin-Hernandez, A., Gallardo-Perez, J. C., Ralph, S. J., Rodriguez-Enriquez, S., & Moreno-Sanchez, R. (2009). HIF-1alpha modulates energy metabolism in cancer cells by inducing over-expression of specific glycolytic isoforms. Mini Reviews in Medicinal Chemistry, 9, 1084–1101.PubMedCrossRef

Mir, M., Wang, Z., Shen, Z., Bednarz, M., Bashir, R., Golding, I., et al. (2011). Optical measurement of cycle-dependent cell growth. Proceedings of the National Academy of Sciences of the United States of America, 108, 13124–13129.PubMedCentralPubMedCrossRef

Mo, M. L., Palsson, B. O., & Herrgard, M. J. (2009). Connecting extracellular metabolomic measurements to intracellular flux states in yeast. BMC Systems Biology, 3, 37.PubMedCentralPubMedCrossRef

Nikiforov, A., Dolle, C., Niere, M., & Ziegler, M. (2011). Pathways and subcellular compartmentation of NAD biosynthesis in human cells: From entry of extracellular precursors to mitochondrial NAD generation. The Journal of biological chemistry, 286, 21767–21778.PubMedCentralPubMedCrossRef

Ogasawara, Y., Funakoshi, M., & Ishii, K. (2009). Determination of reduced nicotinamide adenine dinucleotide phosphate concentration using high-performance liquid chromatography with fluorescence detection: Ratio of the reduced form as a biomarker of oxidative stress. Biological & Pharmaceutical Bulletin, 32, 1819–1823.CrossRef

Paglia, G., Hrafnsdottir, S., Magnusdottir, M., Fleming, R. M., Thorlacius, S., Palsson, B. O., et al. (2012a). Monitoring metabolites consumption and secretion in cultured cells using ultra-performance liquid chromatography quadrupole-time of flight mass spectrometry (UPLC-Q-ToF-MS).Analytical and Bioanalytical Chemistry, 402, 1183–1198.PubMedCrossRef

Paglia, G., Palsson, B. O., & Sigurjonsson, O. E. (2012b). Systems biology of stored blood cells: Can it help to extend the expiration date? Journal of Proteomics, 76, 163–167.PubMedCrossRef

Price, N. D., Schellenberger, J., & Palsson, B. O. (2004). Uniform sampling of steady-state flux spaces: Means to design experiments and to interpret enzymopathies. Biophysical Journal, 87, 2172–2186.PubMedCentralPubMedCrossRef

Reed, J. L., Famili, I., Thiele, I., & Palsson, B. O. (2006). Towards multidimensional genome annotation. Nature Reviews Genetics, 7, 130–141.PubMedCrossRef

Sahoo, S., Aurich, M. K., Jonsson, J. J., & Thiele, I. (2014). Membrane transporters in a human genome-scale metabolic knowledgebase and their implications for disease. Frontiers in Physiology, 5, 91.PubMedCentralPubMedCrossRef

Sahoo, S., & Thiele, I. (2013). Predicting the impact of diet and enzymopathies on human small intestinal epithelial cells. Human Molecular Genetics, 22, 2705–2722.PubMedCentralPubMedCrossRef

Schellenberger, J., & Palsson, B. O. (2009). Use of randomized sampling for analysis of metabolic networks. The Journal of biological chemistry,284, 5457–5461.PubMedCrossRef

Schellenberger, J., Que, R., Fleming, R. M., Thiele, I., Orth, J. D., Feist, A. M., et al. (2011). Quantitative prediction of cellular metabolism with constraint-based models: The COBRA Toolbox v2.0. Nature Protocols, 6, 1290–1307.PubMedCentralPubMedCrossRef

Schmidt, B. J., Ebrahim, A., Metz, T. O., Adkins, J. N., Palsson, B. O., & Hyduke, D. R. (2013). GIM3E: Condition-specific models of cellular metabolism developed from metabolomics and expression data. Bioinformatics (Oxford, England), 29, 2900–2908.CrossRef

Suganuma, K., Miwa, H., Imai, N., Shikami, M., Gotou, M., Goto, M., et al. (2010). Energy metabolism of leukemia cells: Glycolysis versus oxidative phosphorylation. Leukemia & Lymphoma, 51, 2112–2119.CrossRef

Thiele, I., & Palsson, B. O. (2010). A protocol for generating a high-quality genome-scale metabolic reconstruction. Nature Protocols, 5, 93–121.PubMedCentralPubMedCrossRef

Thiele, I., Price, N. D., Vo, T. D., & Palsson, B. O. (2005). Candidate metabolic network states in human mitochondria. Impact of diabetes, ischemia, and diet. The Journal of biological chemistry, 280, 11683–11695.PubMedCrossRef

Thiele, I., Swainston, N., Fleming, R. M., Hoppe, A., Sahoo, S., Aurich, M. K., et al. (2013). A community-driven global reconstruction of human metabolism. Nature Biotechnology, 31, 419–425.PubMedCrossRef

Uhlen, M., Oksvold, P., Fagerberg, L., Lundberg, E., Jonasson, K., Forsberg, M., et al. (2010). Towards a knowledge-based human protein Atlas.Nature Biotechnology, 28, 1248–1250.PubMedCrossRef

Vander Heiden, M. G. (2011). Targeting cancer metabolism: A therapeutic window opens. Nature Reviews Drug Discovery, 10, 671–684.PubMedCrossRef

Vazquez, A., Markert, E. K., & Oltvai, Z. N. (2011). Serine biosynthesis with one carbon catabolism and the glycine cleavage system represents a novel pathway for ATP generation. PLoS ONE, 6, e25881.PubMedCentralPubMedCrossRef

Wishart, D. S., Jewison, T., Guo, A. C., Wilson, M., Knox, C., Liu, Y., et al. (2013). HMDB 3.0—The human metabolome database in 2013. Nucleic Acids Research, 41, D801–D807.PubMedCentralPubMedCrossRef

Zu, X. L., & Guppy, M. (2004). Cancer metabolism: Facts, fantasy, and fiction. Biochemical and Biophysical Research Communications, 313, 459–465.PubMedCrossRef


Read Full Post »

Pentose Shunt, Electron Transfer, Galactose, more Lipids in brief

Pentose Shunt, Electron Transfer, Galactose, more Lipids in brief

Reviewer and Curator: Larry H. Bernstein, MD, FCAP

Pentose Shunt, Electron Transfer, Galactose, and other Lipids in brief

This is a continuation of the series of articles that spans the horizon of the genetic
code and the progression in complexity from genomics to proteomics, which must
be completed before proceeding to metabolomics and multi-omics.  At this point
we have covered genomics, transcriptomics, signaling, and carbohydrate metabolism
with considerable detail.In carbohydrates. There are two topics that need some attention –
(1) pentose phosphate shunt;
(2) H+ transfer
(3) galactose.
(4) more lipids
Then we are to move on to proteins and proteomics.

Summary of this series:

The outline of what I am presenting in series is as follows:

  1. Signaling and Signaling Pathways
    http://pharmaceuticalintelligence.com/2014/08/12/signaling-and-signaling-pathways/
  2. Signaling transduction tutorial.
    http://pharmaceuticalintelligence.com/2014/08/12/signaling-transduction-tutorial/
  3. Carbohydrate metabolism
    http://pharmaceuticalintelligence.com/2014/08/13/carbohydrate-metabolism/

Selected References to Signaling and Metabolic Pathways published in this Open Access Online Scientific Journal, include the following: 

http://pharmaceuticalintelligence.com/2014/08/14/selected-references-to-signaling-
and-metabolic-pathways-in-leaders-in-pharmaceutical-intelligence/

  1. Lipid metabolism

4.1  Studies of respiration lead to Acetyl CoA
http://pharmaceuticalintelligence.com/2014/08/18/studies-of-respiration-lead-to-acetyl-coa/

4.2 The multi-step transfer of phosphate bond and hydrogen exchange energy
http://pharmaceuticalintelligence.com/2014/08/19/the-multi-step-transfer-of-phosphate-
bond-and-hydrogen-exchange-energy/

5.Pentose shunt, electron transfers, galactose, and other lipids in brief

6. Protein synthesis and degradation

7.  Subcellular structure

8. Impairments in pathological states: endocrine disorders; stress
hypermetabolism; cancer.

Section I. Pentose Shunt

Bernard L. Horecker’s Contributions to Elucidating the Pentose Phosphate Pathway

Nicole Kresge,     Robert D. Simoni and     Robert L. Hill

The Enzymatic Conversion of 6-Phosphogluconate to Ribulose-5-Phosphate
and Ribose-5-Phosphate (Horecker, B. L., Smyrniotis, P. Z., and Seegmiller,
J. E.      J. Biol. Chem. 1951; 193: 383–396

Bernard Horecker

Bernard Leonard Horecker (1914) began his training in enzymology in 1936 as a
graduate student at the University of Chicago in the laboratory of T. R. Hogness.
His initial project involved studying succinic dehydrogenase from beef heart using
the Warburg manometric apparatus. However, when Erwin Hass arrived from Otto
Warburg’s laboratory he asked Horecker to join him in the search for an enzyme
that would catalyze the reduction of cytochrome c by reduced NADP. This marked
the beginning of Horecker’s lifelong involvement with the pentose phosphate pathway.

During World War II, Horecker left Chicago and got a job at the National Institutes of
Health (NIH) in Frederick S. Brackett’s laboratory in the Division of Industrial Hygiene.
As part of the wartime effort, Horecker was assigned the task of developing a method
to determine the carbon monoxide hemoglobin content of the blood of Navy pilots
returning from combat missions. When the war ended, Horecker returned to research
in enzymology and began studying the reduction of cytochrome c by the succinic
dehydrogenase system.

Shortly after he began these investigation changes, Horecker was approached by
future Nobel laureate Arthur Kornberg, who was convinced that enzymes were the
key to understanding intracellular biochemical processes
. Kornberg suggested
they collaborate, and the two began to study the effect of cyanide on the succinic
dehydrogenase system. Cyanide had previously been found to inhibit enzymes
containing a heme group, with the exception of cytochrome c. However, Horecker
and Kornberg found that

  • cyanide did in fact react with cytochrome c and concluded that
  • previous groups had failed to perceive this interaction because
    • the shift in the absorption maximum was too small to be detected by
      visual examination.

Two years later, Kornberg invited Horecker and Leon Heppel to join him in setting up
a new Section on Enzymes in the Laboratory of Physiology at the NIH. Their Section on Enzymes eventually became part of the new Experimental Biology and Medicine
Institute and was later renamed the National Institute of Arthritis and Metabolic
Diseases.

Horecker and Kornberg continued to collaborate, this time on

  • the isolation of DPN and TPN.

By 1948 they had amassed a huge supply of the coenzymes and were able to
present Otto Warburg, the discoverer of TPN, with a gift of 25 mg of the enzyme
when he came to visit. Horecker also collaborated with Heppel on 

  • the isolation of cytochrome c reductase from yeast and 
  • eventually accomplished the first isolation of the flavoprotein from
    mammalian liver.

Along with his lab technician Pauline Smyrniotis, Horecker began to study

  • the enzymes involved in the oxidation of 6-phosphogluconate and the
    metabolic intermediates formed in the pentose phosphate pathway.

Joined by Horecker’s first postdoctoral student, J. E. Seegmiller, they worked
out a new method for the preparation of glucose 6-phosphate and 6-phosphogluconate, 
both of which were not yet commercially available.
As reported in the Journal of Biological Chemistry (JBC) Classic reprinted here, they

  • purified 6-phosphogluconate dehydrogenase from brewer’s yeast (1), and 
  • by coupling the reduction of TPN to its reoxidation by pyruvate in
    the presence of lactic dehydrogenase
    ,
  • they were able to show that the first product of 6-phosphogluconate oxidation,
  • in addition to carbon dioxide, was ribulose 5-phosphte.
  • This pentose ester was then converted to ribose 5-phosphate by a
    pentose-phosphate isomerase.

They were able to separate ribulose 5-phosphate from ribose 5- phosphate and demonstrate their interconversion using a recently developed nucleotide separation
technique called ion-exchange chromatography. Horecker and Seegmiller later
showed that 6-phosphogluconate metabolism by enzymes from mammalian
tissues also produced the same products
.8

Bernard Horecker

Bernard Horecker

http://www.jbc.org/content/280/29/e26/F1.small.gif

Over the next several years, Horecker played a key role in elucidating the

  • remaining steps of the pentose phosphate pathway.

His total contributions included the discovery of three new sugar phosphate esters,
ribulose 5-phosphate, sedoheptulose 7-phosphate, and erythrose 4-phosphate, and
three new enzymes, transketolase, transaldolase, and pentose-phosphate 3-epimerase.
The outline of the complete pentose phosphate cycle was published in 1955
(2). Horecker’s personal account of his work on the pentose phosphate pathway can
be found in his JBC Reflection (3).1

Horecker’s contributions to science were recognized with many awards and honors
including the Washington Academy of Sciences Award for Scientific Achievement in
Biological Sciences (1954) and his election to the National Academy of Sciences in
1961. Horecker also served as president of the American Society of Biological
Chemists (now the American Society for Biochemistry and Molecular Biology) in 1968.

Footnotes

  • ↵1 All biographical information on Bernard L. Horecker was taken from Ref. 3.
  • The American Society for Biochemistry and Molecular Biology, Inc.

References

  1. ↵Horecker, B. L., and Smyrniotis, P. Z. (1951) Phosphogluconic acid dehydrogenase
    from yeast. J. Biol. Chem. 193, 371–381FREE Full Text
  2. ↵Gunsalus, I. C., Horecker, B. L., and Wood, W. A. (1955) Pathways of carbohydrate
    metabolism in microorganisms. Bacteriol. Rev. 19, 79–128  FREE Full Text
  3. ↵Horecker, B. L. (2002) The pentose phosphate pathway. J. Biol. Chem. 277, 47965–
    47971 FREE Full Text

The Pentose Phosphate Pathway (also called Phosphogluconate Pathway, or Hexose
Monophosphate Shunt) is depicted with structures of intermediates in Fig. 23-25
p. 863 of Biochemistry, by Voet & Voet, 3rd Edition. The linear portion of the pathway
carries out oxidation and decarboxylation of glucose-6-phosphate, producing the
5-C sugar ribulose-5-phosphate.

Glucose-6-phosphate Dehydrogenase catalyzes oxidation of the aldehyde
(hemiacetal), at C1 of glucose-6-phosphate, to a carboxylic acid in ester linkage
(lactone). NADP+ serves as electron acceptor.

6-Phosphogluconolactonase catalyzes hydrolysis of the ester linkage (lactone)
resulting in ring opening. The product is 6-phosphogluconate. Although ring opening
occurs in the absence of a catalyst, 6-Phosphogluconolactonase speeds up the
reaction, decreasing the lifetime of the highly reactive, and thus potentially
toxic, 6-phosphogluconolactone.

Phosphogluconate Dehydrogenase catalyzes oxidative decarboxylation of
6-phosphogluconate, to yield the 5-C ketose ribulose-5-phosphate. The
hydroxyl at C3 (C2 of the product) is oxidized to a ketone. This promotes loss
of the carboxyl at C1 as CO2.  NADP+ again serves as oxidant (electron acceptor).

pglucose hd

pglucose hd

https://www.rpi.edu/dept/bcbp/molbiochem/MBWeb/mb2/part1/images/pglucd.gif

Reduction of NADP+ (as with NAD+) involves transfer of 2e- plus 1H+ to the
nicotinamide moiety.

nadp

NADPH, a product of the Pentose Phosphate Pathway, functions as a reductant in
various synthetic (anabolic) pathways, including fatty acid synthesis.

NAD+ serves as electron acceptor in catabolic pathways in which metabolites are
oxidized. The resultant NADH is reoxidized by the respiratory chain, producing ATP.

nadnadp

https://www.rpi.edu/dept/bcbp/molbiochem/MBWeb/mb2/part1/images/nadnadp.gif

Regulation: 
Glucose-6-phosphate Dehydrogenase is the committed step of the Pentose
Phosphate Pathway. This enzyme is regulated by availability of the substrate NADP+.
As NADPH is utilized in reductive synthetic pathways, the increasing concentration of
NADP+ stimulates the Pentose Phosphate Pathway, to replenish NADPH.

The remainder of the Pentose Phosphate Pathway accomplishes conversion of the
5-C ribulose-5-phosphate to the 5-C product ribose-5-phosphate, or to the 3-C
glyceraldehyde -3-phosphate and the 6-C fructose-6-phosphate (reactions 4 to 8
p. 863).

Transketolase utilizes as prosthetic group thiamine pyrophosphate (TPP), a
derivative of vitamin B1.

tpp

tpp

https://www.rpi.edu/dept/bcbp/molbiochem/MBWeb/mb2/part1/images/tpp.gif

Thiamine pyrophosphate binds at the active sites of enzymes in a “V” conformation.The amino group of the aminopyrimidine moiety is close to the dissociable proton,
and serves as the proton acceptor. This proton transfer is promoted by a glutamate
residue adjacent to the pyrimidine ring.

The positively charged N in the thiazole ring acts as an electron sink, promoting
C-C bond cleavage. The 3-C aldose glyceraldehyde-3-phosphate is released.
A 2-C fragment remains on TPP.

FASEB J. 1996 Mar;10(4):461-70.   http://www.ncbi.nlm.nih.gov/pubmed/8647345

Reviewer

The importance of this pathway can easily be underestimated.  The main source for
energy in respiration was considered to be tied to the

  • high energy phosphate bond in phosphorylation and utilizes NADPH, converting it to NADP+.

glycolysis n skeletal muscle in short term, dependent on muscle glycogen conversion
to glucose, and there is a buildup of lactic acid – used as fuel by the heart.  This
pathway accounts for roughly 5% of metabolic needs, varying between tissues,
depending on there priority for synthetic functions, such as endocrine or nucleic
acid production.

The mature erythrocyte and the ocular lens both are enucleate.  85% of their
metabolic energy needs are by anaerobic glycolysis.  Consider the erythrocyte
somewhat different than the lens because it has iron-based hemoglobin, which
exchanges O2 and CO2 in the pulmonary alveoli, and in that role, is a rapid
regulator of H+ and pH in the circulation (carbonic anhydrase reaction), and also to
a lesser extent in the kidney cortex, where H+ is removed  from the circulation to
the urine, making the blood less acidic, except when there is a reciprocal loss of K+.
This is how we need a nomogram to determine respiratory vs renal acidosis or
alkalosis.  In the case of chronic renal disease, there is substantial loss of
functioning nephrons, loss of countercurrent multiplier, and a reduced capacity to
remove H+.  So there is both a metabolic acidosis and a hyperkalemia, with increased
serum creatinine, but the creatinine is only from muscle mass – not accurately
reflecting total body mass, which includes visceral organs.  The only accurate
measure of lean body mass would be in the linear relationship between circulating
hepatic produced transthyretin (TTR).

The pentose phosphate shunt is essential for

  • the generation of nucleic acids, in regeneration of red cells and lens – requiring NADPH.

Insofar as the red blood cell is engaged in O2 exchange, the lactic dehydrogenase
isoenzyme composition is the same as the heart. What about the lens of and cornea the eye, and platelets?  The explanation does appear to be more complex than
has been proposed and is not discussed here.

Section II. Mitochondrial NADH – NADP+ Transhydrogenase Reaction

There is also another consideration for the balance of di- and tri- phospopyridine
nucleotides in their oxidized and reduced forms.  I have brought this into the
discussion because of the centrality of hydride tranfer to mitochondrial oxidative
phosphorylation and the energetics – for catabolism and synthesis.

The role of transhydrogenase in the energy-linked reduction of TPN ☆

Fritz Hommes∗, Ronald W. Estabrook∗∗

The Wenner-Gren Institute, University of Stockholm
Stockholm, Sweden
Biochemical and Biophysical Research Communications 11, (1), 2 Apr 1963, Pp 1–6
http://dx.doi.org:/10.1016/0006-291X(63)90017-2

In 1959, Klingenberg and Slenczka (1) made the important observation that incubation of isolated

  • liver mitochondria with DPN-specific substrates or succinate in the absence of phosphate
    acceptor resulted in a rapid and almost complete reduction of the intramitochondrial TPN.

These and related findings led Klingenberg and co-workers (1-3) to postulate

  • the occurrence of an ATP-controlled transhydrogenase reaction catalyzing the reduction of
    mitochondrial TPN by DPNH. A similar conclusion was reached by Estabrook and Nissley (4).

The present paper describes the demonstration and some properties of an

  • energy-dependent reduction of TPN by DPNH, catalyzed by submitochondrial particles.

Preliminary reports of some of these results have already appeared (5, 6 ) , and a
complete account is being published elsewhere (7).We have studied the energy- dependent reduction of TPN by PNH with submitochondrial particles from both
rat liver and beef heart. Rat liver particles were prepared essentially according to
the method of Kielley and Bronk (8), and beef heart particles by the method of
Low and Vallin (9).

PYRIDINE NUCLEOTIDE TRANSHYDROGENASE  II. DIRECT EVIDENCE FOR
AND MECHANISM OF THE
 TRANSHYDROGENASE REACTION*

BY  NATHAN 0. KAPLAN, SIDNEY P. COLOWICK, AND ELIZABETH F. NEUFELD
(From the McCollum-Pratt Institute, The Johns Hopkins University, Baltimore,
Maryland)  J. Biol. Chem. 1952, 195:107-119.
http://www.jbc.org/content/195/1/107.citation

NO Kaplan

NO Kaplan

Sidney Colowick

Sidney Colowick

Elizabeth Neufeld

Elizabeth Neufeld

Kaplan studied carbohydrate metabolism in the liver under David M. Greenberg at the
University of California, Berkeley medical school. He earned his Ph.D. in 1943. From
1942 to 1944, Kaplan participated in the Manhattan Project. From 1945 to 1949,
Kaplan worked with Fritz Lipmann at Massachusetts General Hospital to study
coenzyme A. He worked at the McCollum-Pratt Institute of Johns Hopkins University
from 1950 to 957. In 1957, he was recruited to head a new graduate program in
biochemistry at Brandeis University. In 1968, Kaplan moved to the University of
California, San Diego
, where he studied the role of lactate dehydrogenase in cancer. He also founded a colony of nude mice, a strain of laboratory mice useful in the study
of cancer and other diseases. [1] He was a member of the National Academy of
Sciences.One of Kaplan’s students at the University of California was genomic
researcher Craig Venter.[2]3]  He was, with Sidney Colowick, a founding editor of the scientific book series Methods
in Enzymology
.[1]

http://books.nap.edu/books/0309049768/xhtml/images/img00009.jpg

Colowick became Carl Cori’s first graduate student and earned his Ph.D. at
Washington University St. Louis in 1942, continuing to work with the Coris (Nobel
Prize jointly) for 10 years. At the age of 21, he published his first paper on the
classical studies of glucose 1-phosphate (2), and a year later he was the sole author on a paper on the synthesis of mannose 1-phosphate and galactose 1-phosphate (3). Both papers were published in the JBC. During his time in the Cori lab,

Colowick was involved in many projects. Along with Herman Kalckar he discovered
myokinase (distinguished from adenylate kinase from liver), which is now known as
adenyl kinase. This discovery proved to be important in understanding transphos-phorylation reactions in yeast and animal cells. Colowick’s interest then turned to
the conversion of glucose to polysaccharides, and he and Earl Sutherland (who
will be featured in an upcoming JBC Classic) published an important paper on the
formation of glycogen from glucose using purified enzymes (4). In 1951, Colowick
and Nathan Kaplan were approached by Kurt Jacoby of Academic Press to do a
series comparable to Methodem der Ferment Forschung. Colowick and Kaplan
planned and edited the first 6 volumes of Methods in Enzymology, launching in 1955
what became a series of well known and useful handbooks. He continued as
Editor of the series until his death in 1985.

http://bioenergetics.jbc.org/highwire/filestream/9/field_highwire_fragment_image_s/0/F1.small.gif

The Structure of NADH: the Work of Sidney P. Colowick

Nicole Kresge, Robert D. Simoni and Robert L. Hill

On the Structure of Reduced Diphosphopyridine Nucleotide

(Pullman, M. E., San Pietro, A., and Colowick, S. P. (1954)

J. Biol. Chem. 206, 129–141)

Elizabeth Neufeld
·  Born: September 27, 1928 (age 85), Paris, France
·  Education: Queens College, City University of New York, University of California,
Berkeley

http://fdb5.ctrl.ucla.edu/biological-chemistry/institution/photo?personnel%5fid=45290&max_width=155&max_height=225

In Paper I (l), indirect evidence was presented for the following transhydrogenase
reaction, catalyzed by an enzyme present in extracts of Pseudomonas
fluorescens:

TPNHz + DPN -+ TPN + DPNHz

The evidence was obtained by coupling TPN-specific dehydrogenases with the
transhydrogenase and observing the reduction of large amounts of diphosphopyridine nucleotide (DPN) in the presence of catalytic amounts of triphosphopyridine
nucleotide (TPN).

In this paper, data will be reported showing the direct

  • interaction between TPNHz and DPN, in thepresence of transhydrogenase alone,
  • to yield products having the propertiesof TPN and DPNHZ.

Information will be given indicating that the reaction involves

  • a transfer of electrons (or hydrogen) rather than a phosphate 

Experiments dealing with the kinetics and reversibility of the reaction, and with the
nature of the products, suggest that the reaction is a complex one, not fully described
by the above formulation.

Materials and Methods [edited]

The TPN and DPN used in these studies were preparations of approximately 75
percent purity and were prepared from sheep liver by the chromatographic procedure
of Kornberg and Horecker (unpublished). Reduced DPN was prepared enzymatically with alcohol dehydrogenase as described elsewhere (2). Reduced TPN was prepared by treating TPN with hydrosulfite. This treated mixture contained 2 pM of TPNHz per ml.
The preparations of desamino DPN and reduced desamino DPN have been
described previously (2, 3). Phosphogluconate was a barium salt which was kindly
supplied by Dr. B. F. Horecker. Cytochrome c was obtained from the Sigma Chemical Company.

Transhydrogenase preparations with an activity of 250 to 7000 units per mg. were
used in these studies. The DPNase was a purified enzyme, which was obtained
from zinc-deficient Neurospora and had an activity of 5500 units per mg. (4). The
alcohol dehydrogenase was a crystalline preparation isolated from yeast according to the procedure of Racker (5).

Phosphogluconate dehydrogenase from yeast and a 10 per cent pure preparation of the TPN-specific cytochrome c reductase from liver (6) were gifts of Dr. B. F.
Horecker.

DPN was assayed with alcohol and crystalline yeast alcohol dehydrogenase. TPN was determined By the specific phosphogluconic acid dehydrogenase from yeast and also by the specific isocitric dehydrogenase from pig heart. Reduced DPN was
determined by the use of acetaldehyde and the yeast alcohol dehydrogenase.
All of the above assays were based on the measurement of optical density changes
at 340 rnp. TPNHz was determined with the TPN-specific cytochrome c reductase system. The assay of the reaction followed increase in optical density at 550 rnp  as a measure of the reduction of the cytochrome c after cytochrome c
reductase was added to initiate the reaction. The changes at 550 rnp are plotted for different concentrations of TPNHz in Fig. 3, a. The method is an extremely sensitive and accurate assay for reduced TPN.

Results
[No Figures or Table shown]

Formation of DPNHz from TPNHz and DPN-Fig. 1, a illustrates the direct reaction between TPNHz and DPN to form DPNHZ. The reaction was carried out by incubating TPNHz with DPN in the presence of the
transhydrogenase, yeast alcohol dehydrogenase, and acetaldehyde. Since the yeast dehydrogenase is specific for DPN,

  • a decrease in absorption at340 rnp can only be due to the formation of reduced DPN. It can
    be seen from the curves in Fig. 1, a that a decrease in optical density occurs only in the
    presence of the complete system.

The Pseudomonas enzyme is essential for the formation of DPNH2. It is noteworthy
that, under the conditions of reaction in Fig. 1, a,

  • approximately 40 per cent of theTPNH, reacted with the DPN.

Fig. 1, a also indicates that magnesium is not required for transhydrogenase activity.  The reaction between TPNHz and DPN takes place in the absence of alcohol
dehydrogenase and acetaldehyde
. This can be demonstrated by incubating the
two pyridine nucleotides with the transhydrogenase for 4 8 12 16 20 24 28 32 36
minutes

FIG. 1. Evidence for enzymatic reaction of TPNHt with DPN.

  • Rate offormation of DPNH2.

(b) DPN disappearance and TPN formation.

(c) Identification of desamino DPNHz as product of reaction of TPNHz with desamino DPN.  (assaying for reduced DPN by the yeast alcohol dehydrogenase technique.

Table I (Experiment 1) summarizes the results of such experiments in which TPNHz was added with varying amounts of DPN.

  • In the absence of DPN, no DPNHz was formed. This eliminates the possibility that TPNH 2 is
    converted to DPNHz
  • by removal ofthe monoester phosphate grouping.

The data also show that the extent of the reaction is

  • dependent on the concentration of DPN.

Even with a large excess of DPN, only approximately 40 per cent of the TPNHzreacts to form reduced DPN. It is of importance to emphasize that in the above
experiments, which were carried out in phosphate buffer, the extent of  the reaction

  • is the same in the presence or absence of acetaldehyde andalcohol dehydrogenase.

With an excess of DPN and different  levels of TPNHZ,

  • the amount of reduced DPN which is formed is
  • dependent on the concentration of TPNHz(Table I, Experiment 2).
  • In all cases, the amount of DPNHz formed is approximately
    40 per cent of the added reduced TPN.

Formation of TPN-The reaction between TPNHz and DPN should yield TPN as well as DPNHz.
The formation of TPN is demonstrated in Table 1. in Fig. 1, b. In this experiment,
TPNHz was allowed to react with DPN in the presence of the transhydrogenase
(PS.), and then alcohol and alcohol dehydrogenase were added . This
would result in reduction of the residual DPN, and the sample incubated with the
transhydrogenase contained less DPN. After the completion of the alcohol
dehydrogenase reaction, phosphogluconate and phosphogluconic dehydrogenase (PGAD) were added to reduce the TPN. The addition of this TPN-specific
dehydrogenase results in an

  • increase inoptical density in the enzymatically treated sample.
  • This change represents the amount of TPN formed.

It is of interest to point out that, after addition of both dehydrogenases,

  • the total optical density change is the same in both

Therefore it is evident that

  • for every mole of DPN disappearing  a mole of TPN appears.

Balance of All Components of Reaction–

Table II (Experiment 1) shows that,

  • if measurements for all components of the reaction are made, one can demonstrate
    that there is
  • a mole for mole disappearance of TPNH, and DPN, and
  • a stoichiometric appearance of TPN and DPNH2.
  1. The oxidized forms of the nucleotides were assayed as described
  2. the reduced form of TPN was determined by the TPNHz-specific cytochrome c reductase,
  3. the DPNHz by means of yeast alcohol dehydrogenase plus

This stoichiometric balance is true, however,

  • only when the analyses for the oxidized forms are determined directly on the reaction

When analyses are made after acidification of the incubated reaction mixture,

  • the values found forDPN and TPN are much lower than those obtained by direct analysis.

This discrepancy in the balance when analyses for the oxidized nucleotides are
carried out in acid is indicated in Table II (Experiment 2). The results, when
compared with the findings in Experiment 1, are quite striking.

Reaction of TPNHz with Desamino DPN–

Desamino DPN

  • reacts with the transhydrogenase system at the same rate as does DPN (2).

This was of value in establishing the fact that

  • the transhydrogenase catalyzesa transfer of hydrogen rather than a phosphate transfer reaction.

The reaction between desamino DPN and TPNHz can be written in two ways.

TPN f desamino DPNHz

TPNH, + desamino DPN

DPNH2 + desamino TPN

If the reaction involved an electron transfer,

  • desamino DPNHz would be
  • Phosphate transfer would result in the production of reduced

Desamino DPNHz can be distinguished from DPNHz by its

  • slowerrate of reaction with yeast alcohol dehydrogenase (2, 3).

Fig. 1, c illustrates that, when desamino DPN reacts with TPNH2, 

  • the product of the reaction is desamino DPNHZ.

This is indicated by the slow rate of oxidation of the product by yeast alcohol
dehydrogenase and acetaldehyde.

From the above evidence phosphate transfer 

  • has been ruled out as a possible mechanism for the transhydrogenase reaction.

Inhibition by TPN–

As mentioned in Paper I and as will be discussed later in this paper,

  • the transhydrogenase reaction does not appear to be readily reversible.

This is surprising, particularly since only approximately 

  • 40 per cent of the TPNHz undergoes reaction with DPN
    under the conditions described above. It was therefore thought that
  • the TPN formed might inhibit further transfer of electrons from TPNH2.

Table III summarizes data showing the

  • strong inhibitory effect of TPN on thereaction between TPNHz and DPN.

It is evident from the data that

  • TPN concentration is a factor in determining the extent of the reaction.

Effect of Removal of TPN on Extent of Reaction–

A purified DPNase from Neurospora has been found

  • to cleave the nicotinamide riboside linkagesof the oxidized forms of both TPN and DPN
  • without acting on thereduced forms of both nucleotides (4).

It has been found, however, that

  • the DPNase hydrolyzes desamino DPN at a very slow rate (3).

In the reaction between TPNHz and desamino DPN, TPN and desamino DPNH:,

  • TPNis the only component of this reaction attacked by the Neurospora enzyme
    at an appreciable rate

It was  thought that addition of the DPNase to the TPNHZ-desamino DPN trans-
hydrogenase reaction mixture

  • would split the TPN formed andpermit the reaction to go to completion.

This, indeed, proved to be the case, as indicated in Table IV, where addition of
the DPNase with desamino DPN results in almost

  • a stoichiometric formation of desamino DPNHz
  • and a complete disappearance of TPNH2.

Extent of Reaction in Buffers Other Than Phosphate–

All the reactions described above were carried out in phosphate buffer of pH 7.5.
If the transhydrogenase reaction between TPNHz and DPN is run at the same pH
in tris(hydroxymethyl)aminomethane buffer (TRIS buffer)

  • with acetaldehydeand alcohol dehydrogenase present,
  • the reaction proceeds muchfurther toward completion 
  • than is the case under the same conditions ina phosphate medium (Fig. 2, a).

The importance of phosphate concentration in governing the extent of the reaction
is illustrated in Fig. 2, b.

In the presence of TRIS the transfer reaction

  • seems to go further toward completion in the presence of acetaldehyde
    and 
    alcohol dehydrogenase
  • than when these two components are absent.

This is not true of the reaction in phosphate,

  • in which the extent is independent of the alcoholdehydrogenase system.

Removal of one of the products of the reaction (DPNHp) in TRIS thus

  • appears to permit the reaction to approach completion,whereas
  • in phosphate this removal is without effect on the finalcourse of the reaction.

The extent of the reaction in TRIS in the absence of alcohol dehydrogenase
and acetaldehyde
 is

  • somewhat greater than when the reaction is run in phosphate.

TPN also inhibits the reaction of TPNHz with DPN in TRIS medium, but the inhibition

  • is not as marked as when the reaction is carried out in phosphate buffer.

Reversibility of Transhydrogenase Reaction;

Reaction between DPNHz and TPN–

In Paper I, it was mentioned that no reversal of the reaction could be achieved in a system containing alcohol, alcohol dehydrogenase, TPN, and catalytic amounts of
DPN.

When DPNH, and TPN are incubated with the purified transhydrogenase, there is
also

  • no evidence for reversibility.

This is indicated in Table V which shows that

  • there is no disappearance of DPNHz in such a system.

It was thought that removal of the TPNHz, which might be formed in the reaction,
could promote the reversal of the reaction. Hence,

  • by using the TPNHe-specific cytochrome c reductase, one could
  1. not only accomplishthe removal of any reduced TPN,
  2. but also follow the course of the reaction.

A system containing DPNH2, TPN, the transhydrogenase, the cytochrome c
reductase, and cytochrome c, however, gives

  • no reduction of the cytochrome

This is true for either TRIS or phosphate buffers.2

Some positive evidence for the reversibility has been obtained by using a system
containing

  • DPNH2, TPNH2, cytochrome c, and the cytochrome creductase in TRIS buffer.

In this case, there is, of course, reduction of cytochrome c by TPNHZ, but,

  • when the transhydrogenase is present.,there is
  • additional reduction over and above that due to the added TPNH2.

This additional reduction suggests that some reversibility of the reaction occurred
under these conditions. Fig. 3, b shows

  • the necessity of DPNHzfor this additional reduction.

Interaction of DPNHz with Desamino DPN-

If desamino DPN and DPNHz are incubated with the purified Pseudomonas enzyme,
there appears

  • to be a transfer of electrons to form desamino DPNHz.

This is illustrated in Fig. 4, a, which shows the

  • decreased rate of oxidation by thealcohol dehydrogenase system
  • after incubation with the transhydrogenase.
  • Incubation of desamino DPNHz with DPN results in the formation of DPNH2,
  • which is detected by the faster rate of oxidation by the alcohol dehydrogenase system
  • after reaction of the pyridine nucleotides with thetranshydrogenase (Fig. 4, b).

It is evident from the above experiments that

the transhydrogenase catalyzes an exchange of hydrogens between

  • the adenylic and inosinic pyridine nucleotides.

However, it is difficult to obtain any quantitative information on the rate or extent of
the reaction by the method used, because

  • desamino DPNHz also reacts with the alcohol dehydrogenase system,
  • although at a much slower rate than does DPNH2.

DISCUSSION

The results of the balance experiments seem to offer convincing evidence that
the transhydrogenase catalyzes the following reaction.

TPNHz + DPN -+ DPNHz + TPN

Since desamino DPNHz is formed from TPNHz and desamino DPN,

  • thereaction appears to involve an electron (or hydrogen) transfer
  • rather thana transfer of the monoester phosphate grouping of TPN.

A number of the findings reported in this paper are not readily understandable in
terms of the above simple formulation of the reaction. It is difficult to understand
the greater extent of the reaction in TRIS than in phosphate when acetaldehyde
and alcohol dehydrogenase are present.

One possibility is that an intermediate may be involved which is more easily converted
to reduced DPN in the TRIS medium. The existence of such an intermediate is also
suggested by the discrepancies noted in balance experiments, in which

  • analyses of the oxidized nucleotides after acidification showed
  • much lower values than those found by direct analysis.

These findings suggest that the reaction may involve

  • a 1 electron ratherthan a 2 electron transfer with
  • the formation of acid-labile free radicals as intermediates.

The transfer of hydrogens from DPNHz to desamino DPN

  • to yield desamino DPNHz and DPN and the reversal of this transfer
  • indicate the unique role of the transhydrogenase
  • in promoting electron exchange between the pyridine nucleotides.

In this connection, it is of interest that alcohol dehydrogenase and lactic
dehydrogenase cannot duplicate this exchange  between the DPN and
the desamino systems.3  If one assumes that desamino DPN behaves
like DPN,

  • one might predict that the transhydrogenase would catalyze an
    exchange of electrons (or hydrogen) 3.

Since alcohol dehydrogenase alone

  • does not catalyze an exchange of electrons between the adenylic
    and inosinic pyridine nucleotides, this rules out the possibility
  • that the dehydrogenase is converted to a reduced intermediate
  • during electron between DPNHz and added DPN.

It is hoped to investigate this possibility with isotopically labeled DPN.
Experiments to test the interaction between TPN and desamino TPN are
also now in progress.

It seems likely that the transhydrogenase will prove capable of

  • catalyzingan exchange between TPN and TPNH2, as well as between DPN and

The observed inhibition by TPN of the reaction between TPNHz and DPN may
therefore

  • be due to a competition between DPN and TPNfor the TPNH2.

SUMMARY

  1. Direct evidence for the following transhydrogenase reaction. catalyzedby an
    enzyme from Pseudomonas fluorescens, is presented.

TPNHz + DPN -+ TPN + DPNHz

Balance experiments have shown that for every mole of TPNHz disappearing
1 mole of TPN appears and that for each mole of DPNHz generated 1 mole of
DPN disappears. The oxidized nucleotides found at the end of the reaction,
however, show anomalous lability toward acid.

  1. The transhydrogenase also promotes the following reaction.

TPNHz + desamino DPN -+ TPN + desamino DPNH,

This rules out the possibility that the transhydrogenase reaction involves a
phosphate transfer and indicates that the

  • enzyme catalyzes a shift of electrons (or hydrogen atoms).

The reaction of TPNHz with DPN in 0.1 M phosphate buffer is strongly
inhibited by TPN; thus

  • it proceeds only to the extent of about40 per cent or less, even
  • when DPNHz is removed continuously by meansof acetaldehyde
    and alcohol dehydrogenase.
  • In other buffers, in whichTPN is less inhibitory, the reaction proceeds
    much further toward completion under these conditions.
  • The reaction in phosphate buffer proceedsto completion when TPN
    is removed as it is formed.
  1. DPNHz does not react with TPN to form TPNHz and DPN in the presence
    of transhydrogenase. Some evidence, however, has been obtained for
    the reversibility by using the following system:
  • DPNHZ, TPNHZ, cytochromec, the TPNHz-specific cytochrome c reductase,
    and the transhydrogenase.
  1. Evidence is cited for the following reversible reaction, which is catalyzed
    by the transhydrogenase.

DPNHz + desamino DPN fi DPN + desamino DPNHz

  1. The results are discussed with respect to the possibility that the
    transhydrogenase reaction may
  • involve a 1 electron transfer with theformation of free radicals as intermediates.


BIBLIOGRAPHY

  1. Coiowick, S. P., Kaplan, N. O., Neufeld, E. F., and Ciotti, M. M., J. Biol. Chem.,196, 95 (1952).
  2. Pullman, 111. E., Colowick, S. P., and Kaplan, N. O., J. Biol. Chem., 194, 593(1952).
  3. Kaplan, N. O., Colowick, S. P., and Ciotti, M. M., J. Biol. Chem., 194, 579 (1952).
  4. Kaplan, N. O., Colowick, S. P., and Nason, A., J. Biol. Chem., 191, 473 (1951).
  5. Racker, E., J. Biol. Chem., 184, 313 (1950).
  6. Horecker, B. F., J. Biol. Chem., 183, 593 (1950).

Section !II. 

Luis_Federico_Leloir_-_young

The Leloir pathway: a mechanistic imperative for three enzymes to change
the stereochemical configuration of a single carbon in galactose.

Frey PA.
FASEB J. 1996 Mar;10(4):461-70.    http://www.fasebj.org/content/10/4/461.full.pdf
PMID:8647345

The biological interconversion of galactose and glucose takes place only by way of
the Leloir pathway and requires the three enzymes galactokinase, galactose-1-P
uridylyltransferase, and UDP-galactose 4-epimerase.
The only biological importance of these enzymes appears to be to

  • provide for the interconversion of galactosyl and glucosyl groups.

Galactose mutarotase also participates by producing the galactokinase substrate
alpha-D-galactose from its beta-anomer. The galacto/gluco configurational change takes place at the level of the nucleotide sugar by an oxidation/reduction
mechanism in the active site of the epimerase NAD+ complex. The nucleotide portion
of UDP-galactose and UDP-glucose participates in the epimerization process in two ways:

1) by serving as a binding anchor that allows epimerization to take place at glycosyl-C-4 through weak binding of the sugar, and

2) by inducing a conformational change in the epimerase that destabilizes NAD+ and
increases its reactivity toward substrates.

Reversible hydride transfer is thereby facilitated between NAD+ and carbon-4
of the weakly bound sugars.

The structure of the enzyme reveals many details of the binding of NAD+ and
inhibitors at the active site
.

The essential roles of the kinase and transferase are to attach the UDP group
to galactose, allowing for its participation in catalysis by the epimerase. The
transferase is a Zn/Fe metalloprotein
, in which the metal ions stabilize the
structure rather than participating in catalysis. The structure is interesting
in that

  • it consists of single beta-sheet with 13 antiparallel strands and 1 parallel strand
    connected by 6 helices.

The mechanism of UMP attachment at the active site of the transferase is a double
displacement
, with the participation of a covalent UMP-His 166-enzyme intermediate
in the Escherichia coli enzyme. The evolution of this mechanism appears to have
been guided by the principle of economy in the evolution of binding sites.

PMID: 8647345 Free full text

Section IV.

More on Lipids – Role of lipids – classification

  • Energy
  • Energy Storage
  • Hormones
  • Vitamins
  • Digestion
  • Insulation
  • Membrane structure: Hydrophobic properties

Lipid types

lipid types

lipid types

nat occuring FAs in mammals

nat occuring FAs in mammals

Read Full Post »

Signaling transduction tutorial

Larry H. Bernstein, MD, FCAP, Reporter and Curator
Leaders in Pharmaceutical Intelligence

http://pharmaceuticalintelligence.com/8-10-2014/Signaling transduction tutorial

This portion of the discussion is a series of articles on signaling and signaling pathways. Many of the protein-protein interactions or protein-membrane interactions and associated regulatory features have been referred to previously, but the focus of the discussion or points made were different.  I considered placing this after the discussion of proteins and how they play out their essential role, but this is quite a suitable place for a progression to what follows.  This is introduced by material taken from Wikipedia, which will be followed by a series of mechanisms and examples from the current literature, which give insight into the developments in cell metabolism, with the later goal of separating views introduced by molecular biology and genomics from functional cellular dynamics that are not dependent on the classic view.  The work is vast, and this discussion does not attempt to cover it in great depth.  It is the first in a series.  This discussion, in particular is a tutorial on signaling transduction that was already available, and relevant.  One may note that all of the slides used herein were also used in the previous blog, but in a different construction.  I shall tweak the contents, as I find helpful.

  1. Signaling and signaling pathways
  2. Signaling transduction tutorial.
  3. Carbohydrate metabolism
  4. Lipid metabolism
  5. Protein synthesis and degradation
  6. Subcellular structure
  7. Impairments in pathological states: endocrine disorders; stress hypermetabolism; cancer.


Signal Transduction Tutorial

The goal of this tutorial is for you to gain an understanding of how cell signaling occurs in a cell.  Upon completion of the tutorial,

  • you will have a basic understanding signal transduction and
  • the role of phosphorylation in signal transduction.

You will also have detailed knowledge of

  • the role of Tyrosine kinases and
  • G protein-coupled receptors in cell signaling.
  1. Description of Signal Transduction

As living organisms

  • we are constantly receiving and interpreting signals from our environment.

These signals can come

  • in the form of light, heat, odors, touch or sound.

The cells of our bodies are also

  • constantly receiving signals from other cells.

These signals are important to

  • keep cells alive and functioning as well as
  • to stimulate important events such as
  • cell division and differentiation.

Signals are most often chemicals that can be found

  • in the extracellular fluid around cells.

These chemicals can come

  • from distant locations in the body (endocrine signaling by hormones), from
  • nearby cells (paracrine signaling) or can even
  • be secreted by the same cell (autocrine signaling).
intercellular signaling

intercellular signaling

http://www.hartnell.edu/tutorials/biology/images/intercellularsignaling.jpg

Signaling molecules may trigger any number of cellular responses, including

  • changing the metabolism of the cell receiving the signal or
  • result in a change in gene expression (transcription) within the nucleus of the cell or both.

Overview of Cell Signaling

Cell signaling can be divided into 3 stages.

  1. Reception: A cell detects a signaling molecule from the outside of the cell. A signal is detected when the chemical signal (also known as a ligand) binds to a receptor protein on the surface of the cell or inside the cell.
  2. Transduction: When the signaling molecule binds the receptor it changes the receptor protein in some way. This change initiates the process of transduction. Signal transduction is usually a pathway of several steps. Each relay molecule in the signal transduction pathway changes the next molecule in the pathway.
  3. Response: Finally, the signal triggers a specific cellular response.
signal transduction_simple

signal transduction_simple

http://www.hartnell.edu/tutorials/biology/images/signaltransduction_simple.jpg

Reception

Signal Transduction - ligand binds to surface receptor

Signal Transduction – ligand binds to surface receptor


Membrane receptors function by binding the signal molecule (ligand) and causing the production of a second signal (also known as a second messenger) that then causes a cellular response. These types of receptors transmit information from the extracellular environment to the inside of the cell

  • by changing shape or
conformational-rearrangements

conformational-rearrangements

Enzyme_Model  allosterism

Enzyme_Model allosterism

  • by joining with another protein
  • once a specific ligand binds to it.

Examples of membrane receptors include

  • G Protein-Coupled Receptors and
membrane_receptor_g protein

membrane_receptor_g protein


  • Receptor Tyrosine Kinases.
activation of receptor Tyrosine Kinase

activation of receptor Tyrosine Kinase

http://www.hartnell.edu/tutorials/biology/images/membrane_receptor_tk.jpg

Intracellular receptors are found inside the cell, either in the cytopolasm or in the nucleus of the target cell (the cell receiving the signal).

Chemical messengers that are hydrophobic or very small (steroid hormones for example) can

  • pass through the plasma membrane without assistance and
  • bind these intracellular receptors.

Once bound and activated by the signal molecule,

  • the activated receptor can initiate a cellular response, such as a
  • change in gene expression.

Note that this is the first time that change in gene expression is stated.  Is the change in gene expression implication of a change in the genetic information – such as – mutation?  That does not have to be the case in the normal homeostatic case.  This might only be

  • a change in the rate of a transcription or a suppression of expression through RNA.
intracellular_receptor_steroid

intracellular_receptor_steroid

http://www.hartnell.edu/tutorials/biology/images/intracellular_receptor_steroid.jpg

Transduction

Since signaling systems need to be

  • responsive to small concentrations of chemical signals and act quickly,
  • cells often use a multi-step pathway that transmits the signal quickly,
  • while amplifying the signal to numerous molecules at each step.
Signal transduction cascades amplify the signal output

Signal transduction cascades amplify the signal output

Steps in the signal transduction pathway often involve

  • the addition or removal of phosphate groups which results in the activation of proteins.
  • Enzymes that transfer phosphate groups from ATP to a protein are called protein kinases.

Many of the relay molecules in a signal transduction pathway are protein kinases and

  • often act on other protein kinases in the pathway. Often
  • this creates a phosphorylation cascade, where
  • one enzyme phosphorylates another, which then phosphorylates another protein, causing a chain reaction.
phosphorylation-cascade

phosphorylation-cascade

Also important to the phosphorylation cascade are

  • a group of proteins known as protein phosphatases.

Protein phosphatases are enzymes that can rapidly remove phosphate groups from proteins (dephosphorylation) and thus inactivate protein kinases. Protein phosphatases are

  • the “off switch” in the signal transduction pathway.

Phosphorylation Dephosphorylation


Turning the signal transduction pathway off when the signal is no longer present is important

  • to ensure that the cellular response is regulated appropriately.

Dephosphorylation also makes protein kinases

  • available for reuse and
  • enables the cell to respond again when another signal is received.

Kinases are not the only tools used by cells in signal transduction. Small, nonprotein, water-soluble molecules or ions called second messengers (the ligand that binds the receptor is the first messenger) can also

  • relay signals received by receptors on the cell surface
  • to target molecules in the cytoplasm or the nucleus.
membrane protein receptor binds with hormone

membrane protein receptor binds with hormone


insulin receptor and and insulin receptor signaling pathway (IRS)

insulin receptor and and insulin receptor signaling pathway (IRS)


binding-proteins-and-bioavailable-25-hydroxyvitamin-d

binding-proteins-and-bioavailable-25-hydroxyvitamin-d


Examples of second messengers include cyclic AMP (cAMP) and calcium ions.

membrane_receptor_g protein

membrane_receptor_g protein

http://www.hartnell.edu/tutorials/biology/images/membrane_receptor_gprotein.jpg

Response

Cell signaling ultimately leads to the regulation of one or more cellular activities. Regulation of gene expression (turning transcription of specific genes on or off) is a common outcome of cell signaling. A signaling pathway may also

  • regulate the activity of a protein, for example
ion-transporters-and-channels-in-mammalian-choroidal-epithelium

ion-transporters-and-channels-in-mammalian-choroidal-epithelium

Ca(2+) and contraction

Ca(2+) and contraction


transepithelial-electrogenic-ion-transport

transepithelial-electrogenic-ion-transport


calcium release flux

calcium release flux


coupled receptors


  1. opening or closing an ion channel in the plasma membrane or
  2. promoting a change in cell metabolism such as catalyzing the breakdown of glycogen.

Signaling pathways can also lead to important cellular events such as

  • cell division or apoptosis (programmed cell death).
ubiquitylation-is-a-multistep-reaction.

ubiquitylation-is-a-multistep-reaction.


Involvement of VSMCs apoptosis in fibrous plaque rupture.

Involvement of VSMCs apoptosis in fibrous plaque rupture.


G- Protein-Coupled Receptor


membrane_receptor_g protein

membrane_receptor_g protein

Arrestin binding to active GPCR kinase (GRK)-phosphorylated GPCRs blocks G protein coupling

Arrestin binding to active GPCR kinase (GRK)-phosphorylated GPCRs blocks G protein coupling

Signal Transduction Tutorial by Dr. Katherine Harris is licensed under a Creative Commons Attribution-NonCommercial-ShareAlike 3.0 Unported License.

Funded by the U.S. Department of Education, College Cost Reduction and Access (CCRAA) grant award # P031C080096.

http://creativecommons.org/licenses/by-nc-sa/3.0/

  • NonCommercial — You may not use the material for commercial purposes.
  • ShareAlike — If you remix, transform, or build upon the material, you must distribute your contributions under the same license as the original.

Adapt — remix, transform, and build upon the material

hormone + receptor signaling

http://home.earthlink.net/~dayvdanls/SignalTrans.gif

Signal-Transduction-Pathway

http://pi-silico.hkbu.edu.hk/wp-content/uploads/2012/12/Signal-Transduction-Pathway.png

http://upload.wikimedia.org/wikipedia/commons/a/a4/1Signal_Transduction_Pathways_Model.jpg

Akt mTOR pathway

Akt mTOR pathway

http://cc.scu.edu.cn/G2S/eWebEditor/uploadfile/20120810155043970.jpg

Quia – 9AP Chapter 11 – Cell Commun

http://www.quia.com/files/quia/users/lmcgee/membranetransport/cell_communication/reception_transduction_resp.gif

http://cc.scu.edu.cn/G2S/eWebEditor/uploadfile/20120810155043970.jpg

HER2 in Breast Cancer–What Does it Mean?

http://img.medscape.com/fullsize/migrated/editorial/clinupdates/2000/681/tu02.fig2.jpg

Protease signalling: the cutting edge

http://emboj.embopress.org/content/embojnl/31/7/1630/F5.large.jpg

Quia – 9AP Chapter 11 – Cell Commun

http://www.quia.com/files/quia/users/lmcgee/membranetransport/cell_communication/phosphorylation-cascade.gif


Signal Transduction in Autism

http://www.mun.ca/biology/desmid/brian/BIOL2060/BIOL2060-14/1403.jpg

The multiple protein-dependent steps in signal transduction

http://www.nature.com/nrm/journal/v1/n2/images/nrm1100_145a_i2.gif

CONVERSING AT THE CELLULAR LEVEL: AN INTRODUCTION TO SIGNAL …

  1. scq.ubc.ca


http://www.scq.ubc.ca/wp-content/uploads/2006/07/transduction.gif


Biology 1710 > Davis > Flashcards > exam 1 | StudyBlue

  1. studyblue.com


http://classconnection.s3.amazonaws.com/602/flashcards/1005602/png/bio101332955375817.png


Read Full Post »

Signaling and Signaling Pathways

Curator: Larry H. Bernstein, MD, FCAP


http://pharmaceuticalintelligence.com/8-9-2014/Signaling and Signaling Pathways

This portion of the discussion is a series of articles on signaling and signaling pathways. Many of the protein-protein interactions or protein-membrane interactions and associated regulatory features have been referred to previously, but the focus of the discussion or points made were different.  I considered placing this after the discussion of proteins and how they play out their essential role, but this is quite a suitable place for a progression to what follows.  This is introduced by material taken from Wikipedia, which will be followed by a series of mechanisms and examples from the current literature, which give insight into the developments in cell metabolism, with the later goal of separating views introduced by molecular biology and genomics from functional cellular dynamics that are not dependent on the classic view.  The work is vast, and this discussion does not attempt to cover it in great depth.  It is the first in a series.

  1. Signaling and signaling pathways
  2. Signaling transduction tutorial.
  3. Carbohydrate metabolism
  4. Lipid metabolism
  5. Protein synthesis and degradation
  6. Subcellular structure
  7. Impairments in pathological states: endocrine disorders; stress hypermetabolism; cancer.

Signal transduction

(From Wikipedia, the free encyclopedia)
http://en.wikipedia.org/wiki/File:Signal_transduction_publications_graph.jpeg


Signal_transduction_pathways.svg

Signal_transduction_pathways.svg


Signal transduction occurs when an extracellular signaling[1] molecule activates a specific receptor located on the cell surface or inside the cell. In turn, this receptor triggers a biochemical chain of events inside the cell, creating a response.[2] Depending on the cell, the response alters the cell’s metabolism, shape, gene expression, or ability to divide.[3] The signal can be amplified at any step. Thus, one signaling molecule can cause many responses.[4]

In 1970, Martin Rodbell examined the effects of glucagon on a rat’s liver cell membrane receptor. He noted that guanosine triphosphate disassociated glucagon from this receptor and stimulated the G-protein, which strongly influenced the cell’s metabolism. Thus, he deduced that the G-protein is a transducer that accepts glucagon molecules and affects the cell.[5] For this, he shared the 1994 Nobel Prize in Physiology or Medicine with Alfred G. Gilman.

Signal_transduction_publications_graph

Signal_transduction_publications_graph

The earliest MEDLINE entry for “signal transduction” dates from 1972.[6] Some early articles used the terms signal transmission and sensory transduction.[7][8] In 2007, a total of 48,377 scientific papers—including 11,211 e review papers—were published on the subject. The term first appeared in a paper’s title in 1979.[9][10] Widespread use of the term has been traced to a 1980 review article by Rodbell:[5][11] Research papers focusing on signal transduction first appeared in large numbers in the late 1980s and early 1990s.[12]

Notch-mediated juxtacrine signal between adjacent cells.

Notch-mediated juxtacrine signal between adjacent cells.

Signal transduction involves the binding of extracellular signaling molecules and ligands to cell-surface receptors that trigger events inside the cell. The combination of messenger with receptor causes a change in the conformation of the receptor, known as receptor activation. This activation is always the initial step (the cause) leading to the cell’s ultimate responses (effect) to the messenger. Despite the myriad of these ultimate responses, they are all directly due to changes in particular cell proteins. Intracellular signaling cascades can be started through cell-substratum interactions; examples are the integrin that binds ligands in the extracellular matrix and steroids.[13] Most steroid hormones have receptors within the cytoplasm and act by stimulating the binding of their receptors to the promoter region of steroid-responsive genes.[14] Examples of signaling molecules include the hormone melatonin,[15] the neurotransmitter acetylcholine[16] and the cytokine interferon γ.[17]

Signal transduction cascades amplify the signal output

Signal transduction cascades amplify the signal output

Various environmental stimuli exist that initiate signal transmission processes in multicellular organisms; examples include photons hitting cells in the retina of the eye,[20] and odorants binding to odorant receptors in the nasal epithelium.[21] Certain microbial molecules, such as viral nucleotides and protein antigens, can elicit an immune system response against invading pathogens mediated by signal transduction processes. This may occur independent of signal transduction stimulation by other molecules, as is the case for the toll-like receptor. It may occur with help from stimulatory molecules located at the cell surface of other cells, as with T-cell receptor signaling. Unicellular organisms may respond to environmental stimuli through the activation of signal transduction pathways. For example, slime molds secrete cyclic adenosine monophosphate upon starvation, stimulating individual cells in the immediate environment to aggregate,[22] and yeast cells use mating factors to determine the mating types of other cells and to participate in sexual reproduction.[23] Receptors can be roughly divided into two major classes: intracellular receptors and extracellular receptors.

Extracellular

Extracellular receptors are integral transmembrane proteins and make up most receptors. They span the plasma membrane of the cell, with one part of the receptor on the outside of the cell and the other on the inside. Signal transduction occurs as a result of a ligand binding to the outside; the molecule does not pass through the membrane. This binding stimulates a series of events inside the cell; different types of receptor stimulate different responses and receptors typically respond to only the binding of a specific ligand. Upon binding, the ligand induces a change in the conformation of the inside part of the receptor.[24] These result in either the activation of an enzyme in the receptor or the exposure of a binding site for other intracellular signaling proteins within the cell, eventually propagating the signal through the cytoplasm.

In eukaryotic cells, most intracellular proteins activated by a ligand/receptor interaction possess an enzymatic activity; examples include tyrosine kinase and phosphatases. Some of them create second messengers such as cyclic AMP and IP3, the latter controlling the release of intracellular calcium stores into the cytoplasm. Other activated proteins interact with adaptor proteins that facilitate signalling protein interactions and coordination of signalling complexes necessary to respond to a particular stimulus. Enzymes and adaptor proteins are both responsive to various second messenger molecules.

Many adaptor proteins and enzymes activated as part of signal transduction possess specialized protein domains that bind to specific secondary messenger molecules. For example, calcium ions bind to the EF hand domains of calmodulin, allowing it to bind and activate calmodulin-dependent kinase. PIP3 and other phosphoinositides do the same thing to the Pleckstrin homology domains of proteins such as the kinase protein AKT.

G protein-coupled

G protein-coupled receptors (GPCRs) are a family of integral transmembrane proteins that possess seven transmembrane domains and are linked to a heterotrimeric G protein. Many receptors are in this family, including adrenergic receptors and chemokine receptors.

Arrestin binding to active GPCR kinase (GRK)-phosphorylated GPCRs blocks G protein coupling

Arrestin binding to active GPCR kinase (GRK)-phosphorylated GPCRs blocks G protein coupling

Signal transduction by a GPCR begins with an inactive G protein coupled to the receptor; it exists as a heterotrimer consisting of Gα, Gβ, and Gγ.[25] Once the GPCR recognizes a ligand, the conformation of the receptor changes to activate the G protein, causing Gα to bind a molecule of GTP and dissociate from the other two G-protein subunits. The dissociation exposes sites on the subunits that can interact with other molecules.[26] The activated G protein subunits detach from the receptor and initiate signaling from many downstream effector proteins such as phospholipases and ion channels, the latter permitting the release of second messenger molecules.[27] The total strength of signal amplification by a GPCR is determined by the lifetimes of the ligand-receptor complex and receptor-effector protein complex and the deactivation time of the activated receptor and effectors through intrinsic enzymatic activity.

A study was conducted where a point mutation was inserted into the gene encoding the chemokine receptor CXCR2; mutated cells underwent a malignant transformation due to the expression of CXCR2 in an active conformation despite the absence of chemokine-binding. This meant that chemokine receptors can contribute to cancer development.[28]

Tyrosine and histidine kinase

Receptor tyrosine kinases (RTKs) are transmembrane proteins with an intracellular kinase domain and an extracellular domain that binds ligands; examples include growth factor receptors such as the insulin receptor.[29] To perform signal transduction, RTKs need to form dimers in the plasma membrane;[30] the dimer is stabilized by ligands binding to the receptor. The interaction between the cytoplasmic domains stimulates the autophosphorylation of tyrosines within the domains of the RTKs, causing conformational changes. Subsequent to this, the receptors’ kinase domains are activated, initiating phosphorylation signaling cascades of downstream cytoplasmic molecules that facilitate various cellular processes such as cell differentiation and metabolism.[29]

As is the case with GPCRs, proteins that bind GTP play a major role in signal transduction from the activated RTK into the cell. In this case, the G proteins are members of the Ras, Rho, and Raf families, referred to collectively as small G proteins. They act as molecular switches usually tethered to membranes by isoprenyl groups linked to their carboxyl ends. Upon activation, they assign proteins to specific membrane subdomains where they participate in signaling. Activated RTKs in turn activate small G proteins that activate guanine nucleotide exchange factors such as SOS1. Once activated, these exchange factors can activate more small G proteins, thus amplifying the receptor’s initial signal. The mutation of certain RTK genes, as with that of GPCRs, can result in the expression of receptors that exist in a constitutively activate state; such mutated genes may act as oncogenes.[31]

Histidine-specific protein kinases are structurally distinct from other protein kinases and are found in prokaryotes, fungi, and plants as part of a two-component signal transduction mechanism: a phosphate group from ATP is first added to a histidine residue within the kinase, then transferred to an aspartate residue on a receiver domain on a different protein or the kinase itself, thus activating the aspartate residue.[32]

Integrin

integrin-mediated signal transduction

integrin-mediated signal transduction

An overview of integrin-mediated signal transduction, adapted from Hehlgens et al. (2007).[33]

Integrins are produced by a wide variety of cells; they play a role in cell attachment to other cells and the extracellular matrix and in the transduction of signals from extracellular matrix components such as fibronectin and collagen. Ligand binding to the extracellular domain of integrins changes the protein’s conformation, clustering it at the cell membrane to initiate signal transduction. Integrins lack kinase activity; hence, integrin-mediated signal transduction is achieved through a variety of intracellular protein kinases and adaptor molecules, the main coordinator being integrin-linked kinase.[33] As shown in the picture to the right, cooperative integrin-RTK signalling determines the timing of cellular survival, apoptosis, proliferation, and differentiation.

Important differences exist between integrin-signalling in circulating blood cells and non-circulating cells such as epithelial cells; integrins of circulating cells are normally inactive. For example, cell membrane integrins on circulating leukocytes are maintained in an inactive state to avoid epithelial cell attachment; they are activated only in response to stimuli such as those received at the site of an inflammatory response. In a similar manner, integrins at the cell membrane of circulating platelets are normally kept inactive to avoid thrombosis. Epithelial cells (which are non-circulating) normally have active integrins at their cell membrane, helping maintain their stable adhesion to underlying stromal cells that provide signals to maintain normal functioning.[34]

Toll gate

When activated, toll-like receptors (TLRs) take adapter molecules within the cytoplasm of cells in order to propagate a signal. Four adaptor molecules are known to be involved in signaling, which are Myd88, TIRAP, TRIF, and TRAM.[35][36][37] These adapters activate other intracellular molecules such as IRAK1, IRAK4, TBK1[disambiguation needed], and IKKi that amplify the signal, eventually leading to the induction or suppression of genes that cause certain responses. Thousands of genes are activated by TLR signaling, implying that this method constitutes an important gateway for gene modulation.

Ligand-gated ion channel

A ligand-gated ion channel, upon binding with a ligand, changes conformation to open a channel in the cell membrane through which ions relaying signals can pass. An example of this mechanism is found in the receiving cell of a neural synapse. The influx of ions that occurs in response to the opening of these channels induces action potentials, such as those that travel along nerves, by depolarizing the membrane of post-synaptic cells, resulting in the opening of voltage-gated ion channels.

An example of an ion allowed into the cell during a ligand-gated ion channel opening is Ca2+; it acts as a second messenger initiating signal transduction cascades and altering the physiology of the responding cell. This results in amplification of the synapse response between synaptic cells by remodelling the dendritic spines involved in the synapse.

Ion transporters and channels in mammalian choroidal epithelium

Ion transporters and channels in mammalian choroidal epithelium


Intracellular

Extracellular receptors are integral transmembrane proteins and make up most receptors. They span the plasma membrane of the cell, with one part of the receptor on the outside of the cell and the other on the inside. Signal transduction occurs as a result of a ligand binding to the outside; the molecule does not pass through the membrane. This binding stimulates a series of events inside the cell; different types of receptor stimulate different responses and receptors typically respond to only the binding of a specific ligand. Upon binding, the ligand induces a change in the conformation of the inside part of the receptor.[24] These result in either the activation of an enzyme in the receptor or the exposure of a binding site for other intracellular signaling proteins within the cell, eventually propagating the signal through the cytoplasm.

Understanding these receptors and identifying their ligands and the resulting signal transduction pathways represent a major conceptual advance

Understanding these receptors and identifying their ligands and the resulting signal transduction pathways represent a major conceptual advance


intercellular signaling

intercellular signaling


conformational-rearrangements

conformational-rearrangements


membrane protein receptor binds with hormone

membrane protein receptor binds with hormone


The multiple protein-dependent steps in signal transduction

The multiple protein-dependent steps in signal transduction

In eukaryotic cells, most intracellular proteins activated by a ligand/receptor interaction possess an enzymatic activity; examples include tyrosine kinase and phosphatases. Some of them create second messengers such as cyclic AMP and IP3, the latter controlling the release of intracellular calcium stores into the cytoplasm. Other activated proteins interact with adaptor proteins that facilitate signalling protein interactions and coordination of signalling complexes necessary to respond to a particular stimulus. Enzymes and adaptor proteins are both responsive to various second messenger molecules.

Ca++ exchange

Ca++ exchange

Many adaptor proteins and enzymes activated as part of signal transduction possess specialized protein domains that bind to specific secondary messenger molecules. For example, calcium ions bind to the EF hand domains of calmodulin, allowing it to bind and activate calmodulin-dependent kinase. PIP3 and other phosphoinositides do the same thing to the Pleckstrin homology domains of proteins such as the kinase protein AKT.

G protein-coupled

G protein-coupled receptors (GPCRs) are a family of integral transmembrane proteins that possess seven transmembrane domains and are linked to a heterotrimeric G protein. Many receptors are in this family, including adrenergic receptors and chemokine receptors.

membrane_receptor_g protein

membrane_receptor_g protein


intracellular_receptor_steroid

intracellular_receptor_steroid

Signal transduction by a GPCR begins with an inactive G protein coupled to the receptor; it exists as a heterotrimer consisting of Gα, Gβ, and Gγ.[25] Once the GPCR recognizes a ligand, the conformation of the receptor changes to activate the G protein, causing Gα to bind a molecule of GTP and dissociate from the other two G-protein subunits. The dissociation exposes sites on the subunits that can interact with other molecules.[26] The activated G protein subunits detach from the receptor and initiate signaling from many downstream effector proteins such as phospholipases and ion channels, the latter permitting the release of second messenger molecules.[27] The total strength of signal amplification by a GPCR is determined by the lifetimes of the ligand-receptor complex and receptor-effector protein complex and the deactivation time of the activated receptor and effectors through intrinsic enzymatic activity.

A study was conducted where a point mutation was inserted into the gene encoding the chemokine receptor CXCR2; mutated cells underwent a malignant transformation due to the expression of CXCR2 in an active conformation despite the absence of chemokine-binding. This meant that chemokine receptors can contribute to cancer development.[28]

Tyrosine and histidine kinase

Receptor tyrosine kinases (RTKs) are transmembrane proteins with an intracellular kinase domain and an extracellular domain that binds ligands; examples include growth factor receptors such as the insulin receptor.[29] To perform signal transduction, RTKs need to form dimers in the plasma membrane;[30] the dimer is stabilized by ligands binding to the receptor. The interaction between the cytoplasmic domains stimulates the autophosphorylation of tyrosines within the domains of the RTKs, causing conformational changes. Subsequent to this, the receptors’ kinase domains are activated, initiating phosphorylation signaling cascades of downstream cytoplasmic molecules that facilitate various cellular processes such as cell differentiation and metabolism.[29]

insulin-receptor-and-and-insulin-receptor-signaling-pathway-irs

insulin-receptor-and-and-insulin-receptor-signaling-pathway-irs


receptors-regulators

receptors-regulators

phosphorylation-cascade

phosphorylation-cascade


As is the case with GPCRs, proteins that bind GTP play a major role in signal transduction from the activated RTK into the cell. In this case, the G proteins are members of the Ras, Rho, and Raf families, referred to collectively as small G proteins. They act as molecular switches usually tethered to membranes by isoprenyl groups linked to their carboxyl ends. Upon activation, they assign proteins to specific membrane subdomains where they participate in signaling. Activated RTKs in turn activate small G proteins that activate guanine nucleotide exchange factors such as SOS1. Once activated, these exchange factors can activate more small G proteins, thus amplifying the receptor’s initial signal. The mutation of certain RTK genes, as with that of GPCRs, can result in the expression of receptors that exist in a constitutively activate state; such mutated genes may act as oncogenes.[31]

Histidine-specific protein kinases are structurally distinct from other protein kinases and are found in prokaryotes, fungi, and plants as part of a two-component signal transduction mechanism: a phosphate group from ATP is first added to a histidine residue within the kinase, then transferred to an aspartate residue on a receiver domain on a different protein or the kinase itself, thus activating the aspartate residue.[32]


Integrin

integrin-mediated signal transduction

integrin-mediated signal transduction

An overview of integrin-mediated signal transduction, adapted from Hehlgens et al. (2007).[33]

Integrins are produced by a wide variety of cells; they play a role in cell attachment to other cells and the extracellular matrix and in the transduction of signals from extracellular matrix components such as fibronectin and collagen. Ligand binding to the extracellular domain of integrins changes the protein’s conformation, clustering it at the cell membrane to initiate signal transduction. Integrins lack kinase activity; hence, integrin-mediated signal transduction is achieved through a variety of intracellular protein kinases and adaptor molecules, the main coordinator being integrin-linked kinase.[33] As shown in the picture to the right, cooperative integrin-RTK signalling determines the timing of cellular survival, apoptosis, proliferation, and differentiation.

Platelet signaling pathways

Platelet signaling pathways


Protein ubiquitylation

Protein ubiquitylation

ubiquitylation-is-a-multistep-reaction.

ubiquitylation-is-a-multistep-reaction.


Important differences exist between integrin-signaling in circulating blood cells and non-circulating cells such as epithelial cells; integrins of circulating cells are normally inactive. For example, cell membrane integrins on circulating leukocytes are maintained in an inactive state to avoid epithelial cell attachment; they are activated only in response to stimuli such as those received at the site of an inflammatory response. In a similar manner, integrins at the cell membrane of circulating platelets are normally kept inactive to avoid thrombosis. Epithelial cells (which are non-circulating) normally have active integrins at their cell membrane, helping maintain their stable adhesion to underlying stromal cells that provide signals to maintain normal functioning.[34]

Toll gate

When activated, toll-like receptors (TLRs) take adapter molecules within the cytoplasm of cells in order to propagate a signal. Four adaptor molecules are known to be involved in signaling, which are Myd88, TIRAP, TRIF, and TRAM.[35][36][37] These adapters activate other intracellular molecules such as IRAK1, IRAK4, TBK1[disambiguation needed], and IKKi that amplify the signal, eventually leading to the induction or suppression of genes that cause certain responses. Thousands of genes are activated by TLR signaling, implying that this method constitutes an important gateway for gene modulation.


SignalTrans

SignalTrans


Signal-Transduction-Pathway


Ligand-gated ion channel

A ligand-gated ion channel, upon binding with a ligand, changes conformation to open a channel in the cell membrane through which ions relaying signals can pass. An example of this mechanism is found in the receiving cell of a neural synapse. The influx of ions that occurs in response to the opening of these channels induces action potentials, such as those that travel along nerves, by depolarizing the membrane of post-synaptic cells, resulting in the opening of voltage-gated ion channels.

An example of an ion allowed into the cell during a ligand-gated ion channel opening is Ca2+; it acts as a second messenger initiating signal transduction cascades and altering the physiology of the responding cell. This results in amplification of the synapse response between synaptic cells by remodelling the dendritic spines involved in the synapse.

Ion transporters and channels in mammalian choroidal epithelium

Ion transporters and channels in mammalian choroidal epithelium

Intracellular

Intracellular receptors, such as nuclear receptors and cytoplasmic receptors, are soluble proteins localized within their respective areas. The typical ligands for nuclear receptors are lipophilic hormones like the steroid hormones testosterone and progesterone and derivatives of vitamins A and D. To initiate signal transduction, the ligand must pass through the plasma membrane by passive diffusion. On binding with the receptor, the ligands pass through the nuclear membrane into the nucleus, enabling gene transcription and protein production.


Signal Transduction

Signal Transduction


Activated nuclear receptors attach to the DNA at receptor-specific hormone-responsive element (HRE) sequences, located in the promoter region of the genes activated by the hormone-receptor complex. Due to their enabling gene transcription, they are alternatively called inductors of gene expression. All hormones that act by regulation of gene expression have two consequences in their mechanism of action; their effects are produced after a characteristically long period of time and their effects persist for another long period of time, even after their concentration has been reduced to zero, due to a relatively slow turnover of most enzymes and proteins that would either deactivate or terminate ligand binding onto the receptor.

Signal transduction via these receptors involves little proteins, but the details of gene regulation by this method are not well-understood. Nucleic receptors have DNA-binding domains containing zinc fingers and a ligand-binding domain; the zinc fingers stabilize DNA binding by holding its phosphate backbone. DNA sequences that match the receptor are usually hexameric repeats of any kind; the sequences are similar but their orientation and distance differentiate them. The ligand-binding domain is additionally responsible for dimerization of nucleic receptors prior to binding and providing structures for transactivation used for communication with the translational apparatus.


signal-transduction-in-protease-signaling-

signal-transduction-in-protease-signaling-


protein changes in biological mechanisms

protein changes in biological mechanisms


Steroid receptors are a subclass of nuclear receptors located primarily within the cytosol; in the absence of steroids, they cling together in an aporeceptor complex containing chaperone or heatshock proteins (HSPs). The HSPs are necessary to activate the receptor by assisting the protein to fold in a way such that the signal sequence enabling its passage into the nucleus is accessible. Steroid receptors, on the other hand, may be repressive on gene expression when their transactivation domain is hidden; activity can be enhanced by phosphorylation of serine residues at their N-terminal as a result of another signal transduction pathway, a process called crosstalk.

Structure of the N-terminal domain of the yeast Hsp90 chaperone

Structure of the N-terminal domain of the yeast Hsp90 chaperone

Pincer movement of Hsp90 coupled to the ATPase cycle. NTD = N-terminal domain, MD = middle domain, CTD = C-terminal domain.

Pincer movement of Hsp90 coupled to the ATPase cycle. NTD = N-terminal domain, MD = middle domain, CTD = C-terminal domain.

Retinoic acid receptors are another subset of nuclear receptors. They can be activated by an endocrine-synthesized ligand that entered the cell by diffusion, a ligand synthesised from a precursor like retinol brought to the cell through the bloodstream or a completely intracellularly synthesised ligand like prostaglandin. These receptors are located in the nucleus and are not accompanied by HSPs; they repress their gene by binding to their specific DNA sequence when no ligand binds to them, and vice versa.

Certain intracellular receptors of the immune system are cytoplasmic receptors; recently identified NOD-like receptors (NLRs) reside in the cytoplasm of some eukaryotic cells and interact with ligands using a leucine-rich repeat (LRR) motif similar to TLRs. Some of these molecules like NOD2 interact with RIP2 kinase that activates NF-κB signaling, whereas others like NALP3 interact with inflammatory caspases and initiate processing of particular cytokines like interleukin-1β.[38][39]


Cell signaling

signaling pathjways map

signaling pathjways map

Cell signalling is part of a complex system of communication that governs basic cellular activities and coordinates cell actions. The ability of cells to perceive and correctly respond to their microenvironment is the basis of development, tissue repair, and immunity as well as normal tissue homeostasis. Errors in cellular information processing are responsible for diseases such as cancer, autoimmunity, and diabetes. By understanding cell signalling, diseases may be treated effectively and, theoretically, artificial tissues may be created.

Traditional work in biology has focused on studying individual parts of cell signaling pathways. Systems biology research helps us to understand the underlying structure of cell signaling networks and how changes in these networks may affect the transmission and flow of information. Such networks are complex systems in their organization and may exhibit a number of emergent properties. Long-range allostery is often a significant component of cell signaling events.[1]

Enzyme_Model allosterism

Enzyme_Model allosterism

Classification

Signaling within, between, and among cells is subdivided into the following classifications:

  • Intracrine signals are produced by the target cell that stay within the target cell.
  • Autocrine signals are produced by the target cell, are secreted, and effect the target cell itself via receptors. Sometimes autocrine cells can target cells close by if they are the same type of cell as the emitting cell. An example of this are immune cells.
  • Juxtacrine signals target adjacent (touching) cells. These signals are transmitted along cell membranes via protein or lipid components integral to the membrane and are capable of affecting either the emitting cell or cells immediately adjacent.
transepithelial-electrogenic-ion-transport

transepithelial-electrogenic-ion-transport

calcium release calmodulin + ER

calcium release calmodulin + ER


Ca++ exchange

Ca++ exchange

Paracrine bidirectional cardiac fibroblast-myocyte crosstalk

Paracrine bidirectional cardiac fibroblast-myocyte crosstalk

  • Paracrine signals target cells in the vicinity of the emitting cell. Neurotransmitters represent an example.
  • Endocrine signals target distant cells. Endocrine cells produce hormones that travel through the blood to reach all parts of the body.
Notch-mediated juxtacrine signal between adjacent cells.

Notch-mediated juxtacrine signal between adjacent cells.


Notch-mediated juxtacrine signal between adjacent cells.

Some cell–cell communication requires direct cell–cell contact. Some cells can form gap junctions that connect their cytoplasm to the cytoplasm of adjacent cells. In cardiac muscle, gap junctions between adjacent cells allows for action potential propagation from the cardiac pacemaker region of the heart to spread and coordinately cause contraction of the heart.

The notch signaling mechanism is an example of juxtacrine signaling (also known as contact-dependent signaling) in which two adjacent cells must make physical contact in order to communicate. This requirement for direct contact allows for very precise control of cell differentiation during embryonic development. In the worm Caenorhabditis elegans, two cells of the developing gonad each have an equal chance of terminally differentiating or becoming a uterine precursor cell that continues to divide. The choice of which cell continues to divide is controlled by competition of cell surface signals. One cell will happen to produce more of a cell surface protein that activates the Notch receptor on the adjacent cell. This activates a feedback loop or system that reduces Notch expression in the cell that will differentiate and that increases Notch on the surface of the cell that continues as a stem cell.[5]

Many cell signals are carried by molecules that are released by one cell and move to make contact with another cell. Endocrine signals are called hormones. Hormones are produced by endocrine cells and they travel through the blood to reach all parts of the body. Specificity of signaling can be controlled if only some cells can respond to a particular hormone. Paracrine signals such as retinoic acid target only cells in the vicinity of the emitting cell.[6] Neurotransmitters represent another example of a paracrine signal. Some signaling molecules can function as both a hormone and a neurotransmitter. For example, epinephrine and norepinephrine can function as hormones when released from the adrenal gland and are transported to the heart by way of the blood stream. Norepinephrine can also be produced by neurons to function as a neurotransmitter within the brain.[7] Estrogen can be released by the ovary and function as a hormone or act locally via paracrine or autocrine signaling.[8] Active species of oxygen and nitric oxide can also act as cellular messengers. This process is dubbed redox signaling.

Signaling Pathways

Cell Signaling Biology

Michael J. Berridge

Module 2

Cell Signaling Pathways
The nine membrane-bound adenylyl cyclases (AC1–AC9) have a similar domain structure. The single polypeptide has a tandem repeat of six transmembrane domains (TM) with TM1- -TM6 in one repeat and TM7- -TM12 in the other. Each TM cassette is followed by large cytoplasmic domains (C1 and C2), which contain the catalytic regions that convert ATP into cyclic AMP. As shown in the lower panel, the C1 and C2 domains come together to form a heterodimer. The ATP-binding site is located at the interface between these two domains. The soluble AC10 isoform lacks the transmembrane regions, but it retains the C1 and C2 domains that are responsible for catalysis
www.cellsignallingbiology.org  http://www.biochemj.org/csb/002/csb002.pdf


Resources:

Elucidate Target-Specific Pathways With a Suite of Cellular Assays

DiscoveRx® offers a comprehensive collection of cell-based pathway indicator assays designed to detect activation or inhibition of complex signal transduction pathways in response to compound treatment. Based on the proven PathHunter® technology, These biosensor cell lines allow you to measure distinct events within a variety of pathways involved in compound toxicity, cholesterol metabolism, antioxidant function, DNA damage and ER stress. In combination with our biosensor cell lines with fast and simple chemiluminescent detection, DiscoveRx Pathway Signaling assays will help you generate cellular pathway selectivity profiles of your compounds without relying on reporter gene assays or complex phenotypic screens. – See more at: http://www.discoverx.com/targets/signaling-pathways?gclid=CPPrxrrli8ACFSdp7AodO2IADQ#sthash.OhK3iKl4.dpuf

  GPCR Targets ,   Kinase Targets ,   Nuclear Receptors ,   Protease Targets ,   Epigenetic Targets ,   Signaling Pathways –  See more at: http://www.discoverx.com/targets#sthash.KjwWEjjx.dpuf

DiscoveRx® offers a comprehensive collection of cell-based pathway indicator assays designed to detect activation or inhibition of complex signal transduction pathways in response to compound treatment. Based on the proven PathHunter® technology, These biosensor cell lines allow you to measure distinct events within a variety of pathways involved in compound toxicity, cholesterol metabolism, antioxidant function, DNA damage and ER stress. – See more at: http://www.discoverx.com/targets/signaling-pathways#sthash.ZTb5UXVO.dpuf


inhibitors of signal transduction pathway

inhibitors of signal transduction pathway

Inhibitors of MAPK Signaling Pathway

Inhibitors of MAPK Signaling Pathway


jak-stat

jak-stat


Nrf2 signaling in ARE-mediated coordinated activation of defensive genes

Nrf2 signaling in ARE-mediated coordinated activation of defensive genes


Regulation of AMPK

Regulation of AMPK


metabolic pathways

metabolic pathways


On these resource pages you can find signaling pathway diagrams, research overviews, relevant antibody products, publications, and other research resources organized by topic. The pathway diagrams associated with these topics have been assembled by CST scientists and outside experts to provide succinct and current overviews of selected signaling pathways. Please send suggestions for developing new pathways to info@cellsignal.com. Protein nodes in each pathway diagram are linked to specific antibody product information or, optionally, to protein-specific listings in the PhosphoSitePlus® database of post-translational modifications.

http://www.cellsignal.com/common/content/content.jsp?id=science-pathways
http://www.cellsignal.com/common/content/content.jsp?id=pathways-akt-signaling
http://www.cellsignal.com/common/content/content.jsp?id=pathways-mtor-signaling

PI3K / Akt Signaling Overview

 The serine/threonine kinase Akt/PKB exists as three isoforms in mammals. Akt1 has a wide tissue distribution, whereas Akt2 is found predominantly in muscle and fat cells and Akt3 is expressed in testes and brain. Akt regulates multiple biological processes including cell survival, proliferation, growth, and glycogen metabolism. Various growth factors, hormones, and cytokines activate Akt by binding their cognate receptor tyrosine kinase (RTK), cytokine receptor, or GPCR and triggering activation of the lipid kinase PI3K, which generates PIP3 at the plasma membrane. Akt binds PIP3 through its pleckstrin homology (PH) domain, resulting in translocation of Akt to the membrane. Akt is activated through a dual phosphorylation mechanism. PDK1, which is also brought to the membrane through its PH domain, phosphorylates Akt within its activation loop at Thr308. A second phosphorylation at Ser473 within the carboxy terminus is also required for activity and is carried out by the mTOR-rictor complex, mTORC2.

PTEN, a lipid phosphatase that catalyzes the dephosphorylation of PIP3, is a major negative regulator of Akt signaling. Loss of PTEN function has been implicated in many human cancers. Akt activity is also negatively regulated by the phosphatases PP2A and PHLPP, as well as by the chemical modulators wortmannin and LY294002, both of which are inhibitors of PI3K.

Activated Akt phosphorylates a large number of downstream substrates containing the consensus sequence RXRXXS/T. One of its primary functions is to promote cell growth and protein synthesis through regulation of the mTOR signaling pathway. Akt directly phosphorylates and activates mTOR, as well as inhibits the mTOR inhibitor proteins PRAS40 and tuberin (TSC2). Combined, these actions promote cell growth and G1 cell cycle progression through signaling via p70 S6 Kinase and inhibition of 4E-BP1.

Phosphofructokinase mechanism

Phosphofructokinase mechanism

GSK-3 is a primary target of Akt and inhibitory phosphorylation of GSK-3α (Ser21) or GSK-3β (Ser9) has numerous cellular effects such as promoting glycogen metabolism, cell cycle progression, regulation of wnt signaling, and formation of neurofibrillary tangles in Alzheimers disease. Akt promotes cell survival directly by its ability to phosphorylate and inactivate several pro-apoptotic targets, including Bad, Bim, Bax, and the forkhead (FoxO1/3a) transcription factors. Akt also plays an important role in metabolism and insulin signaling. Insulin receptor signaling through Akt promotes Glut4 translocation through activation of AS160 and TBC1D1, resulting in increased glucose uptake. Akt regulates glycolysis through phosphorylation of PFK and hexokinase, and plays a significant role in aerobic glycolysis of cancer cells, also known as the Warburg Effect.

Aberrant Akt signaling is the underlying defect found in several pathologies. Akt is one of the most frequently activated kinases in human cancer as constitutively active Akt can promote unregulated cell proliferation. Abnormalities in Akt2 signaling can result in diabetes due to defects in glucose homeostasis. Akt is also a key player in cardiovascular disease through its role in cardiac growth, angiogenesis, and hypertrophy.

References

  1. Robey RB, Hay N (2009) Is Akt the “Warburg kinase”?-Akt-energy metabolism interactions and oncogenesis. Cancer Biol. 19(1), 25–31.
  2. Zhang S, Yu D (2010) PI(3)king apart PTEN’s role in cancer. Cancer Res. 16(17), 4325–30.
  3. Zoncu R, Efeyan A, Sabatini DM (2011) mTOR: from growth signal integration to cancer, diabetes and ageing. Rev. Mol. Cell Biol. 12(1), 21–35.
  4. Zhang X, Tang N, Hadden TJ, Rishi AK (2011) Akt, FoxO and regulation of apoptosis. Biophys. Acta 1813(11), 1978–86.
  5. Kloet DE, Burgering BM (2011) The PKB/FOXO switch in aging and cancer. Biophys. Acta 1813(11), 1926–37.
  6. Hers I, Vincent EE, Tavars JM (2011) Akt signalling in health and disease. Signal. 23(10), 1515–27.
  7. Wang H, Zhang Q, Wen Q, Zheng Y, Lazarovici P, Philip L, Jiang H, Lin J, Zheng W (2012) Proline-rich Akt substrate of 40kDa (PRAS40): a novel downstream target of PI3k/Akt signaling pathway. Signal. 24(1), 17–24.
  8. Dazert E, Hall MN (2011) mTOR signaling in disease. Opin. Cell Biol. 23(6), 744–55.
  9. Bayley JP, Devilee P (2012) The Warburg effect in 2012. Curr Opin Oncol 24(1), 62–7.


mTOR Signaling Pathway

Akt mTOR pathway

Akt mTOR pathway

The mammalian target of rapamycin (mTOR) is an atypical serine/threonine kinase that is present in two distinct complexes. mTOR complex 1 (mTORC1) is composed of mTOR, Raptor, GβL (mLST8), and Deptor and is partially inhibited by rapamycin. mTORC1 integrates multiple signals reflecting the availability of growth factors, nutrients, or energy to promote either cellular growth when conditions are favorable or catabolic processes during stress or when conditions are unfavorable. Growth factors and hormones (e.g. insulin) signal to mTORC1 via Akt, which inactivates TSC2 to prevent inhibition of mTORC1. Alternatively, low ATP levels lead to the AMPK-dependent activation of TSC2 and phosphorylation of raptor to reduce mTORC1 signaling. Amino acid availability is signaled to mTORC1 via a pathway involving the Rag and Ragulator (LAMTOR1-3) proteins. Active mTORC1 has a number of downstream biological effects including translation of mRNA via the phosphorylation of downstream targets (4E-BP1 and p70 S6 Kinase), suppression of autophagy (Atg13, ULK1), ribosome biogenesis, and activation of transcription leading to mitochondrial metabolism or adipogenesis. The mTOR complex 2 (mTORC2) is composed of mTOR, Rictor, GβL, Sin1, PRR5/Protor-1, and Deptor and promotes cellular survival by activating Akt. mTORC2 also regulates cytoskeletal dynamics by activating PKCα and regulates ion transport and growth via SGK1 phosphorylation. Aberrant mTOR signaling is involved in many disease states including cancer, cardiovascular disease, and metabolic disorders.

Selected Reviews:

We would like to thank Carson Thoreen and Prof. David Sabatini, Whitehead Institute for Biomedical Research, MIT, Cambridge, MA, for reviewing this diagram. revised November 2012

Protein Folding


conformational-rearrangements

conformational-rearrangements

Pincer movement of Hsp90 coupled to the ATPase cycle. NTD = N-terminal domain, MD = middle domain, CTD = C-terminal domain.

Pincer movement of Hsp90 coupled to the ATPase cycle. NTD = N-terminal domain, MD = middle domain, CTD = C-terminal domain.


Heat Shock Proteins (HSPs) form seven families (small HSPs (sHSPs), HSP10, 40, 60, 70, 90, and 100) of molecular chaperone proteins that play a central role in the cellular resistance to stress and actin organization. They are involved in the proper folding of proteins and the recognition and refolding of misfolded proteins. HSP expression is induced by a variety of environmental stresses, including heat, hypoxia, nutrient deficiency, free radicals, toxins, ischemia, and UV radiation. HSP27 is a member of the sHSP family. It is phosphorylated at Ser15, Ser78, and Ser82 by MAPKAPK-2 as a result of the activation of the p38 MAP kinase pathway. Phosphorylation and increased concentration of HSP27 has been implicated in actin polymerization and reorganization. HSP70 and HSP90 interact with unfolded proteins to prevent irreversible aggregation and catalyze the refolding of their substrates in an ATP- and co-chaperone-dependent manner. HSP70 has a broad range of substrates including newly synthesized and denatured proteins, while HSP90 tends to have a more limited subset of substrates, most of which are signaling molecules. HSP70 and HSP90 are also essential for the maturation and inactivation of nuclear hormones and other signaling molecules.

References

  1. Stenmark H (2009) Rab GTPases as coordinators of vesicle traffic. Rev. Mol. Cell Biol. 10(8), 513–25.
  2. Horgan CP, McCaffrey MW (2009) The dynamic Rab11-FIPs. Soc. Trans. 37(Pt 5), 1032–6.
  3. Evans CG, Chang L, Gestwicki JE (2010) Heat shock protein 70 (hsp70) as an emerging drug target. Med. Chem. 53(12), 4585–602.
  4. Lanneau D, Wettstein G, Bonniaud P, Garrido C (2010) Heat shock proteins: cell protection through protein triage. ScientificWorldJournal 10, 1543–52.
  5. Ghayour-Mobarhan M, Saber H, Ferns GA (2012) The potential role of heat shock protein 27 in cardiovascular disease. Chim. Acta 413(1-2), 15–24.
  6. Horgan CP, McCaffrey MW (2011) Rab GTPases and microtubule motors. Soc. Trans. 39(5), 1202–6.
  7. Stenmark H (2009) Rab GTPases as coordinators of vesicle traffic. Rev. Mol. Cell Biol. 10(8), 513–25.
  8. Horgan CP, McCaffrey MW (2009) The dynamic Rab11-FIPs. Soc. Trans. 37(Pt 5), 1032–6.
  9. Evans CG, Chang L, Gestwicki JE (2010) Heat shock protein 70 (hsp70) as an emerging drug target. Med. Chem. 53(12), 4585–602.
  10. Lanneau D, Wettstein G, Bonniaud P, Garrido C (2010) Heat shock proteins: cell protection through protein triage. ScientificWorldJournal 10, 1543–52.
  11. Ghayour-Mobarhan M, Saber H, Ferns GA (2012) The potential role of heat shock protein 27 in cardiovascular disease. Chim. Acta 413(1-2), 15–24.
  12. Horgan CP, McCaffrey MW (2011) Rab GTPases and microtubule motors. Soc. Trans. 39(5), 1202–6

– See more at: http://www.cellsignal.com/common/content/content.jsp?id=protein-folding#sthash.xAfeElH1.dpuf


Read Full Post »

« Newer Posts - Older Posts »