Protein-binding, Protein-Protein interactions & Therapeutic Implications
Writer and Curator: Larry H. Bernstein, MD, FCAP
7.3 Protein-binding, Protein-Protein interactions & Therapeutic Implications
7.3.1 Action at a Distance. Allostery_Delabarre_allostery review
7.3.2 Chemical proteomics approaches to examine novel histone modifications
7.3.3 Misfolded Proteins – from Little Villains to Little Helpers… Against Cancer
7.3.4 Endoplasmic reticulum protein 29 (ERp29) in epithelial cancer
7.3.5 Putting together structures of epidermal growth factor receptors
7.3.6 Complex Relationship between Ligand Binding and Dimerization in the Epidermal Growth Factor Receptor
7.3.7 IGFBP-2.PTEN- A critical interaction for tumors and for general physiology
7.3.8 Emerging-roles-for-the-Ph-sensing-G-protein-coupled-receptor
7.3.9 Protein amino-terminal modifications and proteomic approaches for N-terminal profiling
7.3.10 Protein homeostasis networks in physiology and disease
7.3.11 Proteome sequencing goes deep
7.3.1 Action at a Distance. Allostery_Delabarre_allostery review
DeLaBarre B1, Hurov J1, Cianchetta G1, Murray S1, Dang L2.
Chem Biol. 2014 Sep 18; 21(9):1143-61
http://dx.doi.org:/10.1016/j.chembiol.2014.08.007
Cancer cells must carefully regulate their metabolism to maintain growth and division under varying nutrient and oxygen levels. Compelling data support the investigation of numerous enzymes as therapeutic targets to exploit metabolic vulnerabilities common to several cancer types. We discuss the rationale for developing such drugs and review three targets with central roles in metabolic pathways crucial for cancer cell growth: pyruvate kinase muscle isozyme splice variant 2 (PKM2) in glycolysis, glutaminase in glutaminolysis, and mutations in isocitrate dehydrogenase 1 and 2 isozymes (IDH1/2) in the tricarboxylic acid cycle. These targets exemplify the drugging approach to cancer metabolism, with allosteric modulation being the common theme. The first glutaminase and mutant IDH1/2 inhibitors have entered clinical testing, and early data are promising. Cancer metabolism provides a wealth of novel targets, and targeting allosteric sites promises to yield selective drugs with the potential to transform clinical outcomes across many cancer types.
Based on knowledge acquired to date, there is no doubt that cancer metabolism provides a wealth of novel therapeutic targets and multiple innovative ways in which to exploit metabolic vulnerabilities for therapeutic benefit. More comprehensive reviews cover the breadth of metabolic targets that are currently under investigation (Stine and Dang, 2013; Vander Heiden, 2011). The following sections of this review focus on PKM2, glutaminase, and mutated IDH1/2 as exemplary metabolism targets under investigation for development of cancer therapies.
Drugging Glycolysis: Targeting Pyruvate Kinase Muscle Isozyme Alternative Splice Variant 2 PK catalyzes the last step of glycolysis, converting phosphoenolpyruvate (PEP) to pyruvate, while producing one molecule of ATP. The reaction encompasses two chemical steps: the first involves a phosphoryl transfer from PEP to ADP, forming an enolate intermediate and ATP, and the second involves protonation of the enolate intermediate, forming pyruvate (Robinson and Rose, 1972). PKM2 is one of four PK isoforms in humans. PKM1 and PKM2 result from the alternative splicing of exons 9 and 10 of the PKM gene, which encode a stretch of amino acids that differ at 23 positions between PKM1 and PKM2. PKM1 is constitutively active in skeletal muscle and brain tissue, but is not allosterically regulated. PKM2 is expressed in fetal and proliferating tissues, has low basal activity compared with PKM1, and is allosterically regulated. R-type pyruvate kinase (PKR) and L-type pyruvate kinase (PKL) are transcribed via different promoters from the PKLR gene. PKR is expressed in erythrocytes and PKL in the liver. PKR, PKL, and PKM1 exist as stable tetramers,whereas PKM2 forms tetramers (high activity form), dimers (low activity form), and monomers (Mazurek, 2011).
Figure 1. Central Metabolic Pathways Utilized by Cancer Cells *denotes mutated isoenzyme.
Pyruvate Kinase Muscle Isozyme Alternative Splice Variant 2 in Cancer Cell Metabolism Cancer cells predominantly express PKM2, which can be downregulated by tyrosine kinase growth factor signaling pathways, allowing metabolic flexibility. Phosphotyrosine peptides have been shown to suppress PKM2 activity by binding tightly to PKM2, thereby catalyzing the release of fructose 1,6-bisphosphate (FBP), resulting in a switch to the low activity dimer state (Christofk et al., 2008b; Hitosugi et al., 2009). This downregulation is thought to support tumor growth and proliferation by allowing for the shunting of glycolytic intermediates toward other biosynthetic pathways (i.e., pentose phosphate and serine pathways). In keeping with this model, the activation of PKM2 in cancer cells using small molecule agonists resulted in serine auxotrophy (Kung et al., 2012). Consistent with the hypothesis that PKM2 is a critical metabolic switch, there is growing evidence that, depending on the cellular stress environment, PKM2activity canberegulated byposttranslational modification such as acetylation (Lv et al., 2011), phosphorylation (Hitosugi et al., 2009), cysteine oxidation (Anastasiou et al., 2011), and proline hydroxylation (Luo et al., 2011). The utility of PKM2 activators in the clinic has yet to be determined, but recent work with tumor xenografts with a PKM2 activator suggests that this may be a viable approach (Parnell et al., 2013). As PKM2 tetramers show greater than 50-fold higher activity than PKM2 monomers (Anastasiou et al., 2012), one consideration when designing drugs to activate PKM2 for therapeutic means would be the need for small-molecule ligands capable of driving the enzyme toward its optimally active tetrameric form, thus forcing cancer cells into a less flexible metabolic state.
Structure of Pyruvate Kinase Muscle Isozyme Alternative Splice Variant 2 The structure of the PKM2 tetramer is summarized in Figure 2A. PKM2 is allosterically activated in a ‘‘feedforward’’ manner by the upstream glycolytic metabolite, FBP, which induces a shift to the active tetrameric conformation (Christofk et al., 2008b; Dombrauckas et al., 2005). PKM2 can be independently allosterically activated by serine (Chaneton et al., 2012), which binds in a distinct pocket that can also accommodate the inhibitor phenylalanine (Protein Data Bank [PDB] ID: 4FXJ). The binding of phenylalanine results in a tetrameric form distinct from the active conformer (Morgan et al., 2013). It is not clear how the change from serine to phenylalanine elicits such a dramatic change in protein behavior, or whether there is any biological interaction between serine activation and phenylalanine inhibition of PKM2 in cancer cells. Of note, PKM1 and PKL/R are not activated by serine, despite the conservation of the serine binding site in all PK isoforms.
Figure 2. Three Different Metabolic Enzymes and Their Allosteric Inhibitors Protomers are depicted as cartoon ribbons in blue, green, yellow, and cyan. Synthetic allostery is depicted in stick format with red highlight. (A) Structure of tetrameric PKM2:AGI-980 (4:2 complex) from PDB 4G1N. AGI-980 is shown in stick rendering near the center of tetramer. Each PK monomer consists of four domains, usually designated A, B, C, and N (Dombrauckas et al., 2005). The tetramer is a dimer-of-dimers with approximate D2 symmetry. The dimer is formed between the A domains of each monomer, while the tetramer is formed via dimerization along the C subunit interfaces of each dimer. The active site of PKM2 lies within a cleft between the A and B domain, illustrated by a PEP analog (red spheres). The FBP binding pocket is located entirely within the C domain (pink spheres). The natural allosteric site of serine is also shown (black spheres). (B)Tetrameric GAC:BPTES (4:2 complex) from PDB 3UO9. Glutamate molecules are shown as spheres. (C) Dimeric IDH2R140Q:AGI-6780 (2:1 complex) from PDB 4JA8 (Wang et al., 2013). NADP molecules are shown as spheres.
Discovery of Allosteric Activators of Pyruvate Kinase Muscle Isozyme Alternative Splice Variant 2 A number of small molecules that potently activate PKM2 have been discovered by various groups (Table 1). Interestingly, all seven X-rayco-complexescurrentlyavailableshowcompoundsbound at a novel binding pocket distinct from the FBP and serine binding sites, which would otherwise allow cells to overcome negative regulation by phosphotyrosines (Kung et al., 2012). The compounds found in structures 3GQY, 3GR4 (Boxer et al., 2010), 3H6O (Jiang et al., 2010), 3ME3, and 3U2Z (Anastasiou et al., 2012) were identified by screening the NIH Small Molecule Repository, and can be classified into two distinct chemical series, both of which establish very similar interactions with PKM2 (Table 1). Analogues in these two classes selectively activated PKM2 allosterically with good selectivity against PKM1, PKL, and PKR (Anastasiou et al., 2012; Boxer et al., 2010; Jiang et al., 2010). The molecule found in the structure 4JPG (Guo et al., 2013) is similar to the two series described above, where the pyrimidone ring is found between the two Phe26 residues (Table 1). Interestingly, the activator found in the 4G1N structure (Kung et al., 2012) sits in the same pocket as the NIH compounds. However, the interactions are quite different, with the side chains of the two Phe26 that line the pocket assuming distinct conformations. This activator wraps around the two aromatic residues, which pushes it closer to the walls of the pocket, allowing for a richer series of interactions with PKM2 (Table 1). There are two additional series of PKM2 activators that have been reported for which no structural information is available (Table 1)(Parnell et al., 2013; Xu et al., 2014; Yacovan et al., 2012). Members of this series were shown to have an activation level comparable to that of FBP, with selectivity for PKM2 over PKL, PKR, and PKM1. PKM2 offers a very interesting example of an allosterically regulated enzyme. Different allosteric sites have so far been identified for three different types of activator (FBP, serine, and small-molecule ligands) and all activate PKM2 by stabilizing the tetrameric form. It is remarkable that molecules as small as serine can dramatically alter this protein’s conformational landscape and aggregation state and lead to an active enzyme. This unusual allosteric site revealed by the small-molecule ligands is of particular curiosity, largely because neither its function nor its native ligands are known. All of the drug-like activators described above bind at the dimer–dimer interface and seem to act by displacing water from the mainly apolar pocket, thus contributing to the stabilization of the tetramer. While these PKM2 activators show promising preclinical data, none have yet entered clinical development.
Table 1. Biochemical Properties of Small Molecule PKM2 Inhibitors Series PDB ID Ligand Reference Binding Characteristics
Substituted N,N’diarylsulfonamide 3GQY (Boxer et al., 2010)
- All completely buried within A-A’ interface, 35A ˚ from FBP pocket
- Binding pocket lined with residues equivalent to those of PKM2 molecules forming A-A’ interface
- All sandwiched between phenyl rings of the two Phe26 from different monomers
- All additionally interact with side chain of Phe26 through slightly distorted T-shaped p-p interactions (two such interactions for substituted N,N0diarylsulfonamides and one for thieno[3,2-b]pyrrole[3,2-] pyridazinones)
- 3GR4 (Boxer et al., 2010) 3ME3 (Anastasiou et al., 2012)
- Thieno[3,2-b]pyrrole [3,2-d]pyridazinone 3H6O (Jiang et al., 2010)
- 3U2Z (Anastasiou et al., 2012)
- 2-((1H-benzo[d]imidazol1-yl)methyl)-4H-pyrido [1,2-a]pyrimidin-4-ones
- 4JPG (Guo et al., 2013)
- Pyrimidone ring found between the two Phe26 residues forming p-p interactions with the aromatic rings
- Carbonyl interacts with a bridging water molecule
- Benzimidazole reaches a region of the activator pocket that is not occupied in any of the published crystal structures
- One of the imidazole nitrogens forms an H-bond with Lys311, which is normally part of a salt bridge to Asp354
Quinolone sulfonamides 4G1N (Kung et al., 2012)
- Quinoline moiety sits on a flat, mainly apolar surface defined by Phe26, Leu27 and Met30 from chain A and Phe26, Tyr390 and Leu394 from chain A’
- One of the two oxygen atoms of the sulfonamide accepts an H bond from the backbone oxygen of Tyr390, the other interacts with a water molecule
- The oxygen of the amide moiety forms an H-bond with side-chain nitrogen of Lys311
- Terminal aromatic ring sits in the other copy of the quinoline pocket d Aromatic rings of the side chains of the two Phe26 lining the pocket almost perpendicular (not parallel); activator wrapped around the two aromatic residues
3-(trifluoromethyl)-1Hpyrazole-5-carboxamide (Parnell et al., 2013; Xu et al., 2014)
- Cocrystal structure of one compound bound to tetrameric PKM2 obtained but file not available for download from PDB: described as bound to the allosteric site at the dimer–dimer interface
5-((2,3-dihydrobenzo[b] [1,4]dioxin-6-yl)sulfonyl)-2methyl-1-(methylsulfonyl) indoline scaffold (Yacovan et al., 2012)
- Cocrystal structure of one compound bound to PKM2 obtained but not available for download from the PDB: described as bound to dimer interface
- Interactions very similar to those established by thieno [3,2-b]pyrrole[3,2-d]pyridazinone series above
Drugging Glutaminolysis: Targeting the Glutaminase C Variant Glutaminase catalyzes the conversion of glutamine to glutamate and ammonia. Glutamate can be oxidized to a-ketoglutarate (aKG), which then anaplerotically feeds into the TCA cycle as a means of providing proliferating cells with biosynthetic intermediates and ATP (Figure 1); glutamate is also used as a substrate for the generation of glutathione, which provides protection from redox stress (Hensley et al., 2013; Shanware et al., 2011). The ammonia produced during the reaction can be used in certain tissues like the kidney to provide pH homeostasis, and nitrogen derived from glutamine is utilized in nucleotide biosynthetic and glycosylation pathways.
Table 2. Characteristics of Small Molecule Glutaminase Inhibitors
BPTES N-(5–[1,3,4]thiadiazol-2yl)-2-phenylacetamide 6 (Shukla et al., 2012)
- Similar potency but better water solubility vs. BPTES d Attenuated growth of P493 human lymphoma B cells in vitro d Diminished tumor growth in P493 tumor xenograft SCID mice with no apparent toxicity
CB-839 (Calithera) (Gross et al., 2014)
- Orally bioavailable d Binds at allosteric sites of GLS1 KGA and GAC d Potent, selective, time-dependent reversible inhibition with slow recovery time
- Anti-proliferative activity (double-digit nM potency) in cellular proliferation assays in wide range of tumors
- Currently in Phase I trials of locally-advanced/metastatic refractory solid tumors (triple negative breast cancer, NSCLC, RCC, mesothelioma) and hematological cancers [Clinicaltrials.gov: NCT02071927, NCT02071862, NCT02071888]
Dibenzophenanthridines Compound 968 (Katt et al., 2012; Wang et al., 2010)
- Modest potency in the low mM concentrations d Loses all inhibitory activity against glutaminase activated by preincubation with inorganic phosphate (phosphate does not affect BPTES potency)
- Anti-proliferative activity in breast cancer cell line at 10 mmol/L concentration
There are three isoforms of IDH. IDH1 is located in both the peroxisome and the cytosol, whereas IDH2 and IDH3 are located in mitochondria. It is unclear what the relative contributions of the IDH2 and IDH3 isoforms are to overall mitochondrial TCA function. IDH1 and IDH2 are both obligatory homodimeric proteins and use NADP+ as a cofactor, whereas IDH3 uses NAD+ as a cofactor and is a heterotrimeric protein comprising alpha, beta, and gamma subunits. All three isozymes require either Mg2+ or Mn2+ asdivalent metal cofactors for catalysis.The dimeric structure of IDH2 is shown in Figure 2C.
Mutant Isocitrate Dehydrogenase in Cancer Cell Metabolism The role of IDH mutations in cancer metabolism was recognized following the observation of frequent and recurrent mutations of IDH1 and IDH2 in patients with glioma and AML, initially identified by genomic deep sequencing and subsequent comparative genetic analyses (Parsons et al., 2008; Yan et al., 2009). These mutations were originally characterized as loss of function (Mardis etal.,2009; Parsonsetal.,2008; Yanet al.,2009), suggesting that mutated IDH acts as a tumor suppressor due to the loss of catalytic conversion of isocitrate to aKG (Zhaoetal., 2009). However, with the exception of cases of haploinsufficiency, the heterozygous mutation pattern of IDH is more consistent with an oncogene role. Subsequently, IDH mutations were shown to possess the neomorphic activity to generate the oncometabolite, 2-hydroxyglutarate (2HG) (Dang et al., 2009; Gross et al., 2010; Ward et al., 2010). With a single codon substitution, the kinetic properties of the mutant IDH isozyme are significantly altered, resulting in an obligatory sequential ordered reaction in the reverse direction (Rendina et al., 2013). Indeed, the critical kinetic observation of mutant IDH was not only the loss of affinity for isocitrate, but also a dramatic increase in NADPH affinity by three orders of magnitude (Dang et al.,2009), suggesting a substantial change in protein dynamics imparted by the mutation. The only known homeostatic 2HG clearance mechanism is the relatively inefficient reconversion of 2HG back to aKG by D-2hydroxyglutarate dehydrogenase. Therefore, 2HG accumulates when over-produced by mutant IDH. 2HG itself has been shown to be sufficient to drive the malignant phenotype (Rakheja et al., 2013). Abnormally high 2HG levels impair aKG-dependent dioxygenases through competitive inhibition, including those that modify DNA and histones (i.e., Jumonji domain-containing histone demethylases and the ten-eleven translocation (TET) family of 50-methylcytosine hydroxylases) (Chowdhury et al., 2011; Figueroa et al., 2010), as well as EglN prolyl hydroxylase in regulating hypoxia-inducible factor (Losman et al., 2013). This results in altered epigenetic status that blocks cell differentiation. These findings, combined with the inhibitory effects of fumarate and succinate on the same families of aKG-dependent enzymes, highlight a critical and fascinatingnetwork that ties together central metabolic pathways and epigenetic control. Remarkably, mutations in TET2 are mutually exclusive with IDH mutations in AML, strongly suggesting that, in this context, the tumorigenic effects of 2HG are at least in part driven by inhibition of TET2. The precise targets of IDH mutations with associated 2HG production (and TET2 mutations) that promote tumorigenesis are currentlyunknown;however,itisclearthatIDH1/2andTET2mutations lead to a block in hematopoietic cell differentiation (Figueroa et al., 2010; Lu et al., 2012; Moran-Crusio et al., 2011; Wang et al., 2013). To date, no IDH3 mutation associated with cancer has been reported (Krell et al., 2011; Reitman and Yan, 2010), suggesting that the role of IDH1/2 has a greater impact on tumorigenesis. Targeting mutated isoforms of IDH1/2 therefore presents a logical approach to cancer therapy. A consideration in designing suchdrugsistheheterozygoussomaticnatureoftheIDH1/2mutation, which likely yields a mixture of homo- and heterodimers; statistically, heterodimers should be the major species in vivo. Mutant homodimers and wild-type-mutant heterodimers both efficiently catalyze the production of 2HG from aKG (Dang et al., 2009; Rendina et al., 2013). However, the heterodimer is potentially more oncogenic, as it is more efficient at producing 2HG than homodimeric mutants (Pietrak et al., 2011) due to an increased local concentration of substrate while conserving NADPH. The heterodimer as a molecular target therefore becomes an important consideration in this scenario.
Structure of Isocitrate Dehydrogenase Structurally, both IDH1 and IDH2 comprise three main domains: the large domain, the small domain, and the clasp region (Yang et al., 2010). A simplified description of protein motion is provided in Figure 3 (Rendina et al., 2013; Xu et al., 2004). The dynamic of motion may differ slightly between IDH1 and IDH2 mutants. IDH1 mutants appear to open wider than IDH2 mutants to the point of unwinding a helix termed ‘‘seg2’’ (Yang et al., 2010). In contrast, the open form of IDH2 does not involve the melting of any secondary structure, and as a consequence has a much narrower range of motion (Taylor et al., 2008; Wang et al., 2013). This differential in protein dynamics could possibly explain the differential responses of IDH1 and IDH2 to inhibitors. X-ray structures of IDH3 have not yet been reported, but it appears to be distinct from IDH1 and IDH2 in terms of primary sequence and predicted quaternary organization (Kim et al., 1995; Ramachandran and Colman, 1980). There are three arginine residues in the enzyme active site that are predicted to play a central role in electrostatic stabilization and proper geometric orientation of isocitrate via its acidic moieties as the substrate binds in the active site. With the exception of the novel G97D or G97N codon mutation (Ward et al., 2012), virtually all confirmed IDH mutations that generate high levels of 2HG occur in one of these arginines (i.e., IDH1-R132 and IDH2-R172/R140) (Losman and Kaelin, 2013) and have in common a substitution of one of the diffuse positive charges of the respective arginine’s guanidinium moiety.
Discovery of Inhibitors against Mutated Isocitrate Dehydrogenase Several inhibitors of mutant IDH isoforms that block 2HG production in vitro and in vivo have been recently described. The first potent and specific IDH1 inhibitors reported were the phenylglycine series, specifically AGI-5198 (Popovici-Muller et al., 2012; Rohle et al., 2013) and subsequently ML309 (Davis et al., 2014)(Table 3), which were shown to be rapid-equilibrium inhibitors specific for IDH1-R132-codon mutations. These compounds inhibited IDH1-R132H competitively with respect to aKG and uncompetitively with respect to NADPH, suggesting that they preferably bind to the enzyme-NADPH ternary complex. Notably, they do not appreciably cross-react against the IDH2-R140Q mutant isozyme, suggesting a unique binding mode in IDH1-R132 that does not favorably exist in IDH2R140. Because no X-ray co-complex has been reported for this series, the exact mode of binding cannot be ascertained at this time. Preclinical data indicated 2HG inhibition and antitumor effects in vitro and in vivo (Table 3). These phenylglycine compounds appear to be excellent chemical tools for tumor biology investigation, but optimization of their properties is likely required for further therapeutic development. Co-complexes of IDH1-R132H with two different 1-hydroxypyridin-2-one inhibitors have been reported (Zheng et al., 2013), but the quality of the crystal structure data supporting the mechanism of inhibition is poor. AG-120, a selective, potent inhibitor of mutated IDH1, is currently in clinical development for the treatment of cancers with IDH1 mutations (Table 3), but there is currently no published information on this inhibitor. Another inhibitor of mutated IDH1 has been reported recently (Table 3) (Deng et al., 2014). Co-complex X-ray studies revealed that Compound1 binds mutated IDH1 allosterically at the dimer interface resulting in an asymmetric open conformation. Distinctively, Compound 1 displaces the conserved catalytic Tyr139 and further disrupts the Mg2+ binding network, consistent with kinetic results of competitive inhibition with respect to Mg2+, but not with aKG substrate. Others have reported modeling of inhibitors into the active site of IDH1, but experimental evidence is lacking (Chaturvedi et al., 2013; Davis et al., 2014). The first reported potent and selective IDH2 inhibitor was the urea-sulfonamide series, AGI-6780 (Wang et al., 2013), a timedependent slow-tight binder to IDH2-R140Q exhibiting noncompetitive inhibition with respect to substrate and uncompetitive inhibition with respect to NADPH, and nanomolar potency for 2HG inhibition (Table 3). This compound showed good inhibitory selectivity for IDH2-R140Q, with no effect on the closely related IDH1 and IDH1-R132H isozymes. At doses that effectively blocked 2HG to basal levels, AGI-6780 induced differentiation of TF-1 erythroleukemia and primary human AML cells in vitro, suggesting potential to reverse leukemic phenotype in AML tumors harboring the IDH2 mutation. Unlike the case of IDH1 above, the published structure of AGI-6780 co-complexed with IDH2-R140Q allows for detailed analysis of its inhibitory mechanism (Wang et al., 2013). In the X-ray structure, a single molecule
of AGI-6780 binds at the interface of two protomers (Figure 2C). The allosteric inhibition appears to arise from the ability of AGI6780 to keep the IDH2-R140Q mutant enzyme in an open orientation, thereby preventing the NADPH cofactor and substrate aKG from coming close to the catalytic Mg2+ binding site (see Figure 3). The highly symmetric AGI-6780 binding pocket extends deep into the protein interface and is closed over by loops composed of residues 152–167, which also fold over the binding pocket, providing anexplanation for the time-dependent inhibition kinetics. AGI-6780 makes several direct H-bond interactions from its urea group and amide nitrogen to Gln316, but a significant amount of binding energy arises from van der Waals contacts between the protein and hydrophobic surfaces of AGI-6780. The in vivo potential for this compound is not known, since its pharmacokinetic properties were not reported. Nevertheless, this effective mode of inhibition serves as an important molecular model for the design of bioisosteric compounds. OtherIDH2inhibitorsareunderdevelopment,notablyAG-221, a first-in-class, orally available inhibitor (Table 3) which demonstrated a survival advantage in a preclinical study of a primary human IDH2 mutant AML xenograft mouse model (Yen et al., 2013). Early phase I clinical trial data for AG-221 show promise, with meaningful clinical responses in evaluable AML patients harboring IDH2 mutations (Stein et al., 2014). To date, there is no published example of a molecule that inhibits both IDH1 and IDH2 mutant isoforms with equipotency.
Table 3.Characteristics of Small Molecule Inhibitors of Mutant IDH
PhenylglycineAGI-5198 (Popovici-Mulleretal., 2012; Rohleetal.,2013)
N-cyclohexyl-2-(N-(3-fluorophenyl)-2(2-methyl-1H-imidazol-1-yl)acetamido)2-(o-tolyl)acetamide IDH1-R132H
- Good potency against enzyme and in U87cell line overexpressing R132H mutation (IC50= 70nM)
- Good oral exposure in rodents at high doses (>300mg/kg), which were likely at levels saturating hepatic clearance mechanisms
- Plasma 2HG inhibition > 90% (BID dosing) in xenograft model of U87-R132H tumors
- Promoted differentiation of glioma cells via induced demethylation of histone H3K9me3 and expression of genes associated with gliogenic differentiation at near-complete 2HG inhibition
- inhibited plasma 2HG and delayed growth of IDH1-mutant but not wild-type glioma xenografts in mice
ML309 (Davis et al.,2014)
2-(2-(1H-benzo[d]imidazol-1-yl)-N-(3fluorophenyl)acetamido)-N-cyclopentyl2-o-tolylacetamide IDH1-R132H IDH1-R132C dIC50=68nM(R132H)
- Inhibited 2HG production in glioblastoma cell line (IC50 = 250 nM) with minimal cytotoxicity
- 1-hydroxypyridin2-one Compounds2and3 (Zhengetal.,2013)
6-substituted1-hydroxypyridin-2-oneIDH1-R132H IDH1-R132C
- K i= 190 and 280 nM (forR132H)
- Inhibited production of 2HG in IDH1 mutated cells
Undisclosed
AG-120 (Agios)
Undisclosed
IDH1
- Orally available, selective, potent inhibitor
- PhaseI studies ongoing in advanced solid tumors (NCT02073994; NCT02074839)
Allostery as an Approach to Drugging Metabolic Enzymes Is Important in Cancer All enzymes discussed in this article are allosterically targeted by small molecule modulators. With the exception of the enzymes of lipid metabolism, it is striking that there are very few examples of the regulation of metabolic enzymes by drug-like molecules at the catalytic site. We believe that this observation will hold true for the wider set of metabolic enzymes. Metabolic pathways are typically regulated by upstream and downstream metabolites through feedforward and feedback mechanisms. This regulation occurs typically through binding at allosteric sites, which have distinctly different properties relative to active sites. Therefore regulation can come from effectors that may have very different properties to the substrate. This review describes the potential therapeutic impact of specific allosteric regulators of PKM2, glutaminase, and IDH. Additionally, preclinical studies of tool compounds demonstrated that allosteric regulators of other enzymes involved in cancer cell metabolism could provide more therapeutic opportunities (Table 4). Substrates and products of metabolic enzymes tend to be small and very polar, and often include crucial metal ions and their ligands, so it is likely that targeting their catalytic pockets will yield molecules with similar properties. From a drug-discovery point of view, targeting allosteric sites is appealing as hydrophilic substrate-binding sites are generally not hospitable to strong interactions with small molecule drugs, which gain potency to a large extent through hydrophobic interactions. In addition, as activity of most metabolic enzymes is regulated by multimerization, the formation of multimers provides opportunity for binding sites to form at protein–protein interfaces.
Table 4. Examples of Allostery in Cancer Cell Metabolism
TH Tyrosine hydroxylase Haloperidol Activator Catecholamine metabolism (Casu and Gale, 1981)
PDK1 Pyruvate dehydrogenase
kinase isozyme1 3,5-diphenylpent-2-enoicacids Activator TCAcycle (Stroba et al., 2009)
BCKDK Branched chain keto acid
dehydrogenase kinase (S)-a-chloro-phenylpropionicacid[(S)-CPP] Inhibitor Branch-chain amino acid (Tso et al., 2013)
ACACA Acetyl-CoA carboxylase
alpha 5-tetradecyloxy-2-furoicacid (TOFA) Inhibitor Fatty acid synthesis (Wang et al.,2009)
FBP1 Fructose-1,6
bisphosphatase1 Benzoxazole benzene sulfonamide1 Inhibitor Glycolysis (von Geldern et al., 2006)
ALADA minolevulinate
dehydratase wALAD in1 benzimidazoles Inhibitor Haem synthesis (Lentz et al., 2014)
TYR Tyrosinase 2,3-dithiopropanol Inhibitor Melanin metabolism (Wood and Schallreuter, 1991)
DBHD opamine beta
hydroxylase-2H-phthalazinehydrazone (hydralazine;HYD)
2-1H-pyridinonehydrazone (2-hydrazinopyridine;HP)
2-quinoline-carboxylicacid (QCA)
1H-imidazole-4-aceticacid (imidazole-4-aceticacid;IAA) Inhibitor Neurotransmitter synthesis (Townes et al.,1990)
DCTD dCMP
deaminase 5-iodo-2’-deoxyuridine5’-triphosphate Inhibitor Nucleotide metabolism (Prusoff and Chang, 1968)
TYMP Thymidine
phosphorylase 5’-O-tritylinosine (KIN59) Inhibitor Nucleotide metabolism (Casanova et al.,2006)
TYMS Thymidylate
synthase 1,3-propanediphosphonicacid (PDPA) Inhibitor Nucleotide metabolism (Lovelace et al.,2007)
Figure 3. Simplified Description of IDH Protein Motion The large domain (residues 1–103 and 286–414) forms nearly all of the NADPH cofactor binding residues and roughly half of the substrate binding residues.The small domain(residues 104–136 and 186–285) contains the remaining substrate binding residues and the metal binding residues. The interface between the two protomers is formed by both the small domain and the clasp region (residues 137–185). The large domain moves away from the small domain to facilitate NADPH cofactor exchange and substrate binding. The large domain then closes up against the small domain, thereby completing the substrate binding pocket and bringing the cofactor, substrate, and metal into close contact with each other and with the key catalytic residues to facilitate hydride transfer between substrate and cofactor and enzyme-assisted carboxylation/decarboxylation. Subsequent opening of the large domain from the small domain would enable product release and cofactor exchange to complete the catalytic cycle (Rendina et al., 2013; Xu et al., 2004).
7.3.2 Chemical proteomics approaches to examine novel histone modifications
Xin Li, Xiang David Li
Current Opinion in Chemical Biology Feb 2015; 24:80–90
http://dx.doi.org/10.1016/j.cbpa.2014.10.015
Highlights
- A variety of novel histone PTMs have been identified by MS-based methods.
- Regulatory mechanisms and cellular functions of most novel histone PTMs remain unknown, due to lack of knowledge about their readers, erasers and writers.
- Chemical proteomics approaches provide valuable tools to characterize novel histone PTMs.
- The application of photoaffinity probes helps the profiling of histone PTMs’ readers, erasers and writers.
Histone posttranslational modifications (PTMs) play key roles in the regulation of many fundamental cellular processes, such as gene transcription, DNA damage repair and chromosome segregation. Significant progress has been made on the detection of a large variety of PTMs on histones. However, the identification of these PTMs’ regulating enzymes (i.e. ‘writers’ and ‘erasers’) and functional binding partners (i.e. ‘readers’) have been a relatively slow-paced process. As a result, cellular functions and regulatory mechanisms of many histone PTMs, particularly the newly identified ones, remain poorly understood. This review focuses on the recent progress in developing chemical proteomics approaches to profile readers, erasers and writers of histone PTMs. One of such efforts involves the development of the Cross-Linking-Assisted and SILAC-based Protein Identification (CLASPI) approach to examine PTM-mediated protein–protein interactions.
Table 1 Novel histone PTMs functions
1 Lysine formylation Arising from oxidative damage of DNA modification sites overlap with lysine acetylation and methylation, potentially interfere with normal regulation of these PTMs
2 Lysine propionylation p300,c CREB-binding protein,c Sirt1,c Sirt2,c Sirt3c
Structurally similar with lysine acetylation, regulated by same set of enzymes, H3K23pr may be regulatory for cell metabolism
3 Lysine butyrylation p300,c CREB-binding protein,c Sirt1,c Sirt2,c Sirt3c
Structurally similar with lysine acetylation, regulated by same set of enzymes
4 Lysine malonylation Sirt5c
Changing the positively charged lysine to negatively charged residue, likely to affect the chromatin structure
5 Lysine succinylation Sirt5c
A mutation to mimic crotonyl lysine that changes lysine to glutamic acid of histone H4K31, reduces cell viability
6 Lysine crotonylation Sirt1,c Sirt2,c Sirt3
Enriched at active gene promoters potential enhancers in mammalian genomes, male germ cell differentiation
7 Lysine 2-hydroxyiso
butyrylation HDAC1-3c
Associated with gene transcription
8 Lysine 4-oxononoylation Modified by 4-oxo-2-nonenal, generated under oxidative stress, prevents nucleosome assembly in vitro
9 Lysine 5-hydroxylation JMJD6
suppress lysine acetylation and methylation
10 Glutamine methylation Nop1 (yeast), fibrillarin (huma)
human histone H2AQ105
11 Serine and
threonine GlcNAcylation O-GlcNAc transferase
H2BS112 GlcNAcylation promotes K120 monoubiquitination, H3S10 GlcNAcylation suppresses phosphorylation of site
12 Serine and threonine acetylation
13 Serine palmitoylation Lpcat1
catalyzed H4S47 palmitoylation, Ca2+-dependent, regulates global RNA synthesis
14 Cysteine glutathionylation
H3.2 and H3.3
conserved cysteine, but not H3.1, destabilize the nucleosomal structure
15 Cysteine fatty-acylation
H3.2 C110
16 Tyrosine hydroxylation
Fig. 1. Schematic description of a MS-based method for the identification of novel histone PTMs.
http://ars.els-cdn.com/content/image/1-s2.0-S1367593114001562-gr1.sml
Fig. 2. Chemical proteomics approaches to profile readers and erasers of histone PTMs.
(a) Photo-cross-linking strategy to capture proteins recognizing histone PTMs.
(b) Chemical structure of photoaffinity peptide probes.
Modifications of interest were labeled in green; photo-cross-linkers were labeled in red; chemical handles (alkyne) were labeled in blue; the sequence of probe C and probes 1–5 were derived from the
histone H3 1–15 amino acids residues, the sequence of probe 6 was derived from the histone H4 1–19 amino acids residues.
(c) Schematic for the CLASPI strategy to profile proteins that bind certain histone mark in whole-cell proteomes
http://ars.els-cdn.com/content/image/1-s2.0-S1367593114001562-gr2.sml
Consistent with our findings, Tate and coworkers [57] recently reported the development of a photoaffinity probe based on a succinylated glutamate dehydrogenase (GDH) peptide for capturing Sirt5
as the corresponding desuccinylase. In addition to the application of photo-cross-linking strategy for examining the histone PTMs with known erasers, we recently used CLASPI with a photoaffinity
probe (probe 5, Figure 2b) to profile proteins that recognize a novel histone mark, crotonylation at histone H3K4 (H3K4cr, Table 1, Entry 6) [25], whose erasers were unknown. This study revealed,
for the first time, that Sirt3 can recognize the H3K4cr mark and efficiently catalyze the removal of histone crotonylation marks. More importantly, Sirt3 was found to regulate histone Kcr level in
cells and may potentially modulate gene transcription through its decrotonylase activity [58]. By converting bisubstrate inhibitors of HATs (histone peptides with certain lysine residues covalently
attached to Ac-CoA) to clickable photoaffinity probes (for example, probe 6, Figure 2b), they carried out the first systematic profiling of HATs in whole-cell proteomes [59]. We anticipate that similar methods can be used to search for writers of novel histone PTMs such as Kmal, Ksucc, Kcr and Khib (Table 1) since the corresponding acyl-CoAs are presumed to be the acyl donors.
We have shown, in this review, the applications and recent advances of chemical tools, in combination with MS-based proteomics approaches, for the detection and characterization of histone
PTMs and their readers, erasers and writers.
This article belongs to a special issue
Omics Edited By Benjamin F Cravatt and Thomas Kodadek
Editorial overview: Omics: Methods to monitor and manipulate biological systems: recent advances in ‘omics’
Benjamin F Cravatt, Thomas Kodadek
Current Opinion in Chemical Biology Feb 2015; 24:v–vii
http://dx.doi.org/10.1016/j.cbpa.2014.12.023
7.3.3 Misfolded Proteins – from Little Villains to Little Helpers… Against Cancer
Ansgar Brüning1,* and Julia Jückstock
Front Oncol. 2015; 5: 47
http://dx.doi.org/10.3389.2Ffonc.2015.00047
The application of cytostatic drugs targeting the high proliferation rates of cancer cells is currently the most commonly used treatment option in cancer chemotherapy. However, severe side effects and resistance mechanisms may occur as a result of such treatment, possibly limiting the therapeutic efficacy of these agents. In recent years, several therapeutic strategies have been developed that aim at targeting not the genomic integrity and replication machinery of cancer cells but instead their protein homeostasis. During malignant transformation, the cancer cell proteome develops vast aberrations in the expression of mutated proteins, oncoproteins, drug- and apoptosis-resistance proteins, etc. A complex network of protein quality-control mechanisms, including chaperoning by heat shock proteins (HSPs), not only is essential for maintaining the extravagant proteomic lifestyle of cancer cells but also represents an ideal cancer-specific target to be tackled. Furthermore, the high rate of protein synthesis and turnover in certain types of cancer cells can be specifically directed by interfering with the proteasomal and autophagosomal protein recycling and degradation machinery, as evidenced by the clinical application of proteasome inhibitors. Since proteins with loss of their native conformation are prone to unspecific aggregations and have proved to be detrimental to normal cellular function, specific induction of misfolded proteins by HSP inhibitors, proteasome inhibitors, hyperthermia, or inducers of endoplasmic reticulum stress represents a new method of cancer cell killing exploitable for therapeutic purposes. This review describes drugs – approved, repurposed, or under investigation – that can be used to accumulate misfolded proteins in cancer cells, and particularly focuses on the molecular aspects that lead to the cytotoxicity of misfolded proteins in cancer cells.
Introduction:
How Do Proteins Fold and What Makes Misfolded Proteins Dangerous?
For an understanding of misfolded proteins, it is necessary to understand how cellular proteins attain and then further maintain their native conformation and how mature proteins and unfolded proteins are generated and converted into each other.
The principles and mechanisms of protein folding were one of the major research topics and achievements of biochemical research in the last century. For decades, Anfinsen’s model, which explained protein structure by thermodynamic principles applying to the polypeptide’s inherent amino acid sequence (1), was to be found in the introductory sections of all textbooks in protein biochemistry. According to Anfinsen’s thermodynamic hypothesis, the structure with the lowest conformational Gibbs free energy was finally taken by each single polypeptide due to a thermodynamic and stereochemical selection for side chain relations that form most stable and effective enzymes or structural proteins (1). Beyond this individual selection for the energetically most optimized conformation, evolution also selected for amino acid sequences that energetically allowed the smoothest and most “frustration-free” folding processes via a thermodynamic “folding funnel” (1–3).
Whereas Anfinsen’s model preferred the side chain elements as preferential organizing structures, recent hypotheses have inversely proposed the backbone hydrogen bonds as the driving force behind protein folding (4). According to the former theory, the finally folded protein was assumed to attain a single defined structure and shape (1, 4), and the unfolded conditions were described as being represented by a structureless statistical coil with nearly indefinite conformations – a so-called “featureless energy landscape” (4). The latter model assumes that a protein selects during its folding process from a limited repertoire of stable scaffolds of backbone hydrogen bond-satisfied α-helices and β-strands (4). This also implies that unfolded proteins are not structureless, shoelace-like linear amino acid alignments as often depicted in cartoons for graphical reasons, but actually, at least in part, retain discrete and stable scaffolds.
Once the protein has attained its final conformation, the problem of stabilizing this structure arises. Hydrophobic interactions that press non-polar side chains into the center of the protein are assumed to be a major force in protein stabilization (5, 6). At the protein surface, polar interactions, mainly by hydrogen bonds of polar side chains and backbone structure, are assumed to be of similar importance (6). Salt bridges and covalent disulfide bonds were identified as further forces supporting the stability of proteins (6). Accordingly, all conditions that interfere with these stabilizing forces, including extreme temperature, salt concentrations, and redox conditions, may lead to protein misfolding.
Another aspect that must be taken into account when studying protein folding relates to the very different conditions found in viable cells when compared to test tube conditions. Considering the life-cycle of a protein, each protein begins as a growing polypeptide chain protruding from the ribosomal exit tunnel and with several of its future interacting amino acid binding partners not even yet attached to the growing chain of the nascent polymer. In these ribosomal exit tunnels, first molecular interactions and helical structures are formed, and evidence exists to support the notion that the speed of translation is regulated by slow translating codon sequences just to optimize these first folding processes (7). After leaving the ribosomal tunnel, nascent polypeptides are also directly welcomed by chaperoning protein complexes, which facilitate and further guide the folding process of newly synthesized proteins (8). It is believed that a high percentage of nascent proteins are subject to immediate degradation due to early folding errors (9). Since many nascent proteins are synthesized in parallel at polysomes, the temporal and spatial proximity of unfolded peptides brings the additional risk of protein aggregation (10). Moreover, as mentioned above, even incomplete folding intermediates and partially folded states may form energetically but not physiologically active metastable structures (11, 12). An immediate, perinatal guidance and chaperoning of newborn proteins is therefore essential to creating functional, integrative proteins and to avoiding misfolded, function-less polypeptides with potentially cytotoxic features.
Since protein structure and function are coupled, misfolded proteins are, at first, loss-of-function proteins that might reduce cell viability, in particular when generated in larger quantities. A more dangerous feature of misfolded proteins, however, lies in their strong tendency toward abnormal protein–protein interactions or aggregations, which is reflected by the involvement of misfolded proteins and their aggregates in several amyloidotic diseases, including neurodegenerative syndromes such as Alzheimer’s disease and Parkinson’s disease (13, 14). The fact that several of these intracellular and extracellular protein aggregates contain β-sheet-like structures and form filamentous structures also supports the notion that misfolded proteins are not necessarily structureless protein coils or unspecific aggregates, at least when they are formed by homogenous proteins as in the case of several neurodegenerative diseases (13). Paradoxically, these larger aggregates appear to reflect a cell protective mechanism so as to sequester or segregate smaller, but highly reactive, nucleation cores of condensing protein aggregates (13).
Unspecific hydrophobic interactions, in particular, have been held responsible for protein aggregations that form when terminally folded proteins lose their native conformation and expose buried hydrophobic side chains on their surface (15, 16). These hydrophobic interactions are also believed to be the most problematic issues with newly synthesized polypeptides on single ribosomes or polysomes (12). Once exposed to the surface, the hydrophobic structures will quickly find possible interaction partners. The intracellular milieu can be regarded as a “crowded environment” (17), fully packed with proteins in close contact and near to their solubility limit (8, 12). Thus, misfolded proteins not only aggregate among each other but may also attach to normal native proteins and inhibit their function and activity. Since such misfolding effects and interactions can also include nuclear DNA replication and repair enzymes (18), misfolded proteins may not only exert proteotoxic but also genotoxic effects, thereby endangering the entire cellular “interactome” (19) by interfering both with the integrity of the proteome (proteostasis) and the genome. Therefore, a misfolded protein is not simply a loss-of-function protein but also a promiscuous little villain that might act like a free radical, exerting uncontrolled danger to the cell.
The way in which cells deal with misfolded proteins strongly depends on the nature, strength, length, and location of the damage induced by the various insults. Management of misfolded proteins can be achieved by heat shock protein (HSP)-mediated protein renaturation (repair); proteasomal, lysosomal, or autophagosomal degradation (recycling); intracellular disposal (aggregation); or – in its last consequence if overwhelmed – by programed cell death (despair). In the following paragraphs, the cellular management of misfolded proteins is described and therapeutic options to induce misfolded proteins in cancer cells are presented.
Hsp90 and Hsp90 Inhibitors
The best-known and evolutionarily most-conserved mechanism to protect against protein misfolding is the binding and refolding process mediated by so-called heat shock proteins (HSPs). HSPs recognize unfolded or misfolded proteins and facilitate their restructuring in either an ATP-dependent (large HSPs) or energy-independent manner (low weight HSPs). HSP of 90 kDa (hsp90) is a constitutively expressed HSP and is regarded as the most common and abundantly expressed HSP in eukaryotic cells (20, 21). Although commonly referred to as hsp90, it consists of a variety of isoforms that are encoding for cytosolic (hsp90α1, α2, β), mitochondrial (TRAP1), or endoplasmic reticulum (ER)-resident (GRP94) forms. Its primary function is less that of a stress response protein and more to bind to a certain group of client proteins unable to maintain a stable configuration without being assisted by hsp90 (20, 22, 23). Steroid hormone receptors (estrogen receptor, glucocorticoid receptor), cell cycle regulatory proteins (CDK4, cyclin D, polo-like kinase), and growth factor receptors and their downstream targets (epidermal growth factor receptor 1, HER2, AKT) are among the best-studied client proteins of hsp90 (20–22). Also, several cancer-specific mutations generating otherwise instable oncoproteins, such as mutant p53 or bcr-abl, rely on hsp90 chaperoning to keep them in a soluble form, thereby facilitating the extravagant but vulnerable “malignant lifestyle” of hsp90-addicted cancer cells (21, 24). Accordingly, hsp90 has been assumed to be a prominent target, in particular for hormone-responsive and growth factor receptor amplification-dependent cancer types.
The microbial antibiotics geldanamycin and radicicol are the prototypes of hsp90 inhibitors. Based on intolerable toxicity, these molecules had to be chemically modified for application in humans, and most of the ongoing clinical studies with hsp90 inhibitors are aimed at identifying semi-synthetic derivatives of these lead compounds with an acceptable risk profile. Unfortunately, most recent studies using geldanamycin derivatives have provided disappointing results because of toxicities and insufficient efficacy (22, 25–27). Studies with radicicol (resorcinol) derivatives, in particular with ganetespib, appear to be more promising because of fewer adverse effects (22, 25–27). Liver and ocular (retinal) toxicities have been described as main adverse effects of hsp90 inhibition, and appeared to be experienced less with ganetespib than with most of the first generation hsp90 inhibitors (28).
Since both geldanamycin and radicicol target the highly conserved and unique ATP-binding domain of hsp90, new synthetic inhibitors have also been generated by rational drug design (22, 25–27). However, none of the various natural or synthetic hsp90 inhibitors under investigation have yet provided convincing clinical data, and future studies will show whether hsp90 can eventually be added to the list of effective cancer targets.
Hsp70, Hsp40, Hsp27, and HSF1
Hsp90 is assisted by several other HSPs and non-chaperoning co-factors, finally forming a large protein complex that recruits and releases client proteins in an energy-dependent manner (21, 22, 29). Client proteins for hsp90 are first bound to hsp70, which transfers the prospective client to hsp90 through the mediating help of an hsp70–hsp90 organizing protein (HOP). Binding of potential hsp90 client proteins to hsp70 is facilitated by its co-chaperone hsp40 (23, 30). Exposed hydrophobic amino acids, the typical feature of misfolded proteins, have been described as the main recognition signal for hsp70 proteins (15, 16, 31). Hsp70 proteins are not only supporter proteins for hsp90 but also represent a large chaperone family capable of acting independently of hsp90 and that can be found in all cellular compartments, including cytosol and nucleus (hsp70, hsp72, hsc70), mitochondria (GRP75 = mortalin), and the ER (GRP78 = BiP). Hsp70 chaperones may act on misfolded or nascent proteins either as “holders” or “folders” (31), which means that they prevent protein aggregation either by sheltering these aggregation-prone protein intermediates or by allowing these proteins to fold/refold into their native form in an assisted mechanism within a protected environment (31). Hsc70 (HSPA8) is a constitutively expressed major hsp70 isoform that is an essential factor for normal protein homeostasis even in unstressed cells (16). Misfolded proteins can also be destined by hsp70 proteins for their ultimate degradation. Proteins that expose KFERQ amino acid motifs on their surface during their unfolding process are preferentially bound by hsc70 and can be directed to lysosomes in a process called chaperone-mediated autophagy (CMA) (32, 33). In another mechanism of targeted protein degradation, interaction of hsc70 with the E3 ubiquitin ligase CHIP (carboxyl terminus of Hsc70-interacting protein) leads to ubiquitination of misfolded proteins and thus their destination of the ubiquitin-proteasome protein degradation pathway (34, 35). Since hsc70 is essential for normal protein homeostasis and its knock-out is lethal in mice (16, 36), hsc70 inhibition might not be an optimal target for cancer-specific induction of misfolded proteins. This contrasts with the inducible forms of hsp70 such as hsp72 (HSPA1), which are upregulated in a cell stress-specific manner and are often found to be constitutively overexpressed in cancer tissues (16, 36). Transcriptional activation of these inducible HSPs is mediated by the heat shock factor 1 (HSF1), which also regulates expression of hsp40 and the small HSP hsp27 by sharing a common promoter consensus sequence (heat shock response element) for HSF1 binding (37). HSF1 was also found to be constitutively activated in cancer tissues, modulating several cell cycle- and apoptosis-related pathways via its target genes (38–40). HSF1 itself is kept inactive in the cytosol by binding to hsp90, and the recruitment of hsp90 to misfolded proteins is considered a main activation mechanism to release monomeric HSF1 for its subsequent trimerization, post-translational activation, and nuclear translocation (24, 41). Also, since hsp90 inhibition causes hsp70 induction by HSF1 activation as a compensatory feed-back mechanism (24), combined inhibition of hsp90 and hsp70, or of hsp90 and HSF1 might be a more effective therapeutic approach for cancer treatment than single HSP targeting alone.
Indeed, several small-molecule inhibitors and aptamers for hsp70, hsp40, and hsp27 have been designed (16, 42–44), but most of them remain in pre-clinical development, or are either not applicable in humans or associated with intolerable side effects (16, 42–44). Notably, the natural bioflavonoid quercetin was shown to inhibit phosphorylation and transcriptional activity of the heat shock transcription factor HSF1, thus reducing HSP expression at its most basal level (45–48). This HSP and HSF1 inhibition may also contribute to the observed cancer-preventing effects of a flavonoid-rich diet, which includes fruits and vegetables. However, due to their low bioavailability, the concentrations of flavonoids needed to induce direct cytotoxic effects in cancer cells for (chemo-)therapeutic reasons are obviously not achievable in humans, even when applied as nutritional supplements (49). More effective and clinically more easily applicable inhibitors of HSF1 are therefore urgently sought. Promising HSF1 targeting strategies are currently under development, although are apparently not yet suited for clinical applications (24, 50, 51).
SP Williams Comment:
There is a new hsp90- inhibitor, ganetespib, which is active against ovarian cancer in vitro and in vivo. Clinical trials are looking at this in cisplatin refractory cases. This was identified by a network analysis from a previous siRNA screen on ovarian cancer cells for pathways related to growth inhibition in an effort to find possible targets against CP resistance. The reference ishttp://www.researchgate.net/publication/253647952_Network_analysis_identifies_an_HSP90-central_hub_susceptible_in_ovarian_cancer
Protein Ubiquitination and Proteasomal Degradation
Ubiquitin is a 76 amino acid polypeptide that can covalently be attached via its carboxy-terminus to free (lysyl) amino groups of proteins. Ubiquitination of proteins generates a cellular recognition motif that is involved in various functions ranging from transcription factor and protein kinase activation to DNA repair and protein degradation – depending on the extent and exact location of this post-translational modification (52, 53). Monoubiquitination of peptides of more than 20 amino acids was found to be a minimal requirement for protein degradation, but the canonical fourfold (poly-)ubiquitination with three further lysine (K48) side chain-linked ubiquitins appears to be most apt for an effective and rapid substrate recognition by the proteasome (54). This canonical polyubiquitin structure, as well as several other mixed polyubiquitin structures, can be recognized by the external 19S subunits of the 26S proteasome complex (54, 55). Prior to degradation of ubiquitinated proteins by the proteasomal 20S core subunit, the attached ubiquitin chains are released by the external 19S subunits for recycling, although they can also be co-degraded by the proteasome (56). After first passing the 19S subunit, the proteasomal target proteins are then unfolded in an energy-dependent manner and introduced into the narrow enzymatic cavity of proteasome for degradation. The barrel-shaped 20S proteasomal core complex contains three different proteolytic activities in duplicate (β1: caspase-like-, β2: tryptic-, and β5: chymotryptic activity), which initiate an efficient cleavage of the proteasomal target proteins into smaller peptides (57).
It is important to note that specific ubiquitination and ensuing proteasomal degradation is not an exclusive degradation mechanism of misfolded proteins but is also used to regulate the expression level of several native cell cycle regulatory proteins [cyclins, proliferating cell nuclear antigen (PCNA), p53], signaling pathway molecules (β-catenin, IκB), and survival factors (mcl-1) during the course of normal protein homeostasis and cell cycle progression (53, 55, 57, 58). Moreover, proteasomes are involved in protein maturation, including the processing and maturation of the NF-κB transcription factor subunit p50 and the drug-resistant protein MDR1 (57). Therefore, targeting proteasomal activity has not only been of interest for the generation of misfolded, cytotoxic proteins but also for interfering with the expression of proteins involved in several hallmarks of cancer, including cell cycle progression, signal transduction, and apoptosis.
Proteasome Inhibitors
Bortezomib (PS-341, Velcade ™) has long been known as a paragon of a clinically applicable proteasome inhibitor. Bortezomib has been approved for the treatment of multiple myeloma and mantle cell lymphoma (55, 59, 60). The great expectations of transferring the success of bortezomib to non-hematological solid cancer types have unfortunately not yet been fulfilled. It has been suggested that the high antibody-producing capacity of myeloma cells and thus the need for an efficient proteasomal degradation system to cope with the recycling process of misfolded ER-generated antibodies [ER-associated degradation process (ERAD); see below] might contribute to the high sensitivity of myeloma cells to bortezomib (9, 60, 61). Originally, bortezomib was developed to inhibit the proteasomal degradation of the NF-κB inhibitor IκB, thus targeting the pro-inflammatory, but also cancer-promoting, effect of the NF-κB transcription factor (55, 60, 62). Recent insights indicate that the anti-tumoral effect of bortezomib is not only mediated by its NF-κB inhibitory activity but also by its ability to induce accumulation of misfolded proteins in the cytosol and the ER (60, 62–65). However, the use of bortezomib, even for highly sensitive multiple myeloma, is limited by its strong tendency to induce a proteasome inhibition-independent peripheral neuropathy by acting on neuronal mitochondria (61). Since neurodegenerative diseases are associated with protein misfolding and aggregation, the neuropathological effects of bortezomib might also be assumed to be mediated by the possible proteotoxic effects of bortezomib in neuronal cells. However, although proteasome inhibitor-induced neurodegeneration and inclusion body formation have been described in animal models, similarities between proteasome inhibitor-induced neurodegeneration and Parkinson’s disease-like histopathological features could not be established (66).
Table 1 Drugs described in this review and their mechanism of action (MOA), status of approval, and main adverse effects.
Aggresome Formation and Re-Solubilization: Role of HDAC6
As depicted above, proteasome and HSP inhibition will eventually lead to the accumulation of misfolded and polyubiquitinated proteins. Based on their inherent cohesive properties mediated by their exposed hydrophobic surfaces, both ubiquitinated and non-ubiquitinated misfolded proteins tend to adhere as small aggregates (Figure (Figure1).1). Individual ubiquitinated proteins and small ubiquitinated aggregates can be recognized by specific ubiquitin-binding proteins such as HDAC6 via its zinc finger ubiquitin-binding domain. HDAC6 is an unusual histone deacetylase located in the cytosol that regulates microtubule acetylation and is also able to bind ubiquitinated proteins. Based on HDAC6’s additional ability to bind to microtubule motor protein dynein, these aggregates are actively transported along the microtubular system into perinuclear aggregates around the microtubule organizing center (MTOC) (10, 83, 84). Recognition of small, scattered ubiquitinated aggregates by HDAC6 has been described as being mediated by unanchored ubiquitin chains, which are generated by aggregate-attached ubiquitin ligase ataxin-3 (85). Whereas proteasomal target proteins are primarily tagged by K-48 (lysine-48) linked ubiquitins; K-63 linked ubiquitin chains appear to be a preferential modification for aggresomal targeting by HDAC6 and were assumed to mediate a redirection from proteasomal degradation to aggresome formation in the case of proteasomal inhibition or overload (86). Accordingly, aggresome formation is not an unspecific protein aggregation but a specific, ubiquitin-controlled sorting process. Furthermore, these aggresomes consist not only of misfolded and deposited proteins but have also been shown to contain a large amount of associated HSPs and ubiquitin-binding proteins, including HDAC6 [Figure [Figure1;1; (10, 83, 84)]. Aggresomes contain, and are also surrounded by, large numbers of proteasomes (10, 83, 84), which help to resolubilize these aggregates not only through their intrinsic proteasomal digestion but also by generating unanchored K63-branched polyubiquitin chains, which then stimulate HDAC6-mediated autophagy, another cellular disposal mechanism in involving HDAC6 (87). Notably, HDAC6 has also been shown to control further maturation of autophagic vesicles by stimulating autophagosome–lysosome fusion (Figure (Figure1)1) in a manner different from the normal autophagosome–lysosome fusion process (88).
Figure 1
Drugs that inhibit folding or disposal of misfolded proteins. Native mature proteins, nascent proteins, or misfolded proteins can be prevented from folding or refolding by small and large heat shock protein inhibitors, of which the hsp90 inhibitors based …
The HDAC6 multitalent also exerts its deacetylase activity on hsp90 and modifies hsp90 client binding by facilitating its chaperoning of steroid hormone receptors and HSF1 (89–91). Recruitment of HDAC6 to ubiquitinated proteins leads to the dissociation of the repressive HDAC6/hsp90/HSF1 complex (91) and allows the release of transcriptionally active HSF1 to the nucleus. The engagement of HDAC6 at the aggresome–autophagy pathway hence also indirectly facilitates HSF1 activity. p97/VCP (valosin-containing protein), another binding partner of HDAC6 and itself a multi-interactive, ATP-dependent chaperone (92–94), is assumed to be involved not only in the specific separation of hsp90 and HSF1 by its “segregase” activity but also in the binding and remodeling of polyubiquitinated proteins before their delivery to the proteasome (93–95). Additionally, p97/VCP dissociates polyubiquitinated proteins bound to HDAC6 (91). Accumulation of polyubiquitinated proteins thus leads to HDAC6-dependent HSF1 activation and HSP induction, p97/VCP-dependent recruitment and “preparation” of polyubiquitinated proteins to proteasomes, and, in the case of pharmacological proteasome inhibition or physiological overload, to an HDAC6-dependent detoxification of polyubiquitinated proteins by the aggresome/autophagy pathway.
Pharmacological Inhibition of Aggresome Formation: HDAC6 Inhibitors
The central involvement of HDAC6 in aggresome formation and clearance makes HDAC6 one of the most interesting druggable targets for the induction of proteotoxicity in cancer cells. Also, HDAC6 has been found to be overexpressed in various cancer tissues, associated with advanced cancer stages and increased neoplastic transformation (96). Several pan-histone deacetylase inhibitors have been developed and tested in clinical studies for a variety of diseases, including different types of cancer (97, 98). Although hematological malignancies responded best to most of the already clinically tested pan-histone deacetylase inhibitors, the efficacy on solid cancer types was disappointingly poor and also associated with intolerable side effects (98). The unforeseeable pleiotropic epigenetic mechanism caused by non-specific (nuclear) histone deacetylase inhibitors may also limit their application for use in cancer treatment or HDAC6 inhibition, and has led to the search for selective HDAC6 inhibitors with no inhibitory effects on transcription modifying histone deacetylases. Through screening of small molecules under the rationale of selecting for tubulin deacetylase inhibitors with no cross-reactive histone deacetylase activity, the HDAC6 inhibitor tubacin was identified, and suggested for use in the treatment of neurodegenerative diseases or to reduce cancer cell migration and angiogenesis (99). Hideshima et al. then proved the hypothesis that the combined use of bortezomib with tubacin leads to an accumulation of non-disposed cytotoxic proteins and aggregates in cancer cells (100). Indeed, a synergistic effect of these two drugs against multiple myeloma cells could be observed with no detectable toxic effect on peripheral blood mononuclear cells (100). This and follow-up studies also revealed the efficacy of tubacin as a single agent against leukemia cells (100, 101) and a chemo-sensitizing effect on cytotoxic drugs in breast- and prostate-cancer cells (102).
Endoplasmic Reticulum Stress
Besides the cytosol, the ER is a major site for protein synthesis, in particular for those proteins destined for extracellular secretion, the cell membrane, or their retention within the endomembrane system. At the rough ER, nascent proteins are co-translationally transported across the ER membrane into the ER lumen (107), where they immediately encounter ER-resident chaperones, most prominently represented by hsp70 family member BiP/GRP78 and hsp90 family member GRP94 to help proper protein folding (15, 108). Most of these proteins also undergo post-translational modifications, including N- or O-linked glycosylation or protein disulfide bridge-building (109, 110), thereby adding further mechanisms of protein stabilization but also challenges for proper protein folding.
Similar to the situation in cytosolic protein biosynthesis, a large proportion of nascent proteins in the ER are assumed to misfold and to go “off-pathway” even under normal physiological conditions. Furthermore, the ER lumen, narrowly sandwiched between two phospholipid membranes, has been described as an even more densely crowded environment than the cytosol, additionally facilitating unspecific protein attachments and aggregations (15). Since, with the exception of bulk reticulophagy, the lumen of the ER contains no endogenous protein degradation system, and the anterograde transport of ER proteins to the Golgi, lysosomes, endosomes, or the extracellular environment requires properly folded proteins, a retrograde transport of ER proteins into the cytosol remains the only possible mechanism of preventing misfolded protein accumulation within the ER. In this ERAD, misfolded proteins are re-exported across the ER membrane by a specific multi protein complex, ubiquitinated by ER membrane-integrated ubiquitin ligases, and finally become degraded by cytosolic proteasomes (111, 112). Notably, association of the cytosolic p97/VCP protein, an important interacting partner with HDAC6, has also been described as being an essential factor for driving the luminal proteins through the ER membrane pore complex into the cytosol (92,112).
Accordingly, all agents and conditions that interfere with these folding, maturation, and retranslocation processes can lead to protein misfolding and aggregation within this sensitive organelle. Chemicals that act as glycosylation inhibitors (tunicamycin), calcium ionophore inhibitors (A23187, thapsigargin), heavy metal ions (cadmium, lead), reducing agents (dithiothreitol), as well as conditions like hypoxia or oxidative stress, all lead to a phenomenon called ER stress (113–116). In the ER-stress response, a triad of ER membrane-resident signaling receptors and transducers, IRE1, ATF6, and PERK1, become activated and lead to the transcriptional activation of cytosolic and ER-resident chaperones to cope with the increasing number of misfolded proteins. Induction of autophagy (reticulophagy; ER-phagy) may also occur and supports the removal of damaged regions of the ER (117). Under very intensive or even unmanageable ER-stress conditions, a variety of pro-apoptotic pathways ensue, including CHOP induction, c-JUN-kinase activation, and caspase cleavage (118–120), which eventually prevails over the cytoprotective arm of the ER-stress response and may lead to apoptosis. Targeting of protein folding within the ER is therefore a very promising strategy to induce apoptosis in cancer cells, in particular in those cancer cells characterized by an unphysiologically high protein secretion rate, such as, for example, multiple myeloma cells. Whereas the above-mentioned drugs such as tunicamycin or thapsigargin are valuable tools for cell biology studies, they display unacceptable toxicities in humans and are not suited for therapeutic applications. Interestingly, several already established drugs used for non-cancerous diseases have been described as inducing ER stress at pharmacologically relevant concentrations in humans as an off-target effect (113, 116). The non-steroidal anti-inflammatory COX-2 inhibitor celecoxib is an approved drug to treat various forms of arthritis and pain, but has also been described as exerting ER stress by functioning as a SERCA (sarco/ER Ca2+ ATPase) inhibitor (113, 116). However, although well tolerated in humans, the ER-stress-inducing ability of celecoxib seems to be weaker than that of direct SERCA inhibitors such as thapsigargin, and the usefulness of celecoxib against advanced cancer has been questioned (116). Various HIV protease inhibitors have been described as inducing ER stress in human tissue cells as a side effect (121–123). In particular the HIV drugs lopinavir, saquinavir, and nelfinavir appear to be potent inducers of the ER-stress reaction, leading to a focused interest in these drugs for the induction of ER stress and apoptosis in cancer cells (116, 124–128). In fact, with currently over 27 clinical studies in cancer patients2, nelfinavir, either used as a single agent or in combination therapy, is on the list of the most promising prospective candidates to induce selective proteotoxicity in cancer cells at pharmacologically relevant concentrations. Although the exact mechanism by which nelfinavir induces ER stress is not yet clear, it was shown that nelfinavir causes the upregulation of cytosolic and ER-resident HSPs, and induces apoptosis in cancer cells associated with caspase activation and induction of the pro-apoptotic transcription factor CHOP (125, 126). Nelfinavir was also shown to be combinable with bortezomib to enhance its activity on cancer cells (129). Since the retrograde transport of misfolded ER proteins is inhibited by the p97/VCP inhibitor eeyarestatin (130, 131), we recently tested the combination of eeyarestatin with nelfinavir but found no synergistic effect between these two agents in cervical cancer cells (132). In contrast, eeyarestatin markedly sensitized cervical cancer cells to bortezomib treatment (132), which was also observed in preceding studies in which eeyarestatin was used to augment the ER-stress-inducing ability of bortezomib in leukemia cells (131).
Induction of proteotoxicity through the accumulation of misfolded proteins has evolved as a new treatment modality in the fight against cancer. Clinically approved drugs such as bortezomib and carfilzomib provide evidence of the functionality of this approach. Newly developed agents like the HDAC6 inhibitor ACY-1215 or repurposed drugs like nelfinavir or disulfiram are currently being tested in clinical trials with cancer patients and will hopefully further broaden our arsenal of anti-cancer drugs. Notably, most proteotoxic agents that have been approved or are in clinical trials target the ubiquitin-proteasome-system (UPS) and are mainly effective in multiple myeloma cells, which rely on a functional ER/ERAD/UPS for excessive and proper antibody production. Similarly, it can be assumed that other cancer cell types with a marked secretory phenotype may also be affected by ER/ERAD/UPS inhibitors. In accordance with this notion, a recent dose-escalating Phase Ia study with nelfinavir as a single agent, that covered a large variety of solid cancer entities, revealed response rates primarily in patients with neuroendocrine tumors (140). In most other solid cancer types, however, the chemo-sensitizing or combination effects of proteotoxic drugs may prevail, and have become the focus of an increasing number of very promising clinical and pre-clinical studies.
7.3.4 Endoplasmic reticulum protein 29 (ERp29) in epithelial cancer
Friend or Foe: Endoplasmic reticulum protein 29 (ERp29) in epithelial cancer
Chen S1, Zhang D2
FEBS Open Bio. 2015 Jan 30; 5:91-8
http://dx.doi.org:/10.1016/j.fob.2015.01.004
The endoplasmic reticulum (ER) protein 29 (ERp29) is a molecular chaperone that plays a critical role in protein secretion from the ER in eukaryotic cells. Recent studies have also shown that ERp29 plays a role in cancer. It has been demonstrated that ERp29 is inversely associated with primary tumor development and functions as a tumor suppressor by inducing cell growth arrest in breast cancer. However, ERp29 has also been reported to promote epithelial cell morphogenesis, cell survival against genotoxic stress and distant metastasis. In this review, we summarize the current understanding on the biological and pathological functions of ERp29 in cancer and discuss the pivotal aspects of ERp29 as “friend or foe” in epithelial cancer.
The endoplasmic reticulum (ER) is found in all eukaryotic cells and is complex membrane system constituting of an extensively interlinked network of membranous tubules, sacs and cisternae. It is the main subcellular organelle that transports different molecules to their subcellular destinations or to the cell surface [10,85].
The ER contains a number of molecular chaperones involved in protein synthesis and maturation. Of the ER chaperones, protein disulfide isomerase (PDI)-like proteins are characterized by the presence of a thioredoxin domain and function as oxido-reductases, isomerases and chaperones [33]. ERp29 lacks the active-site double-cysteine (CxxC) motif and does not belong to the redox-active PDIs [5,47]. ERp29 is recognized as a characterized resident of the cellular ER, and it is expressed ubiquitously and abundantly in mammalian tissues [50]. Protein structural analysis showed that ERp29 consists of N-terminal and C-terminal domains [5]: N-terminal domain involves dimerization whereas the C-terminal domain is essential for substrate binding and secretion [78]. The biological function of ERp29 in protein secretion has been well established in cells [8,63,67].
ERp29 is proposed to be involved in the unfolded protein response (UPR) as a factor facilitating transport of synthesized secretory proteins from the ER to Golgi [83]. The expression of ERp29 was demonstrated to be increased in cells exposed to radiation [108], sperm cells undergoing maturation [42,107], and in certain cell types both under the pharmacologically induced UPR and under the physiological conditions (e.g., lactation, differentiation of thyroid cells) [66,82]. Under ER stress, ERp29 translocates the precursor protein p90ATF6 from the ER to Golgi where it is cleaved to be a mature and active form p50ATF by protease (S1P and S2P) [48]. In most cases, ERp29 interacts with BiP/GRP78 to exert its function under ER stress [65].
ERp29 is considered to be a key player in both viral unfolding and secretion [63,67,77,78] Recent studies have also demonstrated that ERp29 is involved in intercellular communication by stabilizing the monomeric gap junction protein connexin43 [27] and trafficking of cystic fibrosis transmembrane conductance regulator to the plasma membrane in cystic fibrosis and non-cystic fibrosis epithelial cells [90]. It was recently reported that ERp29 directs epithelial Na(+) channel (ENaC) toward the Golgi, where it undergoes cleavage during its biogenesis and trafficking to the apical membrane [40]. ERp29 expression protects axotomized neurons from apoptosis and promotes neuronal regeneration [111]. These studies indicate a broad biological function of ERp29 in cells.
Recent studies demonstrated a tumor suppressive function of ERp29 in cancer. It was found that ERp29 expression inhibited tumor formation in mice [4,87] and the level of ERp29 in primary tumors is inversely associated with tumor development in breast, lung and gallbladder cancer [4,29].
However, its expression is also responsible for cancer cell survival against genotoxic stress induced by doxorubicin and radiation [34,76,109]. The most recent studies demonstrate other important roles of ERp29 in cancer cells such as the induction of mesenchymal–epithelial transition (MET) and epithelial morphogenesis [3,4]. MET is considered as an important process of transdifferentiation and restoration of epithelial phenotype during distant metastasis [23,52]. These findings implicate ERp29 in promoting the survival of cancer cells and also metastasis. Hence, the current review focuses on the novel functions of ERp29 and discusses its pathological importance as a “friend or foe” in epithelial cancer.
2. ERp29 regulates mesenchymal–epithelial transition
2.1. Epithelial–mesenchymal transition (EMT) and MET
The EMT is an essential process during embryogenesis [6] and tumor development [43,96]. The pathological conditions such as inflammation, organ fibrosis and cancer progression facilitate EMT [16]. The epithelial cells after undergoing EMT show typical features characterized as: (1) loss of adherens junctions (AJs) and tight junctions (TJs) and apical–basal polarity; (2) cytoskeletal reorganization and distribution; and (3) gain of aggressive phenotype of migration and invasion [98]. Therefore, EMT has been considered to be an important process in cancer progression and its pathological activation during tumor development induces primary tumor cells to metastasize [95]. However, recent studies showed that the EMT status was not unanimously correlated with poorer survival in cancer patients examined [92].
In addition to EMT in epithelial cells, mesenchymal-like cells have capability to regain a fully differentiated epithelial phenotype via the MET [6,35]. The key feature of MET is defined as a process of transdifferentiation of mesenchymal-like cells to polarized epithelial-like cells [23,52] and mediates the establishment of distant metastatic tumors at secondary sites [22]. Recent studies demonstrated that distant metastases in breast cancer expressed an equal or stronger E-cadherin signal than the respective primary tumors and the re-expression of E-cadherin was independent of the E-cadherin status of the primary tumors [58]. Similarly, it was found that E-cadherin is re-expressed in bone metastasis or distant metastatic tumors arising from E-cadherin-negative poorly differentiated primary breast carcinoma [81], or from E-cadherin-low primary tumors [25]. In prostate and bladder cancer cells, the nonmetastatic mesenchymal-like cells were interacted with metastatic epithelial-like cells to accelerate their metastatic colonization [20]. It is, therefore, suggested that the EMT/MET work co-operatively in driving metastasis.
2.2. Molecular regulation of EMT/MET
E-cadherin is considered to be a key molecule that provides the physical structure for both cell–cell attachment and recruitment of signaling complexes [75]. Loss of E-cadherin is a hallmark of EMT [53]. Therefore, characterizing transcriptional regulators of E-cadherin expression during EMT/MET has provided important insights into the molecular mechanisms underlying the loss of cell–cell adhesion and the acquisition of migratory properties during carcinoma progression [73].
Several known signaling pathways, such as those involving transforming growth factor-β (TGF-β), Notch, fibroblast growth factor and Wnt signaling pathways, have been shown to trigger epithelial dedifferentiation and EMT [28,97,110]. These signals repress transcription of epithelial genes, such as those encoding E-cadherin and cytokeratins, or activate transcription programs that facilitate fibroblast-like motility and invasion [73,97].
The involvement of microRNAs (miRNAs) in controlling EMT has been emphasized [11,12,18]. MiRNAs are small non-coding RNAs (∼23 nt) that silence gene expression by pairing to the 3′UTR of target mRNAs to cause their posttranscriptional repression [7]. MiRNAs can be characterized as “mesenchymal miRNA” and “epithelial miRNA” [68]. The “mesenchymal miRNA” plays an oncogenic role by promoting EMT in cancer cells. For instance, the well-known miR-21, miR-103/107 are EMT inducer by repressing Dicer and PTEN [44].
The miR-200 family has been shown to be major “epithelial miRNA” that regulate MET through silencing the EMT-transcriptional inducers ZEB1 and ZEB2 [13,17]. MiRNAs from this family are considered to be predisposing factors for cancer cell metastasis. For instance, the elevated levels of the epithelial miR-200 family in primary breast tumors associate with poorer outcomes and metastasis [57]. These findings support a potential role of “epithelial miRNAs” in MET to promote metastatic colonization [15].
2.3. ERp29 promotes MET in breast cancer
The role of ERp29 in regulating MET has been established in basal-like MDA-MB-231 breast cancer cells. It is known that myosin light chain (MLC) phosphorylation initiates to myosin-driven contraction, leading to reorganization of the actin cytoskeleton and formation of stress fibers [55,56]. ERp29 expression in this type of cells markedly reduced the level of phosphorylated MLC [3]. These results indicate that ERp29 regulates cortical actin formation through a mechanism involved in MLC phosphorylation (Fig. 1). In addition to the phenotypic change, ERp29 expression leads to: expression and membranous localization of epithelial cell marker E-cadherin; expression of epithelial differentiation marker cytokeratin 19; and loss of the mesenchymal cell marker vimentin and fibronectin [3] (Fig. 1). In contrast, knockdown of ERp29 in epithelial MCF-7 cells promotes acquisition of EMT traits including fibroblast-like phenotype, enhanced cell spreading, decreased expression of E-cadherin and increased expression of vimentin [3,4]. These findings further substantiate a role of ERp29 in modulating MET in breast cancer cells.
Fig. 1 ERp29 triggers mesenchymal–epithelial transition. Exogenous expression of ERp29 in mesenchymal MDA-MB-231 breast cancer cells inhibits stress fiber formation by suppressing MLC phosphorylation. In addition, the overexpressed ERp29 decreases the …
http://www.ncbi.nlm.nih.gov/pmc/articles/PMC4329646/bin/gr1.gif
2.4. ERp29 targets E-cadherin transcription repressors
The transcription repressors such as Snai1, Slug, ZEB1/2 and Twist have been considered to be the main regulators for E-cadherin expression [19,26,32]. Mechanistic studies revealed that ERp29 expression significantly down-regulated transcription of these repressors, leading to their reduced nuclear expression in MDA-MB-231 cells [3,4] (Fig. 2). Consistent with this, the extracellular signal-regulated kinase (ERK) pathway which is an important up-stream regulator of Slug and Ets1 was highly inhibited [4]. Apparently, ERp29 up-regulates the expressions of E-cadherin transcription repressors through repressing ERK pathway. Interestingly, ERp29 over-expression in basal-like BT549 cells resulted in incomplete MET and did not significantly affect the mRNA or protein expression of Snai1, ZEB2 and Twist, but increased the protein expression of Slug [3]. The differential regulation of these transcriptional repressors of E-cadherin by ERp29 in these two cell-types may occur in a cell-context-dependent manner.
Fig. 2 ERp29 decreases the expression of EMT inducers to promote MET. Exogenous expression of ERp29 in mesenchymal MDA-MB-231 breast cancer cells suppresses transcription and protein expression of E-cadherin transcription repressors (e.g., ZEB2, SNAI1 and Twist), ..
http://www.ncbi.nlm.nih.gov/pmc/articles/PMC4329646/bin/gr2.gif
2.5. ERp29 antagonizes Wnt/ β-catenin signaling
Wnt proteins are a family of highly conserved secreted cysteine-rich glycoproteins. The Wnt pathway is activated via a binding of a family member to a frizzled receptor (Fzd) and the LDL-Receptor-related protein co-receptor (LRP5/6). There are three different cascades that are activated by Wnt proteins: namely canonical/β-catenin-dependent pathway and two non-canonical/β-catenin-independent pathways that include Wnt/Ca2+ and planar cell polarity [84]. Of note, the Wnt/β-catenin pathway has been extensively studied, due to its important role in cancer initiation and progression [79]. The presence of Wnt promotes formation of a Wnt–Fzd–LRP complex, recruitment of the cytoplasmic protein Disheveled (Dvl) to Fzd and the LRP phosphorylation-dependent recruitment of Axin to the membrane, thereby leading to release of β-catenin from membrane and accumulation in cytoplasm and nuclei. Nuclear β-catenin replaces TLE/Groucho co-repressors and recruits co-activators to activate expression of Wnt target genes. The most important genes regulated are those related to proliferation, such as Cyclin D1 and c-Myc [46,94], which are over-expressed in most β-catenin-dependent tumors. When β-catenin is absent in nucleus, the transcription factors T-cell factor/lymphoid enhancer factors (TCF/LEF) recruits co-repressors of the TLE/Groucho family and function as transcriptional repressors.
β-catenin is highly expressed in the nucleus of mesenchymal MDA-MB-231 cells. ERp29 over-expression in this type of cells led to translocation of nuclear β-catenin to membrane where it forms complex with E-cadherin [3] (Fig. 3). This causes a disruption of β-catenin/TCF/LEF complex and abolishes its transcription activity. Indeed, ERp29 significantly decreased the expression of cyclin D1/D2 [36], one of the downstream targets of activated Wnt/β-catenin signaling [94], indicating an inhibitory effect of ERp29 on this pathway. Meanwhile, expression of ERp29 in this cell type increased the nuclear expression of TCF3, a transcription factor regulating cancer cell differentiation while inhibiting self-renewal of cancer stem cells [102,106]. Hence, ERp29 may play dual functions in mesenchymal MDA-MB-231 breast cancer cells by: (1) suppressing activated Wnt/β-catenin signaling via β-catenin translocation; and (2) promoting cell differentiation via activating TCF3 (Fig. 3). Because β-catenin serves as a signaling hub for the Wnt pathway, it is particularly important to focus on β-catenin as the target of choice in Wnt-driven cancers. Though the mechanism by which ERp29 expression promotes the disassociation of β-catenin/TCF/LEF complex in MDA-MB-231 cells remains elusive, activating ERp29 expression may exert an inhibitory effect on the poorly differentiated, Wnt-driven tumors.
Fig. 3 ERp29 over-expression “turns-off” activated Wnt/β-catenin signaling. In mesenchymal MDA-MB-231 cells, high expression of nuclear β-catenin activates its downstream signaling involved in cell cycles and cancer stem cell …
http://www.ncbi.nlm.nih.gov/pmc/articles/PMC4329646/bin/gr3.gif
3. ERp29 regulates epithelial cell integrity
3.1. Cell adherens and tight junctions
Adherens junctions (AJs) and tight junctions (TJs) are composed of transmembrane proteins that adhere to similar proteins in the adjacent cell [69]. The transmembrane region of the TJs is composed mainly of claudins, tetraspan proteins with two extracellular loops [1]. AJs are mediated by Ca2+-dependent homophilic interactions of cadherins [71] which interact with cytoplasmic catenins that link the cadherin/catenin complex to the actin cytoskeleton [74].
The cytoplasmic domain of claudins in TJs interacts with occludin and several zona occludens proteins (ZO1-3) to form the plaque that associates with the cytoskeleton [99]. The AJs form and maintain intercellular adhesion, whereas the TJs serve as a diffusion barrier for solutes and define the boundary between apical and basolateral membrane domains [21]. The AJs and TJs are required for integrity of the epithelial phenotype, as well as for epithelial cells to function as a tissue [75].
The TJs are closely linked to the proper polarization of cells for the establishment of epithelial architecture[86]. During cancer development, epithelial cells lose the capability to form TJs and correct apico–basal polarity [59]. This subsequently causes the loss of contact inhibition of cell growth [91]. In addition, reduction of ZO-1 and occludin were found to be correlated with poorly defined differentiation, higher metastatic frequency and lower survival rates [49,64]. Hence, TJs proteins have a tumor suppressive function in cancer formation and progression.
3.2. Apical–basal cell polarity
The apical–basal polarity of epithelial cells in an epithelium is characterized by the presence of two specialized plasma membrane domains: namely, the apical surface and basolateral surface [30]. In general, the epithelial cell polarity is determined by three core complexes. These protein complexes include: (1) the partitioning-defective (PAR) complex; (2) the Crumbs (CRB) complex; and (3) the Scribble complex[2,30,45,51]. PAR complex is composed of two scaffold proteins (PAR6 and PAR3) and an atypical protein kinase C (aPKC) and is localized to the apical junction domain for the assembly of TJs [31,39]. The Crumbs complex is formed by the transmembrane protein Crumbs and the cytoplasmic scaffolding proteins such as the homologue of Drosophila Stardust (Pals1) and Pals-associated tight junction protein (Patj) and localizes to the apical [38]. The Scribble complex is comprised of three proteins, Scribble, Disc large (Dlg) and Lethal giant larvae (Lgl) and is localized in the basolateral domain of epithelial cells [100].
Fig. 4 ERp29 regulates epithelial cell morphogenesis. Over-expression of ERp29 in breast cancer cells induces the transition from a mesenchymal-like to epithelial-like phenotype and the restoration of tight junctions and cell polarity. Up-regulation and membrane …
http://www.ncbi.nlm.nih.gov/pmc/articles/PMC4329646/bin/gr4.gif
The current data from breast cancer cells supports the idea that ERp29 can function as a tumor suppressive protein, in terms of suppression of cell growth and primary tumor formation and inhibition of signaling pathways that facilitate EMT. Nevertheless, the significant role of ERp29 in cell survival against drugs, induction of cell differentiation and potential promotion of MET-related metastasis may lead us to re-assess its function in cancer progression, particularly in distant metastasis. Hence, it is important to explore in detail the ERp29’s role in cancer as a “friend or foe” and to elucidate its clinical significance in breast cancer and other epithelial cancers. Targeting ERp29 and/or its downstream molecules might be an alternative molecular therapeutic approach for chemo/radio-resistant metastatic cancer treatment
7.3.5 Putting together structures of epidermal growth factor receptors
Bessman NJ, Freed DM, Lemmon MA
Curr Opin Struct Biol. 2014 Dec; 29:95-101
http://dx.doi.org:/10.1016/j.sbi.2014.10.002
Highlights
- Several studies suggest flexible linkage between extracellular and intracellular regions. • Others imply more rigid connections, required for allosteric regulation of dimers. • Interactions with membrane lipids play important roles in EGFR regulation. • Cellular studies suggest half-of-the-sites negative cooperativity for human EGFR.
Numerous crystal structures have been reported for the isolated extracellular region and tyrosine kinase domain of the epidermal growth factor receptor (EGFR) and its relatives, in different states of activation and bound to a variety of inhibitors used in cancer therapy. The next challenge is to put these structures together accurately in functional models of the intact receptor in its membrane environment. The intact EGFR has been studied using electron microscopy, chemical biology methods, biochemically, and computationally. The distinct approaches yield different impressions about the structural modes of communication between extracellular and intracellular regions. They highlight possible differences between ligands, and also underline the need to understand how the receptor interacts with the membrane itself.
http://ars.els-cdn.com/content/image/1-s2.0-S0959440X14001304-gr1.sml
http://ars.els-cdn.com/content/image/1-s2.0-S0959440X14001304-gr2.sml
Growth factor receptor tyrosine kinases (RTKs) such as the epidermal growth factor receptor (EGFR) have been the subjects of intense study for many years [1,2]. There are 58 RTKs in the deduced human
proteome, and all play key roles in regulating cellular processes such as proliferation, differentiation, cell survival and metabolism, cell migration, and cell cycle control [3]. Importantly, aberrant activation
of RTK signaling by mutation, gene amplification, gene translocation or other mechanisms has been causally linked to cancers, diabetes, inflammation, and other diseases. These observations have prompted
the development of many targeted therapies that inhibit RTKs such as EGFR [4], Kit, VEGFR, or their ligands — typically employing therapeutic antibodies [5] or small molecule tyrosine kinase inhibitors [6].
Following the initial discoveries for EGFR [7] and the platelet-derived growth factor receptor (PDGFR) [8] that ligand-stabilized dimers are essential for RTK signaling, structural studies over the past decade
or so have guided development of quite sophisticated mechanistic views[1]. Each RTK has a ligand-binding extracellular region (ECR) that is linked by a single transmembrane a-helix to an intracellular
tyrosine kinase domain (TKD). Structures of the isolated ECRs and TKDs from several RTKs point to surprising mechanistic diversity across the larger family [1]. Unliganded RTKs exist as an equilibrium
mixture of inactive monomers, inactive dimers and active dimers (Figure 1), except for the extreme case of the insulin receptor (IR), which is covalently dimerized [9]. Extracellular ligand can bind to monomers,
to inactive dimers, or to active dimers — in each case pushing the equilibria shown in Figure 1 towards the central ligand-bound active dimer. Thus, ligand binding can drive receptor dimerization (Figure 1,
upper), or can promote inactive-to-active conformational transitions in dimers (Figure 1, lower). Regardless of pathway, the intracellular TKD of the ligand-stabilized dimer becomes activated either through
trans-autophosphorylation or through induced allosteric changes [1,10]. Roles for other parts of the receptor in RTK activation, including the juxtamembrane (JM) and transmembrane (TM) segments, have
also become clearer. The key current challenge for the field is to assemble data from many studies of isolated RTK parts into coherent views of how the intact receptors are regulated in their native membranes.
We will focus here on recent efforts to do this for the EGFR (or ErbB receptor) family. The missing links in intact RTKs: flexible or rigid? A central goal in extrapolating to the intact RTKs from studies of
isolated soluble domains is to understand how the individual parts of the receptor communicate with one another. The methods that have been used to produce and study the isolated domains inevitably
yield the impression that inter-domain linkers are flexible and disordered. For example, extracellular juxtamembrane regions have typically only been observed as C-terminal extensions of the soluble ECR.
Similarly, intracellular juxtamembrane regions have been encountered predominantly as N-terminal extensions of TKD constructs, or as short peptides. In each of these contexts, the JM regions are incomplete,
and may appear disordered and flexible simply because key structural restraints have been removed. Nonetheless, this possible artifact has strongly influenced thinking about linkages between the extracellular
and intracellular regions [11], and in turn about mechanisms of RTK signaling. Highly flexible linkages between extracellular and intracellular regions of RTKs are fully consistent with simpler ligand-induced
dimerization models for transmembrane signaling by RTKs. It is more difficult, however, to understand how subtle allosteric communication across the membrane could be achieved if the linkages are truly
flexible. For example, since flexible linkage implies structural independence of the extracellular and intracellular regions, it is difficult to envision how a transition from inactive to active dimer in Figure 1
could be controlled precisely by ligand without more rigid (or restricted) connections.
Recent experimental studies with intact — or nearly intact — EGFR differ in the impressions they provide about how flexibly or rigidly the extracellular and intracellular regions are linked. Springer’s laboratory used cysteine crosslinking and mutagenesis approaches to investigate this issue for EGFR expressed in Ba/F3 cells [12]. They were unable to identify any specific JM or TM region interfaces
that were required for EGFR signaling, leading them to argue that the linkage across the membrane is too flexible to transmit a specific orientation between the extracellular and intracellular regions.
Consistent with this, negative-stain electron microscopy studies of (nearly) full-length EGFR in dodecylmaltoside micelles showed that a given extracellular dimer can be linked to several different
arrangements of the intracellular kinase domain [13,14]. Similarly, dimers driven by inhibitor binding to the intracellular TKD could couple to multiple different ECR conformations [13]. Biochemical
studies are also consistent with such structural independence of the extracellular and intracellular regions [15,16]. Contrasting with these observations, however, Schepartz and colleagues have
reported that different precise conformations within the EGFR intracellular region can be induced by distinct activating ligands [17]. They used a method called bipartite tetracysteine display that
reports on formation of a chemically detectable tetracysteine motif when two cysteine pairs come together at the dimer interface. EGF activation of the receptor led to formation of a tetracysteine
motif that requires the intracellular JM helix [18] shown in Figure 2a to form antiparallel coiled-coil dimers (Figure 2b/c) as proposed by Kuriyan and colleagues [19,20]. Surprisingly, transforming
growth factor-a (TGFa),which also activates EGFR, did not bring these two cysteine pairs together in the same way — arguing that TGFa does not induce formation of the same intracellular antiparallel
coiled-coil. Instead, activation of EGFR with TGFa (but not EGF) stabilized an alternative tetracysteine motif, consistent with a different intracellular JM structure. Evidence for ‘inside-out’ signaling
in EGFR has also been reported, where alterations in the intracellular JM region directly influence allosteric EGF binding to the ECR of the intact receptor analyzed in CHO cells [21–23]. The contradictory
views of flexibility versus rigidity in linkages between the domains leave the path to understanding the intact receptor unclear, although it seems reasonable doubt that the inactive dimers known to
form in the absence of ligand [24–26] could be regulated by extracellular ligand if all linkages are always highly flexible.
Does the membrane hold the key?
All of the studies that support direct conformational communication between the extracellular and intracellular regions of EGFR were performed in cells [17,21,22]. By contrast, most of those that
explicitly suggest otherwise were performed in detergent micelles [13,14,15] — where the potentially important influences of specific membrane lipids (or membrane geometry) are absent. Studies of intact EGFR in liposomes with defined lipid compositions [27] have shown that the ganglioside GM3 inhibits ligand-independent activation (and dimerization) of the receptor, apparently through interactions with a site in its extracellular JM region. McLaughlin and colleagues [28,29] also proposed a model in which interaction of the intracellular JM region (and TKD) with anionic phospholipids in the inner leaflet of the plasma membrane (notably PtdIns(4,5)P2) exerts an inhibitory effect that must be overcome in order for EGFR to signal. Association of the JM and TM regions with specific membrane lipids is likely to define specific structures in the linkages between the EGFR extracellular and intracellular regions that are more well-defined (and potentially rigid) than is typically appreciated. Recent studies have begun to shed some structural light on how membrane interactions with the intracellular JM region of EGFR might influence the signaling mechanism. Endres et al. [20] found that simply tethering the complete intracellular region of EGFR to the inner leaflet of the plasma membrane maintains the TKD in a largely monomeric state and inhibits its kinase activity. Parallel computational studies [30] suggest that this results from the previously proposed [29] inhibitory interaction of the JM and TKD regions of EGFR with the negatively charged membrane surface. The data of Endres et al. [20] further indicated that TM-mediated dimerization reverses this inhibitory effect. Moreover, NMR studies of a 60-residue peptide containing the TM and part of the JM region solubilized in lipid bicelles led them to conclude that specific TM dimerization through an N terminal GxxxG motif stabilizes formation of an antiparallel coiled-coil between the two JM fragments in the dimer — the same JM coiled-coil shown in Figure 2b/c that was investigated in the bipartite tetracysteine display studies of intact EGF-bound EGFR described above [17,19]. Independent solid-state NMR studies of a similar TM-JM peptide from the EGFR relative
ErbB2 in vesicles containing acidic phospholipids [31] further suggested that an activating mutation in the TM domain leads to release of the JM region from the anionic membrane surface. Collectively,
these data suggest that ligand-induced dimerization of the receptor (or reorientation of receptors within a dimer) may engage the TM domain in a specific dimer that promotes both the formation of activating
interactions in the JM region and the disruption of inhibitory interactions between the JM region (and possibly TKD) and the membrane surface.
Negative cooperativity
A key characteristic of ligand binding at the cell surface to EGFR [36], IR [37], and other receptors [38] is negative cooperativity — which is lost when soluble forms of the ECR from human EGFR [39]
or IR [40] are studied in isolation. Several studies have shown that intracellular and/or transmembrane regions are required for this negative cooperativity to be manifest [21,22,40,41], implying that
these parts of the receptor contribute to breaking the symmetry of the dimer — as required for the two sites to have distinct binding properties [42]. Such propagation of dimer asymmetry across the
membrane would surely require defined structures in the regions that connect extracellular and intracellular regions, and is difficult to reconcile with highly flexible JM linkers.
In brief, binding of one ligand stabilizes a singly-liganded asymmetric dimer in which the unoccupied ligand-binding site is compromised [43]. The binding affinity of the second ligand is thus reduced,
constituting a half-of-the-sites mode of negative cooperativity [44]. Leahy’s group has provided important evidence consistent with a similar mechanism in the cases of human EGFR and ErbB4 [16].
By comparing human ErbB receptor ECR dimer crystal structures with different bound ligands, Leahy and colleagues went on to identify two types of dimer interface [16], a ‘flush’ interface that resembles
the asymmetric (singly-liganded) dimer seen for the Drosophila EGFR [43] and a ‘staggered’ interface seen in the ECRs from EGFR (with bound EGF [12]) and ErbB4 (with bound neuregulin1b[16]).
These observations suggest that the ‘flush’ interface drives the most stable dimers, which are singly liganded (Figure 2b). Binding of the second ligand is weaker, and also forces the dimer interface
into the less stable ‘staggered’ conformation (Figure 2c). Taken together, these findings suggest both a structural basis for negative cooperativity and a possible structural distinction between singly-liganded
and doubly-liganded ErbB receptor dimers.
A model for EGFR activation
The model shown in Figure 2 summarizes key proposed steps in the activation of human EGFR. In the absence of ligand, the ECR exists in a tethered conformation with the domain II ‘dimerization
arm’ engaged in an intramolecular interaction with domain IV that occludes the dimer interface [49]. The TKDs and the N-terminal portions of each intracellular JM region are thought to be engaged
in autoinhibitory interactions with the membrane surface [20,28,29,30].
Figure 2. More detailed view of EGF-induced activation of EGFR, as described in the text.
In the absence of ligand (a), the ECR adopts a tethered conformation, with an autoinhibitory tether interaction between domains II and IV. The TKD and JM regions lie against the membrane, making what
are believed to be additional autoinhibitory interactions. Domains I and III of the ECR are colored red, and domains II and IV are green. The JM helix is shown as a short cylinder and labeled in magenta.
The N-lobes and C-lobes of the kinase are also labeled, and both helix aC (blue) and the short helix in the activation loop (green) that interacts with aC to inhibit the TKD [50] are shown. The C-tail is
also depicted as a curve bearing 5 tyrosines. As described in the text, binding of a single ligand (b) induces formation of a singly-liganded dimer with a ‘flush’ (presumed asymmetric) ECR dimer interface.
The JM region forms an anti-parallel helix, as labeled in magenta, and the TKDs form an asymmetric dimer in which the activator (grey) allosterically activates the receiver (shown with an amber N-lobe).
It is not clear how the extracellular and intracellular asymmetry is structurally related, if at all. Finally, a second ligand binds to yield a more symmetric dimer with the ‘staggered’ ECR interface (c) described
in the text.
Conclusions Our mechanistic understanding of EGFR and its relatives has advanced dramatically in recent years, and the past year or two has seen substantial progress in putting the results of studies
with isolated domains together into initial views of how the intact receptor works. New insights into the origin of allosteric regulation of EGFR have been gained through a combination of innovative
structural, biochemical, cellular, and computational studies. A self-consistent picture is beginning to emerge. Two key issues remain unclear, however, and represent the current frontiers in studies of EGFR.
The first — for which we describe progress in this review — centers on the influence of specific interactions of the receptor with membrane lipids, which seem likely to define the structural ‘connections’
between extracellular and intracellular regions of the receptor. The second centers on the role of the carboxy-terminal 230 amino acids, which is believed to play a regulatory role for which little detail has
so far been defined [55].
(10PRE4140108).
DMF
is
supported
by
7.3.6 Complex Relationship between Ligand Binding and Dimerization in the Epidermal Growth Factor Receptor
Bessman NJ1, Bagchi A2, Ferguson KM2, Lemmon MA3.
Cell Rep. 2014 Nov 20; 9(4):1306-17.
http://dx.doi.org/10.1016/j.celrep.2014.10.010
Highlights
- Preformed extracellular dimers of human EGFR are structurally heterogeneous • EGFR dimerization does not stabilize ligand binding
• Extracellular mutations found in glioblastoma do not stabilize EGFR dimerization • Glioblastoma mutations in EGFR increase ligand-binding affinity
The epidermal growth factor receptor (EGFR) plays pivotal roles in development and is mutated or overexpressed in several cancers. Despite recent advances, the complex allosteric regulation of EGFR remains incompletely understood. Through efforts to understand why the negative cooperativity observed for intact EGFR is lost in studies of its isolated extracellular region (ECR), we uncovered unexpected relationships between ligand binding and receptor dimerization. The two processes appear to compete. Surprisingly, dimerization does not enhance ligand binding (although ligand binding promotes dimerization). We further show that simply forcing EGFR ECRs into preformed dimers without ligand yields ill-defined, heterogeneous structures. Finally, we demonstrate that extracellular EGFR-activating mutations in glioblastoma enhance ligand-binding affinity without directly promoting EGFR dimerization, suggesting that these oncogenic mutations alter the allosteric linkage between dimerization and ligand binding. Our findings have important implications for understanding how EGFR and its relatives are activated by specific ligands and pathological mutations.
http://www.cell.com/cms/attachment/2020816777/2040986303/fx1.jpg
X-ray crystal structures from 2002 and 2003 (Burgess et al., 2003) yielded the scheme for ligand-induced epidermal growth factor receptor (EGFR) dimerization shown in Figure 1. Binding of a single ligand to domains I and III within the same extracellular region (ECR) stabilizes an “extended” conformation and exposes a dimerization interface in domain II, promoting self-association with a KD in the micromolar range (Burgess et al., 2003, Dawson et al., 2005, Dawson et al., 2007). Although this model satisfyingly explains ligand-induced EGFR dimerization, it fails to capture the complex ligand-binding characteristics seen for cell-surface EGFR, with concave-up Scatchard plots indicating either negative cooperativity (De Meyts, 2008, Macdonald and Pike, 2008) or distinct affinity classes of EGF-binding site with high-affinity sites responsible for EGFR signaling (Defize et al., 1989). This cooperativity or heterogeneity is lost when the ECR from EGFR is studied in isolation, as also described for the insulin receptor (De Meyts, 2008).
Figure 1
Structural View of Ligand-Induced Dimerization of the hEGFR ECR
(A) Surface representation of tethered, unliganded, sEGFR from Protein Data Bank entry 1NQL (Ferguson et al., 2003). Ligand-binding domains I and III are green and cysteine-rich domains II and IV are cyan. The intramolecular domain II/IV tether is circled in red.
(B) Hypothetical model for an extended EGF-bound sEGFR monomer based on SAXS studies of an EGF-bound dimerization-defective sEGFR variant (Dawson et al., 2007) from PDB entry 3NJP (Lu et al., 2012). EGF is blue, and the red boundary represents the primary dimerization interface.
(C) 2:2 (EGF/sEGFR) dimer, from PDB entry 3NJP (Lu et al., 2012), colored as in (B). Dimerization arm contacts are circled in red.
http://www.cell.com/cms/attachment/2020816777/2040986313/gr1.sml
Here, we describe studies of an artificially dimerized ECR from hEGFR that yield useful insight into the heterogeneous nature of preformed ECR dimers and into the origins of negative cooperativity. Our data also argue that extracellular structures induced by ligand binding are not “optimized” for dimerization and conversely that dimerization does not optimize the ligand-binding sites. We also analyzed the effects of oncogenic mutations found in glioblastoma patients (Lee et al., 2006), revealing that they affect allosteric linkage between ligand binding and dimerization rather than simply promoting EGFR dimerization. These studies have important implications for understanding extracellular activating mutations found in EGFR/ErbB family receptors in glioblastoma and other cancers and also for understanding specificity of ligand-induced ErbB receptor heterodimerization
Predimerizing the EGFR ECR Has Modest Effects on EGF Binding
To access preformed dimers of the hEGFR ECR (sEGFR) experimentally, we C-terminally fused (to residue 621 of the mature protein) either a dimerizing Fc domain (creating sEGFR-Fc) or the dimeric leucine zipper from S. cerevisiae GCN4 (creating sEGFR-Zip). Size exclusion chromatography (SEC) and/or sedimentation equilibrium analytical ultracentrifugation (AUC) confirmed that the resulting purified sEGFR fusion proteins are dimeric (Figure S1). To measure KD values for ligand binding to sEGFR-Fc and sEGFR-Zip, we labeled EGF with Alexa-488 and monitored binding in fluorescence anisotropy (FA) assays. As shown in Figure 2A, EGF binds approximately 10-fold more tightly to the dimeric sEGFR-Fc or sEGFR-Zip proteins than to monomeric sEGFR (Table 1). The curves obtained for EGF binding to sEGFR-Fc and sEGFR-Zip showed no signs of negative cooperativity, with sEGFR-Zip actually requiring a Hill coefficient (nH) greater than 1 for a good fit (nH = 1 for both sEGFRWT and sEGFR-Fc). Thus, our initial studies argued that simply dimerizing human sEGFR fails to restore the negatively cooperative ligand binding seen for the intact receptor in cells.
One surprise from these data was that forced sEGFR dimerization has only a modest (≤10-fold) effect on EGF-binding affinity. Under the conditions of the FA experiments, isolated sEGFR (without zipper or Fc fusion) remains monomeric; the FA assay contains just 60 nM EGF, so the maximum concentration of EGF-bound sEGFR is also limited to 60 nM, which is over 20-fold lower than the KD for dimerization of the EGF/sEGFR complex (Dawson et al., 2005, Lemmon et al., 1997). This ≤10-fold difference in affinity for dimeric and monomeric sEGFR seems small in light of the strict dependence of sEGFR dimerization on ligand binding (Dawson et al., 2005,Lax et al., 1991, Lemmon et al., 1997). Unliganded sEGFR does not dimerize detectably even at millimolar concentrations, whereas liganded sEGFR dimerizes with KD ∼1 μM, suggesting that ligand enhances dimerization by at least 104– to 106-fold. Straightforward linkage of dimerization and binding equilibria should stabilize EGF binding to dimeric sEGFR similarly (by 5.5–8.0 kcal/mol). The modest difference in EGF-binding affinity for dimeric and monomeric sEGFR is also significantly smaller than the 40- to 100-fold difference typically reported between high-affinity and low-affinity EGF binding on the cell surface when data are fit to two affinity classes of binding site (Burgess et al., 2003, Magun et al., 1980).
Mutations that Prevent sEGFR Dimerization Do Not Significantly Reduce Ligand-Binding Affinity
The fact that predimerizing sEGFR only modestly increased ligand-binding affinity led us to question the extent to which domain II-mediated sEGFR dimerization is linked to ligand binding. It is typically assumed that the domain II conformation stabilized upon forming the sEGFR dimer in Figure 1C optimizes the domain I and III positions for EGF binding. To test this hypothesis, we introduced a well-characterized pair of domain II mutations into sEGFRs that block dimerization: one at the tip of the dimerization arm (Y251A) and one at its “docking site” on the adjacent molecule in a dimer (R285S). The resulting (Y251A/R285S) mutation abolishes sEGFR dimerization and EGFR signaling (Dawson et al., 2005, Ogiso et al., 2002). Importantly, we chose isothermal titration calorimetry (ITC) for these studies, where all interacting components are free in solution. Previous surface plasmon resonance (SPR) studies have indicated that dimerization-defective sEGFR variants bind immobilized EGF with reduced affinity (Dawson et al., 2005), and we were concerned that this reflects avidity artifacts, where dimeric sEGFR binds more avidly than monomeric sEGFR to sensor chip-immobilized EGF.
Surprisingly, our ITC studies showed that the Y251A/R285S mutation has no significant effect on ligand-binding affinity for sEGFR in solution (Table 1). These experiments employed sEGFR (with no Fc fusion) at 10 μM—ten times higher than KD for dimerization of ligand-saturated WT sEGFR (sEGFRWT) (KD ∼1 μM). Dimerization of sEGFRWT should therefore be complete under these conditions, whereas the Y251A/R285S-mutated variant (sEGFRY251A/R285S) does not dimerize at all (Dawson et al., 2005). The KD value for EGF binding to dimeric sEGFRWT was essentially the same (within 2-fold) as that for sEGFRY251A/R285S (Figures 2B and 2C; Table 1), arguing that the favorable Gibbs free energy (ΔG) of liganded sEGFR dimerization (−5.5 to −8 kcal/mol) does not contribute significantly (<0.4 kcal/mol) to enhanced ligand binding. …
Thermodynamics of EGF Binding to sEGFR-Fc
If there is no discernible positive linkage between sEGFR dimerization and EGF binding, why do sEGFR-Fc and sEGFR-Zip bind EGF ∼10-fold more strongly than wild-type sEGFR? To investigate this, we used ITC to compare EGF binding to sEGFR-Fc and sEGFR-Zip (Figures 3A and 3B ) with binding to isolated (nonfusion) sEGFRWT. As shown in Table 1, the positive (unfavorable) ΔH for EGF binding is further elevated in predimerized sEGFR compared with sEGFRWT, suggesting that enforced dimerization may actually impair ligand/receptor interactions such as hydrogen bonds and salt bridges. The increased ΔH is more than compensated for, however, by a favorable increase in TΔS. This favorable entropic effect may reflect an “ordering” imposed on unliganded sEGFR when it is predimerized, such that it exhibits fewer degrees of freedom compared with monomeric sEGFR. In particular, since EGF binding does induce sEGFR dimerization, it is clear that predimerization will reduce the entropic cost of bringing two sEGFR molecules into a dimer upon ligand binding, possibly underlying this effect.
Possible Heterogeneity of Binding Sites in sEGFR-Fc
Close inspection of EGF/sEGFR-Fc titrations such as that in Figure 3A suggested some heterogeneity of sites, as evidenced by the slope in the early part of the experiment. To investigate this possibility further, we repeated titrations over a range of temperatures. We reasoned that if there are two different types of EGF-binding sites in an sEGFR-Fc dimer, they might have different values for heat capacity change (ΔCp), with differences that might become more evident at higher (or lower) temperatures. Indeed, ΔCp values correlate with the nonpolar surface area buried upon binding (Livingstone et al., 1991), and we know that this differs for the two Spitz-binding sites in the asymmetric Drosophila EGFR dimer (Alvarado et al., 2010). As shown in Figure 3C, the heterogeneity was indeed clearer at higher temperatures for sEGFR-Fc—especially at 25°C and 30°C—suggesting the possible presence of distinct classes of binding sites in the sEGFR-Fc dimer. We were not able to fit the two KD values (or ΔH values) uniquely with any precision because the experiment has insufficient information for unique fitting to a model with four variables. Whereas binding to sEGFRWT could be fit confidently with a single-site binding model throughout the temperature range, enforced sEGFR dimerization (by Fc fusion) creates apparent heterogeneity in binding sites, which may reflect negative cooperativity of the sort seen with dEGFR. …
Ligand Binding Is Required for Well-Defined Dimerization of the EGFR ECR
To investigate the structural nature of the preformed sEGFR-Fc dimer, we used negative stain electron microscopy (EM). We hypothesized that enforced dimerization might cause the unliganded ECR to form the same type of loose domain II-mediated dimer seen in crystals of unliganded Drosophila sEGFR (Alvarado et al., 2009). When bound to ligand (Figure 4A), the Fc-fused ECR clearly formed the characteristic heart-shape dimer seen by crystallography and EM (Lu et al., 2010, Mi et al., 2011). Figure 4B presents a structural model of an Fc-fused liganded sEGFR dimer, and Figure 4C shows a calculated 12 Å resolution projection of this model. The class averages for sEGFR-Fc plus EGF (Figure 4A) closely resemble this model, yielding clear densities for all four receptor domains, arranged as expected for the EGF-induced domain II-mediated back-to-back extracellular dimer shown in Figure 1 (Garrett et al., 2002, Lu et al., 2010). In a subset of classes, the Fc domain also appeared well resolved, indicating that these particular arrangements of the Fc domain relative to the ECR represent highly populated states, with the Fc domains occupying similar positions to those of the kinase domain in detergent-solubilized intact receptors (Mi et al., 2011). …
Our results and those of Lu et al. (2012)) argue that preformed extracellular dimers of hEGFR do not contain a well-defined domain II-mediated interface. Rather, the ECRs in these dimers likely sample a broad range of positions (and possibly conformations). This conclusion argues against recent suggestions that stable unliganded extracellular dimers “disfavor activation in preformed dimers by assuming conformations inconsistent with” productive dimerization of the rest of the receptor (Arkhipov et al., 2013). The ligand-free inactive dimeric ECR species modeled by Arkhipov et al. (2013) in their computational studies of the intact receptor do not appear to be stable. The isolated ECR from EGFR has a very low propensity for self-association without ligand, with KD in the millimolar range (or higher). Moreover, sEGFR does not form a defined structure even when forced to dimerize by Fc fusion. It is therefore difficult to envision how it might assume any particular autoinhibitory dimeric conformation in preformed dimers. …
Extracellular Oncogenic Mutations Observed in Glioblastoma May Alter Linkage between Ligand Binding and sEGFR Dimerization
Missense mutations in the hEGFR ECR were discovered in several human glioblastoma multiforme samples or cell lines and occur in 10%–15% of glioblastoma cases (Brennan et al., 2013, Lee et al., 2006). Several elevate basal receptor phosphorylation and cause EGFR to transform NIH 3T3 cells in the absence of EGF (Lee et al., 2006). Thus, these are constitutively activating oncogenic mutations, although the mutated receptors can be activated further by ligand (Lee et al., 2006, Vivanco et al., 2012). Two of the most commonly mutated sites in glioblastoma, R84 and A265 (R108 and A289 in pro-EGFR), are in domains I and II of the ECR, respectively, and contribute directly in inactive sEGFR to intramolecular interactions between these domains that are thought to be autoinhibitory (Figure 5). Domains I and II become separated from one another in this region upon ligand binding to EGFR (Alvarado et al., 2009), as illustrated in the lower part of Figure 5. Interestingly, analogous mutations in the EGFR relative ErbB3 were also found in colon and gastric cancers (Jaiswal et al., 2013).
We hypothesized that domain I/II interface mutations might activate EGFR by disrupting autoinhibitory interactions between these two domains, possibly promoting a domain II conformation that drives dimerization even in the absence of ligand. In contrast, however, sedimentation equilibrium AUC showed that sEGFR variants harboring R84K, A265D, or A265V mutations all remained completely monomeric in the absence of ligand (Figure 6A) at a concentration of 10 μM, which is similar to that experienced at the cell surface (Lemmon et al., 1997). As with WT sEGFR, however, addition of ligand promoted dimerization of each mutated sEGFR variant, with KD values that were indistinguishable from those of WT. Thus, extracellular EGFR mutations seen in glioblastoma do not simply promote ligand-independent ECR dimerization, consistent with our finding that even dimerized sEGFR-Fc requires ligand binding in order to form the characteristic heart-shaped dimer. …
We suggest that domain I is normally restrained by domain I/II interactions so that its orientation with respect to the ligand is compromised. When the domain I/II interface is weakened with mutations, this effect is mitigated. If this results simply in increased ligand-binding affinity of the monomeric receptor, the biological consequence might be to sensitize cells to lower concentrations of EGF or TGF-α (or other agonists). However, cellular studies of EGFR with glioblastoma-derived mutations (Lee et al., 2006, Vivanco et al., 2012) clearly show ligand-independent activation, arguing that this is not the key mechanism. The domain I/II interface mutations may also reduce restraints on domain II so as to permit dimerization of a small proportion of intact receptor, driven by the documented interactions that promote self-association of the transmembrane, juxtamembrane, and intracellular regions of EGFR (Endres et al., 2013, Lemmon et al., 2014, Red Brewer et al., 2009).
Setting out to test the hypothesis that simply dimerizing the EGFR ECR is sufficient to recover the negative cooperativity lost when it is removed from the intact receptor, we were led to revisit several central assumptions about this receptor. Our findings suggest three main conclusions. First, we find that enforcing dimerization of the hEGFR ECR does not drive formation of a well-defined domain II-mediated dimer that resembles ligand-bound ECRs or the unliganded ECR from Drosophila EGFR. Our EM and SAXS data show that ligand binding is necessary for formation of well-defined heart-shaped domain II-mediated dimers. This result argues that the unliganded extracellular dimers modeled by Arkhipov et al. (2013)) are not stable and that it is improbable that stable conformations of preformed extracellular dimers disfavor receptor activation by assuming conformations that counter activating dimerization of the rest of the receptor. Recent work from the Springer laboratory employing kinase inhibitors to drive dimerization of hEGFR (Lu et al., 2012) also showed that EGF binding is required to form heart-shaped ECR dimers. These findings leave open the question of the nature of the ECR in preformed EGFR dimers but certainly argue that it is unlikely to resemble the crystallographic dimer seen for unligandedDrosophila EGFR (Alvarado et al., 2009) or that suggested by computational studies (Arkhipov et al., 2013).
This result argues that ligand binding is required to permit dimerization but that domain II-mediated dimerization may compromise, rather than enhance, ligand binding. Assuming flexibility in domain II, we suggest that this domain serves to link dimerization and ligand binding allosterically. Optimal ligand binding may stabilize one conformation of domain II in the scheme shown in Figure 1 that is then distorted upon dimerization of the ECR, in turn reducing the strength of interactions with the ligand. Such a mechanism would give the appearance of a lack of positive linkage between ligand binding and ECR dimerization, and a good test of this model would be to determine the high-resolution structure of a liganded sEGFR monomer (which we expect to differ from a half dimer). This model also suggests a mechanism for selective heterodimerization over homodimerization of certain ErbB receptors. If a ligand-bound EGFR monomer has a domain II conformation that heterodimerizes with ErbB2 in preference to forming EGFR homodimers, this could explain several important observations. It could explain reports that ErbB2 is a preferred heterodimerization partner of EGFR (Graus-Porta et al., 1997) and might also explain why EGF binds more tightly to EGFR in cells where it can form heterodimers with ErbB2 than in cells lacking ErbB2, where only EGFR homodimers can form (Li et al., 2012).
7.3.7 IGFBP-2/PTEN: A critical interaction for tumours and for general physiology?
IGFBP-2
The insulin-like growth factor family of proteins, together with insulin, form an evolutionarily conserved system that helps to coordinate the metabolic status and activity of organisms with their nutritional environment. When food is abundant, the IGF/insulin signalling pathway is switched on and cell proliferation and other activities are enhanced; while when food is limited, such activities are suppressed to conserve energy and resources [1,2]. The IGF axis consists of two ligands IGF-I and -II, a series of heterotetrameric tyrosine kinase receptors and six high affinity binding proteins IGFBP-1 to-6. These IGFBPs not only regulate the reservoir, availability and functions of IGFs but also have direct actions upon cell behaviour that are independent of IGF-binding [3]. The six IGFBPs are conserved in all placental mammals having evolved from serial duplication of genes that were present throughout vertebrate evolution [4]. Each of the six IGFBPs has evolved unique functions that presumably have conferred some evolutionary advantage and hence have been conserved across mammalian evolution. After IGFBP-3, IGFBP-2 is the second most abundant binding protein in the circulation throughout adult life in humans. While circulating IGFBP-3 levels peak during puberty and decrease thereafter, IGFBP-2 levels are highest in infancy and old age. Together with the other five IGFBPs, IGFBP-2 regulates IGF availability and actions and has pleiotropic effects on normal and neoplastic tissues [3]. One of the clear distinctive structural features of IGFBP-2 is that it contains an Arg-Gly-Asp (RGD) sequence that enables functional interactions with integrin receptors [4]. This structural element is only present in one of the other IGFBPs, IGFBP-1. Although the RGD sequence was only acquired in IGFBP-1 during mammalian evolution it was present within IGFBP-2 from early vertebrate evolution indicating that it has been a long retained functional characteristic of IGFBP-2 [4]. The integrin receptors are critical for the anchorage of cells to the extracellular matrix (ECM) within tissues and hence for maintaining tissue architecture [5,6]. In solid tissue an important safeguard is imposed by linking normal cell functions and proliferation to appropriate cues from the ECM that are mediated by signals from attachment receptors such as the integrin receptors. Anchoragedependent growth is a common feature of normal cells and loss of attachment results in a form of apoptosis called anoikis. The integrin receptors interact with growth factor receptors in an ancillary and permissive manner to ensure that the signals for growth and survival occur in the appropriate setting and not inappropriately in detached cells. It has also become clear that integrin receptors serve many other roles in regulating cell functions and integrating cues from the surrounding ECM [5,6]. Over the last few decades, as the role of IGFBPs as extracellular modulators of IGF-availability and actions has emerged, there has also been a gradual characterization of the intracellular counter-regulatory components that modulate the signals initiated by IGF-receptor activation. There has been considerable progress in charting the signalling cascades initiated from these receptors but it is evident that the reason needs to be mechanisms for inactivating the pathways in intervening periods in preparation for subsequent activation. Throughout the canonical kinase cascades, activated by receptor ligation, at each node there is a corresponding phosphatase that returns the pathway to the inactive state and modulates the signal. The extracellular regulators of these phosphatases have however received much less attention than the activating kinases. That the extracellular counter-regulators may act in synchrony and be linked to the intracellular counter-regulators has only recently started to be revealed. Transgenic over-expression of IGFBP-2 at supra-physiological levels in mice results in reduced somatic growth [7] and this growth deficit is more pronounced when these mice were crossed with mice with raised growth hormone/IGF-I [8] implying that the growth inhibitory effect was due to sequestration of IGF-I. As with most of the IGFBP-family [3], there are also however multiple lines of evidence that IGFBP-2 has cellular actions that are independent of its ability to bind IGFs. There is evidence that IGFBP-2 initiates intrinsic cellular signalling through specific binding of its RGD-motif to integrin receptors, particularly the α5β1 integrin.In addition IGFBP-2 appears to modulate IGF and epidermal growth factor signalling through interactions with α5β3 integrins [9]. A heparin binding domain also exists in IGFBP-2 and it has been shown to bind to glycosaminoglycans [10], heparin [11], and other proteoglycans such as the receptor protein tyrosine phosphatase-β (RPTPβ) [12,13]. In addition,IGFBP-2has been reported to be localized on the cell surface, in the cytoplasm and on the nuclear membrane[14]. Several groups have now reported nuclear localization of IGFBP-2 [15–17]. A functional nuclear localization sequence in the central domain of IGFBP-2 has been reported that appears to interact with importin-α [18]. In the nucleus IGFBP-2 has been reported to regulate the expression of vascular endothelial growth factor [19].
IGFBP-2 and metabolic regulation
Epidemiological studies of human populations have indicated that IGFBP-2 levels are reduced in obesity, metabolic syndrome and type 2 diabetes and are inversely correlated with insulin sensitivity [20]. That these associations were due to a metabolic role for IGFBP-2, rather thanitjustbeingamarkerofdisturbance,hasbeenconfirmedinanumber of animal models. Using a transgenic IGFBP-2 over-expressing mouse model, Wheatcroft and coworkers found that IGFBP-2 was able to protect mice from high-fat/high-energy induced obesity and insulin resistance, and also protected the mice from the age-related development of glucose intolerance and hypertension [21]. Over-expression of IGFBP-2 induced by Leptin in wild type or obese mice similarly resulted in reduced plasma glucose and insulin levels [22]. All these data indicate a metabolic role for IGFBP-2 in glucose homeostasis.
IGFBP-2 and cancer
As indicated above, the early reports had implied that IGFBP-2 was generally a negative regulator of IGF-activity; the systemic growth restriction observed in transgenic mice over-expressing IGFBP-2 was followed by observations that chemically induced colorectal cancers were inhibited in this model [23]. Despite this there has been an accumulation of evidence indicating that IGFBP-2 is positively associated with the malignant progression of a wide range of cancers, as has been reviewed previously [24]. Raised serum levels of IGFBP-2 have been reported and positive associations between tumor IGFBP-2 expression and malignancy or metastasis have been observed for a variety of cancers, including glioma [25], breast [26], prostate [27], lung [28], colon [29] and lymphoid tumor [30]. Subsequent work has generally been consistent with this association between IGFBP-2 and cancer progression. In view of the majority of evidence, indicating that IGFBP-2 interacting with IGFs generally inhibited cell growth, it was suggested thatIGF-independentactionswereprobablyresponsibleforpositiveassociations between IGFBP-2 and tumourgrowth and progression [24]. The explanation for the increased expression of IGFBP-2 that has beenreportedformanydifferentcancersappearstocomefromthefactorsthat have been shown to regulate IGFBP-2 expression.The tumor suppressor gene p53, which is the most mutated gene in many human cancers, has been reported to transcriptionally regulate IGFBP-2 [31].
There also appears to again be reciprocal feedback as p53 mRNA in the breast cancer cell line Hs578T increased significantly after treatment with human recombinant IGFBP-2, suggesting a close interaction between IGFBP-2 and p53 [14]. A number of hormonal regulators of IGFBP-2 expression have been described including hCG, FSH, TGF-β, IL1, estradiol, glucocorticoids, EGF, IGF-I, IGF-II and insulin [24]. The stimulation of IGFBP-2 expression by EGF, IGF-I, IGF-II and insulin has been shown to be via the PI3K/AKT/mTOR pathway in breast cancer cells [32] and in adipocytes [33]. This is one of the most well characterisedsignallingpathwaysactivatedbyinsulinandIGFs.Inaddition the critical counter-regulatory phosphatase that deactivates this pathway the phosphatase and tensin homologue PTEN has been shown to downregulate the expression of IGFBP-2 [34]. This suggests another autoregulatory loop in which activation of the PI3K/AKT/mTOR pathway by IGFs induces the expression of IGFBP-2 that then sequesters the IGFs and modulates the signal. As activating mutations in the PI3K pathway or loss of PTEN are very common across a variety of human cancers, this plus the effect of p53, probably accounts for the common dysregulation of IGFBP-2 observed across many cancers. Using prostate cancer cell lines it has also been shown that local IGFBP-2 expression is metabolically regulated; IGFBP-2 expression was increased in hyperglycemic conditions through acetylation of histones H3 and H4 associated with the IGFBP-2 promoter, furthermore this up-regulation of IGFBP-2 mediated hyperglycemia-induced chemo-resistance [35].
PI3K
The signaling kinase PI3K plays a fundamental role that has been maintained throughout most of evolution. The ability to control growth and development according to the availability of nutrients provides a survival advantage and therefore has been selectively retained throughout evolution. Evidence has accumulated to indicate that the PI3K pathway provides this control in all species from yeast to mammals.Various forms of the PI3K enzyme exist that are classified into three groups (classes I, II, and III). Only one of these forms is present in yeast and is equivalent to mammalian class III PI3K: this acts as a nutrient sensor and is directly activated by the availability of amino acids and then itself activates mTOR/S6K1 to regulate cell growth and development [36]. In mammals class 1API3K has evolved: this form is not directly activated by nutrients but consists of heterodimers comprising a catalytic p110 subunit and a regulatory p85 subunit that enables the enzyme to be controlled by receptor tyrosine kinases, classically the insulin and insulin-like growth factor receptors (IR and IGF-IR) [37]. This enables the regulation of PI3K by social nutritionally dependent signals rather than by nutrients directly. It is not by chance that the insulin/IGF/PI3K pathway plays a fundamental role in regulating both metabolism and growth as it clearly is an advantage to synchronize the set processes and this synchronized control has been maintained throughout evolution.
Phosphatase and tensin homolog (PTEN)
Of all the intracellular counter-regulators of the IGF-pathway the one that has received the most attention in relation to cancer is PTEN. PTEN is a lipid tyrosine phosphatase that negatively regulates the Akt/ PKB signaling pathway by specifically dephosphorylating phosphatidylinositol (3,4,5)-trisphosphate and thereby reduces AKT activation to reduce signals for cell metabolism, proliferation and survival [37]. PTEN is the second most often mutated tumor suppressor in human cancers, after p53[38]. Aberrant PTEN activity occurs due to mutation, homozygous deletion, loss of heterozygosity, or epigenetic silencing. Lost or reduced activity of PTEN has been observed in a great variety of cancers, including breast [39], prostate [40,41], colorectal [42], lung[43], glioblastoma [44], endometrial [45], etc. It has been demonstrated that deregulation of PTEN is involved in tumorigenesis, tumor progression and also the predisposition of many cancers [46]. AsPI3K/Akt signaling is critical for the metabolic effects of insulin. It is clear that PTEN will also play a role in modulating the metabolic actions of insulin. Consistent with this mice genetically modified to have haploinsufficiency of PTEN were observed to be hypersensitive to insulin [47]. Similarly humans with haplo-insufficiency due to mutations in PTEN were found to have enhanced insulin sensitivity [48]. Recently an increase in insulin sensitivity due to suppression of PTEN has been described in grizzly bears in preparation for hibernation, indicating that this is a mechanism for physiological adaptation [49]. Although the genetic defects resulting in PTEN loss in cancers and the intrinsic mechanisms for regulation of PTEN have been well characterised; there have been relatively few reports of external cell regulators. Of interest one of the few extrinsic regulators that has been described is IGF-II [50]. IGF-II is the most abundant growth factor present in most human tissues and activates the PI3K/AKT/mTOR pathway. Just as the induction of IGFBP-2 by activation of the PI3K pathway suggests an autoregulatory feedback loop extrinsic to the cell;the induction of PTEN by IGF-II via PI3K suggests an additional feedback loop that is intrinsic within the cell (Fig. 1). Activation of the pathway by IGF-II induces expression of PTEN that then attenuates the signal; conversely when the pathway is not activated then PTEN expression is reduced making the cell more responsive for when an activation signal is next received.One of the mechanisms that has emerged,to explain this feedback loop, indicates that the signaling output of the PI3K/PTEN pathway is balanced by asynchronous regulation of the activity of both PI3K and PTEN. The p85α regulatory subunit of PI3K that binds to and represses the activity of the p110 catalytic subunit also binds directly to PTEN at a regulatory site within PTEN where serine/threonine phosphorylation occurs to inactivatePTEN.The p85α subunit binds to unphosphorylated PTEN at this site and enhances its lipid phosphatase activity 3-fold [51]. The nature of this feedback loop has been further extended by reports that PTEN can suppress the expression of IGF-II [52,53]. As IGF-II induces PTEN, the ability of PTEN to subsequently reduce IGF-II expression may enable the cell to protect itself from over-stimulation. In contrast loss of PTEN may increase the expression of IGF-II resulting inactivation of the PI3K/AKT/mTOR pathway that is then unopposed.
PTEN/IGFBP-2 interactions
In view of the recognized importance of loss of PTEN for a variety of cancers there has been considerable interest in identifying biomarkers that could be used clinically to indicate loss of PTEN within tumors. An unbiased screen of human prostate cancer xenografts and human glioblastoma samples using microarray-based expression profiling found that the most significant gene was IGFBP-2 and it was confirmed in experimental models that IGFBP-2 was inversely regulated by PTEN [54]. This was consistent with all of the subsequent studies indicating that the expression of IGFBP-2 was regulated by the PI3K/AKT/mTOR pathway. An increase in tumor IGFBP-2 has also been associated with loss of PTEN in human breast cancer samples[55]. In the same year that a screen revealed IGFBP-2 as the best marker for loss of PTEN; the nature of the interaction between these two proteins was extended by the demonstration that at the cellular level IGFBP-2 can inversely regulate PTEN. With human breast cancer cells it was confirmed that IGF-II stimulated PTEN expression and that this was modulated by the binding of IGF-II to IGFBP-2, but when IGFBP-2 was not bound to IGF-II it was able to suppress PTEN via an interaction with cell surface integrin receptors (Fig. 1) [56]. Subsequent work with human prostate cancer cells indicated that the interaction of IGFBP-2 with integrin receptors could also result in PTEN inactivation via increasing its phosphorylation [57].
Fig.1. A proposed autoregulatory feedback loop of IGFBP-2/PTEN interaction. Binding of IGF-II to the IGF-IR activates the PI3K pathway. Induction of PI3K activates Akt and mTOR signaling and leads to cell proliferation and cell survival. The regulatory subunit of PI3K,p85, also binds and activates PTEN through dephosphorylation. This increased PTEN subsequently blocks IGFII production to avoid overstimulation. On the other hand, activated PI3K pathway induces IGFBP-2 expression, which when unbound to IGF-II, suppresses PTEN via an interaction with integrin receptors and/or the receptor protein tyrosine phosphatase β(RPTPβ). Thus the negative control of PTEN on PI3K signaling is counteracted. These feedback loops enable the extrinsic balance between IGF-II and IGFBP-2 to be tightly integrated to the intrinsic balance between PI3K and PTEN.
The ability of IGFBP-2 to regulate PTEN, originally observed in human cancer cell lines has subsequently been confirmed in a variety of normal cell types from different tissues. In IGFBP-2 knock-out mice a decrease in hematopoietic stem cell survival and cycling has been associated with an increase in PTEN and this appeared to be mediated by the heparin binding domain (HBD) within IGFBP-2 as the administration of a peptide analogue could restore the deficit [58]. Similarly a decrease in bone mass in the IGFBP-2 knock-out mice has been attributed to an increase in PTEN and again the use of a peptide analogue appeared to implicate the IGFBP-2HBD [59]. It was subsequently reported that the IGFBP-2HBD mediated an interaction with the RPTPβ resulting in dimerization and consequent inactivation of RPTPβ and that this reduction in phosphatase activity cooperated with IGF-I activation of the IGF-IR to enhance the phosphorylation and inactivation of PTEN [12]. Recently IGFBP-2 has been reported to also suppress PTEN in human skeletal muscle cells [60] and human visceral adipocytes [61] by interacting with integrin receptors. A similar association between IGFBP-2 and PTEN has been implicated as playing a role in murine skeletal muscle cell differentiation, although the functional regulation was not directly investigated in that study [62].
Summary
Evidence from a variety of different sources have indicated a close regulatory feedback loop between IGFBP-2 and PTEN. Work using a variety of different cell types from different tissues and different species has indicated that IGFBP-2 inversely regulates PTEN. There are reports that this is mediated via the IGFBP-2 RGD domain interacting with integrin receptors and by the IGFBP-2 HBD interacting with proteoglycans; the relative involvement of each of these domains and their functional interactions will require further work to elucidate. These studies however suggest a general mechanism that plays a role in a variety of normal physiological processes in addition to having important implications for the progression of many different cancers. The phosphatase PTEN has an important role in determining insulin sensitivity and the extent that IGFBP-2 exerts a metabolic role in regulating PTEN to determine insulin-sensitivity is yet to be examined. The extracellular balance between IGF-II and IGFBP-2 seems tightly linked with the intracellular balance between PI3K and PTEN (Fig. 1). When driving, in order to move forward there is a synchronous application of the accelerator and a removal of the brake. It appears that the cell also synchronizes activation of an essential regulatory pathway with the removal of the tightly linked inactivation pathway.
References
[1] B.C. Melnik, S.M. John, G. Schmitz, Over-stimulation of insulin/IGF-1 signaling by western diet may promote diseases of civilization: lessons learnt from Laron syndrome, Nutr. Metab. (Lond.) 8 (2011) 41. [2] J.M. Holly, C.M. Perks, Insulin-like growth factor physiology: what we have learned from human studies, Endocrinol. Metab. Clin. North. Am. 41 (2012) 249–263.
[3] J.Holly,C.Perks, The role ofinsulin-like growth factor binding proteins, Neuroendocrinology 83 (3–4) (2006) 154–160.
[4] D.O.Daza, etal.,Evolution of the insulin-like growth factor binding protein (IGFBP) family, Endocrinology 152 (6) (2011) 2278–2289.
[5] A.R. Ferreira, J.Felgueiras, M. Fardilha, Signaling pathways inanchoringjunctionsof epithelial cells: cell-to-cell and cell-to-extracellular matrix interactions, J. Recept. Signal Transduct. Res. (2014) 1–9.
[6] S.H. Kim, J. Turnbull, S. Guimond, Extracellular matrix and cell signalling: the dynamic cooperation of integrin, proteoglycan and growth factor receptor, J. Endocrinol. 209 (2) (2011) 139–151.
[7] A.Hoeflich,etal.,Overexpression ofinsulin-like growth factor-bindingprotein-2 in transgenic mice reduces postnatal body weight gain, Endocrinology 140 (12) (1999) 5488–5496.
[8] A. Hoeflich, et al., Growth inhibition in giant growth hormone transgenic mice by overexpression of insulin-like growth factor-binding protein-2, Endocrinology 142 (5) (2001) 1889–1898.
[9] G.K.Wang,etal., Aninteraction betweeninsulin-likegrowthfactor-bindingprotein 2 (IGFBP2) and integrin alpha5 is essential for IGFBP2-induced cell mobility, J. Biol. Chem. 281 (20) (2006) 14085–14091. [10] T.Arai,W.BusbyJr.,D.R.Clemmons,Bindingofinsulin-likegrowthfactor(IGF)IorII to IGF-binding protein-2 enables it to bind to heparin and extracellular matrix, Endocrinology 137 (11) (1996) 4571–4575. [11] J. Lund, et al., Heparin-binding mechanism of the IGF2/IGF-binding protein 2 complex, J. Mol. Endocrinol. 52 (3) (2014) 345–355.
[12] X. Shen, et al., Insulin-like growth factor (IGF) binding protein 2 functions coordinately with receptor protein tyrosinephosphatase βandtheIGF-Ireceptorto regulate IGF-I-stimulated signaling, Mol. Cell. Biol. 32 (20) (2012) 4116–4130.
[13] V.C.Russo, etal.,Insulin-like growth factor binding protein-2 bindingto extracellularmatrixplaysacriticalroleinneuroblastomacellproliferation,migration,andinvasion, Endocrinology 146 (10) (2005) 4445–4455.
[14] K.W. Frommer, etal., IGF-independent effects of IGFBP-2 on the human breast cancer cell line Hs578T, J. Mol. Endocrinol. 37 (1) (2006) 13–23.
[15] K. Miyako, et al., PAPA-1 Is a nuclear binding partner of IGFBP-2 and modulates its growth-promoting actions, Mol. Endocrinol. 23 (2) (2009) 169–175.
[16] X.Terrien,etal.,IntracellularcolocalizationandinteractionofIGF-bindingprotein-2 with the cyclin-dependent kinase inhibitor p21CIP1/WAF1 during growth inhibition, Biochem. J. 392 (Pt 3) (2005) 457–465.
[17] R.M. Villani, et al., Patched1 inhibits epidermal progenitor cell expansion and basal cell carcinoma formation by limiting Igfbp2 activity, Cancer Prev. Res. (Phila.) 3 (10) (2010) 1222–1234.
[18] W.J. Azar, et al., IGFBP-2 nuclear translocation is mediated by a functional NLS sequence and is essential for its pro-tumorigenic actions in cancer cells, Oncogene 33 (5) (2014) 578–588.
[19] W.J.Azar,etal.,IGFBP-2enhancesVEGFgenepromoteractivityandconsequentpromotion of angiogenesis by neuroblastoma cells, Endocrinology 152 (9) (2011) 3332–3342.
[20] S.B. Wheatcroft, M.T. Kearney, IGF-dependent and IGF-independent actions of IGFbinding protein-1 and -2: implications for metabolic homeostasis, Trends Endocrinol. Metab. 20 (4) (2009) 153–162. [21] S.B. Wheatcroft, et al., IGF-binding protein-2 protects against the development of obesity and insulin resistance, Diabetes 56 (2) (2007) 285–294.
7.3.8 Emerging roles for the pH-sensing G protein-coupled receptors in response to acidotic stress
Edward J Sanderlin, Calvin R Justus, Elizabeth A Krewson, Li V Yang
Cell Health & Cytoskel Mar 2015; 2015(7): 99—109
http://www.dovepress.com/emerging-roles-for-the-ph-sensing-g-protein-coupled-receptors-in-respo-peer-reviewed-article-CHC#
Protons (hydrogen ions) are the simplest form of ions universally produced by cellular metabolism including aerobic respiration and glycolysis. Export of protons out of cells by a number of acid transporters is essential to maintain a stable intracellular pH that is critical for normal cell function. Acid products in the tissue interstitium are removed by blood perfusion and excreted from the body through the respiratory and renal systems. However, the pH homeostasis in tissues is frequently disrupted in many pathophysiologic conditions such as in ischemic tissues and tumors where protons are overproduced and blood perfusion is compromised. Consequently, accumulation of protons causes acidosis in the affected tissue. Although acidosis has profound effects on cell function and disease progression, little is known about the molecular mechanisms by which cells sense and respond to acidotic stress. Recently a family of pH-sensing G protein-coupled receptors (GPCRs), including GPR4, GPR65 (TDAG8), and GPR68 (OGR1), has been identified and characterized. These GPCRs can be activated by extracellular acidic pH through the protonation of histidine residues of the receptors. Upon activation by acidosis the pH-sensing GPCRs can transduce several downstream G protein pathways such as the Gs, Gq/11, and G12/13 pathways to regulate cell behavior. Studies have revealed the biological roles of the pH-sensing GPCRs in the immune, cardiovascular, respiratory, renal, skeletal, endocrine, and nervous systems, as well as the involvement of these receptors in a variety of pathological conditions such as cancer, inflammation, pain, and cardiovascular disease. As GPCRs are important drug targets, small molecule modulators of the pH-sensing GPCRs are being developed and evaluated for potential therapeutic applications in disease treatment.
Cellular metabolism produces acid as a byproduct. Metabolism of each glucose molecule by glycolysis generates two pyruvate molecules. Under anaerobic conditions the metabolism of pyruvate results in the production of the glycolytic end product lactic acid, which has a pKa of 3.9. Lactic acid is deprotonated at the carboxyl group and results in one lactate ion and one proton at the physiological pH. Under aerobic conditions pyruvate is converted into acetyl-CoA and CO2 in the mitochondria. CO2in water forms a chemical equilibrium of carbonic acid and bicarbonate, an important physiological pH buffering system. The body must maintain suitable pH for proper physiological functions. Some regulatory mechanisms to control systemic pH are respiration, renal excretion, bone buffering, and metabolism.1–4 The respiratory system can buffer the blood by excreting carbonic acid as CO2 while the kidney responds to decreased circulatory pH by excreting protons and electrolytes to stabilize the physiological pH. Bone buffering helps maintain systemic pH by Ca2+ reabsorption and mineral dissolution. Collectively, it is clear that several biological systems require tight regulation to maintain pH for normal physiological functions. Cells utilize vast varieties of acid-base transporters for proper pH homeostasis within each biological context.5–8 Some such transporters are H+-ATPase, Na+/H+exchanger, Na+-dependent HCO3–/C1– exchanger, Na+-independent anion exchanger, and monocarboxylate transporters. Cells can also maintain short-term pH homeostasis of the intracellular pH by rapid H+ consuming mechanisms. Some such mechanisms utilize metabolic conversions that move acids from the cytosol into organelles. Despite these cellular mechanisms that tightly maintain proper pH homeostasis, there are many diseases whereby pH homeostasis is disrupted. These pathological conditions are characterized by either local or systemic acidosis. Systemic acidosis can occur from respiratory, renal, and metabolic diseases and septic shock.1–4,9 Additionally, local acidosis is characterized in ischemic tissues, tumors, and chronically inflamed conditions such as in asthma and arthritis caused by deregulated metabolism and hypoxia.10–15
Acidosis is a stress for the cell. The ability of the cell to sense and modulate activity for adaptation to the stressful environment is critical. There are several mechanisms whereby cells sense acidosis and modulate cellular functions to facilitate adaptation. Cells can detect extracellular pH changes by acid sensing ion channels (ASICs) and transient receptor potential (TRP) channels.16 Apart from ASIC and TRP channels, extracellular acidic pH was shown to stimulate inositol polyphosphate formation and calcium efflux.17,18 This suggested the presence of an unknown cell surface receptor that may be activated by a certain functional group, namely the imidazole of a histidine residue. The identity of the acid-activated receptor was later unmasked by Ludwig et al as a family of proton-sensing G protein-coupled receptors (GPCRs). This group identified human ovarian cancer GPCR 1 (OGR1) which upon activation will produce inositol phosphate and calcium efflux through the Gq pathway.19 These pH-sensing GPCR family members, including GPR4, GPR65 (TDAG8), and GPR68 (OGR1), will be discussed in this review (Figure 1). The proton-sensing GPCRs sense extracellular pH by protonation of several histidine residues on their extracellular domain. The activation of these proton-sensing GPCRs facilitates the downstream signaling through the Gq/11, Gs, and G12/13 pathways. Their expression varies in different cell types and play critical roles in sensing extracellular acidity and modulating cellular functions in several biological systems.
  |
Figure 1 Biological roles and G protein coupling of the pH-sensing GPCRs.
Abbreviation: GPCRs, G protein-coupled receptors.
|
Role for the pH-sensing GPCRs in the immune system and inflammation
Acidic pH is a main characteristic of the inflammatory loci.14,20,21 The acidic microenvironment in inflamed tissue is predominately due to the increased metabolic demand from infiltrating immune cells, such as the neutrophil. These immune cells increase oxygen consumption and glucose uptake for glycolysis and oxidative phosphorylation. When oxygen availability is limited, cells often undergo anaerobic glycolysis. This process generates increasing amounts of lactic acid, thereby creating a local acidic microenvironment within the inflammatory loci.22 This presents a role for the pH-sensing GPCR GPR65 (TDAG8) in inflammation and immune cell function.23 TDAG8 was originally identified by cloning as an orphan GPCR which was observed to be upregulated during thymocyte apoptosis.24,25GPR65 (TDAG8) is predominately expressed in lymphoid tissues such as the spleen, lymph nodes, thymus, and leukocytes.24–26 It was demonstrated that GPR65 inhibited pro-inflammatory cytokine secretion, which includes IL-6 and TNF-α, in mouse peritoneal macrophages upon activation by extracellular acidification. This cytokine inhibition was shown to occur through the Gs-cAMP-protein kinase A (PKA) signaling pathway.23,27 Treatment with dexamethasone, a potent glucocorticoid, increased GPR65 expression in peritoneal macrophages. Following dexamethasone treatment, there was an inhibition of TNF-α secretion in a manner dependent on increased expression of GPR65.28Another report provides an anti-inflammatory role for GPR65 in arthritis.29 Type II collagen-induced arthritis was increased in GPR65-null mice in comparison to wild-type mice. These studies taken together suggest GPR65 serves as a negative regulator in inflammation.30 However, one study provided a function for GPR65 as a positive modulator in inflammation.31 GPR65 was reported to increase eosinophil viability in the acidic microenvironment by reducing apoptosis through the cAMP pathway. As eosinophils are central in asthmatic inflammation and allergic airway disease, GPR65 may play a role in increasing asthmatic inflammation.31 On the other hand, GPR65 has shown little involvement in immune cell development. One report indicates that GPR65 knockout mice had normal immune development and function.26 Modulation of inflammation by GPR65 is complex and must be examined within each specific pathology.23
In addition to GPR65, GPR4 is also involved in the inflammatory response. Endothelial cells compose blood vessels that often penetrate acidic tissue microenvironments such as the inflammatory loci. Among the pH-sensing GPCR family, GPR4 has the highest expression in endothelial cells. Response to inflammation by vascular endothelial cells facilitates the induction of inflammatory cytokines that are involved in the recruitment of leukocytes for adherence and transmigration into inflamed tissues. Activation of GPR4 by acidosis in human umbilical vein endothelial cells, among other endothelial cell types, increased the expression of a broad range of pro-inflammatory genes including chemokines, cytokines, PTGS2, NF-κB pathway genes, and adhesion molecules.32 Moreover, human umbilical vein endothelial cells, when treated with acidic pH, increased GPR4-mediated endothelial adhesion to leukocytes.32,33 Altogether, GPR65 and GPR4 provide differential regulation of the inflammatory response through their acid sensing capabilities. GPR65 predominately demonstrates function in the inhibition of the inflammatory response whereas GPR4 activation exacerbates inflammation.
Role for the pH-sensing GPCRs in the cardiovascular system
Taken together, both GPR4 and GPR68 play roles in regulating the function of the cardiovascular system. GPR4 regulates blood vessel stability and endothelial cell function and GPR68 increases cardiomyogenic and pro-survival gene expression while also mediating aortic smooth muscle cell gene expression.
Role for the pH-sensing GPCRs in the renal system
GPR4 is expressed in the kidney cortex, isolated kidney collecting ducts, inner and outer medulla, and in cultured inner and outer medullary collecting duct cells.59 In mice deficient for GPR4, renal acid excretion and the ability to respond to metabolic acidosis was reduced.59 In response to acidosis, inner and outer medullary collecting duct cells produced cAMP, a second messenger for the Gs G-protein pathway, through the GPR4 receptor.59 In renal HEK293 epithelial cells GPR4 overexpression was found to increase the activity of PKA.60 In addition, the protein expression of H+-K+-ATPase α-subunit (HKα2) was increased following GPR4 overexpression dependent on increased PKA activity.60
GPR68 has also been reported to alter proton export of HEK293 cells by stimulating the Na+/H+exchanger and H+-ATPase.58 The activation of GPR68 by acidosis was found to stimulate this effect through a cluster of extracellular histidine residues and the Gq/PKC signaling pathway.58 In GPR68-null mice the expression of the pH-sensitive kinase Pyk2 in the kidney proximal tubules was upregulated which might compensate for GPR68 deficiency.58 Taken together, GPR4 and GPR68 may both be necessary for successful systemic pH buffering by controlling renal acid excretion.
Role for the pH-sensing GPCRs in the respiratory system
Aoki et al demonstrated that GPR68-deficient mice were resistant to asthma along with inhibiting Th2 cytokine and immunoglobulin E production.68 This study concludes that GPR68 in dendritic cells is crucial for the onset of asthmatic responses.68 Moreover, GPR65 has been implicated as having a role in respiratory disorders as it is highly expressed in eosinophils, hallmark cells for asthmatic inflammation.69 Kottyan et al showed that GPR65 increased the viability of eosinophils within an acidic environment through the cAMP pathway in murine asthma models.31 In summary, GPR68 and GPR65 play important roles in the respiratory system and asthma. GPR68 regulates gene expression in airway epithelial, smooth muscle and immune cells while GPR65 enhances the survival of airway eosinophils in response to acidosis.
Role for the pH-sensing GPCRs in the skeletal system
GPR65 has also been reported as a pH sensor in bone. GPR65 is expressed in osteoclasts and its activity may inhibit Ca2+ resorption.81 Disruption of GPR65 gene exacerbated osteoclastic bone resorption in ovariectomized mice.81 The relative bone density of GPR65-null mice was less than control mice.81 In cultured osteoclast cells from mice deficient for GPR65, the normal inhibition of osteoclast formation in response to acidosis was abrogated.81 Taken together, this data suggest that the activation of GPR65 may enhance bone density, thus the GPR65 signaling may be important for disease processes such as osteoporosis and other bone density disorders.
Role for the pH-sensing GPCRs in the endocrine system
GPR68 has also been found to modify insulin production and secretion. In GPR68 knockout mice insulin secretion in response to glucose administration was reduced when compared to wild-type mice although blood glucose was not significantly altered.84 GPR68 deficiency in this respect may reduce insulin secretion but at the same time increase insulin sensitivity. In addition, stimulation of GPR68 in islet cells by acidosis increased the secretion of insulin through the Gq/11 G-protein signaling.84
Role for the pH-sensing GPCRs in the nervous system and nociception
Acidosis causes pain by exciting nociceptors located in sensory neurons. Several types of ion channels and receptors, such as ASICs, TRPV1, and proton-sensing GPCRs, have been identified as nociceptors in response to acidosis. ASICs and TRPV act as proton-gated membrane-bound channels, which are activated by acidic pH and mediate multimodal sensory perception including nociception.86–88 GPR65 activation sensitized the response of TRPV1 to capsaicin. The results suggest high accumulation of protons post inflammation may not only stimulate nociceptive ion channels such as TRPV1 to trigger pain, but also activate proton-sensing GPCRs to regulate heightened sensitivity to pain.89 Furthermore, Hang et al demonstrated GPR65 activation elicited cancer-related bone pain through the PKA and phosphorylated CREB (pCREB) signaling pathway in the rat model.90 Collectively, GPR4, GPR65, and GPR68 are all expressed in the dorsal root ganglia; GPR65 is a functional receptor involved in nociception and the nervous system by sensitizing inflammatory pain and the evocation of cancer-related bone pain.
Role for the pH-sensing GPCRs in tumor biology
The tumor microenvironment is highly heterogeneous. Hypoxia, acidosis, inflammation, defective vasculature, poor blood perfusion, and deregulated cancer cell metabolism are hallmarks of the tumor microenvironment.91–93 The acidity in the tumor microenvironment is owing to the altered cancer cell metabolism termed the “Warburg Effect”. This metabolic phenotype allows the cancer cells to preferentially utilize glycolysis over oxidative phosphorylation as a primary means of energy production.94 This process occurs even in normoxic tissue environments where sufficient oxygen is available. Due to this phenomenon, the Warburg Effect is often termed “aerobic glycolysis”. This unique metabolic phenotype produces vast quantities of lactic acid, which serve as a proton source for acidification. Upon disassociation of lactic acid to one lactate molecule and one proton, the monocarboxylate transporter and proton transporters export lactate and protons into the extracellular tumor microenvironment.95 The proton-sensing GPCRs are activated by acidic pH and facilitate tumor cell modulation in response to extracellular acidification. GPR4, GPR65, and GPR68 play roles in tumor cell apoptosis, proliferation, metastasis, angiogenesis, and immune cell function.19,27,32,33,44,45,96,97
GPR4 has had conflicting reports in terms of tumor suppressing or promoting activities. One study demonstrated that GPR4 could act as a tumor metastasis suppressor, when overexpressed and activated by acidic pH in B16F10 melanoma cells, by impeding migration and invasion of tumor cells.45 GPR4 overexpression also significantly inhibited the lung metastasis of B16F10 melanoma cells in mice.45 Another study utilizing the B16F10 melanoma cell line which overexpressed GPR4 showed an increase in mitochondrial surface area and a significant reduction in membrane protrusions by quantification of 3D morphology.98 These data point to a decrease in cancer cell migration when GPR4 is overexpressed and provides another example of GPR4 as exhibiting tumor metastasis suppressor function.98 However, in another report GPR4 malignantly transformed immortalized NIH3T3 fibroblasts.99 This presents GPR4 with tumor-promoting capabilities. The conflicting reports seem to indicate the functional ability of GPR4 to act as a tumor promoter and a tumor suppressor depending on the context of certain cell types and biological systems.
Reports with GPR65 involvement in cancer cells provide evidence in favor for cancer cell survival; however, opposing evidences suggest GPR65 functions as a tumor suppressor. In the same report suggesting GPR4 is oncogenic due to GPR4 transforming immortalized NIH3T3 fibroblasts, GPR65 overexpression was able to transform the mouse NMuMG mammary epithelial cell line.99 Another group demonstrated in NCI-H460 human non-small cell lung cancer cells that GPR65 promotes cancer cell survival in an acidic microenvironment.100 Conversely, a recent study showed that GPR65 inhibited c-Myc oncogene expression in human lymphoma cells.101 Furthermore, GPR65 messenger ribonucleic acid expression was reduced by more than 50% in a variety of human lymphoma samples when compared to normal lymphoid tissues, therefore implying GPR65 has a tumor suppressor function in lymphoma.101 GPR65 has also been shown to increase glucocorticoid-induced apoptosis in murine lymphoma cells.102 These reports highlight cell type dependency and biological context for GPR65 activity as a tumor suppressor or promoter.
GPR68 also has roles in tumor biology as a potential tumor suppressor or a tumor promoter. Reports have shown that GPR68 can inhibit cancer metastasis, reduce cancer cell proliferation, and inhibit migration. One study showed that when GPR68 was overexpressed in prostate cancer cells, metastasis to the lungs, diaphragm, and spleen was inhibited.97 When GPR68 was overexpressed in ovarian cancer (HEY) cells, cellular proliferation and migration were significantly reduced, and cell adhesion to the extracellular matrix was increased.96 Another study reported GPR68 expression was critical for the tumor cell induced immunosuppression in myeloid-derived cells. This study proposed that GPR68 promotes M2 macrophage development and inhibits T-cell infiltration, and thereby facilitates tumor development.103 In summary, the biological roles of GPR4, GPR65, and GPR68 in tumor biology are complex and both tumor-suppressing and tumor-promoting functions have been reported, primarily dependent on cell type and biological milieu.
Development of small molecule modulators of the pH-sensing GPCRs
GPCRs are critical receptors for the regulation of many physiological operations. It is of little surprise that GPCRs have become a central focus of pharmaceutical development. In fact, 30%–50% of therapeutics focuses on modulating GPCR activity.104,105 In view of the diverse roles of the pH-sensing GPCRs in the context of multiple biological systems, targeting these receptors with small molecules and other modulators could serve as potential therapeutics for diseases associated with deregulated pH homeostasis. There have been recent developments in the characterization of GPR4 antagonists along with agonists for GPR65 and GPR68.29,32,50,106 The GPR4 antagonist demonstrated effectiveness in vitro to reduce the GPR4-mediated inflammatory response to acidosis in endothelial cells.32 The GPR65 agonist, BTB09089, showed in vitro effects in GPR65 activation of immune cells to inhibit inflammatory response; however, the activity of BTB09089 was not strong enough for the use in animal models in vivo.29 The GPR68 agonist, lsx, exhibited pro-neurogenic activity and induced hippocampal neurogenesis in young mice.107 It was also demonstrated that lsx suppressed the proliferation of malignant astrocytes.108 To date, however, much advancement needs to be done in development of efficacious agonists and antagonists of the pH-sensing GPCRs coupled with a capacity to target specific tissue dysfunction in the midst of systemic drug administration to optimize therapeutic effects and minimize potential adverse effects.
Concluding remarks
Cells encounter acidotic stress in many pathophysiologic conditions such as inflammation, cancer, and ischemia. Intricate molecular mechanisms, including a large array of acid/base transporters and acid sensors, have evolved for cells to sense and respond to acidotic stress. Emerging evidence has demonstrated that a family of the pH-sensing GPCRs can be activated by extracellular acidotic stress and regulate the function of multiple physiological systems (Table 1). The pH-sensing GPCRs also play important roles in various pathological disorders. Agonists, antagonists and other modulators of the pH-sensing GPCRs are being actively developed and evaluated as potential novel treatment for acidosis-related diseases.
 |
Table 1 The main biological functions of the pH-sensing GPCRs
|
7.3.9 Protein amino-terminal modifications and proteomic approaches for N-terminal profiling
Lai ZW1, Petrera A2, Schilling O3.
Curr Opin Chem Biol. 2015 Feb; 24:71-9
http://dx.doi.org:/10.1016/j.cbpa.2014.10.026
Amino-/N-terminal processing is a crucial post-translational modification affecting almost all proteins. In addition to altering the chemical properties of the N-terminus, these modifications affect protein activation, conversion, and degradation, which subsequently lead to diversified biological functions. The study of N-terminal modifications is of increasing interest; especially since modifications such as proteolytic truncation or pyroglutamate formation have been linked to disease processes. During the past decade, mass spectrometry has played an important role in facilitating the investigation of N-terminal modifications. Continuous progress is being made in the development and application of robust methods for the dedicated analysis of native and modified protein N-termini in a proteome-wide manner. Here we highlight recent progress in our understanding of protein N-terminal biology as well as outlining present enrichment strategies for mass spectrometry-based studies of protein N-termini.
Highlights
• N-terminal acetylation, pyroglutamate formation, N-degrons and proteolysis are reviewed.• N-terminomics provide comprehensive profiling of modification at protein N-termini in a proteome-wide manner.• We outline a number of established methodologies for the enrichment of protein N-termini through positive and negative selection strategies.• Peptidomics-based approach is beneficial for the study of post-translational processing of protein N-termini.
Introduction The life of every protein begins at the amino-terminus, also known as the N-terminus. During the initiation of mRNA translation into proteins or polypeptides, newly synthesized amino
acid chains form the N-termini and are the first to exit the ribosomes into the cytosol or the endoplasmic reticulum. The N-termini of these proteins or protein precursors often contain a signaling peptide
sequence proximal to the N-terminus, which may function as a ‘zip-code’ to direct the delivery of a protein to a cellular compartment as well as orchestrating protein maturation via different post-translational
modifications (PTMs) such as acetylation or proteolysis. These modifications often determine protein activity or stability; thus being crucial for the tight regulation of cellular homeostasis (Figure 1).
Mass spectrometry (MS) based analyses of protein N-termini, termed N-terminomics, is a promising tool to tackle these problems. In the past decade, we have witnessed significant progress in the
area of mass spectrometric investigation of post-translational modifications such as phosphorylation or glycosylation [1]. Similarly, MS-based studies of protein N-termini are gaining momentum.
Recent progress in positional proteomics using advanced MS platforms combined with a number of effective enrichment strategies has reinforced significant interest in N-terminomics.
Here we outline some of the most current highlights on proteomics-based studies on N-terminal modifications, including N-acetylation, pyroglutamate formation, proteolysis, and N-terminal degrons
(Figure 2). We also present a number of recent N-terminomic methodologies for the study of protein N-termini.
Acetylation of protein N-termini represents an abundant post-translational modification in eukaryotes, affecting nearly all cytoplasmic proteins. This modification is catalyzed by the N-terminal
acetyltransferase (Nat) enzyme complex, which transfers an acetyl group to the N-termini of newly synthesized proteins during translation (Figure 2). Initial findings highlighted that N-terminal
acetylation protects proteins from degradation [2–4]. Recent studies however yield a more diverse picture. N-terminal acetylation may also play a role in protein delivery and localization [5–7],
protein complex formation and generation of specific degradation signals in cellular proteins via the N-degron pathway [9,10]. Loss of N-terminal acetylation through inactive acetyltransferases leads to
smaller aggregates of prion proteins [11]. In addition, N-terminal acetyltransferases have been described to also function as N-terminal proprionyltransferases [12]. Genetic mutation in the Naa10 gene,
encoding the NatA catalytic subunit, is known to cause N-terminal acetyltransferase deficient phenotypes. This genetic mutation has also been linked to X-linked disorder of infancy, causing lethality in
male infants[13]. The multifunctional roles of N-acetyltransferases as well as the importance of N-terminal acetylation have been previously reviewed in [14]. Few MS-based studies have emerged that
specifically investigate acetylated N-termini in a proteome wide manner. The structural and functional integrity of actomyosin fibers depends on active NatB. A novel methodology determines the
extent of N-terminal acetylation in vivo through chemical, stable-isotope coded acetylation of proteins before their mass spectrometric analysis [16].
Pyroglutamate conversion of N-terminal glutamate and glutamine Many proteins and biologically active peptides exhibit an N-terminal pyroglutamic acid (pGlu) residue. This post
translational modification originates from the conversion of N-terminal glutamate and glutamine into pyroglutamic acid by glutaminyl cyclase or isoglutaminyl cyclase (Figure 2). N-terminal
pGlu influences structural stability as well as biological activity of peptides and proteins [17]. pGlu protects proteins from degradation by aminopeptidases [18] as well as regulating the
biological activity of peptide hormones, neuropeptides or chemokines [19]. Examples include thyrotropin releasing hormone (TRH), gonadotropin-releasing hormone, and the human
chemokines MCP-1 and 2. The presence of N-terminal pGlu in some amyloidogenic peptides, such as amyloid-b peptides, increases their hydrophobicity, resulting in an accelerated
aggregation [20]. Modulating the extent of N-terminal pGlu formation through pharmaceutical inhibition of glutaminyl cyclase is considered a promising strategy, for example, to
increase the degradation of inflammatory and neurotoxic peptides. Inhibition of glutaminyl cyclase has alleviated liver inflammation by destabilizing the chemokine MCP1 (CCL2) [21].
Proteolytic degradation of this promigratory chemokine by inhibiting glutaminyl cyclase was also proposed as an attractive novel strategy in preventing thyroid cancer metastasis [22].
Given the functional relevance of N-terminal pGlu in pathological conditions, an MS-based approach to profile this modification may be particularly useful.
N-terminal degrons N-terminal residues have a strong impact on protein stability and half-life. Firstly described in 1986 by Varshavsky and colleagues [25], the N-end rule pathway
has been identified in a broad range of species, from mammals to bacteria, and from yeast to plants [26]. This control of protein degradation in eukaryotes and bacteria is governed
by the formation and recognition of specific sequences at protein N-termini, called N-degrons. The main determinant of an N-degron is an N-terminal destabilizing residue. In eukaryotes,
two N-end rule pathways are being distinguished: the Ac/N-end rule pathway targets proteins through their N-terminally acetylated residues while the Arg/N-rule pathway targets
unacetylated N-terminal residues and involves N-terminal arginylation [26]. Proteolytic processing leading to new protein N-termini is increasingly recognized to play an important
role in the formation of N-degrons. In eukaryotes, N-degron mediated protein degradation occurs through the ubiquitin–proteasome system. N degrons are recognized by E3
ubiquitin ligases called N-recognins, which induce protein ubiquitylation. Recent studies showed that the N-end rule pathway can be regulated by various mechanisms [26].
Hemin, the ferric (Fe3+) counterpart of heme, and short peptides can bind to components of the N-end rule pathway and impede their functionality [26]. Although the N-end rule
pathway has been molecularly dissected in great detail, numbers of identified physiological substrates undergoing N-end rule degradation have remained limited. A recent study
has expanded the range of substrates targeted by the Arg/N-end rule. Kim and colleagues have shown that N terminal Met followed by a hydrophobic residue functions as an N-degron
[27]. N-terminal Met followed by a small residue is typically removed by aminopeptidases in a cotranslational manner (Figure 2). However, approximately 15% of the genes in mammals
or yeast encode for an N-terminal Met followed by a larger hydrophobic residue. This specific N-degron is targeted by the Ac/N-end rule pathway when the N-terminal Met is acetylated.
The Arg/N-end rule acts instead on the non-acetylated N-terminal Met. As previously mentioned, novel N-degrons can be generated by preceding proteolysis. Piatkov and colleagues
investigated this concept for proteolytic cleavage products that occur during apoptosis [28]. They find that numerous proapoptotic fragments are short lived substrates of Arg/N-end
rule pathway, attributing to this pathway an anti-apoptotic role. Notably, the corresponding N-degron sequences are evolutionary conserved.
Figure 1 Protein N-termini are susceptible to various post-translational modification.
For a more comprehensive overview of all possible N terminal modification, see [60].
Figure 2 Examples of N-terminal mofications: acetylation, pyroglutamate conversion, proteolysis and N-degron processing via deamidation and amino acid conjugation.
Proteolytic processing of N-termini Proteolysis has long been regarded a degradation process. It is now increasingly recognized as an important posttranslational modification
with an array of proteases mediating cellular signaling via the precise processing of bioactive proteins and peptides. The study of cleavage events using N-terminomics is particularly
useful for the identification of proteolytic substrates. Proteolytic cleavage of proteins and polypeptides results in the generation of cleavage fragments with new N-termini and
C-termini. Numerous recent proteomic studies highlighted differential regulation of proteases in different disease settings. MALDI-TOF in combination with enzymatic assays
established reduced levels of dipeptidyl-peptidase (DPP)4 in the serum of patients suffering from metastatic prostate cancer [31]. Another proteomic based study, using isotope
coded affinity tag (ICAT) labeling showed bacterial leucine aminopeptidase from Plasmodium chabaudi to be significantly upregulated in periodontal disease [32]. Mass spectrometry
was also used for the functional characterization of proteases.
7.3.10 Protein homeostasis networks in physiology and disease
Although most text books of biochemistry describe the process of protein folding to a three dimensional native state as an intrinsic property of the primary sequence, it is becoming increasingly clear that this process can go wrong in an almost infinite number of ways. In fact, many different diseases are caused by the misfolding and aggregation of certain proteins without genetic mutations in the primary sequence. An integrative view of the mechanisms that maintain protein folding homeostasis is emerging, which could be thought as a balanced and dynamic network of interconnected processes tightly regulated by a series of quality control mechanisms. This protein homeostasis network involves families of folding catalysts, co-factors under specific environmental and metabolic conditions. Maintaining protein homeostasis is particularly challenging in specialized secretory cells where the high demand for protein synthesis generates a constant source of stress that could lead to proteotoxicity.
Protein folding is assisted and monitored by diverse interconnected processes that follow a sequential pattern over time. The calnexin/calreticulin cycle ensures the proper folding of glycosylated proteins through the secretory pathway, which establishes the final pattern of disulfide bond formation through interactions with the disulfide isomerase ERp57. Coupled to this cycle is the ER-associated degradation (ERAD) pathway, which translocates terminally misfolded proteins to the cytosol for degradation by proteasomes. In addition, macroautophagy is becoming a relevant mechanism for the clearance of damaged proteins and abnormal protein aggregates through lysosomal hydrolysis, a process also referred to as ERAD-II. The folding status at the ER is constantly monitored by the Unfolded Protein Response (UPR), a specialized signaling pathway initiated by the activation of three types of stress sensors. The process underlying the surveillance of protein folding stress by the UPR is not fully understood, but it may require coupling to key folding mediators such as BiP or the direct recognition of the misfolded peptides by stress sensors. The UPR regulates genes and processs related to almost every folding step in the secretory pathway to reduce the load of misfolded proteins, including protein translation into the ER, translocation, folding, quality control, ERAD, the redox status, and many other related functions. Protein folding stress is observed in many disease conditions such as cancer, diabetes, and neurodegeneration. For example, abnormal protein aggregation and the accumulation of protein inclusions is associated with Parkinson’s and Alzheimer’s Disease, and amyotrophic lateral sclerosis. In those diseases and many others, neuronal dysfunction and disease progression correlates with the presence of a strong ER stress response; however, the direct in vivo role of the UPR in the disease process has been experimentally defined in only a few cases. Therapeutic strategies are currently being developed to increase protein folding and clearance of misfolded proteins, with the goal of alleviating ER stress.
In this issue of Current Opinion in Cell Biology we present a series of focused reviews from recognized experts in the field, that provide an overview of mechanisms underlying protein folding and quality control, and how balance of protein homeostasis is maintained in physiology and deregulated in diseases. Daniela Roth and William Balch integrate the concept of protein homeostasis networks into an interesting model termed FoldFx, showing how the interconnection between different pathways in the context of the cellular proteome determines the energetic barrier required to generate a functional folded peptide. The authors have previously proposed the term Proteostasis to refer to the set of interacting activities that maintain the health of the proteome and the organism (protein homeostasis). The ER is a central subcellular compartment for protein synthesis and quality control in the secretory pathway. Yukio Kimata and Kenji Kohno give an overview of the signaling pathways that control adaptation to ER stress and maintenance of protein folding homeostasis. The authors summarize the models proposed so far for the activation of UPR stress sensors, and discuss how this directly or indirectly relates to the accumulation of unfolded proteins in the ER lumen. Chronic or irreversible ER stress triggers cell death by apoptosis. Gordon Shore, Feroz Papa, and Scott Oakes summarize the complex signaling pathways initiating apoptosis by ER stress, where cross talk between the ER and the mitochondria play a central role. The authors focus on addressing the role of the BCL-2 protein family on the activation of intrinsic mitochondrial apoptosis pathways, highlighting different cytosolic and transcriptional events that determine the transition between adaptive responses to apoptosis programmed by the UPR to eliminate irreversibly injured cells.
Although diverse families of chaperones, foldases and co-factors are expressed at the ER, only a few protein folding networks have been well defined. However, molecular explanations for specific substrate recognition and quality control mechanisms are poorly defined. Here we present a series of reviews covering different aspects of protein maturation. Amy Lee summarizes what is known about the biology of the key ER folding chaperone BiP/Grp78, and its emerging role in diverse pathological conditions including cancer. In two reviews, David B. Williams and Linda M. Hendershot describe the best characterized mechanism of protein quality control at the ER, the calnexin cycle. In addition, they give an overview of the function of a family of ER foldases, the protein disulfide isomerases (PDIs), in folding, quality control and degradation of abnormally folded proteins. PDIs are also becoming key factors in establishing the redox tone of the ER. Riccardo Bernasconi and Maurizio Molinari overview the ERAD process and how this pathway affects the efficiency of the protein folding process at the ER and its relation to pathological conditions.
Lysosomal-mediated degradation is becoming a fundamental process for the control of the haft-life of proteins and the degradation of misfolded, aggregate prone proteins. Ana Maria Cuervo reviews the relevance of Chaperone-mediated autophagy in the selective degradation of soluble cytosolic proteins in lysosomes, and also points out a key role for Chaperone-mediated autophagy in the cellular defense against proteotoxicity. David Rubinsztein and Guido Kroemer present two reviews highlighting the emerging relevance of macroautophagy in maintaining the homeostasis of the nervous system. They also discuss the actual impact of macroautophagy in the clearance of protein aggregates related to neurodegenerative diseases, including Parkinson’s disease, amyotrophic lateral sclerosis, Huntington’s disease among others. In addition, recent evidence suggesting an actual impairment of macroautophagy as a causative factor in aging-related disorders is also discussed.
Alterations in protein homeostasis underlie the etiology of many diseases affecting the nervous system, in addition to cancer and diabetes. Fumiko Urano summarizes the impact of ER stress in β cell dysfunction and death during the progression of type 1 and type 2 diabetes, as well as in genetic forms of diabetes such as Wolfram syndrome. The occurrence of basal ER stress is observed in specialized secretory cells and organs, including plasma B cells. Roberto Sitia covers several aspects of how proteotoxic stresses physiologically contribute to regulate the biogenesis, function and lifespan of B cells, and speculates about the possible impact of ER stress in the treatment of multiple myeloma. Claudio Soto describes the specific role of calcineurin, a key phosphatase in the brain, in the occurrence of synaptic dysfunction and neuronal death in prion-related disorders. We also present provide a review summarizing the emerging role of ER stress and the UPR in most neurodegenerative diseases related to protein misfolding. We also discuss the particular mechanisms currently proposed to be involved in the generation of protein folding stress at the ER in these pathologies, and speculate about possible therapeutic interventions to treat neurodegenerative diseases.
Strategies to increase the efficiency of quality control mechanisms, to reduce protein aggregation and to enhance folding are suggested to be beneficial in the setting of diseases associated with the disruption of protein homeostasis. Finally, Jeffery Kelly overviews recent chemical and biological therapeutic strategies to restore protein homeostasis, which could be achieved by enhancing the biological capacity of the proteostasis network or through small molecule to stabilize misfolding-prone proteins. In summary, this volume ofCurrent Opinion in Cell Biology compiles the most recent advances in understanding the impact of protein folding stress in physiology and disease, and integrates a variety of complex mechanisms that evolved to maintain protein homeostasis in a dynamic way in the context of a changing environment. The biomedical applications of developing strategies to cope with protein folding stress have profound implications for the treatment of the most prevalent diseases in the human population.
7.3.11 Proteome sequencing goes deep
Advances in mass spectrometry (MS) have transformed the scope and impact of protein characterization efforts. Identifying hundreds of proteins from rather simple biological matrices, such as yeast, was a daunting task just a few decades ago. Now, expression of more than half of the estimated ∼20,000 human protein coding genes can be confirmed in record time and from minute sample quantities. Access to proteomic information at such unprecedented depths has been fueled by strides in every stage of the shotgun proteomics workflow-from sample processing to data analysis-and promises to revolutionize our understanding of the causes and consequences of proteome variation.
Highlights
Mammalian proteomes are complex [3]. The human proteome contains ~20,300 protein-coding genes; however, non-synonymous single nucleotide polymorphisms (nsSNPs), alternative
splicing events, and post-translational modifications (PTMs) all occur and exponentially increase the number of distinct proteoforms [4–6]. Detection of 5000 proteins in a proteomic
experiment was a considerable achievement just a few years ago [7–9]. More recently, two groups identified over 10,000 protein groups in a single experiment. Through extensive protein
and peptide fractionation (72 fractions) and digestion with multiple enzymes, Nagaraj et al. identified 10,255 protein groups from HeLa cells over 288 hours of instrument analysis [10].
A comparison with paired RNA-Seq data revealed nearly complete overlap between the detected proteins and the expressed transcripts. In that same year, a similar strategy enabled
the identification of 10,006 proteins from the U2OS cell line [11]. Kim and co-workers analyzed 30 human tissues and primary cells over 2000 LC–MS/MS experiments, resulting
in the detection of 293,000 peptides with unique amino acid sequences and evidence for 17,294 gene products [16]. Wilhelm et al. amassed a total of 16,857 LC–MS/MS experiments
from human cell lines, tissues, and body fluids. These experiments produced 946,000 unique peptides, which map to 18,097 protein coding genes [17]. Together, these two studies
provide direct evidence for protein translation of over 90% of human genes (Figure 2). New developments in mass spectrometer technology have increased the rate at which proteomes
can be analyzed. We describe developments in sample preparation, MS instrumentation, and bioinformatics that have been key to obtaining comprehensive proteomic coverage.
Further, we consider how access to such proteomic detail will impact genomic research.
Read Full Post »


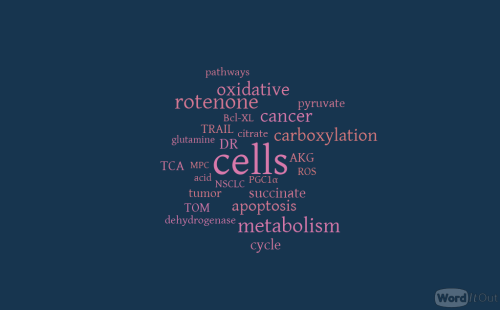


Warburg Effect revisited
It is very interesting the series of commentaries following Warburg Effect revisited. However, it comes as no surprise that almost all of them have small or greater emphasis in the molecular biology (changes in gene expression) events of the metabolic regulation involved.
I would like to comment on some aspects: 1- Warburg did the initial experiments following Pasteur line of reasoning that aimed at carbon flow through the cell (yeast in his case) instead of describing anything inside the cell. It is worth to recall that for the sake of his study, Pasteur considered anything inside the cell under the domain of divine forces. He, at least in defence of his work, entirely made outside the cell, considered that inside the cells was beyond human capability of understanding – He has followed vitalism as his line of reasoning in defence of his work – Interestingly, the same scientist that has ruled out spontaneous generation when Pasteurization was started. Therefore, Pasteur measured everything outside the cell (mainly sugar, ethanol – the equivalent of our lactic acid end product of anaerobic metabolism) and found that as soon as yeasts were placed in the presence of oxygen, sugar was consumed at low speed in comparison with the speed measured in anaerobiosis and ethanol was also produced at reduced speed. This is an indication of a fast biological regulatory mechanism that obviously, do not require changes in gene expression. As previously said, Warburg work translated for republishing in the Journal Biological Chemistry mentioned “grana” for mitochondria calling attention on an “inside-the-cell” component. It seems that, there is not a unique, single site of metabolism, where the Pasteur Effect – Warburg Effect seems to be elicited by the shift from anaerobiosis to aerobiosis or vice versa.
In order to find a core for the mechanism the best approach seems to take into account one of the most important contributions of one of the greatest north-American biochemists, Briton Chance. He has made it with his polarographic method of following continuously the oxygen consumption of the cell´s mitochondria.
Mitochondria burn organic carbon molecules under a very stringent control mechanism of oxidative-phosphorylation ATP production. Measured in the form of changes in the speed of oxygen consumption over time as Respiratory Control Ratio (RCR). When no ATP is required by the cell, oxygen consumption goes at low speed (basal or state II or IV). When ADP is offered to the mitochondria as an indication that ATP synthesis is necessary, oxygen consumption is activated in state III respiration. Low respiration means low burning activity of organic (carbon) molecules what in this case, means indirectly low glucose consumption. While high respiration is the converse – greater glucose consumption.
Aerobic metabolism of glucose to carbonic acid and water provides a change in free energy enough for 38 molecules of ATP (the real production is +/- 32 ATP in aerobic condition) while glucose to lactic acid metabolism in anaerobiosis leads to 2 ATP production after discounting the other 2 required at initial stages of glucose metabolism.
The low ATP yield in anaerobiosis explains the fast glucose metabolism in anaerobiosis while the control by RCR in mitochondria explains the reduction in glucose metabolism under aerobiosis as long as the ATP requirements of the cell remains the same – This is what it is assumed to happen in quiescent cells. Not necessarily in fast growing cells as cancer cells are. However, this will not be discussed here. In my first experiments in the early seventies, with M. Rouxii a dimorphic mold-yeast biological system the environmental change (aerobic – anaerobic) led to morphogenetic change presented as morphogenetic expression of the Pasteur Effect. In this case, the enzyme that replaces mitochondria in ATP production (Pyruvate Kinase) converting phosphoenolpyruvate into pyruvate together with ADP into ATP, shows changes that can be interpreted as change in gene expression together with new self-assembly of enzyme subunits. (Dimer AA – yeast in anaerobic growth or sporangiospores- converted into dimer AB in aerobic mold). In Leloir opinions at that time, PK I (AA) was only highly glycosylated, while PK II (AB) was less glycosylated without changes in gene expression.
In case you read comments posted, you will see that the reference to aerobic glycolysis, continues to be made together with, new deranged forms of reasoning as is indicated by referring to: Mitochondrial role in ion homeostasis…
Homeostasis is a regulation of something, ions, molecules, pH etc. that is kept outside the cell, therefore any role for mitochondria on it is only made indirectly, by its ATP production.
However, mitochondria has a role together with other cell components in the regulation of for instance, intracellular Ca levels (Something that is not a homeostatic regulation). This is a very important point for the following reason: Homeostasis is maintained as a composite result of several differentiated cellular, tissue and organ functions. Differentiated function is something clearly missing in cancer cells. The best form to refer to the mitochondrial function regarding ions is to indicate a mitochondrial role in ion fluxes.
In short, to indicate how an environmental event or better saying condition could favour genetic changes instead of being caused by genetic changes is to follow the same line of reasoning that is followed in understanding the role of cardioplegia. To stop heart beating is adequate for heart surgery it is also adequate for heart cells by sparing the ATP use during surgery and therefore, offering better recovery condition to the heart afterwards.
In the case, here considered, even assuming that the genome is not made more unstable during hypoxic condition it is quite possible to understand that sharing ATP with both differentiated cell function and replication may led quality control of DNA in short supply of much needed ATP and this led to maintenance of mutations as well as less organized genome.
Thank you. I enjoy reading your comments. They are very instructive. I don’t really think that I comprehend the use of the term “epigenetics” and longer. In fact, it was never clear to me when I first heard it used some years ago.
The term may have been closely wedded to the classic hypothesis of a unidirectional DNA–> RNA–> protein model that really has lost explanatory validity for the regulated cell in its environment. The chromatin has an influence, and protein-protein interactions are everywhere. As you point out, these are adjusting to a fast changing substrate milieu, and the genome is not involved. But in addition, the proteins may well have a role in suppression or activation of signaling pathways, and thereby, may well have an effect on gene expression. I don’t have any idea about how it would work, but mutations would appear to follow the metabolic condition of the cell over time. It would appear to be – genomic modification.
In aerobic glucose metabolism, the oxidation of citric acid requires ADP and Mg²+, which will increase the speed of the reaction: Iso-citric acid + NADP (NAD) — isocitrate dehydrogenase (IDH) = alpha-ketoglutaric acid. In the Krebs cycle (the citric cycle), IDH1 and IDH2 are NADP+-dependent enzymes that normally catalyze the inter-conversion of D-isocitrate and alpha-ketoglutarate (α-KG). The IDH1 and IDH2 genes are mutated in > 75% of different malignant diseases. Two distinct alterations are caused by tumor-derived mutations in IDH1 or IDH2: the loss of normal catalytic activity in the production of α-ketoglutarate (α-KG) and the gain of catalytic activity to produce 2-hydroxyglutarate (2-HG), [22].
This product is a competitive inhibitor of multiple α-KG-dependent dioxygenases, including demethylases, prolyl-4-hydroxylase and the TET enzymes family (Ten-Eleven Translocation-2), resulting in genome-wide alternations in histones and DNA methylation. [23]
IDH1 and IDH2 mutations have been observed in myeloid malignancies, including de novo and secondary AML (15%–30%), and in pre-leukemic clone malignancies, including myelodysplastic syndrome and myeloproliferative neoplasm (85% of the chronic phase and 20% of transformed cases in acute leukemia), [24].
Normally, cells in the body communicate via intra-cytoplasmic channels and maintain the energetic potential across cell membranes, which is 1-2.5 µmol of ATP in the form of ATP-ADP/ATP-ADP-IMP. These normal energetic values occur during normal cell division. If the intra-cellular and extra-cellular levels of Mg2+ are high, the extra-cellular charges of the cells will not be uniformly distributed.
This change in distribution induces a high net positive charge for the cell and induces a loss of contact inhibition via the electromagnetic induction of oscillation [28, 29, 30]. Thereafter, malignant cells become invasive and metastasize.
,,,,,,,,,,,,,,,,,,,,,,,,,,,,,,,,,,,,,,,,,,,,,,,,,,,,,,,,,,,,,,,,,,,,,,,,,,,,,,,,,,,,,,,,,,,,,,,,,,,,,,,,,,,,,,,,,,,,,,,,
-22. Hartmann C, Meyer J, Balss J. Capper D, et al. Type and frequency of IDH1 and IDH2 mutations are related to astrocytic and oligodendroglial differentiation and age: a study of 1,010 diffuse gliomas. Acta Neuropathol 2009; 118: 464-474.
23. Raymakers R.A, Langemeijer S.M., Kuiper R.P, Berends M, et al. Acquired mutations in TET2 are common in myelodysplastic syndromes. Nat. Genet 2009; 41; 838–849.
24 Wagner K, Damm F, Gohring G., Gorlich K et al. Impact of IDH1 R132 mutations and an IDH1 single nucleotide polymorphism in cytogenetically normal acute myeloid leukemia: SNP rs11554137 is an adverse prognostic factor. J. Clin. Oncol.2010; 28: 2356–2364.
Plant Molecular Biology 1989; 1: 271–303.
29. Chien MM, Zahradka CE, Newel MC, Fred JW. Fas induced in B cells apoptosis require an increase in free cytosolic magnesium as in early event. J Biol Chem.1999; 274: 7059-7066.
30. Milionis H J, Bourantas C L, Siamopoulos C K, Elisaf MS. Acid bases and electrolytes abnormalities in Acute Leukemia. Am J Hematol 1999; (62): 201-207.
31. Thomas N Seyfried; Laura M Shelton.Cancer as a Metabolic Disease. Nutr Metab 2010; 7: 7
– Aurelian Udristioiu, M.D,
– Lab Director, EuSpLM,
– City Targu Jiu, Romania
AACC, National Academy of Biochemical Chemistry (NACB) Member, Washington D.C, USA.