Feeds:
Posts
Comments

Archive for the ‘Population Health Management, Nutrition and Phytochemistry’ Category

Remote Care Management of CHF Patients by Home Digital Technology and Continuous Access to NP – A Partnership of an Insurer with a Technology Company


Reporter: Aviva Lev-Ari, PhD, RN


CIGNA-HEALTHSPRING AND INTEL-GE CARE INNOVATIONS™ EXPAND REMOTE CARE MANAGEMENT PROGRAM TO REDUCE CONGESTIVE HEART FAILURE-RELATED COMPLICATIONS IN TENNESSEE

02 October 2014
  • Completion of successful pilot prompts statewide program expansion in TN
  • Program helps monitor and educate participants, promotes self-monitoring and empowers patient engagement with their health
  • Participants receive interactive tablet, blood pressure cuff and scale at no extra cost
  • Key to program success is customer’s direct access to dedicated Cigna-HealthSpring nurse practitioner with virtual connection enabled through interactive tablet

NASHVILLE – October 2, 2014 – In partnership with Intel-GE Care Innovations™, Cigna-HealthSpring® is expanding its population health program that utilizes interactive tablets – the Intel-GE Care Innovations™ Guide – and virtual connection to Cigna-HealthSpring nurse practitioners to partner and engage with patients diagnosed with congestive heart failure (CHF) to successfully manage their condition at home. Based on a successful pilot in Middle Tennessee that engaged 50 patients, the innovative remote patient management program is now being implemented with 250 patients statewide with potential for further expansion.

“We are dedicated to helping our customers get more from life and the success of the pilot program shows what an invaluable opportunity we have to truly make a positive impact in our customers’ lives,” said Dr. Jim Lancaster, senior medical director for Cigna-HealthSpring of Tennessee. “Many people with congestive heart failure find themselves back in the hospital within a matter of weeks after returning home so it’s important that we continue to seek new and innovative solutions to help them better manage their health. We are pleased by the early success of the pilot program and excited to implement it statewide to help more of our customers take control of their health with the convenience of virtual yet personalized medicine at home.”

Under the expanded program, participating Cigna-HealthSpring customers will be given a blood pressure cuff, scale and interactive tablet for a minimum of 90 days which will enable them to interact virtually with their Cigna-HealthSpring nurse practitioner, track their daily biometrics and complete an educational program to help them manage their CHF at home. Once they achieve specific milestones, participants will transition away from the tablet to a less intensive program where they will continue to monitor and log their weight and blood pressure with the help of a case manager. At the end of the program, customers should be able to recognize symptoms of CHF exacerbation and understand the impact of diet, education and medication on their condition. To participate in the program, customers must have received a CHF diagnosis and a previous ER visit or hospital admission. There is no cost to the customer to participate in the program but using the tablet requires a landline or internet connectivity.

“We have seen dramatic reductions in the need for hospitalization in our first year of the program pilot with Cigna-HealthSpring. We also recently worked with many hospitals across the country to create successful remote care management programs and have seen as high as a 75 percent reduction in hospital readmissions,” said Sean Slovenski, CEO of Intel-GE Care Innovations. “We’ve learned that a successful program is as much about the logistical details as it is about the technology. Helping consumers engage proactively in their own health is our mission at Care Innovations. By monitoring and engaging CHF patients as they go about their daily lives, we are able to catch problems early, involve the doctor immediately and ultimately avoid unnecessary ER visits, hospital stays and worsening of the patients’ health.”

Cigna-HealthSpring customer success examples:

When Elizabeth*, 74, started the program her blood pressure was extremely high, she was overweight and she had struggled with hospital admissions due to CHF complications. Since starting the program, she has lost 25 pounds, consistently had her blood pressure and heart rate in a healthy range and avoided the hospital. She says the program has helped give her better awareness of her condition and made her realize the positive impact she can make from simple daily monitoring of her biometrics. Elizabeth’s improvement has also helped her husband, who acts as her caregiver, gain more comfort and assurance that she has personal and direct access to her Cigna-HealthSpring nurse practitioner.

Margery*, 72, had struggled with controlling her CHF and frequently found herself in the hospital. Cigna-HealthSpring worked together with her cardiologist to enroll her in the program and create a personalized care plan to better manage her CHF. She says she now knows what to do and the program has helped educate and empower her to take better care of her herself and control her CHF. The program has helped her improve her biometrics, avoid the hospital for CHF-related complications and allowed her nurse practitioner to intervene early to prevent CHF exacerbation or a trip to the hospital.

*Names changed for privacy.

CHF is a chronic condition that affects 5.1 million people in the U.S.[1] and costs Medicare $17.4 billion per year in avoidable hospital readmissions.[2]. A companion piece to a recent study by Dartmouth University listed some of the reasons for hospital readmissions regardless of the condition, including patients not fully understanding their condition and being confused about medications.[3]

“What makes this program so special is that customers know they have easy and direct access to a Cigna-HealthSpring nurse practitioner, someone who truly cares about them and their health,” added Dr. Lancaster. “They feel empowered to learn how they can impact their own health.”

About Cigna-HealthSpring
Cigna-HealthSpring, a Cigna company (NYSE:CI), is one of the country’s leading health plans focused on delivering care to the senior population, predominately through Medicare Advantage and other Medicare and Medicaid products.  Based in Nashville, Tennessee, Cigna-HealthSpring offers a national stand-alone prescription drug plan and operates health plans in Alabama, Arizona, Arkansas, Delaware, Florida, Georgia, Illinois, Indiana, Maryland, Mississippi, North Carolina, Oklahoma, Pennsylvania, South Carolina, Tennessee, Texas and Washington, D.C. For more information, visitwww.cignahealthspring.com.

About Intel-GE Care Innovations™ 
Intel-GE Care Innovations, a joint venture between Intel Corporation and GE Healthcare, connects the care continuum to the home and makes it easier for patients, family caregivers, and professional caregivers to interact and achieve better health at home.

Experts in technology and behavior change, Care Innovations identifies the best methods for health care providers and health plans to capture and integrate real-time data from the home into care delivery. The company’s third-generation remote care management solution, Connect RCM, delivers insights for timely intervention and superior patient engagement with patients outside the formal care setting. The Connect RCM application is built with a smart filter and predictive analytics platform that sorts the complex array of aggregated data captured from a wide array of sensors and sources present in the daily lives of consumers. Visit www.careinnovations.com  to learn more.


[2] CMS National Medicare Readmission Findings. Available athttp://www.academyhealth.org/files/2012/sunday/brennan.pdf 
[3] Care About Your Care: Tips for Patients When They Leave the Hospital. Available atwww.dartmouthatlas.org/downloads/reports/Atlas_CAYC_092811.pdf 


Read Full Post »

Mapping the Universe of Pharmaceutical Business Intelligence: The Model developed by LPBI and the Model of Best Practices LLC

Mapping the Universe of Pharmaceutical Business Intelligence: The Model developed by LPBI and the Model of Best Practices LLC


Author and Curator of Model A: Aviva Lev-Ari, PhD, RN

Reporter on Model B: Aviva Lev-Ari, PhD, RN


This article provides the e-Reader with a MAP for navigation through two different Business Models that Co-exist in the EcoSystem of an industry called Pharmaceutical Business Intelligence.

Model A: is represented by Six Ventures of Leaders in Pharmaceutical Business Intelligence (LPBI), based in Boston, Philadelphia, CT, CA and Israel

Model B: is represented by Best Practices, LLC, headquartered in Chapel Hill, NC, with Offices in NYC and in Mumbai, India.


We concluded that the two models are viable, represent fast growth, the models and non-competing and are in full complementarity, thus, expanding the domain and the practice of the industrial sector, aka, Pharmaceutical Business Intelligence.


Model A:

Leaders in Pharmaceutical Business Intelligence (LPBI),

Boston, Philadelphia, CT, CA and Israel 

Team members


Our Growth Needs: Leaders in Pharmaceutical Business Intelligence


 Our Business Portfolio

VENTURE #1:

e-Publishing: Medicine, HealthCare, Life Sciences, BioMed, Pharmaceutical

  • Open Access Online Scientific Journal

http://pharmaceuticalintelligence.com Site statistics http://pharmaceuticalintelligence.com/wp-admin/index.php?page=stats

  • Scoop.it!.com

  1. http://www.scoop.it/t/cardiotoxicity
  2. http://www.scoop.it/t/cardiovascular-and-vascular-imaging
  3. http://www.scoop.it/t/cardiovascular-disease-pharmaco-therapy

VENTURE #2:

1. BioMedical e-Books e-Series: Cardiovascular, Genomics, Cancer, BioMed, Patient Centered Medicine

http://pharmaceuticalintelligence.com/biomed-e-books/

2. on Amazon’s Kindle e-Books List since 6/2013

3. Plans for Volume 1,2,3 – Hardcover

VENTURE #3:

International Scientific Delegations

http://pharmaceuticalintelligence.com/scientific-delegation/

  • Shanghai, May 2015
  • Barcelona, Spain, November 2015
  • Amsterdam, May 2016
  • Geneva, November 2016


VENTURE #4:

Funding, Deals & Partnerships

http://pharmaceuticalintelligence.com/joint-ventures/


VENTURE #5:

IP Invented HERE!

1.  Development of a NEW Nitric Oxide monitor to Alpha Szenszor Inc. sensor portfolio. A concept for a low cost POC e-nose, capable of real time ppb detection of Cancer The Cancer Team at Leaders in Pharmaceutical Business Intelligence under the leadership of Dr. Williams

2.  Development of a NEW Nitric Oxide monitor to Alpha Szenszor Inc. sensor portfolio. A concept for Inhaled Nitric Oxide for the Adult HomeCare Market – IP by Dr. Pearlman and Dr. A. Lev-Ari

a.  iknow iNO is i-kNOw – Inhaled Nitric Oxide for the HomeCare Markethttp://pharmaceuticalintelligence.com/2013/10/16/iknow-ino-is-i-know-inhaled-nitric-oxide-for-the-homecare-market/

b. electronic Book on Nitric Oxide by Nitric Oxide Team @ Leaders in Pharmaceutical Business Intelligence (LPBI)

Perspectives on Nitric Oxide in Disease Mechanisms

http://www.amazon.com/dp/B00DINFFY

c. The rationale and use of inhaled NO in Pulmonary Artery Hypertension and Right Sided Heart Failure Larry H. Bernstein 8/20/2012

d. Inhaled Nitric Oxide in Adults: Clinical Trials and Meta Analysis Studies – Recent Findings

Aviva Lev-Ari, PhD, RN, 6/2/2013

e. Clinical Indications for Use of Inhaled Nitric Oxide (iNO) in the Adult Patient Market: Clinical Outcomes after Use, Therapy Demand and Cost of Care

Aviva Lev-Ari, PhD, RN, 6/3/2013

3.  Cancer Genomics for NEW product development in diagnosis and treatment of Cancer Patients using sensory technology with applications for Radiation Therapy –The Cancer Team at Leaders in Pharmaceutical Business Intelligence under leadership of TBA

4.  Developing Mitral Valve Disease: MRI Methods and Devices for Percutaneous Mitral Valve Replacement and Mitral Valve Repair Augmentation of Patented Technology using RF – Dr. Pearlman’s IP Non-Hardware Mitral Annuloplasty – Dr. Justin D. Pearlman

http://pharmaceuticalintelligence.com/joint-ventures/valvecure-llc/non-hardware-mitral-annuloplasty-dr-justin-d-pearlman/

5.  Novel Technology using MRI for Vascular Lesions, Tumors, Hyperactive Glands and non-Surgical Cosmetic Reconstruction – Dr. Pearlman’s IP

http://pharmaceuticalintelligence.com/biomed-e-books/series-a-e-books-on-cardiovascular-diseases/httppharmaceuticalintelligence-combiomed-e-bookscardiovascular-diseases-causes-risks-and-management/cvd-business-affairs/mitral-valve-disease-mri-methods-and-devices/


VENTURE # 6:

PRESS Coverage of Conferences

http://pharmaceuticalintelligence.com/press-coverage/

Model B:

 
Best Practices, LLC, Chapel Hill, NC, Mumbai, India, Branch in New York


Best Practices, LLC
6350 Quadrangle Drive, Suite 200,
Chapel Hill, NC 27517

+1 919-403-0251

SOURCE

http://www.best-in-class.com/sitemap


Read Full Post »

Metformin, Thyroid-Pituitary Axis, Diabetes Mellitus, and Metabolism

Metformin, Thyroid-Pituitary Axis, Diabetes Mellitus, and Metabolism

Larry H, Bernstein, MD, FCAP, Author and Curator
and Aviva Lev-Ari, PhD, RN

http://pharmaceuticalintelligence.com/9/27/2014/Metformin,_thyroid-pituitary_ axis,_diabetes_mellitus,_and_metabolism

The following article is a review of the central relationship between the action of
metformin as a diabetic medication and its relationship to AMPK, the important and
essential regulator of glucose and lipid metabolism under normal activity, stress, with
its effects on skeletal muscle, the liver, the action of T3 and more.

We start with a case study and a publication in the J Can Med Assoc.  Then we shall look
into key literature on these metabolic relationships.

Part I.  Metformin , Diabetes Mellitus, and Thyroid Function

Hypothyroidism, Insulin resistance and Metformin
May 30, 2012   By Janie Bowthorpe
The following was written by a UK hypothyroid patient’s mother –
Sarah Wilson.

My daughter’s epilepsy is triggered by unstable blood sugars. And since taking
Metformin to control her blood sugar, she has significantly reduced the number of
seizures. I have been doing research and read numerous academic medical journals,
which got me thinking about natural thyroid hormone and Hypothyroidism. My hunch
was that when patients develop hypothyroid symptoms, they are actually becoming
insulin resistant (IR). There are many symptoms in common between women with
polycystic ovaries and hypothyroidism–the hair loss, the weight gain, etc.
(http://insulinhub.hubpages.com/hub/PCOS-and-Hypothyroidism).

A hypothyroid person’s body behaves as if it’s going into starvation mode and so, to
preserve resources and prolong life, the metabolism changes. If hypothyroid is prolonged
or pronounced, then perhaps, chemical preservation mode becomes permanent even
with the reintroduction of thyroid hormones. To get back to normal, they need
a “jump-start” reinitiate a higher rate of metabolism. The kick start is initiated through
AMPK, which is known as the “master metabolic regulating enzyme.”
(http://en.wikipedia.org/wiki/AMP-activated protein kinase).

Guess what? This is exactly what happens to Diabetes patients when Metformin is
introduced. http://en.wikipedia.org/wiki/Metformin
Suggested articles: http://www.springerlink.com/content/r81606gl3r603167/  and
http://onlinelibrary.wiley.com/doi/10.1111/j.1365-2265.2011.04029.x/pdf

Note the following comments/partial statements:
“Hypothyroidism is characterized by decreased insulin responsiveness”;
“the pivotal regulatory role of T3 in major metabolic pathways”.

The community knows that T3/NTH (natural thyroid hormone [Armour]) makes
hypothyroid patients feel better – but the medical establishment is averse to T3/NTH
(treating subclinical hypoT (T3/T4 euthyroid) with natural dessicated thyroid (NDT).
The medical establishment might find an alternative view about impaired metabolism
more if shown real proof that the old NDT **was/is** having the right result –i.e., the
T3 is jump-starting the metabolism by re-activating
 AMPK.

If NDT also can be used for hypothyroidism without the surmised “dangers” of NTH,
then they should consider it. [The reality in the choice is actually recombinant TH
(Synthroid)]. Metformin is cheap, stable and has very few serious side effects. I use the
car engine metaphor, and refer to glucose as our petrol, AMPK as the spark plug and
both T3 and Metformin as the ignition switches. Sometimes if you have flat batteries in
the car, it doesn’t matter how much you turn the ignition switch or pump the petrol
pedal, all it does is flatten the battery and flood the engine.

Dr. Skinner in the UK has been treating “pre-hypothyroidism” the way that some
doctors treat “pre-diabetes”. Those hypothyroid patients who get treated early
might not have had their AMPK pathways altered and the T4-T3 conversion still works.
There seems to be no reason why thyroid hormone replacement therapy shouldn’t
logically be given to ward off a greater problem down the line.

It’s my belief that there is clear and abundant academic evidence that the AMPK/
Metformin research should branch out to also look at thyroid disease.

Point – direct T3 is kicking the closed -down metabolic process back into life,
just like Metformin does for insulin resistance.
http://www.hotthyroidology.com/editorial_79.html
There is serotonin resistance! http://www.ncbi.nlm.nih.gov/pubmed/17250776

Metformin Linked to Risk of Low Levels of Thyroid Hormone

CMAJ (Canadian Medical Association Journal) 09/22/2014

Metformin, the drug commonly for treating type 2 diabetes,

  • is linked to an increased risk of low thyroid-stimulating hormone
    (TSH) levels
  • in patients with underactive thyroids (hypothyroidism),

according to a study in CMAJ (Canadian Medical Association Journal).

Metformin is used to lower blood glucose levels

  • by reducing glucose production in the liver.

previous studies have raised concerns that

  • metformin may lower thyroid-stimulating hormone levels.

Study characteristics:

  1. Retrospective  long-term
  2. 74 300 patient who received metformin and sulfonylurea
  3. 25-year study period.
  4. 5689 had treated hypothyroidism
  5. 59 937 had normal thyroid function.

Metformin and low levels of thyroid-stimulating hormone in
patients with type 2 diabetes mellitus

Jean-Pascal Fournier,  Hui Yin, Oriana Hoi Yun Yu, Laurent Azoulay  +
Centre for Clinical Epidemiology (Fournier, Yin, Yu, Azoulay), Lady Davis Institute,
Jewish General Hospital; Department of Epidemiology, Biostatistics and Occupational
Health (Fournier), McGill University; Division of Endocrinology (Yu), Jewish General
Hospital; Department of Oncology (Azoulay), McGill University, Montréal, Que., Cananda

CMAJ Sep 22, 2014,   http://dx.doi.org:/10.1503/cmaj.140688

Background:

  • metformin may lower thyroid-stimulating hormone (TSH) levels.

Objective:

  • determine whether the use of metformin monotherapy, when compared with
    sulfonylurea monotherapy,
  • is associated with an increased risk of low TSH levels(< 0.4 mIU/L)
  • in patients with type 2 diabetes mellitus.

Methods:

  • Used the Clinical Practice Research Datalink,
  • identified patients who began receiving metformin or sulfonylurea monotherapy
    between Jan. 1, 1988, and Dec. 31, 2012.
  • 2 subcohorts of patients with treated hypothyroidism or euthyroidism,

followed them until Mar. 31, 2013.

  • Used Cox proportional hazards models to evaluate the association of low TSH
    levels with metformin monotherapy, compared with sulfonylurea monotherapy,
    in each subcohort.

Results:

  • 5689 patients with treated hypothyroidism and 59 937 euthyroid patients were
    included in the subcohorts.

For patients with treated hypothyroidism:

  1. 495 events of low TSH levels were observed (incidence rate 0.1197/person-years).
  2. 322 events of low TSH levels were observed (incidence rate 0.0045/person-years)
    in the euthyroid group.
  • metformin monotherapy was associated with a 55% increased risk of low TSH
    levels 
    in patients with treated hypothyroidism (incidence rate 0.0795/person-years
    vs.0.1252/ person-years, adjusted hazard ratio [HR] 1.55, 95% confidence
    interval [CI] 1.09– 1.20), compared with sulfonylurea monotherapy,
  • the highest risk in the 90–180 days after initiation (adjusted HR 2.30, 95% CI
    1.00–5.29).
  • No association was observed in euthyroid patients (adjusted HR 0.97, 95% CI 0.69–1.36).

Interpretation: The clinical consequences of this needs further investigation.


Crude and adjusted hazard ratios for suppressed thyroid-stimulating hormone
levels (< 0.1 mIU/L) associated with the use metformin monotherapy, compared
with sulfonylurea monotherapy, in patients with treated hypothyroidism or
euthyroidism and type 2 diabetes
Variable No. events
suppressed
TSH levels
Person-years of
exposure
Incidence rate,
per 1000 person-years (95% CI)
Crude
HR
Adjusted HR*(95% CI)
Patients with treated hypothyroidism, n = 5689
Sulfonylure,
n = 762
18 503 35.8
(21.2–56.6)
1.00 1.00
(reference)
Metformin,
n = 4927
130 3 633 35.8
(29.9–42.5)
1.05 0.99
(0.57–1.72)
Euthyroid patients, n = 59 937
Sulfonylurea,
n = 7980
12 8 576 1.4
(0.7–2.4)
1.00 1.00
(reference)
Metformin,
n = 51 957
75 63 047 1.2
(0.9–1.5)
0.85 1.03
(0.52–2.03)


Part II. Metabolic Underpinning 
(Source: Wikipedia, AMPK and thyroid)

5′ AMP-activated protein kinase or AMPK or 5′ adenosine monophosphate-activated protein kinase
is an enzyme that plays a role in cellular energy homeostasis.
It consists of three proteins (subunits) that

  1. together make a functional enzyme, conserved from yeast to humans.
  2. It is expressed in a number of tissues, including the liver, brain, and skeletal
    muscle.
  3. The net effect of AMPK activation is stimulation of
    1. hepatic fatty acid oxidation and ketogenesis,
    2. inhibition of cholesterol synthesis,
    3. lipogenesis, and triglyceride synthesis,
    4. inhibition of adipocyte lipolysis and lipogenesis,
    5. stimulation of skeletal muscle fatty acid oxidation and muscle
      glucose uptake, and
    6. modulation of insulin secretion by pancreatic beta-cells.

The heterotrimeric protein AMPK is formed by α, β, and γ subunits. Each of these three
subunits takes on a specific role in both the stability and activity of AMPK.

  • the γ subunit includes four particular Cystathionine beta synthase (CBS) domains
    giving AMPK its ability to sensitively detect shifts in the AMP:ATP ratio.
  • The four CBS domains create two binding sites for AMP commonly referred to as
    Bateman domains. Binding of one AMP to a Bateman domain cooperatively
    increases the binding affinity of the second AMP to the other Bateman domain.
  • As AMP binds both Bateman domains the γ subunit undergoes a conformational
    change which exposes the catalytic domain found on the α subunit.
  • It is in this catalytic domain where AMPK becomes activated when
    phosphorylation takes place at threonine-172by an upstream AMPK kinase
    (AMPKK). The α, β, and γ subunits can also be found in different isoforms.

AMPK acts as a metabolic master switch regulating several intracellular systems

  1. the cellular uptake of glucose,
  2. the β-oxidation of fatty acids and
  3. the biogenesis of glucose transporter 4 (GLUT4) and
  4. mitochondria

The energy-sensing capability of AMPK can be attributed to

  • its ability to detect and react to fluctuations in the AMP:ATP ratio that take
    place during rest and exercise (muscle stimulation).

During muscle stimulation,

  • AMP increases while ATP decreases, which changes AMPK into a good substrate
    for activation.
  • AMPK activity increases while the muscle cell experiences metabolic stress
    brought about by an extreme cellular demand for ATP.
  • Upon activation, AMPK increases cellular energy levels by
    • inhibiting anabolic energy consuming pathways (fatty acid synthesis,
      protein synthesis, etc.) and
    • stimulating energy producing, catabolic pathways (fatty acid oxidation,
      glucose transport, etc.).

A recent JBC paper on mice at Johns Hopkins has shown that when the activity of brain
AMPK was pharmacologically inhibited,

  • the mice ate less and lost weight.

When AMPK activity was pharmacologically raised (AICAR see below)

  • the mice ate more and gained weight.

Research in Britain has shown that the appetite-stimulating hormone ghrelin also
affects AMPK levels.

The antidiabetic drug metformin (Glucophage) acts by stimulating AMPK, leading to

  1. reduced glucose production in the liver and
  2. reduced insulin resistance in the muscle.

(Metformin usually causes weight loss and reduced appetite, not weight gain and
increased appetite, ..opposite of expected from the Johns Hopkins mouse study results.)

Triggering the activation of AMPK can be carried out provided two conditions are met.

First, the γ subunit of AMPK

  • must undergo a conformational change so as to
  • expose the active site(Thr-172) on the α subunit.

The conformational change of the γ subunit of AMPK can be accomplished

  • under increased concentrations of AMP.

Increased concentrations of AMP will

  • give rise to the conformational change on the γ subunit of AMPK
  • as two AMP bind the two Bateman domains located on that subunit.
  • It is this conformational change brought about by increased concentrations
    of  AMP that exposes the active site (Thr-172) on the α subunit.

This critical role of AMP is further substantiated in experiments that demonstrate

  • AMPK activation via an AMP analogue 5-amino-4-imidazolecarboxamide
    ribotide (ZMP) which is derived fromthe familiar
  • 5-amino-4-imidazolecarboxamide riboside (AICAR)

AMPK is a good substrate for activation via an upstream kinase complex, AMPKK
AMPKK is a complex of three proteins,

  1. STE-related adaptor (STRAD),
  2. mouse protein 25 (MO25), and
  3. LKB1 (a serine/threonine kinase).

The second condition that must be met is

  • the phosphorylation/activation of AMPK on its activating loop at
    Thr-172of the α subunit
  • brought about by an upstream kinase (AMPKK).

The complex formed between LKB1 (STK 11), mouse protein 25 (MO25), and the
pseudokinase STE-related adaptor protein (STRAD) has been identified as

  • the major upstream kinase responsible for phosphorylation of AMPK
    on its activating loop at Thr-172

Although AMPK must be phosphorylated by the LKB1/MO25/STRAD complex,

  • it can also be regulated by allosteric modulators which
  • directly increase general AMPK activity and
  • modify AMPK to make it a better substrate for AMPKK
  • and a worse substrate for phosphatases.

It has recently been found that 3-phosphoglycerate (glycolysis intermediate)

  • acts to further pronounce AMPK activation via AMPKK

Muscle contraction is the main method carried out by the body that can provide
the conditions mentioned above needed for AMPK activation

  • As muscles contract, ATP is hydrolyzed, forming ADP.
  • ADP then helps to replenish cellular ATP by donating a phosphate group to
    another ADP,

    • forming an ATP and an AMP.
  • As more AMP is produced during muscle contraction,
    • the AMP:ATP ratio dramatically increases,
  • leading to the allosteric activation of AMPK

For over a decade it has been known that calmodulin-dependent protein kinase
kinase-beta (CaMKKbeta) can phosphorylate and thereby activate AMPK,

  • but it was not the main AMPKK in liver.

CaMKK inhibitors had no effect on 5-aminoimidazole-4-carboxamide-1-beta-4-
ribofuranoside (AICAR) phosphorylation and activation of AMPK.

  • AICAR is taken into the celland converted to ZMP,
  • an AMP analogthat has been shown to activate AMPK.

Recent LKB1 knockout studies have shown that without LKB1,

  • electrical and AICAR stimulation of muscleresults in very little
    phosphorylation of AMPK and of ACC, providing evidence that
  • LKB1-STRAD-MO25 is the major AMPKK in muscle.

Two particular adipokines, adiponectin and leptin, have even been demonstrated
to regulate AMPK. A main functions of leptin in skeletal muscle is

  • the upregulation of fatty acid oxidation.

Leptin works by way of the AMPK signaling pathway, and adiponectin also
stimulates the oxidation of fatty acids via the AMPK pathway, and

  • Adiponectin also stimulates the uptake of glucose in skeletal muscle.

An increase in enzymes which specialize in glucose uptake in cells such as GLUT4
and hexokinase II are thought to be mediated in part by AMPK when it is activated.
Increases in AMPK activity are brought about by increases in the AMP:ATP ratio
during single bouts of exercise and long-term training.

One of the key pathways in AMPK’s regulation of fatty acid oxidation is the

  • phosphorylation and inactivation of acetyl-CoA carboxylase.
  1. Acetyl-CoA carboxylase (ACC) converts acetyl-CoA (ACA) to malonyl-CoA
    (MCA), an inhibitor of carnitine palmitoyltransferase 1 (CPT-1).
  2. CPT-1 transports fatty acids into the mitochondria for oxidation.
  3. Inactivation of ACC results in increased fatty acid transport and oxidation.
  4. the AMPK induced ACC inactivation  and reduced conversion to MCA
    may occur as a result of malonyl-CoA decarboxylase (MCD)
  5. MCD as an antagonist to ACC, decarboxylatesmalonyl-CoA to acetyl-CoA
    (reversal of ACC conversion of ACA to MCA)
  6. This resultsin decreased malonyl-CoA and increased CPT-1 and fatty acid oxidation.

AMPK also plays an important role in lipid metabolism in the liver. It has long been
known that hepatic ACC has been regulated in the liver.

  1. It phosphorylates and inactivates 3-hydroxy-3-methylglutaryl-CoA reductase (HMGCR)
  2. acetyl-CoA(ACA) is converted to mevalonic acid (MVA) by ACC
    with inhibition of CPT-1
  3. HMGR converts 3-hydroxy-3-methylglutaryl-CoA, which is made from MVA
  4. which then travels down several more metabolic steps to become cholesterol.

Insulin facilitates the uptake of glucose into cells via increased expression and
translocation of glucose transporter GLUT-4. In addition, glucose is phosphorylated
by hexokinase wheni iot enters the cell. The phosphorylated form keeps glucose from
leaving the cell,

  • The decreasedthe concentration of glucose molecules creates a gradient for more
    glucose to be transported into the cell.
AMPK and thyroid hormone regulate some similar processes. Knowing these similarities,
Winder and Hardie et al. designed an experiment to see if AMPK was influenced by thyroid
hormone. They found that all of the subunits of AMPK were increased in skeletal muscle,
especially in the soleus and red quadriceps, with thyroid hormone treatment. There was
also an increase in phospho-ACC, a marker of AMPK activity.
  •  Winder WW, Hardie DG (July 1999). “AMP-activated protein kinase,
    a metabolic master switch: possible roles in type 2 diabetes”. J. Physiol. 277
    (1 Pt 1): E1–10. PMID 10409121.
  • Winder WW, Hardie DG (February 1996). “Inactivation of acetyl-CoA
    carboxylase and activation of AMP-activated protein kinase in muscle
    during exercise”. J. Physiol. 270 (2 Pt 1): E299–304. PMID 8779952.
  • Hutber CA, Hardie DG, Winder WW (February 1997). “Electrical stimulation
    inactivates muscle acetyl-CoA carboxylase and increases AMP-activated
    protein kinase”. Am. J. Physiol. 272 (2 Pt 1): E262–6. PMID 9124333
  • Durante PE, Mustard KJ, Park SH, Winder WW, Hardie DG (July 2002).
    “Effects of endurance training on activity and expression of AMP-activated
    protein kinase isoforms in rat muscles”. Am. J. Physiol. Endocrinol.
    Metab. 283 (1): E178–86. doi:10.1152/ajpendo.00404.2001. PMID 12067859
  • Corton JM, Gillespie JG, Hardie DG (April 1994). “Role of the AMP-activated
    protein kinase in the cellular stress response”. Curr. Biol. 4 (4):
    315–24. doi:10.1016/S0960-9822(00)00070-1. PMID 7922340
  • Winder WW (September 2001). “Energy-sensing and signaling by
    AMP-activated protein kinase in skeletal muscle”. J. Appl. Physiol. 91 (3):
    1017–28. PMID 11509493
  • Suter M, Riek U, Tuerk R, Schlattner U, Wallimann T, Neumann D (October
    2006). “Dissecting the role of 5′-AMP for allosteric stimulation, activation,
    and deactivation of AMP-activated protein kinase”.  J. Biol. Chem.
    281 (43): 32207–6. doi:10.1074/jbc.M606357200. PMID 16943194


Part III. Pituitary-thyroid axis and diabetes mellitus
The Interface Between Thyroid and Diabetes Mellitus

Leonidas H. Duntas, Jacques Orgiazzi, Georg Brabant   Clin Endocrinol. 2011;75(1):1-9.
Interaction of Metformin and Thyroid Function

Metformin acts primarily by

  • suppressing hepatic gluconeogenesis via activation of AMPK
  • It has the opposite effects on hypothalamic AMPK,
    • inhibiting activity of the enzyme.
  • the metformin effects on hypothalamic AMPK activity will
    • counteractT3 effects at the hypothalamic level.
  • AMPK therefore represents a direct target for dual regulation
    • in the hypothalamic partitioning of energy homeostasis.
  • metformin crossesthe blood–brain barrier and
    • levels in the pituitary gland are substantially increased.
  • It convincinglysuppresses TSH

A recent study recruiting 66 patients with benign thyroid nodules furthermore
demonstrated that metformin significantly decreases nodule size in patients with
insulin resistance.[76] The effect of metformin, which was produced over a
6-month treatment period, parallelled a fall in TSH concentrations and achieved a
shrinkage amounting to 30% of the initial nodule size when metformin was
administered alone and up to 55% when it was added to ongoing LT4 treatment.

These studies reveal a

  • suppressive effect of metformin on TSH secretion patterns in
    hypothyroid patients, an effect that is apparently
  • independent of T4 treatment and does not alter the TH profile.
  • A rebound of TSH secretion occurs at about 3 months following metformin
    withdrawal.

It appears that recommendations for more frequent testing, on an annual to
biannual basis, seems justified in higher risk groups like patients over 50 or 55,
particularly with suggestive symptoms, raised antibody titres or dylipidaemia.
We thus would support the suggestion of an initial TSH and TPO antibody testing
which, as discussed, will help to predict the development of hypothyroidism in
patients with diabetes.

Hypothalamic AMPK and fatty acid metabolism mediate thyroid
regulation of energy 
balance
M López,  L Varela,  MJ Vázquez,  S Rodríguez-Cuenca, CR González, …, & Vidal-Puig
Nature Medicine  29 Aug 2010; 16: 1001–1008 http://dx.doi.org:/10.1038/nm.2207

Thyroid hormones have widespread cellular effects; however it is unclear whether
their effects on the central nervous system (CNS) contribute to global energy balance.
Here we demonstrate that either

  • whole-body hyperthyroidism or central administration of triiodothyronine
    (T3) decreases

    • the activity of hypothalamic AMP-activated protein kinase (AMPK),
    • increases sympathetic nervous system (SNS) activity and
    • upregulates thermogenic markers in brown adipose tissue (BAT).

Inhibition of the lipogenic pathway in the ventromedial nucleus of the hypothalamus
(VMH) prevents CNS-mediated activation of BAT by thyroid hormone and reverses
the weight loss associated with hyperthyroidism. Similarly, inhibition of thyroid
hormone receptors in the VMH reverses the weight loss associated with hyperthyroidism.

This regulatory mechanism depends on AMPK inactivation, as genetic inhibition of this
enzyme in the VMH of euthyroid rats induces feeding-independent weight loss and
increases expression of thermogenic markers in BAT. These effects are reversed by
pharmacological blockade of the SNS. Thus, thyroid hormone–induced modulation
of AMPK activity and lipid metabolism in the hypothalamus is a major regulator of
whole-body energy homeostasis.

Metabolic Basis for Thyroid Hormone Liver Preconditioning:
Upregulation of AMP-Activated Protein Kinase Signaling
  
LA Videla,1 V Fernández, P Cornejo, and R Vargas
1Molecular and Clinical Pharmacology Program, Institute of Biomedical Sciences,
Faculty of Medicine, University of Chile, 2Faculty of Medicine, Diego Portales University,
Santiago, Chile
Academic Editors: H. M. Abu-Soud and D. Benke
The Scientific World Journal 2012; 2012, ID 475675, 10 pp
http://dx.doi.org/10.1100/2012/475675

The liver is a major organ responsible for most functions of cellular metabolism and

  • a mediator between dietary and endogenous sources of energy for extrahepatic tissues.
  • In this context, adenosine-monophosphate- (AMP-) activated protein kinase (AMPK)
    constitutes an intrahepatic energy sensor
  • regulating physiological energy dynamics by limiting anabolism and stimulating
    catabolism, thus increasing ATP availability.
  • This is achieved by mechanisms involving direct allosteric activation and
    reversible phosphorylation of AMPK, in response to signals such as

    • energy status,
    • serum insulin/glucagon ratio,
    • nutritional stresses,
    • pharmacological and natural compounds, and
    • oxidative stress status.

Reactive oxygen species (ROS) lead to cellular AMPK activation and

  • downstream signaling under several experimental conditions.

Thyroid hormone (L-3,3′,5-triiodothyronine, T3) administration, a condition
that enhances liver ROS generation,

  • triggers the redox upregulation of cytoprotective proteins
    • affording preconditioning against ischemia-reperfusion (IR) liver injury.

Data discussed in this work suggest that T3-induced liver activation of AMPK

  • may be of importance in the promotion of metabolic processes
  • favouring energy supply for the induction and operation of preconditioning
    mechanisms.

These include

  1. antioxidant,
  2. antiapoptotic, and
  3. anti-inflammatory mechanisms,
  4. repair or resynthesis of altered biomolecules,
  5. induction of the homeostatic acute-phase response, and
  6. stimulation of liver cell proliferation,

which are required to cope with the damaging processes set in by IR.

The liver functions as a mediator between dietary and endogenous sources
of energy and extrahepatic organs that continuously require energy, mainly
the brain and erythrocytes, under cycling conditions between fed and fasted states.

In the fed state, where insulin action predominates, digestion-derived glucose is
converted to pyruvate via glycolysis, which is oxidized to produce energy, whereas
fatty acid oxidation is suppressed. Excess glucose can be either stored as hepatic
glycogen or channelled into de novo lipogenesis.

In the fasted state, considerable liver fuel metabolism changes occur due to decreased
serum insulin/glucagon ratio, with higher glucose production as a consequence of
stimulated glycogenolysis and gluconeogenesis (from alanine, lactate, and glycerol).

Major enhancement in fatty acid oxidation also occurs to provide energy for liver
processes and ketogenesis to supply metabolic fuels for extrahepatic tissues. For these
reasons, the liver is considered as the metabolic processing organ of the body, and
alterations in liver functioning affect whole-body metabolism and energy homeostasis.

In this context, adenosine-monophosphate- (AMP-) activated protein kinase (AMPK)
is the downstream component of a protein kinase cascade acting as an

  • intracellular energy sensor regulating physiological energy dynamics by
  • limiting anabolic pathways, to prevent excessive adenosine triphosphate (ATP)
    utilization, and
  • by stimulating catabolic processes, to increase ATP production.

Thus, the understanding of the mechanisms by which liver AMPK coordinates hepatic
energy metabolism represents a crucial point of convergence of regulatory signals
monitoring systemic and cellular energy status

Liver AMPK: Structure and Regulation

AMPK, a serine/threonine kinase, is a heterotrimeric complex comprising

  1. a catalytic subunit α and
  2. two regulatory subunits β and γ .

The α subunit has a threonine residue (Thr172) within the activation loop of the kinase
domain, with the C-terminal region being required for association with β and γ subunits.
The β subunit associates with α and γ by means of its C-terminal region , whereas

  • the γ subunit has four cystathionine β-synthase (CBS) motifs, which
  • bind AMP or ATP in a competitive manner.

75675.fig.001 (not shown)

Figure 1: Regulation of AMP-activated protein kinase (AMPK) by
(A) direct allosteric activation and
(B) reversible phosphorylation and downstream responses maintaining
intracellular energy balance.

Regulation of liver AMPK activity involves both direct allosteric activation and
reversible phosphorylation. AMPK is allosterically activated by AMP through

  • binding to the regulatory subunit-γ, which induces a conformational change in
    the kinase domain of subunit α that protects AMPK from dephosphorylation
    of Thr172, probably by protein phosphatase-2C.

Activation of AMPK requires phosphorylation of Thr172 in its α subunit, which can be
attained by either

(i) tumor suppressor LKB1 kinase following enhancement in the AMP/ATP ratio, a
kinase that plays a crucial role in AMPK-dependent control of liver glucose and
lipid metabolism;

(ii) Ca2+-calmodulin-dependent protein kinase kinase-β (CaMKKβ) that
phosphorylates AMPK in an AMP-independent, Ca2+-dependent manner;

(iii) transforming growth-factor-β-activated kinase-1 (TAK1), an important
kinase in hepatic Toll-like receptor 4 signaling in response to lipopolysaccharide.

Among these kinases, the relevance of CaMKKβ and TAK1 in liver AMPK activation
remains to be established in metabolic stress conditions. Both allosteric and
phosphorylation mechanisms are able to elicit

  • over 1000-fold increase in AMPK activity, thus allowing
  • the liver to respond to small changes in energy status in a highly sensitive fashion.

In addition to rapid AMPK regulation through allosterism and reversible phosphorylation

  • long-term effects of AMPK activation induce changes in hepatic gene expression.

This was demonstrated for

(i) the transcription factor carbohydrate-response element-binding protein (ChREBP),

  • whose Ser568 phosphorylation by activated AMPK
  • blocks its DNA binding capacity and glucose-induced gene transcription
  • under hyperlipidemic conditions;(ii) liver sterol regulatory element-binding
    protein-1c (SREBP-1c), whose mRNA and protein expression and those of
    its target gene for fatty acid synthase (FAS)
  • are reduced by metformin-induced AMPK activation,
  • decreasing lipogenesis and increasing fatty acid oxidation due to
    malonyl-CoA depletion;

(iii) transcriptional coactivator transducer of regulated CREB activity-2 (TORC2),
a crucial component of the hepatic gluconeogenic program, was reported
to be phosphorylated by activated AMPK.

This modification leads to subsequent cytoplasmatic sequestration of TORC2 and
inhibition of gluconeogenic gene expression, a mechanism underlying

  • the plasma glucose-lowering effects of adiponectin and metformin
  • through AMPK activation by upstream LKB1.

Activation of AMPK in the liver is a key regulatory mechanism controlling glucose
and lipid metabolism,

  1. inhibiting anabolic processes, and
  2. enhancing catabolic pathways in response to different signals, including
    1. energy status,
    2. serum insulin/glucagon ratio,
    3. nutritional stresses,
    4. pharmacological and natural compounds, and
    5. oxidative stress status

Reactive Oxygen Species (ROS) and AMPK Activation

The high energy demands required to cope with all the metabolic functions
of the liver are met by

  • fatty acid oxidation under conditions of both normal blood glucose levels and
    hypoglycemia, whereas
  • glucose oxidation is favoured in hyperglycemic states, with consequent
    generation of ROS.

Under normal conditions, ROS occur at relatively low levels due to their fast processing
by antioxidant mechanisms, whereas at acute or prolonged high ROS levels, severe
oxidation of biomolecules and dysregulation of signal transduction and gene expression
is achieved, with consequent cell death through necrotic and/or apoptotic-signaling
pathways.

Thyroid Hormone (L-3,3′,5-Triiodothyronine, T3), Metabolic Regulation,
and ROS Production

T3 is important for the normal function of most mammalian tissues, with major actions
on O2 consumption and metabolic rate, thus

  • determining enhancement in fuel consumption for oxidation processes
  • and ATP repletion.

T3 acts predominantly through nuclear receptors (TR) α and β, forming

  • functional complexes with retinoic X receptor that
  • bind to thyroid hormone response elements (TRE) to activate gene expression.

T3 calorigenesis is primarily due to the

  • induction of enzymes related to mitochondrial electron transport and ATP
    synthesis, catabolism, and
  • some anabolic processes via upregulation of genomic mechanisms.

The net result of T3 action is the enhancement in the rate of O2 consumption of target
tissues such as liver, which may be effected by secondary processes induced by T3

(i) energy expenditure due to higher active cation transport,

(ii) energy loss due to futile cycles coupled to increase in catabolic and anabolic pathways, and

(iii) O2 equivalents used in hepatic ROS generation both in hepatocytes and Kupffer cells

In addition, T3-induced higher rates of mitochondrial oxidative phosphorylation are
likely to induce higher levels of ATP, which are partially balanced by intrinsic uncoupling
afforded by induction of uncoupling proteins by T3. In agreement with this view, the
cytosolic ATP/ADP ratio is decreased in hyperthyroid tissues, due to simultaneous
stimulation of ATP synthesis and consumption.

Regulation of fatty acid oxidation is mainly attained by carnitine palmitoyltransferase Iα (CPT-Iα),

  • catalyzing the transport of fatty acids from cytosol to mitochondria for β-oxidation,
    and acyl-CoA oxidase (ACO),
  • catalyzing the first rate-limiting reaction of peroxisomal β-oxidation, enzymes that are
    induced by both T3 and peroxisome proliferator-activated receptor α (PPAR-α).

Furthermore, PPAR-α-mediated upregulation of CPT-Iα mRNA is enhanced by PPAR-γ
coactivator 1α (PGC-1α), which in turn

  • augments T3 induction of CPT-Iα expression.

Interestingly, PGC-1α is induced by

  1. T3,
  2. AMPK activation, and
  3. ROS,

thus establishing potential links between

  • T3 action, ROS generation, and AMPK activation

with the onset of mitochondrial biogenesis and fatty acid β-oxidation.

Liver ROS generation leads to activation of the transcription factors

  1. nuclear factor-κB (NF-κB),
  2. activating protein 1 (AP-1), and
  3. signal transducer and activator of transcription 3 (STAT3)

at the Kupffer cell level, with upregulation of cytokine expression (TNF-α, IL-1, IL-6),
which upon interaction with specific receptors in hepatocytes trigger the expression of

  1. cytoprotective proteins (Figure 3(A)).

These responses and the promotion of hepatocyte and Kupffer-cell proliferation
represent hormetic effects reestablishing

  1. redox homeostasis,
  2. promoting cell survival, and
  3. protecting the liver against ischemia-reperfusion injury.

T3 liver preconditioning also involves the activation of the

  1. Nrf2-Keap1 defense pathway
  • upregulating antioxidant proteins,
  • phase-2 detoxifying enzymes, and
  • multidrug resistance proteins, members of the ATP binding cassette (ABC)
    superfamily of transporters (Figure 3(B))

In agreement with T3-induced liver preconditioning, T3 or L-thyroxin afford
preconditioning against IR injury in the heart, in association with

  • activation of protein kinase C and
  • attenuation of p38 and
  • c-Jun-N-terminal kinase activation ,

and in the kidney, in association with

  • heme oxygenase-1 upregulation.

475675.fig.002

http://www.hindawi.com/journals/tswj/2012/floats/475675/thumbnails/475675.fig.002_th.jpg

Figure 2: Calorigenic response of thyroid hormone (T3) and its relationship with O2
consumption, reactive oxygen species (ROS) generation, and antioxidant depletion in the liver.
Abbreviations: CYP2E1, cytochrome P450 isoform 2E1; GSH, reduced glutathione; QO2, rate
of O2 consumption; SOD, superoxide dismutase.

475675.fig.003

genomic signaling in T3 calorigenesis and ROS production 475675.fig.003

genomic signaling in T3 calorigenesis and ROS production 475675.fig.003

http://www.hindawi.com/journals/tswj/2012/floats/475675/thumbnails/475675.fig.003_th.jpg

Figure 3: Genomic signaling mechanisms in T3 calorigenesis and liver reactive oxygen
species (ROS) production leading to
(A) upregulation of cytokine expression in Kupffer cells and hepatocyte activation of genes
conferring cytoprotection,
(B) Nrf2 activation controling expression of antioxidant and detoxication proteins, and
(C) activation of the AMPK cascade regulating metabolic functions.Abbreviations: AP-1, activating protein 1; ARE, antioxidant responsive element; CaMKKβ,
Ca2+-calmodulin-dependent kinase kinase-β; CBP, CREB binding protein; CRC, chromatin
remodelling complex; EH, epoxide hydrolase; HO-1, hemoxygenase-1; GC-Ligase,
glutamate cysteine ligase; GPx, glutathione peroxidase; G-S-T, glutathione-S-transferase;
HAT, histone acetyltransferase; HMT, histone arginine methyltransferase; IL1,
interleukin 1; iNOS, inducible nitric oxide synthase; LKB1, tumor suppressor LKB1 kinase;
MnSOD, manganese superoxide dismutase; MRPs, multidrug resistance proteins; NF-κB,
nuclear factor-κB; NQO1, NADPH-quinone oxidoreductase-1; NRF-1, nuclear respiratory
factor-1; Nrf2, nuclear receptor-E2-related factor 2; PCAF, p300/CBP-associated
factor; RXR, retinoic acid receptor; PGC-1, peroxisome proliferator-activated receptor-γ
coactivator-1; QO2, rate of O2 consumption; STAT3, signal transducer and activator
of transcription 3; TAK1, transforming-growth-factor-β-activated kinase-1; TNF-α, tumor
necrosis factor-α; TR, T 3 receptor; TRAP, T3-receptor-associated protein; TRE,  T3 responsive element; UCP, uncoupling proteins; (—), reported mechanisms;
(- - - -), proposed mechanisms.


T3 is a key metabolic regulator coordinating short-term and long-term energy needs,
with major actions on liver metabolism. These include promotion of

(i) gluconeogenesis and hepatic glucose production, and

(ii) fatty acid oxidation coupled to enhanced adipose tissue lipolysis, with

  • higher fatty acid flux to the liver and
  • consequent ROS production (Figure 2) and
  • redox upregulation of cytoprotective proteins

affording liver preconditioning (Figure 3).

Thyroid Hormone and AMPK Activation: Skeletal Muscle and Heart

In skeletal muscle, T3 increases the levels of numerous proteins involved in

  1. glucose uptake (GLUT4),
  2. glycolysis (enolase, pyruvate kinase, triose phosphate isomerase),
  3. fatty acid oxidation (carnitine palmitoyl transferase-1, mitochondrial thioesterase I),
    and uncoupling protein-3,

effects that are achieved through enhanced transcription of TRE-containing genes

Skeletal muscle AMPK activation is characterized by

(i) being a rapid and transient response,

(ii) upstream activation by Ca2+-induced mobilization and CaMKKβ activation,

(iii) upstream upregulation of LKB1 expression, which requires association with STRAD
and MO25 for optimal phosphorylation/activation of AMPK, and

(iv) stimulation of mitochondrial fatty acid β-oxidation.

T3-induced muscle AMPK activation was found to trigger two major downstream

signaling pathways, namely,

(i) peroxisome proliferator-activated receptor-γ coactivator-1α (PGC-1α) mRNA
expression and phosphorylation, a transcriptional regulator for genes related to

  • mitochondrial biogenesis,
  • fatty acid oxidation, and
  • gluconeogenesis and

(ii) cyclic AMP response element binding protein (CREB) phosphorylation, which

  • in turn induces PGC-1α expression in liver tissue, thus
  • reinforcing mechanism (i).

These data indicate that AMPK phosphorylation of PGC-1α initiates many of the
important gene regulatory functions of AMPK in skeletal muscle.

In heart, hyperthyroidism increased glycolysis and sarcolemmal GLUT4 levels by the
combined effects of AMPK activation and insulin stimulation, with concomitant increase
in fatty acid oxidation proportional to enhanced cardiac mass and contractile function.

Thyroid Hormone, AMPK Activation, and Liver Preconditioning

Recent studies by our group revealed that administration of a single dose of 0.1 mg T3/kg
to rats activates liver AMPK (Figure 4; unpublished work).

  1. enhancement in phosphorylated AMPK/nonphosphorylated AMPK ratios in T3-
    treated rats over control values thatis significant in the time period of 1 to 48
    hours after hormone treatment
  2. Administration of a substantially higher dose (0.4 mg T3/kg) resulted in
    decreased liver AMPK activation at 4 h to return to control values at 6 h
    after treatment

Activation of liver AMPK by T3 may be of relevance in terms of

  • promotion of fatty acid oxidation for ATP supply,
  • supporting hepatoprotection against IR injury (Figure 3(C)).

This proposal is based on the high energy demands underlying effective liver
preconditioning for full operation of hepatic

  • antioxidant, antiapoptotic, and anti-inflammatory mechanisms,
  • oxidized biomolecules repair or resynthesis,
  • induction of the homeostatic acute-phase response, and
  • promotion of hepatocyte and Kupffer cell proliferation,

mechanisms that are needed to cope with the damaging processes set in by IR.
T3 liver preconditioning , in addition to that afforded by

  • n-3 long-chain polyunsaturated fatty acids given alone or
  • combined with T3 at lower dosages, or
  • by iron supplementation,

constitutes protective strategies against hepatic IR injury.

Studies on the molecular mechanisms underlying T3-induced liver AMPK
activation (Figure 4) are currently under assessment in our laboratory.

References

Fernández and L. A. Videla, “Kupffer cell-dependent signaling in thyroid hormone
calorigenesis: possible applications for liver preconditioning,” Current Signal
Transduction Therapy 2009; 4(2): 144–151.

Viollet, B. Guigas, J. Leclerc et al., “AMP-activated protein kinase in the regulation
of  hepatic energy metabolism: from physiology to therapeutic perspectives,” Acta
Physiologica 2009; 196(1): 81–98.

Carling, “The AMP-activated protein kinase cascade – A unifying system
for energy control,” Trends in Biochemical Sciences, 2004;. 29(1): 18–24.

E. Kemp, D. Stapleton, D. J. Campbell et al., “AMP-activated protein kinase,
super 
metabolic regulator,” Biochemical Society Transactions 2003; 31(1):
162–168
.

G. Hardie, “AMP-activated protein kinase-an energy sensor that
regulates all ;aspects of cell function,” Genes and Development,
2011; 25(18): 1895–1908.

Woods, P. C. F. Cheung, F. C. Smith et al., “Characterization of AMP-activated
protein kinase βandγ subunits Assembly of the heterotrimeric complex in vitro,”
Journal of Biological Chemistry 1996;271(17): 10282–10290.

Xiao, R. Heath, P. Saiu et al., “Structural basis for AMP binding to mammalian AMP-
activated protein kinase,” Nature 2007; 449(7161): 496–500.

more…

Impact of Metformin and compound C on NIS expression and iodine uptake in vitro and in vivo: a role for CRE in AMPK modulation of thyroid function.
Abdulrahman RM1, Boon MR, Sips HC, Guigas B, Rensen PC, Smit JW, Hovens GC.
Author information 
Thyroid. 2014 Jan;24(1):78-87.  Epub 2013 Sep 25.  PMID: 23819433
http://dx.doi.org:/10.1089/thy.2013.0041.

Although adenosine monophosphate activated protein kinase (AMPK) plays a crucial role
in energy metabolism, a direct effect of AMPK modulation on thyroid function has only
recently been reported, and much of its function in the thyroid is currently unknown.

The aim of this study was

  1. to investigate the mechanism of AMPK modulation in iodide uptake.
  2. to investigate the potential of the AMPK inhibitor compound C as an enhancer of
    iodide uptake by thyrocytes.

Metformin reduced NIS promoter activity (0.6-fold of control), whereas compound C
stimulated its activity (3.4-fold) after 4 days. This largely coincides with

  • CRE activation (0.6- and 3.0-fold).

These experiments show that AMPK exerts its effects on iodide uptake, at least partly,
through the CRE element in the NIS promoter. Furthermore, we have used AMPK-alpha1
knockout mice to determine the long-term effects of AMPK inhibition without chemical compounds.
These mice have a less active thyroid, as shown by reduced colloid volume and reduced
responsiveness to thyrotropin.

NIS expression and iodine uptake in thyrocytes

  • can be modulated by metformin and compound C.

These compounds exert their effect by

  • modulation of AMPK, which, in turn, regulates
  • the activation of the CRE element in the NIS promoter.

Overall, this suggests that AMPK modulating compounds may be useful for the
enhancement of iodide uptake by thyrocytes, which could be useful for the
treatment of thyroid cancer patients with radioactive iodine.

AMPK: Master Metabolic Regulator

© 1996–2013 themedicalbiochemistrypage.org, LLC | info
@ themedicalbiochemistrypage.org

AMPK-activating drugs metformin or phenformin might provide protection against cancer 1741-7007-11-36-5

AMPK-activating drugs metformin or phenformin might provide protection against cancer 1741-7007-11-36-5


AMPK and AMPK-related kinase (ARK) family 1741-7007-11-36-4

AMPK and AMPK-related kinase (ARK) family 1741-7007-11-36-4


central role of AMPK in the regulation of metabolism


AMP-activated protein kinase (AMPK) was first discovered as an activity that

AMPK induces a cascade of events within cells in response to the ever changing energy
charge of the cell. The role of AMPK in regulating cellular energy charge places this
enzyme at a central control point in maintaining energy homeostasis.

More recent evidence has shown that AMPK activity can also be regulated by physiological stimuli, independent of the energy charge of the cell, including hormones and nutrients.


Once activated, AMPK-mediated phosphorylation events

These events are rapidly initiated and are referred to as

  • short-term regulatory processes.

The activation of AMPK also exerts

  • long-term effects at the level of both gene expression and protein synthesis.

Other important activities attributable to AMPK are

  1. regulation of insulin synthesis and
  2. secretion in pancreatic islet β-cells and
  3. modulation of hypothalamic functions involved in the regulation of satiety.

How these latter two functions impact obesity and diabetes will be discussed below.

Regulation of AMPK

In the presence of AMP the activity of AMPK is increased approximately 5-fold.
However, more importantly is the role of AMP in regulating the level of phosphorylation
of AMPK. An increased AMP to ATP ratio leads to a conformational change in the γ-subunit
leading to increased phosphorylation and decreased dephosphorylation of AMPK.

The phosphorylation of AMPK results in activation by at least 100-fold. AMPK is
phosphorylated by at least three different upstream AMPK kinases (AMPKKs).
Phosphorylation of AMPK occurs in the α subunit at threonine 172 (T172) which

  • lies in the activation loop.

One kinase activator of AMPK is

  • Ca2+-calmodulin-dependent kinase kinase β (CaMKKβ)
  • which phosphorylates and activates AMPK in response to increased calcium.

The distribution of CaMKKβ expression is primarily in the brain with detectable levels
also found in the testes, thymus, and T cells. As described for the Ca2+-mediated
regulation of glycogen metabolism,

  • increased release of intracellular stores of Ca2+ create a subsequent demand for
    ATP.

Activation of AMPK in response to Ca fluxes

  • provides a mechanism for cells to anticipate the increased demand for ATP.

Evidence has also demonstrated that the serine-threonine kinase, LKB1 (also called
serine-threonine kinase 11, STK11) which is encoded by the Peutz-Jeghers syndrome
tumor suppressor gene, is required for activation of AMPK in response to stress.

The active LKB1 kinase is actually a complex of three proteins:

  1. LKB1,
  2. Ste20-related adaptor (STRAD) and
  3. mouse protein 25 (MO25).

Thus, the enzyme complex is often referred to as LKB1-STRAD-MO25. Phosphorylation
of AMPK by LKB1 also occurs on T172. Unlike the limited distribution of CaMKKβ,

  • LKB1 is widely expressed, thus making it the primary AMPK-regulating kinase.

Loss of LKB1 activity in adult mouse liver leads to

  • near complete loss of AMPK activity and
  • is associated with hyperglycemia.

The hyperglycemia is, in part, due to an increase in the transcription of gluconeogenic
genes. Of particular significance is the increased expression of

  • the peroxisome proliferator-activated receptor-γ (PPAR-γ) coactivator 1α
    (PGC-1α), which drives gluconeogenesis.
  • Reduction in PGC-1α activity results in normalized blood glucose levels in
    LKB1-deficient mice.

The third AMPK phosphorylating kinase is transforming growth factor-β-activated
kinase 1 (TAK1). However, the normal physiological conditions under which TAK1
phosphorylates AMPK are currently unclear.

The effects of AMP are two-fold:

  1. a direct allosteric activation and making AMPK a poorer substrate for
    dephosphorylation.

Because AMP affects both
the rate of AMPK phoshorylation in the positive direction and
dephosphorylation in the negative direction,

the cascade is ultrasensitive. This means that

  1. a very small rise in AMP levels can induce a dramatic increase in the activity of
    AMPK.

The activity of adenylate kinase, catalyzing the reaction shown below, ensures that

  • AMPK is highly sensitive to small changes in the intracellular [ATP]/[ADP] ratio.

2 ADP ——> ATP + AMP

Negative allosteric regulation of AMPK also occurs and this effect is exerted by
phosphocreatine. As indicated above, the β subunits of AMPK have a glycogen-binding domain, GBD. In muscle, a high glycogen content

  • represses AMPK activity and
  • this is likely the result of interaction between the GBD and glycogen,
  • the GBD of AMPK allows association of the enzyme with the regulation of glycogen metabolism
  • by placing AMPK in close proximity to one of its substrates glycogen synthase.

AMPK has also been shown to be activated by receptors that are coupled to

  • phospholipase C-β (PLC-β) and by
  • hormones secreted by adipose tissue (termed adipokines) such as leptinand adiponectin (discussed below).

Targets of AMPK

The signaling cascades initiated by the activation of AMPK exert effects on

  • glucose and lipid metabolism,
  • gene expression and
  • protein synthesis.

These effects are most important for regulating metabolic events in the liver, skeletal
muscle, heart, adipose tissue, and pancreas.

Demonstration of the central role of AMPK in the regulation of metabolism in response
to events such as nutrient- or exercise-induced stress. Several of the known physiologic
targets for AMPK are included as well as several pathways whose flux is affected by
AMPK activation. Arrows indicate positive effects of AMPK, whereas, T-lines indicate
the resultant inhibitory effects of AMPK action.

The uptake, by skeletal muscle, accounts for >70% of the glucose removal from the
serum in humans. Therefore, it should be obvious that this event is extremely important
for overall glucose homeostasis, keeping in mind, of course, that glucose uptake by
cardiac muscle and adipocytes cannot be excluded from consideration. An important fact
related to skeletal muscle glucose uptake is that this process is markedly impaired in
individuals with type 2 diabetes.

The uptake of glucose increases dramatically in response to stress (such as ischemia) and
exercise and is stimulated by insulin-induced recruitment of glucose transporters
to the plasma membrane, primarily GLUT4. Insulin-independent recruitment of glucose
transporters also occurs in skeletal muscle in response to contraction (exercise).

The activation of AMPK plays an important, albeit not an exclusive, role in the induction of
GLUT4 recruitment to the plasma membrane. The ability of AMPK to stimulate
GLUT4 translocation to the plasma membrane in skeletal muscle is by a different mechanism
than that stimulated by insulin and insulin and AMPK effects are additive.

Under ischemic/hypoxic conditions in the heart the activation of AMPK leads to the
phosphorylation and activation of the kinase activity of phosphofructokinase-2, PFK-2
(6-phosphofructo-2-kinase). The product of the action of PFK-2 (fructose-2,6-bisphosphate,
F2,6BP) is one of the most potent regulators of the rate of flux through
glycolysis and gluconeogenesis.

In liver the PKA-mediated phosphorylation of PFK-2 results in conversion of the
enzyme from a kinase that generates F2,6BP to a phosphatase that removes the
2-phosphate thus reducing the levels of the potent allosteric activator of the glycolytic
enzyme 6-phosphfructo-1-kinase, PFK-1 and the potent allosteric inhibitor
of the gluconeogenic enzyme fructose-1,6-bisphosphatase (F1,-6BPase).

It is important to note that like many enzymes, there are multiple isoforms of PFK-2
(at least 4) and neither the liver or the skeletal muscle isoforms contain the AMPK
phosphorylation sites found in the cardiac and inducible (iPFK2) isoforms of PFK-2.

Inducible PFK-2 is expressed in the monocyte/macrophage lineage in response to pro-
inflammatory stimuli. The ability to activate the kinase activity by phosphorylation of
PFK-2 in cardiac tissue and macrophages in response to ischemic conditions allows these
cells to continue to have a source of ATP via anaerobic glycolysis. This phenomenon is
recognized as the Pasteur effect: an increased rate of glycolysis in response to hypoxia.

Of pathological significance is the fact that the inducible form of PFK-2 is commonly
expressed in many tumor cells and this may allow AMPK to play an important role in
protecting tumor cells from hypoxic stress. Indeed, techniques for depleting AMPK in
tumor cells have shown that these cells become sensitized to nutritional stress upon loss
of AMPK activity.

Whereas, stress and exercise are powerful inducers of AMPK activity in skeletal muscle,
additional regulators of its activity have been identified.

Insulin-sensitizing drugs of the thiazolidinedione family (activators of PPAR-γ, see
below) as well as the hypoglycemia drug metformin exert a portion of their effects
through regulation of the activity of AMPK.

As indicated above, the activity of the AMPK activating kinase, LKB1, is critical for
regulating gluconeogenic flux and consequent glucose homeostasis. The action of
metformin in reducing blood glucose levels

  • requires the activity of LKB1 in the liver for this function.

Also, several adipokines (hormones secreted by adipocytes) either stimulate or inhibit
AMPK activation:

  1. leptin and adiponectin have been shown to stimulate AMPK activation, whereas,
  2. resistininhibits AMPK activation.

Cardiac effects exerted by activation of AMPK also include

AMPK-mediated phosphorylation of eNOS leads to increased activity and consequent
NO production and provides a link between metabolic stresses and cardiac function.

In platelets, insulin action leads to an increase in eNOS activity that is

  • due to its phosphorylation by AMPK.

Activation of NO production in platelets leads to

  • a decrease in thrombin-induced aggregation, thereby,
  • limiting the pro-coagulant effects of platelet activation.

The response of platelets to insulin function clearly indicates why disruption in insulin
action is a major contributing factor in the development of the metabolic syndrome

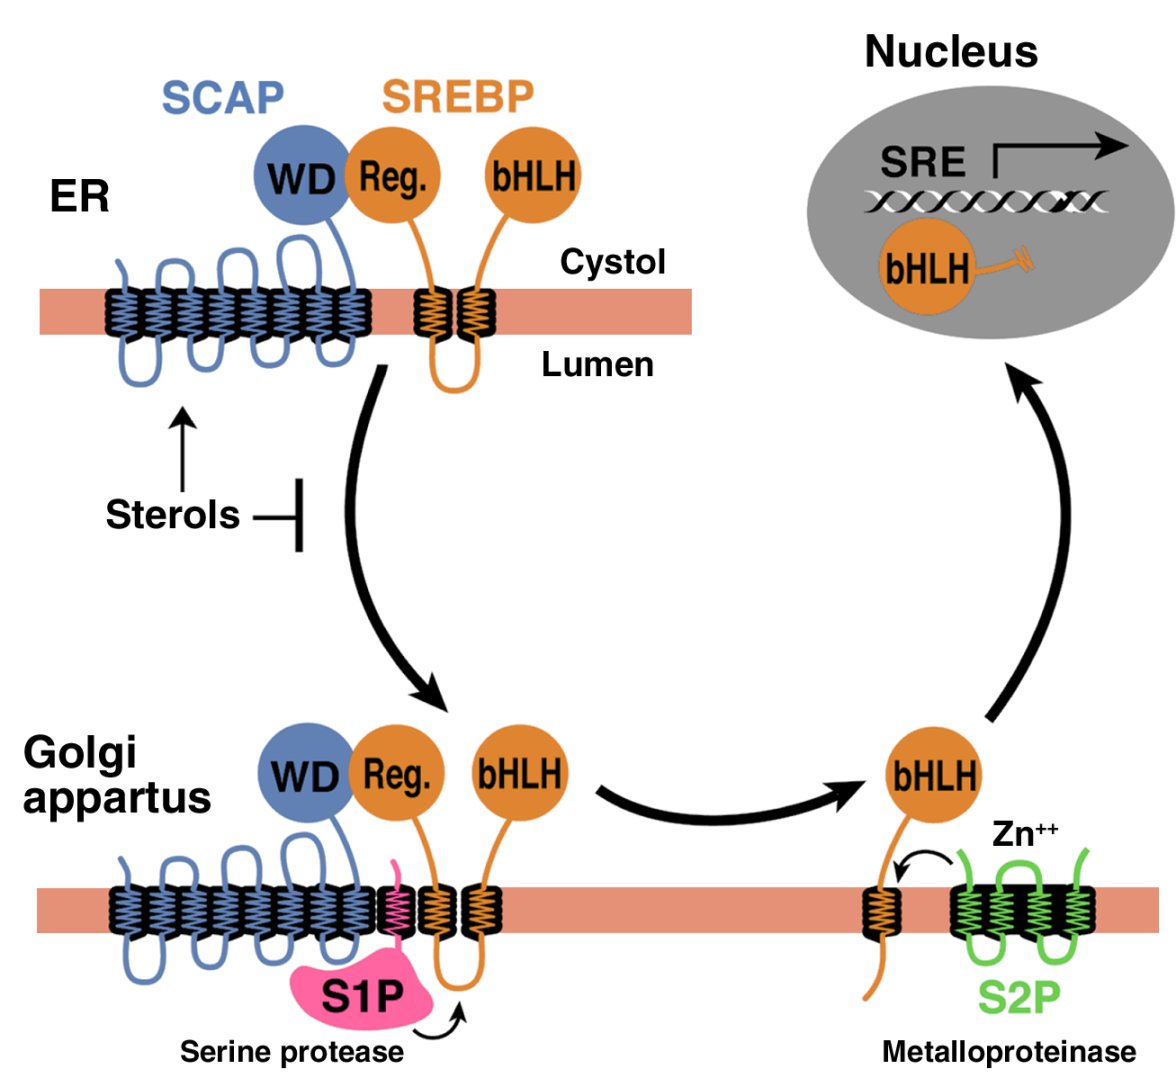
Activation of AMPK leads to a reduction in the level of SREBP

  • a transcription factor &regulator of the expression of numerous
    lipogenic enzymes

Another transcription factor reduced in response to AMPK activation is

  • hepatocyte nuclear factor 4α, HNF4α
    • a member of the steroid/thyroid hormone superfamily.
    • HNF4α is known to regulate the expression of several liver and
      pancreatic β-cell genes such as GLUT2, L-PK and preproinsulin.
  • Of clinical significance is that mutations in HNF4α are responsible for
    • maturity-onset diabetes of the young, MODY-1.

Recent evidence indicates that the gene for the carbohydrate-response-element-
binding protein (ChREBP) is a target for AMPK-mediated transcriptional regulation
in the liver. ChREBP is rapidly being recognized as a master regulator of lipid
metabolism in liver, in particular in response to glucose uptake.

The target of the thiazolidinedione (TZD) class of drugs used to treat type 2 diabetes is
the peroxisome proliferator-activated receptor γ, PPARγ which

  • itself may be a target for the action of AMPK.

The transcription co-activator, p300, is phosphorylated by AMPK

  • which inhibits interaction of p300 with not only PPARγ but also
  • the retinoic acid receptor, retinoid X receptor, and
  • thyroid hormone receptor.

PPARγ is primarily expressed in adipose tissue and thus it was difficult to reconcile how
a drug that was apparently acting only in adipose tissue could lead to improved insulin
sensitivity of other tissues. The answer to this question came when it was discovered that the TZDs stimulated the expression and release of the adipocyte hormone (adipokine),
adiponectin. Adiponectin stimulates glucose uptake and fatty acid oxidation in skeletal
muscle. In addition, adiponectin stimulates fatty acid oxidation in liver while inhibiting
expression of gluconeogenic enzymes in this tissue.

These responses to adiponectin are exerted via activation of AMPK. Another
transcription factor target of AMPK is the forkhead protein, FKHR (now referred to as
FoxO1). FoxO1 is involved in the activation of glucose-6-phosphatase expression and,
therefore, loss of FoxO1 activity in response to AMPK activation will lead to reduced
hepatic output of glucose.

This concludes a very complicated perspective that ties together the thyroid hormone
activity, the hypophysis, diabetes mellitus, and AMPK tegulation of metabolism in the
liver, skeletal muscle, adipose tissue, and heart.  I also note at this time that there
nongenetic points to be made here:

  1. The tissue specificity of isoenzymes
  2. The modulatory role of AMP:ATP ratio in phosphorylation/dephosphorylation
    effects on metabolism tied to AMPK
  3. The tie in of stress or ROS with fast reactions to protect harm to tissues
  4. The relationship of cytokine activation and release to the above metabolic events
  5. The relationship of effective and commonly used diabetes medications to AMPK
    mediated processes
  6. The preceding presentation is notable for the importance of proteomic and
    metabolomic invetigations in elucidation common chronic and nongenetic diseases


Read Full Post »

A Future for Plasma Metabolomics in Cardiovascular Disease Assessment

Curator: Larry H Bernstein, MD, FCAP


Plasma metabolomics reveals a potential panel of biomarkers for early diagnosis
in acute coronary syndrome  

CM. Laborde, L Mourino-Alvarez, M Posada-Ayala,
G Alvarez-Llamas, MG Serranillos-Reus, et al.
Metabolomics – manuscript draft

In this study, analyses of peripheral plasma from Non-ST Segment Elevation
Acute Coronary Syndrome patients and healthy controls by gas chromatography-
mass spectrometry permitted the identification of 15 metabolites with statistical
differences (p<0.05) between experimental groups.
In our study, 6 amino acids were found decreased in NSTEACS patients when
compared with healthy control group suggesting either a decrease in anabolic
activity of these metabolites or an increase in the catabolic pathways. Of both
possibilities, the increased catabolism of the amino acids can be explained
considering simultaneously the capacity of glycogenic and ketogenic amino
acids along with the gradual hypoxic condition to which cardiac muscle cells
have been exposed.

Additionally, validation by gas chromatography-mass spectrometry and liquid
chromatography-mass spectrometry permitted us to identify a potential panel
of biomarkers formed by 5-OH tryptophan, 2-OH-butyric acid and 3-OH-butyric
acid. Oxidative stress conditions dramatically increase the rate of hepatic
synthesis of glutathione. It is synthesized from the amino acids cysteine, glutamic
acid and glycine. Under these conditions of metabolic stress, the supply of cysteine
for glutathione synthesis become limiting and homocysteine is used to form
cystathionine, which is cleaved to cysteine and 2-OH-butyric acid. Thus elevated
plasma levels of 2-OH-butyric acid can be a good biomarker of cellular oxidative
stress for the early diagnosis of ACS.  Another altered metabolite of similar
structure was 3-OH-butyric acid, a ketone body together with the acetoacetate,
and acetone. Elevated levels of ketone bodies in blood and urine mainly occur
in diabetic ketoacidosis. Type 1 diabetes mellitus (DMI) patients have decreased
levels of insulin in the blood that prevent glucose enter cells so these cells use
the catabolism of fats as energy source that produce ketones as final products.
This panel of biomarkers reflects the oxidative stress and the hypoxic state that
disrupts the myocardial cells and consequently constitutes a metabolomic
signature that could be used for early diagnosis of acute coronary syndrome.
We hypothesize that the hypoxia situation comes to “mimic” the physiological
situation that occurs in DMI. In this case, the low energy yield of glucose
metabolism “forces” these cells to use fat as energy source (through catabolism
independent of aerobic/anaerobic conditions) occurring ketones as final
products. In our experiment, the 3-OH-butyric acid was strongly elevated in
NSTEACS patients.


Current Methods Used in the Protein Carbonyl Assay
Nicoleta Carmen Purdel, Denisa Margina and Mihaela Ilie.
Ann Res & Rev in Biol 2014; 4(12): 2015-2026.
http://www.sciencedomain.org/download.php?f=Purdel4122013ARRB8763-1

The attack of reactive oxygen species on proteins and theformation of
protein carbonyls were investigated only in the recent years. Taking into
account that protein carbonyls may play an important role in the early
diagnosis of pathologies associated with reactive oxygen species
overproduction, a robust and reliable method to quantify the protein
carbonyls in complex biological samples is also required. Oxidative
stress represents the aggression produced at the molecular level by
the imbalance between pro-oxidant and antioxidant agents, in favor of
pro-oxidants, with severe functional consequences in all organs and
tissues. An overproduction of ROS results in oxidative damages
especially to proteins (the main target of ROS), as well as in lipids,or
DNA. Glycation and oxidative stress are closely linked, and both
phenomena are referred to as ‘‘glycoxidation’’. All steps of glycoxidation
generate oxygen-free radical production, some of them being common
with lipidic peroxidation pathways.
The initial glycation reaction is followed by a cascade of chemical
reactions resulting in the formation of intermediate products (Schiff base,
Amadori and Maillard products) and finally to a variety of derivatives
named advanced glycation end products (AGEs). In hyperglycemic
environments and in natural aging, AGEs are generated in increased
concentrations; their levels can be evaluated in plasma due to the fact
that they are fluorescent compounds. Specific biomarkers of oxidative
stress are currently investigated in order to evaluate the oxidative status
of a biological system and/or its regenerative power. Generaly, malondi-
aldehyde, 4-hydroxy-nonenal (known together as thiobarbituric acid
reactive substances – TBARS), 2-propenal and F2-isoprostanes are
investigated as markers of lipid peroxidation, while the measurement
of protein thiols, as well as S-glutathionylated protein are assessed
as markers of oxidative damage of proteins. In most cases, the
oxidative damage of the DNA has 8-hydroxy-2l-deoxyguanosine
(8-OHdG) as a marker.  The oxidative degradation of proteins plays an
important role in the early diagnosis of pathologies associated with
ROS overproduction. Oxidative modification of the protein structure
may take a variety of forms, including the nitration of tyrosine residues,
carbonylation, oxidation of methionine, or thiol groups, etc.

The carbonylation of protein represents the introduction of carbonyl
groups (aldehyde or ketone) in the protein structure, through several
mechanisms: by direct oxidation of the residues of lysine, arginine,
proline and threonine residues from the protein chain, by interaction
with lipid peroxidation products with aldehyde groups (such as 4-
hydroxy-2-nonenal, malondialdehyde, 2-propenal), or by the
interaction with the compounds with the carbonyl groups resulting
from the degradation of the lipid or glycoxidation. All of these
molecular changes occur under oxidative stress conditions.
There is a pattern of carbonylation, meaning that only certain
proteins can undergo this process and protein structure determines
the preferential sites of carbonylation. The most investigated
carbonyl derivates are represented by gamma-glutamic
semialdehyde (GGS) generated from the degradation of arginine
residue and α-aminoadipic semialdehyde (AAS) derived from lysine.

A number of studies have shown that the generation of protein
carbonyl groups is associated with normal cellular phenomena like
apoptosis, and cell differentiation and is dependent on age, species
and habits (eg. smoking) or severe conditions’ exposure (as
starvation or stress). The formation and accumulation of protein
carbonyls is increased in various human diseases, including –
diabetes and cardiovascular disease.

Recently, Nystrom [7] suggested that the carbonylation process
is associated with the physiological and not to the chronological
age of the organism and the carbonylation may be one of the causes
of aging and cell senescence; therefore it can be used as the marker
of these processes. Jha and Rizvi, [15] proposed the quantification of
protein carbonyls in the erythrocyte membrane as a biomarker of aging

PanelomiX: A threshold-based algorithm to create panels of
biomarkers

X Robin, N Turck, A Hainard, N Tiberti, F Lisacek. 
T r a n s l a t i o n a l  P r o t e o m i c s   2 0 1 3; 1: 57–64.
http://dx.doi.org/10.1016/j.trprot.2013.04.003

The computational toolbox we present here – PanelomiX – uses
the iterative combination of biomarkers and thresholds (ICBT) method.
This method combines biomarkers andclinical scores by selecting
thresholds that provide optimal classification performance. Tospeed
up the calculation for a large number of biomarkers, PanelomiX selects
a subset ofthresholds and parameters based on the random forest method.
The panels’ robustness and performance are analysed by cross-validation
(CV) and receiver operating characteristic(ROC) analysis.

Using 8 biomarkers, we compared this method against classic
combination procedures inthe determination of outcome for 113 patients
with an aneurysmal subarachnoid hemorrhage. The panel classified the
patients better than the best single biomarker (p < 0.005) and compared
favourably with other off-the-shelf classification methods.

In conclusion, the PanelomiX toolbox combines biomarkers and evaluates
the performance of panels to classify patients better than single markers
or other classifiers. The ICBT algorithm proved to be an efficient classifier,
the results of which can easily be interpreted. 

Multiparametric diagnostics of cardiomyopathies by microRNA
signatures.
CS. Siegismund, M Rohde, U Kühl,  D  Lassner.
Microchim Acta 2014 Mar.
http://dx.doi.org:/10.1007/s00604-014-1249-y

MicroRNAs (miRNAs) represent a new group of stable biomarkers
that are detectable both in tissue and body fluids. Such miRNAs
may serve as cardiological biomarkers to characterize inflammatory
processes and to differentiate various forms of infection. The predictive
power of single miRNAs for diagnosis of complex diseases may be further
increased if several distinctly deregulated candidates are combined to
form a specific miRNA signature. Diagnostic systems that generate
disease related miRNA profiles are based on microarrays, bead-based
oligo sorbent assays, or on assays based on real-time polymerase
chain reactions and placed on microfluidic cards or nanowell plates.
Multiparametric diagnostic systems that can measure differentially
expressed miRNAs may become the diagnostic tool of the future due
to their predictive value with respect to clinical course, therapeutic
decisions, and therapy monitoring.

Nutritional lipidomics: Molecular metabolism, analytics, and
diagnostics
JT. Smilowitz, AM. Zivkovic, Yu-Jui Y Wan, SM. Watkins, et al.
Mol. Nutr. Food Res. 2013, 00, 1–17.
http://dx.doi.org:/10.1002/mnfr.201200808

The term lipidomics is quite new, first appearing in 2001. Its definition
is still being debated, from “the comprehensive analysis of all lipid
components in a biological sample” to “the full characterization of
lipid molecular species and their biological roles with respect to the
genes that encode proteins that regulate lipid metabolism”. In principle,
lipidomics is a field taking advantage of the innovations in the separation
sciences and MS together with bioinformatics to characterize the lipid
compositions of biological samples (biofluids, cells, tissues, organisms)
compositionally and quantitatively.

Biochemical pathways of lipid metabolism remain incomplete and the
tools to map lipid compositional data to pathways are still being assembled.
Biology itself is dauntingly complex and simply separating biological
structures remains a key challenge to lipidomics. Nonetheless, the
strategy of combining tandem analytical methods to perform the sensitive,
high-throughput, quantitative, and comprehensive analysis of lipid
metabolites of very large numbers of molecules is poised to drive
the field forward rapidly. Among the next steps for nutrition to understand
the changes in structures, compositions, and function of lipid biomolecules
in response to diet is to describe their distribution within discrete functional
compartments lipoproteins. Additionally, lipidomics must tackle the task
of assigning the functions of lipids as signaling molecules, nutrient sensors,
and intermediates of metabolic pathways.

Read Full Post »

Metabolomics, Metabonomics and Functional Nutrition: the next step in nutritional metabolism and biotherapeutics

Metabolomics, Metabonomics and Functional Nutrition: the next step in nutritional metabolism and biotherapeutics

Reviewer and Curator: Larry H. Bernstein, MD, FCAP 


The human genome is estimated to encode over 30,000 genes, and to be responsible for generating more than 100,000 functionally distinct proteins. Understanding the interrelationships among

  1. genes,
  2. gene products, and
  3. dietary habits

is fundamental to identifying those who will benefit most from or be placed at risk by intervention strategies.

Unraveling the multitude of

  • nutrigenomic,
  • proteomic, and
  • metabolomic patterns

that arise from the ingestion of foods or their

  • bioactive food components

will not be simple but is likely to provide insights into a tailored approach to diet and health. The use of new and innovative technologies, such as

  • microarrays,
  • RNA interference, and
  • nanotechnologies,

will provide needed insights into molecular targets for specific bioactive food components and

  • how they harmonize to influence individual phenotypes(1).

Nutrigenetics asks the question how individual genetic disposition, manifesting as

  • single nucleotide polymorphisms,
  • copy-number polymorphisms and
  • epigenetic phenomena,

affects susceptibility to diet.

Nutrigenomics addresses the inverse relationship, that is how diet influences

  • gene transcription,
  • protein expression and
  • metabolism.

A major methodological challenge and first pre-requisite of nutrigenomics is integrating

  • genomics (gene analysis),
  • transcriptomics (gene expression analysis),
  • proteomics (protein expression analysis) and
  • metabonomics (metabolite profiling)

to define a “healthy” phenotype. The long-term deliverable of nutrigenomics is personalised nutrition (2).

Science is beginning to understand how genetic variation and epigenetic events

  • alter requirements for, and responses to, nutrients (nutrigenomics).

At the same time, methods for profiling almost all of the products of metabolism in a single sample of blood or urine are being developed (metabolomics). Relations between

  • diet and nutrigenomic and metabolomic profiles and
  • between those profiles and health

have become important components of research that could change clinical practice in nutrition.

Most nutrition studies assume that all persons have average dietary requirements, and the studies often

  • do not plan for a large subset of subjects who differ in requirements for a nutrient.

Large variances in responses that occur when such a population exists

  • can result in statistical analyses that argue for a null effect.

If nutrition studies could better identify responders and differentiate them from nonresponders on the basis of nutrigenomic or metabolomic profiles,

  • the sensitivity to detect differences between groups could be greatly increased, and
  • the resulting dietary recommendations could be appropriately targeted (3).

In recent years, nutrition research has moved from classical epidemiology and physiology to molecular biology and genetics. Following this trend,

  • Nutrigenomics has emerged as a novel and multidisciplinary research field in nutritional science that
  • aims to elucidate how diet can influence human health.

It is already well known that bioactive food compounds can interact with genes affecting

  • transcription factors,
  • protein expression and
  • metabolite production.

The study of these complex interactions requires the development of

  • advanced analytical approaches combined with bioinformatics.

Thus, to carry out these studies

  • Transcriptomics,
  • Proteomics and
  • Metabolomics

approaches are employed together with an adequate integration of the information that they provide(4).

Metabonomics is a diagnostic tool for metabolic classification of individuals with the asset of quantitative, non-invasive analysis of easily accessible human body fluids such as urine, blood and saliva. This feature also applies to some extent to Proteomics, with the constraint that

  • the latter discipline is more complex in terms of composition and dynamic range of the sample.

Apart from addressing the most complex “Ome”, Proteomics represents

  • the only platform that delivers not only markers for disposition and efficacy
  • but also targets of intervention.

Application of integrated Omic technologies will drive the understanding of

  • interrelated pathways in healthy and pathological conditions and
  • will help to define molecular ‘switchboards’,
  • necessary to develop disease related biomarkers.

This will contribute to the development of new preventive and therapeutic strategies for both pharmacological and nutritional interventions (5).

Human health is affected by many factors. Diet and inherited genes play an important role. Food constituents,

  • including secondary metabolites of fruits and vegetables, may
  • interact directly with DNA via methylation and changes in expression profiles (mRNA, proteins)
  • which results in metabolite content changes.

Many studies have shown that

  • food constituents may affect human health and
  • the exact knowledge of genotypes and food constituent interactions with
  • both genes and proteins may delay or prevent the onset of diseases.

Many high throughput methods have been employed to get some insight into the whole process and several examples of successful research, namely in the field of genomics and transcriptomics, exist. Studies on epigenetics and RNome significance have been launched. Proteomics and metabolomics need to encompass large numbers of experiments and linked data. Due to the nature of the proteins, as well as due to the properties of various metabolites, experimental approaches require the use of

  • comprehensive high throughput methods and a sufficiency of analysed tissue or body fluids (6).

New experimental tools that investigate gene function at the subcellular, cellular, organ, organismal, and ecosystem level need to be developed. New bioinformatics tools to analyze and extract meaning

  • from increasingly systems-based datasets will need to be developed.

These will require, in part, creation of entirely new tools. An important and revolutionary aspect of “The 2010 Project”  is that it implicitly endorses

  • the allocation of resources to attempts to assign function to genes that have no known function.

This represents a significant departure from the common practice of defining and justifying a scientific goal based on the biological phenomena. The rationale for endorsing this radical change is that

  • for the first time it is feasible to envision a whole-systems approach to gene and protein function.

This whole-systems approach promises to be orders of magnitude more efficient than the conventional approach (7).

The Institute of Medicine recently convened a workshop to review the state of the various domains of nutritional genomics research and policy and to provide guidance for further development and translation of this knowledge into nutrition practice and policy (8). Nutritional genomics holds the promise to revolutionize both clinical and public health nutrition practice and facilitate the establishment of

(a) genome-informed nutrient and food-based dietary guidelines for disease prevention and healthful aging,

(b) individualized medical nutrition therapy for disease management, and

(c) better targeted public health nutrition interventions (including micronutrient fortification and supplementation) that

  • maximize benefit and minimize adverse outcomes within genetically diverse human populations.

As the field of nutritional genomics matures, which will include filling fundamental gaps in

  • knowledge of nutrient-genome interactions in health and disease and
  • demonstrating the potential benefits of customizing nutrition prescriptions based on genetics,
  • registered dietitians will be faced with the opportunity of making genetically driven dietary recommendations aimed at improving human health.

The new era of nutrition research translates empirical knowledge to evidence-based molecular science (9). Modern nutrition research focuses on

  • promoting health,
  • preventing or delaying the onset of disease,
  • optimizing performance, and
  • assessing risk.

Personalized nutrition is a conceptual analogue to personalized medicine and means adapting food to individual needs. Nutrigenomics and nutrigenetics

  • build the science foundation for understanding human variability in
  • preferences, requirements, and responses to diet and
  • may become the future tools for consumer assessment

motivated by personalized nutritional counseling for health maintenance and disease prevention.

The primary aim of ―omic‖ technologies is

  • the non-targeted identification of all gene products (transcripts, proteins, and metabolites) present in a specific biological sample.

By their nature, these technologies reveal unexpected properties of biological systems.

A second and more challenging aspect of ―omic‖ technologies is

  • the refined analysis of quantitative dynamics in biological systems (10).

For metabolomics, gas and liquid chromatography coupled to mass spectrometry are well suited for coping with

  • high sample numbers in reliable measurement times with respect to
  • both technical accuracy and the identification and quantitation of small-molecular-weight metabolites.

This potential is a prerequisite for the analysis of dynamic systems. Thus, metabolomics is a key technology for systems biology.

In modern nutrition research, mass spectrometry has developed into a tool

  • to assess health, sensory as well as quality and safety aspects of food.

In this review, we focus on health-related benefits of food components and, accordingly,

  • on biomarkers of exposure (bioavailability) and bioefficacy.

Current nutrition research focuses on unraveling the link between

  • dietary patterns,
  • individual foods or
  • food constituents and

the physiological effects at cellular, tissue and whole body level

  • after acute and chronic uptake.

The bioavailability of bioactive food constituents as well as dose-effect correlations are key information to understand

  • the impact of food on defined health outcomes.

Both strongly depend on appropriate analytical tools

  • to identify and quantify minute amounts of individual compounds in highly complex matrices–food or biological fluids–and
  • to monitor molecular changes in the body in a highly specific and sensitive manner.

Based on these requirements,

  • mass spectrometry has become the analytical method of choice
  • with broad applications throughout all areas of nutrition research (11).

Recent advances in high data-density analytical techniques offer unrivaled promise for improved medical diagnostics in the coming decade. Genomics, proteomics and metabonomics (as well as a whole slew of less well known ―omics‖ technologies) provide a detailed descriptor of each individual. Relating the large quantity of data on many different individuals to their current (and possibly even future) phenotype is a task not well suited to classical multivariate statistics. The datasets generated by ―omics‖ techniques very often violate the requirements for multiple regression. However, another statistical approach exists, which is already well established in areas such as medicinal chemistry and process control, but which is new to medical diagnostics, that can overcome these problems. This approach, called megavariate analysis (MVA),

  • has the potential to revolutionise medical diagnostics in a broad range of diseases.

It opens up the possibility of expert systems that can diagnose the presence of many different diseases simultaneously, and

  • even make exacting predictions about the future diseases an individual is likely to suffer from (12).

Cardiovascular diseases

Cardiovascular diseases are the leading cause of morbidity and mortality in Western countries. Although coronary thrombosis is the final event in acute coronary syndromes,

  • there is increasing evidence that inflammation also plays a role in development of atherosclerosis and its clinical manifestations, such as
  • myocardial infarction, stroke, and peripheral vascular disease.

The beneficial cardiovascular health effects of

  • diets rich in fruits and vegetables are in part mediated by their flavanol content.

This concept is supported by findings from small-scale intervention studies with surrogate endpoints including

  1. endothelium-dependent vasodilation,
  2. blood pressure,
  3. platelet function, and
  4. glucose tolerance.

Mechanistically, short term effects on endothelium-dependent vasodilation

  • following the consumption of flavanol-rich foods, as well as purified flavanols,
  • have been linked to an increased nitric oxide bioactivity.

The critical biological target(s) for flavanols have yet to be identified (13), but we are beginning to see over the horizon.

Nutritional sciences

Nutrition sciences apply

  1. transcriptomics,
  2. proteomics and
  3. metabolomics

to molecularly assess nutritional adaptations.

Transcriptomics can generate a

  • holistic overview on molecular changes to dietary interventions.

Proteomics is most challenging because of the higher complexity of proteomes as compared to transcriptomes and metabolomes. However, it delivers

  • not only markers but also
  • targets of intervention, such as
  • enzymes or transporters, and
  • it is the platform of choice for discovering bioactive food proteins and peptides.

Metabolomics is a tool for metabolic characterization of individuals and

  • can deliver metabolic endpoints possibly related to health or disease.

Omics in nutrition should be deployed in an integrated fashion to elucidate biomarkers

  • for defining an individual’s susceptibility to diet in nutritional interventions and
  • for assessing food ingredient efficacy (14).

The more elaborate tools offered by metabolomics opened the door to exploring an active role played by adipose tissue that is affected by diet, race, sex, and probably age and activity. When the multifactorial is brought into play, and the effect of changes in diet and activities studied we leave the study of metabolomics and enter the world of ―metabonomics‖. Adiponectin and adipokines arrive (15-22). We shall discuss ―adiposity‖ later.

Potential Applications of Metabolomics

Either individually or grouped as a profile, metabolites are detected by either

  • nuclear magnetic resonance spectroscopy or mass spectrometry.

There is potential for a multitude of uses of metabolome research, including

  1. the early detection and diagnosis of cancer and as
  2. both a predictive and pharmacodynamic marker of drug effect.

However, the knowledge regarding metabolomics, its technical challenges, and clinical applications is unappreciated

  • even though when used as a translational research tool,
  • it can provide a link between the laboratory and clinic.

Precise numbers of human metabolites is unknown, with estimates ranging from the thousands to tens of thousands. Metabolomics is a term that encompasses several types of analyses, including

(a) metabolic fingerprinting, which measures a subset of the whole profile with little differentiation or quantitation of metabolites;

(b) metabolic profiling, the quantitative study of a group of metabolites, known or unknown, within or associated with a particular metabolic pathway; and

(c) target isotope-based analysis, which focuses on a particular segment of the metabolome by analyzing

  • only a few selected metabolites that comprise a specific biochemical pathway.


Dynamic Construct of the –Omics

Dynamic Construct of the –Omics


Dynamic Construct of the –Omics


Iron metabolism – Anemia

Hepcidin is a key hormone governing mammalian iron homeostasis and may be directly or indirectly involved in the development of most iron deficiency/overload and inflammation-induced anemia. The anemia of chronic disease (ACD) is characterized by macrophage iron retention induced by cytokines and hepcidin regulation. Hepcidin controls cellular iron efflux on binding to the iron export protein ferroportin. While patients present with both ACD and iron deficiency anemia (ACD/IDA), the latter results from chronic blood loss. Iron retention during inflammation occurs in macrophages and the spleen, but not in the liver. In ACD, serum hepcidin concentrations are elevated, which is related to reduced duodenal and macrophage expression of ferroportin. Individuals with ACD/IDA have significantly lower hepcidin levels than ACD subjects. ACD/IDA patients, in contrast to ACD subjects, were able to absorb dietary iron from the gut and to mobilize iron from macrophages. Hepcidin elevation may affect iron transport in ACD and ACD/IDA and it is more responsive to iron demand with IDA than to inflammation. Hepcidin determination may aid in selecting appropriate therapy for these patients (23).

There is correlation between serum hepcidin, iron and inflammatory indicators associated with anemia of chronic disease (ACD), ACD, ACD concomitant iron-deficiency anemia (ACD/IDA), pure IDA and acute inflammation (AcI) patients. Hepcidin levels in anemia types were statistically different, from high to low: ACD, AcI > ACD/IDA > the control > IDA. Serum ferritin levels were significantly increased in ACD and AcI patients but were decreased significantly in ACD/IDA and IDA. Elevated serum EPO concentrations were found in ACD, ACD/IDA and IDA patients but not in AcI patients and the controls. A positive correlation exists between hepcidin and IL-6 levels only in ACD/IDA, AcI and the control groups. A positive correlation between hepcidin and ferritin was marked in the control group, while a negative correlation between hepcidin and ferritin was noted in IDA. The significant negative correlation between hepcidin expression and reticulocyte count was marked in both ACD/IDA and IDA groups. If the hepcidin role in pathogenesis of ACD, ACD/IDA and IDA, it could be a potential marker for detection and differentiation of these anemias (24).

Cancer

Because cancer cells are known to possess a highly unique metabolic phenotype, development of specific biomarkers in oncology is possible and might be used in identifying fingerprints, profiles, or signatures to detect the presence of cancer, determine prognosis, and/or assess the pharmacodynamic effects of therapy (25).

HDM2, a negative regulator of the tumor suppressor p53, is over-expressed in many cancers that retain wild-type p53. Consequently, the effectiveness of chemotherapies that induce p53 might be limited, and inhibitors of the HDM2–p53 interaction are being sought as tumor-selective drugs. A binding site within HDM2 has been dentified which can be blocked with peptides inducing p53 transcriptional activity. A recent report demonstrates the principle using drug-like small molecules that target HDM2 (26).

Obesity, CRP, interleukins, and chronic inflammatory disease

Elevated CRP levels and clinically raised CRP levels were present in 27.6% and 6.7% of the population, respectively. Both overweight (body mass index [BMI], 25-29.9 kg/m2) and obese (BMI, 30 kg/m2) persons were more likely to have elevated CRP levels than their normal-weight counterparts (BMI, <25 kg/m2). After adjusting for potential confounders, the odds ratio (OR) for elevated CRP was 2.13 for obese men and 6.21 for obese women. In addition, BMI was associated with clinically raised CRP levels in women, with an OR of 4.76 (95% CI, 3.42-6.61) for obese women. Waist-to-hip ratio was positively associated with both elevated and clinically raised CRP levels, independent of BMI. Restricting the analyses to young adults (aged 17-39 years) and excluding smokers, persons with inflammatory disease, cardiovascular disease, or diabetes mellitus and estrogen users did not change the main findings (27).

A study of C-reactive protein and interleukin-6 with measures of obesity and of chronic infection as their putative determinants related levels of C-reactive protein and interleukin-6 to markers of the insulin resistance syndrome and of endothelial dysfunction. Levels of C-reactive protein were significantly related to those of interleukin-6 (r=0.37, P<0.0005) and tumor necrosis factor-a (r=0.46, P<0.0001), and concentrations of C-reactive protein were related to insulin resistance as calculated from the homoeostasis model and to markers of endothelial dysfunction (plasma levels of von Willebrand factor, tissue plasminogen activator, and cellular fibronectin). A mean standard deviation score of levels of acute phase markers correlated closely with a similar score of insulin resistance syndrome variables (r=0.59, P<0.00005) and the data suggested that adipose tissue is an important determinant of a low level, chronic inflammatory state as reflected by levels of interleukin-6, tumor necrosis factor-a, and C-reactive protein (28).

A number of other studies have indicated the inflammatory ties of visceral obesity to adipose tissue metabolic profiles, suggesting a role in ―metabolic syndrome‖. There is now a concept of altered liver metabolism in ―non-alcoholic‖ fatty liver disease (NAFLD) progressing from steatosis to steatohepatitis (NASH) (31,32).

These unifying concepts were incomprehensible 50 years ago. It was only known that insulin is anabolic and that insulin deficiency (or resistance) would have consequences in the point of entry into the citric acid cycle, which generates 16 ATPs. In fat catabolism, triglycerides are hydrolyzed to break them into fatty acids and glycerol. In the liver the glycerol can be converted into glucose via dihydroxyacetone phosphate and glyceraldehyde-3-phosphate by way of gluconeogenesis. In the case of this cycle there is a tie in with both catabolism and anabolism.


TCA_reactions

TCA_reactions

 http://www.newworldencyclopedia.org/entry/Image:TCA_reactions.gif


For bypass of the Pyruvate Kinase reaction of Glycolysis, cleavage of 2 ~P bonds is required. The free energy change associated with cleavage of one ~P bond of ATP is insufficient to drive synthesis of phosphoenolpyruvate (PEP), since PEP has a higher negative G of phosphate hydrolysis than ATP.

The two enzymes that catalyze the reactions for bypass of the Pyruvate Kinase reaction are the following:

(a) Pyruvate Carboxylase (Gluconeogenesis) catalyzes:

pyruvate + HCO3 + ATP — oxaloacetate + ADP + Pi

(b) PEP Carboxykinase (Gluconeogenesis) catalyzes:

oxaloacetate + GTP — phosphoenolpyruvate + GDP + CO2

The concept of anomalies in the pathways with respect to diabetes was sketchy then, and there was much to be filled in. This has been substantially done, and is by no means complete. However, one can see how this comes into play with diabetic ketoacidosis accompanied by gluconeogenesis and in severe injury or sepsis with peripheral proteolysis to provide gluconeogenic precursors. The reprioritization of liver synthetic processes is also brought into play with the conundrum of protein-energy malnutrition.

The picture began to be filled in with the improvements in technology that emerged at the end of the 1980s with the ability to profile tissue and body fluids by NMR and by MS. There was already a good inkling of a relationship of type 2 diabetes to major indicators of CVD (29,30). And a long suspected relationship between obesity and type 2 diabetes was evident. But how did it tie together?

End Stage Renal Disease and Cardiovascular Risk

Mortality is markedly elevated in patients with end-stage renal disease. The leading cause of death is cardiovascular disease.

As renal function declines,

  • the prevalence of both malnutrition and cardiovascular disease increase.

Malnutrition and vascular disease correlate with the levels of

  • markers of inflammation in patients treated with dialysis and in those not yet on dialysis.

The causes of inflammation are likely to be multifactorial. CRP levels are associated with cardio-vascular risk in the general population.

The changes in endothelial cell function,

  • in plasma proteins, and
  • in lpiids in inflammation

are likely to be atherogenic.

That cardiovascular risk is inversely correlated with serum cholesterol in dialysis patients, suggests that

  • hyperlipidemia plays a minor role in the incidence of cardiovascular disease.

Hypoalbuminemia, ascribed to malnutrition, has been one of the most powerful risk factors that predict all-cause and cardiovascular mortality in dialysis patients. The presence of inflammation, as evidenced by increased levels of specific cytokines (interleukin-6 and tumor necrosis factor a) or acute-phase proteins (C-reactive protein and serum amyloid A), however, has been found to be associated with vascular disease in the general population as well as in dialysis patients. Patients have

  • loss of muscle mass and changes in plasma composition—decreases in serum albumin, prealbumin, and transferrin levels, also associated with malnutrition.

Inflammation alters

  • lipoprotein structure and function as well as
  • endothelial structure and function

to favor atherogenesis and increases

  • the concentration of atherogenic proteins in serum.

In addition, proinflammatory compounds, such as

  • advanced glycation end products, accumulate in renal failure, and
  • defense mechanisms against oxidative injury are reduced,

contributing to inflammation and to its effect on the vascular endothelium (33,34).

Endogenous copper can play an important role in postischemic reperfusion injury, a condition associated with endothelial cell activation and increased interleukin 8 (IL-8) production. Excessive endothelial IL-8 secreted during trauma, major surgery, and sepsis may contribute to the development of systemic inflammatory response syndrome (SIRS), adult respiratory distress syndrome (ARDS), and multiple organ failure (MOF). No previous reports have indicated that copper has a direct role in stimulating human endothelial IL-8 secretion. Copper did not stimulate secretion of other cytokines. Cu(II) appeared to be the primary copper ion responsible for the observed increase in IL-8 because a specific high-affinity Cu(II)-binding peptide, d-Asp-d-Ala-d-Hisd-Lys (d-DAHK), completely abolished this effect in a dose-dependent manner. These results suggest that Cu(II) may induce endothelial IL-8 by a mechanism independent of known Cu(I) generation of reactive oxygen species (35).

Blood coagulation plays a key role among numerous mediating systems that are activated in inflammation. Receptors of the PAR family serve as sensors of serine proteinases of the blood clotting system in the target cells involved in inflammation. Activation of PAR_1 by thrombin and of PAR_2 by factor Xa leads to a rapid expression and exposure on the membrane of endothelial cells of both adhesive proteins that mediate an acute inflammatory reaction and of the tissue factor that initiates the blood coagulation cascade. Other receptors that can modulate responses of the cells activated by proteinases through PAR receptors are also involved in the association of coagulation and inflammation together with the receptors of the PAR family. The presence of PAR receptors on mast cells is responsible for their reactivity to thrombin and factor Xa , essential to the inflammation and blood clotting processes (36).

The understanding of regulation of the inflammatory process in chronic inflammatory diseases is advancing.

Evidence consistently indicates that T-cells play a key role in initiating and perpetuating inflammation, not only via the production of soluble mediators but also via cell/cell contact interactions with a variety of cell types through membrane receptors and their ligands. Signalling through CD40 and CD40 ligand is a versatile pathway that is potently involved in all these processes. Many inflammatory genes relevant to atherosclerosis are influenced by the transcriptional regulator nuclear factor κ B (NFκB). In these events T-cells become activated by dendritic cells or inflammatory cytokines, and these T-cells activate, in turn, monocytes / macrophages, endothelial cells, smooth muscle cells and fibroblasts to produce pro-inflammatory cytokines, chemokines, the coagulation cascade in vivo, and finally matrix metalloproteinases, responsible for tissue destruction. Moreover, CD40 ligand at inflammatory sites stimulates fibroblasts and tissue monocyte/macrophage production of VEGF, leading to angiogenesis, which promotes and maintains the chronic inflammatory process.

NFκB plays a pivotal role in co-ordinating the expression of genes involved in the immune and inflammatory response, evoking tumor necrosis factor α (TNFα), chemokines such as monocyte chemoattractant protein-1 (MCP-1) and interleukin (IL)-8, matrix metalloproteinase enzymes (MMP), and genes involved in cell survival. A complex array of mechanisms, including T cell activation, leukocyte extravasation, tissue factor expression, MMP expression and activation, as well induction of cytokines and chemokines, implicated in atherosclerosis, are regulated by NFκB.

Expression of NFκB in the atherosclerotic milieu may have a number of potentially harmful consequences. IL-1 activates NFκB upregulating expression of MMP-1, -3, and -9. Oxidized LDL increases macrophage MMP-9, associated with increased nuclear binding of NFκB and AP-1. Expression of tissue factor, initiating the coagulation cascade, is regulated by NFκB. In atherosclerotic plaque cells, tissue factor antigen and activity were inhibited following over-expression of IκBα and dominant-negative IKK-2, but not by dominant negative IKK-1 or NIK. Tis supports the concept that activation of the ―canonical‖ pathway upregulates pro-thrombotic mediators involved in disease. Many of the cytokines and chemokines which have been detected in human atherosclerotic plaques are also regulated by NFκB. Over-expression of IκBα inhibits release of TNFα, IL-1, IL-6, and IL-8 in macrophages stimulated with LPS and CD40 ligand (CD40L). This report describes how NFκB activation upregulates major pro-inflammatory and pro-thrombotic mediators of atherosclerosis (37-41).

This review is both focused and comprehensive. The details of evolving methods are avoided in order to build the argument that a very rapid expansion of discovery has been evolving depicting disease, disease mechanisms, disease associations, metabolic biomarkers, study of effects of diet and diet modification, and opportunities for targeted drug development. The extent of future success will depend on the duration and strength of the developed interventions, and possibly the avoidance of dead end interventions that are unexpectedly bypassed. I anticipate the prospects for the interplay between genomics, metabolomics, metabonomics, and personalized medicine may be realized for several of the most common conditions worldwide within a few decades (42-44).

References

  1. Trujillo E, Davis C, Milner J. Nutrigenomics, proteomics, metabolomics, and the practice of dietetics. J Am Diet Assoc. 2006;106(3):403-13.
  2. Kussmann M, Raymond F, Affolter M. OMICS-driven biomarker discovery in nutrition and health. J Biotechnol. 2006;124(4):758-87.
  3. (Zeisel SH. Nutrigenomics and metabolomics will change clinical nutrition and public health practice: insights from studies on dietary requirements for choline. Am J Clin Nutr. 2007;86(3):542-8.
  4. García-Cañas V, Simó C, León C, Cifuentes A. Advances in Nutrigenomics research: novel and future analytical approaches to investigate the biological activity of natural compounds and food functions. J Pharm Biomed Anal. 2010;51(2):290-304.
  5. Kussmann M, Blum S. OMICS-derived targets for inflammatory gut disorders: opportunities for the development of nutrition related biomarkers. Endocr Metab Immune Disord Drug Targets. 2007;7(4):271-87.
  6. Ovesná J, Slabý O, Toussaint O, Kodícek M, et al. High throughput ‘omics’ approaches to assess the effects of phytochemicals in human health studies. Br J Nutr. 2008;99 E Suppl 1:ES127-34.
  7. Workshop Report: ―The 2010 Project‖. Chory J, Ecker JR, Briggs S, et al. A Blueprint for Understanding How Plants Are Built and How to Improve Them. Plant Physiology 2000;123:423–425, http://www.plantphysiol.org.
  8. Stover PJ, Caudill MA. Genetic and epigenetic contributions to human nutrition and health: managing genome-diet interactions. J Am Diet Assoc. 2008 Sep;108(9):1480-7.
  9. Kussmann M, Panchaud A, Affolter M.. Proteomics in nutrition: status quo and outlook for biomarkers and bioactives. J Proteome Res. 201;9(10):4876-87.
  10. Wolfram Weckwerth. Metabolomics in Systems Biology. Annual Review of Plant Biology 2003; 54: 669-689.
  11. Kussmann M, Affolter M, Nagy K, Holst B, Fay LB. Mass spectrometry in nutrition: understanding dietary health effects at the molecular level. Mass Spectrom Rev. 2007;26(6):727-50.
  12. Grainger DJ. Megavariate Statistics meets High Data-density Analytical Methods: The Future of Medical Diagnostics? IRTL Reviews 2003;1:1-6.
  13. Heiss; C, Keen CL, Kelm M. Flavanols and Cardiovascular Disease Prevention. European Heart Journal 2010;31(21):2583-2592.
  14. Kussmann M, Rezzi S, Daniel H. Profiling techniques in nutrition and health research. Curr Opin Biotechnol. 2008;19 (2):83-99.
  15. Ohashi N, Ito C, Fujikawa R, Yamamoto H, et al. The impact of visceral adipose tissue and high-molecular weight adiponectin on cardia-ankle vascular index in asymptomatic Japanese subjects. Metabolism 2009; 58:1023-9. [CAVI and VAT and HMW adiponectin levels];
  1. Zha JM, Di WJ, Zhu T, Xie T, et al. Comparison of gene transcription between subcutaneous and visceral adipose tissue in chinese adults. Endocr J 2009;56:934-44. [TLR4 signaling, 11 beta-HSD1 and GR levels in VAT];
  2. Albert L, Girola A, Gilardini L, Conti A, et al. Type 2 diabetes and metabolic syndrome are associated with increased expression of 11 beta-hydroxysteroid dehydrogenase 1 in obese subjects. Int J Obesity (Lond) 2007;31:1826-31;
  3. Fabbrini E, Markos F, Mohammed BS, Pietka T, et al. Intrahepatic fat, not visceral fat, is linked with metabolic complications of obesity. PNAS 2009;106:15430-5;
  4. Tong J, Boyko EJ, Utzschneider KM, McNeely MJ, et al. Intraabdominal fat accumulation predicts the development of the metabolic syndrome in non-diabetic Japanese-Americans. Diabetologia 2007;50:1156-60;
  5. Kim K, Valentine RJ, Shin Y, Gong K. Association of visceral adiposity and exercise participation with C- reactive protein, insulin resistance, and endothelial dysfunction in Korean healthy adults. Metabolism 2008;57:1181-9. [(VAT-EC exhibits a marked angiogenic and proinflammatory state];
  6. Villaret A, Galitzky J, Decaunes P, Exteve D, et al. Adipose tisue endothelial cells from obese human subjects: differences among depots in angiogenic, metabolic, and inflammatory gene expression and cellular senescence. Diabetes 2010;59:2755-63;
  7. van Dijk -, Feskens EJ, Bos MB, Hoelen DW, et al. A saturated fatty acid-rich diet induces an obesity-linked proinflammatory gene expression profile in adipose tissue of subjects at risk of metabolic syndrome. Am J Clin Nutr 2009;90:1656-64.[MUFA in LDL lowering].
  8. Theurl I, Aigner E, Theurl M, Nairz M, et al. Regulation of iron homeostasis in anemia of chronic disease and iron deficiency anemia: diagnostic and therapeutic implications. Blood. 2009;113(21):5277-86
  9. Cheng PP, Jiao XY, Wang XH, Lin JH, Cai YM. Hepcidin expression in anemia of chronic disease and concomitant iron-deficiency anemia. Clin Exp Med. 2010 May 25. [Epub ahead of print].
  10. Spratlin JL, Serkova NJ, and Eckhardt SG. Clinical Applications of Metabolomics in Oncology: A Review. Clin Cancer Res. 2009 ;15; 15(2): 431–440.
  11. Fischer PM, Lane DP. Small molecule inhibitors of thep53 suppressor HDM2: have protein-protein interactions come of age as drug targets? Trends in Pharm Sci 2004;25(7):343-346.
  12. Visser M, Bouter LM, McQuillan GM, Wener HM. Elevated C-Reactive Protein Levels in Overweight and Obese Adults. JAMA. 1999;282:2131-2135.
  13. Yudkin JS, Stehouwer CDA, Emeis JJ, Coppack SW. C-Reactive Protein in Healthy Subjects: Associations With Obesity, Insulin Resistance, and Endothelial Dysfunction : A Potential Role for Cytokines Originating From Adipose Tissue? Arterioscler. Thromb. Vasc. Biol. 1999; 19:972-978.
  14. Visvikis-Siest S, Siest G. The STANISLAS cohort: a 10-year followup of supposed healthy families. Gene-environment interactions, reference values and evaluation of biomarkers in prevention of cardiovascular diseases. Clin Chem Lab Med 2008;46:733-47.
  15. Schmidt MI, Duncan BB. Diabesity: an inflammatory metabolic condition. Clin Chem Lab Med 2003;41:1120-1130.
  16. Fenkci S, Rota S, Sabir N, Akdag B. Ultrasonographic and biochemical evaluation of visceral obesity in obese women with non-alcoholic fatty liver disease. Eur J Med Res 2007;12:68-73. (VAT, HOMA)
  17. Lee JW, Lee HR, Shim JY, Im JA, et al. Viscerally obese women with normal body weight have greater brachial-ankle pulse wave velocity than non viscerally obese women with excessive body weight. Clin Endocrinol (Oxf) 2007;66:572-8. [visceral obesity – high trigly, high baPWV, greater SFA and thigh SFA].
  18. Kaysen GE. The Microinflammatory State in Uremia: Causes and Potential Consequences. J Am Soc Nephrol 2001;12:1549–1557.
  19. Kaysen GE. Role of Inflammation and Its Treatment in ESRD Patients. Blood Purif 2002;20:70–80.
  20. Bar-Or D, Thomas GW, Yukl RL, Rael LT, et al. Copper stimulates the synthesis and release of interleukin-8 in human endothelial cells: a possible early role in systemic inflammatory responses. Shock 2003;20(2):154–158.
  21. Dugina TN, Kiseleva EV, Chistov IV, Umarova BA, and Strukova SM. Receptors of the PAR Family as a Link between Blood Coagulation and Inflammation. Biochemistry (Moscow), 2002; 67(1):65-74. [Translated from Biokhimiya 2002;67(1):77-87].
  22. Monaco C, Andreakos E, Kiriakidis S, Feldmann M, and and Ewa Paleolog. T-Cell-Mediated Signalling in Immune, Inflammatory and Angiogenic Processes: The Cascade of Events Leading to Inflammatory Diseases. Current Drug Targets – Inflammation & Allergy, 2004, 3, 35-42.
  23. Monaco C, Grosjean J, and Paleolog E. The role of the NFκB pathway in atherosclerosis. [E-mail: e.paleolog@imperial.ac.uk]
  24. Libby P, Ridker PM, and Maseri A. Inflammation and atherosclerosis. Circulation 2002;105:1135-43.
  25. Karin M, Yamamoto Y, Wang QM. The IKK NF-kappa B system: a treasure trove for drug development. Nat Rev Drug Discov 2004;3:17-26.
  26. Karin M, Ben-Neriah Y. Phosphorylation meets ubiquitination: the control of NF-[kappa]B activity. Annu Rev Immunol 2000;18:621-63.
  27. Lee DY, Bowen BP, and Northen TR. Mass spectrometry–based metabolomics, analysis of metabolite-protein interactions, and imaging. BioTechniques 2010;49:557-565.
  28. Faca V, Krasnoselsky A, and Hanash S. Innovative proteomic approaches for cancer biomarker discove.
  29. Sharp, P, and MIT faculty. ‘Convergence’ offers potential for revolutionary advance in biomedicine. The Third Revolution: Convergence of the Life Sciences, Physical Sciences and Engineering. White paper. Reported in Biotechnology Jan 5, 2011. [Convergence is a new paradigm that can yield critical advances in a broad array of sectors]


Read Full Post »

Lipid Metabolism

Lipid Metabolism

Reporter and Curator: Larry H. Bernstein, MD, FCAP 


This is fourth of a series of articles, lipid metabolism, that began with signaling and signaling pathways. These discussion lay the groundwork to proceed in later discussions that will take on a somewhat different approach. These are critical to develop a more complete point of view of life processes.  I have indicated that many of the protein-protein interactions or protein-membrane interactions and associated regulatory features have been referred to previously, but the focus of the discussion or points made were different.  The role of lipids in circulating plasma proteins as biomarkers for coronary vascular disease can be traced to the early work of Frederickson and the classification of lipid disorders.  The very critical role of lipids in membrane structure in health and disease has had much less attention, despite the enormous importance, especially in the nervous system.

  1. Signaling and signaling pathways
  2. Signaling transduction tutorial.
  3. Carbohydrate metabolism

3.1  Selected References to Signaling and Metabolic Pathways in Leaders in Pharmaceutical Intelligence

  1. Lipid metabolism
  2. Protein synthesis and degradation
  3. Subcellular structure
  4. Impairments in pathological states: endocrine disorders; stress hypermetabolism; cancer.


Lipid Metabolism

http://www.elmhurst.edu/~chm/vchembook/622overview.html

Overview of Lipid Catabolism:

The major aspects of lipid metabolism are involved with

  • Fatty Acid Oxidationto produce energy or
  • the synthesis of lipids which is called Lipogenesis.

The metabolism of lipids and carbohydrates are related by the conversion of lipids from carbohydrates. This can be seen in the diagram. Notice the link through actyl-CoA, the seminal discovery of Fritz Lipmann. The metabolism of both is upset by diabetes mellitus, which results in the release of ketones (2/3 betahydroxybutyric acid) into the circulation.


metabolism of fats

metabolism of fats


http://www.elmhurst.edu/~chm/vchembook/images/590metabolism.gif

The first step in lipid metabolism is the hydrolysis of the lipid in the cytoplasm to produce glycerol and fatty acids.

Since glycerol is a three carbon alcohol, it is metabolized quite readily into an intermediate in glycolysis, dihydroxyacetone phosphate. The last reaction is readily reversible if glycerol is needed for the synthesis of a lipid.

The hydroxyacetone, obtained from glycerol is metabolized into one of two possible compounds. Dihydroxyacetone may be converted into pyruvic acid, a 3-C intermediate at the last step of glycolysis to make energy.

In addition, the dihydroxyacetone may also be used in gluconeogenesis (usually dependent on conversion of gluconeogenic amino acids) to make glucose-6-phosphate for glucose to the blood or glycogen depending upon what is required at that time.

Fatty acids are oxidized to acetyl CoA in the mitochondria using the fatty acid spiral. The acetyl CoA is then ultimately converted into ATP, CO2, and H2O using the citric acid cycle and the electron transport chain.

There are two major types of fatty acids – ω-3 and ω-6.  There are also saturated and unsaturated with respect to the existence of double bonds, and monounsaturated and polyunsatured.  Polyunsaturated fatty acids (PUFAs) are important in long term health, and it will be seen that high cardiovascular risk is most associated with a low ratio of ω-3/ω-6, the denominator being from animal fat. Ω-3 fatty acids are readily available from fish, seaweed, and flax seed. More can be said of this later.

Fatty acids are synthesized from carbohydrates and occasionally from proteins. Actually, the carbohydrates and proteins have first been catabolized into acetyl CoA. Depending upon the energy requirements, the acetyl CoA enters the citric acid cycle or is used to synthesize fatty acids in a process known as LIPOGENESIS.

The relationships between lipid and carbohydrate metabolism are
summarized in Figure 2.


fattyacidspiral

fattyacidspiral

http://www.elmhurst.edu/~chm/vchembook/images/620fattyacidspiral.gif


 Energy Production Fatty Acid Oxidation:

“Visible” ATP:

In the fatty acid spiral, there is only one reaction which directly uses ATP and that is in the initiating step. So this is a loss of ATP and must be subtracted later.

A large amount of energy is released and restored as ATP during the oxidation of fatty acids. The ATP is formed from both the fatty acid spiral and the citric acid cycle.


Connections to Electron Transport and ATP:

One turn of the fatty acid spiral produces ATP from the interaction of the coenzymes FAD (step 1) and NAD+ (step 3) with the electron transport chain. Total ATP per turn of the fatty acid spiral is:

Electron Transport Diagram – (e.t.c.)

Step 1 – FAD into e.t.c. = 2 ATP
Step 3 – NAD+ into e.t.c. = 3 ATP
Total ATP per turn of spiral = 5 ATP

In order to calculate total ATP from the fatty acid spiral, you must calculate the number of turns that the spiral makes. Remember that the number of turns is found by subtracting one from the number of acetyl CoA produced. See the graphic on the left bottom.

Example with Palmitic Acid = 16 carbons = 8 acetyl groups

Number of turns of fatty acid spiral = 8-1 = 7 turns

ATP from fatty acid spiral = 7 turns and 5 per turn = 35 ATP.

This would be a good time to remember that single ATP that was needed to get the fatty acid spiral started. Therefore subtract it now.

NET ATP from Fatty Acid Spiral = 35 – 1 = 34 ATP

Review ATP Summary for Citric Acid Cycle:The acetyl CoA produced from the fatty acid spiral enters the citric acid cycle. When calculating ATP production, you have to show how many acetyl CoA are produced from a given fatty acid as this controls how many “turns” the citric acid cycle makes.Starting with acetyl CoA, how many ATP are made using the citric acid cycle? E.T.C = electron transport chain

 Step  ATP produced
7  1
Step 4 (NAD+ to E.T.C.) 3
Step 6 (NAD+ to E.T.C.)  3
Step10 (NAD+ to E.T.C.)  3
Step 8 (FAD to E.T.C.) 2
 NET 12 ATP


 ATP Summary for Palmitic Acid – Complete Metabolism:The phrase “complete metabolism” means do reactions until you end up with carbon dioxide and water. This also means to use fatty acid spiral, citric acid cycle, and electron transport as needed.Starting with palmitic acid (16 carbons) how many ATP are made using fatty acid spiral? This is a review of the above panel E.T.C = electron transport chain

 Step  ATP (used -) (produced +)
Step 1 (FAD to E.T.C.) +2
Step 4 (NAD+ to E.T.C.) +3
Total ATP  +5
 7 turns  7 x 5 = 35
initial step  -1
 NET  34 ATP

The fatty acid spiral ends with the production of 8 acetyl CoA from the 16 carbon palmitic acid.

Starting with one acetyl CoA, how many ATP are made using the citric acid cycle? Above panel gave the answer of 12 ATP per acetyl CoA.

E.T.C = electron transport chain

 Step  ATP produced
One acetyl CoA per turn C.A.C. +12 ATP
8 Acetyl CoA = 8 turns C.A.C. 8 x 12 = 96 ATP
Fatty Acid Spiral 34 ATP
GRAND TOTAL  130 ATP


Fyodor Lynen

Feodor Lynen was born in Munich on 6 April 1911, the son of Wilhelm Lynen, Professor of Mechanical Engineering at the Munich Technische Hochschule. He received his Doctorate in Chemistry from Munich University under Heinrich Wieland, who had won the Nobel Prize for Chemistry in 1927, in March 1937 with the work: «On the Toxic Substances in Amanita». in 1954 he became head of the Max-Planck-Institut für Zellchemie, newly created for him as a result of the initiative of Otto Warburg and Otto Hahn, then President of the Max-Planck-Gesellschaft zur Förderung der Wissenschaften.

Lynen’s work was devoted to the elucidation of the chemical details of metabolic processes in living cells, and of the mechanisms of metabolic regulation. The problems tackled by him, in conjunction with German and other workers, include the Pasteur effect, acetic acid degradation in yeast, the chemical structure of «activated acetic acid» of «activated isoprene», of «activated carboxylic acid», and of cytohaemin, degradation of fatty acids and formation of acetoacetic acid, degradation of tararic acid, biosynthesis of cysteine, of terpenes, of rubber, and of fatty acids.

In 1954 Lynen received the Neuberg Medal of the American Society of European Chemists and Pharmacists, in 1955 the Liebig Commemorative Medal of the Gesellschaft Deutscher Chemiker, in 1961 the Carus Medal of the Deutsche Akademie der Naturforscher «Leopoldina», and in 1963 the Otto Warburg Medal of the Gesellschaft für Physiologische Chemie. He was also a member of the U>S> National Academy of Sciences, and shared the Nobel Prize in Physiology and Medicine with Konrad Bloch in 1964, and was made President of the Gesellschaft Deutscher Chemiker (GDCh) in 1972.

This biography was written at the time of the award and first published in the book series Les Prix Nobel. It was later edited and republished in Nobel Lectures, and shortened by myself.

The Pathway from “Activated Acetic Acid” to the Terpenes and Fatty Acids

My first contact with dynamic biochemistry in 1937 occurred at an exceedingly propitious time. The remarkable investigations on the enzyme chain of respiration, on the oxygen-transferring haemin enzyme of respiration, the cytochromes, the yellow enzymes, and the pyridine proteins had thrown the first rays of light on the chemical processes underlying the mystery of biological catalysis, which had been recognised by your famous countryman Jöns Jakob Berzelius. Vitamin B2 , which is essential to the nourishment of man and of animals, had been recognised by Hugo Theorell in the form of the phosphate ester as the active group of an important class of enzymes, and the fermentation processes that are necessary for Pasteur’s “life without oxygen”

had been elucidated as the result of a sequence of reactions centered around “hydrogen shift” and “phosphate shift” with adenosine triphosphate as the phosphate-transferring coenzyme. However, 1,3-diphosphoglyceric acid, the key substance to an understanding of the chemical relation between oxidation and phosphorylation, still lay in the depths of the unknown. Never-

theless, Otto Warburg was on its trail in the course of his investigations on the fermentation enzymes, and he was able to present it to the world in 1939.


This was the period in which I carried out my first independent investigation, which was concerned with the metabolism of yeast cells after freezing in liquid air, and which brought me directly into contact with the mechanism of alcoholic fermentation. This work taught me a great deal, and yielded two important pieces of information.


  • The first was that in experiments with living cells, special attention must be given to the permeability properties of the cell membranes, and
  • the second was that the adenosine polyphosphate system plays a vital part in the cell,
    • not only in energy transfer, but
    • also in the regulation of the metabolic processes.


.

This investigation aroused by interest in problems of metabolic regulation, which led me to the investigation of the Pasteur effects, and has remained with me to the present day.


My subsequent concern with the problem of the acetic acid metabolism arose from my stay at Heinrich Wieland’s laboratory. Workers here had studied the oxidation of acetic acid by yeast cells, and had found that though most of the acetic acid undergoes complete oxidation, some remains in the form of succinic and citric acids.


The explanation of these observations was provided-by the Thunberg-Wieland process, according to which two molecules of acetic acid are dehydrogenated to succinic acid, which is converted back into acetic acid via oxaloacetic acid, pyruvic acid, and acetaldehyde, or combines at the oxaloacetic acid stage with a further molecule of acetic acid to form citric acid (Fig. 1). However, an experimental check on this view by a Wieland’s student Robert Sonderhoffs brought a surprise. The citric acid formed when trideuteroacetic acid was supplied to yeast cells contained the expected quantity of deuterium, but the succinic acid contained only half of the four deuterium atoms required by Wieland’s scheme.


This investigation aroused by interest in problems of metabolic regulation, which led me to the investigation of the Pasteur effects, and has remained with me to the present day. My subsequent concern with the problem of the acetic acid metabolism arose from my stay at Heinrich Wieland’s laboratory. Workers here had studied the oxidation of acetic acid by yeast cells, and had found that though most of the acetic acid undergoes complete oxidation, some remains in the form of succinic and citric acid

The answer provided by Martius was that citric acid  is in equilibrium with isocitric acid and is oxidised to cr-ketoglutaric acid, the conversion of which into succinic acid had already been discovered by Carl Neuberg (Fig. 1).

It was possible to assume with fair certainty from these results that the succinic acid produced by yeast from acetate is formed via citric acid. Sonderhoff’s experiments with deuterated acetic acid led to another important discovery.

In the analysis of the yeast cells themselves, it was found that while the carbohydrate fraction contained only insignificant quantities of deuterium, large quantities of heavy hydrogen were present in the fatty acids formed and in the sterol fraction. This showed that

  • fatty acids and sterols were formed directly from acetic acid, and not indirectly via the carbohydrates.

As a result of Sonderhoff’s early death, these important findings were not pursued further in the Munich laboratory.

  • This situation was elucidated only by Konrad Bloch’s isotope experiments, on which he reports.

My interest first turned entirely to the conversion of acetic acid into citric acid, which had been made the focus of the aerobic degradation of carbohydrates by the formulation of the citric acid cycle by Hans Adolf Krebs. Unlike Krebs, who regarded pyruvic acid as the condensation partner of acetic acid,

  • we were firmly convinced, on the basis of the experiments on yeast, that pyruvic acid is first oxidised to acetic acid, and only then does the condensation take place.

Further progress resulted from Wieland’s observation that yeast cells that had been “impoverished” in endogenous fuels by shaking under oxygen were able to oxidise added acetic acid only after a certain “induction period” (Fig. 2). This “induction period” could be shortened by addition of small quantities of a readily oxidisable substrate such as ethyl alcohol, though propyl and butyl alcohol were also effective. I explained this by assuming that acetic acid is converted, at the expense of the oxidation of the alcohol, into an “activated acetic acid”, and can only then condense with oxalacetic acid.

In retrospect, we find that I had come independently on the same group of problems as Fritz Lipmann, who had discovered that inorganic phosphate is indispensable to the oxidation of pyruvic acid by lactobacilli, and had detected acetylphosphate as an oxidation product. Since this anhydride of acetic acid and phosphoric acid could be assumed to be the “activated acetic acid”.

I learned of the advances that had been made in the meantime in the investigation of the problem of “activated acetic acid”. Fritz Lipmann has described the development at length in his Nobel Lecture’s, and I need not repeat it. The main advance was the recognition that the formation of “activated acetic acid” from acetate involved not only ATP as an energy source, but also the newly discovered coenzyme A, which contains the vitamin pantothenic acid, and that “activated acetic acid” was probably an acetylated coenzyme  A.

http://www.nobelprize.org/nobel_prizes/medicine/laureates/1964/lynen-bio.html

http://onlinelibrary.wiley.com/store/10.1002/anie.201106003/asset/image_m/mcontent.gif?v=1&s=1e6dc789dfa585fe48947e92cc5dfdcabd8e2677

Fyodor Lynen

Lynen’s most important research at the University of Munich focused on intermediary metabolism, cholesterol synthesis, and fatty acid biosynthesis. Metabolism involves all the chemical processes by which an organism converts matter and energy into forms that it can use. Metabolism supplies the matter—the molecular building blocks an organism needs for the growth of new tissues. These building blocks must either come from the breakdown of molecules of food, such as glucose (sugar) and fat, or be built up from simpler molecules within the organism.

Cholesterol is one of the fatty substances found in animal tissues. The human body produces cholesterol, but this substance also enters the body in food. Meats, egg yolks, and milk products, such as butter and cheese, contain cholesterol. Such organs as the brain and liver contain much cholesterol. Cholesterol is a type of lipid, one of the classes of chemical compounds essential to human health. It makes up an important part of the membranes of each cell in the body. The body also uses cholesterol to produce vitamin D and certain hormones.

All fats are composed of an alcohol called glycerol and substances called fatty acids. A fatty acid consists of a long chain of carbon atoms, to which hydrogen atoms are attached. There are three types of fatty acids: saturated, monounsaturated, and polyunsaturated.

Living cells manufacture complicated chemical compounds from simpler substances through a process called biosynthesis. For example, simple molecules called amino acids are put together to make proteins. The biosynthesis of both fatty acids and cholesterol begins with a chemically active form of acetate, a two-carbon molecule. Lynen discovered that the active form of acetate is a coenzyme, a heat-stabilized, water-soluble portion of an enzyme, called acetyl coenzyme A. Lynen and his colleagues demonstrated that the formation of cholesterol begins with the condensation of two molecules of acetyl coenzyme A to form acetoacetyl coenzyme A, a four-carbon molecule.

http://science.howstuffworks.com/dictionary/famous-scientists/biologists/feodor-lynen-info.htm

Fyodor Lynen

Fyodor Lynen


SREBPs: activators of the complete program of cholesterol and fatty acid synthesis in the liver

Jay D. Horton1,2, Joseph L. Goldstein1 and Michael S. Brown1

1Department of Molecular Genetics, and
2Department of Internal Medicine, University of Texas Southwestern Medical Center, Dallas, Texas, USA

J Clin Invest. 2002;109(9):1125–1131.
http://dx.doi.org:/10.1172/JCI15593
Lipid homeostasis in vertebrate cells is regulated by a family of membrane-bound transcription factors designated sterol regulatory element–binding proteins (SREBPs). SREBPs directly activate the expression of more than 30 genes dedicated to the synthesis and uptake of cholesterol, fatty acids, triglycerides, and phospholipids, as well as the NADPH cofactor required to synthesize these molecules (1–4). In the liver, three SREBPs regulate the production of lipids for export into the plasma as lipoproteins and into the bile as micelles. The complex, interdigitated roles of these three SREBPs have been dissected through the study of ten different lines of gene-manipulated mice. These studies form the subject of this review.

SREBPs: activation through proteolytic processing

SREBPs belong to the basic helix-loop-helix–leucine zipper (bHLH-Zip) family of transcription factors, but they differ from other bHLH-Zip proteins in that they are synthesized as inactive precursors bound to the endoplasmic reticulum (ER) (1, 5). Each SREBP precursor of about 1150 amino acids is organized into three domains: (a) an NH2-terminal domain of about 480 amino acids that contains the bHLH-Zip region for binding DNA; (b) two hydrophobic transmembrane–spanning segments interrupted by a short loop of about 30 amino acids that projects into the lumen of the ER; and (c) a COOH-terminal domain of about 590 amino acids that performs the essential regulatory function described below.

In order to reach the nucleus and act as a transcription factor, the NH2-terminal domain of each SREBP must be released from the membrane proteolytically (Figure 1). Three proteins required for SREBP processing have been delineated in cultured cells, using the tools of somatic cell genetics (see ref. 5for review). One is an escort protein designated SREBP cleavage–activating protein (SCAP). The other two are proteases, designated Site-1 protease (S1P) and Site-2 protease (S2P). Newly synthesized SREBP is inserted into the membranes of the ER, where its COOH-terminal regulatory domain binds to the COOH-terminal domain of SCAP (Figure 1).


Figure 1

Model for the sterol-mediated proteolytic release of SREBPs from membranes JCI0215593.f1

Model for the sterol-mediated proteolytic release of SREBPs from membranes JCI0215593.f1


Model for the sterol-mediated proteolytic release of SREBPs from membranes. SCAP is a sensor of sterols and an escort of SREBPs. When cells are depleted of sterols, SCAP transports SREBPs from the ER to the Golgi apparatus, where two proteases, Site-1 protease (S1P) and Site-2 protease (S2P), act sequentially to release the NH2-terminal bHLH-Zip domain from the membrane. The bHLH-Zip domain enters the nucleus and binds to a sterol response element (SRE) in the enhancer/promoter region of target genes, activating their transcription. When cellular cholesterol rises, the SCAP/SREBP complex is no longer incorporated into ER transport vesicles, SREBPs no longer reach the Golgi apparatus, and the bHLH-Zip domain cannot be released from the membrane. As a result, transcription of all target genes declines. Reprinted from ref. 5 with permission.

http://dm5migu4zj3pb.cloudfront.net/manuscripts/15000/15593/large/JCI0215593.f1.jpg

SCAP is both an escort for SREBPs and a sensor of sterols. When cells become depleted in cholesterol, SCAP escorts the SREBP from the ER to the Golgi apparatus, where the two proteases reside. In the Golgi apparatus, S1P, a membrane-bound serine protease, cleaves the SREBP in the luminal loop between its two membrane-spanning segments, dividing the SREBP molecule in half (Figure 1). The NH2-terminal bHLH-Zip domain is then released from the membrane via a second cleavage mediated by S2P, a membrane-bound zinc metalloproteinase. The NH2-terminal domain, designated nuclear SREBP (nSREBP), translocates to the nucleus, where it activates transcription by binding to nonpalindromic sterol response elements (SREs) in the promoter/enhancer regions of multiple target genes.


Figure 1


When the cholesterol content of cells rises, SCAP senses the excess cholesterol through its membranous sterol-sensing domain, changing its conformation in such a way that the SCAP/SREBP complex is no longer incorporated into ER transport vesicles. The net result is that SREBPs lose their access to S1P and S2P in the Golgi apparatus, so their bHLH-Zip domains cannot be released from the ER membrane, and the transcription of target genes ceases (1, 5). The biophysical mechanism by which SCAP senses sterol levels in the ER membrane and regulates its movement to the Golgi apparatus is not yet understood. Elucidating this mechanism will be fundamental to understanding the molecular basis of cholesterol feedback inhibition of gene expression.

SREBPs: two genes, three proteins

The mammalian genome encodes three SREBP isoforms, designated SREBP-1a, SREBP-1c, and SREBP-2. SREBP-2 is encoded by a gene on human chromosome 22q13. Both SREBP-1a and -1c are derived from a single gene on human chromosome 17p11.2 through the use of alternative transcription start sites that produce alternate forms of exon 1, designated 1a and 1c (1). SREBP-1a is a potent activator of all SREBP-responsive genes, including those that mediate the synthesis of cholesterol, fatty acids, and triglycerides. High-level transcriptional activation is dependent on exon 1a, which encodes a longer acidic transactivation segment than does the first exon of SREBP-1c. The roles of SREBP-1c and SREBP-2 are more restricted than that of SREBP-1a. SREBP-1c preferentially enhances transcription of genes required for fatty acid synthesis but not cholesterol synthesis. Like SREBP-1a, SREBP-2 has a long transcriptional activation domain, but it preferentially activates cholesterol synthesis (1). SREBP-1a and SREBP-2 are the predominant isoforms of SREBP in most cultured cell lines, whereas SREBP-1c and SREBP-2 predominate in the liver and most other intact tissues (6).

When expressed at higher than physiologic levels, each of the three SREBP isoforms can activate all enzymes indicated in Figure 2, which shows the biosynthetic pathways used to generate cholesterol and fatty acids. However, at normal levels of expression, SREBP-1c favors the fatty acid biosynthetic pathway and SREBP-2 favors cholesterologenesis. SREBP-2–responsive genes in the cholesterol biosynthetic pathway include those for the enzymes HMG-CoA synthase, HMG-CoA reductase, farnesyl diphosphate synthase, and squalene synthase. SREBP-1c–responsive genes include those for ATP citrate lyase (which produces acetyl-CoA) and acetyl-CoA carboxylase and fatty acid synthase (which together produce palmitate [C16:0]). Other SREBP-1c target genes encode a rate-limiting enzyme of the fatty acid elongase complex, which converts palmitate to stearate (C18:0) (ref.7); stearoyl-CoA desaturase, which converts stearate to oleate (C18:1); and glycerol-3-phosphate acyltransferase, the first committed enzyme in triglyceride and phospholipid synthesis (3). Finally, SREBP-1c and SREBP-2 activate three genes required to generate NADPH, which is consumed at multiple stages in these lipid biosynthetic pathways (8) (Figure 2).


Figure 2


major metabolic intermediates in the pathways for synthesis of cholesterol, fatty acids, and triglycerides JCI0215593.f2

major metabolic intermediates in the pathways for synthesis of cholesterol, fatty acids, and triglycerides JCI0215593.f2


http://dm5migu4zj3pb.cloudfront.net/manuscripts/15000/15593/large/JCI0215593.f2.jpg


Genes regulated by SREBPs. The diagram shows the major metabolic intermediates in the pathways for synthesis of cholesterol, fatty acids, and triglycerides. In vivo, SREBP-2 preferentially activates genes of cholesterol metabolism, whereas SREBP-1c preferentially activates genes of fatty acid and triglyceride metabolism. DHCR, 7-dehydrocholesterol reductase; FPP, farnesyl diphosphate; GPP, geranylgeranyl pyrophosphate synthase; CYP51, lanosterol 14α-demethylase; G6PD, glucose-6-phosphate dehydrogenase; PGDH, 6-phosphogluconate dehydrogenase; GPAT, glycerol-3-phosphate acyltransferase.

Genes regulated by SREBPs. The diagram shows the major metabolic intermediates in the pathways for synthesis of cholesterol, fatty acids, and triglycerides. In vivo, SREBP-2 preferentially activates genes of cholesterol metabolism, whereas SREBP-1c preferentially activates genes of fatty acid and triglyceride metabolism. DHCR, 7-dehydrocholesterol reductase; FPP, farnesyl diphosphate; GPP, geranylgeranyl pyrophosphate synthase; CYP51, lanosterol 14α-demethylase; G6PD, glucose-6-phosphate dehydrogenase; PGDH, 6-phosphogluconate dehydrogenase; GPAT, glycerol-3-phosphate acyltransferase.

Knockout and transgenic mice

Ten different genetically manipulated mouse models that either lack or overexpress a single component of the SREBP pathway have been generated in the last 6 years (9–16). The key molecular and metabolic alterations observed in these mice are summarized in Table 1.


Table 1
Alterations in hepatic lipid metabolism in gene-manipulated mice overexpressing or lacking SREBPs

http://dm5migu4zj3pb.cloudfront.net/manuscripts/15000/15593/small/JCI0215593.t1.gif

Knockout mice that lack all nSREBPs die early in embryonic development. For instance, a germline deletion of S1p, which prevents the processing of all SREBP isoforms, results in death before day 4 of development (15, 17). Germline deletion of Srebp2 leads to 100% lethality at a later stage of embryonic development than does deletion of S1p (embryonic day 7–8). In contrast, germline deletion of Srebp1, which eliminates both the 1a and the 1c transcripts, leads to partial lethality, in that about 15–45% of Srebp1–/– mice survive (13). The surviving homozygotes manifest elevated levels of SREBP-2 mRNA and protein (Table 1), which presumably compensates for the loss of SREBP-1a and -1c. When the SREBP-1c transcript is selectively eliminated, no embryonic lethality is observed, suggesting that the partial embryonic lethality in the Srebp1–/– mice is due to the loss of the SREBP-1a transcript (16).

To bypass embryonic lethality, we have produced mice in which all SREBP function can be disrupted in adulthood through induction of Cre recombinase. For this purpose, loxP recombination sites were inserted into genomic regions that flank crucial exons in the Scap or S1p genes (so-called floxed alleles) (14, 15). Mice homozygous for the floxed gene and heterozygous for a Cre recombinase transgene, which is under control of an IFN-inducible promoter (MX1-Cre), can be induced to delete Scap or S1p by stimulating IFN expression. Thus, following injection with polyinosinic acid–polycytidylic acid, a double-stranded RNA that provokes antiviral responses, the Cre recombinase is produced in liver and disrupts the floxed gene by recombination between the loxP sites.

Cre-mediated disruption of Scap or S1p dramatically reduces nSREBP-1 and nSREBP-2 levels in liver and diminishes expression of all SREBP target genes in both the cholesterol and the fatty acid synthetic pathways (Table 1). As a result, the rates of synthesis of cholesterol and fatty acids fall by 70–80% in Scap- and S1p-deficient livers.

In cultured cells, the processing of SREBP is inhibited by sterols, and the sensor for this inhibition is SCAP (5). To learn whether SCAP performs the same function in liver, we have produced transgenic mice that express a mutant SCAP with a single amino acid substitution in the sterol-sensing domain (D443N) (12). Studies in tissue culture show that SCAP(D443N) is resistant to inhibition by sterols. Cells that express a single copy of this mutant gene overproduce cholesterol (18). Transgenic mice that express this mutant version of SCAP in the liver exhibit a similar phenotype (12). These livers manifest elevated levels of nSREBP-1 and nSREBP-2, owing to constitutive SREBP processing, which is not suppressed when the animals are fed a cholesterol-rich diet. nSREBP-1 and -2 increase the expression of all SREBP target genes shown in Figure 2, thus stimulating cholesterol and fatty acid synthesis and causing a marked accumulation of hepatic cholesterol and triglycerides (Table 1). This transgenic model provides strong in vivo evidence that SCAP activity is normally under partial inhibition by endogenous sterols, which keeps the synthesis of cholesterol and fatty acids in a partially repressed state in the liver.

http://dm5migu4zj3pb.cloudfront.net/manuscripts/15000/15593/small/JCI0215593.t1.gif

Function of individual SREBP isoforms in vivo

To study the functions of individual SREBPs in the liver, we have produced transgenic mice that overexpress truncated versions of SREBPs (nSREBPs) that terminate prior to the membrane attachment domain. These nSREBPs enter the nucleus directly, bypassing the sterol-regulated cleavage step. By studying each nSREBP isoform separately, we could determine their distinct activating properties, albeit when overexpressed at nonphysiologic levels.

Overexpression of nSREBP-1c in the liver of transgenic mice produces a triglyceride-enriched fatty liver with no increase in cholesterol (10). mRNAs for fatty acid synthetic enzymes and rates of fatty acid synthesis are elevated fourfold in this tissue, whereas the mRNAs for cholesterol synthetic enzymes and the rate of cholesterol synthesis are not increased (8). Conversely, overexpression of nSREBP-2 in the liver increases the mRNAs only fourfold. This increase in cholesterol synthesis is even more remarkable when encoding all cholesterol biosynthetic enzymes; the most dramatic is a 75-fold increase in HMG-CoA reductase mRNA (11). mRNAs for fatty acid synthesis enzymes are increased to a lesser extent, consistent with the in vivo observation that the rate of cholesterol synthesis increases 28-fold in these transgenic nSREBP-2 livers, while fatty acid synthesis increases one considers the extent of cholesterol overload in this tissue, which would ordinarily reduce SREBP processing and essentially abolish cholesterol synthesis (Table 1).

http://dm5migu4zj3pb.cloudfront.net/manuscripts/15000/15593/small/JCI0215593.t1.gif

We have also studied the consequences of overexpressing SREBP-1a, which is expressed only at low levels in the livers of adult mice, rats, hamsters, and humans (6). nSREBP-1a transgenic mice develop a massive fatty liver engorged with both cholesterol and triglycerides (9), with heightened expression of genes controlling cholesterol biosynthesis and, still more dramatically, fatty acid synthesis (Table 1). The preferential activation of fatty acid synthesis (26-fold increase) relative to cholesterol synthesis (fivefold increase) explains the greater accumulation of triglycerides in their livers. The relative representation of the various fatty acids accumulating in this tissue is also unusual. Transgenic nSREBP-1a livers contain about 65% oleate (C18:1), markedly higher levels than the 15–20% found in typical wild-type livers (8) — a result of the induction of fatty acid elongase and stearoyl-CoA desaturase-1 (7). Considered together, the overexpression studies indicate that both SREBP-1 isoforms show a relative preference for activating fatty acid synthesis, whereas SREBP-2 favors cholesterol.

The phenotype of animals lacking the Srebp1 gene, which encodes both the SREBP-1a and -1c transcripts, also supports the notion of distinct hepatic functions for SREBP-1 and SREBP-2 (13). Most homozygous SREBP-1 knockout mice die in utero. The surviving Srebp1–/– mice show reduced synthesis of fatty acids, owing to reduced expression of mRNAs for fatty acid synthetic enzymes (Table 1). Hepatic nSREBP-2 levels increase in these mice, presumably in compensation for the loss of nSREBP-1. As a result, transcription of cholesterol biosynthetic genes increases, producing a threefold increase in hepatic cholesterol synthesis (Table 1).

http://dm5migu4zj3pb.cloudfront.net/manuscripts/15000/15593/small/JCI0215593.t1.gif

The studies in genetically manipulated mice clearly show that, as in cultured cells, SCAP and S1P are required for normal SREBP processing in the liver. SCAP, acting through its sterol-sensing domain, mediates feedback regulation of cholesterol synthesis. The SREBPs play related but distinct roles: SREBP-1c, the predominant SREBP-1 isoform in adult liver, preferentially activates genes required for fatty acid synthesis, while SREBP-2 preferentially activates the LDL receptor gene and various genes required for cholesterol synthesis. SREBP-1a and SREBP-2, but not SREBP-1c, are required for normal embryogenesis.

Transcriptional regulation of SREBP genes

Regulation of SREBPs occurs at two levels — transcriptional and posttranscriptional. The posttranscriptional regulation discussed above involves the sterol-mediated suppression of SREBP cleavage, which results from sterol-mediated suppression of the movement of the SCAP/SREBP complex from the ER to the Golgi apparatus (Figure 1). This form of regulation is manifest not only in cultured cells (1), but also in the livers of rodents fed cholesterol-enriched diets (19).

http://dm5migu4zj3pb.cloudfront.net/manuscripts/15000/15593/small/JCI0215593.f1.gif

The transcriptional regulation of the SREBPs is more complex. SREBP-1c and SREBP-2 are subject to distinct forms of transcriptional regulation, whereas SREBP-1a appears to be constitutively expressed at low levels in liver and most other tissues of adult animals (6). One mechanism of regulation shared by SREBP-1c and SREBP-2 involves a feed-forward regulation mediated by SREs present in the enhancer/promoters of each gene (20, 21). Through this feed-forward loop, nSREBPs activate the transcription of their own genes. In contrast, when nSREBPs decline, as in Scap or S1p knockout mice, there is a secondary decline in the mRNAs encoding SREBP-1c and SREBP-2 (14, 15).

Three factors selectively regulate the transcription of SREBP-1c: liver X-activated receptors (LXRs), insulin, and glucagon. LXRα and LXRβ, nuclear receptors that form heterodimers with retinoid X receptors, are activated by a variety of sterols, including oxysterol intermediates that form during cholesterol biosynthesis (22–24). An LXR-binding site in the SREBP-1c promoter activates SREBP-1c transcription in the presence of LXR agonists (23). The functional significance of LXR-mediated SREBP-1c regulation has been confirmed in two animal models. Mice that lack both LXRα and LXRβ express reduced levels of SREBP-1c and its lipogenic target enzymes in liver and respond relatively weakly to treatment with a synthetic LXR agonist (23). Because a similar blunted response is found in mice that lack SREBP-1c, it appears that LXR increases fatty acid synthesis largely by inducing SREBP-1c (16). LXR-mediated activation of SREBP-1c transcription provides a mechanism for the cell to induce the synthesis of oleate when sterols are in excess (23). Oleate is the preferred fatty acid for the synthesis of cholesteryl esters, which are necessary for both the transport and the storage of cholesterol.

LXR-mediated regulation of SREBP-1c appears also to be one mechanism by which unsaturated fatty acids suppress SREBP-1c transcription and thus fatty acid synthesis. Rodents fed diets enriched in polyunsaturated fatty acids manifest reduced SREBP-1c mRNA expression and low rates of lipogenesis in liver (25). In vitro, unsaturated fatty acids competitively block LXR activation of SREBP-1c expression by antagonizing the activation of LXR by its endogenous ligands (26). In addition to LXR-mediated transcriptional inhibition, polyunsaturated fatty acids lower SREBP-1c levels by accelerating degradation of its mRNA (27). These combined effects may contribute to the long-recognized ability of polyunsaturated fatty acids to lower plasma triglyceride levels.

SREBP-1c and the insulin/glucagon ratio

The liver is the organ responsible for the conversion of excess carbohydrates to fatty acids to be stored as triglycerides or burned in muscle. A classic action of insulin is to stimulate fatty acid synthesis in liver during times of carbohydrate excess. The action of insulin is opposed by glucagon, which acts by raising cAMP. Multiple lines of evidence suggest that insulin’s stimulatory effect on fatty acid synthesis is mediated by an increase in SREBP-1c. In isolated rat hepatocytes, insulin treatment increases the amount of mRNA for SREBP-1c in parallel with the mRNAs of its target genes (28, 29). The induction of the target genes can be blocked if a dominant negative form of SREBP-1c is expressed (30). Conversely, incubating primary hepatocytes with glucagon or dibutyryl cAMP decreases the mRNAs for SREBP-1c and its associated lipogenic target genes (30, 31).

In vivo, the total amount of SREBP-1c in liver and adipose tissue is reduced by fasting, which suppresses insulin and increases glucagon levels, and is elevated by refeeding (32, 33). The levels of mRNA for SREBP-1c target genes parallel the changes in SREBP-1c expression. Similarly, SREBP-1c mRNA levels fall when rats are treated with streptozotocin, which abolishes insulin secretion, and rise after insulin injection (29). Overexpression of nSREBP-1c in livers of transgenic mice prevents the reduction in lipogenic mRNAs that normally follows a fall in plasma insulin levels (32). Conversely, in livers of Scap knockout mice that lack all nSREBPs in the liver (14) or knockout mice lacking either nSREBP-1c (16) or both SREBP-1 isoforms (34), there is a marked decrease in the insulin-induced stimulation of lipogenic gene expression that normally occurs after fasting/refeeding. It should be noted that insulin and glucagon also exert a posttranslational control of fatty acid synthesis though changes in the phosphorylation and activation of acetyl-CoA carboxylase. The posttranslational regulation of fatty acid synthesis persists in transgenic mice that overexpress nSREBP-1c (10). In these mice, the rates of fatty acid synthesis, as measured by [3H]water incorporation, decline after fasting even though the levels of the lipogenic mRNAs remain high (our unpublished observations).

Taken together, the above evidence suggests that SREBP-1c mediates insulin’s lipogenic actions in liver. Recent in vitro and in vivo studies involving adenoviral gene transfer suggest that SREBP-1c may also contribute to the regulation of glucose uptake and glucose synthesis. When overexpressed in hepatocytes, nSREBP-1c induces expression of glucokinase, a key enzyme in glucose utilization. It also suppresses phosphoenolpyruvate carboxykinase, a key gluconeogenic enzyme (35, 36).

SREBPs in disease

Many individuals with obesity and insulin resistance also have fatty livers, one of the most commonly encountered liver abnormalities in the US (37). A subset of individuals with fatty liver go on to develop fibrosis, cirrhosis, and liver failure. Evidence indicates that the fatty liver of insulin resistance is caused by SREBP-1c, which is elevated in response to the high insulin levels. Thus, SREBP-1c levels are elevated in the fatty livers of obese (ob/ob) mice with insulin resistance and hyperinsulinemia caused by leptin deficiency (38, 39). Despite the presence of insulin resistance in peripheral tissues, insulin continues to activate SREBP-1c transcription and cleavage in the livers of these insulin-resistant mice. The elevated nSREBP-1c increases lipogenic gene expression, enhances fatty acid synthesis, and accelerates triglyceride accumulation (31, 39). These metabolic abnormalities are reversed with the administration of leptin, which corrects the insulin resistance and lowers the insulin levels (38).

Metformin, a biguanide drug used to treat insulin-resistant diabetes, reduces hepatic nSREBP-1 levels and dramatically lowers the lipid accumulation in livers of insulin-resistant ob/ob mice (40). Metformin stimulates AMP-activated protein kinase (AMPK), an enzyme that inhibits lipid synthesis through phosphorylation and inactivation of key lipogenic enzymes (41). In rat hepatocytes, metformin-induced activation of AMPK also leads to decreased mRNA expression of SREBP-1c and its lipogenic target genes (41), but the basis of this effect is not understood.

The incidence of coronary artery disease increases with increasing plasma LDL-cholesterol levels, which in turn are inversely proportional to the levels of hepatic LDL receptors. SREBPs stimulate LDL receptor expression, but they also enhance lipid synthesis (1), so their net effect on plasma lipoprotein levels depends on a balance between opposing effects. In mice, the plasma levels of lipoproteins tend to fall when SREBPs are either overexpressed or underexpressed. In transgenic mice that overexpress nSREBPs in liver, plasma cholesterol and triglycerides are generally lower than in control mice (Table 1), even though these mice massively overproduce fatty acids, cholesterol, or both. Hepatocytes of nSREBP-1a transgenic mice overproduce VLDL, but these particles are rapidly removed through the action of LDL receptors, and they do not accumulate in the plasma. Indeed, some nascent VLDL particles are degraded even before secretion by a process that is mediated by LDL receptors (42). The high levels of nSREBP-1a in these animals support continued expression of the LDL receptor, even in cells whose cholesterol concentration is elevated. In LDL receptor–deficient mice carrying the nSREBP-1a transgene, plasma cholesterol and triglyceride levels rise tenfold (43).

Mice that lack all SREBPs in liver as a result of disruption of Scap or S1p also manifest lower plasma cholesterol and triglyceride levels (Table 1).

http://dm5migu4zj3pb.cloudfront.net/manuscripts/15000/15593/small/JCI0215593.t1.gif

In these mice, hepatic cholesterol and triglyceride synthesis is markedly reduced, and this likely causes a decrease in VLDL production and secretion. LDL receptor mRNA and LDL clearance from plasma is also significantly reduced in these mice, but the reduction in LDL clearance is less than the overall reduction in VLDL secretion, the net result being a decrease in plasma lipid levels (15). However, because

humans and mice differ substantially with regard to LDL receptor expression, LDL levels, and other aspects of lipoprotein metabolism,

it is difficult to predict whether human plasma lipids will rise or fall when the SREBP pathway is blocked or activated.

SREBPs in liver: unanswered questions

The studies of SREBPs in liver have exposed a complex regulatory system whose individual parts are coming into focus. Major unanswered questions relate to the ways in which the transcriptional and posttranscriptional controls on SREBP activity are integrated so as to permit independent regulation of cholesterol and fatty acid synthesis in specific nutritional states. A few clues regarding these integration mechanisms are discussed below.

Whereas cholesterol synthesis depends almost entirely on SREBPs, fatty acid synthesis is only partially dependent on these proteins. This has been shown most clearly in cultured nonhepatic cells such as Chinese hamster ovary cells. In the absence of SREBP processing, as when the Site-2 protease is defective, the levels of mRNAs encoding cholesterol biosynthetic enzymes and the rates of cholesterol synthesis decline nearly to undetectable levels, whereas the rate of fatty acid synthesis is reduced by only 30% (44). Under these conditions, transcription of the fatty acid biosynthetic genes must be maintained by factors other than SREBPs. In liver, the gene encoding fatty acid synthase (FASN) can be activated transcriptionally by upstream stimulatory factor, which acts in concert with SREBPs (45). The FASN promoter also contains an LXR element that permits a low-level response to LXR ligands even when SREBPs are suppressed (46). These two transcription factors may help to maintain fatty acid synthesis in liver when nSREBP-1c is low.

Another mechanism of differential regulation is seen in the ability of cholesterol to block the processing of SREBP-2, but not SREBP-1, under certain metabolic conditions. This differential regulation has been studied most thoroughly in cultured cells such as human embryonic kidney (HEK-293) cells. When these cells are incubated in the absence of fatty acids and cholesterol, the addition of sterols blocks processing of SREBP-2, but not SREBP-1, which is largely produced as SREBP-1a in these cells (47). Inhibition of SREBP-1 processing requires an unsaturated fatty acid, such as oleate or arachidonate, in addition to sterols (47). In the absence of fatty acids and in the presence of sterols, SCAP may be able to carry SREBP-1 proteins, but not SREBP-2, to the Golgi apparatus. Further studies are necessary to document this apparent independent regulation of SREBP-1 and SREBP-2 processing and to determine its mechanism.


Acknowledgments

Support for the research cited from the authors’ laboratories was provided by grants from the NIH (HL-20948), the Moss Heart Foundation, the Keck Foundation, and the Perot Family Foundation. J.D. Horton is a Pew Scholar in the Biomedical Sciences and is the recipient of an Established Investigator Grant from the American Heart Association and a Research Scholar Award from the American Digestive Health Industry.

References

  1. Brown, MS, Goldstein, JL. The SREBP pathway: regulation of cholesterol metabolism by proteolysis of a membrane-bound transcription factor. Cell 1997. 89:331-340.

View this article via: PubMed

  1. Horton, JD, Shimomura, I. Sterol regulatory element-binding proteins: activators of cholesterol and fatty acid biosynthesis. Curr Opin Lipidol 1999. 10:143-150.

View this article via: PubMed

  1. Edwards, PA, Tabor, D, Kast, HR, Venkateswaran, A. Regulation of gene expression by SREBP and SCAP. Biochim Biophys Acta 2000. 1529:103-113.

View this article via: PubMed

  1. Sakakura, Y, et al. Sterol regulatory element-binding proteins induce an entire pathway of cholesterol synthesis. Biochem Biophys Res Commun 2001. 286:176-183.

View this article via: PubMed

  1. Goldstein, JL, Rawson, RB, Brown, MS. Mutant mammalian cells as tools to delineate the sterol regulatory element-binding protein pathway for feedback regulation of lipid synthesis. Arch Biochem Biophys 2002. 397:139-148.

View this article via: PubMed

  1. Shimomura, I, Shimano, H, Horton, JD, Goldstein, JL, Brown, MS. Differential expression of exons 1a and 1c in mRNAs for sterol regulatory element binding protein-1 in human and mouse organs and cultured cells. J Clin Invest 1997. 99:838-845.

View this article via: JCI.org PubMed

  1. Moon, Y-A, Shah, NA, Mohapatra, S, Warrington, JA, Horton, JD. Identification of a mammalian long chain fatty acyl elongase regulated by sterol regulatory element-binding proteins. J Biol Chem 2001. 276:45358-45366.

View this article via: PubMed

  1. Shimomura, I, Shimano, H, Korn, BS, Bashmakov, Y, Horton, JD. Nuclear sterol regulatory element binding proteins activate genes responsible for entire program of unsaturated fatty acid biosynthesis in transgenic mouse liver. J Biol Chem 1998. 273:35299-35306.

View this article via: PubMed

  1. Shimano, H, et al. Overproduction of cholesterol and fatty acids causes massive liver enlargement in transgenic mice expressing truncated SREBP-1a. J Clin Invest 1996. 98:1575-1584.

View this article via: JCI.org PubMed

  1. Shimano, H, et al. Isoform 1c of sterol regulatory element binding protein is less active than isoform 1a in livers of transgenic mice and in cultured cells. J Clin Invest 1997. 99:846-854.

View this article via: JCI.org PubMed

  1. Horton, JD, et al. Activation of cholesterol synthesis in preference to fatty acid synthesis in liver and adipose tissue of transgenic mice overproducing sterol regulatory element-binding protein-2. J Clin Invest 1998. 101:2331-2339.

View this article via: JCI.org PubMed

  1. Korn, BS, et al. Blunted feedback suppression of SREBP processing by dietary cholesterol in transgenic mice expressing sterol-resistant SCAP(D443N). J Clin Invest 1998. 102:2050-2060.

View this article via: JCI.org PubMed

  1. Shimano, H, et al. Elevated levels of SREBP-2 and cholesterol synthesis in livers of mice homozygous for a targeted disruption of the SREBP-1 gene. J Clin Invest 1997. 100:2115-2124.

View this article via: JCI.org PubMed

  1. Matsuda, M, et al. SREBP cleavage-activating protein (SCAP) is required for increased lipid synthesis in liver induced by cholesterol deprivation and insulin elevation. Genes Dev 2001. 15:1206-1216.

View this article via: PubMed

  1. Yang, J, et al. Decreased lipid synthesis in livers of mice with disrupted Site-1 protease gene. Proc Natl Acad Sci USA 2001. 98:13607-13612.

View this article via: PubMed

Liang, G, et al. Diminished hepatic response to fasting/refeeding and liver X receptor agonists in mice with selective deficiency of sterol regulatory element-binding protein-1c. J Biol Chem 2002. 277:9520-9528.

http://www.jci.org/articles/view/15593


Structural Biochemistry/Lipids/Membrane Lipids

< Structural Biochemistry‎ | Lipids

Membrane proteins rely on their interaction with membrane lipids to uphold its structure and maintain its functions as a protein. For membrane proteins to purify and crystallize, it is essential for the membrane protein to be in the appropriate lipid environment. Lipids assist in crystallization and stabilize the protein and provide lattice contacts. Lipids can also help obtain membrane protein structures in a native conformation. Membrane protein structures contain bound lipid molecules. Biological membranes are important in life, providing permeable barriers for cells and their organelles. The interaction between membrane proteins and lipids facilitates basic processes such as respiration, photosynthesis, transport, signal transduction and motility. These basic processes require a diverse group of proteins, which are encoded by 20-30% of an organism’s annotated genes.

There exist a great number of membrane lipids. Specifically, eukaryotic cells have a very complex collection of lipids that rely on many of the cell’s resources for its synthesis. Interactions between proteins and lipids can be very specific. Specific types of lipids can make a structure stable, provide control in insertion and folding processes, and help to assemble multisubunit complexes or supercomplexes, and most importantly, can significantly affect a membrane protein’s functions. Protein and lipid interactions are not sufficiently tight, meaning that lipids are retained during membrane protein purification. Since cellular membranes are fluid arrangements of lipids, some lipids affect interesting changes to membrane due to their characteristics. Glycosphigolipids and cholesterol tend to form small islands within the membranes, called lipid rafts, due to their physical properties. Some proteins also tend to cluster in lipid raft, while others avoid being in lipid rafts. However, the existence of lipid rafts in cells seems to be transitory.

Recent progress in determining membrane protein structure has brought attention to the importance of maintaining a favorable lipid environment so proteins to crystallize and purify successfully. Lipids assist in crystallization by stabilizing the protein fold and the relationships between subunits or monomers. The lipid content in protein-lipid detergent complexes can be altered by adjusting solubilisation and purification protocols, also by adding native or non-native lipids.

There are three type of membrane lipids: 1. Phospholipids: major class of membrane lipids. 2. glycolipids. 3. Cholesterols. Membrane lipids were started with eukaryotes and bacteria.

http://en.wikibooks.org/wiki/Structural_Biochemistry/Lipids/Membrane_Lipids

Types of Membrane Lipids

Lipids are often used as membrane constituents. The three major classes that membrane lipids are divided into are phospholipids, glycolipids, and cholesterol. Lipids are found in eukaryotes and bacteria. Although the lipids in archaea have many features that are related to the membrane formation that is similar with lipids of other organisms, they are still distinct from one another. The membranes of archaea differ in composition in three major ways. Firstly, the nonpolar chains are joined to a glycerol backbone by ether instead of esters, allowing for more resistance to hydrolysis. Second, the alkyl chains are not linear, but branched and make them more resistant to oxidation. The ability of archaeal lipids to resist hydrolysis and oxidation help these types of organisms to withstand the extreme conditions of high temperature, low pH, or high salt concentration. Lastly, the stereochemistry of the central glycerol is inverted. Membrane lipids have an extensive repertoire, but they possess a critical common structural theme in which they are amphipathic molecules, meaning they contain both a hydrophilic and hydrophobic moiety.

Membrane lipids are all closed bodies or boundaries separating substituent parts of the cell. The thickness of membranes is usually between 60 and 100 angstroms. These bodies are constructed from non-covalent assemblies. Their polar heads align with each other and their non-polar hydrocarbon tails align as well. The resulting stability is credited to hydrophobic interaction which proves to be quite stable due to the length of their hydrocarbon tails.


Membrane Lipids

Lipid Vesicles

Lipid vesicles, also known as liposomes, are vesicles that are essentially aqueous vesicles that are surrounded by a circular phospholipid bilayer. Like the other phospholipid structures, they have the hydrocarbon/hydrophobic tails facing inward, away from the aqueous solution, and the hydrophilic heads facing towards the aqueous solution. These vesicles are structures that form enclosed compartments of ions and solutes, and can be utilized to study the permeability of certain membranes, or to transfer these ions or solutes to certain cells found elsewhere.

Liposomes as vesicles can serve various clinical uses. Injecting liposomes containing medicine or DNA (for gene therapy) into patients is a possible method of drug delivery. The liposomes fuse with other cells’ membranes and therefore combine their contents with that of the patient’s cell. This method of drug delivery is less toxic than direct exposure because the liposomes carry the drug directly to cells without any unnecessary intermediate steps.

Because of the hydrophobic interactions among several phospholipids and glycolipids, a certain structure called the lipid bilayer or bimolecular sheet is favored. As mentioned earlier, phospholipids and glycolipids have both hydrophilic and hydrophobic moieties; thus, when several phospholipids or glycolipids come together in an aqueous solution, the hydrophobic tails interact with each other to form a hydrophobic center, while the hydrophilic heads interact with each other forming a hydrophilic coating on each side of the bilayer.

http://upload.wikimedia.org/wikibooks/en/b/ba/Liposome_final%2A.png

http://upload.wikimedia.org/wikibooks/en/f/fa/Membrane_bilayer.jpg


Liposome_

Liposome_


Membrane_bilayer

Membrane_bilayer


Evidence Report/Technology Assessment   Number 89


Effects of Omega-3 Fatty Acids on Lipids and Glycemic Control in Type II Diabetes and the Metabolic Syndrome and on Inflammatory Bowel Disease, Rheumatoid Arthritis, Renal Disease, Systemic Lupus Erythematosus, and Osteoporosis


Prepared for:

Agency for Healthcare Research and Quality

U.S. Department of Health and Human Services

540 Gaither Road

Rockville, MD 20850

http://www.ahrq.gov

Contract No. 290-02-0003


Chapter 1. Introduction

This report is one of a group of evidence reports prepared by three Agency for Healthcare Research and Quality (AHRQ)-funded Evidence-Based Practice Centers (EPCs) on the role of omega-3 fatty acids (both from food sources and from dietary supplements) in the prevention or treatment of a variety of diseases. These reports were requested and funded by the Office of Dietary Supplements, National Institutes of Health. The three EPCs – the Southern California EPC (SCEPC, based at RAND), the Tufts-New England Medical Center (NEMC) EPC, and the University of Ottawa EPC – have each produced evidence reports. To ensure consistency of approach, the three EPCs collaborated on selected methodological elements, including literature search strategies, rating of evidence, and data table design.

The aim of these reports is to summarize the current evidence on the effects of omega-3 fatty acids on prevention and treatment of cardiovascular diseases, cancer, child and maternal health, eye health, gastrointestinal/renal diseases, asthma, immune- mediated diseases, tissue/organ transplantation, mental health, and neurological diseases and conditions. In addition to informing the research community and the public on the effects of omega-3 fatty acids on various health conditions, it is anticipated that the findings of the reports will also be used to help define the agenda for future research.

This report focuses on the effects of omega-3 fatty acids on immune- mediated diseases, bone metabolism, and gastrointestinal/renal diseases. Subsequent reports from the SCEPC will focus on cancer and neurological diseases and conditions.

This chapter provides a brief review of the current state of knowledge about the metabolism, physiological functions, and sources of omega-3 fatty acids.


The Recognition of Essential Fatty Acids

Dietary fat has long been recognized as an important source of energy for mammals, but in the late 1920s, researchers demonstrated the dietary requirement for particular fatty acids, which came to be called essential fatty acids. It was not until the advent of intravenous feeding, however, that the importance of essential fatty acids was widely accepted: Clinical signs of essential fatty acid deficiency are generally observed only in patients on total parenteral nutrition who received mixtures devoid of essential fatty acids or in those with malabsorption syndromes.

These signs include dermatitis and changes in visual and neural function. Over the past 40 years, an increasing number of physiological functions, such as immunomodulation, have been attributed to the essential fatty acids and their metabolites, and this area of research remains quite active.1, 2

Fatty Acid Nomenclature

The fat found in foods consists largely of a heterogeneous mixture of triacylglycerols (triglycerides)–glycerol molecules that are each combined with three fatty acids. The fatty acids can be divided into two categories, based on chemical properties: saturated fatty acids, which are usually solid at room temperature, and unsaturated fatty acids, which are liquid at room temperature. The term “saturation” refers to a chemical structure in which each carbon atom in the fatty acyl chain is bound to (saturated with) four other atoms, these carbons are linked by single bonds, and no other atoms or molecules can attach; unsaturated fatty acids contain at least one pair of carbon atoms linked by a double bond, which allows the attachment of additional atoms to those carbons (resulting in saturation). Despite their differences in structure, all fats contain approximately the same amount of energy (37 kilojoules/gram, or 9 kilocalories/gram).

The class of unsaturated fatty acids can be further divided into monounsaturated and polyunsaturated fatty acids. Monounsaturated fatty acids (the primary constituents of olive and canola oils) contain only one double bond. Polyunsaturated fatty acids (PUFAs) (the primary constituents of corn, sunflower, flax seed and many other vegetable oils) contain more than one double bond. Fatty acids are often referred to using the number of carbon atoms in the acyl chain, followed by a colon, followed by the number of double bonds in the chain (e.g., 18:1 refers to the 18-carbon monounsaturated fatty acid, oleic acid; 18:3 refers to any 18-carbon PUFA with three double bonds).

PUFAs are further categorized on the basis of the location of their double bonds. An omega or n notation indicates the number of carbon atoms from the methyl end of the acyl chain to the first double bond. Thus, for example, in the omega-3 (n-3) family of PUFAs, the first double bond is 3 carbons from the methyl end of the molecule. The trivial names, chemical names and abbreviations for the omega-3 fatty acids are detailed in Table 1.1.  Finally, PUFAs can be categorized according to their chain length. The 18-carbon n-3 and n-6 short-chain PUFAs are precursors to the longer 20- and 22-carbon PUFAs, called long-chain PUFAs (LCPUFAs).

Fatty Acid Metabolism

Mammalian cells can introduce double bonds into all positions on the fatty acid chain except the n-3 and n-6 position. Thus, the short-chain alpha- linolenic acid (ALA, chemical abbreviation: 18:3n-3) and linoleic acid (LA, chemical abbreviation: 18:2n-6) are essential fatty acids.

No other fatty acids found in food are considered ‘essential’ for humans, because they can all be synthesized from the short chain fatty acids.

Following ingestion, ALA and LA can be converted in the liver to the long chain, more unsaturated n-3 and n-6 LCPUFAs by a complex set of synthetic pathways that share several enzymes (Figure 1). LC PUFAs retain the original sites of desaturation (including n-3 or n-6). The omega-6 fatty acid LA is converted to gamma-linolenic acid (GLA, 18:3n-6), an omega- 6 fatty acid that is a positional isomer of ALA. GLA, in turn, can be converted to the longerchain omega-6 fatty acid, arachidonic acid (AA, 20:4n-6). AA is the precursor for certain classes of an important family of hormone- like substances called the eicosanoids (see below).

The omega-3 fatty acid ALA (18:3n-3) can be converted to the long-chain omega-3 fatty acid, eicosapentaenoic acid (EPA; 20:5n-3). EPA can be elongated to docosapentaenoic acid (DPA 22:5n-3), which is further desaturated to docosahexaenoic acid (DHA; 22:6n-3). EPA and DHA are also precursors of several classes of eicosanoids and are known to play several other critical roles, some of which are discussed further below.

The conversion from parent fatty acids into the LC PUFAs – EPA, DHA, and AA – appears to occur slowly in humans. In addition, the regulation of conversion is not well understood, although it is known that ALA and LA compete for entry into the metabolic pathways.

Physiological Functions of EPA and AA

As stated earlier, fatty acids play a variety of physiological roles. The specific biological functions of a fatty acid are determined by the number and position of double bonds and the length of the acyl chain.

Both EPA (20:5n-3) and AA (20:4n-6) are precursors for the formation of a family of hormone- like agents called eicosanoids. Eicosanoids are rudimentary hormones or regulating – molecules that appear to occur in most forms of life. However, unlike endocrine hormones, which travel in the blood stream to exert their effects at distant sites, the eicosanoids are autocrine or paracrine factors, which exert their effects locally – in the cells that synthesize them or adjacent cells. Processes affected include the movement of calcium and other substances into and out of cells, relaxation and contraction of muscles, inhibition and promotion of clotting, regulation of secretions including digestive juices and hormones, and control of fertility, cell division, and growth.3

The eicosanoid family includes subgroups of substances known as prostaglandins, leukotrienes, and thromboxanes, among others. As shown in Figure 1.1, the long-chain omega-6 fatty acid, AA (20:4n-6), is the precursor of a group of eicosanoids that include series-2 prostaglandins and series-4 leukotrienes. The omega-3 fatty acid, EPA (20:5n-3), is the precursor to a group of eicosanoids that includes series-3 prostaglandins and series-5 leukotrienes. The AA-derived series-2 prostaglandins and series-4 leukotrienes are often synthesized in response to some emergency such as injury or stress, whereas the EPA-derived series-3 prostaglandins and series-5 leukotrienes appear to modulate the effects of the series-2 prostaglandins and series-4 leukotrienes (usually on the same target cells). More specifically, the series-3 prostaglandins are formed at a slower rate and work to attenuate the effects of excessive levels of series-2 prostaglandins. Thus, adequate production of the series-3 prostaglandins seems to protect against heart attack and stroke as well as certain inflammatory diseases like arthritis, lupus, and asthma.3.

EPA (22:6 n-3) also affects lipoprotein metabolism and decreases the production of substances – including cytokines, interleukin 1ß (IL-1ß), and tumor necrosis factor a (TNF-a) – that have pro-inflammatory effects (such as stimulation of collagenase synthesis and the expression of adhesion molecules necessary for leukocyte extravasation [movement from the circulatory system into tissues]).2 The mechanism responsible for the suppression of cytokine production by omega-3 LC PUFAs remains unknown, although suppression of omega-6-derived eicosanoid production by omega-3 fatty acids may be involved, because the omega-3 and omega-6 fatty acids compete for a common enzyme in the eicosanoid synthetic pathway, delta-6 desaturase.

DPA (22:5n-3) (the elongation product of EPA) and its metabolite DHA (22:6n-3) are frequently referred to as very long chain n-3 fatty acids (VLCFA). Along with AA, DHA is the major PUFA found in the brain and is thought to be important for brain development and function. Recent research has focused on this role and the effect of supplementing infant formula with DHA (since DHA is naturally present in breast milk but not in formula).

Dietary Sources and Requirements

Both ALA and LA are present in a variety of foods. LA is present in high concentrations in many commonly used oils, including safflower, sunflower, soy, and corn oil. ALA is present in some commonly used oils, including canola and soybean oil, and in some leafy green vegetables. Thus, the major dietary sources of ALA and LA are PUFA-rich vegetable oils. The proportion of LA to ALA as well as the proportion of those PUFAs to others varies considerably by the type of oil. With the exception of flaxseed, canola, and soybean oil, the ratio of LA to ALA in vegetable oils is at least 10 to 1. The ratios of LA to ALA for flaxseed, canola, and soy are approximately 1: 3.5, 2:1, and 8:1, respectively; however, flaxseed oil is not typically consumed in the North American diet. It is estimated that on average in the U.S., LA accounts for 89% of the total PUFAs consumed, and ALA accounts for 9%. Another estimate suggests that Americans consume 10 times more omega-6 than omega-3 fatty acids.4 Table 1.2 shows the proportion of omega 3 fatty acids for a number of foods.

Syntheis and Degradation

Source of Acetyl CoA for Fatty Acid Synthesis

Source of Acetyl CoA for Fatty Acid Synthesis

step 1

step 1

condensation reaction with malonyl ACP

ACP (acyl carrier protein)

ACP (acyl carrier protein)

synthesis requires acetyl CoA from citrate shuttle

synthesis requires acetyl CoA from citrate shuttle

conversion to fatty acyl co A in cytoplasm

conversion to fatty acyl co A in cytoplasm

ACP (acyl carrier protein)

ACP (acyl carrier protein)

FA synthesis not exactly reverse of catabolism

FA synthesis not exactly reverse of catabolism


Fatty Acid Synthase

Fatty Acid Synthase

complete FA synthesis

complete FA synthesis

Desaturation

Desaturation

Elongation and Desaturation of Fatty Acids

Elongation and Desaturation of Fatty Acids

release of FAs from adiposites

release of FAs from adiposites

Fatty acid beta oxidation and Krebs cycle produce NAD, NADH, FADH2

Fatty acid beta oxidation and Krebs cycle produce NAD, NADH, FADH2

ketone bodies

ketone bodies

metabolism of ketone bodies

metabolism of ketone bodies

Arachidonoyl-mimicking

Arachidonoyl-mimicking

Arachidonate pathways

Arachidonate pathways

arachidonic acid derivatives

arachidonic acid derivatives

major metabolic intermediates in the pathways for synthesis of cholesterol, fatty acids, and triglycerides

major metabolic intermediates in the pathways for synthesis of cholesterol, fatty acids, and triglycerides

Model for the sterol-mediated proteolytic release of SREBPs from membrane

Model for the sterol-mediated proteolytic release of SREBPs from membrane

hormone regulation

hormone regulation

 insulin receptor and and insulin receptor signaling pathway (IRS)

insulin receptor and and insulin receptor signaling pathway (IRS)

 islet brain glucose signaling

islet brain glucose signaling


Fish source

Fish source

omega FAs

omega FAs


Excessive omega 6s

Excessive omega 6s

omega 6s

omega 6s

diet and cancer

diet and cancer

Patients at risk of FA deficiency

Patients at risk of FA deficiency

PPAR role

PPAR role

PPAR role

PPAR role

Omega 6_3 pathways

Omega 6_3 pathways

n3 vs n6 PUFAs

n3 vs n6 PUFAs

triene-teraene ratio

triene-teraene ratio

arachidonic acid, leukotrienes, PG and thromboxanes

arachidonic acid, leukotrienes, PG and thromboxanes

Cox 2 and cancer

Cox 2 and cancer

Lipidomics of atherosclerotic plaques

Lipidomics of atherosclerotic plaques


Effect of TPN on EFAD

Effect of TPN on EFAD

benefits of omega 3s

benefits of omega 3s

food consumption

food consumption


Read Full Post »

Risk of Major Cardiovascular Events by LDL-Cholesterol Level (mg/dL): Among those treated with high-dose statin therapy, more than 40% of patients failed to achieve an LDL-cholesterol target of less than 70 mg/dL.

Reporter: Aviva Lev-Ari, PhD, RN

UPDATED on 9/15/2025

Jamal Rana MD FACCJamal Rana MD FACC  

• 2ndVerified • 2ndChair (APIC) Medical Specialties & Interventional Services, People Operations, Professional Development TPMG | Clinician Researcher | Past President California ACC I Professor Department of Clinical Science KPSOMChair (APIC) Medical Specialties & Interventional Services, People Operations, Professional Development TPMG | Clinician Researcher | Past President California ACC I Professor Department of Clinical Science KPSOM4d

•  4 days ago • Visible to anyone on or off LinkedIn

“The Importance of Being Ernest” about #LDL Cholesterol

Our latest paper out in JACC Journals, led by Dr. Peng & Dr. Eugenia Gianos.
LINK: https://lnkd.in/gNqrjzSv

⚡ We asked if cumulative LDL-Cholesterol exposure in individuals with a Coronary artery Calcium hashtag#CAC of 0 associated with higher rates of long-term cardiovascular events?
⚡ We found that despite CAC of 0, long-term cumulative LDL-C exposure is associated with significantly higher CVD risk, highlighting hashtag#early individualized risk factor optimization and hashtag#CVDprevention across the hashtag#lifecourse.
⚡ Although patients with CAC = 0 have overall low CVD risk, their risk is not zero, and that risk increases with cumulative LDL-C exposure.
⚡ Cumulative LDL-C exposure during early adulthood starting in one’s teens to early 20s contributes to increased risk.
⚡ I have started to use the term hashtag#LDLYears more and more. From lifestyle to so many pharmaceutical therapy options, focusing primary prevention is still better than secondary prevention, as many patients do not survive their 1st heart attack!

Original Article

JACC Journals › JACC › Archives › Vol. 86 No. 9

25 August 2025

Impact of LDL-Cholesterol When the Coronary Artery Calcium Score Is 0: Long-Term Cardiovascular Events

Authors: Allison W. Peng, Alexander C. Razavi, John T. Wilkins, Norrina B. Allen, Laurence S. Sperling, Jamal S. Rana, Tia Bimal, Seamus P. Whelton, Michael J. Blaha, Roger S. Blumenthal, and Eugenia Gianos egianos@northwell.eduAuthors Info & Affiliations

Publication: JACC, Volume 86, Number 9

https://www.jacc.org/doi/abs/10.1016/j.jacc.2025.06.053


@@@@@@@@@

Lower LDL Still Best: Very Low Levels of LDL Linked with Reduced CV Events

July 28, 2014


AMSTERDAM, THE NETHERLANDS — The question of how low LDL-cholesterol levels should be in the present statin era, recently addressed with the new US clinical guidelines, is once again questioned with the new publication of a patient-level meta-analysis of eight clinical trials investigating statin therapy[1].


The new meta-analysis, published July 28, 2014 in the Journal of the American College of Cardiology, suggests that lowering LDL-cholesterol levels to very low levels results in a significant reduction in cardiovascular events. Individuals with LDL-cholesterol levels <50 mg/dL had a significantly lower risk of major cardiovascular events compared with individuals who had higher LDL-cholesterol levels, including those with LDL levels 50 to <75 mg/dL and 75 to <100 mg/dL.


The Results From the Meta-analysis


The investigators, including first author Dr Matthijs Boekholdt (Academic Medical Center), analyzed eight trials and 38 153 patients treated with statin therapy. The studies included some of the landmark statin trials, including AFCAPS-TexCAPS , 4S , LIPID , SPARCL , TNT , IDEAL , and JUPITER .


The investigators observed a large degree of interindividual variability in the reductions of LDL cholesterol, non-HDL cholesterol, and apolipoprotein B (apoB) levels with statin therapy. Among those treated with high-dose statin therapy, more than 40% of patients failed to achieve an LDL-cholesterol target of less than 70 mg/dL.


Compared with individuals with LDL-cholesterol levels >175 mg/dL, which served as the reference group, individuals who achieved lower levels of LDL cholesterol had a significantly lower risk of major cardiovascular events. For those with LDL-cholesterol levels <50 mg/dL, 50 to <75 mg/dL, and 75 to <100 mg/dL, the relative reduction in risk was 56%, 49%, and 44%, respectively. Regarding the end point of major coronary events and cerebrovascular events, a similar trend was observed with lower LDL cholesterol levels.


Risk of Major Cardiovascular Events by LDL-Cholesterol Level (mg/dL)


Outcome LDL <50 50 to <75 75 to <100 100 to <125 125 to <150 150 to <175 > 175
Major cardiovascular events 0.44 (0.35–0.55) 0.51 (0.42–0.62) 0.56 (0.46–0.67) 0.58 (0.48–0.69) 0.64 (0.53–0.79) 0.71 (0.56–0.89) 1.00 (ref)


References


  1. Boekholdt SM, Hovingh GK, Mora S, et al. Very low levels of atherogenic lipoprotein and the risk for cardiovascular events. J Am Coll Cardiol 2014; DOI:10.1016.j.jacc.2014.02.615. Available at:http://content.onlinejacc.org/journal.aspx
  2. Ben-Yehuda O, DeMaria AN. LDL-cholesterol after the ACC/AHA 2013 guidelines. J Am Coll Cardiol 2014; DOI:10.1016.j.jacc.2014.05.020. Available at: http://content.onlinejacc.org/journal.aspx

SOURCE

http://www.medscape.com/viewarticle/828967?nlid=62503_2562&src=wnl_edit_medp_card&uac=93761AJ&spon=2


Other related articles published in this Open Access Online Scientific Journal include the following:


  • Endothelium, Angiogenesis, and Disordered Coagulation

What is the Role of Plasma Viscosity in Hemostasis and Vascular Disease Risk? 

Larry H Bernstein, MD, FACP and Aviva Lev-Ari, PhD, RN

Special Considerations in Blood Lipoproteins, Viscosity, Assessment and Treatment 

Larry H Bernstein, MD, FACP  and Aviva Lev-Ari, PhD, RN

Coagulation: Transition from a Familiar Model tied to Laboratory Testing, and the New Cellular-driven Model

Larry H Bernstein, MD, FACP

Telling NO to Cardiac Risk‘

Stephen J Williams, PhD

Nitric Oxide Function in Coagulation – Part II

Larry H Bernstein, MD, FACP

Nitric Oxide, Platelets, Endothelium and Hemostasis (Coagulation Part II)

Larry H Bernstein, MD, FACP

Peroxisome Proliferator-Activated Receptor (PPAR-gamma) Receptors Activation: PPARγ Transrepression for Angiogenesis in Cardiovascular Disease and PPARγ Transactivation for Treatment of Diabetes 

Aviva Lev-Ari, PhD, RN

  • Hypertension BioMarkers

Hypertension – JNC 8 Guideline: Henry R. Black, MD, Michael A. Weber, MD and Raymond R. Townsend, MD

Aviva Lev-Ari, PhD, RN

Imaging Biomarker for Arterial Stiffness: Pathways in Pharmacotherapy for Hypertension and Hypercholesterolemia Management

Justin D. Pearlman, MD, PhD and Aviva Lev-Ari, PhD, RN

Hypertension and Vascular Compliance: 2013 Thought Frontier – An Arterial Elasticity Focus

Justin D. Pearlman, MD, PhD and Aviva Lev-Ari, PhD, RN

Arterial Hypertension in Young Adults: An Ignored Chronic Problem

Manuela Stoicescu, MD, PhD

An Important Marker of Hypertension in Youth

Manuela Stoicescu, MD, PhD

IF Elevated Pediatric Blood Pressure THEN High Adult Arterial Stiffness

Aviva Lev-Ari, PhD, RN

2014 High Blood Pressure Research Conference, 9/9 – 9/12, 2014 — Hilton SF Union Square, San Francisco, CA

Aviva Lev-Ari, PhD, RN


  • Inflammatory, Atherosclerotic and Heart Failure Markers

Cardiovascular Risk: C-Reactive Protein BioMarker and Plasma Fibrinogen

Aviva Lev-Ari, PhD, RN

Clinical Trials Results for Endothelin System: Pathophysiological role in Chronic Heart Failure, Acute Coronary Syndromes and MI ­Marker of Disease Severity or Genetic Determination?

Aviva Lev-Ari, PhD, RN

The Cardiorenal Syndrome in Heart Failure: Cardiac? Renal? syndrome?

Larry H. Bernstein, MD, FCAP and Aviva Lev-Ari, PhD, RN

Voices from the Cleveland Clinic On Circulating apoA1: A Biomarker for a Proatherogenic Process in the Artery Wall

Aviva Lev-Ari, PhD, RN

Voice from the Cleveland Clinic: On the New Lipid Guidelines and On the ACC/AHA Risk Calculator

Aviva Lev-Ari, PhD, RN

Atherogenesis: Predictor of CVD ­ the Smaller and Denser LDL Particles

Aviva Lev-Ari, PhD, RN

Cardiovascular Risk Inflammatory Marker: Risk Assessment for Coronary Heart Disease and Ischemic Stroke ­ Atherosclerosis.  

Aviva Lev-Ari, PhD, RN

Recombinant Human Lecithin-Cholesterol Acyltransferase (rhLCAT): New Biomarker for Atherosclerosis

Aviva Lev-Ari, PhD, RN

Identification of Biomarkers that are Related to the Actin Cytoskeleton

Larry H Bernstein, MD, FCAP

Leptin Signaling in Mediating the Cardiac Hypertrophy associated with Obesity

Larry H Bernstein, MD, FCAP and Aviva Lev-Ari, PhD, RN

Publications on Heart Failure by Prof. William Gregory Stevenson, M.D.

Aviva Lev-Ari, PhD, RN

CVD Prevention and Evaluation of Cardiovascular Imaging Modalities: Coronary Calcium Score by CT Scan Screening to justify or not the Use of Statin

Aviva Lev-Ari, PhD, RN


Read Full Post »

Malnutrition in India, High Newborn Death Rate and Stunting of Children Age Under Five Years

Curator: Larry H Bernstein, MD, FCAP


A lead report in the New York Times focuses on a major public health problem in India today, with the irony of high growth rate and malnutrition and stunting of children under age 5 years that occurs in the majority and wealthy Hindu population, but not to any comparable degree in the Muslim population or in Bangladesh.  This is prevalent along the Ganges River, which crosses India below the Himalaya Mountains.  The inference is that the problem is perhaps solely related to poor sanitation, which is to a large degree indisputable, and the disease is related to the gut microbiome (not so stated), that leaves an intestinal mucosa with flattened epithelia, and no observation is made of the submucosal thymic-derived T-cell lymphocyte population, the largest in the human body.

Moreover, I might point out that the turnover of the intestinal epithelium with its large surface area is very high under normal metabolic circumstances.  The result is that the children are malnourished, and they have visceral protein losses as well as somatic protein loss (stunted growth, probably affecting both skeletal muscle and the metaphyseal growth plates of long bones).  This is not quite stated this way.

The irony is that they have sufficient food supply, except that if there is a diarrhea or intestinal malabsorption at an early age, the children just might not eat, except for perhaps soft foods.  So it is not explicitly cleat that their is sufficient animal protein in the diet, which has a S:N ratio that is roughly twice that of an exclusively plant diet.  The distinction is made between marasmus and kwashiorkor in that in kwashiorkor the protein deficiency is in the visceral compartment.  Consequently, there is a reprioriotization of the liver to synthesize acute phase proteins with a decline in albumin, transthyretin, and retinol-binding protein.  This is not insignificant, even though there may also be an inflammatory state, as from repeated infections.

I certainly would be interested in seeing data from the ongoing study that measures the serum protein analytes, and also a measurement of serum red cell Hb, serum cysteine, homocysteine, and glutathione, and perhaps a muscle biopsy.

I go directly to the article at this point.

Poor Sanitation in India May Afflict Well-Fed Children With Malnutrition

By GARDINER HARRIS      JULY 13, 2014
http://www.nytimes.com/2014/07/15/world/asia/poor-sanitation-in-india-may-afflict-well-fed-children-with-malnutrition.html

SHEOHAR DISTRICT, India — He wore thick black eyeliner to ward off the evil eye, but Vivek, a tiny 1-year-old living in a village of mud huts and diminutive people, had nonetheless fallen victim to India’s great scourge of malnutrition.

His parents seemed to be doing all the right things. His mother still breast-fed him. His family had six goats, access to fresh buffalo milk and a hut filled with hundreds of pounds of wheat and potatoes. The economy of the state where he lives has for years grown faster than almost any other. His mother said she fed him as much as he would eat and took him four times to doctors, who diagnosed malnutrition. Just before Vivek was born in this green landscape of small plots and grazing water buffalo near the Nepali border, the family even got electricity.

So why was Vivek malnourished?

‘Bihar grew at 12% last 7 years’

Abhay Singh, TNN | Feb 15, 2014, 02.15AM IST


Bihar's average annual growth rate has been 12% in the last seven fiscal years

Bihar’s average annual growth rate has been 12% in the last seven fiscal years


The report has taken 1999-2006 as the cut-off period to highlight spectacular Bihar turnaround story achieved under CM Nitish Kumar.

PATNA: Bihar’s average annual growth rate has been 12% in the last seven fiscal years, one of the highest among all Indian states, on the back of high growth rate achieved in the agriculture and allied sectors. Besides, advancement has also been made in healthcare and education.

The state’s Economic Survey Report for 2013-14, which was tabled in the assembly on Friday, has concluded this. The summary of the report said, “During 1990-91 to 2005-06, the state’s income at constant prices grew at an annual rate of 5.7%.” It said after that the economy witnessed a turnaround and grew at an annual rate of 12%. “The rate of growth achieved by the economy during 2006-13 is not only much higher, but also one of the highest among all Indian states.”

The report has taken 1999-2006 as the cut-off period to highlight spectacular Bihar turnaround story achieved under CM Nitish Kumar.


Poor Sanitation Linked to Malnutrition in India

New research on malnutrition, which leads to childhood stunting, suggests that a root cause may be an abundance of human waste polluting soil and water, rather than a scarcity of food.

SANITATION - bathing in Ganges River contaminated by human waste

SANITATION – bathing in Ganges River contaminated by human waste


Like almost everyone else in their village, Vivek and his family have no toilet, and the district where they live has the highest concentration of people who defecate outdoors. As a result, children are exposed to a bacterial brew that often sickens them, leaving them unable to attain a healthy body weight no matter how much food they eat.

“These children’s bodies divert energy and nutrients away from growth and brain development to prioritize infection-fighting survival,” said Jean Humphrey, a professor of human nutrition at Johns Hopkins Bloomberg School of Public Health. “When this happens during the first two years of life, children become stunted. What’s particularly disturbing is that the lost height and intelligence are permanent.”

Two years ago, Unicef, the World Health Organization and the World Bank released a major report on child malnutrition that focused entirely on a lack of food. Sanitation was not mentioned. Now, Unicef officials and those from other major charitable organizations said in interviews that they believe that poor sanitation may cause more than half of the world’s stunting problems.

“Our realization about the connection between stunting and sanitation is just emerging,” said Sue Coates, chief of water, sanitation and hygiene at Unicef India. “At this point, it is still just an hypothesis, but it is an incredibly exciting and important one because of its potential impact.”

This research has quietly swept through many of the world’s nutrition and donor organizations in part because it resolves a great mystery: Why are Indian children so much more malnourished than their poorer counterparts in sub-Saharan Africa?

A child raised in India is far more likely to be malnourished than one from the Democratic Republic of Congo, Zimbabwe or Somalia, the planet’s poorest countries. Stunting affects 65 million Indian children under the age of 5, including a third of children from the country’s richest families.

This disconnect between wealth and malnutrition is so striking that economists have concluded that economic growth does almost nothing to reduce malnutrition.

Half of India’s population, or at least 620 million people, defecate outdoors. And while this share has declined slightly in the past decade, an analysis of census data shows that rapid population growth has meant that most Indians are being exposed to more human waste than ever before.

In Sheohar, for instance, a toilet-building program between 2001 and 2011 decreased the share of households without toilets to 80 percent from 87 percent, but population growth meant that exposure to human waste rose by half.

“The difference in average height between Indian and African children can be explained entirely by differing concentrations of open defecation,” said Dean Spears, an economist at the Delhi School of Economics. “There are far more people defecating outside in India more closely to one another’s children and homes than there are in Africa or anywhere else in the world.”


SANITATION-children defecate outside - 162 million malnourished and stunted

SANITATION-children defecate outside – 162 million malnourished and stunted


Not only does stunting contribute to the deaths of a million children under the age of 5 each year, but those who survive suffer cognitive deficits and are poorer and sicker than children not affected by stunting. They also may face increased risks for adult illnesses like diabetes, heart attacks and strokes.

“India’s stunting problem represents the largest loss of human potential in any country in history, and it affects 20 times more people in India alone than H.I.V./AIDS does around the world,” said Ramanan Laxminarayan, vice president for research and policy at the Public Health Foundation of India.

India is an increasingly risky place to raise children. The country’s sanitation and air quality are among the worst in the world. Parasitic diseases and infections like tuberculosis, often linked with poor sanitation, are most common in India. More than one in four newborn deaths occur in India.

Open defecation has long been an issue in India. Some ancient Hindu texts advised people to relieve themselves far from home, a practice that Gandhi sought to curb.

“The cause of many of our diseases is the condition of our lavatories and our bad habit of disposing of excreta anywhere and everywhere,” Gandhi wrote in 1925.

SANITATION-disposing of excreta anywhere and everywhere

SANITATION-disposing of excreta anywhere and everywhere


Other developing countries have made huge strides in improving sanitation. Just 1 percent of Chinese and 3 percent of Bangladeshis relieve themselves outside compared with half of Indians. Attitudes may be just as important as access to toilets. Constructing and maintaining tens of millions of toilets in India would cost untold billions, a price many voters see no need to pay — a recent survey found that many people prefer going to the bathroom outside.

Few rural households build the sort of inexpensive latrines that have all but eliminated outdoor waste in neighboring Bangladesh.

“We need a cultural revolution in this country to completely change people’s attitudes toward sanitation and hygiene,” said Jairam Ramesh, an economist and former sanitation minister.

India’s government has for decades tried to resolve the country’s stubborn malnutrition problems by distributing vast stores of subsidized food. But more and better food has largely failed to reverse early stunting, studies have repeatedly shown.

India now spends about $26 billion annually on food and jobs programs, and less than $400 million on improving sanitation — a ratio of more than 60 to 1.

Lack of food is still an important contributor to malnutrition for some children, and some researchers say the field’s sudden embrace of sanitation has been overdone. “In South Asia, a more important factor driving stunting is diet quality,” said Zulfiqar A. Bhutta, a director of the Center for Global Child Health at the Hospital for Sick Children in Toronto.

Studies are underway in Bangladesh, Kenya and Zimbabwe to assess the share of stunting attributable to poor sanitation. “Is it 50 percent? Ninety percent? That’s a question worth answering,” said Dr. Stephen Luby, a professor of medicine at Stanford University who is overseeing a trial in Bangladesh that is expected to report its results in 2016. “In the meantime, I think we can all agree that it’s not a good idea to raise children surrounded by poop.”

Better sanitation in the West during the 19th and early 20th centuries led to huge improvements in health long before the advent of vaccines and antibiotics, and researchers have long known that childhood environments play a crucial role in child death and adult height.

The present research on gut diseases in children has focused on a condition resulting from repeated bacterial infections that flatten intestinal linings, reducing by a third the ability to absorb nutrients. A recent study of starving children found that they lacked the crucial gut bacteria needed to digest food.

In a little-discussed but surprising finding, Muslim children in India are 17 percent more likely to survive infancy than Hindus, even though Muslims are generally poorer and less educated. This enormous difference in infant mortality is explained by the fact that Muslims are far more likely to use latrines and live next to others also using latrines, a recent analysis found.

So widespread housing discrimination that confines many Muslims to separate slums may protect their children from increased exposure to the higher levels of waste in Hindu communities and, as a result, save thousands of Indian Muslim babies from death each year.

SANITATION-one in 4 newborn deaths related to sanitation

SANITATION-one in 4 newborn deaths related to sanitation


Discussion:

The coexistence of poor sanitation, where has a very large cultural barrier, with serious protein-energy malnutrition, is a toxic mix.  There is the comparison with the Muslim population at the adjoining border of the Ganges River outflow in Bangladesh.  One might also look at the catholic Portuguese population in Goa, the Jewish population in Mumbai and Kochi, and the nearby Catholic population.  There is no malnutrition in those populations, or in the Siiks.  This is undoubtedly a cultural phenomenon of ancient origin.  (The migration of the jews and of the catholics to Kochi occurred around the Indian Ocean at the time of Christ.  The catholic population in Goa was from Portugal.

I don’t think we have enough of the story here.  The Ganges river flows centrally across India, and is not far from the Himalayas.  This has some significance in the sufficiency of animal protein availability, and most importantly, of what I might expect of the tissue S:N ratio, which is critical for availability of methionine, S-adenosyl methionine, and mitochondrial energy reactions.  These are also mediated by transsulfuration reactions and by cystathionine beta-synthase.  Detailed discussions are available elsewhere.   It has been pointed out by Vernon Young and Yve Ingenbleek that sulfur is insufficient in the soil where there is not a lava flow of volcanic ash, which could be the case here.  So it is at best not a good geographic situation, even before compounding the issue.

The relationship to heart attack and stroke is established for elevated homocysteine.

Homocysteine and Vascular Disease
STEVEN E . S. MINER , M.D. , DAVID E .C. COLE *, M.D. , PHD. AND DUNCAN J . STEWART, M.D.
Cardiology Rounds   A U G U S T 1 9 9 6 ;  I(5)

Homocysteine is a naturally occurring, sulfur-containing amino acid. Continuously formed and catabolized in vivo, its metabolism is dependent on a complex interaction of genetics and physiology (Fig. 1). Its relevance is based on the increasing recognition of the correlation between elevated levels of homocysteine and human disease.

Table 1
Selected Determinants of Plasma Homocysteine*
1. Genetic
• Cystathionine-beta-synthase:
heterozygote mutations 0.5-1.5% {451}
• Methionine synthase: rare
• MTHFR: heterozygote mutations
approximately 50% {403}
2. Physiologic
• age: Hcy increases with increasing age {336}
• sex: pre-and post-menopausal women
have lower levels than men {247}
• diet: related to methionine and vitamin cofactor
(folate, vitamins B6 and B12) intake {437}
• alcohol: relationship unclear {375}
3. Pathologic
• vitamin deficiency: increased homocysteine
concentrations {10}
• renal disease: increase correlated
with increasing serum creatinine {81}
• transplantation: increased levels {149, 435}
• post stroke: transiently decreased levels {341}
• severe psoriasis: elevated levels {438}
4. Medications
• oral contraceptives/hormone replacement:
decreased levels {269}
• corticosteriods: increased {159}
• cyclosporine: increased {393}
• smoking: increased {336}

Abstracts of Interest
Serum total homocysteine and coronary heart disease in middleaged
British men.
IJ PERRY, H REFSUM, RW MORRIS, SB EBRAHIM, PM UELAND, AG SHAPER.
D E PA RTMENT OF PRIMARY CARE & POPULATION SCIENCES, ROYAL FREE
H O S P I TAL SCHOOL OF MEDICINE, LONDON, AND DEPA RTMENT OF CLINICAL
B I O L O G Y, UNIVERSITY OF BERGEN, NORWAY.
Serum total homocysteine (tHcy) levels are inversely associated with dietary intake of folic acid and B vitamins. Raised tHcy levels have been linked with coronary heart disease (CHD). We have examined the association between tHcy concentration and the subsequent risk of CHD, using a nested case control study design, within a prospective study of cardiovascular disease in British men. tHcy concentration was measured in serum samples, stored at entry to the study, from 110 incident cases of myocardial infarction and 118 controls. Cases were randomly sampled from events which occured after the first five years of follow-up. Cases and controls were frequency matched by town and age group. Levels of homocysteine [geometric mean (95% CI)] were significantly higher in cases than controls: homocysteine 13.5 (12.6 – 14.3) μmol/L vs 11.9 (11.3 – 12.6) μmol/L; p=0.005. There was a graded increase in the relative risk (odds ratio; OR) of CHD in the 2nd, 3rd and 4th quartile of tHcy (OR 1.4, 1.9, 2.2; trend p=0.006) relative to the first quartile. Adjustment for age, town, social class, body mass index, smoking, physical activity, alcohol intake, hypertensive status, serum cholesterol, and serum creatinine did not attenuate this association, (OR 2.1, 2.3, 2.7; trend p=0.04). tHcy levels were higher at baseline in men with evidence of pre-existing CHD and (as expected) adjustment for this factor attenuated the linear association between tHcy and subsequent events, trend p=0.07. The findings suggest that homocysteine is an independent risk factor for CHD
with no threshold level.
Reprinted from Heart, Volume 75 /Number 5 (Supplement 1), May 1996.
Homocysteine and Coronary Atherosclerosis
ELLEN L. MAYER, MD, DONALD W. JACOBSEN, PHD, KILLIAN ROBINSON, MD,
FACC, CLEVELAND, OHIO
The conventional risk factors for premature coronary artery disease include smoking, hyperlipidemia, hypertension, diabetes and a positive family history. However, many patients have precocious atherosclerosis without having any of these standard risk factors. Identification of other markers that increase the risk of coronary disease may improve our understanding of the pathophysiologic mechanisms of this disorder and allow the development of new preventive or therapeutic measures. An elevated plasma homocysteine level has recently received greater attention as an important risk factor for vascular disease, including coronary atherosclerosis. This review discusses the biochemistry of homocysteine and the related metabolic importance of folate, vitamin B6 (pyridoxine) and B12 (cobalamin) as well as a number of essential enzymes. The major factors that influence homocysteine concentration are genetic, nutritional and pathologic.
There is a large body of experimental and clinical evidence for high plasma homocysteine to be a risk factor for vascular disease, including coronary atherosclerosis.
Excerpted from Journal of the American College of Cardiology 1996;27:517-27

An important meta-analysis by Boushey et al in 1995 further quantified the magnitude of risk. In their analysis of all major studies available at that time, they found a linear, independent risk  for increments in homocysteine. There were no levels above or below which an incremental rise in homocysteine did not affect cardiovascular risk. Specifically, every 5 μmol/L increment in homocysteine was found to be associated with odds ratios of 1.6 for m e n ; (95% Cl 1.4-1.7) and 1.8 for women; (95% CI 1.3-1.9) for coronary artery disease.

Cystathionine beta synthase (CBS) catalyzes the reaction taking homocysteine to cystathionine. This enzyme requires pyridoxine as a co-factor and is an integral part of the transsulfuration or
pyridoxine – dependent pathway. 33 distinct mutations have been identified with heterozygosity occurring at a prevalence of 0.5-1.5%. The majority of heterozygotes will have normal fasting homocysteine levels, but can be detected with a methionine load test.

Hyperhomocysteinemia is a Biomarker of Sulfur-Deficiency in Human Morbidities

Yves Ingenbleek
Laboratory of Nutrition, University Louis Pasteur Strasbourg, France
The Open Clinical Chemistry Journal, 2009, 2, 49-60

Abstract: Methionine (Met) is crucially involved in the synthesis of S-compounds endowed with molecular, structural and functional properties of survival value. Dietary Met may undergo transmethylation processes to release homocysteine (Hcy) which may either be regenerated to Met following remethylation (RM) pathways or catabolized along the transsulfuration
(TS) cascade. The activity of enzymes governing RM and TS pathways is depending on pyridoxine, folate and cobalamin bioavailability. Dietary restriction in any of these watersoluble B-vitamins may lead to hyperhomocysteinemia (HHcy) causing a panoply of cardiovascular disorders. Taken together, the vitamin triad only affords partial account of Hcy variance, prompting the search for additional causal factor(s). Body composition studies demonstrate that nitrogen (N) and sulfur (S) maintain tightly correlated concentrations in tissues of both healthy subjects and diseased patients. Any morbid condition characterized by insufficient N intake or assimilation, as seen in protein malnutrition or intestinal malabsorption, reduces body S accretion rates. Excessive urinary N-losses, as reported in acute or chronic inflammatory disorders, entail proportionate obligatory S-losses. As a result, lean body mass (LBM) undergoes downsizing and concomitant depletion of N and S body stores which depresses the activity of cystathionine-􀀁-synthase, thereby promoting upstream accumulation of Hcy and overstimulation of RM processes. HHcy thus appears as the dark side of efforts developed by S-deprived patients to safeguard Met homeostasis. Irrespective of vitamin-B status, Hcy values are negatively correlated with LBM shrinkage well identified by the serial measurement of plasma transthyretin (TTR). The S deprivation theory fulfills the gap and allows full causal coverage of the metabolic anomaly, hence providing together with vitamin-deficiencies an unifying overview of the main nutritional determinants implicated in HHcy epidemiology.

The Oxidative Stress of Hyperhomocysteinemia Results from Reduced Bioavailability of Sulfur-Containing Reductants

Yves Ingenbleek
Laboratory of Nutrition, Faculty of Pharmacy, University Louis Pasteur Strasbourg, France
The Open Clinical Chemistry Journal, 2011, 4, 34-44

Abstract: Vegetarian subjects consuming subnormal amounts of methionine (Met) are characterized by subclinical protein malnutrition causing reduction in size of their lean body mass (LBM) best identified by the serial measurement of plasma transthyretin (TTR). As a result, the transsulfuration pathway is depressed at cystathionine-beta-synthase (C-b-S) level triggering the upstream sequestration of homocysteine (Hcy) in biological fluids and promoting its conversion to Met. Maintenance of beneficial Met homeostasis is counterpoised by the drop of cysteine (Cys) and glutathione (GSH) values downstream to CbS causing in turn declining generation of hydrogen sulfide (H2S) from enzymatic sources. The biogenesis of H2S via non-enzymatic reduction is further inhibited in areas where earth’s crust is depleted in elemental sulfur (S8) and sulfate oxyanions. Combination of subclinical malnutrition and S8-deficiency thus maximizes the defective production of Cys, GSH and H2S reductants, explaining persistence of unabated oxidative burden. The clinical entity increases the risk of developing cardiovascular diseases (CVD) and stroke in underprivileged plant-eating populations regardless of Framingham criteria and vitamin-B status. Although unrecognized up to now, the nutritional disorder is one of the commonest worldwide, reaching top prevalence in populated regions of Southeastern Asia. Increased risk of hyperhomocysteinemia and oxidative stress may also affect individuals suffering from intestinal malabsorption or westernized communities
having adopted vegan dietary lifestyles.


Read Full Post »

Larry H. Bernstein, MD, FCAP, Curator

http://pharmaceuticalinnovation/6/7/2014/Omega-3 fatty acids, depleting the source, and protein insufficiency in renal disease


This article is concerned only with updating the importance of key nutrients for maintenance of health. Nutritional losses are associated with memory loss, impaired immunity, and loss of lean body mass.


Low levels of omega-3 fatty acids may cause memory problems

Disease and Conditions, General Diet • Tags: Alzheimer’s disease, American Academy of Neurology, Docosahexaenoic acid, Magnetic resonance imaging, Neurology, Omega-3 fatty acid, United States Environmental Protection Agency, University of California Los Angeles

09 Mar 2012


ST. PAUL, Minn. – A diet lacking in omega-3 fatty acids, nutrients commonly found in fish, may cause your brain to age faster and lose some of its memory and thinking abilities, according to a study published in the February 28, 2012, print issue of Neurology®, the medical journal of the American Academy of Neurology. Omega-3 fatty acids include the nutrients called docosahexaenoic acid (DHA) and eicosapentaenoic acid (EPA).

salmon dinner

salmon dinner


“People with lower blood levels of omega-3 fatty acids had lower brain volumes that were equivalent to about two years of structural brain aging,” said study author Zaldy S. Tan, MD, MPH, of the Easton Center for Alzheimer’s Disease Research and the Division of Geriatrics, University of California at Los Angeles.

For the study, 1,575 people with an average age of 67 and free of dementia underwent MRI brain scans. They were also given tests that measured mental function, body mass and the omega-3 fatty acid levels in their red blood cells.

The researchers found that people whose DHA levels were among the bottom 25 percent of the participants had lower brain volume compared to people who had higher DHA levels. Similarly, participants with levels of all omega-3 fatty acids in the bottom 25 percent also scored lower on tests of visual memory and executive function, such as problem solving and multi-tasking and abstract thinking.

Related articles


Mechanisms of muscle wasting in chronic kidney disease.

Xiaonan H Wang, William E Mitch

Nature Reviews Nephrology (Impact Factor: 7.94). 07/2014; DOI: 10.1038/nrneph.2014.112

Source: PubMed

ABSTRACT In patients with chronic kidney disease (CKD), loss of cellular proteins increases the risks of morbidity and mortality. Persistence of muscle protein catabolism in CKD results in striking losses of muscle proteins as whole-body protein turnover is great; even small but persistent imbalances between protein synthesis and degradation cause substantial protein loss. No reliable methods to prevent CKD-induced muscle wasting currently exist, but mechanisms that control cellular protein turnover have been identified, suggesting that therapeutic strategies will be developed to suppress or block protein loss. Catabolic pathways that cause protein wasting include activation of the ubiquitin-proteasome system (UPS), caspase-3, lysosomes and myostatin (a negative regulator of skeletal muscle growth). These pathways can be initiated by complications associated with CKD, such as metabolic acidosis, defective insulin signalling, inflammation, increased angiotensin II levels, abnormal appetite regulation and impaired microRNA responses. Inflammation stimulates cellular signalling pathways that activate myostatin, which accelerates UPS-mediated catabolism. Blocking this pathway can prevent loss of muscle proteins. Myostatin inhibition could yield new therapeutic directions for blocking muscle protein wasting in CKD or disorders associated with its complications.


We’re Fishing the Oceans Dry. It’s Time to Reconsider Fish Farms.

Food and Agriculture Organization of the United Nations -State of World Fisheries and Aquaculture  2014

Food and Agriculture Organization of the United Nations -State of World Fisheries and Aquaculture 2014


Aquaculture has gotten much greener, with American innovators leading the way.

— Text by Maddie Oatman; video by Brett Brownell

| Wed Jul. 2, 2014 6:00 AM EDT    MotherJones.com


When I meet Kenny Belov mid-morning at San Francisco’s Fisherman’s Wharf, the boats that would normally be out at sea chasing salmon sit tethered to their docks. The steady breeze coursing through the bay belies choppier conditions farther out—so rough that the local fishermen threw in the towel for the fifth morning in a row. Belov scans the horizon as he explains this, feet away from the warehouse of his sustainable seafood company, TwoXSea. Because his business hinges on what local fishermen can bring in, he’s used to coping with wild fish shortages.

If we continue to fish at the current pace, some scientists predict we’ll be facing oceans devoid of edible marine creatures by 2050.

But unlike these fishermen, Belov has a stash of treasure in his warehouse, as he soon shows me: a golf-cart-size container of plump trout, their glossy bodies still taut from rigor mortis. The night before, Belov drove north to Humboldt to help “chill kill” the fish by submerging them live into barrels of slushy ice water. Belov can count on shipments of these McFarland Springs trout every week—because he helped grow them himself on a farm.

For many consumers, aquaculture lost its appeal after unappetizing news spread about commercial fish farms—like fish feed’s pressure on wild resources, overflowing waste, toxic buildup in the water, and displacement of natural species. But consider this: Our appetite for seafood continues to rise. Globally, we’ve hungered for 3.2 percent more seafood every year for the last five decades, double the rate of our population. Yet more than four-fifths of the world’s wild fisheries are overexploited or fully exploited (yielding the most fish possible with no expected room for growth). Only 3 percent of stocks are considered underexploited—meaning they have any significant room for expansion. If we continue to fish at the current pace, some scientists predict we’ll be facing oceans devoid of edible marine creatures by 2050.

Aquaculture could come to the rescue. The Food and Agriculture Organization of the United Nations predicts that farmed fish will soon surpass wild-caught; by 2030, aquaculture may produce more than 60 percent of fish we consume as food.

Food and Agriculture Organization of the United Nations “State of World Fisheries and Aquaculture” 2014 report

One of the most pressing concerns about aquaculture, though, is that many farmed fish are raised on a diet of 15 million tons a year of smaller bait fish—species like anchovies and menhaden. These bait—also known as forage fish—are ground up and converted into a substance called fishmeal. It takes roughly five pounds of them to produce one pound of farmed salmon. Bait fish are also used for nonfood products like pet food, makeup, farm animal feed, and fish oil supplements.

Forage fish are a “finite resource that’s been fully utilized.”

It may appear as though the ocean enjoys endless schools of these tiny fish, but they too have been mismanaged, and their populations are prone to collapse. They’re a “finite resource that’s been fully utilized,” says Mike Rust of NOAA’s fisheries arm. Which is disturbing, considering that researchers like those at Oceana argue that forage fish may play an outsize role in maintaining the ocean’s ecological balance, including by contributing to the abundance of bigger predatory fish.

And that’s where Belov’s trout come in: Though he swears no one can taste the difference, his fish are vegetarians. That means those five pounds of forage fish can rest easy at sea. It also means that the trout don’t consume some of the other rendered animal proteins in normal fishmeal pellets: bone meal, feather meal, blood meal, and chicken byproducts.

Belov and McFarland Springs’ owner David McFarland were inspired to switch to vegetarian feed in part by Rick Barrows, a USDA researcher. About six years ago, recounts Barrows, several USDA studies confirmed that fish rely on nutrients—vitamins, minerals, fatty acids, and protein—rather than fishmeal or fish oil, to thrive. If those nutrients could be found in other products, including purely plant-based substances, then aquaculture might not be so dependent on feeding fish other smaller fish.

Barrows and team began to test about 50 potential materials a year, and now have a database of 140 that anyone can browse through online. Belov was one of their first commercial partners. The plant-based food fed to McFarland Springs’ trout consists of a hearty blend of marine algae, freshwater micro algae, vitamins, minerals, flax, flax oil, corn, and nut waste. The resulting complete protein means the trout’s omega 3s are high and their omega 6s are low—a ratio that’s said to enhance anti-inflammatory properties. And “they don’t have the concentration of heavy metals that come from the bait fish,” Belov says. I took one of his rosy fillets home and turned it into trout lox; find the recipe here.

McFarland Springs manages the trout’s waste by funneling it out into a natural sagebrush pasture where it composts the soil.

Belov’s fish feed includes California nuts that are too broken or disfigured to be sold.

Barrows thinks region-specific material for this type of feed offers the most potential. For instance, his team learned that around 5 percent of California nuts can’t be sold because they’re broken or disfigured. They realized they could repurpose excess nut parts for the trout feed; the nut bits helped round out the complete protein. Lately, Barrows has become especially excited about turning barley surplus from the beer industry—which comes at a cheap price in Montana, where he’s based—into a feed-grade concentrate for trout feed.

“You can get just as much growth rate out of fishmeal-free feeds as fishmeal,” says Barrows. And his lab has proven as much with eight different fish species: cobia, Florida pompano, coho salmon, Atlantic salmon, walleye, yellowtail, and White seabass.

But the price difference still stands in the way for many fish farmers. Belov pays slightly more than $1/pound for his plant-based feed, whereas fishmeal pellets average around $0.71/pound. He sells his trout for $6.95/pound, about a dollar more than conventional. But he’s well positioned in the affluent Bay Area, and he usually sells out of his McFarland Springs trout well before the end of each week. As innovation continues in the realm of plant-based feeds, he’s hopeful, along with Barrows, that the price of the pellets will continue to drop.

Here in the United States, we consume plenty of farmed fish already, but only 5 percent of it is sourced domestically. “If we didn’t import so much farmed seafood,” implored Four Fish author Paul Greenberg in a recent New York Times op-ed, “we might develop a viable, sustainable aquaculture sector of our own.” It doesn’t just boil down to economics: The locations we generally export from, like China and South Asia, don’t have near the stringent environmental and health regulations as the US. “Growing more seafood at home would help with trade deficit, but also we could control the safety more,” says Barrows.

Though our current aquaculture sector is relatively tiny, US farmers are in a better position to innovate, because we have a sophisticated animal nutrition research center and feed sector, says NOAA’s Rust. “We’re the leading technical country in the world on feed.”

Belov wasn’t always open to aquaculture, and he still feels that fish—such as some salmon—with healthy wild fisheries attached to them should never be farmed. That way, environmentally responsible fishermen can stay in business. His long-term strategy for sustainable seafood? Draw from the “amazing [wild] fisheries that exist, and then you backfill with intelligent aquaculture, and yes, you can feed the planet with sustainable marine products.” Which may take more work, but as he puts it, “We depleted the ocean. It wasn’t anybody else’s fault. So it’s our job to fix it.”


Read Full Post »

Larry H Bernstein, MD, FCAP, Curator

http://pharmaceuticalintelligence.com/6/7/2014/Health benefit of anthocyanins from apples and berries noted for men

After significant studies have been completed, particularly on a relationship between anthocyanins consumption and decreasd risk of Parkinson’s Disease in men, it is unclear why a comparable effect is not seen in women.  This would lead one to ask questions about predominant time course of development in relationship to androgen activity.  Pre- and postmenopausal status would seem to make no difference. It is reported that the anthocyanins cross the blood brain barrier.  There are other questions that need to be raised.  There is a decline in the production of transthyretin by the choroid plexus in the elderly – not sex related – with an elevation of homocysteine that is reciprocal to decline in transthyretin-RBP complex, that is related to AD.  This is mediated by cystathionine-beta synthase, and involves matrix metalloproteinases.  A mechanism for Parkinson’s Disease has been postulated to be related to Parkin gene expression, but how does this work, and why do we see the sex assymetry?

Eating flavonoids protects men against Parkinson’s disease

General Diet, Missed – Medical Breakthroughs • Tags: Anthocyanin, Flavonoid, Harvard University,Health, Neurology, Parkinson, Parkinson Disease, University of East Anglia

http://healthresearchreport.me/       07 Apr 2012

Men who eat flavonoid-rich foods such as berries, tea, apples and red wine significantly reduce their risk of developing Parkinson’s disease, according to new research by Harvard University and the University of East Anglia (UEA).

Published today in the journal Neurology ®, the findings add to the growing body of evidence that regular consumption of some flavonoids can have a marked effect on human health. Recent studies have shown that these compounds can offer protection against a wide range of diseases including heart disease, hypertension, some cancers and dementia.

This latest study is the first study in humans to show that flavonoids can protect neurons against diseases of the brain such as Parkinson’s.

Around 130,000 men and women took part in the research. More than 800 had developed Parkinson’s disease within 20 years of follow-up. After a detailed analysis of their diets and adjusting for age and lifestyle, male participants who ate the most flavonoids were shown to be 40 per cent less likely to develop the disease than those who ate the least. No similar link was found for total flavonoid intake in women.

The research was led by Dr Xiang Gao of Harvard School of Public Health in collaboration with Prof Aedin Cassidy of the Department of Nutrition, Norwich Medical School at UEA.

“These exciting findings provide further confirmation that regular consumption of flavonoids can have potential health benefits,” said Prof Cassidy.

“This is the first study in humans to look at the associations between the range of flavonoids in the diet and the risk of developing Parkinson’s disease and our findings suggest that a sub-class of flavonoids called anthocyanins may have neuroprotective effects.”

Prof Gao said: “Interestingly, anthocyanins and berry fruits, which are rich in anthocyanins, seem to be associated with a lower risk of Parkinson’s disease in pooled analyses. Participants who consumed one or more portions of berry fruits each week were around 25 per cent less likely to develop Parkinson’s disease, relative to those who did not eat berry fruits. Given the other potential health effects of berry fruits, such as lowering risk of hypertension as reported in our previous studies, it is good to regularly add these fruits to your diet.”

Flavonoids are a group of naturally occurring, bioactive compunds found in many plant-based foods and drinks. In this study the main protective effect was from higher intake of anthocyanins, which are present in berries and other fruits and vegetables including aubergines, blackcurrants and blackberries. Those who consumed the most anthocyanins had a 24 per cent reduction in risk of developing Parkinson’s disease and strawberries and blueberries were the top two sources in the US diet.

The findings must now be confirmed by other large epidemiological studies and clinical trials.

Parkinson’s disease is a progresssive neurological condition affecting one in 500 people, which equates to 127,000 people in the UK. There are few effective drug therapies available.  Dr Kieran Breen, director of research at Parkinson’s UK said: “This study raises lots of interesting questions about how diet may influence our risk of Parkinson’s…   there are still a lot of questions to answer and much more research to do before we really know how important diet might be for people with Parkinson’s.”


Eating berries may lower risk of Parkinson’s

Missed – Medical Breakthroughs • Tags: Berry, Doctor of Philosophy, Flavonoid, Parkinson,Parkinson Disease, Xiang Gao

http://healthresearchreport.me/    Public release date: 13-Feb-2011

ST. PAUL, Minn. –New research shows men and women who regularly eat berries may have a lower risk of developing Parkinson’s disease, while men may also further lower their risk by regularly eating apples, oranges and other sources rich in dietary components called flavonoids. The study was released today and will be presented at the American Academy of Neurology’s 63rd Annual Meeting in Honolulu April 9 to April 16, 2011.

Flavonoids are found in plants and fruits and are also known collectively as vitamin P and citrin. They can also be found in berry fruits, chocolate, and citrus fruits such as grapefruit.

The study involved 49,281 men and 80,336 women. Researchers gave participants questionnaires and used a database to calculate intake amount of flavonoids. They then analyzed the association between flavonoid intakes and risk of developing Parkinson’s disease. They also analyzed consumption of five major sources of foods rich in flavonoids: tea, berries, apples, red wine and oranges or orange juice. The participants were followed for 20 to 22 years.

During that time, 805 people developed Parkinson’s disease. In men, the top 20 percent who consumed the most flavonoids were about 40 percent less likely to develop Parkinson’s disease than the bottom 20 percent of male participants who consumed the least amount of flavonoids. In women, there was no relationship between overall flavonoid consumption and developing Parkinson’s disease. However, when sub-classes of flavonoids were examined, regular consumption of anthocyanins, which are mainly obtained from berries, were found to be associated with a lower risk of Parkinson’s disease in both men and women.

“This is the first study in humans to examine the association between flavonoids and risk of developing Parkinson’s disease,” said study author Xiang Gao, MD, PhD, with the Harvard School of Public Health in Boston. “Our findings suggest that flavonoids, specifically a group called anthocyanins, may have neuroprotective effects. If confirmed, flavonoids may be a natural and healthy way to reduce your risk of developing Parkinson’s disease.”
May 10, 2013

Could eating peppers prevent Parkinson’s?

Missed – Medical Breakthroughs • Tags: American Neurological Association, Annals of Neurology,Group Health Cooperative, Nicotine, Parkinson, Parkinson’s disease, Solanaceae, University of Washington

Contact: Dawn Peters sciencenewsroom@wiley.com 781-388-8408 Wiley

Dietary nicotine may hold protective key

New research reveals that Solanaceae—a flowering plant family with some species producing foods that are edible sources of nicotine—may provide a protective effect against Parkinson’s disease. The study appearing today inAnnals of Neurology, a journal of the American Neurological Association and Child Neurology Society, suggests that eating foods that contain even a small amount of nicotine, such as peppers and tomatoes, may reduce risk of developing Parkinson’s.

Parkinson’s disease is a movement disorder caused by a loss of brain cells that produce dopamine. Symptoms include facial, hand, arm, and leg tremors, stiffness in the limbs, loss of balance, and slower overall movement. Nearly one million Americans have Parkinson’s, with 60,000 new cases diagnosed in the U.S. each year, and up to ten million individuals worldwide live with this disease according to the Parkinson’s Disease Foundation. Currently, there is no cure for Parkinson’s, but symptoms are treated with medications and procedures such as deep brain stimulation.

Previous studies have found that cigarette smoking and other forms of tobacco, also a Solanaceae plant, reduced relative risk of Parkinson’s disease. However, experts have not confirmed if nicotine or other components in tobacco provide a protective effect, or if people who develop Parkinson’s disease are simply less apt to use tobacco because of differences in the brain that occur early in the disease process, long before diagnosis.

For the present population-based study Dr. Susan Searles Nielsen and colleagues from the University of Washington in Seattle recruited 490 patients newly diagnosed with Parkinson’s disease at the university’s Neurology Clinic or a regional health maintenance organization, Group Health Cooperative. Another 644 unrelated individuals without neurological conditions were used as controls. Questionnaires were used to assess participants’ lifetime diets and tobacco use, which researchers defined as ever smoking more than 100 cigarettes or regularly using cigars, pipes or smokeless tobacco.

Vegetable consumption in general did not affect Parkinson’s disease risk, but as consumption of edible Solanaceae increased, Parkinson’s disease risk decreased, with peppers displaying the strongest association. Researchers noted that the apparent protection from Parkinson’s occurred mainly in men and women with little or no prior use of tobacco, which contains much more nicotine than the foods studied.

“Our study is the first to investigate dietary nicotine and risk of developing Parkinson’s disease,” said Dr. Searles Nielsen. “Similar to the many studies that indicate tobacco use might reduce risk of Parkinson’s, our findings also suggest a protective effect from nicotine, or perhaps a similar but less toxic chemical in peppers and tobacco.” The authors recommend further studies to confirm and extend their findings, which could lead to possible interventions that prevent Parkinson’s disease.

###

This study is published in Annals of Neurology. Media wishing to receive a PDF of this article may contact sciencenewsroom@wiley.com.

Full citation: “Nicotine from Edible Solanaceae and Risk of Parkinson Disease.” Susan Searles Nielsen, Gary M. Franklin, W.T. Longstreth Jr, Phillip D. Swanson and Harvey Checkoway. Annals of Neurology; Published May 9, 2013 (DOI:10.1002/ana.23884).

URL Upon Publication: http://doi.wiley.com/10.1002/ana.23884

Author Contact: To arrange an interview with Dr. Susan Searles Nielsen, please contact Leila Gray with the University of Washington Health Sciences News Office at +1 206-685-0381 or at leilag@uw.edu.

About the Journal

Annals of Neurology, the official journal of the American Neurological Association and the Child Neurology Society, publishes articles of broad interest with potential for high impact in understanding the mechanisms and treatment of diseases of the human nervous system. All areas of clinical and basic neuroscience, including new technologies, cellular and molecular neurobiology, population sciences, and studies of behavior, addiction, and psychiatric diseases are of interest to the journal. The journal is published by Wiley on behalf of the
American Neurological Association and Child Neurology Society. For more information, please visit http://onlinelibrary.wiley.com/journal/10.1002/ana.

Flavonoids from berries shown to protect men against Parkinson’s disease

December 19, 2013 · by MrT

by: John Phillip, John is a Certified Nutritional Consultant and Health Researcher

(NaturalNews) Past research bodies have confirmed the health-protective effect of a natural diet rich in flavonoids to protect against a wide range of diseases including heart disease, hypertension, some cancers, and dementia. Researchers from Harvard University and the University of East Anglia have published the result of a study in the journalNeurology that demonstrates how these plant-based phytonutrients can significantly lower the risk of developing Parkinson’s disease, especially in men.

Flavonoids from healthy foods such as berries, tea, apples, and red wine cross the delicate blood-brain barrier to protect neurons against neurologic diseases such as Parkinson’s. This large scale study included more than 130,000 men and women participants that were followed for a period of twenty years. During this time, more than 800 individuals developed Parkinson’s disease.

A diet high in flavonoids from berries lowers Parkinson’s disease risk by forty percent

After a detailed analysis of their diets and adjusting for age and lifestyle, male participants who ate the most flavonoids were shown to be forty percent  less likely to develop the disease than those who ate the least. No similar link was found for total flavonoid intake in women.

”This was the first study to examine the connection between flavonoid consumption and the development of Parkinson’s disease. The findings suggest that a sub-class of flavonoids called anthocyanins may exhibit neuroprotective effects. Participants consuming one or more portions of berry fruits each week were around twenty-five percent less likely to develop Parkinson’s disease, relative to those who did not eat berry fruits.

Flavonoids are the bioactive, naturally occurring chemical compounds found in many plant-based foods and drinks.

This study demonstrated the main protective effect was from the consumption of anthocyanins, which are present in berries and other fruits and vegetables including aubergines, blackcurrants, and blackberries. Strawberries and blueberries are the two most common sources of flavonoids in the US diet, contributing to a twenty-four percent lowered risk in this research.

Parkinson’s disease is among a group of chronic diseases presently affecting one in 500 people, with new cases on the rise. Drug therapies are ineffective and bear significant side effects.

Nutrition experts recommend adding a minimum of three to five servings of flavonoids to your diet each week. Include all varieties of berries, apples, and green tea to guard against Parkinson’s disease and other neurodegenerative illnesses.


Read Full Post »

« Newer Posts - Older Posts »