Feeds:
Posts
Comments

Posts Tagged ‘Cytokines’

Feeling the Heat – the Link between Inflammation and Cancer

Reporter: Irina Robu, PhD

Researchers at Lerner Research Institute led by Dr. Xiaoxia Li revealed a new signaling pathway in a subset of hair follicle stem cells that can be linked to inflammation, wound healing and tumorigenesis giving new insights into how to potential target to slow or prevent tumor initiation. However, previous research shows that uncontrolled tissue repair is usually associated with tumor formation, but there is no direct connection between them.

The scientists found that the proinflammatory cytokine, IL-17A plays a vital role in aberrant tissue repair. They showed that when IL-17A signaling is turned on, Lrig1+ stem cells expanded and their progeny translocated to other layers of the skin in reply to injury. Through a series of investigations, Dr. Li showed that the presence and physical proximity of a series of proteins sets into motion a complex signaling cascade that results in activation of ERK5 (extracellular signal regulated kinase 5), which is ultimately responsible for the expansion and migration of Lrig1+ stem cells. While many proteins including interleukin-17 receptor, epidermal growth factor receptor and Act1 are involved, tumor necrosis factor receptor associated factor 4 is the first receptor to fail, setting the entire signaling cascade in motion.

Considering that this is the first study to show that a proinflammatory cytokine can recruit a growth factor receptor to activate stem cells in support of tissue repair and tumorigenesis. This proves that tumor necrosis factor receptor associated factor 4 may be a viable therapeutic target to pursue in upcoming studies.

SOURCE

https://www.eurekalert.org/pub_releases/2011-10/lri-ccs100711.php

Read Full Post »

Targeting Cancer Neoantigens and Metabolic Change in T-cells

Curator: Larry H. Bernstein, MD, FCAP

Targeting Cancer Neoantigens

WordCloud created by Noam Steiner Tomer 8/10/2020

Updated 5/28/2016

Updated 6/1/2016

Updated 6/11/2021

Fighting Cancer with Borrowed Immunity

http://www.genengnews.com/gen-news-highlights/fighting-cancer-with-borrowed-immunity/81252754/

Outsource a part of the T cell’s immune value chain, propose cancer immunotherapy researchers, from patient T cells to donor T cells. The novel allogeneic approach could rely on T-cell receptor gene transfer to generate broad and tumor-specific T-cell immune responses. [NIAID]

A new cancer immunotherapy approach could essentially outsource a crucial T-cell function. This function, T-cell reactivity to specific cancer antigens, is sometimes lacking in cancer patients. Yet, according to a new proof-of-principle study, these patients could benefit from T cells provided by healthy donors. Specifically, the healthy donors’ T cells could be used to broaden the T-cell receptor repertoires of the cancer patients’ T cells.

Ultimately, this approach relies on a cancer immunotherapy technique called T-cell receptor (TCR) transfer, or the genetic transfer of TCR chains. TCR transfer can be used to outsource the T cell’s learning function, the process by which a T cell acquires the ability to recognize foreign antigens—in this case, the sort of proteins that can be expressed on the surface of cancer cells. Because cancer cells harbor faulty proteins, they can also display foreign protein fragments, also known as neoantigens, on their surface, much in the way virus-infected cells express fragments of viral proteins.

The approach was detailed in a paper that appeared May 19 in the journal Science, in an article entitled, “Targeting of Cancer Neoantigens with Donor-Derived T Cell Receptor Repertoires.” This article, by scientists based at the Netherlands Cancer Institute and the University of Oslo, describes a novel strategy to broaden neoantigen-specific T-cell responses. Such a strategy would be useful in overcoming a common limitation seen in the immune response to cancer: Neoantigen-specific T-cell reactivity is generally limited to just a few mutant epitopes, even though the number of predicted epitopes is large.

“We demonstrate that T cell repertoires from healthy donors provide a rich source of T cells that specifically recognize neoantigens present on human tumors,” the study’s authors wrote. “Responses to 11 epitopes were observed, and for the majority of evaluated epitopes, potent and specific recognition of tumor cells endogenously presenting the neoantigens was detected.”

First, the researchers mapped all possible neoantigens on the surface of melanoma cells from three different patients. In all three patients, the cancer cells seemed to display a large number of different neoantigens. But when the researchers tried to match these to the T cells derived from within the patient’s tumors, most of these aberrant protein fragments on the tumor cells went unnoticed.

Next, the researchers tested whether the same neoantigens could be seen by T cells derived from healthy volunteers. Strikingly, these donor-derived T cells could detect a significant number of neoantigens that had not been seen by the patients’ T cells.

“Many of the T cell reactivities [among donor T cells] involved epitopes that in vivo were neglected by patient autologous tumor-infiltrating lymphocytes,” the authors of the Science article continued. “T cells re-directed with T cell receptors identified from donor-derived T cells efficiently recognized patient-derived melanoma cells harboring the relevant mutations, providing a rationale for the use of such ‘outsourced’ immune responses in cancer immunotherapy.”

“In a way, our findings show that the immune response in cancer patients can be strengthened; there is more on the cancer cells that makes them foreign that we can exploit. One way we consider doing this is finding the right donor T cells to match these neoantigens,” said Ton Schumacher, Ph.D., a principal investigator at the Netherlands Cancer Institute. “The receptor that is used by these donor T cells can then be used to genetically modify the patient’s own T cells so these will be able to detect the cancer cells.”

“Our study shows that the principle of outsourcing cancer immunity to a donor is sound,” added Johanna Olweus, M.D., Ph.D., who heads a research group at the University of Oslo. “However, more work needs to be done before patients can benefit from this discovery. Thus, we need to find ways to enhance the throughput.”

“We are currently exploring high-throughput methods to identify the neoantigens that the T cells can ‘see’ on the cancer and isolate the responding cells. But the results showing that we can obtain cancer-specific immunity from the blood of healthy individuals are already very promising.”

Targeting of cancer neoantigens with donor-derived T cell receptor repertoires

Erlend Strønen1,2Mireille Toebes3Sander Kelderman3,…., Fridtjof Lund-Johansen2,5Johanna Olweus1,2,*,Ton N. Schumacher3,*,   + Author Affiliations
Science  19 May 2016:                         http://dx.doi.org:/10.1126/science.aaf2288

Accumulating evidence suggests that clinically efficacious cancer immunotherapies are driven by T cell reactivity against DNA mutation-derived neoantigens. However, among the large number of predicted neoantigens, only a minority is recognized by autologous patient T cells, and strategies to broaden neoantigen specific T cell responses are therefore attractive. Here, we demonstrate that naïve T cell repertoires of healthy blood donors provide a source of neoantigen-specific T cells, responding to 11/57 predicted HLA-A2-binding epitopes from three patients. Many of the T cell reactivities involved epitopes that in vivo were neglected by patient autologous tumor-infiltrating lymphocytes. Finally, T cells re-directed with T cell receptors identified from donor-derived T cells efficiently recognized patient-derived melanoma cells harboring the relevant mutations, providing a rationale for the use of such “outsourced” immune responses in cancer immunotherapy.
 

Metabolic maintenance of cell asymmetry following division in activated T lymphocytes.

Verbist KC1, Guy CS1, Milasta S1, Liedmann S1, Kamiński MM1, Wang R2, Green DR1
Nature. 2016 Apr 21; 532(7599):389-93.   http://dx. doi.org:/10.1038/nature17442. Epub 2016 Apr 11

Asymmetric cell division, the partitioning of cellular components in response to polarizing cues during mitosis, has roles in differentiation and development. It is important for the self-renewal of fertilized zygotes in Caenorhabditis elegans and neuroblasts in Drosophila, and in the development of mammalian nervous and digestive systems. T lymphocytes, upon activation by antigen-presenting cells (APCs), can undergo asymmetric cell division, wherein the daughter cell proximal to the APC is more likely to differentiate into an effector-like T cell and the distal daughter is more likely to differentiate into a memory-like T cell. Upon activation and before cell division, expression of the transcription factor c-Myc drives metabolic reprogramming, necessary for the subsequent proliferative burst. Here we find that during the first division of an activated T cell in mice, c-Myc can sort asymmetrically. Asymmetric distribution of amino acid transporters, amino acid content, and activity of mammalian target of rapamycin complex 1 (mTORC1) is correlated with c-Myc expression, and both amino acids and mTORC1 activity sustain the differences in c-Myc expression in one daughter cell compared to the other. Asymmetric c-Myc levels in daughter T cells affect proliferation, metabolism, and differentiation, and these effects are altered by experimental manipulation of mTORC1 activity or c-Myc expression. Therefore, metabolic signalling pathways cooperate with transcription programs to maintain differential cell fates following asymmetric T-cell division.

AMPK Is Essential to Balance Glycolysis and Mitochondrial Metabolism to Control T-ALL Cell Stress and Survival.

 
T cell acute lymphoblastic leukemia (T-ALL) is an aggressive malignancy associated with Notch pathway mutations. While both normal activated and leukemic T cells can utilize aerobic glycolysis to support proliferation, it is unclear to what extent these cell populations are metabolically similar and if differences reveal T-ALL vulnerabilities. Here we show that aerobic glycolysis is surprisingly less active in T-ALL cells than proliferating normal T cells and that T-ALL cells are metabolically distinct. Oncogenic Notch promoted glycolysis but also induced metabolic stress that activated 5′ AMP-activated kinase (AMPK). Unlike stimulated T cells, AMPK actively restrained aerobic glycolysis in T-ALL cells through inhibition of mTORC1 while promoting oxidative metabolism and mitochondrial Complex I activity. Importantly, AMPK deficiency or inhibition of Complex I led to T-ALL cell death and reduced disease burden. Thus, AMPK simultaneously inhibits anabolic growth signaling and is essential to promote mitochondrial pathways that mitigate metabolic stress and apoptosis in T-ALL.


Glutamine Modulates Macrophage Lipotoxicity.

He L1,2, Weber KJ3,4, Schilling JD5,6,7
Nutrients. 2016 Apr 12;8(4). pii: E215.   http://dx.doi.org:/10.3390/nu8040215
 
Obesity and diabetes are associated with excessive inflammation and impaired wound healing. Increasing evidence suggests that macrophage dysfunction is responsible for these inflammatory defects. In the setting of excess nutrients, particularly dietary saturated fatty acids (SFAs), activated macrophages develop lysosome dysfunction, which triggers activation of the NLRP3 inflammasome and cell death. The molecular pathways that connect lipid stress to lysosome pathology are not well understood, but may represent a viable target for therapy. Glutamine uptake is increased in activated macrophages leading us to hypothesize that in the context of excess lipids glutamine metabolism could overwhelm the mitochondria and promote the accumulation of toxic metabolites. To investigate this question we assessed macrophage lipotoxicity in the absence of glutamine using LPS-activated peritoneal macrophages exposed to the SFA palmitate. We found that glutamine deficiency reduced lipid induced lysosome dysfunction, inflammasome activation, and cell death. Under glutamine deficient conditions mTOR activation was decreased and autophagy was enhanced; however, autophagy was dispensable for the rescue phenotype. Rather, glutamine deficiency prevented the suppressive effect of the SFA palmitate on mitochondrial respiration and this phenotype was associated with protection from macrophage cell death. Together, these findings reveal that crosstalk between activation-induced metabolic reprogramming and the nutrient microenvironment can dramatically alter macrophage responses to inflammatory stimuli.


Immunoregulatory Protein B7-H3 Reprograms Glucose Metabolism in Cancer Cells by ROS-Mediated Stabilization of HIF1α

Sangbin Lim1Hao Liu1,2,*Luciana Madeira da Silva1Ritu Arora1,…., Gary A. Piazza1Oystein Fodstad1,4,*, and Ming Tan1,5,*
C
ancer Res April 5, 2016    http://dx.doi.org:/10.1158/0008-5472.CAN-15-1538

B7-H3 is a member of B7 family of immunoregulatory transmembrane glycoproteins expressed by T cells. While B7-H3 overexpression is associated with poor outcomes in multiple cancers, it also has immune-independent roles outside T cells and its precise mechanistic contributions to cancer are unclear. In this study, we investigated the role of B7-H3 in metabolic reprogramming of cancer cells in vitro and in vivo. We found that B7-H3 promoted the Warburg effect, evidenced by increased glucose uptake and lactate production in B7-H3–expressing cells. B7-H3 also increased the protein levels of HIF1α and its downstream targets, LDHA and PDK1, key enzymes in the glycolytic pathway. Furthermore, B7-H3 promoted reactive oxygen species–dependent stabilization of HIF1α by suppressing the activity of the stress-activated transcription factor Nrf2 and its target genes, including the antioxidants SOD1, SOD2, and PRX3. Metabolic imaging of human breast cancer xenografts in mice confirmed that B7-H3 enhanced tumor glucose uptake and tumor growth. Together, our results illuminate the critical immune-independent contributions of B7-H3 to cancer metabolism, presenting a radically new perspective on B7 family immunoregulatory proteins in malignant progression. Cancer Res; 76(8); 1–12. ©2016 AACR.

TLR-Mediated Innate Production of IFN-γ by CD8+ T Cells Is Independent of Glycolysis.

Salerno F1, Guislain A2, …, Wolkers MC2.
J Immunol. 2016 May 1;196(9):3695-705.   http://dx.doi.org:/10.4049/jimmunol.1501997. Epub 2016 Mar 25.
 
CD8(+) T cells can respond to unrelated infections in an Ag-independent manner. This rapid innate-like immune response allows Ag-experienced T cells to alert other immune cell types to pathogenic intruders. In this study, we show that murine CD8(+) T cells can sense TLR2 and TLR7 ligands, resulting in rapid production of IFN-γ but not of TNF-α and IL-2. Importantly, Ag-experienced T cells activated by TLR ligands produce sufficient IFN-γ to augment the activation of macrophages. In contrast to Ag-specific reactivation, TLR-dependent production of IFN-γ by CD8(+) T cells relies exclusively on newly synthesized transcripts without inducing mRNA stability. Furthermore, transcription of IFN-γ upon TLR triggering depends on the activation of PI3K and serine-threonine kinase Akt, and protein synthesis relies on the activation of the mechanistic target of rapamycin. We next investigated which energy source drives the TLR-induced production of IFN-γ. Although Ag-specific cytokine production requires a glycolytic switch for optimal cytokine release, glucose availability does not alter the rate of IFN-γ production upon TLR-mediated activation. Rather, mitochondrial respiration provides sufficient energy for TLR-induced IFN-γ production. To our knowledge, this is the first report describing that TLR-mediated bystander activation elicits a helper phenotype of CD8(+) T cells. It induces a short boost of IFN-γ production that leads to a significant but limited activation of Ag-experienced CD8(+) T cells. This activation suffices to prime macrophages but keeps T cell responses limited to unrelated infections.


 Immunometabolism of regulatory T cells 

Newton RPriyadharshini B & Laurence A Turk
Nature Immunology 2016;17:618–625
  http://dx.doi.
doi.org:/10.1038/ni.3466

The bidirectional interaction between the immune system and whole-body metabolism has been well recognized for many years. Via effects on adipocytes and hepatocytes, immune cells can modulate whole-body metabolism (in metabolic syndromes such as type 2 diabetes and obesity) and, reciprocally, host nutrition and commensal-microbiota-derived metabolites modulate immunological homeostasis. Studies demonstrating the metabolic similarities of proliferating immune cells and cancer cells have helped give birth to the new field of immunometabolism, which focuses on how the cell-intrinsic metabolic properties of lymphocytes and macrophages can themselves dictate the fate and function of the cells and eventually shape an immune response. We focus on this aspect here, particularly as it relates to regulatory T cells.

Figure 1: Proposed model for the metabolic signatures of various Treg cell subsets.

Proposed model for the metabolic signatures of various Treg cell subsets.

http://www.nature.com/ni/journal/v17/n6/carousel/ni.3466-F1.jpg

(a) Activated CD4+ T cells that differentiate into the Teff cell lineage (green) (TH1 or TH17 cells) are dependent mainly on carbon substrates such as glucose and glutamine for their anabolic metabolism. In contrast to that, pTreg cells…


T-bet is a key modulator of IL-23-driven pathogenic CD4+ T cell responses in the intestine
 
Krausgruber TSchiering CAdelmann K & Harrison OJ.
Nature Communications 7; Article number:11627    http://dx.doi.org:/10.1038/ncomms11627

IL-23 is a key driver of pathogenic Th17 cell responses. It has been suggested that the transcription factor T-bet is required to facilitate IL-23-driven pathogenic effector functions; however, the precise role of T-bet in intestinal T cell responses remains elusive. Here, we show that T-bet expression by T cells is not required for the induction of colitis or the differentiation of pathogenic Th17 cells but modifies qualitative features of the IL-23-driven colitogenic response by negatively regulating IL-23R expression. Consequently, absence of T-bet leads to unrestrained Th17 cell differentiation and activation characterized by high amounts of IL-17A and IL-22. The combined increase in IL-17A/IL-22 results in enhanced epithelial cell activation and inhibition of either IL-17A or IL-22 leads to disease amelioration. Our study identifies T-bet as a key modulator of IL-23-driven colitogenic responses in the intestine and has important implications for understanding of heterogeneity among inflammatory bowel disease patients.
 

Th17 cells are enriched at mucosal sites, produce high amounts of IL-17A, IL-17F and IL-22, and have an essential role in mediating host protective immunity against a variety of extracellular pathogens1. However, on the dark side, Th17 cells have also been implicated in a variety of autoimmune and chronic inflammatory conditions, including inflammatory bowel disease (IBD)2. Despite intense interest, the cellular and molecular cues that drive Th17 cells into a pathogenic state in distinct tissue settings remain poorly defined.

The Th17 cell programme is driven by the transcription factor retinoid-related orphan receptor gamma-t (RORγt) (ref. 3), which is also required for the induction and maintenance of the receptor for IL-23 (refs 4, 5). The pro-inflammatory cytokine IL-23, composed of IL-23p19 and IL-12p40 (ref. 6), has been shown to be a key driver of pathology in various murine models of autoimmune and chronic inflammatory disease such as experimental autoimmune encephalomyelitis (EAE)7, collagen induced arthritis8 and intestinal inflammation9, 10, 11, 12. Several lines of evidence, predominantly derived from EAE, suggest that IL-23 promotes the transition of Th17 cells to pathogenic effector cells9, 10, 11, 12. Elegant fate mapping experiments of IL-17A-producing cells during EAE have shown that the majority of IL-17A+IFN-γ+ and IL-17A−IFN-γ+ effector cells arise from Th17 cell progeny13. This transition of Th17 cells into IFN-γ-producing ‘ex’ Th17 cells required IL-23 and correlated with increased expression of T-bet. The T-box transcription factor T-bet drives the Th1 cell differentiation programme14 and directly transactivates the Ifng gene by binding to its promoter as well as multiple enhancer elements15. Indeed, epigenetic analyses have revealed that the loci for T-bet and IFN-γ are associated with permissive histone modifications in Th17 cells suggesting that Th17 cells are poised to express T-bet which could subsequently drive IFN-γ production16, 17.

A similar picture is emerging in the intestine where IL-23 drives T-cell-mediated intestinal pathology which is thought to be dependent on expression of T-bet18 and RORγt (ref. 19) by T cells. In support of this we have recently shown that IL-23 signalling in T cells drives the emergence of IFN-γ producing Th17 cells in the intestine during chronic inflammation20. Collectively these studies suggest a model whereby RORγt drives differentiation of Th17 cells expressing high amounts of IL-23R, and subsequently, induction of T-bet downstream of IL-23 signalling generates IL-17A+IFN-γ+ T cells that are highly pathogenic. Indeed, acquisition of IFN-γ production by Th17 cells has been linked to their pathogenicity in several models of chronic disease13, 21, 22, 23, 24 and a population of T cells capable of producing both IL-17A and IFN-γ has also been described in intestinal biopsies of IBD patients25, 26.

However, in the context of intestinal inflammation, it remains poorly defined whether the requirement for RORγt and T-bet reflects a contribution of Th17 and Th1 cells to disease progression or whether Th17 cells require T-bet co-expression to exert their pathogenic effector functions. Here, we use two distinct models of chronic intestinal inflammation and make the unexpected finding that T-bet is dispensable for IL-23-driven colitis. Rather the presence of T-bet serves to modify the colitogenic response restraining IL-17 and IL-22 driven pathology. These data identify T-bet as a key modulator of IL–23-driven colitogenic effector responses in the intestine and have important implications for understanding of heterogeneous immune pathogenic mechanisms in IBD patients.

 
Figure 1: IL-23 signalling is required for bacteria-driven T-cell-dependent colitis and the emergence of IL-17A+IFN-γ+ T cells.
C57BL/6 WT and Il23r−/− mice were infected orally with Hh and received weekly i.p. injections of IL-10R blocking antibody. Mice were killed at 4 weeks post infection and assessed for intestinal inflammation. (a) Colitis scores. (b) Typhlitis sores. (c) Representative photomicrographs of colon and caecum (× 10 magnification; scale bars, 200μM). (d) Representative flow cytometry plots of colonic lamina propria gated on viable CD4+ T cells. (e) Frequencies of IL-17A+ and/or IFN-γ+ CD4+ T cells present in the colon. Data represent pooled results from two independent experiments (n=12 for WT, n=10 for Il23r−/−). Bars are the mean and each symbol represents an individual mouse. *P<0.05, ***P<0.001 as calculated by Mann–Whitney U test.
 

IL-23 signals are dispensable for T-bet and RORγt expression 

RORγt but not T-bet is required for T cell transfer colitis

Figure 2: RORγt but not T-bet expression by CD4+ T cells is required for the development of T cell transfer colitis.

http://www.nature.com/ncomms/2016/160519/ncomms11627/images_article/ncomms11627-f2.jpg

C57BL/6 Rag1−/− mice were injected i.p. with 4 × 10⁵ CD4+CD25CD45RBhi T cells from C57BL/6 WT,Rorc−/− or Tbx21−/− donors. Mice were killed when recipients of Tbx21−/− T cells developed clinical signs of disease (4–6 weeks) and assessed for intestinal inflammation. (a) Colitis scores. (b) Representative photomicrographs of proximal colon sections (× 10 magnification; scale bars, 200μM). (c) Concentration of cytokines released from colon explants into the medium after overnight culture. Data represent pooled results from two independent experiments (n=14 for WT, n=11 for Rorc−/−, n=14 forTbx21−/−). Bars are the mean and each symbol represents an individual mouse. Bars are the mean and error bars represent s.e.m. *P<0.05, **P<0.01, ***P<0.001 as calculated by Kruskal–Wallis one-way ANOVA with Dunn’s post-test.

T-bet is dispensable for IL-17A+IFN-γ+ intestinal T cells

Figure 3: T-bet expression by CD4+ T cells is not required for the emergence of IL-17A+IFN-γ+ T cells.

http://www.nature.com/ncomms/2016/160519/ncomms11627/images_article/ncomms11627-f3.jpg

C57BL/6 Rag1−/− mice were injected i.p. with 4×10⁵ CD4+CD25CD45RBhi T cells from C57BL/6 WT,Rorc−/− or Tbx21−/− donors. Mice were killed when recipients of Tbx21−/−T cells developed clinical signs of disease (4–6 weeks). (a) Representative plots of IL-17A and IFN-γ expression in colonic CD4+ T cells. (b) Frequencies of IL-17A+ and/or IFN-γ+ cells among colonic CD4+ T cells. (c) Total numbers of IL-17A+and/or IFN-γ+ CD4+ T cells present in the colon. Data represent pooled results from three independent experiments (n=20 for WT, n=18 for Tbx21−/−, n=12 for Rorc−/−). Bars are the mean and each symbol represents an individual mouse. *P<0.05, **P<0.01, ***P<0.001 as calculated by Kruskal–Wallis one-way ANOVA with Dunn’s post-test.

T-bet deficiency promotes an exacerbated Th17-type response

Our transfer of Tbx21−/− T cells revealed a striking increase in the frequency of IL-17A+IFN-γcells (Fig. 3) and we reasoned that T-bet-deficiency could impact on Th17 cell cytokine production. Therefore, we transferred WT or Tbx21−/− CD4+ T cells into Rag1−/− recipients and measured the expression of RORγt, IL-17A, IL-17F and IL-22 by CD4+ T cells isolated from the colon. In agreement with our earlier findings, Tbx21−/− T cells gave rise to significantly increased frequencies of RORγt-expressing T cells capable of producing IL-17A (Fig. 4a). Furthermore, T-bet deficiency also led to a dramatic expansion of IL-17F and IL-22-expressing cells, which constituted only a minor fraction in WT T cells (Fig. 4a,b). By contrast, the frequency of granulocyte-macrophage colony-stimulating factor (GM-CSF) and IFN-γ producing cells was significantly reduced in T-bet-deficient T cells as compared with WT T cells. When analysed in more detail we noted that the production of IL-17A, IL-17F and IL-22 increased specifically in T-bet-deficient IL-17A+IFN-γ+ T cells as compared with WT T cells whereas IFN-γ production decreased overall in the absence of T-bet as expected (Supplementary Fig. 4A). Similarly, GM-CSF production was also generally reduced in Tbx21−/− CD4+ T cells further suggesting a shift in the qualitative nature of the T cell response.

Figure 4: T-bet-deficient CD4+ T cells promote an exacerbated Th17-type inflammatory response.

http://www.nature.com/ncomms/2016/160519/ncomms11627/images_article/ncomms11627-f4.jpg

C57BL/6 Rag1−/− mice were injected i.p. with 4×10⁵ CD4+CD25CD45RBhi T cells from C57BL/6 WT orTbx21−/− donors. Mice were killed when recipients of Tbx21−/−T cells developed clinical signs of disease (4–6 weeks). (a) Representative plots of cytokines and transcription factors in WT or Tbx21−/− colonic CD4+ T cells. (b) Frequency of IL-17A+, IL-17F+, IL-22+, GM-CSF+ or IFN-γ+ colonic T cells in WT orTbx21−/−. (c) quantitative reverse transcription PCR (qRT-PCR) analysis of mRNA levels of indicated genes in colon tissue homogenates. (d) Total number of neutrophils (CD11b+ Gr1high) in the colon. (e) Primary epithelial cells were isolated from the colon of steady state C57BL/6 Rag1−/− mice and stimulated with 10ngml−1 cytokines for 4h after which cells were harvested and analysed by qRT-PCR for the indicated genes. Data in bd represent pooled results from two independent experiments (n=14 for WT, n=11 for Tbx21−/−). Bars are the mean and error bars represent s.e.m. Data in e are pooled results from four independent experiments, bars are the mean and error bars represent s.e.m. *P<0.05, **P<0.01,***P<0.001 as calculated by Mann–Whitney U test.

………

T-bet-deficient colitis depends on IL-23, IL-17A and IL-22

In the present study we show that bacteria-driven colitis is associated with the IL-23-dependent emergence of IFN-γ-producing Th17 cells co-expressing RORγt and T-bet. Strikingly, while RORγt is required for the differentiation of IFN-γ-producing Th17 cells and induction of colitis, T-bet is dispensable for the emergence of IL-17A+IFN-γ+ T cells and intestinal pathology. Our results show that instead of a mandatory role in the colitogenic response, the presence of T-bet modulates the qualitative nature of the IL-23-driven intestinal inflammatory response. In the presence of T-bet, IL-23-driven colitis is multifunctional in nature and not functionally dependent on either IL-17A or IL-22. By contrast, in the absence of T-bet a highly polarized colitogenic Th17 cell response ensues which is functionally dependent on both IL-17A and IL-22. T-bet-deficient T cells are hyper-responsive to IL-23 resulting in enhanced STAT3 activation and downstream cytokine secretion providing a mechanistic basis for the functional changes. These data newly identify T-bet as a key modulator of IL-23-driven colitogenic CD4+ T cell responses.

Contrary to our expectations T-bet expression by CD4 T cells was not required for their pathogenicity. In keeping with the negative effect of T-bet on Th17 differentiation40, 41, 42, we observed highly polarized Th17 responses in T-bet-deficient intestinal T cells. Early studies demonstrated that IFN-γ could suppress the differentiation of Th17 cells40 and thus the reduced IFN-γ production by Tbx21−/−T cells could facilitate Th17 cell generation. However, our co-transfer studies revealed unrestrained Th17 differentiation of Tbx21−/− T cells even in the presence of WT T cells, suggesting a cell autonomous role for T-bet-mediated suppression of the Th17 programme. Indeed, the role of T-bet as a transcriptional repressor of the Th17 cell fate has been described recently. For example, T-bet physically interacts with and sequesters Runx1, thereby preventing Runx1-mediated induction of RORγt and Th17 cell differentiation43. In addition, T-bet binds directly to and negatively regulates expression of many Th17-related genes15, 34 and we identified IL23r to be repressed in a T-bet-dependent manner. In line with this we show here that T-bet-deficient intestinal T cells express higher amounts of Il23r as well as Rorc. This resulted in enhanced IL-23-mediated STAT3 activation and increased production of IL-17A and IL-22. It has also been suggested that T-bet activation downstream of IL-23R signalling is required for pathogenic IL-23-driven T cell responses43, 44. However, we did not find a role for IL-23 in the induction and/or maintenance of T-bet expression and colitis induced by T-bet-deficient T cells was IL-23 dependent. Collectively, these findings demonstrate that T-bet deficiency leads to unrestrained expansion of colitogenic Th17 cells, which is likely mediated through enhanced activation of the IL-23R-STAT3 pathway.

The observation that T-bet-deficient T cells retain their colitogenic potential is in stark contrast to earlier studies. Neurath et al.18 convincingly showed that adoptive transfer of Tbx21−/− CD4+ T cells into severe combined immunodeficiency (SCID) recipients failed to induce colitis and this correlated with reduced IFN-γ and increased IL-4 production. Another study revealed that IL-4 plays a functional role in inhibiting the colitogenic potential of Tbx21−/− T cells, as recipients ofStat6−/−Tbx21−/− T cells developed severe colitis37. Importantly, the intestinal inflammation that developed in recipients of Stat6−/−Tbx21−/− T cells could be blocked by administration of IL-17A neutralizing antibody, suggesting that the potent inhibitory effect of IL-4/STAT6 signals on Th17 differentiation normally prevent colitis induced by Tbx21−/− T cells37. Various explanations could account for the discrepancy between our study and those earlier findings. First, in contrast to the published reports, we used naïve Tbx21−/− CD4+ T cells from C57BL/6 mice instead of BALB/c mice. An important difference between Tbx21−/− CD4+ T cells from these genetic backgrounds appears to be their differential susceptibility to suppression by IL-4/STAT6 signals. We found that transfer of Tbx21−/− T cells induced IL-17A-dependent colitis despite increased frequencies of IL-4-expressing cells in the intestine. This discrepancy may be due to higher amounts of IL-4 produced by activated CD4+ T cells from BALB/c versus C57BL/6 mice45, leading to the well-described Th2-bias of the BALB/c strain45. Second, differences in the composition of the intestinal microbiota between animal facilities can have a substantial effect on skewing CD4+ T cells responses. In particular, the Clostridium-related segmented filamentous bacteria (SFB) have been shown to drive the emergence of IL-17 and IL-22 producing CD4+ T cells in the intestine46. Importantly, the ability of naïve CD4+ T cells to induce colitis is dependent on the presence of intestinal bacteria, as germ-free mice do not develop pathology upon T cell transfer47. In line with this, we previously described that colonization of germ-free mice with intestinal microbiota containing SFB was necessary to restore the development of colitis47. Since our Rag1−/− colony is SFB+ and the presence of SFB was not reported in the previous studies, it is possible that differences in SFB colonization status contributed to the observed differences in pathogenicity ofTbx21−/− T cells.

It is important to note that T-bet-deficient T cells did not induce more severe colitis than WT T cells but rather promoted a distinct mucosal inflammatory response. Colitis induced by WT T cells is characterized by a multifunctional response with high amounts of IFN-γ and GM-CSF and a lower IL-17A and IL-22 response. Consistent with this, we have shown that blockade of GM-CSF abrogates T cell transfer colitis48 as well as bacteria-driven intestinal inflammation49 in T-bet sufficiency whereas blockade of IL-17A or IL-22 fails to do so. By contrast T-bet deficiency leads to production of high amounts of IL-17A and IL-22 in the colon and neutralization of either was sufficient to reduce intestinal pathology. Our in vitro experiments suggest that IL-17A and IL-22 synergise to promote intestinal epithelial cell responses, which may in part explain the efficacy of blocking IL-17A or IL-22 in colitis induced by T-bet-deficient T cells. A similar synergistic interplay has been described in the lung where IL-22 served a tissue protective function in homeostasis but induced airway inflammation in the presence of IL-17A (ref. 50). This highlights the complexity of the system in health and disease, and the need for a controlled production of both cytokines. We describe here only one mechanism of how IL-17A/IL-22 induce a context-specific epithelial cell response that potentially impacts on the order or composition of immune cell infiltration. Overall, these results provide a new perspective on T-bet, revealing its role in shaping the qualitative nature of the IL-23-driven colitogenic T cell response.

We also describe here the unexpected finding that a substantial proportion of T-bet-deficient intestinal T cells retain the ability to express IFN-γ. To investigate the potential mechanisms responsible for T-bet-independent IFN-γ production by intestinal CD4+ T cells we focused on two transcription factors, Runx3 and Eomes. Runx3 has been shown to promote IFN-γ expression directly through binding to the Ifng promoter38 and Eomes is known to compensate for IFN-γproduction in T-bet-deficient Th1 cells37. We found IL-23-mediated induction of Runx3 protein in WT and Tbx21−/− T cells isolated from the intestine, thus identifying Runx3 downstream of IL-23R signalling. By contrast, we could only detect Eomes protein and its induction by IL-23 in T-bet-deficient but not WT T cells. Thus, Runx3 and Eomes are activated in response to IL-23 in T-bet-deficient cells and are likely to be drivers of T-bet-independent IFN-γ production. In support of this we found that the majority of T-bet-deficient IL-17AIFN-γ+ T cells expressed Eomes. However, only a minor population of IL-17A+IFN-γ+ T cells stained positive for Eomes, suggesting the existence of alternative pathways for IFN-γ production by Th17 cells. Intriguingly, a recent study identified Runx3 and Runx1 as the transcriptional regulators critical for the differentiation of IFN-γ-producing Th17 cells51. The author’s demonstrated that ectopic expression of Runx transcription factors was sufficient to induce IFN-γ production by Th17 cells even in the absence of T-bet. These findings, combined with our data on Runx3 activation downstream of IL-23R signalling strongly suggest that Runx3 rather than Eomes is driving IFN-γ expression by intestinal Th17 cells.

We have not formally addressed the role of IFN-γ in colitis driven by T-bet-deficient T cells. A recent report by Zimmermann et al.52 found that antibody-mediated blockade of IFN-γ ameliorates colitis induced by WT or T-bet-deficient T cells suggesting IFN-γ also contributes to the colitogneic response mediated by T-bet-deficient T cells as originally described for WT T cells53, 54. By contrast with our results the Zimmerman study found that IL-17A blockade exacerbated colitis following transfer of Tbx21−/− T cells. The reason for the differential role of IL-17A in the two studies is not clear but it is notable that the Zimmerman study was performed in the presence of co-infection with SFB and Hh, and this strong inflammatory drive may alter the pathophysiological role of particular cytokines. Together the data indicate that T-bet deficiency in T cells does not impede their colitogenic activity but that the downstream effector cytokines of the response are context dependent.

In conclusion, our data further underline the essential role for IL-23 in intestinal inflammation and demonstrate that T-bet is an important modulator of the IL–23-driven effector T cell response. The colitogenic T cell response in a T-bet sufficient environment is multifunctional with a dominant GM-CSF and IFN-γ response. By contrast T-bet-deficient colitogenic responses are dominated by IL-17A and IL-22-mediated immune pathology. These results may have significant bearing on human IBD where it is now recognized that differential responsiveness to treatment may reflect considerable disease heterogeneity. As such, identification of suitable biomarkers such as immunological parameters, that allow stratification of patient groups, is becoming increasingly important55. Genome-wide association studies have identified polymorphisms in loci related to innate and adaptive immune arms that confer increased susceptibility to IBD. Among these are Th1 (STAT4, IFNG and STAT1) as well as Th17-related genes (RORC, IL23R and STAT3) (refs56, 57). Thus, detailed profiling of the T cell response in IBD patients may help identify appropriate patient groups that are most likely to benefit from therapeutic blockade of certain effector cytokines. Finally, our studies highlight the importance of IL-23 in the intestinal inflammatory hierarchy and suggest that IL-23 could be an effective therapeutic target across a variety of patient groups.

Yale study: How antibodies access neurons to fight infection


Yale scientists have solved a puzzle of the immune system: how antibodies enter the nervous system to control viral infections. Their finding may have implications for the prevention and treatment of a range of conditions, including herpes and Guillain-Barre syndrome, which has been linked to the Zika virus.

Many viruses — such as West Nile, Zika, and the herpes simplex virus — enter the nervous system, where they were thought to be beyond the reach of antibodies. Yale immunobiologists Akiko Iwasaki and Norifumi Iijima used mice models to investigate how antibodies could gain access to nerve tissue in order to control infection.

In mice infected with herpes, they observed a previously under-recognized role of CD4 T cells, a type of white blood cell that guards against infection by sending signals to activate the immune system. In response to herpes infection, CD4 T cells entered the nerve tissue, secreted signaling proteins, and allowed antibody access to infected sites. Combined, CD4 T cells and antibodies limited viral spread.

“This is a very elegant design of the immune system to allow antibodies to go to the sites of infection,” said Iwasaki. “The CD4 T cells will only go to the site where there is a virus. It’s a targeted delivery system for antibodies.”

Access of protective antiviral antibody to neuronal tissues requires CD4 T-cell help

Norifumi Iijima & Akiko Iwasaki
Nature 533,552–556 (26 May 2016)
    http://dx.
doi.org:/10.1038/nature17979

Circulating antibodies can access most tissues to mediate surveillance and elimination of invading pathogens. Immunoprivileged tissues such as the brain and the peripheral nervous system are shielded from plasma proteins by the blood–brain barrier1 and blood–nerve barrier2, respectively. Yet, circulating antibodies must somehow gain access to these tissues to mediate their antimicrobial functions. Here we examine the mechanism by which antibodies gain access to neuronal tissues to control infection. Using a mouse model of genital herpes infection, we demonstrate that both antibodies and CD4 T cells are required to protect the host after immunization at a distal site. We show that memory CD4 T cells migrate to the dorsal root ganglia and spinal cord in response to infection with herpes simplex virus type 2. Once inside these neuronal tissues, CD4 T cells secrete interferon-γ and mediate local increase in vascular permeability, enabling antibody access for viral control. A similar requirement for CD4 T cells for antibody access to the brain is observed after intranasal challenge with vesicular stomatitis virus. Our results reveal a previously unappreciated role of CD4 T cells in mobilizing antibodies to the peripheral sites of infection where they help to limit viral spread.

T Cells Help Reverse Ovarian Cancer Drug Resistance

http://www.genengnews.com/gen-news-highlights/t-cells-help-reverse-ovarian-cancer-drug-resistance/81252753/

http://www.genengnews.com/Media/images/GENHighlight/116057_web2151982472.jpg

T cells (red) attack ovarian cancer cells (green). [University of Michigan Health System]

Researchers at the University of Michigan have recently published the results from a new study that they believe underscores why so many ovarian tumors develop resistance to chemotherapy. The tumor microenvironment is made up of an array of cell types, yet effector T cells and fibroblasts constitute the bulk of the tissue. The investigators believe that understanding the interplay between these two cell types holds the key to how ovarian cancer cells develop resistance.

The new study suggests that the fibroblasts surrounding the tumor work to block chemotherapy, which is why nearly every woman with ovarian cancer becomes resistant to treatment. Conversely, the scientists published evidence that T cells in the microenvironment can reverse the resistance phenotype—suggesting a whole different way of thinking about chemotherapy resistance and the potential to harness immunotherapy drugs to treat ovarian cancer.

“Ovarian cancer is often diagnosed at late stages, so chemotherapy is a key part of treatment,” explained co-senior study author J. Rebecca Liu, M.D., associate professor of obstetrics and gynecology at the University of Michigan. “Most patients will respond to it at first, but everybody develops chemoresistance. And that’s when ovarian cancer becomes deadly.”

Dr. Liu continued, stating that “in the past, we’ve thought the resistance was caused by genetic changes in tumor cells. But we found that’s not the whole story.”

The University of Michigan team looked at tissue samples from ovarian cancer patients and separated the cells by type to study the tumor microenvironment in vitro and in mice. More importantly, the scientists linked their findings back to actual patient outcomes.

The results of this study were published recently in Cell through an article entitled “Effector T Cells Abrogate Stroma-Mediated Chemoresistance in Ovarian Cancer.”

Ovarian cancer is typically treated with cisplatin, a platinum-based chemotherapy. The researchers found that fibroblasts blocked platinum. These cells prevented platinum from accumulating in the tumor and protected tumor cells from being killed off by cisplatin.

http://www.genengnews.com/Media/images/GENHighlight/1s20S0092867416304007fx11564016520.jpg

Diagram depicting how T cells can reverse chemotherapeutic resistance. [Cell, Volume 165, Issue 5, May 19, 2016]

“We show that fibroblasts diminish the nuclear accumulation of platinum in ovarian cancer cells, resulting in resistance to platinum-based chemotherapy,” the authors wrote. “We demonstrate that glutathione and cysteine released by fibroblasts contribute to this resistance.”

T cells, on the other hand, overruled the protection of the fibroblasts. When researchers added the T cells to the fibroblast population, the tumor cells began to die off.

“CD8+ T cells abolish the resistance by altering glutathione and cystine metabolism in fibroblasts,” the authors explained. “CD8+ T-cell-derived interferon (IFN)γ controls fibroblast glutathione and cysteine through upregulation of gamma-glutamyltransferases and transcriptional repression of system xccystine and glutamate antiporter via the JAK/STAT1 pathway.”

By boosting the effector T cell numbers, the researchers were able to overcome the chemotherapy resistance in mouse models. Moreover, the team used interferon, an immune cell-secreted cytokine, to manipulate the pathways involved in cisplatin.

“T cells are the soldiers of the immune system,” noted co-senior study author Weiping Zou, M.D., Ph.D., professor of surgery, immunology, and biology at the University of Michigan. “We already know that if you have a lot of T cells in a tumor, you have better outcomes. Now we see that the immune system can also impact chemotherapy resistance.”

The researchers suggest that combining chemotherapy with immunotherapy may be effective against ovarian cancer. Programmed death ligand 1 (PD-L1) and PD-1 pathway blockers are currently FDA-approved treatments for some cancers, although not ovarian cancer.

“We can imagine re-educating the fibroblasts and tumor cells with immune T cells after chemoresistance develops,” Dr. Zou remarked.

“Then we could potentially go back to the same chemotherapy drug that we thought the patient was resistant to. Only now we have reversed that, and it’s effective again,” Dr. Liu concluded.

Effector T Cells Abrogate Stroma-Mediated Chemoresistance in Ovarian Cancer

Weimin Wang, Ilona Kryczek, Lubomír Dostál, Heng Lin, Lijun Tan, et al.
Cell May 2016;  165, Issue 5:1092–1105.   http://dx.doi.org/10.1016/j.cell.2016.04.009
 
Highlights
  • Fibroblasts diminish platinum content in cancer cells, resulting in drug resistance
  • GSH and cysteine released by fibroblasts contribute to platinum resistance
  • T cells alter fibroblast GSH and cystine metabolism and abolish the resistance
  • Fibroblasts and CD8+ T cells associate with patient chemotherapy response

Summary

Effector T cells and fibroblasts are major components in the tumor microenvironment. The means through which these cellular interactions affect chemoresistance is unclear. Here, we show that fibroblasts diminish nuclear accumulation of platinum in ovarian cancer cells, resulting in resistance to platinum-based chemotherapy. We demonstrate that glutathione and cysteine released by fibroblasts contribute to this resistance. CD8+ T cells abolish the resistance by altering glutathione and cystine metabolism in fibroblasts. CD8+ T-cell-derived interferon (IFN)γ controls fibroblast glutathione and cysteine through upregulation of gamma-glutamyltransferases and transcriptional repression of system xc cystine and glutamate antiporter via the JAK/STAT1 pathway. The presence of stromal fibroblasts and CD8+ T cells is negatively and positively associated with ovarian cancer patient survival, respectively. Thus, our work uncovers a mode of action for effector T cells: they abrogate stromal-mediated chemoresistance. Capitalizing upon the interplay between chemotherapy and immunotherapy holds high potential for cancer treatment.

Activation of effect or T cells leads to increased glucose uptake, glycolysis, and lipid synthesis to support growth and proliferation. Activated T cells were identified with CD7, CD5, CD3, CD2, CD4, CD8 and CD45RO. Simultaneously, the expression of CD95 and its ligand causes apoptotic cells death by paracrine or autocrine mechanism, and during inflammation, IL1-β and interferon-1α..
The receptor glucose, Glut 1, is expressed at a low level in naive T cells, and rapidly induced by Myc following T cell receptor (TCR) activation. Glut1 trafficking is also highly regulated, with Glut1 protein remaining in intracellular vesicles until T cell activation.
CD28 co-stimulation further activates the PI3K/Akt/mTOR pathway in particular, and provides a signal for Glut1 expression and cell surface localization.
Mechanisms that control T cell metabolic reprogramming are now coming to light, and many of the same oncogenes importance in cancer metabolism are also crucial to drive T cell metabolic transformations, most notably Myc, hypoxia inducible factor (HIF)1a, estrogen-related receptor (ERR) a, and the mTOR pathway. The proto-oncogenic transcription factor, Myc, is known to promote transcription of genes for the cell cycle, as well as aerobic glycolysis and glutamine metabolism.
Recently, Myc has been shown to play an essential role in inducing the expression of glycolytic and glutamine metabolism genes in the initial hours of T cell activation. In a similar fashion, the transcription factor (HIF)1a can up-regulate glycolytic genes to allow cancer cells to survive under hypoxic conditions

UPDATE 6/11/2021

Bispecific Antibodies Emerging as Effective Cancer Therapeutics

In Perspectives in the Journal Science

Bispecific antibodies

Source: https://science.sciencemag.org/content/372/6545/916

 See all authors and affiliations

Science  28 May 2021:
Vol. 372, Issue 6545, pp. 916-917
DOI: 10.1126/science.abg1209

Bispecific antibodies (bsAbs) bind two different epitopes on the same or different antigens. Through this dual specificity for soluble or cell-surface antigens, bsAbs exert activities beyond those of natural antibodies, offering numerous opportunities for therapeutic applications. Although initially developed for retargeting T cells to tumors, with a first bsAb approved in 2009 (catumaxomab, withdrawn in 2017), exploring new modes of action opened the door to many additional applications beyond those of simply combining the activity of two different antibodies within one molecule. Examples include agonistic “assembly activities” that mimic the activity of natural ligands and cofactors (for example, factor VIII replacement in hemophilia A), inactivation of receptors or ligands, and delivery of payloads to cells or tissues or across biological barriers. Over the past years, the bsAb field transformed from early research to clinical applications and drugs. New developments offer a glimpse into the future promise of this exciting and rapidly progressing field.

Monoclonal antibodies (mAbs) comprise antigen-binding sites formed by the variable domains of the heavy and light chain and an Fc region that mediates immune responses. BsAbs, produced through genetic engineering, combine the antigen-binding sites of two different antibodies within one molecule, with a plethora of formats available (1). Conceptually, one can discriminate between bsAbs with combinatorial modes of action where the antigen-binding sites act independently from each other, and bsAbs with obligate modes of action where activity needs binding of both, either in a sequential (temporal) way or dependent on the physical (spatial) linkage of both (see the figure) (2). BsAbs approved as drugs are so far in the obligate dual-binding category: A T cell recruiter (blinatumomab) against cancer and a factor VIIIa mimetic to treat hemophilia A (emicizumab). Most but not all of the more than 100 bsAbs in clinical development address cancers. Some are in late stage (such as amivantamab, epcoritamab, faricimab, and KNO46), but most are still in early stages (2). Most of these entities enable effector cell retargeting to induce target cell destruction.

An increasing number of programs also explore alternative modes of action. This includes bsAbs that target pathways involved in tumor proliferation (such as amivantamab), invasion, ocular angiogenesis (such as faricimab), or immune regulation by blocking receptors and/or ligands, mainly in a combinatorial manner. Challenges for all of these entities are potential adverse effects, toxicity in normal tissues, and overshooting and systemic immune responses, especially with T cell retargeting or immune-modulating or activating entities. Such issues need to be carefully addressed.

Most of the bispecific T cell engagers comprise a binding site for a tumor-associated antigen and CD3 [a component of the T cell receptor (TCR) activation complex] as trigger molecule on T cells. To prevent or ameliorate “on-target, off-tumor” effects of T cell recruiters, approaches currently investigated include the modulation of target affinities and mechanisms to allow conditional activation upon target cell binding. Thus, a reduced affinity for CD3 increased tolerability by reducing peripheral cytokine concentrations that are associated with nonspecific or overshooting immune reactions (3). Similarly, reduced affinity for the target antigen was shown to ameliorate cytokine release and damage of target-expressing tissues (4). Tumor selectivity can be further increased by implementing avidity effects—for example, by using 2+1 bsAb formats with two low-affinity binding sites for target antigens and monovalent binding to CD3 (4).

In further approaches, binders to CD3 were identified that efficiently trigger target cell destruction without inducing undesired release of cytokines, demonstrating the importance of epitope specificity to potentially uncouple efficacy from cytokine release (5). Complementing these T cell–recruiting principles, the nonclassical T cell subset of γ9d2 T cells with strong cytotoxic activity emerged as potent effectors, which can be retargeted with bsAbs binding to the γ9d2 TCR. Thereby, global activation of all T cells, including inhibitory regulatory T cells (Treg cells), through CD3 binding, may be avoided (6). However, even these approaches might result in a narrow therapeutic window to treat solid tumors because of T cell activation in normal tissues.

Consequently, there are several approaches to conditionally activate T cells within tumors, including a local liberation of the CD3-binding sites or triggering local assembly of CD3-binding sites from two half-molecules. For example, CD3-binding sites have been masked by fusing antigen binding or blocking moieties—such as peptides, aptamers, or anti-idiotypic antibody fragments—to one or both variable domains. These moieties are released within the tumor by tumor-associated proteases, or through biochemical responses to hypoxia or low pH (7). This approach can also be applied to confer specific binding of antibody therapeutics, including bsAbs, to antigens on tumor cells (8).

An on-target restoration of CD3-binding sites requires application of two target-binding entities, each comprising parts of the CD3-binding site, which assemble into functional binding sites upon close binding of both half-antibodies. The feasibility of this approach was recently shown, for example, for a split T cell–engaging antibody derivative (Hemibody) that targets a cell surface antigen (9). Such approaches can also be applied to half-antibodies that recognize two different targets expressed on the same cell, further increasing tumor selectivity.

Regarding T cell engagers, increasing efforts are made to target not only cell-surface antigens expressed on tumor cells but also human leukocyte antigen (HLA)–presented tumor-specific peptides. This expands the target space of bsAbs toward tumor-specific intracellular antigens and can be achieved by using either recombinant TCRs or antibodies with TCR-like specificities combined with, for example, CD3-binding arms to engage T cell responses. A first TCR–anti-CD3 bispecific molecule is in phase I and II trials to treat metastatic melanoma (10). A challenge of this approach is the identification of TCRs or TCR-like antibodies that bind the peptide in the context of HLA with high affinity and specificity, without cross-reacting with related peptides to reduce or avoid off-target activities. Comprehensive screening tools and implementation of computational approaches are being developed to achieve this task.

A rapidly growing area of bsAbs in cancer therapy is their use to foster antitumor immune responses. Here, they are especially applied for dual inhibition of checkpoints that prevent immune responses—for example, programmed cell death protein 1 (PD-1) and its ligand (PD-L1), cytotoxic T lymphocyte–associated antigen 4 (CTLA-4), or lymphocyte activation gene 3 (LAG-3; for example, KNO46). Tumor-targeted bsAbs can also target costimulatory factors such as CD28 or 4-1BB ligand (4-1BBL) to enhance T cell responses when combined with PD-1 blockade or to provide an activity-enhancing costimulatory signal in combination with CD3-based bsAbs (11). Furthermore, bsAbs are being developed for local effects by targeting one arm to antigens that are expressed by tumor cells or cells of the tumor microenvironment (2).

Clinical application of bsAbs now expands to other therapeutic areas, including chronic inflammatory, autoimmune, and neurodegenerative diseases; vascular, ocular, and hematologic disorders; and infections. In contrast to mAbs, bsAbs can inactivate the signaling of different cytokines with one molecule to treat inflammatory diseases (12). Simultaneous dual-target binding is not essential to elicit activity for bsAbs against combinations of proinflammatory cytokines, such as tumor necrosis factor (TNF), interleukin-1α (IL-1α), IL-1β, IL-4, IL-13, IL-17, inducible T cell costimulator ligand (ICOSL), or B cell–activating factor (BAFF). This presumably also applies to blockade of immune cell receptors, although dual targeting might confer increased efficacy due to avidity effects and increased selectivity through simultaneous binding of two different receptors.

A further application of combinatorial dual targeting is in ophthalmology. Loss of vision in wet age-related macular degeneration (AMD) results from abnormal proliferation and leakiness of blood vessels in the macula. This can be treated with antibodies that bind and inactivate factors that stimulate their proliferation (13). In contrast to mAbs or fragments that recognize individual factors, bsAbs bind two such factors. For example, faricimab that binds vascular endothelial growth factor A (VEGF-A) and angiopoietin-2 (ANG2), demonstrated dual efficacy in preclinical studies, and is currently in phase 3 trials.

BsAbs with obligate modes of action that mandate simultaneous dual-target binding are “assemblers” that replace the function of factors necessary to form functional protein complexes. One of these bsAbs with an assembly role (emicizumab, approved in 2018) replaces factor VIIIa in the clotting cascade. Deficiency of factor VIII causes hemophilia A, which can be overcome by substitution with recombinant factor VIII. However, a proportion of patients develop factor VIII–neutralizing immune responses and no longer respond to therapy. To overcome this, a bsAb was developed with binding sites that recognize and physically connect factors IXa and X, a process normally mediated by factor VIIIa. Extensive screening of a large set of bsAbs was required to identify those that combine suitable epitopes with optimized affinities and geometry to serve as functional factor VIIIa mimetics (14). This exemplifies the complexity of identifying the best bsAb for therapeutic applications.

A mode of action requiring sequential binding of two targets is the transport of bsAbs across the blood-brain barrier (BBB). This is a tight barrier of brain capillary endothelial cells that controls the transport of substances between the blood and the cerebrospinal fluid—the brain parenchyma. Passage of large molecules, including antibodies, across the BBB is thereby restricted. Some proteins, such as transferrin or insulin, pass through the BBB by way of transporters on endothelial cells. Antibodies that bind these shuttle molecules, such as the transferrin receptor (TfR), can hitchhike across the BBB. BsAbs that recognize brain targets (such as β-amyloid for Alzheimer’s disease) and TfR with optimized affinities, epitopes, and formats can thereby enter the brain. Such bsAbs are currently in clinical evaluation to treat neurodegenerative diseases (15).

In the past years, there has been a transition from a technology-driven phase, solving hurdles to generate bsAbs with defined composition, toward exploring and extending the modes of action for new therapeutic options. The challenge of generating bsAbs is not only to identify suitable antigen pairs to be targeted in a combined manner. It is now recognized that the molecular composition has a profound impact on bsAb functionality (13). That more than 30 different bsAb formats are in clinical trials proves that development is now driven by a “fit for purpose” or “format defines function” rationale. Many candidates differ in their composition, affecting valency, geometry, flexibility, size, and half-life (1). Not all members of this “zoo of bsAb formats” qualify to become drugs. Strong emphasis is therefore on identifying candidates that exhibit drug-like properties and fulfill safety, developability, and manufacturability criteria. There is likely to be an exciting new wave of bsAb therapeutics available in the coming years.

References and Notes

    1. U. Brinkmann, 
    2. R. E. Kontermann
    , MAbs 9, 182 (2017).CrossRefPubMedGoogle Scholar
    1. A. F. Labrijn et al
    ., Nat. Rev. Drug Discov. 18, 585 (2019).PubMedGoogle Scholar
    1. K. Staflin et al
    ., JCI Insight 5, e133757 (2020).Google Scholar
    1. D. Slaga et al
    ., Sci. Transl. Med. 10, eaat5775 (2018).Abstract/FREE Full TextGoogle Scholar
    1. N. D. Trinklein et al
    ., MAbs 11, 639 (2019).Google Scholar
    1. I. de Weerdt et al
    ., Cancer Immunol. Res. 9, 50 (2021).Abstract/FREE Full TextGoogle Scholar
    1. W. W. Lin et al
    ., J. Biomed. Sci. 27, 76 (2020).Google Scholar
    1. K. A. Autio et al
    ., Clin. Cancer Res. 26, 984 (2020).Abstract/FREE Full TextGoogle Scholar
    1. A. Banaszek et al
    ., Nat. Commun. 10, 5387 (2019).Google Scholar
    1. M. R. Middleton et al
    ., Clin. Cancer Res. 26, 5869 (2020).Abstract/FREE Full TextGoogle Scholar
    1. J. C. Waite et al
    ., Sci. Transl. Med. 12, 549 (2020).Google Scholar
    1. Q. Zhao
    , BioDrugs 34, 111 (2020).Google Scholar
    1. S. Nie et al
    ., Antib. Ther. 3, 18 (2020).Google Scholar
    1. T. Kitazawa et al
    ., Nat. Med. 18, 1570 (2012).CrossRefPubMedGoogle Scholar
    1. F. Weber et al
    ., Cell Rep. 22, 149 (2018).Google Scholar

Read Full Post »

Gluten-free Diets

Writer and Curator: Larry H. Bernstein, MD, FCAP 


Clinical, Serologic, and Histologic Features of Gluten Sensitivity in Children

Ruggiero Francavilla, Fernanda Cristofori, Stefania Castellaneta, et al.
J Pediatr 2014; 164:463-7.
http://dx.doi.org/10.1016/j.jpeds.2013.10.007

Until a few years ago, the spectrum of gluten-related disorders included only celiac disease (CD) and wheat allergy (WA).  Recent data, however, suggest the existence of another form of gluten intolerance, known as nonceliac gluten sensitivity, or simply gluten sensitivity (GS). Some individuals experience distress after eating gluten-containing products and show improvement after institution of a gluten-free diet (GFD). Although the gastrointestinal symptoms may resemble those seen in CD, patients with CD do not have positive celiac-related antibodies or intestinal damage. This entity was described more than 30 years ago in 8 adult females suffering from abdominal pain and chronic diarrhea who experienced relief from a GFD and a return of symptoms on a gluten challenge.

GS is diagnosed in patients with symptoms that respond to removal of gluten from the diet, after CD and WA are excluded. Currently, it is a clinical diagnosis based on response to the GFD and relapse after gluten challenge; no specific blood test is available for GS. Sapone et al, aiming to elucidate the underlying pathophysiological mechanisms of GS, found that GS, as opposed to CD, is a condition associated with prevalent gluten-induced activation of innate, rather than adaptive, immune responses in the absence of detectable changes in mucosal barrier function.

Recently, the existence of GS was confirmed by Biesiekierski et al in a double-blind, randomized, placebo-controlled challenge trial performed in a selected group of patients with irritable bowel syndrome who were symptomatically controlled on a GFD. Patients with irritable bowel syndrome-GS frequently demonstrate serum IgG class native anti-gliadin antibodies (AGA) as a possible marker of immune activation to gluten.

Objective To describe the clinical, serologic, and histologic characteristics of children with gluten sensitivity (GS). Study design We studied 15 children (10 males and 5 females; mean age, 9.6 + 3.9 years) with GS who were diagnosed based on a clear-cut relationship between wheat consumption and development of symptoms, after excluding celiac disease (CD) and wheat allergy, along with 15 children with active CD (5 males and 10 females; mean age, 9.1 + 3.1 years) and 15 controls with a functional gastrointestinal disorder (6males and 9 females; mean age, 8.6 + 2.7 years). Method: All children underwent CD panel testing (native anti-gliadin antibodies IgG and IgA, anti-tissue transglutaminase antibody IgA and IgG, and anti-endomysial antibody IgA), hematologic assessment (hemoglobin, iron, ferritin, aspartate aminotransferase, erythrocyte sedimentation rate), HLA typing, and small intestinal biopsy (on a voluntary basis in the children with GS).
Results Abdominal pain was the most prevalent symptomin the children with GS (80%), followed by chronic diarrhea in (73%), tiredness (33%), bloating (26%), limb pain, vomiting, constipation, headache (20%), and failure to thrive (13%). Native antigliadin antibodies IgG was positive in 66% of the children with GS. No differences in nutritional, biochemical, or inflammatory markers were found between the children with GS and controls. HLA-DQ2 was found in 7 children with GS. Histology revealed normal to mildly inflamed mucosa (Marsh stage 0-1) in the children with GS. Conclusion Our findings support the existence of GS in children across all ages with clinical, serologic, genetic, and histologic features similar to those of adults. (J Pediatr 2014;164:463-7).


Coeliac disease

C Leivers, G Martin, M Gasparetto, H Shelley, M Valente
Paediatrics and Child Health  2014; 24(11):481-84

Celiac disease is an immune-mediated systemic disorder, which is triggered by dietary gluten in genetically susceptible individuals. It is characterised by the presence of HLA-DQ2 or HLADQ8 genetic haplotypes, gluten-dependent signs and symptoms, celiac-specific antibodies and enteropathy.

The pathogenesis of celiac disease is complex and involves both genetic and environmental factors. Genetics is important: there is a high concordance in monozygotic twins (between 70 and 86%) and the HLA haplotype of DQ2/DQ8 is the principal genetic factor described. In the Caucasian population, between 30 and 35% will be carriers of these markers, but only 2-5% will go on to develop celiac disease. In patients with coeliac disease, 95% have HLA-DQ2 and 5-10% will carry HLA-DQ8.

Non-celiac gluten sensitivity

This occurs in those who have had a diagnosis of celiac disease excluded, but whereby there is a clear adverse response associated with gluten ingestion. Non-IgE mediated food allergy is a potential cause.

Differential diagnoses/causes of villous atrophy

  • Coeliac disease
  • Food protein hypersensitivity (particularly cow’s milk and/or soya proteins)
  • Eosinophilic gastroenteritis
  • Hypogammaglobulinemia
  • Whipple diseases
  • Abetalipoproteinaemia (Bassen-Kornzweig syndrome)
  • Intestinal lymphoma
  • Crohn’s disease
  • Infectious diseases (e.g. tuberculosis, giardiasis, parasitic infestations, infectious enteritis)
  • Small bowel bacterial overgrowth
  • Severe malnutrition
  • Small bowel ischemia
  • Radiotherapy
  • Autoimmune enteropathy
  • Cytotoxic drugs

Gluten challenge

Routine gluten challenge is not recommended. However, the process is advised when the initial diagnosis was not secure. Challenges should be undertaken at age 6-7 years or when pubertal growth is complete. Prior to a challenge HLA-DQ2/8 haplotype should be determined; if absent, celiac disease is unlikely. At least 4-6 weeks (ideally three months) of a normal gluten-containing diet (2-3 meals per day containing at least 5 g of gluten) is recommended prior to testing. Celiac serology and symptoms should be closely monitored to decide on the timing of biopsies. A pediatric dietitian is useful to support families and clinicians through this process.

Serological testing

Blood tests including tTG-IgA and full blood count are undertaken and growth is assessed. tTG-IgA levels are used to assess recovery and dietary adherence, particularly in asymptomatic patients. The high sensitivity and specificity of tTG-IgA in the diagnosis of celiac disease, has been extensively validated for diagnostic and follow up purposes.

Dietetic assessment and interview

A dietary assessment includes a review of the gluten free diet; the child and family’s level of adherence and its overall nutritional adequacy. In particular, the child’s intake of calcium and iron is assessed and if required, the family is advised on how to increase the intake of these nutrients up to the Reference Nutrient Intake (RNI).

Practice points

  1. The incidence of coeliac disease remains high, currently estimated to be around 1% of the UK population, although only 10-20% of these are diagnosed
  2. Prior to confirming a diagnosis, it is important to ensure the child is on a gluten-containing diet
  3. The diagnostic process in children has changed and depends on whether the child is symptomatic or asymptomatic, and on the level of their tTG
  4. Duodenal biopsy may be avoided in symptomatic children who meet strict criteria upon further laboratory testing
  5. A lifelong gluten free diet is currently the only treatment for celiac disease
  6. The management of coeliac disease involves examination, repeat serology and dietetic interview and support
  7. Prolonged, untreated coeliac disease has associated morbidity and mortality


Controlled Trial of Gluten-Free Diet in Patients with Irritable Bowel Syndrome-Diarrhea: Effects on Bowel Frequency and Intestinal Function

Maria I. Vazquez–Roque, Michael Camilleri, Thomas Smyrk, et al.
Gastroenterology 2013;144:903–911
http://dx.doi.org/10.1053/j.gastro.2013.01.049

Background & Aims: Patients with diarrhea-predominant irritable bowel syndrome (IBS-D) could benefit from a gluten-free diet (GFD).
Methods: We performed a randomized controlled 4-week trial of a gluten-containing  diet (GCD) or GFD in 45 patients with IBS-D; genotype analysis was performed for HLA-DQ2 and HLA-DQ8. Twenty-two patients were placed on the GCD (11 HLA-DQ2/8 negative and 11 HLA-DQ2/8 positive) and 23 patients were placed on the GFD (12 HLA-DQ2/8 negative and 11 HLADQ2/8 positive). We measured bowel function daily, small bowel (SB) and colonic transit, mucosal permeability (by lactulose and mannitol excretion), and cytokine production by peripheral blood mononuclear cells after exposure to gluten and rice. We collected rectosigmoid biopsy specimens from 28 patients, analyzed levels of messenger RNAs encoding tight junction proteins, and performed H&E staining and immune-histochemical analyses. Analysis of covariance models was used to compare data from the GCD and GFD groups.
Results: Subjects on the GCD had more bowel movements per day (P < .04); the GCD had a greater effect on bowel movements per day of HLA-DQ2/8–positive than HLA-DQ2/8–negative patients (P < .019). The GCD was associated with higher SB permeability (based on 0-2 h levels of mannitol and the lactulose/
mannitol ratio); SB permeability was greater in HLA-DQ2/8–positive than HLADQ2/8–negative patients (P < .018). No significant differences in colonic permeability were observed. Patients on the GCD had a small decrease in expression of zonula occludens 1 in SB mucosa and significant decreases in expression of zonula occludens 1, claudin-1, and occludin in rectosigmoid mucosa; the effects of the GCD on expression were significantly greater in HLA-DQ2/8–positive patients. The GCD vs the GFD had no significant effects on transit or histology. Peripheral blood mononuclear cells produced higher levels of interleukin-10, granulocyte colony-stimulating factor, and transforming growth factor-α in response to gluten than rice (unrelated to HLA genotype). Conclusions: Gluten alters bowel barrier functions in patients with IBS-D, particularly in HLA-DQ2/8–positive patients. These findings reveal a reversible mechanism for the disorder. Clinical trials.gov NCT01094041.

Our data convincingly showed effects of gluten on the increased mRNA expression of all the measured TJ proteins in colonic tissue relative to GFD. One limitation of the study was the inability to document alterations in colonic permeability using the 2-sugar excretion profile from 8 to 24 hours. We perceive that this may represent a lack of sensitivity of the lactulose and mannitol excretion test, for example, because of the metabolism of both sugars by colonic bacteria. There are advantages to measuring both tissue and in vivo markers of barrier function. Another limitation was that the mechanism for improvement in stool frequency on a GFD in the absence of changes in colonic transit was not elucidated by our studies. Because it is unclear whether gluten or its metabolic products induce specific secretory mechanisms, the current hypothesis is that change in stool frequency may reflect change in fluid secretion from increased mucosal permeability. Our current studies did not evaluate effects of gluten on the microbiome, afferent functions, or cytokine expression in the mucosal biopsy specimens from patients before and after the interventions. These would be interesting parameters to include in future studies. Finally, our study did not specifically address the effects of gluten protein per se, and it is possible that other proteins in wheat flour may be responsible for the changes observed.

Overall, our data provide mechanistic explanations for the observation that gluten withdrawal may improve patient symptoms in IBS. The data also explain, in part, the observation of the relationship of HLA genotype to beneficial effects of gluten withdrawal in view of our results showing that biological effects of gluten were associated with HLA-DQ2 or HLA-DQ8 genotype. The data suggest that the relationship of dietary factors, innate and adaptive immune responses, and mucosal interactions in IBS-D deserve further study, and they support the need for further clinical intervention studies to evaluate the clinical effects of gluten withdrawal in patients with IBS-D.


Ingestion of oats and barley in patients with celiac disease mobilizes cross-reactive T cells activated by avenin peptides and immuno-dominant hordein peptides

Melinda Y. Hardy, Jason A. Tye-Din, Jessica A. Stewart, et al.
Journal of Autoimmunity 56 (2015) 56-65
http://dx.doi.org/10.1016/j.jaut.2014.10.003

Celiac disease (CD) is a common CD4+ T cell mediated enteropathy driven by gluten in wheat, rye, and barley. Whilst clinical feeding studies generally support the safety of oats ingestion in CD, the avenin protein from oats can stimulate intestinal gluten-reactive T cells isolated from some CD patients in vitro. Our objective was to establish whether ingestion of oats or other grains toxic in CD stimulate an avenin specific T cell response in vivo. We fed participants a meal of oats (100 g/day over 3 days) to measure the in vivo polyclonal avenin-specific T cell responses to peptides contained within comprehensive avenin peptide libraries in 73 HLADQ2.5+ CD patients. Grain cross-reactivity was investigated using oral challenge with wheat, barley, and rye. Avenin-specific responses were observed in 6/73 HLA-DQ2.5+ CD patients (8%), against four closely related peptides. Oral barley challenge efficiently induced cross-reactive avenin/hordein-specific T cells in most CD patients, whereas wheat or rye challenge did not. In vitro, immunogenic avenin peptides were susceptible to digestive endopeptidases and showed weak HLA-DQ2.5 binding stability. Our findings indicate that CD patients possess T cells capable of responding to immuno-dominant hordein epitopes and homologous avenin peptides ex vivo, but the frequency and consistency of these T cells in blood is substantially higher after oral challenge with barley compared to oats. The low rates of T cell activation after a substantial oats challenge (100 g/d) suggests that doses of oats commonly consumed are insufficient to cause clinical relapse, and supports the safety of oats demonstrated in long-term feeding studies.


Diagnosis and classification of celiac disease and gluten sensitivity

Elio Tonutti, Nicola Bizzaro
Autoimmunity Reviews 13 (2014) 472–476
http://dx.doi.org/10.1016/j.autrev.2014.01.043
Celiac disease is a complex disorder, the development of which is controlled by a combination of genetic (HLA alleles) and environmental (gluten ingestion) factors. New diagnostic guidelines developed by ESPGHAN emphasize the crucial role of serological tests in the diagnostic process of symptomatic subjects, and of the detection of HLA DQ2/DQ8 alleles in defining a diagnosis in asymptomatic subjects belonging to at-risk groups. The serological diagnosis of CD is based on the detection of class IgA anti-tissue transglutaminase (anti-tTG) and anti-endomysial antibodies. In patients with IgA deficiency, anti-tTG or anti-deamidated gliadin peptide antibody assays of the IgG class are used. When anti-tTG antibody levels are very high, antibody specificity is absolute and CD can be diagnosed without performing a duodenum biopsy. Non-celiac gluten sensitivity is a gluten reaction in which both allergic and autoimmune mechanisms have been ruled out. Diagnostic criteria include the presence of symptoms similar to those of celiac or allergic patients; negative allergological tests and absence of anti-tTG and EMA antibodies; normal duodenal histology; evidence of disappearance of the symptoms with a gluten-free diet; relapse of the symptoms when gluten is reintroduced.

Celiac disease (CD) is a chronic, immune-mediated, gluten-induced gut disorder that manifests itself with a range of clinical symptoms in genetically susceptible subjects. Immune reaction to wheat, barley and rye gliadin fractions and glutenins triggers an inflammatory state of the duodenal mucosa: the result is reduced intestinal villus height and hyperplastic cryptae that may lead to complete villus atrophy. The critical role played by gluten is demonstrated by the fact that in CD patients on a gluten free diet (GFD) clinical symptoms disappear, anti-transglutaminase 2 antibodies (anti-tTG2, the serological markers of the disorder) normalize, and villus atrophy recedes. As to the role
of genetic factors, CD development has been demonstrated to be closely associated with MHC class II HLA-DQ2 and HLA-DQ8 molecules; in fact, virtually all CD patients express at least one of these HLA molecules compared to the general population in which about 30–35% have either DQ2 or DQ8.

A new gluten-associated clinical condition, named ‘non-celiac gluten sensitivity’ (NCGS) [4], also described in literature as gluten hypersensitivity or gluten intolerance, has been recently identified. NCGS is characterized by gastrointestinal or extra-intestinal symptoms comparable, in many cases, to those of CD patients; however, to date no specific immunological mechanisms or serological markers have been identified for this disorder. The diagnosis is made by exclusion of CD or IgE-mediated allergy to wheat, and is based on the direct association between gluten ingestion and symptom onset.

The development of highly sensitive immunological methods for identifying diagnostic antibodies (e.g. anti-tTG autoantibodies and anti-DGP antibodies) has enabled an increasing number of CD patients with vague or asymptomatic clinical presentations to be identified. Population-based studies now indicate that approximately 0.5–1% of the Western European and Northern American populations suffer from CD. In a recent paper, Abadie and coworkers correlate gluten consumption with HLA DQ2 and DQ8 haplotype frequency in the populations of the different world countries. The authors found a significant correlation between CD prevalence and wheat consumption, and between CD prevalence and DQ2–DQ8 frequency in most countries. However, outlier countries have been observed: Finland and Russia, for example, have similar wheat consumption levels and comparable HLA haplotype frequencies, but the prevalence of CD in Finland is 1–2.4% whereas in the adjacent Russian republic of Karelia the prevalence of CD is considerably lower (0.2%). In the Maghreb area, wheat and barley are the major staple foods. Despite similar frequencies of the DR3–DQ2 and DR4–DQ8 haplotypes, the prevalence of CD in Algeria (5.6%) is by far the highest reported worldwide, whereas CD prevalence in Tunisia (0.28%) remains one of the lowest. These observations suggest that similar levels of wheat consumption and predisposing HLA expression can be associated with strikingly different levels of CD prevalence.

CD is characterized by multiple clinical expressions. An ESPGHAN (European Society for Paediatric Gastroenterology, Hepatology and Nutrition) working group has recently developed new guidelines for the diagnosis of CD based on scientific and technical developments using an evidence-based approach. The ESPGHAN working group decided to revise the classification, also taking into consideration signs and symptoms that had not been considered in the previous classification. In particular, it was deemed advisable to eliminate the distinction between classic and atypical CD based on symptoms, as atypical signs and symptoms (e.g. anemia, neuropathy, reduced bone density) may be considerably more common than classic symptoms (e.g. chronic diarrhea).

Patients suffering from certain disorders (especially Hashimoto’s thyroiditis, type I diabetes, IgA deficiency and Down’s syndrome) have a higher risk of developing CD than the normal population. In these patients it is advisable to perform HLA DQ2/DQ8 and serological tests for CD even in the absence of symptoms.

CD and NGCS cannot be distinguished clinically, since the symptoms experienced by NGCS patients are often seen in CD. The definition of NGCS is a gluten reaction in which both allergic and autoimmune mechanisms have been ruled out (diagnosis by exclusion criteria).

Specifically: symptoms similar to those of celiac or allergic patients must be present; in vivo and in vitro wheat allergy tests (prick test and specific IgE), as well as anti-tTG and EMA antibodies must be negative; duodenal histology must be normal; the patients must also experience a disappearance of the symptoms when on a GFD and their reappearance after the reintroduction of gluten. The most frequent symptoms in NGCS patients are abdominal pain, eczema or rash, headache, blurred vision, fatigue, diarrhea, depression, anemia, numbness in the legs, arms or fingers, and joint pain.

Signs and symptoms of patients with non-celiac gluten sensitivity (NCGS)

Abdominal pain
Abdominal distension/bloating
Diarrhea
Eczema
Rash
Headache
Foggy mind
Fatigue
Depression
Anemia
Numbness in the legs, arms
Joint pain


An important aspect, confirmed by numerous studies, is the correlation between anti-tTG count and histological damage. One of the latest studies assessed retrospectively 412 consecutive anti-tTG and EMA patients who received a biopsy for suspected CD: the subjects whose levels of anti-tTG were greater than 7-fold the cut-off value had a 99.7% positive predictive value for histological damage (with Marsh score N2). To date, there are no specific laboratory markers for NCGS; a recent study by Volta found that 78 patients with NCGS were AGA IgG positive in 56.4% of the cases and AGA IgA positive in 7.7% of the cases. All patients were negative for anti-DGP IgG and IgA, as well as for anti-tTG and EMA.

Analysis of multiple biopsies is important: patchiness of the lesion has been reported and recent work suggests that different degrees of severity may be present, even in the same bioptic fragment. The biopsies should be taken from the second/third portion of the duodenum and at least one biopsy should be taken from the duodenal bulb. Patients with NCGS do not exhibit significant alterations of the duodenal mucosa; histological negativity is an essential parameter for a diagnosis of NCGS.

The diagnostic criteria proposed by ESPGHAN in 1990 envisaged the performance of gastro-duodenoscopy and histological confirmation of mucosal damage as the conclusive phase of the diagnostic process. These criteria did not indicate which serological tests should be positive, were not applicable to children aged below 2 years, and in any case required other clinical conditions to be ruled out. Therefore, in 2010, the ESPGHAN working group deemed appropriate to set out new criteria based on new knowledge and diagnostic tools developed in the last few years.

The new CD guidelines are revolutionary in two major respects: the crucial role of serological tests in the diagnostic process of symptomatic subjects, and the detection of HLA DQ2/DQ8 in diagnosing asymptomatic subjects belonging to groups at risk of CD.

Concerning the diagnosis of children and adolescents with signs and symptoms suggestive of CD, the ESPGHAN guidelines recommend, as the initial approach to symptomatic patients, testing for anti-tTG IgA antibodies as well as for total serum IgA to exclude IgA deficiency. As an alternative to total serum IgA, direct testing for IgG anti-DGP antibodies can be performed. The decision to perform IgA anti-tTG as the initial test in this population is based on the high sensitivity and specificity of the test, its widespread availability, and low costs compared with the EMA IgA test.

A fundamental aspect of the new guidelines concerns the possibility of not necessarily performing an intestinal biopsy if the anti-tTG antibody levels are very high, as in these cases the specificity of the antibody is absolute. Indeed, pediatric gastroenterologists should discuss with the parents and the patient who is positive for anti-tTG antibody levels N10 times ULN (as appropriate for age) the option of omitting the biopsies and the implications of doing so. If the parents (patient) accept this option, then blood should be drawn for HLA and EMA testing.

Patients with positive anti-tTG antibody levels lower than 10 times the upper limit for the normal population (ULN) given by the manufacturer of this particular test should undergo upper endoscopy with multiple biopsies.

As far as diagnosis methods in asymptomatic pediatric patients belonging to
at-risk groups are concerned, the ESPGHAN guidelines suggest a different procedure. In these patients, HLA-DQ2 and HLA-DQ8 testing as the initial action is probably cost-effective since a significant proportion of the patients can be excluded from further studies because they do not harbor DQ2 or DQ8. In individuals with DQ2 or DQ8 positivity, IgA anti-tTG and total serum IgA determination should be performed. If IgA anti-tTG is negative and IgA deficiency is excluded, then CD is unlikely; however, the disease may still develop later in life. Therefore, serological testing should be repeated at regular intervals. If anti-tTG antibodies are positive, then signs related to CD should be searched for (e.g. anemia, elevated liver enzymes).


Influence of dietary components on Aspergillus niger prolyl endoprotease mediated gluten degradation

Veronica Montserrat, Maaike J. Bruins, Luppo Edens, Frits Koning
Food Chemistry 174 (2015) 440–445
http://dx.doi.org/10.1016/j.foodchem.2014.11.053

Celiac disease (CD) is caused by intolerance to gluten. Oral supplementation with enzymes like Aspergillus niger propyl-endoprotease (AN-PEP), which can hydrolyse gluten, has been proposed to prevent the harmful effects of ingestion of gluten. The influence of meal composition on AN-PEP activity was investigated using an in vitro model that simulates stomach-like conditions. AN-PEP optimal dosage was 20 proline protease units (PPU)/g gluten. The addition of a carbonated drink strongly enhanced AN-PEP activity because of its acidifying effect. While fat did not affect gluten degradation by AN-PEP, the presence of food proteins slowed down gluten detoxification. Moreover, raw gluten was degraded more efficiently by AN-PEP than baked gluten. We conclude that the meal composition influences the amount of AN-PEP needed for gluten elimination. Therefore, AN-PEP should not be used to replace a gluten free diet, but rather to support digestion of occasional and/or inadvertent gluten consumption.


No Effects of Gluten in Patients with Self-Reported Non-Celiac Gluten Sensitivity after Dietary Reduction of Fermentable, Poorly Absorbed, Short-Chain Carbohydrates

Jessica R. Biesiekierski, Simone L. Peters, Evan D. Newnham, et al.
Gastroenterology 2013;145:320–328
http://dx.doi.org/10.1053/j.gastro.2013.04.051

Background & Aims: Patients with non-celiac gluten sensitivity (NCGS) do not have celiac disease but their symptoms improve when they are placed on gluten-free diets. We investigated the specific effects of gluten after dietary reduction of fermentable, poorly absorbed, short-chain carbohydrates (fermentable, oligo-, di-, monosaccharides, and polyols [FODMAPs]) in subjects believed to have NCGS. Methods: We performed a double-blind crossover trial of 37 subjects (aged 2461 y, 6 men) with NCGS and irritable bowel syndrome (based on Rome III criteria), but not celiac disease. Participants were randomly assigned to groups given a 2-week diet of reduced FODMAPs, and were then placed on high-gluten (16 g gluten/d), low-gluten (2 g gluten/d and 14 g whey protein/d), or control (16 g whey protein/d) diets for 1 week, followed by a washout period of at least 2 weeks. We assessed serum and fecal markers of intestinal inflammation/injury and immune activation, and indices of fatigue. Twenty-two participants then crossed over to groups given gluten (16 g/d), whey (16 g/d), or control (no additional protein) diets for 3 days. Symptoms were evaluated by visual analogue scales. Results: In all participants, gastrointestinal symptoms consistently and significantly improved during reduced FODMAP intake, but significantly worsened to a similar degree when their diets included gluten or whey protein. Gluten-specific effects were observed in only 8% of participants. There were no diet-specific changes in any biomarker. During the 3-day rechallenge, participants’ symptoms increased by similar levels among groups. Gluten-specific gastrointestinal effects were not reproduced. An order effect was observed. Conclusions: In a placebo controlled, cross-over rechallenge study, we found no evidence of specific or dose-dependent effects of gluten in patients with NCGS placed diets low in FODMAPs. www.anzctr.org.au.ACTRN12610000524099


Gluten Sensitivity: Not Celiac and Not Certain

See “No effects of gluten in patients with self-reported non-celiac gluten sensitivity after dietary reduction of fermentable, poorlyabsorbed, short-chain carbohydrates,” by Biesiekierski JR, Peters SL, Newnham ED, et al.

Rohini Vanga, Daniel A. Leffler
http://dx.doi.org/10.1053/j.gastro.2013.06.027

The past few years have seen a flurry of clinical and basic research studies targeting NCGS, the results of which seem determined to thwart any attempt to come to broad consensus regarding what NCGS is or is not, what causes it, and who it might affect.

Some studies suggest that NCGS generally belongs on the spectrum of functional bowel disorders. Other studies are more suggestive that NCGS may actually fit better within the spectrum of celiac disease. For example, in contrast with the studies by Biesiekierski et al. and Saponi et al., a number of studies have reported that nonceliac individuals with gluten-responsive symptoms are more likely to carry human leukocyte antigen (HLA)-DQ2/8. Taking a somewhat different tack, Carroccio et al. reported that NCGS patients with negative wheat IgE allergy testing developed greater symptoms with wheat exposure compared with placebo (P < .0001). The presence of anemia, weight loss, self-reported wheat intolerance, history of food allergy in infancy, and coexistent atopic diseases were more frequent in wheat-sensitive patients than in non–gluten-responsive IBS controls. There was also a higher frequency of positive serum assays for IgG/IgA anti-gliadin and greater association with DQ2 or DQ8 haplotype than controls.

In this issue of Gastroenterology, Biesiekierski et al. return with another double-blind, randomized, controlled trial on NCGS. Although in many ways this work seems to have been designed as a more thorough follow-on study to their prior work, the most significant variation from the prior study was the recommendation that participants restrict to low-fermentable, poorly absorbed, short-chain carbohydrates (FODMAPs) throughout the study. With the changing patterns of food intake and dietary behaviors over the last 20 years so-called westernization, FODMAPs have constituted significant proportion in food consumption. FODMAPs have been identified as important triggers for functional gut symptoms in people with visceral hypersensitivity or abnormal motility responses, largely by inducing luminal distension via a combination of osmotic effects and gas production related to their rapid fermentation by bacteria in the small and proximal large intestines. This seems to have been the rationale behind the addition of a low FODMAP diet in the current study, limiting alternate dietary triggers that could confound results. In the current study,  subjects with NCGS defined as “IBS fulfilling Rome III criteria that self-reportedly improved with a GFD” after exclusion of celiac disease were enrolled into the trial.

This study calls into question the very existence of NCGS as a discrete entity and suggests that FODMAPs, rather than gluten or other wheat proteins, might be the mediator by which low-gluten diets improve gastrointestinal symptoms. As noted, there are many potential ways in which FODMAPs may elicit gastrointestinal symptoms in predisposed individuals; however, limited as our understanding of NCGS is, investigation into FODMAPs in gastrointestinal disease has been nearly nonexistent outside of a few small studies published by this same group. The other clear possibility is that NCGS is a real entity but confounded by a low FODMAP diet by an unclear mechanism. In either case, it is tempting to say that everything seems to be at a standstill and therefore NCGS remains a controversial topic. Overall, these studies have highlighted the great potential of specific dietary interventions in gastrointestinal disorders outside of celiac disease. Although few facets of NCGS are clear, it is apparent that only the combination of larger, high-quality clinical trials on the role of specific diets in patients with chronic gastrointestinal symptoms, and translational studies evaluating mechanisms and potential biomarkers of NCGS and other food sensitivities, will allow us to make advances on this elusive entity.


Predictors of dietary gluten avoidance in adults without a prior diagnosis of celiac disease

Pornthep Tanpowpong , S Broder-Fingert, AJ. Katz, CA. Camargo Jr.
Nutrition 31 (2015) 236–238
http://dx.doi.org/10.1016/j.nut.2014.07.001

Objective: Prior studies have shown that dietary gluten avoidance (DGA) is relatively common in children without previously diagnosed celiac disease (CD), and several clinical predictors of DGA have been found. However, available data on predictors of DGA in adults without diagnosed CD are limited. The aim of this study was to determine the independent predictors of DGA in this population. Methods: We performed a structured medical record review of 376 patients, ages 20 y, who had never been formally diagnosed with CD, presenting for an initial CD evaluation (ICD-9-CM 579.0) between January 2000 and December 2010 at two large Boston teaching hospitals. We collected data including demographic characteristics, medical history, history of CD serology before referral, and self-reported DGA. Predictors of DGA were determined using multivariable logistic regression. Results: Mean age was 47 (SD ¼ 17) years. We found that 41 patients (10.9%; 95% confidence interval [CI], 7.9–14.5) had avoided gluten at some time in their lives. Most patients had subjective abdominal complaints or bowel movement changes. History of CD seropositivity before referral was noted in 14%. Independent predictors of DGA (P < 0.05) were lactose intolerance (odds ratio [OR], 2.8; 95% CI, 1.1–7.5), food allergy (OR, 3.8; 95% CI, 1.04–13.7), and history of positive serology of less-specific CD markers before the referral (OR, 3.2; 95% CI, 1.3–7.9). Conclusions: Gluten avoidance is common in a clinic population of adults without prior CD diagnosis. The recognized predictors suggest that DGA may associate with conditions presenting with nonspecific gastrointestinal complaints and perhaps with the perceived benefits of DGA among patients with prior history of positive CD serology.

Solubilization of gliadins for use as a source of nitrogen in the selection of bacteria with gliadinase activity

Patricia Alvarez-Sieiro, Begoña Redruello, Victor Ladero, Elena Cañedo, et al.
Food Chemistry 168 (2015) 439–444
http://dx.doi.org/10.1016/j.foodchem.2014.07.085

For patients with celiac disease, gliadin detoxification via the use of gliadinases may provide an alternative to a gluten-free diet. A culture medium, in which gliadins were the sole source of nitrogen, was developed for screening for microorganisms with gliadinase activity. The problem of gliadin insolubility was solved by mild acid treatment, which renders an acid-hydrolysed gliadin/peptide mixture (AHG). This medium provided a sensitive and reliable means of detecting proteases, compared to the classical spectrophotometric method involving azocasein. When a sample of fermented wheat (a source of bacteria) was plated on an AHG-based culture medium, strains with gliadinase activity were isolated. These strains’ gliadinase profiles were determined using an AHG-based substrate in zymographic analyses.


Sustained in vivo signaling by long-lived IL-2 induces prolonged increases of regulatory T cells

Charles J.M. Bell, Yongliang Sun, Urszula M. Nowak, Jan Clark, et al.
Journal of Autoimmunity 56 (2015) 66e80
http://dx.doi.org/10.1016/j.jaut.2014.10.002

Regulatory T cells (Tregs) expressing FOXP3 are essential for the maintenance of self-tolerance and are deficient in many common autoimmune diseases. Immune tolerance is maintained in part by IL-2 and deficiencies in the IL-2 pathway cause reduced Treg function and an increased risk of autoimmunity. Recent studies expanding Tregs in vivo with low-dose IL-2 achieved major clinical successes highlighting the potential to optimize this pleiotropic cytokine for inflammatory and autoimmune disease indications. Here we compare the clinically approved IL-2 molecule, Proleukin, with two engineered IL-2 molecules with long half-lives owing to their fusion in monovalent and bivalent stoichiometry to a non-FcRg binding human IgG1. Using nonhuman primates, we demonstrate that single ultra-low doses of IL-2 fusion proteins induce a prolonged state of in vivo activation that increases Tregs for an extended period of time similar to multiple-dose Proleukin. One of the common pleiotropic effects of high dose IL-2 treatment, eosinophilia, is eliminated at doses of the IL-2 fusion proteins that greatly expand Tregs. The long half-lives of the IL-2 fusion proteins facilitated a detailed characterization of an IL-2 dose response driving Treg expansion that correlates with increasingly sustained, supra-threshold pSTAT5α induction and subsequent sustained increases in the expression of CD25, FOXP3 and Ki-67 with retention of Treg-specific epigenetic signatures at FOXP3 and CTLA4.

Over the last 20 years we have progressed from discovering that IL-2 and IL-2RA are genetically associated with autoimmune diabetes and the functional state of Tregs to seeing dramatic clinical success with IL-2 in chronic GVHD. The central role of IL-2 in the maintenance of self-tolerance and Treg function is now immunological canon and many attempts are being made to harness Tregs to combat a variety of autoimmune and inflammatory diseases. The recent clinical successes with Proleukin are noteworthy since pharmacologically it is a drug with limitations: its short half-life requires daily or every other day injection and the doses used to date stimulate CD4+ T effector cells, NK cells and eosinophils in addition to Tregs. Our goal was to develop and characterize IL-2 molecules with improved pharmacologic profiles that could be delivered less frequently and at lower doses than Proleukin and selectively expand Tregs that maintained their epigenetic profiles at FOXP3 and CTLA4.

Increasing the in vivo half-life of IL-2 by fusion to IgG1, i.e. IgG-IL-2, results in a molecule that can induce a 4-fold increase in Tregs after a single dose in cynomolgus, a response that multiple-dose, but no single dose, of Proleukin can achieve. Increasing the stoichiometry and hence the avidity, i.e. IgG-(IL-2)2, increases the potency and stimulates a similar increase in Tregs albeit at a 5-fold lower dose than IgG-IL-2. A detailed characterization of the in vivo dose responses for Proleukin and IgG-(IL-2)2 highlights that the magnitude and duration of Treg expansion, defined by its AUC, correlates with the magnitude and duration of pSTAT5α upregulation, also defined by its AUC. Single doses of Proleukin that increase pSTAT5α for one day have a minimal AUC and as a consequence little impact on Treg numbers; whereas single dose IgG-IL-2 and IgG-(IL-2)2 or multiple-dose Proleukin stimulate pSTAT5α that is  sustained for 4 days resulting in 3-4-fold larger pSTAT5α AUCs and corresponding increases in Tregs and the AUCs of Treg/mm3. Intermediate levels and duration of pSTAT5α induction result in moderate increases in Tregs. Following in vivo activation with Proleukin and IgG-(IL-2)2, Treg cell surface CD25 as well as intracellular FOXP3 and Ki-67, increased in a dose-dependent manner and persisted longer than the corresponding pSTAT5α responses; the effects of IgG-(IL-2)2 were >10-fold more potent and persisted longer than those induced by Proleukin. Of particular significance, the cynomolgus Tregs present after IgG-IL-2 and IgG-(IL-2)2-induced in vivo expansion retain their fully demethylated FOXP3 and CTLA4 epigenetic signatures indicating a functional suppressive phenotype.

The ability of cynomolgus to respond and differentiate amongst different forms and doses of IL-2 with varying degrees of activation and increases in Tregs speaks to their utility as a translational preclinical species. In fact, single doses of IgG-IL-2 and IgG-(IL-2)2 replicated the increased number of Tregs seen in GVHD patients given daily Proleukin. Furthermore, Proleukin given to cynomolgus following the same multiple-dose protocol at the human equivalent dose achieved the same increases in Tregs and eosinophils as patients with type 1 diabetes.

The long half-lives of IgG-IL-2 and IgG-(IL-2)2 enable the detection of receptor-mediated clearance of IL-2 in vivo; the half-lives of the fusion proteins are five times longer in mice in the absence of the high affinity IL-2 receptor. The competition for injected IL-2 by different cell populations and the upregulation of IL-2 receptors in response to injections of the cytokine are important considerations when interpreting IL-2 doses required for preferential Treg expansion.  The failure of low-dose IL-2 to expand cynomolgus NK cells in vivo means that this aspect of IL-2 immunotherapy using novel, long-lived molecules will need to be addressed in future human studies. Despite these differences, the pharmacokinetic and pharmacodynamic analyses in this cynomolgus study strongly support the hypothesis that increasing the half-life of IL-2 allows for lower doses of IL-2 to be delivered far less frequently thereby favoring prolonged Treg-specific cell expansion.


T cell subsets and their signature cytokines in autoimmune and inflammatory diseases

Itay Raphael, Saisha Nalawade, Todd N. Eagar, Thomas G. Forsthuber
Cytokine xxx (2014) xxx–xxx
http://dx.doi.org/10.1016/j.cyto.2014.09.011

CD4+ T helper (Th) cells are critical for proper immune cell homeostasis and host defense, but are also major contributors to pathology of autoimmune and inflammatory diseases. Since the discovery of the Th1/Th2 dichotomy, many additional Th subsets were discovered, each with a unique cytokine profile, functional properties, and presumed role in autoimmune tissue pathology. This includes Th1, Th2, Th17, Th22, Th9, and Treg cells which are characterized by specific cytokine profiles. Cytokines produced by these Th subsets play a critical role in immune cell differentiation, effector subset commitment, and in directing the effector response. Cytokines are often categorized into proinflammatory and anti-inflammatory cytokines and linked to Th subsets expressing them. This article reviews the different Th subsets in terms of cytokine profiles, how these cytokines influence and shape the immune response, and their relative roles in promoting pathology in autoimmune and inflammatory diseases. Furthermore, we will discuss whether Th cell pathogenicity can be defined solely based on their cytokine profiles and whether rigid definition of a Th cell subset by its cytokine profile is helpful.

T helper cell subsets differentiate and express their protective and pathogenic roles of their lineage-signature cytokines. The signature cytokines for each subset are as follows: IL-12 induces the expression of T-bet and differentiation into the Th1 subset which produces IFN-c and TNF; Th2 differentiation and GATA3 expression is induced by IL-4, leading to the production of IL-4, IL-5 and IL-13, whereas TGF- T helper-cell subset differentiation and the protective and pathogenic roles of their lineage-signature cytokines. The signature cytokines for each subset is as follows:  IL-12 induces the expression of T-β and differentiation into the Th1 subset which produces IFN-c and TNF; Th2 differentiation and GATA3 expression is induced by IL-4, leading to the production of IL-4, IL-5 and IL-13, whereas TGF-β and IL-4 induce PU.1 expression. This causes differentiation into the Th9 subset and leads to the production of IL-9. TGF-β induces the expression of Foxp3, which leads to differentiation into the Treg lineage; Th17 differentiation is a result of RORct expression induced by TGF-β, IL-6 and IL-23, leading to the production of IL-17, IL-22, IL-21, IL-25 and IL-26 (human); IL-6 and TNF induce AHR and differentiation into the Th22 subset and production of IL-22. STAT: Signal transducer and activator of transcription; RORc: RAR related orphan receptor gamma, AHR: Aryl hydrocarbon receptor, Foxp3: forkhead box P3 and IL-4 induce PU.1 expression which causes differentiation into the Th9 subset leading to the production of IL-9. TGF-β induces the expression of Foxp3, which leads to differentiation into the Treg lineage; Th17 differentiation is a result of RORct expression induced by TGF-β, IL-6 and IL-23, leading to the production of IL-17, IL-22, IL-21, IL-25 and IL-26 (human); IL-6 and TNF induce AHR and differentiation into the Th22 subset and production of IL-22. STAT: Signal transducer and activator of transcription; RORc: RAR related orphan receptor gamma, AHR: Aryl hydrocarbon receptor, Foxp3: forkhead box P3.

In autoimmune diseases, Th2 cells were initially described as anti-inflammatory based on their ability to suppress cell-mediated or Th1 models of disease. Th2 cells have been described in lesions of MS patients, and IL-4 and IL-4R expression has been reported in several cell types in close proximity to active demyelinating lesions. Over the years, however, a number of reports established a role for Th2 cells in tissue inflammation and implicated their cytokines in immunopathology.  Genain et al. reported that in marmoset monkeys with EAE the cytokine production was shifted from a Th1 to a Th2 pattern, and titers of autoantibodies to myelin oligodendrocyte glycoprotein (MOG) were enhanced. They concluded that induction of Th2 responses may exacerbate autoimmunity by enhancing production of pathogenic autoantibodies.

The involvement of Th2 cells and pathogenic antibodies contrast the prevailing models of murine EAE which are considered to be Th1 and Th17-effector T cell-mediated diseases. However, pathogenic roles for Th2 cells have also been reported in murine EAE. Lafaille et al. showed that adoptive transfer of Th2-polarized MBP-specific T effector cells elicited EAE in immunocompromised recipient mice (RAG-1 or TCRα deficient), but not immune-sufficient hosts. When compared with other T effector subsets, mice receiving Th2 cells developed EAE with delayed onset and milder symptoms. Jager et al. have also reported that 2D2 MOG-specific Th2 cells can induce EAE with delayed onset and low severity. Taken together, these reports support that Th2 cells can promote pathogenicity, but ensuing disease may be less severe. Alternatively, but not mutually exclusive, development of EAE may not have been mediated by ‘‘Th2’’ cytokines, but might have been due to the switch of Th2 cells to a Th1-like phenotype and secretion of proinflammatory cytokines such as IFN-c. Th2 cytokines are associated with the pathogenesis of antibody-mediated autoimmune diseases.

The expression of one signature cytokine, such as IL-17, may not tell the full story about Th subset commitment, since the stability of its expression may be influenced by different factors as mentioned above. Along these lines, IL-17 is enhanced by IL-23, which promotes the pathogenic potential of Th17 cells and enhances the expression of IL-17 by these cells. Thus, adoptive transfer of IL-23-induced Th17 cells results in severe EAE, and in the absence of IL-23 signaling the mice are resistant to EAE. However, the disease resistance seen in the absence of IL-23 signals was not due to the lack of expression of IL-17 or IL-22 by Th17 cells, but rather by the failure of these cells to produce GM-CSF, a cytokine that was initially believed to be produced by encephalitogenic, IFN-c producing Th1 cells. Indeed both Th1 cells and Th17 cells can produce GM-CSF. Interestingly, induction of GM-CSF expression by human Th cells is constrained by the IL-23/ROR-ct/Th17 cell axis but promoted by the IL-12/T-bet/Th1 cell axis. Thus the enigma remains as to why IL-23-induced Th17 cells are indispensable for the induction of EAE. As it turns out, IL-23-induced Th17 cells not only produce GM-CSF, but are also producing IFN-c. The observation of IFN-c producing Th17 cells lead to the realization that IL-17 and IFN-c double-producing cells, belonging to the Th17 subset, developed under the influence of IL-23 and converted into IL-17 producing Th1-like cells, and later to ‘‘exTh17’’ cells, while discontinuing the production of IL-17.

The concept of a specialized subset of T lymphocytes with suppressive function has been around since the early 1970s. In the mid-1990s a novel subset of Th cells with ‘‘regulatory’’ function was identified and designated Tregs. Tregs were later found to express the signature Foxp3 transcription factor, which is critical for their development, lineage commitment, and regulatory functions. Foxp3 expressing Treg subsets include thymically derived or natural Tregs (nTregs) and Tregs that are induced via post-thymic maturation (iTregs). Later, iTregs were further discriminated into Foxp3+ cells (Th3) and Foxp3 cells (Tr1). Numerous studies have identified Tregs as important immunoregulators in many inflammatory and autoimmune disease conditions including asthma, MS, and type-I diabetes.

Several mechanisms of Treg-mediated immune suppression have been identified, including: the secretion of anti-inflammatory  cytokines, expression of inhibitory receptors, and cytokine deprivation. For the purpose of this review we will focus on regulatory cytokine production. The two cytokines mostly associated with Tregs are IL-10 and TGF-β. Importantly, Tregs can themselves secrete these cytokines and use them to carry out their suppressive function. TGF-β is produced by both nTreg and Th3 cells, however other cells including B cells, macrophages, DCs, and many other non-immune cells, can also produce this cytokine. TGF-β is required for the generation of iTregs by inducing the expression of Foxp3 in a paracrine feedback loop that will convert naïve T cells (Th0) to differentiate into iTregs. The positive feedback loop between TGF-β and Foxp3 plays a critical role in maintaining peripheral tolerance and is key to the generation and maintenance of Tregs. In vivo, TGF-β producing Tregs have been shown to suppress EAE by inhibiting autoimmune T cell responses in the CNS of EAE mice.

Not shown.  A proposed model reveals an immune switch point from pathogenic Th17 cells to suppressive ex-Th17 cells in EAE. TGF-β, IL-6 and IL-23 induce the differentiation of Th17 cells in the immune periphery. In the CNS, signaling by IL-23 induces the expression of GM-CSF and IFN-c in Th17 cells, thereby rendering these cells pathogenic. In an autocrine signaling loop, IFN-c suppresses the expression of RORct and the production of GM-CSF (as well as IL-17) by pathogenic Th17 cells, thereby inducing a switch to ‘‘suppressive’’ exTh17 cells.

ExTh17 cells are expressing the transcription factor T-bet and as a result IFN-c, in an IL-23 dependent manner, which is important for the pathogenic potential of exTh17 cells. Furthermore, IFN-c acts as a potent negative regulator of ROR-ct, the master regulator of the Th17 subset that drives the production of GM-CSF. Similar observations were made in other inflammatory and autoimmune conditions, illustrating the transition of Th17 cells into Th1-like cells. These observations further support the view of a switch point at which anti-inflammatory pathways are activated by the same Th subsets that initially promoted pathogenicity. In this scenario, IFN-c inhibits GM-CSF production by Th17 cells in the target tissues. We propose a possible model for a switch point for GM-CSF production by ‘‘pathogenic’’ Th-17 cells which is mediated by IL-23 and IFN-c in EAE.

Taken together, the one cytokine, one pathogenic Th cell, does not fit the bill anymore. The discovery of Th1-like Th17 cells, exTh17 cells, etc. complicates the question as to whether targeting a single cytokine or pathogenic T cell subset will ever result in the cure for autoimmune diseases.

The immune system seems to favor a balance between pathogenic and protective Th cells via dual roles for ‘‘subset-specific’’, or ‘‘signature cytokines’’, as well as allowing plasticity for subset differentiation and expression of ‘‘signature’’ cytokine(s) by other Th subsets. The observation that many Th subsets can convert into IFN-c secreting Th1-like cells illustrates this fact since IFN-c can be both pathogenic and protective. Targeting cytokines as therapy for autoimmune and/or inflammatory disorders remains a conceptual challenge more than ever. Clearly, cytokine therapy proved successful in some cases, such as anti-TNF therapy of RA, with the caveat that surprising adverse effects were observed in some patients indicative of the additional roles of this cytokine.


Regulatory T-cells in autoimmune diseases: Challenges, controversies and—yet—unanswered question

Charlotte R. Grant, R Liberal, G Mieli-Vergani, D Vergani, MS Longhi
Autoimmunity Reviews 14 (2015) 105–116
http://dx.doi.org/10.1016/j.autrev.2014.10.012

Regulatory T cells (Tregs) are central to the maintenance of self-tolerance and tissue homeostasis. Markers commonly used to define human Tregs in the research setting include high expression of CD25, FOXP3 positivity and low expression/negativity for CD127. Many other markers have been proposed, but none unequivocally identifies bona fide Tregs. Tregs are equipped with an array of mechanisms of suppression, including the modulation of antigen presenting cell maturation and function, the killing of target cells, the disruption of metabolic pathways and the production of anti-inflammatory cytokines. Treg impairment has been reported in a number of human autoimmune conditions and includes Treg numerical and functional defects and conversion into effector cells in response to inflammation. In addition to intrinsic Treg impairment, resistance of effector T cells to Treg control has been described. Discrepancies in the literature are common, reflecting differences in the choice of study participants and the technical challenges associated with investigating this cell population. Studies differ in terms of the methodology used to define and isolate putative regulatory cells and to assess their suppressive function. In this review we outline studies describing Treg frequency and suppressive function in systemic and organ specific autoimmune diseases, with a specific focus on the challenges faced when investigating Tregs in these conditions.

There are four basic mechanisms that Tregs use to suppress immune responses:

  1. the modulation of antigen presenting cell (APC) maturation and function,
  2. the killing of target cells,
  3. the disruption of metabolic pathways and
  4. the production of anti-inflammatory cytokines

Fig not shown. A) Regulatory T cellmechanisms of suppression. Regulatory T cell (Treg) can suppress by four basicmechanisms. The interaction between cytotoxic T lymphocyte antigen-4 (CTLA4) and CD80/CD86, expressed by antigen presenting cells (APCs), leads to CD80/CD86 down-regulation. Removal of these co-stimulatory molecules modulates APC function, limiting the initiation of an adaptive immune response. Tregs induce effector T cell (Teff) apoptosis by the interaction between Galectin-9 (Gal-9) and the T cell immunoglobulin and mucin domain-3 (TIM-3), and by the release of granzymes which enter Teffs via perforin pores. Tregs release the anti-inflammatory cytokines TGFβ, IL10 and IL35. Treg expression of the ecto-enzymes CD39 and CD73 enables the hydrolysis of pro-inflammatory adenosine triphosphate (ATP) into anti-inflammatory adenosine (ADO). B) Regulatory T cell defects in autoimmunity. In health, Tregs maintain tolerance by exerting suppression of effector T cells. In organ specific autoimmune disease, Tregs fail to suppress autoreactive effector T cells, therefore leading to target cell death. Reported reasons for this include inadequate numbers of Tregs, impaired suppressive ability, Treg conversion into effector cells and resistance of effector T cells to Treg-mediated suppression.

In the following sections, studies investigating the frequency and suppressive function of Tregs in the archetypal non-organ specific autoimmune disease SLE, and the organ specific autoimmune diseases MS, T1D, RA, autoimmune thyroid disease, psoriasis and IBD will be discussed.

Treg defects are frequently reported in autoimmune disease. There are, however, often discrepancies in the literature, which can be accounted for by the choice of study participants and the techniques used to study this challenging population of cells. The search for new markers that could unequivocally identify bona fide human Tregs—for the purposes of both phenotypic and functional analysis—will greatly facilitate our understanding of the role of Tregs in autoimmune disease. Studies suggest that the nature of the Treg impairment differs according to the autoimmune disease under investigation. There are reports of numerical and functional Treg impairments, of resistance of effector T cells to Treg suppression and of conversion of Tregs to effector cells. It is, therefore, important to consider numerical, phenotypic and functional defects affecting a range of Treg subsets. Moreover, current evidence strongly implies that systemic or regional factors can confine Treg impairments to the target organ. Treg studies would, therefore, benefit from more thorough investigation of the inflammatory site.

Take-home message

  • Tregs are central to tolerance maintenance and tissue homeostasis.
  • Treg impairment has been reported in several autoimmune diseases.
  • Systemic or regional factors can confine Treg impairment to the target organ.
  • Challenges remain when defining and investigating Tregs in autoimmune diseases.


Read Full Post »

Lipid Metabolism

Lipid Metabolism

Reporter and Curator: Larry H. Bernstein, MD, FCAP 


This is fourth of a series of articles, lipid metabolism, that began with signaling and signaling pathways. These discussion lay the groundwork to proceed in later discussions that will take on a somewhat different approach. These are critical to develop a more complete point of view of life processes.  I have indicated that many of the protein-protein interactions or protein-membrane interactions and associated regulatory features have been referred to previously, but the focus of the discussion or points made were different.  The role of lipids in circulating plasma proteins as biomarkers for coronary vascular disease can be traced to the early work of Frederickson and the classification of lipid disorders.  The very critical role of lipids in membrane structure in health and disease has had much less attention, despite the enormous importance, especially in the nervous system.

  1. Signaling and signaling pathways
  2. Signaling transduction tutorial.
  3. Carbohydrate metabolism

3.1  Selected References to Signaling and Metabolic Pathways in Leaders in Pharmaceutical Intelligence

  1. Lipid metabolism
  2. Protein synthesis and degradation
  3. Subcellular structure
  4. Impairments in pathological states: endocrine disorders; stress hypermetabolism; cancer.


Lipid Metabolism

http://www.elmhurst.edu/~chm/vchembook/622overview.html

Overview of Lipid Catabolism:

The major aspects of lipid metabolism are involved with

  • Fatty Acid Oxidationto produce energy or
  • the synthesis of lipids which is called Lipogenesis.

The metabolism of lipids and carbohydrates are related by the conversion of lipids from carbohydrates. This can be seen in the diagram. Notice the link through actyl-CoA, the seminal discovery of Fritz Lipmann. The metabolism of both is upset by diabetes mellitus, which results in the release of ketones (2/3 betahydroxybutyric acid) into the circulation.


metabolism of fats

metabolism of fats


http://www.elmhurst.edu/~chm/vchembook/images/590metabolism.gif

The first step in lipid metabolism is the hydrolysis of the lipid in the cytoplasm to produce glycerol and fatty acids.

Since glycerol is a three carbon alcohol, it is metabolized quite readily into an intermediate in glycolysis, dihydroxyacetone phosphate. The last reaction is readily reversible if glycerol is needed for the synthesis of a lipid.

The hydroxyacetone, obtained from glycerol is metabolized into one of two possible compounds. Dihydroxyacetone may be converted into pyruvic acid, a 3-C intermediate at the last step of glycolysis to make energy.

In addition, the dihydroxyacetone may also be used in gluconeogenesis (usually dependent on conversion of gluconeogenic amino acids) to make glucose-6-phosphate for glucose to the blood or glycogen depending upon what is required at that time.

Fatty acids are oxidized to acetyl CoA in the mitochondria using the fatty acid spiral. The acetyl CoA is then ultimately converted into ATP, CO2, and H2O using the citric acid cycle and the electron transport chain.

There are two major types of fatty acids – ω-3 and ω-6.  There are also saturated and unsaturated with respect to the existence of double bonds, and monounsaturated and polyunsatured.  Polyunsaturated fatty acids (PUFAs) are important in long term health, and it will be seen that high cardiovascular risk is most associated with a low ratio of ω-3/ω-6, the denominator being from animal fat. Ω-3 fatty acids are readily available from fish, seaweed, and flax seed. More can be said of this later.

Fatty acids are synthesized from carbohydrates and occasionally from proteins. Actually, the carbohydrates and proteins have first been catabolized into acetyl CoA. Depending upon the energy requirements, the acetyl CoA enters the citric acid cycle or is used to synthesize fatty acids in a process known as LIPOGENESIS.

The relationships between lipid and carbohydrate metabolism are
summarized in Figure 2.


fattyacidspiral

fattyacidspiral

http://www.elmhurst.edu/~chm/vchembook/images/620fattyacidspiral.gif


 Energy Production Fatty Acid Oxidation:

Visible” ATP:

In the fatty acid spiral, there is only one reaction which directly uses ATP and that is in the initiating step. So this is a loss of ATP and must be subtracted later.

A large amount of energy is released and restored as ATP during the oxidation of fatty acids. The ATP is formed from both the fatty acid spiral and the citric acid cycle.


Connections to Electron Transport and ATP:

One turn of the fatty acid spiral produces ATP from the interaction of the coenzymes FAD (step 1) and NAD+ (step 3) with the electron transport chain. Total ATP per turn of the fatty acid spiral is:

Electron Transport Diagram – (e.t.c.)

Step 1 – FAD into e.t.c. = 2 ATP
Step 3 – NAD+ into e.t.c. = 3 ATP
Total ATP per turn of spiral = 5 ATP

In order to calculate total ATP from the fatty acid spiral, you must calculate the number of turns that the spiral makes. Remember that the number of turns is found by subtracting one from the number of acetyl CoA produced. See the graphic on the left bottom.

Example with Palmitic Acid = 16 carbons = 8 acetyl groups

Number of turns of fatty acid spiral = 8-1 = 7 turns

ATP from fatty acid spiral = 7 turns and 5 per turn = 35 ATP.

This would be a good time to remember that single ATP that was needed to get the fatty acid spiral started. Therefore subtract it now.

NET ATP from Fatty Acid Spiral = 35 – 1 = 34 ATP

Review ATP Summary for Citric Acid Cycle:The acetyl CoA produced from the fatty acid spiral enters the citric acid cycle. When calculating ATP production, you have to show how many acetyl CoA are produced from a given fatty acid as this controls how many “turns” the citric acid cycle makes.Starting with acetyl CoA, how many ATP are made using the citric acid cycle? E.T.C = electron transport chain

 Step  ATP produced
7  1
Step 4 (NAD+ to E.T.C.) 3
Step 6 (NAD+ to E.T.C.)  3
Step10 (NAD+ to E.T.C.)  3
Step 8 (FAD to E.T.C.) 2
 NET 12 ATP


 ATP Summary for Palmitic Acid – Complete Metabolism:The phrase “complete metabolism” means do reactions until you end up with carbon dioxide and water. This also means to use fatty acid spiral, citric acid cycle, and electron transport as needed.Starting with palmitic acid (16 carbons) how many ATP are made using fatty acid spiral? This is a review of the above panel E.T.C = electron transport chain

 Step  ATP (used -) (produced +)
Step 1 (FAD to E.T.C.) +2
Step 4 (NAD+ to E.T.C.) +3
Total ATP  +5
 7 turns  7 x 5 = 35
initial step  -1
 NET  34 ATP

The fatty acid spiral ends with the production of 8 acetyl CoA from the 16 carbon palmitic acid.

Starting with one acetyl CoA, how many ATP are made using the citric acid cycle? Above panel gave the answer of 12 ATP per acetyl CoA.

E.T.C = electron transport chain

 Step  ATP produced
One acetyl CoA per turn C.A.C. +12 ATP
8 Acetyl CoA = 8 turns C.A.C. 8 x 12 = 96 ATP
Fatty Acid Spiral 34 ATP
GRAND TOTAL  130 ATP


Fyodor Lynen

Feodor Lynen was born in Munich on 6 April 1911, the son of Wilhelm Lynen, Professor of Mechanical Engineering at the Munich Technische Hochschule. He received his Doctorate in Chemistry from Munich University under Heinrich Wieland, who had won the Nobel Prize for Chemistry in 1927, in March 1937 with the work: «On the Toxic Substances in Amanita». in 1954 he became head of the Max-Planck-Institut für Zellchemie, newly created for him as a result of the initiative of Otto Warburg and Otto Hahn, then President of the Max-Planck-Gesellschaft zur Förderung der Wissenschaften.

Lynen’s work was devoted to the elucidation of the chemical details of metabolic processes in living cells, and of the mechanisms of metabolic regulation. The problems tackled by him, in conjunction with German and other workers, include the Pasteur effect, acetic acid degradation in yeast, the chemical structure of «activated acetic acid» of «activated isoprene», of «activated carboxylic acid», and of cytohaemin, degradation of fatty acids and formation of acetoacetic acid, degradation of tararic acid, biosynthesis of cysteine, of terpenes, of rubber, and of fatty acids.

In 1954 Lynen received the Neuberg Medal of the American Society of European Chemists and Pharmacists, in 1955 the Liebig Commemorative Medal of the Gesellschaft Deutscher Chemiker, in 1961 the Carus Medal of the Deutsche Akademie der Naturforscher «Leopoldina», and in 1963 the Otto Warburg Medal of the Gesellschaft für Physiologische Chemie. He was also a member of the U>S> National Academy of Sciences, and shared the Nobel Prize in Physiology and Medicine with Konrad Bloch in 1964, and was made President of the Gesellschaft Deutscher Chemiker (GDCh) in 1972.

This biography was written at the time of the award and first published in the book series Les Prix Nobel. It was later edited and republished in Nobel Lectures, and shortened by myself.

The Pathway from “Activated Acetic Acid” to the Terpenes and Fatty Acids

My first contact with dynamic biochemistry in 1937 occurred at an exceedingly propitious time. The remarkable investigations on the enzyme chain of respiration, on the oxygen-transferring haemin enzyme of respiration, the cytochromes, the yellow enzymes, and the pyridine proteins had thrown the first rays of light on the chemical processes underlying the mystery of biological catalysis, which had been recognised by your famous countryman Jöns Jakob Berzelius. Vitamin B2 , which is essential to the nourishment of man and of animals, had been recognised by Hugo Theorell in the form of the phosphate ester as the active group of an important class of enzymes, and the fermentation processes that are necessary for Pasteur’s “life without oxygen”

had been elucidated as the result of a sequence of reactions centered around “hydrogen shift” and “phosphate shift” with adenosine triphosphate as the phosphate-transferring coenzyme. However, 1,3-diphosphoglyceric acid, the key substance to an understanding of the chemical relation between oxidation and phosphorylation, still lay in the depths of the unknown. Never-

theless, Otto Warburg was on its trail in the course of his investigations on the fermentation enzymes, and he was able to present it to the world in 1939.


This was the period in which I carried out my first independent investigation, which was concerned with the metabolism of yeast cells after freezing in liquid air, and which brought me directly into contact with the mechanism of alcoholic fermentation. This work taught me a great deal, and yielded two important pieces of information.


  • The first was that in experiments with living cells, special attention must be given to the permeability properties of the cell membranes, and
  • the second was that the adenosine polyphosphate system plays a vital part in the cell,
    • not only in energy transfer, but
    • also in the regulation of the metabolic processes.


.

This investigation aroused by interest in problems of metabolic regulation, which led me to the investigation of the Pasteur effects, and has remained with me to the present day.


My subsequent concern with the problem of the acetic acid metabolism arose from my stay at Heinrich Wieland’s laboratory. Workers here had studied the oxidation of acetic acid by yeast cells, and had found that though most of the acetic acid undergoes complete oxidation, some remains in the form of succinic and citric acids.


The explanation of these observations was provided-by the Thunberg-Wieland process, according to which two molecules of acetic acid are dehydrogenated to succinic acid, which is converted back into acetic acid via oxaloacetic acid, pyruvic acid, and acetaldehyde, or combines at the oxaloacetic acid stage with a further molecule of acetic acid to form citric acid (Fig. 1). However, an experimental check on this view by a Wieland’s student Robert Sonderhoffs brought a surprise. The citric acid formed when trideuteroacetic acid was supplied to yeast cells contained the expected quantity of deuterium, but the succinic acid contained only half of the four deuterium atoms required by Wieland’s scheme.


This investigation aroused by interest in problems of metabolic regulation, which led me to the investigation of the Pasteur effects, and has remained with me to the present day. My subsequent concern with the problem of the acetic acid metabolism arose from my stay at Heinrich Wieland’s laboratory. Workers here had studied the oxidation of acetic acid by yeast cells, and had found that though most of the acetic acid undergoes complete oxidation, some remains in the form of succinic and citric acid

The answer provided by Martius was that citric acid  is in equilibrium with isocitric acid and is oxidised to cr-ketoglutaric acid, the conversion of which into succinic acid had already been discovered by Carl Neuberg (Fig. 1).

It was possible to assume with fair certainty from these results that the succinic acid produced by yeast from acetate is formed via citric acid. Sonderhoff’s experiments with deuterated acetic acid led to another important discovery.

In the analysis of the yeast cells themselves, it was found that while the carbohydrate fraction contained only insignificant quantities of deuterium, large quantities of heavy hydrogen were present in the fatty acids formed and in the sterol fraction. This showed that

  • fatty acids and sterols were formed directly from acetic acid, and not indirectly via the carbohydrates.

As a result of Sonderhoff’s early death, these important findings were not pursued further in the Munich laboratory.

  • This situation was elucidated only by Konrad Bloch’s isotope experiments, on which he reports.

My interest first turned entirely to the conversion of acetic acid into citric acid, which had been made the focus of the aerobic degradation of carbohydrates by the formulation of the citric acid cycle by Hans Adolf Krebs. Unlike Krebs, who regarded pyruvic acid as the condensation partner of acetic acid,

  • we were firmly convinced, on the basis of the experiments on yeast, that pyruvic acid is first oxidised to acetic acid, and only then does the condensation take place.

Further progress resulted from Wieland’s observation that yeast cells that had been “impoverished” in endogenous fuels by shaking under oxygen were able to oxidise added acetic acid only after a certain “induction period” (Fig. 2). This “induction period” could be shortened by addition of small quantities of a readily oxidisable substrate such as ethyl alcohol, though propyl and butyl alcohol were also effective. I explained this by assuming that acetic acid is converted, at the expense of the oxidation of the alcohol, into an “activated acetic acid”, and can only then condense with oxalacetic acid.

In retrospect, we find that I had come independently on the same group of problems as Fritz Lipmann, who had discovered that inorganic phosphate is indispensable to the oxidation of pyruvic acid by lactobacilli, and had detected acetylphosphate as an oxidation product. Since this anhydride of acetic acid and phosphoric acid could be assumed to be the “activated acetic acid”.

I learned of the advances that had been made in the meantime in the investigation of the problem of “activated acetic acid”. Fritz Lipmann has described the development at length in his Nobel Lecture’s, and I need not repeat it. The main advance was the recognition that the formation of “activated acetic acid” from acetate involved not only ATP as an energy source, but also the newly discovered coenzyme A, which contains the vitamin pantothenic acid, and that “activated acetic acid” was probably an acetylated coenzyme  A.

http://www.nobelprize.org/nobel_prizes/medicine/laureates/1964/lynen-bio.html

http://onlinelibrary.wiley.com/store/10.1002/anie.201106003/asset/image_m/mcontent.gif?v=1&s=1e6dc789dfa585fe48947e92cc5dfdcabd8e2677

Fyodor Lynen

Lynen’s most important research at the University of Munich focused on intermediary metabolism, cholesterol synthesis, and fatty acid biosynthesis. Metabolism involves all the chemical processes by which an organism converts matter and energy into forms that it can use. Metabolism supplies the matter—the molecular building blocks an organism needs for the growth of new tissues. These building blocks must either come from the breakdown of molecules of food, such as glucose (sugar) and fat, or be built up from simpler molecules within the organism.

Cholesterol is one of the fatty substances found in animal tissues. The human body produces cholesterol, but this substance also enters the body in food. Meats, egg yolks, and milk products, such as butter and cheese, contain cholesterol. Such organs as the brain and liver contain much cholesterol. Cholesterol is a type of lipid, one of the classes of chemical compounds essential to human health. It makes up an important part of the membranes of each cell in the body. The body also uses cholesterol to produce vitamin D and certain hormones.

All fats are composed of an alcohol called glycerol and substances called fatty acids. A fatty acid consists of a long chain of carbon atoms, to which hydrogen atoms are attached. There are three types of fatty acids: saturated, monounsaturated, and polyunsaturated.

Living cells manufacture complicated chemical compounds from simpler substances through a process called biosynthesis. For example, simple molecules called amino acids are put together to make proteins. The biosynthesis of both fatty acids and cholesterol begins with a chemically active form of acetate, a two-carbon molecule. Lynen discovered that the active form of acetate is a coenzyme, a heat-stabilized, water-soluble portion of an enzyme, called acetyl coenzyme A. Lynen and his colleagues demonstrated that the formation of cholesterol begins with the condensation of two molecules of acetyl coenzyme A to form acetoacetyl coenzyme A, a four-carbon molecule.

http://science.howstuffworks.com/dictionary/famous-scientists/biologists/feodor-lynen-info.htm

Fyodor Lynen

Fyodor Lynen


SREBPs: activators of the complete program of cholesterol and fatty acid synthesis in the liver

Jay D. Horton1,2, Joseph L. Goldstein1 and Michael S. Brown1

1Department of Molecular Genetics, and
2Department of Internal Medicine, University of Texas Southwestern Medical Center, Dallas, Texas, USA

J Clin Invest. 2002;109(9):1125–1131.
http://dx.doi.org:/10.1172/JCI15593
Lipid homeostasis in vertebrate cells is regulated by a family of membrane-bound transcription factors designated sterol regulatory element–binding proteins (SREBPs). SREBPs directly activate the expression of more than 30 genes dedicated to the synthesis and uptake of cholesterol, fatty acids, triglycerides, and phospholipids, as well as the NADPH cofactor required to synthesize these molecules (14). In the liver, three SREBPs regulate the production of lipids for export into the plasma as lipoproteins and into the bile as micelles. The complex, interdigitated roles of these three SREBPs have been dissected through the study of ten different lines of gene-manipulated mice. These studies form the subject of this review.

SREBPs: activation through proteolytic processing

SREBPs belong to the basic helix-loop-helix–leucine zipper (bHLH-Zip) family of transcription factors, but they differ from other bHLH-Zip proteins in that they are synthesized as inactive precursors bound to the endoplasmic reticulum (ER) (1, 5). Each SREBP precursor of about 1150 amino acids is organized into three domains: (a) an NH2-terminal domain of about 480 amino acids that contains the bHLH-Zip region for binding DNA; (b) two hydrophobic transmembrane–spanning segments interrupted by a short loop of about 30 amino acids that projects into the lumen of the ER; and (c) a COOH-terminal domain of about 590 amino acids that performs the essential regulatory function described below.

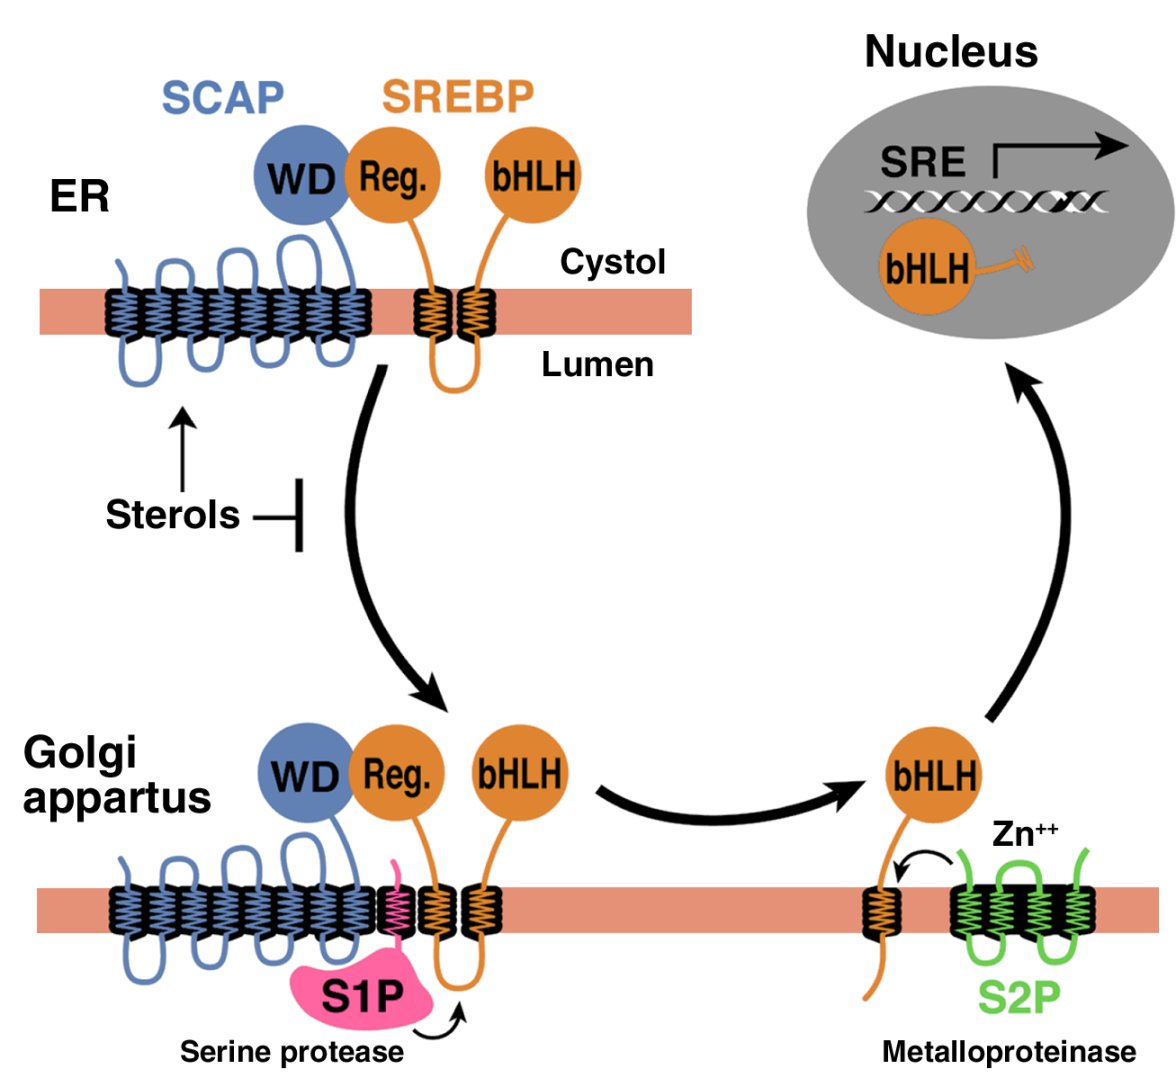
In order to reach the nucleus and act as a transcription factor, the NH2-terminal domain of each SREBP must be released from the membrane proteolytically (Figure 1). Three proteins required for SREBP processing have been delineated in cultured cells, using the tools of somatic cell genetics (see ref. 5for review). One is an escort protein designated SREBP cleavage–activating protein (SCAP). The other two are proteases, designated Site-1 protease (S1P) and Site-2 protease (S2P). Newly synthesized SREBP is inserted into the membranes of the ER, where its COOH-terminal regulatory domain binds to the COOH-terminal domain of SCAP (Figure 1).


Figure 1

Model for the sterol-mediated proteolytic release of SREBPs from membranes JCI0215593.f1

Model for the sterol-mediated proteolytic release of SREBPs from membranes JCI0215593.f1


Model for the sterol-mediated proteolytic release of SREBPs from membranes. SCAP is a sensor of sterols and an escort of SREBPs. When cells are depleted of sterols, SCAP transports SREBPs from the ER to the Golgi apparatus, where two proteases, Site-1 protease (S1P) and Site-2 protease (S2P), act sequentially to release the NH2-terminal bHLH-Zip domain from the membrane. The bHLH-Zip domain enters the nucleus and binds to a sterol response element (SRE) in the enhancer/promoter region of target genes, activating their transcription. When cellular cholesterol rises, the SCAP/SREBP complex is no longer incorporated into ER transport vesicles, SREBPs no longer reach the Golgi apparatus, and the bHLH-Zip domain cannot be released from the membrane. As a result, transcription of all target genes declines. Reprinted from ref. 5 with permission.

http://dm5migu4zj3pb.cloudfront.net/manuscripts/15000/15593/large/JCI0215593.f1.jpg

SCAP is both an escort for SREBPs and a sensor of sterols. When cells become depleted in cholesterol, SCAP escorts the SREBP from the ER to the Golgi apparatus, where the two proteases reside. In the Golgi apparatus, S1P, a membrane-bound serine protease, cleaves the SREBP in the luminal loop between its two membrane-spanning segments, dividing the SREBP molecule in half (Figure 1). The NH2-terminal bHLH-Zip domain is then released from the membrane via a second cleavage mediated by S2P, a membrane-bound zinc metalloproteinase. The NH2-terminal domain, designated nuclear SREBP (nSREBP), translocates to the nucleus, where it activates transcription by binding to nonpalindromic sterol response elements (SREs) in the promoter/enhancer regions of multiple target genes.


Figure 1


When the cholesterol content of cells rises, SCAP senses the excess cholesterol through its membranous sterol-sensing domain, changing its conformation in such a way that the SCAP/SREBP complex is no longer incorporated into ER transport vesicles. The net result is that SREBPs lose their access to S1P and S2P in the Golgi apparatus, so their bHLH-Zip domains cannot be released from the ER membrane, and the transcription of target genes ceases (1, 5). The biophysical mechanism by which SCAP senses sterol levels in the ER membrane and regulates its movement to the Golgi apparatus is not yet understood. Elucidating this mechanism will be fundamental to understanding the molecular basis of cholesterol feedback inhibition of gene expression.

SREBPs: two genes, three proteins

The mammalian genome encodes three SREBP isoforms, designated SREBP-1a, SREBP-1c, and SREBP-2. SREBP-2 is encoded by a gene on human chromosome 22q13. Both SREBP-1a and -1c are derived from a single gene on human chromosome 17p11.2 through the use of alternative transcription start sites that produce alternate forms of exon 1, designated 1a and 1c (1). SREBP-1a is a potent activator of all SREBP-responsive genes, including those that mediate the synthesis of cholesterol, fatty acids, and triglycerides. High-level transcriptional activation is dependent on exon 1a, which encodes a longer acidic transactivation segment than does the first exon of SREBP-1c. The roles of SREBP-1c and SREBP-2 are more restricted than that of SREBP-1a. SREBP-1c preferentially enhances transcription of genes required for fatty acid synthesis but not cholesterol synthesis. Like SREBP-1a, SREBP-2 has a long transcriptional activation domain, but it preferentially activates cholesterol synthesis (1). SREBP-1a and SREBP-2 are the predominant isoforms of SREBP in most cultured cell lines, whereas SREBP-1c and SREBP-2 predominate in the liver and most other intact tissues (6).

When expressed at higher than physiologic levels, each of the three SREBP isoforms can activate all enzymes indicated in Figure 2, which shows the biosynthetic pathways used to generate cholesterol and fatty acids. However, at normal levels of expression, SREBP-1c favors the fatty acid biosynthetic pathway and SREBP-2 favors cholesterologenesis. SREBP-2–responsive genes in the cholesterol biosynthetic pathway include those for the enzymes HMG-CoA synthase, HMG-CoA reductase, farnesyl diphosphate synthase, and squalene synthase. SREBP-1c–responsive genes include those for ATP citrate lyase (which produces acetyl-CoA) and acetyl-CoA carboxylase and fatty acid synthase (which together produce palmitate [C16:0]). Other SREBP-1c target genes encode a rate-limiting enzyme of the fatty acid elongase complex, which converts palmitate to stearate (C18:0) (ref.7); stearoyl-CoA desaturase, which converts stearate to oleate (C18:1); and glycerol-3-phosphate acyltransferase, the first committed enzyme in triglyceride and phospholipid synthesis (3). Finally, SREBP-1c and SREBP-2 activate three genes required to generate NADPH, which is consumed at multiple stages in these lipid biosynthetic pathways (8) (Figure 2).


Figure 2


major metabolic intermediates in the pathways for synthesis of cholesterol, fatty acids, and triglycerides JCI0215593.f2

major metabolic intermediates in the pathways for synthesis of cholesterol, fatty acids, and triglycerides JCI0215593.f2


http://dm5migu4zj3pb.cloudfront.net/manuscripts/15000/15593/large/JCI0215593.f2.jpg


Genes regulated by SREBPs. The diagram shows the major metabolic intermediates in the pathways for synthesis of cholesterol, fatty acids, and triglycerides. In vivo, SREBP-2 preferentially activates genes of cholesterol metabolism, whereas SREBP-1c preferentially activates genes of fatty acid and triglyceride metabolism. DHCR, 7-dehydrocholesterol reductase; FPP, farnesyl diphosphate; GPP, geranylgeranyl pyrophosphate synthase; CYP51, lanosterol 14α-demethylase; G6PD, glucose-6-phosphate dehydrogenase; PGDH, 6-phosphogluconate dehydrogenase; GPAT, glycerol-3-phosphate acyltransferase.

Genes regulated by SREBPs. The diagram shows the major metabolic intermediates in the pathways for synthesis of cholesterol, fatty acids, and triglycerides. In vivo, SREBP-2 preferentially activates genes of cholesterol metabolism, whereas SREBP-1c preferentially activates genes of fatty acid and triglyceride metabolism. DHCR, 7-dehydrocholesterol reductase; FPP, farnesyl diphosphate; GPP, geranylgeranyl pyrophosphate synthase; CYP51, lanosterol 14α-demethylase; G6PD, glucose-6-phosphate dehydrogenase; PGDH, 6-phosphogluconate dehydrogenase; GPAT, glycerol-3-phosphate acyltransferase.

Knockout and transgenic mice

Ten different genetically manipulated mouse models that either lack or overexpress a single component of the SREBP pathway have been generated in the last 6 years (916). The key molecular and metabolic alterations observed in these mice are summarized in Table 1.


Table 1
Alterations in hepatic lipid metabolism in gene-manipulated mice overexpressing or lacking SREBPs

http://dm5migu4zj3pb.cloudfront.net/manuscripts/15000/15593/small/JCI0215593.t1.gif

Knockout mice that lack all nSREBPs die early in embryonic development. For instance, a germline deletion of S1p, which prevents the processing of all SREBP isoforms, results in death before day 4 of development (15, 17). Germline deletion of Srebp2 leads to 100% lethality at a later stage of embryonic development than does deletion of S1p (embryonic day 7–8). In contrast, germline deletion of Srebp1, which eliminates both the 1a and the 1c transcripts, leads to partial lethality, in that about 15–45% of Srebp1–/– mice survive (13). The surviving homozygotes manifest elevated levels of SREBP-2 mRNA and protein (Table 1), which presumably compensates for the loss of SREBP-1a and -1c. When the SREBP-1c transcript is selectively eliminated, no embryonic lethality is observed, suggesting that the partial embryonic lethality in the Srebp1–/– mice is due to the loss of the SREBP-1a transcript (16).

To bypass embryonic lethality, we have produced mice in which all SREBP function can be disrupted in adulthood through induction of Cre recombinase. For this purpose, loxP recombination sites were inserted into genomic regions that flank crucial exons in the Scap or S1p genes (so-called floxed alleles) (14, 15). Mice homozygous for the floxed gene and heterozygous for a Cre recombinase transgene, which is under control of an IFN-inducible promoter (MX1-Cre), can be induced to delete Scap or S1p by stimulating IFN expression. Thus, following injection with polyinosinic acid–polycytidylic acid, a double-stranded RNA that provokes antiviral responses, the Cre recombinase is produced in liver and disrupts the floxed gene by recombination between the loxP sites.

Cre-mediated disruption of Scap or S1p dramatically reduces nSREBP-1 and nSREBP-2 levels in liver and diminishes expression of all SREBP target genes in both the cholesterol and the fatty acid synthetic pathways (Table 1). As a result, the rates of synthesis of cholesterol and fatty acids fall by 70–80% in Scap- and S1p-deficient livers.

In cultured cells, the processing of SREBP is inhibited by sterols, and the sensor for this inhibition is SCAP (5). To learn whether SCAP performs the same function in liver, we have produced transgenic mice that express a mutant SCAP with a single amino acid substitution in the sterol-sensing domain (D443N) (12). Studies in tissue culture show that SCAP(D443N) is resistant to inhibition by sterols. Cells that express a single copy of this mutant gene overproduce cholesterol (18). Transgenic mice that express this mutant version of SCAP in the liver exhibit a similar phenotype (12). These livers manifest elevated levels of nSREBP-1 and nSREBP-2, owing to constitutive SREBP processing, which is not suppressed when the animals are fed a cholesterol-rich diet. nSREBP-1 and -2 increase the expression of all SREBP target genes shown in Figure 2, thus stimulating cholesterol and fatty acid synthesis and causing a marked accumulation of hepatic cholesterol and triglycerides (Table 1). This transgenic model provides strong in vivo evidence that SCAP activity is normally under partial inhibition by endogenous sterols, which keeps the synthesis of cholesterol and fatty acids in a partially repressed state in the liver.

http://dm5migu4zj3pb.cloudfront.net/manuscripts/15000/15593/small/JCI0215593.t1.gif

Function of individual SREBP isoforms in vivo

To study the functions of individual SREBPs in the liver, we have produced transgenic mice that overexpress truncated versions of SREBPs (nSREBPs) that terminate prior to the membrane attachment domain. These nSREBPs enter the nucleus directly, bypassing the sterol-regulated cleavage step. By studying each nSREBP isoform separately, we could determine their distinct activating properties, albeit when overexpressed at nonphysiologic levels.

Overexpression of nSREBP-1c in the liver of transgenic mice produces a triglyceride-enriched fatty liver with no increase in cholesterol (10). mRNAs for fatty acid synthetic enzymes and rates of fatty acid synthesis are elevated fourfold in this tissue, whereas the mRNAs for cholesterol synthetic enzymes and the rate of cholesterol synthesis are not increased (8). Conversely, overexpression of nSREBP-2 in the liver increases the mRNAs only fourfold. This increase in cholesterol synthesis is even more remarkable when encoding all cholesterol biosynthetic enzymes; the most dramatic is a 75-fold increase in HMG-CoA reductase mRNA (11). mRNAs for fatty acid synthesis enzymes are increased to a lesser extent, consistent with the in vivo observation that the rate of cholesterol synthesis increases 28-fold in these transgenic nSREBP-2 livers, while fatty acid synthesis increases one considers the extent of cholesterol overload in this tissue, which would ordinarily reduce SREBP processing and essentially abolish cholesterol synthesis (Table 1).

http://dm5migu4zj3pb.cloudfront.net/manuscripts/15000/15593/small/JCI0215593.t1.gif

We have also studied the consequences of overexpressing SREBP-1a, which is expressed only at low levels in the livers of adult mice, rats, hamsters, and humans (6). nSREBP-1a transgenic mice develop a massive fatty liver engorged with both cholesterol and triglycerides (9), with heightened expression of genes controlling cholesterol biosynthesis and, still more dramatically, fatty acid synthesis (Table 1). The preferential activation of fatty acid synthesis (26-fold increase) relative to cholesterol synthesis (fivefold increase) explains the greater accumulation of triglycerides in their livers. The relative representation of the various fatty acids accumulating in this tissue is also unusual. Transgenic nSREBP-1a livers contain about 65% oleate (C18:1), markedly higher levels than the 15–20% found in typical wild-type livers (8) — a result of the induction of fatty acid elongase and stearoyl-CoA desaturase-1 (7). Considered together, the overexpression studies indicate that both SREBP-1 isoforms show a relative preference for activating fatty acid synthesis, whereas SREBP-2 favors cholesterol.

The phenotype of animals lacking the Srebp1 gene, which encodes both the SREBP-1a and -1c transcripts, also supports the notion of distinct hepatic functions for SREBP-1 and SREBP-2 (13). Most homozygous SREBP-1 knockout mice die in utero. The surviving Srebp1–/– mice show reduced synthesis of fatty acids, owing to reduced expression of mRNAs for fatty acid synthetic enzymes (Table 1). Hepatic nSREBP-2 levels increase in these mice, presumably in compensation for the loss of nSREBP-1. As a result, transcription of cholesterol biosynthetic genes increases, producing a threefold increase in hepatic cholesterol synthesis (Table 1).

http://dm5migu4zj3pb.cloudfront.net/manuscripts/15000/15593/small/JCI0215593.t1.gif

The studies in genetically manipulated mice clearly show that, as in cultured cells, SCAP and S1P are required for normal SREBP processing in the liver. SCAP, acting through its sterol-sensing domain, mediates feedback regulation of cholesterol synthesis. The SREBPs play related but distinct roles: SREBP-1c, the predominant SREBP-1 isoform in adult liver, preferentially activates genes required for fatty acid synthesis, while SREBP-2 preferentially activates the LDL receptor gene and various genes required for cholesterol synthesis. SREBP-1a and SREBP-2, but not SREBP-1c, are required for normal embryogenesis.

Transcriptional regulation of SREBP genes

Regulation of SREBPs occurs at two levels — transcriptional and posttranscriptional. The posttranscriptional regulation discussed above involves the sterol-mediated suppression of SREBP cleavage, which results from sterol-mediated suppression of the movement of the SCAP/SREBP complex from the ER to the Golgi apparatus (Figure 1). This form of regulation is manifest not only in cultured cells (1), but also in the livers of rodents fed cholesterol-enriched diets (19).

http://dm5migu4zj3pb.cloudfront.net/manuscripts/15000/15593/small/JCI0215593.f1.gif

The transcriptional regulation of the SREBPs is more complex. SREBP-1c and SREBP-2 are subject to distinct forms of transcriptional regulation, whereas SREBP-1a appears to be constitutively expressed at low levels in liver and most other tissues of adult animals (6). One mechanism of regulation shared by SREBP-1c and SREBP-2 involves a feed-forward regulation mediated by SREs present in the enhancer/promoters of each gene (20, 21). Through this feed-forward loop, nSREBPs activate the transcription of their own genes. In contrast, when nSREBPs decline, as in Scap or S1p knockout mice, there is a secondary decline in the mRNAs encoding SREBP-1c and SREBP-2 (14, 15).

Three factors selectively regulate the transcription of SREBP-1c: liver X-activated receptors (LXRs), insulin, and glucagon. LXRα and LXRβ, nuclear receptors that form heterodimers with retinoid X receptors, are activated by a variety of sterols, including oxysterol intermediates that form during cholesterol biosynthesis (2224). An LXR-binding site in the SREBP-1c promoter activates SREBP-1c transcription in the presence of LXR agonists (23). The functional significance of LXR-mediated SREBP-1c regulation has been confirmed in two animal models. Mice that lack both LXRα and LXRβ express reduced levels of SREBP-1c and its lipogenic target enzymes in liver and respond relatively weakly to treatment with a synthetic LXR agonist (23). Because a similar blunted response is found in mice that lack SREBP-1c, it appears that LXR increases fatty acid synthesis largely by inducing SREBP-1c (16). LXR-mediated activation of SREBP-1c transcription provides a mechanism for the cell to induce the synthesis of oleate when sterols are in excess (23). Oleate is the preferred fatty acid for the synthesis of cholesteryl esters, which are necessary for both the transport and the storage of cholesterol.

LXR-mediated regulation of SREBP-1c appears also to be one mechanism by which unsaturated fatty acids suppress SREBP-1c transcription and thus fatty acid synthesis. Rodents fed diets enriched in polyunsaturated fatty acids manifest reduced SREBP-1c mRNA expression and low rates of lipogenesis in liver (25). In vitro, unsaturated fatty acids competitively block LXR activation of SREBP-1c expression by antagonizing the activation of LXR by its endogenous ligands (26). In addition to LXR-mediated transcriptional inhibition, polyunsaturated fatty acids lower SREBP-1c levels by accelerating degradation of its mRNA (27). These combined effects may contribute to the long-recognized ability of polyunsaturated fatty acids to lower plasma triglyceride levels.

SREBP-1c and the insulin/glucagon ratio

The liver is the organ responsible for the conversion of excess carbohydrates to fatty acids to be stored as triglycerides or burned in muscle. A classic action of insulin is to stimulate fatty acid synthesis in liver during times of carbohydrate excess. The action of insulin is opposed by glucagon, which acts by raising cAMP. Multiple lines of evidence suggest that insulin’s stimulatory effect on fatty acid synthesis is mediated by an increase in SREBP-1c. In isolated rat hepatocytes, insulin treatment increases the amount of mRNA for SREBP-1c in parallel with the mRNAs of its target genes (28, 29). The induction of the target genes can be blocked if a dominant negative form of SREBP-1c is expressed (30). Conversely, incubating primary hepatocytes with glucagon or dibutyryl cAMP decreases the mRNAs for SREBP-1c and its associated lipogenic target genes (30, 31).

In vivo, the total amount of SREBP-1c in liver and adipose tissue is reduced by fasting, which suppresses insulin and increases glucagon levels, and is elevated by refeeding (32, 33). The levels of mRNA for SREBP-1c target genes parallel the changes in SREBP-1c expression. Similarly, SREBP-1c mRNA levels fall when rats are treated with streptozotocin, which abolishes insulin secretion, and rise after insulin injection (29). Overexpression of nSREBP-1c in livers of transgenic mice prevents the reduction in lipogenic mRNAs that normally follows a fall in plasma insulin levels (32). Conversely, in livers of Scap knockout mice that lack all nSREBPs in the liver (14) or knockout mice lacking either nSREBP-1c (16) or both SREBP-1 isoforms (34), there is a marked decrease in the insulin-induced stimulation of lipogenic gene expression that normally occurs after fasting/refeeding. It should be noted that insulin and glucagon also exert a posttranslational control of fatty acid synthesis though changes in the phosphorylation and activation of acetyl-CoA carboxylase. The posttranslational regulation of fatty acid synthesis persists in transgenic mice that overexpress nSREBP-1c (10). In these mice, the rates of fatty acid synthesis, as measured by [3H]water incorporation, decline after fasting even though the levels of the lipogenic mRNAs remain high (our unpublished observations).

Taken together, the above evidence suggests that SREBP-1c mediates insulin’s lipogenic actions in liver. Recent in vitro and in vivo studies involving adenoviral gene transfer suggest that SREBP-1c may also contribute to the regulation of glucose uptake and glucose synthesis. When overexpressed in hepatocytes, nSREBP-1c induces expression of glucokinase, a key enzyme in glucose utilization. It also suppresses phosphoenolpyruvate carboxykinase, a key gluconeogenic enzyme (35, 36).

SREBPs in disease

Many individuals with obesity and insulin resistance also have fatty livers, one of the most commonly encountered liver abnormalities in the US (37). A subset of individuals with fatty liver go on to develop fibrosis, cirrhosis, and liver failure. Evidence indicates that the fatty liver of insulin resistance is caused by SREBP-1c, which is elevated in response to the high insulin levels. Thus, SREBP-1c levels are elevated in the fatty livers of obese (ob/ob) mice with insulin resistance and hyperinsulinemia caused by leptin deficiency (38, 39). Despite the presence of insulin resistance in peripheral tissues, insulin continues to activate SREBP-1c transcription and cleavage in the livers of these insulin-resistant mice. The elevated nSREBP-1c increases lipogenic gene expression, enhances fatty acid synthesis, and accelerates triglyceride accumulation (31, 39). These metabolic abnormalities are reversed with the administration of leptin, which corrects the insulin resistance and lowers the insulin levels (38).

Metformin, a biguanide drug used to treat insulin-resistant diabetes, reduces hepatic nSREBP-1 levels and dramatically lowers the lipid accumulation in livers of insulin-resistant ob/ob mice (40). Metformin stimulates AMP-activated protein kinase (AMPK), an enzyme that inhibits lipid synthesis through phosphorylation and inactivation of key lipogenic enzymes (41). In rat hepatocytes, metformin-induced activation of AMPK also leads to decreased mRNA expression of SREBP-1c and its lipogenic target genes (41), but the basis of this effect is not understood.

The incidence of coronary artery disease increases with increasing plasma LDL-cholesterol levels, which in turn are inversely proportional to the levels of hepatic LDL receptors. SREBPs stimulate LDL receptor expression, but they also enhance lipid synthesis (1), so their net effect on plasma lipoprotein levels depends on a balance between opposing effects. In mice, the plasma levels of lipoproteins tend to fall when SREBPs are either overexpressed or underexpressed. In transgenic mice that overexpress nSREBPs in liver, plasma cholesterol and triglycerides are generally lower than in control mice (Table 1), even though these mice massively overproduce fatty acids, cholesterol, or both. Hepatocytes of nSREBP-1a transgenic mice overproduce VLDL, but these particles are rapidly removed through the action of LDL receptors, and they do not accumulate in the plasma. Indeed, some nascent VLDL particles are degraded even before secretion by a process that is mediated by LDL receptors (42). The high levels of nSREBP-1a in these animals support continued expression of the LDL receptor, even in cells whose cholesterol concentration is elevated. In LDL receptor–deficient mice carrying the nSREBP-1a transgene, plasma cholesterol and triglyceride levels rise tenfold (43).

Mice that lack all SREBPs in liver as a result of disruption of Scap or S1p also manifest lower plasma cholesterol and triglyceride levels (Table 1).

http://dm5migu4zj3pb.cloudfront.net/manuscripts/15000/15593/small/JCI0215593.t1.gif

In these mice, hepatic cholesterol and triglyceride synthesis is markedly reduced, and this likely causes a decrease in VLDL production and secretion. LDL receptor mRNA and LDL clearance from plasma is also significantly reduced in these mice, but the reduction in LDL clearance is less than the overall reduction in VLDL secretion, the net result being a decrease in plasma lipid levels (15). However, because

humans and mice differ substantially with regard to LDL receptor expression, LDL levels, and other aspects of lipoprotein metabolism,

it is difficult to predict whether human plasma lipids will rise or fall when the SREBP pathway is blocked or activated.

SREBPs in liver: unanswered questions

The studies of SREBPs in liver have exposed a complex regulatory system whose individual parts are coming into focus. Major unanswered questions relate to the ways in which the transcriptional and posttranscriptional controls on SREBP activity are integrated so as to permit independent regulation of cholesterol and fatty acid synthesis in specific nutritional states. A few clues regarding these integration mechanisms are discussed below.

Whereas cholesterol synthesis depends almost entirely on SREBPs, fatty acid synthesis is only partially dependent on these proteins. This has been shown most clearly in cultured nonhepatic cells such as Chinese hamster ovary cells. In the absence of SREBP processing, as when the Site-2 protease is defective, the levels of mRNAs encoding cholesterol biosynthetic enzymes and the rates of cholesterol synthesis decline nearly to undetectable levels, whereas the rate of fatty acid synthesis is reduced by only 30% (44). Under these conditions, transcription of the fatty acid biosynthetic genes must be maintained by factors other than SREBPs. In liver, the gene encoding fatty acid synthase (FASN) can be activated transcriptionally by upstream stimulatory factor, which acts in concert with SREBPs (45). The FASN promoter also contains an LXR element that permits a low-level response to LXR ligands even when SREBPs are suppressed (46). These two transcription factors may help to maintain fatty acid synthesis in liver when nSREBP-1c is low.

Another mechanism of differential regulation is seen in the ability of cholesterol to block the processing of SREBP-2, but not SREBP-1, under certain metabolic conditions. This differential regulation has been studied most thoroughly in cultured cells such as human embryonic kidney (HEK-293) cells. When these cells are incubated in the absence of fatty acids and cholesterol, the addition of sterols blocks processing of SREBP-2, but not SREBP-1, which is largely produced as SREBP-1a in these cells (47). Inhibition of SREBP-1 processing requires an unsaturated fatty acid, such as oleate or arachidonate, in addition to sterols (47). In the absence of fatty acids and in the presence of sterols, SCAP may be able to carry SREBP-1 proteins, but not SREBP-2, to the Golgi apparatus. Further studies are necessary to document this apparent independent regulation of SREBP-1 and SREBP-2 processing and to determine its mechanism.


Acknowledgments

Support for the research cited from the authors’ laboratories was provided by grants from the NIH (HL-20948), the Moss Heart Foundation, the Keck Foundation, and the Perot Family Foundation. J.D. Horton is a Pew Scholar in the Biomedical Sciences and is the recipient of an Established Investigator Grant from the American Heart Association and a Research Scholar Award from the American Digestive Health Industry.

References

  1. Brown, MS, Goldstein, JL. The SREBP pathway: regulation of cholesterol metabolism by proteolysis of a membrane-bound transcription factor. Cell 1997. 89:331-340.

View this article via: PubMed

  1. Horton, JD, Shimomura, I. Sterol regulatory element-binding proteins: activators of cholesterol and fatty acid biosynthesis. Curr Opin Lipidol 1999. 10:143-150.

View this article via: PubMed

  1. Edwards, PA, Tabor, D, Kast, HR, Venkateswaran, A. Regulation of gene expression by SREBP and SCAP. Biochim Biophys Acta 2000. 1529:103-113.

View this article via: PubMed

  1. Sakakura, Y, et al. Sterol regulatory element-binding proteins induce an entire pathway of cholesterol synthesis. Biochem Biophys Res Commun 2001. 286:176-183.

View this article via: PubMed

  1. Goldstein, JL, Rawson, RB, Brown, MS. Mutant mammalian cells as tools to delineate the sterol regulatory element-binding protein pathway for feedback regulation of lipid synthesis. Arch Biochem Biophys 2002. 397:139-148.

View this article via: PubMed

  1. Shimomura, I, Shimano, H, Horton, JD, Goldstein, JL, Brown, MS. Differential expression of exons 1a and 1c in mRNAs for sterol regulatory element binding protein-1 in human and mouse organs and cultured cells. J Clin Invest 1997. 99:838-845.

View this article via: JCI.org PubMed

  1. Moon, Y-A, Shah, NA, Mohapatra, S, Warrington, JA, Horton, JD. Identification of a mammalian long chain fatty acyl elongase regulated by sterol regulatory element-binding proteins. J Biol Chem 2001. 276:45358-45366.

View this article via: PubMed

  1. Shimomura, I, Shimano, H, Korn, BS, Bashmakov, Y, Horton, JD. Nuclear sterol regulatory element binding proteins activate genes responsible for entire program of unsaturated fatty acid biosynthesis in transgenic mouse liver. J Biol Chem 1998. 273:35299-35306.

View this article via: PubMed

  1. Shimano, H, et al. Overproduction of cholesterol and fatty acids causes massive liver enlargement in transgenic mice expressing truncated SREBP-1a. J Clin Invest 1996. 98:1575-1584.

View this article via: JCI.org PubMed

  1. Shimano, H, et al. Isoform 1c of sterol regulatory element binding protein is less active than isoform 1a in livers of transgenic mice and in cultured cells. J Clin Invest 1997. 99:846-854.

View this article via: JCI.org PubMed

  1. Horton, JD, et al. Activation of cholesterol synthesis in preference to fatty acid synthesis in liver and adipose tissue of transgenic mice overproducing sterol regulatory element-binding protein-2. J Clin Invest 1998. 101:2331-2339.

View this article via: JCI.org PubMed

  1. Korn, BS, et al. Blunted feedback suppression of SREBP processing by dietary cholesterol in transgenic mice expressing sterol-resistant SCAP(D443N). J Clin Invest 1998. 102:2050-2060.

View this article via: JCI.org PubMed

  1. Shimano, H, et al. Elevated levels of SREBP-2 and cholesterol synthesis in livers of mice homozygous for a targeted disruption of the SREBP-1 gene. J Clin Invest 1997. 100:2115-2124.

View this article via: JCI.org PubMed

  1. Matsuda, M, et al. SREBP cleavage-activating protein (SCAP) is required for increased lipid synthesis in liver induced by cholesterol deprivation and insulin elevation. Genes Dev 2001. 15:1206-1216.

View this article via: PubMed

  1. Yang, J, et al. Decreased lipid synthesis in livers of mice with disrupted Site-1 protease gene. Proc Natl Acad Sci USA 2001. 98:13607-13612.

View this article via: PubMed

Liang, G, et al. Diminished hepatic response to fasting/refeeding and liver X receptor agonists in mice with selective deficiency of sterol regulatory element-binding protein-1c. J Biol Chem 2002. 277:9520-9528.

http://www.jci.org/articles/view/15593


Structural Biochemistry/Lipids/Membrane Lipids

< Structural Biochemistry‎ | Lipids

Membrane proteins rely on their interaction with membrane lipids to uphold its structure and maintain its functions as a protein. For membrane proteins to purify and crystallize, it is essential for the membrane protein to be in the appropriate lipid environment. Lipids assist in crystallization and stabilize the protein and provide lattice contacts. Lipids can also help obtain membrane protein structures in a native conformation. Membrane protein structures contain bound lipid molecules. Biological membranes are important in life, providing permeable barriers for cells and their organelles. The interaction between membrane proteins and lipids facilitates basic processes such as respiration, photosynthesis, transport, signal transduction and motility. These basic processes require a diverse group of proteins, which are encoded by 20-30% of an organism’s annotated genes.

There exist a great number of membrane lipids. Specifically, eukaryotic cells have a very complex collection of lipids that rely on many of the cell’s resources for its synthesis. Interactions between proteins and lipids can be very specific. Specific types of lipids can make a structure stable, provide control in insertion and folding processes, and help to assemble multisubunit complexes or supercomplexes, and most importantly, can significantly affect a membrane protein’s functions. Protein and lipid interactions are not sufficiently tight, meaning that lipids are retained during membrane protein purification. Since cellular membranes are fluid arrangements of lipids, some lipids affect interesting changes to membrane due to their characteristics. Glycosphigolipids and cholesterol tend to form small islands within the membranes, called lipid rafts, due to their physical properties. Some proteins also tend to cluster in lipid raft, while others avoid being in lipid rafts. However, the existence of lipid rafts in cells seems to be transitory.

Recent progress in determining membrane protein structure has brought attention to the importance of maintaining a favorable lipid environment so proteins to crystallize and purify successfully. Lipids assist in crystallization by stabilizing the protein fold and the relationships between subunits or monomers. The lipid content in protein-lipid detergent complexes can be altered by adjusting solubilisation and purification protocols, also by adding native or non-native lipids.

There are three type of membrane lipids: 1. Phospholipids: major class of membrane lipids. 2. glycolipids. 3. Cholesterols. Membrane lipids were started with eukaryotes and bacteria.

http://en.wikibooks.org/wiki/Structural_Biochemistry/Lipids/Membrane_Lipids

Types of Membrane Lipids

Lipids are often used as membrane constituents. The three major classes that membrane lipids are divided into are phospholipids, glycolipids, and cholesterol. Lipids are found in eukaryotes and bacteria. Although the lipids in archaea have many features that are related to the membrane formation that is similar with lipids of other organisms, they are still distinct from one another. The membranes of archaea differ in composition in three major ways. Firstly, the nonpolar chains are joined to a glycerol backbone by ether instead of esters, allowing for more resistance to hydrolysis. Second, the alkyl chains are not linear, but branched and make them more resistant to oxidation. The ability of archaeal lipids to resist hydrolysis and oxidation help these types of organisms to withstand the extreme conditions of high temperature, low pH, or high salt concentration. Lastly, the stereochemistry of the central glycerol is inverted. Membrane lipids have an extensive repertoire, but they possess a critical common structural theme in which they are amphipathic molecules, meaning they contain both a hydrophilic and hydrophobic moiety.

Membrane lipids are all closed bodies or boundaries separating substituent parts of the cell. The thickness of membranes is usually between 60 and 100 angstroms. These bodies are constructed from non-covalent assemblies. Their polar heads align with each other and their non-polar hydrocarbon tails align as well. The resulting stability is credited to hydrophobic interaction which proves to be quite stable due to the length of their hydrocarbon tails.


Membrane Lipids

Lipid Vesicles

Lipid vesicles, also known as liposomes, are vesicles that are essentially aqueous vesicles that are surrounded by a circular phospholipid bilayer. Like the other phospholipid structures, they have the hydrocarbon/hydrophobic tails facing inward, away from the aqueous solution, and the hydrophilic heads facing towards the aqueous solution. These vesicles are structures that form enclosed compartments of ions and solutes, and can be utilized to study the permeability of certain membranes, or to transfer these ions or solutes to certain cells found elsewhere.

Liposomes as vesicles can serve various clinical uses. Injecting liposomes containing medicine or DNA (for gene therapy) into patients is a possible method of drug delivery. The liposomes fuse with other cells’ membranes and therefore combine their contents with that of the patient’s cell. This method of drug delivery is less toxic than direct exposure because the liposomes carry the drug directly to cells without any unnecessary intermediate steps.

Because of the hydrophobic interactions among several phospholipids and glycolipids, a certain structure called the lipid bilayer or bimolecular sheet is favored. As mentioned earlier, phospholipids and glycolipids have both hydrophilic and hydrophobic moieties; thus, when several phospholipids or glycolipids come together in an aqueous solution, the hydrophobic tails interact with each other to form a hydrophobic center, while the hydrophilic heads interact with each other forming a hydrophilic coating on each side of the bilayer.

http://upload.wikimedia.org/wikibooks/en/b/ba/Liposome_final%2A.png

http://upload.wikimedia.org/wikibooks/en/f/fa/Membrane_bilayer.jpg


Liposome_

Liposome_


Membrane_bilayer

Membrane_bilayer


Evidence Report/Technology Assessment   Number 89


Effects of Omega-3 Fatty Acids on Lipids and Glycemic Control in Type II Diabetes and the Metabolic Syndrome and on Inflammatory Bowel Disease, Rheumatoid Arthritis, Renal Disease, Systemic Lupus Erythematosus, and Osteoporosis


Prepared for:

Agency for Healthcare Research and Quality

U.S. Department of Health and Human Services

540 Gaither Road

Rockville, MD 20850

http://www.ahrq.gov

Contract No. 290-02-0003


Chapter 1. Introduction

This report is one of a group of evidence reports prepared by three Agency for Healthcare Research and Quality (AHRQ)-funded Evidence-Based Practice Centers (EPCs) on the role of omega-3 fatty acids (both from food sources and from dietary supplements) in the prevention or treatment of a variety of diseases. These reports were requested and funded by the Office of Dietary Supplements, National Institutes of Health. The three EPCs – the Southern California EPC (SCEPC, based at RAND), the Tufts-New England Medical Center (NEMC) EPC, and the University of Ottawa EPC – have each produced evidence reports. To ensure consistency of approach, the three EPCs collaborated on selected methodological elements, including literature search strategies, rating of evidence, and data table design.

The aim of these reports is to summarize the current evidence on the effects of omega-3 fatty acids on prevention and treatment of cardiovascular diseases, cancer, child and maternal health, eye health, gastrointestinal/renal diseases, asthma, immune- mediated diseases, tissue/organ transplantation, mental health, and neurological diseases and conditions. In addition to informing the research community and the public on the effects of omega-3 fatty acids on various health conditions, it is anticipated that the findings of the reports will also be used to help define the agenda for future research.

This report focuses on the effects of omega-3 fatty acids on immune- mediated diseases, bone metabolism, and gastrointestinal/renal diseases. Subsequent reports from the SCEPC will focus on cancer and neurological diseases and conditions.

This chapter provides a brief review of the current state of knowledge about the metabolism, physiological functions, and sources of omega-3 fatty acids.


The Recognition of Essential Fatty Acids

Dietary fat has long been recognized as an important source of energy for mammals, but in the late 1920s, researchers demonstrated the dietary requirement for particular fatty acids, which came to be called essential fatty acids. It was not until the advent of intravenous feeding, however, that the importance of essential fatty acids was widely accepted: Clinical signs of essential fatty acid deficiency are generally observed only in patients on total parenteral nutrition who received mixtures devoid of essential fatty acids or in those with malabsorption syndromes.

These signs include dermatitis and changes in visual and neural function. Over the past 40 years, an increasing number of physiological functions, such as immunomodulation, have been attributed to the essential fatty acids and their metabolites, and this area of research remains quite active.1, 2

Fatty Acid Nomenclature

The fat found in foods consists largely of a heterogeneous mixture of triacylglycerols (triglycerides)–glycerol molecules that are each combined with three fatty acids. The fatty acids can be divided into two categories, based on chemical properties: saturated fatty acids, which are usually solid at room temperature, and unsaturated fatty acids, which are liquid at room temperature. The term “saturation” refers to a chemical structure in which each carbon atom in the fatty acyl chain is bound to (saturated with) four other atoms, these carbons are linked by single bonds, and no other atoms or molecules can attach; unsaturated fatty acids contain at least one pair of carbon atoms linked by a double bond, which allows the attachment of additional atoms to those carbons (resulting in saturation). Despite their differences in structure, all fats contain approximately the same amount of energy (37 kilojoules/gram, or 9 kilocalories/gram).

The class of unsaturated fatty acids can be further divided into monounsaturated and polyunsaturated fatty acids. Monounsaturated fatty acids (the primary constituents of olive and canola oils) contain only one double bond. Polyunsaturated fatty acids (PUFAs) (the primary constituents of corn, sunflower, flax seed and many other vegetable oils) contain more than one double bond. Fatty acids are often referred to using the number of carbon atoms in the acyl chain, followed by a colon, followed by the number of double bonds in the chain (e.g., 18:1 refers to the 18-carbon monounsaturated fatty acid, oleic acid; 18:3 refers to any 18-carbon PUFA with three double bonds).

PUFAs are further categorized on the basis of the location of their double bonds. An omega or n notation indicates the number of carbon atoms from the methyl end of the acyl chain to the first double bond. Thus, for example, in the omega-3 (n-3) family of PUFAs, the first double bond is 3 carbons from the methyl end of the molecule. The trivial names, chemical names and abbreviations for the omega-3 fatty acids are detailed in Table 1.1.  Finally, PUFAs can be categorized according to their chain length. The 18-carbon n-3 and n-6 short-chain PUFAs are precursors to the longer 20- and 22-carbon PUFAs, called long-chain PUFAs (LCPUFAs).

Fatty Acid Metabolism

Mammalian cells can introduce double bonds into all positions on the fatty acid chain except the n-3 and n-6 position. Thus, the short-chain alpha- linolenic acid (ALA, chemical abbreviation: 18:3n-3) and linoleic acid (LA, chemical abbreviation: 18:2n-6) are essential fatty acids.

No other fatty acids found in food are considered ‘essential’ for humans, because they can all be synthesized from the short chain fatty acids.

Following ingestion, ALA and LA can be converted in the liver to the long chain, more unsaturated n-3 and n-6 LCPUFAs by a complex set of synthetic pathways that share several enzymes (Figure 1). LC PUFAs retain the original sites of desaturation (including n-3 or n-6). The omega-6 fatty acid LA is converted to gamma-linolenic acid (GLA, 18:3n-6), an omega- 6 fatty acid that is a positional isomer of ALA. GLA, in turn, can be converted to the longerchain omega-6 fatty acid, arachidonic acid (AA, 20:4n-6). AA is the precursor for certain classes of an important family of hormone- like substances called the eicosanoids (see below).

The omega-3 fatty acid ALA (18:3n-3) can be converted to the long-chain omega-3 fatty acid, eicosapentaenoic acid (EPA; 20:5n-3). EPA can be elongated to docosapentaenoic acid (DPA 22:5n-3), which is further desaturated to docosahexaenoic acid (DHA; 22:6n-3). EPA and DHA are also precursors of several classes of eicosanoids and are known to play several other critical roles, some of which are discussed further below.

The conversion from parent fatty acids into the LC PUFAs – EPA, DHA, and AA – appears to occur slowly in humans. In addition, the regulation of conversion is not well understood, although it is known that ALA and LA compete for entry into the metabolic pathways.

Physiological Functions of EPA and AA

As stated earlier, fatty acids play a variety of physiological roles. The specific biological functions of a fatty acid are determined by the number and position of double bonds and the length of the acyl chain.

Both EPA (20:5n-3) and AA (20:4n-6) are precursors for the formation of a family of hormone- like agents called eicosanoids. Eicosanoids are rudimentary hormones or regulating – molecules that appear to occur in most forms of life. However, unlike endocrine hormones, which travel in the blood stream to exert their effects at distant sites, the eicosanoids are autocrine or paracrine factors, which exert their effects locally – in the cells that synthesize them or adjacent cells. Processes affected include the movement of calcium and other substances into and out of cells, relaxation and contraction of muscles, inhibition and promotion of clotting, regulation of secretions including digestive juices and hormones, and control of fertility, cell division, and growth.3

The eicosanoid family includes subgroups of substances known as prostaglandins, leukotrienes, and thromboxanes, among others. As shown in Figure 1.1, the long-chain omega-6 fatty acid, AA (20:4n-6), is the precursor of a group of eicosanoids that include series-2 prostaglandins and series-4 leukotrienes. The omega-3 fatty acid, EPA (20:5n-3), is the precursor to a group of eicosanoids that includes series-3 prostaglandins and series-5 leukotrienes. The AA-derived series-2 prostaglandins and series-4 leukotrienes are often synthesized in response to some emergency such as injury or stress, whereas the EPA-derived series-3 prostaglandins and series-5 leukotrienes appear to modulate the effects of the series-2 prostaglandins and series-4 leukotrienes (usually on the same target cells). More specifically, the series-3 prostaglandins are formed at a slower rate and work to attenuate the effects of excessive levels of series-2 prostaglandins. Thus, adequate production of the series-3 prostaglandins seems to protect against heart attack and stroke as well as certain inflammatory diseases like arthritis, lupus, and asthma.3.

EPA (22:6 n-3) also affects lipoprotein metabolism and decreases the production of substances – including cytokines, interleukin 1ß (IL-1ß), and tumor necrosis factor a (TNF-a) – that have pro-inflammatory effects (such as stimulation of collagenase synthesis and the expression of adhesion molecules necessary for leukocyte extravasation [movement from the circulatory system into tissues]).2 The mechanism responsible for the suppression of cytokine production by omega-3 LC PUFAs remains unknown, although suppression of omega-6-derived eicosanoid production by omega-3 fatty acids may be involved, because the omega-3 and omega-6 fatty acids compete for a common enzyme in the eicosanoid synthetic pathway, delta-6 desaturase.

DPA (22:5n-3) (the elongation product of EPA) and its metabolite DHA (22:6n-3) are frequently referred to as very long chain n-3 fatty acids (VLCFA). Along with AA, DHA is the major PUFA found in the brain and is thought to be important for brain development and function. Recent research has focused on this role and the effect of supplementing infant formula with DHA (since DHA is naturally present in breast milk but not in formula).

Dietary Sources and Requirements

Both ALA and LA are present in a variety of foods. LA is present in high concentrations in many commonly used oils, including safflower, sunflower, soy, and corn oil. ALA is present in some commonly used oils, including canola and soybean oil, and in some leafy green vegetables. Thus, the major dietary sources of ALA and LA are PUFA-rich vegetable oils. The proportion of LA to ALA as well as the proportion of those PUFAs to others varies considerably by the type of oil. With the exception of flaxseed, canola, and soybean oil, the ratio of LA to ALA in vegetable oils is at least 10 to 1. The ratios of LA to ALA for flaxseed, canola, and soy are approximately 1: 3.5, 2:1, and 8:1, respectively; however, flaxseed oil is not typically consumed in the North American diet. It is estimated that on average in the U.S., LA accounts for 89% of the total PUFAs consumed, and ALA accounts for 9%. Another estimate suggests that Americans consume 10 times more omega-6 than omega-3 fatty acids.4 Table 1.2 shows the proportion of omega 3 fatty acids for a number of foods.

Syntheis and Degradation

Source of Acetyl CoA for Fatty Acid Synthesis

Source of Acetyl CoA for Fatty Acid Synthesis

step 1

step 1

condensation reaction with malonyl ACP

ACP (acyl carrier protein)

ACP (acyl carrier protein)

synthesis requires acetyl CoA from citrate shuttle

synthesis requires acetyl CoA from citrate shuttle

conversion to fatty acyl co A in cytoplasm

conversion to fatty acyl co A in cytoplasm

ACP (acyl carrier protein)

ACP (acyl carrier protein)

FA synthesis not exactly reverse of catabolism

FA synthesis not exactly reverse of catabolism


Fatty Acid Synthase

Fatty Acid Synthase

complete FA synthesis

complete FA synthesis

Desaturation

Desaturation

Elongation and Desaturation of Fatty Acids

Elongation and Desaturation of Fatty Acids

release of FAs from adiposites

release of FAs from adiposites

Fatty acid beta oxidation and Krebs cycle produce NAD, NADH, FADH2

Fatty acid beta oxidation and Krebs cycle produce NAD, NADH, FADH2

ketone bodies

ketone bodies

metabolism of ketone bodies

metabolism of ketone bodies

Arachidonoyl-mimicking

Arachidonoyl-mimicking

Arachidonate pathways

Arachidonate pathways

arachidonic acid derivatives

arachidonic acid derivatives

major metabolic intermediates in the pathways for synthesis of cholesterol, fatty acids, and triglycerides

major metabolic intermediates in the pathways for synthesis of cholesterol, fatty acids, and triglycerides

Model for the sterol-mediated proteolytic release of SREBPs from membrane

Model for the sterol-mediated proteolytic release of SREBPs from membrane

hormone regulation

hormone regulation

 insulin receptor and and insulin receptor signaling pathway (IRS)

insulin receptor and and insulin receptor signaling pathway (IRS)

 islet brain glucose signaling

islet brain glucose signaling


Fish source

Fish source

omega FAs

omega FAs


Excessive omega 6s

Excessive omega 6s

omega 6s

omega 6s

diet and cancer

diet and cancer

Patients at risk of FA deficiency

Patients at risk of FA deficiency

PPAR role

PPAR role

PPAR role

PPAR role

Omega 6_3 pathways

Omega 6_3 pathways

n3 vs n6 PUFAs

n3 vs n6 PUFAs

triene-teraene ratio

triene-teraene ratio

arachidonic acid, leukotrienes, PG and thromboxanes

arachidonic acid, leukotrienes, PG and thromboxanes

Cox 2 and cancer

Cox 2 and cancer

Lipidomics of atherosclerotic plaques

Lipidomics of atherosclerotic plaques


Effect of TPN on EFAD

Effect of TPN on EFAD

benefits of omega 3s

benefits of omega 3s

food consumption

food consumption


Read Full Post »

Approach to Controlling Pathogenic Inflammation in Arthritis

Curator: Larry H Bernstein, MD, FCAP

A network approach to controlling pathogenic inflammation: Sequence sharing pattern peptides downregulate experimental arthritis

a new approach to network regulation of inflammation based on

Chai Ezerzer, Raanan Margalit and Irun R. Cohen

Aberrant inflammation probably results from aberrant regulation of the molecules that mediate inflammation; the actual molecules mediating inflammation –

  • chemokines,
  • cytokines, and
  • growth factors and their receptors –
    • would appear to be normal in their chemical structure.

If faulty regulation is indeed the problem,

  • a reasonable approach to alleviating inflammatory diseases might be to influence the interactions
  • within the network of connectivity of the disease-associated proteins (DAPs).
Aberrant inflammation appears to be a pathogenic factor in autoimmune diseases and other noxious inflammatory
conditions in which the inflammatory process
  1. is misapplied,
  2. exaggerated,
  3. recurrent or chronic.
The protein molecules involved in pathogenic inflammation—
disease-associated proteins (DAP )
  1. chemokines,
  2. cytokines, and
  3. growth factors and their receptors,
  • appear normal; their networks of interaction are at fault.

These researchers asked the question – 

  • whether shared amino acid sequence motifs among DAPs
  • might identify novel peptide treatments for regulating inflammation.

We aligned the sequences of 37 DAPs previously discovered to be associated with arthritis

  • to uncover shared sequence motifs.

We focused on chemokine receptor molecules because

  • chemokines and chemokine receptors play important roles in directing the migration of inflammatory cells into sites of tissue inflammation.
  •  different chemokine receptors shared amino acid sequence motifs in their extra-cellular loop domains (ECL2);
  • the ECL2 loop is outside of the known ligand binding site.

These shared sequence motifs established what we term a sequence-sharing network (SSN). SSN motifs exhibited very low E-values,

  • indicating their preservation during evolution.
This study demonstrates a new
  • approach to network regulation of inflammation based on peptide sequence motifs
  • shared by the second extra-cellular loop (EC L2) of different chemokine receptors;
  • previously known chemokine receptor binding sites have not involved the EC L2 loop.
These motifs of 9 amino acids, which were detected by sequence alignment, manifest very low E-values
  • compared with slightly modified sequence variations,
  • indicating that they were not likely to have evolved by chance.
To test whether this shared sequence network (SSN) might serve a regulatory function,
  • theysynthesized 9-amino acid SSN peptides from the EC L2 loops of three different chemokine receptors.
Theye administered these peptides to rats during the
Two of the peptides significantly downregulated the arthritis; one of the peptides
  • synergized with non-specific anti-inflammatory treatment with dexamethasone.
These findings suggest that
  • the SSN peptide motif reported here is likely to have adaptive value in controlling inflammation.
  • detection of SSN motif peptides could provide a network-based approach to immune modulation.
administering a highly connected chemokine receptor peptide motif , as done here, induced
  • the downregulation of inflammation in a rat model of arthritis.
Thus, study of the SSN provides a new network approach toward modulating inflammation

English: Typical chemokine receptor structure ...

English: Typical chemokine receptor structure showing seven transmembrane domains and a chanracteristic “DRY” motif in the second intracelluar domain. (Photo credit: Wikipedia)

Structure of Chemokines

Structure of Chemokines (Photo credit: Wikipedia)

Chemokine receptor

Chemokine receptor (Photo credit: Wikipedia)


Read Full Post »

A Second Look at the Transthyretin Nutrition Inflammatory Conundrum

Subtitle: Transthyretin and the Systemic Inflammatory Response


Author and Curator: Larry H. Bernstein, MD, FACP, Clinical Pathologist, Biochemist, and Transfusion Physician


Brief introduction

Transthyretin  (also known as prealbumin) has been widely used as a biomarker for identifying protein-energy malnutrition (PEM) and for monitoring the improvement of nutritional status after implementing a nutritional intervention by enteral feeding or by parenteral infusion. This has occurred because transthyretin (TTR) has a rapid removal from the circulation in 48 hours and it is readily measured by immunometric assay. Nevertheless, concerns have been raised about the use of TTR in the ICU setting, which prompted a review of the  benefit of using this test in acute and chronic care. TTR is easily followed in the underweight and the high risk populations in an ambulatory setting, which has a significant background risk of chronic diseases. It is sensitive to the systemic inflammatory response syndrome (SIRS), and needs to be understood in the context of acute illness to be used effectively. There are a number of physiologic changes associated with SIRS and the injury/repair process that affect TTR. The most important point is that in the context of an ICU setting, the contribution of TTR is significant in a complex milieu.  A much better understanding of the significance of this program has emerged from studies of nitrogen and sulfur in health and disease.

Transthyretin protein structure

Transthyretin protein structure (Photo credit: Wikipedia)

Age-standardised disability-adjusted life year...

Age-standardised disability-adjusted life year (DALY) rates from Protein-energy malnutrition by country (per 100,000 inhabitants). (Photo credit: Wikipedia)

_________________________________________________________________________________________________________

The systemic inflammatory response syndrome C-reactive protein and transthyretin conundrum.
Larry H Bernstein
Clin Chem Lab Med 2007; 45(11):0
ICID: 939932
Article type: Editorial

The Transthyretin Inflammatory State Conundrum
Larry H. Bernstein
Current Nutrition & Food Science, 2012, 8, 00-00

Keywords: Tranthyretin (TTR), systemic inflammatory response syndrome (SIRS), protein-energy malnutrition (PEM), C- reactive protein, cytokines, hypermetabolism, catabolism, repair.

Transthyretin has been widely used as a biomarker for identifying protein-energy malnutrition (PEM) and for monitoring the improvement of nutritional status after implementing a nutritional intervention by enteral feeding or by parenteral infusion. This has occurred because transthyretin (TTR) has a rapid removal from the circulation in 48 hours and it is readily measured by immunometric assay. Nevertheless, concerns have been raised about the use of TTR in the ICU setting, which prompts a review of the actual benefit of using this test in a number of settings. TTR is easily followed in the underweight and the high risk populations in an ambulatory setting, which has a significant background risk of chronic diseases. It is sensitive to the systemic inflammatory response syndrome (SIRS), and needs to be understood in the context of acute illness to be used effectively.

There are a number of physiologic changes associated with SIRS and the injury/repair process that affect TTR and  in the context of an ICU setting, the contribution of TTR is essential.  The only consideration is the timing of initiation since the metabolic burden is sufficiently high that a substantial elevation is expected in the first 3 days post admission, although the level of this biomarker is related to the severity of injury. Despite the complexity of the situation, TTR is not to be considered a test “for all seasons”. In the context of age, prolonged poor meal intake, chronic or acute illness, TTR needs to be viewed in a multivariable lens, along with estimated lean body mass, C-reactive protein, the absolute lymphocyte count, presence of neutrophilia, and perhaps procalcitonin if there is remaining uncertainty. Furthermore, the reduction of risk of associated complication requires a systematized approach to timely identification, communication, and implementation of a suitable treatment plan.

The most important point is that in the context of an ICU setting, the contribution of TTR is significant in a complex milieu.

_________________________________________________________________________________________________________

Title: The Automated Malnutrition Assessment
Accepted 29 April 2012. http://www.nutritionjrnl.com. Nutrition (2012), doi:10.1016/j.nut.2012.04.017.
Authors: Gil David, PhD; Larry Howard Bernstein, MD; Ronald R Coifman, PhD
Article Type: Original Article

Keywords: Network Algorithm; unsupervised classification; malnutrition screening; protein energy malnutrition (PEM); malnutrition risk; characteristic metric; characteristic profile; data characterization; non-linear differential diagnosis

We have proposed an automated nutritional assessment (ANA) algorithm that provides a method for malnutrition risk prediction with high accuracy and reliability.  The problem of rapidly identifying risk and severity of malnutrition is crucial for minimizing medical and surgical complications. These are not easily performed or adequately expedited. We characterized for each patient a unique profile and mapped similar patients into a classification. We also found that the laboratory parameters were sufficient for the automated risk prediction.

_________________________________________________________________________________________________________

Title: The Increasing Role for the Laboratory in Nutritional Assessment
Article Type: Editorial
Section/Category: Clinical Investigation
Accepted 22 May 2012. http://www.elsevier.com/locate/clinbiochem.
Clin Biochem (2012), doi:10.1016/j.clinbiochem.2012.05.024
Keywords: Protein Energy Malnutrition; Nutritional Screening; Laboratory Testing
Author: Dr. Larry Howard Bernstein, MD

The laboratory role in nutritional management of the patient has seen remarkable growth while there have been dramatic changes in technology over the last 25 years, and it is bound to be transformative in the near term. This editorial is an overview of the importance of the laboratory as an active participant in nutritional care.

The discipline emerged divergently along separate paths with unrelated knowledge domains in physiological chemistry, pathology, microbiology, immunology and blood cell recognition, and then cross-linked emerging into clinical biochemistry, hematology-oncology, infectious diseases, toxicology and therapeutics, genetics, pharmacogenomics, translational genomics and clinical diagnostics.

In reality, the more we learn about nutrition, the more we uncover of metabolic diversity of individuals, the family, and societies in adapting and living in many unique environments and the basic reactions, controls, and responses to illness. This course links metabolism to genomics and individual diversity through metabolomics, which will be enlightened by chemical and bioenergetic insights into biology and translated into laboratory profiling.

Vitamin deficiencies were discovered as clinical entities with observed features as a result of industrialization (rickets and vitamin D deficiency) and mercantile trade (scurvy and vitamin C)[2].  Advances in chemistry led to the isolation of each deficient “substance”.  In some cases, a deficiency of a vitamin and what is later known as an “endocrine hormone” later have confusing distinctions (vitamin D, and islet cell insulin).

The accurate measurement and roles of trace elements, enzymes, and pharmacologic agents was to follow within the next two decades with introduction of atomic absorption, kinetic spectrophotometers, column chromatography and gel electrophoresis.  We had fully automated laboratories by the late 1960s, and over the next ten years basic organ panels became routine.   This was a game changer.

Today child malnutrition prevalence is 7 percent of children under the age of 5 in China, 28 percent in sub-Saharan African, and 43 percent in India, while under-nutrition is found mostly in rural areas with 10 percent of villages and districts accounting for 27-28 percent of all Indian underweight children. This may not be surprising, but it is associated with stunting and wasting, and it has not receded with India’s economic growth. It might go unnoticed viewed alongside a growing concurrent problem of worldwide obesity.

The post WWII images of holocaust survivors awakened sensitivity to nutritional deprivation.

In the medical literature, Studley [HO Studley.  Percentage of weight loss. Basic Indicator of surgical risk in patients with chronic peptic ulcer.  JAMA 1936; 106(6):458-460.  doi:10.1001/jama.1936.02770060032009] reported the association between weight loss and poor surgical outcomes in 1936.  Ingenbleek et al [Y Ingenbleek, M De Vissher, PH De Nayer. Measurement of prealbumin as index of protein-calorie malnutrition. Lancet 1972; 300[7768]: 106-109] first reported that prealbumin (transthyretin, TTR) is a biomarker for malnutrition after finding very low TTR levels in African children with Kwashiorkor in 1972, which went unnoticed for years.  This coincided with the demonstration by Stanley Dudrick  [JA Sanchez, JM Daly. Stanley Dudrick, MD. A Paradigm ShiftArch Surg. 2010; 145(6):512-514] that beagle puppies fed totally through a catheter inserted into the superior vena cava grew, which method was then extended to feeding children with short gut.  Soon after Bistrian and Blackburn [BR Bistrian, GL Blackburn, E Hallowell, et al. Protein status of general surgical patients. JAMA 1974; 230:858; BR Bistrian, GL Blackburn, J Vitale, et al. Prevalence of malnutrition in general medicine patients, JAMA, 1976, 235:1567] showed that malnourished hospitalized medical and surgical patients have increased length of stay, increased morbidity, such as wound dehiscence and wound infection, and increased postoperative mortality, later supported by many studies.

Michael Meguid,MD, PhD, founding editor of Nutrition [Elsevier] held a nutrition conference “Skeleton in the Closet – 20 years later” in Los Angeles in 1995, at which a Beckman Prealbumin Roundtable was held, with Thomas Baumgartner and Michael M Meguid as key participants.  A key finding was that to realize the expected benefits of a nutritional screening and monitoring program requires laboratory support. A Ross Roundtable, chaired by Dr. Lawrence Kaplan, resulted in the first Standard of Laboratory Practice Document of the National Academy of Clinical Biochemists on the use of the clinical laboratory in nutritional support and monitoring. Mears then showed a real benefit to a laboratory interactive program in nutrition screening based on TTR [E Mears. Outcomes of continuous process improvement of a nutritional care program incorporating serum prealbumin measurements. Nutrition 1996; 12 (7/8): 479-484].

A later Ross Roundtable on Quality in Nutritional Care included a study of nutrition screening and time to dietitian intervention organized by Brugler and Di Prinzio that showed a decreased length of hospital stay with $1 million savings in the first year (which repeated), which included reduced cost for dietitian evaluations and lower complication rates.

Presentations were made at the 1st International Transthyretin Congress in Strasbourg, France by Mears [E Mears.  The role of visceral protein markers in protein calorie malnutrition. Clin Chem Lab Med 2002; 40:1360-1369] on the impact of TTR in screening for PEM in a public hospital in Louisiana, and by Potter [MA Potter, G Luxton. Prealbumin measurement as a screening tool for patients with protein calorie malnutrition in emergency hospital admissions: a pilot study.  Clin Invest Med. 1999; 22(2):44-52] that indicated a 17% in-hospital mortality rate in a Canadian hospital for patients with PCM compared with 4% without PCM (p < 0.02), while only 42% of patients with PCM received nutritional supplementation. Cost analysis of screening with prealbumin level projected a saving of $414 per patient screened.  Ingenbleek and Young [Y Ingenbleek, VR Young.  Significance of transthyretin in protein metabolism.  Clin Chem Lab Med. 2002; 40(12):1281–1291.  ISSN (Print) 1434-6621, DOI: 10.1515/ CCLM.2002.222, December 2002. published online: 01/06/2005] tied the TTR to basic effects reflected in protein metabolism.

_______________________________________________________________________________________________

Transthyretin as a marker to predict outcome in critically ill patients.
Arun Devakonda, Liziamma George, Suhail Raoof, Adebayo Esan, Anthony Saleh, Larry H Bernstein
Clin Biochem 2008; 41(14-15):1126-1130
ICID: 939927
Article type: Original article

TTR levels correlate with patient outcomes and are an accurate predictor of patient recovery in non-critically ill patients, but it is uncertain whether or not TTR level correlates with level of nutrition support and outcome in critically ill patients. This issue has been addressed only in critically ill patients on total parenteral nutrition and there was no association reported with standard outcome measures. We revisit this in all patients admitted to a medical intensive care unit.

Serum TTR was measured on the day of admission, day 3 and day 7 of their ICU stay. APACHE II and SOFA score was assessed on the day of admission. A registered dietician for their entire ICU stay assessed the nutritional status and nutritional requirement. Patients were divided into three groups based on initial TTR level and the outcome analysis was performed for APACHE II score, SOFA score, ICU length of stay, hospital length of stay, and mortality.

TTR showed excellent concordance with the univariate or multivariate classification of patients with PEM or at high malnutrition risk, and followed for seven days in the ICU, it is a measure of the metabolic burden.  TTR levels decline from day 1 to day 7 in spite of providing nutritional support. Twenty-five patients had an initial TTR serum concentration more than 17 mg/dL (group 1), forty-eight patients had mild malnutrition with a concentration between 10 and 17 mg/dL (group 2), Forty-five patients had severe malnutrition with a concentration less than 10 mg/dL (group 3).  Initial TTR level had inverse correlation with ICU length of stay, hospital length of stay, and APACHE II score, SOFA score; and predicted mortality, especially in group 3.

___________________________________________________________________________________________________________

A simplified nutrition screen for hospitalized patients using readily available laboratory and patient
information.
Linda Brugler, Ana K Stankovic, Madeleine Schlefer, Larry Bernstein
Nutrition 2005; 21(6):650-658
ICID: 825623
Article type: Review article
The role of visceral protein markers in protein calorie malnutrition.
Linda Brugler, Ana Stankovic, Larry Bernstein, Frederick Scott, Julie O’Sullivan-Maillet
Clin Chem Lab Med 2002; 40(12):1360-1369
ICID: 636207
Article type: Original article

The Automated Nutrition Score is a data-driven extension of continuous quality improvement.

Larry H Bernstein
Nutrition 2009; 25(3):316-317
ICID: 939934

______________________________________________________________________________________________________
Transthyretin: its response to malnutrition and stress injury. clinical usefulness and economic implications.
LH Bernstein, Y Ingenbleek
Clin Chem Lab Med 2002; 40(12):1344-1348
ICID: 636205
Article type: Original article

_______________________________________________________________________________________________________

THE NUTRITIONALLY-DEPENDENT ADAPTIVE DICHOTOMY (NDAD) AND STRESS HYPERMETABOLISM
Yves Ingenbleek  MD  PhD  and  Larry Bernstein MD
J CLIN LIGAND ASSAY  (out of print)

The acute reaction to stress is characterized by major metabolic, endocrine and immune alterations. According to classical descriptions, these changes clinically present as a succession of 3 adaptive steps – ebb phase, catabolic flow phase, and anabolic flow phase. The ebb phase, shock and resuscitation, is immediate, lasts several hours, and is characterized by hypokinesis, hypothermia, hemodynamic instability and reduced basal metabolic rate. The catabolic flow phase, beginning within 24 hours and lasting several days, is characterized by catabolism with the flow of gluconeogenic substrates and ketone bodies in response to the acute injury. The magnitude of the response depends on the acuity and the severity of the stress. The last, a reparative anabolic flow phase, lasts weeks and is characterized by the accretion of amino acids (AAs) to rebuilding lean body mass.

The current opinion is that the body economy is reset during the course of stress at novel thresholds of metabolic priorities. This is exemplified mainly by proteolysis of muscle, by an effect on proliferating gut mucosa and lymphoid tissue as substrates are channeled to support wound healing, by altered syntheses of liver proteins with preferential production of acute phase proteins (APPs) and local repair in inflamed tissues (3). The first two stages demonstrate body protein breakdown exceeding the rate of protein synthesis, resulting in a negative nitrogen (N) balance, muscle wasting and weight loss. In contrast, the last stage displays reversed patterns, implying progressive recovery of endogenous N pools and body weight.

These adaptive alterations undergo continuing elucidation. The identification of cytokines, secreted by activated macrophages/monocytes or other reacting cells, has provided further insights into the molecular mechanisms controlling energy expenditure, redistribution of protein pools, reprioritization of syntheses and secretory processes.

The free fraction of hormones bound to specific binding-protein(s) [BP(s)] manifests biological activities, and any change in the BP blood level modifies the effect of the hormone on the end target organ.  The efficacy of these adaptive responses may be severely impaired in protein-energy malnourished (PEM) patients. This is especially critical with respect to changes of the circulating levels of transthyretin (TTR), retinol-binding protein (RBP) and corticosteroid-binding globulin (CBG) conveying thyroid hormones (TH), retinol and cortisol, respectively.  This reaction is characterized by cytokine mediated autocrine, paracrine and endocrine changes. Among the many inducing molecules identified, interleukins 1 and 6 (Il-1, Il-6) and tumor necrosis factor a (TNF) are associated with enhanced production of 3 counterregulatory hormonal families (cortisol, catecholamines and glucagon). Growth hormone (GH) and TH also have roles in these metabolic adjustments.

There is overproduction of cortisol mediated by several cytokines acting on both the adrenal cortex (10) and on the pituitary through hypothalamic CRH with loss of feedback regulation of ACTH production (11). Hypercortisolemia is a major finding observed after surgery (12), sepsis (13), and medical insults, usually correlated with severity of insult and of complications. Rising cortisol values parallel hyperglycemic trends, as an effect of both gluconeogenesis and insulin resistance. Working in concert with TNF, glucocorticoids govern the breakdown of muscle mass, which is regarded as the main factor responsible for the negative N balance.

Under normal conditions, GH exerts both lipolytic and anabolic influences in the whole body economy under the dual control of the hypothalamic hormones somatocrinin (GHRH) and somatostatin (SRIH). GH secretion is usually depressed by rising blood concentrations of glucose and free fatty acids (FFAs) but is paradoxicaly elevated despite hyperglycemia in stressed patients.

The oversecretion of counterregulatory hormones working in concert generates subtle equilibria between glycogenolytic/glycolytic/gluconeogenic adaptive processes. The net result is the neutralization of the main hypoglycemic and anabolic activities of insulin and the development of a persisting and controlled hyperglycemic tone in the stressed body. The molecular mechanisms whereby insulin resistance occurs in the course of stress refer to
cytokine-  and  hormone-induced  phosphorylation abnormalities affecting receptor signaling. The insulin-like anabolic processes of GH are mediated by IGF1 working as relay agent. The expected high IGF1 surge associated with GH oversecretion is not observed in severe stress as plasma values are usually found at the lower limit of normal or even in the subnormal range.  The end result of this dissociation between high GH and low IGF1 levels is to favor the proteolysis of muscle mass to release AAs for gluconeogenesis and the breakdown of adipose tissue to provide ketogenic substrates.

The acute stage of stress is associated with the onset of a low T3 syndrome typically delineated by the drop of both total (TT3) and free (FT3) triiodothyronine plasma levels in the subnormal range. In contrast, both total (TT4) and free (FT4) thyroxine values usually remain within normal ranges with declining trends observed for TT4 and rising tendencies for FT4 (44). This last free compound is regarded as the sensor reflecting the actual thyroid status and governing the release of TSH whereas FT3 works as the active hormonal mediator at nuclear receptor level. The maintenance of an euthyroid sick syndrome is compatible with the down-regulation of most metabolic and energetic processes in healthy tissues. These inhibitory effects , negatively affecting all functional steps of the hypothalamo-pituitary-thyroid axis concern TSH production, iodide uptake, transport and organification into iodotyrosyl residues, peroxidase coupling activity as well as thyroglobulin synthesis and TH leakage. Taken together, the above-mentioned data indicate that the development of hyperglycemia and of insulin-resistance in healthy tissues – mainly in the muscle mass – are hallmarks resulting from the coordinated activities of the counterregulatory hormones.

A growing body of recent data suggest that the stressed territory, whatever the causal agent – bacterial or viral sepsis, auto-immune disorder, traumatic or toxic shock, burns, cancer – manifest differentiated metabolic and immune reactions. The amplitude, duration and efficacy of these responses are reportedly impaired along several ways in PEM patients. These last detrimental effects are accompanied by a number of medical, social and economical consequences, such as extended length of hospital stay and increased complication / mortality rates. It is therefore mandatory to correctly identify and follow up the nutritional status of hospitalized patients. Such approaches are prerequisite to timely and scientifically grounded nutritional and pharmacological mediated interventions.

Contrary to the rest of the body, energy requirements of the inflamed territory are primarily fulfilled by anaerobic glycolysis, an effect triggered by the inhibition of key-enzymes of carbohydrate metabolism, notably pyruvate-dehydrogenase. This non-oxidative combustion of glucose reveals low conversion efficiency but offers the major advantage to maintain, in the context of hyperglycemia, fuel provision to poorly irrigated and/or edematous tissues. The depression of the 5’-monodeiodinating activity (5’-DA) plays a pivotal role in these adaptive changes, yielding inactive reverse T3 (rT3) as index of impaired T4 to T3 conversion rates, but at the same time there is an augmented supply of bioactive T3 molecules and local overstimulation of thyro-dependent processes characterized by thyroid down-regulation.  The same differentiated evolutionary pattern applies to IGF1. In spite of lowered plasma total concentrations, the proportion of IGF1 released in free form may be substantially increased owing to the proteolytic degradation of IGFBP-3 in the intravascular compartment. The digestion of  BP-3 results from the surge of several proteases occurring the course of stress, yielding biologically active IGF1 molecules available for the repair of damaged tissues. In contrast, healthy receptors oppose a strong resistance to IGF1 ligands freed in the general circulation, likely induced by an acquired phosphorylation defect very similar in nature to that for the insulin transduction pathway.

PEM is the generic denomination of a broad spectrum of nutritional disorders, commonly found in hospital settings, and whose extreme poles are identified as marasmus and kwashiorkor. The former condition is usually regarded as the result of long-lasting starvation leading to the loss of lean body mass and fat reserves but relatively well-preserved liver function and immune capacities. The latter condition is typically the consequence of (sub)acute deprivation predominantly affecting the protein content of staplefood, an imbalance causing hepatic steatosis, fall of visceral proteins, edema and increased vulnerability to most stressful factors. PEM may be hypometabolic or hypermetabolic, usually coexists with other diseased states and is frequently associated with complications. Identification of PEM calls upon a large set of clinical and analytical disciplines comprising anthropometry, immunology, hematology and biochemistry.

CBG, TTR and RBP share in common the transport of specific ligands exerting their metabolic effects at nuclear receptor level. Released from their specific BPs in free form, cortisol, FT4 and retinol immediately participe to the strenghtening of the positive and negative responses to stressful stimuli. CBG is a relatively weak responder to short-term nutritional influences (73)  although long-lasting PEM is reportedly capable of causing its significant diminution (74). The dramatic drop of CBG in the course of stress appears as the combined effect of Il-6-induced posttranscriptional blockade of its liver synthesis (75) and peripheral overconsumption by activated neutrophils (61). The divergent alterations outlined by CBG and total cortisolemia result in an increased disposal of free ligand reaching proportions considerably higher than the 4 % recorded under physiological conditions.

The appellation of negative APPs that was once given to the visceral group of carrier-proteins. The NDAD concept takes the opposite view, defending the opinion that their suppressed synthesis releases free ligands which positively contribute to strengthen all aspects of the stress reaction, justifying the ABR denomination. This implies that the role played by ABRs should no longer be interpreted in terms of concentrations but in terms of functionality.

++++++++++++++++++++++++++++++++++++++++++++++++++++++++++++++++++++++++++++++++++++++++++++

THE OXIDATIVE STRESS OF HYPERHOMOCYSTEINEMIA RESULTS FROM REDUCED BIOAVAILABILITY OF SULFUR-CONTAINING REDUCTANTS.
Yves Ingenbleek. The Open Clinical Chemistry Journal, 2011, 4, 34-44.

Vegetarian subjects consuming subnormal amounts of methionine (Met) are characterized by subclinical protein malnutrition causing reduction in size of their lean body mass (LBM) best identified by the serial measurement of plasma transthyretin (TTR). As a result, the transsulfuration pathway is depressed at cystathionine-β-synthase (CβS) level triggering the upstream sequestration of homocysteine (Hcy) in biological fluids and promoting its conversion to Met. Maintenance of beneficial Met homeostasis is counterpoised by the drop of cysteine (Cys) and glutathione (GSH) values downstream to CβS causing in turn declining generation of hydrogen sulfide (H2S) from enzymatic sources. The biogenesis of H2S via non-enzymatic reduction is further inhibited in areas where earth’s crust is depleted in elemental sulfur (S8) and sulfate oxyanions. Combination of subclinical malnutrition and S8-deficiency thus maximizes the defective production of Cys, GSH and H2S reductants, explaining persistence of unabated oxidative burden. The clinical entity increases the risk of developing cardiovascular diseases (CVD) and stroke in underprivileged plant-eating populations regardless of Framingham criteria and vitamin-B status. Although unrecognized up to now, the nutritional disorder is one of the commonest worldwide, reaching top prevalence in populated regions of Southeastern Asia. Increased risk of hyperhomocysteinemia and oxidative stress may also affect individuals suffering from intestinal malabsorption or westernized communities having adopted vegan dietary lifestyles.

Metabolic pathways: Met molecules supplied by dietary proteins are submitted to TM processes allowing to release Hcy which may in turn either undergo Hcy – Met RM pathways or be irreversibly committed into TS decay. Impairment of CbS activity, as described in protein malnutrition, entails supranormal accumulation of Hcy in body fluids, stimulation of activity and maintenance of Met homeostasis. This last beneficial effect is counteracted by decreased concentration of most components generated downstream to CbS, explaining the depressed CbS- and CbL-mediated enzymatic production of H2S along the TS cascade. The restricted dietary intake of elemental S further operates as a limiting factor for its non-enzymatic reduction to H2S which contributes to downsizing a common body pool. Combined protein- and S-deficiencies work in concert to deplete Cys, GSH and H2S from their body reserves, hence impeding these reducing molecules to properly face the oxidative stress imposed by hyperhomocysteinemia.

see also …

McCully, K.S. Vascular pathology of homocysteinemia: implications for the pathogenesis of arteriosclerosis. Am. J. Pathol., 1996, 56, 111-128.

Cheng, Z.; Yang, X.; Wang, H. Hyperhomocysteinemia and endothelial dysfunction. Curr. Hypertens. Rev., 2009, 5,158-165.

Loscalzo, J. The oxidant stress of hyperhomocyst(e)inemia. J. Clin.Invest., 1996, 98, 5-7.

Ingenbleek, Y.; Hardillier, E.; Jung, L. Subclinical protein malnutrition is a determinant of hyperhomocysteinemia. Nutrition, 2002, 18, 40-46.

Ingenbleek, Y.; Young, V.R. The essentiality of sulfur is closely related to nitrogen metabolism: a clue to hyperhomocysteinemia. Nutr. Res. Rev., 2004, 17, 135-153.

Hosoki, R.; Matsuki, N.; Kimura, H. The possible role of hydrogen sulfide as an endogenous smooth muscle relaxant in synergy with nitric oxide. Biochem. Biophys. Res. Commun., 1997, 237, 527-531.

Tang, B.; Mustafa, A.; Gupta, S.; Melnyk, S.; James S.J.; Kruger, W.D. Methionine-deficient diet induces post-transcriptional downregulation of cystathionine-􀀁-synthase. Nutrition, 2010, 26, 1170-1175.

Elshorbagy, A.K.; Valdivia-Garcia, M.; Refsum, H.; Smith, A.D.; Mattocks, D.A.; Perrone, C.E. Sulfur amino acids in methioninerestricted rats: Hyperhomocysteinemia. Nutrition, 2010, 26, 1201- 1204.

_______________________________________________________________________________________________________

Yves Ingenbleek. Plasma Transthyretin Reflects the Fluctuations of Lean Body Mass in Health and Disease. Chapter 20. In S.J. Richardson and V. Cody (eds.), Recent Advances in Transthyretin Evolution, Structure and Biological Functions, DOI: 10.1007/978‐3‐642‐00646‐3_20, # Springer‐Verlag Berlin Heidelberg 2009.

Transthyretin (TTR) is a 55-kDa protein secreted mainly by the choroid plexus and the liver. Whereas its intracerebral production appears as a stable secretory process allowing even distribution of intrathecal thyroid hormones, its hepatic synthesis is influenced by nutritional and inflammatory circumstances working concomitantly. Both morbid conditions are governed by distinct pathogenic mechanisms leading to the reduction in size of lean body mass (LBM). The liver production of TTR integrates the dietary and stressful components of any disease spectrum, explaining why it is the sole plasma protein whose evolutionary patterns closely follow the shape outlined by LBM fluctuations. Serial measurement of TTR therefore provides unequalled information on the alterations affecting overall protein nutritional status. Recent advances in TTR physiopathology emphasize the detecting power and preventive role played by the protein in hyperhomocysteinemic states, acquired metabolic disorders currently ascribed to dietary restriction in water-soluble vitamins. Sulfur (S)-deficiency is proposed as an additional causal factor in the sizeable proportion of hyperhomocysteinemic patients characterized by adequate vitamin intake but experiencing varying degrees of nitrogen (N)-depletion. Owing to the fact that N and S coexist in plant and animal tissues within tightly related concentrations, decreasing LBM as an effect of dietary shortage and/or excessive hypercatabolic losses induces proportionate S-losses. Regardless of water-soluble vitamin status, elevation of homocysteine plasma levels is negatively correlated with LBM reduction and declining TTR plasma levels. These findings occur as the result of impaired cystathionine-b-synthase activity, an enzyme initiating the transsulfuration pathway and whose suppression promotes the upstream accumulation and remethylation of homocysteine molecules. Under conditions of N- and S-deficiencies, the maintenance of methionine homeostasis indicates high metabolic priority.

Schematically, the human body may be divided into two major compartments, namely fat mass (FM) and FFM that is obtained by substracting
FM from body weight (BW). The fat cell mass sequesters about 80% of the total body lipids, is poorly hydrated and contains only small quantities of lean tissues and nonfat constituents. FFM comprises the sizeable part of lean tissues and minor mineral compounds among which are Ca, P, Na, and Cl pools totaling about 1.7 kg or 2.5% of BW in a healthy man weighing 70 kg. Subtraction of mineral mass from FFM provides LBM, a composite aggregation of organs and tissues with specific functional properties. LBM is thus nearly but not strictly equivalent to FFM. With extracellular mineral content subtracted, LBM accounts for most of total body proteins (TBP) and of TBN assuming a mean 6.25 ratio between protein and N content.

SM accounts for 45% of TBN whereas the remaining 55% is in nonmuscle lean tissues. The LBM of the reference man contains 98% of total
body potassium (TBK) and the bulk of total body sulfur (TBS). TBK and TBS reach equal intracellular amounts (140 g each) and share distribution patterns (half in SM and half in the rest of cell mass).  The body content of K and S largely exceeds that of magnesium (19 g), iron (4.2 g) and zinc (2.3 g). The average hydration level of LBM in healthy subjects of all age is 73% with the proportion of the intracellular/extracellular fluid spaces being 4:3. SM is of particular relevance in nutritional studies due to its capacity to serve as a major reservoir of amino acids (AAs) and as a dispenser of gluconeogenic substrates. An indirect estimate of SM size consists in the measurement of urinary creatinine, end-product of the nonenzymatic hydrolysis of phosphocreatine which is limited to muscle cells.

During ageing, all the protein components of the human body decrease regularly. This shrinking tendency is especially well documented for SM  whose absolute amount is preserved until the end of the fifth decade, consistent with studies showing unmodified muscle structure, intracellular K content and working capacit. TBN and TBK are highly correlated in healthy subjects and both parameters manifest an age-dependent curvilinear decline
with an accelerated decrease after 65 years.  The trend toward sarcopenia is more marked and rapid in elderly men than in elderly women decreasing strength and functional capacity. The downward SM slope may be somewhat prevented by physical training or accelerated by supranormal cytokine status as reported in apparently healthy aged persons suffering low-grade inflammation. 2002) or in critically ill patients whose muscle mass undergoes proteolysis and contractile dysfunction.

The serial measurement of plasma TTR in healthy children shows that BP values are low in the neonatal period and rise linearly with superimposable concentrations in both sexes during infant growth consistent with superimposable N accretion and protein synthesis rates. Starting from the sixties, TTR values progressively decline showing steeper slopes in elderly males. The lowering trend seems to be initiated by the attenuation of androgen influences and trophic stimuli with increasing age. The normal human TTR trajectory from birth to death has been well documented by scientists belonging to the Foundation for Blood Research. TTR is the first plasma protein to decline in response to marginal protein restricion, thus working as an early signal warning that adaptive mechanisms maintaining homeostasis are undergoing decompensation.

TTR was proposed as a marker of protein nutritional status following a clinical investigation undertaken in 1972 on protein-energy malnourished (PEM) Senegalese children (Ingenbleek et al. 1972). By comparison with ALB and transferrin (TF) plasma values, TTR revealed a much higher degree of sensitivity to changes in protein status that has been attributed to its shorter biological half-life (2 days) and to its unusual Trp richness (Ingenbleek et al. 1972, 1975a). Transcription of the TTR gene in the liver is directed by CCAAT/enhancer binding protein (C/EBP) bound to hepatocyte nuclear factor 1 (HNF1) under the control of several other HNFs. The mechanism responsible for the suppressed TTR synthesis in PEM-states is a restricted AA and energy supply working as limiting factors (Ingenbleek and Young 2002). The rapidly turning over TTR protein is highly responsive to any change in protein flux and energy supply, being clearly situated on the cutting edge of the equipoise.

LBM shrinking may be the consequence of either dietary restriction reducing protein syntheses to levels compatible with survival or that of cytokine-induced tissue proteolysis exceeding protein synthesis and resulting in a net body negative N balance. The size of LBM in turn determines plasma TTR concentrations whose liver production similarly depends on both dietary provision and inflammatory conditions. In animal cancer models, reduced TBN pools were correlated with decreasing plasma TTR values and provided the same predictive ability. In kidney patients, LBM is proposed as an excellent predictor of outcome working in the same direction as TTR plasma levels.  High N intake, supposed to preserve LBM reserves, reduces significantly the mortality rate of kidney patients and is positively correlated with the alterations of TTR plasma concentrations appearing as the sole predictor of final outcome. It is noteworthy that most SELDI or MALDI workers interested in defining protein nutritional status have chosen TTR as a biomarker, showing that there exists a large consensus considering the BP as the most reliable indicator of protein depletion in most morbid circumstances.

Total homocysteine (tHcy) is a S-containing AA not found in customary diets but endogenously produced in the body of mammals by the enzymatic transmethylation of methionine (Met), one of the eight IAAs supplied by staplefoods. tHcy may either serve as precursor substrate for the synthesis of new Met molecules along the remethylation (RM) pathway or undergo irreversible kidney leakage through a cascade of derivatives defining the transsulfuration (TS) pathway. Hcy is thus situated at the crossroad of RM and TS pathways that are regulated by three water-soluble vitamins (pyridoxine, B6; folates, B9; cobalamins, B12).

Significant positive correlations are found between tHcy and plasma urea and plasma creatinine, indicating that both visceral and muscular tissues undergo proteolytic degradation throughout the course of rampant inflammatory burden. In healthy individuals, tHcy plasma concentrations maintain positive correlations with LBM and TTR from birth until the end of adulthood. Starting from the onset of normal old age, tHcy values become disconnected from LBM control and reveal diverging trends with TTR values. Of utmost importance is the finding that, contrary to all protein
components which are downregulated in protein-depleted states, tHcy values are upregulated.  Hyperhomocysteinemia is an acquired clinical entity characterized by mild or moderate elevation in tHcy blood values found in apparently healthy individuals (McCully 1969). This distinct morbid condition appears as a public health problem of increasing importance in the general population, being regarded as an independent and graded risk factor for vascular pathogenesis unrelated to hypercholesterolemia, arterial hypertension, diabetes and smoking.

Studies grounded on stepwise multiple regression analysis have concluded that the two main watersoluble vitamins account for only 28% of tHcy variance whereas vitamins B6, B9, and B12, taken together, did not account for more than 30–40% of variance. Moreover, a number of hyperhomocysteinemic conditions are not responsive to folate and pyridoxine supplementation. This situation prompted us to search for other causal factors which might fill the gap between the public health data and the vitamin triad deficiencies currently incriminated. We suggest that S – the forgotten element – plays central roles in nutritional epidemiology (Ingenbleek and Young 2004).

Aminoacidemia studies performed in PEM children, adult patients and elderly subjects have reported that the concentrations of plasma IAAs invariably display lowering trends as the morbid condition worsens. The depressed tendency is especially pronounced in the case of tryptophan and for the so-called branched-chain AAs (BCAAs, isoleucine, leucine, valine) the decreases in which are regarded as a salient PEM feature following the direction outlined by TTR (Ingenbleek et al. 1986). Met constitutes a notable exception to the above described evolutionary profiles, showing unusual stability in chronically protein depleted states.

Maintenance of normal methioninemia is associated with supranormal tHcy blood values in PEMadults (Ingenbleek et al. 1986) and increased tHcy leakage in the urinary output of PEM children. In contrast, most plasma and urinary S-containing compounds produced along the TS pathway downstream to CbSconverting step (Fig. 20.1) display significantly diminished values. This is notably the case for cystathionine (Ingenbleek et al. 1986), glutathione, taurine, and sulfaturia. Such distorted patterns are reminiscent of abnormalities defining homocystinuria, an inborn disease of Met metabolism characterized by CbS refractoriness to pyridoxine stimuli, thereby promoting the upstream retention of tHcy in biological fluids. It
was hypothesized more than 20 years ago (Ingenbleek et al. 1986) that PEM is apparently able to similarly depress CbS activity, suggesting that the enzyme is a N-status sensitive step working as a bidirectional lockgate, overstimulated by high Met intake (Finkelstein and Martin 1986) and downregulated under N-deprivation conditions (Ingenbleek et al. 2002). Confirmation that N dietary deprivation may inhibit CbS activity has recently provided. The tHcy precursor pool is enlarged in biological fluids, boosting Met remethylation processes along the RM pathway, consistent with studies showing overstimulation of Met-synthase activity in conditions of protein restriction. In other words, high tHcy plasma concentrations observed in PEM states are the dark side of adaptive mechanisms for maintaining Met homeostasis. This is consistent with the unique role played by Met in the preservation of N body stores.

The classical interpretation that strict vegans, who consume plenty of folates in their diet and manifest nevertheless higher tHcy plasma concentrations than omnivorous counterparts, needs to be revisited. On the basis of hematological and biochemical criteria, cobalamin deficiency is one of the most prevalent vitamin-deficiencies wordwide, being often incriminated as deficient in vegan subjects. It seems, however, likely that its true causal impact on rising tHcy values is substantially overestimated in most studies owing to the modest contribution played by cobalamins on tHcy
variance analyses. In contrast, there exists a growing body of converging data indicating that the role played by the protein component is largely underscored in vegan studies. It is worth recalling that S is the main intracellular anion coexisting with N within a constant mean S:N ratio (1:14.5) in animal tissues and dietary products of animal origin (Ingenbleek 2006). The mean S:N ratio found in plant items ranges from 1:20 to 1:35, a proportion that does not optimally meet human tissue requirements (Ingenbleek 2006), paving the way for borderline S and N deficiencies.

A recent Taiwanese investigation on hyperhomocysteinemic nuns consuming traditional vegetarian regimens consisting of mainly rice, soy products,
vegetables and fruits with few or no dairy items illustrates such clinical misinterpretation (Hung et al. 2002). The authors reported that folates and cobalamins, taken together, accounted for only 28.6% of tHcy variance in the vegetarian cohort whereas pyridoxine was inoperative (Hung et al. 2002). The daily vegetable N and Met intakes were situated highly significantly (p < 0.001) below the recommended allowances for humans (FAO/WHO/United Nations University 1985), causing a stage of unrecognized PEM documented by significantly depressed BCAA plasma
concentrations. Met levels escaped the overall decline in IAAs levels, emphasizing that efficient homeostatic mechanisms operate at the expense of an acquired hyperhomocysteinemic state. The diagnosis of subclinical PEM was missed because the authors ignored the exquisitely sensitive TTR detecting power. A proper PEM identification would have allowed the authors to confirm the previously described TTR–tHcy relationship that was established in Western Africa from comparable field studies involving country dwellers living on plant products.

The concept that acute or chronic stressful conditions may exert similar inhibitory effects on CbS activity and thereby promote hyperhomocysteinemic states is founded on previous studies showing that hypercatabolic states are characterized by increased urinary N and S losses maintaining tightly correlated depletion rates (Cuthbertson 1931; Ingenbleek and Young 2004; Sherman and Hawk 1900) which reflect the S:N ratio found in tissues undergoing cytokine induced proteolysis. This has been documented in coronary infarction and in acute pancreatitis where tHcy elevation evolves too rapidly to allow for a nutritional vitamin B-deficit explanation.  tHcy is considered stable in plasma and the two investigations report unaltered folate and cobalamin plasma concentrations.

The clinical usefulness of TTR as a nutritional biomarker, described in the early seventies (Ingenbleek et al. 1972) has been substantially disregarded by the scientific community for nearly four decades. This long-lasting reluctance expressed by many investigators is largely due to the fact that protein malnutrition and stressful disorders of various causes have combined inhibitory effects on hepatic TTR synthesis. Declining TTR plasma concentrations may result from either dietary protein and energy restrictions or from cytokine-induced transcriptional blockade (Murakami et al. 1988) of its hepatic synthesis. The proposed marker was therefore seen as having high sensitivity but poor specificity. Recent advances in protein metabolism settle the controversy by throwing further light on the relationships between TTR and the N-components of body composition.

The developmental patterns of LBM and TTR exhibit striking similarities. Both parameters rise from birth to puberty, manifest gender dimorphism during full sexual maturity then decrease during ageing. Uncomplicated PEM primarily affects both visceral and structural pools of LBM with distinct kinetics, reducing protein synthesis to levels compatible with prolonged survival. In acute or chronic stressful disorders, LBM undergoes muscle proteolysis exceeding the upregulation of protein syntheses in liver and injured areas, yielding a net body negative N balance. These adaptive responses are well identified by the measurement of TTR plasma concentrations which therefore appear as a plasma marker for LBM fluctuations.
Attenuation of stress and/or introduction of nutritional rehabilitation restores both LBM and TTR to normal values following parallel slopes. TTR fulfills, therefore, a unique position in assessing actual protein nutritional status, monitoring the efficacy of dietetic support and predicting the patient’s outcome (Bernstein and Pleban 1996).

see also…

Acosta PB, Yannicelli S, Ryan AS, Arnold G, Marriage BJ, Plewinska M, Bernstein L, Fox J, Lewis V, Miller M, Velazquez A (2005) Nutritional therapy improves growth and protein status of children with a urea cycle enzyme defect. Mol Genet Metab 86:448–455.

Arroyave G, Wilson D, Be´har M, Scrimshaw NS (1961) Serum and urinary creatinine in children with severe protein malnutrition. Am J Clin Nutr 9:176–179.

Bates CJ, Mansoor MA, van der Pols J, Prentice A, Cole TJ, Finch S (1997) Plasma total homocysteine in a representative sample of 972 British men and women aged 65 and over. Eur J Clin Nutr 51:691–697.

Battezzatti A, Bertoli S, San Romerio A, Testolin G (2007) Body composition: An important determinant of homocysteine and methionine concentrations in healthy individuals. Nutr Metab Cardiovasc Dis 17:525–534.

Bernstein LH, Bachman TE, Meguid M, Ament M, Baumgartner T, Kinosian B, Martindale R, Spiekerman M (1995) Prealbumin in nutritional care Consensus Group. Measurement of visceral protein status in assessing protein and energy malnutrition: Standard of care. Nutrition 11:169–171

Bernstein LH, Ingenbleek Y (2002) Transthyretin: Its response to malnutrition and stress injury. Clinical usefulness and economical implications. Clin Chem Lab Med 40:1344–1348.

Boorsook H, Dubnoff JW (1947) The hydrolysis of phosphocreatine and the origin of creatinine. J Biol Chem 168:493–510.

Briend A, Garenne M, Maire B, Fontaine O, Dieng F (1989) Nutritional status, age and survival: The muscle mass hypothesis. Eur J Clin Nutr 43:715–726

Brouillette J, Quirion R (2007) Transthyretin: A key gene involved in the maintenance of memory capacities during aging. Neurobiol Aging 29:1721–1732

Chertow GM, Goldstein-Fuchs DJ, Lazarus JM, Kaysen GA (2005) Prealbumin, mortality, and cause-specific hospitalization in hemodialysis patients. Kidney Int 68:2794–2800

Cohn SH, Gartenhaus W, Sawitsky A, Rai K, Zanzi I, Vaswani A, Ellis KJ, Yasumura S, Cortes E, Vartsky D (1981) Compartmental body composition of cancer patients by measurement of total body nitrogen, potassium and water. Metabolism 30:222–229

Cuthbertson DP (1931) The distribution of nitrogen and sulphur in the urine during conditions of increased catabolism. Biochem J 25:236–244

Devakonda A, George L, Raoof S, Esan A, Saleh A, Bernstein LH (2008) Transthyretin as a marker to predict outcome in critically ill patients. Clin Biochem 41:1126–1130

Ellis KJ, Yasumura S, Vartsky D, Vaswani AN, Cohn SH (1982) Total body nitrogen in health and disease: Effects of age, weight, height, and sex. J Lab Clin Med 99:917–926

Etchamendy N, Enderlin V, Marighetto A, Vouimba RM, Pallet V, Jaffard R, Higueret P (2001) Alleviation of a selective age-related relational memory deficit in mice by pharmacologically induced normalization of brain retinoid signaling. J Neurosci 21:6423–6429

Evans WJ (1991) Reversing sarcopenia: How weight training can build strength and vitality. Geriatrics 51:46–53

Evans WJ, Campbell WW (1993) Sarcopenia and age-related changes in body composition and functional capacity. J Nutr 123:465–468

Finkelstein JD, Martin JJ (1984) Methionine metabolism in mammals. Distribution of methionine between competing pathways. J Biol Chem 259:9508–9513

Garg UC, Zheng ZJ, Folsom AR, Moyer YS, Tsai MY, McGovern P, Eckfeldt JH (1997) Short-term and long-term variability of plasma homocysteine measurement. Clin Chem 43:141–145

Goodman AB, Pardee AB (2003) Evidence for defective retinoid transport and function in late onset Alzheimer’s disease. Proc Natl Acad Sci USA 100:2901–2905

Gray GE, Landel AM, Meguid MM (1994) Taurine-supplemented total parenteral nutrition and taurine status of malnourished cancer patients. Nutrition 10:11–15

Heymsfield SB, McManus C, Stevens V, Smith J (1982) Muscle mass: Reliable indicator of protein-energy malnutrition and outcome. Am J Clin Nutr 35:1192–1199

Ingenbleek Y (2006) The nutritional relationship linking sulfur to nitrogen in living organisms. J Nutr 136:S1641–S1651
Ingenbleek Y (2008) Plasma transthyretin indicates the direction of both nitrogen balance and retinoid status in health and disease. Open Clin Chem J 1:1–12
Ingenbleek Y, Bernstein LH (1999a) The stressful condition as a nutritionally dependent adaptive dichotomy. Nutrition 15:305–320
Ingenbleek Y, Bernstein LH (1999b) The nutritionally dependent adaptive dichotomy (NDAD) and stress hypermetabolism. J Clin Ligand Assay 22:259–267
Ingenbleek Y, Carpentier YA (1985) A prognostic inflammatory and nutritional index scoring critically ill patients. Internat J Vitam Nutr Res 55:91–101

Ingenbleek Y, Young VR (1994) Transthyretin (prealbumin) in health and disease: Nutritional implications. Annu Rev Nutr 14:495–533
Ingenbleek Y, Young VR (2002) Significance of transthyretin in protein metabolism. Clin Chem Lab Med 40:1281–1291
Ingenbleek Y, Young VR (2004) The essentiality of sulfur is closely related to nitrogen metabolism. Nutr Res Rev 17:135–151

Pharma Intell Links

Nitric Oxide and iNOS have Key Roles in Kidney Diseases – Part II
Biochemistry of the Coagulation Cascade and Platelet Aggregation – Part I 
Mitochondrial dynamics and cardiovascular diseases 
“Seductive Nutrition”: Making Popular Dishes a Bit Healthier – Culinary Institute of America
Low Bioavailability of Nitric Oxide due to Misbalance in Cell Free Hemoglobin in Sickle Cell Disease – A Computational Model
Ubiquinin-Proteosome pathway, autophagy, the mitochondrion, proteolysis and cell apoptosis
Nitric Oxide and Immune Responses: Part 2
Mitochondrial Damage and Repair under Oxidative Stress
Endothelial Function and Cardiovascular Disease
Nitric Oxide and Sepsis, Hemodynamic Collapse, and the Search for Therapeutic Options
Is the Warburg Effect the cause or the effect of cancer: A 21st Century View?
Sepsis, Multi-organ Dysfunction Syndrome, and Septic Shock: A Conundrum of Signaling Pathways Cascading Out of Control
Mitochondria: Origin from oxygen free environment, role in aerobic glycolysis, metabolic adaptation
Metabolite Identification Combining Genetic and Metabolic Information: Genetic association links unknown metabolites to functionally related genes
Clinical Trials Results for Endothelin System: Pathophysiological role in Chronic Heart Failure, Acute Coronary Syndromes and MI – Marker of Disease Severity or Genetic Determination?
Nitric Oxide Covalent Modifications: A Putative Therapeutic Target?

Read Full Post »