Warburg Effect Revisited – 2
Writer and Curator: Larry H. Bernstein, MD, FCAP
Finding Dysregulation in the Cancer Cell
2.1. Warburg Effect Revisited
One of the great observations of the 20th century was the behavior of cancer cells to proliferate and rely on anaerobic glycolysis for the source of energy. This was a restatement of the Pasteur effect, described 60 years earlier by the great French scientist in yeast experiments. The experiments with yeast were again reperformed by Jose EDS Roselino, a Brazilian biochemist, who established an explanation for it 50 years after Warburg. It is quite amazing the mitochondria were not yet discovered at the time that Warburg carried out the single-cell thickness measurements in his respiratory apparatus. He concluded from the observation that the cancer cells grew in a media that became acidic from producing lactic acid, that the cells were dysfunctional in the utilization of oxygen, as nonmalignant cells efficiently utilized oxygen. He also related the metabolic events to observations made by Meyerhof. The mitochondria and the citric acid cycle at this time had not yet been discovered, and the latter was, worked out by Hans Krebs and Albert Szent-Gyorgi, both of whom worked with him on mitochondrial metabolism. The normal cell utilizes glucose efficiently and lipids as well, generating energy through oxidative phosphorylation, with the production of ATP in a manner previously described in these posts. Greater clarity was achieved with the discovery of Coenzyme A, and finally the electron transport chain (ETC). This requires that the pyruvate be directed into the tricarboxylic acid cycle and to go through a series of reactions producing succinate and finally malate.
The following great achievements were made with regard to elucidating these processes:
| 1922 | Archibald Vivian Hill | United Kingdom | “for his discovery relating to the production of heat in the muscle“[26] | |||
| Otto Fritz Meyerhof | Germany | “for his discovery of the fixed relationship between the consumption of oxygen and the metabolism of lactic acid in the muscle”[26] | ||||
| 1931 | Otto Heinrich Warburg | Germany | “for his discovery of the nature and mode of action of the respiratory enzyme“[34] | |||
| 1937 | Albert Szent-Györgyi von Nagyrapolt | Hungary | “for his discoveries in connection with the biological combustion processes, with special reference to vitamin C and the catalysis of fumaric acid“[40] | |||
| 1953 | Sir Hans Adolf Krebs | United Kingdom | “for his discovery of the citric acid cycle“[53] | |||
| Fritz Albert Lipmann | United States | “for his discovery of co-enzyme A and its importance for intermediary metabolism”[53] | ||||
| 1955 | Axel Hugo Theodor Theorell | Sweden | “for his discoveries concerning the nature and mode of action of oxidation enzymes”[55] | |||
| 1978 | Peter D. Mitchell | United Kingdom | “for his contribution to the understanding of biological energy transfer through the formulation of the chemiosmotic theory“[77] | |||
| 1997 | Paul D. Boyer | United States | “for their elucidation of the enzymatic mechanism underlying the synthesis of adenosine triphosphate (ATP)”[96] | |||
| John E. Walker | United Kingdom | |||||
1967 Manfred Eigen and the other half jointly to:
Ronald George Wreyford Norrish and Lord George Porter for their studies of extremely fast chemical reactions, effected by disturbing the equlibrium by means of very short pulses of energy.
1965 FRANÇOIS JACOB , ANDRÉ LWOFF And JACQUES MONOD for their discoveries concerning genetic control of enzyme and virus synthesis.
1964 KONRAD BLOCH And FEODOR LYNEN for their discoveries concerning the mechanism and regulation of the cholesterol and fatty acid metabolism.
If there is a more immediate need for energy (as in stressed muscular activity) with net oxygen insufficiency, the pyruvate is converted to lactic acid, with acidemia, and with much less ATP production, but the lactic academia and the energy deficit is subsequently compensated for. The observation made by Jose EDS Rosalino was that yeast grown in a soil deficient in oxygen don’t put down roots.
^I. Topisirovic and N. Sonenberg
Cold Spring Harbor Symposia on Quantitative Biology, Volume LXXVI
http://dx.doi.org:/10.1101/sqb.2011.76.010785 ”A prominent feature of cancer cells is the use of aerobic glycolysis under conditions in which oxygen levels are sufficient to support energy production in the mitochondria (Jones and Thompson 2009; Cairns et al. 2010). This phenomenon, named the “Warburg effect,” after its discoverer Otto Warburg, is thought to fuel the biosynthetic requirements of the neoplastic growth (Warburg 1956; Koppenol et al. 2011) and has recently been acknowledged as one of the hallmarks of cancer (Hanahan and Weinberg 2011). mRNA translation is the most energy-demanding process in the cell (Buttgereit and Brand 1995).
Again, the use of aerobic glycolysis expression has been twisted.”
To understand my critical observation consider this: Aerobic glycolysis is the carbon flow that goes from Glucose to CO2 and water (includes Krens cycle and respiratory chain for the restoration of NAD, FAD etc.
Anerobic glyclysis is the carbon flow that goes from glucose to lactate. It uses conversion of pyruvate to lactate to regenerate NAD.
“Pasteur effect” is an expression coined by Warburg, which refers to the reduction in the carbon flow from glucose when oxygen is offered to yeasts. The major reason for that is in general terms, derived from the fact that carbon flow is regulated by several cell requirements but mainly by the ATP needs of the cell. Therefore, as ATP is generated 10 more efficiently in aerobiosis than under anaerobiosis, less carbon flow is required under aerobiosis than under anaerobiosis to maintain ATP levels. Warburg, after searching for the same regulatory mechanism in normal and cancer cells for comparison found that transformed cell continued their large flow of glucose carbons to lactate despite the presence of oxygen.
So, it is wrong to describe that aerobic glycolysis continues in the presence of oxygen. It is what it is expected to occur. The wrong thing is that anaerobic glycolysis continues under aerobiosis.
^Aurelian Udristioiu (comment)
In cells, the immediate energy sources involve glucose oxidation. In anaerobic metabolism, the donor of the phosphate group is adenosine triphosphate (ATP), and the reaction is catalyzed via the hexokinase or glucokinase: Glucose +ATP-Mg²+ = Glucose-6-phosphate (ΔGo = – 3.4 kcal/mol with hexokinase as the co-enzyme for the reaction.).
In the following step, the conversion of G-6-phosphate into F-1-6-bisphosphate is mediated by the enzyme phosphofructokinase with the co-factor ATP-Mg²+. This reaction has a large negative free energy difference and is irreversible under normal cellular conditions. In the second step of glycolysis, phosphoenolpyruvic acid in the presence of Mg²+ and K+ is transformed into pyruvic acid. In cancer cells or in the absence of oxygen, the transformation of pyruvic acid into lactic acid alters the process of glycolysis.
The energetic sum of anaerobic glycolysis is ΔGo = -34.64 kcal/mol. However a glucose molecule contains 686kcal/mol and, the energy difference (654.51 kcal) allows the potential for un-controlled reactions during carcinogenesis. The transfer of electrons from NADPH in each place of the conserved unit of energy transmits conformational exchanges in the mitochondrial ATPase. The reaction ADP³+ P²¯ + H²à ATP + H2O is reversible. The terminal oxygen from ADP binds the P2¯ by forming an intermediate pentacovalent complex, resulting in the formation of ATP and H2O. This reaction requires Mg²+ and an ATP-synthetase, which is known as the H+-ATPase or the Fo-F1-ATPase complex. Intracellular calcium induces mitochondrial swelling and aging. [12].
The known marker of monitoring of treatment in cancer diseases, lactate dehydrogenase (LDH) is an enzyme that is localized to the cytosol of human cells and catalyzes the reversible reduction of pyruvate to lactate via using hydrogenated nicotinamide deaminase (NADH) as co-enzyme.
The causes of high LDH and high Mg levels in the serum include neoplastic states that promote the high production of intracellular LDH and the increased use of Mg²+ during molecular synthesis in processes pf carcinogenesis (Pyruvate acid>> LDH/NADH >>Lactate acid + NAD), [13].
The material we shall discuss explores in more detail the dysmetabolism that occurs in cancer cells.
Is the Warburg Effect the Cause or the Effect of Cancer: A 21st Century View?
http://pharmaceuticalintelligence.com/2014/06/21/is-the-warburg-effect-the-cause-or-the-effect-of-cancer-a-21st-century-view-2/
Warburg Effect Revisited
http://pharmaceuticalintelligence.com/2013/11/28/warburg-effect-revisited/
AMPK Is a Negative Regulator of the Warburg Effect and Suppresses Tumor Growth In Vivo
http://pharmaceuticalintelligence.com/2013/03/12/ampk-is-a-negative-regulator-of-the-warburg-effect-and-suppresses-tumor-growth-in-vivo/
AKT Signaling Variable Effects
http://pharmaceuticalintelligence.com/2013/03/04/akt-signaling-variable-effects/
Otto Warburg, A Giant of Modern Cellular Biology
http://pharmaceuticalintelligence.com/2012/11/02/otto-warburg-a-giant-of-modern-cellular-biology/
The Metabolic View of Epigenetic Expression
http://pharmaceuticalintelligence.com/2015/03/28/the-metabolic-view-of-epigenetic-expression/
Metabolomics Summary and Perspective
http://pharmaceuticalintelligence.com/2014/10/16/metabolomics-summary-and-perspective/
2.1.1 Cancer Metabolism
2.1.1.1 Oncometabolites: linking altered metabolism with cancer
Ming Yang, Tomoyoshi Soga, and Patrick J. Pollard
J Clin Invest Sep 2013; 123(9):3652–3658
http://dx.doi.org:/10.1172/JCI67228
The discovery of cancer-associated mutations in genes encoding key metabolic enzymes has provided a direct link between altered metabolism and cancer. Advances in mass spectrometry and nuclear magnetic resonance technologies have facilitated high-resolution metabolite profiling of cells and tumors and identified the accumulation of metabolites associated with specific gene defects. Here we review the potential roles of such “oncometabolites” in tumor evolution and as clinical biomarkers for the detection of cancers characterized by metabolic dysregulation.
The emerging interest in metabolites whose abnormal accumulation causes both metabolic and nonmetabolic dysregulation and potential transformation to malignancy (herein termed “oncometabolites”) has been fueled by the identification of cancerassociated mutations in genes encoding enzymes with significant roles in cellular metabolism (1–5). Loss-of-function mutations in genes encoding the Krebs cycle enzymes fumarate hydratase (FH) and succinate dehydrogenase (SDH) cause the accumulation of fumarate and succinate, respectively (6), whereas gain-offunction isocitrate dehydrogenase (IDH) mutations increase levels of D–2-hydroxyglutarate (D-2HG) (7, 8). These metabolites have been implicated in the dysregulation of cellular processes including the competitive inhibition of α-ketoglutarate–dependent (α-KG–dependent) dioxygenase enzymes (also known as 2-oxoglutarate–dependent dioxgenases) and posttranslational modification of proteins (1, 4, 9–11). To date, several lines of biochemical and genetic evidence support roles for fumarate, succinate, and D-2HG in cellular transformation and oncogenesis (3, 12).
The Journal of Clinical Investigation http://www.jci.org Volume 123 Number 9 September 2013
ventional gene sequencing methods may lead to false positives due to genetic polymorphism and sequencing artifacts (98). In comparison, screening for elevated 2HG levels is a sensitive and specific approach to detect IDH mutations in tumors. Whereas patient sera/plasma can be assessed in the case of AML (7, 8, 21, 99), exciting advances with proton magnetic resonance spectroscopy (MRS) have been made in the noninvasive detection of 2HG in patients with gliomas (100–103). Using MRS sequence optimization and spectral fitting techniques, Maher and colleagues examined 30 patients with glioma and showed that the detection of 2HG correlated 100% with the presence of IDH1 or IDH2 mutations (102). Andronesi et al. further demonstrated that two-dimensional correlation spectroscopy could effectively distinguish 2HG from chemically similar metabolites present in the brain (103). Negative IHC staining for SDHB correlates with the presence of SDH mutations, whether in SDHB, SDHC, or SDHD (104). This finding is most likely explained by the fact that mutations in any of the four subunits of SDH can destabilize the entire enzyme complex. PGLs/PCCs associated with an SDHA mutation show negative staining for SDHA as well as SDHB (105). Therefore, IHC staining for SDHB is a useful diagnostic tool to triage patients for genetic testing of any SDH mutation, and subsequent staining for the other subunits may further narrow the selection of genes to be tested. In contrast, detection of FH protein is often evident in HLRCC tumors due to retention of the nonfunctional mutant allele (106). However, staining of cysts and tumors for 2SC immunoreactivity reveals a striking correlation between FH inactivation and the presence of 2SC-modified protein (2SCP), which is absent in non-HLRCC tumors and normal tissue controls (106). IHC staining for 2SCP thus provides a robust diagnostic biomarker for FH deficiency (107).
Therapeutic targeting Because D-2HG is a product of neomorphic enzyme activities, curtailing the D-2HG supply by specifically inhibiting the mutant IDH enzymes provides an elegant approach to target IDH-mutant cancers. Indeed, recent reports of small-molecule inhibitors against mutant forms of IDH1 and IDH2 demonstrated the feasibility of this method. An inhibitor against IDH2 R140Q was shown to reduce both intracellular and extracellular levels of D-2HG, suppress cell growth, and increase differentiation of primary human AML cells (108). Similarly, small-molecule inhibition of IDH1 R132H suppressed colony formation and increased tumor cell differentiation in a xenograft model for IDH1 R132H glioma (58). The inhibitors exhibited a cytostatic rather than cytotoxic effect, and therefore their therapeutic efficacy over longer time periods may need further assessment (109). Letouzé et al. showed that the DNA methytransferase inhibitor decitabine could repress the migration capacities of SDHB-mutant cells (40). However, for SDH- and FH-associated cancers, a synthetic lethality approach is worth exploring because of the pleiotrophic effects associated with succinate and fumarate accumulation.
Outlook The application of next-generation sequencing technologies in the field of cancer genomics has substantially increased our understanding of cancer biology. Detection of germline and somatic mutations in specific tumor types not only expands the current repertoire of driver mutations and downstream effectors in tumorigenesis, but also sheds light on how oncometabolites may exert their oncogenic roles. For example, the identification of mutually exclusive mutations in IDH1 and TET2 in AML led to the characterization of TET2 as a major pathological target of D-2HG (34, 110). Additionally, the discovery of somatic CUL3, SIRT1, and NRF2 mutations in sporadic PRCC2 converges with FH mutation in HLRCC, in which NRF2 activation is a consequence of fumarate-mediated succination of KEAP1, indicating the functional prominence of the NRF2 pathway in PRCC2 (73). In light of this, the identification of somatic mutations in genes encoding the chromatin-modifying enzymes histone H3K36 methyltransferase (SETD2), histone H3K4 demethylase JARID1C (KDM5C), histone H3K27 demethylase UTX (KDM6A), and the SWI/SNF chromatin remodelling complex gene PBRM1 in clear cell renal cell carcinoma (111–113) highlights the importance of epigenetic modulation in human cancer and raises the potential for systematic testing in other types of tumors such as those associated with FH mutations. Technological advances such as those in gas and liquidchromatography mass spectrometry (114, 115) and nuclear magnetic resonance imaging (102) have greatly improved the ability to measure low-molecular-weight metabolites in tumor samples with high resolution (116). Combined with metabolic flux analyses employing isotope tracers and mathematical modeling, modern-era metabolomic approaches can provide direct pathophysiological insights into tumor metabolism and serve as an excellent tool for biomarker discovery. Using a data-driven approach, Jain and colleagues constructed the metabolic profiles of 60 cancer cell lines and discovered glycine consumption as a key metabolic event in rapidly proliferating cancer cells (117), thus demonstrating the power of metabolomic analyses and the relevance to future cancer research and therapeutics.
Acknowledgments The Cancer Biology and Metabolism Group is funded by Cancer Research UK and the European Research Council under the European Community’s Seventh Framework Programme (FP7/20072013)/ERC grant agreement no. 310837 to Dr. Pollard. Professor Soga receives funding from a Grant-in-Aid for scientific research on Innovative Areas, Japan (no. 22134007), and the Yamagata Prefectural Government and City of Tsuruoka.
Address correspondence to: Patrick J. Pollard, Cancer Biology and Metabolism Group, Nuffield Department of Medicine, Henry Wellcome Building for Molecular Physiology, University of Oxford, Roosevelt Drive, Oxford, OX3 7BN, United Kingdom. Phone: 44.0.1865287780; Fax: 44.0.1865287787; E-mail: patrick.pollard@well.ox.ac.uk.
- Yang M, Soga T, Pollard PJ, Adam J. The emerging role of fumarate as an oncometabolite. Front Oncol. 2012;2:85. 2. Ward PS, Thompson CB. Metabolic reprogramming: a cancer hallmark even warburg did not anticipate. Cancer Cell. 2012;21(3):297–308. 3. Vander Heiden MG, Cantley LC, Thompson CB. Understanding the Warburg effect: the metabolic requirements of cell proliferation. Science. 2009; 324(5930):1029–1033. 4. Thompson CB. Metabolic enzymes as oncogenes or tumor suppressors. N Engl J Med. 2009; 360(8):813–815. 5. Schulze A, Harris AL. How cancer metabolism is tuned for proliferation and vulnerable to disruption. Nature. 2012;491(7424):364–373.
- Pollard PJ, et al. Accumulation of Krebs cycle intermediates and over-expression of HIF1alpha in tumours which result from germline FH and SDH mutations. Hum Mol Genet. 2005; 14(15):2231–2239. 7. Ward PS, et al. The common feature of leukemiaassociated IDH1 and IDH2 mutations is a neomorphic enzyme activity converting alpha-ketoglutarate to 2-hydroxyglutarate. Cancer Cell. 2010; 17(3):225–234.
Because D-2HG is a product of neomorphic enzyme activities, curtailing the D-2HG supply by specifically inhibiting the mutant IDH enzymes provides an elegant approach to target IDH-mutant cancers. Indeed, recent reports of small-molecule inhibitors against mutant forms of IDH1 and IDH2 demonstrated the feasibility of this method. An inhibitor against IDH2 R140Q was shown to reduce both intracellular and extracellular levels of D-2HG, suppress cell growth, and increase differentiation of primary human AML cells (108). Similarly, small-molecule inhibition of IDH1 R132H suppressed colony formation and increased tumor cell differentiation in a xenograft model for IDH1 R132H glioma (58). The inhibitors exhibited a cytostatic rather than cytotoxic effect, and therefore their therapeutic efficacy over longer time periods may need further assessment (109). Letouzé et al. showed that the DNA methytransferase inhibitor decitabine could repress the migration capacities of SDHB-mutant cells (40). However, for SDH- and FH-associated cancers, a synthetic lethality approach is worth exploring because of the pleiotrophic effects associated with succinate and fumarate accumulation.
Technological advances such as those in gas and liquid chromatography mass spectrometry (114, 115) and nuclear magnetic resonance imaging (102) have greatly improved the ability to measure low-molecular-weight metabolites in tumor samples with high resolution (116). Combined with metabolic flux analyses employing isotope tracers and mathematical modeling, modern-era metabolomic approaches can provide direct pathophysiological insights into tumor metabolism and serve as an excellent tool for biomarker discovery. Using a data-driven approach, Jain and colleagues constructed the metabolic profiles of 60 cancer cell lines and discovered glycine consumption as a key metabolic event in rapidly proliferating cancer cells (117), thus demonstrating the power of metabolomic analyses and the relevance to future cancer research and therapeutics.
Figure 1 D-2HG produced by mutant IDH1/2 affects metabolism and epigenetics by modulating activities of α-KG–dependent oxygenases. Wild-type IDH1 and IDH2 catalyze the NADP+-dependent reversible conversion of isocitrate to α-KG, whereas cancer-associated gain-of-function mutations enable mutant IDH1/2 (mIDH1/2) to catalyze the oxidation of α-KG to D-2HG, using NADPH as a cofactor. Because D-2HG is structurally similar to α-KG, its accumulation can modulate the activities of α-KG–utilizing dioxygenases. Inhibition of 5mC hydroxylase TET2 and the KDMs results in increased CpG island methylation and increased histone methylation marks, respectively, thus blocking lineage-specific cell differentiation. Inhibition of collagen prolyl and lysyl hydroxylases (C-P4Hs and PLODs, respectively) leads to impaired collagen maturation and disrupted basement membrane formation. D-2HG can also stimulate the activities of HIF PHDs, leading to enhanced HIF degradation and a diminished HIF response, which are associated with increased soft agar growth of human astrocytes and growth factor independence of leukemic cells. Together these processes exert pleiotrophic effects on cell signaling and gene expression that probably contribute to the malignancy of IDH1/2-mutant cells.
Figure 2 Candidate oncogenic mechanisms of succinate and fumarate accumulation. SDH and FH are Krebs cycle enzymes and tumor suppressors. Loss-of-function mutations in SDH and FH result in abnormal accumulation of Krebs cycle metabolites succinate (Succ) and fumarate (Fum), respectively, both of which can inhibit the activities of α-KG–dependent oxygenases. Inhibition of HIF PHDs leads to activation of HIF-mediated pseudohypoxic response, whereas inhibition of KDMs and TET family of 5mC hydroxylases causes epigenetic alterations. Fumarate is electrophilic and can also irreversibly modify cysteine residues in proteins by succination. Succination of KEAP1 in FH deficiency results in the constitutive activation of the antioxidant defense pathway mediated by NRF2, conferring a reductive milieu that promotes cell proliferation. Succination of the Krebs cycle enzyme Aco2 impairs aconitase activity in Fh1-deficient MEFs. Fumarate accumulation may also affect cytosolic pathways by inhibiting the reactions involved in the biosynthesis of arginine and purine. AcCoA, acetyl CoA; Mal, malate; OAA, oxaloacetate; Succ-CA, succinyl CoA.
2.1.1.2. Emerging concepts: linking hypoxic signaling and cancer metabolism.
Lyssiotis CA, Vander-Heiden MG, Muñoz-Pinedo C, Emerling BM.
Cell Death Dis. 2012 May 3; 3:e303
http://dx.doi.org:/10.1038/cddis.2012.41
The Joint Keystone Symposia on Cancer and Metabolism and Advances in Hypoxic Signaling: From Bench to Bedside were held in Banff, Alberta, Canada from 12 to 17 February 2012. Drs. Reuben Shaw and David Sabatini organized the Cancer and Metabolism section, and Drs. Volker Haase, Cormac Taylor, Johanna Myllyharju and Paul Schumacker organized the Advances in Hypoxic Signaling section. Accumulating data illustrate that both hypoxia and rewired metabolism influence cancer biology. Indeed, these phenomena are tightly coupled, and a joint meeting was held to foster interdisciplinary interactions and enhance our understanding of these two processes in neoplastic disease. In this report, we highlight the major themes of the conference paying particular attention to areas of intersection between hypoxia and metabolism in cancer.
One opening keynote address was delivered by Craig Thompson (Memorial Sloan-Kettering, USA), in which he provided a comprehensive perspective on the current thinking around how altered metabolism supports cancer cell growth and survival, and discussed areas likely to be important for future discovery. In particular, Thompson highlighted the essential roles of glucose and glutamine in cell growth, how glucose- and glutamine-consuming processes are rewired in cancer and how this rewiring facilitates anabolic metabolism. These topics were at the core of many of the metabolism presentations that described in detail how some metabolic alterations contribute to the properties of transformed cells.
The other keynote address was delivered by Peter Ratcliffe (University of Oxford, UK), in which he provided a historical perspective on the progress of how signaling events sense oxygen. Mammals have evolved multiple acute and long-term adaptive responses to low oxygen levels (hypoxia). This response prevents a disparity in ATP utilization and production that would otherwise result in a bioenergetic collapse when oxygen level is low. Multiple effectors have been proposed to mediate the response to hypoxia including prolyl hydroxylases, AMPK, NADPH oxidases and the mitochondrial complex III. Currently, however, the precise mechanism by which oxygen is sensed in various physiological contexts remains unknown. Indeed, this was an active point of debate, with Peter Ratcliffe favoring the prolyl hydroxylase PHD2 as the primary cellular oxygen sensor.
Anabolic glucose metabolism and the Warburg effect
Nearly a century ago, Warburg noted that cancer tissues take up glucose in excess than most normal tissues and secrete much of the carbon as lactate. Recently, headway has been made toward determining how the enhanced glucose conversion to lactate occurs and contributes to cell proliferation and survival. Heather Christofk (University of California, Los Angeles, USA) and John Cleveland (the Scripps Research Institute, USA) described a role for the lactate/pyruvate transporter MCT-1 in carbon secretion, and suggested that blocking lactate or pyruvate transport may be a strategy to target glucose metabolism in cancer cells. Kun-Liang Guan (University of California, San Diego, USA) described a novel feedback loop to control glucose metabolism in highly glycolytic cells. Specifically, he discussed how glucose-derived acetyl-CoA can be used as a substrate to modify two enzymes involved in glucose metabolism, pyruvate kinase M2 (PKM2) and phosphoenolpyruvate carboxylase (PEPCK). In both cases, acetylation leads to protein degradation and decreased glycolysis and gluconeogenesis, respectively. Data presented from Matthew Vander Heiden’s laboratory (Koch Institute/MIT, USA) illustrated that loss of pyruvate kinase activity can accelerate tumor growth, suggesting that the regulation of glycolysis may be more complex than previously appreciated. Almut Schulze (London Research Institute, UK) discussed a novel regulatory role for phosphofructokinase in controlling glucose metabolism and Jeffrey Rathmell (Duke University, USA) discussed parallels between glucose metabolism in cancer cells and lymphocytes that suggest many of these phenotypes could be a feature of rapidly dividing cells.
Glutamine addiction
Cancer cells also consume glutamine to support proliferation and survival. Alfredo Csibi (Harvard Medical School, USA) described how mTORC1 promotes glutamine utilization by indirectly regulating the activity of glutamate dehydrogenase. This work united two major themes at the meeting, mTOR signaling and glutamine metabolism, highlighting the interconnectedness of signal transduction and metabolic regulation. Richard Cerione (Cornell University, USA) described a small molecule inhibitor of glutaminase that can be used to target glutamine-addicted cancer cells. Christian Metallo (University of California, San Diego, USA), Andrew Mullen (University of Texas Southwestern Medical School, USA) and Patrick Ward (Memorial Sloan-Kettering, USA) presented data demonstrating that the carbon skeleton of glutamine can be incorporated into newly synthesized lipids. This contribution of glutamine to lipid synthesis was most pronounced in hypoxia or when the mitochondrial electron transport chain was compromised.
Signal transduction and metabolism
The protein kinases AMPK and mTOR can function as sensors of metabolic impairment, whose activation by energy stress controls multiple cellular functions. Grahame Hardie (University of Dundee, UK) and Reuben Shaw (Salk Institute, USA) highlighted novel roles for AMPK, including inhibition of viral replication, and the control of histone acetylation via phosphorylation of class IIa HDACs, respectively. Brandon Faubert (McGill University, USA) reported on an AMPK-dependent effect on glucose metabolism in unstressed cells. Brendan Manning (Harvard Medical School, USA) found that chronic activation of mTOR in the mouse liver, due to genetic ablation of this complex, promotes the development of liver cancer. Kevin Williams (University of California, Los Angeles, USA) discussed how growth signaling can control both lipid and glucose metabolism by impinging on SREBP-1, a transcription factor downstream of mTOR. AMPK-independent control of mTOR was addressed by John Blenis (Harvard Medical School, USA), who discussed the possible role of mTOR stabilizing proteins as mediators of mTOR inactivation upon energetic stress. David Sabatini (Whitehead Institute/MIT, USA) discussed several aspects of amino-acid sensing by Rag GTPases and showed that constitutive activation of the Rag GTPases leads to metabolic defects in mice.
One of the outcomes of AMPK activation and mTOR inhibition is autophagy, which can provide amino acids and fatty acids to nutrient-deprived cells. Ana Maria Cuervo (Albert Einstein College of Medicine, USA) and Eileen White (Rutgers University, USA) illuminated the role of chaperone-mediated autophagy (CMA) and macroautophagy, respectively, in tumor survival. White described a role for macroautophagy in the regulation of mitochondrial fitness, maintenance of TCA cycle and tumorigenesis induced by oncogenic Ras. Cuervo described how CMA is consistently elevated in tumor cells, and how its inactivation leads to metabolic impairment via p53-mediated downregulation of glycolytic enzymes.
Oncogene-specific changes to metabolism
Lewis Cantley (Harvard Medical School, USA) described a metabolic role for oncogenic Kras in the rewiring of glucose metabolism in pancreatic cancer. Specifically, Myc-mediated transcription (downstream of MEK-ERK signaling) both enhances glucose uptake and diverts glucose carbon into the nonoxidative pentose phosphate pathway to facilitate nucleotide biosynthesis. Alejandro Sweet-Cordero (Stanford University, USA) described how oncogenic Kras increases glycolysis and represses mitochondrial respiration (via decreased pyruvate dehydrogenase phosphatase 1 (PDP1) expression) in colon cancer. While these studies indicate that hyperstimulation of the Erk pathway suppresses PDH flux through suppression of PDP1, Joan Brugge (Harvard Medical School, USA) described studies showing that reduction of Erk signaling in normal epithelial cells also causes suppression of PDH flux, in this case through loss of repression of PDK4. The seemingly contradictory nature of these results highlighted an important theme emphasized throughout the week-long conference—that cellular context has an important role in shaping how oncogenic mutations or pathway activation rewires metabolism.
Targeting cancer metabolism
There was extensive discussion around targeting metabolism for cancer therapy. Metformin and phenformin, which act in part by mitochondrial complex I inhibition, can activate AMPK and influence cancer cell metabolism. Kevin Struhl (Harvard Medical School, USA) described how metformin can selectively target cancer stem cells, whereas Jessica Howell (Harvard Medical School, USA) described how the therapeutic activity of metformin relies on both AMPK and mTOR signaling to mediate its effect. Similarly, David Shackelford (University of California, Los Angeles, USA) demonstrated efficacy for phenformin in LKB1-deficient mouse models.
Several presentations, including those by Taru Muranen (Harvard Medical School, USA), Karen Vousden and Eyal Gottlieb (both from the Beatson Institute for Cancer Research, UK), provided insight into genetic control mechanisms that cancer cells use to promote survival under conditions of increased biosynthesis. As an example, Vousden illustrated how p53 loss can make cancer cells more dependent on exogenous serine. Several additional presentations, including those by Gottlieb, Richard Possemato (Whitehead Institute/MIT, USA), Michael Pollak (McGill University, USA) and Kevin Marks (Agios Pharmaceuticals, USA), also included data highlighting the important role of serine biosynthesis and metabolism in cancer growth. Collectively, these data highlight a metabolic addiction that may be therapeutically exploitable. Similarly, Cristina Muñoz-Pinedo (Institut d’Investigació Biomèdica, Spain) described how mimicking glucose deprivation with 2-deoxyglucose can cause programmed cell death and may be an effective cancer treatment.
Regulation of hypoxic responses
Peter Carmeliet (University of Leuven, Belgium) highlighted the mechanisms of resistance against VEGF-targeted therapies. Roland Wenger (University of Zurich, Switzerland) discussed the oxygen-responsive transcriptional networks and, in particular, the difference between the transcription factors HIF-1α and HIF-2α. Importantly, he demonstrated a rapid role for HIF-1α, and a later and more persistent response for HIF-2α. These results were central to a recurrent theme calling for the distinction of HIF-1α and HIF-2α target genes and how these responses mediate divergent hypoxic adaptations.
Advances in hypoxic signaling
Brooke Emerling (Harvard Medical School, USA) introduced CUB domain-containing protein 1 (CDCP1) and showed persuasive data on CDCP1 being a HIF-2α target gene involved in cell migration and metastasis, and suggested CDCP1 regulation as an attractive therapeutic target. Johannes Schodel (University of Oxford, UK) described an elegant HIF-ChIP-Seq methodology to define direct transcriptional targets of HIF in renal cancer.
Randall Johnson (University of Cambridge, UK) emphasized that loss of HIF-1α results in decreased lung metastasis. Lorenz Poellinger (Karolinska Institutet, Sweden) focused on how hypoxia can alter the epigenetic landscape of cells, and furthermore, how the disruption of the histone demethylase JMJD1A and/or the H3K9 methyltransferase G9a has opposing effects on tumor growth and HIF target gene expression.
Paul Schumacker (Northwestern University, USA) further emphasized the importance of mitochondrial ROS signaling under hypoxic conditions showing that ROS could be detected in the inter-membrane space of the mitochondria before activating signaling cascades in the cytosol. He also presented evidence for mitochondria as a site of oxygen sensing in diverse cell types. Similarly, Margaret Ashcroft (University College London, UK) argued for a critical role of mitochondria in hypoxic signaling. She presented on a family of mitochondrial proteins (CHCHD4) that influence hypoxic signaling and tumorigenesis and suggested that CHCHD4 is important for HIF and tumor progression.
2.1.1.3 Glutaminolysis: supplying carbon or nitrogen or both for cancer cells?
Dang CV
Cell Cycle. 2010 Oct 1; 9(19):3884-6
A cancer cell comprising largely of carbon, hydrogen, oxygen, phosphorus, nitrogen and sulfur requires not only glucose, which is avidly transported and converted to lactate by aerobic glycolysis or the Warburg effect, but also glutamine as a major substrate. Glutamine and essential amino acids, such as methionine, provide energy through the TCA cycle as well as nitrogen, sulfur and carbon skeletons for growing and proliferating cancer cells. The interplay between utilization of glutamine and glucose is likely to depend on the genetic make-up of a cancer cell. While the MYC oncogene induces both aerobic glycolysis and glutaminolysis, activated β-catenin induces glutamine synthesis in hepatocellular carcinoma. Cancer cells that have elevated glutamine synthetase can use glutamate and ammonia to synthesize glutamine and are hence not addicted to glutamine. As such, cancer cells have many degrees of freedom for re-programming cell metabolism, which with better understanding will result in novel therapeutic approaches.
Figure 1. Glutamine, glucose and glutamate are imported into the cytoplasm of a cell. Glucose is depicted to be converted primarily (large powder blue arrow) to lactate via aerobic glycolysis or the Warburg effect or channeled into the mitochondrion as pyruvate and converted to acetyl-CoA for oxidation. Glutamine is shown imported and used for different processes including glutaminolysis, which involves the conversion of glutamine to glutamate and ammonia by glutaminase (GLS). Glutamate is further oxidized via the TCA cycle to produce ATP and contribute anabolic carbon skeletons. Some cells can import glutamate and use ammonia to generate glutamine through glutamine synthetase (GLUL); glutamine could then be used for different purposes including glutathione synthesis (not shown).
The liver is organized into lobules, which have zones of cells around the perivenous region enriched with glutamine synthetase, which detoxifies ammonia by converting it to glutamine through the amination of glutamate (Fig. 1). As such, liver cancers vary in the degree of glutamine synthetase expression depending on the extent of anaplasia or de-differentiation. Highly undifferentiated liver cancers tend to be more glycolytic than those that retain some of the differentiated characteristics of liver cells. Furthermore, glutamine synthetase (considered as a direct target of activated β-catenin, which also induces ornithine aminotransferase and glutamate transporters) expression in liver cancers has been directly linked to β-catenin activation or mutations. Hence, the work by Meng et al. illustrates, first and foremost, the metabolic heterogeneity amongst cancer cell lines, such that the ability to utilize ammonia instead of glutamine by Hep3B cells depends on the expression of glutamine synthetase. The Hep3B cells are capable of producing glutamine from glutamate and ammonia, as suggested by the observation that a glutamine-independent derivative of Hep3B has high expression of glutamine synthetase. In this regard, Hep3B could utilize glutamate directly for the production of α-ketoglutarate or to generate glutamine for protein synthesis or other metabolic processes, such as to import essential amino acids. In contrast to Hep3B, other cell lines in the Meng et al. study were not demonstrated to be glutamine independent and thus become ammonia auxotrophs. Hence, the mode of glutamine or glucose utilization is dependent on the metabolic profile of cancer cells.
The roles of glutamine in different cancer cell lines are likely to be different depending on their genetic and epigenetic composition. In fact, well-documented isotopic labeling studies have demonstrated a role for glutamine to provide anapleurotic carbons in certain cancer and mammalian cell types. But these roles of glutaminolysis, whether providing nitrogen or anabolic carbons, should not be generalized as mutually exclusive features of all cancer cells. From these considerations, it is surmised that the expression of glutamine synthetase in different cancers will determine the extent by which these cancers are addicted to exogenous glutamine.
2.1.1.4 The Warburg effect and mitochondrial stability in cancer cells
Gogvadze V, Zhivotovsky B, Orrenius S.
Mol Aspects Med. 2010 Feb; 31(1):60-74
http://dx.doi.org:/10.1016/j.mam.2009.12.004
The last decade has witnessed a renaissance of Otto Warburg’s fundamental hypothesis, which he put forward more than 80 years ago, that mitochondrial malfunction and subsequent stimulation of cellular glucose utilization lead to the development of cancer. Since most tumor cells demonstrate a remarkable resistance to drugs that kill non-malignant cells, the question has arisen whether such resistance might be a consequence of the abnormalities in tumor mitochondria predicted by Warburg. The present review discusses potential mechanisms underlying the upregulation of glycolysis and silencing of mitochondrial activity in cancer cells, and how pharmaceutical intervention in cellular energy metabolism might make tumor cells more susceptible to anti-cancer treatment.

mitochondrial stabilization gr1
http://ars.els-cdn.com/content/image/1-s2.0-S0098299709000934-gr1.sml
Fig. 1. (1) Oligomerization of Bax is mediated by the truncated form of the BH3-only, pro-apoptotic protein Bid (tBid); (2) Bcl-2, Bcl-XL, Mcl-1, and Bcl-w, interact with the pro-apoptotic proteins, Bax and Bak, to prevent their oligomerization; (3) The anti-apoptotic protein Bcl-XL prevents tBid-induced closure of VDAC and apoptosis by maintaining VDAC in open configuration allowing ADT/ATP exchange and normal mitochondrial functioning; (4) MPT pore is a multimeric complex, composed of VDAC located in the OMM, ANT, an integral protein of the IMM, and a matrix protein, CyPD; (5) Interaction with VDAC allows hexokinase to use exclusively intramitochondrial ATP to phosphorylate glucose, thereby maintaining high rate of glycolysis.

mitochodrial stabilization gr2
http://ars.els-cdn.com/content/image/1-s2.0-S0098299709000934-gr2.sml
Fig. 2. Different sites of therapeutic intervention in cancer cell metabolism. (1) The non-metabolizable analog of glucose, 2-deoxyglucose, decreases ATP level in the cell; (2) 3-bromopyruvate suppresses the activity of hexokinase, and respiration in isolated mitochondria; (3) Phloretin a glucose transporter inhibitor, decreases ATP level in the cell and markedly enhances the anti-cancer effect of daunorubicin; (4) Dichloroacetate (DCA) shifts metabolism from glycolysistoglucoseoxidation;(5)Apoptolidin,aninhibitorofmitochondrialATPsynthase,inducescelldeathindifferentmalignantcelllineswhenapplied together with the LDH inhibitor oxamate (6).
Warburg Symposium
2.1.1.5 Oxidative phosphorylation in cancer cells
Giancarlo Solaini , Gianluca Sgarbi, Alessandra Baracca
BB Acta – Bioenergetics 2011 Jun; 1807(6): 534–542
http://dx.doi.org/10.1016/j.bbabio.2010.09.003
Research Highlights
►Mitochondrial hallmarks of tumor cells.►Complex I of the respiratory chain is reduced in many cancer cells.►Oligomers of F1F0ATPase are reduced in cancer cells.►Mitochondrial membranes are critical to the life or death of cancer cells.
Evidence suggests that mitochondrial metabolism may play a key role in controlling cancer cells life and proliferation. Recent evidence also indicates how the altered contribution of these organelles to metabolism and the resistance of cancer mitochondria against apoptosis-associated permeabilization are closely related. The hallmarks of cancer growth, increased glycolysis and lactate production in tumours, have raised attention due to recent observations suggesting a wide spectrum of oxidative phosphorylation deficit and decreased availability of ATP associated with malignancies and tumour cell expansion. More specifically, alteration in signal transduction pathways directly affects mitochondrial proteins playing critical roles in controlling the membrane potential as UCP2 and components of both MPTP and oxphos complexes, or in controlling cells life and death as the Bcl-2 proteins family. Moreover, since mitochondrial bioenergetics and dynamics, are also involved in processes of cells life and death, proper regulation of these mitochondrial functions is crucial for tumours to grow. Therefore a better understanding of the key pathophysiological differences between mitochondria in cancer cells and in their non-cancer surrounding tissue is crucial to the finding of tools interfering with these peculiar tumour mitochondrial functions and will disclose novel approaches for the prevention and treatment of malignant diseases. Here, we review the peculiarity of tumour mitochondrial bioenergetics and the mode it is linked to the cell metabolism, providing a short overview of the evidence accumulated so far, but highlighting the more recent advances. This article is part of a Special Issue entitled: Bioenergetics of Cancer.
Mitochondria are essential organelles and key integrators of metabolism, but they also play vital roles in cell death and cell signaling pathways critically influencing cell fate decisions [1], [2] and [3]. Mammalian mitochondria contain their own DNA (mtDNA), which encodes 13 polypeptides of oxidative phosphorylation complexes, 12S and 16S rRNAs, and 22 tRNAs required for mitochondrial function [4]. In order to synthesize ATP through oxidative phosphorylation (oxphos), mitochondria consume most of the cellular oxygen and produce the majority of reactive oxygen species (ROS) as by-products [5]. ROS have been implicated in the etiology of carcinogenesis via oxidative damage to cell macromolecules and through modulation of mitogenic signaling pathways [6], [7] and [8]. In addition, a number of mitochondrial dysfunctions of genetic origin are implicated in a range of age-related diseases, including tumours [9]. How mitochondrial functions are associated with cancer is a crucial and complex issue in biomedicine that is still unravelled [10] and [11], but it warrants an extraordinary importance since mitochondria play a major role not only as energy suppliers and ROS “regulators”, but also because of their control on cellular life and death. This is of particular relevance since tumour cells can acquire resistance to apoptosis by a number of mechanisms, including mitochondrial dysfunction, the expression of anti-apoptotic proteins or by the down-regulation or mutation of pro-apoptotic proteins [12].
Cancer cells must adapt their metabolism to produce all molecules and energy required to promote tumor growth and to possibly modify their environment to survive. These metabolic peculiarities of cancer cells are recognized to be the outcome of mutations in oncogenes and tumor suppressor genes which regulate cellular metabolism. Mutations in genes including P53, RAS, c-MYC, phosphoinosine 3-phosphate kinase (PI3K), and mTOR can directly or through signaling pathways affect metabolic pathways in cancer cells as discussed in several recent reviews [13], [14], [15], [16] and [17]. Cancer cells harboring the genetic mutations are also able to thrive in adverse environments such as hypoxia inducing adaptive metabolic alterations which include glycolysis up-regulation and angiogenesis factor release [18] and [19]. In response to hypoxia, hypoxia-induced factor 1 (HIF-1) [20], a transcription factor, is up-regulated, which enhances expression of glycolytic enzymes and concurrently it down regulates mitochondrial respiration through up-regulation of pyruvate dehydrogenase kinase 1 (PDK1) (see recent reviews [21] and [22]). However, several tumours have been reported to display high HIF-1 activity even in normoxic condition, now referred to as pseudohypoxia [23], [24] and [25]. In addition, not only solid tumours present a changed metabolism with respect to matched normal tissues, hematological cell malignancies also are characterized by peculiar metabolisms, in which changes of mitochondrial functions are significant [26],[27] and [28], therefore indicating a pivotal role of mitochondria in tumours independently from oxygen availability.
Collectively, actual data show a great heterogeneity of metabolism changes in cancer cells, therefore comprehensive cellular and molecular basis for the association of mitochondrial bioenergetics with tumours is still undefined, despite the numerous studies carried out. This review briefly revisits the data which are accumulating to account for this association and highlights the more recent advances, particularly focusing on the metabolic and structural changes of mitochondria.
Mitochondria-related metabolic changes of cancer cells
Accumulating evidence indicate that many cancer cells have an higher glucose consumption under normoxic conditions with respect to normal differentiated cells, the so-called “aerobic glycolysis” (Warburg effect), a phenomenon that is currently exploited to detect and diagnose staging of solid and even hematological malignancies [27]. Since the initial publication by Otto Warburg over half a century ago [29], an enormous amount of studies on many different tumours have been carried out to explain the molecular basis of the Warburg effect. Although the regulatory mechanisms underlying aerobic and glycolytic pathways of energy production are complex, making the prediction of specific cellular responses rather difficult, the actual data seem to support the view that in order to favour the production of biomass, proliferating cells are commonly prone to satisfy the energy requirement utilizing substrates other than the complete oxidation of glucose (to CO2 and H2O). More precisely, only part (40 to 75%, according to [30]) of the cells need of ATP is obtained through the scarcely efficient catabolism of glucose to pyruvate/lactate in the cytoplasm and the rest of the ATP need is synthesized in the mitochondria through both the tricarboxylic acid (TCA) cycle (one ATP produced each acetyl moiety oxidized) and the associated oxidative phosphorylation that regenerates nicotinamide- and flavin-dinucleotides in their oxidized state(NAD+ and FAD). This might be due to the substrate availability as it was shown in HeLa cells, where replacing glucose with galactose/glutamine in the culture medium induced increased expression of oxphos proteins, suggesting an enhanced energy production from glutamine [31]. As a conclusion the authors proposed that energy substrate can modulate mitochondrial oxidative capacity in cancer cells. A direct evidence of this phenomenon was provided a few years later in glioblastoma cells, in which it was demonstrated that the TCA cycle flux is significantly sustained by anaplerotic alfa-ketoglutarate produced from glutamine and by acetyl moieties derived from the pyruvate dehydrogenase reaction where pyruvate may have an origin other than glucose [32]. The above changes are the result of genetic alteration and environmental conditions that induce many cancer cells to change their metabolism in order to synthesize molecules necessary to survive, grow and proliferate, including ribose and NADPH to synthesize nucleotides, and glycerol-3 phosphate to produce phospholipids. The synthesis of the latter molecules requires major amount of acetyl moieties that are derived from beta-oxidation of fatty acids and/or from cytosolic citrate (citrate lyase reaction) and/or from the pyruvate dehydrogenase reaction. Given the important requirement for NADPH in macromolecular synthesis and redox control, NADPH production in cancer cells besides being produced through the phosphate pentose shunt, may be significantly sustained by cytosolic isocitrate dehydrogenases and by the malic enzyme (see Ref. [33] for a recent review). Therefore, many cancer cells tend to have reduced oxphos in the mitochondria due to either or both reduced flux within the tricarboxylic acid cycle and/or respiration (Fig. 1). The latter being also caused by reduced oxygen availability, a typical condition of solid tumors, that will be discussed below.

Schematic illustration of mitochondrial metabolism and metabolic reprogramming in tumours gr1
http://ars.els-cdn.com/content/image/1-s2.0-S0005272810007024-gr1.jpg
Fig. 1. Schematic illustration of mitochondrial metabolism and metabolic reprogramming in tumours. In normal cells (A), glucose is phosphorylated by HK-I, then the major part is degraded via glycolysis to pyruvate, which prevalently enters the mitochondria, it is decarboxylated and oxidized by PDH to acetyl-coenzyme A, which enters the TCA cycle where the two carbons are completely oxidized to CO2 whereas hydrogen atoms reduce NAD+ and FAD, which feed the respiratory chain (turquoise). Minor part of glycolytic G-6P is diverted to produce ribose 5-phosphate (R-5P) and NADPH, that will be used to synthesize nucleotides, whereas triose phosphates in minimal part will be used to synthesize lipids and phospholipids with the contribution of NADPH and acetyl-coenzyme A. Amino acids, including glutamine (Gln) will follow the physiological turnover of the proteins, in minimal part will be used to synthesize the nucleotides bases, and the excess after deamination will be used to produce energy. In the mitochondria inner membranes are located the respiratory chain complexes and the ATP synthase (turquoise), which phosphorylates ADP releasing ATP, that in turn is carried to the cytosol by ANT (green) in exchange for ADP. About 1–2% O2 uptaken by the mitochondria is reduced to superoxide anion radical and ROS. In cancer cells (B), where anabolism is enhanced, glucose is mostly phosphorylated by HK-II (red), which is up-regulated and has an easy access to ATP being more strictly bound to the mitochondria. Its product, G-6P, is only in part oxidized to pyruvate. This, in turn, is mostly reduced to lactate being both LDH and PDH kinase up-regulated. A significant part of G-6P is used to synthesize nucleotides that also require amino acids and glutamine. Citrate in part is diverted from the TCA cycle to the cytosol, where it is a substrate of citrate lyase, which supplies acetyl-coenzyme A for lipid and phospholipid synthesis that also requires NADPH. As indicated, ROS levels in many cancer cells increase.
Of particular relevance in the study of the metabolic changes occurring in cancer cells, is the role of hexokinase II. This enzyme is greatly up-regulated in many tumours being its gene promoter sensitive to typical tumour markers such as HIF-1 and P53 [30]. It plays a pivotal role in both the bioenergetic metabolism and the biosynthesis of required molecules for cancer cells proliferation. Hexokinase II phosphorylates glucose using ATP synthesized by the mitochondrial oxphos and it releases the product ADP in close proximity of the adenine nucleotide translocator (ANT) to favour ATP re-synthesis within the matrix (Fig. 1). Obviously, the expression level, the location, the substrate affinity, and the kinetics of the enzyme are crucial to the balancing of the glucose fate, to either allowing intermediates of the glucose oxidation pathway towards required metabolites for tumour growth or coupling cytoplasmic glycolysis with further oxidation of pyruvate through the TCA cycle, that is strictly linked to oxphos. This might be possible if the mitochondrial-bound hexokinase activity is reduced and/or if it limits ADP availability to the mitochondrial matrix, to inhibit the TCA cycle and oxphos. However, the mechanism is still elusive, although it has been shown that elevated oncogene kinase signaling favours the binding of the enzyme to the voltage-dependent anion channel (VDAC) by AKT-dependent phosphorylation [34] (Fig. 2). VDAC is a protein complex of the outer mitochondrial membrane which is in close proximity of ANT that exchanges ADP for ATP through the inner mitochondrial membrane [35]. However, the enzyme may also be detached from the mitochondrial membrane, to be redistributed to the cytosol, through the catalytic action of sirtuin-3 that deacylates cyclophilin D, a protein of the inner mitochondrial membrane required for binding hexokinase II to VDAC (Fig. 2) [36]. Removing hexokinase from the mitochondrial membrane has also another important consequence in cancer cells: whatever mechanism its removal activates, apoptosis is induced [37] and [38]. These observations indicate hexokinase II as an important tool used by cancer cells to survive and proliferate under even adverse conditions, including hypoxia, but it may result an interesting target to hit in order to induce cells cytotoxicity. Indeed, a stable RNA interference of hexokinase II gene showed enhanced apoptosis indices and inhibited growth of human colon cancer cells; in accordance in vivo experiments indicated a decreased tumour growth [39].

Schematic illustration of the main mitochondrial changes frequently occurring in cancer cells gr2
http://ars.els-cdn.com/content/image/1-s2.0-S0005272810007024-gr2.jpg
Fig. 2. Schematic illustration of the main mitochondrial changes frequently occurring in cancer cells. The reprogramming of mitochondrial metabolism in many cancer cells comprises reduced pyruvate oxidation by PDH followed by the TCA cycle, increased anaplerotic feeding of the same cycle, mostly from Gln, whose entry in the mitochondrial matrix is facilitated by UCP2 up-regulation. This increases also the free fatty acids uptake by mitochondria, therefore β-oxidation is pushed to produce acetyl-coenzyme A, whose oxidation contributes to ATP production. In cancer cells many signals can converge on the mitochondrion to regulate the mitochondrial membrane permeability, which may respond by elevating the MPTP (PTP) threshold, with consequent enhancement of apoptosis resistance. ROS belong to this class of molecules since it can enhance Bcl2 and may induce DNA mutations. Dotted lines indicate regulation; solid lines indicate reaction(s).
Respiratory chain complexes and ATP synthase
Beyond transcriptional control of metabolic enzyme expression by oncogenes and tumour suppressors, it is becoming evident that environmental conditions affect the mitochondrial energy metabolism, and many studies in the last decade indicate that mitochondrial dysfunction is one of the more recurrent features of cancer cells, as reported at microscopic, molecular, biochemical, and genetic level [7], [40] and [41]. Although cancer cells under several conditions, including hypoxia, oncogene activation, and mDNA mutation, may substantially differ in their ability to use oxygen, only few reports have been able to identify a strict association between metabolic changes and mitochondrial complexes composition and activity. In renal oncocytomas [42] and in lung epidermoid carcinoma [43], the NADH dehydrogenase activity and protein content of Complex I were found to be strongly depressed; subsequently, in a thyroid oncocytoma cell line [44] a similar decrease of Complex I activity was ascribed to a specific mutation in the ND1 gene of mitochondrial DNA. However, among the respiratory chain complexes, significant decrease of the only Complex I content and activity was found in K-ras transformed cells in our laboratory [45], and could not be ascribed to mtDNA mutations, but rather, based on microarray analysis of oxphos genes, we proposed that a combination of genetic (low transcription of some genes) and biochemical events (assembly factors deficiency, disorganization of structured supercomplexes, and ROS-induced structural damage) might cause the Complex I defects.
In some hereditary tumours (renal cell carcinomas) a correlation has been identified between mitochondrial dysfunctions and content of oxphos complexes [46]. For instance, the low content of ATP synthase, often observed in clear cell type renal cell carcinomas and in chromophilic tumours, seems to indicate that the mitochondria are in an inefficient structural and functional state [46]. However, it cannot be excluded that, in some cases, the structural alteration of ATP synthase may offer a functional advantage to cells exhibiting a deficient respiratory chain for instance to preserve the transmembrane electrical potential (Δψm) [47]. It is likely that low levels of ATP synthases may play a significant role in cancer cell metabolism since it has been reported that in tumours from many different tissues, carcinogenesis specifically affects the expression of F1-ATPase β subunit, suggesting alterations in the mechanisms that control mitochondrial differentiation (see for a detailed review [48]). What it seems intriguing is the overexpression of the inhibitor protein, IF1, reported in hepatocellular carcinomas [49] and [50] and in Yoshida sarcoma [51]. Normally, this protein binds to the F1 domain of the ATP synthase inhibiting its activity [52], and it is believed to limit the ATP hydrolysis occurring in the mitochondria of hypoxic cells, avoiding ATP depletion and maintaining Δψm to a level capable to avoid the induction of cell death [5]. But why is its expression in cancer cells enhanced in front of a reduced F1-ATPase β subunit?
The first possibility is that IF1 has a function similar to that in normal cells, simply avoiding excessive ATP hydrolysis therefore limiting Δψm enhancement, but in cancer cells this is unlikely due to both the reduced level of ATP synthase [46] and the high affinity of IF1 for the enzyme. A second possibility might be that cancer cells need strongly reduced oxphos to adapt their metabolism and acquire a selective growth advantage under adverse environmental conditions such as hypoxia, as it has been experimentally shown [53]. Finally, IF1 might contribute to the saving of the inner mitochondrial membrane structure since it has been reported its capability to stabilize oligomers of ATP synthase, which in turn can determine cristae shapes [54]. In this regard, recent experimental evidence has shed some light on a critical role of mitochondrial morphology in the control of important mitochondrial functions including apoptosis [55] and oxidative phosphorylation [56]. In particular, dysregulated mitochondrial fusion and fission events can now be regarded as playing a role in cancer onset and progression [57]. Accordingly, mitochondria-shaping proteins seem to be an appealing target to modulate the mitochondrial phase of apoptosis in cancer cells. In fact, several cancer tissues: breast, head-and-neck, liver, ovarian, pancreatic, prostate, renal, skin, and testis, showed a pattern suggestive of enlarged mitochondria resulting from atypical fusion [58].
Mitochondrial membrane potential in cancer cells
Critical mitochondrial functions, including ATP synthesis, ion homeostasis, metabolites transport, ROS production, and cell death are highly dependent on the electrochemical transmembrane potential, a physico-chemical parameter consisting of two components, the major of which being the transmembrane electrical potential (Δψm) (see for a recent review [59]). In normal cells, under normoxic conditions, Δψm is build up by the respiratory chain and is mainly used to drive ATP synthesis, whereas in anoxia or severe hypoxia it is generated by the hydrolytic activity of the ATP synthase complex and by the electrogenic transport of ATP in exchange for ADP from the cytosol to the matrix, operated by the adenine nucleotide translocator [17]. Dissipation of the mitochondrial membrane potential (proton leak) causes uncoupling of the respiratory chain electron transport from ADP phosphorylation by the ATP synthase complex. Proton leak functions as a regulator of mitochondrial ROS production and its modulation by uncoupling proteins may be involved in pathophysiology, including tumours. In addition, Δψm plays a role in the control of the mitochondrial permeability transition pore (MPTP), that might be critical in determining reduced sensitivity to stress stimuli that were described in neoplastic transformation [60], implying that dysregulation of pore opening might be a strategy used by tumour cells to escape death. Indeed, it has recently been reported that ERK is constitutively activated in the mitochondria of several cancer cell types, where it inhibits glycogen synthase kinase-3-dependent phosphorylation of CyP-D and renders these cells more refractory to pore opening and to the ensuing cell death [61].
It is worth mentioning a second protein of the inner mitochondrial membrane, the uncoupling protein, UCP2 (Fig. 2), which contributes to regulate Δψm. Indeed, recent observations evidenced its overexpression in various chemoresistent cancer cell lines and in primary human colon cancer. This overexpression was associated with an increased apoptotic threshold [62]. Moreover, UCP2 has been reported to be involved in metabolic reprogramming of cells, and appeared necessary for efficient oxidation of glutamine [63]. On the whole, these results led to hypothesize an important role of the uncoupling protein in the molecular mechanism at the basis of the Warburg effect, that suppose a reduced Δψm-dependent entry of pyruvate into the mitochondria accompanied by enhanced fatty acid oxidation and high oxygen consumption (see for a review [64]). However, in breast cancer Sastre-Serra et al. [65] suggested that estrogens by down-regulating UCPs, increase mitochondrial Δψm, that in turn enhances ROS production, therefore increasing tumorigenicity. While the two above points of view concur to support increased tumorigenicity, the mechanisms at the basis of the phenomenon appear on the opposite of the other. Therefore, although promising for the multiplicity of metabolic effects in which UCPs play a role (see for a recent review [66]), at present it seems that much more work is needed to clarify how UCPs are related to cancer.
A novel intriguing hypothesis has recently been put forward regarding effectors of mitochondrial function in tumours. Wegrzyn J et al. [67] demonstrated the location of the transcription factor STAT3 within the mitochondria and its capability to modulate respiration by regulating the activity of Complexes I and II, and Gough et al. [68] reported that human ras oncoproteins depend on mitochondrial STAT3 for full transforming potential, and that cancer cells expressing STAT3 have increased both Δψm and lactate dehydrogenase level, typical hallmarks of malignant transformation (Fig. 2). A similar increase of Δψm was recently demonstrated in K-ras transformed fibroblasts [45]. In this study, the increased Δψm was somehow unexpected since the cells had shown a substantial decrease of NADH-linked substrate respiration rate due to a compatible reduced Complex I activity with respect to normal fibroblasts. The authors associated the reduced activity of the enzyme to its peculiar low level in the extract of the cells that was confirmed by oxphos nuclear gene expression analysis. This significant and peculiar reduction of Complex I activity relative to other respiratory chain complexes, is recurrent in a number of cancer cells of different origin [42], [44], [45] and [69]. Significantly, all those studies evidenced an overproduction of ROS in cancer cells, which was consistent with the mechanisms proposed by Lenaz et al. [70] who suggested that whatever factor (i.e. genetic or environmental) initiate the pathway, if Complex I is altered, it does not associate with Complex III in supercomplexes, consequently it does not channel correctly electrons from NADH through coenzyme Q to Complex III redox centres, determining ROS overproduction. This, in turn, enhances respiratory chain complexes alteration resulting in further ROS production, thus establishing a vicious cycle of oxidative stress and energy depletion, which can contribute to further damaging cells pathways and structures with consequent tumour progression and metastasis [69].
Hypoxia and oxidative phosphorylation in cancer cells
Tumour cells experience an extensive heterogeneity of oxygen levels, from normoxia (around 2–4% oxygen tension), through hypoxia, to anoxia (< 0.1% oxygen tension). The growth of tumours beyond a critical mass > 1–2 mm3 is dependent on adequate blood supply to receive nutrients and oxygen by diffusion [88]. Cells adjacent to capillaries were found to exhibit a mean oxygen concentration of 2%, therefore, beyond this distance, hypoxia occurs: indeed, cells located at 200 μm displayed a mean oxygen concentration of 0.2%, which is a condition of severe hypoxia [89]. Oxygen shortage results in hypoxia-dependent inhibition of mitochondrial activity, mostly mediated by the hypoxia-inducible factor 1 (HIF-1)[90] and [91]. More precisely, hypoxia affects structure, dynamics, and function of the mitochondria, and in particular it has a significant inhibitory effect on the oxidative phosphorylation machinery, which is the main energy supplier of cells (see Ref. [22] for a recent review). The activation of HIF-1 occurs in the cytoplasmic region of the cell, but the contribution of mitochondria is critical being both cells oxygen sensors and suppliers of effectors of HIF-1α prolyl hydroxylase like α-ketoglutarate and probably ROS, that inhibit HIF-1α removal [92]. As reported above, mitochondria can also promote HIF-1α stabilization if the TCA flux is severely inhibited with release of intermediate molecules like succinate and fumarate into the cytosol. On the other hand, HIF-1 can modulate mitochondrial functions through different mechanisms, that besides metabolic reprogramming [7], [22], [93] and [94], include alteration of mitochondrial structure and dynamics[58], induction of microRNA-210 that decreases the cytochrome c oxidase (COX) activity by inhibiting the gene expression of the assembly protein COX10 [95], that also increases ROS generation. Moreover, these stress conditions could induce the anti-apoptotic protein Bcl-2, which has also been reported to regulate COX activity and mitochondrial respiration [96] conferring resistance to cells death in tumours (Fig. 2). This effect might be further enhanced upon severe hypoxia conditions, since COX is also inhibited by NO, the product of activated nitric oxide synthases [97].
The reduced respiration rate occurring in hypoxia favours the release of ROS also by Complex III, which contribute to HIF stabilization and induction of Bcl-2 [98]. In addition, hypoxia reduces oxphos by inhibiting the ATP synthase complex through its natural protein inhibitor IF1 (discussed in a previous section), which contributes to the enhancement of the “aerobic glycolysis”, all signatures of cancer transformation.
The observations reported to date indicate that cancer cells exhibit large varieties of metabolic changes which are associated with alterations in the mitochondrial structure, dynamics and function, and with tumour growth and survival. On one hand, mitochondria can regulate tumour growth through modulation of the TCA cycle and oxidative phosphorylation. The altered TCA cycle provides intermediates for both macromolecular biosynthesis and regulation of transcription factors such as HIF, and it allows cytosolic reductive power enhancement. Oxphos provides significant amounts of ATP which varies among tumour types. On the other hand, mitochondria are crucial in controlling redox homeostasis in the cell, inducing them to be either resistant or sensitive to apoptosis. All these reasons locate mitochondria at central stage to understanding the molecular basis of tumour growth and to seeking for novel therapeutical approaches.
Due to the complexity and variability of mitochondrial roles in cancer, careful evaluation of mitochondrial function in each cancer type is crucial. Deeper and more integrated knowledge of mitochondrial mechanisms and cancer-specific mitochondrial modulating means are expected for reducing tumorigenicity and/or improving anticancer drugs efficacy at the mitochondrial level. Although the great variability of biochemical changes found in tumour mitochondria, some highlighted peculiarities such as reduced TCA cycle flux, reduced oxphos rate, and reduced Complex I activity with respect to tissue specific normal counterparts are more frequent. In addition, deeper examination of supramolecular organization of the complexes in the inner mitochondrial membrane has to be considered in relation to oxphos dysfunction.
2.1.1.6 Oxidation–reduction states of NADH in vivo: From animals to clinical use
Mayevsky A, Chance B.
Mitochondrion. 2007 Sep; 7(5):330-9
http://dx.doi.org:/10.1016/j.mito.2007.05.001
Mitochondrial dysfunction is part of many pathological states in patients, such as sepsis or stroke. Presently, the monitoring of mitochondrial function in patients is extremely rare, even though NADH redox state is routinely measured in experimental animals. In this article, we describe the scientific backgrounds and practical use of mitochondrial NADH fluorescence measurement that was applied to patients in the past few years. In addition to NADH, we optically measured the microcirculatory blood flow and volume, as well as HbO(2) oxygenation, from the same tissue area. The four detected parameters provide real time data on tissue viability, which is critical for patients monitoring.
(very important article)
2.1.1.7 Mitochondria in cancer. Not just innocent bystanders
Frezza C, and Gottlieb E
Sem Cancer Biol 2009; 19: 4-11
http://dx.doi.org:/10.1016/j.semcancer.2008.11.008
The first half of the 20th century produced substantial breakthroughs in bioenergetics and mitochondria research. During that time, Otto Warburg observed abnormally high glycolysis and lactate production in oxygenated cancer cells, leading him to suggest that defects in mitochondrial functions are at the heart of malignant cell transformation. Warburg’s hypothesis profoundly influenced the present perception of cancer metabolism, positioning what is termed aerobic glycolysis in the mainstream of clinical oncology. While some of his ideas stood the test of time, they also frequently generated misconceptions regarding the biochemical mechanisms of cell transformation. This review examines experimental evidence which supports or refutes the Warburg effect and discusses the possible advantages conferred on cancer cells by ‘metabolic transformation’.
Fig.1. Mitochondria as a crossroad for catabolic and anabolic pathways in normal and cancer cells. Glucose and glutamine are important carbon sources which are metabolized in cells for the generation of energy and anabolic precursors. The pathways discussed in the text are illustrated and colour coded: red, glycolysis; white, TCA cycle; pink, non-essential amino acids synthesis; orange, pentose phosphate pathway and nucleotide synthesis; green, fatty acid and lipid synthesis; blue, pyruvate oxidation in the mitochondria; brown, glutaminolysis; black, malic enzyme reaction. Solid arrows indicate a single step reaction;dashed-dotted arrows indicate transport across membranes and dotted arrows indicate multi-step reactions. Abbreviations: HK, hexokinase; AcCoA, acetyl co-enzyme A; OAA, oxaloacetate; αKG, α-ketoglutarate.
http://ars.els-cdn.com/content/image/1-s2.0-S1044579X08001041-gr1.sml
Fig. 2. Mitochondria as a target for multiple metabolic transformation events. Principal metabolic perturbations of cancer cells are induced by genetic reprogramming and environmental changes. The activation of Akt and MYC oncogenes and the loss of p53 tumor suppressor gene are among the most frequent events in cancer. Furthermore, all solid tumors are exposed to oxidative stress and hypoxia hence to HIF activation.These frequent changes in cancer cells trigger a dramatic metabolic shift from oxidative phosphorylation to glycolysis. In addition, direct genetic lesions of mtDNA or of nuclear encoded mitochondrial enzyme (SDH or FH) can directly abrogate oxidative phosphorylation in cancer. 3- D structures of the respiratory complexes in the scheme were retrieved from Protein DataBank (PDB:www.rcsb.org) except for complex I which was retrieved from [87]. PDB codes are as follow: SDH (II), 1 LOV; complex III (III), 1BGY; COX (IV), 1OCC; ATP synthase (V), 1QO1.
http://ars.els-cdn.com/content/image/1-s2.0-S1044579X08001041-gr2.sml
Fig. 3. The physiological roles of SDH in the TCA cycle and the ETC and its potential roles in cancer. (A) Ribbon diagram of SDH structure (PBD code: 1LOV). The catalytic subunits: the flavoprotein (SDHA) and the iron-sulphur protein (SDHB) are depicted in red and yellow, respectively, and the membrane anchors and ubiquinone binding proteins SDHC and SDHD are depicted in cyan and green, respectively. (B) Other than being a TCA enzyme, SDH is an additional entry point to the ETC (most electrons are donated from NADH to complex I—not shown in this diagram). The electron flow in and out of complex II and III is depicted by the yellow arrows. During succinate oxidation to fumarate by SDHA, a two-electron reduction of FAD to FADH2 occurs. Electrons are transferred through their on–Sulphur centres on SDHB to ubiquinone (Q) bound to SDHC and SDHD in the inner mitochondrial membrane (IMM), reducing it to ubiquinol (QH2). Ubiquinol transfers its electrons through complex III, in a mechanism named the Q cycle, to cytochrome c (PDB: 1CXA). Electrons then flow from cytochrome c to COX where the final four-electron reduction of molecular oxygen to water occurs (not shown in this diagram). Complex III is the best characterized site of ROS production in the ETC, where a single electron reduction of oxygen to superoxide can occur (red arrow). It was proposed that obstructing electron flow within complex II might support a single electron reduction of oxygen at the FAD site (red arrow). Superoxide is dismutated to hydrogen peroxide which can then leave the mitochondria and inhibit PHD in the cytosol, leading to HIF[1] stabilization. Succinate or fumarate, which accumulate in SDH- or FH-deficient tumors, can also leave the mitochondria and inhibit PHD activity in the cytosol. The red dotted line represents the outer mitochondrial membrane (OMM).
2.1.1.8 Mitochondria in cancer cells: what is so special about them?
Gogvadze V, Orrenius S, Zhivotovsky B.
Trends Cell Biol. 2008 Apr; 18(4):165-73
http://dx.doi.org:/10.1016/j.tcb.2008.01.006
The past decade has revealed a new role for the mitochondria in cell metabolism–regulation of cell death pathways. Considering that most tumor cells are resistant to apoptosis, one might question whether such resistance is related to the particular properties of mitochondria in cancer cells that are distinct from those of mitochondria in non-malignant cells. This scenario was originally suggested by Otto Warburg, who put forward the hypothesis that a decrease in mitochondrial energy metabolism might lead to development of cancer. This review is devoted to the analysis of mitochondrial function in cancer cells, including the mechanisms underlying the upregulation of glycolysis, and how intervention with cellular bioenergetic pathways might make tumor cells more susceptible to anticancer treatment and induction of apoptosis.

Glucose utilization pathway
http://www.cell.com/cms/attachment/591821/4554537/gr1.sml
Figure 1. Glucose utilization pathway. When glucose enters the cell, it is phosphorylated by hexokinase to glucose-6-phosphate, which is further metabolized by glycolysis to pyruvate. Under aerobic conditions, most of the pyruvate in non-malignant cells enters the mitochondria, with only a small amount being metabolized to lactic acid. In mitochondria, pyruvate dehydrogenase (PDH) converts pyruvate into acetyl-CoA, which feeds into the Krebs cycle. Oxidation of Krebs cycle substrates by the mitochondrial respiratory chain builds up the mitochondrial membrane potential (Dc) – the driving force for ATP synthesis. By contrast, in tumor cells, the oxidative (mitochondrial) pathway of glucose utilization is suppressed, and most of the pyruvate is converted into lactate. Thus, the fate of pyruvate is determined by the relative activities of two key enzymes – lactate dehydrogenase and pyruvate dehydrogenase.

Mechanisms of mitochondrial silencing in tumors
http://www.cell.com/cms/attachment/591821/4554539/gr2.sml
Figure 2. Mechanisms of mitochondrial silencing in tumors. The activity of PDH is regulated by pyruvate dehydrogenase kinase 1 (PDK1), the enzyme that phosphorylates and inactivates pyruvate dehydrogenase. HIF-1 inactivates PDH through PDK1 induction, resulting in suppression of the Krebs cycle and mitochondrial respiration. In addition, HIF-1 stimulates expression of the lactate dehydrogenase A gene, facilitating conversion of pyruvate into lactate by lactate dehydrogenase (LDH). Mutation of p53 can suppress the mitochondrial respiratory activity through downregulation of the Synthesis of Cytochrome c Oxidase 2 (SCO2) gene, the product of which is required for the assembly of cytochrome c oxidase (COX) of the mitochondrial respiratory chain. Thus, mutation of p53 can suppress mitochondrial respiration and shift cellular energy metabolism towards glycolysis.
Production of ROS by mitochondria
In any cell, the majority of ROS are by-products of mitochondrial respiration. Approximately 2% of the molecular oxygen consumed during respiration is converted into the superoxide anion radical, the precursor of most ROS. Normally, a four-electron reduction of O2, resulting in the production of two molecules of water, is catalyzed by complex IV (COX) of the mitochondrial respiratory chain. However, the electron transport chain contains several redox centers (e.g. in complex I and III) that can leak electrons to molecular oxygen, serving as the primary source of superoxide production in most tissues. The one-electron reduction of oxygen is thermodynamically favorable for most mitochondrial oxidoreductases. Superoxide-producing sites and enzymes were recently analyzed in detail in a comprehensive review [87]. ROS, if not detoxified, oxidize cellular proteins, lipids, and nucleic acids and, by doing so, cause cell dysfunction or death. A cascade of water and lipid soluble antioxidants and antioxidant enzymes suppresses the harmful ROS activity. An imbalance that favors the production of ROS over antioxidant defenses, defined as oxidative stress, is implicated in a wide variety of pathologies, including malignant diseases. It should be mentioned that mitochondria are not only a major source of ROS but also a sensitive target for the damaging effects of oxygen radicals. ROS produced by mitochondria can oxidize proteins and induce lipid peroxidation, compromising the barrier properties of biological membranes. One of the targets of ROS is mitochondrial DNA (mtDNA), which encodes several proteins essential for the function of the mitochondrial respiratory chain and, hence, for ATP synthesis by oxidative phosphorylation. mtDNA, therefore, represents a crucial cellular target for oxidative damage, which might lead to lethal cell injury through the loss of electron transport and ATP generation. mtDNA is especially susceptible to attack by ROS, owing to its close proximity to the electron transport chain, the major locus for free-radical production, and the lack of protective histones. For example, mitochondrially generated ROS can trigger the formation of 8-hydroxydeoxyguanosine as a result of oxidative DNA damage; the level of oxidatively modified bases in mtDNA is 10- to 20-fold higher than that in nuclear DNA. Oxidative damage induced by ROS is probably a major source of mitochondrial genomic instability leading to respiratory dysfunction.
Figure 3. Stabilization of mitochondria against OMM permeabilization in tumor cells. OMM permeabilization is a key event in apoptotic cell death. (a) During apoptosis, tBid-mediated oligomerization of Bax causes OMM permeabilization and release of cytochrome c (red circles). (b) Bcl-2 protein binds Bax and prevents its oligomerization. A shift in the balance between pro- apoptotic and antiapoptotic proteins in cancer cells, in favor of the latter, reduces the availability of Bax and prevents OMM permeabilization. (c) Upregulation of hexokinase in tumors and its binding to VDAC in the OMM not only facilitates glucose phosphorylation using mitochondrially generated ATP but keeps VDAC in the open state, preventing its interaction with tBid (de).
http://www.cell.com/cms/attachment/591821/4554543/gr4.sml
Figure 4. Shifting metabolism from glycolysis to glucose oxidation. Utilization of pyruvate is controlled by the relative activities of two enzymes, PDH and LDH. In cancer cells, PDH activity is suppressed by PDH kinase-mediated phosphorylation, and, therefore, instead of entering the Krebs cycle, pyruvate is converted into lactate. Several attempts have been made to redirect pyruvate towards oxidation in the mitochondria. Thus, inhibition of PDK1 by dichloroacetate might stimulate the activity of PDH and, hence, direct pyruvate to the mitochondria. A similar effect can be achieved by inhibition of LDH by oxamate. Overall, suppression of PDK1 and LDH activities will stimulate mitochondrial ATP production and might be lethal to tumor cells, even if these inhibitors are used at non-toxic doses. In addition, stimulation of mitochondrial function, for example though overexpression of mitochondrial frataxin, a protein associated with Friedreich ataxia, was shown to stimulate oxidative metabolism and inhibited growth in several cancer cell lines [86].
2.1.1.9 Glucose avidity of carcinomas
Ortega AD1, Sánchez-Aragó M, Giner-Sánchez D, Sánchez-Cenizo L, et al.
Cancer Letters 276 (2009) 125–135
http://dx.doi.org:/10.1016/j.canlet.2008.08.007
The cancer cell phenotype has been summarized in six hallmarks [D. Hanahan, R.A. Weinberg, The hallmarks of cancer, Cell 100 (1) (2000) 57-70]. Following the conceptual trait established in that review towards the comprehension of cancer, herein we summarize the basis of an underlying principle that is fulfilled by cancer cells and tumors: its avidity for glucose. Our purpose is to push forward that the metabolic reprogramming that operates in the cancer cell represents a seventh hallmark of the phenotype that offers a vast array of possibilities for the future treatment of the disease. We summarize the metabolic pathways that extract matter and energy from glucose, paying special attention to the concerted regulation of these pathways by the ATP mass-action ratio. The molecular and functional evidences that support the high glucose uptake and the “abnormal” aerobic glycolysis of the carcinomas are detailed discussing also the role that some oncogenes and tumor suppressors have in these pathways. We overview past and present evidences that sustain that mitochondria of the cancer cell are impaired, supporting the original Warburg’s formulation that ascribed the high glucose uptake of cancer cells to a defective mitochondria. A simple proteomic approach designed to assess the metabolic phenotype of cancer, i.e., its bioenergetic signature, molecularly and functionally supports Warburg’s hypothesis. Furthermore, we discuss the clinical utility that the bioenergetic signature might provide. Glycolysis is presented as the “selfish” pathway used for cellular proliferation, providing both the metabolic precursors and the energy required for biosynthetic purposes, in the context of a plethora of substrates. The glucose avidity of carcinomas is thus presented as the result of both the installment of glycolysis for cellular proliferation and of the impairment of mitochondrial activity in the cancer cell. At the end, the repression of mitochondrial activity affords the cancer cell with a cell-death resistant phenotype making them prone to malignant growth.
Fig. 1. Pathways of glucose metabolism. The model shows some of the relevant aspects of the metabolism of glucose. After entering the cell by specific transporters, glucose can be (i) catabolized by the pentose phosphate pathway (PPP) to obtain reducing power in the form of NADPH, (ii) used for the synthesis of carbohydrates or (iii) utilized by glycolysis to generate pyruvate and other metabolic intermediates that could be used in different anabolic processes (blue rectangles). In the cytoplasm, the generated pyruvate can be reduced to lactate and further exported from the cell or oxidized in the mitochondria by pyruvate dehydrogenase to generate acetyl-CoA, which is condensed with oxaloacetate in the tricarboxylic acid cycle (TCA cycle). The operation of the TCA cycle completes the oxidation of mitochondrial pyruvate. Different pathways that drain intermediates of the TCA cycle (oxaloacetate, succinyl-CoA, a-ketoglutarate and citrate) for biosynthetic purposes (blue rectangles) are represented. The transfer of electrons obtained in biological oxidations (NADH/FADH2) to molecular oxygen by respiratory complexes of the inner mitochondrial membrane (in green) is depicted by yellow lines. The utilization of the proton gradient generated by respiration for the synthesis of ATP by the H+-ATP synthase (in orange) in oxidative phosphorylation (OXPHOS) is also indicated. The incorporation of glutamine carbon skeletons into the TCA cycle is shown. The utilization of NADPH in anabolic pathways is also indicated.
Fig. 3. Fluxes of matter and energy in differentiated, proliferating and cancer cells. In differentiated cells, the flux of glycolysis is low because the requirement for precursors for anabolic purposes is low and there is a high energy yield by the oxidation of pyruvate in mitochondrial oxidative phosphorylation (OXPHOS). In this situation, mitochondrial activity produces large amounts of ROS that are normally quenched by the cellular antioxidant defense. In proliferating and cancer cells, there is a high demand of glucose to provide metabolic precursors for the biosynthesis of the macromolecules of daughter cells and because most of the energy required for anabolic purposes derives from non-efficient non-respiratory modes (glycolysis, pentose phosphate pathway) of energy generation. Limiting mitochondrial activity in these situations ensures less ROS production and their further downstream consequences. In addition, cancer cells have less overall mitochondrial complement or activity than normal cells by repressing the biogenesis of mitochondria.
Fig. 2. Genetic alterations underlying the glycolytic phenotype of cancer cells. The diagram represents the impact of gain-of-function mutations in oncogenes (ovals) and loss-of-function mutations in tumor suppressors (rectangles) in glycolysis and in the mitochondrial utilization of pyruvate in cancer cells. Hypoxia (low O2) induces the stabilization of HIF-1, which promotes transcriptional activation of the glucose transporter, glycolytic genes and PDK1. The expression of PDK1 results in the inactivation of pyruvate dehydrogenase and thus in a decreased oxidation of pyruvate in the TCA cycle concurrent to its enhanced cytoplasmic reduction to lactate by lactate dehydrogenase (LDHA). In addition, HIF1a reciprocally regulates the expression of two isoforms of the cytochrome c oxidase complex. The oncogen myc also supports an enhanced glycolytic pathway by transcriptional activation of glycolytic genes. High levels of c-myc could also promote the production of reactive oxygen species (ROS) that could damage nuclear (nDNA) and mitochondrial (mtDNA). The loss-of-function of the tumor suppressor p53 promotes an enhanced glycolytic phenotype by the repression of TIGAR expression. Likewise, loss-of-function of p53 diminished the expression of SCO2, a gene required for the appropriate assembly of cytochrome c oxidase, and thus limits the activity of mitochondria in the cancer cell.
Discussion:


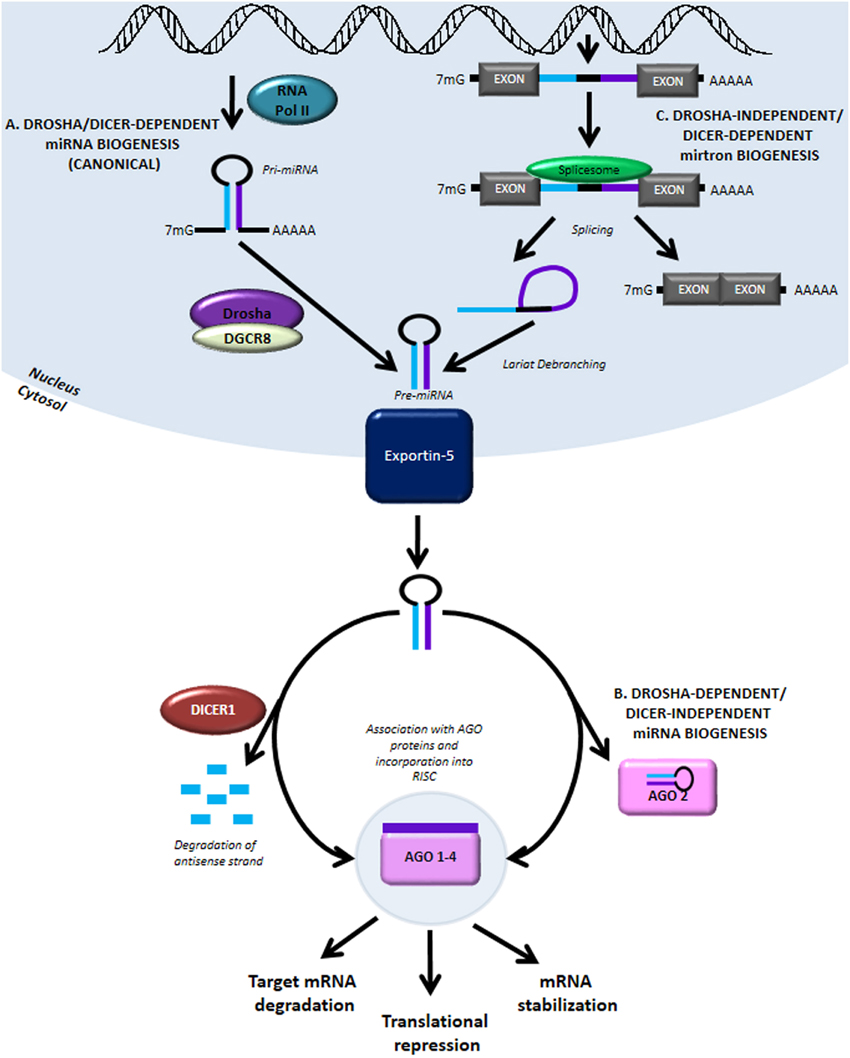
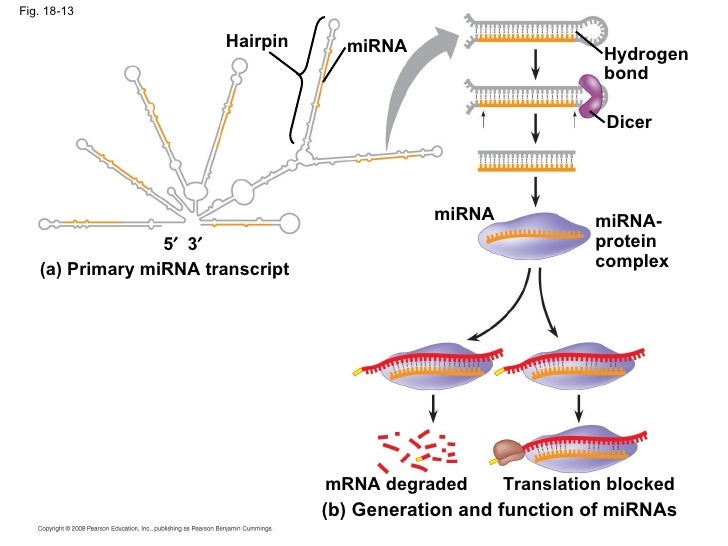
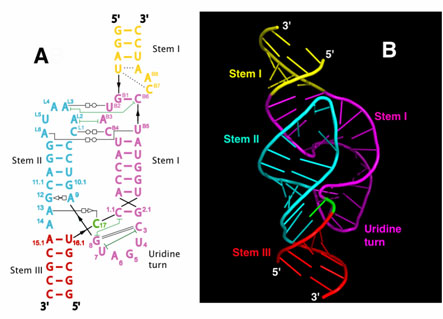
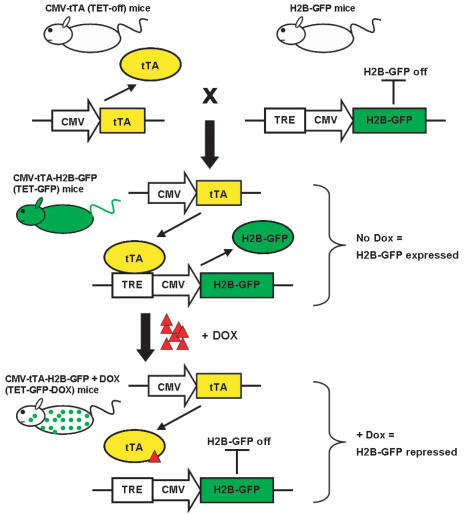
Warburg Effect revisited
It is very interesting the series of commentaries following Warburg Effect revisited. However, it comes as no surprise that almost all of them have small or greater emphasis in the molecular biology (changes in gene expression) events of the metabolic regulation involved.
I would like to comment on some aspects: 1- Warburg did the initial experiments following Pasteur line of reasoning that aimed at carbon flow through the cell (yeast in his case) instead of describing anything inside the cell. It is worth to recall that for the sake of his study, Pasteur considered anything inside the cell under the domain of divine forces. He, at least in defence of his work, entirely made outside the cell, considered that inside the cells was beyond human capability of understanding – He has followed vitalism as his line of reasoning in defence of his work – Interestingly, the same scientist that has ruled out spontaneous generation when Pasteurization was started. Therefore, Pasteur measured everything outside the cell (mainly sugar, ethanol – the equivalent of our lactic acid end product of anaerobic metabolism) and found that as soon as yeasts were placed in the presence of oxygen, sugar was consumed at low speed in comparison with the speed measured in anaerobiosis and ethanol was also produced at reduced speed. This is an indication of a fast biological regulatory mechanism that obviously, do not require changes in gene expression. As previously said, Warburg work translated for republishing in the Journal Biological Chemistry mentioned “grana” for mitochondria calling attention on an “inside-the-cell” component. It seems that, there is not a unique, single site of metabolism, where the Pasteur Effect – Warburg Effect seems to be elicited by the shift from anaerobiosis to aerobiosis or vice versa.
In order to find a core for the mechanism the best approach seems to take into account one of the most important contributions of one of the greatest north-American biochemists, Briton Chance. He has made it with his polarographic method of following continuously the oxygen consumption of the cell´s mitochondria.
Mitochondria burn organic carbon molecules under a very stringent control mechanism of oxidative-phosphorylation ATP production. Measured in the form of changes in the speed of oxygen consumption over time as Respiratory Control Ratio (RCR). When no ATP is required by the cell, oxygen consumption goes at low speed (basal or state II or IV). When ADP is offered to the mitochondria as an indication that ATP synthesis is necessary, oxygen consumption is activated in state III respiration. Low respiration means low burning activity of organic (carbon) molecules what in this case, means indirectly low glucose consumption. While high respiration is the converse – greater glucose consumption.
Aerobic metabolism of glucose to carbonic acid and water provides a change in free energy enough for 38 molecules of ATP (the real production is +/- 32 ATP in aerobic condition) while glucose to lactic acid metabolism in anaerobiosis leads to 2 ATP production after discounting the other 2 required at initial stages of glucose metabolism.
The low ATP yield in anaerobiosis explains the fast glucose metabolism in anaerobiosis while the control by RCR in mitochondria explains the reduction in glucose metabolism under aerobiosis as long as the ATP requirements of the cell remains the same – This is what it is assumed to happen in quiescent cells. Not necessarily in fast growing cells as cancer cells are. However, this will not be discussed here. In my first experiments in the early seventies, with M. Rouxii a dimorphic mold-yeast biological system the environmental change (aerobic – anaerobic) led to morphogenetic change presented as morphogenetic expression of the Pasteur Effect. In this case, the enzyme that replaces mitochondria in ATP production (Pyruvate Kinase) converting phosphoenolpyruvate into pyruvate together with ADP into ATP, shows changes that can be interpreted as change in gene expression together with new self-assembly of enzyme subunits. (Dimer AA – yeast in anaerobic growth or sporangiospores- converted into dimer AB in aerobic mold). In Leloir opinions at that time, PK I (AA) was only highly glycosylated, while PK II (AB) was less glycosylated without changes in gene expression.
In case you read comments posted, you will see that the reference to aerobic glycolysis, continues to be made together with, new deranged forms of reasoning as is indicated by referring to: Mitochondrial role in ion homeostasis…
Homeostasis is a regulation of something, ions, molecules, pH etc. that is kept outside the cell, therefore any role for mitochondria on it is only made indirectly, by its ATP production.
However, mitochondria has a role together with other cell components in the regulation of for instance, intracellular Ca levels (Something that is not a homeostatic regulation). This is a very important point for the following reason: Homeostasis is maintained as a composite result of several differentiated cellular, tissue and organ functions. Differentiated function is something clearly missing in cancer cells. The best form to refer to the mitochondrial function regarding ions is to indicate a mitochondrial role in ion fluxes.
In short, to indicate how an environmental event or better saying condition could favour genetic changes instead of being caused by genetic changes is to follow the same line of reasoning that is followed in understanding the role of cardioplegia. To stop heart beating is adequate for heart surgery it is also adequate for heart cells by sparing the ATP use during surgery and therefore, offering better recovery condition to the heart afterwards.
In the case, here considered, even assuming that the genome is not made more unstable during hypoxic condition it is quite possible to understand that sharing ATP with both differentiated cell function and replication may led quality control of DNA in short supply of much needed ATP and this led to maintenance of mutations as well as less organized genome.
Thank you. I enjoy reading your comments. They are very instructive. I don’t really think that I comprehend the use of the term “epigenetics” and longer. In fact, it was never clear to me when I first heard it used some years ago.
The term may have been closely wedded to the classic hypothesis of a unidirectional DNA–> RNA–> protein model that really has lost explanatory validity for the regulated cell in its environment. The chromatin has an influence, and protein-protein interactions are everywhere. As you point out, these are adjusting to a fast changing substrate milieu, and the genome is not involved. But in addition, the proteins may well have a role in suppression or activation of signaling pathways, and thereby, may well have an effect on gene expression. I don’t have any idea about how it would work, but mutations would appear to follow the metabolic condition of the cell over time. It would appear to be – genomic modification.
In aerobic glucose metabolism, the oxidation of citric acid requires ADP and Mg²+, which will increase the speed of the reaction: Iso-citric acid + NADP (NAD) — isocitrate dehydrogenase (IDH) = alpha-ketoglutaric acid. In the Krebs cycle (the citric cycle), IDH1 and IDH2 are NADP+-dependent enzymes that normally catalyze the inter-conversion of D-isocitrate and alpha-ketoglutarate (α-KG). The IDH1 and IDH2 genes are mutated in > 75% of different malignant diseases. Two distinct alterations are caused by tumor-derived mutations in IDH1 or IDH2: the loss of normal catalytic activity in the production of α-ketoglutarate (α-KG) and the gain of catalytic activity to produce 2-hydroxyglutarate (2-HG), [22].
This product is a competitive inhibitor of multiple α-KG-dependent dioxygenases, including demethylases, prolyl-4-hydroxylase and the TET enzymes family (Ten-Eleven Translocation-2), resulting in genome-wide alternations in histones and DNA methylation. [23]
IDH1 and IDH2 mutations have been observed in myeloid malignancies, including de novo and secondary AML (15%–30%), and in pre-leukemic clone malignancies, including myelodysplastic syndrome and myeloproliferative neoplasm (85% of the chronic phase and 20% of transformed cases in acute leukemia), [24].
Normally, cells in the body communicate via intra-cytoplasmic channels and maintain the energetic potential across cell membranes, which is 1-2.5 µmol of ATP in the form of ATP-ADP/ATP-ADP-IMP. These normal energetic values occur during normal cell division. If the intra-cellular and extra-cellular levels of Mg2+ are high, the extra-cellular charges of the cells will not be uniformly distributed.
This change in distribution induces a high net positive charge for the cell and induces a loss of contact inhibition via the electromagnetic induction of oscillation [28, 29, 30]. Thereafter, malignant cells become invasive and metastasize.
,,,,,,,,,,,,,,,,,,,,,,,,,,,,,,,,,,,,,,,,,,,,,,,,,,,,,,,,,,,,,,,,,,,,,,,,,,,,,,,,,,,,,,,,,,,,,,,,,,,,,,,,,,,,,,,,,,,,,,,,
-22. Hartmann C, Meyer J, Balss J. Capper D, et al. Type and frequency of IDH1 and IDH2 mutations are related to astrocytic and oligodendroglial differentiation and age: a study of 1,010 diffuse gliomas. Acta Neuropathol 2009; 118: 464-474.
23. Raymakers R.A, Langemeijer S.M., Kuiper R.P, Berends M, et al. Acquired mutations in TET2 are common in myelodysplastic syndromes. Nat. Genet 2009; 41; 838–849.
24 Wagner K, Damm F, Gohring G., Gorlich K et al. Impact of IDH1 R132 mutations and an IDH1 single nucleotide polymorphism in cytogenetically normal acute myeloid leukemia: SNP rs11554137 is an adverse prognostic factor. J. Clin. Oncol.2010; 28: 2356–2364.
Plant Molecular Biology 1989; 1: 271–303.
29. Chien MM, Zahradka CE, Newel MC, Fred JW. Fas induced in B cells apoptosis require an increase in free cytosolic magnesium as in early event. J Biol Chem.1999; 274: 7059-7066.
30. Milionis H J, Bourantas C L, Siamopoulos C K, Elisaf MS. Acid bases and electrolytes abnormalities in Acute Leukemia. Am J Hematol 1999; (62): 201-207.
31. Thomas N Seyfried; Laura M Shelton.Cancer as a Metabolic Disease. Nutr Metab 2010; 7: 7
– Aurelian Udristioiu, M.D,
– Lab Director, EuSpLM,
– City Targu Jiu, Romania
AACC, National Academy of Biochemical Chemistry (NACB) Member, Washington D.C, USA.