Sirtuins
Writer and Curator: Larry H. Bernstein, MD, FCAP
7.8 Sirtuins
7.8.1 Function and regulation of the mitochondrial Sirtuin isoform Sirt5 in Mammalia
7.8.2 Substrates and Regulation Mechanisms for the Human Mitochondrial Sirtuins- Sirt3 and Sirt5
7.8.3 The mTORC1 Pathway Stimulates Glutamine Metabolism and Cell Proliferation by Repressing SIRT4
7.8.4 Rab1A and small GTPases Activate mTORC1
7.8.5 PI3K.Akt signaling in osteosarcoma
7.8.6 The mTORC1-S6K1 Pathway Regulates Glutamine Metabolism through the eIF4B-Dependent Control of c-Myc Translation
7.8.7 Localization of mouse mitochondrial SIRT proteins
7.8.8 SIRT4 Has Tumor-Suppressive Activity and Regulates the Cellular Metabolic Response to DNA Damage by Inhibiting Mitochondrial Glutamine Metabolism
7.8.9 Mitochondrial sirtuins and metabolic homeostasis
7.8.10 Mitochondrial sirtuins
7.8.11 Sirtuin regulation of mitochondria: energy production, apoptosis, and signaling
7.8.1 Function and regulation of the mitochondrial Sirtuin isoform Sirt5 in Mammalia
Gertz M1, Steegborn C.
Biochim Biophys Acta. 2010 Aug; 1804(8):1658-65
http://dx.doi.org:/10.1016/j.bbapap.2009.09.011
Sirtuins are a family of protein deacetylases that catalyze the nicotinamide adenine dinucleotide (NAD(+))-dependent removal of acetyl groups from modified lysine side chains in various proteins. Sirtuins act as metabolic sensors and influence metabolic adaptation but also many other processes such as stress response mechanisms, gene expression, and organismal aging. Mammals have seven Sirtuin isoforms, three of them – Sirt3, Sirt4, and Sirt5 – located to mitochondria, our centers of energy metabolism and apoptosis initiation. In this review, we shortly introduce the mammalian Sirtuin family, with a focus on the mitochondrial isoforms. We then discuss in detail the current knowledge on the mitochondrial isoform Sirt5. Its physiological role in metabolic regulation has recently been confirmed, whereas an additional function in apoptosis regulation remains speculative. We will discuss the biochemical properties of Sirt5 and how they might contribute to its physiological function. Furthermore, we discuss the potential use of Sirt5 as a drug target, structural features of Sirt5 and of an Sirt5/inhibitor complex as well as their differences to other Sirtuins and the current status of modulating Sirt5 activity with pharmacological compounds.

removal of acetyl groups from modified lysine side chain
http://ars.els-cdn.com/content/image/1-s2.0-S1570963909002593-gr1.sml
removal of acetyl groups from modified lysine side chain

sirtuin structure
http://ars.els-cdn.com/content/image/1-s2.0-S1570963909002593-gr2.sml
sirtuin structure
7.8.2 Substrates and Regulation Mechanisms for the Human Mitochondrial Sirtuins- Sirt3 and Sirt5
Schlicker C1, Gertz M, Papatheodorou P, Kachholz B, Becker CF, Steegborn C
J Mol Biol. 2008 Oct 10; 382(3):790-801
http://dx.doi.org/10.1016/j.jmb.2008.07.048
The enzymes of the Sirtuin family of nicotinamide-adenine-dinucleotide-dependent protein deacetylases are emerging key players in nuclear and cytosolic signaling, but also in mitochondrial regulation and aging. Mammalian mitochondria contain three Sirtuins, Sirt3, Sirt4, and Sirt5. Only one substrate is known for Sirt3 as well as for Sirt4, and up to now, no target for Sirt5 has been reported. Here, we describe the identification of novel substrates for the human mitochondrial Sirtuin isoforms Sirt3 and Sirt5. We show that Sirt3 can deacetylate and thereby activate a central metabolic regulator in the mitochondrial matrix, glutamate dehydrogenase. Furthermore, Sirt3 deacetylates and activates isocitrate dehydrogenase 2, an enzyme that promotes regeneration of antioxidants and catalyzes a key regulation point of the citric acid cycle. Sirt3 thus can regulate flux and anapleurosis of this central metabolic cycle. We further find that the N- and C-terminal regions of Sirt3 regulate its activity against glutamate dehydrogenase and a peptide substrate, indicating roles for these regions in substrate recognition and Sirtuin regulation. Sirt5, in contrast to Sirt3, deacetylates none of the mitochondrial matrix proteins tested. Instead, it can deacetylate cytochrome c, a protein of the mitochondrial intermembrane space with a central function in oxidative metabolism, as well as apoptosis initiation. Using a mitochondrial import assay, we find that Sirt5 can indeed be translocated into the mitochondrial intermembrane space, but also into the matrix, indicating that localization might contribute to Sirt5 regulation and substrate selection.
Mitochondria are central organelles in cellular energy metabolism, but also in processes such as apoptosis, cellular senescence, and lifespan regulation.1 and 2 Failures in mitochondrial function and regulation contribute to aging-related diseases, such as atherosclerosis3 and Parkinson’s disease,4 likely by increasing cellular levels of reactive oxygen species and the damage they cause.1 Emerging players in metabolic regulation and cellular signaling are members of the Sirtuin family of homologs of “silent information regulator 2” (Sir2), a yeast protein deacetylase.5 and 6 Sir2 was found to be involved in aging processes and lifespan determination in yeast,7 and 8 and its homologs were subsequently identified as lifespan regulators in various higher organisms.8, 9 and 10 Sirtuins form class III of the protein deacetylase superfamily and hydrolyze one nicotinamide adenine dinucleotide (NAD +) as cosubstrate for each lysine residue they deacetylate.11 and 12 The coupling of deacetylation to NAD + was proposed to link changes in cellular energy levels to deacetylation activity,13 and 14 which would indicate Sirtuins as metabolic sensors. Other known regulation mechanisms for Sirtuin activity are the modulation of the expression levels of their genes6 and the autoinhibitory effect of an N-terminal region on the yeast Sirtuin “homologous to SIR2 protein 2” (Hst2).15
The seven mammalian Sirtuin proteins (Sirt1–Sirt7) have various substrate proteins that mediate functions in genetic, cellular, and mitochondrial regulation.5 and 6 The best-studied mammalian Sir2 homolog, Sirt1, was shown to regulate, among others, transcription factor p53, nuclear factor-kappa B, and peroxisome proliferator-activated receptor gamma coactivator-1-alpha.6 Three human Sirtuin proteins are known to be located in the mitochondria, Sirt3, Sirt4, and Sirt5,16, 17, 18 and 19 although Sirt3 was reported to change its localization to nuclear when coexpressed with Sirt5.20 The recent identification of the first substrates for mitochondrial Sirtuins—acetyl coenzyme A synthetase 221 and 22 and glutamate dehydrogenase (GDH)16—as targets of Sirtuins 3 and 4, respectively, revealed that these Sirtuins control a regulatory network that has implications for energy metabolism and the mechanisms of caloric restriction (CR) and lifespan determination.23 Sirt3 regulates adaptive thermogenesis and decreases mitochondrial membrane potential and reactive oxygen species production, while increasing cellular respiration.24 Furthermore, Sirt3 is down-regulated in several genetically obese mice,24 and variability in the human SIRT3 gene has been linked to survivorship in the elderly. 25 In contrast to the deacetylases Sirt3 and Sirt5, Sirt4 appears to be an ADP ribosyltransferase. 16 Through this activity, Sirt4 inhibits GDH and thereby down-regulates insulin secretion in response to amino acids. 16 For Sirt5, however, there is no report yet on its physiological function or any physiological substrate. It is dominantly expressed in lymphoblasts and heart muscle cells,17 and 26 and its gene contains multiple repetitive elements that might make it a hotspot for chromosomal breaks. 26 Interestingly, the Sirt5 gene has been located to a chromosomal region known for abnormalities associated with malignant diseases. 26
A proteomics study found 277 acetylation sites in 133 mitochondrial proteins;27 many of them should be substrates for the mitochondrial Sirtuins mediating their various functions, but up to now, only one physiological substrate could be identified for Sirt3,21 and 22 and none could be identified for Sirt5. Our understanding of substrate selection by Sirtuins is incomplete, and knowledge of specific Sirtuin targets would be essential for a better understanding of Sirtuin-mediated processes and Sirtuin-targeted therapy. A first study on several Sirtuins showed varying preferences among acetylated peptides.28 Structural and thermodynamic analysis of peptides bound to the Sirtuin Sir2Tm from Thermatoga maritima indicated that positions − 1 and + 2 relative to the acetylation site play a significant role in substrate binding. 29 However, these studies were conducted with nonphysiological Sirtuin/substrate pairs, and other studies indicated little sequence specificity; instead, the yeast Sirtuin Hst2 was described to display contextual and conformational specificity: Hst2 deacetylated acetyl lysine only in the context of a protein, and it preferentially deacetylated within flexible protein regions. 30 Finally, statistical analysis of a proteomics study on acetylated proteins identified preferences at various positions such as + 1, − 2, and − 3, and deacetylation sites appeared to occur preferentially in helical regions. 27 Thus, our present knowledge of Sirtuin substrates and of factors determining Sirtuin specificity is incomplete and insufficient for sequence-based identification of physiological substrates.
Here, we describe the identification of novel targets for the mitochondrial deacetylases Sirt3 and Sirt5. We show that Sirt3 can deacetylate and thereby activate the enzymes GDH and isocitrate dehydrogenase (ICDH) 2—two key metabolic regulators in the mitochondrial matrix. We find that the N- and C-terminal regions of Sirt3 influence its activity against GDH and a peptide substrate, indicating roles in regulation and substrate recognition for these regions. Furthermore, we find that Sirt5 can deacetylate cytochrome c, a protein of the mitochondrial intermembrane space (IMS) with a central function in oxidative metabolism and apoptosis.
The upstream sequence contributes to the target specificity of Sirt3 and Sirt5
Sirtuins have been reported to have little sequence specificity,30 but other studies indicated a sequence preference dominated by positions − 1 and + 2.29 We tested the importance of the amino acid pattern preceding the acetylation site for recognition by the mitochondrial Sirtuins Sirt3 and Sirt5 through a fluorescence assay. First, the fluorogenic and commercially available modified p53-derived tetrapeptide QPK-acetylK, originally developed for Sirt2 assays but also efficiently used by Sirt3, was tested. Even 60 μg of Sirt5 did not lead to any deacetylation signal, whereas 0.35 μg of Sirt3 efficiently deacetylated the peptide (Fig. 1a). We then tested Sirt3 and Sirt5 on a second modified p53-derived tetrapeptide, RHK-acetylK. Sirt3 (0.5 μg) showed a slightly increased activity against this substrate as compared to QPK-acetylK (Fig. 1b); more importantly, 0.5 μg of Sirt5 showed significant activity against this peptide. These results show that the mitochondrial Sirtuins Sirt3 and, especially, Sirt5 indeed recognize the local target sequence, and target positions further upstream of − 1 seem to be involved in substrate recognition. For identification of novel substrates for the mitochondrial Sirtuins and further characterization of their target recognition mechanisms, we then turned to testing full-length proteins, as the downstream sequence and the larger protein context of the deacetylation site might also contribute to substrate selection.

Sirtuin substrate specificity
Fig. 1. Testing the substrate specificity of Sirt3 and Sirt5 with peptides. (a) Sirt3, but not Sirt5, deacetylates the fluorogenic peptide QPK-acetylK. (b) Sirt3 efficiently deacetylates the fluorogenic peptide RHK-acetylK, and Sirt5 also significantly deacetylates this substrate.
http://ars.els-cdn.com/content/image/1-s2.0-S0022283608009029-gr1.jpg
Sirt3 deacetylates and activates GDH
In order to identify novel physiological substrates of the mitochondrial Sirtuins, we used proteins isolated in their partly acetylated form from natural sources (i.e., from mammalian mitochondria). These proteins, carrying physiological acetylations, were tested as Sirt3 and Sirt5 substrates in vitro in an ELISA system using an antibody specific for acetylated lysine. In a recent proteomics study, 27 GDH, a central regulator of mitochondrial metabolism, was identified to be acetylated in a feeding-dependent manner. With our ELISA, we found that Sirt3 and Sirt5 can both deacetylate pure GDH isolated from mitochondria, but with very different efficiencies ( Fig. 2a). Sirt3 significantly deacetylated GDH, but even large amounts of Sirt5 decreased the acetylation level of this substrate only slightly. We next tested the effect of GDH deacetylation on its activity. Deacetylation of GDH through incubation with Sirt3 and NAD + before its examination in a GDH activity assay increased its activity by 10%, and a stronger stimulation of GDH activity was seen when larger amounts of Sirt3 were used for deacetylation ( Fig. 2b). GDH is colocalized with Sirt3 in the mitochondrial matrix 16, 18 and 19 and, thus, likely could be a physiological substrate of this Sirtuin. Indeed, GDH from a Sirt3 knockout mouse was recently shown to be hyperacetylated compared to protein from wild-type mice. 31 Thus, Sirt3 deacetylates GDH in vivo, and our results show that this direct deacetylation of GDH by Sirt3 leads to GDH activation.

sirtuin structure
Fig. 2. Sirt3 can deacetylate and thereby activate GDH. (a) Deacetylation of GDH tested in ELISA. Sirt3 efficiently deacetylates GDH, whereas Sirt5 has only a small effect on the acetylation state. (b) GDH activity is increased after deacetylation of the enzyme by Sirt3. The increase in GDH activity depends on the amount of Sirt3 activity used for deacetylation.
http://ars.els-cdn.com/content/image/1-s2.0-S0022283608009029-gr2.jpg
Sirt3 can deacetylate and thereby activate ICDH2
In the proteomics study by Kim et al., the mitochondrial citric acid cycle enzymes fumarase and ICDH2 (a key regulator of this metabolic cycle) were found to be acetylated in a feeding-dependent manner. 27 In our ELISA system, we found that Sirt3 efficiently deacetylated the ICDH2 substrate isolated from mitochondria ( Fig. 3a). Western blot analysis (data not shown) and mass spectrometry confirmed that, indeed, the ICDH2 fraction of the partially purified protein was deacetylated by Sirt3. In contrast, even large amounts of Sirt5 did not significantly decrease the acetylation level of this substrate ( Fig. 3a). As expected, deacetylation of ICDH2 by Sirt3 was dependent on NAD +. Fumarase, in contrast, could not be deacetylated as efficiently as ICDH2 through treatment with either Sirt3 or Sirt5 ( Fig. 3b). The low absolute values over background for the ELISA with fumarase, however, might indicate low acetylation levels of the natively purified protein, and a stronger effect might be attainable when testing fumarase with a higher acetylation level.
Fig. 3. Sirt3 deacetylates ICDH2, but not fumarase. (a) Deacetylation of ICDH2 by Sirt3 and Sirt5 tested in ELISA. Sirt3, but not Sirt5, deacetylates ICDH2 in a NAD +-dependent manner. (b) Fumarase acetylation determined through ELISA cannot be significantly decreased by incubation with recombinant Sirt3 or Sirt5. (c) ICDH2 activity measured in a spectrophotometric assay based on the formation of NADPH. ICDH2 activity (continuous line) is increased after deacetylation of the enzyme by Sirt3 (dashed line). (d) The stimulatory effect of deacetylation on ICDH2 activity depends on the amount of deacetylase activity added during pretreatment. (e) ICDH2 with and without Sirt3 treatment analyzed by mass spectrometry after proteolytic digest. The decrease in the signal at 962.3 Da and the increase in signal at 903.5 Da indicate deacetylation at either K211 or K212.
In order to analyze the potential physiological function of ICDH2 deacetylation, we tested the effect of Sirt3-mediated ICDH2 deacetylation on its activity. Incubation of ICDH2 with Sirt3 and NAD + prior to its analysis in an ICDH activity assay increased its activity (Fig. 3c). The stimulation of ICDH2 activity was further increased when larger amounts of Sirt3 were used for deacetylation (Fig. 3d), and no significant increase in ICDH2 activity was observed when the Sirtuin inhibitor dihydrocoumarin was present during incubation with Sirt3 (data not shown). Sirt3 and ICDH2 are colocalized in the mitochondrial matrix,16, 19 and 32 and we therefore assume that ICDH2 is likely a physiological substrate for Sirt3, which activates ICDH2 by deacetylation.
http://ars.els-cdn.com/content/image/1-s2.0-S0022283608009029-gr3.jpg
Sirt3 can deacetylate KK motifs in substrate proteins
In order to identify the site of ICDH2 deacetylation upon treatment with Sirt3, we analyzed ICDH2 by mass spectrometry. For analyzing pure ICDH2, we excised its band from an SDS gel before mass spectrometry analysis. In the proteomics study by Kim et al., two acetylation sites were reported for ICDH2: K75 and K241 (numbering of the partial sequence of the unprocessed precursor; SwissProt entry P33198). 27 After digest of ICDH2, we could not detect peptides comprising K75 and, therefore, could not determine its acetylation status, and we only observed the deacetylated form of K241. We identified an additional acetylation site, however, by detecting signals at m/z = 903.5 and m/z = 962.3 for the peptide QYAIQKK (residues 206–212) carrying one and two acetyl groups, respectively ( Fig. 3e; calculated m/z = 903.5 and 962.5). Sirt3 treatment decreased the signal for the double-acetylated form and increased the signal for the single-acetylated form as compared to internal peptides [e.g., m/z = 890.5 (calculated m/z = 890.5) andm/z = 1041.4 (calculated m/z = 1041.5)]. These data indicate that Sirt3 deacetylates either position K211 or K212 of this KK motif located at a surface-exposed end of a helix that flanks the active site of ICDH2. 33Deacetylation of a KK motif by Sirt3 is consistent with the efficient use of the tested peptide substrates (see above) that both carry KK motifs.
Fig. 4. Increased activity of N- and C-terminally truncated Sirt3. (a) Specific activity against a peptide substrate of the longest Sirt3 form after proteolytic processing that covers residues 102–399. N-terminal truncation increases the specific activity dramatically, and an additional C-terminal truncation activates the catalytic core further. (b) Homology model of Sirt3 based on the crystal structure of Sirt2. The part comprising the catalytic core is shown in red. The NAD + and peptide ligands were manually placed into their binding sides based on the crystal structure of their complex with a bacterial Sir2 homolog from T. maritima. Parts removed in N- and C-terminal truncation constructs are shown in cyan and blue, respectively. (c) Level of acetylation of GDH tested in ELISA. The shortest Sirt3 form Sirt3(114–380) deacetylates more efficiently than Sirt3(114–399) and Sirt3(102–399), which show activities comparable to each other.

Sirt5 can deacetylate cytochrome c
http://ars.els-cdn.com/content/image/1-s2.0-S0022283608009029-gr4.jpg
Sirt5 can deacetylate cytochrome c
The Sirt5 protein that we used for our study comprises residues 34–302, corresponding to the fully active catalytic core determined for Sirt3 (see above). This protein is indeed active against a peptide substrate, but it showed no significant activity against the acetylated mitochondrial matrix proteins tested so far: GDH, ICDH2, and fumarase. We thus picked cytochrome c, a central protein in energy metabolism and apoptosis localized in the mitochondrial IMS, from the list of acetylated mitochondrial proteins 27 for testing as deacetylation substrate. Sirt5 showed deacetylation activity against pure cytochrome c in our ELISA system, whereas Sirt3 had almost no activity against this substrate ( Fig. 5a). Even the more active shortened form of Sirt3(114–380) showed no considerable activity against this substrate.
Fig. 5. Sirt5 can deacetylate cytochrome c. (a) Deacetylation of cytochrome c tested in ELISA. Sirt5 uses cytochrome c as substrate for deacetylation, whereas Sirt3 treatment leaves the acetylation level of cytochrome c unchanged. (b) Model of the action of the mammalian Sirtuins Sirt3, Sirt4, and Sirt5 in mitochondria. CAC: citric acid cycle. (c) Digest of Sirt5 synthesized in vitro with PK. The protein is fully degraded at proteinase concentrations of 25 μg/ml and above. (d) Import of Sirt5 into isolated yeast mitochondria. Sirt5 reaches an inner mitochondrial compartment in the presence and in the absence of the mitochondrial membrane potential (ΔΨ), whereas Sirt3, as a control for a matrix-targeted protein, is not imported into uncoupled mitochondria. (e) Intramitochondrial localization of Sirt5. Part of the imported Sirt5 is sensitive to PK after swelling (SW) and thus localized in the IMS, but another part of the protein remains protease-resistant and therefore appears to be localized to the matrix. Atp3, a protein localized at the matrix site of the mitochondrial inner membrane, and an IMS-located domain of translocase of inner membrane 23 detected by Western blot analysis served as controls for matrix transport and swelling, respectively. aTim23: anti-Tim23. (f) Scheme of the domain organizations of Sirt3 and Sirt5. Numbers in brackets are residue numbers for boundaries of protein parts. NLS: nuclear localization sequence; MLS: mitochondrial localization sequence; R1, regulatory region 1; R2: regulatory region 2.
http://ars.els-cdn.com/content/image/1-s2.0-S0022283608009029-gr5.jpg
Cytochrome c might be a physiological substrate of Sirt5 if this Sirtuin is localized to the mitochondrial IMS (Fig. 5b). A recent study on overexpressed tagged mouse Sirt5 in COS7 cells 20 indeed indicated that Sirt5, at least from mouse, is localized in the IMS. In order to test whether human Sirt5 can be localized to the IMS, we performed import experiments with human Sirt3 and Sirt5 using isolated yeast mitochondria as a model system. 3 Sirt3 and Sirt5 proteins were incubated with mitochondria, followed by PK treatment for degradation of nonimported protein ( Fig. 5d). In a parallel reaction, mitochondria were uncoupled prior to the import reaction by addition of valinomycin (− ΔΨ). Sirt3, a protein known to be located in the mitochondrial matrix, 19 was only efficiently imported in the presence of a membrane potential. Dependence on the mitochondrial potential is a hallmark of matrix import, 38 and the results thus show that Sirt3 is imported into the correct compartment in our experimental system. Sirt5, in contrast, reaches an inner-mitochondrial compartment both in the presence and in the absence of the membrane potential, suggesting that Sirt5 may accumulate in the IMS.
In order to further test the localization of Sirt5, we removed the outer mitochondrial membrane after the import reaction by osmotic swelling, followed by PK digest of then accessible proteins (Fig. 5e). Rupture of the outer membrane was confirmed by monitoring the accessibility of an IMS-exposed domain of endogenous translocase of inner membrane 23 (detected by Western blot analysis). Part of the imported Sirt5 was degraded by PK, indicating its localization in the IMS.
Sirtuins are involved in central physiological regulation mechanisms, many of them with relevance to metabolic regulation and aging processes.5 and 6 Therefore, the seven mammalian Sirtuin isoforms are emerging targets for the treatment of metabolic disorders and aging-related diseases.39 For most Sirtuin effects, however, the specific signaling mechanisms and molecular targets are not yet known. We have identified novel potential targets for Sirtuins in mitochondria, the major metabolic centers in cells. We found that Sirt3 can deacetylate and thereby activate ICDH2, a key regulation point for flux throughout the citric acid cycle. Interestingly, the ICDH isoform regulated by Sirt3 forms NADPH instead of the NADH used for ATP synthesis. This activity is assumed to be important for the NADPH-dependent regeneration of antioxidants,40 and its stimulation by Sirt3 should thus help to slow oxidative damage and cellular aging processes. Furthermore, Sirt3 deacetylates GDH in vitro (this study) and in vivo, 31 and we find that this modification also stimulates GDH activity that promotes glucose and ATP synthesis by enabling amino acids to be used as fuels for citric acid cycle and gluconeogenesis. 41 Consistently, Sirt3 was reported to increase respiration, 24 which is needed for ATP synthesis but also for conversion of amino acids into glucose and urea. 41 The enzyme previously identified to be activated by Sirt3, acetyl coenzyme A synthetase 2, 21 and 22 also fuels the citric acid cycle independently of glycolysis by activating free acetate (Fig. 5b). Interestingly, a shift away from liver glycolysis is one of the metabolic changes observed under CR, a feeding regimen with 20–40% fewer calories than consumed ad libitum that is found to extend the lifespan of a variety of organisms. 6 CR was previously reported to increase GDH activity in the liver, 42where Sirt3 is highly expressed, 17 and Sirt3 activity is known to be increased by CR. 6 and 24 It thus appears that Sirt3 mediates some of the effects of CR and lifespan regulation, consistent with its implication in survivorship in the elderly 25 and 43 and the prominent role of Sirtuins in CR found for various organisms,6 and 44 and it also appears that GDH activation likely contributes to the Sirt3-dependent effects.
Little is known about additional factors regulating the activity and specificity of Sirtuin enzymes. Their requirement for NAD + indicates that the NAD +/NADH ratio should regulate Sirtuins,13 and 14 but even changes to ratios observed under extreme conditions such as CR appear to influence Sirtuin activity only slightly.35 Furthermore, NAD + levels would influence all Sirtuins similarly, but a more specific tuning of individual Sirtuin activities appears necessary in order to orchestrate the many effects mediated by Sirtuins (see, e.g., discussion above).6 and 45 A deeper insight into the regulation of Sirtuin enzymes would also be required for the development of more specific Sirtuin inhibitors—a prerequisite for Sirtuin-targeted therapy.39 The regulatory parts flanking the catalytic cores might be interesting target sites (Fig. 5f). N-terminal extensions between ∼ 30 and 120 residues are present in all human Sirtuins but show little conservation, indicating that they might respond to various regulators. Our results indicate that the corresponding N-terminal region in Sirt3 also blocks productive binding for small peptides (Fig. 4a), but enables access for entire protein substrates (Fig. 4c). The C-terminal truncated part in our experiments (Sirt3 residues 380–399) is formed by α14 (secondary structure numbering for Sirt236) whose end corresponds to the N-terminus of Hst2 α13 that partly occupies the NAD +binding site.15 In Sirt3, however, the C-terminal truncation alone lowers activity only slightly, and we assume that it has no regulatory function on its own but might instead assist the N-terminal autoinhibitory region. This module of the N-terminus and the C-terminus (Figs. 4b and 5f) appears to contribute to the substrate specificity of the enzyme, and ligands binding to it might enable or block rearrangements opening up the active site and thereby regulate the enzyme’s activity. Alternatively, the flanking parts might be removed by proteolytic processing or alternative splicing, thereby changing Sirtuin activity and specificity.
7.8.3 The mTORC1 Pathway Stimulates Glutamine Metabolism and Cell Proliferation by Repressing SIRT4
Csibi A1, Fendt SM, Li C, Poulogiannis G, Choo AY, Chapski DJ, et al.
Cell. 2013 May 9; 153(4):840-54.
http://dx.doi.org:/10.1016/j.cell.2013.04.023
Proliferating mammalian cells use glutamine as a source of nitrogen and as a key anaplerotic source to provide metabolites to the tricarboxylic acid cycle (TCA) for biosynthesis. Recently, mTORC1 activation has been correlated with increased nutrient uptake and metabolism, but no molecular connection to glutaminolysis has been reported. Here, we show that mTORC1 promotes glutamine anaplerosis by activating glutamate dehydrogenase (GDH). This regulation requires transcriptional repression of SIRT4, the mitochondrial-localized sirtuin that inhibits GDH. Mechanistically, mTORC1 represses SIRT4 by promoting the proteasome-mediated destabilization of cAMP response element binding-2 (CREB2). Thus, a relationship between mTORC1, SIRT4 and cancer is suggested by our findings. Indeed, SIRT4 expression is reduced in human cancer, and its overexpression reduces cell proliferation, transformation and tumor development. Finally, our data indicate that targeting nutrient metabolism in energy-addicted cancers with high mTORC1 signaling may be an effective therapeutic approach.
Proliferating mammalian cells use glutamine as a source of nitrogen and as a key anaplerotic source to provide metabolites to the tricarboxylic acid cycle (TCA) for biosynthesis. Recently, mTORC1 activation has been correlated with increased nutrient uptake and metabolism, but no molecular connection to glutaminolysis has been reported. Here, we show that mTORC1 promotes glutamine anaplerosis by activating glutamate dehydrogenase (GDH). This regulation requires transcriptional repression of SIRT4, the mitochondrial-localized sirtuin that inhibits GDH. Mechanistically, mTORC1 represses SIRT4 by promoting the proteasome-mediated destabilization of cAMP response element binding-2 (CREB2). Thus, a relationship between mTORC1, SIRT4 and cancer is suggested by our findings. Indeed, SIRT4 expression is reduced in human cancer, and its overexpression reduces cell proliferation, transformation and tumor development. Finally, our data indicate that targeting nutrient metabolism in energy-addicted cancers with high mTORC1 signaling may be an effective therapeutic approach.
Nutrient availability plays a pivotal role in the decision of a cell to commit to cell proliferation. In conditions of sufficient nutrient sources and growth factors (GFs), the cell generates enough energy and acquires or synthesizes essential building blocks at a sufficient rate to meet the demands of proliferation. Conversely, when nutrients are scarce, the cell responds by halting the biosynthetic machinery and by stimulating catabolic processes such as fatty acid oxidation and autophagy to provide energy maintenance (Vander Heiden et al., 2009). Essential to the decision process between anabolism and catabolism is the highly conserved, atypical Serine/Threonine kinase mammalian Target of Rapamycin Complex 1 (mTORC1), whose activity is deregulated in many cancers (Menon and Manning, 2008). This complex, which consists of mTOR, Raptor, and mLST8, is activated by amino acids (aa), GFs (insulin/IGF-1) and cellular energy to drive nutrient uptake and subsequently proliferation (Yecies and Manning, 2011). The molecular details of these nutrient-sensing processes are not yet fully elucidated, but it has been shown that aa activate the Rag GTPases to regulate mTORC1 localization to the lysosomes (Kim et al., 2008; Sancak et al., 2008); and GFs signal through the PI3K-Akt or the extracellular signal-regulated kinase (ERK)-ribosomal protein S6 kinase (RSK) pathways to activate mTORC1 by releasing the Ras homolog enriched in brain (RHEB) GTPase from repression by the tumor suppressors, tuberous sclerosis 1 (TSC1)– TSC2 (Inoki et al., 2002; Manning et al., 2002; Roux et al., 2004). Finally, low energy conditions inhibit mTORC1 by activating AMPK and by repressing the assembly of the TTT-RUVBL1/2 complex. (Inoki et al., 2003; Gwinn et al., 2008; Kim et al., 2013).
Glutamine, the most abundant amino acid in the body plays an important role in cellular proliferation. It is catabolized to α-ketoglutarate (αKG), an intermediate of the tricarboxylic acid (TCA) cycle through two deamination reactions in a process termed glutamine anaplerosis (DeBerardinis et al., 2007). The first reaction requires glutaminase (GLS) to generate glutamate, and the second occurs by the action of either glutamate dehydrogenase (GDH) or transaminases. Incorporation of αKG into the TCA cycle is the major anaplerotic step critical for the production of biomass building blocks including nucleotides, lipids and aa (Wise and Thompson, 2010). Recent studies have demonstrated that glutamine is also an important signaling molecule. Accordingly, it positively regulates the mTORC1 pathway by facilitating the uptake of leucine (Nicklin et al., 2009) and by promoting mTORC1 assembly and lysosomal localization (Duran et al., 2012;Kim et al., 2013).
Commonly occurring oncogenic signals directly stimulate nutrient metabolism, resulting in nutrient addiction. Oncogenic levels of Myc have been linked to increased glutamine uptake and metabolism through a coordinated transcriptional program (Wise et al., 2008; Gao et al., 2009). Hence, it is not surprising that cancer cells are addicted to glutamine (Wise and Thompson, 2010). Thus, considering the prevalence of mTORC1 activation in cancer and the requirement of nutrients for cell proliferation, understanding how mTORC1 activation regulates nutrient levels and metabolism is critical. Activation of the mTORC1 pathway promotes the utilization of glucose, another nutrient absolutely required for cell growth. However, no study has yet investigated if and how the mTORC1 pathway regulates glutamine uptake and metabolism. Here, we discover a novel role of the mTORC1 pathway in the stimulation of glutamine anaplerosis by promoting the activity of GDH. Mechanistically, mTORC1 represses the transcription of SIRT4, an inhibitor of GDH. SIRT4 is a mitochondrial-localized member of the sirtuin family of NAD-dependent enzymes known to play key roles in metabolism, stress response and longevity (Haigis and Guarente, 2006). We demonstrate that the mTORC1 pathway negatively controls SIRT4 by promoting the proteasome-mediated degradation of cAMP-responsive element-binding (CREB) 2. We reveal that SIRT4 levels are decreased in a variety of cancers, and when expressed, SIRT4 delays tumor development in a Tsc2−/− mouse embryonic fibroblasts (MEFs) xenograft model. Thus, our findings provide new insights into how mTORC1 regulates glutamine anaplerosis, contributing therefore to the metabolic reprogramming of cancer cells, an essential hallmark to support their excessive needs for proliferation.
The mTORC1 pathway regulates glutamine metabolism via GDH
The activation of the mTORC1 pathway has recently been linked to glutamine addiction of cancer cells (Choo et al., 2010), yet it remains to be resolved if mTORC1 serves as a regulator of glutamine anaplerosis. To investigate this possibility, we first determined the effect of mTORC1 activity on glutamine uptake. We measured glutamine uptake rates in Tsc2 wild-type (WT) and Tsc2−/− MEFs. We found that Tsc2−/− MEFs consumed significantly more glutamine (Figure 1A), showing that mTORC1 activation stimulates the uptake of this nutrient. In addition, re-expression of Tsc2 in Tsc2−/− cells reduced glutamine uptake (Figure S1A). Similarly, mTORC1 inhibition with rapamycin resulted in decreased glutamine uptake in MEFs (Figure 1A). The decreased on glutamine uptake was significantly reduced after 6h of rapamycin treatment when compared to control (data not shown). To further confirm the role of mTORC1 on glutamine uptake, we used human embryonic kidney (HEK) 293T cells stably expressing either WT-RHEB or a constitutively active mutant (S16H) of RHEB. Increased mTORC1 signaling, as evidenced by sustained phosphorylation of S6K1 and its target rpS6, was observed in RHEB-expressing cells (Figure S1B). The activation of the mTORC1 pathway nicely correlated with an increase in glutamine consumption, therefore confirming that changes in mTORC1 signaling are reflected in cellular glutamine uptake (Figure S1B). To determine whether the modulation of glutamine uptake by the mTORC1 pathway occurs in cancer cells, we examined glutamine uptake rates in conditions of mTORC1 inhibition in human epithelial tumor cell lines, including the colon carcinoma DLD1, and the prostate cancer DU145. Rapamycin treatment resulted in decreased proliferation (data not shown) and yielded a decreased glutamine uptake in both cell lines (Figure 1B & data not shown). Glutamine is the major nitrogen donor for the majority of ammonia production in cells (Figure 1C) (Shanware et al., 2011). Consistent with decreased glutamine uptake, we found that ammonia levels were also diminished after rapamycin treatment (Figure S1C).
Figure 1 The mTORC1 pathway regulates glutamine metabolism via glutamate dehydrogenase
We next examined the fate of glutamine in conditions of mTORC1 inhibition, using gas chromatography/mass spectrometry (GC/MS) analysis to monitor the incorporation of uniformly labeled [U-13C5]-Glutamine into TCA cycle intermediates. Direct glutamine contribution to I̧KG (m+5), succinate (m+4), malate (m+4) and citrate (m+4) was decreased in rapamycin treated cells (Figure S1D) indicating that rapamycin impaired glutamine oxidation and subsequent carbon contribution into the TCA cycle.
To test whether glutamine uptake or glutamine conversion is limiting, we measured the intracellular levels of glutamine and glutamate in DLD1 cells. Increased levels of glutamine and/or glutamate will show that the catalyzing enzyme activity is limiting and not glutamine transport itself (Fendt et al., 2010). Rapamycin treatment resulted in increased intracellular levels of both glutamine and glutamate, showing that glutamate to αKG conversion is the critical limiting reaction (Figures 1D & 1E). To further confirm the implication of the glutamate catalyzing reaction we also measured αKG levels. If glutamate conversion is indeed critical we expect no alteration in αKG levels. This is expected because αKG is downstream of the potentially limiting glutamate conversion step, and it has been shown that product metabolite concentrations of limiting metabolic enzymes stay unaltered, while the substrate metabolite concentrations change to keep metabolic homeostasis (Fendt et al., 2010). We found that αKG levels were unaltered after rapamycin treatment, corroborating that the limiting enzymatic step is glutamate conversion (Figure 1F). To further confirm the limitation in glutamate-to-αKG conversion, we measured flux through this reaction. Strikingly, this flux was significantly reduced during rapamycin treatment (Figure 1G). Additionally, the inhibition of mTORC1 resulted in increased glutamate secretion (Figure 1H), thus confirming that the glutamate-to-αKG conversion step is a major bottleneck in the glutamine pathway during rapamycin treatment.
Glutamate conversion can be conducted by GDH (Figure 1C), suggesting that the mTORC1 pathway potentially regulates this enzyme. In agreement, rapamycin treatment resulted in decreased GDH activity in DLD1 cells (Figure 1I). To exclude that transaminases play a role in the mTORC1-induced regulation of glutamine metabolism, we used amin ooxyacetate (AOA) at a concentration shown to effectively inhibit the two predominant transaminases, alanine aminotransferase (ALT) and aspartate aminotransferase (AST) (Figure 1C) (Wise et al., 2008), or rapamycin in the presence of α-15N-labeled glutamine. Subsequently, we measured 15N-labeling patterns and metabolite levels of alanine, an amino acid that is predominately produced by a transaminase-catalyzed reaction (Possemato et al., 2011). We found that AOA dramatically decreased 15N contribution and metabolite levels of alanine, while rapamycin only mildly affected the 15N contribution to this amino acid and showed no effect on alanine levels compared to the control condition (Figures 1J & S1E). In conclusion, these data demonstrate that GDH, not transaminases, plays a major role in the regulation of glutamine metabolism downstream of mTORC1.
mTORC1 controls GDH activity by repressing SIRT4
As our results show that mTORC1 regulates glutamate dehydrogenase, we sought to identify the molecular mechanism. SIRT4 is a negative regulator of GDH activity through ADP-ribosylation (Haigis et al., 2006), thus suggesting that mTORC1 potentially controls this step of glutamine metabolism via SIRT4. To test this possibility, we first assessed the ADP-ribosylation status of GDH by introducing biotin-labeled NAD followed by immunoprecipitation using avidin-coated beads. Rapamycin treatment led to an increase in the mono-ADP-ribosylation status of GDH, similar to that observed in cells stably expressing SIRT4 (Figure 2A). Importantly, we found that the knockdown of SIRT4 abrogated the rapamycin-induced decrease in the activity of GDH (Figures 2B & S2A). Strikingly, SIRT4 protein levels were increased upon mTORC1 inhibition in MEFs (Figures 2C). This regulation was confirmed in both DLD1 and DU145 cells (Figures 2D). Remarkably, rapamycin potently increased SIRT4 levels after 6h of treatment (Figure S2B), correlating with reduced glutamine consumption at the same time point (data not shown). In contrast, SIRT4 levels were not influenced by the treatment of MEFs with U0216, an inhibitor of MEK1/2 in the MAPK pathway (Figure S2C). All other mTOR catalytic inhibitors tested in Tsc2−/− MEFs also resulted in increased SIRT4 protein levels (Figure S2D). To evaluate a potential regulation of SIRT4 by mTORC2, we performed RNA interference (RNAi) experiments of either raptor or the mTORC2 component, rictor, in Tsc2−/− MEFs. The knockdown of raptor, but not rictor, was sufficient to increase SIRT4 protein levels, confirming the role of the mTORC1 pathway in the regulation of SIRT4 (Figure 2E). To investigate whether mTORC1 regulation of SIRT4 occurs in tumor samples, a TSC-xenograft model was used. We injected a TSC2−/− rat leiomyoma cell line; ELT3 cells, expressing either an empty vector (V3) or TSC2 (T3), in the flank of nude mice. SIRT4 levels were dramatically increased in TSC2-expressing tumors compared to empty vector samples (Figure S2E). In addition, we assessed the levels of SIRT4 in both ELT3 xenograft tumors and in mouse Tsc2+/− liver tumors after rapamycin treatment. As expected, these tumor samples exhibited robust elevation of SIRT4 after rapamycin treatment (Figures 2F & S2F). Thus, these data demonstrate that the mTORC1 pathway represses SIRT4 in several tumor systems.
Figure 2 mTORC1 controls glutamate dehydrogenase activity by repressing SIRT4
CREB2 regulates the transcription of SIRT4 in an mTORC1-dependent fashion
We next asked whether the mTORC1-dependent regulation of SIRT4 occurred at the mRNA level. Quantitative RT-PCR results show that rapamycin treatment significantly increased the expression of SIRT4mRNA in Tsc2−/− MEFs (Figure 3A). SIRT4 mRNA levels were dramatically reduced in Tsc2−/− MEFs compared to their WT counterpart (Figure 3B). Similar results were obtained from transcriptional profiling analysis of the SIRT4 gene from a previously published dataset (GSE21755) (Figure 3C) (Duvel et al. 2010). Altogether, our data demonstrate that mTORC1 negatively regulates the transcription of SIRT4. To determine whether CREB2 is involved in the mTORC1-dependent regulation of SIRT4, we performed RNAi experiments. The silencing of CREB2 abolished the rapamycin-induced expression of SIRT4 (Figures 3E & S3A). The knockdown of CREB1 did not affect the upregulation of SIRT4 upon mTORC1 inhibition, thus demonstrating the specificity of CREB2 to induce SIRT4 (Figure S3B), and the knockdown of CREB2 significantly abrogated the rapamycin-induced increase in the activity of the SIRT4 promoter.
Figure 3 SIRT4 is regulated at the mRNA level in an mTORC1-dependent fashion
mTORC1 regulates the stability of CREB2
We next investigated whether the mTORC1 pathway regulates CREB2. Although we did not observe major changes in Creb2 mRNA in normal growth conditions (Figure S4A), mTORC1 inhibition resulted in accumulation of CREB2 protein levels by 2h of rapamycin treatment (Figure 4A). U0126 failed to cause the accumulation of CREB2 (Figure S4B). In contrast, CREB1 protein levels were not affected after 24h rapamycin treatment (Figure S4C). As observed for SIRT4, mTOR catalytic inhibitors, and the specific knockdown of mTOR, resulted in upregulation of CREB2 protein levels (Figures S4D & S4E). CREB2 is upregulated in diverse cell types as a response to a variety of stresses, including hypoxia, DNA damage, and withdrawal of GFs, glucose, and aa (Cherasse et al., 2007; Rouschop et al., 2010; Yamaguchi et al., 2008;Whitney et al., 2009). Interestingly, mTORC1 is negatively regulated by all of these environmental inputs (Zoncu et al., 2011). Since mTORC1 signaling in Tsc2−/− MEFs is insensitive to serum deprivation, we assessed the role of aa withdrawal and re-stimulation on CREB2 levels. As shown in Fig. 4B, CREB2 accumulated upon aa deprivation, and was decreased following aa re-addition. This phenomenon required the action of the proteasome as MG132 efficiently blocked CREB2 degradation following aa re-addition. Importantly, we found that mTORC1 inhibition abrogated the aa-induced decrease of CREB2 (Figure 4B).
Figure 4 mTORC1 regulates the stability of CREB2
mTORC1 activation promotes the binding of CREB2 to βTrCP and modulates CREB2 ubiquitination
Next, we attempted to identify the E3 ubiquitin ligase that might be responsible for CREB2 turnover. Consistent with a recent study, we found CREB2 to bind the E3 ligase, βTrCP (Frank et al., 2010). However, other related E3 ligases including Fbxw2, Fbxw7a, and Fbxw9 did not bind to CREB2 (data not shown). The interaction of CREB2 with Flag-βTrCP1 was enhanced in the presence of insulin, and was abolished by rapamycin pretreatment (Figure 4D). Importantly, insulin treatment promoted the ubiquitination of CREB2 in an mTORC1-dependent fashion (Figure 4E). Altogether, our results support the notion that the mTORC1 pathway regulates the targeting of CREB2 for proteasome-mediated degradation. βTrCP binds substrates via phosphorylated residues in conserved degradation motifs (degrons), typically including the consensus sequence DpSGX(n)pS or similar variants. We found an evolutionary conserved putative βTrCP binding site (DSGXXXS) in CREB2 (Figure 4F). Interestingly, we noted a downward mobility shift in CREB2 protein with mTORC1 inhibition, consistent with a possible decrease in the phosphorylation of CREB2. (Figure 4A). Frank et al. (2010) showed that phosphorylation of the first serine in the degron motif corresponding to Ser218 is required for the CREB2/βTrCP interaction, and this modification acts as a priming site for a gradient of phosphorylation events on five proline-directed residues codons (T212, S223, S230, S234, and S247) that is required for CREB2 degradation during the cell cycle progression (Frank et al., 2010). Consistent with these observations, we found that the mutation of the five residues to alanine (5A mutant) resulted in strong stabilization of CREB2, comparable to the serine-to-alanine mutation on the priming Ser218 phosphorylation site (Figure S4G).
SIRT4 represses bioenergetics and cell proliferation
We observed that glutamine utilization is repressed by rapamycin treatment (Figure 1) and SIRT4 is induced by mTORC1 inhibition (Figure 2). Thus, we tested whether SIRT4 itself directly regulates cellular glutamine uptake. The stable expression of SIRT4 resulted in the repression of glutamine uptake in Tsc2−/− MEFs and DLD1 cells (Figures 5A & 5B). Glucose uptake was not affected by SIRT4 expression (data not shown). Because glutamine can be an important nutrient for energy production, we examined ATP levels in SIRT4 expressing cells. Consistent with reduced glutamine consumption, the expression of SIRT4 in Tsc2−/− cells resulted in decreased ATP/ADP ratio compared to control cells (Figure 5C). Cells produce ATP via glycolysis and oxidative phosphorylation (OXPHOS). To test the contribution of mitochondrial metabolism versus glycolysis to ATP, we measured the ATP/ADP ratio after the treatment with oligomycin, an inhibitor of ATP synthesis from OXPHOS. Importantly, the difference of the ATP/ADP ratio between control and SIRT4 expressing cells was abrogated by oligomycin (Figure 5C), further demonstrating that SIRT4 may repress the ability of cells to generate energy from mitochondrial glutamine catabolism. Mitochondrial glutamine catabolism is essential for energy production and viability in the absence of glucose (Yang et al., 2009, Choo et al., 2010). Thus, we examined the effect of SIRT4 on the survival of Tsc2−/− MEFs during glucose deprivation. Control cells remained viable following 48h of glucose deprivation. Conversely, SIRT4 expressing cells showed a dramatic increase in cell death under glucose-free conditions, which was rescued by the addition of the cell permeable dimethyl-I̧KG (DM-I̧KG) (Figure 5D). Conversely, the expression of SIRT4 did not affect the viability of glucose-deprived Tsc2 WT MEFs (Figure S5A). Glucose deprivation also induced death of the human DU145 cancer cell line stably expressing SIRT4 (data not shown).
Figure 5 SIRT4 represses bioenergetics and proliferation
Glutamine is an essential metabolite for proliferating cells, and many cancer cells exhibit a high rate of glutamine consumption (DeBerardinis et al., 2007). Thus, decreased glutamine uptake in DLD1 and DU145 cancer cells expressing SIRT4 might result in decreased proliferation. Indeed, these cells grew significantly slower than did control cells. Remarkably, DM-I̧KG completely abrogated the decreased proliferation of SIRT4 expressing cells (Figure 5E & 5F), suggesting that repressed glutamine metabolism drove the reduced proliferation of cells expressing SIRT4. The expression of SIRT4 also slowed the proliferation of Tsc2−/− MEFs but did not affect Tsc2 WT MEFs (Figures S5B & S5C). Finally, to rule out that the effect on proliferation was due to aberrant localization and to off-target effects of the overexpressed protein, we examined the localization of HA-SIRT4. We found that SIRT4 is co-localized with the MitoTracker, a mitochondrial-selective marker (Figure S5D). Taken together, these data demonstrate that SIRT4 is a critical negative regulator of mitochondrial glutamine metabolism and cell proliferation.
SIRT4 represses TSC-tumor development
Recent studies have demonstrated a major role of glutamine metabolism in driving oncogenic transformation of many cell lines (Gao et al., 2009; Wang et al., 2011). Since SIRT4 expression represses glutamine uptake and cell proliferation (Figure 5), we hypothesized that it could affect tumorigenesis. To test this idea, we assessed the role of SIRT4 in cell transformation by using an anchorage-independent growth assay. SIRT4 expression reduced the ability of Tsc2−/−p53−/− MEFs to grow in soft agar. However, the expression of SIRT4 in Tsc2+/+p53−/− did not impair their colony formation properties (Figure 6A). Tumor incidence in mice injected with Tsc2+/+p53−/− MEFs was not affected by SIRT4 (data not shown). Conversely, in the Tsc2−/−p53−/− cohort, SIRT4 reduced tumor incidence by 20 days at median (Figure 6B). SIRT4 expression inTsc2−/−p53−/− MEFs resulted in reduction of Ki-67 positivity by 60% (Figure 6E), consistent with the finding that SIRT4 inhibits the proliferation of these cells in vitro (Figure S5B). Finally, we performed a comprehensive meta-analysis of SIRT4 expression in human tumors and found significantly lower expression levels of SIRT4, relative to normal tissue, in bladder, breast, colon, gastric, ovarian and thyroid carcinomas (Figure 6F). Interestingly, loss of SIRT4 expression showed a strong association with shorter time to metastasis in patients with breast cancer (Figures 6G & 6H). Altogether, these data strongly suggest that SIRT4 delays tumorigenesis regulated by the mTORC1 pathway.
Figure 6 SIRT4 suppresses TSC-tumor development
The pharmacologic inhibition of glutamine anaplerosis synergizes with glycolytic inhibition to induce the specific death of mTORC1 hyperactive cells
The activation of mTORC1 leads to glucose and glutamine addiction as a result of increased uptake and metabolism of these nutrients (Choo et al., 2010; Duvel et al., 2010 & Figure 1). These observations suggest that targeting this addiction offers an interesting therapeutic approach for mTORC1-driven tumors. The alkylating agent, mechlorethamine (Mechlo), incites cell toxicity in part by the inhibition of the GAPDH step of glycolysis via poly-ADP ribose polymerase (PARP)-dependent cellular consumption of cytoplasmic NAD+. The ultimate consequence is glycolytic inhibition, thus mimicking glucose deprivation (Zong et al., 2004). Treatment of Tsc2−/− MEFs with Mechlo decreased both NAD levels and lactate production (Figure 7A and data not shown). The decrease in NAD+ levels was rescued by addition of DPQ (Figure 7A), a PARP inhibitor (Zong et al., 2004). We next tested the ability of glutamine inhibition to determine the sensitivity of Tsc2−/− MEFs to Mechlo. As shown in Figure 7B, the treatment with EGCG, a GDH inhibitor (Figure 1G), potently synergized with Mechlo to kill Tsc2−/− MEFs with the greatest effect observed at 30μM (Figure 7B). As a result, this combination dramatically increased the cleavage of PARP, an apoptotic marker (Figure 7E). Similarly, glutamine deprivation sensitized Tsc2−/− MEFs to Mechlo (data not shown). The RNAi-mediated knockdown of GDH also synergized with Mechlo to induce death of Tsc2−/− MEFs (Figure 7D). Importantly, at these concentrations the combination did not induce death of a Tsc2-rescued cell line (Figure 7C).
Figure 7 The combination of glutamine metabolism inhibitors with glycolytic inhibition is an effective therapy to kill Tsc2−/− and PTEN−/− cells
http://www.ncbi.nlm.nih.gov/pmc/articles/PMC3684628/bin/nihms-474527-f0007.gif
Because the metabolic properties of cells with activated mTORC1 by Tsc2– deficiency can be efficiently targeted, we also examined other cell types in which mTORC1 is hyperactive by the loss of PTEN. We found that the combination of Mechlo and EGCG was also effective to induce specific toxicity of PTEN−/− MEFs, while PTEN+/+ MEFs were not affected (Figures S7A & S7B). In addition, the PTEN-deficient human prostate adenocarcinoma cell line, LNCaP, was also sensitive to treatment with Mechlo and EGCG (Figure 7F). This effect was specifically due to lack of TCA cycle replenishment as pyruvate supplementation completely reversed the synergistic effect (Figure 7F). The combination of Mechlo with the GLS1 inhibitor, BPTES (Figure 1G), also resulted in decreased viability of Tsc2−/− cells but not of Tsc2-reexpressing cells (Figures S7C & S7D). Again, death in Tsc2−/− cells was rescued with pyruvate or OAA (Figure S7E). To further investigate if the potent cell death in Tsc2−/− was restricted to Mechlo, we used 2-DG, a glycolytic inhibitor. The combination of 2-DG with either EGCG or BPTES resulted in enhanced cell death of Tsc2−/− MEFs compared to single agent treatments (Figure S7F). This effect was also specific to Tsc2−/− cells, since this combination was less toxic in Tsc2-reexpressing MEFs (Figure S7G). Taken together, our results demonstrate that the combination treatments aimed at inhibiting glycolysis and glutaminolysis potently synergize to kill cells with hyperactive mTORC1 signaling.
Here, we define a novel mTORC1-regulated pathway that controls glutamine-dependent anaplerosis and energy metabolism (Figure 7G). We discovered that the mTORC1 pathway regulates glutamine metabolism by promoting the activity of GDH (Figures 1–-3).3). We show that this regulation occurs by repressing the expression of SIRT4, an inhibitor of GDH (Figures 2 & 3). Molecularly, this is the result of mTORC1-dependent proteasome-mediated degradation of the SIRT4 transcriptional regulator, CREB2 (Figure 4). Interestingly, the modulation of CREB2 levels correlates with increased sensitivity to glutamine deprivation (Ye et al., 2010; Qing et al., 2012), fitting with our model of glutamine addiction as a result of mTORC1 activation (Choo et al., 2010). Our data suggest that mTORC1 promotes the binding of the E3 ligase, βTrCP, to CREB2 (Figure 4D), promoting CREB2 degradation by the proteasome (Figure 4E). A previous study has demonstrated that five residues in CREB2 located next to the βTrCP degron are required for its stability (Frank et al., 2010). Accordingly, the mutation of these residues to alanine resulted in stabilization of CREB2 and SIRT4 following insulin and aa-dependent mTORC1 activation (Figure 4G). Future work is aimed at determining if mTORC1 and/or downstream kinases are directly responsible for the multisite phosphorylation of CREB2.
The identification of CREB2 as an mTORC1-regulated transcription factor increases the repertoire of transcriptional regulators modulated by this pathway including HIF1α (glycolysis), Myc (glycolysis) and SREBP1 (lipid biosynthesis) (Duvel et al., 2010; Yecies and Manning, 2011). The oncogene Myc has also been linked to the regulation of glutamine metabolism by increasing the expression of the surface transporters ASCT2 and SN2, and the enzyme GLS. Thus, enhanced activity of Myc correlates with increased glutamine uptake and glutamate production (Wise et al., 2008; Gao et al., 2009). Our findings describe a new level of control to this metabolic node as shown by the modulation of the glutamate-to-αKG flux (Figure 2). This regulation is particularly relevant as some cancer cells produce more than 50% of their ATP by oxidizing glutamine-derived αKG in the mitochondria (Reitzer et al JBC, 1979). Therefore, these studies support the notion that Myc and CREB2/SIRT4 cooperate to regulate the metabolism of glutamine to αKG.
7.8.4 Rab1A and small GTPases Activate mTORC1
7.8.4.1 Rab1A Is an mTORC1 Activator and a Colorectal Oncogene
Thomas JD1, Zhang YJ2, Wei YH3, Cho JH3, Morris LE3, Wang HY4, Zheng XF5.
Cancer Cell. 2014 Nov 10; 26(5):754-69.
http://dx.doi.org:/10.1016/j.ccell.2014.09.008.
Highlights
- Rab1A mediates amino acid signaling to activate mTORC1 independently of Rag
- Rab1A regulates mTORC1-Rheb interaction on the Golgi apparatus
- Rab1A is an oncogene that is frequently overexpressed in human cancer
- Hyperactive amino acid signaling is a common driver for cancer
Amino acid (AA) is a potent mitogen that controls growth and metabolism. Here we describe the identification of Rab1 as a conserved regulator of AA signaling to mTORC1. AA stimulates Rab1A GTP binding and interaction with mTORC1 and Rheb-mTORC1 interaction in the Golgi. Rab1A overexpression promotes mTORC1 signaling and oncogenic growth in an AA- and mTORC1-dependent manner. Conversely, Rab1A knockdown selectively attenuates oncogenic growth of Rab1-overexpressing cancer cells. Moreover, Rab1A is overexpressed in colorectal cancer (CRC), which is correlated with elevated mTORC1 signaling, tumor invasion, progression, and poor prognosis. Our results demonstrate that Rab1 is an mTORC1 activator and an oncogene and that hyperactive AA signaling through Rab1A overexpression drives oncogenesis and renders cancer cells prone to mTORC1-targeted therapy.
7.8.4.2 Regulation of TOR by small GTPases
Raúl V Durán1 and Michael N Halla,1
EMBO Rep. 2012 Feb; 13(2): 121–128.
http://dx.doi.org/10.1038%2Fembor.2011.257
TOR is a conserved serine/threonine kinase that responds to nutrients, growth factors, the bioenergetic status of the cell and cellular stress to control growth, metabolism and ageing. A diverse group of small GTPases including Rheb, Rag, Rac1, RalA and Ryh1 play a variety of roles in the regulation of TOR. For example, while Rheb binds to and activates TOR directly, Rag and Rac1 regulate its localization and RalA activates it indirectly through the production of phosphatidic acid. Here, we review recent findings on the regulation of TOR by small GTPases.
The growth-controlling TOR signalling pathway is structurally and functionally conserved from unicellular eukaryotes to humans. TOR, an atypical serine/threonine kinase, was originally discovered inSaccharomyces cerevisiae as the target of rapamycin (Heitman et al, 1991). It was later described in many other organisms including the protozoan Trypanosoma brucei, the yeast Schizosaccharomyces pombe, photosynthetic organisms such as Arabidopsis thaliana and Chlamydomonas reinhardtii, and in metazoans such as Caenorhabditis elegans, Drosophila melanogaster and mammals. TOR integrates various stimuli to control growth, metabolism and ageing (Avruch et al, 2009; Kim & Guan, 2011; Soulard et al, 2009;Wullschleger et al, 2006; Zoncu et al, 2011a). In mammals, mTOR is activated by nutrients, growth factors and cellular energy, and is inhibited by stress. Thus, the molecular regulation of TOR is complex and diverse. Among the increasing number of TOR regulators, small GTPases are currently garnering much attention. Small GTPases (20–25 kDa) are either in an inactive GDP-bound form or an active GTP-bound form (Bos et al, 2007). GDP–GTP exchange is regulated by GEFs, which mediate the replacement of GDP by GTP, and by GAPs, which stimulate the intrinsic GTPase activity of a cognate GTPase to convert GTP into GDP (Fig 1). Upon activation, small GTPases interact with effector proteins, thereby stimulating downstream signalling pathways. Small GTPases constitute a superfamily that comprises several subfamilies, such as the Rho, Ras, Rab, Ran and Arf families. Rheb, Rag, RalA, Rac1 and Ryh1, all members of the small GTPase superfamily, play a role in the concerted regulation of TOR by different stimuli. This review summarizes recent advances in the understanding of TOR regulation by these small GTPases.

Regulation of small GTPases by GEFs and GAPs
http://www.ncbi.nlm.nih.gov/pmc/articles/PMC3271343/bin/embor2011257f1.gif
Figure 1 Regulation of small GTPases by GEFs and GAPs. A guanine nucleotide exchange factor (GEF) replaces GDP with GTP to activate the signalling function of the GTPase. Conversely, a GTPase-activating protein (GAP) stimulates hydrolysis of GTP into GDP
The TOR complexes
TOR is found in two functionally and structurally distinct multiprotein complexes, named TORC1 and TORC2 (Avruch et al, 2009; Kim & Guan, 2011; Soulard et al, 2009; Wullschleger et al, 2006; Zoncu et al, 2011a). TORC1 regulates several cellular processes including protein synthesis, ribosome biogenesis, nutrient uptake and autophagy. TORC2, in turn, regulates actin cytoskeleton organization, cell survival, lipid synthesis and probably other processes. TORC1 and TORC2 are rapamycin-sensitive and rapamycin-insensitive, respectively, although in some organisms, for example A. thaliana and T. brucei, this rule does not apply (Barquilla et al, 2008; Mahfouz et al, 2006). Nevertheless, long-term treatment with rapamycin can also indirectly inhibit TORC2 in mammalian cell lines (Sarbassov et al, 2006). Furthermore, there is accumulating evidence that not all TORC1 readouts are rapamycin-sensitive (Choo & Blenis, 2009; Dowling et al, 2010; Peterson et al, 2011).
Upstream of TOR
Four main inputs regulate mTORC1: nutrients, growth factors, the bioenergetic status of the cell and oxygen availability. It is well established that growth factors activate mTORC1 through the PI3K–AKT pathway. Once activated, AKT phosphorylates and inhibits the heterodimeric complex TSC1–TSC2, a GAP for Rheb and thus an inhibitor of mTORC1 (Avruch et al, 2009). The TSC1–TSC2 heterodimer is a ‘reception centre’ for various stimuli that are then transduced to mTORC1, including growth factor signals transduced through the AKT and ERK pathways, hypoxia through HIF1 and REDD1, and energy status through AMPK (Wullschleger et al, 2006). In addition to the small GTPases Rheb and Rag (see below), PA also binds to and activates mTORC1 (Fang et al, 2001). Pharmacological or genetic inhibition of PA production, through the inhibition of PLD, impairs activation of mTORC1 by nutrients and growth factors (Fang et al, 2001). Moreover, elevated PLD activity leads to rapamycin resistance in human breast cancer cells (Chen et al, 2003), further supporting a role for PA as an mTORC1 regulator. As discussed below, the small GTPase RalA participates in the mechanism by which PA activates mTORC1 (Maehama et al, 2008; Xu et al, 2011).
In the case of nutrients, amino acids in particular, several elements mediate the activation of TORC1. As discussed below, the Rag GTPases are necessary to activate TORC1 in response to amino acids (Binda et al, 2009; Kim et al, 2008; Sancak et al, 2008). In mammals, it has also been proposed that amino acids stimulate an increase in intracellular calcium concentration, which in turn activates mTORC1 through the class III PI3K Vps34 (Gulati et al, 2008).
Downstream of TOR
TORC1 regulates growth-related processes such as transcription, ribosome biogenesis, protein synthesis, nutrient transport and autophagy (Wullschleger et al, 2006). In mammals, the best-characterized substrates of mTORC1 are S6K and 4E-BP1, through which mTORC1 stimulates protein synthesis. mTORC1 activates S6K, which is a positive regulator of protein synthesis, and inhibits 4E-BP1, which is a negative regulator of protein synthesis. Upon phosphorylation by mTORC1, 4E-BP1 releases eIF4E. Once released from 4E-BP1, eIF4E interacts with the eIF4G subunit of the eIF4F complex, allowing initiation of translation. In mammals, 4E-BP1 participates mainly in the regulation of cell proliferation and metabolism (Dowling et al, 2010). In S. cerevisiae, the main substrate of TORC1 is the S6K orthologue Sch9 (Urban et al, 2007). Sch9 is required for the activation of ribosome biogenesis and translation initiation stimulated by TORC1. Furthermore, it participates in TORC1-dependent inhibition of G0 phase entry.
Regulation of TOR by Rheb
The small GTPase Rheb was first identified in 1994 in a screen for genes induced in neurons in response to synaptic activity (Yamagata et al, 1994), and was first described to interact with the Raf1 kinase (Yee & Worley, 1997). A later report showed that loss of Rhb1, the Rheb orthologue in S. pombe, causes a starvation-like growth arrest (Mach et al, 2000). In 2003, several independent groups working with mammalian cells in vitro and Drosophila in vivo demonstrated that Rheb is the target of the TSC1–TSC2 GAP and a TORC1 activator (Avruch et al, 2009).
Interestingly, the Rheb–mTOR interaction both in vivo and in vitro does not depend on GTP loading of Rheb. This is unusual for GTPases as GTP loading usually regulates effector binding. However, GTP loading of Rheb is crucial for the activation of mTOR kinase activity (Sancak et al, 2007). Conversely, mTOR becomes inactive after association with a nucleotide-deficient Rheb (Long et al, 2005a; Fig 2). Similar results were obtained in S. pombe, making use of mutations that hyperactivate Rheb by increasing its overall GTP : GDP binding ratio (Urano et al, 2005). In contrast to the situation in mammals, interaction of Rheb with SpTOR2 in fission yeast is detected only with a hyperactive Rheb mutant. This suggests that, in S. pombe, Rheb binds to SpTOR2 in a GTP-dependent manner.

Rheb activates TORC1
http://www.ncbi.nlm.nih.gov/pmc/articles/PMC3271343/bin/embor2011257f2.gif
Figure 2 Rheb activates TORC1 both directly and indirectly. GTP-bound Rheb interacts directly with TORC1 to activate TORC1 kinase. GTP-bound Rheb also activates RalA, which activates PLD to increase production of PA. PA in turn interacts with TORC1
In addition to the direct interaction between mTOR and Rheb, activation of PA production by Rheb is an additional mechanism by which Rheb might regulate mTORC1. Rheb binds to and activates PLD in a GTP-dependent manner (Sun et al, 2008). PLD produces PA, which binds directly to and upregulates mTORC1. This finding reveals cross-talk between the TSC–Rheb and the PA pathways in the regulation of mTORC1 signalling. A recent study by Yoon and colleagues further demonstrated the role of PLD in mTORC1 regulation (Yoon et al, 2011). They showed that amino acids activate PLD through translocation of PLD to the lysosomal compartment. This translocation is positively regulated by human Vps34 and is necessary for the activation of mTORC1 by amino acids. These authors propose the existence of a Vps34–PLD1 pathway that activates mTORC1 in parallel to the Rag pathway (Yoon et al, 2011).
Although Rheb is required for the activation of mTORC1 by amino acids, Rheb itself does not participate in amino acid sensing, and GTP-loading of Rheb is not affected by amino acid depletion (Long et al, 2005b). Furthermore, amino acid depletion inhibits mTORC1 even in TSC2−/− fibroblasts (Roccio et al, 2006). Nevertheless, interaction of mTORC1 with Rheb depends on amino acid availability (Long et al, 2005b). As discussed below, the current model proposes that amino acids mediate translocation of mTORC1 to the lysosomal surface where mTORC1 interacts with and is activated by GTP-loaded Rheb (Sancak et al, 2008).
Regulation of TOR by Rag
Rag GTPases have unique features among the Ras GTPase subfamily members: they form heterodimers and lack a membrane-targeting sequence (Nakashima et al, 1999; Sekiguchi et al, 2001). Gtr1 in S. cerevisiaewas the first member of this GTPase subfamily to be identified (Bun-Ya et al, 1992). The mammalian RagA and RagB GTPases were later described as Gtr1 orthologues (Hirose et al, 1998). Gtr2 in yeast (Nakashima et al, 1999) and its mammalian orthologues RagC and RagD (Sekiguchi et al, 2001) were subsequently discovered due to their ability to form heterodimers with Gtr1 in yeast and RagA and RagB in mammals, respectively. The crystal structure of the Gtr1–Gtr2 complex has been determined recently (Gong et al, 2011). Gtr1 and Gtr2 have similar structures, organized in two domains: an amino-terminal GTPase domain (designated as the G domain) and a carboxy-terminal domain. The Gtr1–Gtr2 heterodimer presents a pseudo-twofold symmetry resembling a horseshoe. The crystal structure reveals that Gtr1–Gtr2 dimerization results from extensive contacts between the C-terminal domains of both proteins, while the G domains do not contact each other (Gong et al, 2011).

Rag proteins mediate the activation of TORC1 in response to amino acids.
http://www.ncbi.nlm.nih.gov/pmc/articles/PMC3271343/bin/embor2011257f3.gif
Figure 3 Rag proteins mediate the activation of TORC1 in response to amino acids. The RagA/B–RagC/D heterodimer is anchored to the MP1–p14–p18 complex on the surface of the lysosome.
Overexpressed Rheb is mislocalized throughout the cell, and therefore interaction of mTORC1 with Rheb does not require amino-acid-induced translocation of mTORC1 to the lysosome. The model is further supported by observations in Drosophila showing that expression of a constitutively active mutant of RagA significantly increases the size of individual cells, whereas expression of a dominant negative mutant of RagA reduces cell size (Kim et al, 2008). Moreover, Rag plays a role in TORC1-mediated inhibition of autophagy both in Drosophila (Kim et al, 2008) and in human cells (Narita et al, 2011).
mTOR and small GTPases are therapeutic targets in the treatment of cancer (Berndt et al, 2011; Dazert & Hall, 2011). Aberrant activation of GTPases, including Ras, Rho, Rab or Ran GTPases, promotes cell transformation and cancer (Agola et al, 2011; Ly et al, 2010; Pylayeva-Gupta et al, 2011), in some cases by acting in the mTOR pathway. Targeting GTPases by using farnesyltransferase inhibitors or geranylgeranyltransferase inhibitors affects signal transduction pathways, cell cycle progression, proliferation and cell survival. Both types of inhibitor are currently under investigation for cancer therapy, although only a small subset of patients responds to these inhibitors (Berndt et al, 2011). A better understanding of the relationship between GTPases and mTOR is essential for the design of combined therapies.
From a mechanistic point of view, research on TOR in different systems is continually adding new insight on the role of TOR in cell biology. However, what is lacking is an integration of the various proposed regulators of TOR, in particular small GTPases (see Sidebar A).
Sidebar A | In need of answers
- How are amino acids sensed by the cell?
- What is the mechanism by which amino acids regulate the GTP-loading of Rag proteins? What are the GEF and GAP for the Rag proteins?
- Is there a GEF that regulates the GTP-loading of Rheb?
- What is the molecular mechanism by which Rheb activates TORC1?
- How is the dual effect of Rac1 being both upstream and downstream from TOR regulated?
- How are the diverse GTPases that impinge on TOR integrated?
7.8.5 PI3K.Akt signaling in osteosarcoma
Zhang J1, Yu XH2, Yan YG1, Wang C1, Wang WJ3.
Clin Chim Acta. 2015 Apr 15; 444:182-192.
http://dx.doi.org:/10.1016/j.cca.2014.12.041
Highlights
- Activation of the PI3K/Akt signaling regulates various cellular functions.
- The PI3K/Akt signaling may play a key role in the progression of osteosarcoma.
- Targeting the PI3K/Akt signaling has therapeutic potential for osteosarcoma.
Osteosarcoma (OS) is the most common nonhematologic bone malignancy in children and adolescents. Despite the advances of adjuvant chemotherapy and significant improvement of survival, the prognosis remains generally poor. As such, the search for more effective anti-OS agents is urgent. The phosphatidylinositol 3-kinase (PI3K)/Akt pathway is thought to be one of the most important oncogenic pathways in human cancer. An increasing body of evidence has shown that this pathway is frequently hyperactivated in OS and contributes to disease initiation and development, including tumorigenesis, proliferation, invasion, cell cycle progression, inhibition of apoptosis, angiogenesis, metastasis and chemoresistance. Inhibition of this pathway through small molecule compounds represents an attractive potential therapeutic approach for OS. The aim of this review is to summarize the roles of the PI3K/Akt pathway in the development and progression of OS, and to highlight the therapeutic potential of targeting this signaling pathway. Knowledge obtained from the application of these compounds will help in further understanding the pathogenesis of OS and designing subsequent treatment strategies.

PK.Akt signaling
http://ars.els-cdn.com/content/image/1-s2.0-S0009898115001059-gr1.sml
PI3K/Akt signaling

PI3K.Akt signaling pathway
http://ars.els-cdn.com/content/image/1-s2.0-S0009898115001059-gr2.sml
PI3K/Akt signaling pathway

PK.Akt therapeutic target
http://ars.els-cdn.com/content/image/1-s2.0-S0009898115001059-gr3.sml
PK/Akt therapeutic target
7.8.6 The mTORC1-S6K1 Pathway Regulates Glutamine Metabolism through the eIF4B-Dependent Control of c-Myc Translation
Csibi A1, Lee G1, Yoon SO1, Tong H2,…, Fendt SM4, Roberts TM2, Blenis J5.
Curr Biol. 2014 Oct 6; 24(19):2274-80.
http://dx.doi.org:/10.1016/j.cub.2014.08.007
Growth-promoting signaling molecules, including the mammalian target of rapamycin complex 1 (mTORC1), drive the metabolic reprogramming of cancer cells required to support their biosynthetic needs for rapid growth and proliferation. Glutamine is catabolyzed to α-ketoglutarate (αKG), a tricarboxylic acid (TCA) cycle intermediate, through two deamination reactions, the first requiring glutaminase (GLS) to generate glutamate and the second occurring via glutamate dehydrogenase (GDH) or transaminases. Activation of the mTORC1 pathway has been shown previously to promote the anaplerotic entry of glutamine to the TCA cycle via GDH. Moreover, mTORC1 activation also stimulates the uptake of glutamine, but the mechanism is unknown. It is generally thought that rates of glutamine utilization are limited by mitochondrial uptake via GLS, suggesting that, in addition to GDH, mTORC1 could regulate GLS. Here we demonstrate that mTORC1 positively regulates GLS and glutamine flux through this enzyme. We show that mTORC1 controls GLS levels through the S6K1-dependent regulation of c-Myc (Myc). Molecularly, S6K1 enhances Myc translation efficiency by modulating the phosphorylation of eukaryotic initiation factor eIF4B, which is critical to unwind its structured 5′ untranslated region (5’UTR). Finally, our data show that the pharmacological inhibition of GLS is a promising target in pancreatic cancers expressing low levels of PTEN.
Highlights
- The mTORC1 pathway positively regulates GLS and glutamine flux
- mTORC1 controls the translation efficiency of Myc mRNA
- S6K1 regulates Myc translation through eIF4B phosphorylation
- Inhibition of GLS decreases the growth of pancreatic cancer cells
Figure 1. The mTORC1 Pathway Regulates GLS1 (A–C and E) GLS protein levels in whole cell lysates from Tsc2 WT and Tsc22/2 MEFs treated with rapamycin (Rapa) for 8 hr (A); HEK293T cells stably expressing Rheb WT, the mutant S16H Rheb, or EV and treated with rapamycin for 24 hr (B); Tsc22/2 MEFs treated with rapamycin at the indicated time points (C); and Tsc2 WT and Tsc22/2 MEFs treated with the indicated compounds for 8 hr (E). The concentrations of the compounds were as follows: rapamycin, 20 ng/ml; LY294002 (LY), 20 mM; and BEZ235, 10 mM. (D) Time course of glutamine consumption in Tsc22/2 MEFs incubated with or without 20ng/ml rapamycin for 24 hr. Each time data point is an average of triplicate experiments. (F) Intracellular glutamine levels in Tsc22/2 MEFs treated with rapamycin for 24 hr. (G) Glutamineflux inTsc22/2 MEFs expressing an EV or re-expressingTSC2 treated with theindicated compounds for 24hr.The concentrations of the compounds were as follows: rapamycin 20 ng/ml; LY294002, 20 mM; BEZ235, 10 mM; BPTES, 10 mM; and 6-diazo-5-oxo-l-norleucine, 1mM. The mean is shown. Error bars represent the SEM from at least three biological replicates. Numbers below the immunoblot image represent quantification normalized to the loading control. See also Figure S1.
Figure2. The mTORC1 Pathway Regulates GLS1 via Myc GLS and Myc protein levels in whole cell lysates from BxPC3 cells transfected with a nontargeting control (NTC) siRNA or four independent siRNAs against Myc for 72 hr (A), Tsc2 WT and Tsc22/2 MEFs treated with rapamycin (20 ng/ml) for 8 hr (B), and Tsc22/2 MEFs stably expressing Myc or EV and treated with rapamycin (20 ng/ml) for 24 hr (C).
Figure 3. The mTORC1 Substrate S6K1 Controls GLS through Myc mRNA Translation (A) Normalized luciferase light units of Tsc22/2 MEFs stably expressing a Myc-responsive firefly luciferase construct (Myc-Luc) or vector control (pCignal Lenti-TRE Reporter). Myc transcriptional activity was measured after treatment with rapamycin (20 ng/ml) or PF4708671 (10 mM) for 8 hr. (B) GLS and Myc protein levels in whole cell lysates from HEK293T cells expressing HA-S6K1-CA (F5A-R3A-T389E) or EV treated with rapamycin (20 ng/ml) for 24 hr. HA, hemagglutinin. (CandD) Intracellular glutamine levels of Tsc22/2 MEFs stably expressing S6K-CA(F5A/R5A/T389E, mutating either the three arginines or all residues within the RSPRR motif to alanines shows the same effect; [10]) or empty vector and treated with rapamycin (20 ng/ml) or DMSO for 48 hr (C) or transfected with NTC siRNA or siRNA against both S6K1/2 (D). 24 hr posttransfection, cells transfected with NTC siRNA were treated with PF4708671 (10 mM) or DMSO for 48 hr. (E) Glutamine consumption of Tsc22/2 MEFs transfected with NTC siRNA or siRNA against both S6K1/2. 72 hr posttransfection, media were collected, and levels of glutamine in the media were determined. (F) Normalized luciferase light units of Tsc2WTMEFs transfected with thepDL-N reporter construct containing the 50 UTR of Myc under the control of Renilla luciferase. Firefly luciferase was used as an internal control. 48hr posttransfection, cells were treated with rapamycin (20ng/ml) or PF4708671 (10mM) for 8h. (G) Relative levels of Myc, Gls, and Actin mRNA in each polysomal gradient fraction. mRNA levels were measured by quantitative PCR and normalized to the 5S rRNA level. HEK293T cells were treated with rapamycin (20 ng/ml) for 24 hr, and polysomes were fractionated on sucrose density gradients. The values are averaged from two independent experiments performed in duplicate, and the error bars denote SEM (n = 4). (Hand I) GLS and Myc protein levels in whole cell lysates from Tsc22/2 MEFs transfected with NTC siRNA or two independent siRNAs against eIF4B for 72hr (H) and Tsc22/2 MEFs stably expressing eIF4B WT, mutant S422D, or EV) and treated with rapamycin for 24 hr (I). The mean is shown. Error bars represent the SEM from at least three biological replicates. The asterisk denotes a nonspecific band. The numbers below the immunoblot image represent quantification normalized to the loading control. See also Figures S2 and S3.
Figure 4. Inhibition of GLS Reduces the Growth of Pancreatic Cancer Cells (A) GLS and Myc protein levels in whole cell lysates from BxPC3, MIAPaCa-2, or AsPC-1 cells treated with rapamycin (20 ng/ml) or BEZ235 (1 mM) for 24 hr. (B) Glutamine consumption of BxPC3 or AsPC-1 cells 48 hr after plating. (Cand D) Soft agar assays with BxPC3 or AsPC-1 cells treated with BPTES (10 mM), the combination of BPTES (10 mM) + OAA (2 mM) (C) and BxPC3 or AsPC-1 cells treated with BPTES, and the combination of BPTES (10 mM) + NAC (10 mM) (D). NS, not significant. The mean is shown. Error bars represent the SEM from at least three biological replicates.
7.8.7 Localization of mouse mitochondrial SIRT proteins
Nakamura Y1, Ogura M, Tanaka D, Inagaki N.
Biochem Biophys Res Commun. 2008 Feb 1; 366(1):174-9
http://www.ncbi.nlm.nih.gov/pubmed/18054327#
Yeast silent information regulator 2 (SIR2) is involved in extension of yeast longevity by calorie restriction, and SIRT3, SIRT4, and SIRT5 are mammalian homologs of SIR2 localized in mitochondria. We have investigated the localization of these three SIRT proteins of mouse. SIRT3, SIRT4, and SIRT5 proteins were localized in different compartments of the mitochondria. When SIRT3 and SIRT5 were co-expressed in the cell, localization of SIRT3 protein changed from mitochondria to nucleus. These results suggest that the SIRT3, SIRT4, and SIRT5 proteins exert distinct functions in mitochondria. In addition, the SIRT3 protein might function in nucleus
Fig. 1. Localization of SIRT3, SIRT4, and SIRT5 in mitochondria. (A) Confocal microscopy. SIRT3-myc (upper panels), SIRT4-myc (middle panels), and SIRT5-FLAG (lower panels) were expressed in COS7 cells and immunostained with anti-myc antibody or anti-FLAG antibody. Mitochondria and nuclei were stained by MitoTracker Red and DAPI, respectively, and fluorescent images were obtained using a confocal microscope. (B) Fractionation of post-nuclear supernatant. SIRT3-myc, SIRT4-myc, and SIRT5-FLAG proteins each was expressed in COS7 cells, and the obtained PNS was fractionated into mitochondria-enriched precipitate (P1), microsome-enriched precipitate (P2), and supernatant (S) fractions. The three fractions were separated by SDS–PAGE and then analyzed by Western blotting using anti-myc antibody for SIRT3-myc and SIRT4-myc or anti-FLAG antibody for SIRT5-FLAG. Hsp60, calnexin, and GAPDH were used as endogenous markers for mitochondria, microsome, and cytosol, respectively. (C) Alkaline treatment of mitochondria. Mitochondria prepared from the COS7 cells expressing each of the SIRT3-myc, SIRT4-myc, and SIRT5-FLAG proteins were treated with Na2CO3. The reaction mixture was centrifuged to separate the precipitate and supernatant fractions, containing membrane-integrated proteins and soluble proteins, respectively. The two fractions were analyzed by Western blotting. Cytochrome c (cytc) and hsp60 were used as endogenous protein markers for mitochondrial soluble protein. (D) Submitochondrial fractionation. The mitochondria from COS7 cells expressing one of three SIRT proteins were treated with either H2O (hypotonic) or TX-100, and then treated with trypsin. The reaction mixtures were analyzed by Western blotting. Cytochrome c and hsp60 were used as endogenous markers for mitochondrial intermembrane space protein and matrix protein, respectively.
Fig. 2. Localization of SIRT3 when co-expressed with SIRT5. (A) Confocal microscopic analysis of COS7 cells expressing two of the three mitochondrial SIRT proteins. SIRT3-myc and SIRT5-FLAG (upper panels), SIRT3-myc and SIRT4-FLAG (middle panels), and SIRT4-myc and SIRT5-FLAG (lower panels) were co-expressed in COS7 cells, and immunostained using antibodies against myc tag and FLAG tag. Nuclei were stained by DAPI. (B) Subcellular fractionation of PNS. PNS of COS7 cells co-expressing SIRT3-myc and SIRT5-FLAG was fractionated into mitochondria-enriched precipitate (P1), microsome-enriched precipitate (P2), and supernatant (S) fractions, and these fractions along with whole cell lysate were analyzed by Western blotting. (C) Subcellular fractionation using digitonin. COS7 cells expressing either SIRT3-myc (left) or SIRT5-FLAG (middle) or both (right) were solubilized by digitonin, and the obtained lysate was centrifuged and fractionated into nuclear-enriched insoluble (INS), and soluble (SOL) fractions. Hsp60 and laminA/C were used as endogenous markers for mitochondria protein and nucleus protein, respectively.
Because the segment containing amino acid residues 66– 88 potentially forms a basic amphiphilic a-helical structure, it could serve as a MTS. To examine the role of this segment, SIRT3 mutant SIRT3mt, in which the four amino acid residues 72–75 were replaced by four alanine residues, was constructed (Fig. 3A). When SIRT3mt alone was expressed in COS7 cells, SIRT3mt protein was not detected in mitochondria but was widely distributed in the cell in confocal microscopic analysis (Fig. 3B, upper panels). In addition, when SIRT3mt and SIRT5 were co-expressed, the distribution of SIRT3mt protein was not changed compared to that expressed alone (Fig. 3B, lower panels). In fractionation of PNS, SIRT3mt protein was fractionated into S fraction both when SIRT3mt was expressed alone and when SIRT3mt and SIRT5 were co-expressed. SIRT5 protein was localized in mitochondria when SIRT3mt and SIRT5 were co-expressed (Fig. 3C). These results indicate that the MTS is necessary not only for targeting SIRT3 to mitochondria in the absence of SIRT5 but also for targeting SIRT3 to nucleus in the presence of SIRT5.
Fig. 3. Effect of disruption of putative mitochondrial targeting signal of SIRT3. (A) Alanine replacement of putative MTS of SIRT3. Four residues of the putative MTS of SIRT3 (amino acid residues 72–75) were replaced with four alanine residues. In the SIRT3mt sequence, amino acid residues identical with wild-type SIRT3 protein are indicated with dots. (B) Confocal microscopy. Immunofluorescent images of COS7 cells expressing SIRT3mt-myc alone (upper panels) or both SIRT3mt-myc and SIRT5-FLAG (lower panels) are shown. Mitochondria and nuclei were stained by MitoTracker Red and DAPI, respectively. (C) Subcellular fractionation of PNS. PNSs of COS7 cells expressing SIRT3mt-myc alone (an upper panel) or co-expressing SIRT3mt-myc and SIRT5-FLAG (middle and lower panels) were centrifuged and fractionated into mitochondria-enriched precipitate (P1), microsome-enriched precipitate (P2), and supernatant (S) fractions. The fractions were analyzed by Western blotting.
Fig. 4. Effect of disruption of putative nuclear localization signal of SIRT3. (A) Comparison of the amino acid sequences of putative NLS of SIRT3, SIRT3nu, and SV40 large T antigen. Three basic amino acid residues of the putative NLS of SIRT3 (amino acid residues 214–216) were replaced with three alanine residues. In the SIRT3nu sequence, amino acid residues identical with wild-type SIRT3 protein are indicated with dots. The classical NLS of SV40 large T antigen also is shown (SV40). (B) Confocal microscopy. Immunofluorescent images of COS7 cells expressing SIRT3nu-myc alone (upper panels) or both SIRT3nu-myc and SIRT5-FLAG (lower panels) are shown. Mitochondria and nuclei were stained by MitoTracker Red and DAPI, respectively. (C) Subcellular fractionation of PNS. PNSs of the COS7 cells expressing SIRT3nu-myc alone (an upper panel) or co-expressing SIRT3numyc and SIRT5-FLAG (middle and lower panels) were fractionated into mitochondria-enriched precipitate (P1), microsome-enriched precipitate (P2), and supernatant (S) fractions. The fractions were analyzed by Western blotting.
The sequence containing amino acid sequence 213-219 of the SIRT3 closely resembles the putative protein classical NLS of the SV40 T antigen (Fig. 4A). To examine whether this sequence functions as a NLS, the mutant SIRT3 protein SIRT3nu, in which the three basic amino acid residues (214–216) in the putative NLS of SIRT3 were replaced by three alanine residues (Fig. 4A), was constructed. When SIRT3nu alone was expressed in COS7 cells, it was localized in mitochondria (Fig. 4B, upper panels). In the cells co-expressing SIRT3nu and SIRT5, a shift of SIRT3nu protein to the nucleus was not observed, and SIRT3nu protein and a part of SIRT5 protein were scattered widely in the cell in confocal microscopic analysis (Fig. 4B, lower panels). In fractionation of PNS, all of the SIRT3nu protein and nearly half of the SIRT5 protein were shifted from P1 fraction to S fraction by co-expression (Figs. 1B and 4C). These results suggest that the segment containing amino acid residues 213–219 of SIRT3 plays an important role in the localization shift of SIRT3 protein to nucleus when co-expressed with SIRT5. Furthermore, SIRT5 may well hamper SIRT3nu localization in mitochondria through interaction with SIRT3nu. However, further study is required to elucidate the mechanism of the localization shift of SIRT3 protein. Interestingly, recent study has reported that human prohibitin 2 (PHB2), known as a repressor of estrogen receptor (ER) activity, is localized in the mitochondrial inner membrane, and translocates to the nucleus in the presence of ER and estradiol [18]. Although the mechanism of regulation of the expression level of SIRT5 remains unknown, SIRT3 might play a role in communication between nucleus and mitochondria in a SIRT5-dependent manner. The function of mitochondrial SIRT proteins is still not well known. In the present study, we determined the exact localization of mouse SIRT3, SIRT4, and SIRT5 proteins in mitochondria. In addition, we demonstrated that SIRT3 can be present in nucleus in the presence of SIRT5. It has been reported that SIRT3 deacetylates proteins that are not localized in mitochondria in vitro such as histone-4 peptide and tubulin [14]. Thus, if SIRT3 is present in nucleus in vivo, SIRT3 protein might well deacetylate nuclear proteins. These results provide useful information for the investigation of the function of these proteins.
References
[1] J.C. Tanny, G.J. Dowd, J. Huang, H. Hilz, D. Moazed, An enzymatic activity in the yeast Sir2 protein that is essential for gene silencing, Cell 99 (1999) 735–745.
[2] S. Imai, C.M. Armstrong, M. Kaeberlein, L. Guarente, Transcriptional silencing and longevity protein Sir2 is an NAD-dependent histone deacetylase, Nature 403 (2000) 795–800.
[3] M. Gotta, S. Strahl-Bolsinger, H. Renauld, T. Laroche, B.K. Kennedy, M. Grunstein, S.M. Gasser, Localization of Sir2p: the nucleolus as a compartment for silent information regulators, EMBO J. 16 (1997) 3243–3255.
[4] I. Muller, M. Zimmermann, D. Becker, M. Flomer, Calendar life span versus budding life span of Saccharomyces cerevisiae, Mech. Aging Dev. 12 (1980) 47–52.
[5] S.J. Lin, M. Kaeberlein, A.A. Andalis, L.A. Sturtz, P.A. Defossez, V.C. Culotta, G.R. Fink, L. Guarente, Calorie restriction extends Saccharomyces cerevisiae lifespan by increasing respiration, Nature 418 (2002) 344–348.
[6] S.J. Lin, P.A. Defossez, L. Guarente, Requirement of NAD and SIR2 for life-span extension by calorie restriction in Saccharomyces cerevisiae, Science 289 (2000) 2126–2128.
7.8.8 SIRT4 Has Tumor-Suppressive Activity and Regulates the Cellular Metabolic Response to DNA Damage by Inhibiting Mitochondrial Glutamine Metabolism
Jeong SM1, Xiao C, Finley LW, Lahusen T, Souza AL, Pierce K, Li YH, et al.
Cancer Cell. 2013 Apr 15; 23(4):450-63.
http://www.ncbi.nlm.nih.gov/pubmed/23562301#
http://dx.doi.org:/10.1016/j.ccr.2013.02.024
DNA damage elicits a cellular signaling response that initiates cell cycle arrest and DNA repair. Here we find that DNA damage triggers a critical block in glutamine metabolism, which is required for proper DNA damage responses. This block requires the mitochondrial SIRT4, which is induced by numerous genotoxic agents and represses the metabolism of glutamine into TCA cycle. SIRT4 loss leads to both increased glutamine-dependent proliferation and stress-induced genomic instability, resulting in tumorigenic phenotypes. Moreover, SIRT4 knockout mice spontaneously develop lung tumors. Our data uncover SIRT4 as an important component of the DNA damage response pathway that orchestrates a metabolic block in glutamine metabolism, cell cycle arrest and tumor suppression.
DNA damage initiates a tightly coordinated signaling response to maintain genomic integrity by promoting cell cycle arrest and DNA repair. Upon DNA damage, ataxia telangiectasia mutated (ATM) and ataxia telangiectasia and RAD3-related protein (ATR) are activated and induce phosphorylation of Chk1, Chk2 and γ-H2AX to trigger cell cycle arrest and to initiate assembly of DNA damage repair machinery (Abraham, 2001; Ciccia and Elledge, 2010; Su, 2006). Cell cycle arrest is a critical outcome of the DNA damage response (DDR) and defects in the DDR often lead to increased incorporation of mutations into newly synthesized DNA, the accumulation of chromosomal instability and tumor development (Abbas and Dutta, 2009; Deng, 2006; Negrini et al., 2010).
The cellular metabolic response to DNA damage is not well elucidated. Recently, it has been shown that DNA damage causes cells to upregulate the pentose phosphate pathway (PPP) to generate nucleotide precursors needed for DNA repair (Cosentino et al., 2011). Intriguingly, a related metabolic switch to increase anabolic glucose metabolism has been observed for tumor cells and is an important component of rapid generation of biomass for cell growth and proliferation (Jones and Thompson, 2009; Koppenol et al., 2011). Hence, cells exposed to genotoxic stress face a metabolic challenge; they must be able to upregulate nucleotide biosynthesis to facilitate DNA repair, while at the same time limiting proliferation and inducing cell cycle arrest to limit the accumulation of damaged DNA. The molecular events that regulate this specific metabolic program in response to DNA damage are still unclear.
Sirtuins are a highly conserved family of NAD+-dependent deacetylases, deacylases, and ADP-ribosyltransferases that play various roles in metabolism, stress response and longevity (Finkel et al., 2009;Haigis and Guarente, 2006). In this study, we studied the role of SIRT4, a mitochondria-localized sirtuin, in cellular metabolic response to DNA damage and tumorigenesis.
DNA damage represses glutamine metabolism
To investigate how cells might balance needs for continued nucleotide synthesis, while also preparing for cell cycle arrest, we assessed the metabolic response to DNA damage by monitoring changes in the cellular consumption of two important fuels, glucose and glutamine, after DNA-damage. Strikingly, treatment of primary mouse embryonic fibroblasts (MEFs) with camptothecin (CPT), a topoisomerase 1 inhibitor that causes double-stranded DNA breaks (DSBs), resulted in a pronounced reduction in glutamine consumption (Figure 1A). Glutamine metabolism in mammalian cells is complex and contributes to a number of metabolic pathways. Glutamine is the primary nitrogen donor for protein and nucleotide synthesis, which are essential for cell proliferation (Wise and Thompson, 2010). Additionally, glutamine provides mitochondrial anaplerosis. Glutamine can be metabolized via glutaminase (GLS) to glutamate and NH4+, and further converted to the tricarboxylic acid (TCA) cycle intermediate α-ketoglutarate via glutamate dehydrogenase (GDH) or aminotransferases. This metabolism of glutamine provides an important entry point of carbon to fuel the TCA cycle (Jones and Thompson, 2009), and accounts for the majority of ammonia production in cells (Yang et al., 2009). CPT-induced reduction of glutamine consumption was accompanied by a reduction in ammonia secretion from cells (Figure 1B). Notably, under these conditions, we observed no obvious decrease in glucose uptake and lactate production (Figures 1C and 1D), consistent with previous studies showing that intact glucose utilization through the PPP is important for a normal DNA damage response (Cosentino et al., 2011). Preservation of glucose uptake also suggests that repression of glutamine consumption may be a specific metabolic response to genotoxic stress and not reflective of a non-specific metabolic crisis.
Figure 1 Glutamine metabolism is repressed by genotoxic stress
To examine the metabolic response to other forms of genotoxic stress, we monitored the metabolic response to ultra-violet (UV) exposure in primary MEFs. Similar to CPT treatment, UV exposure reduced glutamine uptake, without significant changes in glucose consumption (Figures 1E and 1F). Similarly two human cell lines, HepG2 and HEK293T, also demonstrated marked reductions in glutamine uptake in response to DNA damaging agents without comparable changes in glucose uptake (Figures 1G and 1H; Figures S1A and S1B). Taken together, these results suggest that a variety of primary and tumor cell lines (from mouse or human) respond to genotoxic stress by down-regulating glutamine metabolism.
To examine in more detail the changes in cellular glutamine metabolism after genotoxic stress, we performed a global metabolomic analysis with transformed MEFs before and after DNA damage. As previously reported, we observed that PPP intermediates were increased in response to DNA damage (Figures 1I and 1J). Remarkably, we observed a decrease in measured TCA cycle intermediates after UV exposure (Figures 1I and 1K). Moreover, we found that HepG2 cells showed a similar metabolomic shift in response to DNA damage (Figure S1D). We did not observe a clear, coordinated repression of nucleotides or glutamine-derived amino acids after exposure to DNA damage (Figure S1C).
To determine whether reduction in TCA cycle metabolites was the consequence of reduced glutamine metabolism, we performed a time-course tracer study to monitor the incorporation of [U-13C5]glutamine into TCA cycle intermediates at 0, 2 and 4 hr after UV treatment. We observed that after UV exposure, cells reduced contribution of glutamine to TCA cycle intermediates in a time-dependent manner (Figure 1L). Moreover, the vast majority of the labeled fumarate and malate contained four carbon atoms derived from [U-13 C5]glutamine (Figure S1F, M+3 versus M+4), indicating that most glutamine was used in the non-reductive direction towards succinate, fumarate and malate production. We were able to observe little contribution of glutamine flux into nucleotides or glutathione in control or UV-treated cells at these time points (data not shown), suggesting that the mitochondrial metabolism of glutamine accounts for the majority of glutamine consumption in these cells. Taken together, the metabolic flux analysis demonstrates that DNA damage results in a reduction of mitochondrial glutamine anaplerosis, thus limiting the critical refueling of carbons into the TCA cycle.
To assess the functional relevance of decreased glutamine metabolism after DNA damage, we deprived cells of glucose, thereby shifting cellular dependence to glutamine to maintain viability (Choo et al., 2011; Dang, 2010). If DNA damage represses glutamine usage, we reasoned that cells would be more sensitive to glucose deprivation. Indeed, following 72 hr of glucose deprivation, cell death in primary MEFs was significantly elevated at 10 hr after UV exposure (Figure S1E). However, cells cultured with glucose remained viable in these conditions. Thus, these data demonstrate that genotoxic stress limits glutamine entry into the central mitochondrial metabolism of the TCA cycle.
SIRT4 is induced in response to genotoxic stress
Because sirtuins regulate both cellular metabolism and stress responses (Finkel et al., 2009; Schwer and Verdin, 2008), we examined whether sirtuins were involved in the metabolic adaptation to DNA damage. We first examined the expression of sirtuins in the response to DNA damage. Specifically, we probed SIRT1, which is involved in stress responses (Haigis and Guarente, 2006), as well as mitochondrial sirtuins (SIRT3–5), which have been shown to regulate amino acid metabolism (Haigis et al., 2006; Hallows et al., 2011; Nakagawa et al., 2009). Remarkably, SIRT4 mRNA levels were induced by nearly 15-fold at 15 hr after CPT treatment and 5-fold after etoposide (ETS), a topoisomerase 2 inhibitor, in HEK293T cells (Figure 2A). Interestingly, the induction of SIRT4 was significantly higher than the induction of SIRT1 and mitochondrial SIRT3 (~2-fold), sirtuins known to be induced by DNA damage and regulate cellular responses to DNA damage (Sundaresan et al., 2008; Vaziri et al., 2001; Wang et al., 2006). Moreover, overall mitochondrial mass was increased by only 10% in comparison with control cells (Figure S2A), indicating that the induction of SIRT4 is not an indirect consequence of mitochondrial biogenesis. These data hint that SIRT4 may have an important, previously undetermined role in the DDR.
Figure 2 SIRT4 is induced by DNA damage stimuli
To test the induction of SIRT4 in the general genotoxic stress response, we treated cells with other types of DNA damage, including UV and gamma-irradiation (IR). SIRT4 mRNA levels were also increased by these genotoxic agents (Figures S2B and S2C) and low doses of CPT and UV treatment also induced SIRT4expression (Figures S2D and S2E). We observed similar results with MEFs (Figures 2B and 2D; Figure S2F) and HepG2 cells (Figure S2G). DNA damaging agents elevated SIRT4 in p53-inactive HEK293T cells (Figures 2A and 2C) and in p53-null PC3 human prostate cancer cells (Figure S2H), suggesting that SIRT4can be induced in a p53-independent manner.
To examine whether the induction of SIRT4 occurred as a result of cell cycle arrest, we measured SIRT4levels after the treatment of nocodazole, which inhibits microtubule polymerization to block mitosis. While treatment with nocodazole completely inhibited cell proliferation (data not shown), SIRT4 expression was not elevated (Figure S2I). In addition, we analyzed SIRT4 expression in distinct stages of the cell cycle in HepG2 cells synchronized with thymidine block (Figure S2J, Left). SIRT4 mRNA levels were measured at different times after release and were not elevated during G1 or G2/M phases (Figure S2J, Right), suggesting thatSIRT4 is not induced as a general consequence of cell cycle arrest. Next, we re-examined the localization of SIRT4 after DNA damage. SIRT4 localizes to the mitochondria of human and mouse cells under basal, unstressed conditions (Ahuja et al., 2007; Haigis et al., 2006). Following CPT treatment, SIRT4 colocalized with MitoTracker, a mitochondrial-selective marker, indicating that SIRT4 retains its mitochondrial localization after exposure to DNA damage (Figure S2K). Taken together, our findings demonstrate that SIRT4 is induced by multiple forms of DNA damage in numerous cell types, perhaps to coordinate the mitochondrial response to genotoxic stress.
SIRT4 represses glutamine anaplerosis
We observed that glutamine anaplerosis is repressed by genotoxic stress (Figure 1) and SIRT4 is induced by DNA damage (Figure 2). Additionally, previous studies reported that SIRT4 represses glutamine anaplerosis (Haigis et al., 2006). We next tested whether SIRT4 directly regulates cellular glutamine metabolism and contribution of glutamine to the TCA cycle. Like DNA damage, SIRT4 overexpression (SIRT4-OE) in HepG2, HeLa or HEK293T cells resulted in the repression of glutamine consumption (Figure 3A; Figures S3A–C). Conversely, SIRT4 knockout (KO) MEFs consumed more glutamine than did wild-type (WT) cells (Figure 3B).
Figure 3 SIRT4 represses mitochondrial glutamine metabolism in response to DNA damage
Mitochondrial glutamine catabolism refuels the TCA cycle and is essential for viability in the absence of glucose (Choo et al., 2011; Yang et al., 2009). Thus, we examined the effect of SIRT4 on cell survival during glucose deprivation. Overexpression of SIRT4 in HEK293T or HeLa cells increased cell death in glucose-free media compared to control cells (Figure 3C; Figure S3D). Importantly, this cell death was completely rescued by the addition of pyruvate or cell permeable dimethyl α-ketoglutarate (DM-KG), demonstrating that SIRT4 overexpression reduced the ability of cells to utilize glutamine for mitochondrial energy production. Moreover, cell death was equally maximized in the absence of glucose and presence of the mitochondrial ATPase inhibitor oligomycin (Figure 3C). These findings are in line with the model that SIRT4 induction with DNA damage limits glutamine metabolism and utilization by the TCA cycle
We next utilized a metabolomic approach to interrogate glutamine usage in the absence of SIRT4. SIRT4 KO MEFs demonstrated elevated levels of TCA cycle intermediates (Figure 3J, WT versus KO), whereas intermediates of glycolysis were comparable with WT cells (data not shown). Nucleotides and other metabolites downstream of glutamine metabolism were not coordinately regulated by SIRT4 loss (Figure S3E and data not shown). Next, we analyzed glutamine flux in WT and SIRT4 KO MEFs in medium containing [U-13C5]glutamine for 2 or 4 hours and measured isotopic enrichment of TCA cycle intermediates. Loss of SIRT4 promoted a higher rate of incorporation of 13C-labeled metabolites derived from [U-13C5]glutamine in all TCA cycle intermediates measured (Figure 3D). These data provide direct evidence that SIRT4 loss drives increased entry of glutamine-derived carbon into the TCA cycle.
Next, we examined the mechanisms involved in this repression of glutamine anaplerosis. GLS is the first required enzyme for mitochondrial glutamine metabolism (Curthoys and Watford, 1995) and its inhibition limits glutamine flux into the TCA cycle (Wang et al., 2010; Le et al., 2012; Yuneva et al., 2012). Treatment with bis-2-(5-phenylacetoamido-1,2,4-thiadiazol-2-yl)ethyl sulfide (BPTES) (Robinson et al., 2007), an inhibitor of GLS1, repressed glutamine uptake and completely rescued the increased glutamine consumption of SIRT4 KO cells (Figure 3E). Moreover, SIRT4 overexpression no longer inhibited glutamine uptake when GLS1 was reduced by using short hairpin RNAs (shRNAs) (Figures 3F and 3G), demonstrating that SIRT4 regulates mitochondrial glutamine metabolism. SIRT4 is a negative regulator of GDH activity (Haigis et al., 2006) and SIRT4 KO MEFs exhibited increased GDH activity in comparison with WT MEFs (Figure S3F). To test whether SIRT4 regulates mitochondrial glutamine metabolism via inhibiting GDH activity, we measured glutamine uptake in WT and SIRT4 KO cells in the presence of EGCG, a GDH inhibitor (Choo et al., 2011; Li et al., 2006). The treatment of EGCG partially rescued the increased glutamine uptake of KO cells (Figure S3G), suggesting that GDH contributes to the role of SIRT4 in glutamine metabolism.
SIRT4 represses mitochondrial glutamine metabolism after DNA damage
SIRT4 regulates cell cycle progression and genomic fidelity in response to DNA damage
Figure 4 SIRT4 is involved in cellular DNA damage responses
SIRT4 represses tumor proliferation
Figure 5 SIRT4 has tumor suppressive function
(A and B) Growth curves of WT and SIRT4 KO MEFs (n = 3) cultured in standard media (A) or media supplemented with BPTES (10 μM) (B). Data are means ±SD.
(C and D) Growth curves of Vector and SIRT4-OE HeLa cells (n = 3) cultured in standard media (C) or media supplemented with BPTES (10 μM) (D). Data are means ±SD.
(E) Focus formation assays with transformed WT and SIRT4 KO MEFs (left). Cells were cultured with normal medium or medium without glucose or glutamine for 10 days and stained with crystal violet. The number of colonies was counted (right) (n =3 samples of each condition). n.d., not determined.
(F) Focus formation assays with transformed KO MEFs reconstituted with SIRT4 or a catalytic mutant of SIRT4 (n = 3). Cells were cultured for 8 days and stained with crystal violet.
(G) Contact inhibited cell growth of transformed WT and SIRT4 KO MEFs cultured in the presence of DMSO or BPTES (10 μM) for 14 days (left). The number of colonies was counted (right). Data are means ±SEM. n.s., not significant. *p < 0.05, **p < 0.005. See also Figure S5.
http://www.ncbi.nlm.nih.gov/pmc/articles/PMC3650305/bin/nihms451579f5.jpg
SIRT4 represses tumor formation in vivo
To investigate SIRT4 function in human cancers, we examined changes in SIRT4 expression. SIRT4 mRNA level was reduced in several human cancers, such as small cell lung carcinoma (Garber et al., 2001), gastric cancer (Wang et al., 2012), bladder carcinoma (Blaveri et al., 2005), breast cancer (TCGA) and leukemia (Choi et al., 2007) (Figure 6A). Of note, lower SIRT4 expression associated with shorter time to death in lung tumor patients (Shedden et al., 2008) (Figure 6B). Overall the expression data is consistent with the model that SIRT4 may play a tumor suppressive role in human cancers.
Figure 6 SIRT4 is a mitochondrial tumor suppressor
SIRT4 regulates glutamine metabolism in lung tissue
To test further the biological relevance of this pathway in lung, we examined whether SIRT4 is induced in vivo after exposure to DNA damaging IR treatment. Remarkably, Sirt4 was significantly induced in lung tissue after IR exposure (Figure 7A). We next examined whether IR repressed glutamine metabolism in vivo, as observed in cell culture by examining GDH activity in lung tissue from WT and SIRT4 KO mice with or without IR exposure. GDH activity was elevated in lung tissue extracts from SIRT4 KO mice compared with WT lung tissue (Figure 7B). Importantly, GDH activity was significantly decreased in lung tissue from WT mice after IR exposure, whereas not in lung tissue from KO mice (Figure 7C). Thus, these findings recapitulate our cellular studies and are in line with the model that SIRT4 induction with DNA damage limits mitochondrial glutamine metabolism and utilization.

SIRT4 inhibits mitochondria glutamine metabolism in vivo
http://www.ncbi.nlm.nih.gov/pmc/articles/PMC3650305/bin/nihms451579f7.gif
Figure 7 SIRT4 inhibits mitochondria glutamine metabolism in vivo
To assess whether the functions of SIRT4 can be reproduced in these lung tumors, cells derived from SIRT4 KO lung tumors were reconstituted with wild type SIRT4 (Figure S7A). As expected, SIRT4 reconstitution reduced glutamine uptake, but not glucose uptake (Figures 7D and 7E) and repressed proliferation (Figure S7B) of lung tumor cells.
Here, we report that SIRT4 has an important role in cellular metabolic response to DNA damage by regulating mitochondrial glutamine metabolism with important implication for the DDR and tumorigenesis. First, we discovered that DNA damage represses cellular glutamine metabolism (Figure 1). Next, we found that SIRT4 is induced by genotoxic stress (Figure 2) and is required for the repression of mitochondrial glutamine metabolism (Figure 3). This metabolic response contributes to the control of cell cycle progression and the maintenance of genomic integrity in response to DNA damage (Figure 4). Loss of SIRT4 increased glutamine-dependent tumor cell proliferation and tumorigenesis (Figure 5). In mice, SIRT4 loss resulted in spontaneous tumor development (Figure 6). We demonstrate that SIRT4 is induced in normal lung tissue in response to DNA damage where it represses GDH activity. Finally, the glutamine metabolism-genomic fidelity axis is recapitulated in lung tumor cells derived from SIRT4 KO mice via SIRT4 reconstitution (Figure 7). Our studies therefore uncover SIRT4 as a important regulator of cellular metabolic response to DNA damage that coordinates repression of glutamine metabolism, genomic stability and tumor suppression.
The DDR is a highly orchestrated and well-studied signaling response that detects and repairs DNA damage. Upon sensing DNA damage, the ATM/ATR protein kinases are activated to phosphorylate target proteins, leading to cell cycle arrest, DNA repair, transcriptional regulation and initiation of apoptosis (Ciccia and Elledge, 2010; Su, 2006). Dysregulation of this pathway is frequently observed in many tumors. Emerging evidence has suggested that cell metabolism also plays key roles downstream of the DDR-induced pathways.
7.8.9 Mitochondrial sirtuins and metabolic homeostasis
Pirinen E1, Lo Sasso G, Auwerx J.
Best Pract Res Clin Endocrinol Metab. 2012 Dec; 26(6):759-70. http://dx.doi.org:/10.1016/j.beem.2012.05.001
The maintenance of metabolic homeostasis requires the well-orchestrated network of several pathways of glucose, lipid and amino acid metabolism. Mitochondria integrate these pathways and serve not only as the prime site of cellular energy harvesting but also as the producer of many key metabolic intermediates. The sirtuins are a family of NAD+-dependent enzymes, which have a crucial role in the cellular adaptation to metabolic stress. The mitochondrial sirtuins SIRT3, SIRT4 and SIRT5 together with the nuclear SIRT1 regulate several aspects of mitochondrial physiology by controlling posttranslational modifications of mitochondrial protein and transcription of mitochondrial genes. Here we discuss current knowledge how mitochondrial sirtuins and SIRT1 govern mitochondrial processes involved in different metabolic pathways.
Mitochondria are organelles composed of a matrix enclosed by a double (inner and outer) membrane (1). Major cellular functions, such as nutrient oxidation, nitrogen metabolism, and especially ATP production, take place in the mitochondria. ATP production occurs in a process referred to as oxidative phosphorylation (OXPHOS), which involves electron transport through a chain of protein complexes (I-IV), located in the inner mitochondrial membrane. These complexes carry electrons from electron donors (e.g. NADH) to electron acceptors (e.g. oxygen), generating a chemiosmotic gradient between the mitochondrial intermembrane space and matrix. The energy stored in this gradient is then used by ATP synthase to produce ATP (1). One well-known side effect of the OXPHOS process is the production of reactive oxygen species (ROS) that can generate oxidative damage in biological macromolecules (1). However, to neutralize the harmful effects of ROS, cells have several antioxidant enzymes, including superoxide dismutase, catalase, and peroxidases (1). The sirtuin silent information regulator 2 (Sir2), the founding member of the sirtuin protein family, was identified in 1984 (2). Sir2 was subsequently characterized as important in yeast replicative aging (3) and shown to posses NAD+-dependent histone deacetylase activity (4), suggesting it could play a role as an energy sensor. A family of conserved Sir2-related proteins was subsequently identified. Given their involvement in basic cellular processes and their potential contribution to the pathogenesis of several diseases (5), the sirtuins became a widely studied protein family.
In mammals the sirtuin family consists of seven proteins (SIRT1-SIRT7), which show different functions, structure, and localization. SIRT1 is mostly localized in the nucleus but, under specific physiological conditions, it shuttles to the cytosol (6). Similar to SIRT1, also SIRT6 (7) and SIRT7 (8) are localized in the nucleus. On the contrary, SIRT2 is mainly present in the cytosol and shuttles into the nucleus during G2/M cell cycle transition (9). Finally, SIRT3, SIRT4, and SIRT5, are mitochondrial proteins (10).
The main enzymatic activity catalyzed by the sirtuins is NAD+-dependent deacetylation, as known for the progenitor Sir2 (4,11). Along with histones also many transcription factors and enzymes were identified as targets for deacetylation by the sirtuins. Remarkably, mammalian sirtuins show additional interesting enzymatic activities. SIRT4 has an important ADP-ribosyltransferase activity (12), while SIRT6 can both deacetylate and ADP-ribosylate proteins (13,14). Moreover, SIRT5 was recently shown to demalonylate and desuccinylate proteins (15,16), in particular the urea cycle enzyme carbamoyl phosphate synthetase 1 (CPS1) (16). The (patho-)physiological context in which the seven mammalian sirtuins exert their functions, as well as their biochemical characteristics, are extensively discussed in the literature (17,18) and will not be addressed in this review; here we will focus on the emerging roles of the mitochondrial sirtuins, and their involvement in metabolism. Moreover, SIRT1 will be discussed as an important enzyme that indirectly affects mitochondrial physiology.
Sirtuins are regulated at different levels. Their subcellular localization, but also transcriptional regulation, post-translational modifications, and substrate availability, all impact on sirtuin activity. Moreover, nutrients and other molecules could affect directly or indirectly sirtuin activity. As sirtuins are NAD+-dependent enzymes, the availability of NAD+ is perhaps one of the most important mechanisms to regulate their activity. Changes in NAD+ levels occur as the result of modification in both its synthesis or consumption (19). Increase in NAD+ amounts during metabolic stress, as prolonged fasting or caloric restriction (CR) (20–22), is well documented and tightly connected with sirtuin activation (4,19). Furthermore, the depletion and or inhibition of poly-ADP-ribose polymerase (PARP) 1 (23) or cADP-ribose synthase 38 (24), two NAD+consuming enzymes, increase SIRT1 action.
Analysis of the SIRT1 promoter region identified several transcription factors involved in up- or down-regulation of SIRT1 expression. FOXO1 (25), peroxisome proliferator-activated receptors (PPAR) α/β (26,27), and cAMP response element-binding (28) induce SIRT1 transcription, while PPARγ (29), hypermethylated in cancer 1 (30), PARP2 (31), and carbohydrate response element-binding protein (28) repress SIRT1 transcription. Of note, SIRT1 is also under the negative control of miRNAs, like miR34a (32) and miR199a (33). Furthermore, the SIRT1 protein contains several phosphorylation sites that are targeted by several kinases (34,35), which may tag the SIRT1 protein so that it only exerts activity towards specific targets (36,37). The beneficial effects driven by the SIRT1 activation – discussed below- led the development of small molecules modulators of SIRT1. Of note, resveratrol, a natural plant polyphenol, was shown to increase SIRT1 activity (38), most likely indirectly (22,39,40), inducing lifespan in a range of species ranging from yeast (38) to high-fat diet fed mice (41). The beneficial effect of SIRT1 activation by resveratrol on lifespan, may involve enhanced mitochondrial function and metabolic control documented both in mice (42) and humans (43). Subsequently, several powerful synthetic SIRT1 agonists have been identified (e.g. SRT1720 (44)), which, analogously to resveratrol, improve mitochondrial function and metabolic diseases (45). The precise mechanism of action of these compounds is still under debate; in fact, it may well be that part of their action is mediated by AMP-activated protein kinase (AMPK) activation (21,22,46), as resveratrol was shown to inhibit ATP synthesis by directly inhibiting ATP synthase in the mitochondrial respiratory chain (47), leading to an energy stress with subsequent activation of AMPK. However, at least in β-cells, resveratrol-mediated SIRT1 activation and AMPK activation seem to regulate glucose response in the opposite direction, pointing to the existence of alternative molecular targets (48).
Another hypothesis to explain the pleitropic effects of resveratrol suggests it inhibits cAMP-degrading phosphodiesterase 4 (PDE4), resulting in the cAMP-dependent activation of exchange proteins activated by cyclic AMP (Epac1) (40). The consequent Epac1-mediated increase of intracellular Ca2+ levels may then activate of CamKKβ-AMPK pathway (40), which ultimately will result in an increase in NAD+ levels and SIRT1 activation (21). Interestingly, also PDE4 inhibitors reproduce some of the metabolic benefits of resveratrol representing yet another putative way to activate SIRT1.
The regulation of the activity of the mitochondrial sirtuins is at present poorly understood. SIRT3 expression is induced in white adipose (WAT) and brown adipose tissues upon CR (49), while it is down-regulated in the liver of high-fat fed mice (50). SIRT3 activity changes also in the muscle after fasting (51) and chronic contraction (52). All these processes are associated with increase (20,53) or decrease (50) in NAD+ levels. From a transcriptional point of view, SIRT3 gene expression in brown adipocytes seems under the control of peroxisome proliferator-activated receptor gamma coactivator-1α (PGC-1α) -estrogen-related receptor α (ERRα) axis, and this effect is crucial for full brown adipocyte differentiation (54,55). SIRT4 expression is reported to be reduced during CR (12), while the impact of resveratrol on SIRT4 is still under debate (56). Finally, upon ethanol exposure, SIRT5 gene expression was shown to be decreased together with the NAD+levels (57), probably explaining the protein hyperacetylation caused by alcohol exposure (58).
Metabolic homeostasis
The maintenance of metabolic homeostasis is critical for the survival of all species to sustain body structure and function. Metabolic homeostasis is achieved through complicated interactions between metabolic pathways that govern glucose, lipid and amino acid metabolism. Mitochondria are organelles, which integrate these metabolic pathways by serving a physical site for the production and recycling of metabolic intermediates.
Glucose metabolism
Overview
Glucose homeostasis is regulated through various complex processes including hepatic glucose output, glucose uptake, glucose utilization and storage. The main hormones regulating glucose homeostasis are insulin and glucagon, and the balance between these hormones determines glucose homeostasis. Insulin promotes glucose uptake in peripheral tissues (muscle and WAT), glycolysis and storage of glucose as glycogen in the fed state, while glucagon stimulates hepatic glucose production during fasting. Sirtuins influence many aspects of glucose homeostasis in several tissues such as muscle, WAT, liver and pancreas.
Gluconeogenesis
The body’s ability to synthesise glucose is vital in order to provide an uninterrupted supply of glucose to the brain and survive during starvation. Gluconeogenesis is a cytosolic process, in which glucose is formed from non-carbohydrate sources, such as amino acids, lactate, the glycerol portion of fats and tricarboxylic acid (59) cycle intermediates, during energy demand. This process, which occurs mainly in liver and kidney, shares some enzymes with glycolysis but it employs phosphoenolpyruvate carboxykinase, fructose-1,6-bisphosphatase and glucose-6-phosphatase to control the flow of metabolites towards glucose production. These three enzymes are stimulated by glucagon, epinephrine and glucocorticoids, whereas their activity is suppressed by insulin.
The role of mitochondrial sirtuins in the control of gluconeogenesis is not well established. SIRT3 is suggested to induce fasting-dependent hepatic glucose production from amino acids by deacetylating and activating the mitochondrial conversion of glutamate into the TCA cycle intermediate α-ketoglutarate, via the enzyme glutamate dehydrogenase (GDH) (Fig. 1A) (60,61). As SIRT3−/− mice do not display changes in GDH activity (62), the mechanism requires further clarification. In contrast to SIRT3, SIRT4 inhibits GDH via ADP-ribosylation under basal dietary conditions (Fig. 1A-B) (12). Conversely, SIRT4 activity is suppressed during CR resulting in activation of GDH, which fuels the TCA cycle and possibly also gluconeogenesis (12). Therefore, mitochondrial sirtuins may function to support gluconeogenesis during energy limitation, but further research is required to understand the exact roles of mitochondrial sirtuins in gluconeogenesis.

Summary of mitochondrial sirtuins’ role in mitochondrial pathways
Figure 1 Summary of mitochondrial sirtuins’ role in mitochondrial pathways
http://www.ncbi.nlm.nih.gov/pmc/articles/PMC3621019/bin/emss-52490-f0001.gif
Glucose utilization
Lipid metabolism
Urea metabolism
The recent discoveries in the biology of mitochondria have shed light on the metabolic regulatory roles of the sirtuin family. To maintain proper metabolic homeostasis, sirtuins sense cellular NAD+ levels, which reflect the nutritional status of the cells, and translate this information to adapt the activity of mitochondrial processes via posttranslational modifications and transcriptional regulation. SIRT1 and SIRT3 function to stimulate proper energy production via FAO and SIRT3 also protects from oxidative stress and ammonia accumulation during nutrient deprivation. SIRT4 seems to play role in the regulation of gluconeogenesis, insulin secretion and fatty acid utilization during times of energy limitation, while SIRT5 detoxifies excess ammonia that can accumulate during fasting. However, we are only at the beginning of our understanding of the roles of the mitochondrial sirtuins, SIRT3, SIRT4 and SIRT5 in complex metabolic processes. In the coming years, further research should identify and verify novel sirtuin targets in vivo and in vitro. We need also to elucidate the regulation and tissue-specific functions of these mitochondrial sirtuins, as well as to understand the potential crosstalk and synchrony between the different sirtuins in different subcellular compartments. Ultimately, the understanding of mitochondrial sirtuin functions may open new possibilities, not only for treatment of cancer and metabolic diseases characterized by mitochondrial dysfunction, but also for disease prevention and health maintenance.
7.8.10 Mitochondrial sirtuins
Huang JY1, Hirschey MD, Shimazu T, Ho L, Verdin E.
Biochim Biophys Acta. 2010 Aug; 1804(8):1645-51. http://dx.doi.org:/10.1016/j.bbapap.2009.12.021
Sirtuins have emerged as important proteins in aging, stress resistance and metabolic regulation. Three sirtuins, SIRT3, 4 and 5, are located within the mitochondrial matrix. SIRT3 and SIRT5 are NAD(+)-dependent deacetylases that remove acetyl groups from acetyllysine-modified proteins and yield 2′-O-acetyl-ADP-ribose and nicotinamide. SIRT4 can transfer the ADP-ribose group from NAD(+) onto acceptor proteins. Recent findings reveal that a large fraction of mitochondrial proteins are acetylated and that mitochondrial protein acetylation is modulated by nutritional status. This and the identification of targets for SIRT3, 4 and 5 support the model that mitochondrial sirtuins are metabolic sensors that modulate the activity of metabolic enzymes via protein deacetylation or mono-ADP-ribosylation. Here, we review and discuss recent progress in the study of mitochondrial sirtuins and their targets.

mitochondrial sirtuins
http://www.sciencedirect.com/science/article/pii/S1570963909003902
mitochondrial sirtuins
Fig.1 .NAD+ -dependent deacetylation of sirtuins. The two step catalytic reaction mechanism. In this diagram ADPR = acetyl-ADP-ribose, NAM = nicotinamide, 1-O-AADPR = 1-O-acetyl ADP-ribose and βNAD = beta nicotinamide adenine dinucleotide.
Table 1 Shows subcellular localization, substrates and functions of different types of sirtuins.
Fig.2. Sirt3 regulated pathways in mitochondrial metabolism. Schematic diagram demonstrating the different roles of Sirt3 in the regulation of the main metabolic pathways of mitochondria.In this diagram LCAD = long-chain acyl-CoA dehydrogenase, ACeS2 = acetyl coenzyme synthetase 2, Mn SOD = manganese superoxide dismutase, CypD = cyclophilin D, ICDH2 = isocitrate dehydrogenase 2, OTC = ornithine transcarbomylase,TCA = tricaboxylic acid, ROS = reactive oxygen species, mPTP = membrane permeability transition pore, I–V = respiratory chain complex I–V
Fig. 3.(A) Schematic diagram showing different roles of Sirt4 in the regulation of various metabolic pathways. The diagram shows the Sirt4 regulated decrease in insulin level and the increase in availability of ATP inside mitochondria via upregulation of insulin degrading enzyme (IDE) and adenine translocator (ANT). The diagram also shows the Sirt4 regulated decrease in the efficiency of fatty acid oxidation and tricarboxylic acid cycle (TCA) via inhibition of glutamate dehydrogenase (GDH) and malonyl CoA decarboxylase (MCoAD). (B) Schematic diagram indicating the different roles of Sirt5 in regulation of various metabolic pathways. Sirt5 regulates urea production, fatty acid oxidation, tricarboxylic acid cycle (TCA), glycolysis, reactive oxygen species (ROS) metabolism, purine metabolism via regulating carbamoyl phosphate synthetase (CPS), hydroxyl-coenzyme A dehydrogenase (HADH), pyruvate dehydrogenase (PDH), pyruvate kinase (PK), succinate dehydrogenase(SDH) andurate oxidase (UO) respectively
Conclusion and future perspectives
Sirtuins are highly conserved NAD+-dependent protein deacetylases or ADP ribosyl transferases involved in many cellular processes including genome stability, cell survival, oxidative stress responses, metabolism, and aging. Mitochondrial sirtuins, Sirt3, Sirt4 and Sirt5 are important energy sensors and thus can be regarded as master regulators of mitochondrial metabolism. But it is still not known whether specific sirtuins can only function within particular metabolic pathways or two or more sirtuins could affect the same pathways. One of the mitochondrial sirtuins, Sirt3 is a major mitochondrial deacetylase that plays a pivotal role in the acetylation based regulation of numerous mitochondrial proteins. However, the question how mitochondrial proteins become acetylated is still unsolved and the identity of mitochondrial acetyltransferases is mysterious. Although the predominant function of the sirtuins is NAD+ dependent lysine deacetylation, but along with this major function another less characterized activity of these sirtuins includes ADP ribosylation which is mainly done by Sirt4. Moreover, in the case when the mitochondrial sirtuins exhibit both deacetylase and ADP ribosyl transferase activity, the conditions that determine the relative contribution of both of these activities in same or different metabolic pathways require further investigation. Sirt5 another mitochondrial sirtuin, was a puzzle until the recent finding as it possesses unique demalonylase and desuccinylase activities. However, most of the malonylated or succinylated proteins are important metabolic enzymes but as the significance of lysine malonylation and succinylation is still unknown thus it would be interesting to know how lysine malonylation and succinylation alter the functions of various metabolic enzymes. The mitochondrial sirtuins Sirt3, Sirt4 and Sirt5 serve as critical junctions and are required to exert many of the beneficial effect in mitochondrial metabolism. The emerging multidimensional role of mitochondrial sirtuins in regulation of mitochondrial metabolism and bioenergetics may have far-reaching consequences for many diseases associated with mitochondrial dysfunctions. However it is very important to fully elucidate the functions of mitochondrial sirtuins in different tissues to achieve the goal of therapeutic intervention in different metabolic diseases. Although several proteomic studies have provided detailed information that how mitochondrial sirtuin driven modification takes place on various targets in response to different environmental conditions, still the role of sirtuins in mitochondrial physiology and human diseases requires further exploration. Hopefully the progress in the field of sirtuin biology will soon provide insight into the therapeutic applications for targeting mitochondrial sirtuins by bioactive compounds to treat various human age-related diseases.
References
Ahn B.H.,et al.,2008. A role for the mitochondrial deacetylase Sirt3 in regulating energy homeostasis. Proc. Natl. Acad. Sci. U. S. A. 105 (38), 14447–14452. http://dx.doi.org/10.1073/pnas.0803790105.
Ahuja N.,et al., 2007. Regulation of insulin secretion by SIRT4, a mitochondrial ADP ribosyltransferase. J. Biol. Chem. 282 (46), 33583–33592. http://dx.doi.org/10.1074/jbc.M705488200.
Allison, S.J., Milner, J., 2007. SIRT3 is pro-apoptotic and participates in distinct basal apoptotic pathways. Cell Cycle 6, 2669–2677. http://dx.doi.org/10.4161/cc.6.21.4866.
Ashraf, N., et al., 2006. Altered sirtuin expression is associated with node-positive breast cancer. Br. J. Cancer 95, 1056–1061. http://dx.doi.org/10.1038/sj.bjc.6603384.
Bao, J.,et al.,2010. SIRT3 is regulated by nutrient excess and modulates hepatic susceptibility to lipotoxicity. Free Radic. Biol. Med. 49, 1230–1237.
Beal, M.F., 2005. Less stress, longer life. Nat. Med. 11 (6), 598–599. http://dx.doi.org/10.1038/nm0605-598.
Bell, E.L., Guarente,L., 2011. The SirT3 divining rod points to oxidative stress. Mol.Cell 42 (5), 561–568. http://dx.doi.org/10.1016/j.molcel.2011.05.008
(Review).
Bell,E.L., Emerling,B.M., Ricoult,S.J.H., Guarente,L., 2011. SirT3 suppresses hypoxia inducible factor 1α and tumor growth by inhibiting mitochondrial ROS production. Oncogene 30, 2986–2996. http://dx.doi.org/10.1038/onc.2011.37.
Bellizzi,D.,Rose,G.,Cavalcante,P.,Covello,G.,et al., 2005. A novel VNTR enhancer within the SIRT3 gene, a human homologue of SIR2, is associated with survival at oldest ages. Genomics 85, 258–263.
http://dx.doi.org/10.1016/j.ygeno.2004.11.003.
7.8.11 Sirtuin regulation of mitochondria: energy production, apoptosis, and signaling
Verdin E1, Hirschey MD, Finley LW, Haigis MC.
Trends Biochem Sci. 2010 Dec; 35(12):669-75.
http://dx.doi.org:/10.1016/j.tibs.2010.07.003
Sirtuins are a highly conserved family of proteins whose activity can prolong the lifespan of model organisms such as yeast, worms and flies. Mammals contain seven sirtuins (SIRT1-7) that modulate distinct metabolic and stress response pathways. Three sirtuins, SIRT3, SIRT4 and SIRT5, are located in the mitochondria, dynamic organelles that function as the primary site of oxidative metabolism and play crucial roles in apoptosis and intracellular signaling. Recent findings have shed light on how the mitochondrial sirtuins function in the control of basic mitochondrial biology, including energy production, metabolism, apoptosis and intracellular signaling.
Mitochondria play critical roles in energy production, metabolism, apoptosis, and intracellular signaling [1–3]. These highly dynamic organelles have the ability to change their function, morphology and number in response to physiological conditions and stressors such as diet, exercise, temperature, and hormones [4]. Proper mitochondrial function is crucial for maintenance of metabolic homeostasis and activation of appropriate stress responses. Not surprisingly, changes in mitochondrial number and activity are implicated in aging and age-related diseases, including diabetes, neurodegenerative diseases, and cancer [1]. Despite the important link between mitochondrial dysfunction and human diseases, in most cases, the molecular causes for dysfunction have not been identified and remain poorly understood.
One of the principal bioenergetic functions of mitochondria is to generate ATP through the process of oxidative phosphorylation (OXPHOS), which occurs in the inner-mitochondrial membrane. Mitochondria are unique bi-membrane organelles that contain their own circular genome (mtDNA) encoding 13 protein subunits involved in electron transport. The remainder of the estimated 1000-1500 mitochondrial proteins are encoded by the nuclear genome and imported into mitochondria from the cytoplasm [5, 6]. These imported proteins can be found either in the matrix, associated with inner or outer mitochondrial membranes or in the inner membrane space (Figure 1). Dozens of nuclear-encoded protein subunits form complexes with the mtDNA-encoded subunits to form electron transport complexes I-IV and ATP synthase, again highlighting the need for precise coordination between these two genomes. The transcriptional coactivator PGC-1α, a master regulator of mitochondrial biogenesis and function, is responsive to a variety of metabolic stresses, ensuring that the number and capacity of mitochondria keeps pace with the energetic demands of tissues [7].

Network of mitochondrial sirtuins
http://www.ncbi.nlm.nih.gov/pmc/articles/instance/2992946/bin/nihms239607f1.gif
Network of mitochondrial sirtuins. Mitochondria can metabolize fuels, such as fatty acids, amino acids, and pyruvate, derived from glucose. Electrons pass through electron transport complexes (I-IV; red) generating a proton gradient, which is used to drive ATP synthase (AS; red) to generate ATP. SIRT3 (gold) binds complexes I and II, regulating cellular energy levels in the cell [43, 55]. Moreover, SIRT3 binds and deacetylates acetyl-CoA synthetase 2 (AceCS2) [39, 40] and glutamate dehydrogenase (GDH) [33, 47], thereby activating their enzymatic activities. SIRT3 also binds and activates long-chain acyl-CoA dehydrogenase (LCAD) [46]. SIRT4 (light purple) binds and represses GDH activity via ADP-ribosylation [21]. In the rate-limiting step of the urea cycle, SIRT5 (light blue) deacetylates and activates carbamoyl phosphate synthetase 1 (CPS1) [48, 49].
As high-energy electrons derived from glucose, amino acids or fatty acids fuels are passed through a series of protein complexes (I-IV), their energy is used to pump protons from the mitochondrial matrix through the inner membrane into the inner-membrane space, generating a proton gradient known as the mitochondrial membrane potential (Dψm) (Figure 1). Ultimately, the electrons reduce oxygen to form water, and the protons flow down their gradient through ATP synthase, driving the formation of ATP from ADP. Protons can also flow through uncoupling proteins (UCPs), dissipating their potential energy as heat. Reactive oxygen species (ROS) are a normal side-product of the respiration process [1, 8]. In addition, an increase in Dψm, whether caused by impaired OXPHOS or by an overabundance of nutrients relative to ADP, will result in aberrant electron migration in the electron transport chain and elevated ROS production [1]. ROS react with lipids, protein and DNA, generating oxidative damage. Consequently, cells have evolved robust mechanisms to guard against an increase in oxidative stress accompanying ROS production [9].
Mitochondria are the primary site of ROS production within the cell, and increased oxidative stress is proposed to be one of the causes of mammalian aging [1, 2, 10]. Major mitochondrial age-related changes are observed in multiple tissues and include decreased Dψm, increased ROS production and an increase in oxidative damage to mtDNA, proteins, and lipids [11–14]. As a result, mitochondrial bioenergetic changes that occur with aging have been extensively reviewed [15–17].
Silent information regulator (SIR) 2 protein and its orthologs in other species, termed sirtuins, promote an increased lifespan in model organisms such as yeast, worms and flies. Mammals contain seven sirtuins (SIRT1–7) that are characterized by an evolutionary conserved sirtuin core domain [18, 19]. This domain contains the catalytic activity and invariant amino acid residues involved in binding NAD+, a metabolic co-substrate. All sirtuins exhibit two major enzymatic activities in vitro: NAD+-dependent protein deacetylase activity and ADP-ribosyltransferase activity. Except for SIRT4, well-defined acetylated substrates have been identified for the other sirtuins. So far, only ADP-ribosyltransferase activity has been described for SIRT4 [20, 21]. Thus, these enzymes couple their biochemical and biological functions to an organism’s energetic state via their dependency on NAD+. A decade of research, largely focused on SIRT1, has revealed that mammalian sirtuins regulate metabolism and cellular survival. In brief, SIRT1–7 target distinct acetylated protein substrates and are localized in distinct subcellular compartments. SIRT1, SIRT6 and SIRT7 are found in nucleus, SIRT2 is primarily cytosolic and SIRT3, 4 and 5 are found in the mitochondria. The mitochondrial-only localization of SIRT3 is controversial and other groups have reported non-mitochondrial localization of this sirtuin [22, 23]. The biology and biochemistry of the seven mammalian sirtuins have been extensively discussed in the literature [24–26] and is not the topic of this review. Instead, we focus on the mitochondrial sirtuins, their substrates, and their impact on mitochondrial biology.
The mitochondrial sirtuins, SIRT3–5 [21, 27–29], participate in the regulation of ATP production, metabolism, apoptosis and cell signaling. Unlike SIRT1, a 100 kDa protein, the mitochondrial sirtuins are small, ranging from 30–40 kDa. Thus, their amino acid sequence consists mostly of an N-terminal mitochondrial targeting sequence and the sirtuin core domain, with small flanking regions. Whereas, SIRT3 and SIRT5 function as NAD+-dependent deacetylases on well defined substrates, SIRT4 has no identified acetylated substrate and only shows ADP-ribosyltransferase activity. It is likely, however, that SIRT4 possesses substrate-specific NAD+-dependent deacetylase activity, as has been demonstrated for SIRT6 [30,31]. The three-dimensional structures for the core domains of human SIRT3 and human SIRT5 have been solved and reveal remarkable structural conservation with other sirtuins, such as the ancestral yeast protein and human SIRT2 (Figure 2) [32–34]. Given its sequence conservation with the other sirtuins [18], it is likely that SIRT4 adopts a similar three-dimensional conformation.
Figure 2 Structure and alignment of sirtuins
Role of mitochondrial sirtuins in metabolism and energy production
The NAD+ dependence of sirtuins provided the first clue that these enzymes function as metabolic sensors. For instance, sirtuin activity can increase when NAD+ levels are abundant, such as times of nutrient deprivation. In line with this model, mass spectrometry studies have revealed that metabolic proteins, such as tricarboxylic acid (TCA) cycle enzymes, fatty acid oxidation enzymes and subunits of oxidative phosphorylation complexes are acetylated in response to metabolic stress [35–37].
Fatty acid oxidation
Consistent with the hypothesis that nutrient stress alters sirtuin activity, a recent report identified significant metabolic abnormalities in Sirt3-/- mice during fasting [38]. In this study, hepatic SIRT3 protein expression increased during fasting, suggesting that both its levels and enzymatic activity are elevated during nutrient deprivation. SIRT3 activates hepatic lipid catabolism via deacetylation of long-chain acyl-CoA dehydrogenase (LCAD), a central enzyme in the fatty acid oxidation pathway. Sirt3-/- mice have diminished fatty acid oxidation, develop fatty liver, have low ATP production, and show a defect in thermogenesis and hypoglycemia during a cold test [38].
Surprisingly, many of the phenotypes observed in Sirt3-/- mice were also observed in mice lacking acetyl-CoA synthetase 2 (AceCS2), a previously identified substrate of SIRT3 [39, 40]. For example, fasting ATP levels were reduced by 50% in skeletal muscle of AceCS2-/- mice, in comparison to wild type (WT) mice. As a result, fasted AceCS2-/- mice were hypothermic and had reduced capacity for exercise. By converting acetate into acetyl CoA, AceCS2 provides an alternate energy source during times of metabolic challenges, such as thermogenesis or fasting. Interestingly, Acadl-deficient mice (Acadl encodes LCAD) also show cold intolerance, reduced ATP, and hypoglycemia under fasting conditions [41]. These overlapping phenotypes between Sirt3-/-, AceCS2-/- and Acadl-/- mice indicate that the regulation of LCAD and AceCS2 acetylation by SIRT3 represents an important adaptive signal during the fasting response (Figure 2).
Electron transport chain
Of all mitochondrial proteins, oxidative phosphorylation complexes are among the most heavily acetylated. One study reported that 511 lysine residues in complexes I-IV and ATP synthase are modified by acetylation [37], hinting that a mitochondrial sirtuin might deacetylate these residues. Indeed, SIRT3 interacts with and deacetylates complex I subunits (including NDUFA9) [42], succinate dehydrogenase (complex II) [43]. SIRT3 has also been shown to bind ATP synthase in a proteomic analysis [44]. SIRT3 also regulates mitochondrial translation, a process which can impact electron transport [45]. Mice lacking SIRT3 demonstrate reduced ATP levels in many tissues [42 46]; however, additional work is required to determine if reduced ATP levels in Sirt3-/- mice is a direct result of OX PHOS hyperacetylation or an indirect effect, via decreased fatty acid oxidation, or a combination of both effects.
Less is known about the roles of SIRT4 and SIRT5 in electron transport. SIRT4 binds adenine nucleotide translocator (ANT), which transports ATP into the cytosol and ADP into the mitochondrial matrix, thereby providing a substrate for ATP synthase [20]. SIRT5 physically interacts with cytochrome C. The biological significance of these interactions, however, remains unknown [21].
TCA cycle
Enzymes for the TCA cycle (also called the Kreb’s cycle) are located in the mitochondrial matrix; this compartmentalization provides a way for cells to utilize metabolites from carbohydrates, fats and proteins. Numerous TCA cycle enzymes are modified by acetylation, although the functional consequences of acetylation have been examined for only a few of these proteins. SIRT3 interacts with several TCA cycle enzymes, including succinate dehydrogenase (SDH, see above [43]) and isocitrate dehydrogenase 2 (ICDH2) [33]. ICDH2 catalyzes the irreversible oxidative decarboxylation of isocitrate to form alpha-ketoglutarate and CO2, while converting NAD+ to NADH. Although the biological significance of these interactions is not yet known, it seems possible that SIRT3 might regulate flux through the TCA cycle.
Role of mitochondrial sirtuins in signaling
During cellular stress or damage, mitochondria release a variety of signals to the cytosol and the nucleus to alert the cell of changes in mitochondrial function. In response, the nucleus generates transcriptional changes to activate a stress response or repair the damage. For example, mitochondrial biogenesis requires a sophisticated transcriptional program capable of responding to the energetic demands of the cell by coordinating expression of both nuclear and mitochondrial encoded genes [4]. Unlike anterograde transcriptional control of mitochondria from nuclear transcription regulators such as PGC-1α, the retrograde signaling pathway, from the mitochondria to the nucleus is poorly understood in mammals. Although there is no evidence directly linking sirtuins to a mammalian retrograde signaling pathway, changes in mitochondrial sirtuin activity could influence signals transmitted from the mitochondria. Interestingly, the nuclear sirtuin SIRT1 deacetylates and activates PGC-1α, a key factor in the transcriptional regulation of genes involved in fatty acid oxidation and oxidative phosphorylation (Figure 3) [50, 51]. Thus, mitochondrial and nuclear sirtuins might exist in a signaling communication loop to control metabolism.

mitochondria-at-nexus-of-cellular-signaling-nihms239607f3
http://www.ncbi.nlm.nih.gov/pmc/articles/instance/2992946/bin/nihms239607f3.gif
Mitochondria at nexus of cellular signaling. Mitochondria and mitochondrial sirtuins play a central role in intra- and extra-cellular signaling. Circulating fatty acids and acetate provide whole body energy homeostasis. The mitochondrial metabolites NAD+, NADH, ATP, Ca2+, ROS, ketone bodies, and acetyl-CoA participate in intracellular signaling.
Numerous signaling pathways are activated by changes in mitochondrial release of metabolites and molecules, such as Ca2+, ATP, NAD+, NADH, nitric oxide (NO), and ROS (Figure 3). Of these, Ca2+ is the best studied as a mitochondrial messenger. Mitochondria are important regulators of Ca2+ storage and homeostasis, and mitochondrial Ca2+ uptake is directly tied to the membrane potential of the organelle. Membrane potential serves as a gauge of mitochondrial function: disruption of OXPHOS, interruption in the supply or catabolism of nutrients or loss of structural integrity generally result in a fall in membrane potential, and, in turn, decreased mitochondrial Ca2+ uptake. Subsequent increases in cytosolic free Ca2+ will activate calcineurin and several Ca2+-dependent kinases [52] and affect a wide variety of transcription factors to produce appropriate cell-specific transcriptional responses [53]. Through regulation of nutrient oxidation and electron transport or yet to be identified target(s), mitochondrial sirtuins could influence mAlthough the effect of sirtuins on intracellular calcium signaling has not been studied directly, sirtuin effects on ATP production have been shown. ANT facilitates the exchange of mitochondrial ATP with cytosolic ADP. As a result the cytosolic ATP:ADP ratio reflects changes in mitochondrial energy production. A fall in ATP production activates AMP-activated protein kinase (AMPK), which directly stimulates mitochondrial energy production, inhibits protein synthesis through regulation of mammalian target of rapamycin (mTOR), and influences mitochondrial transcriptional programs [54]. SIRT3 regulates ATP levels in a variety of tissues, suggesting that its activity could have an important role in ATP-mediated retrograde signaling [46,55]. Indeed, recent studies have shown that SIRT3 regulates AMPK activation [56–58]. Furthermore, SIRT4 interacts with ANT [20], raising the possibility that SIRT4 activity also influences the ATP:ADP ratio or membrane potential and modulates important mitochondrial signals.
NAD+ and NADH levels are intimately connected with mitochondrial energy production and regulate mitochondrial sirtuin activity. Unlike NAD+, however, NADH is not a sirtuin co-substrate. Indeed, changes in the NAD+:NADH ratio can change the redox state of the cell and alter the activity of enzymes such as poly-ADP-ribose polymerases and sirtuins, with subsequent effects on signaling cascades and gene expression [59–61]. Changes in mitochondrial sirtuin activity could change the balance of these metabolites within the mitochondria. For example, fatty acid oxidation reduces NAD+ to NADH, which is oxidized back to NAD+ by OXPHOS. However, it is unclear whether changes in NAD+/NADH can be transmitted outside the organelle. The inner mitochondrial membrane is impermeable to NAD+ and NADH; however, the mitochondrial malate-aspartate shuttle could transfer reducing equivalents across the mitochondrial membranes.
Mitochondrial sirtuin control of apoptosis
Apoptosis is a cellular process of programmed cell death. Mitochondria play an important role in apoptosis by the activation of mitochondrial outer membrane permeabilization, which represents the irrevocable point of no return in committing a cell to death. Outer membrane permeabilization leads to the release of caspase-activating molecules, caspase-independent death effectors, and disruption of ATP production. Despite the central role for mitochondria in the control of apoptosis, surprisingly little is known about how mitochondrial sirtuins participate in apoptotic programs. SIRT3 plays a pro-apoptotic role in both BCL2-53- and JNK-regulated apoptosis [63]. Additionally, cells lacking SIRT3 show decreased stress-induced apoptosis, lending further support for a pro-apoptotic role for SIRT3 [62]. Furthermore, recent work points to a tumor suppressive role for SIRT3: SIRT3 levels are decreased in human breast cancers and Sirt3 null mice develop mammary tumors after 12 months [62]. The mechanism for the tumor suppressive function of SIRT3 is incompletely understood, but involves repression of ROS and protection against DNA damage [62]. In conflicting studies, SIRT3 has been shown to be anti-apoptotic. For example, in the cellular response to DNA damage when mitochondrial NAD+ levels fall below critical levels, SIRT3 and SIRT4 display anti-apoptotic activity, protecting cells from death [64]. SIRT3 has also been shown to be cardioprotective, in part by activation of ROS clearance genes [65]. In future studies, it will be important to elucidate the balance achieved by SIRT3 between stress resistance (anti-apoptosis) and tumor suppression (pro-apoptosis). Additionally, the role of SIRT4 and SIRT5 in regulating metabolism suggests that these mitochondrial sirtuins could also contribute to apoptosis in tumor suppressive or stress resistant manners.
Concluding remarks
An elegant coordination of metabolism by mitochondrial sirtuins is emerging where SIRT3, SIRT4 and SIRT5 serve at critical junctions in mitochondrial metabolism by acting as switches to facilitate energy production during nutrient adaptation and stress. Rather than satisfy, these studies lead to more questions. How important are changes in global mitochondrial acetylation to mitochondrial biology and is acetylation status a readout for sirtuin activity? What are other substrates for SIRT4 and SIRT5? What molecular factors dictate substrate specificity for mitochondrial sirtuins? Moreover, further studies will provide insight into the therapeutic applications for targeting mitochondrial sirtuins to treat human diseases. It is clear that many discoveries have yet to be made in this exciting area of biology.
Body of review in energetic metabolic pathways in malignant T cells
Antigen stimulation of T cell receptor (TCR) signaling to nuclear factor (NF)-B is required for T cell proliferation and differentiation of effector cells.
The TCR-to-NF-B pathway is generally viewed as a linear sequence of events in which TCR engagement triggers a cytoplasmic cascade of protein-protein interactions and post-translational modifications, ultimately culminating in the nuclear translocation of NF-B.
Activation of effect or T cells leads to increased glucose uptake, glycolysis, and lipid synthesis to support growth and proliferation.
Activated T cells were identified with CD7, CD5, CD3, CD2, CD4, CD8 and CD45RO. Simultaneously, the expression of CD95 and its ligand causes apoptotic cells death by paracrine or autocrine mechanism, and during inflammation, IL1-β and interferon-1α. The receptor glucose, Glut 1, is expressed at a low level in naive T cells, and rapidly induced by Myc following T cell receptor (TCR) activation. Glut1 trafficking is also highly regulated, with Glut1 protein remaining in intracellular vesicles until T cell activation.
Dr. Aurel,
Targu Jiu
Like this:
Like Loading...
Read Full Post »


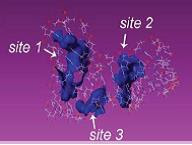

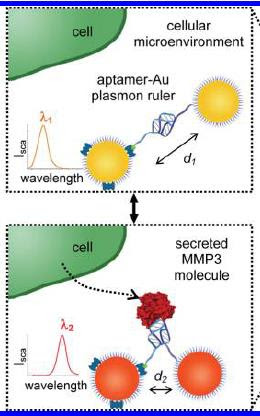


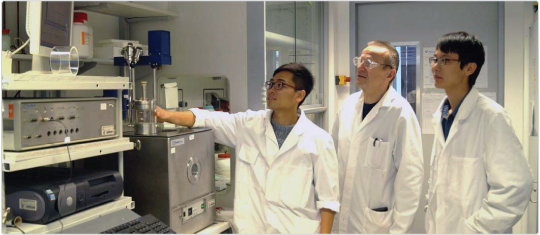


Wouldn’t then the preferred target be mTORC instead of Sirtuins if mTORC represses Sirtuin activity?
The answer may not be so simple, perhaps a conundrum.
In conflicting studies, SIRT3 has been shown to be anti-apoptotic. For example, in the cellular response to DNA damage when mitochondrial NAD+ levels fall below critical levels, SIRT3 and SIRT4 display anti-apoptotic activity, protecting cells from death [64].
For anti-cancer activity, apoptosis is a desired effect. This reminds me of the problem 15 years ago with the drug that would be effective against sepsis, the best paper of the year in NEJM. It failed.
We tend to not appeciate the intricacies of biological interactions and fail to see bypass reactions. Pleotropy comes up again and again. The seminal work from Britton Chances lab on the NAD+/NADH ratio have been overlooked.