Feeds:
Posts
Comments

Archive for the ‘Amino acids’ Category

Summary of Cell Structure, Anatomic Correlates of Metabolic Function

Author and Curator: Larry H. Bernstein, MD, FCAP  


This chapter has been concerned with the subcellular ultrastructure of organelles, and importantly, their function.  There is no waste in the cell structure. The nucleus has the instructions necessary to carry out the cell’s functions.  In the Eukaryotic cell there is significant differentiation so that the cells are regulated for the needs that they uniquely carry out.  When there is disregulation, it leads to remodeling or to cell death.

Here I shall note some highlights of this chapter.

  1. In every aspect of cell function, proteins are involved embedded in the structure, for most efficient functioning.
  2. Metabolic regulation is dependent on pathways that are also linkages of proteins.
  3. Energy utilization is dependent on enzymatic reactions, often involving essential metal ions of high valence numbers, which facilitates covalent and anion binding, and has an essential role in allostericity.

Mitochondria

Mitochondria,_mammalian_lung

Mitochondria,_mammalian_lung

http://en.wikipedia.org/wiki/File:Mitochondria,_mammalian_lung_-_TEM.jpg

Mitochondria range from 0.5 to 1.0 micrometer (μm) in diameter. These structures are sometimes described as “cellular power plants” because they generate most of the cell’s supply of adenosine triphosphate (ATP), used as a source of chemical energy. In addition to supplying cellular energy, mitochondria are involved in other tasks such as signaling, cellular differentiation, cell death, as well as the control of the cell cycle and cell growth. Mitochondria have been implicated in several human diseases, including mitochondrial disorders and cardiac dysfunction.

The number of mitochondria in a cell can vary widely by organism, tissue, and cell type. For instance, red blood cells have no mitochondria, whereas liver cells can have more than 2000. The organelle is composed of compartments that carry out specialized functions. These compartments or regions include the outer membrane, the intermembrane space, the inner membrane, and the cristae and matrix. Mitochondrial proteins vary depending on the tissue and the species. The mitochondrial proteome is thought to be dynamically regulated. Although most of a cell’s DNA is contained in the cell nucleus, the mitochondrion has its own independent genome. Further, its DNA shows substantial similarity to bacterial genomes.

In 1913 particles from extracts of guinea-pig liver were linked to respiration by Otto Heinrich Warburg, which he called “grana”. Warburg and Heinrich Otto Wieland, who had also postulated a similar particle mechanism, disagreed on the chemical nature of the respiration. It was not until 1925 when David Keilin discovered cytochromes that the respiratory chain was described.  In 1939, experiments using minced muscle cells demonstrated that one oxygen atom can form two adenosine triphosphate molecules, and, in 1941, the concept of phosphate bonds being a form of energy in cellular metabolism was developed by Fritz Albert Lipmann. In the following years, the mechanism behind cellular respiration was further elaborated, although its link to the mitochondria was not known. The introduction of tissue fractionation by Albert Claude allowed mitochondria to be isolated from other cell fractions and biochemical analysis to be conducted on them alone. In 1946, he concluded that cytochrome oxidase and other enzymes responsible for the respiratory chain were isolated to the mitchondria.

The first high-resolution micrographs appeared in 1952, replacing the Janus Green stains as the preferred way of visualising the mitochondria. This led to a more detailed analysis of the structure of the mitochondria, including confirmation that they were surrounded by a membrane. It also showed a second membrane inside the mitochondria that folded up in ridges dividing up the inner chamber and that the size and shape of the mitochondria varied from cell to cell.  In 1967, it was discovered that mitochondria contained ribosomes. In 1968, methods were developed for mapping the mitochondrial genes, with the genetic and physical map of yeast mitochondria being completed in 1976.

A mitochondrion contains outer and inner membranes composed of phospholipid bilayers and proteins. The two membranes have different properties. Because of this double-membraned organization, there are five distinct parts to a mitochondrion. They are:

  1. the outer mitochondrial membrane,
  2. the intermembrane space (the space between the outer and inner membranes),
  3. the inner mitochondrial membrane,
  4. the cristae space (formed by infoldings of the inner membrane), and
  5. the matrix (space within the inner membrane).

Mitochondria stripped of their outer membrane are called mitoplasts.

Mitochondrion_structure_drawing

Mitochondrion_structure_drawing

http://upload.wikimedia.org/wikipedia/commons/thumb/9/9e/Mitochondrion_structure_drawing.svg/500px-Mitochondrion_structure_drawing.svg.png

Mitochondrion ultrastructure (interactive diagram) A mitochondrion has a double membrane; the inner one contains its chemiosmotic apparatus and has deep grooves which increase its surface area. While commonly depicted as an “orange sausage with a blob inside of it” (like it is here), mitochondria can take many shapes and their intermembrane space is quite thin.

The intermembrane space is the space between the outer membrane and the inner membrane. It is also known as perimitochondrial space. Because the outer membrane is freely permeable to small molecules, the concentrations of small molecules such as ions and sugars in the intermembrane space is the same as the cytosol. However, large proteins must have a specific signaling sequence to be transported across the outer membrane, so the protein composition of this space is different from the protein composition of the cytosol. One protein that is localized to the intermembrane space in this way is cytochrome c.

The inner mitochondrial membrane contains proteins with five types of functions:

  1. Those that perform the redox reactions of oxidative phosphorylation
  2. ATP synthase, which generates ATP in the matrix
  3. Specific transport proteins that regulate metabolite passage into and out of the matrix
  4. Protein import machinery.
  5. Mitochondria fusion and fission protein.

It contains more than 151 different polypeptides, and has a very high protein-to-phospholipid ratio (more than 3:1 by weight, which is about 1 protein for 15 phospholipids). The inner membrane is home to around 1/5 of the total protein in a mitochondrion. In addition, the inner membrane is rich in an unusual phospholipid, cardiolipin. This phospholipid was originally discovered in cow hearts in 1942, and is usually characteristic of mitochondrial and bacterial plasma membranes. Cardiolipin contains four fatty acids rather than two, and may help to make the inner membrane impermeable. Unlike the outer membrane, the inner membrane doesn’t contain porins, and is highly impermeable to all molecules. Almost all ions and molecules require special membrane transporters to enter or exit the matrix. Proteins are ferried into the matrix via the translocase of the inner membrane (TIM) complex or via Oxa1. In addition, there is a membrane potential across the inner membrane, formed by the action of the enzymes of the electron transport chain.

The inner mitochondrial membrane is compartmentalized into numerous cristae, which expand the surface area of the inner mitochondrial membrane, enhancing its ability to produce ATP. For typical liver mitochondria, the area of the inner membrane is about five times as large as the outer membrane. This ratio is variable and mitochondria from cells that have a greater demand for ATP, such as muscle cells, contain even more cristae. These folds are studded with small round bodies known as F1 particles or oxysomes. These are not simple random folds but rather invaginations of the inner membrane, which can affect overall chemiosmotic function. One recent mathematical modeling study has suggested that the optical properties of the cristae in filamentous mitochondria may affect the generation and propagation of light within the tissue.

Mitochondrion

Mitochondrion

http://upload.wikimedia.org/wikipedia/commons/thumb/d/d8/MitochondrionCAM.jpg/250px-MitochondrionCAM.jpg

The matrix is the space enclosed by the inner membrane. It contains about 2/3 of the total protein in a mitochondrion. The matrix is important in thThe MAM is enriched in enzymes involved in lipid biosynthesis, such as phosphatidylserine synthase on the ER face and phosphatidylserine decarboxylase on the mitochondrial face.[28][29] Because mitochondria are dynamic organelles constantly undergoing fission and fusion events, they require a constant and well-regulated supply of phospholipids for membrane integrity.[30][31] But mitochondria are not only a destination for the phospholipids they finish synthesis of; rather, this organelle also plays a role in inter-organelle trafficking of the intermediates and products of phospholipid biosynthetic pathways, ceramide and cholesterol metabolism, and glycosphingolipid anabolisme production of ATP with the aid of the ATP synthase contained in the inner membrane. The matrix contains a highly concentrated mixture of hundreds of enzymes, special mitochondrial ribosomes, tRNA, and several copies of the mitochondrial DNA genome. Of the enzymes, the major functions include oxidation of pyruvate and fatty acids, and the citric acid cycle.

Purified MAM from subcellular fractionation has shown to be enriched in enzymes involved in phospholipid exchange, in addition to channels associated with Ca2+ signaling. The mitochondria-associated ER membrane (MAM) is another structural element that is increasingly recognized for its critical role in cellular physiology and homeostasis. Once considered a technical snag in cell fractionation techniques, the alleged ER vesicle contaminants that invariably appeared in the mitochondrial fraction have been re-identified as membranous structures derived from the MAM—the interface between mitochondria and the ER. Physical coupling between these two organelles had previously been observed in electron micrographs and has more recently been probed with fluorescence microscopy. Such studies estimate that at the MAM, which may comprise up to 20% of the mitochondrial outer membrane, the ER and mitochondria are separated by a mere 10–25 nm and held together by protein tethering complexes.

Such trafficking capacity depends on the MAM, which has been shown to facilitate transfer of lipid intermediates between organelles. In contrast to the standard vesicular mechanism of lipid transfer, evidence indicates that the physical proximity of the ER and mitochondrial membranes at the MAM allows for lipid flipping between opposed bilayers. Despite this unusual and seemingly energetically unfavorable mechanism, such transport does not require ATP. Instead, in yeast, it has been shown to be dependent on a multiprotein tethering structure termed the ER-mitochondria encounter structure, or ERMES, although it remains unclear whether this structure directly mediates lipid transfer or is required to keep the membranes in sufficiently close proximity to lower the energy barrier for lipid flipping.

A critical role for the ER in calcium signaling was acknowledged before such a role for the mitochondria was widely accepted, in part because the low affinity of Ca2+ channels localized to the outer mitochondrial membrane seemed to fly in the face of this organelle’s purported responsiveness to changes in intracellular Ca2+ flux. But the presence of the MAM resolves this apparent contradiction: the close physical association between the two organelles results in Ca2+ microdomains at contact points that facilitate efficient Ca2+ transmission from the ER to the mitochondria. Transmission occurs in response to so-called “Ca2+ puffs” generated by spontaneous clustering and activation of IP3R, a canonical ER membrane Ca2+ channel.

The properties of the Ca2+ pump SERCA and the channel IP3R present on the ER membrane facilitate feedback regulation coordinated by MAM function. In particular, clearance of Ca2+ by the MAM allows for spatio-temporal patterning of Ca2+ signaling because Ca2+ alters IP3R activity in a biphasic manner. SERCA is likewise affected by mitochondrial feedback: uptake of Ca2+ by the MAM stimulates ATP production, thus providing energy that enables SERCA to reload the ER with Ca2+ for continued Ca2+ efflux at the MAM. Thus, the MAM is not a passive buffer for Ca2+ puffs; rather it helps modulate further Ca2+ signaling through feedback loops that affect ER dynamics.

Regulating ER release of Ca2+ at the MAM is especially critical because only a certain window of Ca2+ uptake sustains the mitochondria, and consequently the cell, at homeostasis. Sufficient intraorganelle Ca2+ signaling is required to stimulate metabolism by activating dehydrogenase enzymes critical to flux through the citric acid cycle. However, once Ca2+ signaling in the mitochondria passes a certain threshold, it stimulates the intrinsic pathway of apoptosis in part by collapsing the mitochondrial membrane potential required for metabolism.  Studies examining the role of pro- and anti-apoptotic factors support this model; for example, the anti-apoptotic factor Bcl-2 has been shown to interact with IP3Rs to reduce Ca2+ filling of the ER, leading to reduced efflux at the MAM and preventing collapse of the mitochondrial membrane potential post-apoptotic stimuli. Given the need for such fine regulation of Ca2+ signaling, it is perhaps unsurprising that dysregulated mitochondrial Ca2+ has been implicated in several neurodegenerative diseases, while the catalogue of tumor suppressors includes a few that are enriched at the MAM.

…more

http://en.wikipedia.org/wiki/Mitochondrion

Lysosome and Apoptosis

Role of autophagy in cancer

R Mathew, V Karantza-Wadsworth & E White

Nature Reviews Cancer 7, 961-967 (Dec 2007) |  http://dx.doi.org:/10.1038/nrc2254

Autophagy is a cellular degradation pathway for the clearance of damaged or superfluous proteins and organelles. The recycling of these intracellular constituents also serves as an alternative energy source during periods of metabolic stress to maintain homeostasis and viability. In tumour cells with defects in apoptosis, autophagy allows prolonged survival. Paradoxically, autophagy defects are associated with increased tumorigenesis, but the mechanism behind this has not been determined. Recent evidence suggests that autophagy provides a protective function to limit tumour necrosis and inflammation, and to mitigate genome damage in tumour cells in response to metabolic stress.

Sustained Activation of mTORC1 in Skeletal Muscle Inhibits Constitutive and Starvation-Induced Autophagy and Causes a Severe, Late-Onset Myopathy

P Castets, S Lin, N Rion, S Di Fulvio, et al.
cell-metabolism 7 May, 2013; 17(5): p731–744   http://dx.doi.org/10.1016/j.cmet.2013.03.015

  • mTORC1 inhibition is required for constitutive and starvation-induced autophagy
  • Sustained activation of mTORC1 causes a severe myopathy due to autophagy impairment
  • TSC1 depletion is sufficient to activate mTORC1 irrespective of other stimuli
  • mTORC1 inactivation is sufficient to trigger LC3 lipidation

Autophagy is a catabolic process that ensures homeostatic cell clearance and is deregulated in a growing number of myopathological conditions. Although FoxO3 was shown to promote the expression of autophagy-related genes in skeletal muscle, the mechanisms triggering autophagy are unclear. We show that TSC1-deficient mice (TSCmKO), characterized by sustained activation of mTORC1, develop a late-onset myopathy related to impaired autophagy. In young TSCmKO mice,

  • constitutive and starvation-induced autophagy is blocked at the induction steps via
  • mTORC1-mediated inhibition of Ulk1, despite FoxO3 activation.

Rapamycin is sufficient to restore autophagy in TSCmKO mice and

  • improves the muscle phenotype of old mutant mice.

Inversely, abrogation of mTORC1 signaling by

  • depletion of raptor induces autophagy regardless of FoxO inhibition.

Thus, mTORC1 is the dominant regulator of autophagy induction in skeletal muscle and

  • ensures a tight coordination of metabolic pathways.

These findings may open interesting avenues for therapeutic strategies directed toward autophagy-related muscle diseases.

Histone deacetylases 1 and 2 regulate autophagy flux and skeletal muscle homeostasis in mice

Viviana Moresi, et al.   PNAS Jan 31, 2012; 109(5): 1649-1654
http://dx.doi.org:/10.1073/pnas.1121159109
http://www.pnas.org/content/109/5/1649/F6.medium.gif

HDAC1 activates FoxO and is both sufficient and required for skeletal muscle atrophy

Beharry, PB. Sandesara, BM. Roberts, et al.
J. Cell Sci. Apr 2014 127 (7) 1441-1453   http://dx.doi.org:/10.1242/​jcs.136390

The Forkhead box O (FoxO) transcription factors are activated, and necessary for the muscle atrophy, in several pathophysiological conditions, including muscle disuse and cancer cachexia. However, the mechanisms that lead to FoxO activation are not well defined. Recent data from our laboratory and others indicate that

  • the activity of FoxO is repressed under basal conditions via reversible lysine acetylation,
  • which becomes compromised during catabolic conditions.

Therefore, we aimed to determine how histone deacetylase (HDAC) proteins contribute to

  • activation of FoxO and induction of the muscle atrophy program.

Through the use of various pharmacological inhibitors to block HDAC activity, we demonstrate that

  • class I HDACs are key regulators of FoxO and the muscle-atrophy program
  • during both nutrient deprivation and skeletal muscle disuse.

Furthermore, we demonstrate, through the use of wild-type and dominant-negative HDAC1 expression plasmids,

  • that HDAC1 is sufficient to activate FoxO and induce muscle fiber atrophy in vivo and
  • is necessary for the atrophy of muscle fibers that is associated with muscle disuse.

The ability of HDAC1 to cause muscle atrophy required its deacetylase activity and

  • was linked to the induction of several atrophy genes by HDAC1,
  • including atrogin-1, which required deacetylation of FoxO3a.

Moreover, pharmacological inhibition of class I HDACs during muscle disuse, using MS-275,

  • significantly attenuated both disuse muscle fiber atrophy and contractile dysfunction.

Together, these data solidify the importance of class I HDACs in the muscle atrophy program and

  • indicate that class I HDAC inhibitors are feasible countermeasures to impede muscle atrophy and weakness.

Autophagy and thyroid carcinogenesis: genetic and epigenetic links
F Morani, R Titone, L Pagano, et al.  Endocr Relat Cancer Feb 1, 2014 21 R13-R29
http://dx.doi.org:/10.1530/ERC-13-0271

Autophagy is a vesicular process for the lysosomal degradation of protein aggregates and

  • of damaged or redundant organelles.

Autophagy plays an important role in cell homeostasis, and there is evidence that

  • this process is dysregulated in cancer cells.

Recent in vitro preclinical studies have indicated that autophagy is

  • involved in the cytotoxic response to chemotherapeutics in thyroid cancer cells.

Indeed, several oncogenes and oncosuppressor genes implicated in thyroid carcinogenesis

  • also play a role in the regulation of autophagy.

In addition, some epigenetic modulators involved in thyroid carcinogenesis also influence autophagy. In this review, we highlight the genetic and epigenetic factors that

  • mechanistically link thyroid carcinogenesis and autophagy, thus substantiating the rationale for
  • an autophagy-targeted therapy of aggressive and radio-chemo-resistant thyroid cancers.

Read Full Post »

Introduction to Subcellular Structure

Author and Curator: Larry H. Bernstein, MD, FCAP  


The following chapter of the metabolism/transcriptomics/proteomics/metabolomics series deals with the subcellular structure of the cell.  This would have to include the cytoskeleton, which has a key role in substrate and ion efflux and influx, and in cell movement mediated by tubulins.  It has been extensively covered already.  Much of the contributions here are concerned with the mitochondrion, which is also covered in metabolic pathways.  The ribosome is the organelle that we have discussed with respect to the transcription and translation of the genetic code through mRNA and tRNA, and the therapeutic implications of SiRNA as well as the chromatin regulation of lncRNA.

We have also encountered the mitochondrion and the lysosome in the discussion of apoptosis and autophagy, maintaining the balance between cell regeneration and cell death.

I here list the organelles:

  1. Nucleus
  2. Centrosome
  3. Nuclear Membrane
  4. Ribososome
  5. Endoplasmic Reticulum
  6. Mitochondria
  7. Lysosome
  8. Cytoskeleton
  9. Golgi apparatus
  10. Cytoplasm
cell_organelle_quiz

cell_organelle_quiz

http://www.youtube.com/watch?feature=player_embedded&v=JufLDxmCwB0

http://www.youtube.com/watch?feature=player_embedded&v=FFrKN7hJm64

Golgi Apparatus

Found within the cytoplasm of both plant and animal cells, the Golgi is composed of stacks of membrane-bound structures known as cisternae (singular: cisterna). An individual stack is sometimes called a dictyosome (from Greek dictyon: net + soma: body), especially in plant cells. A mammalian cell typically contains 40 to 100 stacks. Between four and eight cisternae are usually present in a stack; however, in some protists as many as sixty have been observed. Each cisterna comprises a flat, membrane-enclosed disc that includes special Golgi enzymes which modify or help to modify cargo proteins that travel through it.

The cisternae stack has four functional regions: the cis-Golgi network, medial-Golgi, endo-Golgi, and trans-Golgi network. Vesicles from the endoplasmic reticulum (via the vesicular-tubular clusters) fuse with the network and subsequently progress through the stack to the trans-Golgi network, where they are packaged and sent to their destination.

The Golgi apparatus is integral in modifying, sorting, and packaging these macromolecules for cell secretion (exocytosis) or use within the cell. It primarily modifies proteins delivered from the rough endoplasmic reticulum, but is also involved in the transport of lipids around the cell, and the creation of lysosomes.  Enzymes within the cisternae are able to modify the proteins by addition of carbohydrates (glycosylation) and phosphates (phosphorylation). In order to do so, the Golgi imports substances such as nucleotide sugars from the cytosol. These modifications may also form a signal sequence which determines the final destination of the protein. For example, the Golgi apparatus adds a mannose-6-phosphate label to proteins destined for lysosomes.

The Golgi plays an important role in the synthesis of proteoglycans, which are molecules present in the extracellular matrix of animals. It is also a major site of carbohydrate synthesis. This includes the production of glycosaminoglycans (GAGs), long unbranched polysaccharides which the Golgi then attaches to a protein synthesised in the endoplasmic reticulum to form proteoglycans. Enzymes in the Golgi polymerize several of these GAGs via a xylose link onto the core protein. Another task of the Golgi involves the sulfation of certain molecules passing through its lumen via sulfotranferases that gain their sulfur molecule from a donor called PAPS. This process occurs on the GAGs of proteoglycans as well as on the core protein. Sulfation is generally performed in the trans-Golgi network. The level of sulfation is very important to the proteoglycans’ signalling abilities, as well as giving the proteoglycan its overall negative charge.

The phosphorylation of molecules requires that ATP is imported into the lumen of the Golgi and utilised by resident kinases such as casein kinase 1 and casein kinase 2. One molecule that is phosphorylated in the Golgi is apolipoprotein, which forms a molecule known as VLDL that is found in plasma. It is thought that the phosphorylation of these molecules labels them for secretion into the blood.

The Golgi has a putative role in apoptosis, with several Bcl-2 family members localised there, as well as to the mitochondria. A newly characterized protein, GAAP (Golgi anti-apoptotic protein), almost exclusively resides in the Golgi and protects cells from apoptosis by an as-yet undefined mechanism.

The vesicles that leave the rough endoplasmic reticulum are transported to the cis face of the Golgi apparatus, where they fuse with the Golgi membrane and empty their contents into the lumen. Once inside the lumen, the molecules are modified, then sorted for transport to their next destinations. The Golgi apparatus tends to be larger and more numerous in cells that synthesize and secrete large amounts of substances; for example, the plasma B cells and the antibody-secreting cells of the immune system have prominent Golgi complexes.

Those proteins destined for areas of the cell other than either the endoplasmic reticulum or Golgi apparatus are moved towards the trans face, to a complex network of membranes and associated vesicles known as the trans-Golgi network (TGN). This area of the Golgi is the point at which proteins are sorted and shipped to their intended destinations by their placement into one of at least three different types of vesicles, depending upon the molecular marker they carry.

Nucleus_ER_golgi

Nucleus_ER_golgi

Diagram of secretory process from endoplasmic reticulum (orange) to Golgi apparatus (pink). 1. Nuclear membrane; 2. Nuclear pore; 3. Rough endoplasmic reticulum (RER); 4. Smooth endoplasmic reticulum (SER); 5. Ribosome attached to RER; 6. Macromolecules; 7. Transport vesicles; 8. Golgi apparatus; 9. Cis face of Golgi apparatus; 10. Trans face of Golgi apparatus; 11. Cisternae of the Golgi Apparatus

Exocytotic vesicles

After packaging, the vesicles bud off and immediately move towards the plasma membrane, where they fuse and release the contents into the extracellular space in a process known as constitutive secretion. (Antibody release by activated plasma B cells)

Secretory vesicles

After packaging, the vesicles bud off and are stored in the cell until a signal is given for their release. When the appropriate signal is received they move towards the membrane and fuse to release their contents. This process is known as regulated secretion. (Neurotransmitter release from neurons)

Lysosomal vesicles

Vesicle contains proteins and ribosomes destined for the lysosome, an organelle of degradation containing many acid hydrolases, or to lysosome-like storage organelles. These proteins include both digestive enzymes and membrane proteins. The vesicle first fuses with the late endosome, and the contents are then transferred to the lysosome via unknown mechanisms.

http://en.wikipedia.org/wiki/Golgi_apparatus

Lysosome (derived from the Greek words lysis, meaning “to loosen”, and soma, “body”) is a membrane-bound cell organelle found in animal cells (they are absent in red blood cells). They are structurally and chemically spherical vesicles containing hydrolytic enzymes, which are capable of breaking down virtually all kinds of biomolecules, including proteins, nucleic acids, carbohydrates, lipids, and cellular debris.  Lysosomes are responsible for cellular homeostasis for their involvements in secretion, plasma membrane repair, cell signalling and energy metabolism, which are related to health and diseases. Depending on their functional activity their sizes can be very different, as the biggest ones can be more than 10 times bigger than the smallest ones. They were discovered and named by Belgian biologist Christian de Duve, who eventually received the Nobel Prize in Physiology or Medicine in 1974.

Enzymes of the lysosomes are synthesised in the rough endoplasmic reticulum. The enzymes are released from Golgi apparatus in small vesicles which ultimately fuse with acidic vesicles called endosomes, thus becoming full lysosomes. In the process the enzymes are specifically tagged with mannose 6-phosphate to differentiate them from other enzymes. Lysosomes are interlinked with three intracellular processes namely phagocytosis, endocytosis and autophagy. Extracellular materials such as microorganisms taken up by phagocytosis, macromolecules by endocytosis, and unwanted cell organelles are fused with lysosomes in which they are broken down to their basic molecules. Thus lysosomes are the recycling units of a cell.

http://en.wikipedia.org/wiki/Lysosome

The endoplasmic reticulum (ER) is a type of organelle in the cells of eukaryotic organisms that forms an interconnected network of flattened, membrane-enclosed sacs or tubes known as cisternae. The membranes of the ER are continuous with the outer membrane of the nuclear envelope. Endoplasmic reticulum occurs in most types of eukaryotic cells, including the most primitive Giardia, but is absent from red blood cells and spermatozoa. There are two types of endoplasmic reticulum, rough endoplasmic reticulum (RER) and smooth endoplasmic reticulum (SER). The outer (cytosolic) face of the rough endoplasmic reticulum is studded with ribosomes that are the sites of protein synthesis. The rough endoplasmic reticulum is especially prominent in cells such as hepatocytes where active smooth endoplasmic reticulum lacks ribosomes and functions in lipid metabolism, carbohydrate metabolism, and detoxification and is especially abundant in mammalian liver and gonad cells. The lacey membranes of the endoplasmic reticulum were first seen in 1945 by Keith R. Porter, Albert Claude, Brody Meskers and Ernest F. Fullam, using electron microscopy.

http://en.wikipedia.org/wiki/Endoplasmic_reticulum

endoplasmic_reticulum

endoplasmic_reticulum

https://2cslacardano.wikispaces.com/file/view/Cell7.png/338811858/408×313/Cell7.png

Cytoskeleton

The Effects of Actomyosin Tension on Nuclear Pore Transport
Rachel Sammons
Undergraduate Honors Thesis
Spring 2011

The cytoskeleton maintains cellular structure and tension through a force balance with the nucleus, where actomyosin is anchored to the nuclear envelope by nesprin integral proteins. It is hypothesized that the presence or absence of this tension alters the transport of molecules through the nuclear pore complex. We tested the effects of cytoskeletal tension on nuclear transport in human umbilical vein endothelial cells (HUVECs) by performing fluorescence recovery after photo-bleaching (FRAP) experiments on the nuclei to monitor the passive transport of the molecules through nuclear pores.

Using myosin inhibitors, as well as siRNA transfections to reduce the expression of nesprin-1, we altered the nucleo-cytoskeletal force balance and monitored the effect of each on the nuclear pore. FRAP data was fit to a diffusion model by assuming pseudo-steady state inside the nuclear pore, perfect mixing within both the cytoplasm and the nucleus, and no intracellular binding of the fluorescent probes. From these results and a model from the current literature relating diffusion rate constants to nuclear pore radii, we were able to determine that changing cytoskeletal tension alters nuclear pore size and passive transport.

nuclear pores in nuclear envelope

nuclear pores in nuclear envelope

image of nuclear pores on the external surface of the nuclear envelope

nuclear envelope and FG filaments

nuclear envelope and FG filaments

nuclear envelope and FG filaments

Figure 1: The structure and location of the nuclear pore, shown by (a) AFM image of nuclear pores on the external surface of the nuclear envelope[5] and (b) computer model cross-section. The nuclear envelope is shown in cyan, and FG filaments in blue can be seen throughout the channel. The nuclear basket extends into the nucleoplasm.

Fusion-pore expansion during syncytium formation is restricted by an actin network

A Chen, E Leikina, K Melikov, B Podbilewicz, MM. Kozlov and LV. Chernomordik,*
J Cell Sci 1 Nov 2008;121: 3619-3628. http://dx.doi.org:/10.1242/​jcs.032169

Effects of actin-modifying agents indicate that the actin cortex slows down pore expansion. We propose that the growth of the strongly bent fusion-pore rim is restricted by a dynamic resistance of the actin network and driven by membrane-bending proteins that are involved in the generation of highly curved intracellular membrane compartments.

Read Full Post »

Summary of Transcription, Translation ond Transcription Factors

Author and Curator:  Larry H. Bernstein, MD, FCAP  

Article ID #158: Summary of Transcription, Translation and Transcription Factors. Published on 11/5/2014

WordCloud Image Produced by Adam Tubman


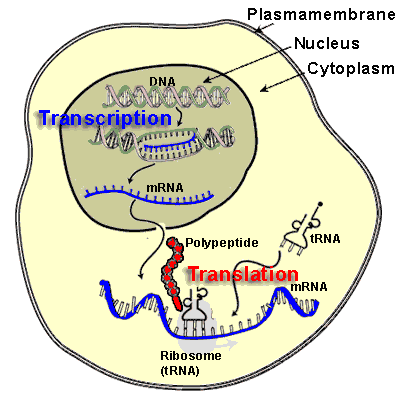
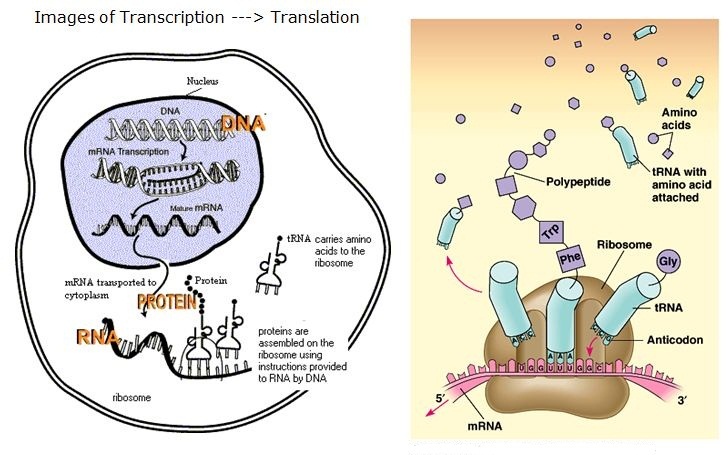
Proteins are integral to the composition of the cytoskeleton, and also to the extracellular matrix.  Many proteins are actually enzymes, carrying out the transformation of some substrate, a derivative of the food we ingest.  They have a catalytic site, and they function with a cofactor – either a multivalent metal or a nucleotide. Proteins also are critically involved in the regulation of cell metabolism, and they are involved in translation of the DNA code, as they make up transcription factors (TFs). There are 20 essential amino acids that go into protein synthesis that are derived from animal or plant protein.   Protein synthesis is carried out by the transport of mRNA out of the nucleus to the ribosome, where tRNA is paired with a matching amino acid, and the primary sequence of a protein is constructed as a linear string of amino acids.

This is illustrated in the following three pictures:

protein synthesis

protein synthesis

mcell-transcription-translation

mcell-transcription-translation

transcription_translation

transcription_translation

Proteins synthesized at distal locations frequently contain intrinsically disordered segments. These regions are generally rich in assembly-promoting modules and are often regulated by post-translational modifications. Such proteins are tightly regulated but display distinct temporal dynamics upon stimulation with growth factors. Thus, proteins synthesized on-site may rapidly alter proteome composition and act as dynamically regulated scaffolds to promote the formation of reversible cellular assemblies.
RJ Weatheritt, et al. Nature Structural & Molecular Biology 24 Aug, 2014; 21: 833–839 http://dx.do.orgi:/10.1038/nsmb.2876

An overview of the potential advantages conferred by distal-site protein synthesis

An overview of the potential advantages conferred by distal-site protein synthesis

Turquoise and red filled circle represents off-target and correct interaction partners, respectively. Wavy lines represent a disordered region within a distal site synthesis protein. Grey and red line in graphs represents profiles of t…  http://www.nature.com/nsmb/journal/v21/n9/carousel/nsmb.2876-F5.jpg

In the the transcription process an RNA sequence is read.  This is essential for protein synthesis through the ordering of the amino acids in the primary structure. However, there are microRNAs and noncoding RNAs, and there are transcription factors.  The transcription factors bind to chromatin, and the RNAs also have some role in regulating the transcription process. (see picture above)

Transcription factors (TFs) interact dynamically in vivo with chromatin binding sites. Four different techniques are currently used to measure their kinetics in live cells,

  1. fluorescence recovery after photobleaching (FRAP),
  2. fluorescence correlation spectroscopy (FCS),
  3. single molecule tracking (SMT) and
  4. competition ChIP (CC).

A comparison of data from each of these techniques raises an important question:

  • do measured transcription kinetics reflect biologically functional interactions at specific sites (i.e. working TFs) or
  • do they reflect non-specific interactions (i.e. playing TFs)?

There are five key unresolved biological questions related to

  • the functionality of transient and prolonged binding events at both
  • specific promoter response elements as well as non-specific sites.

In support of functionality,

  • there are data suggesting that TF residence times are tightly regulated, and
  • that this regulation modulates transcriptional output at single genes.

In addition to this site-specific regulatory role, TF residence times

  • also determine the fraction of promoter targets occupied within a cell
  • thereby impacting the functional status of cellular gene networks.
  • TF residence times, then, are key parameters that could influence transcription in multiple ways.

Quantifying transcription factor kinetics: At work or at play? Mueller F., et al.  http://dx.doi.org:/10.3109/10409238.2013.833891

Dr. Virginie Mattot works in the team “Angiogenesis, endothelium activation and Cancer” directed by Dr. Fabrice Soncin at the Institut de Biologie de Lille in France where she studies the roles played by microRNAs in endothelial cells during physiological and pathological processes such as angiogenesis or endothelium activation. She has been using Target Site Blockers to investigate the role of microRNAs on putative targets.

A few years ago, the team identified

  • an endothelial cell-specific gene which
  • harbors a microRNA in its intronic sequence.

They have since been working on understanding the functions of

  • both this new gene and its intronic microRNA in endothelial cells.

While they were searching for the functions of the intronic microRNA,

  • theye identified an unknown gene as a putative target.

The aim of my project was to investigate if this unknown gene was actually a genuine target and

  • if regulation of this gene by the microRNA was involved in endothelial cell function.

They had already shown the endothelial cell phenotype is associated with the inhibition of the intronic microRNA.
They then used miRCURY LNA™ Target Site Blockers to demonstrate

  • the expression of this unknown gene is actually controlled by this microRNA.
  • the microRNA regulates specific endothelial cell properties through regulation of this unknown gene.

MicroRNA function in endothelial cells – Solving the mystery of an unknown target gene using Target Site Blockers to investigate the role of microRNAs on putative targets

We first verified that this TSB was functional by analyzing

  • the expression of the miRNA target against which the TSB was directed
  • we then showed the TSB induced similar phenotypes as those when we inhibited the microRNA in the same cells.

Target Site Blockers were shown to be efficient tools to demonstrate the specific involvement of

  • putative microRNA targets
  • in the function played by this microRNA.

Some genes are known to have several different alternatively spliced protein variants, but the Scripps Research Institute’s Paul Schimmel and his colleagues have uncovered almost 250 protein splice variants of an essential, evolutionarily conserved family of human genes. The results were published July 17 in Science.

Focusing on the 20-gene family of aminoacyl tRNA synthetases (AARSs),

  • the team captured AARS transcripts from human tissues—some fetal, some adult—and showed that
  • many of these messenger RNAs (mRNAs) were translated into proteins.

Previous studies have identified several splice variants of these enzymes that have novel functions, but uncovering so many more variants was unexpected, Schimmel said. Most of these new protein products

  • lack the catalytic domain but retain other AARS non-catalytic functional domains.

This study fundamentally effects how we view protein-synthesis, according to  Michael Ibba (who was not involved in the work), The Scientist reported. “The unexpected and potentially vast expanded functional networks that emerge from this study have the potential to influence virtually any aspect of cell growth.”

The team—comprehensively captured and sequenced the AARS mRNAs from six human tissue types using high-throughput deep sequencing. They next showed that a proportion of these transcripts, including those missing the catalytic domain, indeed resulted in stable protein products:

  • 48 of these splice variants associated with polysomes.

In vitro translation assays and the expression of more than 100 of these variants in cells confirmed that

  • many of these variants could be made into stable protein products.

The AARS enzymes—of which there’s one for each of the 20 amino acids—bring together an amino acid with its appropriate transfer RNA (tRNA) molecule. This reaction allows a ribosome to add the amino acid to a growing peptide chain during protein translation. AARS enzymes can be found in all living organisms and are thought to be among the first proteins to have originated on Earth.

One goal of human genetics is to understand how the information for precise and dynamic gene expression programs is encoded in the genome. The interactions of transcription factors (TFs) with DNA regulatory elements clearly

  • play an important role in determining gene expression outputs, yet
  • the regulatory logic underlying functional transcription factor binding is poorly understood.

An important question in genomics is to understand how a class of proteins called ‘‘transcription factors’’ controls the expression level of other genes in the genome in a cell type-specific manner – a process that is essential to human development. One major approach to this problem is to study where these transcription factors bind in the genome, but this does not tell us about the effect of that binding on gene expression levels and

  • it is generally accepted that much of the binding does not strongly influence gene expression.

DA Cusanovich et al. PLoS Genet 2014;10(3):e1004226.  http://dx.doi.org:/10.1371/journal.pgen.1004226

We knocked down 59 TFs and chromatin modifiers in one HapMap lymphoblastoid cell line

  • to evaluate the context of functional TF binding.

We then identified genes whose expression was affected by the knockdowns

  • by intersecting the gene expression data with transcription factor binding data
    (based on ChIP-seq and DNase-seq)
  • within 10 kb of the transcription start sites of expressed genes.

This combination of data allowed us to infer functional TF binding.
Only a small subset of genes bound by a factor were

  • differentially expressed following the knockdown of that factor,
  • suggesting that most interactions between TF and chromatin
  • do not result in measurable changes in gene expression levels
  • of putative target genes.

We found that functional TF binding is enriched

  • in regulatory elements that harbor a large number of TF binding sites,
  • at sites with predicted higher binding affinity, and
  • at sites that are enriched in genomic regions annotated as ‘‘active enhancers.’’

We aim to be able to predict the expression pattern of a gene based on its regulatory
sequence alone.

Combining a TF knockdown approach with TF binding data can help us to

  • distinguish functional binding from non-functional binding

This approach has previously been applied to the study of human TFs, although for the most part studies have only focused on

  • the regulatory relationship of a single factor with its downstream targets.

The FANTOM consortium knocked down 52 different transcription factors in

  • the THP-1 cell line, an acute monocytic leukemia-derived cell line, and
  • used a subset of these to validate certain regulatory predictions based on binding motif enrichments.

We and others previously studied the regulatory architecture of gene expression in

  • the model system of HapMap lymphoblastoid cell lines (LCLs) using both
  • binding map strategies and QTL mapping strategies.

We now sought to use knockdown experiments targeting transcription factors in a HapMap LCL

  • to refine our understanding of the gene regulatory circuitry of the human genome.

Therefore, We integrated the results of the knockdown experiments with previous data on TF binding to

  • better characterize the regulatory targets of 59 different factors and
  • to learn when a disruption in transcription factor binding
  • is most likely to be associated with variation in the expression level of a nearby gene.

Gene expression levels following the knockdown were compared to

  • expression data collected from six samples that were transfected with negative control siRNA.

Depending on the factor targeted, the knockdowns resulted in

  • between 39 and 3,892 differentially expressed genes at an FDR of 5%
    (Figure 1B; see Table S3 for a summary of the results).

The knockdown efficiency for the 59 factors ranged

  • from 50% to 90% (based on qPCR; Table S1).

The qPCR measurements of the knockdown level were significantly

  • correlated with estimates of the TF expression levels
  • based on the microarray data (P =0.001; Figure 1C).


Did the factors tended to have a consistent effect (either up- or down-regulation)

  • on the expression levels of genes they purportedly regulated?

All factors we tested are associated with both up- and down-regulation of downstream targets (Figure 6).

While there is compelling evidence for our inferences, the current chromatin functional annotations

  • do not fully explain the regulatory effects of the knockdown experiments.

For example, the enrichments for binding in ‘‘strong enhancer’’ regions of the genome range from 7.2% to 50.1% (median = 19.2%),

  • much beyond what is expected by chance alone, but far from accounting for all functional binding.

A slight majority of downstream target genes were expressed at higher levels

  • following the knockdown for 15 of the 29 factors for which we had binding information (Figure 6B).

The factor that is associated with the largest fraction (68.8%) of up-regulated target genes following the knockdown is EZH2,

  • the enzymatic component of the Polycomb group complex.

On the other end of the spectrum was JUND, a member of the AP-1 complex, for which

  • 66.7% of differentially expressed targets were down-regulated following the knockdown.

Our results, combined with the previous work from our group and others make for a complicated view

  • of the role of transcription factors in gene regulation as
  • it seems difficult to reconcile the inference from previous work that
  • many transcription factors should primarily act as activators with the results presented here.

One somewhat complicated hypothesis, which nevertheless can resolve the apparent discrepancy, is that

  • the ‘‘repressive’’ effects we observe for known activators may be
  • at sites in which the activator is acting as a weak enhancer of transcription and
  • that reducing the cellular concentration of the factor
  • releases the regulatory region to binding by an alternative, stronger activator.

Integrative study of Arabidopsis thaliana metabolomic and transcriptomic data
with the interactiveMarVis-Graph software

M Landesfeind, A Kaever, K Feussner, C Thurow, C Gatz, I Feussner and P Meinicke
PeerJ 2:e239;   http://dx.doi.org /10.7717/peerj.239

High-throughput technologies notoriously generate large datasets often including data from different omics platforms. Each dataset contains data for several thousand experimental markers, e.g., mass-to-charge ratios in mass spectrometry or spots in DNA microarray analysis. An experimental marker is associated with an intensity profile which may include several measurements according to different experimental conditions (Dettmer, Aronov & Hammock, 2007).

The combined analysis and visualization of data from different high-throughput technologies remains a key challenge in bioinformatics.We present here theMarVis-Graph software for integrative analysis of metabolic and transcriptomic data. All experimental data is investigated in terms of the full metabolic network obtained from a reference database. The reactions of the network are scored based on the associated data, and

  • sub-networks, according to connected high-scoring reactions, are identified.

Finally, MarVis-Graph scores the detected sub-networks,

  • evaluates them by means of a random permutation test and
  • presents them as a ranked list.

Furthermore, MarVis-Graph features an interactive network visualization that provides researchers with a convenient view on the results.

The key advantage ofMarVis-Graph is the analysis of reactions detached from their pathways so that

  • it is possible to identify new pathways or
  • to connect known pathways by previously unrelated reactions.

TheMarVis-Graph software is freely available for academic use and can be downloaded at: http://marvis.gobics.de/marvis-graph.

Significant differences or clusters may be explained by associated annotations, e.g., in terms of metabolic pathways or biological functions. During recent years, numerous specialized tools have been developed to aid biological researchers in automating all these steps (e.g., Medina et al., 2010; Kaever et al., 2009; Waegele et al., 2012). Comprehensive studies can be performed by combining technologies from different omics fields. The combination of transcriptomic and proteomic data sets revealed a strong
correlation between both kinds of data (Nie et al., 2007) and supported the detection of complex interactions, e.g., in RNA silencing (Haq et al., 2010). Moreover, correlations
were detected between RNA expression levels and metabolite abundances (Gibon et al., 2006). Therefore, tools that integrate, analyze and visualize experimental markers from different platforms are needed. To cope with the complexity of genome-wide studies, pathway models are utilized extensively as a simple abstraction of the underlying complex mechanisms. Set Enrichment Analysis (Subramanian et al., 2005) and Over-Representation Analysis (Huang, Sherman & Lempicki, 2009) have become state-of-the-art tools for analyzing large-scale datasets: both methods evaluate predefined sets of entities, e.g., the accumulation of differentially expressed genes in a pathway.

While manually curated pathways are convenient and easy to interpret, experimental studies have shown that all metabolic and signaling pathways are heavily interconnected (Kunkel & Brooks, 2002; Laule et al., 2003). Data from biomolecular databases support these studies: the metabolic network of Arabidopsis thaliana in the KEGG database (Kanehisa et al., 2012; Kanehisa & Goto, 2000) contains 1606 reactions from which 1464 are connected in a single sub-network (>91%), i.e., they
share a metabolite as product or substrate. In the AraCyc 10.0 database (Mueller, Zhang & Rhee, 2003; Rhee et al., 2006), more than 89% of the reactions are counted in a single sub-network. In both databases, most other reactions are completely disconnected. Additionally, Set Enrichment Analyses can not identify links between the predefined sets easily. This becomes even more important when analyzing smaller pathways as provided by the MetaCyc (Caspi et al., 2008; Caspi et al., 2012) database. Moreover, methods that utilize pathways as predefined sets ignore reactions and related biomolecular entities (e.g., metabolites, genes) which are not associated with a single pathway. For example, this affects 4000 reactions in MetaCyc and 2500 in KEGG, respectively (Altman et al., 2013). Therefore, it is desirable to develop additional methods

  • that do not require predefined sets but may detect enriched sub-networks in the full metabolic network.

While several tools support the statistical analysis of experimental markers from one or more omics technologies and then utilize variants of Set Enrichment Analysis (Xia et al., 2012; Chen et al., 2013; Howe et al., 2011),

  • no tool is able to explicitly search for connected reactions that include
  • most of the metabolites, genes, and enyzmes with experimental evidence.

However, the automatic identification of sub-networks has been proven useful in other contexts, e.g., in the analysis of protein–protein-interaction networks (Alcaraz et al., 2012; Baumbach et al., 2012; Maeyer et al., 2013).

MarVis-Graph imports experimental markers from different high-throughput experiments and

  • analyses them in the context of reaction-chains in full metabolic networks.

Then, MarVis-Graph scores the reactions in the metabolic network

  • according to the number of associated experimental markers and
  • identifies sub-networks consisting of subsequent, high-scoring reactions.

The resulting sub-networks are

  • ranked according to a scoring method and visualized interactively.

Hereby, sub-networks consisting of reactions from different pathways may be identified to be important

  • whereas the single pathways may not be found to be significantly enriched.

MarVis-Graph may also connect reactions without an assigned pathway

  • to reactions within a particular pathway.

TheMarVis-Graph tool was applied in a case-study investigating the wound response in Arabidopsis thaliana to analyze combined metabolomic and transcriptomic high-throughput data.

Figure 1 Schema of the metabolic network representation in MarVis-Graph. Metabolite markers are shown in gray, metabolites in red, reactions in blue, enzymes in green, genes in yellow, transcript markers in pink, and pathways in turquoise color. The edges are shown in black with labels that comply with the biological meaning. The orange arrows depict the flow of score for the initial scoring (described in section “Initial Scoring”). (not shown)

In MarVis-Graph, metabolite markers obtained from mass-spectrometry experiments additionally contain the experimental mass. The experimental mass has to be
calculated based on the mass-to-charge ratio (m/z-value) and specific isotope- or adduct-corrections (Draper et al., 2009) by means of specialized tools, e.g.,MarVis-Filter
(Kaever et al., 2012).

For each transcript marker the corresponding annotation has to be given. In DNA microarray experiments, each spot (transcript marker) is specific for a gene and can
therefore be used for annotation. For other technologies an annotation has to be provided by external tools.

In MarVis-Graph, each reaction is scored initially based on the associated experimental data (see “Initial scoring”). This initial scoring is refined (see “Refining the scoring”) and afterwards reactions with a score below a user-defined threshold are removed. The network is

  • decomposed into subsequent high-scoring reactions that constitute the sub-networks.

The weight of each experimental marker (see “Experimental markers”) is equally distributed over all metabolites and genes associated with the metabolite marker or
transcript marker, respectively. For all vertices, this is repeated as illustrated in Fig. 1 until the weights are accumulated by the reactions.

The initial reaction scores are used as input scoring for the random walk algorithm. The algorithm is performed as described by Glaab et al. (2012) with a user-defined
restart-probability r (default value 0.8). After convergence of the algorithm, reactions with a score lower than the user-defined threshold t (default value t = 1−r) are removed from the reaction network. During the removal process,

  • the network is decomposed into pairwise disconnected sub-networks containing only high-scoring reactions.

In the following, a resulting sub-network is denoted by a prime: G′ = (V′,L′) with V′ = M′ ∪C′ ∪R′ ∪E′ ∪G′ ∪T′ ∪P′.

The scores of the identified sub-networks can be assessed using a random permutation test, evaluating the marker annotations under the null hypothesis of being connected
randomly. Here, the assignments

  • from metabolite markers to metabolites and from transcript markers to genes are randomized.

For each association between a metabolite marker and a metabolite,

  • this connection is replaced by a connection between a randomly chosen metabolite marker and a randomly chosen metabolite.

The random metabolite marker is chosen from the pool of formerly connected metabolite markers. Each connected transcript marker

  • is associated with a randomly chosen gene.

Choosing from the list of already connected experimental markers ensures that

  • the sum of weights from the original and the permuted network are equal.

This method differs from the commonly utilized XSwap permutation (Hanhij¨arvi, Garriga & Puolam¨aki, 2009) that is based on swapping endpoints of two random edges. The main difference of our permutation method is that it results in a network with different topological structure, i.e., different degree of the metabolite and gene nodes.

Finally, the sub-networks are detected and scored with the same parameters applied for the original network. Based on the scores of the networks identified in the random
permutations, the family-wise-error-rate (FWER) and false-discovery-rate (FDR) are calculated for each originally identified sub-network.

MarVis-Graph was applied in a case study investigating the A. thaliana wound response. Data from a metabolite fingerprinting (Meinicke et al., 2008) and a DNA microarray
experiment (Yan et al., 2007) were imported into a metabolic network specific for A. thaliana created from the AraCyc 10.0 database (Lamesch et al., 2011). The metabolome
and transcriptome have been measured before wounding as control and at specific time points after wounding in wild-type and in the allene oxide synthase (AOS) knock-out
mutant dde-2-2 (Park et al., 2002) of A. thaliana Columbia (see Table 1). The AOS mutant was chosen, because AOS catalyzes the first specific step in the biosynthesis of the hormone jasmonic acid, which is the key regulator in wound response of plants (Wasternack & Hause, 2013).

Both datasets have been preprocessed with theMarVis-Filter tool (Kaever et al., 2012) utilizing the Kruskal–Wallis p-value calculation on the intensity profiles. Based on the ranking of ascending p-values,

  • the first 25% of the metabolite markers and 10% of the transcript markers have been selected for further investigation (Data S2).

The filtered metabolite and transcript markers were imported into the metabolic network. For metabolite markers, metabolites were associated

  • if the metabolite marker’s detected mass differs from the metabolites monoisotopic mass by a maximum of 0.005u.

Transcript markers were linked to the genes whose ID equaled the ID given in the CATMA database (Sclep et al., 2007) for that transcript marker.

Table 2 Vertices in the A. thaliana specific metabolic network after import of experimental markers. Number of objects in the metabolic network
in absolute counts and relative abundances. For experimental markers, the with annotation column gives the number of metabolite markers and
transcript markers that were annotated with a metabolite or gene, respectively. The direct evidence column contains the number of metabolites
and genes, that are associated with a metabolite marker or transcript marker. For enzymes, this is the number of enzymes encoded by a gene with
direct evidence. The number of vertices with an association to a reaction is given in the with reaction column. In the last column, this is given for
associations to metabolic pathways. (not shown)

MarVis-Graph detected a total of 133 sub-networks. The sub-networks were ranked according to size Ss, diameter Sd, and sum-of-weights Ssow
scores (Table S4). Interestingly, the different rankings show a high correlation with all pairwise correlations higher than 0.75 (Pearson correlation
coefficient) and 0.6 (Spearman rank correlation).

Allene-oxide cyclase sub-network
In all rankings, the sub-network allene-oxide cyclase (named after the reaction with the highest score in this sub-network) appeared as top candidate.

This sub-network is constituted of reactions from different pathways related to fatty acids. Figure 2 shows a visualization of the sub-network.
Jasmonic acid biosynthesis. The main part of the sub-network is formed by reactions from the “jasmonic acid biosynthesis” (PlantMetabolic Network, 2013)
resulting in jasmonic acid (jasmonate). The presence of this pathway is very well established because of its central role in mediating the plants wound response
(Reymond & Farmer, 1998; Creelman, Tierney & Mullet, 1992). Additionally, metabolites and transcripts from this pathway were expected to show prominent
expression profiles because AOS, a key enzyme in this pathway, is knocked-out in themutant plant. Jasmonic acid derivatives and hormones.

Jasmonic acid derivatives and hormones. Jasmonate is a precursor for a broad variety of plant hormones (Wasternack & Hause, 2013), e.g., the derivative (-)-
jasmonic acid methyl ester (also Methyl Jasmonic Acid; MeJA) is a volatile, airborne signal mediating wound response between plants (Farmer&Ryan, 1990).
Reactions from the jasmonoyl-amino acid conjugates biosynthesis I (PMN, 2013a) pathway connect jasmonate to different amino acids, including L-valine,
L-leucine, and L-isoleucine. Via these amino acids, this sub-network is connected to the indole-3-acetylamino acid biosynthesis (PMN, 2013b) (IAA biosynthesis).
Again, this pathway produces a well known plant hormone: Auxine (Woodward & Bartel, 2005). Even though, jasmonate and auxin are both plant hormones, their
connection in this subnetwork is of minor relevance because amino acid conjugates are often utilized as active or storage forms of signaling molecules.While
jasmonoyl-amino acid conjugates represent the active signaling form of jasmonates, IAA amino acid conjugates are the storage form of this hormone (Staswick et al.,
2005).

polyhydroxy fatty acids synthesis

polyhydroxy fatty acids synthesis


Figure 2 Schema of the allene-oxide cyclase sub-network. Metabolites are shown in red, reactions in blue, and enzymes in green color. Metabolites and reactions without direct experimental evidence are marked by a dashed outline and a brighter color while enzymes without experimental evidence are hidden. The metabolic pathways described in section “Resulting sub-networks” are highlighted with different colors. The orange and green parts indicate the reaction chains required to build jasmonate and its amino acid conjugates. The coloring of pathways was done manually after export from MarVis-Graph.

The ω-3-fatty acid desaturase should catalyze a reaction from linoleate to α-linolenate. Metabolite markers that match the mass of crepenynic acid do also match α-linolenate
because both molecules have the same sum-formula and monoisotopic mass. As mentioned above, MarVis-Graph compiled the metabolic network for this study
from the AraCyc database version 10.0. On June 4th, a curator changed the database to remove theΔ12-fatty acid dehydrogenase prior to the release of AraCyc version 11.0.

The presented new software tool MarVis-Graph supports the investigation and visualization of omics data from different fields of study. The introduced algorithm for
identification of sub-networks is able to identify reaction-chains across different pathways and includes reactions that are not associated with a single pathway. The application of MarVis-Graph in the case study on A. thaliana wound response resulted in a convenient graphical representation of high-throughput data which allows the analysis of the complex dynamics in a metabolic network.


Read Full Post »

Introduction to Protein Synthesis and Degradation

Curator: Larry H. Bernstein, MD, FCAP

Updated 8/31/2019


Introduction to Protein Synthesis and Degradation

This chapter I made to follow signaling, rather than to precede it. I had already written much of the content before reorganizing the contents. The previous chapters on carbohydrate and on lipid metabolism have already provided much material on proteins and protein function, which was persuasive of the need to introduce signaling, which entails a substantial introduction to conformational changes in proteins that direct the trafficking of metabolic pathways, but more subtly uncovers an important role for microRNAs, not divorced from transcription, but involved in a non-transcriptional role.  This is where the classic model of molecular biology lacked any integration with emerging metabolic concepts concerning regulation. Consequently, the science was bereft of understanding the ties between the multiple convergence of transcripts, the selective inhibition of transcriptions, and the relative balance of aerobic and anaerobic metabolism, the weight of the pentose phosphate shunt, and the utilization of available energy source for synthetic and catabolic adaptive responses.

The first subchapter serves to introduce the importance of transcription in translational science.  The several subtitles that follow are intended to lay out the scope of the transcriptional activity, and also to direct attention toward the huge role of proteomics in the cell construct.  As we have already seen, proteins engage with carbohydrates and with lipids in important structural and signaling processes.  They are integrasl to the composition of the cytoskeleton, and also to the extracellular matrix.  Many proteins are actually enzymes, carrying out the transformation of some substrate, a derivative of the food we ingest.  They have a catalytic site, and they function with a cofactor – either a multivalent metal or a nucleotide.

The amino acids that go into protein synthesis include “indispensable” nutrients that are not made for use, but must be derived from animal protein, although the need is partially satisfied by plant sources. The essential amino acids are classified into well established groups. There are 20 amino acids commonly found in proteins.  They are classified into the following groups based on the chemical and/or structural properties of their side chains :

  1. Aliphatic Amino Acids
  2. Cyclic Amino Acid
  3. AAs with Hydroxyl or Sulfur-containing side chains
  4. Aromatic Amino Acids
  5. Basic Amino Acids
  6. Acidic Amino Acids and their Amides

Examples include:

Alanine                  aliphatic hydrophobic neutral
Arginine                 polar hydrophilic charged (+)
Cysteine                polar hydrophobic neutral
Glutamine             polar hydrophilic neutral
Histidine                aromatic polar hydrophilic charged (+)
Lysine                   polar hydrophilic charged (+)
Methionine            hydrophobic neutral
Serine                   polar hydrophilic neutral
Tyrosine                aromatic polar hydrophobic

Transcribe and Translate a Gene

  1. For each RNA base there is a corresponding DNA base
  2. Cells use the two-step process of transcription and translation to read each gene and produce the string of amino acids that makes up a protein.
  3. mRNA is produced in the nucleus, and is transferred to the ribosome
  4. mRNA uses uracil instead of thymine
  5. the ribosome reads the RNA sequence and makes protein
  6. There is a sequence combination to fit each amino acid to a three letter RNA code
  7. The ribosome starts at AUG (start), and it reads each codon three letters at a time
  8. Stop codons are UAA, UAG and UGA


protein synthesis

protein synthesis

http://learn.genetics.utah.edu/content/molecules/transcribe/images/TandT.png

mcell-transcription-translation

mcell-transcription-translation

http://www.vcbio.science.ru.nl/images/cellcycle/mcell-transcription-translation_eng_zoom.gif

transcription_translation

transcription_translation


http://www.biologycorner.com/resources/transcription_translation.JPG


What about the purine inosine?

Inosine triphosphate pyrophosphatase – Pyrophosphatase that hydrolyzes the non-canonical purine nucleotides inosine triphosphate (ITP), deoxyinosine triphosphate (dITP) as well as 2′-deoxy-N-6-hydroxylaminopurine triposphate (dHAPTP) and xanthosine 5′-triphosphate (XTP) to their respective monophosphate derivatives. The enzyme does not distinguish between the deoxy- and ribose forms. Probably excludes non-canonical purines from RNA and DNA precursor pools, thus preventing their incorporation into RNA and DNA and avoiding chromosomal lesions.

Gastroenterology. 2011 Apr;140(4):1314-21.  http://dx.doi.org:/10.1053/j.gastro.2010.12.038. Epub 2011 Jan 1.

Inosine triphosphate protects against ribavirin-induced adenosine triphosphate loss by adenylosuccinate synthase function.

Hitomi Y1, Cirulli ET, Fellay J, McHutchison JG, Thompson AJ, Gumbs CE, Shianna KV, Urban TJ, Goldstein DB.

Genetic variation of inosine triphosphatase (ITPA) causing an accumulation of inosine triphosphate (ITP) has been shown to protect patients against ribavirin (RBV)-induced anemia during treatment for chronic hepatitis C infection by genome-wide association study (GWAS). However, the biologic mechanism by which this occurs is unknown.

Although ITP is not used directly by human erythrocyte ATPase, it can be used for ATP biosynthesis via ADSS in place of guanosine triphosphate (GTP). With RBV challenge, erythrocyte ATP reduction was more severe in the wild-type ITPA genotype than in the hemolysis protective ITPA genotype. This difference also remains after inhibiting adenosine uptake using nitrobenzylmercaptopurine riboside (NBMPR).

ITP confers protection against RBV-induced ATP reduction by substituting for erythrocyte GTP, which is depleted by RBV, in the biosynthesis of ATP. Because patients with excess ITP appear largely protected against anemia, these results confirm that RBV-induced anemia is due primarily to the effect of the drug on GTP and consequently ATP levels in erythrocytes.

Ther Drug Monit. 2012 Aug;34(4):477-80.  http://dx.doi.org:/10.1097/FTD.0b013e31825c2703.

Determination of inosine triphosphate pyrophosphatase phenotype in human red blood cells using HPLC.

Citterio-Quentin A1, Salvi JP, Boulieu R.

Thiopurine drugs, widely used in cancer chemotherapy, inflammatory bowel disease, and autoimmune hepatitis, are responsible for common adverse events. Only some of these may be explained by genetic polymorphism of thiopurine S-methyltransferase. Recent articles have reported that inosine triphosphate pyrophosphatase (ITPase) deficiency was associated with adverse drug reactions toward thiopurine drug therapy. Here, we report a weak anion exchange high-performance liquid chromatography method to determine ITPase activity in red blood cells and to investigate the relationship with the occurrence of adverse events during azathioprine therapy.

The chromatographic method reported allows the analysis of IMP, inosine diphosphate, and ITP in a single run in <12.5 minutes. The method was linear in the range 5-1500 μmole/L of IMP. Intraassay and interassay precisions were <5% for red blood cell lysates supplemented with 50, 500, and 1000 μmole/L IMP. Km and Vmax evaluated by Lineweaver-Burk plot were 677.4 μmole/L and 19.6 μmole·L·min, respectively. The frequency distribution of ITPase from 73 patients was investigated.

The method described is useful to determine the ITPase phenotype from patients on thiopurine therapy and to investigate the potential relation between ITPase deficiency and the occurrence of adverse events.


System wide analyses have underestimated protein abundances and the importance of transcription in mammals

Jingyi Jessica Li1, 2, Peter J Bickel1 and Mark D Biggin3

PeerJ 2:e270; http://dx.doi.org:/10.7717/peerj.270

Using individual measurements for 61 housekeeping proteins to rescale whole proteome data from Schwanhausser et al. (2011), we find that the median protein detected is expressed at 170,000 molecules per cell and that our corrected protein abundance estimates show a higher correlation with mRNA abundances than do the uncorrected protein data. In addition, we estimated the impact of further errors in mRNA and protein abundances using direct experimental measurements of these errors. The resulting analysis suggests that mRNA levels explain at least 56% of the differences in protein abundance for the 4,212 genes detected by Schwanhausser et al. (2011), though because one major source of error could not be estimated the true percent contribution should be higher.We also employed a second, independent strategy to determine the contribution of mRNA levels to protein expression.We show that the variance in translation rates directly measured by ribosome profiling is only 12% of that inferred by Schwanhausser et al. (2011), and that the measured and inferred translation rates correlate poorly (R2 D 0.13). Based on this, our second strategy suggests that mRNA levels explain 81% of the variance in protein levels. We also determined the percent contributions of transcription, RNA degradation, translation and protein degradation to the variance in protein abundances using both of our strategies. While the magnitudes of the two estimates vary, they both suggest that transcription plays a more important role than the earlier studies implied and translation a much smaller role. Finally, the above estimates only apply to those genes whose mRNA and protein expression was detected. Based on a detailed analysis by Hebenstreit et al. (2012), we estimat that approximately 40% of genes in a given cell within a population express no mRNA. Since there can be no translation in the ab-sence of mRNA, we argue that differences in translation rates can play no role in determining the expression levels for the 40% of genes that are non-expressed.


Related studies that reveal issues that are not part of this chapter:

  1. Ubiquitylation in relationship to tissue remodeling
  2. Post-translational modification of proteins
    1. Glycosylation
    2. Phosphorylation
    3. Methylation
    4. Nitrosylation
    5. Sulfation – sulfotransferases
      cell-matrix communication
    6. Acetylation and histone deacetylation (HDAC)
      Connecting Protein Phosphatase to 1α (PP1α)
      Acetylation complexes (such as CBP/p300 and PCAF)
      Sirtuins
      Rel/NF-kB Signal Transduction
      Homologous Recombination Pathway of Double-Strand DNA Repair
    7. Glycination
    8. cyclin dependent kinases (CDKs)
    9. lyase
    10. transferase


This year, the Lasker award for basic medical research went to Kazutoshi Mori (Kyoto University) and Peter Walter (University of California, San Francisco) for their “discoveries concerning the unfolded protein response (UPR) — an intracellular quality control system that

detects harmful misfolded proteins in the endoplasmic reticulum and signals the nucleus to carry out corrective measures.”

About UPR: Approximately a third of cellular proteins pass through the Endoplasmic Reticulum (ER) which performs stringent quality control of these proteins. All proteins need to assume the proper 3-dimensional shape in order to function properly in the harsh cellular environment. Related to this is the fact that cells are under constant stress and have to make rapid, real time decisions about survival or death.

A major indicator of stress is the accumulation of unfolded proteins within the Endoplasmic Reticulum (ER), which triggers a transcriptional cascade in order to increase the folding capacity of the ER. If the metabolic burden is too great and homeostasis cannot be achieved, the response shifts from

damage control to the induction of pro-apoptotic pathways that would ultimately cause cell death.

This response to unfolded proteins or the UPR is conserved among all eukaryotes, and dysfunction in this pathway underlies many human diseases, including Alzheimer’s, Parkinson’s, Diabetes and Cancer.


The discovery of a new class of human proteins with previously unidentified activities

In a landmark study conducted by scientists at the Scripps Research Institute, The Hong Kong University of Science and Technology, aTyr Pharma and their collaborators, a new class of human proteins has been discovered. These proteins [nearly 250], called Physiocrines belong to the aminoacyl tRNA synthetase gene family and carry out novel, diverse and distinct biological functions.

The aminoacyl tRNA synthetase gene family codes for a group of 20 ubiquitous enzymes almost all of which are part of the protein synthesis machinery. Using recombinant protein purification, deep sequencing technique, mass spectroscopy and cell based assays, the team made this discovery. The finding is significant, also because it highlights the alternate use of a gene family whose protein product normally performs catalytic activities for non-catalytic regulation of basic and complex physiological processes spanning metabolism, vascularization, stem cell biology and immunology


Muscle maintenance and regeneration – key player identified

Muscle tissue suffers from atrophy with age and its regenerative capacity also declines over time. Most molecules discovered thus far to boost tissue regeneration are also implicated in cancers.  During a quest to find safer alternatives that can regenerate tissue, scientists reported that the hormone Oxytocin is required for proper muscle tissue regeneration and homeostasis and that its levels decline with age.

Oxytocin could be an alternative to hormone replacement therapy as a way to combat aging and other organ related degeneration.

Oxytocin is an age-specific circulating hormone that is necessary for muscle maintenance and regeneration (June 2014)


Proc Natl Acad Sci U S A. 2014 Sep 30;111(39):14289-94.   http://dx.doi.org:/10.1073/pnas.1407640111. Epub 2014 Sep 15.

Role of forkhead box protein A3 in age-associated metabolic decline.

Ma X1, Xu L1, Gavrilova O2, Mueller E3.

Aging is associated with increased adiposity and diminished thermogenesis, but the critical transcription factors influencing these metabolic changes late in life are poorly understood. We recently demonstrated that the winged helix factor forkhead box protein A3 (Foxa3) regulates the expansion of visceral adipose tissue in high-fat diet regimens; however, whether Foxa3 also contributes to the increase in adiposity and the decrease in brown fat activity observed during the normal aging process is currently unknown. Here we report that during aging, levels of Foxa3 are significantly and selectively up-regulated in brown and inguinal white fat depots, and that midage Foxa3-null mice have increased white fat browning and thermogenic capacity, decreased adipose tissue expansion, improved insulin sensitivity, and increased longevity. Foxa3 gain-of-function and loss-of-function studies in inguinal adipose depots demonstrated a cell-autonomous function for Foxa3 in white fat tissue browning. Furthermore, our analysis revealed that the mechanisms of Foxa3 modulation of brown fat gene programs involve the suppression of peroxisome proliferator activated receptor γ coactivtor 1 α (PGC1α) levels through interference with cAMP responsive element binding protein 1-mediated transcriptional regulation of the PGC1α promoter.


Asymmetric mRNA localization contributes to fidelity and sensitivity of spatially localized systems

RJ Weatheritt, TJ Gibson & MM Babu
Nature Structural & Molecular Biology 24 Aug, 2014; 21: 833–839 http://dx.do.orgi:/10.1038/nsmb.2876

Although many proteins are localized after translation, asymmetric protein distribution is also achieved by translation after mRNA localization. Why are certain mRNA transported to a distal location and translated on-site? Here we undertake a systematic, genome-scale study of asymmetrically distributed protein and mRNA in mammalian cells. Our findings suggest that asymmetric protein distribution by mRNA localization enhances interaction fidelity and signaling sensitivity. Proteins synthesized at distal locations frequently contain intrinsically disordered segments. These regions are generally rich in assembly-promoting modules and are often regulated by post-translational modifications. Such proteins are tightly regulated but display distinct temporal dynamics upon stimulation with growth factors. Thus, proteins synthesized on-site may rapidly alter proteome composition and act as dynamically regulated scaffolds to promote the formation of reversible cellular assemblies. Our observations are consistent across multiple mammalian species, cell types and developmental stages, suggesting that localized translation is a recurring feature of cell signaling and regulation.


An overview of the potential advantages conferred by distal-site protein synthesis, inferred from our analysis.


An overview of the potential advantages conferred by distal-site protein synthesis

An overview of the potential advantages conferred by distal-site protein synthesis


Turquoise and red filled circle represents off-target and correct interaction partners, respectively. Wavy lines represent a disordered region within a distal site synthesis protein. Grey and red line in graphs represents profiles of t…

http://www.nature.com/nsmb/journal/v21/n9/carousel/nsmb.2876-F5.jpg


Tweaking transcriptional programming for high quality recombinant protein production

Since overexpression of recombinant proteins in E. coli often leads to the formation of inclusion bodies, producing properly folded, soluble proteins is undoubtedly the most important end goal in a protein expression campaign. Various approaches have been devised to bypass the insolubility issues during E. coli expression and in a recent report a group of researchers discuss reprogramming the E. coli proteostasis [protein homeostasis] network to achieve high yields of soluble, functional protein. The premise of their studies is that the basal E. coli proteostasis network is insufficient, and often unable, to fold overexpressed proteins, thus clogging the folding machinery.

By overexpressing a mutant, negative-feedback deficient heat shock transcription factor [σ32 I54N] before and during overexpression of the protein of interest, reprogramming can be achieved, resulting in high yields of soluble and functional recombinant target protein. The authors explain that this method is better than simply co-expressing/over-expressing chaperones, co-chaperones, foldases or other components of the proteostasis network because reprogramming readies the folding machinery and up regulates the essential folding components beforehand thus  maintaining system capability of the folding machinery.

The Heat-Shock Response Transcriptional Program Enables High-Yield and High-Quality Recombinant Protein Production in Escherichia coli (July 2014)


 Unfolded proteins collapse when exposed to heat and crowded environments

Proteins are important molecules in our body and they fulfil a broad range of functions. For instance as enzymes they help to release energy from food and as muscle proteins they assist with motion. As antibodies they are involved in immune defence and as hormone receptors in signal transduction in cells. Until only recently it was assumed that all proteins take on a clearly defined three-dimensional structure – i.e. they fold in order to be able to assume these functions. Surprisingly, it has been shown that many important proteins occur as unfolded coils. Researchers seek to establish how these disordered proteins are capable at all of assuming highly complex functions.

Ben Schuler’s research group from the Institute of Biochemistry of the University of Zurich has now established that an increase in temperature leads to folded proteins collapsing and becoming smaller. Other environmental factors can trigger the same effect.

Measurements using the “molecular ruler”

“The fact that unfolded proteins shrink at higher temperatures is an indication that cell water does indeed play an important role as to the spatial organisation eventually adopted by the molecules”, comments Schuler with regard to the impact of temperature on protein structure. For their studies the biophysicists use what is known as single-molecule spectroscopy. Small colour probes in the protein enable the observation of changes with an accuracy of more than one millionth of a millimetre. With this “molecular yardstick” it is possible to measure how molecular forces impact protein structure.

With computer simulations the researchers have mimicked the behaviour of disordered proteins.
(Courtesy of Jose EDS Roselino, PhD.


MLKL compromises plasma membrane integrity

Necroptosis is implicated in many diseases and understanding this process is essential in the search for new therapies. While mixed lineage kinase domain-like (MLKL) protein has been known to be a critical component of necroptosis induction, how MLKL transduces the death signal was not clear. In a recent finding, scientists demonstrated that the full four-helical bundle domain (4HBD) in the N-terminal region of MLKL is required and sufficient to induce its oligomerization and trigger cell death.

They also found a patch of positively charged amino acids on the surface of the 4HBD that bound to phosphatidylinositol phosphates (PIPs) and allowed the recruitment of MLKL to the plasma membrane that resulted in the formation of pores consisting of MLKL proteins, due to which cells absorbed excess water causing them to explode. Detailed knowledge about how MLKL proteins create pores offers possibilities for the development of new therapeutic interventions for tolerating or preventing cell death.

MLKL compromises plasma membrane integrity by binding to phosphatidylinositol phosphates (May 2014)


Mitochondrial and ER proteins implicated in dementia

Mitochondria and the endoplasmic reticulum (ER) form tight structural associations that facilitate a number of cellular functions. However, the molecular mechanisms of these interactions aren’t properly understood.

A group of researchers showed that the ER protein VAPB interacted with mitochondrial protein PTPIP51 to regulate ER-mitochondria associations and that TDP-43, a protein implicated in dementia, disturbs this interaction to regulate cellular Ca2+ homeostasis. These studies point to a new pathogenic mechanism for TDP-43 and may also provide a potential new target for the development of new treatments for devastating neurological conditions like dementia.

ER-mitochondria associations are regulated by the VAPB-PTPIP51 interaction and are disrupted by ALS/FTD-associated TDP-43. Nature (June 2014)


A novel strategy to improve membrane protein expression in Yeast

Membrane proteins play indispensable roles in the physiology of an organism. However, recombinant production of membrane proteins is one of the biggest hurdles facing protein biochemists today. A group of scientists in Belgium showed that,

by increasing the intracellular membrane production by interfering with a key enzymatic step of lipid synthesis,

enhanced expression of recombinant membrane proteins in yeast is achieved.

Specifically, they engineered the oleotrophic yeast, Yarrowia lipolytica, by

deleting the phosphatidic acid phosphatase, PAH1 gene,

which led to massive proliferation of endoplasmic reticulum (ER) membranes.

For all 8 tested representatives of different integral membrane protein families, they obtained enhanced protein accumulation.


An unconventional method to boost recombinant protein levels

MazF is an mRNA interferase enzyme in E.coli that functions as and degrades cellular mRNA in a targeted fashion, at the “ACA” sequence. This degradation of cellular mRNA causes a precipitous drop in cellular protein synthesis. A group of scientists at the Robert Wood Johnson Medical School in New Jersey, exploited the degeneracy of the genetic code to modify all “ACA” triplets within their gene of interest in a way that the corresponding amino acid (Threonine) remained unchanged. Consequently, induction of MazF toxin caused degradation of E.coli cellular mRNA but the recombinant gene transcription and protein synthesis continued, causing significant accumulation of high quality target protein. This expression system enables unparalleled signal to noise ratios that could dramatically simplify structural and functional studies of difficult-to-purify, biologically important proteins.


Tandem fusions and bacterial strain evolution for enhanced functional membrane protein production

Membrane protein production remains a significant challenge in its characterization and structure determination. Despite the fact that there are a variety of host cell types, E.coli remains the popular choice for producing recombinant membrane proteins. A group of scientists in Netherlands devised a robust strategy to increase the probability of functional membrane protein overexpression in E.coli.

By fusing Green Fluorescent Protein (GFP) and the Erythromycin Resistance protein (ErmC) to the C-terminus of a target membrane protein they wer e able to track the folding state of their target protein while using Erythromycin to select for increased expression. By increasing erythromycin concentration in the growth media and testing different membrane targets, they were able to identify four evolved E.coli strains, all of which carried a mutation in the hns gene, whose product is implicated in genome organization and transcriptional silencing. Through their experiments the group showed that partial removal of the transcriptional silencing mechanism was related to production of proteins that were essential for functional overexpression of membrane proteins.


The role of an anti-apoptotic factor in recombinant protein production

In a recent study, scientists at the Johns Hopkins University and Frederick National Laboratory for Cancer Research examined an alternative method of utilizing the benefits of anti-apoptotic gene expression to enhance the transient expression of biotherapeutics, specifically, through the co-transfection of Bcl-xL along with the product-coding target gene.

Chinese Hamster Ovary(CHO) cells were co-transfected with the product-coding gene and a vector containing Bcl-xL, using Polyethylenimine (PEI) reagent. They found that the cells co-transfected with Bcl-xL demonstrated reduced apoptosis, increased specific productivity, and an overall increase in product yield.

B-cell lymphoma-extra-large (Bcl-xL) is a mitochondrial transmembrane protein and a member of the Bcl-2 family of proteins which are known to act as either pro- or anti-apoptotic proteins. Bcl-xL itself acts as an anti-apoptotic molecule by preventing the release of mitochondrial contents such as cytochrome c, which would lead to caspase activation. Higher levels of Bcl-xL push a cell toward survival mode by making the membranes pores less permeable and leaky.

Introduction to Protein Synthesis and Degradation Updated 8/31/2019

N-Terminal Degradation of Proteins: The N-End Rule and N-degrons

In both prokaryotes and eukaryotes mitochondria and chloroplasts, the ribosomal synthesis of proteins is initiated with the addition of the N-formyl methionine residue.  However in eukaryotic cytosolic ribosomes, the N terminal was assumed to be devoid of the N-formyl group.  The unformylated N-terminal methionine residues of eukaryotes is then  often N-acetylated (Ac) and creates specific degradation signals, the Ac N-end rule.  These N-end rule pathways are proteolytic systems which recognize these N-degrons resulting in proteosomal degradation or autophagy.  In prokaryotes this system is stimulated by certain amino acid deficiencies and in eukaryotes is dependent on the Psh1 E3 ligase.

Two papers in the journal Science describe this N-degron in more detail.

Structured Abstract
INTRODUCTION

In both bacteria and eukaryotic mitochondria and chloroplasts, the ribosomal synthesis of proteins is initiated with the N-terminal (Nt) formyl-methionine (fMet) residue. Nt-fMet is produced pretranslationally by formyltransferases, which use 10-formyltetrahydrofolate as a cosubstrate. By contrast, proteins synthesized by cytosolic ribosomes of eukaryotes were always presumed to bear unformylated N-terminal Met (Nt-Met). The unformylated Nt-Met residue of eukaryotic proteins is often cotranslationally Nt-acetylated, a modification that creates specific degradation signals, Ac/N-degrons, which are targeted by the Ac/N-end rule pathway. The N-end rule pathways are a set of proteolytic systems whose unifying feature is their ability to recognize proteins containing N-degrons, thereby causing the degradation of these proteins by the proteasome or autophagy in eukaryotes and by the proteasome-like ClpAP protease in bacteria. The main determinant of an N‑degron is a destabilizing Nt-residue of a protein. Studies over the past three decades have shown that all 20 amino acids of the genetic code can act, in cognate sequence contexts, as destabilizing Nt‑residues. The previously known eukaryotic N-end rule pathways are the Arg/N-end rule pathway, the Ac/N-end rule pathway, and the Pro/N-end rule pathway. Regulated degradation of proteins and their natural fragments by the N-end rule pathways has been shown to mediate a broad range of biological processes.

RATIONALE

The chemical similarity of the formyl and acetyl groups and their identical locations in, respectively, Nt‑formylated and Nt-acetylated proteins led us to suggest, and later to show, that the Nt-fMet residues of nascent bacterial proteins can act as bacterial N-degrons, termed fMet/N-degrons. Here we wished to determine whether Nt-formylated proteins might also form in the cytosol of a eukaryote such as the yeast Saccharomyces cerevisiae and to determine the metabolic fates of Nt-formylated proteins if they could be produced outside mitochondria. Our approaches included molecular genetic techniques, mass spectrometric analyses of proteins’ N termini, and affinity-purified antibodies that selectively recognized Nt-formylated reporter proteins.

RESULTS

We discovered that the yeast formyltransferase Fmt1, which is imported from the cytosol into the mitochondria inner matrix, can generate Nt-formylated proteins in the cytosol, because the translocation of Fmt1 into mitochondria is not as efficacious, even under unstressful conditions, as had previously been assumed. We also found that Nt‑formylated proteins are greatly up-regulated in stationary phase or upon starvation for specific amino acids. The massive increase of Nt-formylated proteins strictly requires the Gcn2 kinase, which phosphorylates Fmt1 and mediates its retention in the cytosol. Notably, the ability of Gcn2 to retain a large fraction of Fmt1 in the cytosol of nutritionally stressed cells is confined to Fmt1, inasmuch as the Gcn2 kinase does not have such an effect, under the same conditions, on other examined nuclear DNA–encoded mitochondrial matrix proteins. The Gcn2-Fmt1 protein localization circuit is a previously unknown signal transduction pathway. A down-regulation of cytosolic Nt‑formylation was found to increase the sensitivity of cells to undernutrition stresses, to a prolonged cold stress, and to a toxic compound. We also discovered that the Nt-fMet residues of Nt‑formylated cytosolic proteins act as eukaryotic fMet/N-degrons and identified the Psh1 E3 ubiquitin ligase as the recognition component (fMet/N-recognin) of the previously unknown eukaryotic fMet/N-end rule pathway, which destroys Nt‑formylated proteins.

CONCLUSION

The Nt-formylation of proteins, a long-known pretranslational protein modification, is mediated by formyltransferases. Nt-formylation was thought to be confined to bacteria and bacteria-descended eukaryotic organelles but was found here to also occur at the start of translation by the cytosolic ribosomes of a eukaryote. The levels of Nt‑formylated eukaryotic proteins are greatly increased upon specific stresses, including undernutrition, and appear to be important for adaptation to these stresses. We also discovered that Nt-formylated cytosolic proteins are selectively destroyed by the eukaryotic fMet/N-end rule pathway, mediated by the Psh1 E3 ubiquitin ligase. This previously unknown proteolytic system is likely to be universal among eukaryotes, given strongly conserved mechanisms that mediate Nt‑formylation and degron recognition.

The eukaryotic fMet/N-end rule pathway.

(Top) Under undernutrition conditions, the Gcn2 kinase augments the cytosolic localization of the Fmt1 formyltransferase, and possibly also its enzymatic activity. Consequently, Fmt1 up-regulates the cytosolic fMet–tRNAi (initiator transfer RNA), and thereby increases the levels of cytosolic Nt-formylated proteins, which are required for the adaptation of cells to specific stressors. (Bottom) The Psh1 E3 ubiquitin ligase targets the N-terminal fMet-residues of eukaryotic cytosolic proteins, such as Cse4, Pgd1, and Rps22a, for the polyubiquitylation-mediated, proteasome-dependent degradation.

” data-icon-position=”” data-hide-link-title=”0″>

The eukaryotic fMet/N-end rule pathway.

(Top) Under undernutrition conditions, the Gcn2 kinase augments the cytosolic localization of the Fmt1 formyltransferase, and possibly also its enzymatic activity. Consequently, Fmt1 up-regulates the cytosolic fMet–tRNAi (initiator transfer RNA), and thereby increases the levels of cytosolic Nt-formylated proteins, which are required for the adaptation of cells to specific stressors. (Bottom) The Psh1 E3 ubiquitin ligase targets the N-terminal fMet-residues of eukaryotic cytosolic proteins, such as Cse4, Pgd1, and Rps22a, for the polyubiquitylation-mediated, proteasome-dependent degradation.


A glycine-specific N-degron pathway mediates the quality control of protein N-myristoylation. Richard T. Timms1,2, Zhiqian Zhang1,2, David Y. Rhee3, J. Wade Harper3, Itay Koren1,2,*,†, Stephen J. Elledge1,2

Science  05 Jul 2019: Vol. 365, Issue 6448

The second paper describes a glycine specific N-degron pathway in humans.  Specifically the authors set up a screen to identify specific N-terminal degron motifs in the human.  Findings included an expanded repertoire for the UBR E3 ligases to include substrates with arginine and lysine following an intact initiator methionine and a glycine at the extreme N-terminus, which is a potent degron.

Glycine N-degron regulation revealed

For more than 30 years, N-terminal sequences have been known to influence protein stability, but additional features of these N-end rule, or N-degron, pathways continue to be uncovered. Timms et al. used a global protein stability (GPS) technology to take a broader look at these pathways in human cells. Unexpectedly, glycine exposed at the N terminus could act as a potent degron; proteins bearing N-terminal glycine were targeted for proteasomal degradation by two Cullin-RING E3 ubiquitin ligases through the substrate adaptors ZYG11B and ZER1. This pathway may be important, for example, to degrade proteins that fail to localize properly to cellular membranes and to destroy protein fragments generated during cell death.

Science, this issue p. eaaw4912

Structured Abstract

INTRODUCTION

The ubiquitin-proteasome system is the major route through which the cell achieves selective protein degradation. The E3 ubiquitin ligases are the major determinants of specificity in this system, which is thought to be achieved through their selective recognition of specific degron motifs in substrate proteins. However, our ability to identify these degrons and match them to their cognate E3 ligase remains a major challenge.

RATIONALE

It has long been known that the stability of proteins is influenced by their N-terminal residue, and a large body of work over the past three decades has characterized a collection of N-end rule pathways that target proteins for degradation through N-terminal degron motifs. Recently, we developed Global Protein Stability (GPS)–peptidome technology and used it to delineate a suite of degrons that lie at the extreme C terminus of proteins. We adapted this approach to examine the stability of the human N terminome, allowing us to reevaluate our understanding of N-degron pathways in an unbiased manner.

RESULTS

Stability profiling of the human N terminome identified two major findings: an expanded repertoire for UBR family E3 ligases to include substrates that begin with arginine and lysine following an intact initiator methionine and, more notably, that glycine positioned at the extreme N terminus can act as a potent degron. We established human embryonic kidney 293T reporter cell lines in which unstable peptides that bear N-terminal glycine degrons were fused to green fluorescent protein, and we performed CRISPR screens to identify the degradative machinery involved. These screens identified two Cul2 Cullin-RING E3 ligase complexes, defined by the related substrate adaptors ZYG11B and ZER1, that act redundantly to target substrates bearing N-terminal glycine degrons for proteasomal degradation. Moreover, through the saturation mutagenesis of example substrates, we defined the composition of preferred N-terminal glycine degrons specifically recognized by ZYG11B and ZER1.

We found that preferred glycine degrons are depleted from the native N termini of metazoan proteomes, suggesting that proteins have evolved to avoid degradation through this pathway, but are strongly enriched at annotated caspase cleavage sites. Stability profiling of N-terminal peptides lying downstream of all known caspase cleavages sites confirmed that Cul2ZYG11Band Cul2ZER1 could make a substantial contribution to the removal of proteolytic cleavage products during apoptosis. Last, we identified a role for ZYG11B and ZER1 in the quality control of N-myristoylated proteins. N-myristoylation is an important posttranslational modification that occurs exclusively on N-terminal glycine. By profiling the stability of the human N-terminome in the absence of the N-myristoyltransferases NMT1 and NMT2, we found that a failure to undergo N-myristoylation exposes N-terminal glycine degrons that are otherwise obscured. Thus, conditional exposure of glycine degrons to ZYG11B and ZER1 permits the selective proteasomal degradation of aberrant proteins that have escaped N-terminal myristoylation.

CONCLUSION

These data demonstrate that an additional N-degron pathway centered on N-terminal glycine regulates the stability of metazoan proteomes. Cul2ZYG11B– and Cul2ZER1-mediated protein degradation through N-terminal glycine degrons may be particularly important in the clearance of proteolytic fragments generated by caspase cleavage during apoptosis and in the quality control of protein N-myristoylation.

The glycine N-degron pathway.

Stability profiling of the human N-terminome revealed that N-terminal glycine acts as a potent degron. CRISPR screening revealed two Cul2 complexes, defined by the related substrate adaptors ZYG11B and ZER1, that recognize N-terminal glycine degrons. This pathway may be particularly important for the degradation of caspase cleavage products during apoptosis and the removal of proteins that fail to undergo N-myristoylation.

” data-icon-position=”” data-hide-link-title=”0″>

The glycine N-degron pathway.

Stability profiling of the human N-terminome revealed that N-terminal glycine acts as a potent degron. CRISPR screening revealed two Cul2 complexes, defined by the related substrate adaptors ZYG11B and ZER1, that recognize N-terminal glycine degrons. This pathway may be particularly important for the degradation of caspase cleavage products during apoptosis and the removal of proteins that fail to undergo N-myristoylation.


Read Full Post »

Summary, Metabolic Pathways

Author: Larry H. Bernstein, MD, FCAP 


This portion of a series of chapters on metabolism, proteomics and metabolomics dealt mainly with carbohydrate metabolism. Amino acids and lipids are presented more fully in the chapters that follow. There are features on the

  • functioning of enzymes and proteins,
  • on sequential changes in a chain reaction, and
  • on conformational changes that we shall also cover.

These are critical to developing a more complete understanding of life processes.

I needed to lay out the scope of metabolic reactions and pathways, and their complementary changes. These may not appear to be adaptive, if the circumstances and the duration is not clear. The metabolic pathways map in total
is in interaction with environmental conditions – light, heat, external nutrients and minerals, and toxins – all of which give direction and strength to these reactions. A developing goal is to discover how views introduced by molecular biology and genomics don’t clarify functional cellular dynamics that are not related to the classical view.  The work is vast.

Carbohydrate metabolism denotes the various biochemical processes responsible for the formation, breakdown and interconversion of carbohydrates in living organisms. The most important carbohydrate is glucose, a simple sugar (monosaccharide) that is metabolized by nearly all known organisms. Glucose and other carbohydrates are part of a wide variety of metabolic pathways across species: plants synthesize carbohydrates from carbon dioxide and water by photosynthesis storing the absorbed energy internally, often in the form of starch or lipids. Plant components are consumed by animals and fungi, and used as fuel for cellular respiration. Oxidation of one gram of carbohydrate yields approximately 4 kcal of energy and from lipids about 9 kcal. Energy obtained from metabolism (e.g. oxidation of glucose) is usually stored temporarily within cells in the form of ATP. Organisms capable of aerobic respiration metabolize glucose and oxygen to release energy with carbon dioxide and water as byproducts.

Carbohydrates are used for short-term fuel, and even though they are simpler to metabolize than fats, they don’t produce as equivalent energy yield measured by ATP.  In animals, the concentration of glucose in the blood is linked to the pancreatic endocrine hormone, insulin. . In most organisms, excess carbohydrates are regularly catabolized to form acetyl-CoA, which is a feed stock for the fatty acid synthesis pathway; fatty acids, triglycerides, and other lipids are commonly used for long-term energy storage. The hydrophobic character of lipids makes them a much more compact form of energy storage than hydrophilic carbohydrates.

Glucose is metabolized obtaining ATP and pyruvate by way of first splitting a six-carbon into two three carbon chains, which are converted to lactic acid from pyruvate in the lactic dehydrogenase reaction. The reverse conversion is by a separate unidirectional reaction back to pyruvate after moving through pyruvate dehydrogenase complex.

Pyruvate dehydrogenase complex (PDC) is a complex of three enzymes that convert pyruvate into acetyl-CoA by a process called pyruvate decarboxylation. Acetyl-CoA may then be used in the citric acid cycle to carry out cellular respiration, and this complex links the glycolysis metabolic pathway to the citric acid cycle. This multi-enzyme complex is related structurally and functionally to the oxoglutarate dehydrogenase and branched-chain oxo-acid dehydrogenase multi-enzyme complexes. In eukaryotic cells the reaction occurs inside the mitochondria, after transport of the substrate, pyruvate, from the cytosol. The transport of pyruvate into the mitochondria is via a transport protein and is active, consuming energy. On entry to the mitochondria pyruvate decarboxylation occurs, producing acetyl CoA. This irreversible reaction traps the acetyl CoA within the mitochondria. Pyruvate dehydrogenase deficiency from mutations in any of the enzymes or cofactors results in lactic acidosis.

PDH-rxns The acetyl group is transferred to coenzyme A

PDH-rxns The acetyl group is transferred to coenzyme A

http://guweb2.gonzaga.edu/faculty/cronk/biochem/images/PDH-rxns.gif

Typically, a breakdown of one molecule of glucose by aerobic respiration (i.e. involving both glycolysis and Kreb’s cycle) is about 33-35 ATP. This is categorized as:

Glycogenolysis – the breakdown of glycogen into glucose, which provides a glucose supply for glucose-dependent tissues.

Glycogenolysis in liver provides circulating glucose short term.

Glycogenolysis in muscle is obligatory for muscle contraction.

Pyruvate from glycolysis enters the Krebs cycle, also known as the citric acid cycle, in aerobic organisms.

Anaerobic breakdown by glycolysis – yielding 8-10 ATP

Aerobic respiration by Kreb’s cycle – yielding 25 ATP

The pentose phosphate pathway (shunt) converts hexoses into pentoses and regenerates NADPH. NADPH is an essential antioxidant in cells which prevents oxidative damage and acts as precursor for production of many biomolecules.

Glycogenesis – the conversion of excess glucose into glycogen as a cellular storage mechanism; achieving low osmotic pressure.

Gluconeogenesis – de novo synthesis of glucose molecules from simple organic compounds. An example in humans is the conversion of a few amino acids in cellular protein to glucose.

Metabolic use of glucose is highly important as an energy source for muscle cells and in the brain, and red blood cells.

The hormone insulin is the primary glucose regulatory signal in animals. It mainly promotes glucose uptake by the cells, and it causes the liver to store excess glucose as glycogen. Its absence

  1. turns off glucose uptake,
  2. reverses electrolyte adjustments,
  3. begins glycogen breakdown and glucose release into the circulation by some cells,
  4. begins lipid release from lipid storage cells, etc.

The level of circulatory glucose (known informally as “blood sugar”) is the most important signal to the insulin-producing cells.

  • insulin is made by beta cells in the pancreas,
  • fat is stored n adipose tissue cells, and
  • glycogen is both stored and released as needed by liver cells.
  • no glucose is released to the blood from internal glycogen stores from muscle cells.

The hormone glucagon, on the other hand, opposes that of insulin, forcing the conversion of glycogen in liver cells to glucose, and then release into the blood. Growth hormone, cortisol, and certain catecholamines (such as epinepherine) have glucoregulatory actions similar to glucagon.  These hormones are referred to as stress hormones because they are released under the influence of catabolic proinflammatory (stress) cytokines – interleukin-1 (IL1) and tumor necrosis factor α (TNFα).

Net Yield of GlycolysisThe preparatory phase consumes 2 ATP

The pay-off phase produces 4 ATP.

The gross yield of glycolysis is therefore

4 ATP – 2 ATP = 2 ATP

The pay-off phase also produces 2 molecules of NADH + H+ which can be further converted to a total of 5 molecules of ATP* by the electron transport chain (ETC) during oxidative phosphorylation.

Thus the net yield during glycolysis is 7 molecules of ATP*
This is calculated assuming one NADH molecule gives 2.5 molecules of ATP during oxidative phosphorylation.

Cellular respiration involves 3 stages for the breakdown of glucose – glycolysis, Kreb’s cycle and the electron transport system. Kreb’s cycle produces about 60-70% of ATP for release of energy in the body. It directly or indirectly connects with all the other individual pathways in the body.

The Kreb’s Cycle occurs in two stages:

  1. Conversion of Pyruvate to Acetyl CoA
  2. Acetyl CoA Enters the Kreb’s Cycle

Each pyruvate in the presence of pyruvate dehydrogenase (PDH) complex in the mitochondria gets converted to acetyl CoA which in turn enters the Kreb’s cycle. This reaction is called as oxidative  decarboxylation as the carboxyl group is removed from the pyruvate molecule in the form of CO2 thus yielding 2-carbon acetyl group which along with the coenzyme A forms acetyl CoA.

The PDH requires the sequential action of five co-factors or co-enzymes for the combined action of dehydrogenation and decarboxylation to take place. These five are TPP (thiamine phosphate), FAD (flavin adenine dinucleotide), NAD (nicotinamide adenine dinucleotide), coenzyme A (denoted as CoA-SH at times to depict role of -SH group) and lipoamide.

Acetyl CoA condenses with oxaloacetate (4C) to form a citrate (6C) by transferring its acetyl group in the presence of enzyme citrate synthase. The CoA liberated in this reaction is ready to participate in the oxidative decarboxylation of another molecule of pyruvate by PDH complex.

Isocitrate undergoes oxidative decarboxylation by the enzyme isocitrate dehydrogenase to form oxalosuccinate (intermediate- not shown) which in turn forms α-ketoglutarate (also known as oxoglutarate) which is a five carbon compound. CO2 and NADH are released in this step. α-ketoglutarate (5C) undergoes oxidative decarboxylation once again to form succinyl CoA (4C) catalysed by the enzyme α-ketoglutarate dehydrogenase complex.

Succinyl CoA is then converted to succinate by succinate thiokinase or succinyl coA synthetase in a reversible manner. This reaction involves an intermediate step in which the enzyme gets phosphorylated and then the phosphoryl group which has a high group transfer potential is transferred to GDP to form GTP.

Succinate then gets oxidised reversibly to fumarate by succinate dehydrogenase. The enzyme contains iron-sulfur clusters and covalently bound FAD which when undergoes electron exchange in the mitochondria causes the production of FADH2.

Fumarate is then by the enzyme fumarase converted to malate by hydration(addition of H2O) in a reversible manner.

Malate is then reversibly converted to oxaloacetate by malate dehydrogenase which is NAD linked and thus produces NADH.

The oxaloacetate produced is now ready to be utilized in the next cycle by the citrate synthase reaction and thus the equilibrium of the cycle shifts to the right.

The NADH formed in the cytosol can yield variable amounts of ATP depending on the shuttle system utilized to transport them into the mitochondrial matrix. This NADH, formed in the cytosol, is impermeable to the mitochondrial inner-membrane where oxidative phosphorylation takes place. Thus to carry this NADH to the mitochondrial matrix there are special shuttle systems in the body. The most active shuttle is the malate-aspartate shuttle via which 2.5 molecules of ATP are generated for 1 NADH molecule. This shuttle is mainly used by the heart, liver and kidneys. The brain and skeletal muscles use the other shuttle known as glycerol 3-phosphate shuttle which synthesizes 1.5 molecules of ATP for 1 NADH.

Glucose-6-phosphate Dehydrogenase is the committed step of the Pentose Phosphate Pathway. This enzyme is regulated by availability of the substrate NADP+. As NADPH is utilized in reductive synthetic pathways, the increasing concentration of NADP+ stimulates the Pentose Phosphate Pathway, to replenish NADPH. The importance of this pathway can easily be underestimated.  The main source for energy in respiration was considered to be tied to the high energy phosphate bond in phosphorylation and utilizes NADPH, converting it to NADP+. The pentose phosphate shunt is essential for the generation of nucleic acids, in regeneration of red cells and lens – requiring NADPH.

NAD+ serves as electron acceptor in catabolic pathways in which metabolites are oxidized. The resultant NADH is reoxidized by the respiratory chain, producing ATP.

The pyridine nucleotide transhydrogenase reaction concerns the energy-dependent reduction of TPN by DPNH. In 1959, Klingenberg and Slenczka made the important observation that incubation of isolated liver mitochondria with DPN-specific substrates or succinate in the absence of phosphate acceptor resulted in a rapid and almost complete reduction of  the intramitochondrial TPN. These and related findings led Klingenberg and co-workers (1-3) to postulate the occurrence of a ATP-controlled transhydrogenase reaction catalyzing the reduction of TPN by DPNH.  (The role of transhydrogenase in the energy-linked reduction of TPN.  Fritz Hommes, Ronald W. Estabrook, The Wenner-Gren Institute, University of Stockholm, Stockholm, Sweden. Biochemical and Biophysical Research Communications 11, (1), 2 Apr 1963, Pp 1–6. http://dx.doi.org:/10.1016/0006-291X(63)90017-2/).

Further studies observed the coupling of TPN-specific dehydrogenases with the transhydrogenase and observing the reduction of large amounts of diphosphopyridine nucleotide (DPN) in the presence of catalytic amounts of triphosphopyridine nucleotide (TPN). The studies showed the direct interaction between TPNHz and DPN, in the presence of transhydrogenase to yield products having the properties of TPN and DPNHZ. The reaction involves a transfer of electrons (or hydrogen) rather than a phosphate. (Pyridine Nucleotide Transhydrogenase  II. Direct Evidence for and Mechanism of the Transhydrogenase Reaction* by  Nathan 0. Kaplan, Sidney P. Colowick, And Elizabeth F. Neufeld. (From The Mccollum-Pratt Institute, The Johns Hopkins University, Baltimore, Maryland) J. Biol. Chem. 1952, 195:107-119.) http://www.JBC.org/Content/195/1/107.Citation
Notation: TPN, NADP; DPN, NAD+; reduced pyridine nucleotides: TPNH (NADPH2), DPNH (NADH).

Note: In this discussion there is a detailed presentation of the activity of lactic acid conversion in the mitochondria by way of PDH. In a later section there is mention of the bidirectional reaction of lactate dehydrogenase.  However, the forward reaction is dominant (pyruvate to lactate) and is described. This is not related to the kinetics of the LD reaction with respect to the defining characteristic – Km.

Biochemical Education Jan 1977; 5(1):15. Kinetics of Lactate Dehydrogenase: A Textbook Problem.
K.L. MANCHESTER. Department of Biochemistry, University of Witwatersrand, Johannesburg South Africa.

One presupposes that determined Km values are meaningful under intracellular conditions. In relation to teaching it is a simple experiment for students to determine for themselves the Km towards pyruvate of LDH in a post-mitochondrial supernatant of rat heart and thigh muscle. The difference in Km may be a factor of 3 or 4-fold.It is pertinent then to ask what is the range of suhstrate concentrations over which a difference in Km may be expected to lead to significant differences in activity and how these concentrations compare with pyruvate concentrations in the cell. The evidence of Vesell and co-workers that inhibition by pyruvate is more readily seen at low than at high enzyme concentration is important in emphasizing that under intracellular conditions enzyme concentrations may be relatively large in relation to the substrate available. This will be particularly so in relation to [NADH] which in the cytoplasm is likely to be in the ~M range.

A final point concerns the kinetic parameters for LDH quoted by Bergmeyer for lactate estimations a pH of 9 is recommended and the Km towards lactate at that pH is likely to be appreciably different from the quoted values at pH 7 — Though still at pH 9 showing a substantially lower value for lactate with the heart preparation.  http://onlinelibrary.wiley.com/doi/10.1016/0307-4412%2877%2990013-9/pdf

Several investigators have established that epidermis converts most of the glucose it uses to lactic acid even in the presence of oxygen. This is in contrast to most tissues where lactic acid production is used for energy production only when oxygen is not available. This large amount of lactic acid being continually produced within the epidermal cell must be excreted by the cell and then carried away by the blood stream to other tissues where the lactate can be utilized. The LDH reaction with pyruvate and NADH is reversible although at physiological pH the equilibrium position for the reaction lies very far to the right, i.e., in favor of lactate production. The speed of this reaction depends not only on the amount of enzyme present but also on the concentrations of the substances involved on both sides of the equation. The net direction in which the reaction will proceed depends solely on the relative concentrations of the substances on each side of the equation.
In vivo there is net conversion of pyruvate (formed from glucose) to lactate. Measurements of the speed of lactate production by sheets of epidermis floating on a medium containing glucose indicate a rate of lactate production of approximately 0.7 rn/sm/
mm/mg of fresh epidermis.Slice incubation experiments are presumably much closer to the actual in vivo conditions than
the homogenate experiments. The discrepancy between the
two indicates that in vivo conditions are far from optimal for the conversion of pyruvate to lactate. Only 1/100th of the maximal activity of the enzyme present is being achieved. The concentrations of the various substances involved are not
optimal in vivo since pyruvate and NADH concentrations are
lower than lactate and NAD concentrations and this might explain the in vivo inhibition of LDH activity. (Lactate Production And Lactate Dehydrogenase In The Human Epidermis*. KM. Halprin, A Ohkawara. J Invest Dermat 1966; 47(3): 222-6.)
http://www.nature.com/jid/journal/v47/n3/pdf/jid1966133a.pdf

Read Full Post »

Introduction to Metabolic Pathways

Author: Larry H. Bernstein, MD, FCAP


Humans, mammals, plants and animals, and eukaryotes and prokaryotes all share a common denominator in their manner of existence.  It makes no difference whether they inhabit the land, or the sea, or another living host. They exist by virtue of their metabolic adaptation by way of taking in nutrients as fuel, and converting the nutrients to waste in the expenditure of carrying out the functions of motility, breakdown and utilization of fuel, and replication of their functional mass.

There are essentially two major sources of fuel, mainly, carbohydrate and fat.  A third source, amino acids which requires protein breakdown, is utilized to a limited extent as needed from conversion of gluconeogenic amino acids for entry into the carbohydrate pathway. Amino acids follow specific metabolic pathways related to protein synthesis and cell renewal tied to genomic expression.

Carbohydrates are a major fuel utilized by way of either of two pathways.  They are a source of readily available fuel that is accessible either from breakdown of disaccharides or from hepatic glycogenolysis by way of the Cori cycle.  Fat derived energy is a high energy source that is metabolized by one carbon transfers using the oxidation of fatty acids in mitochondria. In the case of fats, the advantage of high energy is conferred by chain length.

Carbohydrate metabolism has either of two routes of utilization.  This introduces an innovation by way of the mitochondrion or its equivalent, for the process of respiration, or aerobic metabolism through the tricarboxylic acid, or Krebs cycle.  In the presence of low oxygen supply, carbohydrate is metabolized anaerobically, the six carbon glucose being split into two three carbon intermediates, which are finally converted from pyruvate to lactate.  In the presence of oxygen, the lactate is channeled back into respiration, or mitochondrial oxidation, referred to as oxidative phosphorylation. The actual mechanism of this process was of considerable debate for some years until it was resolved that the mechanism involve hydrogen transfers along the “electron transport chain” on the inner membrane of the mitochondrion, and it was tied to the formation of ATP from ADP linked to the so called “active acetate” in Acetyl-Coenzyme A, discovered by Fritz Lipmann (and Nathan O. Kaplan) at Massachusetts General Hospital.  Kaplan then joined with Sidney Colowick at the McCollum Pratt Institute at Johns Hopkins, where they shared tn the seminal discovery of the “pyridine nucleotide transhydrogenases” with Elizabeth Neufeld,  who later established her reputation in the mucopolysaccharidoses (MPS) with L-iduronidase and lysosomal storage disease.

This chapter covers primarily the metabolic pathways for glucose, anaerobic and by mitochondrial oxidation, the electron transport chain, fatty acid oxidation, galactose assimilation, and the hexose monophosphate shunt, essential for the generation of NADPH. The is to be more elaboration on lipids and coverage of transcription, involving amino acids and RNA in other chapters.

The subchapters are as follows:

1.1      Carbohydrate Metabolism

1.2      Studies of Respiration Lead to Acetyl CoA

1.3      Pentose Shunt, Electron Transfer, Galactose, more Lipids in brief

1.4      The Multi-step Transfer of Phosphate Bond and Hydrogen Exchange Energy

Complex I or NADH-Q oxidoreductase

Complex I or NADH-Q oxidoreductase

Fatty acid oxidation and ETC

Fatty acid oxidation and ETC

Read Full Post »

Metabolomics Summary and Perspective

Metabolomics Summary and Perspective

Author and Curator: Larry H Bernstein, MD, FCAP 


This is the final article in a robust series on metabolism, metabolomics, and  the “-OMICS-“ biological synthesis that is creating a more holistic and interoperable view of natural sciences, including the biological disciplines, climate science, physics, chemistry, toxicology, pharmacology, and pathophysiology with as yet unforeseen consequences.

There have been impressive advances already in the research into developmental biology, plant sciences, microbiology, mycology, and human diseases, most notably, cancer, metabolic , and infectious, as well as neurodegenerative diseases.

Acknowledgements:

I write this article in honor of my first mentor, Harry Maisel, Professor and Emeritus Chairman of Anatomy, Wayne State University, Detroit, MI and to my stimulating mentors, students, fellows, and associates over many years:

Masahiro Chiga, MD, PhD, Averill A Liebow, MD, Nathan O Kaplan, PhD, Johannes Everse, PhD, Norio Shioura, PhD, Abraham Braude, MD, Percy J Russell, PhD, Debby Peters, Walter D Foster, PhD, Herschel Sidransky, MD, Sherman Bloom, MD, Matthew Grisham, PhD, Christos Tsokos, PhD,  IJ Good, PhD, Distinguished Professor, Raool Banagale, MD, Gustavo Reynoso, MD,Gustave Davis, MD, Marguerite M Pinto, MD, Walter Pleban, MD, Marion Feietelson-Winkler, RD, PhD,  John Adan,MD, Joseph Babb, MD, Stuart Zarich, MD,  Inder Mayall, MD, A Qamar, MD, Yves Ingenbleek, MD, PhD, Emeritus Professor, Bette Seamonds, PhD, Larry Kaplan, PhD, Pauline Y Lau, PhD, Gil David, PhD, Ronald Coifman, PhD, Emeritus Professor, Linda Brugler, RD, MBA, James Rucinski, MD, Gitta Pancer, Ester Engelman, Farhana Hoque, Mohammed Alam, Michael Zions, William Fleischman, MD, Salman Haq, MD, Jerard Kneifati-Hayek, Madeleine Schleffer, John F Heitner, MD, Arun Devakonda,MD, Liziamma George,MD, Suhail Raoof, MD, Charles Oribabor,MD, Anthony Tortolani, MD, Prof and Chairman, JRDS Rosalino, PhD, Aviva Lev Ari, PhD, RN, Rosser Rudolph, MD, PhD, Eugene Rypka, PhD, Jay Magidson, PhD, Izaak Mayzlin, PhD, Maurice Bernstein, PhD, Richard Bing, Eli Kaplan, PhD, Maurice Bernstein, PhD.

This article has EIGHT parts, as follows:

Part 1

Metabolomics Continues Auspicious Climb

Part 2

Biologists Find ‘Missing Link’ in the Production of Protein Factories in Cells

Part 3

Neuroscience

Part 4

Cancer Research

Part 5

Metabolic Syndrome

Part 6

Biomarkers

Part 7

Epigenetics and Drug Metabolism

Part 8

Pictorial

genome cartoon

genome cartoon

 iron metabolism

iron metabolism

personalized reference range within population range

personalized reference range within population range

Part 1.  MetabolomicsSurge

metagraph  _OMICS

metagraph _OMICS

Metabolomics Continues Auspicious Climb

Jeffery Herman, Ph.D.
GEN May 1, 2012 (Vol. 32, No. 9)

Aberrant biochemical and metabolite signaling plays an important role in

  • the development and progression of diseased tissue.

This concept has been studied by the science community for decades. However, with relatively

  1. recent advances in analytical technology and bioinformatics as well as
  2. the development of the Human Metabolome Database (HMDB),

metabolomics has become an invaluable field of research.

At the “International Conference and Exhibition on Metabolomics & Systems Biology” held recently in San Francisco, researchers and industry leaders discussed how

  • the underlying cellular biochemical/metabolite fingerprint in response to
  1. a specific disease state,
  2. toxin exposure, or
  3. pharmaceutical compound
  • is useful in clinical diagnosis and biomarker discovery and
  • in understanding disease development and progression.

Developed by BASF, MetaMap® Tox is

  • a database that helps identify in vivo systemic effects of a tested compound, including
  1. targeted organs,
  2. mechanism of action, and
  3. adverse events.

Based on 28-day systemic rat toxicity studies, MetaMap Tox is composed of

  • differential plasma metabolite profiles of rats
  • after exposure to a large variety of chemical toxins and pharmaceutical compounds.

“Using the reference data,

  • we have developed more than 110 patterns of metabolite changes, which are
  • specific and predictive for certain toxicological modes of action,”

said Hennicke Kamp, Ph.D., group leader, department of experimental toxicology and ecology at BASF.

With MetaMap Tox, a potential drug candidate

  • can be compared to a similar reference compound
  • using statistical correlation algorithms,
  • which allow for the creation of a toxicity and mechanism of action profile.

“MetaMap Tox, in the context of early pre-clinical safety enablement in pharmaceutical development,” continued Dr. Kamp,

  • has been independently validated “
  • by an industry consortium (Drug Safety Executive Council) of 12 leading biopharmaceutical companies.”

Dr. Kamp added that this technology may prove invaluable

  • allowing for quick and accurate decisions and
  • for high-throughput drug candidate screening, in evaluation
  1. on the safety and efficacy of compounds
  2. during early and preclinical toxicological studies,
  3. by comparing a lead compound to a variety of molecular derivatives, and
  • the rapid identification of the most optimal molecular structure
  • with the best efficacy and safety profiles might be streamlined.
Dynamic Construct of the –Omics

Dynamic Construct of the –Omics

Targeted Tandem Mass Spectrometry

Biocrates Life Sciences focuses on targeted metabolomics, an important approach for

  • the accurate quantification of known metabolites within a biological sample.

Originally used for the clinical screening of inherent metabolic disorders from dried blood-spots of newborn children, Biocrates has developed

  • a tandem mass spectrometry (MS/MS) platform, which allows for
  1. the identification,
  2. quantification, and
  3. mapping of more than 800 metabolites to specific cellular pathways.

It is based on flow injection analysis and high-performance liquid chromatography MS/MS.

Clarification of Pathway-Specific Inhibition by Fourier Transform Ion Cyclotron Resonance.Mass Spectrometry-Based Metabolic Phenotyping Studies F5.large

common drug targets

common drug targets

The MetaDisIDQ® Kit is a

  • “multiparamatic” diagnostic assay designed for the “comprehensive assessment of a person’s metabolic state” and
  • the early determination of pathophysiological events with regards to a specific disease.

MetaDisIDQ is designed to quantify

  • a diverse range of 181 metabolites involved in major metabolic pathways
  • from a small amount of human serum (10 µL) using isotopically labeled internal standards,

This kit has been demonstrated to detect changes in metabolites that are commonly associated with the development of

  • metabolic syndrome, type 2 diabetes, and diabetic nephropathy,

Dr. Dallman reports that data generated with the MetaDisIDQ kit correlates strongly with

  • routine chemical analyses of common metabolites including glucose and creatinine

Biocrates has also developed the MS/MS-based AbsoluteIDQ® kits, which are

  • an “easy-to-use” biomarker analysis tool for laboratory research.

The kit functions on MS machines from a variety of vendors, and allows for the quantification of 150-180 metabolites.

The SteroIDQ® kit is a high-throughput standardized MS/MS diagnostic assay,

  • validated in human serum, for the rapid and accurate clinical determination of 16 known steroids.

Initially focusing on the analysis of steroid ranges for use in hormone replacement therapy, the SteroIDQ Kit is expected to have a wide clinical application.

Hormone-Resistant Breast Cancer

Scientists at Georgetown University have shown that

  • breast cancer cells can functionally coordinate cell-survival and cell-proliferation mechanisms,
  • while maintaining a certain degree of cellular metabolism.

To grow, cells need energy, and energy is a product of cellular metabolism. For nearly a century, it was thought that

  1. the uncoupling of glycolysis from the mitochondria,
  2. leading to the inefficient but rapid metabolism of glucose and
  3. the formation of lactic acid (the Warburg effect), was

the major and only metabolism driving force for unchecked proliferation and tumorigenesis of cancer cells.

Other aspects of metabolism were often overlooked.

“.. we understand now that

  • cellular metabolism is a lot more than just metabolizing glucose,”

said Robert Clarke, Ph.D., professor of oncology and physiology and biophysics at Georgetown University. Dr. Clarke, in collaboration with the Waters Center for Innovation at Georgetown University (led by Albert J. Fornace, Jr., M.D.), obtained

  • the metabolomic profile of hormone-sensitive and -resistant breast cancer cells through the use of UPLC-MS.

They demonstrated that breast cancer cells, through a rather complex and not yet completely understood process,

  1. can functionally coordinate cell-survival and cell-proliferation mechanisms,
  2. while maintaining a certain degree of cellular metabolism.

This is at least partly accomplished through the upregulation of important pro-survival mechanisms; including

  • the unfolded protein response;
  • a regulator of endoplasmic reticulum stress and
  • initiator of autophagy.

Normally, during a stressful situation, a cell may

  • enter a state of quiescence and undergo autophagy,
  • a process by which a cell can recycle organelles
  • in order to maintain enough energy to survive during a stressful situation or,

if the stress is too great,

  • undergo apoptosis.

By integrating cell-survival mechanisms and cellular metabolism

  • advanced ER+ hormone-resistant breast cancer cells
  • can maintain a low level of autophagy
  • to adapt and resist hormone/chemotherapy treatment.

This adaptation allows cells

  • to reallocate important metabolites recovered from organelle degradation and
  • provide enough energy to also promote proliferation.

With further research, we can gain a better understanding of the underlying causes of hormone-resistant breast cancer, with

  • the overall goal of developing effective diagnostic, prognostic, and therapeutic tools.

NMR

Over the last two decades, NMR has established itself as a major tool for metabolomics analysis. It is especially adept at testing biological fluids. [Bruker BioSpin]

Historically, nuclear magnetic resonance spectroscopy (NMR) has been used for structural elucidation of pure molecular compounds. However, in the last two decades, NMR has established itself as a major tool for metabolomics analysis. Since

  • the integral of an NMR signal is directly proportional to
  • the molar concentration throughout the dynamic range of a sample,

“the simultaneous quantification of compounds is possible

  • without the need for specific reference standards or calibration curves,” according to Lea Heintz of Bruker BioSpin.

NMR is adept at testing biological fluids because of

  1.  high reproducibility,
  2. standardized protocols,
  3. low sample manipulation, and
  4. the production of a large subset of data,

Bruker BioSpin is presently involved in a project for the screening of inborn errors of metabolism in newborn children from Turkey, based on their urine NMR profiles. More than 20 clinics are participating to the project that is coordinated by INFAI, a specialist in the transfer of advanced analytical technology into medical diagnostics. The construction of statistical models are being developed

  • for the detection of deviations from normality, as well as
  • automatic quantification methods for indicative metabolites

Bruker BioSpin recently installed high-resolution magic angle spinning NMR (HRMAS-NMR) systems that can rapidly analyze tissue biopsies. The main objective for HRMAS-NMR is to establish a rapid and effective clinical method to assess tumor grade and other important aspects of cancer during surgery.

Combined NMR and Mass Spec

There is increasing interest in combining NMR and MS, two of the main analytical assays in metabolomic research, as a means

  • to improve data sensitivity and to
  • fully elucidate the complex metabolome within a given biological sample.
  •  to realize a potential for cancer biomarker discovery in the realms of diagnosis, prognosis, and treatment.

.

Using combined NMR and MS to measure the levels of nearly 250 separate metabolites in the patient’s blood, Dr. Weljie and other researchers at the University of Calgary were able to rapidly determine the malignancy of a  pancreatic lesion (in 10–15% of the cases, it is difficult to discern between benign and malignant), while avoiding unnecessary surgery in patients with benign lesions.

When performing NMR and MS on a single biological fluid, ultimately “we are,” noted Dr. Weljie,

  1. “splitting up information content, processing, and introducing a lot of background noise and error and
  2. then trying to reintegrate the data…
    It’s like taking a complex item, with multiple pieces, out of an IKEA box and trying to repackage it perfectly into another box.”

By improving the workflow between the initial splitting of the sample, they improved endpoint data integration, proving that

  • a streamlined approach to combined NMR/MS can be achieved,
  • leading to a very strong, robust and precise metabolomics toolset.

Metabolomics Research Picks Up Speed

Field Advances in Quest to Improve Disease Diagnosis and Predict Drug Response

John Morrow Jr., Ph.D.
GEN May 1, 2011 (Vol. 31, No. 9)

As an important discipline within systems biology, metabolomics is being explored by a number of laboratories for

  • its potential in pharmaceutical development.

Studying metabolites can offer insights into the relationships between genotype and phenotype, as well as between genotype and environment. In addition, there is plenty to work with—there are estimated to be some 2,900 detectable metabolites in the human body, of which

  1. 309 have been identified in cerebrospinal fluid,
  2. 1,122 in serum,
  3. 458 in urine, and
  4. roughly 300 in other compartments.

Guowang Xu, Ph.D., a researcher at the Dalian Institute of Chemical Physics.  is investigating the causes of death in China,

  • and how they have been changing over the years as the country has become a more industrialized nation.
  •  the increase in the incidence of metabolic disorders such as diabetes has grown to affect 9.7% of the Chinese population.

Dr. Xu,  collaborating with Rainer Lehman, Ph.D., of the University of Tübingen, Germany, compared urinary metabolites in samples from healthy individuals with samples taken from prediabetic, insulin-resistant subjects. Using mass spectrometry coupled with electrospray ionization in the positive mode, they observed striking dissimilarities in levels of various metabolites in the two groups.

“When we performed a comprehensive two-dimensional gas chromatography, time-of-flight mass spectrometry analysis of our samples, we observed several metabolites, including

  • 2-hydroxybutyric acid in plasma,
  •  as potential diabetes biomarkers,” Dr. Xu explains.

In other, unrelated studies, Dr. Xu and the German researchers used a metabolomics approach to investigate the changes in plasma metabolite profiles immediately after exercise and following a 3-hour and 24-hour period of recovery. They found that

  • medium-chain acylcarnitines were the most distinctive exercise biomarkers, and
  • they are released as intermediates of partial beta oxidation in human myotubes and mouse muscle tissue.

Dr. Xu says. “The traditional approach of assessment based on a singular biomarker is being superseded by the introduction of multiple marker profiles.”

Typical of the studies under way by Dr. Kaddurah-Daouk and her colleaguesat Duke University

  • is a recently published investigation highlighting the role of an SNP variant in
  • the glycine dehydrogenase gene on individual response to antidepressants.
  •  patients who do not respond to the selective serotonin uptake inhibitors citalopram and escitalopram
  • carried a particular single nucleotide polymorphism in the GD gene.

“These results allow us to pinpoint a possible

  • role for glycine in selective serotonin reuptake inhibitor response and
  • illustrate the use of pharmacometabolomics to inform pharmacogenomics.

These discoveries give us the tools for prognostics and diagnostics so that

  • we can predict what conditions will respond to treatment.

“This approach to defining health or disease in terms of metabolic states opens a whole new paradigm.

By screening hundreds of thousands of molecules, we can understand

  • the relationship between human genetic variability and the metabolome.”

Dr. Kaddurah-Daouk talks about statins as a current

  • model of metabolomics investigations.

It is now known that the statins  have widespread effects, altering a range of metabolites. To sort out these changes and develop recommendations for which individuals should be receiving statins will require substantial investments of energy and resources into defining the complex web of biochemical changes that these drugs initiate.
Furthermore, Dr. Kaddurah-Daouk asserts that,

  • “genetics only encodes part of the phenotypic response.

One needs to take into account the

  • net environment contribution in order to determine
  • how both factors guide the changes in our metabolic state that determine the phenotype.”

Interactive Metabolomics

Researchers at the University of Nottingham use diffusion-edited nuclear magnetic resonance spectroscopy to assess the effects of a biological matrix on metabolites. Diffusion-edited NMR experiments provide a way to

  • separate the different compounds in a mixture
  • based on the differing translational diffusion coefficients (which reflect the size and shape of the molecule).

The measurements are carried out by observing

  • the attenuation of the NMR signals during a pulsed field gradient experiment.

Clare Daykin, Ph.D., is a lecturer at the University of Nottingham, U.K. Her field of investigation encompasses “interactive metabolomics,”which she defines as

“the study of the interactions between low molecular weight biochemicals and macromolecules in biological samples ..

  • without preselection of the components of interest.

“Blood plasma is a heterogeneous mixture of molecules that

  1. undergo a variety of interactions including metal complexation,
  2. chemical exchange processes,
  3. micellar compartmentation,
  4. enzyme-mediated biotransformations, and
  5. small molecule–macromolecular binding.”

Many low molecular weight compounds can exist

  • freely in solution,
  • bound to proteins, or
  • within organized aggregates such as lipoprotein complexes.

Therefore, quantitative comparison of plasma composition from

  • diseased individuals compared to matched controls provides an incomplete insight to plasma metabolism.

“It is not simply the concentrations of metabolites that must be investigated,

  • but their interactions with the proteins and lipoproteins within this complex web.

Rather than targeting specific metabolites of interest, Dr. Daykin’s metabolite–protein binding studies aim to study

  • the interactions of all detectable metabolites within the macromolecular sample.

Such activities can be studied through the use of diffusion-edited nuclear magnetic resonance (NMR) spectroscopy, in which one can assess

  • the effects of the biological matrix on the metabolites.

“This can lead to a more relevant and exact interpretation

  • for systems where metabolite–macromolecule interactions occur.”

Diffusion-edited NMR experiments provide a way to separate the different compounds in a mixture based on

  • the differing translational diffusion coefficients (which reflect the size and shape of the molecule).

The measurements are carried out by observing

  • the attenuation of the NMR signals during a pulsed field gradient experiment.

Pushing the Limits

It is widely recognized that many drug candidates fail during development due to ancillary toxicity. Uwe Sauer, Ph.D., professor, and Nicola Zamboni, Ph.D., researcher, both at the Eidgenössische Technische Hochschule, Zürich (ETH Zürich), are applying

  • high-throughput intracellular metabolomics to understand
  • the basis of these unfortunate events and
  • head them off early in the course of drug discovery.

“Since metabolism is at the core of drug toxicity, we developed a platform for

  • measurement of 50–100 targeted metabolites by
  • a high-throughput system consisting of flow injection
  • coupled to tandem mass spectrometry.”

Using this approach, Dr. Sauer’s team focused on

  • the central metabolism of the yeast Saccharomyces cerevisiae, reasoning that
  • this core network would be most susceptible to potential drug toxicity.

Screening approximately 41 drugs that were administered at seven concentrations over three orders of magnitude, they observed changes in metabolome patterns at much lower drug concentrations without attendant physiological toxicity.

The group carried out statistical modeling of about

  • 60 metabolite profiles for each drug they evaluated.

This data allowed the construction of a “profile effect map” in which

  • the influence of each drug on metabolite levels can be followed, including off-target effects, which
  • provide an indirect measure of the possible side effects of the various drugs.

Dr. Sauer says.“We have found that this approach is

  • at least 100 times as fast as other omics screening platforms,”

“Some drugs, including many anticancer agents,

  • disrupt metabolism long before affecting growth.”
killing cancer cells

killing cancer cells

Furthermore, they used the principle of 13C-based flux analysis, in which

  • metabolites labeled with 13C are used to follow the utilization of metabolic pathways in the cell.

These 13C-determined intracellular responses of metabolic fluxes to drug treatment demonstrate

  • the functional performance of the network to be rather robust,
conformational changes leading to substrate efflux.

conformational changes leading to substrate efflux.

leading Dr. Sauer to the conclusion that

  • the phenotypic vigor he observes to drug challenges
  • is achieved by a flexible make up of the metabolome.

Dr. Sauer is confident that it will be possible to expand the scope of these investigations to hundreds of thousands of samples per study. This will allow answers to the questions of

  • how cells establish a stable functioning network in the face of inevitable concentration fluctuations.

Is Now the Hour?

There is great enthusiasm and agitation within the biotech community for

  • metabolomics approaches as a means of reversing the dismal record of drug discovery

that has accumulated in the last decade.

While the concept clearly makes sense and is being widely applied today, there are many reasons why drugs fail in development, and metabolomics will not be a panacea for resolving all of these questions. It is too early at this point to recognize a trend or a track record, and it will take some time to see how this approach can aid in drug discovery and shorten the timeline for the introduction of new pharmaceutical agents.

Degree of binding correlated with function

Degree of binding correlated with function

Diagram_of_a_two-photon_excitation_microscope_

Diagram_of_a_two-photon_excitation_microscope_

Part 2.  Biologists Find ‘Missing Link’ in the Production of Protein Factories in Cells

Biologists at UC San Diego have found

  • the “missing link” in the chemical system that
  • enables animal cells to produce ribosomes

—the thousands of protein “factories” contained within each cell that

  • manufacture all of the proteins needed to build tissue and sustain life.
‘Missing Link’

‘Missing Link’

Their discovery, detailed in the June 23 issue of the journal Genes & Development, will not only force

  • a revision of basic textbooks on molecular biology, but also
  • provide scientists with a better understanding of
  • how to limit uncontrolled cell growth, such as cancer,
  • that might be regulated by controlling the output of ribosomes.

Ribosomes are responsible for the production of the wide variety of proteins that include

  1. enzymes;
  2. structural molecules, such as hair,
  3. skin and bones;
  4. hormones like insulin; and
  5. components of our immune system such as antibodies.

Regarded as life’s most important molecular machine, ribosomes have been intensively studied by scientists (the 2009 Nobel Prize in Chemistry, for example, was awarded for studies of its structure and function). But until now researchers had not uncovered all of the details of how the proteins that are used to construct ribosomes are themselves produced.

In multicellular animals such as humans,

  • ribosomes are made up of about 80 different proteins
    (humans have 79 while some other animals have a slightly different number) as well as
  • four different kinds of RNA molecules.

In 1969, scientists discovered that

  • the synthesis of the ribosomal RNAs is carried out by specialized systems using two key enzymes:
  • RNA polymerase I and RNA polymerase III.

But until now, scientists were unsure if a complementary system was also responsible for

  • the production of the 80 proteins that make up the ribosome.

That’s essentially what the UC San Diego researchers headed by Jim Kadonaga, a professor of biology, set out to examine. What they found was the missing link—the specialized

  • system that allows ribosomal proteins themselves to be synthesized by the cell.

Kadonaga says that he and coworkers found that ribosomal proteins are synthesized via

  • a novel regulatory system with the enzyme RNA polymerase II and
  • a factor termed TRF2,”

“For the production of most proteins,

  1. RNA polymerase II functions with
  2. a factor termed TBP,
  3. but for the synthesis of ribosomal proteins, it uses TRF2.”
  •  this specialized TRF2-based system for ribosome biogenesis
  • provides a new avenue for the study of ribosomes and
  • its control of cell growth, and

“it should lead to a better understanding and potential treatment of diseases such as cancer.”

Coordination of the transcriptome and metabolome

Coordination of the transcriptome and metabolome

the potential advantages conferred by distal-site protein synthesis

the potential advantages conferred by distal-site protein synthesis

Other authors of the paper were UC San Diego biologists Yuan-Liang Wang, Sascha Duttke and George Kassavetis, and Kai Chen, Jeff Johnston, and Julia Zeitlinger of the Stowers Institute for Medical Research in Kansas City, Missouri. Their research was supported by two grants from the National Institutes of Health (1DP2OD004561-01 and R01 GM041249).

Turning Off a Powerful Cancer Protein

Scientists have discovered how to shut down a master regulatory transcription factor that is

  • key to the survival of a majority of aggressive lymphomas,
  • which arise from the B cells of the immune system.

The protein, Bcl6, has long been considered too complex to target with a drug since it is also crucial

  • to the healthy functioning of many immune cells in the body, not just B cells gone bad.

The researchers at Weill Cornell Medical College report that it is possible

  • to shut down Bcl6 in diffuse large B-cell lymphoma (DLBCL)
  • while not affecting its vital function in T cells and macrophages
  • that are needed to support a healthy immune system.

If Bcl6 is completely inhibited, patients might suffer from systemic inflammation and atherosclerosis. The team conducted this new study to help clarify possible risks, as well as to understand

  • how Bcl6 controls the various aspects of the immune system.

The findings in this study were inspired from

  • preclinical testing of two Bcl6-targeting agents that Dr. Melnick and his Weill Cornell colleagues have developed
  • to treat DLBCLs.

These experimental drugs are

  • RI-BPI, a peptide mimic, and
  • the small molecule agent 79-6.

“This means the drugs we have developed against Bcl6 are more likely to be

  • significantly less toxic and safer for patients with this cancer than we realized,”

says Ari Melnick, M.D., professor of hematology/oncology and a hematologist-oncologist at NewYork-Presbyterian Hospital/Weill Cornell Medical Center.

Dr. Melnick says the discovery that

  • a master regulatory transcription factor can be targeted
  • offers implications beyond just treating DLBCL.

Recent studies from Dr. Melnick and others have revealed that

  • Bcl6 plays a key role in the most aggressive forms of acute leukemia, as well as certain solid tumors.

Bcl6 can control the type of immune cell that develops in the bone marrow—playing many roles

  • in the development of B cells, T cells, macrophages, and other cells—including a primary and essential role in
  • enabling B-cells to generate specific antibodies against pathogens.

According to Dr. Melnick, “When cells lose control of Bcl6,

  • lymphomas develop in the immune system.

Lymphomas are ‘addicted’ to Bcl6, and therefore

  • Bcl6 inhibitors powerfully and quickly destroy lymphoma cells,” .

The big surprise in the current study is that rather than functioning as a single molecular machine,

  • Bcl6 functions like a Swiss Army knife,
  • using different tools to control different cell types.

This multifunction paradigm could represent a general model for the functioning of other master regulatory transcription factors.

“In this analogy, the Swiss Army knife, or transcription factor, keeps most of its tools folded,

  • opening only the one it needs in any given cell type,”

He makes the following analogy:

  • “For B cells, it might open and use the knife tool;
  • for T cells, the cork screw;
  • for macrophages, the scissors.”

“this means that you only need to prevent the master regulator from using certain tools to treat cancer. You don’t need to eliminate the whole knife,” . “In fact, we show that taking out the whole knife is harmful since

  • the transcription factor has many other vital functions that other cells in the body need.”

Prior to these study results, it was not known that a master regulator could separate its functions so precisely. Researchers hope this will be a major benefit to the treatment of DLBCL and perhaps other disorders that are influenced by Bcl6 and other master regulatory transcription factors.

The study is published in the journal Nature Immunology, in a paper titled “Lineage-specific functions of Bcl-6 in immunity and inflammation are mediated by distinct biochemical mechanisms”.

Part 3. Neuroscience

Vesicles influence function of nerve cells 
Oct, 06 2014        source: http://feeds.sciencedaily.com

Neurons (blue) which have absorbed exosomes (green) have increased levels of the enzyme catalase (red), which helps protect them against peroxides.

Neurons (blue) which have absorbed exosomes (green) have increased levels of the enzyme catalase (red), which helps protect them against peroxides.

Neurons (blue) which have absorbed exosomes (green) have increased levels of the enzyme catalase (red), which helps protect them against peroxides.

Tiny vesicles containing protective substances

  • which they transmit to nerve cells apparently
  • play an important role in the functioning of neurons.

As cell biologists at Johannes Gutenberg University Mainz (JGU) have discovered,

  • nerve cells can enlist the aid of mini-vesicles of neighboring glial cells
  • to defend themselves against stress and other potentially detrimental factors.

These vesicles, called exosomes, appear to stimulate the neurons on various levels:

  • they influence electrical stimulus conduction,
  • biochemical signal transfer, and
  • gene regulation.

Exosomes are thus multifunctional signal emitters

  • that can have a significant effect in the brain.
Exosome

Exosome

The researchers in Mainz already observed in a previous study that

  • oligodendrocytes release exosomes on exposure to neuronal stimuli.
  • these are absorbed by the neurons and improve neuronal stress tolerance.

Oligodendrocytes, a type of glial cell, form an

  • insulating myelin sheath around the axons of neurons.

The exosomes transport protective proteins such as

  • heat shock proteins,
  • glycolytic enzymes, and
  • enzymes that reduce oxidative stress from one cell type to another,
  • but also transmit genetic information in the form of ribonucleic acids.

“As we have now discovered in cell cultures, exosomes seem to have a whole range of functions,” explained Dr. Eva-Maria Krmer-Albers. By means of their transmission activity, the small bubbles that are the vesicles

  • not only promote electrical activity in the nerve cells, but also
  • influence them on the biochemical and gene regulatory level.

“The extent of activities of the exosomes is impressive,” added Krmer-Albers. The researchers hope that the understanding of these processes will contribute to the development of new strategies for the treatment of neuronal diseases. Their next aim is to uncover how vesicles actually function in the brains of living organisms.

http://labroots.com/user/news/article/id/217438/title/vesicles-influence-function-of-nerve-cells

The above story is based on materials provided by Universitt Mainz.

Universitt Mainz. “Vesicles influence function of nerve cells.” ScienceDaily. ScienceDaily, 6 October 2014. www.sciencedaily.com/releases/2014/10/141006174214.htm

Neuroscientists use snail research to help explain “chemo brain”

10/08/2014
It is estimated that as many as half of patients taking cancer drugs experience a decrease in mental sharpness. While there have been many theories, what causes “chemo brain” has eluded scientists.

In an effort to solve this mystery, neuroscientists at The University of Texas Health Science Center at Houston (UTHealth) conducted an experiment in an animal memory model and their results point to a possible explanation. Findings appeared in The Journal of Neuroscience.

In the study involving a sea snail that shares many of the same memory mechanisms as humans and a drug used to treat a variety of cancers, the scientists identified

  • memory mechanisms blocked by the drug.

Then, they were able to counteract or

  • unblock the mechanisms by administering another agent.

“Our research has implications in the care of people given to cognitive deficits following drug treatment for cancer,” said John H. “Jack” Byrne, Ph.D., senior author, holder of the June and Virgil Waggoner Chair and Chairman of the Department of Neurobiology and Anatomy at the UTHealth Medical School. “There is no satisfactory treatment at this time.”

Byrne’s laboratory is known for its use of a large snail called Aplysia californica to further the understanding of the biochemical signaling among nerve cells (neurons).  The snails have large neurons that relay information much like those in humans.

When Byrne’s team compared cell cultures taken from normal snails to

  • those administered a dose of a cancer drug called doxorubicin,

the investigators pinpointed a neuronal pathway

  • that was no longer passing along information properly.

With the aid of an experimental drug,

  • the scientists were able to reopen the pathway.

Unfortunately, this drug would not be appropriate for humans, Byrne said. “We want to identify other drugs that can rescue these memory mechanisms,” he added.

According the American Cancer Society, some of the distressing mental changes cancer patients experience may last a short time or go on for years.

Byrne’s UT Health research team includes co-lead authors Rong-Yu Liu, Ph.D., and Yili Zhang, Ph.D., as well as Brittany Coughlin and Leonard J. Cleary, Ph.D. All are affiliated with the W.M. Keck Center for the Neurobiology of Learning and Memory.

Byrne and Cleary also are on the faculty of The University of Texas Graduate School of Biomedical Sciences at Houston. Coughlin is a student at the school, which is jointly operated by UT Health and The University of Texas MD Anderson Cancer Center.

The study titled “Doxorubicin Attenuates Serotonin-Induced Long-Term Synaptic Facilitation by Phosphorylation of p38 Mitogen-Activated Protein Kinase” received support from National Institutes of Health grant (NS019895) and the Zilkha Family Discovery Fellowship.

Doxorubicin Attenuates Serotonin-Induced Long-Term Synaptic Facilitation by Phosphorylation of p38 Mitogen-Activated Protein Kinase

Source: Univ. of Texas Health Science Center at Houston

http://www.rdmag.com/news/2014/10/neuroscientists-use-snail-research-help-explain-E2_9_Cchemo-brain

Doxorubicin Attenuates Serotonin-Induced Long-Term Synaptic Facilitation by Phosphorylation of p38 Mitogen-Activated Protein Kinase

Rong-Yu Liu*,  Yili Zhang*,  Brittany L. Coughlin,  Leonard J. Cleary, and  John H. Byrne   +Show Affiliations
The Journal of Neuroscience, 1 Oct 2014, 34(40): 13289-13300;
http://dx.doi.org:/10.1523/JNEUROSCI.0538-14.2014

Doxorubicin (DOX) is an anthracycline used widely for cancer chemotherapy. Its primary mode of action appears to be

  • topoisomerase II inhibition, DNA cleavage, and free radical generation.

However, in non-neuronal cells, DOX also inhibits the expression of

  • dual-specificity phosphatases (also referred to as MAPK phosphatases) and thereby
  1. inhibits the dephosphorylation of extracellular signal-regulated kinase (ERK) and
  2. p38 mitogen-activated protein kinase (p38 MAPK),
  3. two MAPK isoforms important for long-term memory (LTM) formation.

Activation of these kinases by DOX in neurons, if present,

  • could have secondary effects on cognitive functions, such as learning and memory.

The present study used cultures of rat cortical neurons and sensory neurons (SNs) of Aplysia

  • to examine the effects of DOX on levels of phosphorylated ERK (pERK) and
  • phosphorylated p38 (p-p38) MAPK.

In addition, Aplysia neurons were used to examine the effects of DOX on

  • long-term enhanced excitability, long-term synaptic facilitation (LTF), and
  • long-term synaptic depression (LTD).

DOX treatment led to elevated levels of

  • pERK and p-p38 MAPK in SNs and cortical neurons.

In addition, it increased phosphorylation of

  • the downstream transcriptional repressor cAMP response element-binding protein 2 in SNs.

DOX treatment blocked serotonin-induced LTF and enhanced LTD induced by the neuropeptide Phe-Met-Arg-Phe-NH2. The block of LTF appeared to be attributable to

  • overriding inhibitory effects of p-p38 MAPK, because
  • LTF was rescued in the presence of an inhibitor of p38 MAPK
    (SB203580 [4-(4-fluorophenyl)-2-(4-methylsulfinylphenyl)-5-(4-pyridyl)-1H-imidazole]) .

These results suggest that acute application of DOX might impair the formation of LTM via the p38 MAPK pathway.
Terms: Aplysia chemotherapy ERK  p38 MAPK serotonin synaptic plasticity

Technology that controls brain cells with radio waves earns early BRAIN grant

10/08/2014

bright spots = cells with increased calcium after treatment with radio waves,  allows neurons to fire

bright spots = cells with increased calcium after treatment with radio waves, allows neurons to fire

BRAIN control: The new technology uses radio waves to activate or silence cells remotely. The bright spots above represent cells with increased calcium after treatment with radio waves, a change that would allow neurons to fire.

A proposal to develop a new way to

  • remotely control brain cells

from Sarah Stanley, a research associate in Rockefeller University’s Laboratory of Molecular Genetics, headed by Jeffrey M. Friedman, is

  • among the first to receive funding from U.S. President Barack Obama’s BRAIN initiative.

The project will make use of a technique called

  • radiogenetics that combines the use of radio waves or magnetic fields with
  • nanoparticles to turn neurons on or off.

The National Institutes of Health is one of four federal agencies involved in the BRAIN (Brain Research through Advancing Innovative Neurotechnologies) initiative. Following in the ambitious footsteps of the Human Genome Project, the BRAIN initiative seeks

  • to create a dynamic map of the brain in action,

a goal that requires the development of new technologies. The BRAIN initiative working group, which outlined the broad scope of the ambitious project, was co-chaired by Rockefeller’s Cori Bargmann, head of the Laboratory of Neural Circuits and Behavior.

Stanley’s grant, for $1.26 million over three years, is one of 58 projects to get BRAIN grants, the NIH announced. The NIH’s plan for its part of this national project, which has been pitched as “America’s next moonshot,” calls for $4.5 billion in federal funds over 12 years.

The technology Stanley is developing would

  • enable researchers to manipulate the activity of neurons, as well as other cell types,
  • in freely moving animals in order to better understand what these cells do.

Other techniques for controlling selected groups of neurons exist, but her new nanoparticle-based technique has a

  • unique combination of features that may enable new types of experimentation.
  • it would allow researchers to rapidly activate or silence neurons within a small area of the brain or
  • dispersed across a larger region, including those in difficult-to-access locations.

Stanley also plans to explore the potential this method has for use treating patients.

“Francis Collins, director of the NIH, has discussed

  • the need for studying the circuitry of the brain,
  • which is formed by interconnected neurons.

Our remote-control technology may provide a tool with which researchers can ask new questions about the roles of complex circuits in regulating behavior,” Stanley says.
Rockefeller University’s Laboratory of Molecular Genetics
Source: Rockefeller Univ.

Part 4.  Cancer

Two Proteins Found to Block Cancer Metastasis

Why do some cancers spread while others don’t? Scientists have now demonstrated that

  • metastatic incompetent cancers actually “poison the soil”
  • by generating a micro-environment that blocks cancer cells
  • from settling and growing in distant organs.

The “seed and the soil” hypothesis proposed by Stephen Paget in 1889 is now widely accepted to explain how

  • cancer cells (seeds) are able to generate fertile soil (the micro-environment)
  • in distant organs that promotes cancer’s spread.

However, this concept had not explained why some tumors do not spread or metastasize.

The researchers, from Weill Cornell Medical College, found that

  • two key proteins involved in this process work by
  • dramatically suppressing cancer’s spread.

The study offers hope that a drug based on these

  • potentially therapeutic proteins, prosaposin and Thrombospondin 1 (Tsp-1),

might help keep human cancer at bay and from metastasizing.

Scientists don’t understand why some tumors wouldn’t “want” to spread. It goes against their “job description,” says the study’s senior investigator, Vivek Mittal, Ph.D., an associate professor of cell and developmental biology in cardiothoracic surgery and director of the Neuberger Berman Foundation Lung Cancer Laboratory at Weill Cornell Medical College. He theorizes that metastasis occurs when

  • the barriers that the body throws up to protect itself against cancer fail.

But there are some tumors in which some of the barriers may still be intact. “So that suggests

  • those primary tumors will continue to grow, but that
  • an innate protective barrier still exists that prevents them from spreading and invading other organs,”

The researchers found that, like typical tumors,

  • metastasis-incompetent tumors also send out signaling molecules
  • that establish what is known as the “premetastatic niche” in distant organs.

These niches composed of bone marrow cells and various growth factors have been described previously by others including Dr. Mittal as the fertile “soil” that the disseminated cancer cell “seeds” grow in.

Weill Cornell’s Raúl Catena, Ph.D., a postdoctoral fellow in Dr. Mittal’s laboratory, found an important difference between the tumor types. Metastatic-incompetent tumors

  • systemically increased expression of Tsp-1, a molecule known to fight cancer growth.
  • increased Tsp-1 production was found specifically in the bone marrow myeloid cells
  • that comprise the metastatic niche.

These results were striking, because for the first time Dr. Mittal says

  • the bone marrow-derived myeloid cells were implicated as
  • the main producers of Tsp-1,.

In addition, Weill Cornell and Harvard researchers found that

  • prosaposin secreted predominantly by the metastatic-incompetent tumors
  • increased expression of Tsp-1 in the premetastatic lungs.

Thus, Dr. Mittal posits that prosaposin works in combination with Tsp-1

  • to convert pro-metastatic bone marrow myeloid cells in the niche
  • into cells that are not hospitable to cancer cells that spread from a primary tumor.
  • “The very same myeloid cells in the niche that we know can promote metastasis
  • can also be induced under the command of the metastatic incompetent primary tumor to inhibit metastasis,”

The research team found that

  • the Tsp-1–inducing activity of prosaposin
  • was contained in only a 5-amino acid peptide region of the protein, and
  • this peptide alone induced Tsp-1 in the bone marrow cells and
  • effectively suppressed metastatic spread in the lungs
  • in mouse models of breast and prostate cancer.

This 5-amino acid peptide with Tsp-1–inducing activity

  • has the potential to be used as a therapeutic agent against metastatic cancer,

The scientists have begun to test prosaposin in other tumor types or metastatic sites.

Dr. Mittal says that “The clinical implications of the study are:

  • “Not only is it theoretically possible to design a prosaposin-based drug or drugs
  • that induce Tsp-1 to block cancer spread, but
  • you could potentially create noninvasive prognostic tests
  • to predict whether a cancer will metastasize.”

The study was reported in the April 30 issue of Cancer Discovery, in a paper titled “Bone Marrow-Derived Gr1+ Cells Can Generate a Metastasis-Resistant Microenvironment Via Induced Secretion of Thrombospondin-1”.

Disabling Enzyme Cripples Tumors, Cancer Cells

First Step of Metastasis

First Step of Metastasis

Published: Sep 05, 2013  http://www.technologynetworks.com/Metabolomics/news.aspx?id=157138

Knocking out a single enzyme dramatically cripples the ability of aggressive cancer cells to spread and grow tumors.

The paper, published in the journal Proceedings of the National Academy of Sciences, sheds new light on the importance of lipids, a group of molecules that includes fatty acids and cholesterol, in the development of cancer.

Researchers have long known that cancer cells metabolize lipids differently than normal cells. Levels of ether lipids – a class of lipids that are harder to break down – are particularly elevated in highly malignant tumors.

“Cancer cells make and use a lot of fat and lipids, and that makes sense because cancer cells divide and proliferate at an accelerated rate, and to do that,

  • they need lipids, which make up the membranes of the cell,”

said study principal investigator Daniel Nomura, assistant professor in UC Berkeley’s Department of Nutritional Sciences and Toxicology. “Lipids have a variety of uses for cellular structure, but what we’re showing with our study is that

  • lipids can send signals that fuel cancer growth.”

In the study, Nomura and his team tested the effects of reducing ether lipids on human skin cancer cells and primary breast tumors. They targeted an enzyme,

  • alkylglycerone phosphate synthase, or AGPS,
  • known to be critical to the formation of ether lipids.

The researchers confirmed that

  1. AGPS expression increased when normal cells turned cancerous.
  2. inactivating AGPS substantially reduced the aggressiveness of the cancer cells.

“The cancer cells were less able to move and invade,” said Nomura.

The researchers also compared the impact of

  • disabling the AGPS enzyme in mice that had been injected with cancer cells.

Nomura. observes -“Among the mice that had the AGPS enzyme inactivated,

  • the tumors were nonexistent,”

“The mice that did not have this enzyme

  • disabled rapidly developed tumors.”

The researchers determined that

  • inhibiting AGPS expression depleted the cancer cells of ether lipids.
  • AGPS altered levels of other types of lipids important to the ability of the cancer cells to survive and spread, including
    • prostaglandins and acyl phospholipids.

“What makes AGPS stand out as a treatment target is that the enzyme seems to simultaneously

  • regulate multiple aspects of lipid metabolism
  • important for tumor growth and malignancy.”

Future steps include the

  • development of AGPS inhibitors for use in cancer therapy,

“This study sheds considerable light on the important role that AGPS plays in ether lipid metabolism in cancer cells, and it suggests that

  • inhibitors of this enzyme could impair tumor formation,”

said Benjamin Cravatt, Professor and Chair of Chemical Physiology at The Scripps Research Institute, who is not part of the UC.

Agilent Technologies Thought Leader Award Supports Translational Research Program
Published: Mon, March 04, 2013

The award will support Dr DePinho’s research into

  • metabolic reprogramming in the earliest stages of cancer.

Agilent Technologies Inc. announces that Dr. Ronald A. DePinho, a world-renowned oncologist and researcher, has received an Agilent Thought Leader Award.

DePinho is president of the University of Texas MD Anderson Cancer Center. DePinho and his team hope to discover and characterize

  • alterations in metabolic flux during tumor initiation and maintenance, and to identify biomarkers for early detection of pancreatic cancer together with
  • novel therapeutic targets.

Researchers on his team will work with scientists from the university’s newly formed Institute of Applied Cancer Sciences.

The Agilent Thought Leader Award provides funds to support personnel as well as a state-of-the-art Agilent 6550 iFunnel Q-TOF LC/MS system.

“I am extremely pleased to receive this award for metabolomics research, as the survival rates for pancreatic cancer have not significantly improved over the past 20 years,” DePinho said. “This technology will allow us to

  • rapidly identify new targets that drive the formation, progression and maintenance of pancreatic cancer.

Discoveries from this research will also lead to

  • the development of effective early detection biomarkers and novel therapeutic interventions.”

“We are proud to support Dr. DePinho’s exciting translational research program, which will make use of

  • metabolomics and integrated biology workflows and solutions in biomarker discovery,”

said Patrick Kaltenbach, Agilent vice president, general manager of the Liquid Phase Division, and the executive sponsor of this award.

The Agilent Thought Leader Program promotes fundamental scientific advances by support of influential thought leaders in the life sciences and chemical analysis fields.

The covalent modifier Nedd8 is critical for the activation of Smurf1 ubiquitin ligase in tumorigenesis

Ping Xie, Minghua Zhang, Shan He, Kefeng Lu, Yuhan Chen, Guichun Xing, et al.
Nature Communications
  2014; 5(3733).  http://dx.doi.org:/10.1038/ncomms4733

Neddylation, the covalent attachment of ubiquitin-like protein Nedd8, of the Cullin-RING E3 ligase family

  • regulates their ubiquitylation activity.

However, regulation of HECT ligases by neddylation has not been reported to date. Here we show that

  • the C2-WW-HECT ligase Smurf1 is activated by neddylation.

Smurf1 physically interacts with

  1. Nedd8 and Ubc12,
  2. forms a Nedd8-thioester intermediate, and then
  3. catalyses its own neddylation on multiple lysine residues.

Intriguingly, this autoneddylation needs

  • an active site at C426 in the HECT N-lobe.

Neddylation of Smurf1 potently enhances

  • ubiquitin E2 recruitment and
  • augments the ubiquitin ligase activity of Smurf1.

The regulatory role of neddylation

  • is conserved in human Smurf1 and yeast Rsp5.

Furthermore, in human colorectal cancers,

  • the elevated expression of Smurf1, Nedd8, NAE1 and Ubc12
  • correlates with cancer progression and poor prognosis.

These findings provide evidence that

  • neddylation is important in HECT ubiquitin ligase activation and
  • shed new light on the tumour-promoting role of Smurf1.
 Swinging domains in HECT E3

Swinging domains in HECT E3

Subject terms: Biological sciences Cancer Cell biology

Figure 1: Smurf1 expression is elevated in colorectal cancer tissues.

Smurf1 expression is elevated in colorectal cancer tissues.

Smurf1 expression is elevated in colorectal cancer tissues.

(a) Smurf1 expression scores are shown as box plots, with the horizontal lines representing the median; the bottom and top of the boxes representing the 25th and 75th percentiles, respectively; and the vertical bars representing the ra

Figure 2: Positive correlation of Smurf1 expression with Nedd8 and its interacting enzymes in colorectal cancer.

Positive correlation of Smurf1 expression with Nedd8 and its interacting enzymes in colorectal cancer

Positive correlation of Smurf1 expression with Nedd8 and its interacting enzymes in colorectal cancer

(a) Representative images from immunohistochemical staining of Smurf1, Ubc12, NAE1 and Nedd8 in the same colorectal cancer tumour. Scale bars, 100 μm. (b–d) The expression scores of Nedd8 (b, n=283 ), NAE1 (c, n=281) and Ubc12 (d, n=19…

Figure 3: Smurf1 interacts with Ubc12.

Smurf1 interacts with Ubc12

Smurf1 interacts with Ubc12

(a) GST pull-down assay of Smurf1 with Ubc12. Both input and pull-down samples were subjected to immunoblotting with anti-His and anti-GST antibodies. Smurf1 interacted with Ubc12 and UbcH5c, but not with Ubc9. (b) Mapping the regions…

Figure 4: Nedd8 is attached to Smurf1through C426-catalysed autoneddylation.

Nedd8 is attached to Smurf1through C426-catalysed autoneddylation

Nedd8 is attached to Smurf1through C426-catalysed autoneddylation

(a) Covalent neddylation of Smurf1 in vitro.Purified His-Smurf1-WT or C699A proteins were incubated with Nedd8 and Nedd8-E1/E2. Reactions were performed as described in the Methods section. Samples were analysed by western blotting wi…

Figure 5: Neddylation of Smurf1 activates its ubiquitin ligase activity.

Neddylation of Smurf1 activates its ubiquitin ligase activity.

Neddylation of Smurf1 activates its ubiquitin ligase activity.

(a) In vivo Smurf1 ubiquitylation assay. Nedd8 was co-expressed with Smurf1 WT or C699A in HCT116 cells (left panels). Twenty-four hours post transfection, cells were treated with MG132 (20 μM, 8 h). HCT116 cells were transfected with…

http://www.nature.com/ncomms/2014/140513/ncomms4733/carousel/ncomms4733-f1.jpg

http://www.nature.com/ncomms/2014/140513/ncomms4733/carousel/ncomms4733-f2.jpg

http://www.nature.com/ncomms/2014/140513/ncomms4733/carousel/ncomms4733-f3.jpg

http://www.nature.com/ncomms/2014/140513/ncomms4733/carousel/ncomms4733-f4.jpg

http://www.nature.com/ncomms/2014/140513/ncomms4733/carousel/ncomms4733-f5.jpg

http://www.nature.com/ncomms/2014/140513/ncomms4733/carousel/ncomms4733-f6.jpg

http://www.nature.com/ncomms/2014/140513/ncomms4733/carousel/ncomms4733-f7.jpg

http://www.nature.com/ncomms/2014/140513/ncomms4733/carousel/ncomms4733-f8.jpg

The deubiquitylase USP33 discriminates between RALB functions in autophagy and innate immune response

M Simicek, S Lievens, M Laga, D Guzenko, VN. Aushev, et al.
Nature Cell Biology 2013; 15, 1220–1230    http://dx.doi.org:/10.1038/ncb2847

The RAS-like GTPase RALB mediates cellular responses to nutrient availability or viral infection by respectively

  • engaging two components of the exocyst complex, EXO84 and SEC5.
  1. RALB employs SEC5 to trigger innate immunity signalling, whereas
  2. RALB–EXO84 interaction induces autophagocytosis.

How this differential interaction is achieved molecularly by the RAL GTPase remains unknown.

We found that whereas GTP binding

  • turns on RALB activity,

ubiquitylation of RALB at Lys 47

  • tunes its activity towards a particular effector.

Specifically, ubiquitylation at Lys 47

  • sterically inhibits RALB binding to EXO84, while
  • facilitating its interaction with SEC5.

Double-stranded RNA promotes

  • RALB ubiquitylation and
  • SEC5–TBK1 complex formation.

In contrast, nutrient starvation

  • induces RALB deubiquitylation
  • by accumulation and relocalization of the deubiquitylase USP33
  • to RALB-positive vesicles.

Deubiquitylated RALB

  • promotes the assembly of the RALB–EXO84–beclin-1 complexes
  • driving autophagosome formation. Thus,
  • ubiquitylation within the effector-binding domain
  • provides the switch for the dual functions of RALB in
    • autophagy and innate immune responses.

Part 5. Metabolic Syndrome

Single Enzyme is Necessary for Development of Diabetes

Published: Aug 20, 2014 http://www.technologynetworks.com/Metabolomics/news.aspx?ID=169416

12-LO enzyme promotes the obesity-induced oxidative stress in the pancreatic cells.

An enzyme called 12-LO promotes the obesity-induced oxidative stress in the pancreatic cells that leads

  • to pre-diabetes, and diabetes.

12-LO’s enzymatic action is the last step in

  • the production of certain small molecules that harm the cell,

according to a team from Indiana University School of Medicine, Indianapolis.

The findings will enable the development of drugs that can interfere with this enzyme, preventing or even reversing diabetes. The research is published ahead of print in the journal Molecular and Cellular Biology.

In earlier studies, these researchers and their collaborators at Eastern Virginia Medical School showed that

  • 12-LO (which stands for 12-lipoxygenase) is present in these cells
  • only in people who become overweight.

The harmful small molecules resulting from 12-LO’s enzymatic action are known as HETEs, short for hydroxyeicosatetraenoic acid.

  1. HETEs harm the mitochondria, which then
  2. fail to produce sufficient energy to enable
  3. the pancreatic cells to manufacture the necessary quantities of insulin.

For the study, the investigators genetically engineered mice that

  • lacked the gene for 12-LO exclusively in their pancreas cells.

Mice were either fed a low-fat or high-fat diet.

Both the control mice and the knockout mice on the high fat diet

  • developed obesity and insulin resistance.

The investigators also examined the pancreatic beta cells of both knockout and control mice, using both microscopic studies and molecular analysis. Those from the knockout mice were intact and healthy, while

  • those from the control mice showed oxidative damage,
  • demonstrating that 12-LO and the resulting HETEs
  • caused the beta cell failure.

Mirmira notes that fatty diet used in the study was the Western Diet, which comprises mostly saturated-“bad”-fats. Based partly on a recent study of related metabolic pathways, he says that

  • the unsaturated and mono-unsaturated fats-which comprise most fats in the healthy,
  • relatively high fat Mediterranean diet-are unlikely to have the same effects.

“Our research is the first to show that 12-LO in the beta cell

  • is the culprit in the development of pre-diabetes, following high fat diets,” says Mirmira.

“Our work also lends important credence to the notion that

  • the beta cell is the primary defective cell in virtually all forms of diabetes and pre-diabetes.”

A New Player in Lipid Metabolism Discovered

Published: Aug18, 2014  http://www.technologynetworks.com/Metabolomics/news.aspx?ID=169356

Specially engineered mice gained no weight, and normal counterparts became obese

  • on the same high-fat, obesity-inducing Western diet.

Specially engineered mice that lacked a particular gene did not gain weight

  • when fed a typical high-fat, obesity-inducing Western diet.

Yet, these mice ate the same amount as their normal counterparts that became obese.

The mice were engineered with fat cells that lacked a gene called SEL1L,

  • known to be involved in the clearance of mis-folded proteins
  • in the cell’s protein making machinery called the endoplasmic reticulum (ER).

When mis-folded proteins are not cleared but accumulate,

  • they destroy the cell and contribute to such diseases as
  1. mad cow disease,
  2. Type 1 diabetes and
  3. cystic fibrosis.

“The million-dollar question is why don’t these mice gain weight? Is this related to its inability to clear mis-folded proteins in the ER?” said Ling Qi, associate professor of molecular and biochemical nutrition and senior author of the study published online July 24 in Cell Metabolism. Haibo Sha, a research associate in Qi’s lab, is the paper’s lead author.

Interestingly, the experimental mice developed a host of other problems, including

  • postprandial hypertriglyceridemia,
  • and fatty livers.

“Although we are yet to find out whether these conditions contribute to the lean phenotype, we found that

  • there was a lipid partitioning defect in the mice lacking SEL1L in fat cells,
  • where fat cells cannot store fat [lipids], and consequently
  • fat goes to the liver.

During the investigation of possible underlying mechanisms, we discovered

  • a novel function for SEL1L as a regulator of lipid metabolism,” said Qi.

Sha said “We were very excited to find that

  • SEL1L is required for the intracellular trafficking of
  • lipoprotein lipase (LPL), acting as a chaperone,” .

and added that “Using several tissue-specific knockout mouse models,

  • we showed that this is a general phenomenon,”

Without LPL, lipids remain in the circulation;

  • fat and muscle cells cannot absorb fat molecules for storage and energy combustion,

People with LPL mutations develop

  • postprandial hypertriglyceridemia similar to
  • conditions found in fat cell-specific SEL1L-deficient mice, said Qi.

Future work will investigate the

  • role of SEL1L in human patients carrying LPL mutations and
  • determine why fat cell-specific SEL1L-deficient mice remain lean under Western diets, said Sha.

Co-authors include researchers from Cedars-Sinai Medical Center in Los Angeles; Wageningen University in the Netherlands; Georgia State University; University of California, Los Angeles; and the Medical College of Soochow University in China.

The study was funded by the U.S. National Institutes of Health, the Netherlands Organization for Health Research and Development National Institutes of Health, the Cedars-Sinai Medical Center, Chinese National Science Foundation, the American Diabetes Association, Cornell’s Center for Vertebrate Genomics and the Howard Hughes Medical Institute.

Part 6. Biomarkers

Biomarkers Take Center Stage

Josh P. Roberts
GEN May 1, 2013 (Vol. 33, No. 9)  http://www.genengnews.com/

While work with biomarkers continues to grow, scientists are also grappling with research-related bottlenecks, such as

  1. affinity reagent development,
  2. platform reproducibility, and
  3. sensitivity.

Biomarkers by definition indicate some state or process that generally occurs

  • at a spatial or temporal distance from the marker itself, and

it would not be an exaggeration to say that biomedicine has become infatuated with them:

  1. where to find them,
  2. when they may appear,
  3. what form they may take, and
  4. how they can be used to diagnose a condition or
  5. predict whether a therapy may be successful.

Biomarkers are on the agenda of many if not most industry gatherings, and in cases such as Oxford Global’s recent “Biomarker Congress” and the GTC “Biomarker Summit”, they hold the naming rights. There, some basic principles were built upon, amended, and sometimes challenged.

In oncology, for example, biomarker discovery is often predicated on the premise that

  • proteins shed from a tumor will traverse to and persist in, and be detectable in, the circulation.

By quantifying these proteins—singularly or as part of a larger “signature”—the hope is

  1. to garner information about the molecular characteristics of the cancer
  2. that will help with cancer detection and
  3. personalization of the treatment strategy.

Yet this approach has not yet turned into the panacea that was hoped for. Bottlenecks exist in

  • affinity reagent development,
  • platform reproducibility, and
  • sensitivity.

There is also a dearth of understanding of some of the

  • fundamental principles of biomarker biology that we need to know the answers to,

said Parag Mallick, Ph.D., whose lab at Stanford University is “working on trying to understand where biomarkers come from.”

There are dogmas saying that

  • circulating biomarkers come solely from secreted proteins.

But Dr. Mallick’s studies indicate that fully

  • 50% of circulating proteins may come from intracellular sources or
  • proteins that are annotated as such.

“We don’t understand the processes governing

  • which tumor-derived proteins end up in the blood.”

Other questions include “how does the size of a tumor affect how much of a given protein will be in the blood?”—perhaps

  • the tumor is necrotic at the center, or
  • it’s hypervascular or hypovascular.

He points out “The problem is that these are highly nonlinear processes at work, and

  • there is a large number of factors that might affect the answer to that question,” .

Their research focuses on using

  1. mass spectrometry and
  2. computational analysis
  • to characterize the biophysical properties of the circulating proteome, and
  • relate these to measurements made of the tumor itself.

Furthermore, he said – “We’ve observed that the proteins that are likely to

  • first show up and persist in the circulation, ..
  • are more stable than proteins that don’t,”
  • “we can quantify how significant the effect is.”

The goal is ultimately to be able to

  1. build rigorous, formal mathematical models that will allow something measured in the blood
  2. to be tied back to the molecular biology taking place in the tumor.

And conversely, to use those models

  • to predict from a tumor what will be found in the circulation.

“Ultimately, the models will allow you to connect the dots between

  • what you measure in the blood and the biology of the tumor.”

Bound for Affinity Arrays

Affinity reagents are the main tools for large-scale protein biomarker discovery. And while this has tended to mean antibodies (or their derivatives), other affinity reagents are demanding a place in the toolbox.

Affimers, a type of affinity reagent being developed by Avacta, consist of

  1. a biologically inert, biophysically stable protein scaffold
  2. containing three variable regions into which
  3. distinct peptides are inserted.

The resulting three-dimensional surface formed by these peptides

  • interacts and binds to proteins and other molecules in solution,
  • much like the antigen-binding site of antibodies.

Unlike antibodies, Affimers are relatively small (13 KDa),

  • non-post-translationally modified proteins
  • that can readily be expressed in bacterial culture.

They may be made to bind surfaces through unique residues

  • engineered onto the opposite face of the Affimer,
  • allowing the binding site to be exposed to the target in solution.

“We don’t seem to see in what we’ve done so far

  • any real loss of activity or functionality of Affimers when bound to surfaces—

they’re very robust,” said CEO Alastair Smith, Ph.D.

Avacta is taking advantage of this stability and its large libraries of Affimers to develop

  • very large affinity microarrays for
  • drug and biomarker discovery.

To date they have printed arrays with around 20–25,000 features, and Dr. Smith is “sure that we can get toward about 50,000 on a slide,” he said. “There’s no real impediment to us doing that other than us expressing the proteins and getting on with it.”

Customers will be provided with these large, complex “naïve” discovery arrays, readable with standard equipment. The plan is for the company to then “support our customers by providing smaller arrays with

  • the Affimers that are binding targets of interest to them,” Dr. Smith foretold.

And since the intellectual property rights are unencumbered,

  • Affimers in those arrays can be licensed to the end users
  • to develop diagnostics that can be validated as time goes on.

Around 20,000-Affimer discovery arrays were recently tested by collaborator Professor Ann Morgan of the University of Leeds with pools of unfractionated serum from patients with symptoms of inflammatory disease. The arrays

  • “rediscovered” elevated C-reactive protein (CRP, the clinical gold standard marker)
  • as well as uncovered an additional 22 candidate biomarkers.
  • other candidates combined with CRP, appear able to distinguish between different diseases such as
  1. rheumatoid arthritis,
  2. psoriatic arthritis,
  3. SLE, or
  4. giant cell arteritis.

Epigenetic Biomarkers

Methylation of adenine

Sometimes biomarkers are used not to find disease but

  • to distinguish healthy human cell types, with
  •  examples being found in flow cytometry and immunohistochemistry.

These widespread applications, however, are difficult to standardize, being

  • subject to arbitrary or subjective gating protocols and other imprecise criteria.

Epiontis instead uses an epigenetic approach. “What we need is a unique marker that is

  • demethylated only in one cell type and
  • methylated in all the other cell types,”

Each cell of the right cell type will have

  • two demethylated copies of a certain gene locus,
  • allowing them to be enumerated by quantitative PCR.

The biggest challenge is finding that unique epigenetic marker. To do so they look through the literature for proteins and genes described as playing a role in the cell type’s biology, and then

  • look at the methylation patterns to see if one can be used as a marker,

They also “use customized Affymetrix chips to look at the

  • differential epigenetic status of different cell types on a genomewide scale.”

explained CBO and founder Ulrich Hoffmueller, Ph.D.

The company currently has a panel of 12 assays for 12 immune cell types. Among these is an assay for

  • regulatory T (Treg) cells that queries the Foxp3 gene—which is uniquely demethylated in Treg
  • even though it is transiently expressed in activated T cells of other subtypes.

Also assayed are Th17 cells, difficult to detect by flow cytometry because

  • “the cells have to be stimulated in vitro,” he pointed out.

Developing New Assays for Cancer Biomarkers

Researchers at Myriad RBM and the Cancer Prevention Research Institute of Texas are collaborating to develop

  • new assays for cancer biomarkers on the Myriad RBM Multi-Analyte Profile (MAP) platform.

The release of OncologyMAP 2.0 expanded Myriad RBM’s biomarker menu to over 250 analytes, which can be measured from a small single sample, according to the company. Using this menu, L. Stephen et al., published a poster, “Analysis of Protein Biomarkers in Prostate and Colorectal Tumor Lysates,” which showed the results of

  • a survey of proteins relevant to colorectal (CRC) and prostate (PC) tumors
  • to identify potential proteins of interest for cancer research.

The study looked at CRC and PC tumor lysates and found that 102 of the 115 proteins showed levels above the lower limit of quantification.

  • Four markers were significantly higher in PC and 10 were greater in CRC.

For most of the analytes, duplicate sections of the tumor were similar, although some analytes did show differences. In four of the CRC analytes, tumor number four showed differences for CEA and tumor number 2 for uPA.

Thirty analytes were shown to be

  • different in CRC tumor compared to its adjacent tissue.
  • Ten of the analytes were higher in adjacent tissue compared to CRC.
  • Eighteen of the markers examined demonstrated  —-

significant correlations of CRC tumor concentration to serum levels.

“This suggests.. that the Oncology MAP 2.0 platform “provides a good method for studying changes in tumor levels because many proteins can be assessed with a very small sample.”

Clinical Test Development with MALDI-ToF

While there have been many attempts to translate results from early discovery work on the serum proteome into clinical practice, few of these efforts have progressed past the discovery phase.

Matrix-assisted laser desorption/ionization-time of flight (MALDI-ToF) mass spectrometry on unfractionated serum/plasma samples offers many practical advantages over alternative techniques, and does not require

  • a shift from discovery to development and commercialization platforms.

Biodesix claims it has been able to develop the technology into

  • a reproducible, high-throughput tool to
  • routinely measure protein abundance from serum/plasma samples.

“.. we improved data-analysis algorithms to

  • reproducibly obtain quantitative measurements of relative protein abundance from MALDI-ToF mass spectra.

Heinrich Röder, CTO points out that the MALDI-ToF measurements

  • are combined with clinical outcome data using
  • modern learning theory techniques
  • to define specific disease states
  • based on a patient’s serum protein content,”

The clinical utility of the identification of these disease states can be investigated through a retrospective analysis of differing sample sets. For example, Biodesix clinically validated its first commercialized serum proteomic test, VeriStrat®, in 85 different retrospective sample sets.

Röder adds that “It is becoming increasingly clear that

  • the patients whose serum is characterized as VeriStrat Poor show
  • consistently poor outcomes irrespective of
  1. tumor type,
  2. histology, or
  3. molecular tumor characteristics,”

MALDI-ToF mass spectrometry, in its standard implementation,

  • allows for the observation of around 100 mostly high-abundant serum proteins.

Further, “while this does not limit the usefulness of tests developed from differential expression of these proteins,

  • the discovery potential would be greatly enhanced
  • if we could probe deeper into the proteome
  • while not giving up the advantages of the MALDI-ToF approach,”

Biodesix reports that its new MALDI approach, Deep MALDI™, can perform

  • simultaneous quantitative measurement of more than 1,000 serum protein features (or peaks) from 10 µL of serum in a high-throughput manner.
  • it increases the observable signal noise ratio from a few hundred to over 50,000,
  • resulting in the observation of many lower-abundance serum proteins.

Breast cancer, a disease now considered to be a collection of many complexes of symptoms and signatures—the dominant ones are labeled Luminal A, Luminal B, Her2, and Basal— which suggests different prognose, and

  • these labels are considered too simplistic for understanding and managing a woman’s cancer.

Studies published in the past year have looked at

  1. somatic mutations,
  2. gene copy number aberrations,
  3. gene expression abnormalities,
  4. protein and miRNA expression, and
  5. DNA methylation,

coming up with a list of significantly mutated genes—hot spots—in different categories of breast cancers. Targeting these will inevitably be the focus of much coming research.

“We’ve been taking these large trials and profiling these on a variety of array or sequence platforms. We think we’ll get

  1. prognostic drivers
  2. predictive markers for taxanes and
  3. monoclonal antibodies and
  4. tamoxifen and aromatase inhibitors,”
    explained Brian Leyland-Jones, Ph.D., director of Edith Sanford Breast Cancer Research. “We will end up with 20–40 different diseases, maybe more.”

Edith Sanford Breast Cancer Research is undertaking a pilot study in collaboration with The Scripps Research Institute, using a variety of tests on 25 patients to see how the information they provide complements each other, the overall flow, and the time required to get and compile results.

Laser-captured tumor samples will be subjected to low passage whole-genome, exome, and RNA sequencing (with targeted resequencing done in parallel), and reverse-phase protein and phosphorylation arrays, with circulating nucleic acids and circulating tumor cells being queried as well. “After that we hope to do a 100- or 150-patient trial when we have some idea of the best techniques,” he said.

Dr. Leyland-Jones predicted that ultimately most tumors will be found

  • to have multiple drivers,
  • with most patients receiving a combination of two, three, or perhaps four different targeted therapies.

Reduce to Practice

According to Randox, the evidence Investigator is a sophisticated semi-automated biochip sys­tem designed for research, clinical, forensic, and veterinary applications.

Once biomarkers that may have an impact on therapy are discovered, it is not always routine to get them into clinical practice. Leaving regulatory and financial, intellectual property and cultural issues aside, developing a diagnostic based on a biomarker often requires expertise or patience that its discoverer may not possess.

Andrew Gribben is a clinical assay and development scientist at Randox Laboratories, based in Northern Ireland, U.K. The company utilizes academic and industrial collaborators together with in-house discovery platforms to identify biomarkers that are

  • augmented or diminished in a particular pathology
  • relative to appropriate control populations.

Biomarkers can be developed to be run individually or

  • combined into panels of immunoassays on its multiplex biochip array technology.

Specificity can also be gained—or lost—by the affinity of reagents in an assay. The diagnostic potential of Heart-type fatty acid binding protein (H-FABP) abundantly expressed in human myocardial cells was recognized by Jan Glatz of Maastricht University, The Netherlands, back in 1988. Levels rise quickly within 30 minutes after a myocardial infarction, peaking at 6–8 hours and return to normal within 24–30 hours. Yet at the time it was not known that H-FABP was a member of a multiprotein family, with which the polyclonal antibodies being used in development of an assay were cross-reacting, Gribben related.

Randox developed monoclonal antibodies specific to H-FABP, funded trials investigating its use alone, and multiplexed with cardiac biomarker assays, and, more than 30 years after the biomarker was identified, in 2011, released a validated assay for H-FABP as a biomarker for early detection of acute myocardial infarction.

Ultrasensitive Immunoassays for Biomarker Development

Research has shown that detection and monitoring of biomarker concentrations can provide

  • insights into disease risk and progression.

Cytokines have become attractive biomarkers and candidates

  • for targeted therapies for a number of autoimmune diseases, including rheumatoid arthritis (RA), Crohn’s disease, and psoriasis, among others.

However, due to the low-abundance of circulating cytokines, such as IL-17A, obtaining robust measurements in clinical samples has been difficult.

Singulex reports that its digital single-molecule counting technology provides

  • increased precision and detection sensitivity over traditional ELISA techniques,
  • helping to shed light on biomarker verification and validation programs.

The company’s Erenna® immunoassay system, which includes optimized immunoassays, offers LLoQ to femtogram levels per mL resolution—even in healthy populations, at an improvement of 1-3 fold over standard ELISAs or any conventional technology and with a dynamic range of up to 4-logs, according to a Singulex official, who adds that

  • this sensitivity improvement helps minimize undetectable samples that
  • could otherwise delay or derail clinical studies.

The official also explains that the Singulex solution includes an array of products and services that are being applied to a number of programs and have enabled the development of clinically relevant biomarkers, allowing translation from discovery to the clinic.

In a poster entitled “Advanced Single Molecule Detection: Accelerating Biomarker Development Utilizing Cytokines through Ultrasensitive Immunoassays,” a case study was presented of work performed by Jeff Greenberg of NYU to show how the use of the Erenna system can provide insights toward

  • improving the clinical utility of biomarkers and
  • accelerating the development of novel therapies for treating inflammatory diseases.

A panel of inflammatory biomarkers was examined in DMARD (disease modifying antirheumatic drugs)-naïve RA (rheumatoid arthritis) vs. knee OA (osteoarthritis) patient cohorts. Markers that exhibited significant differences in plasma concentrations between the two cohorts included

  • CRP, IL-6R alpha, IL-6, IL-1 RA, VEGF, TNF-RII, and IL-17A, IL-17F, and IL-17A/F.

Among the three tested isoforms of IL-17,

  • the magnitude of elevation for IL-17F in RA patients was the highest.

“Singulex provides high-resolution monitoring of baseline IL-17A concentrations that are present at low levels,” concluded the researchers. “The technology also enabled quantification of other IL-17 isoforms in RA patients, which have not been well characterized before.”

The Singulex Erenna System has also been applied to cardiovascular disease research, for which its

  • cardiac troponin I (cTnI) digital assay can be used to measure circulating
  • levels of cTnI undetectable by other commercial assays.

Recently presented data from Brigham and Women’s Hospital and the TIMI-22 study showed that

  • using the Singulex test to serially monitor cTnI helps
  • stratify risk in post-acute coronary syndrome patients and
  • can identify patients with elevated cTnI
  • who have the most to gain from intensive vs. moderate-dose statin therapy,

according to the scientists involved in the research.

The study poster, “Prognostic Performance of Serial High Sensitivity Cardiac Troponin Determination in Stable Ischemic Heart Disease: Analysis From PROVE IT-TIMI 22,” was presented at the 2013 American College of Cardiology (ACC) Annual Scientific Session & Expo by R. O’Malley et al.

Biomarkers Changing Clinical Medicine

Better Diagnosis, Prognosis, and Drug Targeting Are among Potential Benefits

  1. John Morrow Jr., Ph.D.

Researchers at EMD Chemicals are developing biomarker immunoassays

  • to monitor drug-induced toxicity including kidney damage.

The pace of biomarker development is accelerating as investigators report new studies on cancer, diabetes, Alzheimer disease, and other conditions in which the evaluation and isolation of workable markers is prominently featured.

Wei Zheng, Ph.D., leader of the R&D immunoassay group at EMD Chemicals, is overseeing a program to develop biomarker immunoassays to

  • monitor drug-induced toxicity, including kidney damage.

“One of the principle reasons for drugs failing during development is because of organ toxicity,” says Dr. Zheng.
“proteins liberated into the serum and urine can serve as biomarkers of adverse response to drugs, as well as disease states.”

Through collaborative programs with Rules-Based Medicine (RBM), the EMD group has released panels for the profiling of human renal impairment and renal toxicity. These urinary biomarker based products fit the FDA and EMEA guidelines for assessment of drug-induced kidney damage in rats.

The group recently performed a screen for potential protein biomarkers in relation to

  • kidney toxicity/damage on a set of urine and plasma samples
  • from patients with documented renal damage.

Additionally, Dr. Zheng is directing efforts to move forward with the multiplexed analysis of

  • organ and cellular toxicity.

Diseases thought to involve compromised oxidative phosphorylation include

  • diabetes, Parkinson and Alzheimer diseases, cancer, and the aging process itself.

Good biomarkers allow Dr. Zheng to follow the mantra, “fail early, fail fast.” With robust, multiplexible biomarkers, EMD can detect bad drugs early and kill them before they move into costly large animal studies and clinical trials. “Recognizing the severe liability that toxicity presents, we can modify the structure of the candidate molecule and then rapidly reassess its performance.”

Scientists at Oncogene Science a division of Siemens Healthcare Diagnostics, are also focused on biomarkers. “We are working on a number of antibody-based tests for various cancers, including a test for the Ca-9 CAIX protein, also referred to as carbonic anhydrase,” Walter Carney, Ph.D., head of the division, states.

CAIX is a transmembrane protein that is

  • overexpressed in a number of cancers, and, like Herceptin and the Her-2 gene,
  • can serve as an effective and specific marker for both diagnostic and therapeutic purposes.
  • It is liberated into the circulation in proportion to the tumor burden.

Dr. Carney and his colleagues are evaluating patients after tumor removal for the presence of the Ca-9 CAIX protein. If

  • the levels of the protein in serum increase over time,
  • this suggests that not all the tumor cells were removed and the tumor has metastasized.

Dr. Carney and his team have developed both an immuno-histochemistry and an ELISA test that could be used as companion diagnostics in clinical trials of CAIX-targeted drugs.

The ELISA for the Ca-9 CAIX protein will be used in conjunction with Wilex’ Rencarex®, which is currently in a

  • Phase III trial as an adjuvant therapy for non-metastatic clear cell renal cancer.

Additionally, Oncogene Science has in its portfolio an FDA-approved test for the Her-2 marker. Originally approved for Her-2/Neu-positive breast cancer, its indications have been expanded over time, and was approved

  • for the treatment of gastric cancer last year.

It is normally present on breast cancer epithelia but

  • overexpressed in some breast cancer tumors.

“Our products are designed to be used in conjunction with targeted therapies,” says Dr. Carney. “We are working with companies that are developing technology around proteins that are

  • overexpressed in cancerous tissues and can be both diagnostic and therapeutic targets.”

The long-term goal of these studies is to develop individualized therapies, tailored for the patient. Since the therapies are expensive, accurate diagnostics are critical to avoid wasting resources on patients who clearly will not respond (or could be harmed) by the particular drug.

“At this time the rate of response to antibody-based therapies may be very poor, as

  • they are often employed late in the course of the disease, and patients are in such a debilitated state
  • that they lack the capacity to react positively to the treatment,” Dr. Carney explains.

Nanoscale Real-Time Proteomics

Stanford University School of Medicine researchers, working with Cell BioSciences, have developed a

  • nanofluidic proteomic immunoassay that measures protein charge,
  • similar to immunoblots, mass spectrometry, or flow cytometry.
  • unlike these platforms, this approach can measure the amount of individual isoforms,
  • specifically, phosphorylated molecules.

“We have developed a nanoscale device for protein measurement, which I believe could be useful for clinical analysis,” says Dean W. Felsher, M.D., Ph.D., associate professor at Stanford University School of Medicine.

Critical oncogenic transformations involving

  • the activation of the signal-related kinases ERK-1 and ERK-2 can now be followed with ease.

“The fact that we measure nanoquantities with accuracy means that

  • we can interrogate proteomic profiles in clinical patients,

by drawing tiny needle aspirates from tumors over the course of time,” he explains.

“This allows us to observe the evolution of tumor cells and

  • their response to therapy
  • from a baseline of the normal tissue as a standard of comparison.”

According to Dr. Felsher, 20 cells is a large enough sample to obtain a detailed description. The technology is easy to automate, which allows

  • the inclusion of hundreds of assays.

Contrasting this technology platform with proteomic analysis using microarrays, Dr. Felsher notes that the latter is not yet workable for revealing reliable markers.

Dr. Felsher and his group published a description of this technology in Nature Medicine. “We demonstrated that we could take a set of human lymphomas and distinguish them from both normal tissue and other tumor types. We can

  • quantify changes in total protein, protein activation, and relative abundance of specific phospho-isoforms
  • from leukemia and lymphoma patients receiving targeted therapy.

Even with very small numbers of cells, we are able to show that the results are consistent, and

  • our sample is a random profile of the tumor.”

Splice Variant Peptides

“Aberrations in alternative splicing may generate

  • much of the variation we see in cancer cells,”

says Gilbert Omenn, Ph.D., director of the center for computational medicine and bioinformatics at the University of Michigan School of Medicine. Dr. Omenn and his colleague, Rajasree Menon, are

  • using this variability as a key to new biomarker identification.

It is becoming evident that splice variants play a significant role in the properties of cancer cells, including

  • initiation, progression, cell motility, invasiveness, and metastasis.

Alternative splicing occurs through multiple mechanisms

  • when the exons or coding regions of the DNA transcribe mRNA,
  • generating initiation sites and connecting exons in protein products.

Their translation into protein can result in numerous protein isoforms, and

  • these isoforms may reflect a diseased or cancerous state.

Regulatory elements within the DNA are responsible for selecting different alternatives; thus

  • the splice variants are tempting targets for exploitation as biomarkers.
Analyses of the splice-site mutation

Analyses of the splice-site mutation

Despite the many questions raised by these observations, splice variation in tumor material has not been widely studied. Cancer cells are known for their tremendous variability, which allows them to

  • grow rapidly, metastasize, and develop resistance to anticancer drugs.

Dr. Omenn and his collaborators used

  • mass spec data to interrogate a custom-built database of all potential mRNA sequences
  • to find alternative splice variants.

When they compared normal and malignant mammary gland tissue from a mouse model of Her2/Neu human breast cancers, they identified a vast number (608) of splice variant proteins, of which

  • peptides from 216 were found only in the tumor sample.

“These novel and known alternative splice isoforms

  • are detectable both in tumor specimens and in plasma and
  • represent potential biomarker candidates,” Dr. Omenn adds.

Dr. Omenn’s observations and those of his colleague Lewis Cantley, Ph.D., have also

  • shed light on the origins of the classic Warburg effect,
  • the shift to anaerobic glycolysis in tumor cells.

The novel splice variant M2, of muscle pyruvate kinase,

  • is observed in embryonic and tumor tissue.

It is associated with this shift, the result of

  • the expression of a peptide splice variant sequence.

It is remarkable how many different areas of the life sciences are tied into the phenomenon of splice variation. The changes in the genetic material can be much greater than point mutations, which have been traditionally considered to be the prime source of genetic variability.

“We now have powerful methods available to uncover a whole new category of variation,” Dr. Omenn says. “High-throughput RNA sequencing and proteomics will be complementary in discovery studies of splice variants.”

Splice variation may play an important role in rapid evolutionary changes, of the sort discussed by Susumu Ohno and Stephen J. Gould decades ago. They, and other evolutionary biologists, argued that

  • gene duplication, combined with rapid variability, could fuel major evolutionary jumps.

At the time, the molecular mechanisms of variation were poorly understood, but today

  • the tools are available to rigorously evaluate the role of
  • splice variation and other contributors to evolutionary change.

“Biomarkers derived from studies of splice variants, could, in the future, be exploited

  • both for diagnosis and prognosis and
  • for drug targeting of biological networks,
  • in situations such as the Her-2/Neu breast cancers,” Dr. Omenn says.

Aminopeptidase Activities

“By correlating the proteolytic patterns with disease groups and controls, we have shown that

  • exopeptidase activities contribute to the generation of not only cancer-specific
  • but also cancer type specific serum peptides.

according to Paul Tempst, Ph.D., professor and director of the Protein Center at the Memorial Sloan-Kettering Cancer Center.

So there is a direct link between peptide marker profiles of disease and differential protease activity.” For this reason Dr. Tempst argues that “the patterns we describe may have value as surrogate markers for detection and classification of cancer.”

To investigate this avenue, Dr. Tempst and his colleagues have followed

  • the relationship between exopeptidase activities and metastatic disease.

“We monitored controlled, de novo peptide breakdown in large numbers of biological samples using mass spectrometry, with relative quantitation of the metabolites,” Dr. Tempst explains. This entailed the use of magnetic, reverse-phase beads for analyte capture and a MALDI-TOF MS read-out.

“In biomarker discovery programs, functional proteomics is usually not pursued,” says Dr. Tempst. “For putative biomarkers, one may observe no difference in quantitative levels of proteins, while at the same time, there may be substantial differences in enzymatic activity.”

In a preliminary prostate cancer study, the team found a significant difference

  • in activity levels of exopeptidases in serum from patients with metastatic prostate cancer
  • as compared to primary tumor-bearing individuals and normal healthy controls.

However, there were no differences in amounts of the target protein, and this potential biomarker would have been missed if quantitative levels of protein had been the only criterion of selection.

It is frequently stated that “practical fusion energy is 30 years in the future and always will be.” The same might be said of functional, practical biomarkers that can pass muster with the FDA. But splice variation represents a new handle on this vexing problem. It appears that we are seeing the emergence of a new approach that may finally yield definitive diagnostic tests, detectable in serum and urine samples.

Part 7. Epigenetics and Drug Metabolism

DNA Methylation Rules: Studying Epigenetics with New Tools

The tools to unravel the epigenetic control mechanisms that influence how cells control access of transcriptional proteins to DNA are just beginning to emerge.

Patricia Fitzpatrick Dimond, Ph.D.

http://www.genengnews.com/media/images/AnalysisAndInsight/Feb7_2013_24454248_GreenPurpleDNA_EpigeneticsToolsII3576166141.jpg

New tools may help move the field of epigenetic analysis forward and potentially unveil novel biomarkers for cellular development, differentiation, and disease.

DNA sequencing has had the power of technology behind it as novel platforms to produce more sequencing faster and at lower cost have been introduced. But the tools to unravel the epigenetic control mechanisms that influence how cells control access of transcriptional proteins to DNA are just beginning to emerge.

Among these mechanisms, DNA methylation, or the enzymatically mediated addition of a methyl group to cytosine or adenine dinucleotides,

  • serves as an inherited epigenetic modification that
  • stably modifies gene expression in dividing cells.

The unique methylomes are largely maintained in differentiated cell types, making them critical to understanding the differentiation potential of the cell.

In the DNA methylation process, cytosine residues in the genome are enzymatically modified to 5-methylcytosine,

  • which participates in transcriptional repression of genes during development and disease progression.

5-methylcytosine can be further enzymatically modified to 5-hydroxymethylcytosine by the TET family of methylcytosine dioxygenases. DNA methylation affects gene transcription by physically

  • interfering with the binding of proteins involved in gene transcription.

Methylated DNA may be bound by methyl-CpG-binding domain proteins (MBDs) that can

  • then recruit additional proteins. Some of these include histone deacetylases and other chromatin remodeling proteins that modify histones, thereby
  • forming compact, inactive chromatin, or heterochromatin.

While DNA methylation doesn’t change the genetic code,

  • it influences chromosomal stability and gene expression.

Epigenetics and Cancer Biomarkers

multistage chemical carcinogenesis

multistage chemical carcinogenesis

And because of the increasing recognition that DNA methylation changes are involved in human cancers, scientists have suggested that these epigenetic markers may provide biological markers for cancer cells, and eventually point toward new diagnostic and therapeutic targets. Cancer cell genomes display genome-wide abnormalities in DNA methylation patterns,

  • some of which are oncogenic and contribute to genome instability.

In particular, de novo methylation of tumor suppressor gene promoters

  • occurs frequently in cancers, thereby silencing them and promoting transformation.

Cytosine hydroxymethylation (5-hydroxymethylcytosine, or 5hmC), the aforementioned DNA modification resulting from the enzymatic conversion of 5mC into 5-hydroxymethylcytosine by the TET family of oxygenases, has been identified

  • as another key epigenetic modification marking genes important for
  • pluripotency in embryonic stem cells (ES), as well as in cancer cells.

The base 5-hydroxymethylcytosine was recently identified as an oxidation product of 5-methylcytosine in mammalian DNA. In 2011, using sensitive and quantitative methods to assess levels of 5-hydroxymethyl-2′-deoxycytidine (5hmdC) and 5-methyl-2′-deoxycytidine (5mdC) in genomic DNA, scientists at the Department of Cancer Biology, Beckman Research Institute of the City of Hope, Duarte, California investigated

  • whether levels of 5hmC can distinguish normal tissue from tumor tissue.

They showed that in squamous cell lung cancers, levels of 5hmdC showed

  • up to five-fold reduction compared with normal lung tissue.

In brain tumors,5hmdC showed an even more drastic reduction

  • with levels up to more than 30-fold lower than in normal brain,
  • but 5hmdC levels were independent of mutations in isocitrate dehydrogenase-1, the enzyme that converts 5hmC to 5hmdC.

Immunohistochemical analysis indicated that 5hmC is “remarkably depleted” in many types of human cancer.

  • there was an inverse relationship between 5hmC levels and cell proliferation with lack of 5hmC in proliferating cells.

Their data suggest that 5hmdC is strongly depleted in human malignant tumors,

  • a finding that adds another layer of complexity to the aberrant epigenome found in cancer tissue.

In addition, a lack of 5hmC may become a useful biomarker for cancer diagnosis.

Enzymatic Mapping

But according to New England Biolabs’ Sriharsa Pradhan, Ph.D., methods for distinguishing 5mC from 5hmC and analyzing and quantitating the cell’s entire “methylome” and “hydroxymethylome” remain less than optimal.

The protocol for bisulphite conversion to detect methylation remains the “gold standard” for DNA methylation analysis. This method is generally followed by PCR analysis for single nucleotide resolution to determine methylation across the DNA molecule. According to Dr. Pradhan, “.. bisulphite conversion does not distinguish 5mC and 5hmC,”

Recently we found an enzyme, a unique DNA modification-dependent restriction endonuclease, AbaSI, which can

  • decode the hydryoxmethylome of the mammalian genome.

You easily can find out where the hydroxymethyl regions are.”

AbaSI, recognizes 5-glucosylatedmethylcytosine (5gmC) with high specificity when compared to 5mC and 5hmC, and

  • cleaves at narrow range of distances away from the recognized modified cytosine.

By mapping the cleaved ends, the exact 5hmC location can, the investigators reported, be determined.

Dr. Pradhan and his colleagues at NEB; the Department of Biochemistry, Emory University School of Medicine, Atlanta; and the New England Biolabs Shanghai R&D Center described use of this technique in a paper published in Cell Reports this month, in which they described high-resolution enzymatic mapping of genomic hydroxymethylcytosine in mouse ES cells.

In the current report, the authors used the enzyme technology for the genome-wide high-resolution hydroxymethylome, describing simple library construction even with a low amount of input DNA (50 ng) and the ability to readily detect 5hmC sites with low occupancy.

As a result of their studies, they propose that

factors affecting the local 5mC accessibility to TET enzymes play important roles in the 5hmC deposition

  • including include chromatin compaction, nucleosome positioning, or TF binding.
  •  the regularly oscillating 5hmC profile around the CTCF-binding sites, suggests 5hmC ‘‘writers’’ may be sensitive to the nucleosomal environment.
  • some transiently stable 5hmCs may indicate a poised epigenetic state or demethylation intermediate, whereas others may suggest a locally accessible chromosomal environment for the TET enzymatic apparatus.

“We were able to do complete mapping in mouse embryonic cells and are pleased about what this enzyme can do and how it works,” Dr. Pradhan said.

And the availability of novel tools that make analysis of the methylome and hypomethylome more accessible will move the field of epigenetic analysis forward and potentially novel biomarkers for cellular development, differentiation, and disease.

Patricia Fitzpatrick Dimond, Ph.D. (pdimond@genengnews.com), is technical editor at Genetic Engineering & Biotechnology News.

Epigenetic Regulation of ADME-Related Genes: Focus on Drug Metabolism and Transport

Published: Sep 23, 2013

Epigenetic regulation of gene expression refers to heritable factors that are functionally relevant genomic modifications but that do not involve changes in DNA sequence.

Examples of such modifications include

  • DNA methylation, histone modifications, noncoding RNAs, and chromatin architecture.

Epigenetic modifications are crucial for

packaging and interpreting the genome, and they have fundamental functions in regulating gene expression and activity under the influence of physiologic and environmental factors.

In this issue of Drug Metabolism and Disposition, a series of articles is presented to demonstrate the role of epigenetic factors in regulating

  • the expression of genes involved in drug absorption, distribution, metabolism, and excretion in organ development, tissue-specific gene expression, sexual dimorphism, and in the adaptive response to xenobiotic exposure, both therapeutic and toxic.

The articles also demonstrate that, in addition to genetic polymorphisms, epigenetics may also contribute to wide inter-individual variations in drug metabolism and transport. Identification of functionally relevant epigenetic biomarkers in human specimens has the potential to improve prediction of drug responses based on patient’s epigenetic profiles.

http://www.technologynetworks.com/Metabolomics/news.aspx?ID=157804

This study is published online in Drug Metabolism and Disposition

Part 8.  Pictorial Maps

 Prediction of intracellular metabolic states from extracellular metabolomic data

MK Aurich, G Paglia, Ottar Rolfsson, S Hrafnsdottir, M Magnusdottir, MM Stefaniak, BØ Palsson, RMT Fleming &

Ines Thiele

Metabolomics Aug 14, 2014;

http://dx.doi.org:/10.1007/s11306-014-0721-3

http://link.springer.com/article/10.1007/s11306-014-0721-3/fulltext.html#Sec1

http://link.springer.com/static-content/images/404/art%253A10.1007%252Fs11306-014-0721-3/MediaObjects/11306_2014_721_Fig1_HTML.gif

Metabolic models can provide a mechanistic framework

  • to analyze information-rich omics data sets, and are
  • increasingly being used to investigate metabolic alternations in human diseases.

An expression of the altered metabolic pathway utilization is the selection of metabolites consumed and released by cells. However, methods for the

  • inference of intracellular metabolic states from extracellular measurements in the context of metabolic models remain underdeveloped compared to methods for other omics data.

Herein, we describe a workflow for such an integrative analysis

  • emphasizing on extracellular metabolomics data.

We demonstrate,

  • using the lymphoblastic leukemia cell lines Molt-4 and CCRF-CEM,

how our methods can reveal differences in cell metabolism. Our models explain metabolite uptake and secretion by predicting

  • a more glycolytic phenotype for the CCRF-CEM model and
  • a more oxidative phenotype for the Molt-4 model,
  • which was supported by our experimental data.

Gene expression analysis revealed altered expression of gene products at

  • key regulatory steps in those central metabolic pathways, and

literature query emphasized the role of these genes in cancer metabolism.

Moreover, in silico gene knock-outs identified unique

  •  control points for each cell line model, e.g., phosphoglycerate dehydrogenase for the Molt-4 model.

Thus, our workflow is well suited to the characterization of cellular metabolic traits based on

  • -extracellular metabolomic data, and it allows the integration of multiple omics data sets
  • into a cohesive picture based on a defined model context.

Keywords Constraint-based modeling _ Metabolomics _ Multi-omics _ Metabolic network _ Transcriptomics

1 Introduction

Modern high-throughput techniques have increased the pace of biological data generation. Also referred to as the ‘‘omics avalanche’’, this wealth of data provides great opportunities for metabolic discovery. Omics data sets

  • contain a snapshot of almost the entire repertoire of mRNA, protein, or metabolites at a given time point or

under a particular set of experimental conditions. Because of the high complexity of the data sets,

  • computational modeling is essential for their integrative analysis.

Currently, such data analysis is a bottleneck in the research process and methods are needed to facilitate the use of these data sets, e.g., through meta-analysis of data available in public databases [e.g., the human protein atlas (Uhlen et al. 2010) or the gene expression omnibus (Barrett et al.  2011)], and to increase the accessibility of valuable information for the biomedical research community.

Constraint-based modeling and analysis (COBRA) is

  • a computational approach that has been successfully used to
  • investigate and engineer microbial metabolism through the prediction of steady-states (Durot et al.2009).

The basis of COBRA is network reconstruction: networks are assembled in a bottom-up fashion based on

  • genomic data and extensive
  • organism-specific information from the literature.

Metabolic reconstructions capture information on the

  • known biochemical transformations taking place in a target organism
  • to generate a biochemical, genetic and genomic knowledge base (Reed et al. 2006).

Once assembled, a

  • metabolic reconstruction can be converted into a mathematical model (Thiele and Palsson 2010), and
  • model properties can be interrogated using a great variety of methods (Schellenberger et al. 2011).

The ability of COBRA models

  • to represent genotype–phenotype and environment–phenotype relationships arises
  • through the imposition of constraints, which
  • limit the system to a subset of possible network states (Lewis et al. 2012).

Currently, COBRA models exist for more than 100 organisms, including humans (Duarte et al. 2007; Thiele et al. 2013).

Since the first human metabolic reconstruction was described [Recon 1 (Duarte et al. 2007)],

  • biomedical applications of COBRA have increased (Bordbar and Palsson 2012).

One way to contextualize networks is to

  • define their system boundaries according to the metabolic states of the system, e.g., disease or dietary regimes.

The consequences of the applied constraints can

  • then be assessed for the entire network (Sahoo and Thiele 2013).

Additionally, omics data sets have frequently been used

  • to generate cell-type or condition-specific metabolic models.

Models exist for specific cell types, such as

  1. enterocytes (Sahoo and Thiele2013),
  2. macrophages (Bordbar et al. 2010),
  3. adipocytes (Mardinoglu et al. 2013),
  4. even multi-cell assemblies that represent the interactions of brain cells (Lewis et al. 2010).

All of these cell type specific models, except the enterocyte reconstruction

  • were generated based on omics data sets.

Cell-type-specific models have been used to study

  • diverse human disease conditions.

For example, an adipocyte model was generated using

  • transcriptomic, proteomic, and metabolomics data.

This model was subsequently used to investigate metabolic alternations in adipocytes

  • that would allow for the stratification of obese patients (Mardinoglu et al. 2013).

The biomedical applications of COBRA have been

  1. cancer metabolism (Jerby and Ruppin, 2012).
  2. predicting drug targets (Folger et al. 2011; Jerby et al. 2012).

A cancer model was generated using

  • multiple gene expression data sets and subsequently used
  • to predict synthetic lethal gene pairs as potential drug targets
  • selective for the cancer model, but non-toxic to the global model (Recon 1),

a consequence of the reduced redundancy in the cancer specific model (Folger et al. 2011).

In a follow up study, lethal synergy between FH and enzymes of the heme metabolic pathway

  • were experimentally validated and resolved the mechanism by which FH deficient cells,
    e.g., in renal-cell cancer cells survive a non-functional TCA cycle (Frezza et al. 2011).

Contextualized models, which contain only the subset of reactions active in a particular tissue (or cell-) type,

  • can be generated in different ways (Becker and Palsson, 2008; Jerby et al. 2010).

However, the existing algorithms mainly consider

  • gene expression and proteomic data
  • to define the reaction sets that comprise the contextualized metabolic models.

These subset of reactions are usually defined

  • based on the expression or absence of expression of the genes or proteins (present and absent calls),
  • or inferred from expression values or differential gene expression.

Comprehensive reviews of the methods are available (Blazier and Papin, 2012; Hyduke et al. 2013). Only the compilation of a large set of omics data sets

  • can result in a tissue (or cell-type) specific metabolic model, whereas

the representation of one particular experimental condition is achieved

  • through the integration of omics data set generated from one experiment only (condition-specific cell line model).

Recently, metabolomic data sets have become more comprehensive and

  • using these data sets allow direct determination of the metabolic network components (the metabolites).

Additionally, metabolomics has proven to be stable, relatively inexpensive, and highly reproducible (Antonucci et al. 2012). These factors make metabolomic data sets particularly valuable for

  • interrogation of metabolic phenotypes.

Thus, the integration of these data sets is now an active field of research (Li et al. 2013; Mo et al. 2009; Paglia et al. 2012b; Schmidt et al. 2013).

Generally, metabolomic data can be incorporated into metabolic networks as

  • qualitative, quantitative, and thermodynamic constraints (Fleming et al. 2009; Mo et al. 2009).

Mo et al. used metabolites detected in the

  • spent medium of yeast cells to determine intracellular flux states through a sampling analysis (Mo et al. 2009),
  • which allowed unbiased interrogation of the possible network states (Schellenberger and Palsson 2009) and
  • prediction of internal pathway use.
Modes of transcriptional regulation during the YMC

Modes of transcriptional regulation during the YMC

Such analyses have also been used to reveal the effects of

  1. enzymopathies on red blood cells (Price et al. 2004),
  2. to study effects of diet on diabetes (Thiele et al. 2005) and
  3. to define macrophage metabolic states (Bordbar et al. 2010).

This type of analysis is available as a function in the COBRA toolbox (Schellenberger et al. 2011).

In this study, we established a workflow

  • for the generation and analysis of condition-specific metabolic cell line models
  • that can facilitate the interpretation of metabolomic data.

Our modeling yields meaningful predictions regarding

  • metabolic differences between two lymphoblastic leukemia cell lines (Fig. 1A).

Fig. 1

metabol leukem cell lines11306_2014_721_Fig1_HTML

metabol leukem cell lines11306_2014_721_Fig1_HTML

A Combined experimental and computational pipeline to study human metabolism.

  1. Experimental work and omics data analysis steps precede computational modeling.
  2. Model predictions are validated based on targeted experimental data.
  3. Metabolomic and transcriptomic data are used for model refinement and submodel extraction.
  4. Functional analysis methods are used to characterize the metabolism of the cell-line models and compare it to additional experimental data.
  5. The validated models are subsequently used for the prediction of drug targets.

B Uptake and secretion pattern of model metabolites. All metabolite uptakes and secretions that were mapped during model generation are shown.

  • Metabolite uptakes are depicted on the left, and
  • secreted metabolites are shown on the right.
  1. A number of metabolite exchanges mapped to the model were unique to one cell line.
  2. Differences between cell lines were used to set quantitative constraints for the sampling analysis.

C Statistics about the cell line-specific network generation.

D Quantitative constraints.

For the sampling analysis, an additional set of constraints was imposed on the cell line specific models,

  • emphasizing the differences in metabolite uptake and secretion between cell lines.

Higher uptake of a metabolite was allowed

  • in the model of the cell line that consumed more of the metabolite in vitro, whereas
  • the supply was restricted for the model with lower in vitro uptake.

This was done by establishing the same ratio between the models bounds as detected in vitro.

X denotes the factor (slope ratio) that distinguishes the bounds, and

  • which was individual for each metabolite.

(a) The uptake of a metabolite could be x times higher in CCRF-CEM cells,

(b) the metabolite uptake could be x times higher in Molt-4,

(c) metabolite secretion could be x times higher in CCRF-CEM, or

(d) metabolite secretion could be x times higher in Molt-4 cells.LOD limit of detection.

The consequence of the adjustment was, in case of uptake, that one model was constrained to a lower metabolite uptake (A, B), and the difference depended on the ratio detected in vitro. In case of secretion, one model

  • had to secrete more of the metabolite, and again
  • the difference depended on the experimental difference detected between the cell lines

2 Results

We set up a pipeline that could be used to infer intracellular metabolic states

  • from semi-quantitative data regarding metabolites exchanged between cells and their environment.

Our pipeline combined the following four steps:

  1. data acquisition,
  2. data analysis,
  3. metabolic modeling and
  4. experimental validation of the model predictions (Fig. 1A).

We demonstrated the pipeline and the predictive potential to predict metabolic alternations in diseases such as cancer based on

^two lymphoblastic leukemia cell lines.

The resulting Molt-4 and CCRF-CEM condition-specific cell line models could explain

^  metabolite uptake and secretion
^  by predicting the distinct utilization of central metabolic pathways by the two cell lines.
^  the CCRF-CEM model resembled more a glycolytic, commonly referred to as ‘Warburg’ phenotype,
^  our model predicted a more respiratory phenotype for the Molt-4 model.

We found these predictions to be in agreement with measured gene expression differences

  • at key regulatory steps in the central metabolic pathways, and they were also
  • consistent with additional experimental data regarding the energy and redox states of the cells.

After a brief discussion of the data generation and analysis steps, the results derived from model generation and analysis will be described in detail.

2.1 Pipeline for generation of condition-specific metabolic cell line models

integration of exometabolomic (EM) data

integration of exometabolomic (EM) data

2.1.1 Generation of experimental data

We monitored the growth and viability of lymphoblastic leukemia cell lines in serum-free medium (File S2, Fig. S1). Multiple omics data sets were derived from these cells.Extracellular metabolomics (exo-metabolomic) data,

integration of exometabolomic (EM) data

integration of exometabolomic (EM) data

^  comprising measurements of the metabolites in the spent medium of the cell cultures (Paglia et al. 2012a),
^ were collected along with transcriptomic data, and these data sets were used to construct the models.

2.1.4 Condition-specific models for CCRF-CEM and Molt-4 cells

To determine whether we had obtained two distinct models, we evaluated the reactions, metabolites, and genes of the two models. Both the Molt-4 and CCRF-CEM models contained approximately half of the reactions and metabolites present in the global model (Fig. 1C). They were very similar to each other in terms of their reactions, metabolites, and genes (File S1, Table S5A–C).

(1) The Molt-4 model contained seven reactions that were not present in the CCRF-CEM model (Co-A biosynthesis pathway and exchange reactions).
(2) The CCRF-CEM contained 31 unique reactions (arginine and proline metabolism, vitamin B6 metabolism, fatty acid activation, transport, and exchange reactions).
(3) There were 2 and 15 unique metabolites in the Molt-4 and CCRF-CEM models, respectively (File S1, Table S5B).
(4) Approximately three quarters of the global model genes remained in the condition-specific cell line models (Fig. 1C).
(5) The Molt-4 model contained 15 unique genes, and the CCRF-CEM model had 4 unique genes (File S1, Table S5C).
(6) Both models lacked NADH dehydrogenase (complex I of the electron transport chain—ETC), which was determined by the absence of expression of a mandatory subunit (NDUFB3, Entrez gene ID 4709).

Rather, the ETC was fueled by FADH2 originating from succinate dehydrogenase and from fatty acid oxidation, which through flavoprotein electron transfer

FADH2

FADH2

  • could contribute to the same ubiquinone pool as complex I and complex II (succinate dehydrogenase).

Despite their different in vitro growth rates (which differed by 11 %, see File S2, Fig. S1) and
^^^ differences in exo-metabolomic data (Fig. 1B) and transcriptomic data,
^^^ the internal networks were largely conserved in the two condition-specific cell line models.

2.1.5 Condition-specific cell line models predict distinct metabolic strategies

Despite the overall similarity of the metabolic models, differences in their cellular uptake and secretion patterns suggested distinct metabolic states in the two cell lines (Fig. 1B and see “Materials and methods” section for more detail). To interrogate the metabolic differences, we sampled the solution space of each model using an Artificial Centering Hit-and-Run (ACHR) sampler (Thiele et al. 2005). For this analysis, additional constraints were applied, emphasizing the quantitative differences in commonly uptaken and secreted metabolites. The maximum possible uptake and maximum possible secretion flux rates were reduced
^^^ according to the measured relative differences between the cell lines (Fig. 1D, see “Materials and methods” section).

We plotted the number of sample points containing a particular flux rate for each reaction. The resulting binned histograms can be understood as representing the probability that a particular reaction can have a certain flux value.

A comparison of the sample points obtained for the Molt-4 and CCRF-CEM models revealed

  • a considerable shift in the distributions, suggesting a higher utilization of glycolysis by the CCRF-CEM model
    (File S2, Fig. S2).

This result was further supported by differences in medians calculated from sampling points (File S1, Table S6).
The shift persisted throughout all reactions of the pathway and was induced by the higher glucose uptake (34 %) from the extracellular medium in CCRF-CEM cells.

The sampling median for glucose uptake was 34 % higher in the CCRF-CEM model than in Molt-4 model (File S2, Fig. S2).

The usage of the TCA cycle was also distinct in the two condition-specific cell-line models (Fig. 2). Interestingly,
the models used succinate dehydrogenase differently (Figs. 2, 3).

TCA_reactions

TCA_reactions

The Molt-4 model utilized an associated reaction to generate FADH2, whereas

  • in the CCRF-CEM model, the histogram was shifted in the opposite direction,
  • toward the generation of succinate.

Additionally, there was a higher efflux of citrate toward amino acid and lipid metabolism in the CCRF-CEM model (Fig. 2). There was higher flux through anaplerotic and cataplerotic reactions in the CCRF-CEM model than in the Molt-4 model (Fig. 2); these reactions include

(1) the efflux of citrate through ATP-citrate lyase,
(2) uptake of glutamine,
(3) generation of glutamate from glutamine,
(4) transamination of pyruvate and glutamate to alanine and to 2-oxoglutarate,
(5) secretion of nitrogen, and
(6) secretion of alanine.

energetics-of-cellular-respiration

energetics-of-cellular-respiration

The Molt-4 model showed higher utilization of oxidative phosphorylation (Fig. 3), again supported by
elevated median flux through ATP synthase (36 %) and other enzymes, which contributed to higher oxidative metabolism. The sampling analysis therefore revealed different usage of central metabolic pathways by the condition-specific models.

Fig. 2

Differences in the use of  the TCA cycle by the CCRF-CEM model (red) and the Molt-4 model (blue).

Differences in the use of the TCA cycle by the CCRF-CEM model (red) and the Molt-4 model (blue).

Differences in the use of the TCA cycle by the CCRF-CEM model (red) and the Molt-4 model (blue).

The table provides the median values of the sampling results. Negative values in histograms and in the table describe reversible reactions with flux in the reverse direction. There are multiple reversible reactions for the transformation of isocitrate and α-ketoglutarate, malate and fumarate, and succinyl-CoA and succinate. These reactions are unbounded, and therefore histograms are not shown. The details of participating cofactors have been removed.

Figure 3.

Molt-4 has higher median flux through ETC reactions II–IV 11306_2014_721_Fig3_HTML

Molt-4 has higher median flux through ETC reactions II–IV 11306_2014_721_Fig3_HTML

Atp ATP, cit citrate, adp ADP, pi phosphate, oaa oxaloacetate, accoa acetyl-CoA, coa coenzyme-A, icit isocitrate, αkg α-ketoglutarate, succ-coa succinyl-CoA, succ succinate, fumfumarate, mal malate, oxa oxaloacetate,
pyr pyruvate, lac lactate, ala alanine, gln glutamine, ETC electron transport chain

Ingenuity network analysis showing up (red) and downregulation (green) of miRNAs involved in PC and their target genes

Ingenuity network analysis showing up (red) and downregulation (green) of miRNAs involved in PC and their target genes

metabolic pathways 1476-4598-10-70-1

metabolic pathways 1476-4598-10-70-1

Metabolic Systems Research Team fig2

Metabolic Systems Research Team fig2

Metabolic control analysis of respiration in human cancer tissue. fphys-04-00151-g001

Metabolic control analysis of respiration in human cancer tissue. fphys-04-00151-g001

Metabolome Informatics Research fig1

Metabolome Informatics Research fig1

Modelling of Central Metabolism network3

Modelling of Central Metabolism network3

N. gaditana metabolic pathway map ncomms1688-f4

N. gaditana metabolic pathway map ncomms1688-f4

protein changes in biological mechanisms

protein changes in biological mechanisms

Read Full Post »

Metformin, Thyroid-Pituitary Axis, Diabetes Mellitus, and Metabolism

Metformin, Thyroid-Pituitary Axis, Diabetes Mellitus, and Metabolism

Larry H, Bernstein, MD, FCAP, Author and Curator
and Aviva Lev-Ari, PhD, RN

http://pharmaceuticalintelligence.com/9/27/2014/Metformin,_thyroid-pituitary_ axis,_diabetes_mellitus,_and_metabolism

The following article is a review of the central relationship between the action of
metformin as a diabetic medication and its relationship to AMPK, the important and
essential regulator of glucose and lipid metabolism under normal activity, stress, with
its effects on skeletal muscle, the liver, the action of T3 and more.

We start with a case study and a publication in the J Can Med Assoc.  Then we shall look
into key literature on these metabolic relationships.

Part I.  Metformin , Diabetes Mellitus, and Thyroid Function

Hypothyroidism, Insulin resistance and Metformin
May 30, 2012   By Janie Bowthorpe
The following was written by a UK hypothyroid patient’s mother –
Sarah Wilson.

My daughter’s epilepsy is triggered by unstable blood sugars. And since taking
Metformin to control her blood sugar, she has significantly reduced the number of
seizures. I have been doing research and read numerous academic medical journals,
which got me thinking about natural thyroid hormone and Hypothyroidism. My hunch
was that when patients develop hypothyroid symptoms, they are actually becoming
insulin resistant (IR). There are many symptoms in common between women with
polycystic ovaries and hypothyroidism–the hair loss, the weight gain, etc.
(http://insulinhub.hubpages.com/hub/PCOS-and-Hypothyroidism).

A hypothyroid person’s body behaves as if it’s going into starvation mode and so, to
preserve resources and prolong life, the metabolism changes. If hypothyroid is prolonged
or pronounced, then perhaps, chemical preservation mode becomes permanent even
with the reintroduction of thyroid hormones. To get back to normal, they need
a “jump-start” reinitiate a higher rate of metabolism. The kick start is initiated through
AMPK, which is known as the “master metabolic regulating enzyme.”
(http://en.wikipedia.org/wiki/AMP-activated protein kinase).

Guess what? This is exactly what happens to Diabetes patients when Metformin is
introduced. http://en.wikipedia.org/wiki/Metformin
Suggested articles: http://www.springerlink.com/content/r81606gl3r603167/  and
http://onlinelibrary.wiley.com/doi/10.1111/j.1365-2265.2011.04029.x/pdf

Note the following comments/partial statements:
“Hypothyroidism is characterized by decreased insulin responsiveness”;
“the pivotal regulatory role of T3 in major metabolic pathways”.

The community knows that T3/NTH (natural thyroid hormone [Armour]) makes
hypothyroid patients feel better – but the medical establishment is averse to T3/NTH
(treating subclinical hypoT (T3/T4 euthyroid) with natural dessicated thyroid (NDT).
The medical establishment might find an alternative view about impaired metabolism
more if shown real proof that the old NDT **was/is** having the right result –i.e., the
T3 is jump-starting the metabolism by re-activating
 AMPK.

If NDT also can be used for hypothyroidism without the surmised “dangers” of NTH,
then they should consider it. [The reality in the choice is actually recombinant TH
(Synthroid)]. Metformin is cheap, stable and has very few serious side effects. I use the
car engine metaphor, and refer to glucose as our petrol, AMPK as the spark plug and
both T3 and Metformin as the ignition switches. Sometimes if you have flat batteries in
the car, it doesn’t matter how much you turn the ignition switch or pump the petrol
pedal, all it does is flatten the battery and flood the engine.

Dr. Skinner in the UK has been treating “pre-hypothyroidism” the way that some
doctors treat “pre-diabetes”. Those hypothyroid patients who get treated early
might not have had their AMPK pathways altered and the T4-T3 conversion still works.
There seems to be no reason why thyroid hormone replacement therapy shouldn’t
logically be given to ward off a greater problem down the line.

It’s my belief that there is clear and abundant academic evidence that the AMPK/
Metformin research should branch out to also look at thyroid disease.

Point – direct T3 is kicking the closed -down metabolic process back into life,
just like Metformin does for insulin resistance.
http://www.hotthyroidology.com/editorial_79.html
There is serotonin resistance! http://www.ncbi.nlm.nih.gov/pubmed/17250776

Metformin Linked to Risk of Low Levels of Thyroid Hormone

CMAJ (Canadian Medical Association Journal) 09/22/2014

Metformin, the drug commonly for treating type 2 diabetes,

  • is linked to an increased risk of low thyroid-stimulating hormone
    (TSH) levels
  • in patients with underactive thyroids (hypothyroidism),

according to a study in CMAJ (Canadian Medical Association Journal).

Metformin is used to lower blood glucose levels

  • by reducing glucose production in the liver.

previous studies have raised concerns that

  • metformin may lower thyroid-stimulating hormone levels.

Study characteristics:

  1. Retrospective  long-term
  2. 74 300 patient who received metformin and sulfonylurea
  3. 25-year study period.
  4. 5689 had treated hypothyroidism
  5. 59 937 had normal thyroid function.

Metformin and low levels of thyroid-stimulating hormone in
patients with type 2 diabetes mellitus

Jean-Pascal Fournier,  Hui Yin, Oriana Hoi Yun Yu, Laurent Azoulay  +
Centre for Clinical Epidemiology (Fournier, Yin, Yu, Azoulay), Lady Davis Institute,
Jewish General Hospital; Department of Epidemiology, Biostatistics and Occupational
Health (Fournier), McGill University; Division of Endocrinology (Yu), Jewish General
Hospital; Department of Oncology (Azoulay), McGill University, Montréal, Que., Cananda

CMAJ Sep 22, 2014,   http://dx.doi.org:/10.1503/cmaj.140688

Background:

  • metformin may lower thyroid-stimulating hormone (TSH) levels.

Objective:

  • determine whether the use of metformin monotherapy, when compared with
    sulfonylurea monotherapy,
  • is associated with an increased risk of low TSH levels(< 0.4 mIU/L)
  • in patients with type 2 diabetes mellitus.

Methods:

  • Used the Clinical Practice Research Datalink,
  • identified patients who began receiving metformin or sulfonylurea monotherapy
    between Jan. 1, 1988, and Dec. 31, 2012.
  • 2 subcohorts of patients with treated hypothyroidism or euthyroidism,

followed them until Mar. 31, 2013.

  • Used Cox proportional hazards models to evaluate the association of low TSH
    levels with metformin monotherapy, compared with sulfonylurea monotherapy,
    in each subcohort.

Results:

  • 5689 patients with treated hypothyroidism and 59 937 euthyroid patients were
    included in the subcohorts.

For patients with treated hypothyroidism:

  1. 495 events of low TSH levels were observed (incidence rate 0.1197/person-years).
  2. 322 events of low TSH levels were observed (incidence rate 0.0045/person-years)
    in the euthyroid group.
  • metformin monotherapy was associated with a 55% increased risk of low TSH
    levels 
    in patients with treated hypothyroidism (incidence rate 0.0795/person-years
    vs.0.1252/ person-years, adjusted hazard ratio [HR] 1.55, 95% confidence
    interval [CI] 1.09– 1.20), compared with sulfonylurea monotherapy,
  • the highest risk in the 90–180 days after initiation (adjusted HR 2.30, 95% CI
    1.00–5.29).
  • No association was observed in euthyroid patients (adjusted HR 0.97, 95% CI 0.69–1.36).

Interpretation: The clinical consequences of this needs further investigation.


Crude and adjusted hazard ratios for suppressed thyroid-stimulating hormone
levels (< 0.1 mIU/L) associated with the use metformin monotherapy, compared
with sulfonylurea monotherapy, in patients with treated hypothyroidism or
euthyroidism and type 2 diabetes
Variable No. events
suppressed
TSH levels
Person-years of
exposure
Incidence rate,
per 1000 person-years (95% CI)
Crude
HR
Adjusted HR*(95% CI)
Patients with treated hypothyroidism, n = 5689
Sulfonylure,
n = 762
18 503 35.8
(21.2–56.6)
1.00 1.00
(reference)
Metformin,
n = 4927
130 3 633 35.8
(29.9–42.5)
1.05 0.99
(0.57–1.72)
Euthyroid patients, n = 59 937
Sulfonylurea,
n = 7980
12 8 576 1.4
(0.7–2.4)
1.00 1.00
(reference)
Metformin,
n = 51 957
75 63 047 1.2
(0.9–1.5)
0.85 1.03
(0.52–2.03)


Part II. Metabolic Underpinning 
(Source: Wikipedia, AMPK and thyroid)

5′ AMP-activated protein kinase or AMPK or 5′ adenosine monophosphate-activated protein kinase
is an enzyme that plays a role in cellular energy homeostasis.
It consists of three proteins (subunits) that

  1. together make a functional enzyme, conserved from yeast to humans.
  2. It is expressed in a number of tissues, including the liver, brain, and skeletal
    muscle.
  3. The net effect of AMPK activation is stimulation of
    1. hepatic fatty acid oxidation and ketogenesis,
    2. inhibition of cholesterol synthesis,
    3. lipogenesis, and triglyceride synthesis,
    4. inhibition of adipocyte lipolysis and lipogenesis,
    5. stimulation of skeletal muscle fatty acid oxidation and muscle
      glucose uptake, and
    6. modulation of insulin secretion by pancreatic beta-cells.

The heterotrimeric protein AMPK is formed by α, β, and γ subunits. Each of these three
subunits takes on a specific role in both the stability and activity of AMPK.

  • the γ subunit includes four particular Cystathionine beta synthase (CBS) domains
    giving AMPK its ability to sensitively detect shifts in the AMP:ATP ratio.
  • The four CBS domains create two binding sites for AMP commonly referred to as
    Bateman domains. Binding of one AMP to a Bateman domain cooperatively
    increases the binding affinity of the second AMP to the other Bateman domain.
  • As AMP binds both Bateman domains the γ subunit undergoes a conformational
    change which exposes the catalytic domain found on the α subunit.
  • It is in this catalytic domain where AMPK becomes activated when
    phosphorylation takes place at threonine-172by an upstream AMPK kinase
    (AMPKK). The α, β, and γ subunits can also be found in different isoforms.

AMPK acts as a metabolic master switch regulating several intracellular systems

  1. the cellular uptake of glucose,
  2. the β-oxidation of fatty acids and
  3. the biogenesis of glucose transporter 4 (GLUT4) and
  4. mitochondria

The energy-sensing capability of AMPK can be attributed to

  • its ability to detect and react to fluctuations in the AMP:ATP ratio that take
    place during rest and exercise (muscle stimulation).

During muscle stimulation,

  • AMP increases while ATP decreases, which changes AMPK into a good substrate
    for activation.
  • AMPK activity increases while the muscle cell experiences metabolic stress
    brought about by an extreme cellular demand for ATP.
  • Upon activation, AMPK increases cellular energy levels by
    • inhibiting anabolic energy consuming pathways (fatty acid synthesis,
      protein synthesis, etc.) and
    • stimulating energy producing, catabolic pathways (fatty acid oxidation,
      glucose transport, etc.).

A recent JBC paper on mice at Johns Hopkins has shown that when the activity of brain
AMPK was pharmacologically inhibited,

  • the mice ate less and lost weight.

When AMPK activity was pharmacologically raised (AICAR see below)

  • the mice ate more and gained weight.

Research in Britain has shown that the appetite-stimulating hormone ghrelin also
affects AMPK levels.

The antidiabetic drug metformin (Glucophage) acts by stimulating AMPK, leading to

  1. reduced glucose production in the liver and
  2. reduced insulin resistance in the muscle.

(Metformin usually causes weight loss and reduced appetite, not weight gain and
increased appetite, ..opposite of expected from the Johns Hopkins mouse study results.)

Triggering the activation of AMPK can be carried out provided two conditions are met.

First, the γ subunit of AMPK

  • must undergo a conformational change so as to
  • expose the active site(Thr-172) on the α subunit.

The conformational change of the γ subunit of AMPK can be accomplished

  • under increased concentrations of AMP.

Increased concentrations of AMP will

  • give rise to the conformational change on the γ subunit of AMPK
  • as two AMP bind the two Bateman domains located on that subunit.
  • It is this conformational change brought about by increased concentrations
    of  AMP that exposes the active site (Thr-172) on the α subunit.

This critical role of AMP is further substantiated in experiments that demonstrate

  • AMPK activation via an AMP analogue 5-amino-4-imidazolecarboxamide
    ribotide (ZMP) which is derived fromthe familiar
  • 5-amino-4-imidazolecarboxamide riboside (AICAR)

AMPK is a good substrate for activation via an upstream kinase complex, AMPKK
AMPKK is a complex of three proteins,

  1. STE-related adaptor (STRAD),
  2. mouse protein 25 (MO25), and
  3. LKB1 (a serine/threonine kinase).

The second condition that must be met is

  • the phosphorylation/activation of AMPK on its activating loop at
    Thr-172of the α subunit
  • brought about by an upstream kinase (AMPKK).

The complex formed between LKB1 (STK 11), mouse protein 25 (MO25), and the
pseudokinase STE-related adaptor protein (STRAD) has been identified as

  • the major upstream kinase responsible for phosphorylation of AMPK
    on its activating loop at Thr-172

Although AMPK must be phosphorylated by the LKB1/MO25/STRAD complex,

  • it can also be regulated by allosteric modulators which
  • directly increase general AMPK activity and
  • modify AMPK to make it a better substrate for AMPKK
  • and a worse substrate for phosphatases.

It has recently been found that 3-phosphoglycerate (glycolysis intermediate)

  • acts to further pronounce AMPK activation via AMPKK

Muscle contraction is the main method carried out by the body that can provide
the conditions mentioned above needed for AMPK activation

  • As muscles contract, ATP is hydrolyzed, forming ADP.
  • ADP then helps to replenish cellular ATP by donating a phosphate group to
    another ADP,

    • forming an ATP and an AMP.
  • As more AMP is produced during muscle contraction,
    • the AMP:ATP ratio dramatically increases,
  • leading to the allosteric activation of AMPK

For over a decade it has been known that calmodulin-dependent protein kinase
kinase-beta (CaMKKbeta) can phosphorylate and thereby activate AMPK,

  • but it was not the main AMPKK in liver.

CaMKK inhibitors had no effect on 5-aminoimidazole-4-carboxamide-1-beta-4-
ribofuranoside (AICAR) phosphorylation and activation of AMPK.

  • AICAR is taken into the celland converted to ZMP,
  • an AMP analogthat has been shown to activate AMPK.

Recent LKB1 knockout studies have shown that without LKB1,

  • electrical and AICAR stimulation of muscleresults in very little
    phosphorylation of AMPK and of ACC, providing evidence that
  • LKB1-STRAD-MO25 is the major AMPKK in muscle.

Two particular adipokines, adiponectin and leptin, have even been demonstrated
to regulate AMPK. A main functions of leptin in skeletal muscle is

  • the upregulation of fatty acid oxidation.

Leptin works by way of the AMPK signaling pathway, and adiponectin also
stimulates the oxidation of fatty acids via the AMPK pathway, and

  • Adiponectin also stimulates the uptake of glucose in skeletal muscle.

An increase in enzymes which specialize in glucose uptake in cells such as GLUT4
and hexokinase II are thought to be mediated in part by AMPK when it is activated.
Increases in AMPK activity are brought about by increases in the AMP:ATP ratio
during single bouts of exercise and long-term training.

One of the key pathways in AMPK’s regulation of fatty acid oxidation is the

  • phosphorylation and inactivation of acetyl-CoA carboxylase.
  1. Acetyl-CoA carboxylase (ACC) converts acetyl-CoA (ACA) to malonyl-CoA
    (MCA), an inhibitor of carnitine palmitoyltransferase 1 (CPT-1).
  2. CPT-1 transports fatty acids into the mitochondria for oxidation.
  3. Inactivation of ACC results in increased fatty acid transport and oxidation.
  4. the AMPK induced ACC inactivation  and reduced conversion to MCA
    may occur as a result of malonyl-CoA decarboxylase (MCD)
  5. MCD as an antagonist to ACC, decarboxylatesmalonyl-CoA to acetyl-CoA
    (reversal of ACC conversion of ACA to MCA)
  6. This resultsin decreased malonyl-CoA and increased CPT-1 and fatty acid oxidation.

AMPK also plays an important role in lipid metabolism in the liver. It has long been
known that hepatic ACC has been regulated in the liver.

  1. It phosphorylates and inactivates 3-hydroxy-3-methylglutaryl-CoA reductase (HMGCR)
  2. acetyl-CoA(ACA) is converted to mevalonic acid (MVA) by ACC
    with inhibition of CPT-1
  3. HMGR converts 3-hydroxy-3-methylglutaryl-CoA, which is made from MVA
  4. which then travels down several more metabolic steps to become cholesterol.

Insulin facilitates the uptake of glucose into cells via increased expression and
translocation of glucose transporter GLUT-4. In addition, glucose is phosphorylated
by hexokinase wheni iot enters the cell. The phosphorylated form keeps glucose from
leaving the cell,

  • The decreasedthe concentration of glucose molecules creates a gradient for more
    glucose to be transported into the cell.
AMPK and thyroid hormone regulate some similar processes. Knowing these similarities,
Winder and Hardie et al. designed an experiment to see if AMPK was influenced by thyroid
hormone. They found that all of the subunits of AMPK were increased in skeletal muscle,
especially in the soleus and red quadriceps, with thyroid hormone treatment. There was
also an increase in phospho-ACC, a marker of AMPK activity.
  •  Winder WW, Hardie DG (July 1999). “AMP-activated protein kinase,
    a metabolic master switch: possible roles in type 2 diabetes”. J. Physiol. 277
    (1 Pt 1): E1–10. PMID 10409121.
  • Winder WW, Hardie DG (February 1996). “Inactivation of acetyl-CoA
    carboxylase and activation of AMP-activated protein kinase in muscle
    during exercise”. J. Physiol. 270 (2 Pt 1): E299–304. PMID 8779952.
  • Hutber CA, Hardie DG, Winder WW (February 1997). “Electrical stimulation
    inactivates muscle acetyl-CoA carboxylase and increases AMP-activated
    protein kinase”. Am. J. Physiol. 272 (2 Pt 1): E262–6. PMID 9124333
  • Durante PE, Mustard KJ, Park SH, Winder WW, Hardie DG (July 2002).
    “Effects of endurance training on activity and expression of AMP-activated
    protein kinase isoforms in rat muscles”. Am. J. Physiol. Endocrinol.
    Metab. 283 (1): E178–86. doi:10.1152/ajpendo.00404.2001. PMID 12067859
  • Corton JM, Gillespie JG, Hardie DG (April 1994). “Role of the AMP-activated
    protein kinase in the cellular stress response”. Curr. Biol. 4 (4):
    315–24. doi:10.1016/S0960-9822(00)00070-1. PMID 7922340
  • Winder WW (September 2001). “Energy-sensing and signaling by
    AMP-activated protein kinase in skeletal muscle”. J. Appl. Physiol. 91 (3):
    1017–28. PMID 11509493
  • Suter M, Riek U, Tuerk R, Schlattner U, Wallimann T, Neumann D (October
    2006). “Dissecting the role of 5′-AMP for allosteric stimulation, activation,
    and deactivation of AMP-activated protein kinase”.  J. Biol. Chem.
    281 (43): 32207–6. doi:10.1074/jbc.M606357200. PMID 16943194


Part III. Pituitary-thyroid axis and diabetes mellitus
The Interface Between Thyroid and Diabetes Mellitus

Leonidas H. Duntas, Jacques Orgiazzi, Georg Brabant   Clin Endocrinol. 2011;75(1):1-9.
Interaction of Metformin and Thyroid Function

Metformin acts primarily by

  • suppressing hepatic gluconeogenesis via activation of AMPK
  • It has the opposite effects on hypothalamic AMPK,
    • inhibiting activity of the enzyme.
  • the metformin effects on hypothalamic AMPK activity will
    • counteractT3 effects at the hypothalamic level.
  • AMPK therefore represents a direct target for dual regulation
    • in the hypothalamic partitioning of energy homeostasis.
  • metformin crossesthe blood–brain barrier and
    • levels in the pituitary gland are substantially increased.
  • It convincinglysuppresses TSH

A recent study recruiting 66 patients with benign thyroid nodules furthermore
demonstrated that metformin significantly decreases nodule size in patients with
insulin resistance.[76] The effect of metformin, which was produced over a
6-month treatment period, parallelled a fall in TSH concentrations and achieved a
shrinkage amounting to 30% of the initial nodule size when metformin was
administered alone and up to 55% when it was added to ongoing LT4 treatment.

These studies reveal a

  • suppressive effect of metformin on TSH secretion patterns in
    hypothyroid patients, an effect that is apparently
  • independent of T4 treatment and does not alter the TH profile.
  • A rebound of TSH secretion occurs at about 3 months following metformin
    withdrawal.

It appears that recommendations for more frequent testing, on an annual to
biannual basis, seems justified in higher risk groups like patients over 50 or 55,
particularly with suggestive symptoms, raised antibody titres or dylipidaemia.
We thus would support the suggestion of an initial TSH and TPO antibody testing
which, as discussed, will help to predict the development of hypothyroidism in
patients with diabetes.

Hypothalamic AMPK and fatty acid metabolism mediate thyroid
regulation of energy 
balance
M López,  L Varela,  MJ Vázquez,  S Rodríguez-Cuenca, CR González, …, & Vidal-Puig
Nature Medicine  29 Aug 2010; 16: 1001–1008 http://dx.doi.org:/10.1038/nm.2207

Thyroid hormones have widespread cellular effects; however it is unclear whether
their effects on the central nervous system (CNS) contribute to global energy balance.
Here we demonstrate that either

  • whole-body hyperthyroidism or central administration of triiodothyronine
    (T3) decreases

    • the activity of hypothalamic AMP-activated protein kinase (AMPK),
    • increases sympathetic nervous system (SNS) activity and
    • upregulates thermogenic markers in brown adipose tissue (BAT).

Inhibition of the lipogenic pathway in the ventromedial nucleus of the hypothalamus
(VMH) prevents CNS-mediated activation of BAT by thyroid hormone and reverses
the weight loss associated with hyperthyroidism. Similarly, inhibition of thyroid
hormone receptors in the VMH reverses the weight loss associated with hyperthyroidism.

This regulatory mechanism depends on AMPK inactivation, as genetic inhibition of this
enzyme in the VMH of euthyroid rats induces feeding-independent weight loss and
increases expression of thermogenic markers in BAT. These effects are reversed by
pharmacological blockade of the SNS. Thus, thyroid hormone–induced modulation
of AMPK activity and lipid metabolism in the hypothalamus is a major regulator of
whole-body energy homeostasis.

Metabolic Basis for Thyroid Hormone Liver Preconditioning:
Upregulation of AMP-Activated Protein Kinase Signaling
  
LA Videla,1 V Fernández, P Cornejo, and R Vargas
1Molecular and Clinical Pharmacology Program, Institute of Biomedical Sciences,
Faculty of Medicine, University of Chile, 2Faculty of Medicine, Diego Portales University,
Santiago, Chile
Academic Editors: H. M. Abu-Soud and D. Benke
The Scientific World Journal 2012; 2012, ID 475675, 10 pp
http://dx.doi.org/10.1100/2012/475675

The liver is a major organ responsible for most functions of cellular metabolism and

  • a mediator between dietary and endogenous sources of energy for extrahepatic tissues.
  • In this context, adenosine-monophosphate- (AMP-) activated protein kinase (AMPK)
    constitutes an intrahepatic energy sensor
  • regulating physiological energy dynamics by limiting anabolism and stimulating
    catabolism, thus increasing ATP availability.
  • This is achieved by mechanisms involving direct allosteric activation and
    reversible phosphorylation of AMPK, in response to signals such as

    • energy status,
    • serum insulin/glucagon ratio,
    • nutritional stresses,
    • pharmacological and natural compounds, and
    • oxidative stress status.

Reactive oxygen species (ROS) lead to cellular AMPK activation and

  • downstream signaling under several experimental conditions.

Thyroid hormone (L-3,3′,5-triiodothyronine, T3) administration, a condition
that enhances liver ROS generation,

  • triggers the redox upregulation of cytoprotective proteins
    • affording preconditioning against ischemia-reperfusion (IR) liver injury.

Data discussed in this work suggest that T3-induced liver activation of AMPK

  • may be of importance in the promotion of metabolic processes
  • favouring energy supply for the induction and operation of preconditioning
    mechanisms.

These include

  1. antioxidant,
  2. antiapoptotic, and
  3. anti-inflammatory mechanisms,
  4. repair or resynthesis of altered biomolecules,
  5. induction of the homeostatic acute-phase response, and
  6. stimulation of liver cell proliferation,

which are required to cope with the damaging processes set in by IR.

The liver functions as a mediator between dietary and endogenous sources
of energy and extrahepatic organs that continuously require energy, mainly
the brain and erythrocytes, under cycling conditions between fed and fasted states.

In the fed state, where insulin action predominates, digestion-derived glucose is
converted to pyruvate via glycolysis, which is oxidized to produce energy, whereas
fatty acid oxidation is suppressed. Excess glucose can be either stored as hepatic
glycogen or channelled into de novo lipogenesis.

In the fasted state, considerable liver fuel metabolism changes occur due to decreased
serum insulin/glucagon ratio, with higher glucose production as a consequence of
stimulated glycogenolysis and gluconeogenesis (from alanine, lactate, and glycerol).

Major enhancement in fatty acid oxidation also occurs to provide energy for liver
processes and ketogenesis to supply metabolic fuels for extrahepatic tissues. For these
reasons, the liver is considered as the metabolic processing organ of the body, and
alterations in liver functioning affect whole-body metabolism and energy homeostasis.

In this context, adenosine-monophosphate- (AMP-) activated protein kinase (AMPK)
is the downstream component of a protein kinase cascade acting as an

  • intracellular energy sensor regulating physiological energy dynamics by
  • limiting anabolic pathways, to prevent excessive adenosine triphosphate (ATP)
    utilization, and
  • by stimulating catabolic processes, to increase ATP production.

Thus, the understanding of the mechanisms by which liver AMPK coordinates hepatic
energy metabolism represents a crucial point of convergence of regulatory signals
monitoring systemic and cellular energy status

Liver AMPK: Structure and Regulation

AMPK, a serine/threonine kinase, is a heterotrimeric complex comprising

  1. a catalytic subunit α and
  2. two regulatory subunits β and γ .

The α subunit has a threonine residue (Thr172) within the activation loop of the kinase
domain, with the C-terminal region being required for association with β and γ subunits.
The β subunit associates with α and γ by means of its C-terminal region , whereas

  • the γ subunit has four cystathionine β-synthase (CBS) motifs, which
  • bind AMP or ATP in a competitive manner.

75675.fig.001 (not shown)

Figure 1: Regulation of AMP-activated protein kinase (AMPK) by
(A) direct allosteric activation and
(B) reversible phosphorylation and downstream responses maintaining
intracellular energy balance.

Regulation of liver AMPK activity involves both direct allosteric activation and
reversible phosphorylation. AMPK is allosterically activated by AMP through

  • binding to the regulatory subunit-γ, which induces a conformational change in
    the kinase domain of subunit α that protects AMPK from dephosphorylation
    of Thr172, probably by protein phosphatase-2C.

Activation of AMPK requires phosphorylation of Thr172 in its α subunit, which can be
attained by either

(i) tumor suppressor LKB1 kinase following enhancement in the AMP/ATP ratio, a
kinase that plays a crucial role in AMPK-dependent control of liver glucose and
lipid metabolism;

(ii) Ca2+-calmodulin-dependent protein kinase kinase-β (CaMKKβ) that
phosphorylates AMPK in an AMP-independent, Ca2+-dependent manner;

(iii) transforming growth-factor-β-activated kinase-1 (TAK1), an important
kinase in hepatic Toll-like receptor 4 signaling in response to lipopolysaccharide.

Among these kinases, the relevance of CaMKKβ and TAK1 in liver AMPK activation
remains to be established in metabolic stress conditions. Both allosteric and
phosphorylation mechanisms are able to elicit

  • over 1000-fold increase in AMPK activity, thus allowing
  • the liver to respond to small changes in energy status in a highly sensitive fashion.

In addition to rapid AMPK regulation through allosterism and reversible phosphorylation

  • long-term effects of AMPK activation induce changes in hepatic gene expression.

This was demonstrated for

(i) the transcription factor carbohydrate-response element-binding protein (ChREBP),

  • whose Ser568 phosphorylation by activated AMPK
  • blocks its DNA binding capacity and glucose-induced gene transcription
  • under hyperlipidemic conditions;(ii) liver sterol regulatory element-binding
    protein-1c (SREBP-1c), whose mRNA and protein expression and those of
    its target gene for fatty acid synthase (FAS)
  • are reduced by metformin-induced AMPK activation,
  • decreasing lipogenesis and increasing fatty acid oxidation due to
    malonyl-CoA depletion;

(iii) transcriptional coactivator transducer of regulated CREB activity-2 (TORC2),
a crucial component of the hepatic gluconeogenic program, was reported
to be phosphorylated by activated AMPK.

This modification leads to subsequent cytoplasmatic sequestration of TORC2 and
inhibition of gluconeogenic gene expression, a mechanism underlying

  • the plasma glucose-lowering effects of adiponectin and metformin
  • through AMPK activation by upstream LKB1.

Activation of AMPK in the liver is a key regulatory mechanism controlling glucose
and lipid metabolism,

  1. inhibiting anabolic processes, and
  2. enhancing catabolic pathways in response to different signals, including
    1. energy status,
    2. serum insulin/glucagon ratio,
    3. nutritional stresses,
    4. pharmacological and natural compounds, and
    5. oxidative stress status

Reactive Oxygen Species (ROS) and AMPK Activation

The high energy demands required to cope with all the metabolic functions
of the liver are met by

  • fatty acid oxidation under conditions of both normal blood glucose levels and
    hypoglycemia, whereas
  • glucose oxidation is favoured in hyperglycemic states, with consequent
    generation of ROS.

Under normal conditions, ROS occur at relatively low levels due to their fast processing
by antioxidant mechanisms, whereas at acute or prolonged high ROS levels, severe
oxidation of biomolecules and dysregulation of signal transduction and gene expression
is achieved, with consequent cell death through necrotic and/or apoptotic-signaling
pathways.

Thyroid Hormone (L-3,3′,5-Triiodothyronine, T3), Metabolic Regulation,
and ROS Production

T3 is important for the normal function of most mammalian tissues, with major actions
on O2 consumption and metabolic rate, thus

  • determining enhancement in fuel consumption for oxidation processes
  • and ATP repletion.

T3 acts predominantly through nuclear receptors (TR) α and β, forming

  • functional complexes with retinoic X receptor that
  • bind to thyroid hormone response elements (TRE) to activate gene expression.

T3 calorigenesis is primarily due to the

  • induction of enzymes related to mitochondrial electron transport and ATP
    synthesis, catabolism, and
  • some anabolic processes via upregulation of genomic mechanisms.

The net result of T3 action is the enhancement in the rate of O2 consumption of target
tissues such as liver, which may be effected by secondary processes induced by T3

(i) energy expenditure due to higher active cation transport,

(ii) energy loss due to futile cycles coupled to increase in catabolic and anabolic pathways, and

(iii) O2 equivalents used in hepatic ROS generation both in hepatocytes and Kupffer cells

In addition, T3-induced higher rates of mitochondrial oxidative phosphorylation are
likely to induce higher levels of ATP, which are partially balanced by intrinsic uncoupling
afforded by induction of uncoupling proteins by T3. In agreement with this view, the
cytosolic ATP/ADP ratio is decreased in hyperthyroid tissues, due to simultaneous
stimulation of ATP synthesis and consumption.

Regulation of fatty acid oxidation is mainly attained by carnitine palmitoyltransferase Iα (CPT-Iα),

  • catalyzing the transport of fatty acids from cytosol to mitochondria for β-oxidation,
    and acyl-CoA oxidase (ACO),
  • catalyzing the first rate-limiting reaction of peroxisomal β-oxidation, enzymes that are
    induced by both T3 and peroxisome proliferator-activated receptor α (PPAR-α).

Furthermore, PPAR-α-mediated upregulation of CPT-Iα mRNA is enhanced by PPAR-γ
coactivator 1α (PGC-1α), which in turn

  • augments T3 induction of CPT-Iα expression.

Interestingly, PGC-1α is induced by

  1. T3,
  2. AMPK activation, and
  3. ROS,

thus establishing potential links between

  • T3 action, ROS generation, and AMPK activation

with the onset of mitochondrial biogenesis and fatty acid β-oxidation.

Liver ROS generation leads to activation of the transcription factors

  1. nuclear factor-κB (NF-κB),
  2. activating protein 1 (AP-1), and
  3. signal transducer and activator of transcription 3 (STAT3)

at the Kupffer cell level, with upregulation of cytokine expression (TNF-α, IL-1, IL-6),
which upon interaction with specific receptors in hepatocytes trigger the expression of

  1. cytoprotective proteins (Figure 3(A)).

These responses and the promotion of hepatocyte and Kupffer-cell proliferation
represent hormetic effects reestablishing

  1. redox homeostasis,
  2. promoting cell survival, and
  3. protecting the liver against ischemia-reperfusion injury.

T3 liver preconditioning also involves the activation of the

  1. Nrf2-Keap1 defense pathway
  • upregulating antioxidant proteins,
  • phase-2 detoxifying enzymes, and
  • multidrug resistance proteins, members of the ATP binding cassette (ABC)
    superfamily of transporters (Figure 3(B))

In agreement with T3-induced liver preconditioning, T3 or L-thyroxin afford
preconditioning against IR injury in the heart, in association with

  • activation of protein kinase C and
  • attenuation of p38 and
  • c-Jun-N-terminal kinase activation ,

and in the kidney, in association with

  • heme oxygenase-1 upregulation.

475675.fig.002

http://www.hindawi.com/journals/tswj/2012/floats/475675/thumbnails/475675.fig.002_th.jpg

Figure 2: Calorigenic response of thyroid hormone (T3) and its relationship with O2
consumption, reactive oxygen species (ROS) generation, and antioxidant depletion in the liver.
Abbreviations: CYP2E1, cytochrome P450 isoform 2E1; GSH, reduced glutathione; QO2, rate
of O2 consumption; SOD, superoxide dismutase.

475675.fig.003

genomic signaling in T3 calorigenesis and ROS production 475675.fig.003

genomic signaling in T3 calorigenesis and ROS production 475675.fig.003

http://www.hindawi.com/journals/tswj/2012/floats/475675/thumbnails/475675.fig.003_th.jpg

Figure 3: Genomic signaling mechanisms in T3 calorigenesis and liver reactive oxygen
species (ROS) production leading to
(A) upregulation of cytokine expression in Kupffer cells and hepatocyte activation of genes
conferring cytoprotection,
(B) Nrf2 activation controling expression of antioxidant and detoxication proteins, and
(C) activation of the AMPK cascade regulating metabolic functions.Abbreviations: AP-1, activating protein 1; ARE, antioxidant responsive element; CaMKKβ,
Ca2+-calmodulin-dependent kinase kinase-β; CBP, CREB binding protein; CRC, chromatin
remodelling complex; EH, epoxide hydrolase; HO-1, hemoxygenase-1; GC-Ligase,
glutamate cysteine ligase; GPx, glutathione peroxidase; G-S-T, glutathione-S-transferase;
HAT, histone acetyltransferase; HMT, histone arginine methyltransferase; IL1,
interleukin 1; iNOS, inducible nitric oxide synthase; LKB1, tumor suppressor LKB1 kinase;
MnSOD, manganese superoxide dismutase; MRPs, multidrug resistance proteins; NF-κB,
nuclear factor-κB; NQO1, NADPH-quinone oxidoreductase-1; NRF-1, nuclear respiratory
factor-1; Nrf2, nuclear receptor-E2-related factor 2; PCAF, p300/CBP-associated
factor; RXR, retinoic acid receptor; PGC-1, peroxisome proliferator-activated receptor-γ
coactivator-1; QO2, rate of O2 consumption; STAT3, signal transducer and activator
of transcription 3; TAK1, transforming-growth-factor-β-activated kinase-1; TNF-α, tumor
necrosis factor-α; TR, T 3 receptor; TRAP, T3-receptor-associated protein; TRE,  T3 responsive element; UCP, uncoupling proteins; (—), reported mechanisms;
(- - - -), proposed mechanisms.


T3 is a key metabolic regulator coordinating short-term and long-term energy needs,
with major actions on liver metabolism. These include promotion of

(i) gluconeogenesis and hepatic glucose production, and

(ii) fatty acid oxidation coupled to enhanced adipose tissue lipolysis, with

  • higher fatty acid flux to the liver and
  • consequent ROS production (Figure 2) and
  • redox upregulation of cytoprotective proteins

affording liver preconditioning (Figure 3).

Thyroid Hormone and AMPK Activation: Skeletal Muscle and Heart

In skeletal muscle, T3 increases the levels of numerous proteins involved in

  1. glucose uptake (GLUT4),
  2. glycolysis (enolase, pyruvate kinase, triose phosphate isomerase),
  3. fatty acid oxidation (carnitine palmitoyl transferase-1, mitochondrial thioesterase I),
    and uncoupling protein-3,

effects that are achieved through enhanced transcription of TRE-containing genes

Skeletal muscle AMPK activation is characterized by

(i) being a rapid and transient response,

(ii) upstream activation by Ca2+-induced mobilization and CaMKKβ activation,

(iii) upstream upregulation of LKB1 expression, which requires association with STRAD
and MO25 for optimal phosphorylation/activation of AMPK, and

(iv) stimulation of mitochondrial fatty acid β-oxidation.

T3-induced muscle AMPK activation was found to trigger two major downstream

signaling pathways, namely,

(i) peroxisome proliferator-activated receptor-γ coactivator-1α (PGC-1α) mRNA
expression and phosphorylation, a transcriptional regulator for genes related to

  • mitochondrial biogenesis,
  • fatty acid oxidation, and
  • gluconeogenesis and

(ii) cyclic AMP response element binding protein (CREB) phosphorylation, which

  • in turn induces PGC-1α expression in liver tissue, thus
  • reinforcing mechanism (i).

These data indicate that AMPK phosphorylation of PGC-1α initiates many of the
important gene regulatory functions of AMPK in skeletal muscle.

In heart, hyperthyroidism increased glycolysis and sarcolemmal GLUT4 levels by the
combined effects of AMPK activation and insulin stimulation, with concomitant increase
in fatty acid oxidation proportional to enhanced cardiac mass and contractile function.

Thyroid Hormone, AMPK Activation, and Liver Preconditioning

Recent studies by our group revealed that administration of a single dose of 0.1 mg T3/kg
to rats activates liver AMPK (Figure 4; unpublished work).

  1. enhancement in phosphorylated AMPK/nonphosphorylated AMPK ratios in T3-
    treated rats over control values thatis significant in the time period of 1 to 48
    hours after hormone treatment
  2. Administration of a substantially higher dose (0.4 mg T3/kg) resulted in
    decreased liver AMPK activation at 4 h to return to control values at 6 h
    after treatment

Activation of liver AMPK by T3 may be of relevance in terms of

  • promotion of fatty acid oxidation for ATP supply,
  • supporting hepatoprotection against IR injury (Figure 3(C)).

This proposal is based on the high energy demands underlying effective liver
preconditioning for full operation of hepatic

  • antioxidant, antiapoptotic, and anti-inflammatory mechanisms,
  • oxidized biomolecules repair or resynthesis,
  • induction of the homeostatic acute-phase response, and
  • promotion of hepatocyte and Kupffer cell proliferation,

mechanisms that are needed to cope with the damaging processes set in by IR.
T3 liver preconditioning , in addition to that afforded by

  • n-3 long-chain polyunsaturated fatty acids given alone or
  • combined with T3 at lower dosages, or
  • by iron supplementation,

constitutes protective strategies against hepatic IR injury.

Studies on the molecular mechanisms underlying T3-induced liver AMPK
activation (Figure 4) are currently under assessment in our laboratory.

References

Fernández and L. A. Videla, “Kupffer cell-dependent signaling in thyroid hormone
calorigenesis: possible applications for liver preconditioning,” Current Signal
Transduction Therapy 2009; 4(2): 144–151.

Viollet, B. Guigas, J. Leclerc et al., “AMP-activated protein kinase in the regulation
of  hepatic energy metabolism: from physiology to therapeutic perspectives,” Acta
Physiologica 2009; 196(1): 81–98.

Carling, “The AMP-activated protein kinase cascade – A unifying system
for energy control,” Trends in Biochemical Sciences, 2004;. 29(1): 18–24.

E. Kemp, D. Stapleton, D. J. Campbell et al., “AMP-activated protein kinase,
super 
metabolic regulator,” Biochemical Society Transactions 2003; 31(1):
162–168
.

G. Hardie, “AMP-activated protein kinase-an energy sensor that
regulates all ;aspects of cell function,” Genes and Development,
2011; 25(18): 1895–1908.

Woods, P. C. F. Cheung, F. C. Smith et al., “Characterization of AMP-activated
protein kinase βandγ subunits Assembly of the heterotrimeric complex in vitro,”
Journal of Biological Chemistry 1996;271(17): 10282–10290.

Xiao, R. Heath, P. Saiu et al., “Structural basis for AMP binding to mammalian AMP-
activated protein kinase,” Nature 2007; 449(7161): 496–500.

more…

Impact of Metformin and compound C on NIS expression and iodine uptake in vitro and in vivo: a role for CRE in AMPK modulation of thyroid function.
Abdulrahman RM1, Boon MR, Sips HC, Guigas B, Rensen PC, Smit JW, Hovens GC.
Author information 
Thyroid. 2014 Jan;24(1):78-87.  Epub 2013 Sep 25.  PMID: 23819433
http://dx.doi.org:/10.1089/thy.2013.0041.

Although adenosine monophosphate activated protein kinase (AMPK) plays a crucial role
in energy metabolism, a direct effect of AMPK modulation on thyroid function has only
recently been reported, and much of its function in the thyroid is currently unknown.

The aim of this study was

  1. to investigate the mechanism of AMPK modulation in iodide uptake.
  2. to investigate the potential of the AMPK inhibitor compound C as an enhancer of
    iodide uptake by thyrocytes.

Metformin reduced NIS promoter activity (0.6-fold of control), whereas compound C
stimulated its activity (3.4-fold) after 4 days. This largely coincides with

  • CRE activation (0.6- and 3.0-fold).

These experiments show that AMPK exerts its effects on iodide uptake, at least partly,
through the CRE element in the NIS promoter. Furthermore, we have used AMPK-alpha1
knockout mice to determine the long-term effects of AMPK inhibition without chemical compounds.
These mice have a less active thyroid, as shown by reduced colloid volume and reduced
responsiveness to thyrotropin.

NIS expression and iodine uptake in thyrocytes

  • can be modulated by metformin and compound C.

These compounds exert their effect by

  • modulation of AMPK, which, in turn, regulates
  • the activation of the CRE element in the NIS promoter.

Overall, this suggests that AMPK modulating compounds may be useful for the
enhancement of iodide uptake by thyrocytes, which could be useful for the
treatment of thyroid cancer patients with radioactive iodine.

AMPK: Master Metabolic Regulator

© 1996–2013 themedicalbiochemistrypage.org, LLC | info
@ themedicalbiochemistrypage.org

AMPK-activating drugs metformin or phenformin might provide protection against cancer 1741-7007-11-36-5

AMPK-activating drugs metformin or phenformin might provide protection against cancer 1741-7007-11-36-5


AMPK and AMPK-related kinase (ARK) family 1741-7007-11-36-4

AMPK and AMPK-related kinase (ARK) family 1741-7007-11-36-4


central role of AMPK in the regulation of metabolism


AMP-activated protein kinase (AMPK) was first discovered as an activity that

AMPK induces a cascade of events within cells in response to the ever changing energy
charge of the cell. The role of AMPK in regulating cellular energy charge places this
enzyme at a central control point in maintaining energy homeostasis.

More recent evidence has shown that AMPK activity can also be regulated by physiological stimuli, independent of the energy charge of the cell, including hormones and nutrients.


Once activated, AMPK-mediated phosphorylation events

These events are rapidly initiated and are referred to as

  • short-term regulatory processes.

The activation of AMPK also exerts

  • long-term effects at the level of both gene expression and protein synthesis.

Other important activities attributable to AMPK are

  1. regulation of insulin synthesis and
  2. secretion in pancreatic islet β-cells and
  3. modulation of hypothalamic functions involved in the regulation of satiety.

How these latter two functions impact obesity and diabetes will be discussed below.

Regulation of AMPK

In the presence of AMP the activity of AMPK is increased approximately 5-fold.
However, more importantly is the role of AMP in regulating the level of phosphorylation
of AMPK. An increased AMP to ATP ratio leads to a conformational change in the γ-subunit
leading to increased phosphorylation and decreased dephosphorylation of AMPK.

The phosphorylation of AMPK results in activation by at least 100-fold. AMPK is
phosphorylated by at least three different upstream AMPK kinases (AMPKKs).
Phosphorylation of AMPK occurs in the α subunit at threonine 172 (T172) which

  • lies in the activation loop.

One kinase activator of AMPK is

  • Ca2+-calmodulin-dependent kinase kinase β (CaMKKβ)
  • which phosphorylates and activates AMPK in response to increased calcium.

The distribution of CaMKKβ expression is primarily in the brain with detectable levels
also found in the testes, thymus, and T cells. As described for the Ca2+-mediated
regulation of glycogen metabolism,

  • increased release of intracellular stores of Ca2+ create a subsequent demand for
    ATP.

Activation of AMPK in response to Ca fluxes

  • provides a mechanism for cells to anticipate the increased demand for ATP.

Evidence has also demonstrated that the serine-threonine kinase, LKB1 (also called
serine-threonine kinase 11, STK11) which is encoded by the Peutz-Jeghers syndrome
tumor suppressor gene, is required for activation of AMPK in response to stress.

The active LKB1 kinase is actually a complex of three proteins:

  1. LKB1,
  2. Ste20-related adaptor (STRAD) and
  3. mouse protein 25 (MO25).

Thus, the enzyme complex is often referred to as LKB1-STRAD-MO25. Phosphorylation
of AMPK by LKB1 also occurs on T172. Unlike the limited distribution of CaMKKβ,

  • LKB1 is widely expressed, thus making it the primary AMPK-regulating kinase.

Loss of LKB1 activity in adult mouse liver leads to

  • near complete loss of AMPK activity and
  • is associated with hyperglycemia.

The hyperglycemia is, in part, due to an increase in the transcription of gluconeogenic
genes. Of particular significance is the increased expression of

  • the peroxisome proliferator-activated receptor-γ (PPAR-γ) coactivator 1α
    (PGC-1α), which drives gluconeogenesis.
  • Reduction in PGC-1α activity results in normalized blood glucose levels in
    LKB1-deficient mice.

The third AMPK phosphorylating kinase is transforming growth factor-β-activated
kinase 1 (TAK1). However, the normal physiological conditions under which TAK1
phosphorylates AMPK are currently unclear.

The effects of AMP are two-fold:

  1. a direct allosteric activation and making AMPK a poorer substrate for
    dephosphorylation.

Because AMP affects both
the rate of AMPK phoshorylation in the positive direction and
dephosphorylation in the negative direction,

the cascade is ultrasensitive. This means that

  1. a very small rise in AMP levels can induce a dramatic increase in the activity of
    AMPK.

The activity of adenylate kinase, catalyzing the reaction shown below, ensures that

  • AMPK is highly sensitive to small changes in the intracellular [ATP]/[ADP] ratio.

2 ADP ——> ATP + AMP

Negative allosteric regulation of AMPK also occurs and this effect is exerted by
phosphocreatine. As indicated above, the β subunits of AMPK have a glycogen-binding domain, GBD. In muscle, a high glycogen content

  • represses AMPK activity and
  • this is likely the result of interaction between the GBD and glycogen,
  • the GBD of AMPK allows association of the enzyme with the regulation of glycogen metabolism
  • by placing AMPK in close proximity to one of its substrates glycogen synthase.

AMPK has also been shown to be activated by receptors that are coupled to

  • phospholipase C-β (PLC-β) and by
  • hormones secreted by adipose tissue (termed adipokines) such as leptinand adiponectin (discussed below).

Targets of AMPK

The signaling cascades initiated by the activation of AMPK exert effects on

  • glucose and lipid metabolism,
  • gene expression and
  • protein synthesis.

These effects are most important for regulating metabolic events in the liver, skeletal
muscle, heart, adipose tissue, and pancreas.

Demonstration of the central role of AMPK in the regulation of metabolism in response
to events such as nutrient- or exercise-induced stress. Several of the known physiologic
targets for AMPK are included as well as several pathways whose flux is affected by
AMPK activation. Arrows indicate positive effects of AMPK, whereas, T-lines indicate
the resultant inhibitory effects of AMPK action.

The uptake, by skeletal muscle, accounts for >70% of the glucose removal from the
serum in humans. Therefore, it should be obvious that this event is extremely important
for overall glucose homeostasis, keeping in mind, of course, that glucose uptake by
cardiac muscle and adipocytes cannot be excluded from consideration. An important fact
related to skeletal muscle glucose uptake is that this process is markedly impaired in
individuals with type 2 diabetes.

The uptake of glucose increases dramatically in response to stress (such as ischemia) and
exercise and is stimulated by insulin-induced recruitment of glucose transporters
to the plasma membrane, primarily GLUT4. Insulin-independent recruitment of glucose
transporters also occurs in skeletal muscle in response to contraction (exercise).

The activation of AMPK plays an important, albeit not an exclusive, role in the induction of
GLUT4 recruitment to the plasma membrane. The ability of AMPK to stimulate
GLUT4 translocation to the plasma membrane in skeletal muscle is by a different mechanism
than that stimulated by insulin and insulin and AMPK effects are additive.

Under ischemic/hypoxic conditions in the heart the activation of AMPK leads to the
phosphorylation and activation of the kinase activity of phosphofructokinase-2, PFK-2
(6-phosphofructo-2-kinase). The product of the action of PFK-2 (fructose-2,6-bisphosphate,
F2,6BP) is one of the most potent regulators of the rate of flux through
glycolysis and gluconeogenesis.

In liver the PKA-mediated phosphorylation of PFK-2 results in conversion of the
enzyme from a kinase that generates F2,6BP to a phosphatase that removes the
2-phosphate thus reducing the levels of the potent allosteric activator of the glycolytic
enzyme 6-phosphfructo-1-kinase, PFK-1 and the potent allosteric inhibitor
of the gluconeogenic enzyme fructose-1,6-bisphosphatase (F1,-6BPase).

It is important to note that like many enzymes, there are multiple isoforms of PFK-2
(at least 4) and neither the liver or the skeletal muscle isoforms contain the AMPK
phosphorylation sites found in the cardiac and inducible (iPFK2) isoforms of PFK-2.

Inducible PFK-2 is expressed in the monocyte/macrophage lineage in response to pro-
inflammatory stimuli. The ability to activate the kinase activity by phosphorylation of
PFK-2 in cardiac tissue and macrophages in response to ischemic conditions allows these
cells to continue to have a source of ATP via anaerobic glycolysis. This phenomenon is
recognized as the Pasteur effect: an increased rate of glycolysis in response to hypoxia.

Of pathological significance is the fact that the inducible form of PFK-2 is commonly
expressed in many tumor cells and this may allow AMPK to play an important role in
protecting tumor cells from hypoxic stress. Indeed, techniques for depleting AMPK in
tumor cells have shown that these cells become sensitized to nutritional stress upon loss
of AMPK activity.

Whereas, stress and exercise are powerful inducers of AMPK activity in skeletal muscle,
additional regulators of its activity have been identified.

Insulin-sensitizing drugs of the thiazolidinedione family (activators of PPAR-γ, see
below) as well as the hypoglycemia drug metformin exert a portion of their effects
through regulation of the activity of AMPK.

As indicated above, the activity of the AMPK activating kinase, LKB1, is critical for
regulating gluconeogenic flux and consequent glucose homeostasis. The action of
metformin in reducing blood glucose levels

  • requires the activity of LKB1 in the liver for this function.

Also, several adipokines (hormones secreted by adipocytes) either stimulate or inhibit
AMPK activation:

  1. leptin and adiponectin have been shown to stimulate AMPK activation, whereas,
  2. resistininhibits AMPK activation.

Cardiac effects exerted by activation of AMPK also include

AMPK-mediated phosphorylation of eNOS leads to increased activity and consequent
NO production and provides a link between metabolic stresses and cardiac function.

In platelets, insulin action leads to an increase in eNOS activity that is

  • due to its phosphorylation by AMPK.

Activation of NO production in platelets leads to

  • a decrease in thrombin-induced aggregation, thereby,
  • limiting the pro-coagulant effects of platelet activation.

The response of platelets to insulin function clearly indicates why disruption in insulin
action is a major contributing factor in the development of the metabolic syndrome

Activation of AMPK leads to a reduction in the level of SREBP

  • a transcription factor &regulator of the expression of numerous
    lipogenic enzymes

Another transcription factor reduced in response to AMPK activation is

  • hepatocyte nuclear factor 4α, HNF4α
    • a member of the steroid/thyroid hormone superfamily.
    • HNF4α is known to regulate the expression of several liver and
      pancreatic β-cell genes such as GLUT2, L-PK and preproinsulin.
  • Of clinical significance is that mutations in HNF4α are responsible for
    • maturity-onset diabetes of the young, MODY-1.

Recent evidence indicates that the gene for the carbohydrate-response-element-
binding protein (ChREBP) is a target for AMPK-mediated transcriptional regulation
in the liver. ChREBP is rapidly being recognized as a master regulator of lipid
metabolism in liver, in particular in response to glucose uptake.

The target of the thiazolidinedione (TZD) class of drugs used to treat type 2 diabetes is
the peroxisome proliferator-activated receptor γ, PPARγ which

  • itself may be a target for the action of AMPK.

The transcription co-activator, p300, is phosphorylated by AMPK

  • which inhibits interaction of p300 with not only PPARγ but also
  • the retinoic acid receptor, retinoid X receptor, and
  • thyroid hormone receptor.

PPARγ is primarily expressed in adipose tissue and thus it was difficult to reconcile how
a drug that was apparently acting only in adipose tissue could lead to improved insulin
sensitivity of other tissues. The answer to this question came when it was discovered that the TZDs stimulated the expression and release of the adipocyte hormone (adipokine),
adiponectin. Adiponectin stimulates glucose uptake and fatty acid oxidation in skeletal
muscle. In addition, adiponectin stimulates fatty acid oxidation in liver while inhibiting
expression of gluconeogenic enzymes in this tissue.

These responses to adiponectin are exerted via activation of AMPK. Another
transcription factor target of AMPK is the forkhead protein, FKHR (now referred to as
FoxO1). FoxO1 is involved in the activation of glucose-6-phosphatase expression and,
therefore, loss of FoxO1 activity in response to AMPK activation will lead to reduced
hepatic output of glucose.

This concludes a very complicated perspective that ties together the thyroid hormone
activity, the hypophysis, diabetes mellitus, and AMPK tegulation of metabolism in the
liver, skeletal muscle, adipose tissue, and heart.  I also note at this time that there
nongenetic points to be made here:

  1. The tissue specificity of isoenzymes
  2. The modulatory role of AMP:ATP ratio in phosphorylation/dephosphorylation
    effects on metabolism tied to AMPK
  3. The tie in of stress or ROS with fast reactions to protect harm to tissues
  4. The relationship of cytokine activation and release to the above metabolic events
  5. The relationship of effective and commonly used diabetes medications to AMPK
    mediated processes
  6. The preceding presentation is notable for the importance of proteomic and
    metabolomic invetigations in elucidation common chronic and nongenetic diseases


Read Full Post »

Somatic, germ-cell, and whole sequence DNA in cell lineage and disease profiling

Curator: Larry H Bernstein, MD, FCAP

In humans, mitochondrial DNA spans about 16,500 DNA building blocks (base pairs), representing a small fraction of the total DNA in cells. Mitochondrial DNA contains 37 genes, essential for normal mitochondrial function and thirteen of them provide instructions for making enzymes involved in inner membrane function. The remaining 24 genes are transcribed into transfer RNA (tRNA) and ribosomal RNA (rRNA), which are needed to transfer amino acids into proteins.

Somatic mutations occur in the DNA of certain cells during a person’s lifetime and typically are not passed to future generations.  They differ from germ-line mutations that have a lineal descent from the maternal parent, and they occur later in life.  Mutations in the sperm DNA are not carried on to future generations, as the sperm mitochondria are destroyed after the egg is fertilized.

There is limited evidence linking somatic mutations in mitochondrial DNA with certain cancers, including breast, colon, stomach, liver, and kidney tumors. These mutations might also be associated with cancer of blood-forming tissue (leukemia) and cancer of immune system cells (lymphoma).  There are many heritable diseases that are related to germ-line mutations, and germ-line mutations have a role in many common diseases.  Mitochondrial DNA is particularly vulnerable to the effects of reactive oxygen species (ROS), and with a limited ability of the mitochondrion to repair itself, ROS easily damage mitochondrial DNA.  The repair mechanism is tied to ubiquitinylation system.  A  list of disorders associated with mitochondrial genes  is provided from Wikipedia.

Inherited changes in mitochondrial DNA may be associated with pathologies in growth and development, and multiorgan system disorders, as mutations disrupt the mitochondria’s ability to generate the cell’s energy. The effects of these conditions are most pronounced in organs and tissues with high energy requirements (such as the heart, brain, and muscles). Although the health consequences of inherited mitochondrial DNA mutations vary widely, some frequently observed features include muscle weakness and wasting, problems with movement, diabetes, kidney failure, heart disease, loss of intellectual functions (dementia), hearing loss, and abnormalities involving the eyes and vision.

A buildup of somatic mutations in mitochondrial DNA has been considered to have a role in or associated with increased risk of certain age-related disorders such as heart disease, Alzheimer disease, and Parkinson disease, and the severity of many mitochondrial disorders is thought to be associated with the percentage of mitochondria affected by a particular genetic change. Consequently, the progressive accumulation of these mutations over a person’s lifetime may play a role in aging.

Mitochondrial DNA is typically diagrammed as a circular structure with genes and regulatory regions labeled.

Mitochondrial DNA

Mitochondrial DNA

http://ghr.nlm.nih.gov/html/images/chromosomeIdeograms/mitochondria/wholeMitochondria.jpg

Additional Resources:

  • Additional NIH Resources – National Institutes of Health

NHGRI Talking Glossary: Mitochondrial DNA

mtDNA : The Eve Gene –  by Stephen Oppenheimer

Mutations are a cumulative dossier of our own maternal prehistory. The main task of DNA is to copy itself to each new generation. We can use these mutations to reconstruct a genetic tree of mtDNA, because each new mtDNA mutation in a prospective mother’s ovum will be transferred in perpetuity to all her descendants down the female line. Each new female line is thus defined by the old mutations as well as the new ones.

By looking at the DNA code in a sample of people alive today, and piecing together the changes in the code that have arisen down the generations, biologists can trace the line of descent back in time to a distant shared ancestor. Because we inherit mtDNA only from our mother, this line of descent is a picture of the female genealogy of the human species.

formation of gene trees

formation of gene trees

The diagram above shows the drawing of gene trees using single mutations

http://www.bradshawfoundation.com/journey/images/gene-diagram3.gif

Not only can we retrace the tree, but by taking into account here the sampled people came from, we can see where certain mutations occurred – for example, whether in Europe, or Asia, or Africa. What’s more, because the changes happen at a statistically consistent (though random) rate, we can approximate the time when they happened.  This has made it possible, during the late 1990s and in the new century, for us to do something that anthropologists of the past could only have dreamt of: we can now trace the migrations of modern humans around our planet.

It turns out that the oldest changes in our mtDNA took place in Africa 150,000 – 190,000 years ago. Then new mutations start to appear in Asia, about 60,000 – 80,000 years ago. This tells us that modern humans evolved in Africa, and that some of us migrated out of Africa into Asia after 80,000 years ago.  A method established in 1996, which dates each branch of the gene tree by averaging the number of new mutations in daughter types of that branch, has stood the test of time.

A final point on the methods of genetic tracking of migrations: it is important to distinguish this new approach to tracing the history of molecules on a DNA tree, known as phylogeography (literally ‘tree-geography’), from the mathematical study of the history of whole human populations, which has been used for decades and is known as classical population genetics.

The two disciplines are based on the same Mendelian biological principles, but have quite different aims and assumptions, and the difference is the source of much misunderstanding and controversy. The simplest way of explaining it is that phylogeography studies the prehistory of individual DNA molecules, while population genetics studies the prehistory of populations. Put another way, each human population contains multiple versions of any particular DNA molecule, each with its own history and different origin.

gene-diagram

gene-diagram

The diagram above shows the tracing of gene spread geographically.
Green disks represent migrant new growth on the tree
http://www.bradshawfoundation.com/journey/images/gene-diagram4.gif

http://www.bradshawfoundation.com/journey/eve.html

David Moskowitz, MD, PhD
Founder and President, GenoMed


Germline genes make the best drug targets

  • They operate earliest in the disease pathway
  • Unlike tissue-expressed genes, which operate years after the disease began
  • But which everybody else is using as drug targets

Variation in germline DNA is where all disease starts

  • Cancer patients overexpress oncogenes and underexpress tumor suppressors

beginning in their germline DNA

  • Mutations in tumor DNA are “private”
  • Each tumor is a “snowflake”

Tumor-expressed genes can be compensatory, not causative

  • “Passengers, not drivers”
  • We have the drivers

Tumorigenesis SNPs

Using a SNPnet™ covering only 1/3 of the genome, we found about

2,500 genes associated with each of 6 different cancers in whites

  • Nobody else has found any yet
  • This will change in 2-3 years

We estimate 10,000 genes per cancer

What cellular program takes up 1/3-1/2 of the genome?

What program takes up >1/3 of the genome?

  • Differentiation…

Does sporadic cancer arise when a tissue stem cell fails to differentiate?

  • In the embryo, the surrounding tissue expresses “fields”

Lent C. Johnson published a “field” based hypothesis of bone tumors that coincides with differentiation at the

  1. METAPHYSIS
  2. HYPOPHYSIS

and the type CELL – chondroblast, osteoblast, giant cell (osteoclast), fibroblast

Orthopedic surgeons use magnetic fields for healing

  • of powerful transcription factors.
  • Not so in adult life: a proliferating tissue stem cell is literally on its own.

Germlines hold the key to effective “differentiation therapy”

  • Ideal for patients with stage 3-4 cancer
  • Examples of differentiation therapy:
  1. 1,25-vitamin D and
  2. retinoic acid

Non-toxic but more effective treatment for late stage disease,

GenoMed’s 2,500 cancer-causing genes:

  • ½ are oncogenes,
  • ½ are tumor suppressors

Design inhibitors to oncogenes

  • Screen 1st for toxicity;
  • genomic epidemiology guarantees clinical efficacy


Jewish Heritage Written in DNA

By Kate Yandell | Sept 9, 2014

Fully sequenced genomes of more than 100 Ashkenazi people clarify the group’s history and provide a reference for researchers and physicians trying to pinpoint disease-associated genes.

A whole-genome sequence study from 128 healthy Jewish people is aimed at identifying disease-associated variants in the jewish population of Ashkenazi ancestry, according to a study published Sept 9 in Nature Communications. The library of sequences confirms earlier conclusions about Ashkenazi history hinted at by more limited DNA sequencing studies. The sequences point to an approximate 350-person bottleneck in the Ashkenazi population as recently as 700 years ago (1400 A.D.), and suggest that the population has a mixture of European and Middle Eastern ancestry.

The study “provides a very nice reference panel for the very unique population of Ashkenazi Jews,” said Alon Keinan, who studies human population genomics at Cornell University in New York. Keinan
is acknowledged in the study but was not involved in the research.

“One might have thought that, after many years of genetic studies relating to Ashkenazi Jews . . . there would be little room for additional insights,” Karl Skorecki of the Rambam Healthcare Campus
in Israel who also was not involved in the study wrote in an e-mail to The Scientist. The study, he added, provides “a powerful further validation and further resolution of the demographic history of
the Ashkenazi Jews in relation to non-Jewish Europeans that is reassuringly consistent with inferences drawn from two decades of studies using uniparental regions . . . and from array-based data.”

Itsik Pe’er, coauthor of the new study and an associate professor of computer science at Columbia University in New York City, recalled that several years ago, he and his colleagues kept running into the same problem as they tried to understand the genetics of disease in Ashkenazi populations. They were comparing their Ashkenazi samples to the only control genomes that were available, which were of largely non-Jewish European origin. The Ashkenazi genomes had variation that was absent in these general European genomes, making it hard to distinguish rare variants in Ashkenazi people.

“Technology is there to tell us everything in that [Ashkenazi] patient’s genome, but the genome was not there to distinguish the variants that are there and to tell us whether they are normal or whether we should get worried,” said Pe’er. Pe’er’s group teamed up with researchers from additional universities and hospitals in the U.S., Belgium, and Israel to sequence a collection of healthy Ashkenazi people’s genomes. The panel of reference sequences performs better than a group of European genomes at filtering out harmless variants from Ashkenazi Jewish genomes, thereby making it easier to identify potentially harmful ones. According to Pe’er, researchers will also be able to use the panel to infer
more complete sequences from partially sequenced genomes by looking for familiar sequences from the reference genomes.

The team also used its data to better understand the history of the Ashkenazi Jewish people through analyzing both level of similarity within Ashkenazi genomes and between Ashkenazi and non-Jewish
European genomes. By analyzing the length of identical DNA sequences that Ashkenazi individuals share, the researchers were able to estimate that 25 to 32 generations ago, the Ashkenazi Jewish population shrunk to just several hundred people, before expanding rapidly to eventually include the millions of Ashkenazi Jews alive today. Further, the researchers concluded that modern Ashkenazi Jews likely have an approximately even mixture of European and Middle Eastern ancestry. This suggests that after the Jewish people migrated from the Middle East to Europe, they recruited people from local European populations.

These results are compatible with those of prior work on mitochondrial DNA (mtDNA), which is passed on maternally. This prior work suggested that Ashkenazi men from the Middle East intermarried with local European women. The Ashkenazi population “hasn’t been likely as isolated as at least some researchers considered,” said Keinan.

Finally, the newly sequenced genomes shed light on the deeper history of Europe, showing that the European and Middle Eastern portions of Ashkenazi ancestry diverged just around 20,000 years ago.

“This is, I think, the first evidence from whole human genomes that the most important wave of settlement from the Near East was most likely shortly after the Last Glacial Maximum  . . . and, notably, before the Neolithic transition—which is what researchers working on mitochondrial DNA have been arguing for some years,” Martin Richards, an archeogeneticist at the University of Huddersfield in the U.K., told The Scientist in an e-mail.

Skorecki noted that the new study “demonstrates the utility of sequencing whole genomes in a diverse population… with sufficient numbers of samples, parent population information, and
computational analytic power, we can expect important and surprising utilities for personal genomic and insights in terms of human demographic history from whole genomes.”

  1. Carmi et al., “Sequencing an Ashkenazi reference panel supports population-targeted personal genomics and illuminates Jewish and European origins,” Nature
    Communications,
    http://dx.doi.org:/10.1038/ncomms5835, 2014.

Added Layers of Proteome Complexity

By Anna Azvolinsky | July 17, 2014

Scientists discover a broad spectrum of alternatively spliced human protein variants within a well-studied family of genes.

There may be more to the human proteome than previously thought. Some genes are known to have several different alternatively spliced protein variants, but the Scripps Research Institute’s Paul Schimmel and his colleagues have now uncovered almost 250 protein splice variants of an essential, evolutionarily conserved family of human genes. The results were published today (July 17) in Science.

Focusing on the 20-gene family of aminoacyl tRNA synthetases (AARSs), the team captured AARS transcripts from human tissues—some fetal, some adult—and showed that many of these messenger RNAs (mRNAs) were translated into proteins. Previous studies have identified
several splice variants of these enzymes that have novel functions, but uncovering so many more variants was unexpected, Schimmel said. Most of these new protein products lack the catalytic domain but retain other AARS non-catalytic functional domains. “The main point is that a vast new area of biology, previously missed, has been uncovered,”
said Schimmel.

“This is an incredible study that fundamentally changes how we look at the protein-synthesis machinery,” Michael Ibba, a protein translation researcher at Ohio State University who was not involved in the work, told The Scientist in an e-mail. “The unexpected and potentially vast
expanded functional networks that emerge from this study have the potential to influence virtually any aspect of cell growth.”

The team—including researchers at the Hong Kong University of Science and Technology, Stanford University, and aTyr Pharma, a San Diego-based biotech company that Schimmel co-founded—comprehensively captured and sequenced the AARS mRNAs from six human tissue types using high-throughput deep sequencing. While many of the transcripts were expressed in each of the tissues, there was also some tissue specificity.

Next, the team showed that a proportion of these transcripts, including those missing the catalytic domain, indeed resulted in stable protein products: 48 of these splice variants associated with polysomes. In vitro translation assays and the expression of more than 100 of these variants in cells confirmed that many of these variants could be made into
stable protein products.

The AARS enzymes—of which there’s one for each of the 20 amino acids—bring together an amino acid with its appropriate transfer RNA (tRNA) molecule. This reaction allows a ribosome to add the amino acid to a growing peptide chain during protein translation. AARS
enzymes can be found in all living organisms and are thought to be among the first proteins to have originated on Earth.

To understand whether these non-catalytic proteins had unique biological activities, the researchers expressed and purified recombinant AARS fragments, testing them in cell-based assays for proliferation, cell differentiation, and transcriptional regulation, among other
phenotypes. “We screened through dozens of biological assays and found that these variants operate in many signaling pathways,” said Schimmel.

“This is an interesting finding and fits into the existing paradigm that, in many cases, a single gene is processed in various ways [in the cell] to have alternative functions,” said Steven Brenner, a computational genomics researcher at the University of California, Berkeley.

The team is now investigating the potentially unique roles of these protein splice variants in greater detail—in both human tissue as well as in model organisms. For example, it is not yet clear whether any of these variants directly bind tRNAs.

“I do think [these proteins] will play some biological roles,” said Tao Pan, who studies the functional roles of tRNAs at the University of Chicago. “I am very optimistic that interesting biological functions will come out of future studies on these variants.”

Brenner agreed. “There could be very different biological roles [for some of these proteins]. Biology is very creative that way, [it’s] able to generate highly diverse new functions using combinations of existing protein domains.” However, the low abundance of these variants
is likely to constrain their potential cellular functions, he noted.

Because AARSs are among the oldest proteins, these ancient enzymes were likely subject to plenty of change over time, said Karin Musier-Forsyth, who studies protein translational
at the Ohio State University. According to Musier-Forsyth, synthetases are already known to have non-translational functions and differential localizations. “Like the addition of post-translational modifications, splicing variation has evolved as another way to repurpose protein function,” she said.

One of the protein variants was able to stimulate skeletal muscle fiber formation ex vivo and upregulate genes involved in muscle cell differentiation and metabolism in primary human skeletal myoblasts. “This was really striking,” said Musier-Forsyth. “This suggests
that, perhaps, peptides derived from these splice variants could be used as protein-based therapeutics for a variety of diseases.”

W.S. Lo et al., “Human tRNA synthetase catalytic nulls with diverse functions,” Science, http://dx.doi.org:/10.1126/science.1252943, 2014.

It’s Not Only in DNA’s Hands

By Ilene Schneider  LabRoots   Aug 22, 2014

Blood stem cells have the potential to turn into any type of blood cell, whether it is the oxygen-carrying red blood cells or the immune system’s many types of white blood cells that help fight infection. How exactly is the fate of these stem cells regulated? Preliminary findings from research conducted by scientists from the Weizmann Institute of Science and the Hebrew University are starting to reshape the conventional understanding of the way blood stem cell fate decisions are controlled, thanks to a new technique for epigenetic analysis developed at these institutions. Understanding epigenetic mechanisms (environmental influences other than genetics) of cell fate could lead to the deciphering of the molecular mechanisms of many diseases,
including immunological disorders, anemia, leukemia, and many more. The study of epigenetics also lends strong support to findings that environmental factors and lifestyle play a more prominent
role in shaping our destiny than previously realized.


The process of differentiation – in which a stem cell becomes a specialized mature cell – is controlled by a cascade of events in which specific genes are turned “on” and “off” in a highly regulated and accurate order. The instructions for this process are contained within the DNA itself in short regulatory sequences.

  • These regulatory regions are normally in a “closed” state, masked by special proteins called histones to ensure against unwarranted activation. Therefore, to access and “activate”
    the instructions,
  • this DNA mask needs to be “opened” by epigenetic modifications of the histones so it can be read by the necessary machinery.

In a paper published in Science, Dr. Ido Amit and David Lara-Astiaso of the Weizmann Institute’s Department of Immunology, along with Prof. Nir Friedman and Assaf Weiner of the Hebrew University of Jerusalem, charted – for the first time – histone dynamics during blood development. Thanks to the new technique for epigenetic profiling they developed, in which just a handful of cells – as few as 500 – can be sampled and analyzed accurately, they have identified the exact
DNA sequences, as well as the various regulatory proteins, that are involved in regulating the process of blood stem cell fate.

This research has also yielded unexpected results: As many as

  • 50% of these regulatory sequences are established and opened during intermediate stages of cell development.

The meaning of the research is that epigenetics can be active at stages in which it had been thought that cell destiny was already set. “This changes our whole understanding of the process of blood stem cell fate decisions,” says Lara-Astiaso, “suggesting that the process is more
dynamic and flexible than previously thought.”

Although this research was conducted on mouse blood stem cells, the scientists believe that the mechanism may hold true for other types of cells. “This research creates a lot of excitement in the field, as it sets the groundwork to study these regulatory elements in humans,” says Weiner.

Largest Cancer Genetic Analysis Reveals New Way of Classifying Cancer

http://www.biosciencetechnology.com/news/2014/08/largest-cancer-genetic-analysis-reveals-new-way-classifying-cancer

Thu, 08/07/2014 – 2:24pm

Researchers with The Cancer Genome Atlas (TCGA) Research Network have completed the largest, most diverse tumor genetic analysis ever conducted, revealing a new approach to classifying cancers. The work, led by researchers at the UNC Lineberger Comprehensive
Cancer Center at the University of North Carolina at Chapel Hill and other TCGA sites, not only

  • revamps traditional ideas of how cancers are diagnosed and treated, but could also have
  • a profound impact on the future landscape of drug development.

“We found that one in 10 cancers analyzed in this study would be classified differently using this new approach,” said Chuck Perou, PhD, professor of genetics and pathology, UNC Lineberger member and senior author of the paper, which appears online Aug. 7 in Cell.
“That means that

  • 10 percent of the patients might be better off getting a different therapy—that’s huge.”

Since 2006, much of the research has identified cancer as not a single disease, but many types and subtypes and has defined these disease types based on the tissue—breast, lung, colon, etc.—in which it originated. In this scenario, treatments were tailored to which
tissue was affected, but questions have always existed because some treatments work, and fail for others, even when a single tissue type is tested.

In their work, TCGA researchers analyzed more than 3,500 tumors across 12 different tissue types to see how they compared to one another — the largest data set of tumor genomics ever assembled, explained Katherine Hoadley, PhD, research assistant professor
in genetics and lead author. They found that

  • cancers are more likely to be genetically similar based on the type of cell in which the cancer originated, compared to the type of tissue in which it originated. 

This is fundamental premise of pathology! (Larry Bernstein)  It goes back to Rudolph Virchow. 

“In some cases, the cells in the tissue from which the tumor originates are the same,” said Hoadley. “But in other cases, the tissue in which the cancer originates is made up of multiple types of cells that can each give rise to tumors. Understanding the cell in which the cancer originates appears to be very important in determining the subtype of a tumor
and, in turn, how that tumor behaves and how it should be treated.”

Perou and Hoadley explain that the new approach may also shift how cancer drugs are developed, focusing more on the development of drugs targeting larger groups of cancers with genomic similarities, as opposed to a single tumor type as they are currently developed.

One striking example of the genetic differences within a single tissue type is breast cancer.
The breast, a highly complex organ with multiple types of cells, gives rise to multiple types of breast cancer; luminal A, luminal B, HER2-enriched and basal-like, which was previously known. In this analysis, the basal-like breast cancers looked more like ovarian cancer
and cancers of a squamous-cell type origin, a type of cell that composes the lower-layer of a tissue, rather than other cancers that arise in the breast.

“This latest research further solidifies that basal-like breast cancer is an entirely unique disease and is completely distinct from other types of breast cancer,” said Perou. In addition, bladder cancers were also quite diverse and might represent at least three different disease types that also showed differences in patient survival.

As part of the Alliance for Clinical Trials in Oncology, a national network of researchers conducting clinical trials, UNC researchers are already testing the effectiveness of carboplatin—a common treatment for ovarian cancer—on top of standard of care chemotherapy for triple-negative breast cancer (TNBC) patients, of which 80 percent are the basal-like subtype. The results of this study (called CALGB40603)
were just published on Aug. 6 in the Journal of Clinical Oncology and showed a benefit of carboplatin in TNBC patients. This new clinical trial result suggests that there may be great value in comparing clinical results across tumor types for which this study highlights as having common genomic similarities.

As participants in TCGA, UNC Lineberger scientists have been involved in multiple individual tissue type studies including most recently an analysis of a comprehensive genomic profile of lung adenocarcinoma. Perou’s seminal work in 2000 led to the first discovery of breast
cancer as not one, but in fact, four distinct subtypes of disease.  These most recent findings should continue to lay the groundwork for what could be the next generation of cancer diagnostics.

Source: University of North Carolina at Chapel Hill School of Medicine

New Gene Tied to Breast Cancer Risk

Wed, 08/06/2014

Marilynn Marchione – AP Chief Medical Writer – Associated Press

It’s long been known that faulty BRCA genes greatly raise the risk for breast cancer. Now, scientists say a more recently identified, less common gene can do the same.

Mutations in the gene can make breast cancer up to nine times more likely to develop, an international team of researchers reports in this week’s New England Journal of Medicine.

About 5 to 10 percent of breast cancers are thought to be due to bad BRCA1 or BRCA2 genes. Beyond those, many other genes are thought to play a role but how much each one raises risk has not been known, said Dr. Jeffrey Weitzel, a genetics expert at City of Hope Cancer Center
in Duarte, Calif.

The new study on the gene- called PALB2 – shows “this one is serious,” and probably is the most dangerous in terms of breast cancer after the BRCA genes, said Weitzel, one of leaders of the study.

It involved 362 members of 154 families with PALB2 mutations – the largest study of its kind. The faulty gene seems to give a woman a 14 percent chance of breast cancer by age 50 and 35 percent by age 70 and an even greater risk if she has two or more close relatives with the disease.

That’s nearly as high as the risk from a faulty BRCA2 gene, Dr. Michele Evans of the National Institute on Aging and Dr. Dan Longo of the medical journal staff write in a commentary in the journal.

The PALB2 gene works with BRCA2 as a tumor suppressor, so when it is mutated, cancer can flourish.

How common the mutations are isn’t well known, but it’s “probably more than we thought because people just weren’t testing for it,” Weitzel said. He found three cases among his own breast cancer
patients in the last month alone.

Among breast cancer patients, BRCA mutations are carried by 5 percent of whites and 12 percent of Eastern European (Ashkenazi) Jews. PALB2 mutations have been seen in up to 4 percent of families with a history of breast cancer.

 Men with a faulty PALB2 gene also have a risk for breast cancer that is eight times greater than men in the general population.

Testing for PALB2 often is included in more comprehensive genetic testing, and the new study should give people with the mutation better information on their risk, Weitzel said. Doctors say that people with faulty cancer genes should be offered genetic counseling and may want to consider more frequent screening and prevention options, which can range from hormone-blocking pills to breast removal.

The actress Angelina Jolie had her healthy breasts removed last year after learning she had a defective BRCA1 gene.

The study was funded by many government and cancer groups around the world and was led by Dr. Marc Tischkowitz of the University of Cambridge in England. The authors include Mary-Clare King, the University of Washington scientist who discovered the first breast
cancer predisposition gene, BRCA1.

Study: http://www.nejm.org/doi/full/10.1056/NEJMoa1400382

Gene info: http://ghr.nlm.nih.gov/gene/PALB2

Structure of the DDB1–CRBN E3 ubiquitin ligase in complex with thalidomide

Eric S. Fischer, Kerstin Böhm, John R. Lydeard, Haidi Yang, …, J. Wade Harper, Jeremy L. Jenkins & Nicolas H. Thomä

Nature (07 Aug 2014); 512, 49–53  http://dx.doi.org:/10.1038/nature13527

Published online 16 July 2014

In the 1950s, the drug thalidomide, administered as a sedative to pregnant women, led to the birth of thousands of children with multiple defects. Despite the teratogenicity of thalidomide and its derivatives lenalidomide and pomalidomide,

  • these immunomodulatory drugs (IMiDs) recently emerged as effective treatments for
    multiple myeloma and 5q-deletion-associated dysplasia.
  • IMiDs target the E3 ubiquitin ligase CUL4–RBX1–DDB1–CRBN (known as CRL4CRBN) and
  • promote the ubiquitination of the IKAROS family transcription factors IKZF1 and IKZF3 by CRL4CRBN.

Here we present crystal structures of the DDB1–CRBN complex bound to thalidomide,
lenalidomide and pomalidomide. The structure establishes that

  • CRBN is a substrate receptor within CRL4CRBN and enantioselectively binds IMiDs.

Using an unbiased screen, we identified the

  • homeobox transcription factor MEIS2 as an endogenous substrate of CRL4CRBN.

Our studies suggest that IMiDs block endogenous substrates (MEIS2) from binding to CRL4CRBN while the ligase complex is recruiting IKZF1 or IKZF3 for degradation.

This dual activity implies that

  • small molecules can modulate an E3 ubiquitin ligase and thereby upregulate or downregulate the ubiquitination of proteins.

Curator’s Viewpoint:

The short pieces may not appear to be so closely connected, except for the last subject on the pharmaceutical targeting of an E3 ubiquitin ligase ubiquitination of proteins, but even in that case, we have to keep in mind that protein formation by amino acid transcription, remodeling, and recapture of amino acids are in equilibrium through ubiquitylation. So I put it there.  The DNA in populations ties some mutations to disease that is tied specifically to populations, not only the sephardic population, but in Asia as well.

The next article for consideration is methodological considerations.  The BRCA2 in the sephardic population is one of a number of mutations we can identify, extending to Tay Sachs disease, for instance.  How this might have occurred in the history of the jewish people is not so obvious, except perhaps in the segregation of the jewish population for centuries.  The mutation would be confined within the population with limited marriage outside of the jewish community.  It has been known for some time that there is a Cohen gene that traces back to the priests (Kohanim) of the Holy Temple, the descendents of Aaron (Aharon), the brother of Moses.  The priests would stand at the Ark and bless the congregation in the most holy convocation of Yom Kippur, according to tradition.  Marriages were arranged between the bride and the groom.  Of course, arranged marriages were also the case in other ethnic communities, and between the privileged.

That was dramatically the case during the reign of Queen Victoria of England, with Royal arrangements across Europe.
That would be a factor in the transmission of hemophilia, and in mental disorders in the Royal families. Haemophilia figured prominently in the history of European royalty in the 19th and 20th centuries. Britain’s Queen Victoria, through two of her five daughters (Princess Alice and Princess Beatrice), passed the mutation to various royal houses across the continent, including the royal families of Spain, Germany and Russia. Victoria’s son Prince Leopold, Duke of Albany suffered from the disease.  The Prince Leopold, Duke of Albany KG KT GCSI GCMG GCStJ (Leopold George Duncan Albert; 7 April 1853 – 28 March 1884) was the eighth child and fourth son of Queen Victoria and Prince Albert of Saxe-Coburg and Gotha. Leopold was later created Duke of Albany, Earl of Clarence, and Baron Arklow. He had haemophilia, which led to his death at the age of 30.  The sex-linked X chromosome disorder manifests almost entirely in males, although the gene for the disorder is located on the X chromosome and may be inherited from either mother or father. Expression of the disorder is much more common in males than in females. This is because, although the trait is recessive, males only inherit one X chromosome, from their mothers. Of course, this is classical Mendelian genetics. Victoria appears to have been a spontaneous or de novo mutation and is usually considered the source of the disease in modern cases of haemophilia among royalty. The mutation would probably be assumed today to have occurred at the conception of Princess Alice, as she was the only known carrier among Victoria and Albert’s first seven children. Leopold was a sufferer of haemophilia and her daughters Alice and Beatrice were confirmed carriers of the gene.

Cousin marriage is marriage between people with a common grandparent or other more distant ancestor. In various cultures and legal jurisdictions,  Marriages between first and second cousins account for over 10% of marriages worldwide, and they are common in the Middle East, where in some nations they account for over half of all marriages. Proportions of first-cousin marriage in the United States, Europe and other Western countries like Brazil have declined since the 19th century, though even during that period they were not more than 3.63 percent of all unions in Europe. Cousin marriage is allowed throughout the Middle East for all recorded history, and is used mostly in Syria. It has often been chosen to keep cultural values intact through many generations and preserve familial wealth. In Iraq the right of the cousin has also traditionally been followed and a girl breaking the rule without the consent of the ibn ‘amm could have ended up murdered by him. The Syrian city of Aleppo during the 19th century featured a rate of cousin marriage among the elite of 24% according to one estimate, a figure that masked widespread variation: some leading families had none or only one cousin marriage, while others had rates approaching 70%. Cousin marriage rates were highest among women, merchant families, and older well-established families.  The percentage of Iranian cousin marriages increased from 34 to 44% between the 1940s and 1970s. Cousin marriage among native Middle Eastern Jews is generally far higher than among the European Ashkenazim, who assimilated European marital practices after the diaspora.

The essential elements of the marriage contract were now an offer by the man, an acceptance by the woman, and the performance of such conditions as the payment of dowry. According to anthropologist Ladislav Holý, cousin marriage is not an independent phenomenon but rather one expression of a wider Middle Eastern preference for agnatic solidarity, or solidarity with one’s father’s lineage.

A 2009 study found that many Arab countries display some of the highest rates of consanguineous marriages in the world, and that first cousin marriages which may reach 25-30% of all marriages. Research among Arabs and worldwide has indicated that consanguinity could have an effect on some reproductive health parameters such as postnatal mortality and rates of congenital malformations.

In the terraced streets of Bradford, Yorkshire, a child’s death is anything but rare. At the boy’s inquest, coroner Mark Hinchliffe said Hamza Rehman had died because his Pakistan-born parents (shopkeeper Abdul and housewife Rozina) are first cousins. Muslims have practiced marriages between first cousins in non-prohibited countries since the time of the Quran.

Four years before, Hamza’s older sister, three-month-old Khadeja, had died of the same brain disorder which causes fits, sickness and chest infections. The couple had another baby born with equally devastating neurological problems.

A heartbroken Mr Rehman told the inquest that he and his wife were unsure whether to have any more children. The coroner expressed deep sympathy before saying that Hamza’s death should serve as a warning to others.

I have diverged somewhat onto the genetic risks of consanguinous marriages, which George Darwin, son of Charles Darwin, argues were had a small effect in then English society.  But most importantly, we see the larger factor here of social and familial inheritance, and also the concept of cultural identity.

Insofar as the somatic and mitochondrial mutations are concerned, I call attention to the finding in the GWAS study above discussed that the results were supportive of the conclusions from mtDNA.  This gives some reason to consider whether sufficient information is obtained from the mtDNA, without the more robust GWAS.  One cannot fully consider this without some knowledge of the methodology of specimen preparation.

It is not difficult to prepare mitochondria from cells and obtain a very good preparation before further analysis, whether of the membrane structures, the enzymatic activity, or of the DNA and RNA polynucleotides.  The separation is easily achieved with differential centrifugation.  On the other hand, the finding of the basal layer of epithelium having a different signature than the superficial layer, established by the genomic studies, but known histologically for non-neoplastic tissue, is a matter for cell separation methods that are not easy.  It is from the lower layer of cells that we derive carcinoma in-situ.  These cells were identified in breast, are expected to be found in uterus, and were like the cells in ovarian-cancer, which suggested the use of a common treatment regimen as adjunct in triple negative breast cancer and ovarian cancer.  The importance of a suuficiently prepared cellular specimen as opposed to tissue specimen can’t be taken for granted.


Read Full Post »

A Future for Plasma Metabolomics in Cardiovascular Disease Assessment

Curator: Larry H Bernstein, MD, FCAP


Plasma metabolomics reveals a potential panel of biomarkers for early diagnosis
in acute coronary syndrome  

CM. Laborde, L Mourino-Alvarez, M Posada-Ayala,
G Alvarez-Llamas, MG Serranillos-Reus, et al.
Metabolomics – manuscript draft

In this study, analyses of peripheral plasma from Non-ST Segment Elevation
Acute Coronary Syndrome patients and healthy controls by gas chromatography-
mass spectrometry permitted the identification of 15 metabolites with statistical
differences (p<0.05) between experimental groups.
In our study, 6 amino acids were found decreased in NSTEACS patients when
compared with healthy control group suggesting either a decrease in anabolic
activity of these metabolites or an increase in the catabolic pathways. Of both
possibilities, the increased catabolism of the amino acids can be explained
considering simultaneously the capacity of glycogenic and ketogenic amino
acids along with the gradual hypoxic condition to which cardiac muscle cells
have been exposed.

Additionally, validation by gas chromatography-mass spectrometry and liquid
chromatography-mass spectrometry permitted us to identify a potential panel
of biomarkers formed by 5-OH tryptophan, 2-OH-butyric acid and 3-OH-butyric
acid. Oxidative stress conditions dramatically increase the rate of hepatic
synthesis of glutathione. It is synthesized from the amino acids cysteine, glutamic
acid and glycine. Under these conditions of metabolic stress, the supply of cysteine
for glutathione synthesis become limiting and homocysteine is used to form
cystathionine, which is cleaved to cysteine and 2-OH-butyric acid. Thus elevated
plasma levels of 2-OH-butyric acid can be a good biomarker of cellular oxidative
stress for the early diagnosis of ACS.  Another altered metabolite of similar
structure was 3-OH-butyric acid, a ketone body together with the acetoacetate,
and acetone. Elevated levels of ketone bodies in blood and urine mainly occur
in diabetic ketoacidosis. Type 1 diabetes mellitus (DMI) patients have decreased
levels of insulin in the blood that prevent glucose enter cells so these cells use
the catabolism of fats as energy source that produce ketones as final products.
This panel of biomarkers reflects the oxidative stress and the hypoxic state that
disrupts the myocardial cells and consequently constitutes a metabolomic
signature that could be used for early diagnosis of acute coronary syndrome.
We hypothesize that the hypoxia situation comes to “mimic” the physiological
situation that occurs in DMI. In this case, the low energy yield of glucose
metabolism “forces” these cells to use fat as energy source (through catabolism
independent of aerobic/anaerobic conditions) occurring ketones as final
products. In our experiment, the 3-OH-butyric acid was strongly elevated in
NSTEACS patients.


Current Methods Used in the Protein Carbonyl Assay
Nicoleta Carmen Purdel, Denisa Margina and Mihaela Ilie.
Ann Res & Rev in Biol 2014; 4(12): 2015-2026.
http://www.sciencedomain.org/download.php?f=Purdel4122013ARRB8763-1

The attack of reactive oxygen species on proteins and theformation of
protein carbonyls were investigated only in the recent years. Taking into
account that protein carbonyls may play an important role in the early
diagnosis of pathologies associated with reactive oxygen species
overproduction, a robust and reliable method to quantify the protein
carbonyls in complex biological samples is also required. Oxidative
stress represents the aggression produced at the molecular level by
the imbalance between pro-oxidant and antioxidant agents, in favor of
pro-oxidants, with severe functional consequences in all organs and
tissues. An overproduction of ROS results in oxidative damages
especially to proteins (the main target of ROS), as well as in lipids,or
DNA. Glycation and oxidative stress are closely linked, and both
phenomena are referred to as ‘‘glycoxidation’’. All steps of glycoxidation
generate oxygen-free radical production, some of them being common
with lipidic peroxidation pathways.
The initial glycation reaction is followed by a cascade of chemical
reactions resulting in the formation of intermediate products (Schiff base,
Amadori and Maillard products) and finally to a variety of derivatives
named advanced glycation end products (AGEs). In hyperglycemic
environments and in natural aging, AGEs are generated in increased
concentrations; their levels can be evaluated in plasma due to the fact
that they are fluorescent compounds. Specific biomarkers of oxidative
stress are currently investigated in order to evaluate the oxidative status
of a biological system and/or its regenerative power. Generaly, malondi-
aldehyde, 4-hydroxy-nonenal (known together as thiobarbituric acid
reactive substances – TBARS), 2-propenal and F2-isoprostanes are
investigated as markers of lipid peroxidation, while the measurement
of protein thiols, as well as S-glutathionylated protein are assessed
as markers of oxidative damage of proteins. In most cases, the
oxidative damage of the DNA has 8-hydroxy-2l-deoxyguanosine
(8-OHdG) as a marker.  The oxidative degradation of proteins plays an
important role in the early diagnosis of pathologies associated with
ROS overproduction. Oxidative modification of the protein structure
may take a variety of forms, including the nitration of tyrosine residues,
carbonylation, oxidation of methionine, or thiol groups, etc.

The carbonylation of protein represents the introduction of carbonyl
groups (aldehyde or ketone) in the protein structure, through several
mechanisms: by direct oxidation of the residues of lysine, arginine,
proline and threonine residues from the protein chain, by interaction
with lipid peroxidation products with aldehyde groups (such as 4-
hydroxy-2-nonenal, malondialdehyde, 2-propenal), or by the
interaction with the compounds with the carbonyl groups resulting
from the degradation of the lipid or glycoxidation. All of these
molecular changes occur under oxidative stress conditions.
There is a pattern of carbonylation, meaning that only certain
proteins can undergo this process and protein structure determines
the preferential sites of carbonylation. The most investigated
carbonyl derivates are represented by gamma-glutamic
semialdehyde (GGS) generated from the degradation of arginine
residue and α-aminoadipic semialdehyde (AAS) derived from lysine.

A number of studies have shown that the generation of protein
carbonyl groups is associated with normal cellular phenomena like
apoptosis, and cell differentiation and is dependent on age, species
and habits (eg. smoking) or severe conditions’ exposure (as
starvation or stress). The formation and accumulation of protein
carbonyls is increased in various human diseases, including –
diabetes and cardiovascular disease.

Recently, Nystrom [7] suggested that the carbonylation process
is associated with the physiological and not to the chronological
age of the organism and the carbonylation may be one of the causes
of aging and cell senescence; therefore it can be used as the marker
of these processes. Jha and Rizvi, [15] proposed the quantification of
protein carbonyls in the erythrocyte membrane as a biomarker of aging

PanelomiX: A threshold-based algorithm to create panels of
biomarkers

X Robin, N Turck, A Hainard, N Tiberti, F Lisacek. 
T r a n s l a t i o n a l  P r o t e o m i c s   2 0 1 3; 1: 57–64.
http://dx.doi.org/10.1016/j.trprot.2013.04.003

The computational toolbox we present here – PanelomiX – uses
the iterative combination of biomarkers and thresholds (ICBT) method.
This method combines biomarkers andclinical scores by selecting
thresholds that provide optimal classification performance. Tospeed
up the calculation for a large number of biomarkers, PanelomiX selects
a subset ofthresholds and parameters based on the random forest method.
The panels’ robustness and performance are analysed by cross-validation
(CV) and receiver operating characteristic(ROC) analysis.

Using 8 biomarkers, we compared this method against classic
combination procedures inthe determination of outcome for 113 patients
with an aneurysmal subarachnoid hemorrhage. The panel classified the
patients better than the best single biomarker (p < 0.005) and compared
favourably with other off-the-shelf classification methods.

In conclusion, the PanelomiX toolbox combines biomarkers and evaluates
the performance of panels to classify patients better than single markers
or other classifiers. The ICBT algorithm proved to be an efficient classifier,
the results of which can easily be interpreted. 

Multiparametric diagnostics of cardiomyopathies by microRNA
signatures.
CS. Siegismund, M Rohde, U Kühl,  D  Lassner.
Microchim Acta 2014 Mar.
http://dx.doi.org:/10.1007/s00604-014-1249-y

MicroRNAs (miRNAs) represent a new group of stable biomarkers
that are detectable both in tissue and body fluids. Such miRNAs
may serve as cardiological biomarkers to characterize inflammatory
processes and to differentiate various forms of infection. The predictive
power of single miRNAs for diagnosis of complex diseases may be further
increased if several distinctly deregulated candidates are combined to
form a specific miRNA signature. Diagnostic systems that generate
disease related miRNA profiles are based on microarrays, bead-based
oligo sorbent assays, or on assays based on real-time polymerase
chain reactions and placed on microfluidic cards or nanowell plates.
Multiparametric diagnostic systems that can measure differentially
expressed miRNAs may become the diagnostic tool of the future due
to their predictive value with respect to clinical course, therapeutic
decisions, and therapy monitoring.

Nutritional lipidomics: Molecular metabolism, analytics, and
diagnostics
JT. Smilowitz, AM. Zivkovic, Yu-Jui Y Wan, SM. Watkins, et al.
Mol. Nutr. Food Res. 2013, 00, 1–17.
http://dx.doi.org:/10.1002/mnfr.201200808

The term lipidomics is quite new, first appearing in 2001. Its definition
is still being debated, from “the comprehensive analysis of all lipid
components in a biological sample” to “the full characterization of
lipid molecular species and their biological roles with respect to the
genes that encode proteins that regulate lipid metabolism”. In principle,
lipidomics is a field taking advantage of the innovations in the separation
sciences and MS together with bioinformatics to characterize the lipid
compositions of biological samples (biofluids, cells, tissues, organisms)
compositionally and quantitatively.

Biochemical pathways of lipid metabolism remain incomplete and the
tools to map lipid compositional data to pathways are still being assembled.
Biology itself is dauntingly complex and simply separating biological
structures remains a key challenge to lipidomics. Nonetheless, the
strategy of combining tandem analytical methods to perform the sensitive,
high-throughput, quantitative, and comprehensive analysis of lipid
metabolites of very large numbers of molecules is poised to drive
the field forward rapidly. Among the next steps for nutrition to understand
the changes in structures, compositions, and function of lipid biomolecules
in response to diet is to describe their distribution within discrete functional
compartments lipoproteins. Additionally, lipidomics must tackle the task
of assigning the functions of lipids as signaling molecules, nutrient sensors,
and intermediates of metabolic pathways.

Read Full Post »

« Newer Posts - Older Posts »