Feeds:
Posts
Comments

Archive for the ‘Kinase’ Category

Wnt/β-catenin Signaling

Writer and Curator: Larry H. Bernstein, MD, FCAP 


7.10 Wnt/β-catenin signaling

7.10.1 Wnt signaling and hepatocarcinogenesis. The hepatoblastoma model

7.10.2 The Wnt.β-catenin pathway in ovarian cancer : a review.

7.10.3 Wnt Signaling in the Niche Enforces Hematopoietic Stem Cell Quiescence and Is Necessary to Preserve Self-Renewal In Vivo

7.10.4 Wnt.β-Catenin Signaling in Development and Disease

7.10.5 Wnt.β-Catenin Signaling. Components, Mechanisms, and Diseases

7.10.6 Wnt.β-Catenin Signaling. Turning the Switch

7.10.7 Wnt–β-catenin signaling

7.10.8 Extracellular modulators of Wnt signaling

7.10.9 FOXO3a modulates WNT.β-catenin signaling and suppresses epithelial-to-mesenchymal transition in prostate cancer cells

7.10.1 Wnt signalinbg pathway in liver cancer

7.10.1.1 Wnt signaling and hepatocarcinogenesis. The hepatoblastoma model

Armengol C1Cairo SFabre MBuendia MA.
Int J Biochem Cell Biol. 2011 Feb; 43(2):265-70.
http://dx.doi.org:/10.1016/j.biocel.2009.07.012

The Wnt/β-catenin pathway plays a key role in liver development, regeneration and tumorigenesis. Among human cancers tightly linked to abnormal Wnt/β-catenin signaling, hepatoblastoma (HB) presents with the highest rate (50-90%) of β-catenin mutations. HB is the most common malignant tumor of the liver in childhood. This embryonic tumor differs from hepatocellular carcinoma by the absence of viral etiology and underlying liver disease, and by distinctive morphological patterns evoking hepatoblasts, the bipotent precursors of hepatocytes and cholangiocytes. Recent studies of the molecular pathogenesis of hepatoblastoma have led to identify two major tumor subclasses resembling early and late phases of prenatal liver development and presenting distinctive chromosomal alterations. It has been shown that the molecular signature of Wnt/β-catenin signaling in hepatoblastoma is mainly imposed by liver context, but differs according to developmental stage. Finally, the differentiation stage of tumor cells strongly influences their invasive and metastatic properties, therefore affecting clinical behavior.

7.10.1.2 Targeting the Wnt/β-Catenin Signaling Pathway in Liver Cancer Stem Cells and Hepatocellular Carcinoma Cell Lines with FH535

Roberto Gedaly ,Roberto Galuppo, Michael F. Daily, Malay Shah, Erin Maynard, et al.
PLoS ONE 2014; 9(6): e99272.     http://dx.doi.org:/10.1371/journal.pone.0099272

Activation of the Wnt/β-catenin pathway has been observed in at least 1/3 of hepatocellular carcinomas (HCC), and a significant number of these have mutations in the β-catenin gene. Therefore, effective inhibition of this pathway could provide a novel method to treat HCC. The purposed of this study was to determine whether FH535, which was previously shown to block the β-catenin pathway, could inhibit β-catenin activation of target genes and inhibit proliferation of Liver Cancer Stem Cells (LCSC) and HCC cell lines. Using β-catenin responsive reporter genes, our data indicates that FH535 can inhibit target gene activation by endogenous and exogenously expressed β-catenin, including the constitutively active form of β-catenin that contains a Serine37Alanine mutation. Our data also indicate that proliferation of LCSC and HCC lines is inhibited by FH535 in a dose-dependent manner, and that this correlates with a decrease in the percentage of cells in S phase. Finally, we also show that expression of two well-characterized targets of β-catenin, Cyclin D1 and Survivin, is reduced by FH535. Taken together, this data indicates that FH535 has potential therapeutic value in treatment of liver cancer. Importantly, these results suggest that this therapy may be effective at several levels by targeting both HCC and LCSC.

Hepatocellular carcinoma (HCC), the most common liver cancer, is the fifth most common cancer and the third highest cause of cancer-related mortality worldwide [1][2]. The alarming rise in HCC incidence in Europe and North America in recent years is related mainly to hepatitis C virus infection, although other factors such as excessive alcohol consumption and obesity also contribute to this increase [3]. The etiology of HCC is complex and involves numerous genetic and epigenetic alterations and the disruption of various signaling pathways including the Wnt/β-catenin, Ras/Raf/MAPK, PI3K/AKT/mTOR, HGF/c-MET, IGF, VEGF and PDGF pathways. Among these, the Wnt/β-catenin pathway is considered among the most difficult to inhibit [4]. Currently, few chemical agents targeting the Wnt/β-catenin pathway are available or under investigation [5].

Activation of the canonical Wnt/β-catenin pathway involves the binding of Wnt proteins to cell surface Frizzled receptors and LRP5/6 co-receptors. In the absence of Wnt proteins, much of the cellular β-catenin is bound to E-cadherin on the cell membrane. Cytosolic β-catenin is constitutively phosphorylated at specific serine residues by an enzymatic complex that includes adenomatous polyposis coli (APC), Axin, and the kinases glycogen synthase kinase-3β (GSK-3β) and casein kinase I, marking it for ubiquitin-mediated proteolysis. Under these conditions, the TCF/LEF transcription factors are bound to their cognate DNA recognition elements along with members of the Groucho family of co-repressors, insuring the transcriptional silencing of β-catenin target genes. Engagement of Wnt proteins with the Frizzled receptor activates the Dishevelled protein, resulting in the dissociation of the cytosolic destructive complex and inhibition of GSK-3β. This leads to the stabilization and accumulation of cytoplasmic β-catenin, which then enters the nucleus, binds TCF/LEF proteins and leads to the subsequent dissociation of groucho co-repressors, recruitment of the coactivator p300 and activation of β-catenin target genes [6][9]. Many of the β-catenin targets, including Cyclin D1, c-myc and Survivin, promote cell cycle progression and inhibit apoptosis [10][12]. Consistent with this data, activation of the Wnt/β-catenin pathway is seen in a variety of cancers, including HCC. Aberrant activation of the Wnt/β-catenin pathway has been observed in at least 1/3 of HCC, and roughly 20% of HCCs have mutations in the β-catenin gene. More than 50% of HCC tumors display nuclear accumulation of β-catenin indicating that other factors may be involved such as aberrant methylation of the tumor suppressors APC and E-cadherin, inactivation of casein kinase and GSK-3β, or increased secretion of Wnt ligants [4][5].

There has been increasing interest in the role of liver cancer stem cells (LCSC) in tumorigenesis, tumor progression, invasion and metastases. The cancer stem cell theory suggests that a tumor is comprised of a heterogeneous population of cells that form a distinct cellular hierarchy. Recent studies have provided convincing evidence that these cells do exist in solid tumors of many types including, brain, breast, colorectal, liver, pancreas and prostate cancers. In 2006, two different groups isolated a CD133+ subpopulation from HCC cell lines and described higher proliferative and tumorigenic potential, consistent with stem cell properties. CD44 was also found as an important marker used in combination with other stem cell markers to better define the surface phenotype of LCSC. It has been demonstrated that CD133+ and CD90+ cells co-expressing CD44+ are more aggressive than those expressing CD133 or CD90 alone [13][14].

The chemical agents used to target Wnt-/β-catenin pathway are at the membrane, cytosol and transcription factor levels [5]. The small molecular agent FH535 is a dual inhibitor of peroxisome proliferator-activated receptor (PPAR) and β-catenin/TCF/LEF. FH535 has been shown to inhibit proliferation of HCC and hepatoblastoma cell lines and its specificity on inhibition of β-catenin/TCF/LEF activity was illustrated in hepatoblastoma cell line HepG2 [15].

The aim of this study was to determine if FH535 can inhibit the activation of β-catenin-regulated genes by endogenous and ectopically expressed β-catenin in the HCC cell lines Huh7, Hep3B and PLC and liver cancer stem cells (LCSC). The specificity of FH535 on inhibition of β-catenin via TCF/LEF activation was assayed in dual luciferase reporter transfected in LCSC and in HCC cells. Proliferation, cell cycle, and other targeted genes and proteins were assayed.

FH535 inhibits transcriptional activation mediated by wild-type and constitutively active β-catenin

FH535 has been shown to block signaling through endogenous β-catenin in several cell lines, including the hepatoblastoma cell line HepG2 [15]. To further explore this regulation and to test whether FH535 could block ectopic β-catenin, co-transfections with β-catenin expression vectors and the TCF4-dependent luciferase reporter vector TOPFlash were performed in the human HCC cell lines Huh7 and Hep3B (Fig. 1). In both cell lines, co-transfected wild-type β-catenin expression vector increased luciferase activity from TOPFlash nearly 15-fold compared to cells co-transfected with the empty vector (E.V.) control. This β-catenin-dependent increase was inhibited by FH535 in a dose-dependent manner. β-catenin is often mutated in various cancers, including HCC. One natural mutation changes the serine at position 37; this altered form of β-catenin is resistant to degradation by the APC complex and thus has higher stability. To test whether this form of activated form of β-catenin could also be blocked by FH535, an expression vector for βCatS37A, in which the serine at position 37 has been changed to an alanine, was co-transfected with TOPFlash. As expected, βCatS37A-mediated transactivation of TOPFlash was significantly higher than transactivation by wild-type β-catenin. However, in both cell lines, βCatS37A-mediated transactivation was significantly inhibited by FH535. As controls, cells were also co-transfected with FOPFlash, which is identical to TOPFlash except that the TCF4 sites have been mutated and therefore no longer responsive to β-catenin; FOPFlash was not activated by wild-type β-catenin or βCatS37A as shown in Figure 1.

thumbnail

Figure 1. FH535 inhibits β-catenin dependent transcriptional activation in HCC cell lines.

Huh7 (Panel A) and Hep3B (Panel B) HCC cells were transfected with the luciferase reporter genes TOPFlash (left panels), which contains three TCF binding sites, or E3-pGL3 (right panels), which contains the AFP enhancer element E3 that has a highly conserved TCF site. Cells were additionally co-transfected with an expression vector that contained no insert (empty vector control, E.V.), wild-type β-catenin (β-catenin), or a constitutively active form of β-catenin (βcatS37A). Renilla luciferase was used to control for variations in transfection efficiency. Six hours after the addition of DNA, cells were treated with DMSO alone (no treatment) or increasing amounts of FH535. After 48 hours, luciferase levels were determined; firefly luciferase was normalized to renilla. In both cell lines, FH535 inhibited β-catenin-dependent activation of target genes. *P<0.05. The experiment was done twice with similar results.

doi:10.1371/journal.pone.0099272.g001

TOPFlash contains three consensus TCF4 binding motifs that confer responsiveness to β-catenin. To test whether FH535 could also block β-catenin-mediated transactivation of a TCF4 motif in the context of a natural regulatory region, co-transfections were performed with E3-pGL3. E3 is a ~340 bp fragment that contains alpha-fetoprotein (AFP) enhancer element E3, one of three enhancers that control hepatic expression of the mouse AFP gene. E3 contains binding sites for multiple factors, including Foxa/HNF6, C/EBP, orphan nuclear receptors, and TCF4 [26][27]. We recently showed that this enhancer is regulated by β-catenin in cells and transgenic mice [21]. E3-pGL3 was transactivated by β-catenin and to a greater extent by βCatS37A (Fig. 1). However, this transactivation by both wild-type and S37A forms of β-catenin was blocked by FH535 in a dose-dependent manner.

3.2 FH535 inhibits β-catenin-mediated transcriptional activation in LCSC

Previous studies have shown that β-catenin signaling is elevated in EpCAM positive cells with LCSC properties [28]. We previously described that CD133+, CD44+, CD24+ LCSC aggressively form tumors when small numbers of these cells are injected into nude mice [29]. To test the ability of FH535 to inhibit β-catenin in these LCSCs, transient transfections were performed with TOPFlash. As controls, TOPFlash was also transfected into the HCC cell lines Huh7 and PLC (Fig. 2). In all three populations, untreated cells exhibited low luciferase levels. When treated with the GSK-3β inhibitor LiCl, which leads to endogenous β-catenin activation[30], TOPFlash activity increased dramatically. FH535 effectively blocked LiCl-mediated activation of TOPFlash in a dose-dependent manner. Interestingly, this inhibition was more robust in LCSC than in either HCC cell line. As a control, transfections were also performed with FOPFlash, which is no longer responsive to β-catenin. As expected, luciferase activity in FOPFlash-transfected cells was neither increased by LiCl nor inhibited by FH535.

thumbnail

Figure 2. FH535 inhibits TOPFlash activation in LCSC and HCC cell lines.

LCSC (left panel), Huh7 (middle panel) and HPLC (right panel) cells were co-transfected with TOPFlash or FOPFlash luciferase reporter genes along with renilla luciferase. After 6 hours, cells were left untreated (no treatment) or treated with LiCl alone or LiCl with increasing amounts of FH535. LiCl is a known activator of β-catenin. After an additional 36 hours, cells were harvested and luciferase levels were determined; firefly luciferase was normalized to renilla. TOPFlash activity was highly induced in all three cell populations; this activation was inhibited by FH535. The negative control FOPFlash showed minimal response to LiCl or FH535. TOPFlash inhibition by FH535 was more robust in LCSC than in either HCC cell line. * P<0.003, # P<0.001. The experiment was done twice with similar results.

doi:10.1371/journal.pone.0099272.g002

3.3 FH535 inhibits proliferation of LCSC and HCC cell lines

Numerous studies have demonstrated that β-catenin plays an important role in proliferation during normal development and in cellular transformation in many tissues, including the liver. Liver development is impaired in the absence of β-catenin, and mutations that activate the β-catenin pathway are found in about 1/3 of HCC [4][5]. Furthermore, the growth of adult liver progenitor stem cells (oval cells) can be inhibited by blocking the β-catenin pathway. Since our data indicated that FH535 can block β-catenin-mediated transcriptional activation, we also tested whether proliferation of LCSC and HCC cell lines was affected by this compound. LCSC were cultured in the presence of 10% or 1% serum and with between 5 µM and 30 µM FH535 for 72 hours, and cell proliferation was monitored by 3H-thymidine incorporation (Figs. 3A and 3B, respectively). Proliferation decreased with increasing amounts of FH535, with a more dramatic reduction observed in cells grown in the presence of lower serum; the concentration of FH535 to cause a 50% inhibition of cell grown (IC50) was 13.8 µM for cells grown in 10% serum and 5.1 µM for cells grown in 1% serum. This inhibition was more potent than that seen with XAV939 (IC50 = 55 µM), which inhibits tankyrase, thus stabilizing axin and promoting β-catenin degradation (Fig. 3C) [31]. FH535 also blocked proliferation of HCC cells at concentrations that were similar to that seen with LCSC (IC50 of 10.9 µM, 9.25 µM and 6.6 µM for Huh7, PLC and Hep3B, respectively; Fig.3D). To confirm that FH535 indeed inhibited cell proliferation and did not lead to increased cell death, FH535 and 3H-thymidine were added simultaneously to Huh7 cells, which were then cultured for 18 h. In this scenario, we observed a significant inhibition of proliferation at 2.5, 5, 10 and 15 µM of FH535 treatment as compared to control (p<0.05, n = 6), with FH535 at 15 µM causing a 41% inhibition (Figure S3). This data indicates that FH535 is inhibiting cell proliferation rather than increasing cell death.

thumbnail

Figure 3. FH535 inhibits proliferation of LCSC and HCC cell lines.

Cells were seeded in 96-well plates in 0.2 ml of media as described below for 72 hours, followed by the addition of 3H-thymidine at 1 µCi/well for 4 hours. Incorporation of 3H-thymidine was determined by scintillation counting. In panels A, B and D, the final concentration of DMSO in each well was 0.05%; in panel C, the final DMSO concentration in each well was 0.1%. (A) LCSCs were plated at 1000 cells/well in DMEM with 10% FBS along with DMSO alone or with increasing amounts of FH535. (B). LCSCs were plated at 5000 cells/well in DMEM with 1% FBS with DMSO alone or with increasing concentrations of FH535. (C). LCSCs were plated in DMEM with 10% FBS at 1000 cells/well with DMSO alone or increasing concentrations of XAV939. (D). Huh7, Hep3B and PLC cells were plated in DMEM with 10% FBS at 1000, 2500, and 5000 cells/well, respectively, with DMSO alone or increasing concentrations of FH535. Pvalues are for all the three cell lines treated with FH535 are compared to controls. The experiment was done twice with similar results.

doi:10.1371/journal.pone.0099272.g003

3.4 FH535 induces cell cycle arrest in the HCC cell line Huh7 and in LCSC

The ability of FH535 to inhibit cell proliferation prompted us to investigate the cell cycle distribution following treatment. Huh7 cells were synchronized by growth in 0.1% FBS for 24 hours and then cultured in the presence of 10% FBS and with no FH535 or FH535 at 7.5 µM and 15 µM. After 24 hours, cells were harvested and DNA content was analyzed by propidium iodide staining. In the presence of FH535, there was a statistically significant increase in the number of cells in G0/G1 and a corresponding decreased in the percentage of cells in S phase compared to cells grown in the absence of FH535 (Fig. 4A). The number of cells in G2 was not significantly altered by FH535. In addition, there was no sub-G1 peak detected by flow cytometry, indicating that FH535 was not promoting apoptosis at the concentrations being use (see Figure S4). We also did cell cycle analysis in LCSC after FH535 treatment and found FH535 at 15 µM significantly caused G1 phase arrest in LCSC (P = 0.012). FH535 also significantly reduced G2/M phase in the LCSC after 24 h of 7.5 µM and 15 µM FH535 treatment (P = 0.038 and P<0.001 respectively), no significant S phase inhibition was observed in LCSC (p = 0.446) (Fig. 4B.). Our data are similar to previously published results and reflects β-catenin regulation of cell cycle is different in different cell types [32][33]. Cell cycle regulators (cyclins, CDKs and regulators) can vary in different cell types, which could lead to different responses after FH535 treatment. This may worth exploring in our future study.

thumbnail

Figure 4. FH535 alters cell cycle progression in Huh7 and LCSC cells.

A. Huh7 cells were cultured in DMEM +10%FBS for 24 h. The cells were washed with serum free DMEM 3 times, then cultured in DMEM +0.1% FBS for 24 h for cell synchronization. Cells were then cultured in DMEM+10% FBS along with different concentrations of FH535 for 24 h. The cells were harvested and stained with propidium iodide (PI) and analyzed by flow cytometry according to the GenScript protocol (Piscataway, NJ, USA). Treatment with FH535 increased the percentage of cells in G1 and decreased the percentage of cells in S phase. The experiment was done twice with similar results. B. LCSC cells were cultured in CelProgen complete LCSC culture medium for 24 h. Cells were then washed with serum free CelProgen medium 3 times and cultured in CelProgen Medium +0.1% FBS for 24 h for synchronization of the cells. The cells were then returned to CelProgen Complete Medium +10% FBS with different concentrations of FH535 for 24 h. Cell cycle was assayed as per Huh7 described above.

doi:10.1371/journal.pone.0099272.g004

3.5 Expression of β-catenin target genes cyclin D1 and Survivin is inhibited by FH535

β-catenin controls cell proliferation and survival by regulating the expression of numerous targets genes. Two well-established targets are the genes encoding Survivin (Birc5) and Cyclin D1 (CcnD1). Survivin is an anti-apoptotic protein that also regulates progression through mitosis [34]; Cyclin D1 controls proliferation by activating the G1 kinases cdk4 and cdk6 [35]. Survivin and Cyclin D1 transcription are regulated through TCF elements in their promoter regions [36]. To test whether FH535 inhibits expression of these two β-catenin target genes, real-time RT-PCR was performed with LCSC and HCC cells that were treated with increasing amounts of FH535. Cyclin D1 and Survivin mRNA levels were reduced by FH535 in all three cell populations in a dose-dependent manner (Fig. 5). To confirm that this reduction in mRNA levels also led to lower protein levels, western analysis was performed using whole cell extracts from Huh7 cells. Both Cyclin D1 and Survivin protein levels were reduced in a dose-dependent manner, with the greatest reduction seen in the presence of 10 µM FH535 (Fig. 6.). Densitometric analysis indicated that FH535 at 5 and 10 µM inhibited Cyclin D1 28% and 64% respectively; FH535 at 5 and 10 µM inhibited surviving 24% and 48% respectively (Fig. 6).

thumbnail

Figure 5. FH535 reduces cyclin D1 and survivin mRNA levels in LCSC and in HCC cell lines.

LCSCs, Huh7 and Hep3B cells were treated with DMSO alone or increasing concentrations of FH535 for 38-time PCR for expression of Cyclin D1 (Panel A) or Survivin (Panel B). In both cases, mRNA levels were plotted relative to β2-microglobulin. The experiment was done twice with similar results.

doi:10.1371/journal.pone.0099272.g005

thumbnail

Figure 6. FH535 reduces cyclin D1 and Survivin protein levels in Huh7 cells.

Huh7 cells were treated with DMSO alone or increasing amounts of FH535 for 38-PAGE, and transferred for Western analysis with antibodies against Cyclin D1, Survivin, and β-actin. The top of shows the western blot image; the bottom graph shows densitometric analysis of the western data. This densitometric analysis indicated that FH535 at 5 and 10 µM inhibited Cyclin D1 protein levels 28% and 64% respectively; FH535 at 5 and 10 µM inhibited Survivin protein levels 24% and 48% respectively. The experiment was done twice with similar results.

doi:10.1371/journal.pone.0099272.g006

Discussion

In recent years, numerous signaling pathways have been implicated in hepatic carcinogenesis. The β-catenin pathway is essential in stem cells for self-renewal and maintenance of stem cell properties. Disruption of this balance results in both genetic and epigenetic changes, found in many cancers, including colon cancer and HCC [4]. In this study, we used FH535 as an inhibitor of the β-catenin pathway. This compound has been used previously to inhibit β-catenin expression in cells from colon and lung as well as in cells from hepatoblastoma and HCC [15]. In this report, the authors concluded that FH535 was toxic to a number of cell lines, including Huh7. However, their assays could not distinguish between toxicity and reduced cell proliferation. Our data indicates that FH535 does indeed inhibit cell proliferation; we did not directly measure toxicity.

FH535 inhibition of LCSC proliferation is of interest due to its potential therapeutic effect in chemo-resistant HCC. Our group and others have focused on strategies to inhibit the proliferation of LCSC and differences in resistance patterns with non-liver cancer stem cell lines in vitro and in vivo.

Despite numerous efforts, the etiology of HCC tumorigenesis, whether transformed cells originate from mature hepatocytes or stem/progenitor cells remains unclear. Stem cells are defined by their potential for self-renewal and by their ability to proliferate and differentiate into diverse cell types [37]. In recent years, studies have provided convincing evidence that these cells do exist in solid tumors of many types including, brain, breast, colorectal, liver, pancreas and prostate cancers [27]. In this study we have used LCSC that are 64.4%, 83.2%, 96.4% and 96.9% positive, respectively, for CD133, CD44, CD24 and Aldehyde A1 as determined by flow cytometry. These cells have been previously profiled not only by checking the LCSC markers but also by evaluating their tumorigenic potential using low cell numbers (using 2000 LCSCs instead of 100,000 HCC cells to generate tumors) and studying resistance to several drugs. We previously found that these LCSC have intermediate to high resistance to drugs compare to non- liver cancer stem cell lines using different inhibitors.

In this study, we found that FH535, LCSC inhibition of proliferation was affected by FBS concentration in the culture medium, suggesting that the PPAR pathway may be involved in LCSC proliferation as found in the human cancer cell line HCT116 [15]. This could be explained by a variety of fatty acids and their derivatives present in the FBS that are natural agonists to PPAR. It is possible the PPAR agonists suppress the inhibitory effects of FH535 in cell culture. Indeed, in HCT116 cells, FH535 inhibition of β-catein/TCF-dependent luciferase reporter genes was five times stronger in serum-free medium than in media containing 10% FBS. The ability of FH535 to inhibit tumor growth was dramatically increased when 10% FBS was replaced with 10% BSA [15]. Lysophosphatidic acid was found to be an effective PPAR agonist that could reverse FH535 induced inhibition of HCT116 growth [15]. However, the potential function of PPAR in LCSC is beyond the scope of this study and needs further investigation. Recently, FH535 was found to be the most potent drug among several other Wnt/β-catenin inhibitors on human biliary tract cancer cells cultured in serum-free medium [38]. Our study found that FH535 is much more potent than XAV939 in 10%FBS DMEM. This may be related to the PPAR inhibition potential of FH535. Our study found that FH535 inhibited HCC cell lines Huh7, Hep3B and PLC proliferation, indicating that Wnt/β-catenin signaling plays an important role not only in LCSC but also in HCC.

FH535 inhibition of LCSC and HCC proliferation was illustrated by its ability to inhibit β-catenin/TCF/LEF-dependent luciferase reporter activity. To our knowledge, this is the first report on the ability of FH535 to inhibit β-catenin/TCF/LEF activity in LCSC and in HCC cell lines. Previously, Handeli and Simon reported that FH535 inhibits β-catenin/TCF/LEF activity in the HepG2 cell line, which was mistakenly labeled as HCC by these authors [15]. For over thirty years this cell line was considered HCC by numerous investigators. Lopez et al., who initially isolated these cells, recently concluded that HepG2 cells should in fact be considered a hepatoblastoma cell line [39]. Further studies will be needed to investigate how FH535 inhibition of β-catenin influences LCSCs and HCCs. As shown here, cyclin D1 and Survivin expression are inhibited by FH535. Survivin is an anti-apoptotic protein that also regulates progression through mitosis [26], whereas Cyclin D1 controls proliferation by activating the G1 kinases [35]. Real-time RT-PCR and Western analysis confirmed that the expression of these target genes was evident at the mRNA and protein level. Our preliminary data indicate that FH535 treatment does not alter CD133, CD13 and EPCAM expression in LCSC and HCC cell lines (data not shown). Further analysis of these and other stem cell markers are warranted.

In conclusion, our data show that FH535 is a potent inhibitor of the Wnt/β-catenin pathway in LCSCs and HCC cell lines. Whether its ability to inhibit PPAR also affects the growth of LCSCs and HCC cells will require further investigation. Further studies will also be needed to investigate the in vivo efficacy and toxicity of FH535 on HCC xenografts in an animal model. The role of combination therapy using FH535 with other anti-HCC drugs and the possibility of finding cross-talk of Wnt/β-catenin pathway with other signaling pathways should be investigated.

7.10.1.3 Wnt signaling in hepatocellular carcinoma: analysis of mutation and expression of beta-catenin, T-cell factor-4 and glycogen synthase kinase 3-beta genes.

Hepatocellular carcinoma (HCC) is a common killer cancer in the world. Recently, abnormal activation of the Wnt pathway has been found to be involved in the carcinogenesis of several human cancers including HCC. The goal of the present study was to investigate the mechanism of inappropriate activation of the Wnt pathway in hepatocarcinogenesis. We analyzed the alterations of three key components of the Wnt pathway: beta-catenin, glycogen synthase kinase (GSK)-3beta and T-cell factor (Tcf)-4 in 34 HCC and paracancerous normal liver by immunohistochemistry, polymerase chain reaction (PCR)-single-strand conformation polymorphism (SSCP), direct sequencing, and quantitative real-time reverse transcription (RT)-PCR. We found that 61.8% (21/34) of all HCC examined showed an abnormal beta-catenin protein accumulation in the cytoplasm or nuclei. The RT-PCR-SSCP and direct sequencing showed that beta-catenin exon 3 mutations existed in 44.1% (15/34) of the HCC. No mutations of GSK-3beta or Tcf-4 were detected in HCC. Moreover, messenger RNA of beta-catenin and Tcf-4, but not GSK-3beta, was found to be overexpressed in HCC. On analyzing the relationship between alterations of beta-catenin or Tcf-4 and C-myc or Cyclin D1 expression, we found that mutations of beta-catenin, as well as overexpression of beta-catenin or the Tcf-4 gene were independently correlated with C-myc gene overexpression in HCC. Our present findings strongly suggest that mutations of beta-catenin, as well as overexpression of beta-catenin and the Tcf-4 gene, independently activate the Wnt pathway in HCC, with the target gene most likely to be C-myc.
7.10.1.4 Wnt signaling and cancer
Genes & Dev. 2000. 14:1837-1851
http://dx.doi.org:/10.1101/gad.14.15.1837

The regulation of cell growth and survival can be subverted by a variety of genetic defects that alter transcriptional programs normally responsible for controlling cell number. High throughput analysis of these gene expression patterns should ultimately lead to the identification of minimal expression profiles that will serve as common denominators in assigning a cancer to a given category. In the course of defining the common denominators, though, we should not be too surprised to find that cancers within a single category may nevertheless exhibit seemingly disparate genetic defects. The wnt pathway has already provided an outstanding example of this. We now know of three regulatory genes in this pathway that are mutated in primary human cancers and several others that promote experimental cancers in rodents (Fig. 1). In all of these cases the common denominator is the activation of gene transcription by β-catenin. The resulting gene expression profile should provide us with a signature common to those cancers carrying defects in the wnt pathway. In this review, the wnt pathway will be covered from the perspective of cancer, with emphasis placed on molecular defects known to promote neoplastic transformation in humans and in animal models.

Figure 1.

Oncogenes and tumor suppressors in the wnt signaling pathway. Lines ending with arrows or bars indicate activating or inhibitory effects, respectively. Green and red indicate proto-oncogenic and tumor suppressive activity, respectively, in human cancer or transgenic animals. Definition of the genes and the basis for their activities are described in the text.

The wnt signaling mechanism

The model illustrated in Figure 2 is a proposed mechanism for wnt signaling and is based on the following literature. Signaling is initiated by the secreted wnt proteins, which bind to a class of seven-pass transmembrane receptors encoded by the frizzled genes (Bhanot et al. 1996; Yang-Snyder et al. 1996; He et al. 1997). Activation of the receptor leads to the phosphorylation of the dishevelled protein which, through its association with axin, prevents glycogen synthase kinase 3β (GSK3β) from phosphorylating critical substrates (Itoh et al. 1998; Kishida et al. 1999; Lee et al. 1999; Peters et al. 1999; Smalley et al. 1999). In vertebrates, the inactivation of GSK3β might result from its interaction with Frat-1 (Thomas et al. 1999; Yost et al. 1998; Li et al. 1999a; Salic et al. 2000). The GSK3β substrates include the negative regulators axin and APC, as well as β-catenin itself (Rubinfeld et al. 1996; Yost et al. 1996; Yamamoto et al. 1999). Unphosphorylated β-catenin escapes recognition by β-TRCP, a component of an E3 ubiquitin ligase, and translocates to the nucleus where it engages transcription factors such as TCF and LEF (Behrens et al. 1996; Molenaar et al. 1996;Hart et al. 1999). Additional components in the pathway include casein kinases I and II, both of which have been proposed to phosphorylate dishevelled (Sakanaka et al. 1999; Willert et al. 1997; Peters et al. 1999). The serine/threonine phosphatase PP2A associates with axin and APC, although its functional role in the pathway remains obscure (Hsu et al. 1999; Seeling et al. 1999). Also obscure is the manner by which the wnt receptors communicate with dishevelled.

Figure 2.

Proposed mechanism for the transmission of wnt signals. In the absence of wnt –wnt) GSK3β phosphorylates APC and axin, increasing their binding affinities for β-catenin, which too is phosphorylated by GSK3β, marking it for destruction. In the presence of wnt (+wnt) FRAT prevents GSK3β from phosphorylating its substrates, and β-catenin is stabilized. Casein kinase1ε (CK1ε) binds to and phosphorylates dishevelled (dvl) modulating the FRAT1/GSK3β interaction. RGS, PDZ, and DIX are protein interaction domains.

 Receptors, ligands, and related proteins

The proto-oncogenic effects of wnt were discovered over 18 years ago inciting intense investigation into the role of wnt genes in human cancer (Nusse and Varmus 1982). The subsequent discovery of wingless, the fly homolog of wnt-1, paved the way for assembling a signaling pathway subsequently found to contain cancer causing genes (Cabrera et al. 1987; Rijsewijk et al. 1987). Although wnt was the prototypical oncogene in this pathway, no formal proof for its involvement in human cancer has ever been documented. There have been numerous reports on the overexpression, and sometimes underexpression, of wnt genes in human cancers, but mRNA expression levels are merely correlative. More compelling evidence, such as amplification, rearrangement, or mutation of genes encoding wnt ligands or receptors has not been forthcoming. In lieu of these sorts of findings, we are left to speculate on the consequences of epigenetic events implicating these genes in human cancer. In doing so we can use animal and cell culture models to guide our interpretation.

The wnt ligands, of which there are at least 16 members in vertebrates, are secreted glycoproteins that can be loosely categorized according to their ability to promote neoplastic transformation (for review, seeWodarz and Nusse 1998). For example, the activation of wnt-1, wnt-3, or wnt-10b by retroviral insertion in the mammary gland will promote tumor formation in mice (Lee et al. 1995; Nusse and Varmus 1982; Roelink et al. 1990). Oncogenic potential can also be assessed in cultured mammalian cells, such as C57MG and CH310T1/2, where expression of the proto-oncogenic wnts results in morphological transformation (Bradbury et al. 1994; Wong et al. 1994). These cells are transformed by wnt-1, wnt-2, wnt3a but not by wnt-4, wnt-5a, and wnt-6. The transforming wnt genes also promote the accumulation of β-catenin in some cultured mammalian cells (Shimizu et al. 1997). Some aspects of the wnt cancer pathway are also recapitulated inXenopusdevelopment, where injection of transforming wnts into early embryos results in duplication of the dorsal axis (Wodarz and Nusse 1998). A caveat here is that the lack of specific receptors for certain wnts might also explain their inactivity in some of these assays (He et al. 1997). Nevertheless, identifying those wnts capable of neoplastic transformation will aid the interpretation of epigenetic evidence implicating wnts in cancer. For example, expression of thewnt-16 gene is activated by the E2A–Pbx1 fusion product in acute lymphoblastoid leukemia (McWhirter et al. 1999), but the oncogenic potential of wnt-16 is unknown.

As might be expected from the plethora of wnt genes, there are also numerous wnt receptors. At least 11 vertebrate frizzled genes have been identified, but how they differ in function and ligand specificity is far from clear. The analysis of mere binding specificity may not be sufficient to sort out the appropriate combinations of functional receptor-ligand interactions. Wnt-3a and wnt-5a both bind to Human frizzled 1 (Hfz1), yet only wnt-3a mediates TCF-dependent transcription (Gazit et al. 1999). This suggests that the activation of TCF/LEF-dependent transcription is a good correlate to neoplastic transformation. Implementation of this assay, along with a second assay involving the translocation of PKC to the cell membrane, resulted in the categorization of murine wnt receptors into two exclusive groups (Sheldahl et al. 1999). Human FzE3 fell into the TCF/LEF activation group, consistent with previous work showing that its overexpression resulted in nuclear localization of β-catenin (Tanaka et al. 1998). This receptor was also expressed in numerous human esophageal cancers, but not in matched normal tissue (Tanaka et al. 1998).

In addition to the frizzled receptors, there exists a family of secreted proteins bearing homology to the extracellular cysteine-rich domain of frizzled. The so-called secreted frizzled-related proteins (sFRP) bind to the wnt ligands, thereby exerting antagonistic activity when overexpressed in wnt signaling assays (Leyns et al. 1997; Wang et al. 1997). The vertebrate sFRPs, like the frizzled proteins, exhibit functional specificity with respect to the various wnts. InXenopus assays, the prototypical frizzled related protein frzb, now known as sFRP-3, inhibited wnt-1 and wnt-8, but not wnt-5a (Leyns et al. 1997; Lin et al. 1997; Wang et al. 1997). Assays in mammalian cells showed that FrzA, now termed sFRP-1, inhibited wnt-1-induced accumulation of β-catenin (Dennis et al. 1999;Melkonyan et al. 1997). Again, binding specificity may not relate to functional specificity, as wnt-5a associated with sFRP-3 but was unable to inhibit its activity (Lin et al. 1997). Even the significance of specific functional interactions might be suspect based on recent titration experiments with purified soluble sFRP-1. At low concentrations sFRP-1 enhanced signaling activity by soluble wingless protein, whereas at higher concentrations it was inhibitory (Uren et al. 2000). The authors proposed high and low states of binding affinity that involved the carboxy-terminal heparin binding domain and the amino-terminal cysteine-rich domain of sFRP-1, respectively. Binding to the cysteine-rich domain might confer inhibition while binding to the carboxy-terminal region could facilitate presentation of active ligand to receptor. The potential for some sFRPs to activate wnt signaling is consistent with a previous study in which sFRP-2, then known as SARP-1, increased the intracellular concentration of β-catenin and conferred anti-apoptotic properties to cultured MCF-7 cells (Melkonyan et al. 1997). Functional studies are further complicated by the binding of a sFRP to the putative human receptor frizzled-6, underscoring additional possible modes of regulation (Bafico et al. 1999). The sFRPs have not been directly linked to cancer, but one could speculate that the anti-apoptotic activity observed with the SARP-1 could contribute to tumor progression. Alternatively, the identification of sFRP-2 as a target of the hedgehog signaling pathway might be relevant to human basal cell cancers (Lee et al. 2000). Additional structurally distinct secreted inhibitors of wnt signaling include the recently discovered dickopft-1 and wif-1 proteins (Fedi et al. 1999; Glinka et al. 1998;Hsieh et al. 1999).

GSK3β

The serine/threonine kinase GSK3β binds to and phosphorylates several proteins in the wnt pathway and is instrumental to the down regulation of β-catenin (Dominguez et al. 1995; He et al. 1995; Hedgepeth et al. 1999b; Ikeda et al. 1998;Itoh et al. 1998;Li et al. 1999a; Nakamura et al. 1998b; Rubinfeld et al. 1996;Yamamoto et al. 1999; Yost et al. 1996). As a negative regulator of wnt signaling, GSK3β would qualify as a potential tumor suppressor. However, mutations or deletions in the gene coding for GSK3β were not been detect ed in a survey of colorectal tumors (Sparks et al. 1998). Perhaps GSK3β can compensate for the loss of GSK3β and the biallelic inactivation of both these genes is unlikely in tumor progression. Alternatively, the utilization of GSK3β by pathways independent of wnt could make its overall ablation incompatible with cell viability. Nevertheless, inactivation of GSK3β can still be achieved by a means other than genetic ablation and can occur in a manner that uniquely affects wnt signaling. This mode of inactivation involves the association of GSK3β with Frat-1. Frat-1 was identified by insertional mutagenesis in a screen for genes that enhanced the progression of transplanted T-cell lymphomas in mice (Jonkers et al. 1997). Subsequent transgenic expression of Frat-1 alone did not induce spontaneous lymphomas, but greatly enhanced lymphomagenesis initiated either by leukemia virus M-MuLV or expression of the Pim1 oncogene (Jonkers et al. 1999). A connection to GSK3β was realized by the discovery of the Frat-1 Xenopushomolog GBP, a GSK3β binding protein inhibitory to wnt signaling when expressed in Xenopus embryos (Yost et al. 1998). Frat-1 is also antagonistic to wnt signaling in mammalian cells, presumably because it competes with axin for binding to GSK3β (Li et al. 1999a; Thomas et al. 1999). GBP also inhibited the phosphorylation and degradation of β-catenin in vitro when added to Xenopusextracts (Salic et al. 2000). Although Frat-1 contributes to cancer progression in a transgenic mouse model, its contribution to human cancer has not been documented.

Dishevelled

The genetic analysis of dishevelled in developmental systems has defined it as a positive mediator of wnt signaling positioned downstream of the receptor and upstream of β-catenin (Noordermeer et al. 1994). Overexpression or constitutive activation of dishevelled would be expected to promote neoplastic transformation, but its involvement in human cancers has not been reported. This might reflect the dual function of dishevelled, one that transduces wnt signals for the stabilization of β-catenin and a second that relays signals for the activation of jun kinases (Li et al. 1999b; Moriguchi et al. 1999). Although these two functions are housed in physically separable regions of the protein, dysregulation of one function, without impacting the other, could place severe constraints on selection for potential oncogenic mutations. A possible connection of dishevelled to cancer is through casein kinase II, which binds to and phosphorylates dishevelled and also promotes the formation of lymphomas when expressed in transgenic mice (Seldin and Leder 1995; Song et al. 2000; Willert et al. 1997).

β-catenin

Mutations in the β-catenin gene (CTNNb1) affecting the amino-terminal region of the protein make it refractory to regulation by APC (Morin et al. 1997; Rubinfeld et al. 1997). These mutations affect specific serine and threonine residues, and amino acids adjacent to them, that are essential for the targeted degradation of β-catenin (for review, see Polakis 1999). The mutations abrogate the phosphorylation dependent interaction of β-catenin with β-TRCP, a component of an E3 ubiquitin ligase that makes direct contact with amino terminal sequence in β-catenin (Hart et al. 1999). This regulatory sequence in β-catenin is mutated in a wide variety of human cancers as well as in chemically and genetically induced animal tumors. Importantly, β-catenin mutations in tumors are exclusive to those that inactivate APC. This is particularly apparent in colorectal cancer where the vast majority of these tumors contain APC mutations and the overall frequency of β-catenin mutations is quite low (Samowitz et al. 1999; Sparks et al. 1998;Kitaeva et al. 1997) (Table 1). When colorectal tumors lacking APC mutations were analyzed separately, the likelihood of finding a CTNNb1 mutation was greatly increased (Iwao et al. 1998; Sparks et al. 1998). The exclusivity of CTNNb1 and APC mutations in colorectal cancer was also evident from the analysis of replication error-positive tumors identified by microsatellite instability. Both the hereditary and sporadic forms of replication error-positive colorectal cancers had a relatively high frequency of β-catenin mutations, whereas APC mutations were relatively rare (Mirabelli-Primdahl et al. 1999; Miyaki et al. 1999) (Table 1). Interestingly, this correlation between microsatellite instability andCTNNb1 mutations was not apparent in endometrial cancers (Mirabelli-Primdahl et al. 1999).

Table 1. 
Beta-catenin mutations in human cancers
Aggressive fibromatosis, otherwise known as desmoid tumor, is a locally invasive fibrocytic growth that occurs with increased incidence in patients with familial adenomatous polyposis coli (FAP). FAP individuals carry APC mutations in their germline and present with multiple intestinal adenomas at an early age. Desmoids also occur sporadically and, with the exception of colorectal cancer, represent a rare example of biallelic inactivation of APC in individuals without a pre-existing germline mutation in APC (Alman et al. 1997). Not surprisingly, mutations inCTNNb1 have also been detected in sporadic desmoid tumors (Shitoh et al. 1999;Tejpar et al. 1999). The β-catenin mutations were found in over half of the 42 desmoids analyzed, while inactivating mutations in APC were detected in nine and, again, there was no overlap between APC and β-catenin mutations (Tejpar et al. 1999). The β-catenin mutations were all of the missense variety and were confined to codons 41 and 45. Some of the desmoids lacked mutations in either β-catenin or APC, but all displayed increased expression of β-catenin, implying that yet unidentified defects in β-catenin regulation exist in some of these tumors.

There appears to be a low probability of accruing biallelic inactivating mutations in APC in most sporadic cancers, despite increased cancer incidence at numerous extracolonic sites in FAP patients. This suggests that the stabilization of β-catenin can promote cancer in many tissue types, but the biallelic inactivation of APC is an unlikely means to this end. Components in the wnt pathway other than APC, such as β-catenin, might make easier targets for oncogenic mutations. Indeed, several mutations in CTNNb1 were recently identified in gastric cancers, which occur with increased incidence in FAP patients (Park et al. 1999). In this study, 27% of intestinal type gastric cancers harbored mutations in β-catenin. Hepatoblastoma also occurs with increased incidence in FAP individuals (Hughes and Michels 1992;Giardiello et al. 1996; Cetta et al. 1997), but biallelic inactivation of APC is uncommon in the sporadic forms of these tumors. In three separate studies, mutations in β-catenin were identified at high frequency in hepatoblastoma, while no APC mutations were found (Koch et al. 1999; Jeng et al. 2000; Wei et al. 2000). Hepatoblastoma is also associated with Beckwidth–Wiedemann syndrome (BWS), however, a direct link between wnt signaling and the genetic defects underlying BWS are unlikely as a tumor from one of these patients also contained a somatic mutation in β-catenin (Wei et al. 2000). By contrast, a subset of patients with Turcot’s syndrome harbor germline mutations in APC and are at increased risk of medulloblastoma (Hamilton et al. 1995; Lasser et al. 1994). Although inactivating mutations in APC have not been detected in the sporadic forms of medulloblastoma, CTNNb1mutations were found in a small percentage (Zurawel et al. 1998).

Hepatocellular carcinoma (HCC) has become one of the most common tumors harboring mutations in the wnt pathway. Based on five separate studies, the frequency of CTNNb1 mutations in hepatocellular carcinoma (HCC) was ∼20% overall and perhaps higher still for HCCs associated with hepatitis C virus (de La Coste et al. 1998; Miyoshi et al. 1998;Huang et al. 1999; Legoix et al. 1999; Van Nhieu et al. 1999) (Table1). Preliminary data indicated a poorer prognosis associated with nuclear accumulation of β-catenin in HCC and histological data indicated enhanced nuclear staining in the invasive and intravascular compartments of the tumors (Huang et al. 1999; Van Nhieu et al. 1999). In one of these studies an inverse correlation between β-catenin mutations and loss of heterozygosity in the genome was noted (Legoix et al. 1999). This suggests that chromosomal instability and mutations inCTNNb1 represent alternative modes of tumor progression in HCC.

It is noteworthy that c-myc and cyclin D genes are amplified in a subset of HCCs and both these genes are downstream targets of β-catenin (He et al. 1998; Nishida et al. 1994; Peng et al. 1993;Shtutman et al. 1999; Tetsu and McCormick 1999). It would be of interest to determine whether any overlap exists between their amplification and CTNNb1mutations in HCC. Animal models of HCC have provided some clues toward understanding the relationship between these genes in cancer. HCCs induced by transgenic expression of SV40 T antigen in murine liver did not contain mutations in CTNNb1 (Umeda 2000). As T antigen activates cyclin D kinase by sequestration of Rb, the activation of the cyclin D gene by mutant β-catenin may no longer be required. By contrast, activating mutations inCTNNb1 were identified in half of the HCCs generated by transgenic expression of c-myc in murine liver (de La Coste et al. 1998). This animal model suggests that β-catenin mutations occur as a second “hit” in HCC tumor progression in cooperation with a distinct cancer pathway initiated by c-myc. That CTNNb1mutations can occur subsequent to other oncogenic defects is also evident from their occurrence in Wilm’s tumor. Mutations in β-catenin were detected in 15% of these pediatric kidney cancers and in two of these cases they were concomitant with mutations in the Wilm’s tumor gene WT1 (Koesters et al. 1999). One of these cases was associated with Denys-Drash syndrome, a familial disorder attributable to germline mutations in WT1.

It makes sense that extracolonic tumors associated with FAP, such as desmoids, medulloblastoma, and HCC, would contain CTNNb1mutations in their sporadic forms. Thyroid cancers also occur with increased incidence in FAP and, not surprisingly, a high frequency ofCTNNb1 mutations was recently reported for anaplastic thyroid cancers (Cetta et al. 2000; Garcia-Rostan et al. 1999). Although many of these mutations affected amino acids known to influence the regulation of β-catenin, many of them affected residues for which the consequence of their mutation is unknown (Garcia-Rostan et al. 1999). In particular, the substitution K49R was detected nine times. This mutation was frequently detected in the context of independentCTNNb1 mutations in the same thyroid tumor, and up to four independent CTNNb1 mutations were found in some tumors. The occurrence of multiple independent CTNNb1 mutations was also noted in some HCCs and might reflect the multifocal origin of some cancers (Huang et al. 1999; Legoix et al. 1999; Van Nhieu et al. 1999). In one HCC study, examination of different tumor areas from the same patient revealed distinct CTTNb1 mutations in two independent cases (Huang et al. 1999).

Some cancers, such as endometrial ovarian tumors, do not occur with increased incidence in patients with FAP, yet they contain activating mutations in CTNNb1(Palacios and Gamallo 1998; Gamallo et al. 1999; Wright et al. 1999). Perhaps inactivation of the remaining wild-type APC allele in FAP individuals is unlikely in this tissue, or the expression of an alternative APC gene compensates for its loss. The CTNNb1 mutations associated with ovarian cancer appeared to be confined to the endometrioid subtype. In this tissue, cancers with activated β-catenin signaling were reported to be less aggressive than their nonactivated counterparts. In one report, a more favorable prognosis was associated with cancers exhibiting enhanced nuclear staining of β-catenin and another indicated higher frequency ofCTNNb1 mutations in lower grade tumors (Palacios and Gamallo 1998; Wright et al. 1999). A similar inverse correlation between tumor grade and occurrence ofCTNNb1 mutations was also reported for uterine endometrial cancers (Fukuchi et al. 1998). The overlap between mutations in CTNNb1 and other gene defects in ovarian cancers has not been explored in detail, although one study noted coexisting mutations in the PTEN tumor suppressor andCTNNb1 in endometrioid tumors (Wright et al. 1999).

Additional types of cancers with CTNNb1 mutations, albeit at low frequency, include melanoma and prostate. Although only one of sixty-five melanomas contained detectable mutations, nuclear localization of the protein was seen in one-third (Rimm et al. 1999). Thus, additional mechanisms for β-catenin activation likely occur in these tumors. Possibly the highest percentage ofCTNNb1mutations occurs in a common skin tumor known as pilomatricomas (Chan et al. 1999). That these tumors might contain CTNNb1 mutations was surmised from the genesis of similar tumors in transgenic mice expressing mutant β-catenin in the skin (Gat et al. 1998). The tumors appeared to originate from the hair follicle, which is consistent with the lack of hair in mice homozygous for mutations in LEF, a transcription factor responsive to β-catenin (van Genderen et al. 1994).

Axin

Axin was originally identified as an inhibitor of wnt signaling inXenopus embryos and was subsequently shown to bind directly to APC, β-catenin, GSK3β and dishevelled (for review, see Peifer and Polakis 2000). A plethora of in vitro and in vivo studies inXenopus, Drosophila, and cultured mammalian cells has demonstrated that axin is central to the down regulation of β-catenin (Zeng et al. 1997; Behrens et al. 1998; Hart et al. 1998;Ikeda et al. 1998; Nakamura et al. 1998a; Sakanaka et al. 1998; Fagotto et al. 1999; Hedgepeth et al. 1999a; Li et al. 1999a; Willert et al. 1999a; Farr et al. 2000). It is not entirely clear how axin functions, but it has been proposed to facilitate the phosphorylation of β-catenin and APC by GSK3β (Hart et al. 1998; Ikeda et al. 1998). Thus axin would be viewed as a tumor suppressor based on its ability to downregulate signaling, and this has now been verified by documentation of its biallelic inactivation in human hepatocellular cancers and cell lines (Satoh et al. 2000). Importantly, these mutations were identified in those HCCs that lacked activating mutations inCTNNb1. All of the mutations were predicted to truncate the axin protein in a manner that eliminated the β-catenin binding sites. Axin, which should now be regarded as a tumor suppressor, constitutes the third genetic defect in the wnt pathway that contributes to human cancer. There also exists a close homolog of axin termed conductin, which exhibits of all the binding and regulatory functions of axin (Behrens et al. 1998). That this apparent redundancy did not suppress axin mutations in HCC suggests conductin is either not functionally equivalent to axin or not expressed at levels sufficient to compensate for its loss in HCCs.

PP2A

The dependence upon serine/threonine kinases for the regulation of β-catenin implies that phosphatases are also involved. Indeed, the rapid dephosphorylation of the axin protein is a consequence of wnt signaling and has been proposed to both destabilize axin and reduce its affinity for β-catenin (Willert et al. 1999b;Yamamoto et al. 1999). Although axin binds directly to the PP2A catalytic subunit, the phosphatase affecting axin in response to wnt signaling has not been identified (Hsu et al. 1999). If PP2A is this phosphatase, it would be viewed as proto-oncogenic because it downregulates the tumor suppressor axin. On the contrary, expression of the PP2A regulatory subunit B56 in human colon cancer cells results in the downregulation of β-catenin, consistent with a tumor suppressive function in the wnt pathway (Seeling et al. 1999). Moreover, the beta isoform of the PP2A A subunit is deleted in some human colon tumors, again implying tumor suppression (Wang et al. 1998). Also, disruption of twins, aDrosophila gene coding for a PP2A subunit, complemented the overexpression and underexpression of the β-catenin homolog armadillo, in a manner consistent with negative regulation of wnt signaling (Greaves et al. 1999). By all accounts, PP2A plays a role in wnt signaling, but its potential role as proto-oncogene or tumor suppressor might be dependent upon the precise nature of the defect.

APC

Genetic analysis of FAP families led to the identification of theAPC gene, and subsequent studies demonstrating an interaction with β-catenin placed it tentatively in the wnt pathway (Groden et al. 1991; Kinzler et al. 1991; Munemitsu et al. 1995; Rubinfeld et al. 1993; Su et al. 1993). Experiments in Drosophilaultimately revealed that genetic ablation of APC indeed resulted in upregulation of β-catenin signaling (Ahmed et al. 1998). In some systems, such as Xenopus andCaenorhabditis elegans, a positive role for APC in the wnt pathway has been proposed, but the former study suffers from potential overexpression artifacts and the latter from a lack of relatedness to the vertebrate APC protein (Rocheleau et al. 1997; Vleminckx et al. 1997). In any case, APC is a tumor suppressor in human cancers and its mutation relates strongly to the regulation of β-catenin. The spectrum of APC mutations, which typically truncate the protein, suggest selection against β-catenin regulatory domains, albeit not necessarily against β-catenin binding (for review, see Polakis 1999). The selective pressure might be directed against the presence of Axin binding sites, of which there are three, dispersed across the central region of the APC protein (Behrens et al. 1998). The presence of axin binding sites are critical to APC in the regulation of β-catenin levels and signaling in cultured cells (Kawahara et al. 2000). Moreover, mice lacking wild-type APC but expressing a truncated mutant APC retaining a single axin binding site are viable and do not develop intestinal neoplasia (Smits et al. 1999). This has not been the case for mice with more extensive truncations in APC (Oshima et al. 1995a; Su et al. 1992). Also, milder forms of colorectal polyposis, as well as familial infiltrative fibromatosis (desmoid tumors), have been associated with germline mutations in the 3′ region of the APC open reading frame. These mutations predict truncated proteins that retain only one or two of the three axin binding sites in APC (Walon et al. 1997; Kartheuser et al. 1999; Scott et al. 1996;van der Luijt et al. 1996). A recent study has also demonstrated that the expression of just the central region of APC, which contains all of the axin and β-catenin binding sites, was sufficient to elicit cellular growth suppression (Shih et al. 2000). This effect is consistent with previous work showing that a like fragment of APC was sufficient to downregulate β-catenin levels in cancer cells (Munemitsu et al. 1995).

Although both copies of the APC gene are typically inactivated in colorectal cancers, it remains possible that a mutant truncated APC could contribute to cancer progression. This was tested by transgenic expression of two different APC mutants in a wild-type intestinal background (Oshima et al. 1995b). This did not result in cancer-prone mice, despite high levels of expression of mutant proteins and, therefore, argues against a dominant negative effect by these particular mutants. However, it does not rule out an additive contribution to tumor progression by mutant APC protein in a background lacking wildtype APC. In fact, genetic evidence argues in favor of selection for a somewhat specific mutant APC protein. The mutation cluster region (MCR) in APC, roughly defined by codons 1250–1500, is not only consistent with selection against specific sequence, but also retention of an APC molecule that extends into the MCR (Fig.3.). A correlation between the presence of a germline mutation in the MCR and the severity of polyposis has been noted (Ficari et al. 2000; Nagase et al. 1992; Wu et al. 1998). The enhanced severity of polyposis suggests there should also be selective pressure for somatic mutations in the MCR, which indeed appears to be the case (Miyoshi et al. 1992). Selective pressure for an MCR mutant has also been proposed based on the occurrence of somatic mutations in the MCR relative to the position of the germline mutation in FAP (Lamlum et al. 1999). Tumors from FAP patients with a germline MCR mutation exhibited frequent inactivation of the remaining APC allele by LOH, while those without a germline MCR mutation had frequent somatic mutations in the MCR (Fig. 3). Therefore, a germline mutation in the MCR could relieve the constraint for a subsequent somatic MCR mutation, thereby increasing the likelihood of polyposis. This implies that a truncated MCR APC mutant has an interfering or gain of function property that enhances tumor progression beyond simple loss of APC function. An interfering function would probably not involve interaction with wild-type APC, as recently suggested, because the MCR mutant is still selected for in the absence of a wild-type APC gene copy (Dihlmann et al. 1999). Finally, some of the germline mutations in APC do not disrupt the open reading frame yet correlate with increased risk of colorectal cancer (Frayling et al. 1998; Gryfe et al. 1999; Laken et al. 1997). These mutations have been proposed to increase the occurrence of subsequent truncating mutations by enhancing the mutational susceptibility of the affected nucleotide tract.

Figure 3.

Mutations in APC. A compilation of germline and somatic mutations in APC illustrates selection for mutations in the mutation cluster region (MCR). MCR mutations result in truncated proteins retaining β-catenin binding but not regulatory activity. Somatic MCR mutations are more frequently selected for in FAP patients with germline mutations outside of the MCR.

Transcription factors

Prior to discussing the potential role for LEF/TCF transcription factors in cancer, it is important to outline the mechanism by which they have been proposed to operate. Although LEF/TCFs bind directly to DNA through their HMG domains, they are incapable of independently activating gene transcription (Eastman and Grosschedl 1999; Roose and Clevers 1999). This has best been illustrated for LEF, which through its binding to the cofactor ALY, makes indirect contacts with a second transcription factor AML (Bruhn et al. 1997). The TCFs do not contain the ALY binding site, but like LEF they cannot activate test genes comprised of multimerized TCF/LEF binding sites and a minimal promotor sequence. However, these reporter genes are activated on coexpression of TCF with β-catenin, suggesting that β-catenin supplies additional cofactors required for transcriptional activation (Molenaar et al. 1996). This activity was localized to the carboxy-terminal region of the Drosophila β-catenin armadillo, which when fused directly to TCF resulted in β-catenin independent transcriptional activation (van de Wetering et al. 1997).

The simple interpretation is that the TCF/LEF-β-catenin complex comprises a bipartite positive acting transcription factor in the wnt pathway. This interpretation agrees well with developmental studies in which the manipulation of LEF/TCF function results in phenotypes consistent with the genetic manipulation of wnt/β-catenin signaling (Behrens et al. 1996; Brunner et al. 1997; Huber et al. 1996; van de Wetering et al. 1997). For example, a zygotic homozygous null mutation inDrosophila LEF results in a loss of naked cuticle in the larval epidermis, a phenotype typical of loss of function wingless mutations (Brunner et al. 1997). Moreover, the formation of excess naked cuticle by ectopic expression of armadillo in wild-type embryos does not occur in the LEF null mutants. Exactly how β-catenin contributes to transcriptional activation is unclear, but might involve additional proteins that bridge the TCF/β-catenin complex to the basal transcriptional machinery. The bridging function might be fulfilled by Pontin 52, a TATA-binding protein that was reported to bind to β-catenin (Bauer et al. 1998). Also, a mutant form of β-catenin incapable of binding LEF squelched LEF-dependent reporter gene activation, presumably by titration of an essential cofactor (Prieve and Waterman 1999). Finally, the carboxy-terminal region of armadillo binds to the Zinc finger protein teashirt, a homeotic gene essential for a subset of wingless signaling outputs in Drosophila (Gallet et al. 1999).

The simple model of positive transcriptional activation by the TCF-β-catenin complex is not in accord with all experiments. Mutation of the TCF/LEF binding sites in the promotors of the wingless responsive gene ultrabithorax and the Wnt-responsive Xenopus gene Siamois enhanced their activities under conditions where the wingless/β-catenin signal input was weak (Brannon et al. 1999; Riese et al. 1997). The mammalian cyclin D gene was recently identified as a wnt target and, again, mutation of the corresponding TCF binding sites enhanced its basal activity (Tetsu and McCormick 1999). These results suggest TCF represses transcription of its target genes in unstimulated cells and the binding of β-catenin promotes derepression. Derepression cannot fully account for signaling activity, however, as mutations in the TCF binding sites compromise target gene activation under conditions of active wnt signaling (Brannon et al. 1999; Riese et al. 1997). Repression of gene expression by TCF is consistent with its direct physical interaction with at least three different gene products, the Groucho/TLE and CtBP corepressors, and the CREB binding protein CBP (Brannon et al. 1999;Cavallo et al. 1998; Levanon et al. 1998; Roose et al. 1998; Waltzer and Bienz 1998).

The groucho/TLE proteins bind to the central region of TCF/LEF at a site distinct from that of β-catenin binding and inhibit gene activation of TCF target genes (Levanon et al. 1998; Roose et al. 1998). By contrast, CtBP binds to two independent sites in the carboxy-terminal region of Xtcf-3, which when mutated abrogated the repressor function of this region of Xtcf-3 (Brannon et al. 1999). The binding sites for CtBP are not present in LEF, which might explain the ability of LEF, but not Xtcf-3, to induce axis duplication in Xenopus embryos. Finally, the Drosophila CREB binding protein CBP was reported to bind to the HMG domain of dTCF (Waltzer and Bienz 1998). Loss-of-function CBP mutants displayed some features of wingless over expression and also suppressed phenotypes resulting from loss of the β-catenin homolog armadillo. The genetics imply suppression of wingless by CBP, which is somewhat paradoxical when considering the role of CBP acetyltransferase activity in chromatin remodeling and gene activation. However, it was shown that CBP acetylates a lysine proximal to the armadillo binding site in TCF, thereby reducing its affinity for armadillo. Repression of β-catenin/TCF signaling by CBP does not occur in all settings, though, as two recent studies demonstrated activation ofXenopus TCF target genes by CBP (Hecht et al. 2000;Takemaru and Moon 2000). CBP directly associated with carboxy-terminal sequence in β-catenin and overexpression of E1A, which also directly binds CBP, reduced β-catenin dependent transactivation.

Does the activation of TCF/LEF target genes by β-catenin cause cancer? Good evidence to this effect was provided by the expression of a chimeric protein consisting of the LEF DNA binding sequence fused to the transcriptional activation domain of either VP16 or the estrogen receptor (Aoki et al. 1999). Expression of these constructs in chicken embryo fibroblasts resulted in their neoplastic transformation. The proliferative potential of TCF was also apparent from the phenotype resulting from homozygous disruption of TCF-4 in the germline of mice. These animals were incapable of maintaining a proliferative stem cell compartment in the small intestine and died shortly after birth (Korinek et al. 1998). Whether the TCF/LEF genes are directly activated by mutations in cancer is unclear, but mutations in TCF-4 have been detected in a subset of colorectal tumors (Duval et al. 1999). The mutations all occur as single base deletions in an (A)9 nucleotide repeat within the 3′ coding region of the gene. These deletions generate frame shifts predicted to effect the proportion of the long and short forms of TCF that normally result from alternative mRNA splicing. The mutations were also found in cancer cell lines, all of which possessed mutations in either APC or β-catenin. This indicates that the TCF mutations do not substitute for APC/β-catenin mutations but could act in an additive manner.

An additional mechanism by which TCFs could contribute to cancer was gleaned from the phenotype of mice homozygous for mutations in TCF-1 (Roose et al. 1999). Fifteen percent of these animals developed adenomatous intestinal polyps by one year of age, implicating TCF-1 as a tumor suppressor. The major isoforms of TCF-1 do not contain a β-catenin binding site and could therefore act in a dominant negative manner in wnt signaling. Crossing TCF-1 null mice with cancer-prone ApcMin/+ mice resulted in offspring with ten times the number of intestinal polyps relative to ApcMin/+ littermates. This experimental model suggests that the genetic ablation of TCF-1 could modify, or even independently contribute to cancer progression in humans. Additional potential mechanisms for cancer would include the inactivation of corepressors such as CtBP and TLE/groucho.

Cross talk

Defects leading to activation of the wnt pathway could also occur in signaling systems that are seemingly unrelated to wnt signaling. One potential mode of cross talk includes the kinase TAK1, which can substitute for MAPK kinase kinase in the yeast pheromone pathway. TAK1 (TGF-β activatedkinase) is activated by TGF-β in mammalian cells and has also been implicated in interleukin-1 activation of NFκB (Ninomiya-Tsuji et al. 1999; Yamaguchi et al. 1995). In c. elegans, the TAK1 homolog MOM-4 negatively regulates the TCF homolog POP-1 by activating another kinase LIT-1, which then phosphorylates POP-1 (Meneghini et al. 1999;Shin et al. 1999). LIT-1 is thought to gain access to POP-1 through its direct binding to the β-catenin homolog WRM-1 (Shin et al. 1999). Parallel interactions have been demonstrated for the mammalian counterparts of these proteins where the phosphorylation of TCF, by the LIT-1 homolog NLK, reduces its DNA binding affinity (Ishitani et al. 1999). Thus a MAPK-like signaling system might downregulate the wnt-1 pathway. A second opportunity for cross talk with wnt signaling was realized by a physical interaction between the β-catenin-TCF complex and SMAD4, a mediator of TGF-β signaling (Nishita et al. 2000). This interaction was proposed to be synergistic with respect to the activation of theXenopus wnt target gene twin. How this relates to cancer is somewhat puzzling when considering that TGF-β signaling is typically compromised by genetic and epigenetic defects during tumor progression.

An additional mode of cross regulation was recently revealed by the discovery that retinoids inhibit β-catenin dependent gene transcription (Easwaran et al. 1999). β-catenin associated with a retinoic acid receptor (RAR) and cooperated with retinoids to enhance activation of a retinoic acid responsive promotor. Moreover, the identification of RAR-γ as a target of wnt signaling inXenopus also points to an interaction between these signaling systems (McGrew et al. 1999). Signaling by β-catenin was also reported to be repressed by expression of sox3 and sox17 transcription factors, which associated directly with β-catenin (Zorn et al. 1999). Although inhibition of β-catenin signaling was clearly demonstrated, it is also possible that β-catenin drives gene activation independent of LEF/TCF, through its association with the sox proteins. Finally, the activation of the WISP genes by β-catenin is highly dependent upon the presence of a CREB binding site in the WISP promotor (Xu et al. 2000). This implies that cAMP-dependent protein kinase A feeds into wnt signaling and might cooperate with the activation of some wnt target genes. The binding of CBP to β-catenin is particularly relevant with respect to this proposal (Hecht et al. 2000; Takemaru and Moon 2000).

Conclusion

It is apparent that wnt signaling causes cancer and that tumor promotion by this pathway can proceed through a number of different genetic defects. Additional mechanisms by which defects in the regulation of wnt signaling contribute to tumor progression probably remain undiscovered. The manifestation of cancer by aberrant wnt signaling most likely results from inappropriate gene activation mediated by stabilized β-catenin. Target genes need not contain TCF/LEF binding sites in their promotors, though, as new potential modes of gene activation by β-catenin are becoming apparent. Several target genes of β-catenin signaling have now been identified and some of their functions are consistent with control of cellular growth, differentiation, and survival. For an excellent summary of wnt target genes, and a wealth of information on wnt signaling in general, I refer the reader to the Wnt Home Page posted by the Nusse lab (http://www.stanford.edu/rnusse/wntwindow.html).

7.10.2 The Wnt.β-catenin pathway in ovarian cancer : a review.

Arend RC1Londoño-Joshi AIStraughn JM JrBuchsbaum DJ.
Gynecol Oncol. 2013 Dec; 131(3):772-9.
http://dx.doi.org:/10.1016/j.ygyno.2013.09.034.

Objective: Ovarian cancer is the deadliest gynecologic malignancy and the fifth leading cause of death from cancer in women in the U.S. Since overall survival remains poor, there is a need for new therapeutic paradigms. This paper will review the Wnt/β-catenin pathway as it relates to epithelial ovarian cancer, specifically its role in chemoresistance and its potential role as a target for chemosensitization. Methods: A PubMed search was performed for articles published pertaining to Wnt/β-catenin pathway specific to ovarian cancer. Wnt/β-catenin signaling pathways play an active role in cancer stem cells (CSCs) and carcinogenesis of all ovarian cancer subtypes. Studies also have shown that ovarian CSCs are involved in chemoresistance, metastasis, and tumor recurrence. Results: Wnt/β-catenin target genes regulate cell proliferation and apoptosis, thereby mediating cancer initiation and progression. The Wnt/β-catenin pathway is one of the major signaling pathways thought to be involved in epithelial-to-mesenchymal transition (EMT). Alterations affecting Wnt pathway proteins on the cell membrane, in the cytoplasm, and in the nucleus have been shown to play important roles in the tumorigenesis of ovarian cancer. Conclusions: Wnt signaling is activated in epithelial ovarian cancer. Given the role of the Wnt/β-catenin pathway in carcinogenesis, more pre-clinical studies are warranted to further investigate other Wnt inhibitors in ovarian cancer. The Wnt pathway should also be investigated as a potential target in the development of new drugs for ovarian cancer as a single agent and in combination with chemotherapy or other targeted agents.

Introduction
Ovarian cancer is the deadliest gynecologic malignancy and the fifth leading cause of death from cancer in women in the U.S. In 2013, there will be an estimated 22,240 newly diagnosed cases of ovarian cancer and an estimated 14,030 deaths in the United States [1].A major contributor to the high mortality rate is the fact that 70% of women with ovarian cancer initially present with metastases throughout the peritoneal cavity. Over the last two decades, advances in chemotherapy have improved the overall survival in patients with advanced stage ovarian cancer [2]. These advances include the introduction of taxane/platinum-based chemotherapy, intraperitoneal delivery of chemotherapy,dose-dense chemotherapy, and the availability of novel agents such as bevacizumab [3,4].Since overall survival remains poor, there is a need for new therapeutic paradigms. Further research is needed to understand how molecular pathways contribute to the development of metastasis, recurrence, and resistance of ovarian cancer to chemotherapeutic agents. Studies have shown that ovarian cancer stem cells (CSCs) are also involved in chemoresistance, metastasis, and tumor recurrence [5]. CSCs area subpopulation of cancer cells that possess characteristics associated with normal stem cells and are able to generate tumors through the stem cell processes of self-renewal and differentiation.These cells are proposed to persist in tumors as a distinct population that cause recurrence and metastasis by giving rise to new tumors. Recently, chemoresistance has been reported to be associated with acquiring epithelial to mesenchymal transition (EMT) in ovarian cancer cells [6].CancercellsundergoingEMT are unique in that they have stem-like properties that enable cancer cell dissemination and metastasis formation [7]. Major signaling pathways involved in EMT include TGF-β, Wnt/ β-catenin, Notch, Hedgehog, and others [8]. Endometrioid ovarian carcinomas often harbor mutations in the β-catenin gene, but mutations in the Wnt/β-catenin pathway are rare in serous, clear cell, and mucinous ovarian carcinomas [9]. There is emerging data that suggests that despite not having mutations, the Wnt/β-catenin pathway plays a role in carcinogenesis of all ovarian cancer subtypes [10–12]. It has been suggested that the Wnt/β-catenin target genes can be divided into two groups: a “stemness/proliferation group” that is active early in tumor progression and an “EMT/ dissemination group” that is expressed in late stage tumors. The Wnt/ β-catenin pathway has been shown to be a therapeutic molecular target for CSCs[13].Wnt/β-catenin target genes regulate cell proliferation and apoptosis,thereby mediating cancer initiation and progression [14,15]. Given the role of the Wnt/β-catenin pathway in carcinogenesis, we will review the Wnt/β-catenin pathway as it relates to epithelial ovarian cancer, specifically its role in chemoresistance and its potential role as a target for chemosensitization.

Historical perspective of Wnt signaling in the ovary

In the late 1990s, the importance of the Wnt pathways in the embryonic development of the ovary was established. Wnt-4, a Wnt ligand, demonstrated a critical role in embryonic ovarian development [16]. Wnt-7a was shown to affect sex-specific differentiation of the reproductive tract [17]. In 2002, Ricken et al. reported that components of the Wnt signaling pathways are expressed in the immature rat ovary, and that their expression is localized to specific ovarian compartments [18]. This study reported the expression of three different Wnt transcripts (Wnt-2b, Wnt-5a, Wnt-11) that were common to five ovarian cancer cell lines derived from histologically varied human ovarian carcinomas.These results raised the possibility that aberrant Wnt expression may be involved in ovarian tumorigenesis in humans. Prior to this study, alterations in Wnt expression had been described in a variety of female human tumors, including breast and endometrial cancer, but this was the first study to suggest its involvement in ovarian cancer. When β-catenin gene mutations were initially discovered in ovarian cancer, they were thought to be limited to the endometrioid subtype [19]. A study by Wu et al. carried out a comprehensive molecular analysis of 45 tumor specimens of primary ovarian endometrioid adenocarcinomas and two ovarian endometrioid adenocarcinomaderived cell lines. They found Wnt/β-catenin pathway defects in both the cell lines and in nearly half of the primary ovarian endometrioid adenocarcinomas analyzed. β-catenin deregulation was most often attributable to a mutation of the β-catenin gene (CTNNB1) itself, although less frequently β-catenin deregulation may have resulted from inactive mutations in the APC, AXIN1, orAXIN2 genes [20]. Depending on the study, a wide range (3–59%) of serous ovarian cancers have also been reported to stain positive for cytoplasmic and nuclear β-catenin by immunohistochemistry even in the absence of mutations in APC, Axin or β-catenin, which are more common in the endometrioid subtype [21–23]. More recent data have shown that although gene mutations in the Wnt/β-catenin pathway are relatively uncommon in ovarian cancer in general, especially in serous ovarian cancer,components of the pathway are still important in the molecular events that lead to ovarian cancer development [12]. There are three main Wnt signaling pathways: the canonical Wnt/β-catenin pathway, the non-canonical planar cell polarity pathway, and the non-canonical Wnt–Ca2+ pathway. These pathways belong to one of two categories: canonical or non-canonical. The difference between these two categories is the presence or absence of β-catenin. The canonical Wnt/β-catenin pathway involves this protein and the non-canonical pathway operates independently of it.

Components of the Wnt signaling pathway

Non-canonical Wnt signaling pathways

Wnt proteins, which serve as ligands for the Wnt pathway, consist of 19 cysteine-rich glycoproteins. They bind to the Frizzled (Fzd) transmembrane receptor, one of the main receptors of the Wnt pathways [24]. When Wnt binds to Fzd, it can activate one of the three distinct intracellular signaling pathways. While the canonical Wnt/β-catenin signaling pathway leads to the accumulation and stabilization of cytosolic, unphosphorylated (“free”) β-catenin, the non-canonical pathways promote an increase in intracellular calcium or mediate cell polarity. In all three pathways, a Wnt ligand binds to Fzd receptor and promotes recruitment of Dishevelled (Dsh) protein (Figs. 1 and 2). In the planar cell polarity non-canonical pathway, this complex binds to the Dsh-associated activator of morphogenesis (Daam1). This cascade of events leads to the activation of Rac and RhoA GTPases which mediate cell polarity (Fig. 1). In the Wnt-Ca2+ noncanonical pathway, the Wnt/Fzd/Dsh complex binds with a G protein (Ror 1/2) as shown in Fig. 1, which leads to activation of calmodulindependent kinase II, protein kinase C and the phosphatase calcineurin. This binding promotes the increase in intracellular calcium levels which then mediates other signaling pathways. The Wnt pathways are critical to embryonic development of a variety of organs including the ovaries. Activation of Wnt signaling occurs via the canonical Wnt/β-catenin pathway and the non-canonical cell polarity pathway and the Wnt/ Ca2+ pathway; however, as it relates to oncology research the Wnt/β-catenin canonical pathwayis the mostrelevant [25].

Canonical (Wnt/β-catenin) signaling pathway

In the canonicalWnt/β-catenin pathway, the pathway is “off” when either there is no Wnt ligand, no receptor, or the receptor is being blocked (Fig. 2A). Dikkopf family (DKK1–4) binds directly to one of the transmembrane receptors (Fzd, LRP5/6) and blocks Wnt from binding. Wnt-inhibitory factor (WIF-1) and the family of secreted Fzd receptor proteins (SFRP1-5) bind to Wnt itself and prevent them from binding to the receptors. If the Wnt ligand does not bind to the receptors, β-catenin is degraded by a destruction complex that is comprised of Axin, adenomatous polyposis coli (APC), and glycogen synthase kinase 3β (GSK3β). β-Catenin is phosphorylated by the kinases casein kinase 1 (CK1) and GSK3β, followed by ubiquitination and proteasomal degradation by the 26S proteasome. Low cytoplasmic levels of β-catenin allow for the recruitment of the corepressor Groucho to lymphoid enhanced factor–T-cell factor (TCF/LEF) transcription factors,which blocks the target genes from being activated and ensures transcriptional repression (Fig. 2A). Activation of the canonical Wnt pathway involves the stabilization of β-catenin through the binding of Wn tligands to cell surface receptors including Fzd family receptors and low-density lipoprotein receptor (LDLR)-related proteins: LRP5 and LRP6. When the Wnt pathway is “on”, cytosolic β-catenin is stabilized (Fig. 2B). LRP6/LRP5 is phosphorylated by the kinases CK1 and GSK3β. Dsh molecules are recruited to the plasma membrane to interact with Fzd. Interaction of Axin with phosphorylated LRP6/LRP5 and Dsh leads to inactivation of the destruction complex and degradation of β-catenin is inhibited. βCatenin accumulates in the cytoplasm and enters the nucleus and activates Wnt target genes by binding to the transcriptional factors of the TCF/LEF family by displacing Groucho and interacting with coactivators such as B-cell lymphoma 9/Legles (BCL9/LGS) and Pygopus (Pygo) to promote transcription of target genes [26]. TCF/LEF, BCL9/ LGS, and Pygo all bind with β-catenin in the nucleus to form a transcriptional activation complex (Fig. 2B). β-Catenin promotes transcription of genes related to proliferation and survival. Some of the key downstream proteins and genes that are activated with the binding of β-catenin to the transcriptional factors of the canonical pathway include c-MYC (MYC), Cyclin D1 (CCND1), Survivin (BIRC5), Axin2 (AXIN2), and matrix metalloproteinases (MMPs). There have been over 100 target genes identified as regulated by the Wnt pathway and 23 of them have been shown to be overexpressed in ovarian cancer [27].

Regulation of the Wnt pathway

The remainder of the review will focus on the canonical Wnt/ β-catenin pathway, because the Wnt/β-catenin pathway has been the most well described in the literature as it relates to cancer research and specifically ovarian cancer. It is regulated at multiple levels: gene mutations, extracellular inhibitors, and intranuclear transcription cofactors. These all contribute to the diverse mechanisms that are involved in the Wnt pathway.When there is no Wnt ligand, a destruction complex regulates β-catenin levels. Specifically, CK1 and unphosphorylated GSK3β phosphorylate β-catenin and target the protein for ubiquitination and proteasomal degradation. Phosphorylation of GSK3β by protein kinases (A, B, and C), Akt/PI3K, and MAPK inhibits its ability to phosphorylate and target β-catenin for degradation. The majority of ovarian cancers have an activation of PI3K (phosphoinositide 3-kinase) by gene amplification, which can potentially phosphorylate GSK3β, impeding the phosphorylation of β-catenin and resulting in cellular differentiation, division, and survival [28,29].

Alterations of the Wnt pathway in ovarian cancer

Membranous factors

The first event in the activation of the Wnt pathway is the binding of a Wnt ligand to Fzd and LRP6/LRP5. Two subtypes of the Fzd receptor are increased in epithelial ovarian cancer, Fzd1 and Fzd5. A higher number of malignant ovarian specimens stained positive for both receptors than normal ovary and the Fzd5-positive tumors had a worse 6-year survival than those that were Fzd5-negative [30]. During metastatic spread of epithelial ovarian cancer, there is adhesion of cancer cells to submesothelial interstitial collagens. When β1 integrin mediated anchoring to the mesothelium and submesothelial matrix occurs, it facilitates the formation of metastatic tumor sites on other peritoneal organs. The engagement of collagen-binding β1 integrins have been shown to upregulate LRP6, WNT5A, MMP9, PTGS2 (COX2), PLAUR (uPAR), VIM (vimentin), SNAII (Snail) at the mRNA level [31]. This suggests tha tmetastatic spread of ovarian cancer is likely facilitated by the upregulation of LRP6 and targeting LRP6 may be an effective strategy for treating ovarian cancer.

There are several proteins that act as antagonists to the Wnt pathway. These proteins include: the Dikkopf family (DKK1–4), Wnt inhibitory factor (WIF-1) and the family of secreted Fzd receptor proteins (SFRP1-5)(Fig.2A). SFRPs bind directly to the Wnt ligand or Fzd receptor and inhibit Wnt from binding to Fzd and activating the pathway. Loss of SFRP4 expression correlates with a more aggressive ovarian cancer phenotype and the level of SFRP4 is directly related to prognosis [32]. Investigators have studied the re-expression of SFRP4 in epithelial ovarian cancer cell lines, and found that re-expression inhibited the Wnt/ β-catenin signaling pathway, thereby inhibiting cell migration and EMT. These proteins provide important potential therapeutic targets by either re-expression, if their expression is lost,or potentially upregulated.

Cytoplasmic and nuclear factors

Endometrioid ovarian carcinomas often have mutations in the βcatenin gene. Table 1 summarizes the studies that show β-catenin mutations in human ovarian cancer, from 16% to 54% in endometrioid cancers and 14% in mucinous cancers. Despite no reported mutations in the CTNNB1 gene in serous and clear cell cancers, nuclear β-catenin has been observed in serous and clear cell ovarian cancer [21]. Lee et al. showed a statistically significant correlation between nuclear β-catenin expression and high-grade serous ovarian cancer [23]. The protooncogene, frequently rearranged in advanced T-cell lymphomas-1 (FRAT1), which inhibits phosphorylation of β-catenin, was found to be overexpressed in serous ovarian cancer and was strongly correlated with the accumulation of cytoplasmic β-catenin, leading to an increase in nuclear β-catenin [21]. Pygo, oneof the co-activators that binds to β-catenin is a necessary component of tumor cell growth and is widely expressed in ovarian cancer, both in cell lines and in primary tumor tissue [33]. RNA expression of BCL9/LGS, also a co-activator,is common in both epithelial ovarian cancer and normal ovaries. Upregulation of these co-activators is further evidence that the Wnt pathway plays a pivotal role in the tumorigenesis of ovarian cancer.

Intercellular interactions

Cells undergoing EMT are known to lose E-cadherin and gain vimentin expression, resulting in tumor cell invasion and metastasis [34]. Epithelial ovarian cancer cells also undergo a mesenchymal to epithelial transition (MET) because the normal ovarian surface epithelium is mesenchymally derived. This dynamic process has been termed EMP (epithelial to mesenchymal plasticity). It is thought that both transitions are equally important for metastasis formation and that the “metastable” state is actually when the cells transition between the two states [34]. Metastatic epithelial ovarian cancer cells adhere to the interstitial collagen of the peritoneal cavity via integrins. Cell–matrix and cell– cell adhesions are paramount to this process and are mediated by integrins and E-cadherins. Integrin engagement has been linked to increased internalization of E-cadherin [31]. In epithelial cancer, the MET component dominates, unlike other epithelial cell-derived cancers where the EMT component dominates; therefore, E-cadherin expression is increased with malignant transformation in ovarian cancer [31]. E-cadherin-based adherens junctions are stabilized by β-catenin, and the loss of stability in the junctions may cause an increase in cytoplasmic and/or nuclear β-catenin. Integrins have also been suggested to inhibit GSK3β, elevate levels of nuclear β-catenin, and increase β-catenin-regulated promoter activation. Burkhalter et al.
showed that an inhibitor of β-catenin and TCF-4, a member of the TCF/LEF transcription factor family, reduced cellular invasion [31]. Most of the regulation of the Wnt pathway ultimately leads to an accumulation or depletion of β-catenin in the nucleus, or affects the binding of nuclear β-catenin to TCF/LEF, which determines whether apoptosis can occur. It is important to note that the transcriptional regulatory activity of β-catenin is also controlled by factors other than Wnt signaling. One example of Wnt-independent regulation of β-catenin is through E-cadherin expression, which selectively depletes the transcriptionally active pool of β-catenin [35]. This is especially significant as epithelial ovarian cancer cells are known to undergo MET which causes an increase in E-cadherin.

Extracellular factors

Not only have membranous and intercellular components of theWnt pathway been found to be upregulated in epithelial ovarian cancer, but extracellular activators also are upregulated. These factors specifically include Wnt-1,Wnt-2b,Wnt-5a, and Wnt-11 [30]. Ricken et al. reported the possibility that Wnt-5a could be involved in ovarian carcinogenesis [18]. This study used RT-PCR on RNA from five ovarian cancer cell lines and confirmed the expression of transcripts for Wnt-2b, Wnt-5a and Wnt-11. Filho et al. showed that upregulation of Wnt-1 and Wnt-5a, detected by immunohistochemistry in patient samples, portended a significantly lower survival than ovarian cancer patient samples that did not have an upregulation of Wnt-1 and Wnt-5a [30].

Gene expression

Kumar et al. analyzed 1500 miRNAs to identify which ones were potentially different between A2780 (parental ovarian cancer cell line) and A2780.cp70 (cisplatin resistant cell line) and found changes in 11 miRNAs [36]. The microRNA data was validated by quantitative realtime PCR for these 11 miRNAs. Ingenuity Pathway Analysis (IPA) and Kyoto Encyclopedia of Genes and Genomes (KEGG) analysis were performed for the 11 miRNAs and their targets to identify the pathways involved in cisplatin resistance. Not only was Wnt signaling one of the pathways identified, but so were MAPK and mTOR signaling pathways which both cross-talk with the Wnt pathway by causing the phosphorylation of GSK3β, blocking its ability to phosphorylate βcatenin to allow it to be ubiquitinated. Four gene expression datasets: Moffitt Cancer Center (MCC), Total Cancer Care (TCC), the Cancer Genome Atlas(TCGA),andMDAnderson (MDA) were analyzed, and only four pathways were noted to be differentially expressed between normal ovarian surface epithelium and ovarian cancer. One of these pathways is the “Cytoskeleton remodeling/TGF–Wnt pathway” [37]. The“Cytoskeleton remodeling/TGF/WNT” pathway was previously described as a common pathway created by the crosstalk between the TGF-β pathway and the Wnt pathway that is involved in cytoskeleton remodeling: cell–cell adhesion and cell–matrix adhesion [38]. This pathway has been associated with metastasis in various cancer types and is critical for cancer cell migration and invasion. The same group at H. Lee Mof fitt Cancer Center found that six common molecular signaling pathways were associated with chemoresistance and survival in ovarian cancer that included the TGF– Wnt pathway and specifically Wnt pathway activated by Wnt-2, one of the 19 Wnt ligands [39]. In addition, this group also used the same novel computer analysis technique to identify genes and molecular signaling pathways associated with cancer cell proliferation. Genes and pathways associated with cancer cell proliferation and survival were analyzed against the NCI 60 cell line-drug screening database to identify agents predicted to have pathway- and gene-specific activity. They identified 81 existing agents that could potentially be repurposed to target the TGF-Wnt pathway that are currently the focus of in vitro functional analyses [40].

Non-canonical pathways

Fig. 1. Non-canonical Wnt signaling pathways. In the planar cell polarity pathway Wnt–Frizzled complex binds to the Dsh-associated activator of morphogenesis (Daam1). This cascade of events leads to the activation of Rac and RhoA GTPases which mediate cell polarity. In the Wnt–Ca2+ pathway, the Wnt/Fzd/Dsh complex binds with a G protein, which leads to activation of calmodulin-dependent kinase II (CaMKII), protein kinase C (PKC), and the phosphatase calcineurin. This binding promotes the increase in intracellular calcium levels which stimulates other signaling pathways.

Fig.2.The canonical Wnt signaling pathway. (A)In the absence of Wnt ligand, β-catenin is degraded through interactions with Axin, APC and GSK3β “destruction complex”. β-Cateninis phosphorylated by the kinases CK1 (casein kinase 1) and GSK3β (glycogen synthase kinase 3β), followed by ubiquitylation and proteasomal degradation. Low cytoplasmic levels of βcatenin allow for the recruitment of the corepressor Groucho to LEF (lymphoid enhanced factor)–TCF (T-cell factor) transcription factors which ensures transcriptional repression. Dikkopf (DKK) family proteins, the Wnt-inhibitory factor (WIF), and the family of secreted Frizzled receptor proteins (SFRPs) all act as antagonists to the Wnt pathway. SFRP binds directly to the Wnt ligand or th eFrizzled receptor to inhibit Wnt binding to Frizzled. (B) In the presence of Wnt ligands, Wnt proteins bind to Frizzled/LRP6/LRP5 receptor complex at the cell surface. LRP6/LRP5 is phosphorylated by the kinases casein kinase 1 (CK1) and glycogen synthase kinase 3β (GSK3β). Dishevelled (Dsh) molecules are recruited to the plasma membrane to interact with Frizzled. Interaction of Axin with phosphorylated LRP6/LRP5 and Dsh leads to inactivation of the destruction complex. Degradation of β-catenin is inhibited. β-Catenin accumulates inthe cytoplasm and nucleus. β-Catenin forms a transcriptionally active complex with TCF/LEF by displacing Groucho and interacting with co-activators suchasBCL9/LGS (B-cell lymphoma 9/Legless) and Pygo (Pygopus) to promote transcription of target genes (Axin, CyclinD1, Survivin). β-Catenin is also a coactivator of CREB binding protein (CBP) which is the binding protein of the cAMP response element-binding protein (CREB). β-Catenin/CBP binds to Wnt-responsive element (WRE) and activates transcription. This leads to cell proliferation, survival, and self-renewal.

Potential therapeutic targets of the Wnt pathway in ovarian cancer

Identification of the specific membranous, intracellular, and extracellular components of the Wnt pathway gives insight to potential targets for therapy. There currently are several small molecules that have recently entered into phase I clinical trials that target the Wnt pathway (Table 2). In order for the Wnt protein to be secreted by the cell to act as a ligand it must first undergo fatty acyl modification. Once it undergoes palmiteolyation it is shepherded through the secretory pathway by Wntless chaperone protein. PORCN is the founding member of a 16-gene family with acyltransferase activity and Porcupine (Porcn) is the acyltransferase enzyme that adds the fatty acid to Wnt which is a crucial step in the secretion of the Wnt ligand. Without Porcn to catalyze this modification, the Wnt protein remains trapped inside the cell. Currently being studied in a phase 1 trial is the small molecule, LGK974 (Novartis Pharmaceuticals) that inhibits Porcn(NCT01352203) [41]. Drugs that specifically target the Wnt signaling pathway in the nucleus include the small molecule inhibitor, PRI-724, which specifically blocks the recruitment of β-catenin with its coactivator CBP which is the binding protein of the cAMP response element-binding protein CREB. βCatenin/CBP binds to Wnt-responsive element (WRE) and activates transcription; therefore, PRI-724 prevents activated transcription by aberrant Wnt signaling. This drug is being studied in solid tumors and myeloid malignancies (NCT01606579) [41]. Other pathways may cross-talk with the Wnt pathway. In Wnt signaling, Axin is a key scaffolding protein of the destruction complex of β-catenin, and Poly (ADP ribose) polymerases (PARPs) promote the ribosylation of Axin, thereby causing it to become degraded and no longer facilitate β-catenin destruction. If PARP is inhibited, Axin is stabilized, which allows it to degrade β-catenin [42]. There are several PARP inhibitors that are currently being used in clinical trials for ovarian cancer. In addition, preclinical studies have been carried out with XAV939, which is a small-molecule PARP inhibitor that targets tankyrases, a specific type of PARP. Huang et al. used a chemical genetic screen to identify the small molecule, XAV939, which selectively inhibits β-catenin mediated transcription. XAV939 was shown to stimulate β-catenin degradation by stabilizing Axin. They used a quantitative chemical proteomic approach to show that XAV939 stabilizes Axin by inhibiting tankyrase1 and tankyrase2.They showed that both tankyrase isoforms 1 and 2 stimulate Axin degradation through the ubiquitin–proteasome pathway [43]. JW55 (Tocris Bioscience) is a selective tankyrase 1 and 2 inhibitor which has been shown to inhibit the growth of cancer. JW55 inhibits the canonical Wnt signaling pathway in colon carcinoma cells that contained mutations either in the APC locus or in anallele of β-catenin [44]. Frizzled, oneof themembrane receptors that activates thepathway upon Wnt ligand binding, has been reported to be overexpressed in ovarian cancer. There are two drugs that specifically target the Fzd receptorthatarebeingevaluatedinclinicaltrials.OMP-18R5(OncoMed Pharmaceuticals/Bayer) is one of the Wnt-targeted compounds that is in clinical development (NCT01345201) [41]. It is a monoclonal antibody that targets Fzd receptors and blocks their association with Wnt ligands. This drug is being used in combination with the standard chemotherapy for breast, lung, pancreas, and colon cancer. Another drug, OMP-54F28, binds to and sequesters the Wnt ligand and is a fusion protein of the Fzd8 ligand-binding domain with the Fc region of a human immunoglobulin (OncoMed Pharmaceuticals/Bayer) (NCT01352203) [41]. There has been a growing trend in oncology to evaluate“repurposed” drugs which are drugs that have been used in the past for other purposes and are now being screened for their function as anticancer drugs. Several drugs have been shown to work through the Wnt pathway including the FDA-approved anti-helminth compound, niclosamide, non-steroidalanti-inflammatory drugs(NSAIDS), and two antipsychotic drugs: lithium and valproic acid. NSAIDS have been shown to cause degradation of TCF and inhibit Wnt target genes such as COX2. Although they do not target the Wnt pathway directly, they could be a potential anti-Wnt agent. Niclosamide inhibitsWnt/β-catenin pathway activation. In colorectal cancer, it was shown to downregulate Dvl2, a member of the Dsh protein family, which in turn decreased downstreamβ-catenin signaling [45]. Recently, niclosamide has been reported to target not only Wnt/β-catenin but also other signaling pathways involved in CSC maintenance such as NF-κB, Notch, ROS, mTORC1, and Stat3 [46,47]. Niclosamide has also been reported to inhibit Wnt/β-catenin signaling by inducing degradation of the Wnt surface receptor, LRP6 [48]. Our laboratory has seen an increase expression of LRP6 in ovarian cancer patients. Yo et al. identified a subset of chemoresistant ovarian tumor cells that fulfilled the definition of CSCs and subjected these cells to high-throughput drug screening using more than 1200 clinically approved drugs. Sixty-one potential compounds were identified on preliminary screening and after more stringent screening, niclosamide was found to be the best drug to selectively target ovarian CSCs both in vitro and in vivo [49].

Wnt/β-catenin pathway and CSC

TheWnt/β-catenin pathway is an important pathway in cell survival and has been implicated in the mechanism of chemoresistance of ovarian CSCs. CSCs are a subpopulation of tumor cells that possess characteristics associated with normal stem cells and have the ability to self-renew and differentiate. Wnt/β-catenin signaling plays an important role in the transcription of multidrug resistance genes such as ABCB1/MDR-1 [50]. Chemoresistance, which can be a result of the inhibition of apoptosis, has been reported to be associated with acquiring EMT in ovarian cancer cells [51,52]. Ovarian cancer cells undergoing EMT have stem-like properties that enable cancer cell dissemination and metastasis formation. A recent study done at Georgia Institute of Technology confirmed that metastasizing ovarian cancer cells taken from patients have a different molecular structure from primary tumor cells and display genetic signatures consistent with EMT [53]. The Wnt/ β-catenin pathway is one of the major signaling pathways thought to be involved in EMT and thus has been shown to play an integral role in metastasis.

Conclusions
Alterations affectingWnt pathway proteins on the cel lmembrane, in the cytoplasm, and in the nucleus have been shown to play important roles in the tumorigenesis of ovarian cancer. Pre-clinical studies have shown an upregulation of 5 of the 19 known Wnt ligands in ovarian cancer, which leads to increased activity of the Wnt pathway. Fzd is one of the membrane receptors that activates the pathway upon Wnt ligand binding. It has been reported to be overexpressed in ovarian cancer. Our laboratory has also seen an upregulation of LRP6 detected by immunohistochemistry (unpublished data). In ovarian cancer, an increase in nuclear β-catenin has been shown to be the result of an upregulation in the β-catenin gene itself and also mutations in the proteins necessary to degrade cytoplasmic β-catenin such as Axin2 and APC. The β-catenin destruction complex consists of Axin2, APC, and GSK3β, which must not be phosphorylated in order to cause βcatenin degradation. GSK3β is frequently phosphorylated in ovarian cancer through other pathways, such as PI3K, inhibiting its ability to degrade β-catenin. Upregulation of co-activators of β-catenin also contributes to the increase in transcription of the target genes. As many as 23 different target genes that lead to cell proliferation and survival, which is a result of nuclear β-catenin build-up, have been shown to be overexpressed in ovariancancer. Wntsignalingis activated in epithelial ovarian cancer, both directly through ligand activated upregulation of the pathway and through a ligand independent increase in nuclear β-catenin through cross-talk with other pathways. Recently, Yo et al. reported that niclosamide, which has been shown to have anti-Wnt activity inhibits growth in ovariantumor-initiatingcells[49].Morepre-clinicalstudies,specifically animal studies and mechanistic studies, are warranted to further investigate other Wnt inhibitors in ovarian cancer. The Wnt pathway is very complex, and further studies with targeted agents need to be done to see if inhibition of a single component of the pathway will be clinically useful. This paper supports the fact that the Wnt pathway shows promise as an effective target for anti-cancer therapy in ovarian cancer. As more efficacy data is collected from the phase 1 studies with Wnt inhibitors LGK974, OMP-54F28, OMP-18R5, and PRI724: NCT01352203, NCT01608867, NCT01345201, and NCT01606579 (www.clinicaltrials.gov), they should be considered as potential agents in the treatment of ovarian cancer. Given the fact that the Wnt pathway is involved in so many biological pathways, results from these studies will be important to determine if effective Wnt pathway inhibition will be excessively toxic to patients. Future directions for investigating the Wnt pathway in ovarian cancer should include genetic sequencing of ovarian cancer patients with the aim of targeting those patients who specifically have upregulation of Wnt pathway target genes. More quantitative data is needed to specifically look at the mechanisms of these drugs in patients by performing qPCR on tissue obtained before and after treatment. The Wnt pathway should be investigated as a potential target in the development of new drugs for ovarian cancer as a single agent and in combination with chemotherapy or other targeted agents.

References
[1] Morton BA, Beatty BG, Mison AP, Wanek PM, Beatty JD. Role of bone marrow transplantation in 90Y antibody therapy of colon cancer xenografts in nude mice. Cancer Res Suppl 1990;50:1008s–10s. [2] OzolsRF,BundyBN,GreerBE,FowlerJM,Clarke-PearsonD,BurgerRA,etal.PhaseIII trialofcarboplatinand paclitaxelcompared with cisplatinand paclitaxel inpatients with optimally resected stage III ovarian cancer: a Gynecologic Oncology Group study. J Clin Oncol 2003;21:3194–200. [3] Garcia AA, Hirte H,Fleming G,YangD, Tsao-WeiDD, RomanL,etal. Phase IIclinical trialofbevacizumabandlow-dosemetronomicoralcyclophosphamideinrecurrent ovarian cancer: a trial of the California, Chicago, and Princess Margaret Hospital phase II consortia. J Clin Oncol 2008;26:76–82. [4] Penson RT, Dizon DS, Cannistra SA, Roche MR, Krasner CN, Berlin ST, et al. Phase II study of carboplatin,paclitaxel, andbevacizumab with maintenance bevacizumab as first-line chemotherapy for advanced mulleriantumors.J ClinOncol2010;28:154–9. [5] Steg AD, Bevis KS, Katre AA, Ziebarth A, Dobbin ZC, Alvarez RD, et al. Stem cell pathways contribute to clinical chemoresistance in ovarian cancer. Clin Cancer Res 2012;18:869–81. [6] RicciF,BernasconiS,PeregoP,GanzinelliM,RussoG,BonoF,etal.Ovariancarcinoma tumor-initiatingcellshaveamesenchymalphenotype.CellCycle2012;11:1966–76. [7] Raimondi C, Gianni W, Cortesi E, Gazzaniga P. Cancer stem cells and epithelial– mesenchymal transition: revisiting minimal residual disease. Curr Cancer Drug Targets 2010;10:496–508.
[8] Talbot LJ, Bhattacharya SD, Kuo PC. Epithelial–mesenchymal transition, the tumor microenvironment,andmetastaticbehaviorofepithelialmalignancies.IntJBiochem Mol Biol 2012;3:117–36. [9] DubeauL.Thecelloforiginofovarianepithelialtumours.LancetOncol2008;9:1191–7. [10] Boyer A, Goff AK, Boerboom D. WNT signaling in ovarian follicle biology and tumorigenesis. Trends Endocrinol Metab 2010;21:25–32. [11] Rask K, Nilsson A, Brannstrom M, Carlsson P, Hellberg P, Janson PO, et al. Wntsignalling pathway in ovarian epithelial tumours: increased expression of betacatenin and GSK3beta. Br J Cancer 2003;89:1298–304. [12] Gatcliffe TA, Monk BJ, Planutis K, Holcombe RF. Wnt signaling in ovarian tumorigenesis. Int J Gynecol Cancer 2008;18:954–62. [13] Takebe N, Harris PJ, Warren RQ, Ivy SP. Targeting cancer stem cells by inhibiting Wnt, Notch, and Hedgehog pathways. Nat Rev Clin Oncol 2011;8:97–106. [14] Verras M, Sun Z. Roles and regulation ofWnt signaling and beta-catenin inprostate cancer. Cancer Lett 2006;237:22–32. [15] Wend P, Holland JD, Ziebold U, Birchmeier W. Wnt signaling in stem and cancer stem cells. Semin Cell Dev Biol 2010;21:855–63. [16] Vainio S, Heikkila M, Kispert A, Chin N, McMahon AP. Female development in mammals is regulated by Wnt-4 signalling. Nature 1999;397:405–9. [17] Parr BA, McMahon AP. Sexually dimorphic development of the mammalian reproductive tract requires Wnt-7a. Nature 1998;395:707–10. [18] Ricken A, Lochhead P, Kontogiannea M, Farookhi R. Wnt signaling in the ovary: identification and compartmentalized expression of wnt-2, wnt-2b, and frizzled-4 mRNAs. Endocrinology 2002;143:2741–9. [19] Saegusa M, Okayasu I. Frequent nuclear beta-catenin accumulation and associated mutations in endometrioid-type endometrial and ovarian carcinomas with squamous differentiation. J Pathol 2001;194:59–67. [20] Wu R, Zhai Y, Fearon ER, Cho KR. Diverse mechanisms of beta-catenin deregulation in ovarian endometrioid adenocarcinomas. Cancer Res 2001;61:8247–55. [21] WangY,HewittSM,LiuS,ZhouX,ZhuH,ZhouC,etal.Tissuemicroarrayanalysisof human FRAT1 expression and its correlation with the subcellular localisation of beta-catenin in ovarian tumours. Br J Cancer 2006;94:686–91. [22] Karbova E, Davidson B, Metodiev K, Trope CG, Nesland JM. Adenomatous polyposis coli (APC) protein expression in primary and metastatic serous ovarian carcinoma. Int J Surg Pathol 2002;10:175–80. [23] LeeCM,ShvartsmanH,DeaversMT,WangSC,XiaW,SchmandtR,etal.Beta-catenin nuclear localization is associated with grade in ovarian serous carcinoma. Gynecol Oncol 2003;88:363–8. [24] Gonzalez-SanchoJM,BrennanKR,Castelo-SoccioLA,BrownAM.Wntproteinsinduce dishevelled phosphorylation via an LRP5/6-independent mechanism, irrespective of theirabilityto stabilize beta-catenin. MolCellBiol 2004;24:4757–68. [25] HarrisPJ,SperanzaG,DanskyUllmannC.Targetingembryonicsignalingpathwaysin cancer therapy. Expert Opin Ther Targets 2012;16:131–45. [26] Kikuchi A, Yamamoto H, Kishida S. Multiplicity of the interactions of Wnt proteins and their receptors. Cell Signal 2007;19:659–71. [27] Barbolina MV, Burkhalter RJ, Stack MS. Diverse mechanisms for activation of Wnt signalling in the ovarian tumour microenvironment. Biochem J 2011;437:1–12. [28] Bader AG, Kang S, Zhao L, Vogt PK. Oncogenic PI3K deregulates transcription and translation. Nat Rev Cancer 2005;5:921–9. [29] Bast Jr RC, Hennessy B, Mills GB. The biology of ovarian cancer: new opportunities for translation. Nat Rev Cancer 2009;9:415–28. [30] Badiglian Filho L, Oshima CT, De Oliveira Lima F, De Oliveira Costa H, De Sousa DamiaoR,GomesTS,etal.CanonicalandnoncanonicalWntpathway:acomparison among normal ovary, benign ovarian tumor and ovarian cancer. Oncol Rep 2009;21:313–20. [31] Burkhalter RJ, Symowicz J, Hudson LG, Gottardi CJ, Stack MS. Integrin regulation of beta-catenin signaling in ovarian carcinoma. J Biol Chem 2011;286:23467–75. [32] Jacob F, Ukegjini K, Nixdorf S, Ford CE, Olivier J, Caduff R, et al. Loss of secreted frizzled-related protein 4 correlates with an aggressive phenotype and predicts poor outcome in ovarian cancer patients. PLoS One 2012;7:e31885. [33] Popadiuk CM, Xiong J, Wells MG, Andrews PG, Dankwa K, Hirasawa K, et al. Antisense suppression of pygopus2 results in growth arrest of epithelial ovarian cancer. Clin Cancer Res 2006;12:2216–23. [34] Christiansen JJ, Rajasekaran AK. Reassessing epithelial to mesenchymal transition as a prerequisite for carcinoma invasion and metastasis. Cancer Res 2006;66:8319–26. [35] Gottardi CJ, Wong E, Gumbiner BM. E-cadherin suppresses cellular transformation by inhibiting beta-catenin signaling in an adhesion-independent manner. J Cell Biol 2001;153:1049–60. [36] Kumar S, Kumar A, Shah PP, Rai SN, Panguluri SK, Kakar SS. MicroRNA signature of cis-platin resistant vs. cis-platin sensitive ovarian cancer cell lines. J Ovarian Res 2011;4:17. [37] Al Sawah DM E, Xiong Y, Ramirez-Diaz I, Abbasi F, Bou Zgheib N, Stickles X, et al. A novel strategy to identify ovarian cancer molecular signaling pathways and drug repurposing candidates. Abstract supplement from the Society of Gynecologic Oncology 44th Annual Meeting on Women’s Cancer; 2013. p. S7. [38] FloresRJ,LiY,YuA,ShenJ,RaoPH,LauSS,etal.Asystemsbiologyapproachreveals common metastatic pathways in osteosarcoma. BMC Syst Biol 2012;6:50. [39] Marchion IR-D D, Xiong Y, Al Sawah E, Abbasi F, Bou Zgheib N, Stickles X, et al. An innovativeinsilicomethodtoidentifyagentsthattargetpathwaysofhumancancer chemoresistance. Abstract supplement from the Society of Gynecologic Oncology 44th Annual Meeting on Women’s Cancer; 2013. p. S151. [40] RamirezDMI,XiongY,AlSawahE,BouZgheibN,BoacB,SticklesX,etal.Identifying drug repurposing opportunities to target genes and molecular pathways associated with cancer cell proliferation. Abstract supplement from the Society of Gynecologic Oncology 44th Annual Meeting on Women’s Cancer; 2013. p. S152.

7.10.3 Wnt Signaling in the Niche Enforces Hematopoietic Stem Cell Quiescence and Is Necessary to Preserve Self-Renewal In Vivo

Fleming HE1Janzen VLo Celso CGuo JLeahy KMKronenberg HMScadden DT.
Cell Stem Cell. 2008 Mar 6; 2(3):274-83
http://dx.doi.org/10.1016%2Fj.stem.2008.01.003

Wingless (Wnt) is a potent morphogen demonstrated in multiple cell lineages to promote the expansion and maintenance of stem and progenitor cell populations. Pharmacologic modification of Wnt signaling has been shown to increase hematopoietic stem cells (HSC). We explored the impact of Wnt signaling in vivo, specifically within the context of the HSC niche. Using an osteoblast-specific promoter to drive the expression of a pan-inhibitor of canonical Wnt signaling, Dickkopf1 (Dkk1), we noted changes in trabecular bone and in HSC. Wnt signaling was inhibited in HSC and the cells exhibited reduced p21Cip1 expression, increased cell cycling and a progressive decline in regenerative function after transplantation. This effect was microenvironment-determined, but irreversible if the cells were transferred to a normal host. Wnt pathway activation in the niche is required to preserve the reconstituting function of endogenous hematopoietic stem cells.

The regulation of hematopoietic stem cell function is a complex and balanced process that requires coordinated input from inherent HSC programs and moderating signals provided by the surrounding microenvironment. Together, these signals permit the maintenance of the stem cell pool for the life of the organism, while also allowing for sufficient steady-state and injury-responsive blood cell production. These somewhat dichotomous aspects of HSC function require mechanisms that both preserve a quiescent population of stem cells and also promote their activation, expansion, differentiation and circulation under appropriate conditions (Akala and Clarke, 2006Scadden, 2006). The morphogen family of signaling molecules has been identified as a prominent player in the function of numerous stem cell types, including the hematopoietic lineage. The wingless (Wnt) pathway has been studied extensively in the context of hematopoiesis, and the combined impact of multiple family members binding to a range of receptors leads to activation of canonical and non-canonical signaling pathways (Nemeth and Bodine, 2007). Canonical signals are mediated by TCF/LEF transcription factor activity (Daniels and Weis, 2005), and are considered to be largely dependent on the accumulation of nuclear β- (and/or γ-) catenin (Nemeth and Bodine, 2007).Wnt signals have been implicated in mammalian hematopoiesis by studies not intended to assess normal physiology in which Wnt activation had a strong expansive effect on reconstituting HSCs and multipotent progenitors (Baba et al, 2006Murdoch et al, 2003Reya et al, 2003Trowbridge et al, 2006). With enforced, persistent Wnt activation, however, engineered mice developed hematopoietic failure with impaired differentiation of HSC (Kirstetter et al, 2006Scheller et al, 2006). In contrast, deletion of members of the Wnt / β-catenin cascade under homeostatic conditions had little to no effect on blood cell production by HSCs (Cobas et al, 2004Jeannet et al, 2007Koch et al, 2007), raising the question of what physiological role, if any, Wnt signaling has on this cell type. Some of the variation observed may reflect differing influences exerted by canonical versus non-canonical Wnt signals, particularly given a recent report indicating that Wnt5a can modulate canonical signals mediated by Wnt3a (Nemeth et al, 2007). Wnt signals are also regulated by a host of soluble inhibitors that may interact directly with Wnt ligands, such as the frizzled-related proteins (sFRP) or by preventing Wnt binding to its receptors (Kawano and Kypta, 2003). The Dickkopf (Dkk) family of Wnt inhibitors falls into this latter category, by binding the Wnt coreceptor LRP5/6 in combination with a Kremen receptor, and leading to internalization of the complex (Mao et al, 2001Mao et al, 2002). In order to specifically examine the impact of Wnt activation in an in vivomicroenvironment that has been shown to regulate HSC number and function, we utilized mice engineered to overexpress the Wnt inhibitor, Dkk1, under control of the osteoblast specific 2.3kb fraction of the collagen1α promoter. This promoter has been previously shown to direct transgene expression to osteoblastic cells, resulting in changes in the number and function of HSCs (Calvi et al, 2001Calvi et al, 2003)

We noted very little overt phenotype in the hematopoietic compartment of the Dkk1 tg mice at steady-state, and confirmed that transgene expression did not extend to the primitive hematopoietic fraction itself. Clear alterations of bone morphology were observed, however, including a 20% decrease in trabecular bone (manuscript in preparation). Despite the absence of a steady-state hematopoetic phenotype, TCF/LEF activity was specifically reduced within the HSC-containing fraction of Dkk1 transgenic mice, and stem cell function was altered under specific conditions. For example, a highly significant defect in the maintenance of reconstitution potential of HSC was observed, either in settings of serial transplant, or following secondary transplantation of wildtype donor cells previously used to reconstitute Dkk1 tg hosts. In agreement with the functional data, HSC populations had a marked reduction of cells within the G0 fraction of the cell cycle, and displayed enhanced sensitivity to 5-fluorouracil treatment. Wnt signals therefore appear to participate in mediating HSC quiescence in vivo, a result that was largely unpredicted from previous studies, although recent analysis of Hmgb3 mutant mice also supports this conclusion (Nemeth et al., 2006). Our results highlight the importance of studying the impact of a signaling pathway over long-term experiments, and in a physiologic context when seeking to resolve the effects of manipulations on HSC function. In that context, Wnt signaling plays an unanticipated role in maintaining HSC quiescence, which may underlie its requirement in preserving the self-renewing capability of HSC.

Osteoblast expression of Dkk1 does not affect blood or marrow primitive hematopoietic cell populations at steady state

The Wnt inhibitor, Dkk1, has been shown to play an important role in bone formation during development (Niehrs, 2006), and is normally expressed by osteoblasts (Grotewold et al., 1999MacDonald et al., 2004), hence may have regulatory roles as part of the endosteal HSC niche. To examine the impact of Wnt inhibition on hematopoietic stem cells localized to the periendosteal region, Dkk1 was overexpressed within osteoblastic lineage cells under the control of the truncated 2.3kb collagen 1α promoter (manuscript in preparation). Resulting Col1α2.3-Dkk1 transgenic (Dkk1 tg) mice were backcrossed for at least 5 generations to the C57Bl/6 background and examined for bone and blood phenotypic alterations. No significant differences in peripheral white or red blood cell counts were observed (figure S1a). Bone marrow (BM) and spleen cellularity were also unchanged when Dkk1 tg mice and their littermates were compared, although a slight but not significant trend towards reduced body weight and BM cellularity was apparent in transgenic mice (figure S1b and data not shown). In contrast, significant alterations in bone morphology were observed, as is reported elsewhere (manuscript in preparation, and (Li et al, 2006)) Of note, trabecular bone volume was reduced by approximately 20%, whereas cortical bone was unaffected in Dkk1 tg mice (data not shown). Trabecular bone has been shown by us and others to affect HSC number and function (Adams et al, 2007Calvi et al, 2003Jung et al, 2007Zhang et al, 2003). A panel of antibodies using 7 different flurochromes was used for multiparametric analysis of primitive precursors within the BM of Dkk1 tg mice and their littermates, including populations of LT-HSC, ST-HSC, CMP, GMP, MEP and CLP (figure 1a,c). Subpopulations containing primitive HSCs were not significantly altered at steady-state (figure 1b). However, additional cell surface markers revealed a slight but significant increase in the population containing phenotypically-defined common lymphoid progenitors (figure 1d). The calculated absolute cell numbers based on these frequencies indicated a similar pattern of results (figure S2). Despite the elevation of early lymphoid progenitors in the BM of Dkk1 tg mice, no significant changes were observed in the relative proportion of early B lineage progenitor subsets in the BM (data not shown).

Seven color FACS analysis of primitive populations in wt and Dkk1-tg BM nihms-240191-f0001

Seven color FACS analysis of primitive populations in wt and Dkk1-tg BM nihms-240191-f0001

Seven color FACS analysis of primitive populations in wt and Dkk1-tg BM

http://www.ncbi.nlm.nih.gov/pmc/articles/PMC2991120/bin/nihms-240191-f0001.jpg

Figure 1 Seven color FACS analysis of primitive populations in wt and Dkk1-tg BM

BM from Dkk1 tg and littermates was assayed by multiparameter FACS for relative proportion of primitive HSC populations. BM was stained with antibodies against Lineage markers, cKit, Sca-1, CD34, Flk2, CD16/32 and CD127 and gated as shown in panels (A) and (C). At least 10 mice per genotype were compared, over at least three separate experiments. The proportion of BM corresponding to the HSC-containing LK+S+ fraction (A, blue gate) is shown in (B, left axis), and is sub-sectioned according to CD34 and Flk2 expression to yield phenotypic assessments of LT-HSC and ST-HSC fractions (B, right axis). More differentiated progenitors gated in the LK+S− population (A, left, green gate) were sub-sectioned based on CD16/32 and CD34 expression to compare CMP, GMP and MEP progenitors as shown in (C, left panel). Frequencies of each population, from the same samples quantified for HSC frequency in (B) are shown in (D, left axis). The CLP fraction, gated on LKloSlo in (A, red gate), and gated further on CD127+ cells in (C, right panel) are quantified in (D, right axis). Significance was determined by a Student’s 2-tailed T-test. Error bars indicate the SE of the mean.

Dkk1-tg HSCs exhibit impaired Wnt signaling in a non-cell autonomous manner

To confirm that the transgenic expression of Dkk1 leads to the inhibition of Wnt/βcatenin signaling in the Dkk1 tg mice, HSC-containing populations were isolated from Dkk1 transgenic mice that had been intercrossed with the Topgal reporter strain. In these Topgal mice (DasGupta and Fuchs, 1999), multiple TCF/LEF binding sites have been inserted to control the expression of the reporter gene, β-galactosidase. Reporter activity using this construct has been shown to correlate with canonical Wnt signaling. Of note, TCF/LEF transcription has recently been shown to proceed even with the combined loss of β-catenin and γ-catenin, suggesting that canonical Wnt signals can be transduced by alternate intermediates (Jeannet et al, 2007). Reporter activity was examined within the LK+S+ (Lineage-cKit+Sca1+), HSC-containing population, and the LK+S− population which is devoid of LT-HSC potential. When the Wnt reporter activity detected in each of these populations was compared, a dramatic reduction (>100 fold reduction) in β-catenin activation was observed in the HSC-containing LK+S+ population isolated from Dkk1 tg mice (figure 2a). A more modest reduction (<5 fold reduction) was observed in the less-actively signaling LK+S− fraction. This finding indicates that despite the unchanged frequency of phenotypically-defined HSC-containing populations in unmanipulated Dkk1 tg animals, there is evidence that these cells are molecularly altered by osteoblast expression of the Wnt inhibitor. These data provide evidence for direct inhibition of Wnt signaling in the HSC population in addition to any effects that might be mediated by decreased trabecular bone mass. Wnt signaling is regulated, in part, via a negative feedback loop by TCF/LEF-dependent transcription of endogenous Dkk1 (Niida et al, 2004). Consistent with the decrease in Topgal reporter activity, expression of endogenous Dkk1 was also inhibited in the LK+S+ population of Dkk1 tg mice (figure 2b). Using primers specific for the Dkk1 tg, and in comparison its expression in wt and Dkk1 tg tibea, sorted LK+S+ cells do not express the Dkk1 transgene (figure 2c). Together, these results confirm that Dkk1 tg mice inhibit Wnt signaling specifically within the HSC compartment in a non-cell autonomous manner.

Assessment of canonical Wnt signal activity in HSC-containing populations of Dkk1-tg mice nihms-240191-f0002

Assessment of canonical Wnt signal activity in HSC-containing populations of Dkk1-tg mice nihms-240191-f0002

Assessment of canonical Wnt signal activity in HSC-containing populations of Dkk1-tg mice

http://www.ncbi.nlm.nih.gov/pmc/articles/PMC2991120/bin/nihms-240191-f0002.gif

Figure 2 Assessment of canonical Wnt signal activity in HSC-containing populations of Dkk1-tg mice

Functional impact of the Dkk1 transgene on BM reconstitution

Analysis of stem/progenitor activity cannot rely exclusively on the quantitation of precursors according to phenotypically-defined parameters. Using functional measures, we detected a consistent defect in multilineage and myeloid colony formation on a per cell basis in BM isolated from Dkk1 transgenic mice (figure 3a). This result was despite the absence of significant alteration of myeloid and more primitive progenitors by immunophenotype, possibly reflecting the elevated lymphoid fraction, whose progeny are not read out under these culture conditions. In vitro methods such as the CFU assay offer an entry-level analysis of hematopoietic activity, however functional reconstitution in vivo more accurately examines true HSC function (Purton and Scadden, 2007). Therefore, in order to better assess the functional capacity of HSCs isolated from the Dkk1 transgenic environment, BM was transplanted from wt or Dkk1 tg littermates with an equivalent dose of competing marrow from congenic donor mice into lethally irradiated recipients. Donor marrow was isolated from a single wt or transgenic mouse to assess any individual-to-individual variation. Following six months of engraftment, no significant changes in reconstitution were observed across the groups of recipients receiving BM isolated from individual wt or Dkk1 tg environments, although a range of reconstitution capacity was apparent in both groups (figure S3a). Using a limiting dilution assay to determine the frequency of repopulating cells present in BM isolated from individual Dkk1-expressing animals revealed a two-fold elevation in the number of functional reconstituting HSCs (Figure 3b). These transplant results indicate that cells isolated from the Dkk1-epressing niche are capable of reconstituting irradiated recipients, and appear to be present at a higher frequency when Wnt has been inhibited in this location. An important additional parameter to test when investigating HSC function is their longevity, or ability to respond to repeated rounds of expansion stress. To assay the longevity of HSCs isolated from Dkk1 tg mice, noncompetitive serial transplants were performed. As expected from the previous transplant experiments, Dkk1 tg BM was able to completely reconstitute wt irradiated recipients (data not shown).

Functional assessment of HSCs isolated from Dkk1-tg mice

http://www.ncbi.nlm.nih.gov/pmc/articles/PMC2991120/bin/nihms-240191-f0003.jpg

Figure 3 Functional assessment of HSCs isolated from Dkk1-tg mice

(A) BM from 8 pairs of wt and Dkk1-tg mice was plated in methylcellulose with growth factors (SCF, IL-3, IL-6, Epo) and scored for CFU-C (combined scoring for BFU-E, CFU-GM and CFU-GEMM colonies) after 12 days. All live colonies of more than 30 cells were counted for each of three wells plated per sample. Data are shown as mean colonies per well for each of 8 mice studied over three individual experiments. Significance was determined using a two-tailed Student’s T test. (B) Limiting dilution experiments were performed using three doses of test marrow (CD45.1) transplanted with 5×10⁵ competing cells (CD45.2) into groups of at least 9 recipients (CD45.2) per dose. Test marrow was isolated from two wt and two Dkk1-tg mice, and the Dkk1-tg donors shown here were transplanted into separate groups of irradiated recipients. Data points are plotted as the percent of recipients per group that did not exhibit at least 1% multi-lineage PB engraftment at 6 months (percent unreconstituted). LT-HSC frequency and significance were determined using Poisson statistics: wt, 1 in 63,00 (circles) vs tg, 1 in 31,500 or 1: 37,000 (squares); p<0.02. Similar results were obtained in an independent assessment of two Dkk1-tg donors. (C) Non-competitive serial transplants were initiated by transplanting 1×10⁶ whole BM pooled from three wt or Dkk1-tg donors (CD45.1) into each of 10 irradiated recipients (CD45.2). Secondary and tertiary transplants were performed after 14 weeks of engraftment by pooling BM from 3-4 reconstituted recipients to transplant 1×10⁶ whole BM into new groups of 10 irradiated CD45.2 recipients. The Kaplan-Meier survival graph depicts the survival of tertiary recipients, mice receiving BM from Dkk1-tg mice (solid line) or wt controls (dashed line). Similar results were obtained in an independent assessment of 2 wt and 2 Dkk1-tg mice. (D) Prior to transplant into tertiary recipients, BM from 5 secondary recipients of both genotypes was assayed by FACS for the frequency of LT-HSCs (LK+S+CD34loFlk2−). Error bars indicated SD of the mean, and significance was determined by a two-tailed T test

Effect of temporary exposure to endosteal Dkk1 on HSC function

http://www.ncbi.nlm.nih.gov/pmc/articles/PMC2991120/bin/nihms-240191-f0004.jpg

Figure 4 Transplant analysis of HSC function following residence in a Dkk1-tg environment

Wnt-inhibited HSC-containing populations are less quiescent

http://www.ncbi.nlm.nih.gov/pmc/articles/PMC2991120/bin/nihms-240191-f0005.gif

Figure 5 Examination of cell cycle status of primitive BM in wt and Dkk1-tg mice

http://www.ncbi.nlm.nih.gov/pmc/articles/PMC2991120/bin/nihms-240191-f0006.gif

Figure 6 Gene expression by quantitative PCR of sorted primitive populations

Understanding the role of specific signals in the varied regulatory functions of HSC activities is crucial for designing and developing therapeutic interventions involving these cells. The impact of the Wnt family on the expansion and regulation of hematopoietic cells has been examined in a variety of studies. However, the physiologic effects of this pathway remain somewhat ill-defined with often contradicting results. Some have demonstrated that Wnt cascade activation promotes the proliferation of HSCs and their progeny while maintaining at least short-term functional activity (Baba et al, 2006Murdoch et al, 2003Reya et al, 2003;Trowbridge et al, 2006). Others, employing persistent genetic activation of the pathway, have also demonstrated an increase in proliferation of cells with an HSC immunophenotype, but with marked impairment of HSC differentiation resulting in animal death (Kirstetter et al, 2006Scheller et al, 2006). However, induced deletion of β-catenin, the primary downstream mediator of the Wnt cascade resulted in no apparent impact on HSC activity, even in a reconstitution assay that required expansion of β-catenin null transplanted HSCs (Cobas et al, 2004). Furthermore, recent combined deletions of both β-catenin and its homologue, γ-catenin, also maintain HSC function under steady-state and primary reconstitution conditions (Jeannet et al, 2007Koch et al, 2007).All of these studies have either assayed Wnt activity in broad over- or under-stimulation settings, and the manipulations have been performed on the HSCs themselves, or broadly applied to recipient animals. The context in which morphogens are present is highly relevant to their effect and not previously studied for Wnt effects on hematopoiesis (Trowbridge et al., 2006). Indeed, Wnt ligands can modulate signaling initiated by other Wnt family members, underscoring the concept that context, and different signaling intermediates may have a strong impact on functional outcome (Nemeth et al, 2007).

In the present study, we have established a system that permits the analysis of localized Wnt inhibition, offering the opportunity to assay the impact of chronic or temporary exposure to this inhibited environment. In particular, we have directed expression of the Wnt inhibitor, Dkk1, to a cell population that has been previously demonstrated to exert a regulatory function over HSC activity, and which normally express Dkk-1, albeit at lower levels (Grotewold et al,1999MacDonald et al, 2004). It should be noted that while an increasing number of reports suggest that phenotypically-identified HSCs inhabit additional physical locations within the bone marrow environment (Hooper et al, 2007Scadden, 2006), the promoter used in our study has proven to functionally impact the number and activity of HSCs when used to direct modifying signal expression to a population of osteoblastic cells. Given that expression of Dkk1 also results in alterations to bone morphology itself, there is likely to be a dual effect of Dkk1: one altering the niche architecture and the other affecting Wnt signaling in stem/progenitor cells. Our studies demonstrated an effect of Dkk1 overexpression by non-HSCs on Wnt signaling in hematopoietic stem/progenitors, suggesting that this is at least a contributing factor to the phenotype observed. This observation that TCF/LEF reporter activity is reduced, as is expression of endogenous Dkk1, itself a Wnt signaling target (Niida et al, 2004) in BM cells of the transgenic mice indicates altered canonical Wnt signaling. It does not rule out that Dkk1 may exert additional Wnt-independent functions. The results presented here also indicate that the reduced longevity of HSCs does not require constant exposure to exogenous Dkk1, given that we were unable to detect Dkk1 tg expression within populations of primitive hematopoietic cells, and therefore the functional impact on transplanted cells is observed in a Dkk tg-free environment. It is important to note that transplantation of whole BM populations is generally not effective at engrafting non-hematopoietic cells (Koc et al, 1999).

Wnt mediates HSC quiescence and maintains reconstitution function in vivo

The results presented here establish a role for Wnt, in the maintenance of a quiescent fraction of functional HSCs in BM. This was associated with evidence of increased stem cells on limit dilution transplant analysis. However the ability of the same cells to function after serial rounds of transplantation was drastically reduced. The ability of stem cells to persist under the stress conditions of transplantation requires self-renewal capability that is compromised after Dkk1 exposure

The studies of inducible deletion of β- and γ-catenin noted that they were dispensable for HSC function, however did not include sequential transplants out to the extent where we observed our most dramatic phenotype (Cobas et al, 2004Jeannet et al, 2007Koch et al, 2007) Alternatively, it is possible that Dkk1 interferes with HSC function through a process that does not depend on β- or γ-catenin signaling (Jeannet et al, 2007Niehrs, 2006).

Our results emphasize the importance of studying pathways within the context of other signals present in the natural microenvironment, and underscore the potential for unanticipated functional roles. It is clear that different combinations of signals may have a range of effects depending on the context in which they are received. Indeed, we observed an impact of Wnt-inhibition on the activation of the Notch target, Hes-1, raising the possibility that Notch and Wnt coordinate in vivo to maintain quiescence of HSCs, rather than participating in expansive and/or self-renewal functions (Duncan et al, 2005). Notably, elevated Hes-1 and p21 expression have recently been shown to correlate with the maintenance of quiescence and repopulating function of primitive HSCs (Yu et al, 2006). We noted a highly specific impact of the Dkk1 tg on the stem cell enriched LK+S+ fraction in Wnt-dependent pathway activation and inhibition and the Notch target, Hes-1, or the cell cycle regulator, p21 expression.

The effects of Dkk1 on cell cycling were unanticipated given previous reports of constitutively active β-catenin inducing increased stem/progenitor cell proliferation (Kirstetter et al, 2006Scheller et al, 2006). However, others found that with deletion of the chromatin binding protein, Hmgb3, Wnt signaling was increased, yet stem cells more readily returned to quiescence after 5-FU challenge than controls. (Nemeth et al, 2006) Both increased and decreased activation of the pathway may therefore alter HSC cycling kinetics. This may again be due to the context differences observed with a microenvironmentally-provided signal in the current study contrasted with cell autonomous activation of the pathway in the prior reports. Alternatively, it may be an example of the complex effects of morphogens, which have dose-dependent actions (Delaney et al, 2005Kielman et al, 2002MacDonald et al, 2004). It may be that there is a bi-phasic response of cell cycling to the Wnt pathway and that proper control of stem cell quiescence requires a fine-tuned modulation of intermediate Wnt signaling intensity. This has implications for the potential use of Wnts as mediators of stem cell expansion ex vivo and for interruption of this pathway as an anti-leukemic intervention.

In sum, niche related expression of Dkk1 reveals a role for Wnt signaling in the physiologic regulation of the hematopoietic compartment, altering stem cell cycling and longevity following repeated expansion, or self-renewal. The phenotype observed was sufficiently distinct from what cell-autonomous modifications of the pathway would have predicted to argue for niche specific modeling of exogenous factors’ effects on stem cells. This may be particularly true for members of the locally acting morphogen group of cell modifiers.

7.10.4 Wnt.β-Catenin Signaling in Development and Disease

Clevers H1.
Cell. 2006 Nov 3; 127(3):469-80.
http://dx.doi.org/10.1016/j.cell.2006.10.018

A remarkable interdisciplinary effort has unraveled the WNT (Wingless and INT-1) signal transduction cascade over the last two decades. Wnt genes encode small secreted proteins that are found in all animal genomes. Wnt signaling is involved in virtually every aspect of embryonic development and also controls homeostatic self-renewal in a number of adult tissues. Germline mutations in the Wnt pathway cause several hereditary diseases, and somatic mutations are associated with cancer of the intestine and a variety of other tissues.

The mouse wnt1 gene, originally named Int-1, was identified in 1982 by Nusse and Varmus as a preferential integration site for the Mouse Mammary Tumor Virus in virally induced breast tumors ( Nusse and Varmus, 1982). When sequenced, the Wnt1 proto-oncogene was seen to encode a secreted protein that is cysteine rich. Subsequently, Drosophila wingless (wg), which controls segment polarity during larval development ( Nüsslein-Volhard and Wieschaus, 1980), was shown to be a fly homolog of Wnt1 ( Rijsewijk et al., 1987). Segmentation of the epidermis of wg mutant fly embryos is severely impaired as evidenced by abnormalities in the overlying ventral cuticle. In contrast to the wild-type cuticle, which exhibits alternating denticle and naked belts, the wg cuticle is completely covered with denticles. Fly embryos carrying mutations in the porcupinedishevelled, and armadillo genes display similar cuticle abnormalities to wgmutant embryos, whereas mutations in shaggy/zeste-white 3 cause the opposite phenotype, a naked cuticle. Epistatic analysis of cuticle structure in double mutants indicated that these genes constituted the core of a new signal transduction cascade ( Siegfried et al., 1992Noordermeer et al., 1994 and Peifer et al., 1994).

In 1989, McMahon and Moon (McMahon and Moon, 1989) observed a duplication of the body axis inXenopus following injection of mouse Wnt1 mRNA into ventral blastomeres of embryos at the 4-cell stage. This observation supported the notion that Wnt signaling was shared between vertebrates and invertebrates and, moreover, provided a rapid and convenient assay to study components of the Wnt pathway in vertebrates. Axis duplication was also induced by Dishevelled (Dsh), β-catenin (the vertebrate homolog of armadillo), and a dominant-negative version of glycogen synthase kinase 3 (GSK3), the vertebrate homolog of shaggy/zeste-white 3 ( Dominguez et al., 1995Guger and Gumbiner, 1995 and He et al., 1995). Although long elusive, the specific Wnt signal that triggers axis induction in Xenopus was identified as Wnt11 by Heasman and colleagues last year ( Tao et al., 2005).

The combined observations made in Drosophila and Xenopus delineated a highly conserved signaling pathway, activated by secreted Wnt proteins. Independent of these studies, the adenomatous polyposis coli (APC) gene was discovered in a hereditary cancer syndrome termed familial adenomatous polyposis (FAP) ( Kinzler et al., 1991 and Nishisho et al., 1991). Soon after, the large cytoplasmic APC protein was found to interact with β-catenin ( Rubinfeld et al., 1993 and Su et al., 1993). This observation provided the first connection between the Wnt pathway and human cancer.

Genome sequencing has since revealed that mammalian species have roughly 20 secreted Wnt proteins, which can be divided into 12 conserved Wnt subfamilies. Of these, only 6 subfamilies have counterparts in ecdysozoan animals such as Drosophila and Caenorhabditis. In contrast, at least 11 of the Wnt subfamilies occur in the genome of a cnidarian (the sea anemone Nematostella vectensis). This finding suggests that some Wnt subfamilies were lost during the evolution of the ecdysozoan lineage but more importantly reveals that a complex inventory of Wnt factors was present in multicellular animals well before the Cambrian explosion (550 million years ago). Thus, comparative genomic analysis underscores the crucial role that Wnt genes play in organismal patterning throughout the animal kingdom ( Kusserow et al., 2005).

Currently, three different pathways are believed to be activated upon Wnt receptor activation: the canonical Wnt/β-catenin cascade, the noncanonical planar cell polarity (PCP) pathway, and the Wnt/Ca2+ pathway. Of these three, the canonical pathway is best understood and is the primary subject of this review. For recent comprehensive overviews on the other Wnt signaling pathways, the reader is referred to Katoh (2005) and Kohn and Moon (2005). This review discusses how Wnt proteins are produced and secreted and how they activate the canonical Wnt signaling pathway in recipient cells. Further, the review examines the roles of the canonical Wnt pathway in development, tissue self-renewal, and cancer.

Wnt Protein Secretion

Wnt proteins are characterized by a high number of conserved cysteine residues. Although Wnt proteins carry an N-terminal signal peptide and are secreted, they are relatively insoluble. This insolubility has been attributed to a particular protein modification, cysteine palmitoylation, which is essential for Wnt function (Willert et al., 2003). Hofmann (2000) reported that a Drosophila gene required in the Wnt-secreting cell, termed porcupine, displays homology to acyl-transferases, enzymes that acylate a variety of substrates in the endoplasmic reticulum. Thus, porcupine and its worm homolog mom-1 are believed to encode the enzyme that is responsible for Wnt palmitoylation ( Zhai et al., 2004).

Recently, Banziger et al. (2006) and Bartscherer et al. (2006) uncovered in Drosophila another conserved gene that is essential for Wnt secretion, named wntless (wls) and evenness interrupted (evi), respectively. The gene encodes a seven-pass transmembrane protein that is conserved from worms (mom-3) to man (hWLS). In the absence of Wls/evi, Wnts are retained inside the cell that produces them. The Wntless protein resides primarily in the Golgi apparatus, where it colocalizes and physically interacts with Wnts. A genetic screen in C. elegans revealed that the retromer, a multiprotein complex involved in intracellular trafficking and conserved from yeast to man, is also essential for Wnt secretion and for the generation of a Wnt gradient ( Coudreuse et al., 2006). An attractive hypothesis is that the retromer complex is involved in recycling a Wnt cargo receptor (such as Wntless) between the default secretory pathway and a compartment dedicated to Wnt secretion (see Figure 1).

wnt-secretion

wnt-secretion

http://ars.els-cdn.com/content/image/1-s2.0-S0092867406013444-gr1.jpg

Figure 1. Wnt Secretion

To be secreted, Wnt proteins in the endoplasmic reticulum (ER) need to be palmitoylated by the action of Porcupine. Wnt proteins also require Wntless (Wls/Evi) in order to be routed to the outside of the cell. Loading onto lipoprotein particles may occur in a dedicated endo/exocytic compartment. The retromer complex may shuttle Wls between the Golgi and the endo/exocytic compartment.

Wnt is thought to act as a morphogen (that is, a long-range signal whose activity is concentration dependent) (reviewed in Logan and Nusse, 2004). However, it is unclear how these long-range gradients are generated. It is conceivable that the palmitoyl moiety constrains movement away from membranes or lipid particles. Thus, Wnts may be tethered to intercellular transport vesicles or lipoprotein particles (Panakova et al., 2005). Alternatively, Wnts may be transported by cytonemes, which are long, thin filopodial processes. Additionally, studies in Drosophila suggest a role for extracellular heparan sulfate proteoglycans (HSPG) in the transport or stabilization of Wnt proteins. For instance, flies carrying mutations in Dally, a GPI-anchored HSPG, or in genes encoding enzymes that modify HSPGs resemblewingless mutants (reviewed in Lin, 2004).

Receptors, Agonists, and Antagonists for Wnt

Wnts bind Frizzled (Fz) proteins, which are seven-pass transmembrane receptors with an extracellular N-terminal cysteine-rich domain (CRD) (Bhanot et al., 1996). The Wnt-Fz interaction appears promiscuous, in that a single Wnt can bind multiple Frizzled proteins (e.g., Bhanot et al., 1996) and vice versa. In binding Wnt, Fzs cooperate with a single-pass transmembrane molecule of the LRP family known as Arrow inDrosophila ( Wehrli et al., 2000) and LRP5 and -6 in vertebrates ( Pinson et al., 2000 and Tamai et al., 2000). The transport of Arrow/LRP5/6 to the cell surface is dependent on a chaperone called Boca inDrosophila and Mesd in mice ( Culi and Mann, 2003 and Hsieh et al., 2003). And consistent with a role of the Boca/Mesd chaperone in the transport of Arrow/LRP5/6 transport, mutations in Boca and Mesdresemble loss of Arrow/LRP5/6. Although it has not been formally demonstrated that Wnt molecules form trimeric complexes with LRP5/6 and Frizzled, surface expression of both receptors is required to initiate the Wnt signal.

Derailed, a transmembrane tyrosine kinase receptor from the RYK subfamily, is an unusual Wnt receptor.Drosophila Wnt5 controls axon guidance in the central nervous system. Embryos lacking Dwnt-5 resemble those lacking Derailed, that is, they generate aberrant neuronal projections across the midline ( Yoshikawa et al., 2003). Derailed binds DWnt-5 through its extracellular WIF (Wnt inhibitory factor) domain. Signaling events downstream of this alternative Wnt receptor remain unclear. Somewhat unexpectedly, the Derailed kinase domain may be dispensable for signaling. Lu et al. (2004) propose that, unlike the Drosophila Ryk homolog Derailed, mammalian Ryk functions as a coreceptor along with Fz. Mammalian Ryk binds Dishevelled to activate the canonical Wnt/β-catenin signaling pathway. Another tyrosine kinase receptor, Ror2, harbors a Wnt binding CRD motif. Wnt5a can engage Ror2 to inhibit the canonical Wnt signaling pathway, although paradoxically Wnt5a can also activate the canonical pathway by directly engaging Fz4 (Mikels and Nusse, 2006) and Fz5 ( He et al., 1997).

At least two types of proteins that are unrelated to Wnt factors activate the Frizzled/LRP receptors. One of these factors is the cysteine-knot protein Norrin, which is mutated in Norrie disease, a developmental disorder characterized by vascular abnormalities in the eye and blindness. Norrin binds with high affinity to Frizzled-4 and activates the canonical signaling pathway in an LRP5/6-dependent fashion (Xu et al., 2004). Other factors that activate the canonical Wnt signaling pathway are R-spondins, which are thrombospondin domain-containing proteins. In Xenopus, R-spondin-2 is a Wnt agonist that synergizes with Wnts to activate β-catenin ( Kazanskaya et al., 2004). Human R-spondin-1 has been found to strongly promote the proliferation of intestinal crypt cells, a process which involves the stabilization of β-catenin (Kim et al., 2005). Indeed, studies in cultured cells demonstrate that R-spondins can physically interact with the extracellular domains of LRP6 and Fzd8 and activate Wnt reporter genes ( Nam et al., 2006).

The secreted Dickkopf (Dkk) proteins inhibit Wnt signaling by direct binding to LRP5/6 (Glinka et al., 1998). Through this interaction, Dkk1 crosslinks LRP6 to another class of transmembrane molecules, the Kremens (Mao et al., 2002), thus promoting the internalization and inactivation of LRP6. An unrelated secreted Wnt inhibitor, Wise, also acts by binding to LRP (Itasaki et al., 2003), as does the WISE family member SOST (Li et al., 2005 and Semenov et al., 2005).

Soluble Frizzled-Related Proteins (SFRPs) resemble the ligand-binding CRD domain of the Frizzled family of Wnt receptors (Hoang et al., 1996). WIF proteins are secreted molecules with similarity to the extracellular portion of the Derailed/RYK class of transmembrane Wnt receptors (Hsieh et al., 1999). SFRPs and WIFs are believed to function as extracellular Wnt inhibitors (reviewed in Logan and Nusse, 2004) but, depending on context, may also promote signaling by Wnt stabilization or by facilitating Wnt secretion or transport.

Canonical Wnt Signaling

Once bound by their cognate ligands, the Fz/LRP coreceptor complex activates the canonical signaling pathway (Figure 2). Fz can physically interact with Dsh, a cytoplasmic protein that functions upstream of β-catenin and the kinase GSK-3. Wnt signaling controls phosphorylation of Dsh (reviewed in Wallingford and Habas, 2005). However, it remains unclear whether the binding of Wnt to Fz regulates a direct Fz-Dsh interaction, nor is it known how Dsh phosphorylation is controlled or how phosphorylated Dsh functions in Wnt signal transduction.

canonical-wnt-signaling

canonical-wnt-signaling

Figure 2. Canonical Wnt Signaling

(Left panel) When Wnt receptor complexes are not bound by ligand, the serine/threonine kinases, CK1 and GSK3α/β, phosphorylate β-catenin. Phosphorylated β-catenin is recognized by the F box/WD repeat protein β-TrCP, a component of a dedicated E3 ubiquitin ligase complex. Following ubiquitination, β-catenin is targeted for rapid destruction by the proteasome. In the nucleus, the binding of Groucho to TCF (T cell factor) inhibits the transcription of Wnt target genes. (Right panel) Once bound by Wnt, the Frizzled(Fz)/LRP coreceptor complex activates the canonical signaling pathway. Fz interacts with Dsh, a cytoplasmic protein that functions upstream of β-catenin and the kinase GSK3β. Wnt signaling controls phosphorylation of Dishevelled (Dsh). Wnts are thought to induce the phosphorylation of LRP by GSK3β and casein kinase I-γ (CK1γ), thus regulating the docking of Axin. The recruitment of Axin away from the destruction complex leads to the stabilization of β-catenin. In the nucleus, β-catenin displaces Groucho from Tcf/Lef to promote the transcription of Wnt target genes.

Recent studies have indicated that the coreceptor LRP5/6 interacts with Axin through five phosphorylated PPP(S/T)P repeats in the cytoplasmic tail of LRP (Davidson et al., 2005 and Zeng et al., 2005). Wnts are thought to induce the phosphorylation of the cytoplasmic tail of LRP, thus regulating the docking of Axin. GSK3 phosphorylates the PPP(S/T)P motif, whereas caseine kinase I-γ (CK1γ) phosphorylates multiple motifs close to the GSK3 sites. CK1γ is unique within the CK1 family in that it is anchored in the membrane through C-terminal palmitoylation. Both kinases are essential for signal initiation. It remains presently debated whether Wnt controls GSK3-mediated phosphorylation of LRP5/6 (Zeng et al., 2005) or whether CK1γ is the kinase regulated by Wnt (Davidson et al., 2005). When bound to their respective membrane receptors, Dsh and Axin may cooperatively mediate downstream activation events by heterodimerization through their respective DIX (Dishevelled-Axin) domains.

The Cytoplasmic Destruction Complex

The central player in the canonical Wnt cascade is β-catenin, a cytoplasmic protein whose stability is regulated by the destruction complex. The tumor suppressor protein Axin acts as the scaffold of this complex as it directly interacts with all other components—β-catenin, the tumor suppressor protein APC, and the two kinase families (CK1α, -δ, -ɛ and GSK3α and -β [reviewed in Price, 2006]). When WNT receptor complexes are not engaged, CK1 and GSK3α/β sequentially phosphorylate β-catenin at a series of highly conserved Ser/Thr residues near its N terminus (Figure 2). Phosphorylated β-catenin is then recognized by the F box/WD repeat protein β-TrCP, a component of a dedicated E3 ubiquitin ligase complex. As a consequence, β-catenin is ubiquitinated and targeted for rapid destruction by the proteasome (Aberle et al., 1997). Note that the CK1 and GSK3 kinases perform paradoxical roles in the Wnt pathway. At the level of the LRP coreceptor they act as agonists, whereas in the destruction complex they act as antagonists

Although genetic observations imply an essential role for APC in the destruction complex, there is no consensus on its specific molecular activity. APC has a series of 15 and 20 amino acid repeats with which it interacts with β-catenin. Three Axin-binding motifs are interspersed between these β-catenin-binding motifs. Increasing the expression of Axin in cancer cells that lack APC restores the activity of the destruction complex, implying that APC is only essential when Axin levels are limiting. Quantitatively, Axin indeed appears to be the limiting factor (Lee et al., 2003) and may be the key scaffolding molecule that promotes the rapid assembly and disassembly of the destruction complex.

Given that CK1, Dsh, β-TrCP, and GSK3 participate in other signaling pathways, low levels of Axin may insulate the Wnt pathway from changes in the abundance or activity of these signaling components. It has been proposed that APC is required for efficient shuttling and loading/unloading of β-catenin onto the cytoplasmic destruction complex. Both APC and Axin can themselves be phosphorylated by their associated kinases, which changes their affinity for other components of the destruction complex. Our understanding of the relevance of these phosphorylation events in the regulation of Wnt signaling remains incomplete. For a comprehensive discussion of the kinases in the Wnt pathway, the reader is referred to a recent review (Price, 2006)

β-catenin plays a second role in simple epithelia, that is, as a component of adherens junctions. It is an essential binding partner for the cytoplasmic tail of various cadherins, such as E-cadherin (Peifer et al., 1992). Unlike the signaling pool of β-catenin, the pool that is bound to the adherens junction is highly stable. It is currently unclear whether the adhesive and signaling properties of β-catenin are interconnected. In a likely scenario, newly synthesized β-catenin first saturates the pool that is part of the adhesion junction, which never becomes available for signaling. “Excess,” free cytoplasmic β-catenin protein is then efficiently degraded by the APC complex. It is only this second, highly unstable pool that is subject to regulation by Wnt signals. In support of this model, these two functions of β-catenin are separately performed by two different β-catenin homologs in C. elegans ( Korswagen et al., 2000).

Upon receptor activation by WNT ligands, the intrinsic kinase activity of the APC complex for β-catenin is inhibited. It is unclear how this occurs, but it likely involves the Wnt-induced recruitment of Axin to the phosphorylated tail of LRP and/or to Fz-bound Dsh. As a consequence, stable, nonphosphorylated β-catenin accumulates and translocates into the nucleus, where it binds to the N terminus of LEF/TCF (lymphoid enhancer factor/T cell factor) transcription factors (Behrens et al., 1996Molenaar et al., 1996 and van de Wetering et al., 1997).

It has been suggested that protein phosphatases may regulate β-catenin stability as antagonists of the serine kinases (reviewed in Price, 2006). For example, heterotrimeric PP2A is required for the elevation of β-catenin levels that is dependent on Wnt. Moroever, PP2A can bind Axin and APC, suggesting that it might function to dephosphorylate GSK3 substrates. If and how PP2A activity is regulated by Wnt signals remains to be resolved.

Crystallographic studies are starting to provide insights into the structure of the destruction complex. The central region of β-catenin (to which most partners bind) was the first component of the pathway to be crystallized. It consists of 12 armadillo repeats, which adopt a superhelical shape with a basic groove running along its length. Subsequently, structural interactions of Axin, APC, E-cadherin, and TCF with β-catenin have been visualized (Choi et al., 2006, and references therein). APC, E-cadherin, and TCF bind the central part of the basic groove in a mutually exclusive fashion. Despite very limited conservation of primary sequence in the respective interaction domains, the modes of binding are structurally very similar. Axin utilizes a helix that occupies the groove formed by the third and fourth armadillo repeats of β-catenin. Axin binding precludes the simultaneous interaction with other β-catenin partners in this region. Based on this observation, it is suggested that a key function of APC is to remove phosphorylated β-catenin from the active site of the complex (Xing et al., 2003). In a further study, the structure of Axin bound to APC (Spink et al., 2000) was solved. These studies form stepping stones to a better understanding of the dynamics of the destruction complex. Unfortunately, biochemical studies of the destruction complex in its different activation states are sorely lacking.

Nuclear Events

Upon stabilization by Wnt signals, β-catenin enters the nucleus to reprogram the responding cell (Figure 3). There is no consensus on the mechanism by which β-catenin travels between the cytoplasm and the nucleus. In many cases, cells that undergo Wnt signaling may actually display an overall rise in β-catenin protein without a clear nuclear preference. β-catenin’s nuclear import is independent of the Nuclear Localization Signal/importin machinery. β-catenin itself is a close relative of importin/karyopherins and directly interacts with nuclear pore components. Two proteins, Tcf and Pygopus are proposed to anchor β-catenin in the nucleus, although β-catenin can still localize to the nucleus in the absence of either of the two (reviewed in Staedeli et al., 2006). β-catenin can also be actively transported back to the cytoplasm, by either an intrinsic export signal or as cargo of Axin (Cong and Varmus, 2004) or APC (Rosin-Arbesfeld et al., 2000) that shuttle between cytoplasm and nucleus.

transactivation-of-wnt-target-genes

transactivation-of-wnt-target-genes

Transactivation of Wnt Target Genes

http://ars.els-cdn.com/content/image/1-s2.0-S0092867406013444-gr3.jpg

Figure 3. Transactivation of Wnt Target Genes

The β-catenin/Tcf complex interacts with a variety of chromatin-remodeling complexes to activate transcription of Wnt target genes. The recruitment of β-catenin to Tcf target genes affects local chromatin in several ways. Bcl9 acts as a bridge between Pygopus and the N terminus of β-catenin. Evidence suggests that this trimeric complex is involved in nuclear import/retention of β-catenin (Townsley et al., 2004), but it may also be involved in the ability of β-catenin to activate transcription (Hoffmans et al., 2005). The C terminus of β-catenin also binds to coactivators such as the histone acetylase CBP, Hyrax, and Brg-1 (a component of the SWI/SNF chromatin-remodeling complex).

Whereas the fly and worm genomes both encode a single Tcf protein, the vertebrate genome harbors fourTcf/Lef genes. Tcf factors bind their cognate motif in an unusual fashion, i.e., in the minor groove of the DNA helix, while inducing a dramatic bend of over 90°. Tcf target sites are highly conserved between the four vertebrate Tcf/Lef proteins and Drosophila Tcf. These sites resemble AGATCAAAGG ( van de Wetering et al., 1997). Wnt/TCF reporter plasmids such as pTOPflash ( Korinek et al., 1997), widely used to measure Wnt pathway activation, consist of concatamers of 3–10 of these binding motifs cloned upstream of a minimal promoter. The four vertebrate TCF/LEF differ dramatically in their embryonic and adult expression domains, yet they are highly similar biochemically, explaining the extensive redundancy unveiled in double knockout experiments (as in Galceran et al., 1999).

In the absence of Wnt signals, Tcf acts as a transcriptional repressor by forming a complex with Groucho/Grg/TLE proteins (Cavallo et al., 1998 and Roose et al., 1998). The interaction of β-catenin with the N terminus of Tcf (Behrens et al., 1996Molenaar et al., 1996 and van de Wetering et al., 1997) transiently converts it into an activator, translating the Wnt signal into the transient transcription of Tcf target genes. To accomplish this, β-catenin physically displaces Groucho from Tcf/Lef (Daniels and Weis, 2005). The recruitment of β-catenin to Tcf target genes affects local chromatin in several ways. Its C terminus is a potent transcriptional activator in transient reporter gene assays (van de Wetering et al., 1997). It binds coactivators such as the histone acetylase CBP and Brg-1, a component of the SWI/SNF chromatin remodeling complex (reviewed in Staedeli et al., 2006). A recent study implies that the human and fly homologs of yeast Cdc37 (Parafibromin and Hyrax, respectively) also interact with the C-terminal transactivation domain of β-catenin to activate target gene transcription (Mosimann et al., 2006). Cdc37 is a component of the PAF complex. In yeast the PAF complex directly interacts with RNA polymerase II to regulate transcription initiation and elongation.

Two dedicated, nuclear partners of the TCF/β-catenin complex, Legless/Bcl9 and Pygopus, were recently found in genetic screens in Drosophila ( Kramps et al., 2002Parker et al., 2002 and Thompson et al., 2002). Mutations in these genes result in phenotypes similar to wingless, and overexpression of both genes promotes TCF/β-catenin activity in mammalian cells ( Thompson et al., 2002). Bcl9 bridges Pygopus to the N terminus of β-catenin. The formation of this trimeric complex has been implicated in nuclear import/retention of β-catenin ( Townsley et al., 2004) but may also directly contribute to the ability of β-catenin to transactivate transcription ( Hoffmans et al., 2005). Although most if not all Wnt signaling events in Drosophila appear to be dependent on Bcl9 and Pygopus, it is currently unclear if this holds true in vertebrate development.

Tcf itself can be regulated by phosphorylation. The MAP kinase-related protein kinase NLK/Nemo (Ishitani et al., 1999) phosphorylates Tcf, thereby decreasing the DNA-binding affinity of the β-catenin/Tcf complex and inhibiting transcriptional regulation of Wnt target genes. In C. elegans, LIT-1/NLK-dependent phosphorylation results in PAR-5/14-3-3- and CRM-1-dependent nuclear export of POP-1/Tcf ( Meneghini et al., 1999 and Lo et al., 2004). And lastly, a recent study utilizing chromatin immunoprecipitations suggests that APC, independent of its role in the cytoplasmic destruction complex, acts on chromatin to facilitate CtBP-mediated repression of Wnt target genes in normal, but not in colorectal cancer cells ( Sierra et al., 2006).

Wnt Target Genes

Loss of components of the Wnt pathway can produce dramatic phenotypes that affect a wide variety of organs and tissues. A popular view equates Wnt signaling with maintenance or activation of stem cells (Reya and Clevers, 2005). It should be realized, however, that Wnt signals ultimately activate transcriptional programs and that there is no intrinsic restriction in the type of biological event that may be controlled by these programs. Thus, Wnt signals may promote cell proliferation and tissue expansion but also control fate determination or terminal differentiation of postmitotic cells. Sometimes, these disparate events, proliferation and terminal differentiation, can be activated by Wnt in different cell types within the same structure, such as the hair follicle or the intestinal crypt (Reya and Clevers, 2005).

Numerous Tcf target genes have been identified in diverse biological systems. These studies tend to focus on target genes involved in cancer, as exemplified by the wide interest in the Wnt target genes cMyc and Cyclin D1. For a comprehensive, updated overview of Tcf target genes, the reader is referred to the Wnt homepage (http://www.stanford.edu/∼rnusse/wntwindow.html). The Wnt pathway has distinct transcriptional outputs, which are determined by the developmental identity of the responding cell, rather than by the nature of the signal. In other words, the majority of Wnt target genes appear to be cell type specific. It is not clear whether “universal” Wnt/Tcf target genes exist. The best current candidates in vertebrates are Axin2/conductin (Jho et al., 2002) and SP5 (Weidinger et al., 2005). As noted (Logan and Nusse, 2004), Wnt signaling is autoregulated at many levels. The expression of a variety of positive and negative regulators of the pathway, such as Frizzleds, LRP and HSPG, Axin2, and TCF/Lef are all controlled by the β-catenin/TCF complex.

Wnt Signaling in Self-Renewing Tissues in Adult Mammals

Wnt signaling not only features in many developmental processes; in some self-renewing tissues in mammals it remains essential throughout life. It is this aspect of Wnt signaling that is intricately connected to the development of disease. The examples discussed below illustrate how the Wnt pathway is involved in adult tissue self-renewal. Mutations in the Wnt pathway tip the homoeostatic balance in these tissues to cause pathological conditions such as disturbances in skeletal bone mass or cancer.

Gut

Figure 4. Self-Renewing Tissues in the Adult Mammal

Current evidence indicates that the Wnt cascade is the dominant force in controlling cell fate along the crypt-villus axis. In neonatal mice lacking Tcf4, the differentiated villus epithelium appears unaffected, but the crypt progenitor compartment is entirely absent (Korinek et al., 1998). This implies that physiological Wnt signaling is required for the establishment of this progenitor compartment.

Hair Follicle

Multipotent epidermal stem cells reside in the bulge region of the hair follicle (Figure 4). Bulge stem cells can generate all hair lineages but also the sebocytes and even the stem cells of the interfollicular epidermis (Alonso and Fuchs, 2003). To form a hair, cells migrate downward from the bulge through the outer root sheath. At the base of the hair, the cells enter a transit-amplifying compartment termed the germinative matrix where they undergo terminal differentiation in the precortex compartment of the hair.

Hematopoietic System

Hematopoietic stem cells (HSCs) are the best studied stem cells in mammals. A number of studies have implicated the Wnt signaling pathway as an important regulator of hematopoietic stem and progenitor cells. HSCs themselves as well as the bone marrow microenvironment can produce Wnt proteins. Indeed, Tcf reporters are active in HSCs in their native microenvironment.

Bone

In postnatal and adult life, osteoblasts produce bone matrix, whereas osteoclasts resorb the matrix. Bone density is determined by the relative activities of these two cell types. Gain-of-function mutations in the human LRP5 gene occur in bone diseases, indicating that canonical Wnt signaling may regulate bone mass. This observation has motivated genetic studies in mouse models, which generally confirm the importance of this signaling pathway in bone homeostasis, primarily as a positive regulator of the osteoblast lineage. Similar to humans carrying the gain-of-function LRP5G171V mutation, transgenic mice expressing this allele in osteoblasts display increased bone density and elevated numbers of active osteoblasts (reviewed in Hartmann, 2006).

Wnt Signaling in Cancer

Colon Cancer

The APC gene was among the first tumor suppressors to be cloned. A germline APC mutation is the genetic cause of a hereditary cancer syndrome termed Familiar Adenomatous Polyposis (FAP) (Kinzler et al., 1991 and Nishisho et al., 1991). FAP patients inherit one defective APC allele and as a consequence develop large numbers of colon adenomas, or polyps, in early adulthood. Polyps are benign, clonal outgrowths of epithelial cells in which the second APC allele is inactivated. Inevitably, some of these polyps progress into malignant adenocarcinoma. Loss of both APC alleles occurs in the large majority of sporadic colorectal cancers (Kinzler and Vogelstein, 1996). Mutational inactivation of APC leads to the inappropriate stabilization of β-catenin (Rubinfeld et al., 1996Figure 4). Indeed, Tcf reporter constructs, normally transcribed only upon Wnt signaling, are inappropriately transcribed in APC mutant cancer cells through the action of constitutive complexes between β-catenin and the intestinal TCF family member Tcf4 (Korinek et al., 1997). In rare cases of colorectal cancer where APC is not mutated, Axin2 is mutant (Liu et al., 2000), or activating (oncogenic) point mutations in β-catenin remove its N-terminal Ser/Thr destruction motif (Morin et al., 1997). Of note, patients with hereditary Axin2 mutations display a predisposition to colon cancer (Lammi et al., 2004).

In intestinal epithelial cells in which APC is mutated, the constitutive β-catenin/Tcf4 complex activates a genetic program in crypt stem/progenitor cells (van de Wetering et al., 2002). In the crypt, the Wnt signaling gradient drives expression of this genetic program to maintain progenitor cell proliferation. The Wnt gradient also controls expression of the EphB/EphrinB sorting receptors and ligands (Battle et al., 2002). The resulting EphB/EphrinB countergradients establish crypt-villus boundaries as well as position the Paneth cells at the bottom of the crypt. Several EphB genes are initially upregulated as Wnt/Tcf4 target genes in early adenomas, but their expression is lost upon cancer progression (Batlle et al., 2005) apparently as the result of a selection process. Activating Wnt pathway mutations are not restricted to cancer of the intestine. Loss-of-function mutations in Axin have also been found in hepatocellular carcinomas, whereas oncogenic β-catenin mutations occur in a wide variety of solid tumors (reviewed inReya and Clevers, 2005).

Several animal models exist for FAP. Dove and colleagues first described the multiple intestinal neoplasia(min) mouse, which carries a stop codon in APC (Apcmin). Unlike FAP patients, Apcmin mice develop adenomas predominantly in the small intestine ( Su et al., 1992). Several additional Apc knockout models have been generated in mice. Invariably, these mice develop neoplastic lesions but they may differ in tumor incidence and tissue type in which tumors first appear. In a recent elegant study, the Wnt cascade was mutationally activated in adult mice by conditional deletion of Apc ( Sansom et al., 2004). Within days, villi were entirely populated by crypt-like cells, demonstrating the direct link between active Wnt signaling and the proliferation of crypt progenitors, which when unrestrained results in cancer. Zebrafish that are mutant in Apc resemble the mouse models in that heterozygous mutants develop adenomas in organs of endodermal origin including the intestine. These fish may prove useful for genetic screens for genes that modify cancer risk ( Haramis et al., 2006).

Hair Follicle Tumors

Leukemia

Drawing from the parallels between self-renewal and cancer in the gut and hair follicle, the effects of Wnt pathway components on hematopoietic progenitors predict that Wnt deregulation may contribute to hematological malignancies. Indeed, a recent report suggests that leukemic growth of both myeloid and lymphoid lineages is dependent on Wnt signaling. Granulocyte-macrophage progenitors from Chronic Myelogenous Leukemia patients and blast crisis cells from patients resistant to therapy display active Wnt signaling as demonstrated by Tcf reporter activity and the accumulation of nuclear β-catenin (Jamieson et al., 2004).

Over the last 20 years, a detailed outline of the canonical Wnt pathway has emerged. Although it is likely that most core components of the pathway have now been identified, much remains to be learned about the biochemical events that connect these components. Many of the gaps in our knowledge are due to the notorious difficulties in the production of purified Wnt proteins. Few good Wnt antibodies exist and, 25 years after the cloning of Wnt1, its structure remains unknown. The routing and the coincident posttranslational modifications of Wnt proteins in the secreting cell are incompletely understood. And the rules that dictate the movement of Wnt proteins between cells remain uncertain. However, a procedure to produce soluble Wnt has recently been developed (Willert et al., 2003), which creates avenues to address many of these issues.

The components of the destruction complex have been long known, yet the biochemistry of its activity has remained elusive. APC is an essential component of the destruction complex, but what is its biochemical activity? How relevant is Dsh for the coupling of Wnt receptors to the destruction complex? And what mechanism inhibits the phosphorylation of β-catenin by the destruction complex when a Wnt signal is being transduced?

In addition, a multitude of proposed pathway components, not discussed here, may activate, modify, or inhibit Wnt signaling or may be involved in crosstalk to other pathways. An updated, comprehensive list of these putative components and interactions appears on http://www.stanford.edu/∼rnusse/wntwindow.html. Often based on single studies, these candidate components remain to be independently confirmed.

Wnt signaling ultimately controls developmental fates through the transcription of cell type-specific programs of Tcf target genes. Recent developments in array-based technology allow detailed analysis of the nuclear transcriptional response to Wnt signals. With these technologies, it is expected that the dissection of the gene programs in various developmental or pathological events will provide a wealth of insight into the biology of these processes.

7.10.5 Wnt.β-Catenin Signaling. Components, Mechanisms, and Diseases

MacDonald BT1Tamai KHe X.
Dev Cell. 2009 Jul; 17(1):9-26
http://dx.doi.org/10.1016%2Fj.devcel.2009.06.016

Signaling by the Wnt family of secreted glycolipoproteins via the transcription co-activator β-catenin controls embryonic development and adult homeostasis. Here we review recent progresses in this so-called canonical Wnt signaling pathway. We discuss Wnt ligands, agonists and antagonists and their interactions with Wnt receptors. We also dissect critical events that regulate β-catenin stability from Wnt receptors to the cytoplasmic β-catenin destruction complex, and nuclear machinery that mediates β-catenin-dependent transcription. Finally we highlight some key aspects of Wnt/β-catenin signaling in human diseases including congenital malformations, cancer and osteoporosis and potential therapeutic implications.

Signaling by the Wnt family of secreted glycolipoproteins is one of the fundamental mechanisms that direct cell proliferation, cell polarity and cell fate determination during embryonic development and tissue homeostasis (Logan and Nusse, 2004). As a result, mutations in the Wnt pathway are often linked to human birth defects, cancer and other diseases (Clevers, 2006). A critical and most studied Wnt pathway is canonical Wnt signaling, which functions by regulating the amount of the transcriptional co-activator β-catenin that controls key developmental gene expression programs. This review focuses on our current understanding of Wnt/β-catenin signaling, drawing mainly from genetic, developmental and biochemical analyses in Drosophila, Xenopus, mice and humans. For more comprehensive and historic perspective we refer readers to earlier reviews (Clevers, 2006Logan and Nusse, 2004) and the Wnt homepage (www.stanford.edu/~rnusse/wntwindow.html). The nematode Caenorhabditis elegans exhibits similar but also divergent Wnt/β-catenin pathways, which are covered elsewhere (Mizumoto and Sawa, 2007) and in the accompanying review (Kimble 2009). Wnt also activates a number of non-canonical signaling pathways that are independent of β-catenin and have been recently reviewed (Seifert and Mlodzik, 2007Wang and Nathans, 2007).

The central logic of Wnt/β-catenin signaling has emerged from two decades of studies (Figure 1). In the absence of Wnt, cytoplasmic β-catenin protein is constantly degraded by the action of the Axin complex, which is composed of the scaffolding protein Axin, the tumor suppressor adenomatous polyposis coli gene product (APC), casein kinase 1 (CK1), and glycogen synthase kinase 3 (GSK3). CK1 and GSK3 sequentially phosphorylate the amino terminal region of β-catenin, resulting in β-catenin recognition by β-Trcp, an E3 ubiquitin ligase subunit, and subsequent β-catenin ubiquitination and proteasomal degradation (He et al., 2004). This continual elimination of β-catenin prevents β-catenin from reaching the nucleus, and Wnt target genes are thereby repressed by the DNA-bound T cell factor/lymphoid enhancer factor (TCF/LEF) family of proteins (Figure 1a). The Wnt/β-catenin pathway is activated when a Wnt ligand binds to a seven-pass transmembrane Frizzled (Fz) receptor and its co-receptor, low-density lipoprotein receptor related protein 6 (LRP6) or its close relative LRP5. The formation of a likely Wnt-Fz-LRP6 complex together with the recruitment of the scaffolding protein Dishevelled (Dvl) results in LRP6 phosphorylation and activation and the recruitment of the Axin complex to the receptors. These events lead to inhibition of Axin-mediated β-catenin phosphorylation and thereby to the stabilization of β-catenin, which accumulates and travels to the nucleus to form complexes with TCF/LEF and activates Wnt target gene expression (Figure 1b).

Overview of Wnt.β-catenin signaling nihms196288f1

Overview of Wnt.β-catenin signaling nihms196288f1

Overview of Wnt/β-catenin signaling
http://www.ncbi.nlm.nih.gov/pmc/articles/PMC2861485/bin/nihms196288f1.gif

Figure 1 Overview of Wnt/β-catenin signaling

Wnt ligands and biogenesis

Wnts are conserved in all metazoan animals. In mammals, complexity and specificity in Wnt signaling are in part achieved through 19 Wnt ligands, which are cysteine rich proteins of approxiamately 350-400 amino acids that contain an N-terminal signal peptide for secretion. Murine Wnt3a represents the first purified and biochemically characterized Wnt protein (Willert et al., 2003) owing to its relatively efficient secretion (in contrast to most other Wnt proteins). In addition to N-linked glycosylation, which is required for Wnt3a secretion (Komekado et al., 2007), Wnt3a undergoes two types of lipid modifications that likely account for the hydrophobicity and poor solubility of Wnt proteins (Hausmann et al., 2007). The first reported lipididation was the addition of palmitate to cysteine 77 (Willert et al., 2003). Its mutation had minimal effect on Wnt3a secretion but diminished the ability of Wnt3a to activate β-catenin signaling (Galli et al., 2007;Komekado et al., 2007Willert et al., 2003). The second identified lipididation was a palmitoleoyl attached to serine 209, and its mutation resulted in Wnt3a accumulation in the endoplasmic reticulum (ER) and failure in secretion (Takada et al., 2006).

Drosophila Wingless (Wg) is the Wnt molecule most investigated in vivo (Hausmann et al., 2007). These studies plus work in nematodes have identified genes that regulate Wnt biogenesis and secretion. Porcupine (Porc) encodes a multipass transmembrane ER protein that contains an O-acyl transferase domain suggesting a role in Wg lipid modification (Hausmann et al., 2007). Porc deficiency results in Wg and Wnt3a accumulation in the ER and diminished Wnt3a palmitoleoylation at serine 209 (Takada et al., 2006), suggesting that Porc is responsible for this particular lipidation. Whether Porc or a distinct acyltransferase is involved in Wnt3a palmitoylation at cysteine 77 remains unknown.

Two additional proteins/protein complexes were identified for Wg/Wnt secretion: Wntless (Wls), also known as Evenness interrupted (Evi) or Sprinter (Srt), in Drosophila and the retromer complex in nematodes (Hausmann et al., 2007). Wls is a multipass transmembrane protein that localizes to the Golgi, endocytic compartments and the plasma membrane, and is essential for Wg secretion. The retromer complex, which is composed of five subunits, was defined first in yeast. It mediates membrane protein trafficking between endosomes and the Golgi apparatus (Hausmann et al., 2007). Several groups recently reported that the retromer complex is required for retrieval/recycling of Wls from the endosome to the Golgi (Belenkaya et al., 2008Franch-Marro et al., 2008bPan et al., 2008aPort et al., 2008Yang et al., 2008), likely mediated by direct interaction between Wls and the retromer Vps35 subunit. Loss of retromer function causes Wls to be degraded in the lysosomes and results in reduction of Wls and thus Wnt secretion. These studies led to an emerging picture of Wnt biogenesis (Figure 2). Wnt is glycosylated and lipid modified by Porc in the ER, and is escorted by Wls from the Golgi to the plasma membrane for secretion. Wls is recycled by endocytosis and trafficked back to Golgi by the retromer. Note that porcwls and retromer mutants largely phenocopywg/wnt mutants in flies and worms, attesting their dedicated roles in Wnt biogenesis.

Wnt biogenesis and secretion nihms196288f2

Wnt biogenesis and secretion nihms196288f2

Wnt biogenesis and secretion

http://www.ncbi.nlm.nih.gov/pmc/articles/PMC2861485/bin/nihms196288f2.gif

Figure 2  Wnt biogenesis and secretion

Wnt extracellular distribution and movement

Wnt proteins can function as morphogens that are capable of both short and long range signaling, as best demonstrated for Wg. Wg lipidation raises the issue of its diffusion and distribution through the aqueous extracellular space. Indeed purified Wnt3a exhibits increased activity via artificial liposomal packaging (Morrell et al., 2008). Two distinct Wg secretory pathways for short and long range signaling have been speculated but not fully substantiated. Wg may form multimers to bury lipid modifications inside (Katanaev et al., 2008), or bind to lipoprotein particles, which may be involved in Wg long range signaling (Panakova et al., 2005) (Figure 2). The membrane microdomain protein reggie-1/flotillin-2 specifically promotes Wg long-range secretion (Katanaev et al., 2008). The Wg receptors (see below) and heparan sulfate proteoglycans (HSPGs) such as Dally and Dally-like protein have important roles in the Wg morphogen concentration via regulating Wg degradation, diffusion, endocytosis/transcytosis, and may function in Wg signaling as potential low-affinity co-receptors (Lin, 2004). Note that reggie-1/flotillin-2, lipoprotein particles, Dally and Dally-like protein are important analogously for secreted Hedgehog morphogen, which is also lipid modified (Katanaev et al., 2008Lin, 2004Panakova et al., 2005).

Wnt receptors: Frizzled and LRP5/6

Two distinct receptor families are critical for Wnt/β-catenin signaling (Figure 3): the Frizzled (Fz or Fzd) seven-pass transmembrane receptors (Logan and Nusse, 2004) and the LDL receptor-related proteins 5 and 6 (LRP5 and LRP6) (He et al., 2004). The Wnt-receptor relationship is best illustrated for Wg, which binds toDrosophila Fz2 (Dfz2) and Dfz1 with high affinity (1-10 nM) and requires either Fz in a redundant manner (Logan and Nusse, 2004). Wg reception also absolutely depends on Arrow, the LRP5/6 homolog (He et al., 2004). The mammalian genome harbors 10 Fz genes, most of which have variable capacities to activate β-catenin signaling when co-overexpressed with Wnt and LRP5/6 (e.g., Binnerts et al., 2007) and functional redundancy among Fz members is likely prevalent (Logan and Nusse, 2004). Between the two LRPs, LRP6 plays a more dominant role and is essential for embryogenesis whereas LRP5 is dispensable for embryogenesis but critical for adult bone homeostasis. Nonetheless LRP5 and LRP6 are partially redundant as their functions together are required for mouse gastrulation (He et al., 2004). Most data, including Wnt binding to LRP5/6 and Wnt1-Fz8-LRP6 complex formation in vitro and observations that engineered Fz-LRP5/6 proximity is sufficient to activate β-catenin signaling (Cong et al., 2004Holmen et al., 2005;Tolwinski et al., 2003), support the model that Wnt induces the formation of Fz-LRP5/6 complex (He et al., 2004) (Figure 1). But unambiguous demonstration of this receptor complex in vivo is lacking. It is noteworthy that Wnt3a palmitoylation (at cysteine 77) is important for binding to both Fz and LRP6 (Cong et al., 2004Komekado et al., 2007), explaining in part the importance of this lipid modification

Secreted Wnt antagonists and agonists nihms196288f3

Secreted Wnt antagonists and agonists nihms196288f3

Secreted Wnt antagonists and agonists
http://www.ncbi.nlm.nih.gov/pmc/articles/PMC2861485/bin/nihms196288f3.gif

Figure 3 Secreted Wnt antagonists and agonists

A particular Wnt may activate β-catenin and/or non-canonical pathways depending on the receptor complement (van Amerongen et al., 2008). Fz function is involved in β-catenin and non-canonical pathways. The Fz-LRP5/6 co-receptor model stipulates that a Wnt-Fz pair capable of recruiting LRP5/6 activates the β-catenin pathway, consistent with the specific requirement of LRP5/6 in Wnt/β-catenin signaling (He et al., 2004). However some evidence suggests that LRP6 antagonizes non-canonical Wnt signaling in vivo, possibly via competing for Wnt ligands (Bryja et al., 2009) or an unknown mechanism (Tahinci et al., 2007). Other Wnt receptors exist such as Ryk and ROR2, which are not required for, but in some cases may antagonize, Wnt/β-catenin signaling (van Amerongen et al., 2008).

Wnt antagonists and agonists

Several secreted protein families antagonize or modulate Wnt/β-catenin signaling (Figure 3). sFRPs (secreted Frizzled related proteins), and WIF (Wnt inhibitory protein) bind to Wnt, and in the case of sFRPs, also to Fz (Figure 3), and thereby function as Wnt antagonists for both β-catenin and non-canonical signaling (Bovolenta et al., 2008). Loss-of-function studies in mice have revealed significant redundancy for the sFRP genes (Satoh et al., 2008). The Wnt-binding property suggests that sFRPs and WIF may also regulate Wnt stability and diffusion/distribution extracellularly beyond just Wnt inhibitors. Some sFRPs have been shown to have Wnt-independent activity such as regulators of extracellular proteinases (Bovolenta et al., 2008).

Two distinct classes of Wnt inhibitors are the Dickkopf (Dkk) family and the Wise/SOST family (Figure 3). Dkk proteins, exemplified by Dkk1, are LRP5/6 ligands/antagonists and are considered specific inhibitors for Wnt/β-catenin signaling. Although two different models for Dkk1 action have been proposed (Mao et al., 2002Semenov et al., 2001), recent biochemical and genetic studies (Ellwanger et al., 2008Semenov et al., 2008Wang et al., 2008) have argued against the model that Dkk1 inhibits Wnt signaling via inducing LRP6 internalization/degradation through transmembrane Kremen (Krm) proteins (Mao et al., 2002). Dkk1 disruption of Wnt-induced Fz-LRP6 complex remains a more likely mechanism (Semenov et al., 2001), with Krm playing a minor modulatory role in specific tissues (Ellwanger et al., 2008). Wise and SOST constitute another family of LRP5/6 ligands/antagonists (Itasaki et al., 2003Li et al., 2005Semenov et al., 2005). Like Dkk1, SOST is able to disrupt Wnt-induced Fz-LRP6 complex in vitro (Semenov et al., 2005). Both Dkk1 and SOST are strongly implicated in human diseases (see below).

Shisa proteins represent a distinct family of Wnt antagonists (Figure 3), which trap Fz proteins in the ER and prevent Fz from reaching the cell surface, thereby inhibiting Wnt signaling cell-autonomously (Yamamoto et al., 2005). Shisa proteins also antagonize FGF (fibroblast growth factor) signaling by trapping FGF receptors in the ER. Other Wnt antagonists with multivalent activities exist. Xenopus Cerberus binds to and inhibits Wnt as well as Nodal and BMP (bone morphogenetic protein) (Piccolo et al., 1999), and IGFBP-4 (Insulin-like growth-factor-binding protein-4) antagonizes Wnt signaling via binding to both Fz and LRP6, in addition to modulating IGF signaling (Zhu et al., 2008).

Norrin and R-spondin (Rspo) proteins are two families of agonists for Wnt/β-catenin signaling (Figure 3). Norrin is a specific ligand for Fz4 and acts through Fz4 and LRP5/6 during retinal vascularization (Xu et al., 2004). Rspo proteins exhibit synergy with Wnt, Fz and LRP6 (Kazanskaya et al., 2004Kim et al., 2005;Nam et al., 2006Wei et al., 2007), and show genetic interaction with LRP6 during embryogenesis (Bell et al., 2008), but their mechanism of action is controversial. Results that Rspo binds to both Fz and LRP6 (Nam et al., 2006), to LRP6 primarily (Wei et al., 2007), or to neither (Kazanskaya et al., 2004) have been reported. Another model suggests that Rspo is a ligand for Krm and antagonizes Dkk/Krm-mediated LRP6 internalization (Binnerts et al., 2007), but this seems unlikely given that Krm1 and Krm2 double knockout mice are viable and do not exhibit Rspo mutant phenotypes, and Rspo activates β-catenin signaling in cells lacking both Krm genes (Bell et al., 2008Ellwanger et al., 2008). Rspo genes are often co-expressed with and depend on Wnt for expression (Kazanskaya et al., 2004), and may represent a means of positive feedback that reinforces Wnt signaling. Mutations in Norrin and Rspo genes cause distinct hereditary diseases (see below).

Wnt signaling

Wnt-off state: β-catenin phosphorylation/degradation by the Axin complex

Cytosolic β-catenin phosphorylation/degradation and its regulation by Wnt are the essence of Wnt signaling (Figure 1). The scaffolding protein Axin uses separate domains to interact with GSK3, CK1α, and β-catenin and coordinates sequential phosphorylation of β-catenin at serine 45 by CK1α and then at threonine 41, serine 37 and serine 33 by GSK3 (Kimelman and Xu, 2006). β-catenin phosphorylation at serine 33 and 37 creates a binding site for the E3 ubiquitin ligase β-Trcp, leading to β-catenin ubiquitination and degradation (Figure 4). Mutations of β-catenin at and surrounding these serine and threonine residues are frequently found in cancers, generating mutant β-catenin that escapes phosphorylation and degradation (Table 1). Axin also contains an RGS (regulator of G protein signaling) domain that interacts with APC, a large multifunctional scaffolding protein that itself binds β-catenin. These core Axin complex components (Kimelman and Xu, 2006) share a common goal of ensuring β-catenin phosphorylation and degradation. Indeed both APC and Axin are tumor suppressor genes, and APC mutations are particularly prevalent in colorectal cancer (Table 1).

Regulation of Axin complex assembly for β-catenin degradation
http://www.ncbi.nlm.nih.gov/pmc/articles/PMC2861485/bin/nihms196288f4.gif

Figure 4 Regulation of Axin complex assembly for β-catenin degradation

Table 1 Human diseases associated with mutations of the Wnt signaling components

Several aspects of the Axin complex deserve further discussion. (i) In addition to β-catenin, GSK3 and CK1 also phosphorylate Axin and APC, leading to increased association of Axin and APC with β-catenin and thus enhanced β-catenin phosphorylation/degradation (Huang and He, 2008Kimelman and Xu, 2006) (Figure 4). (ii) Two abundant serine/threonine phosphatases, PP1 and PP2A, both of which associate with Axin and/or APC, counteract the action of GSK3 and/or CK1 in the Axin complex. Thus PP1 dephosphorylates Axin and promotes the disassembly of the Axin complex (Luo et al., 2007), whereas PP2A dephosphorylates β-catenin (Su et al., 2008), each resulting in reduced β-catenin degradation (Figure 4). One should note that PP2A may have multiple and opposing roles in the Wnt pathway depending on the particular associated regulatory subunits and substrates (Kimelman and Xu, 2006). (iii) The assembly of the Axin complex appears to be multivalent and robust. In fly embryos that are null for Axin, expression, at physiological levels, of Axin mutants lacking either the APC-, GSK3-, or β-catenin-binding domain restores a significant degree of normal patterning, implying a quasi-functional Axin complex assembly via multivalent interactions; furthermore, some of these Axin deletion mutants can complement each other and restore fly viability, possibly via Axin dimerization or multimerization (Peterson-Nedry et al., 2008). Indeed Axin has multiple potential dimerization domains (Luo et al., 2005) and the Axin DIX domain may form multimeric polymers (Schwarz-Romond et al., 2007a). (iv) Axin concentration is exceedingly low compared to other components in Xenopus oocytes, indicating that Axin is rate limiting for the complex assembly. This feature may ensure that changes in the Axin protein level will not fluctuate the availability of GSK3 (or other components) for non-Wnt functions, thereby further insulating Wnt and other signaling events (Lee et al., 2003). It is unknown, however, whether the drastic difference between the concentration of Axin versus the other components applies universally, and whether different cells employ quantitative differences in the ratio of Axin and other components to shape their unique Wnt response kinetics (such as the speed and level of β-catenin accumulation). Indeed in Drosophila photoreceptors, APC appears to be present at minimal levels such that a 50% reduction alters the graded Wg response (Benchabane et al., 2008).

Other proteins such as WTX (Wilms tumor gene on the X chromosome) may have roles in β-catenin degradation. Loss of WTX and activating β-catenin mutations seem to have non-overlapping occurrence in Wilms tumor (a pediatric kidney cancer) (Rivera et al., 2007). WTX binds to β-catenin, Axin, APC and β-Trcp to promote β-catenin ubiquitination, although its biochemical role remains unknown (Major et al., 2007). Another Axin-binding protein Diversin can facilitate β-catenin degradation via recruiting CK1ε to phosphorylate β-catenin (Schwarz-Romond et al., 2002).

APC function and APC-Axin cross regulation

The biochemical nature of APC has been enigmatic. A recent study suggested that APC protectsβ-catenin from dephosphorylation by PP2A thereby enhancing β-catenin phosphorylation/degradation (Su et al., 2008) (Figure 4), consistent with the observation that Axin overexpression causes β-catenin degradation even in cells lacking APC function (Behrens et al., 1998). Surprisingly APC (upon phosphorylation by CK1/GSK3) and Axin bind to and compete for the same β-catenin interaction interface, leading to a proposal that APC acts as a “ratchet” to remove phosphorylated β-catenin from Axin for ubiquitination and for making Axin available for a further round of β-catenin phosphorylation (Kimelman and Xu, 2006Xing et al., 2003). A different model was proposed based on differential β-catenin binding affinity by unphosphorylated versus phosphorylated APC (Ha et al., 2004). APC has also been shown to promote β-catenin nuclear export and to act as a chromatin-associated suppressor for β-catenin target genes, thus functioning in the nucleus (see below).

Another paradoxical observation is that APC has a positive function in physiological and ectopic Wg/Wnt signaling through the promotion of Axin degradation (Lee et al., 2003Takacs et al., 2008) (Figure 4). One model suggests that this represents a fail-safe mechanism to buffer dramatic β-catenin fluctuations when APC levels vary (Lee et al., 2003). Thus a decrease in the APC level results in higher Axin amounts, compensating for β-catenin degradation. APC-mediated Axin degradation depends on the APC amino terminal domain that is not involved inβ-catenin degradation (Takacs et al., 2008). It is intriguing that colon cancer cells are rarely null for APC but rather retain the amino terminal half, and may have hijacked a part of this fail-safe regulation for tumorigenesis. Conversely Axin can also facilitate APC degradation upon overexpression (Choi et al., 2004), constituting perhaps the other side of the Axin-APC regulation circuit (Figure 4). Mechanisms for Axin and APC degradation, which are proteosome-dependent, have not been characterized.

Wnt-on state

Activation of Wnt receptors

Wnt signaling requires both Fz and LRP6 (or LRP5), likely through a Wnt-induced Fz-LRP6 complex (Figure 1). Wnt-induced LRP6 phosphorylation is a key event in receptor activation (Tamai et al., 2004). LRP6, LRP5 and Arrow each have five reiterated PPPSPxS motifs (P, proline; S, serine or threonine, x, a variable residue), which are essential for LRP6 function and are each transferrable to a heterologous receptor to result in constitutive β-catenin signaling (MacDonald et al., 2008Tamai et al., 2004Zeng et al., 2005). These dually phosphorylated PPPSPxS motifs are docking sites for the Axin complex (Davidson et al., 2005;Tamai et al., 2004Zeng et al., 2005), thereby recruiting Axin to LRP6 upon Wnt stimulation (Mao et al., 2001) (Figure 5).

Models of Wnt receptor activation nihms196288f5

Models of Wnt receptor activation nihms196288f5

Models of Wnt receptor activation

http://www.ncbi.nlm.nih.gov/pmc/articles/PMC2861485/bin/nihms196288f5.gif

Figure 5 Models of Wnt receptor activation

The kinases responsible for PPPSPxS phosphorylation have been identified unexpectedly as GSK3 and CK1 (Davidson et al., 2005Zeng et al., 2005). Although one study argued that only CK1 phosphorylation is Wnt-induced (Davidson et al., 2005), most available data support that Wnt induces PPPSP phosphorylation (Binnerts et al., 2007Khan et al., 2007Pan et al., 2008bWei et al., 2007), which is carried out by GSK3 and primes xS phosphorylation by CK1, thereby leading to dually induced phosphorylation (Zeng et al., 2005) (Figure 5). Although potential involvement of additional kinases cannot be ruled out, experiments in GSK3α/β null cells indicate that GSK3 accounts for most, if not all, PPPSP phosphorylation (Zeng et al., 2008Zeng et al., 2005). As in β-catenin phosphorylation, Axin-bound GSK3 appears to mediate LRP6 phosphorylation (Zeng et al., 2008). Thus PPPSPxS phosphorylation exhibits a mirror image of β-catenin phosphorylation in sequential order, in priming requirement, and importantly in functionality, but apparently by the same Axin-GSK3 complex (Huang and He, 2008) (Figure 5). This unusual mechanism, using the same kinase complex for both positive and negative regulation, is reminiscent of another morphogenetic pathway, Hedgehog signaling in Drosophila (Price, 2006), and implies a simple view that Wnt signaling regulates the two opposing activities of the Axin-GSK3 complex. One caveat is that GSK3 is genetically defined as a negative regulator of β-catenin signaling. The positive requirement of GSK3 in LRP6 activation is demonstrated when a membrane-tethered GSK3 inhibitory peptide blocks Wnt signaling (Zeng et al., 2008).

Fz function is required for Wnt-induced LRP6 phosphorylation, and forced Fz-LRP6 association is sufficient to trigger LRP6 phosphorylation (Zeng et al., 2008). Fz function is usually linked to Dsh/Dvl (Wallingford and Habas, 2005), a cytoplasmic scaffolding protein that may directly interact with Fz (Wong et al., 2003). Indeed Fz-Dvl interaction and Dvl function are critical for Wnt-induced LRP6 phosphorylation (Bilic et al., 2007Zeng et al., 2008). As Dvl interacts with Axin (Wallingford and Habas, 2005), and is required for Axin recruitment to the plasma membrane during Wg signaling (Cliffe et al., 2003) or in Fz overexpression (Zeng et al., 2008), one model stipulates that Fz-Dvl recruitment of the Axin-GSK3 complex initiates LRP6 phosphorylation by GSK3 (Zeng et al., 2008) (Figure 5).

Several features of Wnt receptor activation deserve further discussion. (i) The observation that Axin is required for LRP6 phosphorylation, and phosphorylated LRP6 in turn recruits Axin suggests a positive feed-forward loop, potentially amplifying and ensuring the phosphorylation of all five PPPSPxS motifs (Figure 5). Indeed the phosphorylation of these motifs relies on the presence of one another, and LRP6 activity is particularly sensitive to the PPPSPxS copy number (MacDonald et al., 2008Wolf et al., 2008). This may explain the distinct roles of Fz and LRP6/Arrow in the “initiation” (which requires both Fz and Arrow) and “amplification” (which requires Arrow only) during Wg signaling (Baig-Lewis et al., 2007) (Figure 5a). (ii) Wnt-induced clustering of Fz-LRP6 receptor has been reported that critically depend on Dvl, Axin and GSK3 for formation (see below) (Bilic et al., 2007Schwarz-Romond et al., 2007a). Although unambiguous evidence for such aggregation under physiological conditions without overexpression remains to be shown, this “signalsome” model (Figure 5b) and the “initiation-amplification” model (Figure 5a) together provide a spatial and temporal framework for understanding Wnt receptor activation. (iii) Wnt also induces LRP6 phosphorylation by CK1γ outside the PPPSPxS motifs, in particular in a conserved S/T cluster amino-terminal to the first PPPSPxS motif (Davidson et al., 2005). This region upon phosphorylation binds to GSK3 (Piao et al., 2008), potentially accounting for observed LRP6-GSK3 interaction (Mi et al., 2006Zeng et al., 2005). The significance of this S/T cluster to LRP6 function has not been investigated in the intact receptor, but these results imply multiple interaction interfaces among LRP6, Axin and GSK3. (iv) Wnt may also “activate” Fz, which is structurally related to G-protein coupled receptors (GPCRs). Some genetic and pharmacological evidence suggests that trimeric G proteins, specifically the Gαo and Gαq, are required downstream of Fz and probably upstream of Dvl in Wnt/β-catenin signaling (Katanaev et al., 2005Liu et al., 2001Liu et al., 2005). Whether G proteins are involved in Wnt/Fz/Dvl-regulated LRP6 phosphorylation is unknown.

Dvl is involved in Wnt/β-catenin and other Wnt/Fz-dependent pathways and has numerous putative binding partners (Wallingford and Habas, 2005). For example CK1ε (or CK1δ) binds to Dvl and is a potent activator of β-catenin signaling, possibly via phosphorylating Dvl, LRP6 and/or the Axin complex (Price, 2006) (Figure 5). PP2A also associates with Dvl but has a positive or negative influence on Wnt signaling depending on the associated regulatory subunit (Kimelman and Xu, 2006). In addition Dvl is subjected to proteasomal degradation via distinct ubiquitination pathways (Angers et al., 2006Simons et al., 2005). Some of these Dvl regulation events have been suggested to switch Dvl between β-catenin and non-canonical pathways. Despite these progresses, the mechanism by which Dvl acts in Wnt/β-catenin signaling remains enigmatic. Two recent findings suggest potential new insights. (i) Polymerization/aggregation of Dvl (and Axin). Fz-Dvl and Dvl-Axin interactions are relatively weak (Schwarz-Romond et al., 2007bWong et al., 2003). However Dvl and Axin each harbor a homologous DIX domain that exhibit dynamic polymerization (Schwarz-Romond et al., 2007a). This unusual property is proposed to allow Dvl and Axin to form large aggregates that facilitate weak but dynamic protein interactions (Figure 5b). Indeed Wnt-induced receptor clustering requires an intact Dvl DIX domain (Bilic et al., 2007Schwarz-Romond et al., 2007a). It is unclear whether Wnt regulates DIX-dependent polymerization, and perhaps in a related manner, Fz-Dvl or Dvl-Axin interaction. (ii) Dvl stimulation of phosphatidylinositol 4,5-bisphosphate [PtdIns (4,5)P2 or PIP2] production by sequential actions of phosphatidylinositol 4-kinase type II (PI4KIIα) and phosphatidylinositol-4-phosphate 5-kinase type I (PIP5KI) (Pan et al., 2008b). Wnt induces Dvl, via the DIX domain, to bind to and activate PIP5K, and the resulting PIP2 production is suggested to promote LRP6 clustering and phosphorylation, although the underlying mechanism remains unclear (Figure 5c). Given that PIP2 has pleiotropic functions in cells including receptor endocytosis (see below), other potential mechanisms for PIP2 in LRP6 phosphorylation remain to be explored. Nonetheless Dvl DIX polymerization and stimulation of PIP2 may act in concert to ensure LRP6 clustering/phosphorylation/activation.

Other regulatory events at or proximal to Wnt receptors

A cytoplasmic protein in vertebrates, referred to as Caprin-2, binds to LRP6 and facilitates LRP6 phosphorylation by GSK3 (Ding et al., 2008). Caprin-2 has an oligomerization domain that may enhance LRP6 aggregation, and Caprin-2 additionally may also associate with both GSK3 and Axin and promote LRP6-Axin-GSK3 complex formation (Ding et al., 2008). Besides the requirement of Dvl, recruitment of Axin to the receptor complex may involve a giant protein (600 kD), Macf1 (microtubule actin cross-linking factor 1) (Chen et al., 2006). Macf1 is a member of the spectraplakin family of proteins that link the cytoskeleton to junctional proteins. Defective gastrulation in Macf1−/− mouse embryos phenotypically resembles Lrp5/6−/− double knockout mutants. On Wnt stimulation Macf1 associates with the Axin complex (including APC) in the cytosol and with LRP6 and the Axin complex (but not APC) in the membrane fraction (Chen et al., 2006), and may shuttle Axin to LRP6 (Figure 5). This Macf1 function may be vertebrate-specific as Drosophila Macf1 (shortstop) mutants do not exhibit wg-related phenotypes. …

Inhibition of β-catenin phosphorylation

How receptor activation leads to inhibition of β-catenin phosphorylation remains uncertain, and available data suggest possible parallel mechanisms. In the LRP6-centric view, as constitutively activated forms of LRP6 fully activate β-catenin signaling in an apparently Fz and Dvl-independent manner (He et al., 2004), LRP6 represents the key output whereas Fz and Dvl act upstream to control LRP6 activation. On the other hand, Dsh overexpression in Drosophila or recombinant Dvl in Xenopus egg extracts can activate β-catenin signaling presumably in the absence of Arrow/LRP6 (Salic et al., 2000Wehrli et al., 2000), and so does a GPCR-Fz chimeric protein in response to the GPCR ligand (Liu et al., 2001). These results argue that Fz/Dvl may activate β-catenin signaling independent of LRP6. The fact that nematodes have a related Wnt/β-catenin pathway (Kimble 2009) but have no LRP6 homolog may be consistent with this notion. Perhaps inDrosophila and vertebrates Wnt signaling components exist under sub-optimal levels and the two parallel branches need to operate together to counteract efficient β-catenin phosphorylation/degradation, whereas over-activation of either branch is sufficient to stabilize β-catenin. …

β-catenin nuclear function

β-catenin nuclear/cytoplasmic shuttling and retention

β-catenin stabilization results in its higher nuclear levels, but how β-catenin is shuttled to and retained in the nucleus is not well understood (Henderson and Fagotto, 2002Stadeli et al., 2006). Earlier studies suggested that β-catenin enters the nucleus in an NLS (nuclear localization signal)- and importin-independent fashion by interacting directly with nuclear pore proteins (Henderson and Fagotto, 2002). β-catenin also exits the nucleus via export involving APC (Henderson and Fagotto, 2002), Axin (Cong and Varmus, 2004), and RanBP3 (Ran binding protein 3), which binds to β-catenin in a Ran-GTP dependent manner (Hendriksen et al., 2005). Live cell imaging suggests that while Axin and APC can enrich β-catenin in the cytoplasm and TCF and β-catenin co-activators (BCL9 and Pygopus, see below) increase nuclear β-catenin, they do not accelerate the export or import rate of β-catenin, thereby arguing for their roles in β-catenin retention rather than shuttling (Krieghoff et al., 2006). Thus β-catenin nuclear and cytoplasmic partitioning is likely the dynamic sum of both shuttling and retention between the two compartments via multiple mechanisms. ….

TCF/LEF

The TCF/LEF family of DNA-bound transcription factors is the main partner for β-catenin in gene regulation (Arce et al., 2006Hoppler and Kavanagh, 2007). TCF represses gene expression by interacting with the repressor Groucho (TLE1 in human), which promotes histone deacetylation and chromatin compaction; Wnt-induced β-catenin stabilization and nuclear accumulation leads TCF to complex with β-catenin, which appears to displace Groucho (Daniels and Weis, 2005) and recruits other co-activators for gene activation (Figure 1). While a single TCF gene is found in Drosophila and worm, four TCF genes, TCF1, LEF1, TCF3 and TCF4, exist in mammals. Alternative splicing and promoter usage produce a large number of TCF variants with distinct properties (Arce et al., 2006Hoppler and Kavanagh, 2007). TCF proteins are HMG (high mobility group) DNA-binding factors, and upon binding to a DNA consensus sequence referred to as the Wnt responsive element (WRE), CCTTTGWW (W represents either T or A), they cause significant DNA bending that may alter local chromatin structure. A genome-wide analysis in colon cancer cells suggests that TCF4/β-catenin target genes are frequently “decorated” with multiple WREs, most of which are located at large distances from transcription start sites (Hatzis et al., 2008). Some TCF1 and TCF4 splicing variants harbor a second DNA-binding domain called C-clamp, which recognizes an additional GC element downstream of the typical WRE, allowing regulation of different sets of target genes (Atcha et al., 2007). These similarities and differences, combined with overlapping and unique expression patterns, underlie in part distinct and sometimes redundant functions of vertebrate/mammalian TCF genes. ….

Three major strategies exist to regulate TCF/β-catenin transcription. (i) Alternative promoter usage in TCF-1 and LEF-1 genes produces dnTCF-1/dnLEF-1, which lack the amino-terminal β-catenin-binding domain and thus act as the endogenous dominant negative TCF/LEF (Arce et al., 2006Hoppler and Kavanagh, 2007). Indeed the TCF-1 locus acts as an intestinal tumor suppressor primarily due to the production of dnTCF-1, which antagonizes TCF-4 in stem cell renewal. (ii) Nuclear antagonists Chibby and ICAT bind to β-catenin and disrupt β-catenin/TCF and β-catenin/co-activator interactions and promote β-catenin nuclear export (Li et al., 2008Tago et al., 2000). Besides these devoted inhibitors, many DNA-binding transcription factors interact with β-catenin or TCF and antagonize TCF/β-catenin-dependent transcription (Supplemental Table 1). For example, KLF4 inhibition of β-catenin transcriptional activation is important for intestinal homeostasis and tumor suppression (Zhang et al., 2006). (iii) Post-translational modifications of TCF/LEF exist including phosphorylation, acetylation, sumoylation, and ubiquitination/degradation (Arce et al., 2006Hoppler and Kavanagh, 2007). For instance, TCF-3 phosphorylation by CK1ε and LEF-1 phosphorylation by CK2 enhances their binding to β-catenin and diminishes LEF-1 binding to Groucho/TLE, whereas LEF-1 and TCF-4 phosphorylation by NLK (Nemo-like kinase) leads to less LEF/TCF/β-catenin complex binding to DNA and to LEF-1/TCF-4 degradation. LEF-1 and TCF-4 sumoylation (by the SUMO ligase PIASy) represses LEF-1 activity by targeting it to nuclear bodies but enhances TCF-4/β-catenin transcription, while CBP-mediated acetylation of TCF results in decreased TCF/β-catenin-binding in Drosophila and increased TCF nuclear retention in nematodes, both leading to transcriptional repression. These diverse modifications are often specific to individual TCF/LEF proteins, conferring differential regulation.

β-catenin associated co-activators

A plethora of β-catenin associated co-activators have been identified. These multi-protein complexes include BCL9 and Pygopus (Pygo), Mediator (for transcription initiation), p300/CBP and TRRAP/TIP60 histone acetyltransferases (HATs), MLL1/2 histone methyltransferases (HMTs), the SWI/SNF family of ATPases for chromatin remodeling, and the PAF1 complex for transcription elongation and histone modifications (Mosimann et al., 2009Willert and Jones, 2006) (Figure 6). While the central Arm-repeats of β-catenin associate with TCF, and the amino-terminal Arm-repeat binds to BCL9, most of the co-activator complexes interact with the β-catenin carboxyl terminal portion (Figure 6), creating a dazzling interplay between β-catenin and the transcriptional apparatus and the chromatin. Indeed TCF/β-catenin binding to WREs leads to histone acetylation in a CBP-dependent manner over a significant genomic distance (30 kb), suggesting that local TCF/β-catenin recruitment results in widespread chromatin modifications (Parker et al., 2008). …

Nuclear TCF.β-catenin co-activator complexes  nihms196288f6

Nuclear TCF.β-catenin co-activator complexes nihms196288f6

Nuclear TCF/β-catenin co-activator complexes

http://www.ncbi.nlm.nih.gov/pmc/articles/PMC2861485/bin/nihms196288f6.gif

Figure 6  Nuclear TCF/β-catenin co-activator complexes

…..

Unlike most co-activators that have general roles in transcription, BCL9 and Pygo in Drosophila are specifically required for β-catenin-dependent transcription and their biochemical functions proposed provide a glimpse of the complexity of TCF/β-catenin-coactivator interactions (Mosimann et al., 2009). (i) BCL9 and Pygo function as a “chain of activators” (Hoffmans et al., 2005). β-catenin binding to BCL9 recruits Pygo, which also interacts with Mediator (Carrera et al., 2008) (Figure 6); (ii) Pygo is constitutively nuclear and may have a role in recruiting/retaining BCL9/β-catenin in the nucleus upon Wg/Wnt signaling (Brembeck et al., 2004Townsley et al., 2004); (iii) Pygo also co-occupies chromatin loci with and via TCF in the absence of Wg signaling (despite a lack of direct TCF-Pygo interaction), and may help capture BCL9/β-catenin for TCF at the onset of Wg signaling (de la Roche and Bienz, 2007); (iv) Pygo has a PHD (plant homology domain) that binds preferentially to dimethylated H3K4 upon interaction with BCL9 (Fiedler et al., 2008). This “histone code” recognition leads to the speculation that Pygo/BCL9 act during the transition from gene silencing to Wnt-induced transcription by participating in histone methylation changes. Alternatively Pygo/BCL9-binding to dimethylated H3K4 may provide a separate β-catenin anchor on chromatin, thereby freeing TCF for interaction with Groucho to pause/terminate transcription (Mosimann et al., 2009); (v) Pygo function is not required when Groucho activity is absent, suggesting that Pygo acts as an anti-repressor (Mieszczanek et al., 2008). Therefore either a single biochemical mechanism of Pygo underlies these diverse observations, or multiple functional properties of Pygo participate in β-catenin signaling. …

Nuclear functions of “cytoplasmic” Wnt signaling components

APC also acts directly on chromatin/WREs to antagonize β-catenin-mediated gene activation via promoting the exchange of co-activators with co-repressors in a stepwise and oscillating manner, as such exchange does not occur in APC mutant cancer cells (Sierra et al., 2006). How APC is recruited to chromatin is a mystery but is unlikely due to β-catenin/TCF, because APC and TCF bind to β-catenin in a mutually exclusive manner. GSK3 and β-Trcp also appear to be associated with the WRE in a cyclic fashion that synchronizes with APC but is opposite to that of β-catenin/co-activators, suggesting that they may have negative roles in TCF/β-catenin-mediated transcription (Sierra et al., 2006). Some studies have also suggested that Dvl is observed in the nucleus (Itoh et al., 2005Torres and Nelson, 2000) and that nuclear Dvl is a component of the TCF/β-catenin complex and facilitates TCF/β-catenin interaction in conjunction with the c-Jun transcription factor (Gan et al., 2008). …

β-catenin-mediated repression and other transcriptional events

Wnt signaling, via the TCF/β-catenin complex, also represses transcription. Note that this is distinct from TCF-mediated repression in the absence of β-catenin. One mechanism is competitive repression, through which TCF/β-catenin displaces or inhibits other DNA-binding transcription activators (Kahler and Westendorf, 2003Piepenburg et al., 2000). Another mechanism is direct repression via TCF/β-catenin binding to the canonical WREs by recruiting co-repressors (Jamora et al., 2003Theisen et al., 2007). A third mechanism is revealed by a novel TCF binding element, AGAWAW, which specifically mediates TCF/β-catenin repression in Drosophila (Blauwkamp et al., 2008). There is evidence that β-catenin is capable of recruiting co-repressors including Groucho/TLE and histone deacetylases (Olson et al., 2006), but the mechanism by which β-catenin recruits co-activators versus co-repressors is unknown. The involvement of co-factors (Theisen et al., 2007) or distinct TCF/β-catenin configurations offers potential explanations. A less understood aspect of β-catenin signaling is that many DNA-binding transcription factors, in addition to TCF/LEF, interact with β-catenin to either activate or repress transcription (Supplemental Table 1b). These β-catenin partners in principle expand significantly the gene expression programs that are regulated by Wnt/β-catenin signaling, but further substantiation of their roles in mediating Wnt signaling is required.

Wnt/β-catenin target genes and Wnt pathway self-regulation

As Wnt/β-catenin signaling regulates proliferation, fate specification and differentiation in numerous developmental stages and adult tissue homeostasis, Wnt target genes are diverse (Vlad et al., 2008) and cell- and context-specific (Logan and Nusse, 2004). An emerging feature is that Wnt signaling components including Fz, LRP6, Axin2, TCF/LEF, Naked (a Dvl antagonist), Dkk1, and Rspo, are often regulated positively or negatively by TCF/β-catenin (Chamorro et al., 2005Kazanskaya et al., 2004Khan et al., 2007Logan and Nusse, 2004). Wnt induction of Axin2, Dkk1 and Naked and suppression of Fz and LRP6 constitute negative feedback loops that dampen Wnt signaling, and the suppression of Fz and LRP6 also enhances Wg/Wnt gradient formation over longer distances (Logan and Nusse, 2004). On the contrary, Wnt induction of Rspo and TCF/LEF genes constitute positive feed-forward circuits that reinforce Wnt signaling, a feature that has been exploited during colon carcinogenesis (Arce et al., 2006Hoppler and Kavanagh, 2007). These various Wnt pathway self-regulatory loops are mostly utilized in a cell-specific manner, affording additional complexity in the control of amplitude and duration of Wnt responses. …

Wnt/β-catenin signaling in diseases and potential therapeutics

Give the critical roles of Wnt/β-catenin signaling in development and homeostasis it is no surprise that mutations of the Wnt pathway components are associated with many hereditary disorders, cancer and other diseases (Table 1). …

LRP5 activity correlates with bone mass likely via regulation of osteoblast (bone forming cell) proliferation, whereas SOST and DKK1, which are specifically expressed in osteocytes, negatively regulates bone mass by antagonizing LRP5. …

Association of deregulated Wnt/β-catenin signaling with cancer has been well documented, particularly with colorectal cancer (Polakis, 2007) (Table 1). Constitutively activated β-catenin signaling, due to APC deficiency or β-catenin mutations that prevent its degradation, leads to excessive stem cell renewal/proliferation that predisposes cells to tumorigenesis. Indeed APC deletion or β-catenin activation in stem cells is essential for intestinal neoplasia (Fuchs, 2009). Blocking β-catenin signaling for cancer treatment has thus generated significant interests. Indeed the beneficial effect of non-steroidal anti-inflammatory drugs (NSAIDS) in colorectal cancer prevention and therapy has been attributed partially to the perturbation of TCF/β-catenin signaling through the ability of NSAIDS to inhibit Prostaglandin E2 production, which enhances TCF/β-catenin-dependent transcription (Castellone et al., 2005Shao et al., 2005). Small molecules that disrupt TCF/β-catenin (Lepourcelet et al., 2004) or β-catenin/co-activator (CBP) interaction (Emami et al., 2004) and thereby block TCF/β-catenin signaling have been described. The task of disrupting TCF/β-catenin interaction specifically, however, is a difficult one since β-catenin interacts with TCF and other binding partners such as APC, Axin and E-cadherin via the same or overlapping interface (Barker and Clevers, 2006). Another potential therapeutic target is the kinase CDK8, which, as a Mediator subunit, is often amplified in and is required for β-catenin-dependent transcription and proliferation of colon cancer cells (Firestein et al., 2008Morris et al., 2008). A new class of small molecules that inhibits β-catenin signaling has recently be identified (Chen et al., 2009), which via an unknown mechanism stabilizes the Axin protein, thereby promoting β-catenin degradation even in cancer cells that lack APC function. As discussed above, since Axin protein levels are the rate-limiting step for β-catenin degradation, manipulation of Axin stabilization represents a promising therapeutic strategy.

Many cancers that do not harbor mutations in the Wnt pathway nonetheless rely on autocrine Wnt signaling for proliferation or survival (Barker and Clevers, 2006). In fact APC mutant colon cancer cells maintain their dependence on Wnt and epigenetically silence the expression of secreted Wnt antagonists (He et al., 2005;Suzuki et al., 2004). Therefore targeting Wnt signaling upstream of TCF/β-catenin is also an important therapeutic option. Reagents against Wnt proteins such as antibodies (He et al., 2005) or a secreted Fz extracellular domain (DeAlmeida et al., 2007), which act outside the cancer cells to block Wnt-receptor interaction, show promise in certain experimental settings, as do small molecule and peptide inhibitors that antagonize Fz-Dvl interaction (Shan et al., 2005Zhang et al., 2009). Small molecules have also been identified that inhibit Porcupine and thus prevent Wnt lipidation and secretion (Chen et al., 2009). We will likely see additional molecular and chemical agents that can interfere with different steps of Wnt/β-catenin signaling, whose complexity presents many potential therapeutic targets. The challenge will be ensuring that these agents target cancer cells without damaging normal tissue homeostasis.

Since the discovery of the Wnt-1 gene 27 years ago (Nusse and Varmus, 1982), Wnt/β-catenin signaling has cemented its role as a key regulatory system in biology. Studies of different animal models and human diseases have established a complex Wnt signaling network far beyond a linear pathway, with many components having multiple distinct roles and acting in different cellular compartments, and many modulators feeding into and cross-regulating within this network. The patterns of dynamic and kinetic protein phosphorylation/modification and complex assembly/disassembly are beginning to emerge. Challenges and excitement both lie ahead. (i) Novel regulators will likely continue to be identified using classical genetic, molecular, modern genomic and proteomic approaches. (ii) New analytical and imaging technologies should enable us to dissect and visualize the dynamic signaling events in vivo and to shed light on the cell biological aspects of Wnt signaling, including where, when and how signaling occurs inside the cell. (iii) Although we have obtained significant structural information on individual domains and protein interaction interfaces, atomic structures of protein complexes such as the Axin complex and ligand-receptor complexes remain daunting challenges. (iv) Additional specific small molecular inhibitors or activators with defined targets and mechanisms would provide not only leads for therapeutics but also research tools to manipulate the Wnt pathway in precise temporal and spatial manners. (v) Integration of vast amounts of information into quantitative models will allow us to predict the behavior and to study the robustness and evolvability of Wnt signaling in various biological contexts. (vi) The Wnt responsive transcriptome remains a gold mine for digging into Wnt-regulated biology. Unfolding examples include Wnt regulation of intestinal and hair follicle development/homeostasis, which has provided significant insights into stem cell biology and cancer pathogenesis (Clevers, 2006Fuchs, 2009). As β-catenin is a co-activator for other transcription factors in addition to TCF/LEF, comparative analyses of Wnt responsive transcription programs that depend on TCF/LEF versus others will likely uncover further complexity of Wnt-regulated gene expression. (vii) β-catenin and APC are also key components in the E-cadherin cell adhesion complex and the microtubule network, but how Wnt/β-catenin signaling interacts with these cellular structures remains poorly understood. In addition, the involvement of the primary cilium, a centrosome- and microtubule-based protrusive organelle in vertebrate cells, in Wnt/β-catenin versus non-canonical Wnt signaling remains an intriguing but debated topic (Gerdes et al., 2009).

Since the discovery of the Wnt-1 gene 27 years ago (Nusse and Varmus, 1982), Wnt/β-catenin signaling has cemented its role as a key regulatory system in biology. Studies of different animal models and human diseases have established a complex Wnt signaling network far beyond a linear pathway, with many components having multiple distinct roles and acting in different cellular compartments, and many modulators feeding into and cross-regulating within this network. The patterns of dynamic and kinetic protein phosphorylation/modification and complex assembly/disassembly are beginning to emerge. Challenges and excitement both lie ahead. (i) Novel regulators will likely continue to be identified using classical genetic, molecular, modern genomic and proteomic approaches. (ii) New analytical and imaging technologies should enable us to dissect and visualize the dynamic signaling events in vivo and to shed light on the cell biological aspects of Wnt signaling, including where, when and how signaling occurs inside the cell. (iii) Although we have obtained significant structural information on individual domains and protein interaction interfaces, atomic structures of protein complexes such as the Axin complex and ligand-receptor complexes remain daunting challenges. (iv) Additional specific small molecular inhibitors or activators with defined targets and mechanisms would provide not only leads for therapeutics but also research tools to manipulate the Wnt pathway in precise temporal and spatial manners. (v) Integration of vast amounts of information into quantitative models will allow us to predict the behavior and to study the robustness and evolvability of Wnt signaling in various biological contexts. (vi) The Wnt responsive transcriptome remains a gold mine for digging into Wnt-regulated biology. Unfolding examples include Wnt regulation of intestinal and hair follicle development/homeostasis, which has provided significant insights into stem cell biology and cancer pathogenesis (Clevers, 2006Fuchs, 2009). As β-catenin is a co-activator for other transcription factors in addition to TCF/LEF, comparative analyses of Wnt responsive transcription programs that depend on TCF/LEF versus others will likely uncover further complexity of Wnt-regulated gene expression. (vii) β-catenin and APC are also key components in the E-cadherin cell adhesion complex and the microtubule network, but how Wnt/β-catenin signaling interacts with these cellular structures remains poorly understood. In addition, the involvement of the primary cilium, a centrosome- and microtubule-based protrusive organelle in vertebrate cells, in Wnt/β-catenin versus non-canonical Wnt signaling remains an intriguing but debated topic (Gerdes et al., 2009).

Finally the study of Wnt signaling in human diseases, and in stem cell biology and regeneration holds promises for translational medicine. In addition to cancer and osteoporosis, both of which will likely see Wnt signaling-based therapeutics moving into clinical trials or even clinics in the near future, potential links between neurological diseases (De Ferrari and Moon, 2006) and a Schizophrenia susceptibility gene product (Mao et al., 2009) to Wnt/β-catenin signaling offer new hopes for the treatment of neurological and psychiatric disorders. Manipulation of Wnt signaling for stem cell regulation also offers exciting opportunities for regenerative medicine (Clevers, 2006Fuchs, 2009Goessling et al., 2009Willert et al., 2003). A better understanding of Wnt/β-catenin signaling will have broad impact on biology and medicine.

7.10.6 Wnt.β-Catenin Signaling. Turning the Switch

Cadigan KM1.
Dev Cell. 2008 Mar; 14(3):322-3
http://dx.doi.org/10.1016/j.devcel.2008.02.006

The regulation of many targets of the Wnt/β-catenin signaling pathway is thought to occur through a transcriptional switch that is achieved by β-catenin binding to TCF transcription factors. Recent work indicates that β-catenin’s intrinsic affinity for TCF is not sufficient for the switch to occur.

The Wnt/β-catenin signaling pathway plays many crucial roles in specifying cell fates during animal development and in regenerating adult tissues. In addition, this pathway is linked to several pathological states, most notably colorectal cancer. Many of the transcriptional responses to Wnt/β-catenin signaling are mediated by the TCF/LEF-1 (TCF) family of transcription factors. Several TCFs are known to repress Wnt targets in the absence of signaling, but upon pathway activation, β-catenin enters the nucleus and binds to TCF on the target chromatin, creating a transcriptional activation complex. Is β-catenin’s intrinsic affinity for TCF sufficient to switch TCF from the repression to the activation state? Two recent papers shed some light on this question. One reports that two previously characterized co-repressor subunits bind to β-catenin and are required to stabilize the β-catenin-TCF interaction. The other suggests that this interaction may be regulated by ubiquitination of APC, a well-known negative regulator of the Wnt/β-catenin pathway.

The first report from Li and Wang (2008) concerns Transducin β-like protein 1 (TBL1) and TBL1-related protein (TBLR1). These proteins are components of the SMRT-nuclear receptor corepressor (N-CoR) complex, where they have been shown to recruit E3 ubiquitin ligases to facilitate the replacement of corepressors with coactivators (Perissi et al., 2004). Similarly, the Drosophila homolog of TBL1, known as Ebi, facilitates proteosomal degradation of the fly N-CoR homolog SMRTER ( Tsuda et al., 2002). In addition, TBL1 binds to the E3 ubiquitin ligase components Siah-1 and Skp1 to promote β-catenin degradation ( Matsuzawa and Reed, 2001). Despite the extensive connections between TBL1, TBLR1, and proteosomal degradation, Li and Wang (2008) found no evidence for these proteins influencing β-catenin turnover in their system. In addition, the proteosome does not appear to contribute to the function of TBL1 and TBLR1 in promoting Wnt/β-catenin signaling.

Using siRNA, Li and Wang found that TBL1 and TBLR1 are required for activation of several targets by Wnt signaling in cell culture. Both proteins interact with β-catenin in coimmunoprecipitation assays. When TBL1 or TBLR1 are depleted, the pathway still promotes nuclear accumulation of β-catenin, but its recruitment to Wnt response element (WRE) chromatin is dramatically reduced. Conversely, TBL1 and TBLR1 are recruited to several WREs in a Wnt- and β-catenin-dependent manner. Thus, binding of β-catenin, TBL1, and TBLR1 to WREs is mutally dependent. Interestingly, TBL1 (but not TBLR1) can be immunoprecipitated by TCF4, and TBL1 is present at some WREs even in the absence of Wnt stimulation. This suggests a model where interactions between TBL1, TCFs, and β-catenin reinforce the complex on WREs, which is required for subsequent recruitment of transcriptional coactivators necessary to activate target gene expression (see Figure 1).

 role-of-tbl1-tblr1-and-trabid-in-tcf-ceb2-catenin-gene-regulation


role-of-tbl1-tblr1-and-trabid-in-tcf-ceb2-catenin-gene-regulation

Role of TBL1-TBLR1 and Trabid in TCF-β-Catenin Gene Regulation

http://ars.els-cdn.com/content/image/1-s2.0-S1534580708000762-gr1.jpg

Figure 1. Speculative Model on the Role of TBL1-TBLR1 and Trabid in TCF-β-Catenin Gene Regulation

In the absence of signaling (top panel), a TCF-corepressor complex silences target gene expression. When Wnt signaling causes nuclear accumulation of β-catenin (bottom panel), TBL1 and TBLR1 help recruit β-catenin to TCF at target loci, which nucleates a complex of transcriptional coactivators. APC can inhibit the TCF-β-catenin complex, and Trabid’s positive role in the pathway can be explained by its ability to regulate the ubiquitination state of APC.

This report extends the importance of TBL1 and TBLR1 in Wnt/β-catenin gene regulation in two important ways. First, the key findings were reproduced in Drosophila cell culture. Second, the authors demonstrate that depletion of TBL1 or TBLR1 greatly reduced activation of Wnt targets in a well-characterized colorectal cell line lacking functional APC. This decrease in target gene activation had a striking effect on the ability of these cells to grow on soft agar. In addition, the invasive nature of head and squamous cell carcinoma cells transfected with β-catenin was greatly curtailed by TBL1 or TBLR1 knockdown, as was the growth of these cells into tumors in nude mice. These results clearly demonstrate both the evolutionary conservation of these factors in the pathway and suggest that strategies to interfere with their function might have great therapeutic value.

While most reports (and reviews) focus on the TCF transcriptional switch from the “OFF” to the “ON” state, it is also interesting to consider how the switch works in reverse. For example, a colorectal cell line lacking functional APC can be stably transfected with an inducible full-length APC gene. Without induction, β-catenin is bound to WREs and Wnt target expression is high. Upon induction of APC, Jones and coworkers found that β-catenin and coactivators are rapidly replaced by corepressors at the WRE (Sierra et al., 2006). Interestingly, APC transiently occupies the WRE during this switch. A recent report from Bienz and coworkers (Tran et al., 2008) suggests that ubiquitination of APC may influence its ability to regulate the TCF-β-catenin complex.

This group identified an APC-interacting protein they call Trabid, which contains three tandem Npl4 zinc (NZF) fingers and an ovarian tumor (OTU) domain. They demonstrated that the OTU domain contains a deubiquitylating (DUB) activity that shows marked preference for K63-linked ubiquitin chains. When Trabid is depleted from cells by siRNA, activation of several Wnt targets is reduced, and rescue experiments indicate that both the NZF and OTU domains are required for Trabid’s positive role in Wnt signaling. Epitasis analysis indicates that Trabid is required downstream of β-catenin stabilization but is dispensible for TCF fusion proteins containing transactivation domains. This suggests that Trabid may influence the formation or dynamics of TCF-β-catenin complexes.

7.10.7 Wnt–β-catenin signaling

Tetsu Akiyama
Cyokine & GF Rev Dec 1, 2000; 11(4):273–282
http://dx.doi.org/10.1016/S1359-6101(00)00011-3

The Wnt/Wingless signaling transduction pathway plays an important role in both embryonic development and tumorigenesis. β-Catenin, a key component of the Wnt signaling pathway, interacts with the TCF/LEF family of transcription factors and activates transcription of Wnt target genes. Recent studies have revealed that a number of proteins such as, the tumor suppressor APC and Axin are involved in the regulation of the Wnt signaling pathway. Furthermore, mutations in APC or β-catenin have been found to be responsible for the genesis of human cancers.

7.10.8 Extracellular modulators of Wnt signaling

Boudin E1Fijalkowski IPiters EVan Hul W.
Semin Arthritis Rheum. 2013 Oct; 43(2):220-40
http://dx.doi.org:/10.1016/j.semarthrit.2013.01.004

Objectives: The Wnt signaling pathway is a key pathway in various processes, including bone metabolism. In this review, current knowledge of all extracellular modulators of the canonical Wnt signaling in bone metabolism is summarized and discussed. Methods: The PubMed database was searched using the following keywords: canonical Wnt signaling, β-catenin bone metabolism, BMD, osteoblast, osteoporosis, Wnt, LRPs, Frizzleds, sFRPs, sclerostin or SOST, dickkopfs, Wif1, R-spondins, glypicans, SOST-dc1 and kremen, all separately as well as in different combinations.
Results: Canonical Wnt signaling is considered to be one of the major pathways regulating bone formation. Consequently, a large number of studies were performed to elucidate the role of numerous proteins in canonical Wnt signaling and bone metabolism. These studies led to the identification of novel modulators of the pathway like the R-spondin and glypican protein families. Furthermore novel insights are gained in the regulatory role of the different Wnt proteins. Finally, due to its function in bone formation, the pathway is an interesting target for the development of therapeutics for osteoporosis and other bone diseases. In this review, we discuss the promising results of the Wnt modulators sclerostin, Dkk1 and sFRP1 as targets for osteoporosis treatment.
Conclusion: The increasing number of studies into the exact function of all proteins in the canonical Wnt pathway in general and in bone metabolism already led to novel insights in the regulation of the canonical Wnt pathway. In this review we covered the current knowledge of all extracellular modulators of canonical Wnt signaling.

Fig 1. Activators and inhibitors of the Wnt/b-catenin signaling pathway.
(a) Lipid-modified Wnt protein (green; palmitoleoyl group is shown in red) binds to Frizzled CRD, LRP6 b-propellers 1–2 and/or 3–4, and triggers downstream signaling. CRD of Wnt receptor Frizzled8
is shown in light blue, four b propellers of  co-receptor LRP6 are shown in dark blue. Hinge region between b-propellers 1–2 and 3–4 is shown as a blue dot. Dimeric signaling activator Norrin (monomers
shown in magenta and grey) binds specifically to Frizzled4 (grey) and LRP6 b-propellers 1–2. Dotted lines represent interactions between molecules where crystal structures of the complexes are absent.
(b) Extracellular inhibitors bind to Wnt co-receptor LRP6 or Wnt and prevent them from triggering signalling. Both Sclerostin and Dickkopf  (Dkk) contain an Asn-X-Ile motif (peptide shown as
connected yellow spheres) recognized by LRP6 b-propeller 1.  The C-terminal domain of Dkk1 (red) binds to LRP6 b-propeller 3.  WIF1 (pink; WIF1-bound DPPC, light blue) and secreted Frizzled
related protein 3 (sFRP3 CRD, teal) prevent signaling by binding to Wnts. WIF1 binds to HS chains of HSPGs (grey). Sclerostin (as well as other activators and inhibitors) bind to HS-mimic, heparin.
Signaling inhibitor 5T4/Wnt-activated inhibitory factor 1 (WAIF1, purple) acts via unknown binding partners.

Fig 2. Atomic details of Wnt recognition and signaling inhibition.
(a) Zoom-in view of the palmitoleoyl binding site in the CRD of Frizzled8. Molecules are colored as in Figure 1. The Ser187-linked palmitoleoyl group is shown as connected red spheres. Frizzled8 CRD
residues forming the hydrophobic groove are shown as sticks (carbon, blue; oxygen, red) and numbered. Boundaries of the lipid-binding groove are marked with grey lines.
(b) WIF domain of WIF-1 forms a hydrophobic pocket which accommodates DPPC (carbon, grey; oxygen, red; phosphorus, orange; nitrogen, blue). The head group of DPPC is exposed to the solvent
and located proximal to the putative Wnt3a binding site.
(c) The first b propeller of LRP6 recognizes an evolutionarily conserved tripeptide motif Asn-X-Ile (X, variable amino acid) present in two inhibitors of  Wnt signaling, Dickkopf1 and Sclerostin. A peptide
derived from human Sclerostin (residues Leu115–Arg121) is shown as sticks (carbon, yellow; oxygen, red; nitrogen, blue).

Regulation of Wnt signaling by R-spondin and its receptors.

(a) Transmembrane ubiquitin (Ub, shown in grey) E3 ligases ZNRF3 (brown) and RNF43 (red) ubiquitinylate Frizzled thus promoting its endocytosis and inhibition of
Wnt signalling. Cytoplasmic regions of both ligases contain RING domains required for ubiquitinylation. The extracellular domains of ZNRF3 form weak dimers in
solution (protomers are shown in brown and grey, respectively; [36]).
(b) R-spondin 1 (RSPO1, green) forms a ternary complex with RNF43 and LGR5 (blue) [35]. Endocytosis of RNF43 and ZNRF3 in complex with RSPOs and LGRs
4–6 prevents ubiquitinylation of Frizzled and promotes Wnt signaling. Dotted lines represent interactions between molecules where crystal structures of complexes
are not determined.

Conclusions and future perspectives

Tremendous progress has been made in structural studies of  Wnt signaling receptors and modulators during the past five years. A series of structures of the Wnt co-receptor LRP6, agonists and
antagonists, and, remarkably, the first crystal structure of a Wnt family member, Wnt8, in complex with the Frizzled8 CRD, provide invaluable insights into the basic mechanisms of Wnt
signaling activation and regulation. In 2012, a novel mechanism of Wnt signaling regulation was discovered which centers on the interactions of the ZNRF3/RNF43 E3 ubiquitin ligases,
the R-spondins and LGR4/5/6.

7.10.9 FOXO3a modulates WNT.β-catenin signaling and suppresses epithelial-to-mesenchymal transition in prostate cancer cells

Liu H1Yin J1Wang H2Jiang G3Deng M1Zhang G2Bu X2Cai S4Du J5He Z6.
Cell Signal. 2015 Mar; 27(3):510-8
http://dx.doi.org:/10.1016/j.cellsig.2015.01.001

Highlights

  • FOXO3a inhibits β-catenin expression through transactivating miR-34b/c.
  • FOXO3a direct binds to β-catenin.
  • FOXO3a inhibits β-catenin/TCF transcriptional activity.
  • FOXO3a inhibit EMT in prostate cancer cells.
  • β-catenin as a regulator of FOXO3a-mediated suppression of EMT.

Emerging evidence has revealed a negative correlation between Forkhead box-O (FOXO) expression and prostate cancer grade and spread, indicating its role as a suppressor of prostate cancer metastasis. However, there is still incomplete understanding about the role of FOXO transcription factors in prostate cancer progression. In this investigation, we demonstrate that FOXO3a significantly inhibits the expression β-catenin in prostate cancer cells. The mechanism of inhibiting β-catenin expression involves the FOXO3a-mediated transactivated microRNA-34b/c, which consequently suppressed β-catenin mRNA expression by targeting the untranslated regions (UTRs) of β-catenin. Additionally, FOXO3a can directly bind to β-catenin, and competes with TCF for interaction with β-catenin, thereby inhibiting β-catenin/TCF transcriptional activity and reducing the expression of β-catenin target genes. Furthermore, prostate cancer cells expressing FOXO3a shRNAs display mesenchymal characteristics, including enhanced cell migration and differential regulation of the EMT markers, whereas knockdown of β-catenin results in reversal of shFOXO3a-mediated EMT phenotypic changes. Collectively, these observations demonstrated that FOXO3a inhibits malignant phenotypes that are dependent on β-catenin-dependent modulation of EMT-related genes, and provided fresh insight into the mechanisms by which a FOXO3a-miR-34b/c axis restrains canonical β-catenin signaling cascades in prostate cancer cell.

Fig.1. FOXO3a activation correlates with downregulation of β-catenin expression in prostate cancer cells. (A) PC3 and DU145 cells were treated with LY294002 for 48h, and Western blot was performed to assess p-FOXO3a, total FOXO3a, and β-catenin expression compared with that of the control cells.(B,C) The PC3 and DU145 cells were transfected with FOXO3a overexpressing and si-FOXO3a knockdown vectors; the mRNA expression (B) and protein expression (C) of β-catenin were assessed by real-time RT-PCR and Western blot, respectively. (D) PC3 cells were transfected with FOXO3a overexpressing vector, immunofluorescence images from PC3 cells stained for FOXO3aand β-catenin. DNA is stained with 4,6-diamidino2-phenylindole (DAPI, blue).Data were presentedasmeans± SDof three independent experiments. *Significant difference from control values with P b 0.05.

Fig.2.FOXO3a inhibits β-catenin expression by modulating miR-34 expression. (A) The miR-34b/c promoter contains consensus FOXO binding sites. miR-34b and miR-34c are encoded by one primary transcript (BC021736). Putative FOXO binding sites were identified at positions−1518,−1512,−1223,and−185 relative to the transcription start site.(B)FOXO3abinds to the BC021736 promoter in vivo. PC3 cells were infected with pCMV-FOXO3a. DNA-bound proteins were crosslinked to chromatin, and FOXO3a was immunoprecipitated with an antibody directed against FOXO3a. Rabbit IgG immune serum was used as IP control. Immunoprecipitated DNA-fragments were amplified by PCR with primers specific for theputative FOXO3 a consensus binding sites(−1518/12,−1223,−185) or a control region.Data are plotted aspercentage ofinput DNA ± SD. (C, D)The PC3 cells were transfectedwith FOXO3a overexpressing(C)andsi-FOXO3aknockdownvectors(D),themRNAexpressionofmiR-34wereassessedbyreal-timeRT-PCR.(E)RealtimeRT-PCRanalysesofβ-cateninmRNAexpression levelswereperformedinPC3 cells 48h after transfectionwith control,miR-34b, ormiR-34cmimics. (F)ThePC3 cells were transfected with pCMV-FOXO3a, anti-miR-34c, pCMVFOXO3a and anti-miR-34c, respectively; or shFOXO3a, miR-34c mimics, shFOXO3a and miR-34c mimics, respectively, the protein expression of FOXO3a and β-catenin were analyzed by Western blot. Data were presented as means± SD of three independent experiments. *Significant difference from control valueswith P < 0.05.

Fig.3. FOXO3a binds to β-catenin, reduces binding of β-Catenin to TCF, and inhibits β-Catenin/TCF-dependent transcription. (A) Total protein extracts of PC3 and DU145 cells were subjected to IP using FOXO3a antibody or control IgG, followed by IB with β-cateninantibody (upper panels). Reciprocal IP was done using β-catenin antibody or control IgG, followed by IB with the FOXO3a antibody (lower panels). (B) Lysates of PC3 cells that stably express FOXO3a or a control vector were subjected to IPusing FOXO3a antibodies, followed by IB with β-catenin antibody.(C) Lysates of PC3 cells that stably express FOXO3a or a control vector were subjected to IP using TCF4 antibodies, followed by IB with β-catenin antibody. Reciprocal IP was done using β-catenin antibody or control IgG, followed by IB with the TCF4 antibody. (D) TOP flash and FOP flash firefly luciferase expression vectors were co-transfected with control, pCMV-FOXO3a, and pCMV-β-catenin plasmid in PC3 cells, and TOP flash activity was measured. (E) PC3 cells were transfected with pCMV-FOXO3a plasmid, or FOXO3 as hRNA, the differential expression of potential β-catenin target genes are shown in the heat map.Data were presented as means±SD of three independent experiments.**Significant difference from control values with P<b 0.01

http://ars.els-cdn.com/content/image/1-s2.0-S0898656815000030-fx1.sml

Aurelian Udristioiu

Aurelian

Aurelian Udristioiu

Lab Director at Emergency County Hospital Targu Jiu

Some studies showed that patients with cancer make
antibodies against p53 proteins, but the frequency and
magnitude of this response is still under debate (Vojtesek
et al., 1995). However, a large number of patients with
cancer did produce p53-reactive T cells (Van der Burg et
al., 2001).
The results from these studies served as a good
reason to attempt the vaccination of patients using p53-
derived peptides, and a several clinical trials are currently
in progress. The most advanced work used a long
synthetic peptide mixture derived from p53 (p53-SLP; ISA
Pharmaceuticals, Bilthoven, the Netherlands) (Speetjens
et al., 2009; Shangary et al., 2008; Van der Burg et al.,
* The vaccine is delivered in the adjuvant setting
and induces T helper type cells.

UPDATE 10/10/2021

WNT/β-catenin pathway activation correlates with immune exclusion across human cancers

Source: Luke JJ, Bao R, Sweis RF, Spranger S, Gajewski TF. WNT/β-catenin Pathway Activation Correlates with Immune Exclusion across Human Cancers. Clin Cancer Res. 2019;25(10):3074-3083. doi:10.1158/1078-0432.CCR-18-1942

Abstract

Background:

The T cell-inflamed phenotype correlates with efficacy of immune-checkpoint blockade while non-T cell-inflamed tumors infrequently benefit. Tumor-intrinsic WNT/β-catenin signaling mediates immune exclusion in melanoma, but association with the non-T cell-inflamed tumor microenvironment in other tumor types is not well understood.

Methods:

Using The Cancer Genome Atlas (TCGA), a T cell-inflamed gene expression signature segregated samples within tumor types. Activation of WNT/β-catenin signaling was inferred using three approaches: somatic mutations or somatic copy number alterations (SCNAs) in β-catenin signaling elements including CTNNB1, APC, APC2, AXIN1, AXIN2; pathway prediction from RNAseq gene expression; and inverse correlation of β-catenin protein levels with the T cell-inflamed gene expression signature.

Results:

Across TCGA, 3137/9244 (33.9%) tumors were non-T cell-inflamed while 3161/9244 (34.2%) were T cell-inflamed. Non-T cell-inflamed tumors demonstrated significantly lower expression of T cell inflammation genes relative to matched normal tissue, arguing for loss of a natural immune phenotype. Mutations of β-catenin signaling molecules in non-T cell-inflamed tumors were enriched three-fold relative to T cell-inflamed tumors. Across 31 tumors, 28 (90%) demonstrated activated β-catenin signaling in the non-T cell-inflamed subset by at least one method. This included target molecule expression from somatic mutations and/or SCNAs of β-catenin signaling elements (19 tumors, 61%), pathway analysis (14 tumors, 45%), and increased β-catenin protein levels (20 tumors, 65%).

Conclusions:

Activation of tumor-intrinsic WNT/β-catenin signaling is enriched in non-T cell-inflamed tumors. These data provide a strong rationale for development of pharmacologic inhibitors of this pathway with the aim of restoring immune cell infiltration and augmenting immunotherapy.

Introduction

Immunotherapies targeting immune checkpoints have contributed to a marked improvement in treatment outcomes in patients with advanced cancer. In melanoma, anti-cytotoxic T lymphocyte antigen 4 (CTLA-4) and anti-programmed death 1 (PD-1) antibodies have demonstrated robust response rates with years of durability in some patients(,) and improvement in overall survival(,). Significant clinical activity of PD-1-targeting agents has led to FDA approval in multiple additional cancer entities. Despite this broad activity, only a subset of patients benefits from treatment within each cancer subtype, and molecular mechanisms to explain primary resistance in these patients remain incompletely understood.

High expression of specific immune cell genes in the tumor microenvironment, described as the T cell-inflamed phenotype, has been observed to correlate with response to multiple immunotherapies including therapeutic vaccines and checkpoint blocking antibodies(,). Conversely, the non-T cell inflamed tumor microenvironment appears to closely associate with lack of clinical benefit to immunotherapy, particularly with anti-PD-1 antibodies(,). Categorization of tumors using transcriptional profiles marking the T cell-inflamed gene expression signature is advantageous as it can define biologically relevant patient sub-populations and set a framework in which to investigate hypothetical mechanisms for primary immunotherapy resistance.

Although multiple molecular mechanisms could theoretically disfavor a T cell-inflamed microenvironment, several lines of investigation have indicated that specific oncogenic molecular aberrations can be sufficient to drive this immune exclusion phenotype in some cases. Tumor cell-intrinsic WNT/β-catenin signaling in melanoma was the first somatic alteration associated with the non-T cell-inflamed tumor microenvironment in patients, and was demonstrated to be causal using a genetically-engineered mouse model(). The mechanism of this effect appears to be through transcriptional repression of key chemokine genes that leads to lack of Batf3-lineage dendritic cell recruitment and subsequent failure to prime and recruit CD8+ T cells(,). This effect is dominant in the tumor microenvironment and leads to loss of therapeutic efficacy of checkpoint blockade, tumor antigen vaccination, and adoptive T cell transfer immunotherapy approaches preclinically(,). While the above studies of tumor-intrinsic WNT/β-catenin signaling have been evaluated in the context of melanoma, the impact of this pathway in driving the non-T cell-inflamed tumor microenvironment in other tumor types are increasingly being recognized. In syngeneic murine models of B16F10 melanoma, 4T1 mammary carcinoma, Neuro2A neuroblastoma, and Renca renal adenocarcinoma, blocking β-catenin pathway signaling via RNA interference resulted in influx of CD8+ T cells and increase in interferon-γ-associated gene targets(). Subsequent combination with immunotherapy yielded complete regressions in the majority of treated animals. More broadly, roles for WNT/β-catenin signaling impacting on the immune system via development and function, active immune exclusion by tumor cells and cancer immunosurveillance are being recognized and accepted across cancer types().

To investigate the influence of WNT/β-catenin signaling across cancers, we performed an integrative analysis of The Cancer Genome Atlas (TCGA) separating individual tumors by T cell-inflamed status and identifying β-catenin pathway activation on three levels. We find that most tumor types within TCGA are enriched for activation of WNT/β-catenin signaling in non-T cell-inflamed tumors. These observations suggest pharmacologic targeting of this pathway could have broad implications for improving immunotherapy efficacy.

Editors note:  Although the majority of mutations in the WNT signaling pathway in cancer have been in the APC gene, this study, although bioinformatic in nature, shows good correlate between other pathway mutations and immune infiltrate. It is interesting to also note that tumor utational burden is the approved biomarker for immune checkpoint inhibitor efficacy.

Read Full Post »

Hypoxia Inducible Factor 1 (HIF-1)

Writer and Curator: Larry H Bernstein, MD, FCAP

7.9  Hypoxia Inducible Factor 1 (HIF-1)

7.9.1 Hypoxia and mitochondrial oxidative metabolism

7.9.2 Hypoxia promotes isocitrate dehydrogenase-dependent carboxylation of α-ketoglutarate to citrate to support cell growth and viability

7.9.3 Hypoxia-Inducible Factors in Physiology and Medicine

7.9.4 Hypoxia-inducible factor 1. Regulator of mitochondrial metabolism and mediator of ischemic preconditioning

7.9.5 Regulation of cancer cell metabolism by hypoxia-inducible factor 1

7.9.6 Coming up for air. HIF-1 and mitochondrial oxygen consumption

7.9.7 HIF-1 mediates adaptation to hypoxia by actively downregulating mitochondrial oxygen consumption

7.9.8 HIF-1. upstream and downstream of cancer metabolism

7.9.9 In Vivo HIF-Mediated Reductive Carboxylation

7.9.10 Evaluation of HIF-1 inhibitors as anticancer agents


7.9.1 Hypoxia and mitochondrial oxidative metabolism

Solaini G1Baracca ALenaz GSgarbi G.
Biochim Biophys Acta. 2010 Jun-Jul; 1797(6-7):1171-7
http://dx.doi.org/10.1016/j.bbabio.2010.02.011

It is now clear that mitochondrial defects are associated with a large variety of clinical phenotypes. This is the result of the mitochondria’s central role in energy production, reactive oxygen species homeostasis, and cell death. These processes are interdependent and may occur under various stressing conditions, among which low oxygen levels (hypoxia) are certainly prominent. Cells exposed to hypoxia respond acutely with endogenous metabolites and proteins promptly regulating metabolic pathways, but if low oxygen levels are prolonged, cells activate adapting mechanisms, the master switch being the hypoxia-inducible factor 1 (HIF-1). Activation of this factor is strictly bound to the mitochondrial function, which in turn is related with the oxygen level. Therefore in hypoxia, mitochondria act as [O2] sensors, convey signals to HIF-1directly or indirectly, and contribute to the cell redox potential, ion homeostasis, and energy production. Although over the last two decades cellular responses to low oxygen tension have been studied extensively, mechanisms underlying these functions are still indefinite. Here we review current knowledge of the mitochondrial role in hypoxia, focusing mainly on their role in cellular energy and reactive oxygen species homeostasis in relation with HIF-1 stabilization. In addition, we address the involvement of HIF-1 and the inhibitor protein of F1F0 ATPase in the hypoxia-induced mitochondrial autophagy.

Over the last two decades a defective mitochondrial function associated with hypoxia has been invoked in many diverse complex disorders, such as type 2 diabetes [1] and [2], Alzheimer’s disease [3] and [4], cardiac ischemia/reperfusion injury [5] and [6], tissue inflammation [7], and cancer [8][9][10],[11] and [12].

The [O2] in air-saturated aqueous buffer at 37 °C is approx. 200 μM [13]; however, mitochondria in vivo are exposed to a considerably lower [O2] that varies with tissue and physiological state. Under physiological conditions, most human resting cells experience some 5% oxygen tension, however the [O2] gradient occurring between the extracellular environment and mitochondria, where oxygen is consumed by cytochrome c oxidase, results in a significantly lower [O2] exposition of mitochondria. Below this oxygen level, most mammalian tissues are exposed to hypoxic conditions  [14]. These may arise in normal development, or as a consequence of pathophysiological conditions where there is a reduced oxygen supply due to a respiratory insufficiency or to a defective vasculature. Such conditions include inflammatory diseases, diabetes, ischemic disorders (cerebral or cardiovascular), and solid tumors. Mitochondria consume the greatest amount (some 85–90%) of oxygen in cells to allow oxidative phosphorylation (OXPHOS), which is the primary metabolic pathway for ATP production. Therefore hypoxia will hamper this metabolic pathway, and if the oxygen level is very low, insufficient ATP availability might result in cell death [15].

When cells are exposed to an atmosphere with reduced oxygen concentration, cells readily “respond” by inducing adaptive reactions for their survival through the AMP-activated protein kinase (AMPK) pathway (see for a recent review [16]) which inter alia increases glycolysis driven by enhanced catalytic efficiency of some enzymes, including phosphofructokinase-1 and pyruvate kinase (of note, this oxidative flux is thermodynamically allowed due to both reduced phosphorylation potential [ATP]/([ADP][Pi]) and the physiological redox state of the cell). However, this is particularly efficient only in the short term, therefore cells respond to prolonged hypoxia also by stimulation of hypoxia-inducible factors (HIFs: HIF-1 being the mostly studied), which are heterodimeric transcription factors composed of α and β subunits, first described by Semenza and Wang [17]. These HIFs in the presence of hypoxic oxygen levels are activated through a complex mechanism in which the oxygen tension is critical (see below). Afterwards HIFs bind to hypoxia-responsive elements, activating the transcription of more than two hundred genes that allow cells to adapt to the hypoxic environment [18] and [19].

Several excellent reviews appeared in the last few years describing the array of changes induced by oxygen deficiency in both isolated cells and animal tissues. In in vivo models, a coordinated regulation of tissue perfusion through vasoactive molecules such as nitric oxide and the action of carotid bodies rapidly respond to changes in oxygen demand [20][21][22][23] and [24]. Within isolated cells, hypoxia induces significant metabolic changes due to both variation of metabolites level and activation/inhibition of enzymes and transporters; the most important intracellular effects induced by different pathways are expertly described elsewhere (for recent reviews, see [25][26] and [27]). It is reasonable to suppose that the type of cells and both the severity and duration of hypoxia may determine which pathways are activated/depressed and their timing of onset [3][6][10][12][23] and [28]. These pathways will eventually lead to preferential translation of key proteins required for adaptation and survival to hypoxic stress. Although in the past two decades, the discovery of HIF-1 by Gregg Semenza et al. provided a molecular platform to investigate the mechanism underlying responses to oxygen deprivation, the molecular and cellular biology of hypoxia has still to be completely elucidated. This review summarizes recent experimental data concerned with mitochondrial structure and function adaptation to hypoxia and evaluates it in light of the main structural and functional parameters defining the mitochondrial bioenergetics. Since mitochondria contain an inhibitor protein, IF1, whose action on the F1F0 ATPase has been considered for decades of critical importance in hypoxia/ischemia, particular notice will be dedicated to analyze molecular aspects of IF1 regulation of the enzyme and its possible role in the metabolic changes induced by low oxygen levels in cells.

Mechanism(s) of HIF-1 activation

HIF-1 consists of an oxygen-sensitive HIF-1α subunit that heterodimerizes with the HIF-1β subunit to bind DNA. In high O2 tension, HIF-1α is oxidized (hydroxylated) by prolyl hydroxylases (PHDs) using α-ketoglutarate derived from the tricarboxylic acid (TCA) cycle. The hydroxylated HIF-1α subunit interacts with the von Hippel–Lindau protein, a critical member of an E3 ubiquitin ligase complex that polyubiquitylates HIF. This is then catabolized by proteasomes, such that HIF-1α is continuously synthesized and degraded under normoxic conditions [18]. Under hypoxia, HIF-1α hydroxylation does not occur, thereby stabilizing HIF-1 (Fig. 1). The active HIF-1 complex in turn binds to a core hypoxia response element in a wide array of genes involved in a diversity of biological processes, and directly transactivates glycolytic enzyme genes [29]. Notably, O2 concentration, multiple mitochondrial products, including the TCA cycle intermediates and reactive oxygen species, can coordinate PHD activity, HIF stabilization, hence the cellular responses to O2 depletion [30] and [31]. Incidentally, impaired TCA cycle flux, particularly if it is caused by succinate dehydrogenase dysfunction, results in decreased or loss of energy production from both the electron-transport chain and the Krebs cycle, and also in overproduction of free radicals [32]. This leads to severe early-onset neurodegeneration or, as it occurs in individuals carrying mutations in the non-catalytic subunits of the same enzyme, to tumors such as phaeochromocytoma and paraganglioma. However, impairment of the TCA cycle may be relevant also for the metabolic changes occurring in mitochondria exposed to hypoxia, since accumulation of succinate has been reported to inhibit PHDs [33]. It has to be noticed that some authors believe reactive oxygen species (ROS) to be essential to activate HIF-1 [34], but others challenge this idea [35], therefore the role of mitochondrial ROS in the regulation of HIF-1 under hypoxia is still controversial [36]. Moreover, the contribution of functional mitochondria to HIF-1 regulation has also been questioned by others [37][38] and [39].

http://ars.els-cdn.com/content/image/1-s2.0-S0005272810000575-gr1.jpg

Major mitochondrial changes in hypoxia

Major mitochondrial changes in hypoxia

Fig. 1. Major mitochondrial changes in hypoxia. Hypoxia could decrease electron-transport rate determining Δψm reduction, increased ROS generation, and enhanced NO synthase. One (or more) of these factors likely contributes to HIF stabilization, that in turn induces metabolic adaptation of both hypoxic cells and mitophagy. The decreased Δψm could also induce an active binding of IF1, which might change mitochondrial morphology and/or dynamics, and inhibit mitophagy. Solid lines indicate well established hypoxic changes in cells, whilst dotted lines indicate changes not yet stated. Inset, relationships between extracellular O2concentration and oxygen tension.

Oxygen is a major determinant of cell metabolism and gene expression, and as cellular O2 levels decrease, either during isolated hypoxia or ischemia-associated hypoxia, metabolism and gene expression profiles in the cells are significantly altered. Low oxygen reduces OXPHOS and Krebs cycle rates, and participates in the generation of nitric oxide (NO), which also contributes to decrease respiration rate [23] and [40]. However, oxygen is also central in the generation of reactive oxygen species, which can participate in cell signaling processes or can induce irreversible cellular damage and death [41].

As specified above, cells adapt to oxygen reduction by inducing active HIF, whose major effect on cells energy homeostasis is the inactivation of anabolism, activation of anaerobic glycolysis, and inhibition of the mitochondrial aerobic metabolism: the TCA cycle, and OXPHOS. Since OXPHOS supplies the majority of ATP required for cellular processes, low oxygen tension will severely reduce cell energy availability. This occurs through several mechanisms: first, reduced oxygen tension decreases the respiration rate, due first to nonsaturating substrate for cytochrome c oxidase (COX), secondarily, to allosteric modulation of COX[42]. As a consequence, the phosphorylation potential decreases, with enhancement of the glycolysis rate primarily due to allosteric increase of phosphofructokinase activity; glycolysis however is poorly efficient and produces lactate in proportion of 0.5 mol/mol ATP, which eventually drops cellular pH if cells are not well perfused, as it occurs under defective vasculature or ischemic conditions  [6]. Besides this “spontaneous” (thermodynamically-driven) shift from aerobic to anaerobic metabolism which is mediated by the kinetic changes of most enzymes, the HIF-1 factor activates transcription of genes encoding glucose transporters and glycolytic enzymes to further increase flux of reducing equivalents from glucose to lactate[43] and [44]. Second, HIF-1 coordinates two different actions on the mitochondrial phase of glucose oxidation: it activates transcription of the PDK1 gene encoding a kinase that phosphorylates and inactivates pyruvate dehydrogenase, thereby shunting away pyruvate from the mitochondria by preventing its oxidative decarboxylation to acetyl-CoA [45] and [46]. Moreover, HIF-1 induces a switch in the composition of cytochrome c oxidase from COX4-1 to COX4-2 isoform, which enhances the specific activity of the enzyme. As a result, both respiration rate and ATP level of hypoxic cells carrying the COX4-2 isoform of cytochrome c oxidase were found significantly increased with respect to the same cells carrying the COX4-1 isoform [47]. Incidentally, HIF-1 can also increase the expression of carbonic anhydrase 9, which catalyses the reversible hydration of CO2 to HCO3 and H+, therefore contributing to pH regulation.

Effects of hypoxia on mitochondrial structure and dynamics

Mitochondria form a highly dynamic tubular network, the morphology of which is regulated by frequent fission and fusion events. The fusion/fission machineries are modulated in response to changes in the metabolic conditions of the cell, therefore one should expect that hypoxia affect mitochondrial dynamics. Oxygen availability to cells decreases glucose oxidation, whereas oxygen shortage consumes glucose faster in an attempt to produce ATP via the less efficient anaerobic glycolysis to lactate (Pasteur effect). Under these conditions, mitochondria are not fueled with substrates (acetyl-CoA and O2), inducing major changes of structure, function, and dynamics (for a recent review see [48]). Concerning structure and dynamics, one of the first correlates that emerge is that impairment of mitochondrial fusion leads to mitochondrial depolarization, loss of mtDNA that may be accompanied by altered respiration rate, and impaired distribution of the mitochondria within cells [49][50] and [51]. Indeed, exposure of cortical neurons to moderate hypoxic conditions for several hours, significantly altered mitochondrial morphology, decreased mitochondrial size and reduced mitochondrial mean velocity. Since these effects were either prevented by exposing the neurons to inhibitors of nitric oxide synthase or mimicked by NO donors in normoxia, the involvement of an NO-mediated pathway was suggested [52]. Mitochondrial motility was also found inhibited and controlled locally by the [ADP]/[ATP] ratio [53]. Interestingly, the author used an original approach in which mitochondria were visualized using tetramethylrhodamineethylester and their movements were followed by applying single-particle tracking.

Of notice in this chapter is that enzymes controlling mitochondrial morphology regulators provide a platform through which cellular signals are transduced within the cell in order to affect mitochondrial function [54]. Accordingly, one might expect that besides other mitochondrial factors [30] and [55] playing roles in HIF stabilization, also mitochondrial morphology might reasonably be associated with HIF stabilization. In order to better define the mechanisms involved in the morphology changes of mitochondria and in their dynamics when cells experience hypoxic conditions, these pioneering studies should be corroborated by and extended to observations on other types of cells focusing also on single proteins involved in both mitochondrial fusion/fission and motion.

Effects of hypoxia on the respiratory chain complexes

O2 is the terminal acceptor of electrons from cytochrome c oxidase (Complex IV), which has a very high affinity for it, being the oxygen concentration for half-maximal respiratory rate at pH 7.4 approximately 0.7 µM [56]. Measurements of mitochondrial oxidative phosphorylation indicated that it is not dependent on oxygen concentration up to at least 20 µM at pH 7.0 and the oxygen dependence becomes markedly greater as the pH is more alkaline [56]. Similarly, Moncada et al. [57] found that the rate of O2 consumption remained constant until [O2] fell below 15 µM. Accordingly, most reports in the literature consider hypoxic conditions occurring in cells at 5–0.5% O2, a range corresponding to 46–4.6 µM O2 in the cells culture medium (see Fig. 1 inset). Since between the extracellular environment and mitochondria an oxygen pressure gradient is established [58], the O2 concentration experienced by Complex IV falls in the range affecting its kinetics, as reported above.

Under these conditions, a number of changes on the OXPHOS machinery components, mostly mediated by HIF-1 have been found. Thus, Semenza et al. [59] and others thereafter [46] reported that activation of HIF-1α induces pyruvate dehydrogenase kinase, which inhibits pyruvate dehydrogenase, suggesting that respiration is decreased by substrate limitation. Besides, other HIF-1 dependent mechanisms capable to affect respiration rate have been reported. First, the subunit composition of COX is altered in hypoxic cells by increased degradation of the COX4-1 subunit, which optimizes COX activity under aerobic conditions, and increased expression of the COX4-2 subunit, which optimizes COX activity under hypoxic conditions [29]. On the other hand, direct assay of respiration rate in cells exposed to hypoxia resulted in a significant reduction of respiration [60]. According with the evidence of Zhang et al., the respiration rate decrease has to be ascribed to mitochondrial autophagy, due to HIF-1-mediated expression of BNIP3. This interpretation is in line with preliminary results obtained in our laboratory where the assay of the citrate synthase activity of cells exposed to different oxygen tensions was performed. Fig. 2 shows the citrate synthase activity, which is taken as an index of the mitochondrial mass [11], with respect to oxygen tension: [O2] and mitochondrial mass are directly linked.

Citrate synthase activity

Citrate synthase activity

http://ars.els-cdn.com/content/image/1-s2.0-S0005272810000575-gr2.jpg

Fig. 2. Citrate synthase activity. Human primary fibroblasts, obtained from skin biopsies of 5 healthy donors, were seeded at a density of 8,000 cells/cm2 in high glucose Dulbecco’s Modified Eagle Medium, DMEM (25 mM glucose, 110 mg/l pyruvate, and 4 mM glutamine) supplemented with 15% Foetal Bovine Serum (FBS). 18 h later, cell culture dishes were washed once with Hank’s Balanced Salt Solution (HBSS) and the medium was replaced with DMEM containing 5 mM glucose, 110 mg/l pyruvate, and 4 mM glutamine supplemented with 15% FBS. Cell culture dishes were then placed into an INVIVO2 humidified hypoxia workstation (Ruskinn Technologies, Bridgend, UK) for 72 h changing the medium at 48 h, and oxygen partial pressure (tension) conditions were: 20%, 4%, 2%, 1% and 0.5%. Cells were subsequently collected within the workstation with trypsin-EDTA (0.25%), washed with PBS and resuspended in a buffer containing 10 mM Tris/HCl, 0.1 M KCl, 5 mM KH2PO4, 1 mM EGTA, 3 mM EDTA, and 2 mM MgCl2 pH 7.4 (all the solutions were preconditioned to the appropriate oxygen tension condition). The citrate synthase activity was assayed essentially by incubating 40 µg of cells with 0.02% Triton X-100, and monitoring the reaction by measuring spectrophotometrically the rate of free coenzyme A released, as described in [90]. Enzymatic activity was expressed as nmol/min/mg of protein. Three independent experiments were carried out and assays were performed in either duplicate or triplicate.

However, the observations of Semenza et al. must be seen in relation with data reported by Moncada et al.[57] and confirmed by others [61] in which it is clearly shown that when cells (various cell lines) experience hypoxic conditions, nitric oxide synthases (NOSs) are activated, therefore NO is released. As already mentioned above, NO is a strong competitor of O2 for cytochrome c oxidase, whose apparent Km results increased, hence reduction of mitochondrial cytochromes and all the other redox centres of the respiratory chain occurs. In addition, very recent data indicate a potential de-activation of Complex I when oxygen is lacking, as it occurs in prolonged hypoxia [62]. According to Hagen et al. [63] the NO-dependent inhibition of cytochrome c oxidase should allow “saved” O2 to redistribute within the cell to be used by other enzymes, including PHDs which inactivate HIF. Therefore, unless NO inhibition of cytochrome c oxidase occurs only when [O2] is very low, inhibition of mitochondrial oxygen consumption creates the paradox of a situation in which the cell may fail to register hypoxia. It has been tempted to solve this paradox, but to date only hypotheses have been proposed [23] and [26]. Interestingly, recent observations on yeast cells exposed to hypoxia revealed abnormal protein carbonylation and protein tyrosine nitration that were ascribed to increased mitochondrially generated superoxide radicals and NO, two species typically produced at low oxygen levels, that combine to form ONOO [64]. Based on these studies a possible explanation has been proposed for the above paradox.

Finally, it has to be noticed that the mitochondrial respiratory deficiency observed in cardiomyocytes of dogs in which experimental heart failure had been induced lies in the supermolecular assembly rather than in the individual components of the electron-transport chain [65]. This observation is particularly intriguing since loss of respirasomes is thought to facilitate ROS generation in mitochondria [66], therefore supercomplexes disassembly might explain the paradox of reduced [O2] and the enhanced ROS found in hypoxic cells. Specifically, hypoxia could reduce mitochondrial fusion by impairing mitochondrial membrane potential, which in turn could induce supercomplexes disassembly, increasing ROS production[11].

Complex III and ROS production

It has been estimated that, under normoxic physiological conditions, 1–2% of electron flow through the mitochondrial respiratory chain gives rise to ROS [67] and [68]. It is now recognized that the major sites of ROS production are within Complexes I and III, being prevalent the contribution of Complex I [69] (Fig. 3). It might be expected that hypoxia would decrease ROS production, due to the low level of O2 and to the diminished mitochondrial respiration [6] and [46], but ROS level is paradoxically increased. Indeed, about a decade ago, Chandel et al. [70] provided good evidence that mitochondrial reactive oxygen species trigger hypoxia-induced transcription, and a few years later the same group [71] showed that ROS generated at Complex III of the mitochondrial respiratory chain stabilize HIF-1α during hypoxia (Fig. 1 and Fig. 3). Although others have proposed mechanisms indicating a key role of mitochondria in HIF-1α regulation during hypoxia (for reviews see [64] and [72]), the contribution of mitochondria to HIF-1 regulation has been questioned by others [35][36] and [37]. Results of Gong and Agani [35] for instance show that inhibition of electron-transport Complexes I, III, and IV, as well as inhibition of mitochondrial F0F1 ATPase, prevents HIF-1α expression and that mitochondrial reactive oxygen species are not involved in HIF-1α regulation during hypoxia. Concurrently, Tuttle et al. [73], by means of a non invasive, spectroscopic approach, could find no evidence to suggest that ROS, produced by mitochondria, are needed to stabilize HIF-1α under moderate hypoxia. The same authors found the levels of HIF-1α comparable in both normal and ρ0 cells (i.e. cells lacking mitochondrial DNA). On the contrary, experiments carried out on genetic models consisting of either cells lacking cytochrome c or ρ0 cells both could evidence the essential role of mitochondrial respiration to stabilize HIF-1α [74]. Thus, cytochrome c null cells, being incapable to respire, exposed to moderate hypoxia (1.5% O2) prevented oxidation of ubiquinol and generation of the ubisemiquinone radical, thus eliminating superoxide formation at Complex III [71]. Concurrently, ρ0 cells lacking electron transport, exposed 4 h to moderate hypoxia failed to stabilize HIF-1α, suggesting the essential role of the respiratory chain for the cellular sensing of low O2 levels. In addition, recent evidence obtained on genetic manipulated cells (i.e. cytochrome b deficient cybrids) showed increased ROS levels and stabilized HIF-1α protein during hypoxia [75]. Moreover, RNA interference of the Complex III subunit Rieske iron sulfur protein in the cytochrome b deficient cells, abolished ROS generation at the Qo site of Complex III, preventing HIF-1α stabilization. These observations, substantiated by experiments with MitoQ, an efficient mitochondria-targeted antioxidant, strongly support the involvement of mitochondrial ROS in regulating HIF-1α. Nonetheless, collectively, the available data do not allow to definitely state the precise role of mitochondrial ROS in regulating HIF-1α, but the pathway stabilizing HIF-1α appears undoubtedly mitochondria-dependent [30].

Overview of mitochondrial electron and proton flux in hypoxia

Overview of mitochondrial electron and proton flux in hypoxia

Overview of mitochondrial electron and proton flux in hypoxia

http://ars.els-cdn.com/content/image/1-s2.0-S0005272810000575-gr3.jpg

Fig. 3. Overview of mitochondrial electron and proton flux in hypoxia. Electrons released from reduced cofactors (NADH and FADH2) under normoxia flow through the redox centres of the respiratory chain (r.c.) to molecular oxygen (blue dotted line), to which a proton flux from the mitochondrial matrix to the intermembrane space is coupled (blue arrows). Protons then flow back to the matrix through the F0 sector of the ATP synthase complex, driving ATP synthesis. ATP is carried to the cell cytosol by the adenine nucleotide translocator (blue arrows). Under moderate to severe hypoxia, electrons escape the r.c. redox centres and reduce molecular oxygen to the superoxide anion radical before reaching the cytochrome c (red arrow). Under these conditions, to maintain an appropriate Δψm, ATP produced by cytosolic glycolysis enters the mitochondria where it is hydrolyzed by the F1F0ATPase with extrusion of protons from the mitochondrial matrix (red arrows).

Hypoxia and ATP synthase

The F1F0 ATPase (ATP synthase) is the enzyme responsible of catalysing ADP phosphorylation as the last step of OXPHOS. It is a rotary motor using the proton motive force across the mitochondrial inner membrane to drive the synthesis of ATP [76]. It is a reversible enzyme with ATP synthesis or hydrolysis taking place in the F1 sector at the matrix side of the membrane, chemical catalysis being coupled to H+transport through the transmembrane F0 sector.

Under normoxia the enzyme synthesizes ATP, but when mitochondria experience hypoxic conditions the mitochondrial membrane potential (Δψm) decreases below its endogenous steady-state level (some 140 mV, negative inside the matrix [77]) and the F1F0 ATPase may work in the reversal mode: it hydrolyses ATP (produced by anaerobic glycolysis) and uses the energy released to pump protons from the mitochondrial matrix to the intermembrane space, concurring with the adenine nucleotide translocator (i.e. in hypoxia it exchanges cytosolic ATP4− for matrix ADP3−) to maintain the physiological Δψm ( Fig. 3). Since under conditions of limited oxygen availability the decline in cytoplasmic high energy phosphates is mainly due to hydrolysis by the ATP synthase working in reverse [6] and [78], the enzyme must be strictly regulated in order to avoid ATP dissipation. This is achieved by a natural protein, the H+ψm-dependent IF1, that binds to the catalytic F1 sector at low pH and low Δψm (such as it occurs in hypoxia/ischemia) [79]. IF1 binding to the ATP synthase results in a rapid and reversible inhibition of the enzyme [80], which could reach about 50% of maximal activity (for recent reviews see [6] and [81]).

Besides this widely studied effect, IF1 appears to be associated with ROS production and mitochondrial autophagy (mitophagy). This is a mechanism involving the catabolic degradation of macromolecules and organelles via the lysosomal pathway that contributes to housekeeping and regenerate metabolites. Autophagic degradation is involved in the regulation of the ageing process and in several human diseases, such as myocardial ischemia/reperfusion [82], Alzheimer’s Disease, Huntington diseases, and inflammatory diseases (for recent reviews see [83] and [84], and, as mentioned above, it promotes cell survival by reducing ROS and mtDNA damage under hypoxic conditions.

Campanella et al. [81] reported that, in HeLa cells under normoxic conditions, basal autophagic activity varies in relation to the expression levels of IF1. Accordingly, cells overexpressing IF1 result in ROS production similar to controls, conversely cells in which IF1 expression is suppressed show an enhanced ROS production. In parallel, the latter cells show activation of the mitophagy pathway (Fig. 1), therefore suggesting that variations in IF1 expression level may play a significant role in defining two particularly important parameters in the context of the current review: rates of ROS generation and mitophagy. Thus, the hypoxia-induced enhanced expression level of IF1[81] should be associated with a decrease of both ROS production and autophagy, which is in apparent conflict with the hypoxia-induced ROS increase and with the HIF-1-dependent mitochondrial autophagy shown by Zhang et al. [60] as an adaptive metabolic response to hypoxia. However, in the experiments of Zhang et al. the cells were exposed to hypoxia for 48 h, whereas the F1F0-ATPase inhibitor exerts a prompt action on the enzyme and to our knowledge, it has never been reported whether its action persists during prolonged hypoxic expositions. Pertinent with this problem is the very recent observation that IEX-1 (immediate early response gene X-1), a stress-inducible gene that suppresses production of ROS and protects cells from apoptosis [85], targets the mitochondrial F1F0-ATPase inhibitor for degradation, reducing ROS by decreasing Δψm. It has to be noticed that the experiments described were carried out under normal oxygen availability, but it does not seem reasonable to rule out IEX-1 from playing a role under stress conditions as those induced by hypoxia in cells, therefore this issue might deserve an investigation also at low oxygen levels.

In conclusion, data are still emerging regarding the regulation of mitochondrial function by the F1F0 ATPase within hypoxic responses in different cellular and physiological contexts. Given the broad pathophysiological role of hypoxic cellular modulation, an understanding of the subtle tuning among different effectors of the ATP synthase is desirable to eventually target future therapeutics most effectively. Our laboratory is actually involved in carrying out investigations to clarify this context.

Conclusions and perspectives

The mitochondria are important cellular platforms that both propagate and initiate intracellular signals that lead to overall cellular and metabolic responses. During the last decades, a significant amount of relevant data has been obtained on the identification of mechanisms of cellular adaptation to hypoxia. In hypoxic cells there is an enhanced transcription and synthesis of several glycolytic pathway enzymes/transporters and reduction of synthesis of proteins involved in mitochondrial catabolism. Although well defined kinetic parameters of reactions in hypoxia are lacking, it is usually assumed that these transcriptional changes lead to metabolic flux modification. The required biochemical experimentation has been scarcely addressed until now and only in few of the molecular and cellular biology studies the transporter and enzyme kinetic parameters and flux rate have been determined, leaving some uncertainties.

Central to mitochondrial function and ROS generation is an electrochemical proton gradient across the mitochondrial inner membrane that is established by the proton pumping activity of the respiratory chain, and that is strictly linked to the F1F0-ATPase function. Evaluation of the mitochondrial membrane potential in hypoxia has only been studied using semiquantitative methods based on measurements of the fluorescence intensity of probes taken up by cells experiencing normal or hypoxic conditions. However, this approach is intrinsically incorrect due to the different capability that molecular oxygen has to quench fluorescence [86] and [87] and to the uncertain concentration the probe attains within mitochondria, whose mass may be reduced by a half in hypoxia [60]. In addition, the uncertainty about measurement of mitochondrial superoxide radical and H2O2 formation in vivo [88] hampers studies on the role of mitochondrial ROS in hypoxic oxidative damage, redox signaling, and HIF-1 stabilization.

The duration and severity of hypoxic stress differentially activate the responses discussed throughout and lead to substantial phenotypic variations amongst tissues and cell models, which are not consistently and definitely known. Certainly, understanding whether a hierarchy among hypoxia response mechanisms exists and which are the precise timing and conditions of each mechanism to activate, will improve our knowledge of the biochemical mechanisms underlying hypoxia in cells, which eventually may contribute to define therapeutic targets in hypoxia-associated diseases. To this aim it might be worth investigating the hypoxia-induced structural organization of both the respiratory chain enzymes in supramolecular complexes and the assembly of the ATP synthase to form oligomers affecting ROS production [65] and inner mitochondrial membrane structure [89], respectively.

7.9.2 Hypoxia promotes isocitrate dehydrogenase-dependent carboxylation of α-ketoglutarate to citrate to support cell growth and viability

DR WisePS WardJES ShayJR CrossJJ Gruber, UM Sachdeva, et al.
Proc Nat Acad Sci Oct 27, 2011; 108(49):19611–19616
http://dx.doi.org:/10.1073/pnas.1117773108

Citrate is a critical metabolite required to support both mitochondrial bioenergetics and cytosolic macromolecular synthesis. When cells proliferate under normoxic conditions, glucose provides the acetyl-CoA that condenses with oxaloacetate to support citrate production. Tricarboxylic acid (TCA) cycle anaplerosis is maintained primarily by glutamine. Here we report that some hypoxic cells are able to maintain cell proliferation despite a profound reduction in glucose-dependent citrate production. In these hypoxic cells, glutamine becomes a major source of citrate. Glutamine-derived α-ketoglutarate is reductively carboxylated by the NADPH-linked mitochondrial isocitrate dehydrogenase (IDH2) to form isocitrate, which can then be isomerized to citrate. The increased IDH2-dependent carboxylation of glutamine-derived α-ketoglutarate in hypoxia is associated with a concomitant increased synthesis of 2-hydroxyglutarate (2HG) in cells with wild-type IDH1 and IDH2. When either starved of glutamine or rendered IDH2-deficient by RNAi, hypoxic cells are unable to proliferate. The reductive carboxylation of glutamine is part of the metabolic reprogramming associated with hypoxia-inducible factor 1 (HIF1), as constitutive activation of HIF1 recapitulates the preferential reductive metabolism of glutamine-derived α-ketoglutarate even in normoxic conditions. These data support a role for glutamine carboxylation in maintaining citrate synthesis and cell growth under hypoxic conditions.

Citrate plays a critical role at the center of cancer cell metabolism. It provides the cell with a source of carbon for fatty acid and cholesterol synthesis (1). The breakdown of citrate by ATP-citrate lyase is a primary source of acetyl-CoA for protein acetylation (2). Metabolism of cytosolic citrate by aconitase and IDH1 can also provide the cell with a source of NADPH for redox regulation and anabolic synthesis. Mammalian cells depend on the catabolism of glucose and glutamine to fuel proliferation (3). In cancer cells cultured at atmospheric oxygen tension (21% O2), glucose and glutamine have both been shown to contribute to the cellular citrate pool, with glutamine providing the major source of the four-carbon molecule oxaloacetate and glucose providing the major source of the two-carbon molecule acetyl-CoA (45). The condensation of oxaloacetate and acetyl-CoA via citrate synthase generates the 6 carbon citrate molecule. However, both the conversion of glucose-derived pyruvate to acetyl-CoA by pyruvate dehydrogenase (PDH) and the conversion of glutamine to oxaloacetate through the TCA cycle depend on NAD+, which can be compromised under hypoxic conditions. This raises the question of how cells that can proliferate in hypoxia continue to synthesize the citrate required for macromolecular synthesis.

This question is particularly important given that many cancers and stem/progenitor cells can continue proliferating in the setting of limited oxygen availability (67). Louis Pasteur first highlighted the impact of hypoxia on nutrient metabolism based on his observation that hypoxic yeast cells preferred to convert glucose into lactic acid rather than burning it in an oxidative fashion. The molecular basis for this shift in mammalian cells has been linked to the activity of the transcription factor HIF1 (810). Stabilization of the labile HIF1α subunit occurs in hypoxia. It can also occur in normoxia through several mechanisms including loss of the von Hippel-Lindau tumor suppressor (VHL), a common occurrence in renal carcinoma (11). Although hypoxia and/or HIF1α stabilization is a common feature of multiple cancers, to date the source of citrate in the setting of hypoxia or HIF activation has not been determined.

Here, we study the sources of hypoxic citrate synthesis in a glioblastoma cell line that proliferates in profound hypoxia (0.5% O2). Glucose uptake and conversion to lactic acid increased in hypoxia. However, glucose conversion into citrate dramatically declined. Glutamine consumption remained constant in hypoxia, and hypoxic cells were addicted to the use of glutamine in hypoxia as a source of α-ketoglutarate. Glutamine provided the major carbon source for citrate synthesis during hypoxia. However, the TCA cycle-dependent conversion of glutamine into citric acid was significantly suppressed. In contrast, there was a relative increase in glutamine-dependent citrate production in hypoxia that resulted from carboxylation of α-ketoglutarate. This reductive synthesis required the presence of mitochondrial isocitrate dehydrogenase 2 (IDH2). In confirmation of the reverse flux through IDH2, the increased reductive metabolism of glutamine-derived α-ketoglutarate in hypoxia was associated with increased synthesis of 2HG. Finally, constitutive HIF1α-expressing cells also demonstrated significant reductive-carboxylation-dependent synthesis of citrate in normoxia and a relative defect in the oxidative conversion of glutamine into citrate. Collectively, the data demonstrate that mitochondrial glutamine metabolism can be rerouted through IDH2-dependent citrate synthesis in support of hypoxic cell growth.

Some Cancer Cells Can Proliferate at 0.5% O2 Despite a Sharp Decline in Glucose-Dependent Citrate Synthesis.

At 21% O2, cancer cells have been shown to synthesize citrate by condensing glucose-derived acetyl-CoA with glutamine-derived oxaloacetate through the activity of the canonical TCA cycle enzyme citrate synthase (4). In contrast, less is known regarding the synthesis of citrate by cells that can continue proliferating in hypoxia. The glioblastoma cell line SF188 is able to proliferate at 0.5% O2 (Fig. 1A), a level of hypoxia that is sufficient to stabilize HIF1α (Fig. 1B) and predicted to limit respiration (1213). Consistent with previous observations in hypoxic cells, we found that SF188 cells demonstrated increased lactate production when incubated in hypoxia (Fig. 1C), and the ratio of lactate produced to glucose consumed increased demonstrating an increase in the rate of anaerobic glycolysis. When glucose-derived carbon in the form of pyruvate is converted to lactate, it is diverted away from subsequent metabolism that can contribute to citrate production. However, we observed that SF188 cells incubated in hypoxia maintain their intracellular citrate to ∼75% of the level maintained under normoxia (Fig. 1D). This prompted an investigation of how proliferating cells maintain citrate production under hypoxia.

SF188 glioblastoma cells proliferate at 0.5% O2 despite a profound reduction in glucose-dependent citrate synthesis.

SF188 glioblastoma cells proliferate at 0.5% O2 despite a profound reduction in glucose-dependent citrate synthesis.

http://www.pnas.org/content/108/49/19611/F1.medium.gif

Fig. 1. SF188 glioblastoma cells proliferate at 0.5% O2 despite a profound reduction in glucose-dependent citrate synthesis. (A) SF188 cells were plated in complete medium equilibrated with 21% O2 (Normoxia) or 0.5% O2 (Hypoxia), total viable cells were counted 24 h and 48 h later (Day 1 and Day 2), and population doublings were calculated. Data are the mean ± SEM of four independent experiments. (B) Western blot demonstrates stabilized HIF1α protein in cells cultured in hypoxia compared with normoxia. (C) Cells were grown in normoxia or hypoxia for 24 h, after which culture medium was collected. Medium glucose and lactate levels were measured and compared with the levels in fresh medium. (D) Cells were cultured for 24 h as in C. Intracellular metabolism was then quenched with 80% MeOH prechilled to −80 °C that was spiked with a 13C-labeled citrate as an internal standard. Metabolites were then extracted, and intracellular citrate levels were analyzed with GC-MS and normalized to cell number. Data for C and D are the mean ± SEM of three independent experiments. (E) Model depicting the pathway for cit+2 production from [U-13C]glucose. Glucose uniformly 13C-labeled will generate pyruvate+3. Pyruvate+3 can be oxidatively decarboxylated by PDH to produce acetyl-CoA+2, which can condense with unlabeled oxaloacetate to produce cit+2. (F) Cells were cultured for 24 h as in C and D, followed by an additional 4 h of culture in glucose-deficient medium supplemented with 10 mM [U-13C]glucose. Intracellular metabolites were then extracted, and 13C-enrichment in cellular citrate was analyzed by GC-MS and normalized to the total citrate pool size. Data are the mean ± SD of three independent cultures from a representative of two independent experiments. *P < 0.05, ***P < 0.001.

Increased glucose uptake and glycolytic metabolism are critical elements of the metabolic response to hypoxia. To evaluate the contributions made by glucose to the citrate pool under normoxia or hypoxia, SF188 cells incubated in normoxia or hypoxia were cultured in medium containing 10 mM [U-13C]glucose. Following a 4-h labeling period, cellular metabolites were extracted and analyzed for isotopic enrichment by gas chromatography-mass spectrometry (GC-MS). In normoxia, the major 13C-enriched citrate species found was citrate enriched with two 13C atoms (cit+2), which can arise from the NAD+-dependent decarboxylation of pyruvate+3 to acetyl-CoA+2 by PDH, followed by the condensation of acetyl-CoA+2 with unenriched oxaloacetate (Fig. 1 E and F). Compared with the accumulation of cit+2, we observed minimal accumulation of cit+3 and cit+5 under normoxia. Cit+3 arises from pyruvate carboxylase (PC)-dependent conversion of pyruvate+3 to oxaloacetate+3, followed by the condensation of oxaloacetate+3 with unenriched acetyl-CoA. Cit+5 arises when PC-generated oxaloacetate+3 condenses with PDH-generated acetyl-CoA+2. The lack of cit+3 and cit+5 accumulation is consistent with PC activity not playing a major role in citrate production in normoxic SF188 cells, as reported (4).

In hypoxic cells, the major citrate species observed was unenriched. Cit+2, cit+3, and cit+5 all constituted minor fractions of the total citrate pool, consistent with glucose carbon not being incorporated into citrate through either PDH or PC-mediated metabolism under hypoxic conditions (Fig. 1F). These data demonstrate that in contrast to normoxic cells, where a large percentage of citrate production depends on glucose-derived carbon, hypoxic cells significantly reduce their rate of citrate production from glucose.

Glutamine Carbon Metabolism Is Required for Viability in Hypoxia.

In addition to glucose, we have previously reported that glutamine can contribute to citrate production during cell growth under normoxic conditions (4). Surprisingly, under hypoxic conditions, we observed that SF188 cells retained their high rate of glutamine consumption (Fig. 2A). Moreover, hypoxic cells cultured in glutamine-deficient medium displayed a significant loss of viability (Fig. 2B). In normoxia, the requirement for glutamine to maintain viability of SF188 cells can be satisfied by α-ketoglutarate, the downstream metabolite of glutamine that is devoid of nitrogenous groups (14). α-ketoglutarate cannot fulfill glutamine’s roles as a nitrogen source for nonessential amino acid synthesis or as an amide donor for nucleotide or hexosamine synthesis, but can be metabolized through the oxidative TCA cycle to regenerate oxaloacetate, and subsequently condense with glucose-derived acetyl-CoA to produce citrate. To test whether the restoration of carbon from glutamine metabolism in the form of α-ketoglutarate could rescue the viability defect of glutamine-starved SF188 cells even under hypoxia, SF188 cells incubated in hypoxia were cultured in glutamine-deficient medium supplemented with a cell-penetrant form of α-ketoglutarate (dimethyl α-ketoglutarate). The addition of dimethyl α-ketoglutarate rescued the defect in cell viability observed upon glutamine withdrawal (Fig. 2B). These data demonstrate that, even under hypoxic conditions, when the ability of glutamine to replenish oxaloacetate through oxidative TCA cycle metabolism is diminished, SF188 cells retain their requirement for glutamine as the carbon backbone for α-ketoglutarate. This result raised the possibility that glutamine could be the carbon source for citrate production through an alternative, nonoxidative, pathway in hypoxia.

Glutamine carbon is required for hypoxic cell viability

Glutamine carbon is required for hypoxic cell viability

Glutamine carbon is required for hypoxic cell viability

http://www.pnas.org/content/108/49/19611/F2.medium.gif

Fig. 2. Glutamine carbon is required for hypoxic cell viability and contributes to increased citrate production through reductive carboxylation relative to oxidative metabolism in hypoxia. (A) SF188 cells were cultured for 24 h in complete medium equilibrated with either 21% O2 (Normoxia) or 0.5% O2(Hypoxia). Culture medium was then removed from cells and analyzed for glutamine levels which were compared with the glutamine levels in fresh medium. Data are the mean ± SEM of three independent experiments. (B) The requirement for glutamine to maintain hypoxic cell viability can be satisfied by α-ketoglutarate. Cells were cultured in complete medium equilibrated with 0.5% O2 for 24 h, followed by an additional 48 h at 0.5% O2 in either complete medium (+Gln), glutamine-deficient medium (−Gln), or glutamine-deficient medium supplemented with 7 mM dimethyl α-ketoglutarate (−Gln +αKG). All medium was preconditioned in 0.5% O2. Cell viability was determined by trypan blue dye exclusion. Data are the mean and range from two independent experiments. (C) Model depicting the pathways for cit+4 and cit+5 production from [U-13C]glutamine (glutamine+5). Glutamine+5 is catabolized to α-ketoglutarate+5, which can then contribute to citrate production by two divergent pathways. Oxidative metabolism produces oxaloacetate+4, which can condense with unlabeled acetyl-CoA to produce cit+4. Alternatively, reductive carboxylation produces isocitrate+5, which can isomerize to cit+5. (D) Glutamine contributes to citrate production through increased reductive carboxylation relative to oxidative metabolism in hypoxic proliferating cancer cells. Cells were cultured for 24 h as in A, followed by 4 h of culture in glutamine-deficient medium supplemented with 4 mM [U-13C]glutamine. 13C enrichment in cellular citrate was quantitated with GC-MS. Data are the mean ± SD of three independent cultures from a representative of three independent experiments. **P < 0.01.

Cells Proliferating in Hypoxia Maintain Levels of Additional Metabolites Through Reductive Carboxylation.

Previous work has documented that, in normoxic conditions, SF188 cells use glutamine as the primary anaplerotic substrate, maintaining the pool sizes of TCA cycle intermediates through oxidative metabolism (4). Surprisingly, we found that, when incubated in hypoxia, SF188 cells largely maintained their levels of aspartate (in equilibrium with oxaloacetate), malate, and fumarate (Fig. 3A). To distinguish how glutamine carbon contributes to these metabolites in normoxia and hypoxia, SF188 cells incubated in normoxia or hypoxia were cultured in medium containing 4 mM [U-13C]glutamine. After a 4-h labeling period, metabolites were extracted and the intracellular pools of aspartate, malate, and fumarate were analyzed by GC-MS.

In normoxia, the majority of the enriched intracellular asparatate, malate, and fumarate were the +4 species, which arise through oxidative metabolism of glutamine-derived α-ketoglutarate (Fig. 3 B and C). The +3 species, which can be derived from the citrate generated by the reductive carboxylation of glutamine-derived α-ketoglutarate, constituted a significantly lower percentage of the total aspartate, malate, and fumarate pools. By contrast, in hypoxia, the +3 species constituted a larger percentage of the total aspartate, malate, and fumarate pools than they did in normoxia. These data demonstrate that, in addition to citrate, hypoxic cells preferentially synthesize oxaloacetate, malate, and fumarate through the pathway of reductive carboxylation rather than the oxidative TCA cycle.

IDH2 Is Critical in Hypoxia for Reductive Metabolism of Glutamine and for Cell Proliferation.

We hypothesized that the relative increase in reductive carboxylation we observed in hypoxia could arise from the suppression of α-ketoglutarate oxidation through the TCA cycle. Consistent with this, we found that α-ketoglutarate levels increased in SF188 cells following 24 h in hypoxia (Fig. 4A). Surprisingly, we also found that levels of the closely related metabolite 2-hydroxyglutarate (2HG) increased in hypoxia, concomitant with the increase in α-ketoglutarate under these conditions. 2HG can arise from the noncarboxylating reduction of α-ketoglutarate (Fig. 4B). Recent work has found that specific cancer-associated mutations in the active sites of either IDH1 or IDH2 lead to a 10- to 100-fold enhancement in this activity facilitating 2HG production (1517), but SF188 cells lack IDH1/2 mutations. However, 2HG levels are also substantially elevated in the inborn error of metabolism 2HG aciduria, and the majority of patients with this disease lack IDH1/2 mutations. As 2HG has been demonstrated to arise in these patients from mitochondrial α-ketoglutarate (18), we hypothesized that both the increased reductive carboxylation of glutamine-derived α-ketoglutarate to citrate and the increased 2HG accumulation we observed in hypoxia could arise from increased reductive metabolism by wild-type IDH2 in the mitochondria.

Reductive carboxylation of glutamine-derived α-ketoglutarate to citrate in hypoxic cancer cells is dependent on mitochondrial IDH2

Reductive carboxylation of glutamine-derived α-ketoglutarate to citrate in hypoxic cancer cells is dependent on mitochondrial IDH2

Reductive carboxylation of glutamine-derived α-ketoglutarate to citrate in hypoxic cancer cells is dependent on mitochondrial IDH2

http://www.pnas.org/content/108/49/19611/F4.medium.gif

Fig. 4. Reductive carboxylation of glutamine-derived α-ketoglutarate to citrate in hypoxic cancer cells is dependent on mitochondrial IDH2. (A) α-ketoglutarate and 2HG increase in hypoxia. SF188 cells were cultured in complete medium equilibrated with either 21% O2 (Normoxia) or 0.5% O2 (Hypoxia) for 24 h. Intracellular metabolites were then extracted, cell extracts spiked with a 13C-labeled citrate as an internal standard, and intracellular α-ketoglutarate and 2HG levels were analyzed with GC-MS. Data shown are the mean ± SEM of three independent experiments. (B) Model for reductive metabolism from glutamine-derived α-ketoglutarate. Glutamine+5 is catabolized to α-ketoglutarate+5. Carboxylation of α-ketoglutarate+5 followed by reduction of the carboxylated intermediate (reductive carboxylation) will produce isocitrate+5, which can then isomerize to cit+5. In contrast, reductive activity on α-ketoglutarate+5 that is uncoupled from carboxylation will produce 2HG+5. (C) IDH2 is required for reductive metabolism of glutamine-derived α-ketoglutarate in hypoxia. SF188 cells transfected with a siRNA against IDH2 (siIDH2) or nontargeting negative control (siCTRL) were cultured for 2 d in complete medium equilibrated with 0.5% O2. (Upper) Cells were then cultured at 0.5% O2 for an additional 4 h in glutamine-deficient medium supplemented with 4 mM [U-13C]glutamine. 13C enrichment in intracellular citrate and 2HG was determined and normalized to the relevant metabolite total pool size. (Lower) Cells transfected and cultured in parallel at 0.5% O2 were counted by hemacytometer (excluding nonviable cells with trypan blue staining) or harvested for protein to assess IDH2 expression by Western blot. Data shown for GC-MS and cell counts are the mean ± SD of three independent cultures from a representative experiment. **P < 0.01, ***P < 0.001.

In an experiment to test this hypothesis, SF188 cells were transfected with either siRNA directed against mitochondrial IDH2 (siIDH2) or nontargeting control, incubated in hypoxia for 2 d, and then cultured for another 4 h in hypoxia in media containing 4 mM [U-13C]glutamine. After the labeling period, metabolites were extracted and analyzed by GC-MS (Fig. 4C). Hypoxic SF188 cells transfected with siIDH2 displayed a decreased contribution of cit+5 to the total citrate pool, supporting an important role for IDH2 in the reductive carboxylation of glutamine-derived α-ketoglutarate in hypoxic conditions. The contribution of cit+4 to the total citrate pool did not decrease with siIDH2 treatment, consistent with IDH2 knockdown specifically affecting the pathway of reductive carboxylation and not other fundamental TCA cycle-regulating processes. In confirmation of reverse flux occurring through IDH2, the contribution of 2HG+5 to the total 2HG pool decreased in siIDH2-treated cells. Supporting the importance of citrate production by IDH2-mediated reductive carboxylation for hypoxic cell proliferation, siIDH2-transfected SF188 cells displayed a defect in cellular accumulation in hypoxia. Decreased expression of IDH2 protein following siIDH2 transfection was confirmed by Western blot. Collectively, these data point to the importance of mitochondrial IDH2 for the increase in reductive carboxylation flux of glutamine-derived α-ketoglutarate to maintain citrate levels in hypoxia, and to the importance of this reductive pathway for hypoxic cell proliferation.

Reprogramming of Metabolism by HIF1 in the Absence of Hypoxia Is Sufficient to Induce Increased Citrate Synthesis by Reductive Carboxylation Relative to Oxidative Metabolism.

The relative increase in the reductive metabolism of glutamine-derived α-ketoglutarate at 0.5% O2 may be explained by the decreased ability to carry out oxidative NAD+-dependent reactions as respiration is inhibited (1213). However, a shift to preferential reductive glutamine metabolism could also result from the active reprogramming of cellular metabolism by HIF1 (810), which inhibits the generation of mitochondrial acetyl-CoA necessary for the synthesis of citrate by oxidative glucose and glutamine metabolism (Fig. 5A). To better understand the role of HIF1 in reductive glutamine metabolism, we used VHL-deficient RCC4 cells, which display constitutive expression of HIF1α under normoxia (Fig. 5B). RCC4 cells expressing either a nontargeting control shRNA (shCTRL) or an shRNA directed at HIF1α (shHIF1α) were incubated in normoxia and cultured in medium with 4 mM [U-13C]glutamine. Following a 4-h labeling period, metabolites were extracted and the cellular citrate pool was analyzed by GC-MS. In shCTRL cells, which have constitutive HIF1α expression despite incubation in normoxia, the majority of the total citrate pool was constituted by the cit+5 species, with low levels of all other species including cit+4 (Fig. 5C). By contrast, in HIF1α-deficient cells the contribution of cit+5 to the total citrate pool was greatly decreased, whereas the contribution of cit+4 to the total citrate pool increased and was the most abundant citrate species. These data demonstrate that the relative enhancement of the reductive carboxylation pathway for citrate synthesis can be recapitulated by constitutive HIF1 activation in normoxia.

Reprogramming of metabolism by HIF1 in the absence of hypoxia

Reprogramming of metabolism by HIF1 in the absence of hypoxia

http://www.pnas.org/content/108/49/19611/F5.medium.gif

Reprogramming of metabolism by HIF1 in the absence of hypoxia is sufficient to induce reductive carboxylation of glutamine-derived α-ketoglutarate.

Fig. 5. Reprogramming of metabolism by HIF1 in the absence of hypoxia is sufficient to induce reductive carboxylation of glutamine-derived α-ketoglutarate. (A) Model depicting how HIF1 signaling’s inhibition of pyruvate dehydrogenase (PDH) activity and promotion of lactate dehydrogenase-A (LDH-A) activity can block the generation of mitochondrial acetyl-CoA from glucose-derived pyruvate, thereby favoring citrate synthesis from reductive carboxylation of glutamine-derived α-ketoglutarate. (B) Western blot demonstrating HIF1α protein in RCC4 VHL−/− cells in normoxia with a nontargeting shRNA (shCTRL), and the decrease in HIF1α protein in RCC4 VHL−/− cells stably expressing HIF1α shRNA (shHIF1α). (C) HIF1-induced reprogramming of glutamine metabolism. Cells from B at 21% O2 were cultured for 4 h in glutamine-deficient medium supplemented with 4 mM [U-13C]glutamine. Intracellular metabolites were then extracted, and 13C enrichment in cellular citrate was determined by GC-MS. Data shown are the mean ± SD of three independent cultures from a representative of three independent experiments. ***P < 0.001.

Compared with glucose metabolism, much less is known regarding how glutamine metabolism is altered under hypoxia. It has also remained unclear how hypoxic cells can maintain the citrate production necessary for macromolecular biosynthesis. In this report, we demonstrate that in contrast to cells at 21% O2, where citrate is predominantly synthesized through oxidative metabolism of both glucose and glutamine, reductive carboxylation of glutamine carbon becomes the major pathway of citrate synthesis in cells that can effectively proliferate at 0.5% O2. Moreover, we show that in these hypoxic cells, reductive carboxylation of glutamine-derived α-ketoglutarate is dependent on mitochondrial IDH2. Although others have previously suggested the existence of reductive carboxylation in cancer cells (1920), these studies failed to demonstrate the intracellular localization or specific IDH isoform responsible for the reductive carboxylation flux. Recently, we identified IDH2 as an isoform that contributes to reductive carboxylation in cancer cells incubated at 21% O2 (16), but remaining unclear were the physiological importance and regulation of this pathway relative to oxidative metabolism, as well as the conditions where this reductive pathway might be advantageous for proliferating cells.

Here we report that IDH2-mediated reductive carboxylation of glutamine-derived α-ketoglutarate to citrate is an important feature of cells proliferating in hypoxia. Moreover, the reliance on reductive glutamine metabolism can be recapitulated in normoxia by constitutive HIF1 activation in cells with loss of VHL. The mitochondrial NADPH/NADP+ ratio required to fuel the reductive reaction through IDH2 can arise from the increased NADH/NAD+ ratio existing in the mitochondria under hypoxic conditions (2122), with the transfer of electrons from NADH to NADP+ to generate NADPH occurring through the activity of the mitochondrial transhydrogenase (23). Our data do not exclude a complementary role for cytosolic IDH1 in impacting reductive glutamine metabolism, potentially through its oxidative function in an IDH2/IDH1 shuttle that transfers high energy electrons in the form of NADPH from mitochondria to cytosol (1624).

In further support of the increased mitochondrial reductive glutamine metabolism that we observe in hypoxia, we report here that incubation in hypoxia can lead to elevated 2HG levels in cells lacking IDH1/2 mutations. 2HG production from glutamine-derived α-ketoglutarate significantly decreased with knockdown of IDH2, supporting the conclusion that 2HG is produced in hypoxia by enhanced reverse flux of α-ketoglutarate through IDH2 in a truncated, noncarboxylating reductive reaction. However, other mechanisms may also contribute to 2HG elevation in hypoxia. These include diminished oxidative activity and/or enhanced reductive activity of the 2HG dehydrogenase, a mitochondrial enzyme that normally functions to oxidize 2HG back to α-ketoglutarate (25). The level of 2HG elevation we observe in hypoxic cells is associated with a concomitant increase in α-ketoglutarate, and is modest relative to that observed in cancers with IDH1/2 gain-of-function mutations. Nonetheless, 2HG elevation resulting from hypoxia in cells with wild-type IDH1/2 may hold promise as a cellular or serum biomarker for tissues undergoing chronic hypoxia and/or excessive glutamine metabolism.

The IDH2-dependent reductive carboxylation pathway that we propose in this report allows for continued citrate production from glutamine carbon when hypoxia and/or HIF1 activation prevents glucose carbon from contributing to citrate synthesis. Moreover, as opposed to continued oxidative TCA cycle functioning in hypoxia which can increase reactive oxygen species (ROS), reductive carboxylation of α-ketoglutarate in the mitochondria may serve as an electron sink that decreases the generation of ROS. HIF1 activity is not limited to the setting of hypoxia, as a common feature of several cancers is the normoxic stabilization of HIF1α through loss of the VHL tumor suppressor or other mechanisms. We demonstrate here that altered glutamine metabolism through a mitochondrial reductive pathway is a central aspect of hypoxic proliferating cell metabolism and HIF1-induced metabolic reprogramming. These findings are relevant for the understanding of numerous constitutive HIF1-expressing malignancies, as well as for populations, such as stem progenitor cells, which frequently proliferate in hypoxic conditions.

7.9.3 Hypoxia-Inducible Factors in Physiology and Medicine

Gregg L. Semenza
Cell. 2012 Feb 3; 148(3): 399–408.
http://dx.doi.org/10.1016%2Fj.cell.2012.01.021

Oxygen homeostasis represents an organizing principle for understanding metazoan evolution, development, physiology, and pathobiology. The hypoxia-inducible factors (HIFs) are transcriptional activators that function as master regulators of oxygen homeostasis in all metazoan species. Rapid progress is being made in elucidating homeostatic roles of HIFs in many physiological systems, determining pathological consequences of HIF dysregulation in chronic diseases, and investigating potential targeting of HIFs for therapeutic purposes. Oxygen homeostasis represents an organizing principle for understanding metazoan evolution, development, physiology, and pathobiology. The hypoxia-inducible factors (HIFs) are transcriptional activators that function as master regulators of oxygen homeostasis in all metazoan species. Rapid progress is being made in elucidating homeostatic roles of HIFs in many physiological systems, determining pathological consequences of HIF dysregulation in chronic diseases, and investigating potential targeting of HIFs for therapeutic purposes.


Oxygen is central to biology because of its utilization in the process of respiration. O2 serves as the final electron acceptor in oxidative phosphorylation, which carries with it the risk of generating reactive oxygen species (ROS) that react with cellular macromolecules and alter their biochemical or physical properties, resulting in cell dysfunction or death. As a consequence, metazoan organisms have evolved elaborate cellular metabolic and systemic physiological systems that are designed to maintain oxygen homeostasis. This review will focus on the role of hypoxia-inducible factors (HIFs) as master regulators of oxygen homeostasis and, in particular, on recent advances in understanding their roles in physiology and medicine. Due to space limitations and the remarkably pleiotropic effects of HIFs, the description of such roles will be illustrative rather than comprehensive.

O2 and Evolution, Part 1

Accumulation of O2 in Earth’s atmosphere starting ~2.5 billion years ago led to evolution of the extraordinarily efficient system of oxidative phosphorylation that transfers chemical energy stored in carbon bonds of organic molecules to the high-energy phosphate bond in ATP, which is used to power physicochemical reactions in living cells. Energy produced by mitochondrial respiration is sufficient to power the development and maintenance of multicellular organisms, which could not be sustained by energy produced by glycolysis alone (Lane and Martin, 2010). The modest dimensions of primitive metazoan species were such that O2 could diffuse from the atmosphere to all of the organism’s thousand cells, as is the case for the worm Caenorhabditis elegans. To escape the constraints placed on organismal growth by diffusion, systems designed to conduct air to cells deep within the body evolved and were sufficient for O2delivery to organisms with hundreds of thousands of cells, such as the fly Drosophila melanogaster. The final leap in body scale occurred in vertebrates and was associated with the evolution of complex respiratory, circulatory, and nervous systems designed to efficiently capture and distribute O2 to hundreds of millions of millions of cells in the case of the adult Homo sapiens.

Hypoxia-Inducible Factors

Hypoxia-inducible factor 1 (HIF-1) is expressed by all extant metazoan species analyzed (Loenarz et al., 2011). HIF-1 consists of HIF-1α and HIF-1β subunits, which each contain basic helix-loop-helix-PAS (bHLH-PAS) domains (Wang et al., 1995) that mediate heterodimerization and DNA binding (Jiang et al., 1996a). HIF-1β heterodimerizes with other bHLH-PAS proteins and is present in excess, such that HIF-1α protein levels determine HIF-1 transcriptional activity (Semenza et al., 1996).

Under well-oxygenated conditions, HIF-1α is bound by the von Hippel-Lindau (VHL) protein, which recruits an ubiquitin ligase that targets HIF-1α for proteasomal degradation (Kaelin and Ratcliffe, 2008). VHL binding is dependent upon hydroxylation of a specific proline residue in HIF-1α by the prolyl hydroxylase PHD2, which uses O2 as a substrate such that its activity is inhibited under hypoxic conditions (Epstein et al., 2001). In the reaction, one oxygen atom is inserted into the prolyl residue and the other atom is inserted into the co-substrate α-ketoglutarate, splitting it into CO2 and succinate (Kaelin and Ratcliffe, 2008). Factor inhibiting HIF-1 (FIH-1) represses HIF-1α transactivation function (Mahon et al., 2001) by hydroxylating an asparaginyl residue, using O2 and α-ketoglutarate as substrates, thereby blocking the association of HIF-1α with the p300 coactivator protein (Lando et al., 2002). Dimethyloxalylglycine (DMOG), a competitive antagonist of α-ketoglutarate, inhibits the hydroxylases and induces HIF-1-dependent transcription (Epstein et al., 2001). HIF-1 activity is also induced by iron chelators (such as desferrioxamine) and cobalt chloride, which inhibit hydroxylases by displacing Fe(II) from the catalytic center (Epstein et al., 2001).

Studies in cultured cells (Jiang et al., 1996b) and isolated, perfused, and ventilated lung preparations (Yu et al., 1998) revealed an exponential increase in HIF-1α levels at O2 concentrations less than 6% (~40 mm Hg), which is not explained by known biochemical properties of the hydroxylases. In most adult tissues, O2concentrations are in the range of 3-5% and any decrease occurs along the steep portion of the dose-response curve, allowing a graded response to hypoxia. Analyses of cultured human cells have revealed that expression of hundreds of genes was increased in response to hypoxia in a HIF-1-dependent manner (as determined by RNA interference) with direct binding of HIF-1 to the gene (as determined by chromatin immunoprecipitation [ChIP] assays); in addition, the expression of hundreds of genes was decreased in response to hypoxia in a HIF-1-dependent manner but binding of HIF-1 to these genes was not detected (Mole et al., 2009), indicating that HIF-dependent repression occurs via indirect mechanisms, which include HIF-1-dependent expression of transcriptional repressors (Yun et al., 2002) and microRNAs (Kulshreshtha et al., 2007). ChIP-seq studies have revealed that only 40% of HIF-1 binding sites are located within 2.5 kb of the transcription start site (Schödel et al., 2011).

In vertebrates, HIF-2α is a HIF-1α paralog that is also regulated by prolyl and asparaginyl hydroxylation and dimerizes with HIF-1β, but is expressed in a cell-restricted manner and plays important roles in erythropoiesis, vascularization, and pulmonary development, as described below. In D. melanogaster, the gene encoding the HIF-1α ortholog is designated similar and its paralog is designated trachealess because inactivating mutations result in defective development of the tracheal tubes (Wilk et al., 1996). In contrast, C. elegans has only a single HIF-1α homolog (Epstein et al., 2001). Thus, in both invertebrates and vertebrates, evolution of specialized systems for O2 delivery was associated with the appearance of a HIF-1α paralog.

O2 and Metabolism

The regulation of metabolism is a principal and primordial function of HIF-1. Under hypoxic conditions, HIF-1 mediates a transition from oxidative to glycolytic metabolism through its regulation of: PDK1, encoding pyruvate dehydrogenase (PDH) kinase 1, which phosphorylates and inactivates PDH, thereby inhibiting the conversion of pyruvate to acetyl coenzyme A for entry into the tricarboxylic acid cycle (Kim et al., 2006Papandreou et al., 2006); LDHA, encoding lactate dehydrogenase A, which converts pyruvate to lactate (Semenza et al. 1996); and BNIP3 (Zhang et al. 2008) and BNIP3L (Bellot et al., 2009), which mediate selective mitochondrial autophagy (Figure 1). HIF-1 also mediates a subunit switch in cytochrome coxidase that improves the efficiency of electron transfer under hypoxic conditions (Fukuda et al., 2007). An analogous subunit switch is also observed in Saccharomyces cerevisiae, although it is mediated by a completely different mechanism (yeast lack HIF-1), suggesting that it may represent a fundamental response of eukaryotic cells to hypoxia.

Regulation of Glucose Metabolism nihms-350382-f0001

Regulation of Glucose Metabolism nihms-350382-f0001

Regulation of Glucose Metabolism

http://www.ncbi.nlm.nih.gov/pmc/articles/PMC3437543/bin/nihms-350382-f0001.gif
Figure 1
Regulation of Glucose Metabolism

It is conventional wisdom that cells switch to glycolysis when O2 becomes limiting for mitochondrial ATP production. Yet, HIF-1α-null mouse embryo fibroblasts, which do not down-regulate respiration under hypoxic conditions, have higher ATP levels at 1% O2 than wild-type cells at 20% O2, demonstrating that under these conditions O2 is not limiting for ATP production (Zhang et al., 2008). However, the HIF-1α-null cells die under prolonged hypoxic conditions due to ROS toxicity (Kim et al. 2006Zhang et al., 2008). These studies have led to a paradigm shift with regard to our understanding of the regulation of cellular metabolism (Semenza, 2011): the purpose of this switch is to prevent excess mitochondrial generation of ROS that would otherwise occur due to the reduced efficiency of electron transfer under hypoxic conditions (Chandel et al., 1998). This may be particularly important in stem cells, in which avoidance of DNA damage is critical (Suda et al., 2011).

Role of HIFs in Development

Much of mammalian embryogenesis occurs at O2 concentrations of 1-5% and O2 functions as a morphogen (through HIFs) in many developmental systems (Dunwoodie, 2009). Mice that are homozygous for a null allele at the locus encoding HIF-1α die by embryonic day 10.5 with cardiac malformations, vascular defects, and impaired erythropoiesis, indicating that all three components of the circulatory system are dependent upon HIF-1 for normal development (Iyer et al., 1998Yoon et al., 2011). Depending on the genetic background, mice lacking HIF-2α: die by embryonic day 12.5 with vascular defects (Peng et al., 2000) or bradycardia due to deficient catecholamine production (Tian et al., 1998); die as neonates due to impaired lung maturation (Compernolle et al., 2002); or die several months after birth due to ROS-mediated multi-organ failure (Scortegagna et al., 2003). Thus, while vertebrate evolution was associated with concomitant appearance of the circulatory system and HIF-2α, both HIF-1 and HIF-2 have important roles in circulatory system development. Conditional knockout of HIF-1α in specific cell types has demonstrated important roles in chondrogenesis (Schipani et al., 2001), adipogenesis (Yun et al., 2002), B-lymphocyte development (Kojima et al., 2002), osteogenesis (Wang et al., 2007), hematopoiesis (Takubo et al., 2010), T-lymphocyte differentiation (Dang et al., 2011), and innate immunity (Zinkernagel et al., 2007). While knockout mouse experiments point to the adverse effects of HIF-1 loss-of-function on development, it is also possible that increased HIF-1 activity, induced by hypoxia in embryonic tissues as a result of abnormalities in placental blood flow, may also dysregulate development and result in congenital malformations. For example, HIF-1α has been shown to interact with, and stimulate the transcriptional activity of, Notch, which plays a key role in many developmental pathways (Gustafsson et al., 2005).

Translational Prospects

Drug discovery programs have been initiated at many pharmaceutical and biotech companies to develop prolyl hydroxylase inhibitors (PHIs) that, as described above for DMOG, induce HIF activity for treatment of disorders in which HIF mediates protective physiological responses. Local and/or short term induction of HIF activity by PHIs, gene therapy, or other means are likely to be useful novel therapies for many of the diseases described above. In the case of ischemic cardiovascular disease, local therapy is needed to provide homing signals for the recruitment of BMDACs. Chronic systemic use of PHIs must be approached with great caution: individuals with genetic mutations that constitutively activate the HIF pathway (described below) have increased incidence of cardiovascular disease and mortality (Yoon et al., 2011). On the other hand, the profound inhibition of HIF activity and vascular responses to ischemia that are associated with aging suggest that systemic replacement therapy might be contemplated as a preventive measure for subjects in whom impaired HIF responses to hypoxia can be documented. In C. elegans, VHL loss-of-function increases lifespan in a HIF-1-dependent manner (Mehta et al., 2009), providing further evidence for a mutually antagonistic relationship between HIF-1 and aging.

Cancer

Cancers contain hypoxic regions as a result of high rates of cell proliferation coupled with the formation of vasculature that is structurally and functionally abnormal. Increased HIF-1α and/or HIF-2α levels in diagnostic tumor biopsies are associated with increased risk of mortality in cancers of the bladder, brain, breast, colon, cervix, endometrium, head/neck, lung, ovary, pancreas, prostate, rectum, and stomach; these results are complemented by experimental studies, which demonstrate that genetic manipulations that increase HIF-1α expression result in increased tumor growth, whereas loss of HIF activity results in decreased tumor growth (Semenza, 2010). HIFs are also activated by genetic alterations, most notably, VHL loss of function in clear cell renal carcinoma (Majmunder et al., 2010). HIFs activate transcription of genes that play key roles in critical aspects of cancer biology, including stem cell maintenance (Wang et al., 2011), cell immortalization, epithelial-mesenchymal transition (Mak et al., 2010), genetic instability (Huang et al., 2007), vascularization (Liao and Johnson, 2007), glucose metabolism (Luo et al., 2011), pH regulation (Swietach et al., 2007), immune evasion (Lukashev et al., 2007), invasion and metastasis (Chan and Giaccia, 2007), and radiation resistance (Moeller et al., 2007). Given the extensive validation of HIF-1 as a potential therapeutic target, drugs that inhibit HIF-1 have been identified and shown to have anti-cancer effects in xenograft models (Table 1Semenza, 2010).

Table 1  Drugs that Inhibit HIF-1

Process Inhibited Drug Class Prototype
HIF-1 α synthesis Cardiac glycosidemTOR inhibitorMicrotubule targeting agent

Topoisomerase I inhibitor

DigoxinRapamycin2-Methoxyestradiol

Topotecan

HIF-1 α protein stability HDAC inhibitorHSP90 inhibitorCalcineurin inhibitor

Guanylate cyclase activator

LAQ82417-AAGCyclosporine

YC-1

Heterodimerization Antimicrobial agent Acriflavine
DNA binding AnthracyclineQuinoxaline antibiotic DoxorubicinEchinomycin
Transactivation Proteasome inhibitorAntifungal agent BortezomibAmphotericin B
Signal transduction BCR-ABL inhibitorCyclooxygenase inhibitorEGFR inhibitor

HER2 inhibitor

ImatinibIbuprofenErlotinib, Gefitinib

Trastuzumab

Over 100 women die every day of breast cancer in the U.S. The mean PO2 is 10 mm Hg in breast cancer as compared to > 60 mm Hg in normal breast tissue and cancers with PO2 < 10 mm Hg are associated with increased risk of metastasis and patient mortality (Vaupel et al., 2004). Increased HIF-1α protein levels, as identified by immunohistochemical analysis of tumor biopsies, are associated with increased risk of metastasis and/or patient mortality in unselected breast cancer patients and in lymph node-positive, lymph node-negative, HER2+, or estrogen receptor+ subpopulations (Semenza, 2011). Metastasis is responsible for > 90% of breast cancer mortality. The requirement for HIF-1 in breast cancer metastasis has been demonstrated for both autochthonous tumors in transgenic mice (Liao et al., 2007) and orthotopic transplants in immunodeficient mice (Zhang et al., 2011Wong et al., 2011). Primary tumors direct the recruitment of bone marrow-derived cells to the lungs and other sites of metastasis (Kaplan et al., 2005). In breast cancer, hypoxia induces the expression of lysyl oxidase (LOX), a secreted protein that remodels collagen at sites of metastatic niche formation (Erler et al., 2009). In addition to LOX, breast cancers also express LOX-like proteins 2 and 4. LOX, LOXL2, and LOXL4 are all HIF-1-regulated genes and HIF-1 inhibition blocks metastatic niche formation regardless of which LOX/LOXL protein is expressed, whereas available LOX inhibitors are not effective against all LOXL proteins (Wong et al., 2011), again illustrating the role of HIF-1 as a master regulator that controls the expression of multiple genes involved in a single (patho)physiological process.

Translational Prospects

Small molecule inhibitors of HIF activity that have anti-cancer effects in mouse models have been identified (Table 1). Inhibition of HIF impairs both vascular and metabolic adaptations to hypoxia, which may decrease O2 delivery and increase O2 utilization. These drugs are likely to be useful (as components of multidrug regimens) in the treatment of a subset of cancer patients in whom high HIF activity is driving progression. As with all novel cancer therapeutics, successful translation will require the development of methods for identifying the appropriate patient cohort. Effects of combination drug therapy also need to be considered. VEGF receptor tyrosine kinase inhibitors, which induce tumor hypoxia by blocking vascularization, have been reported to increase metastasis in mouse models (Ebos et al., 2009), which may be mediated by HIF-1; if so, combined use of HIF-1 inhibitors with these drugs may prevent unintended counter-therapeutic effects.

HIF inhibitors may also be useful in the treatment of other diseases in which dysregulated HIF activity is pathogenic. Proof of principle has been established in mouse models of ocular neovascularization, a major cause of blindness in the developed world, in which systemic or intraocular injection of the HIF-1 inhibitor digoxin is therapeutic (Yoshida et al., 2010). Systemic administration of HIF inhibitors for cancer therapy would be contraindicated in patients who also have ischemic cardiovascular disease, in which HIF activity is protective. The analysis of SNPs at the HIF1A locus described above suggests that the population may include HIF hypo-responders, who are at increased risk of severe ischemic cardiovascular disease. It is also possible that HIF hyper-responders, such as individuals with hereditary erythrocytosis, are at increased risk of particularly aggressive cancer.

O2 and Evolution, Part 2

When lowlanders sojourn to high altitude, hypobaric hypoxia induces erythropoiesis, which is a relatively ineffective response because the problem is not insufficient red cells, but rather insufficient ambient O2. Chronic erythrocytosis increases the risk of heart attack, stroke, and fetal loss during pregnancy. Many high-altitude Tibetans maintain the same hemoglobin concentration as lowlanders and yet, despite severe hypoxemia, they also maintain aerobic metabolism. The basis for this remarkable evolutionary adaptation appears to have involved the selection of genetic variants at multiple loci encoding components of the oxygen sensing system, particularly HIF-2α (Beall et al., 2010Simonson et al., 2010Yi et al., 2010). Given that hereditary erythrocytosis is associated with modest HIF-2α gain-of-function, the Tibetan genotype associated with absence of an erythrocytotic response to hypoxia may encode reduced HIF-2α activity along with other alterations that increase metabolic efficiency. Delineating the molecular mechanisms underlying these metabolic adaptations may lead to novel therapies for ischemic disorders, illustrating the importance of oxygen homeostasis as a nexus where evolution, biology, and medicine converge.

7.9.4 Hypoxia-inducible factor 1. Regulator of mitochondrial metabolism and mediator of ischemic preconditioning

Semenza GL1.
Biochim Biophys Acta. 2011 Jul; 1813(7):1263-8.
http://dx.doi.org/10.1016%2Fj.bbamcr.2010.08.006

Hypoxia-inducible factor 1 (HIF-1) mediates adaptive responses to reduced oxygen availability by regulating gene expression. A critical cell-autonomous adaptive response to chronic hypoxia controlled by HIF-1 is reduced mitochondrial mass and/or metabolism. Exposure of HIF-1-deficient fibroblasts to chronic hypoxia results in cell death due to excessive levels of reactive oxygen species (ROS). HIF-1 reduces ROS production under hypoxic conditions by multiple mechanisms including: a subunit switch in cytochrome c oxidase from the COX4-1 to COX4-2 regulatory subunit that increases the efficiency of complex IV; induction of pyruvate dehydrogenase kinase 1, which shunts pyruvate away from the mitochondria; induction of BNIP3, which triggers mitochondrial selective autophagy; and induction of microRNA-210, which blocks assembly of Fe/S clusters that are required for oxidative phosphorylation. HIF-1 is also required for ischemic preconditioning and this effect may be due in part to its induction of CD73, the enzyme that produces adenosine. HIF-1-dependent regulation of mitochondrial metabolism may also contribute to the protective effects of ischemic preconditioning.

The story of life on Earth is a tale of oxygen production and utilization. Approximately 3 billion years ago, primitive single-celled organisms evolved the capacity for photosynthesis, a biochemical process in which photons of solar energy are captured by chlorophyll and used to power the reaction of CO2 and H2O to form glucose and O2. The subsequent rise in the atmospheric O2 concentration over the next billion years set the stage for the ascendance of organisms with the capacity for respiration, a process that consumes glucose and O2 and generates CO2, H2O, and energy in the form of ATP. Some of these single-celled organisms eventually took up residence within the cytoplasm of other cells and devoted all of their effort to energy production as mitochondria. Compared to the conversion of glucose to lactate by glycolysis, the complete oxidation of glucose by respiration provided such a large increase in energy production that it made possible the evolution of multicellular organisms. Among metazoan organisms, the progressive increase in body size during evolution was accompanied by progressively more complex anatomic structures that function to ensure the adequate delivery of O2 to all cells, ultimately resulting in the sophisticated circulatory and respiratory systems of vertebrates.

All metazoan cells can sense and respond to reduced O2 availability (hypoxia). Adaptive responses to hypoxia can be cell autonomous, such as the alterations in mitochondrial metabolism that are described below, or non-cell-autonomous, such as changes in tissue vascularization (reviewed in ref. 1). Primary responses to hypoxia need to be distinguished from secondary responses to sequelae of hypoxia, such as the adaptive responses to ATP depletion that are mediated by AMP kinase (reviewed in ref 2). In contrast, recent data suggest that O2 and redox homeostasis are inextricably linked and that changes in oxygenation are inevitably associated with changes in the levels of reactive oxygen species (ROS), as will be discussed below.

HIF-1 Regulates Oxygen Homeostasis in All Metazoan Species

A key regulator of the developmental and physiological networks required for the maintenance of O2homeostasis is hypoxia-inducible factor 1 (HIF-1). HIF-1 is a heterodimeric transcription factor that is composed of an O2-regulated HIF-1α subunit and a constitutively expressed HIF-1β subunit [3,4]. HIF-1 regulates the expression of hundreds of genes through several major mechanisms. First, HIF-1 binds directly to hypoxia response elements, which are cis-acting DNA sequences located within target genes [5]. The binding of HIF-1 results in the recruitment of co-activator proteins that activate gene transcription (Fig. 1A). Only rarely does HIF-1 binding result in transcriptional repression [6]. Instead, HIF-1 represses gene expression by indirect mechanisms, which are described below. Second, among the genes activated by HIF-1 are many that encode transcription factors [7], which when synthesized can bind to and regulate (either positively or negatively) secondary batteries of target genes (Fig. 1B). Third, another group of HIF-1 target genes encode members of the Jumonji domain family of histone demethylases [8,9], which regulate gene expression by modifying chromatin structure (Fig. 1C). Fourth, HIF-1 can activate the transcription of genes encoding microRNAs [10], which bind to specific mRNA molecules and either block their translation or mediate their degradation (Fig. 1D). Fifth, the isolated HIF-1α subunit can bind to other transcription factors [11,12] and inhibit (Fig. 1E) or potentiate (Fig. 1F) their activity.

Mechanisms by which HIF-1 regulates gene expression. nihms232046f1

Mechanisms by which HIF-1 regulates gene expression. nihms232046f1

Mechanisms by which HIF-1 regulates gene expression.

http://www.ncbi.nlm.nih.gov/pmc/articles/PMC3010308/bin/nihms232046f1.gif

Fig. 1 Mechanisms by which HIF-1 regulates gene expression. (A) Top: HIF-1 binds directly to target genes at a cis-acting hypoxia response element (HRE) and recruits coactivator proteins such as p300 to increase gene transcription.

HIF-1α and HIF-1β are present in all metazoan species, including the simple roundworm Caenorhabitis elegans [13], which consists of ~103 cells and has no specialized systems for O2 delivery. The fruit flyDrosophila melanogaster evolved tracheal tubes, which conduct air into the interior of the body from which it diffuses to surrounding cells. In vertebrates, the development of the circulatory and respiratory systems was accompanied by the appearance of HIF-2α, which is also O2-regulated and heterodimerizes with HIF-1β [14] but is only expressed in a restricted number of cell types [15], whereas HIF-1α and HIF-1β are expressed in all human and mouse tissues [16]. In Drosophila, the ubiquitiously expressed HIF-1α ortholog is designatedSimilar [17] and the paralogous gene that is expressed specifically in tracheal tubes is designated Trachealess[18].

HIF-1 Activity is Regulated by Oxygen

In the presence of O2, HIF-1α and HIF-2α are subjected to hydroxylation by prolyl-4-hydroxylase domain proteins (PHDs) that use O2 and α-ketoglutarate as substrates and generate CO2 and succinate as by-products [19]. Prolyl hydroxylation is required for binding of the von Hipple-Lindau protein, which recruits a ubiquitin-protein ligase that targets HIF-1α and HIF-2α for proteasomal degradation (Fig. 2). Under hypoxic conditions, the rate of hydroxylation declines and the non-hydroxylated proteins accumulate. HIF-1α transactivation domain function is also O2-regulated [20,21]. Factor inhibiting HIF-1 (FIH-1) represses transactivation domain function [22] by hydroxylating asparagine residue 803 in HIF-1α, thereby blocking the binding of the co-activators p300 and CBP [23].

Negative regulation of HIF-1 activity by oxygen nihms232046f2

Negative regulation of HIF-1 activity by oxygen nihms232046f2

Negative regulation of HIF-1 activity by oxygen

http://www.ncbi.nlm.nih.gov/pmc/articles/PMC3010308/bin/nihms232046f2.gif

Fig. 2 Negative regulation of HIF-1 activity by oxygen. Top: In the presence of O2: prolyl hydroxylation of HIF-1a leads to binding of the von Hippel-Lindau protein (VHL), which recruits a ubiquitin protein-ligase that targets HIF-1a for proteasomal degradation;

When cells are acutely exposed to hypoxic conditions, the generation of ROS at complex III of the mitochondrial electron transport chain (ETC) increases and is required for the induction of HIF-1α protein levels [24]. More than a decade after these observations were first made, the precise mechanism by which hypoxia increases ROS generation and by which ROS induces HIF-1α accumulation remain unknown. However, the prolyl and asparaginyl hydroxylases contain Fe2+ in their active site and oxidation to Fe3+would block their catalytic activity. Since O2 is a substrate for the hydroxylation reaction, anoxia also results in a loss of enzyme activity. However, the concentration at which O2 becomes limiting for prolyl or asparaginyl hydroxylase activity in vivo is not known.

HIF-1 Regulates the Balance Between Oxidative and Glycolytic Metabolism

All metazoan organisms depend on mitochondrial respiration as the primary mechanism for generating sufficient amounts of ATP to maintain cellular and systemic homeostasis. Respiration, in turn, is dependent on an adequate supply of O2 to serve as the final electron acceptor in the ETC. In this process, electrons are transferred from complex I (or complex II) to complex III, then to complex IV, and finally to O2, which is reduced to water. This orderly transfer of electrons generates a proton gradient across the inner mitochondrial membrane that is used to drive the synthesis of ATP. At each step of this process, some electrons combine with O2 prematurely, resulting in the production of superoxide anion, which is reduced to hydrogen peroxide through the activity of mitochondrial superoxide dismutase. The efficiency of electron transport appears to be optimized to the physiological range of O2 concentrations, such that ATP is produced without the production of excess superoxide, hydrogen peroxide, and other ROS at levels that would result in the increased oxidation of cellular macromolecules and subsequent cellular dysfunction or death. In contrast, when O2levels are acutely increased or decreased, an imbalance between O2 and electron flow occurs, which results in increased ROS production.

MEFs require HIF-1 activity to make two critical metabolic adaptations to chronic hypoxia. First, HIF-1 activates the gene encoding pyruvate dehydrogenase (PDH) kinase 1 (PDK1), which phosphorylates and inactivates the catalytic subunit of PDH, the enzyme that converts pyruvate to acetyl coenzyme A (AcCoA) for entry into the mitochondrial tricarboxylic acid (TCA) cycle [25]. Second, HIF-1 activates the gene encoding BNIP3, a member of the Bcl-2 family of mitochondrial proteins, which triggers selective mitochondrial autophagy [26]. Interference with the induction of either of these proteins in hypoxic cells results in increased ROS production and increased cell death. Overexpression of either PDK1 or BNIP3 rescues HIF-1α-null MEFs. By shunting pyruvate away from the mitochondria, PDK1 decreases flux through the ETC and thereby counteracts the reduced efficiency of electron transport under hypoxic conditions, which would otherwise increase ROS production. PDK1 functions cooperatively with the product of another HIF-1 target gene, LDHA [27], which converts pyruvate to lactate, thereby further reducing available substrate for the PDH reaction.

PDK1 effectively reduces flux through the TCA cycle and thereby reduces flux through the ETC in cells that primarily utilize glucose as a substrate for oxidative phosphorylation. However, PDK1 is predicted to have little effect on ROS generation in cells that utilize fatty acid oxidation as their source of AcCoA. Hence another strategy to reduce ROS generation under hypoxic conditions is selective mitochondrial autophagy [26]. MEFs reduce their mitochondrial mass and O2 consumption by >50% after only two days at 1% O2. BNIP3 competes with Beclin-1 for binding to Bcl-2, thereby freeing Beclin-1 to activate autophagy. Using short hairpin RNAs to knockdown expression of BNIP3, Beclin-1, or Atg5 (another component of the autophagy machinery) phenocopied HIF-1α-null cells by preventing hypoxia-induced reductions in mitochondrial mass and O2 consumption as a result of failure to induce autophagy [26]. HIF-1-regulated expression of BNIP3L also contributes to hypoxia-induced autophagy [28]. Remarkably, mice heterozygous for the HIF-1α KO allele have a significantly increased ratio of mitochondrial:nuclear DNA in their lungs (even though this is the organ that is exposed to the highest O2 concentrations), indicating that HIF-1 regulates mitochondrial mass under physiological conditions in vivo [26]. In contrast to the selective mitochondrial autophagy that is induced in response to hypoxia as described above, autophagy (of unspecified cellular components) induced by anoxia does not require HIF-1, BNIP3, or BNIP3L, but is instead regulated by AMP kinase [29].

The multiplicity of HIF-1-mediated mechanisms identified so far by which cells regulate mitochondrial metabolism in response to changes in cellular O2 concentration (Fig. 3) suggests that this is a critical adaptive response to hypoxia. The fundamental nature of this physiological response is underscored by the fact that yeast also switch COX4 subunits in an O2-dependent manner but do so by an entirely different molecular mechanism [33], since yeast do not have a HIF-1α homologue. Thus, it appears that by convergent evolution both unicellular and multicellular eukaryotes possess mechanisms by which they modulate mitochondrial metabolism to maintain redox homeostasis despite changes in O2 availability. Indeed, it is the balance between energy, oxygen, and redox homeostasis that represents the key to life with oxygen.

Regulation of mitochondrial metabolism by HIF-1  nihms232046f3

Regulation of mitochondrial metabolism by HIF-1 nihms232046f3

Regulation of mitochondrial metabolism by HIF-1α

http://www.ncbi.nlm.nih.gov/pmc/articles/PMC3010308/bin/nihms232046f3.gif

Fig. 3 Regulation of mitochondrial metabolism by HIF-1α. Acute hypoxia leads to increased mitochondrial generation of reactive oxygen species (ROS). Decreased O2 and increased ROS levels lead to decreased HIF-1α hydroxylation (see Fig. 2) and increased HIF-1-dependent 


7.9.5 Regulation of cancer cell metabolism by hypoxia-inducible factor 1

Semenza GL1.
Semin Cancer Biol. 2009 Feb; 19(1):12-6.

The Warburg Effect: The Re-discovery of the Importance of Aerobic Glycolysis in Tumor Cells
http://dx.doi.org:/10.1016/j.semcancer.2008.11.009

The induction of hypoxia-inducible factor 1 (HIF-1) activity, either as a result of intratumoral hypoxia or loss-of-function mutations in the VHL gene, leads to a dramatic reprogramming of cancer cell metabolism involving increased glucose transport into the cell, increased conversion of glucose to pyruvate, and a concomitant decrease in mitochondrial metabolism and mitochondrial mass. Blocking these adaptive metabolic responses to hypoxia leads to cell death due to toxic levels of reactive oxygen species. Targeting HIF-1 or metabolic enzymes encoded by HIF-1 target genes may represent a novel therapeutic approach to cancer.

http://ars.els-cdn.com/content/image/1-s2.0-S1044579X08001065-gr1.sml

http://ars.els-cdn.com/content/image/1-s2.0-S1044579X08001065-gr2.sml

7.9.6 Coming up for air. HIF-1 and mitochondrial oxygen consumption

Simon MC1.
Cell Metab. 2006 Mar;3(3):150-1.
http://dx.doi.org/10.1016/j.cmet.2006.02.007

Hypoxic cells induce glycolytic enzymes; this HIF-1-mediated metabolic adaptation increases glucose flux to pyruvate and produces glycolytic ATP. Two papers in this issue of Cell Metabolism (Kim et al., 2006; Papandreou et al., 2006) demonstrate that HIF-1 also influences mitochondrial function, suppressing both the TCA cycle and respiration by inducing pyruvate dehydrogenase kinase 1 (PDK1). PDK1 regulation in hypoxic cells promotes cell survival.

Comment on

Oxygen deprivation (hypoxia) occurs in tissues when O2 supply via the cardiovascular system fails to meet the demand of O2-consuming cells. Hypoxia occurs naturally in physiological settings (e.g., embryonic development and exercising muscle), as well as in pathophysiological conditions (e.g., myocardial infarction, inflammation, and solid tumor formation). For over a century, it has been appreciated that O2-deprived cells exhibit increased conversion of glucose to lactate (the “Pasteur effect”). Activation of the Pasteur effect during hypoxia in mammalian cells is facilitated by HIF-1, which mediates the upregulation of glycolytic enzymes that support an increase in glycolytic ATP production as mitochondria become starved for O2, the substrate for oxidative phosphorylation (Seagroves et al., 2001). Thus, mitochondrial respiration passively decreases due to O2 depletion in hypoxic tissues. However, reports by Kim et al. (2006) and Papandreou et al. (2006) in this issue of Cell Metabolism demonstrate that this critical metabolic adaptation is more complex and includes an active suppression of mitochondrial pyruvate catabolism and O2consumption by HIF-1.

Mitochondrial oxidative phosphorylation is regulated by multiple mechanisms, including substrate availability. Major substrates include O2 (the terminal electron acceptor) and pyruvate (the primary carbon source). Pyruvate, as the end product of glycolysis, is converted to acetyl-CoA by the pyruvate dehydrogenase enzymatic complex and enters the tricarboxylic acid (TCA) cycle. Pyruvate conversion into acetyl-CoA is irreversible; this therefore represents an important regulatory point in cellular energy metabolism. Pyruvate dehydrogenase kinase (PDK) inhibits pyruvate dehydrogenase activity by phosphorylating its E1 subunit (Sugden and Holness, 2003). In the manuscripts by Kim et al. (2006) and Papandreou et al. (2006), the authors find that PDK1 is a HIF-1 target gene that actively regulates mitochondrial respiration by limiting pyruvate entry into the TCA cycle. By excluding pyruvate from mitochondrial metabolism, hypoxic cells accumulate pyruvate, which is then converted into lactate via lactate dehydrogenase (LDH), another HIF-1-regulated enzyme. Lactate in turn is released into the extracellular space, regenerating NAD+ for continued glycolysis by O2-starved cells (see Figure 1). This HIF-1-dependent block to mitochondrial O2 consumption promotes cell survival, especially when O2 deprivation is severe and prolonged.

multiple-hypoxia-induced-cellular-metabolic-changes-are-regulated-by-hif-1

multiple-hypoxia-induced-cellular-metabolic-changes-are-regulated-by-hif-1

http://ars.els-cdn.com/content/image/1-s2.0-S1550413106000672-gr1.jpg

Figure 1. Multiple hypoxia-induced cellular metabolic changes are regulated by HIF-1

By stimulating the expression of glucose transporters and glycolytic enzymes, HIF-1 promotes glycolysis to generate increased levels of pyruvate. In addition, HIF-1 promotes pyruvate reduction to lactate by activating lactate dehydrogenase (LDH). Pyruvate reduction to lactate regenerates NAD+, which permits continued glycolysis and ATP production by hypoxic cells. Furthermore, HIF-1 induces pyruvate dehydrogenase kinase 1 (PDK1), which inhibits pyruvate dehydrogenase and blocks conversion of pyruvate to acetyl CoA, resulting in decreased flux through the tricarboxylic acid (TCA) cycle. Decreased TCA cycle activity results in attenuation of oxidative phosphorylation and excessive mitochondrial reactive oxygen species (ROS) production. Because hypoxic cells already exhibit increased ROS, which have been shown to promote HIF-1 accumulation, the induction of PDK1 prevents the persistence of potentially harmful ROS levels.

Papandreou et al. demonstrate that hypoxic regulation of PDK has important implications for antitumor therapies. Recent interest has focused on cytotoxins that target hypoxic cells in tumor microenvironments, such as the drug tirapazamine (TPZ). Because intracellular O2 concentrations are decreased by mitochondrial O2 consumption, HIF-1 could protect tumor cells from TPZ-mediated cell death by maintaining intracellular O2 levels. Indeed, Papandreou et al. show that HIF-1-deficient cells grown at 2% O2 exhibit increased sensitivity to TPZ relative to wild-type cells, presumably due to higher rates of mitochondrial O2 consumption. HIF-1 inhibition in hypoxic tumor cells should have multiple therapeutic benefits, but the use of HIF-1 inhibitors in conjunction with other treatments has to be carefully evaluated for the most effective combination and sequence of drug delivery. One result of HIF-1 inhibition would be a relative decrease in intracellular O2 levels, making hypoxic cytotoxins such as TPZ more potent antitumor agents. Because PDK expression has been detected in multiple human tumor samples and appears to be induced by hypoxia (Koukourakis et al., 2005), small molecule inhibitors of HIF-1 combined with TPZ represent an attractive therapeutic approach for future clinical studies.

Hypoxic regulation of PDK1 has other important implications for cell survival during O2 depletion. Because the TCA cycle is coupled to electron transport, Kim et al. suggest that induction of the pyruvate dehydrogenase complex by PDK1 attenuates not only mitochondrial respiration but also the production of mitochondrial reactive oxygen species (ROS) in hypoxic cells. ROS are a byproduct of electron transfer to O2, and cells cultured at 1 to 5% O2 generate increased mitochondrial ROS relative to those cultured at 21% O2 (Chandel et al., 1998 and Guzy et al., 2005). In fact, hypoxia-induced mitochondrial ROS have also been shown to be necessary for the stabilization of HIF-1 in hypoxic cells (Brunelle et al., 2005Guzy et al., 2005 and Mansfield et al., 2005). However, the persistence of ROS could ultimately be lethal to tissues during chronic O2 deprivation, and PDK1 induction by HIF-1 should promote cell viability during long-term hypoxia. Kim et al. present evidence that HIF-1-deficient cells exhibit increased apoptosis after 72 hr of culture at 0.5% O2 compared to wild-type cells and that cell survival is rescued by enforced expression of exogenous PDK1. Furthermore, PDK1 reduces ROS production by the HIF-1 null cells. These findings support a novel prosurvival dimension of cellular hypoxic adaptation where PDK1 inhibits the TCA cycle, mitochondrial respiration, and chronic ROS production.

The HIF-1-mediated block to mitochondrial O2 consumption via PDK1 regulation also has implications for O2-sensing pathways by hypoxic cells. One school of thought suggests that perturbing mitochondrial O2consumption increases intracellular O2 concentrations and suppresses HIF-1 induction by promoting the activity of HIF prolyl hydroxylases, the O2-dependent enzymes that regulate HIF-1 stability (Hagen et al., 2003 and Doege et al., 2005). This model suggests that mitochondria function as “O2 sinks.” Although Papandreou et al. demonstrate that increased mitochondrial respiration due to PDK1 depletion results in decreased intracellular O2 levels (based on pimonidazole staining), these changes failed to reduce HIF-1 levels in hypoxic cells. Another model for hypoxic activation of HIF-1 describes a critical role for mitochondrial ROS in prolyl hydroxylase inhibition and HIF-1 stabilization in O2-starved cells (Brunelle et al., 2005Guzy et al., 2005 and Mansfield et al., 2005) (see Figure 1). The mitochondrial “O2 sink” hypothesis can account for some observations in the literature but fails to explain the inhibition of HIF-1 stabilization by ROS scavengers (Chandel et al., 1998Brunelle et al., 2005Guzy et al., 2005 and Sanjuán-Pla et al., 2005). While the relationship between HIF-1 stability, mitochondrial metabolism, ROS, and intracellular O2 redistribution will continue to be debated for some time, these most recent findings shed new light on findings by Louis Pasteur over a century ago.

Selected reading

Brunelle et al., 2005

J.K. Brunelle, E.L. Bell, N.M. Quesada, K. Vercauteren, V. Tiranti, M. Zeviani, R.C. Scarpulla, N.S. Chandel

Cell Metab., 1 (2005), pp. 409–414

Article  PDF (324 K) View Record in Scopus Citing articles (357)

Chandel et al., 1998

N.S. Chandel, E. Maltepe, E. Goldwasser, C.E. Mathieu, M.C. Simon, P.T. Schumacker

Proc. Natl. Acad. Sci. USA, 95 (1998), pp. 11715–11720

View Record in Scopus Full Text via CrossRef Citing articles (973)

Doege et al., 2005Doege, S. Heine, I. Jensen, W. Jelkmann, E. Metzen

Blood, 106 (2005), pp. 2311–2317

View Record in Scopus Full Text via CrossRef Citing articles (84)

Guzy et al., 2005

R.D. Guzy, B. Hoyos, E. Robin, H. Chen, L. Liu, K.D. Mansfield, M.C. Simon, U. Hammerling, P.T. Schumacker

Cell Metab., 1 (2005), pp. 401–408

Article  PDF (510 K) View Record in Scopus Citing articles (593)

Hagen et al., 2003

Hagen, C.T. Taylor, F. Lam, S. Moncada

Science, 302 (2003), pp. 1975–1978

View Record in Scopus Full Text via CrossRef Citing articles (450)

7.9.7 HIF-1 mediates adaptation to hypoxia by actively downregulating mitochondrial oxygen consumption

Papandreou I1Cairns RAFontana LLim ALDenko NC.
Cell Metab. 2006 Mar; 3(3):187-97.
http://dx.doi.org/10.1016/j.cmet.2006.01.012

The HIF-1 transcription factor drives hypoxic gene expression changes that are thought to be adaptive for cells exposed to a reduced-oxygen environment. For example, HIF-1 induces the expression of glycolytic genes. It is presumed that increased glycolysis is necessary to produce energy when low oxygen will not support oxidative phosphorylation at the mitochondria. However, we find that while HIF-1 stimulates glycolysis, it also actively represses mitochondrial function and oxygen consumption by inducing pyruvate dehydrogenase kinase 1 (PDK1). PDK1 phosphorylates and inhibits pyruvate dehydrogenase from using pyruvate to fuel the mitochondrial TCA cycle. This causes a drop in mitochondrial oxygen consumption and results in a relative increase in intracellular oxygen tension. We show by genetic means that HIF-1-dependent block to oxygen utilization results in increased oxygen availability, decreased cell death when total oxygen is limiting, and reduced cell death in response to the hypoxic cytotoxin tirapazamine.

Comment in

Tissue hypoxia results when supply of oxygen from the bloodstream does not meet demand from the cells in the tissue. Such a supply-demand mismatch can occur in physiologic conditions such as the exercising muscle, in the pathologic condition such as the ischemic heart, or in the tumor microenvironment (Hockel and Vaupel, 2001 and Semenza, 2004). In either the physiologic circumstance or pathologic conditions, there is a molecular response from the cell in which a program of gene expression changes is initiated by the hypoxia-inducible factor-1 (HIF-1) transcription factor. This program of gene expression changes is thought to help the cells adapt to the stressful environment. For example, HIF-1-dependent expression of erythropoietin and angiogenic compounds results in increased blood vessel formation for delivery of a richer supply of oxygenated blood to the hypoxic tissue. Additionally, HIF-1 induction of glycolytic enzymes allows for production of energy when the mitochondria are starved of oxygen as a substrate for oxidative phosphorylation. We now find that this metabolic adaptation is more complex, with HIF-1 not only regulating the supply of oxygen from the bloodstream, but also actively regulating the oxygen demand of the tissue by reducing the activity of the major cellular consumer of oxygen, the mitochondria.

Perhaps the best-studied example of chronic hypoxia is the hypoxia associated with the tumor microenvironment (Brown and Giaccia, 1998). The tumor suffers from poor oxygen supply through a chaotic jumble of blood vessels that are unable to adequately perfuse the tumor cells. The oxygen tension within the tumor is also a function of the demand within the tissue, with oxygen consumption influencing the extent of tumor hypoxia (Gulledge and Dewhirst, 1996 and Papandreou et al., 2005b). The net result is that a large fraction of the tumor cells are hypoxic. Oxygen tensions within the tumor range from near normal at the capillary wall, to near zero in the perinecrotic regions. This perfusion-limited hypoxia is a potent microenvironmental stress during tumor evolution (Graeber et al., 1996 and Hockel and Vaupel, 2001) and an important variable capable of predicting for poor patient outcome. (Brizel et al., 1996Cairns and Hill, 2004Hockel et al., 1996 and Nordsmark and Overgaard, 2004).

The HIF-1 transcription factor was first identified based on its ability to activate the erythropoetin gene in response to hypoxia (Wang and Semenza, 1993). Since then, it is has been shown to be activated by hypoxia in many cells and tissues, where it can induce hypoxia-responsive target genes such as VEGF and Glut1 (Airley et al., 2001 and Kimura et al., 2004). The connection between HIF-regulation and human cancer was directly linked when it was discovered that the VHL tumor suppressor gene was part of the molecular complex responsible for the oxic degradation of HIF-1α (Maxwell et al., 1999). In normoxia, a family of prolyl hydroxylase enzymes uses molecular oxygen as a substrate and modifies HIF-1α and HIF2α by hydroxylation of prolines 564 and 402 (Bruick and McKnight, 2001 and Epstein et al., 2001). VHL then recognizes the modified HIF-α proteins, acts as an E3-type of ubiquitin ligase, and along with elongins B and C is responsible for the polyubiquitination of HIF-αs and their proteosomal degradation (Bruick and McKnight, 2001Chan et al., 2002Ivan et al., 2001 and Jaakkola et al., 2001). Mutations in VHL lead to constitutive HIF-1 gene expression, and predispose humans to cancer. The ability to recognize modified HIF-αs is at least partly responsible for VHL activity as a tumor suppressor, as introduction of nondegradable HIF-2α is capable of overcoming the growth–inhibitory activity of wild-type (wt) VHL in renal cancer cells (Kondo et al., 2003).

Mitochondrial function can be regulated by PDK1 expression. Mitochondrial oxidative phosphorylation (OXPHOS) is regulated by several mechanisms, including substrate availability (Brown, 1992). The major substrates for OXPHOS are oxygen, which is the terminal electron acceptor, and pyruvate, which is the primary carbon source. Pyruvate is the end product of glycolysis and is converted to acetyl-CoA through the activity of the pyruvate dehydrogenase complex of enzymes. The acetyl-CoA then directly enters the TCA cycle at citrate synthase where it is combined with oxaloacetate to generate citrate. In metazoans, the conversion of pyruvate to acetyl-CoA is irreversible and therefore represents a critical regulatory point in cellular energy metabolism. Pyruvate dehydrogenase is regulated by three known mechanisms: it is inhibited by acetyl-CoA and NADH, it is stimulated by reduced energy in the cell, and it is inhibited by regulatory phosphorylation of its E1 subunit by pyruvate dehydrogenase kinase (PDK) (Holness and Sugden, 2003 and Sugden and Holness, 2003). There are four members of the PDK family in vertebrates, each with specific tissue distributions (Roche et al., 2001). PDK expression has been observed in human tumor biopsies (Koukourakis et al., 2005), and we have reported that PDK3 is hypoxia-inducible in some cell types (Denko et al., 2003). In this manuscript, we find that PDK1 is also a hypoxia-responsive protein that actively regulates the function of the mitochondria under hypoxic conditions by reducing pyruvate entry into the TCA cycle. By excluding pyruvate from mitochondrial consumption, PDK1 induction may increase the conversion of pyruvate to lactate, which is in turn shunted to the extracellular space, regenerating NAD for continued glycolysis.

Identification of HIF-dependent mitochondrial proteins through genomic and bioinformatics approaches

In order to help elucidate the role of HIF-1α in regulating metabolism, we undertook a genomic search for genes that were regulated by HIF-1 in tumor cells exposed to hypoxia in vitro. We used genetically matched human RCC4 cells that had lost VHL during tumorigenesis and displayed constitutive HIF-1 activity, and a cell line engineered to re-express VHL to establish hypoxia-dependent HIF activation. These cells were treated with 18 hr of stringent hypoxia (<0.01% oxygen), and microarray analysis performed. Using a strict 2.5-fold elevation as our cutoff, we identified 173 genes that were regulated by hypoxia and/or VHL status (Table S1 in the Supplemental Data available with this article online). We used the pattern of expression in these experiments to identify putative HIF-regulated genes—ones that were constitutively elevated in the parent RCC4s independent of hypoxia, downregulated in the RCC4VHL cells under normoxia, and elevated in response to hypoxia. Of the 173 hypoxia and VHL-regulated genes, 74 fit the putative HIF-1 target pattern. The open reading frames of these genes were run through a pair of bioinformatics engines in order to predict subcellular localization, and 10 proteins scored as mitochondrial on at least one engine. The genes, fold induction, and mitochondrial scores are listed in Table 1.

HIF-1 downregulates mitochondrial oxygen consumption

Having identified several putative HIF-1 responsive gene products that had the potential to regulate mitochondrial function, we then directly measured mitochondrial oxygen consumption in cells exposed to long-term hypoxia. While other groups have studied mitochondrial function under acute hypoxia (Chandel et al., 1997), this is one of the first descriptions of mitochondrial function after long-term hypoxia where there have been extensive hypoxia-induced gene expression changes. Figure 1A is an example of the primary oxygen trace from a Clark electrode showing a drop in oxygen concentration in cell suspensions of primary fibroblasts taken from normoxic and hypoxic cultures. The slope of the curve is a direct measure of the total cellular oxygen consumption rate. Exposure of either primary human or immortalized mouse fibroblasts to 24 hr of hypoxia resulted in a reduction of this rate by approximately 50% (Figures 1A and 1B). In these experiments, the oxygen consumption can be stimulated with the mitochondrial uncoupling agent CCCP (carbonyl cyanide 3-chloro phenylhydrazone) and was completely inhibited by 2 mM potassium cyanide. We determined that the change in total cellular oxygen consumption was due to changes in mitochondrial activity by the use of the cell-permeable poison of mitochondrial complex 3, Antimycin A. Figure 1C shows that the difference in the normoxic and hypoxic oxygen consumption in murine fibroblasts is entirely due to the Antimycin-sensitive mitochondrial consumption. The kinetics with which mitochondrial function slows in hypoxic tumor cells also suggests that it is due to gene expression changes because it takes over 6 hr to achieve maximal reduction, and the reversal of this repression requires at least another 6 hr of reoxygenation (Figure 1D). These effects are not likely due to proliferation or toxicity of the treatments as these conditions are not growth inhibitory or toxic to the cells (Papandreou et al., 2005a).

Since we had predicted from the gene expression data that the mitochondrial oxygen consumption changes were due to HIF-1-mediated expression changes, we tested several genetically matched systems to determine what role HIF-1 played in the process (Figure 2). We first tested the cell lines that had been used for microarray analysis and found that the parental RCC4 cells had reduced mitochondrial oxygen consumption when compared to the VHL-reintroduced cells. Oxygen consumption in the parental cells was insensitive to hypoxia, while it was reduced by hypoxia in the wild-type VHL-transfected cell lines. Interestingly, stable introduction of a tumor-derived mutant VHL (Y98H) that cannot degrade HIF was also unable to restore oxygen consumption. These results indicate that increased expression of HIF-1 is sufficient to reduce oxygen consumption (Figure 2A). We also investigated whether HIF-1 induction was required for the observed reduction in oxygen consumption in hypoxia using two genetically matched systems. We measured normoxic and hypoxic oxygen consumption in murine fibroblasts derived from wild-type or HIF-1α null embryos (Figure 2B) and from human RKO tumor cells and RKO cells constitutively expressing ShRNAs directed against the HIF-1α gene (Figures 2C and 4C). Neither of the HIF-deficient cell systems was able to reduce oxygen consumption in response to hypoxia. These data from the HIF-overexpressing RCC cells and the HIF-deficient cells indicate that HIF-1 is both necessary and sufficient for reducing mitochondrial oxygen consumption in hypoxia.

HIF-dependent mitochondrial changes are functional, not structural

Because addition of CCCP could increase oxygen consumption even in the hypoxia-treated cells, we hypothesized that the hypoxic inhibition was a regulated activity, not a structural change in the mitochondria in response to hypoxic stress. We confirmed this interpretation by examining several additional mitochondrial characteristics in hypoxic cells such as mitochondrial morphology, quantity, and membrane potential. We examined morphology by visual inspection of both the transiently transfected mitochondrially localized DsRed protein and the endogenous mitochondrial protein cytochrome C. Both markers were indistinguishable in the parental RCC4 and the RCC4VHL cells (Figure 3A). Likewise, we measured the mitochondrial membrane potential with the functional dye rhodamine 123 and found that it was identical in the matched RCC4 cells and the matched HIF wt and knockout (KO) cells when cultured in normoxia or hypoxia (Figure 3B). Finally, we determined that the quantity of mitochondria per cell was not altered in response to HIF or hypoxia by showing that the amount of the mitochondrial marker protein HSP60 was identical in the RCC4 and HIF cell lines (Figure 3C)

PDK1 is a HIF-1 inducible target protein

After examination of the list of putative HIF-regulated mitochondrial target genes, we hypothesized that PDK1 could mediate the functional changes that we observed in hypoxia. We therefore investigated PDK1 protein expression in response to HIF and hypoxia in the genetically matched cell systems. Figure 4A shows that in the RCC4 cells PDK1 and the HIF-target gene BNip3 (Greijer et al., 2005 and Papandreou et al., 2005a) were both induced by hypoxia in a VHL-dependent manner, with the expression of PDK1 inversely matching the oxygen consumption measured in Figure 1 above. Likewise, the HIF wt MEFs show oxygen-dependent induction of PDK1 and BNip3, while the HIF KO MEFs did not show any expression of either of these proteins under any oxygen conditions (Figure 4B). Finally, the parental RKO cells were able to induce PDK1 and the HIF target gene BNip3L in response to hypoxia, while the HIF-depleted ShRNA RKO cells could not induce either protein (Figure 4C). Therefore, in all three cell types, the HIF-1-dependent regulation of oxygen consumption seen in Figure 2, corresponds to the HIF-1-dependent induction of PDK1 seen in Figure 4.

In order to determine if PDK1 was a direct HIF-1 target gene, we analyzed the genomic sequence flanking the 5′ end of the gene for possible HIF-1 binding sites based on the consensus core HRE element (A/G)CGTG (Caro, 2001). Several such sites exist within the first 400 bases upstream, so we generated reporter constructs by fusing the genomic sequence from −400 to +30 of the start site of transcription to the firefly luciferase gene. In transfection experiments, the chimeric construct showed significant induction by either cotransfection with a constitutively active HIF proline mutant (P402A/P564G) (Chan et al., 2002) or exposure of the transfected cells to 0.5% oxygen (Figure 4D). Most noteworthy, when the reporter gene was transfected into the HIF-1α null cells, it did not show induction when the cells were cultured in hypoxia, but it did show induction when cotransfected with expression HIF-1α plasmid. We then generated deletions down to the first 36 bases upstream of transcription and found that even this short sequence was responsive to HIF-1 (Figure 4D). Analysis of this small fragment showed only one consensus HRE site located in an inverted orientation in the 5′ untranslated region. We synthesized and cloned a mutant promoter fragment in which the core element ACGTG was replaced with AAAAG, and this construct lost over 90% of its hypoxic induction. These experiments suggest that it is this HRE within the proximal 5′ UTR that HIF-1 uses to transactivate the endogenous PDK1 gene in response to hypoxia.

PDK1 is responsible for the HIF-dependent mitochondrial oxygen consumption changes

In order to directly test if PDK1 was the HIF-1 target gene responsible for the hypoxic reduction in mitochondrial oxygen consumption, we generated RKO cell lines with either knockdown or overexpression of PDK1 and measured the oxygen consumption in these derivatives. The PDK1 ShRNA stable knockdown line was generated as a pool of clones cotransfected with pSUPER ShPDK1 and pTK-hygro resistance gene. After selection for growth in hygromycin, the cells were tested by Western blot for the level of PDK1 protein expression. We found that normoxic PDK1 is reduced by 75%, however, there was measurable expression of PDK1 in these cells in response to hypoxia (Figure 5A). When we measured the corresponding oxygen consumption in these cells, we found a change commensurate with the level of PDK1. The knockdown cells show elevated baseline oxygen consumption, and partial reduction in this activity in response to hypoxia. Therefore, reduction of PDK1 expression by genetic means increased mitochondrial oxygen consumption in both normoxic and hypoxic conditions. Interestingly, these cells still induced HIF-1α (Figure 5A) and HIF-1 target genes such as BNip3L in response to hypoxia (data not shown), suggesting that altered PDK1 levels do not alter HIF-1α function.

pdk1-expression-directly-regulates-cellular-oxygen-consumption-rate

pdk1-expression-directly-regulates-cellular-oxygen-consumption-rate

PDK1 expression directly regulates cellular oxygen consumption rate

http://ars.els-cdn.com/content/image/1-s2.0-S155041310600060X-gr5.jpg

Figure 5. PDK1 expression directly regulates cellular oxygen consumption rate

  1. A)Western blot of RKO cell and ShRNAPDK1RKO cell lysates after exposure to 24 hr of normoxia or 0.5% O2. Blots were probed for HIF 1α, PDK1, and tubulin as a loading control.
  2. B)Oxygen consumption rate in RKO and ShRNAPDK1RKO cells after exposure to 24 hr of normoxia or 0.5% O2.
  3. C)Western blot of RKOiresGUS cell and RKOiresPDK1 cell lysates after exposure to 24 hr of normoxia or 0.5% O2. Blots were probed for HIF 1α, PDK1, and tubulin as a loading control.
  4. D)Oxygen consumption rate in RKOiresGUS and RKOiresPDK1 cells after exposure to 24 hr of normoxia or 0.5% O2.
  5. E)Model describing the interconnected effects of HIF-1 target gene activation on hypoxic cell metabolism. Reduced oxygen conditions causes HIF-1 to coordinately induce the enzymes shown in boxes. HIF-1 activation results in increased glucose transporter expression to increase intracellular glucose flux, induction of glycolytic enzymes increases the conversion of glucose to pyruvate generating energy and NADH, induction of PDK1 decreases mitochondrial utilization of pyruvate and oxygen, and induction of LDH increases the removal of excess pyruvate as lactate and also regenerates NAD+ for increased glycolysis.

For all graphs, the error bars represent the standard error of the mean.

We also determined if overexpression of PDK1 could lead to reduced mitochondrial oxygen consumption. A separate culture of RKO cells was transfected with a PDK1-IRES-puro expression plasmid and selected for resistance to puromycin. The pool of puromycin resistant cells was tested for PDK1 expression by Western blot. These cells showed a modest increase in PDK1 expression under control conditions when compared to the cells transfected with GUS-IRES-puro, with an additional increase in PDK1 protein in response to hypoxia (Figure 5C). The corresponding oxygen consumption measurements showed that the mitochondria is very sensitive to changes in the levels of PDK1, as even this slight increase was able to significantly reduce oxygen consumption in the normoxic PDK1-puro cultures. Further increase in PDK1 levels with hypoxia further reduced oxygen consumption in both cultures (Figure 5D). The model describing the relationship between hypoxia, HIF-1, PDK1, and intermediate metabolism is described inFigure 5E.

Altering oxygen consumption alters intracellular oxygen tension and sensitivity to hypoxia-dependent cell killing

The intracellular concentration of oxygen is a net result of the rate at which oxygen diffuses into the cell and the rate at which it is consumed. We hypothesized that the rate at which oxygen was consumed within the cell would significantly affect its steady-state intracellular concentrations. We tested this hypothesis in vitro using the hypoxic marker drug pimonidazole (Bennewith and Durand, 2004). We plated high density cultures of HIF wild-type and HIF knockout cells and placed these cultures in normoxic, 2% oxygen, and anoxic incubators for overnight treatment. The overnight treatment gives the cells time to adapt to the hypoxic conditions and establish altered oxygen consumption profiles. Pimonidozole was then added for the last 4 hr of the growth of the culture. Pimonidazole binding was detected after fixation of the cells using an FITC labeled anti-pimonidazole antibody and it was quantitated by flow cytometry. The quantity of the bound drug is a direct indication of the oxygen concentration within the cell (Bennewith and Durand, 2004). The histograms in Figure 6A show that the HIF-1 knockout and wild-type cells show similar staining in the cells grown in 0% oxygen. However, the cells treated with 2% oxygen show the consequence of the genetic removal of HIF-1. The HIF-proficient cells showed relatively less pimonidazole binding at 2% when compared to the 0% culture, while the HIF-deficient cells showed identical binding between the cells at 2% and those at 0%. We interpret these results to mean that the HIF-deficient cells have greater oxygen consumption, and this has lowered the intracellular oxygenation from the ambient 2% to close to zero intracellularly. The HIF-proficient cells reduced their oxygen consumption rate so that the rate of diffusion into the cell is greater than the rate of consumption.

Figure 6. HIF-dependent decrease in oxygen consumption raises intracellular oxygen concentration, protects when oxygen is limiting, and decreases sensitivity to tirapazamine in vitro

  1. A)Pimonidazole was used to determine the intracellular oxygen concentration of cells in culture. HIF wt and HIF KO MEFs were grown at high density and exposed to 2% O2or anoxia for 24 hr in glass dishes. For the last 4 hr of treatment, cells were exposed to 60 μg/ml pimonidazole. Pimonidazole binding was quantitated by flow cytometry after binding of an FITC conjugated anti-pimo mAb. Results are representative of two independent experiments.
  2. B)HIF1α reduces oxygen consumption and protects cells when total oxygen is limited. HIF wt and HIF KO cells were plated at high density and sealed in aluminum jigs at <0.02% oxygen. At the indicated times, cells were harvested, and dead cells were quantitated by trypan blue exclusion. Note both cell lines are equally sensitive to anoxia-induced apoptosis, so the death of the HIF null cells indicates that the increased oxygen consumption removed any residual oxygen in the jig and resulted in anoxia-induced death.
  3. C)PDK1 is responsible for HIF-1’s adaptive response when oxygen is limiting. A similar jig experiment was performed to measure survival in the parental RKO, the RKO ShRNAHIF1α, and the RKOShPDK1 cells. Cell death by trypan blue uptake was measured 48 hr after the jigs were sealed.
  4. D)HIF status alters sensitivity to TPZ in vitro. HIF wt and HIF KO MEFs were grown at high density in glass dishes and exposed to 21%, 2%, and <0.01% O2conditions for 18 hr in the presence of varying concentrations of Tirapazamine. After exposure, cells were harvested and replated under normoxia to determine clonogenic viability. Survival is calculated relative to the plating efficiency of cells exposed to 0 μM TPZ for each oxygen concentration.
  5. E)Cell density alters sensitivity to TPZ. HIF wt and HIF KO MEFs were grown at varying cell densities in glass dishes and exposed to 2% O2in the presence of 10 μM TPZ for 18 hr. After the exposure, survival was determined as described in (C).

For all graphs, the error bars represent the standard error of the mean.

HIF-induced PDK1 can reduce the total amount of oxygen consumed per cell. The reduction in the amount of oxygen consumed could be significant if there is a finite amount of oxygen available, as would be the case in the hours following a blood vessel occlusion. The tissue that is fed by the vessel would benefit from being economical with the oxygen that is present. We experimentally modeled such an event using aluminum jigs that could be sealed with defined amounts of cells and oxygen present (Siim et al., 1996). We placed 10 × 106 wild-type or HIF null cells in the sealed jig at 0.02% oxygen, waited for the cells to consume the remaining oxygen, and measured cell viability. We have previously shown that these two cell types are resistant to mild hypoxia and equally sensitive to anoxia-induced apoptosis (Papandreou et al., 2005a). Therefore, any death in this experiment would be the result of the cells consuming the small amount of remaining oxygen and dying in response to anoxia. We found that in sealed jigs, the wild-type cells are more able to adapt to the limited oxygen supply by reducing consumption. The HIF null cells continued to consume oxygen, reached anoxic levels, and started to lose viability within 36 hr (Figure 6B). This is a secondary adaptive effect of HIF1. We confirmed that PDK1 was responsible for this difference by performing a similar experiment using the parental RKO cells, the RKOShRNAHIF1α and the RKOShRNAPDK1 cells. We found similar results in which both the cells with HIF1α knockdown and PDK1 knockdown were sensitive to the long-term effects of being sealed in a jig with a defined amount of oxygen (Figure 6c). Note that the RKOShPDK1 cells are even more sensitive than the RKOShHIF1α cells, presumably because they have higher basal oxygen consumption rates (Figure 5B).

Because HIF-1 can help cells adapt to hypoxia and maintain some intracellular oxygen level, it may also protect tumor cells from killing by the hypoxic cytotoxin tirapazamine (TPZ). TPZ toxicity is very oxygen dependent, especially at oxygen levels between 1%–4% (Koch, 1993). We therefore tested the relative sensitivity of the HIF wt and HIF KO cells to TPZ killing in high density cultures (Figure 6D). We exposed the cells to the indicated concentrations of drug and oxygen concentrations overnight. The cells were then harvested and replated to determine reproductive viability by colony formation. Both cell types were equally resistant to TPZ at 21% oxygen, while both cell types are equally sensitive to TPZ in anoxic conditions where intracellular oxygen levels are equivalent (Figure 6A). The identical sensitivity of both cell types in anoxia indicates that both cell types are equally competent in repairing the TPZ-induced DNA damage that is presumed to be responsible for its toxicity. However, in 2% oxygen cultures, the HIF null cells displayed a significantly greater sensitivity to the drug than the wild-type cells. This suggests that the increased oxygen consumption rate in the HIF-deficient cells is sufficient to lower the intracellular oxygen concentration relative to that in the HIF-proficient cells. The lower oxygen level is significant enough to dramatically sensitize these cells to killing by TPZ.

If the increased sensitivity to TPZ in the HIF ko cells is determined by intracellular oxygen consumption differences, then this effect should also be cell-density dependent. We showed that this is indeed the case in Figure 6E where oxygen and TPZ concentrations were held constant, and increased cell density lead to increased TPZ toxicity. The effect was much more pronounced in the HIF KO cells, although the HIF wt cells showed some increased toxicity in the highest density cultures, consistent with the fact they were still consuming some oxygen, even with HIF present (Figure 1). The in vitro TPZ survival data is therefore consistent with our hypothesis that control of oxygen consumption can regulate intracellular oxygen concentration, and suggests that increased oxygen consumption could sensitize cells to hypoxia-dependent therapy.

Discussion

The findings presented here show that HIF-1 is actively responsible for regulating energy production in hypoxic cells by an additional, previously unrecognized mechanism. It has been shown that HIF-1 induces the enzymes responsible for glycolysis when it was presumed that low oxygen did not support efficient oxidative phosphorylation (Iyer et al., 1998 and Seagroves et al., 2001). The use of glucose to generate ATP is capable of satisfying the energy requirements of a cell if glucose is in excess (Papandreou et al., 2005a). We now find that at the same time that glycolysis is increasing, mitochondrial respiration is decreasing. However, the decreased respiration is not because there is not enough oxygen present to act as a substrate for oxidative phosphorylation, but because the flow of pyruvate into the TCA cycle has been reduced by the activity of pyruvate dehydrogenase kinase. Other reports have suggested that oxygen utilization is shifted in cells exposed to hypoxia, but these reports have focused on other regulators such as nitric oxide synthase (Hagen et al., 2003). NO can reduce oxygen consumption through direct inhibition of cytochrome oxidase, but this effect seems to be more significant at physiologic oxygen concentrations, not at severe levels seen in the tumor (Palacios-Callender et al., 2004).

7.9.8 HIF-1. upstream and downstream of cancer metabolism

Semenza GL1.
Curr Opin Genet Dev. 2010 Feb; 20(1):51-6
http://dx.doi.org/10.1016%2Fj.gde.2009.10.009

Hypoxia-inducible factor 1 (HIF-1) plays a key role in the reprogramming of cancer metabolism by activating transcription of genes encoding glucose transporters and glycolytic enzymes, which take up glucose and convert it to lactate; pyruvate dehydrogenase kinase 1, which shunts pyruvate away from the mitochondria; and BNIP3, which triggers selective mitochondrial autophagy. The shift from oxidative to glycolytic metabolism allows maintenance of redox homeostasis and cell survival under conditions of prolonged hypoxia. Many metabolic abnormalities in cancer cells increase HIF-1 activity. As a result, a feed-forward mechanism can be activated that drives HIF-1 activation and may promote tumor progression. Hypoxia-inducible factor 1 (HIF-1) plays a key role in the reprogramming of cancer metabolism by activating transcription of genes encoding glucose transporters and glycolytic enzymes, which take up glucose and convert it to lactate; pyruvate dehydrogenase kinase 1, which shunts pyruvate away from the mitochondria; and BNIP3, which triggers selective mitochondrial autophagy. The shift from oxidative to glycolytic metabolism allows maintenance of redox homeostasis and cell survival under conditions of prolonged hypoxia. Many metabolic abnormalities in cancer cells increase HIF-1 activity. As a result, a feed-forward mechanism can be activated that drives HIF-1 activation and may promote tumor progression.

Metastatic cancer is characterized by reprogramming of cellular metabolism leading to increased uptake of glucose for use as both an anabolic and catabolic substrate. Increased glucose uptake is such a reliable feature that it is utilized clinically to detect metastases by positron emission tomography using 18F-fluorodeoxyglucose (FDG-PET) with a sensitivity of ~90% [1]. As with all aspects of cancer biology, the details of metabolic reprogramming differ widely among individual tumors. However, the role of specific signaling pathways and transcription factors in this process is now understood in considerable detail. This review will focus on the involvement of hypoxia-inducible factor 1 (HIF-1) in both mediating metabolic reprogramming and responding to metabolic alterations. The placement of HIF-1 both upstream and downstream of cancer metabolism results in a feed-forward mechanism that may play a major role in the development of the invasive, metastatic, and lethal cancer phenotype.

O2 concentrations are significantly reduced in many human cancers compared to the surrounding normal tissue. The median PO2 in breast cancers is ~10 mm Hg, as compared to ~65 mm Hg in normal breast tissue [2]. Reduced O2 availability induces HIF-1, which regulates the transcription of hundreds of genes [3*,4*] that encode proteins involved in every aspect of cancer biology, including: cell immortalization and stem cell maintenance; genetic instability; glucose and energy metabolism; vascularization; autocrine growth factor signaling; invasion and metastasis; immune evasion; and resistance to chemotherapy and radiation therapy [5].

HIF-1 is a transcription factor that consists of an O2-regulated HIF-1α and a constitutively expressed HIF-1β subunit [6]. In well-oxygenated cells, HIF-1α is hydroxylated on proline residue 402 (Pro-402) and/or Pro-564 by prolyl hydroxylase domain protein 2 (PHD2), which uses O2 and α-ketoglutarate as substrates in a reaction that generates CO2 and succinate as byproducts [7]. Prolyl-hydroxylated HIF-1α is bound by the von Hippel-Lindau tumor suppressor protein (VHL), which recruits an E3-ubiquitin ligase that targets HIF-1α for proteasomal degradation (Figure 1A). Asparagine 803 in the transactivation domain is hydroxylated in well-oxygenated cells by factor inhibiting HIF-1 (FIH-1), which blocks the binding of the coactivators p300 and CBP [7]. Under hypoxic conditions, the prolyl and asparaginyl hydroxylation reactions are inhibited by substrate (O2) deprivation and/or the mitochondrial generation of reactive oxygen species (ROS), which may oxidize Fe(II) present in the catalytic center of the hydroxylases [8].

HIF-1 and metabolism  nihms156580f1

HIF-1 and metabolism nihms156580f1

HIF-1 and metabolism

http://www.ncbi.nlm.nih.gov/pmc/articles/PMC2822127/bin/nihms156580f1.gif

Figure 1 HIF-1 and metabolism. (A) Regulation of HIF-1α protein synthesis and stability and HIF-1-dependent metabolic reprogramming. The rate of translation of HIF-1α mRNA into protein in cancer cells is dependent upon the activity of the mammalian 

The finding that acute changes in PO2 increase mitochondrial ROS production suggests that cellular respiration is optimized at physiological PO2 to limit ROS generation and that any deviation in PO2 — up or down — results in increased ROS generation. If hypoxia persists, induction of HIF-1 leads to adaptive mechanisms to reduce ROS and re-establish homeostasis, as described below. Prolyl and asparaginyl hydroxylation provide a molecular mechanism by which changes in cellular oxygenation can be transduced to the nucleus as changes in HIF-1 activity. This review will focus on recent advances in our understanding of the role of HIF-1 in controlling glucose and energy metabolism, but it should be appreciated that any increase in HIF-1 activity that leads to changes in cell metabolism will also affect many other critical aspects of cancer biology [5] that will not be addressed here.

HIF-1 target genes involved in glucose and energy metabolism

HIF-1 activates the transcription of SLC2A1 and SLC2A3, which encode the glucose transporters GLUT1 and GLUT3, respectively, as well as HK1 and HK2, which encode hexokinase, the first enzyme of the Embden-Meyerhoff (glycolytic) pathway [9]. Once taken up by GLUT and phosphorylated by HK, FDG cannot be metabolized further; thus, FDG-PET signal is determined by FDG delivery to tissue (i.e. perfusion) and GLUT/HK expression/activity. Unlike FDG, glucose is further metabolized to pyruvate by the action of the glycolytic enzymes, which are all encoded by HIF-1 target genes (Figure 1A). Glycolytic intermediates are also utilized for nucleotide and lipid synthesis [10]. Lactate dehydrogenase A (LDHA), which converts pyruvate to lactate, and monocarboxylate transporter 4 (MCT4), which transports lactate out of the cell (Figure 1B), are also regulated by HIF-1 [9,11]. Remarkably, lactate produced by hypoxic cancer cells can be taken up by non-hypoxic cells and used as a respiratory substrate [12**].

Pyruvate represents a critical metabolic control point, as it can be converted to acetyl coenzyme A (AcCoA) by pyruvate dehydrogenase (PDH) for entry into the tricarboxylic acid (TCA) cycle or it can be converted to lactate by LDHA (Figure 1B). Pyruvate dehydrogenase kinase (PDK), which phosphorylates and inactivates the catalytic domain of PDH, is encoded by four genes and PDK1 is activated by HIF-1 [13,14]. (Further studies are required to determine whether PDK2PDK3, or PDK4 is regulated by HIF-1.) As a result of PDK1 activation, pyruvate is actively shunted away from the mitochondria, which reduces flux through the TCA cycle, thereby reducing delivery of NADH and FADH2 to the electron transport chain. This is a critical adaptive response to hypoxia, because in HIF-1α–null mouse embryo fibroblasts (MEFs), PDK1 expression is not induced by hypoxia and the cells die due to excess ROS production, which can be ameliorated by forced expression of PDK1 [13]. MYC, which is activated in ~40% of human cancers, cooperates with HIF-1 to activate transcription of PDK1, thereby amplifying the hypoxic response [15]. Pharmacological inhibition of HIF-1 or PDK1 activity increases O2 consumption by cancer cells and increases the efficacy of a hypoxia-specific cytotoxin [16].

Hypoxia also induces mitochondrial autophagy in many human cancer cell lines through HIF-1-dependent expression of BNIP3 and a related BH3 domain protein, BNIP3L [19**]. Autocrine signaling through the platelet-derived growth factor receptor in cancer cells increases HIF-1 activity and thereby increases autophagy and cell survival under hypoxic conditions [21]. Autophagy may also occur in a HIF-1-independent manner in response to other physiological stimuli that are associated with hypoxic conditions, such as a decrease in the cellular ATP:AMP ratio, which activates AMP kinase signaling [22].

In clear cell renal carcinoma, VHL loss of function (LoF) results in constitutive HIF-1 activation, which is associated with impaired mitochondrial biogenesis that results from HIF-1-dependent expression of MXI1, which blocks MYC-dependent expression of PGC-1β, a coactivator that is required for mitochondrial biogenesis [23]. Inhibition of wild type MYC activity in renal cell carcinoma contrasts with the synergistic effect of HIF-1 and oncogenic MYC in activating PDK1 transcription [24].

Genetic and metabolic activators of HIF-1

Hypoxia plays a critical role in cancer progression [2,5] but not all cancer cells are hypoxic and a growing number of O2-independent mechanisms have been identified by which HIF-1 is induced [5]. Several mechanisms that are particularly relevant to cancer metabolism are described below.

Activation of mTOR

Alterations in mitochondrial metabolism

NAD+ levels

It is of interest that the NAD+-dependent deacetylase sirtuin 1 (SIRT1) was found to bind to, deacetylate, and increase transcriptional activation by HIF-2α but not HIF-1α [42**]. Another NAD+-dependent enzyme is poly(ADP-ribose) polymerase 1 (PARP1), which was recently shown to bind to HIF-1α and promote transactivation through a mechanism that required the enzymatic activity of PARP1 [43]. Thus, transactivation mediated by both HIF-1α and HIF-2α can be modulated according to NAD+ levels.

Nitric oxide

Increased expression of nitric oxide (NO) synthase isoforms and increased levels of NO have been shown to increase HIF-1α protein stability in human oral squamous cell carcinoma [44]. In prostate cancer, nuclear co-localization of endothelial NO synthase, estrogen receptor β, HIF-1α, and HIF-2α was associated with aggressive disease and the proteins were found to form chromatin complexes on the promoter of TERT gene encoding telomerase [45**]. The NOS2 gene encoding inducible NO synthase is HIF-1 regulated [5], suggesting another possible feed-forward mechanism.

7.9.9 In Vivo HIF-Mediated Reductive Carboxylation

Gameiro PA1Yang JMetelo AMPérez-Carro R, et al.
Cell Metab. 2013 Mar 5; 17(3):372-85.
http://dx.doi.org/10.1016%2Fj.cmet.2013.02.002

Hypoxic and VHL-deficient cells use glutamine to generate citrate and lipids through reductive carboxylation (RC) of α-ketoglutarate. To gain insights into the role of HIF and the molecular mechanisms underlying RC, we took advantage of a panel of disease-associated VHL mutants and showed that HIF expression is necessary and sufficient for the induction of RC in human renal cell carcinoma (RCC) cells. HIF expression drastically reduced intracellular citrate levels. Feeding VHL-deficient RCC cells with acetate or citrate or knocking down PDK-1 and ACLY restored citrate levels and suppressed RC. These data suggest that HIF-induced low intracellular citrate levels promote the reductive flux by mass action to maintain lipogenesis. Using [1–13C] glutamine, we demonstrated in vivo RC activity in VHL-deficient tumors growing as xenografts in mice. Lastly, HIF rendered VHL-deficient cells sensitive to glutamine deprivation in vitro, and systemic administration of glutaminase inhibitors suppressed the growth of RCC cells as mice xenografts.

Cancer cells undergo fundamental changes in their metabolism to support rapid growth, adapt to limited nutrient resources, and compete for these supplies with surrounding normal cells. One of the metabolic hallmarks of cancer is the activation of glycolysis and lactate production even in the presence of adequate oxygen. This is termed the Warburg effect, and efforts in cancer biology have revealed some of the molecular mechanisms responsible for this phenotype (Cairns et al., 2011). More recently, 13C isotopic studies have elucidated the complementary switch of glutamine metabolism that supports efficient carbon utilization for anabolism and growth (DeBerardinis and Cheng, 2010). Acetyl-CoA is a central biosynthetic precursor for lipid synthesis, being generated from glucose-derived citrate in well-oxygenated cells (Hatzivassiliou et al., 2005). Warburg-like cells, and those exposed to hypoxia, divert glucose to lactate, raising the question of how the tricarboxylic acid (TCA) cycle is supplied with acetyl-CoA to support lipogenesis. We and others demonstrated, using 13C isotopic tracers, that cells under hypoxic conditions or defective mitochondria primarily utilize glutamine to generate citrate and lipids through reductive carboxylation (RC) of α-ketoglutarate by isocitrate dehydrogenase 1 (IDH1) or 2 (IDH2) (Filipp et al., 2012Metallo et al., 2012;Mullen et al., 2012Wise et al., 2011).

The transcription factors hypoxia inducible factors 1α and 2α (HIF-1α, HIF-2α) have been established as master regulators of the hypoxic program and tumor phenotype (Gordan and Simon, 2007Semenza, 2010). In addition to tumor-associated hypoxia, HIF can be directly activated by cancer-associated mutations. The von Hippel-Lindau (VHL) tumor suppressor is inactivated in the majority of sporadic clear-cell renal carcinomas (RCC), with VHL-deficient RCC cells exhibiting constitutive HIF-1α and/or HIF-2α activity irrespective of oxygen availability (Kim and Kaelin, 2003). Previously, we showed that VHL-deficient cells also relied on RC for lipid synthesis even under normoxia. Moreover, metabolic profiling of two isogenic clones that differ in pVHL expression (WT8 and PRC3) suggested that reintroduction of wild-type VHL can restore glucose utilization for lipogenesis (Metallo et al., 2012). The VHL tumor suppressor protein (pVHL) has been reported to have several functions other than the well-studied targeting of HIF. Specifically, it has been reported that pVHL regulates the large subunit of RNA polymerase (Pol) II (Mikhaylova et al., 2008), p53 (Roe et al., 2006), and the Wnt signaling regulator Jade-1. VHL has also been implicated in regulation of NF-κB signaling, tubulin polymerization, cilia biogenesis, and proper assembly of extracellular fibronectin (Chitalia et al., 2008Kim and Kaelin, 2003Ohh et al., 1998Thoma et al., 2007Yang et al., 2007). Hypoxia inactivates the α-ketoglutarate-dependent HIF prolyl hydroxylases, leading to stabilization of HIF. In addition to this well-established function, oxygen tension regulates a larger family of α-ketoglutarate-dependent cellular oxygenases, leading to posttranslational modification of several substrates, among which are chromatin modifiers (Melvin and Rocha, 2012). It is therefore conceivable that the effect of hypoxia on RC that was reported previously may be mediated by signaling mechanisms independent of the disruption of the pVHL-HIF interaction. Here we (1) demonstrate that HIF is necessary and sufficient for RC, (2) provide insights into the molecular mechanisms that link HIF to RC, (3) detected RC activity in vivo in human VHL-deficient RCC cells growing as tumors in nude mice, (4) provide evidence that the reductive phenotype ofVHL-deficient cells renders them sensitive to glutamine restriction in vitro, and (5) show that inhibition of glutaminase suppresses growth of VHL-deficient cells in nude mice. These observations lay the ground for metabolism-based therapeutic strategies for targeting HIF-driven tumors (such as RCC) and possibly the hypoxic compartment of solid tumors in general.

Functional Interaction between pVHL and HIF Is Necessary to Inhibit RC

Figure 1  HIF Inactivation Is Necessary for Downregulation of Reductive Carboxylation by pVHL

We observed a concurrent regulation in glucose metabolism in the different VHL mutants. Reintroduction of wild-type or type 2C pVHL mutant, which can meditate HIF-α destruction, stimulated glucose oxidation via pyruvate dehydrogenase (PDH), as determined by the degree of 13C-labeled TCA cycle metabolites (M2 enrichment) (Figures 1D and 1E). In contrast, reintroduction of an HIF nonbinding Type 2B pVHL mutant failed to stimulate glucose oxidation, resembling the phenotype observed in VHL-deficient cells (Figures 1D and 1E). Additional evidence for the overall glucose utilization was obtained from the enrichment of M3 isotopomers using [U13-C6]glucose (Figure S1A), which shows a lower contribution of glucose-derived carbons to the TCA cycle in VHL-deficient RCC cells (via pyruvate carboxylase and/or continued TCA cycling).

To test the effect of HIF activation on the overall glutamine incorporation in the TCA cycle, we labeled an isogenic pair of VHL-deficient and VHL-reconstituted UMRC2 cells with [U-13C5]glutamine, which generates M4 fumarate, M4 malate, M4 aspartate, and M4 citrate isotopomers through glutamine oxidation. As seen in Figure S1BVHL-deficient/VHL-positive UMRC2 cells exhibit similar enrichment of M4 fumarate, M4 malate, and M4 asparate (but not citrate) showing that VHL-deficient cells upregulate reductive carboxylation without compromising oxidative metabolism from glutamine. …  Labeled carbon derived from [5-13C1]glutamine can be incorporated into fatty acids exclusively through RC, and the labeled carbon cannot be transferred to palmitate through the oxidative TCA cycle (Figure 1B, red carbons). Tracer incorporation from [5-13C1]glutamine occurs in the one carbon (C1) of acetyl-CoA, which results in labeling of palmitate at M1, M2, M3, M4, M5, M6, M7, and M8 mass isotopomers. In contrast, lipogenic acetyl-CoA molecules originating from [U-13C6]glucose are fully labeled, and the labeled palmitate is represented by M2, M4, M6, M8, M10, M12, M14, and M16 mass isotopomers.

Figure 2 HIF Inactivation Is Necessary for Downregulation of Reductive Lipogenesis by pVHL

To determine the specific contribution from glucose oxidation or glutamine reduction to lipogenic acetyl-CoA, we performed isotopomer spectral analysis (ISA) of palmitate labeling patterns. ISA indicates that wild-type pVHL or pVHL L188V mutant-reconstituted UMRC2 cells relied mainly on glucose oxidation to produce lipogenic acetyl-CoA, while UMRC2 cells reconstituted with a pVHL mutant defective in HIF inactivation (Y112N or Y98N) primarily employed RC. Upon disruption of the pVHL-HIF interaction, glutamine becomes the preferred substrate for lipogenesis, supplying 70%–80% of the lipogenic acetyl-CoA (Figure 2C). This is not a cell-line-specific phenomenon, but it applies to VHL-deficient human RCC cells in general; the same changes are observed in 786-O cells reconstituted with wild-type pVHL or mutant pVHL or infected with vector only as control (Figure S2).

HIF Is Sufficient to Induce RC (reductive carboxylation) from Glutamine in RCC Cells

As shown in Figure 3C, reintroduction of wild-type VHLinto 786-O cells suppressed RC, whereas the expression of the constitutively active HIF-2α mutant was sufficient to stimulate this reaction, restoring the M1 enrichment of TCA cycle metabolites observed in VHL-deficient 786-O cells. Expression of HIF-2α P-A also led to a concomitant decrease in glucose oxidation, corroborating the metabolic alterations observed in glutamine metabolism (Figures 3D and 3E).

Figure 3 Expression of HIF-2α Is Sufficient to Induce Reductive Carboxylation and Lipogenesis from Glutamine in RCC Cells

Expression of HIF-2α P-A in 786-O cells phenocopied the loss-of-VHL with regards to glutamine reduction for lipogenesis (Figure 3G), suggesting that HIF-2α can induce the glutamine-to-lipid pathway in RCC cells per se. Although reintroduction of wild-type VHL restored glucose oxidation in UMRC2 and UMRC3 cells (Figures S3B–S3I), HIF-2α P-A expression did not measurably affect the contribution of each substrate to the TCA cycle or lipid synthesis in these RCC cells (data not shown). UMRC2 and UMRC3 cells endogenously express both HIF-1α and HIF-2α, whereas 786-O cells exclusively express HIF-2α. There is compelling evidence suggesting, at least in RCC cells, that HIF-α isoforms have overlapping—but also distinct—functions and their roles in regulating bioenergetic processes remain an area of active investigation. Overall, HIF-1α has an antiproliferative effect, and its expression in vitro leads to rapid death of RCC cells while HIF-2α promotes tumor growth (Keith et al., 2011Raval et al., 2005).

Metabolic Flux Analysis Shows Net Reversion of the IDH Flux upon HIF Activation

To determine absolute fluxes in RCC cells, we employed 13C metabolic flux analysis (MFA) as previously described (Metallo et al., 2012). Herein, we performed MFA using a combined model of [U-13C6]glucose and [1-13C1]glutamine tracer data sets from the 786-O derived isogenic clones PRC3 (VHL−/ −)/WT8 (VHL+) cells, which show a robust metabolic regulation by reintroduction of pVHL. To this end, we first determined specific glucose/glutamine consumption and lactate/glutamate secretion rates. As expected, PRC3 exhibited increased glucose consumption and lactate production when compared to WT8 counterparts (Figure 4A). While PRC3 exhibited both higher glutamine consumption and glutamate production rates than WT8 (Figure 4A), the net carbon influx was higher in PRC3 cells (Figure 4B). Importantly, the fitted data show that the flux of citrate to α-ketoglutarate was negative in PRC3 cells (Figure 4C). This indicates that the net (forward plus reverse) flux of isocitrate dehydrogenase and aconitase (IDH + ACO) is toward citrate production. The exchange flux was also higher in PRC3 than WT8 cells, whereas the PDH flux was lower in PRC3 cells. In agreement with the tracer data, these MFA results strongly suggest that the reverse IDH + ACO fluxes surpass the forward flux in VHL-deficient cells. The estimated ATP citrate lyase (ACLY) flux was also lower in PRC3 than in WT8 cells. Furthermore, the malate dehydrogenase (MDH) flux was negative, reflecting a net conversion of oxaloacetate into malate in VHL-deficient cells (Figure 4C). This indicates an increased flux through the reductive pathway downstream of IDH, ACO, and ACLY. Additionally, some TCA cycle flux estimates downstream of α-ketoglutarate were not significantly different between PRC and WT8 (Table S1). This shows that VHL-deficient cells maintain glutamine oxidation while upregulating reductive carboxylation (Figure S1B). This finding is in agreement with the higher glutamine uptake observed in VHL-deficient cells. Table S1 shows the metabolic network and complete MFA results. …

Addition of citrate in the medium, in contrast to acetate, led to an increase in the citrate-to-α-ketoglutarate ratio (Figure 5L) and absolute citrate levels (Figure S4H) not only in VHL-deficient but alsoVHL-reconstituted cells. The ability of exogenous citrate, but not acetate, to also affect RC in VHL-reconstituted cells may be explained by compartmentalization differences or by allosteric inhibition of citrate synthase (Lehninger, 2005); that is, the ability of acetate to raise the intracellular levels of citrate may be limited in (VHL-reconstituted) cells that exhibit high endogenous levels of citrate. Whatever the mechanism, the results imply that increasing the pools of intracellular citrate has a direct biochemical effect in cells with regards to their reliance on RC. Finally, we assayed the transcript and protein levels of enzymes involved in the reductive utilization of glutamine and did not observe significant differences between VHL-deficient andVHL-reconstituted UMRC2 cells (Figures S4I and S4J), suggesting that HIF does not promote RC by direct transactivation of these enzymes. The IDH1/IDH2 equilibrium is defined as follows:

[α−ketoglutrate][NADPH][CO2]/[Isocitrate][NADP+]=K(IDH)

Figure 5 Regulation of HIF-Mediated Reductive Carboxylation by Citrate Levels

We sought to investigate whether HIF could affect the driving force of the IDH reaction by also enhancing NADPH production. We did not observe a significant alteration of the NADP+/NADPH ratio between VHL-deficient and VHL-positive cells in the cell lysate (Figure S4I). Yet, we determined the ratio of the free dinucleotides using the measured ratios of suitable oxidized (α-ketoglutarate) and reduced (isocitrate/citrate) metabolites that are linked to the NADP-dependent IDH enzymes. The determined ratios (Figure S4J) are in close agreement with the values initially reported by the Krebs lab (Veech et al., 1969) and showed that HIF-expressing UMRC2 cells exhibit a higher NADP+/NADPH ratio. Collectively, these data strongly suggest that HIF-regulated citrate levels modulate the reductive flux to maintain adequate lipogenesis.

Reductive Carboxylation from Glutamine Is Detectable In Vivo

Figure 6 Evidence for Reductive Carboxylation Activity In Vivo

Loss of VHL Renders RCC Cells Sensitive to Glutamine Deprivation

We hypothesized that VHL deficiency results in cell addiction to glutamine for proliferation. We treated the isogenic clones PRC3 (VHL-deficient cells) and WT8 (VHL-reconstituted cells) with the glutaminase inhibitor 968 (Wang et al., 2010a). VHL-deficient PRC3 cells were more sensitive to treatment with 968, compared to the VHL-reconstituted WT8 cells (Figure 7A). To confirm that this is not only a cell-line-specific phenomenon, we also cultured UMRC2 cells in the presence of 968 or diluent control and showed selective sensitivity of VHL-deficient cells (Figure 7B).

Figure 7 VHL-Deficient Cells and Tumors Are Sensitive to Glutamine Deprivation

(A–E) Cell proliferation is normalized to the corresponding cell type grown in 1 mM glutamine-containing medium. Effect of treatment with glutaminase (GLS) inhibitor 968 in PRC3/WT8 (A) and UMRC2 cells (B). Rescue of GLS inhibition with dimethyl alpha-ketoglutarate (DM-Akg; 4 mM) or acetate (4 mM) in PRC3/WT8 clonal cells (C) and polyclonal 786-O cells (D). Effect of GLS inhibitor BPTES in UMRC2 cells (E). Student’s t test compares VHL-reconstituted cells to control cells in (A), (B), and (E) and DM-Akg or acetate-rescued cells to correspondent control cells treated with 968 only in (C) and (D) (asterisk in parenthesis indicates comparison between VHL-reconstituted to control cells). Error bars represent SEM.

(F) GLS inhibitor BPTES suppresses growth of human UMRC3 RCC cells as xenografts in nu/nu mice. When the tumors reached 100mm3, injections with BPTES or vehicle control were carried out daily for 14 days (n = 12). BPTES treatment decreases tumor size and mass (see insert). Student’s t test compares control to BPTES-treated mice (F). Error bars represent SEM.

(G) Diagram showing the regulation of reductive carboxylation by HIF.

http://www.ncbi.nlm.nih.gov/pmc/articles/PMC4003458/bin/nihms449661f7.jpg

In summary, our findings show that HIF is necessary and sufficient to promote RC from glutamine. By inhibiting glucose oxidation in the TCA cycle and reducing citrate levels, HIF shifts the IDH reaction toward RC to support citrate production and lipogenesis (Figure 7G). The reductive flux is active in vivo, fuels tumor growth, and can potentially be targeted pharmacologically. Understanding the significance of reductive glutamine metabolism in tumors may lead to metabolism-based therapeutic strategies.

Along with others, we reported that hypoxia and loss of VHL engage cells in reductive carboxylation (RC) from glutamine to support citrate and lipid synthesis (Filipp et al., 2012Metallo et al., 2012Wise et al., 2011). Wise et al. (2011) suggested that inactivation of HIF in VHL-deficient cells leads to reduction of RC. These observations raise the hypothesis that HIF, which is induced by hypoxia and is constitutively active inVHL-deficient cells, mediates RC. In our current work, we provide mechanistic insights that link HIF to RC. First, we demonstrate that polyclonal reconstitution of VHL in several human VHL-deficient RCC cell lines inhibits RC and restores glucose oxidation. Second, the VHL mutational analysis demonstrates that the ability of pVHL to mitigate reductive lipogenesis is mediated by HIF and is not the outcome of previously reported, HIF-independent pVHL function(s). Third, to prove our hypothesis we showed that constitutive expression of a VHL-independent HIF mutant is sufficient to phenocopy the reductive phenotype observed in VHL-deficient cells. In addition, we showed that RC is not a mere in vitro phenomenon, but it can be detected in vivo in human tumors growing as mouse xenografts. Lastly, treatment of VHL-deficient human xenografts with glutaminase inhibitors led to suppression of their growth as tumors.

7.9.10 Evaluation of HIF-1 inhibitors as anticancer agents

Semenza GL1.
Drug Discov Today. 2007 Oct; 12(19-20):853-9
http://dx.doi.org/10.1016/j.drudis.2007.08.006

Hypoxia-inducible factor 1 (HIF-1) regulates the transcription of many genes involved in key aspects of cancer biology, including immortalization, maintenance of stem cell pools, cellular dedifferentiation, genetic instability, vascularization, metabolic reprogramming, autocrine growth factor signaling, invasion/metastasis, and treatment failure. In animal models, HIF-1 overexpression is associated with increased tumor growth, vascularization, and metastasis, whereas HIF-1 loss-of-function has the opposite effect, thus validating HIF-1 as a target. In further support of this conclusion, immunohistochemical detection of HIF-1α overexpression in biopsy sections is a prognostic factor in many cancers. A growing number of novel anticancer agents have been shown to inhibit HIF-1 through a variety of molecular mechanisms. Determining which combination of drugs to administer to any given patient remains a major obstacle to improving cancer treatment outcomes.

Aurelian Udristioiu

Aurelian

Aurelian Udristioiu

Lab Director at Emergency County Hospital Targu Jiu

Mechanisms that control T cell metabolic reprogramming are now coming to light, and many of the same oncogenes importance in cancer metabolism are also crucial to drive T cell metabolic transformations, most notably Myc, hypoxia inducible factor (HIF)1a, estrogen-related receptor (ERR) a, and the mTOR pathway.
The proto-oncogenic transcription factor, Myc, is known to promote transcription of genes for the cell cycle, as well as aerobic glycolysis and glutamine metabolism. Recently, Myc has been shown to play an essential role in inducing the expression of glycolytic and glutamine metabolism genes in the initial hours of T cell activation. In a similar fashion, the transcription factor (HIF)1a can up-regulate glycolytic genes to allow cancer cells to survive under hypoxic conditions

Read Full Post »

Sirtuins

Writer and Curator: Larry H. Bernstein, MD, FCAP 

7.8  Sirtuins

7.8.1 Function and regulation of the mitochondrial Sirtuin isoform Sirt5 in Mammalia

7.8.2 Substrates and Regulation Mechanisms for the Human Mitochondrial Sirtuins- Sirt3 and Sirt5

7.8.3 The mTORC1 Pathway Stimulates Glutamine Metabolism and Cell Proliferation by Repressing SIRT4

7.8.4  Rab1A and small GTPases Activate mTORC1

7.8.5 PI3K.Akt signaling in osteosarcoma

7.8.6 The mTORC1-S6K1 Pathway Regulates Glutamine Metabolism through the eIF4B-Dependent Control of c-Myc Translation

7.8.7 Localization of mouse mitochondrial SIRT proteins

7.8.8 SIRT4 Has Tumor-Suppressive Activity and Regulates the Cellular Metabolic Response to DNA Damage by Inhibiting Mitochondrial Glutamine Metabolism

7.8.9 Mitochondrial sirtuins and metabolic homeostasis

7.8.10 Mitochondrial sirtuins

7.8.11 Sirtuin regulation of mitochondria: energy production, apoptosis, and signaling


7.8.1 Function and regulation of the mitochondrial Sirtuin isoform Sirt5 in Mammalia

Gertz M1Steegborn C.
Biochim Biophys Acta. 2010 Aug; 1804(8):1658-65
http://dx.doi.org:/10.1016/j.bbapap.2009.09.011

Sirtuins are a family of protein deacetylases that catalyze the nicotinamide adenine dinucleotide (NAD(+))-dependent removal of acetyl groups from modified lysine side chains in various proteins. Sirtuins act as metabolic sensors and influence metabolic adaptation but also many other processes such as stress response mechanisms, gene expression, and organismal aging. Mammals have seven Sirtuin isoforms, three of them – Sirt3, Sirt4, and Sirt5 – located to mitochondria, our centers of energy metabolism and apoptosis initiation. In this review, we shortly introduce the mammalian Sirtuin family, with a focus on the mitochondrial isoforms. We then discuss in detail the current knowledge on the mitochondrial isoform Sirt5. Its physiological role in metabolic regulation has recently been confirmed, whereas an additional function in apoptosis regulation remains speculative. We will discuss the biochemical properties of Sirt5 and how they might contribute to its physiological function. Furthermore, we discuss the potential use of Sirt5 as a drug target, structural features of Sirt5 and of an Sirt5/inhibitor complex as well as their differences to other Sirtuins and the current status of modulating Sirt5 activity with pharmacological compounds.

removal of acetyl groups from modified lysine side chain

removal of acetyl groups from modified lysine side chain

http://ars.els-cdn.com/content/image/1-s2.0-S1570963909002593-gr1.sml
removal of acetyl groups from modified lysine side chain

sirtuin structure

sirtuin structure

http://ars.els-cdn.com/content/image/1-s2.0-S1570963909002593-gr2.sml
sirtuin structure

7.8.2 Substrates and Regulation Mechanisms for the Human Mitochondrial Sirtuins- Sirt3 and Sirt5

Schlicker C1Gertz MPapatheodorou PKachholz BBecker CFSteegborn C
J Mol Biol. 2008 Oct 10; 382(3):790-801
http://dx.doi.org/10.1016/j.jmb.2008.07.048

The enzymes of the Sirtuin family of nicotinamide-adenine-dinucleotide-dependent protein deacetylases are emerging key players in nuclear and cytosolic signaling, but also in mitochondrial regulation and aging. Mammalian mitochondria contain three Sirtuins, Sirt3, Sirt4, and Sirt5. Only one substrate is known for Sirt3 as well as for Sirt4, and up to now, no target for Sirt5 has been reported. Here, we describe the identification of novel substrates for the human mitochondrial Sirtuin isoforms Sirt3 and Sirt5. We show that Sirt3 can deacetylate and thereby activate a central metabolic regulator in the mitochondrial matrix, glutamate dehydrogenase. Furthermore, Sirt3 deacetylates and activates isocitrate dehydrogenase 2, an enzyme that promotes regeneration of antioxidants and catalyzes a key regulation point of the citric acid cycle. Sirt3 thus can regulate flux and anapleurosis of this central metabolic cycle. We further find that the N- and C-terminal regions of Sirt3 regulate its activity against glutamate dehydrogenase and a peptide substrate, indicating roles for these regions in substrate recognition and Sirtuin regulation. Sirt5, in contrast to Sirt3, deacetylates none of the mitochondrial matrix proteins tested. Instead, it can deacetylate cytochrome c, a protein of the mitochondrial intermembrane space with a central function in oxidative metabolism, as well as apoptosis initiation. Using a mitochondrial import assay, we find that Sirt5 can indeed be translocated into the mitochondrial intermembrane space, but also into the matrix, indicating that localization might contribute to Sirt5 regulation and substrate selection.

Mitochondria are central organelles in cellular energy metabolism, but also in processes such as apoptosis, cellular senescence, and lifespan regulation.1 and 2 Failures in mitochondrial function and regulation contribute to aging-related diseases, such as atherosclerosis3 and Parkinson’s disease,4 likely by increasing cellular levels of reactive oxygen species and the damage they cause.1 Emerging players in metabolic regulation and cellular signaling are members of the Sirtuin family of homologs of “silent information regulator 2” (Sir2), a yeast protein deacetylase.5 and 6 Sir2 was found to be involved in aging processes and lifespan determination in yeast,7 and 8 and its homologs were subsequently identified as lifespan regulators in various higher organisms.89 and 10 Sirtuins form class III of the protein deacetylase superfamily and hydrolyze one nicotinamide adenine dinucleotide (NAD +) as cosubstrate for each lysine residue they deacetylate.11 and 12 The coupling of deacetylation to NAD + was proposed to link changes in cellular energy levels to deacetylation activity,13 and 14 which would indicate Sirtuins as metabolic sensors. Other known regulation mechanisms for Sirtuin activity are the modulation of the expression levels of their genes6 and the autoinhibitory effect of an N-terminal region on the yeast Sirtuin “homologous to SIR2 protein 2” (Hst2).15

The seven mammalian Sirtuin proteins (Sirt1–Sirt7) have various substrate proteins that mediate functions in genetic, cellular, and mitochondrial regulation.5 and 6 The best-studied mammalian Sir2 homolog, Sirt1, was shown to regulate, among others, transcription factor p53, nuclear factor-kappa B, and peroxisome proliferator-activated receptor gamma coactivator-1-alpha.6 Three human Sirtuin proteins are known to be located in the mitochondria, Sirt3, Sirt4, and Sirt5,161718 and 19 although Sirt3 was reported to change its localization to nuclear when coexpressed with Sirt5.20 The recent identification of the first substrates for mitochondrial Sirtuins—acetyl coenzyme A synthetase 221 and 22 and glutamate dehydrogenase (GDH)16—as targets of Sirtuins 3 and 4, respectively, revealed that these Sirtuins control a regulatory network that has implications for energy metabolism and the mechanisms of caloric restriction (CR) and lifespan determination.23 Sirt3 regulates adaptive thermogenesis and decreases mitochondrial membrane potential and reactive oxygen species production, while increasing cellular respiration.24 Furthermore, Sirt3 is down-regulated in several genetically obese mice,24 and variability in the human SIRT3 gene has been linked to survivorship in the elderly. 25 In contrast to the deacetylases Sirt3 and Sirt5, Sirt4 appears to be an ADP ribosyltransferase. 16 Through this activity, Sirt4 inhibits GDH and thereby down-regulates insulin secretion in response to amino acids. 16 For Sirt5, however, there is no report yet on its physiological function or any physiological substrate. It is dominantly expressed in lymphoblasts and heart muscle cells,17 and 26 and its gene contains multiple repetitive elements that might make it a hotspot for chromosomal breaks. 26 Interestingly, the Sirt5 gene has been located to a chromosomal region known for abnormalities associated with malignant diseases. 26

A proteomics study found 277 acetylation sites in 133 mitochondrial proteins;27 many of them should be substrates for the mitochondrial Sirtuins mediating their various functions, but up to now, only one physiological substrate could be identified for Sirt3,21 and 22 and none could be identified for Sirt5. Our understanding of substrate selection by Sirtuins is incomplete, and knowledge of specific Sirtuin targets would be essential for a better understanding of Sirtuin-mediated processes and Sirtuin-targeted therapy. A first study on several Sirtuins showed varying preferences among acetylated peptides.28 Structural and thermodynamic analysis of peptides bound to the Sirtuin Sir2Tm from Thermatoga maritima indicated that positions − 1 and + 2 relative to the acetylation site play a significant role in substrate binding. 29 However, these studies were conducted with nonphysiological Sirtuin/substrate pairs, and other studies indicated little sequence specificity; instead, the yeast Sirtuin Hst2 was described to display contextual and conformational specificity: Hst2 deacetylated acetyl lysine only in the context of a protein, and it preferentially deacetylated within flexible protein regions. 30 Finally, statistical analysis of a proteomics study on acetylated proteins identified preferences at various positions such as + 1, − 2, and − 3, and deacetylation sites appeared to occur preferentially in helical regions. 27 Thus, our present knowledge of Sirtuin substrates and of factors determining Sirtuin specificity is incomplete and insufficient for sequence-based identification of physiological substrates.

Here, we describe the identification of novel targets for the mitochondrial deacetylases Sirt3 and Sirt5. We show that Sirt3 can deacetylate and thereby activate the enzymes GDH and isocitrate dehydrogenase (ICDH) 2—two key metabolic regulators in the mitochondrial matrix. We find that the N- and C-terminal regions of Sirt3 influence its activity against GDH and a peptide substrate, indicating roles in regulation and substrate recognition for these regions. Furthermore, we find that Sirt5 can deacetylate cytochrome c, a protein of the mitochondrial intermembrane space (IMS) with a central function in oxidative metabolism and apoptosis.

The upstream sequence contributes to the target specificity of Sirt3 and Sirt5

Sirtuins have been reported to have little sequence specificity,30 but other studies indicated a sequence preference dominated by positions − 1 and + 2.29 We tested the importance of the amino acid pattern preceding the acetylation site for recognition by the mitochondrial Sirtuins Sirt3 and Sirt5 through a fluorescence assay. First, the fluorogenic and commercially available modified p53-derived tetrapeptide QPK-acetylK, originally developed for Sirt2 assays but also efficiently used by Sirt3, was tested. Even 60 μg of Sirt5 did not lead to any deacetylation signal, whereas 0.35 μg of Sirt3 efficiently deacetylated the peptide (Fig. 1a). We then tested Sirt3 and Sirt5 on a second modified p53-derived tetrapeptide, RHK-acetylK. Sirt3 (0.5 μg) showed a slightly increased activity against this substrate as compared to QPK-acetylK (Fig. 1b); more importantly, 0.5 μg of Sirt5 showed significant activity against this peptide. These results show that the mitochondrial Sirtuins Sirt3 and, especially, Sirt5 indeed recognize the local target sequence, and target positions further upstream of − 1 seem to be involved in substrate recognition. For identification of novel substrates for the mitochondrial Sirtuins and further characterization of their target recognition mechanisms, we then turned to testing full-length proteins, as the downstream sequence and the larger protein context of the deacetylation site might also contribute to substrate selection.

Sirtuin substrate specificity

Sirtuin substrate specificity

Fig. 1. Testing the substrate specificity of Sirt3 and Sirt5 with peptides. (a) Sirt3, but not Sirt5, deacetylates the fluorogenic peptide QPK-acetylK. (b) Sirt3 efficiently deacetylates the fluorogenic peptide RHK-acetylK, and Sirt5 also significantly deacetylates this substrate.
http://ars.els-cdn.com/content/image/1-s2.0-S0022283608009029-gr1.jpg

Sirt3 deacetylates and activates GDH

In order to identify novel physiological substrates of the mitochondrial Sirtuins, we used proteins isolated in their partly acetylated form from natural sources (i.e., from mammalian mitochondria). These proteins, carrying physiological acetylations, were tested as Sirt3 and Sirt5 substrates in vitro in an ELISA system using an antibody specific for acetylated lysine. In a recent proteomics study, 27 GDH, a central regulator of mitochondrial metabolism, was identified to be acetylated in a feeding-dependent manner. With our ELISA, we found that Sirt3 and Sirt5 can both deacetylate pure GDH isolated from mitochondria, but with very different efficiencies ( Fig. 2a). Sirt3 significantly deacetylated GDH, but even large amounts of Sirt5 decreased the acetylation level of this substrate only slightly. We next tested the effect of GDH deacetylation on its activity. Deacetylation of GDH through incubation with Sirt3 and NAD + before its examination in a GDH activity assay increased its activity by 10%, and a stronger stimulation of GDH activity was seen when larger amounts of Sirt3 were used for deacetylation ( Fig. 2b). GDH is colocalized with Sirt3 in the mitochondrial matrix 1618 and 19 and, thus, likely could be a physiological substrate of this Sirtuin. Indeed, GDH from a Sirt3 knockout mouse was recently shown to be hyperacetylated compared to protein from wild-type mice. 31 Thus, Sirt3 deacetylates GDH in vivo, and our results show that this direct deacetylation of GDH by Sirt3 leads to GDH activation.

sirtuin structure

sirtuin structure

Fig. 2. Sirt3 can deacetylate and thereby activate GDH. (a) Deacetylation of GDH tested in ELISA. Sirt3 efficiently deacetylates GDH, whereas Sirt5 has only a small effect on the acetylation state. (b) GDH activity is increased after deacetylation of the enzyme by Sirt3. The increase in GDH activity depends on the amount of Sirt3 activity used for deacetylation.
http://ars.els-cdn.com/content/image/1-s2.0-S0022283608009029-gr2.jpg

Sirt3 can deacetylate and thereby activate ICDH2

In the proteomics study by Kim et al., the mitochondrial citric acid cycle enzymes fumarase and ICDH2 (a key regulator of this metabolic cycle) were found to be acetylated in a feeding-dependent manner. 27 In our ELISA system, we found that Sirt3 efficiently deacetylated the ICDH2 substrate isolated from mitochondria ( Fig. 3a). Western blot analysis (data not shown) and mass spectrometry confirmed that, indeed, the ICDH2 fraction of the partially purified protein was deacetylated by Sirt3. In contrast, even large amounts of Sirt5 did not significantly decrease the acetylation level of this substrate ( Fig. 3a). As expected, deacetylation of ICDH2 by Sirt3 was dependent on NAD +. Fumarase, in contrast, could not be deacetylated as efficiently as ICDH2 through treatment with either Sirt3 or Sirt5 ( Fig. 3b). The low absolute values over background for the ELISA with fumarase, however, might indicate low acetylation levels of the natively purified protein, and a stronger effect might be attainable when testing fumarase with a higher acetylation level.

Fig. 3. Sirt3 deacetylates ICDH2, but not fumarase. (a) Deacetylation of ICDH2 by Sirt3 and Sirt5 tested in ELISA. Sirt3, but not Sirt5, deacetylates ICDH2 in a NAD +-dependent manner. (b) Fumarase acetylation determined through ELISA cannot be significantly decreased by incubation with recombinant Sirt3 or Sirt5. (c) ICDH2 activity measured in a spectrophotometric assay based on the formation of NADPH. ICDH2 activity (continuous line) is increased after deacetylation of the enzyme by Sirt3 (dashed line). (d) The stimulatory effect of deacetylation on ICDH2 activity depends on the amount of deacetylase activity added during pretreatment. (e) ICDH2 with and without Sirt3 treatment analyzed by mass spectrometry after proteolytic digest. The decrease in the signal at 962.3 Da and the increase in signal at 903.5 Da indicate deacetylation at either K211 or K212.

In order to analyze the potential physiological function of ICDH2 deacetylation, we tested the effect of Sirt3-mediated ICDH2 deacetylation on its activity. Incubation of ICDH2 with Sirt3 and NAD + prior to its analysis in an ICDH activity assay increased its activity (Fig. 3c). The stimulation of ICDH2 activity was further increased when larger amounts of Sirt3 were used for deacetylation (Fig. 3d), and no significant increase in ICDH2 activity was observed when the Sirtuin inhibitor dihydrocoumarin was present during incubation with Sirt3 (data not shown). Sirt3 and ICDH2 are colocalized in the mitochondrial matrix,1619 and 32 and we therefore assume that ICDH2 is likely a physiological substrate for Sirt3, which activates ICDH2 by deacetylation.
http://ars.els-cdn.com/content/image/1-s2.0-S0022283608009029-gr3.jpg

Sirt3 can deacetylate KK motifs in substrate proteins

In order to identify the site of ICDH2 deacetylation upon treatment with Sirt3, we analyzed ICDH2 by mass spectrometry. For analyzing pure ICDH2, we excised its band from an SDS gel before mass spectrometry analysis. In the proteomics study by Kim et al., two acetylation sites were reported for ICDH2: K75 and K241 (numbering of the partial sequence of the unprocessed precursor; SwissProt entry P33198). 27 After digest of ICDH2, we could not detect peptides comprising K75 and, therefore, could not determine its acetylation status, and we only observed the deacetylated form of K241. We identified an additional acetylation site, however, by detecting signals at m/z = 903.5 and m/z = 962.3 for the peptide QYAIQKK (residues 206–212) carrying one and two acetyl groups, respectively ( Fig. 3e; calculated m/z = 903.5 and 962.5). Sirt3 treatment decreased the signal for the double-acetylated form and increased the signal for the single-acetylated form as compared to internal peptides [e.g., m/z = 890.5 (calculated m/z = 890.5) andm/z = 1041.4 (calculated m/z = 1041.5)]. These data indicate that Sirt3 deacetylates either position K211 or K212 of this KK motif located at a surface-exposed end of a helix that flanks the active site of ICDH2. 33Deacetylation of a KK motif by Sirt3 is consistent with the efficient use of the tested peptide substrates (see above) that both carry KK motifs.

Fig. 4. Increased activity of N- and C-terminally truncated Sirt3. (a) Specific activity against a peptide substrate of the longest Sirt3 form after proteolytic processing that covers residues 102–399. N-terminal truncation increases the specific activity dramatically, and an additional C-terminal truncation activates the catalytic core further. (b) Homology model of Sirt3 based on the crystal structure of Sirt2. The part comprising the catalytic core is shown in red. The NAD + and peptide ligands were manually placed into their binding sides based on the crystal structure of their complex with a bacterial Sir2 homolog from T. maritima. Parts removed in N- and C-terminal truncation constructs are shown in cyan and blue, respectively. (c) Level of acetylation of GDH tested in ELISA. The shortest Sirt3 form Sirt3(114–380) deacetylates more efficiently than Sirt3(114–399) and Sirt3(102–399), which show activities comparable to each other.

Sirt5 can deacetylate cytochrome c

Sirt5 can deacetylate cytochrome c

http://ars.els-cdn.com/content/image/1-s2.0-S0022283608009029-gr4.jpg

Sirt5 can deacetylate cytochrome c

The Sirt5 protein that we used for our study comprises residues 34–302, corresponding to the fully active catalytic core determined for Sirt3 (see above). This protein is indeed active against a peptide substrate, but it showed no significant activity against the acetylated mitochondrial matrix proteins tested so far: GDH, ICDH2, and fumarase. We thus picked cytochrome c, a central protein in energy metabolism and apoptosis localized in the mitochondrial IMS, from the list of acetylated mitochondrial proteins 27 for testing as deacetylation substrate. Sirt5 showed deacetylation activity against pure cytochrome c in our ELISA system, whereas Sirt3 had almost no activity against this substrate ( Fig. 5a). Even the more active shortened form of Sirt3(114–380) showed no considerable activity against this substrate.

Fig. 5.  Sirt5 can deacetylate cytochrome c. (a) Deacetylation of cytochrome c tested in ELISA. Sirt5 uses cytochrome c as substrate for deacetylation, whereas Sirt3 treatment leaves the acetylation level of cytochrome c unchanged. (b) Model of the action of the mammalian Sirtuins Sirt3, Sirt4, and Sirt5 in mitochondria. CAC: citric acid cycle. (c) Digest of Sirt5 synthesized in vitro with PK. The protein is fully degraded at proteinase concentrations of 25 μg/ml and above. (d) Import of Sirt5 into isolated yeast mitochondria. Sirt5 reaches an inner mitochondrial compartment in the presence and in the absence of the mitochondrial membrane potential (ΔΨ), whereas Sirt3, as a control for a matrix-targeted protein, is not imported into uncoupled mitochondria. (e) Intramitochondrial localization of Sirt5. Part of the imported Sirt5 is sensitive to PK after swelling (SW) and thus localized in the IMS, but another part of the protein remains protease-resistant and therefore appears to be localized to the matrix. Atp3, a protein localized at the matrix site of the mitochondrial inner membrane, and an IMS-located domain of translocase of inner membrane 23 detected by Western blot analysis served as controls for matrix transport and swelling, respectively. aTim23: anti-Tim23. (f) Scheme of the domain organizations of Sirt3 and Sirt5. Numbers in brackets are residue numbers for boundaries of protein parts. NLS: nuclear localization sequence; MLS: mitochondrial localization sequence; R1, regulatory region 1; R2: regulatory region 2.
http://ars.els-cdn.com/content/image/1-s2.0-S0022283608009029-gr5.jpg

Cytochrome c might be a physiological substrate of Sirt5 if this Sirtuin is localized to the mitochondrial IMS (Fig. 5b). A recent study on overexpressed tagged mouse Sirt5 in COS7 cells 20 indeed indicated that Sirt5, at least from mouse, is localized in the IMS. In order to test whether human Sirt5 can be localized to the IMS, we performed import experiments with human Sirt3 and Sirt5 using isolated yeast mitochondria as a model system. 3 Sirt3 and Sirt5 proteins were incubated with mitochondria, followed by PK treatment for degradation of nonimported protein ( Fig. 5d). In a parallel reaction, mitochondria were uncoupled prior to the import reaction by addition of valinomycin (− ΔΨ). Sirt3, a protein known to be located in the mitochondrial matrix, 19 was only efficiently imported in the presence of a membrane potential. Dependence on the mitochondrial potential is a hallmark of matrix import, 38 and the results thus show that Sirt3 is imported into the correct compartment in our experimental system. Sirt5, in contrast, reaches an inner-mitochondrial compartment both in the presence and in the absence of the membrane potential, suggesting that Sirt5 may accumulate in the IMS.

In order to further test the localization of Sirt5, we removed the outer mitochondrial membrane after the import reaction by osmotic swelling, followed by PK digest of then accessible proteins (Fig. 5e). Rupture of the outer membrane was confirmed by monitoring the accessibility of an IMS-exposed domain of endogenous translocase of inner membrane 23 (detected by Western blot analysis). Part of the imported Sirt5 was degraded by PK, indicating its localization in the IMS.

Sirtuins are involved in central physiological regulation mechanisms, many of them with relevance to metabolic regulation and aging processes.5 and 6 Therefore, the seven mammalian Sirtuin isoforms are emerging targets for the treatment of metabolic disorders and aging-related diseases.39 For most Sirtuin effects, however, the specific signaling mechanisms and molecular targets are not yet known. We have identified novel potential targets for Sirtuins in mitochondria, the major metabolic centers in cells. We found that Sirt3 can deacetylate and thereby activate ICDH2, a key regulation point for flux throughout the citric acid cycle. Interestingly, the ICDH isoform regulated by Sirt3 forms NADPH instead of the NADH used for ATP synthesis. This activity is assumed to be important for the NADPH-dependent regeneration of antioxidants,40 and its stimulation by Sirt3 should thus help to slow oxidative damage and cellular aging processes. Furthermore, Sirt3 deacetylates GDH in vitro (this study) and in vivo31 and we find that this modification also stimulates GDH activity that promotes glucose and ATP synthesis by enabling amino acids to be used as fuels for citric acid cycle and gluconeogenesis. 41 Consistently, Sirt3 was reported to increase respiration, 24 which is needed for ATP synthesis but also for conversion of amino acids into glucose and urea. 41 The enzyme previously identified to be activated by Sirt3, acetyl coenzyme A synthetase 2, 21 and 22 also fuels the citric acid cycle independently of glycolysis by activating free acetate (Fig. 5b). Interestingly, a shift away from liver glycolysis is one of the metabolic changes observed under CR, a feeding regimen with 20–40% fewer calories than consumed ad libitum that is found to extend the lifespan of a variety of organisms. 6 CR was previously reported to increase GDH activity in the liver, 42where Sirt3 is highly expressed, 17 and Sirt3 activity is known to be increased by CR. 6 and 24 It thus appears that Sirt3 mediates some of the effects of CR and lifespan regulation, consistent with its implication in survivorship in the elderly 25 and 43 and the prominent role of Sirtuins in CR found for various organisms,6 and 44 and it also appears that GDH activation likely contributes to the Sirt3-dependent effects.

Little is known about additional factors regulating the activity and specificity of Sirtuin enzymes. Their requirement for NAD + indicates that the NAD +/NADH ratio should regulate Sirtuins,13 and 14 but even changes to ratios observed under extreme conditions such as CR appear to influence Sirtuin activity only slightly.35 Furthermore, NAD + levels would influence all Sirtuins similarly, but a more specific tuning of individual Sirtuin activities appears necessary in order to orchestrate the many effects mediated by Sirtuins (see, e.g., discussion above).6 and 45 A deeper insight into the regulation of Sirtuin enzymes would also be required for the development of more specific Sirtuin inhibitors—a prerequisite for Sirtuin-targeted therapy.39 The regulatory parts flanking the catalytic cores might be interesting target sites (Fig. 5f). N-terminal extensions between ∼ 30 and 120 residues are present in all human Sirtuins but show little conservation, indicating that they might respond to various regulators. Our results indicate that the corresponding N-terminal region in Sirt3 also blocks productive binding for small peptides (Fig. 4a), but enables access for entire protein substrates (Fig. 4c). The C-terminal truncated part in our experiments (Sirt3 residues 380–399) is formed by α14 (secondary structure numbering for Sirt236) whose end corresponds to the N-terminus of Hst2 α13 that partly occupies the NAD +binding site.15 In Sirt3, however, the C-terminal truncation alone lowers activity only slightly, and we assume that it has no regulatory function on its own but might instead assist the N-terminal autoinhibitory region. This module of the N-terminus and the C-terminus (Figs. 4b and 5f) appears to contribute to the substrate specificity of the enzyme, and ligands binding to it might enable or block rearrangements opening up the active site and thereby regulate the enzyme’s activity. Alternatively, the flanking parts might be removed by proteolytic processing or alternative splicing, thereby changing Sirtuin activity and specificity.

7.8.3 The mTORC1 Pathway Stimulates Glutamine Metabolism and Cell Proliferation by Repressing SIRT4

Csibi A1Fendt SMLi CPoulogiannis GChoo AYChapski DJ, et al.
Cell. 2013 May 9; 153(4):840-54.
http://dx.doi.org:/10.1016/j.cell.2013.04.023

Proliferating mammalian cells use glutamine as a source of nitrogen and as a key anaplerotic source to provide metabolites to the tricarboxylic acid cycle (TCA) for biosynthesis. Recently, mTORC1 activation has been correlated with increased nutrient uptake and metabolism, but no molecular connection to glutaminolysis has been reported. Here, we show that mTORC1 promotes glutamine anaplerosis by activating glutamate dehydrogenase (GDH). This regulation requires transcriptional repression of SIRT4, the mitochondrial-localized sirtuin that inhibits GDH. Mechanistically, mTORC1 represses SIRT4 by promoting the proteasome-mediated destabilization of cAMP response element binding-2 (CREB2). Thus, a relationship between mTORC1, SIRT4 and cancer is suggested by our findings. Indeed, SIRT4 expression is reduced in human cancer, and its overexpression reduces cell proliferation, transformation and tumor development. Finally, our data indicate that targeting nutrient metabolism in energy-addicted cancers with high mTORC1 signaling may be an effective therapeutic approach.

Proliferating mammalian cells use glutamine as a source of nitrogen and as a key anaplerotic source to provide metabolites to the tricarboxylic acid cycle (TCA) for biosynthesis. Recently, mTORC1 activation has been correlated with increased nutrient uptake and metabolism, but no molecular connection to glutaminolysis has been reported. Here, we show that mTORC1 promotes glutamine anaplerosis by activating glutamate dehydrogenase (GDH). This regulation requires transcriptional repression of SIRT4, the mitochondrial-localized sirtuin that inhibits GDH. Mechanistically, mTORC1 represses SIRT4 by promoting the proteasome-mediated destabilization of cAMP response element binding-2 (CREB2). Thus, a relationship between mTORC1, SIRT4 and cancer is suggested by our findings. Indeed, SIRT4 expression is reduced in human cancer, and its overexpression reduces cell proliferation, transformation and tumor development. Finally, our data indicate that targeting nutrient metabolism in energy-addicted cancers with high mTORC1 signaling may be an effective therapeutic approach.

Nutrient availability plays a pivotal role in the decision of a cell to commit to cell proliferation. In conditions of sufficient nutrient sources and growth factors (GFs), the cell generates enough energy and acquires or synthesizes essential building blocks at a sufficient rate to meet the demands of proliferation. Conversely, when nutrients are scarce, the cell responds by halting the biosynthetic machinery and by stimulating catabolic processes such as fatty acid oxidation and autophagy to provide energy maintenance (Vander Heiden et al., 2009). Essential to the decision process between anabolism and catabolism is the highly conserved, atypical Serine/Threonine kinase mammalian Target of Rapamycin Complex 1 (mTORC1), whose activity is deregulated in many cancers (Menon and Manning, 2008). This complex, which consists of mTOR, Raptor, and mLST8, is activated by amino acids (aa), GFs (insulin/IGF-1) and cellular energy to drive nutrient uptake and subsequently proliferation (Yecies and Manning, 2011). The molecular details of these nutrient-sensing processes are not yet fully elucidated, but it has been shown that aa activate the Rag GTPases to regulate mTORC1 localization to the lysosomes (Kim et al., 2008Sancak et al., 2008); and GFs signal through the PI3K-Akt or the extracellular signal-regulated kinase (ERK)-ribosomal protein S6 kinase (RSK) pathways to activate mTORC1 by releasing the Ras homolog enriched in brain (RHEB) GTPase from repression by the tumor suppressors, tuberous sclerosis 1 (TSC1)– TSC2 (Inoki et al., 2002Manning et al., 2002Roux et al., 2004). Finally, low energy conditions inhibit mTORC1 by activating AMPK and by repressing the assembly of the TTT-RUVBL1/2 complex. (Inoki et al., 2003Gwinn et al., 2008Kim et al., 2013).

Glutamine, the most abundant amino acid in the body plays an important role in cellular proliferation. It is catabolized to α-ketoglutarate (αKG), an intermediate of the tricarboxylic acid (TCA) cycle through two deamination reactions in a process termed glutamine anaplerosis (DeBerardinis et al., 2007). The first reaction requires glutaminase (GLS) to generate glutamate, and the second occurs by the action of either glutamate dehydrogenase (GDH) or transaminases. Incorporation of αKG into the TCA cycle is the major anaplerotic step critical for the production of biomass building blocks including nucleotides, lipids and aa (Wise and Thompson, 2010). Recent studies have demonstrated that glutamine is also an important signaling molecule. Accordingly, it positively regulates the mTORC1 pathway by facilitating the uptake of leucine (Nicklin et al., 2009) and by promoting mTORC1 assembly and lysosomal localization (Duran et al., 2012;Kim et al., 2013).

Commonly occurring oncogenic signals directly stimulate nutrient metabolism, resulting in nutrient addiction. Oncogenic levels of Myc have been linked to increased glutamine uptake and metabolism through a coordinated transcriptional program (Wise et al., 2008Gao et al., 2009). Hence, it is not surprising that cancer cells are addicted to glutamine (Wise and Thompson, 2010). Thus, considering the prevalence of mTORC1 activation in cancer and the requirement of nutrients for cell proliferation, understanding how mTORC1 activation regulates nutrient levels and metabolism is critical. Activation of the mTORC1 pathway promotes the utilization of glucose, another nutrient absolutely required for cell growth. However, no study has yet investigated if and how the mTORC1 pathway regulates glutamine uptake and metabolism. Here, we discover a novel role of the mTORC1 pathway in the stimulation of glutamine anaplerosis by promoting the activity of GDH. Mechanistically, mTORC1 represses the transcription of SIRT4, an inhibitor of GDH. SIRT4 is a mitochondrial-localized member of the sirtuin family of NAD-dependent enzymes known to play key roles in metabolism, stress response and longevity (Haigis and Guarente, 2006). We demonstrate that the mTORC1 pathway negatively controls SIRT4 by promoting the proteasome-mediated degradation of cAMP-responsive element-binding (CREB) 2. We reveal that SIRT4 levels are decreased in a variety of cancers, and when expressed, SIRT4 delays tumor development in a Tsc2−/− mouse embryonic fibroblasts (MEFs) xenograft model. Thus, our findings provide new insights into how mTORC1 regulates glutamine anaplerosis, contributing therefore to the metabolic reprogramming of cancer cells, an essential hallmark to support their excessive needs for proliferation.

The mTORC1 pathway regulates glutamine metabolism via GDH

The activation of the mTORC1 pathway has recently been linked to glutamine addiction of cancer cells (Choo et al., 2010), yet it remains to be resolved if mTORC1 serves as a regulator of glutamine anaplerosis. To investigate this possibility, we first determined the effect of mTORC1 activity on glutamine uptake. We measured glutamine uptake rates in Tsc2 wild-type (WT) and Tsc2−/− MEFs. We found that Tsc2−/− MEFs consumed significantly more glutamine (Figure 1A), showing that mTORC1 activation stimulates the uptake of this nutrient. In addition, re-expression of Tsc2 in Tsc2−/− cells reduced glutamine uptake (Figure S1A). Similarly, mTORC1 inhibition with rapamycin resulted in decreased glutamine uptake in MEFs (Figure 1A). The decreased on glutamine uptake was significantly reduced after 6h of rapamycin treatment when compared to control (data not shown). To further confirm the role of mTORC1 on glutamine uptake, we used human embryonic kidney (HEK) 293T cells stably expressing either WT-RHEB or a constitutively active mutant (S16H) of RHEB. Increased mTORC1 signaling, as evidenced by sustained phosphorylation of S6K1 and its target rpS6, was observed in RHEB-expressing cells (Figure S1B). The activation of the mTORC1 pathway nicely correlated with an increase in glutamine consumption, therefore confirming that changes in mTORC1 signaling are reflected in cellular glutamine uptake (Figure S1B). To determine whether the modulation of glutamine uptake by the mTORC1 pathway occurs in cancer cells, we examined glutamine uptake rates in conditions of mTORC1 inhibition in human epithelial tumor cell lines, including the colon carcinoma DLD1, and the prostate cancer DU145. Rapamycin treatment resulted in decreased proliferation (data not shown) and yielded a decreased glutamine uptake in both cell lines (Figure 1B & data not shown). Glutamine is the major nitrogen donor for the majority of ammonia production in cells (Figure 1C) (Shanware et al., 2011). Consistent with decreased glutamine uptake, we found that ammonia levels were also diminished after rapamycin treatment (Figure S1C).

Figure 1  The mTORC1 pathway regulates glutamine metabolism via glutamate dehydrogenase

We next examined the fate of glutamine in conditions of mTORC1 inhibition, using gas chromatography/mass spectrometry (GC/MS) analysis to monitor the incorporation of uniformly labeled [U-13C5]-Glutamine into TCA cycle intermediates. Direct glutamine contribution to I̧KG (m+5), succinate (m+4), malate (m+4) and citrate (m+4) was decreased in rapamycin treated cells (Figure S1D) indicating that rapamycin impaired glutamine oxidation and subsequent carbon contribution into the TCA cycle.

To test whether glutamine uptake or glutamine conversion is limiting, we measured the intracellular levels of glutamine and glutamate in DLD1 cells. Increased levels of glutamine and/or glutamate will show that the catalyzing enzyme activity is limiting and not glutamine transport itself (Fendt et al., 2010). Rapamycin treatment resulted in increased intracellular levels of both glutamine and glutamate, showing that glutamate to αKG conversion is the critical limiting reaction (Figures 1D & 1E). To further confirm the implication of the glutamate catalyzing reaction we also measured αKG levels. If glutamate conversion is indeed critical we expect no alteration in αKG levels. This is expected because αKG is downstream of the potentially limiting glutamate conversion step, and it has been shown that product metabolite concentrations of limiting metabolic enzymes stay unaltered, while the substrate metabolite concentrations change to keep metabolic homeostasis (Fendt et al., 2010). We found that αKG levels were unaltered after rapamycin treatment, corroborating that the limiting enzymatic step is glutamate conversion (Figure 1F). To further confirm the limitation in glutamate-to-αKG conversion, we measured flux through this reaction. Strikingly, this flux was significantly reduced during rapamycin treatment (Figure 1G). Additionally, the inhibition of mTORC1 resulted in increased glutamate secretion (Figure 1H), thus confirming that the glutamate-to-αKG conversion step is a major bottleneck in the glutamine pathway during rapamycin treatment.

Glutamate conversion can be conducted by GDH (Figure 1C), suggesting that the mTORC1 pathway potentially regulates this enzyme. In agreement, rapamycin treatment resulted in decreased GDH activity in DLD1 cells (Figure 1I). To exclude that transaminases play a role in the mTORC1-induced regulation of glutamine metabolism, we used amin ooxyacetate (AOA) at a concentration shown to effectively inhibit the two predominant transaminases, alanine aminotransferase (ALT) and aspartate aminotransferase (AST) (Figure 1C) (Wise et al., 2008), or rapamycin in the presence of α-15N-labeled glutamine. Subsequently, we measured 15N-labeling patterns and metabolite levels of alanine, an amino acid that is predominately produced by a transaminase-catalyzed reaction (Possemato et al., 2011). We found that AOA dramatically decreased 15N contribution and metabolite levels of alanine, while rapamycin only mildly affected the 15N contribution to this amino acid and showed no effect on alanine levels compared to the control condition (Figures 1J & S1E). In conclusion, these data demonstrate that GDH, not transaminases, plays a major role in the regulation of glutamine metabolism downstream of mTORC1.

mTORC1 controls GDH activity by repressing SIRT4

As our results show that mTORC1 regulates glutamate dehydrogenase, we sought to identify the molecular mechanism. SIRT4 is a negative regulator of GDH activity through ADP-ribosylation (Haigis et al., 2006), thus suggesting that mTORC1 potentially controls this step of glutamine metabolism via SIRT4. To test this possibility, we first assessed the ADP-ribosylation status of GDH by introducing biotin-labeled NAD followed by immunoprecipitation using avidin-coated beads. Rapamycin treatment led to an increase in the mono-ADP-ribosylation status of GDH, similar to that observed in cells stably expressing SIRT4 (Figure 2A). Importantly, we found that the knockdown of SIRT4 abrogated the rapamycin-induced decrease in the activity of GDH (Figures 2B & S2A). Strikingly, SIRT4 protein levels were increased upon mTORC1 inhibition in MEFs (Figures 2C). This regulation was confirmed in both DLD1 and DU145 cells (Figures 2D). Remarkably, rapamycin potently increased SIRT4 levels after 6h of treatment (Figure S2B), correlating with reduced glutamine consumption at the same time point (data not shown). In contrast, SIRT4 levels were not influenced by the treatment of MEFs with U0216, an inhibitor of MEK1/2 in the MAPK pathway (Figure S2C). All other mTOR catalytic inhibitors tested in Tsc2−/− MEFs also resulted in increased SIRT4 protein levels (Figure S2D). To evaluate a potential regulation of SIRT4 by mTORC2, we performed RNA interference (RNAi) experiments of either raptor or the mTORC2 component, rictor, in Tsc2−/− MEFs. The knockdown of raptor, but not rictor, was sufficient to increase SIRT4 protein levels, confirming the role of the mTORC1 pathway in the regulation of SIRT4 (Figure 2E). To investigate whether mTORC1 regulation of SIRT4 occurs in tumor samples, a TSC-xenograft model was used. We injected a TSC2−/− rat leiomyoma cell line; ELT3 cells, expressing either an empty vector (V3) or TSC2 (T3), in the flank of nude mice. SIRT4 levels were dramatically increased in TSC2-expressing tumors compared to empty vector samples (Figure S2E). In addition, we assessed the levels of SIRT4 in both ELT3 xenograft tumors and in mouse Tsc2+/− liver tumors after rapamycin treatment. As expected, these tumor samples exhibited robust elevation of SIRT4 after rapamycin treatment (Figures 2F & S2F). Thus, these data demonstrate that the mTORC1 pathway represses SIRT4 in several tumor systems.

Figure 2  mTORC1 controls glutamate dehydrogenase activity by repressing SIRT4

CREB2 regulates the transcription of SIRT4 in an mTORC1-dependent fashion

We next asked whether the mTORC1-dependent regulation of SIRT4 occurred at the mRNA level. Quantitative RT-PCR results show that rapamycin treatment significantly increased the expression of SIRT4mRNA in Tsc2−/− MEFs (Figure 3A). SIRT4 mRNA levels were dramatically reduced in Tsc2−/− MEFs compared to their WT counterpart (Figure 3B). Similar results were obtained from transcriptional profiling analysis of the SIRT4 gene from a previously published dataset (GSE21755) (Figure 3C) (Duvel et al. 2010). Altogether, our data demonstrate that mTORC1 negatively regulates the transcription of SIRT4. To determine whether CREB2 is involved in the mTORC1-dependent regulation of SIRT4, we performed RNAi experiments. The silencing of CREB2 abolished the rapamycin-induced expression of SIRT4 (Figures 3E & S3A). The knockdown of CREB1 did not affect the upregulation of SIRT4 upon mTORC1 inhibition, thus demonstrating the specificity of CREB2 to induce SIRT4 (Figure S3B), and the knockdown of CREB2 significantly abrogated the rapamycin-induced increase in the activity of the SIRT4 promoter.

Figure 3  SIRT4 is regulated at the mRNA level in an mTORC1-dependent fashion

mTORC1 regulates the stability of CREB2

We next investigated whether the mTORC1 pathway regulates CREB2. Although we did not observe major changes in Creb2 mRNA in normal growth conditions (Figure S4A), mTORC1 inhibition resulted in accumulation of CREB2 protein levels by 2h of rapamycin treatment (Figure 4A). U0126 failed to cause the accumulation of CREB2 (Figure S4B). In contrast, CREB1 protein levels were not affected after 24h rapamycin treatment (Figure S4C). As observed for SIRT4, mTOR catalytic inhibitors, and the specific knockdown of mTOR, resulted in upregulation of CREB2 protein levels (Figures S4D & S4E). CREB2 is upregulated in diverse cell types as a response to a variety of stresses, including hypoxia, DNA damage, and withdrawal of GFs, glucose, and aa (Cherasse et al., 2007Rouschop et al., 2010Yamaguchi et al., 2008;Whitney et al., 2009). Interestingly, mTORC1 is negatively regulated by all of these environmental inputs (Zoncu et al., 2011). Since mTORC1 signaling in Tsc2−/− MEFs is insensitive to serum deprivation, we assessed the role of aa withdrawal and re-stimulation on CREB2 levels. As shown in Fig. 4B, CREB2 accumulated upon aa deprivation, and was decreased following aa re-addition. This phenomenon required the action of the proteasome as MG132 efficiently blocked CREB2 degradation following aa re-addition. Importantly, we found that mTORC1 inhibition abrogated the aa-induced decrease of CREB2 (Figure 4B).

Figure 4  mTORC1 regulates the stability of CREB2

mTORC1 activation promotes the binding of CREB2 to βTrCP and modulates CREB2 ubiquitination

Next, we attempted to identify the E3 ubiquitin ligase that might be responsible for CREB2 turnover. Consistent with a recent study, we found CREB2 to bind the E3 ligase, βTrCP (Frank et al., 2010). However, other related E3 ligases including Fbxw2, Fbxw7a, and Fbxw9 did not bind to CREB2 (data not shown). The interaction of CREB2 with Flag-βTrCP1 was enhanced in the presence of insulin, and was abolished by rapamycin pretreatment (Figure 4D). Importantly, insulin treatment promoted the ubiquitination of CREB2 in an mTORC1-dependent fashion (Figure 4E). Altogether, our results support the notion that the mTORC1 pathway regulates the targeting of CREB2 for proteasome-mediated degradation. βTrCP binds substrates via phosphorylated residues in conserved degradation motifs (degrons), typically including the consensus sequence DpSGX(n)pS or similar variants. We found an evolutionary conserved putative βTrCP binding site (DSGXXXS) in CREB2 (Figure 4F). Interestingly, we noted a downward mobility shift in CREB2 protein with mTORC1 inhibition, consistent with a possible decrease in the phosphorylation of CREB2. (Figure 4A). Frank et al. (2010) showed that phosphorylation of the first serine in the degron motif corresponding to Ser218 is required for the CREB2/βTrCP interaction, and this modification acts as a priming site for a gradient of phosphorylation events on five proline-directed residues codons (T212, S223, S230, S234, and S247) that is required for CREB2 degradation during the cell cycle progression (Frank et al., 2010). Consistent with these observations, we found that the mutation of the five residues to alanine (5A mutant) resulted in strong stabilization of CREB2, comparable to the serine-to-alanine mutation on the priming Ser218 phosphorylation site (Figure S4G).

SIRT4 represses bioenergetics and cell proliferation

We observed that glutamine utilization is repressed by rapamycin treatment (Figure 1) and SIRT4 is induced by mTORC1 inhibition (Figure 2). Thus, we tested whether SIRT4 itself directly regulates cellular glutamine uptake. The stable expression of SIRT4 resulted in the repression of glutamine uptake in Tsc2−/− MEFs and DLD1 cells (Figures 5A & 5B). Glucose uptake was not affected by SIRT4 expression (data not shown). Because glutamine can be an important nutrient for energy production, we examined ATP levels in SIRT4 expressing cells. Consistent with reduced glutamine consumption, the expression of SIRT4 in Tsc2−/− cells resulted in decreased ATP/ADP ratio compared to control cells (Figure 5C). Cells produce ATP via glycolysis and oxidative phosphorylation (OXPHOS). To test the contribution of mitochondrial metabolism versus glycolysis to ATP, we measured the ATP/ADP ratio after the treatment with oligomycin, an inhibitor of ATP synthesis from OXPHOS. Importantly, the difference of the ATP/ADP ratio between control and SIRT4 expressing cells was abrogated by oligomycin (Figure 5C), further demonstrating that SIRT4 may repress the ability of cells to generate energy from mitochondrial glutamine catabolism. Mitochondrial glutamine catabolism is essential for energy production and viability in the absence of glucose (Yang et al., 2009Choo et al., 2010). Thus, we examined the effect of SIRT4 on the survival of Tsc2−/− MEFs during glucose deprivation. Control cells remained viable following 48h of glucose deprivation. Conversely, SIRT4 expressing cells showed a dramatic increase in cell death under glucose-free conditions, which was rescued by the addition of the cell permeable dimethyl-I̧KG (DM-I̧KG) (Figure 5D). Conversely, the expression of SIRT4 did not affect the viability of glucose-deprived Tsc2 WT MEFs (Figure S5A). Glucose deprivation also induced death of the human DU145 cancer cell line stably expressing SIRT4 (data not shown).

Figure 5  SIRT4 represses bioenergetics and proliferation

Glutamine is an essential metabolite for proliferating cells, and many cancer cells exhibit a high rate of glutamine consumption (DeBerardinis et al., 2007). Thus, decreased glutamine uptake in DLD1 and DU145 cancer cells expressing SIRT4 might result in decreased proliferation. Indeed, these cells grew significantly slower than did control cells. Remarkably, DM-I̧KG completely abrogated the decreased proliferation of SIRT4 expressing cells (Figure 5E & 5F), suggesting that repressed glutamine metabolism drove the reduced proliferation of cells expressing SIRT4. The expression of SIRT4 also slowed the proliferation of Tsc2−/− MEFs but did not affect Tsc2 WT MEFs (Figures S5B & S5C). Finally, to rule out that the effect on proliferation was due to aberrant localization and to off-target effects of the overexpressed protein, we examined the localization of HA-SIRT4. We found that SIRT4 is co-localized with the MitoTracker, a mitochondrial-selective marker (Figure S5D). Taken together, these data demonstrate that SIRT4 is a critical negative regulator of mitochondrial glutamine metabolism and cell proliferation.

SIRT4 represses TSC-tumor development

Recent studies have demonstrated a major role of glutamine metabolism in driving oncogenic transformation of many cell lines (Gao et al., 2009Wang et al., 2011). Since SIRT4 expression represses glutamine uptake and cell proliferation (Figure 5), we hypothesized that it could affect tumorigenesis. To test this idea, we assessed the role of SIRT4 in cell transformation by using an anchorage-independent growth assay. SIRT4 expression reduced the ability of Tsc2−/−p53−/− MEFs to grow in soft agar. However, the expression of SIRT4 in Tsc2+/+p53−/− did not impair their colony formation properties (Figure 6A). Tumor incidence in mice injected with Tsc2+/+p53−/− MEFs was not affected by SIRT4 (data not shown). Conversely, in the Tsc2−/−p53−/− cohort, SIRT4 reduced tumor incidence by 20 days at median (Figure 6B). SIRT4 expression inTsc2−/−p53−/− MEFs resulted in reduction of Ki-67 positivity by 60% (Figure 6E), consistent with the finding that SIRT4 inhibits the proliferation of these cells in vitro (Figure S5B). Finally, we performed a comprehensive meta-analysis of SIRT4 expression in human tumors and found significantly lower expression levels of SIRT4, relative to normal tissue, in bladder, breast, colon, gastric, ovarian and thyroid carcinomas (Figure 6F). Interestingly, loss of SIRT4 expression showed a strong association with shorter time to metastasis in patients with breast cancer (Figures 6G & 6H). Altogether, these data strongly suggest that SIRT4 delays tumorigenesis regulated by the mTORC1 pathway.

Figure 6
SIRT4 suppresses TSC-tumor development

The pharmacologic inhibition of glutamine anaplerosis synergizes with glycolytic inhibition to induce the specific death of mTORC1 hyperactive cells

The activation of mTORC1 leads to glucose and glutamine addiction as a result of increased uptake and metabolism of these nutrients (Choo et al., 2010Duvel et al., 2010 & Figure 1). These observations suggest that targeting this addiction offers an interesting therapeutic approach for mTORC1-driven tumors. The alkylating agent, mechlorethamine (Mechlo), incites cell toxicity in part by the inhibition of the GAPDH step of glycolysis via poly-ADP ribose polymerase (PARP)-dependent cellular consumption of cytoplasmic NAD+. The ultimate consequence is glycolytic inhibition, thus mimicking glucose deprivation (Zong et al., 2004). Treatment of Tsc2−/− MEFs with Mechlo decreased both NAD levels and lactate production (Figure 7A and data not shown). The decrease in NAD+ levels was rescued by addition of DPQ (Figure 7A), a PARP inhibitor (Zong et al., 2004). We next tested the ability of glutamine inhibition to determine the sensitivity of Tsc2−/− MEFs to Mechlo. As shown in Figure 7B, the treatment with EGCG, a GDH inhibitor (Figure 1G), potently synergized with Mechlo to kill Tsc2−/− MEFs with the greatest effect observed at 30μM (Figure 7B). As a result, this combination dramatically increased the cleavage of PARP, an apoptotic marker (Figure 7E). Similarly, glutamine deprivation sensitized Tsc2−/− MEFs to Mechlo (data not shown). The RNAi-mediated knockdown of GDH also synergized with Mechlo to induce death of Tsc2−/− MEFs (Figure 7D). Importantly, at these concentrations the combination did not induce death of a Tsc2-rescued cell line (Figure 7C).

Figure 7 The combination of glutamine metabolism inhibitors with glycolytic inhibition is an effective therapy to kill Tsc2−/− and PTEN−/− cells

http://www.ncbi.nlm.nih.gov/pmc/articles/PMC3684628/bin/nihms-474527-f0007.gif

Because the metabolic properties of cells with activated mTORC1 by Tsc2– deficiency can be efficiently targeted, we also examined other cell types in which mTORC1 is hyperactive by the loss of PTEN. We found that the combination of Mechlo and EGCG was also effective to induce specific toxicity of PTEN−/− MEFs, while PTEN+/+ MEFs were not affected (Figures S7A & S7B). In addition, the PTEN-deficient human prostate adenocarcinoma cell line, LNCaP, was also sensitive to treatment with Mechlo and EGCG (Figure 7F). This effect was specifically due to lack of TCA cycle replenishment as pyruvate supplementation completely reversed the synergistic effect (Figure 7F). The combination of Mechlo with the GLS1 inhibitor, BPTES (Figure 1G), also resulted in decreased viability of Tsc2−/− cells but not of Tsc2-reexpressing cells (Figures S7C & S7D). Again, death in Tsc2−/− cells was rescued with pyruvate or OAA (Figure S7E). To further investigate if the potent cell death in Tsc2−/− was restricted to Mechlo, we used 2-DG, a glycolytic inhibitor. The combination of 2-DG with either EGCG or BPTES resulted in enhanced cell death of Tsc2−/− MEFs compared to single agent treatments (Figure S7F). This effect was also specific to Tsc2−/− cells, since this combination was less toxic in Tsc2-reexpressing MEFs (Figure S7G). Taken together, our results demonstrate that the combination treatments aimed at inhibiting glycolysis and glutaminolysis potently synergize to kill cells with hyperactive mTORC1 signaling.

Here, we define a novel mTORC1-regulated pathway that controls glutamine-dependent anaplerosis and energy metabolism (Figure 7G). We discovered that the mTORC1 pathway regulates glutamine metabolism by promoting the activity of GDH (Figures 1​-3).3). We show that this regulation occurs by repressing the expression of SIRT4, an inhibitor of GDH (Figures 2 & 3). Molecularly, this is the result of mTORC1-dependent proteasome-mediated degradation of the SIRT4 transcriptional regulator, CREB2 (Figure 4). Interestingly, the modulation of CREB2 levels correlates with increased sensitivity to glutamine deprivation (Ye et al., 2010Qing et al., 2012), fitting with our model of glutamine addiction as a result of mTORC1 activation (Choo et al., 2010). Our data suggest that mTORC1 promotes the binding of the E3 ligase, βTrCP, to CREB2 (Figure 4D), promoting CREB2 degradation by the proteasome (Figure 4E). A previous study has demonstrated that five residues in CREB2 located next to the βTrCP degron are required for its stability (Frank et al., 2010). Accordingly, the mutation of these residues to alanine resulted in stabilization of CREB2 and SIRT4 following insulin and aa-dependent mTORC1 activation (Figure 4G). Future work is aimed at determining if mTORC1 and/or downstream kinases are directly responsible for the multisite phosphorylation of CREB2.

The identification of CREB2 as an mTORC1-regulated transcription factor increases the repertoire of transcriptional regulators modulated by this pathway including HIF1α (glycolysis), Myc (glycolysis) and SREBP1 (lipid biosynthesis) (Duvel et al., 2010Yecies and Manning, 2011). The oncogene Myc has also been linked to the regulation of glutamine metabolism by increasing the expression of the surface transporters ASCT2 and SN2, and the enzyme GLS. Thus, enhanced activity of Myc correlates with increased glutamine uptake and glutamate production (Wise et al., 2008Gao et al., 2009). Our findings describe a new level of control to this metabolic node as shown by the modulation of the glutamate-to-αKG flux (Figure 2). This regulation is particularly relevant as some cancer cells produce more than 50% of their ATP by oxidizing glutamine-derived αKG in the mitochondria (Reitzer et al JBC, 1979). Therefore, these studies support the notion that Myc and CREB2/SIRT4 cooperate to regulate the metabolism of glutamine to αKG.

7.8.4  Rab1A and small GTPases Activate mTORC1

7.8.4.1 Rab1A Is an mTORC1 Activator and a Colorectal Oncogene

Thomas JD1Zhang YJ2Wei YH3Cho JH3Morris LE3Wang HY4Zheng XF5.
Cancer Cell. 2014 Nov 10; 26(5):754-69.
http://dx.doi.org:/10.1016/j.ccell.2014.09.008.

Highlights

  • Rab1A mediates amino acid signaling to activate mTORC1 independently of Rag
  • Rab1A regulates mTORC1-Rheb interaction on the Golgi apparatus
  • Rab1A is an oncogene that is frequently overexpressed in human cancer
  • Hyperactive amino acid signaling is a common driver for cancer

Amino acid (AA) is a potent mitogen that controls growth and metabolism. Here we describe the identification of Rab1 as a conserved regulator of AA signaling to mTORC1. AA stimulates Rab1A GTP binding and interaction with mTORC1 and Rheb-mTORC1 interaction in the Golgi. Rab1A overexpression promotes mTORC1 signaling and oncogenic growth in an AA- and mTORC1-dependent manner. Conversely, Rab1A knockdown selectively attenuates oncogenic growth of Rab1-overexpressing cancer cells. Moreover, Rab1A is overexpressed in colorectal cancer (CRC), which is correlated with elevated mTORC1 signaling, tumor invasion, progression, and poor prognosis. Our results demonstrate that Rab1 is an mTORC1 activator and an oncogene and that hyperactive AA signaling through Rab1A overexpression drives oncogenesis and renders cancer cells prone to mTORC1-targeted therapy.

7.8.4.2 Regulation of TOR by small GTPases

Raúl V Durán1 and Michael N Halla,1
EMBO Rep. 2012 Feb; 13(2): 121–128.
http://dx.doi.org/10.1038%2Fembor.2011.257

TOR is a conserved serine/threonine kinase that responds to nutrients, growth factors, the bioenergetic status of the cell and cellular stress to control growth, metabolism and ageing. A diverse group of small GTPases including Rheb, Rag, Rac1, RalA and Ryh1 play a variety of roles in the regulation of TOR. For example, while Rheb binds to and activates TOR directly, Rag and Rac1 regulate its localization and RalA activates it indirectly through the production of phosphatidic acid. Here, we review recent findings on the regulation of TOR by small GTPases.

The growth-controlling TOR signalling pathway is structurally and functionally conserved from unicellular eukaryotes to humans. TOR, an atypical serine/threonine kinase, was originally discovered inSaccharomyces cerevisiae as the target of rapamycin (Heitman et al, 1991). It was later described in many other organisms including the protozoan Trypanosoma brucei, the yeast Schizosaccharomyces pombe, photosynthetic organisms such as Arabidopsis thaliana and Chlamydomonas reinhardtii, and in metazoans such as Caenorhabditis elegansDrosophila melanogaster and mammals. TOR integrates various stimuli to control growth, metabolism and ageing (Avruch et al, 2009Kim & Guan, 2011Soulard et al, 2009;Wullschleger et al, 2006Zoncu et al, 2011a). In mammals, mTOR is activated by nutrients, growth factors and cellular energy, and is inhibited by stress. Thus, the molecular regulation of TOR is complex and diverse. Among the increasing number of TOR regulators, small GTPases are currently garnering much attention. Small GTPases (20–25 kDa) are either in an inactive GDP-bound form or an active GTP-bound form (Bos et al, 2007). GDP–GTP exchange is regulated by GEFs, which mediate the replacement of GDP by GTP, and by GAPs, which stimulate the intrinsic GTPase activity of a cognate GTPase to convert GTP into GDP (Fig 1). Upon activation, small GTPases interact with effector proteins, thereby stimulating downstream signalling pathways. Small GTPases constitute a superfamily that comprises several subfamilies, such as the Rho, Ras, Rab, Ran and Arf families. Rheb, Rag, RalA, Rac1 and Ryh1, all members of the small GTPase superfamily, play a role in the concerted regulation of TOR by different stimuli. This review summarizes recent advances in the understanding of TOR regulation by these small GTPases.

Regulation of small GTPases by GEFs and GAPs

Regulation of small GTPases by GEFs and GAPs

http://www.ncbi.nlm.nih.gov/pmc/articles/PMC3271343/bin/embor2011257f1.gif

Figure 1 Regulation of small GTPases by GEFs and GAPs. A guanine nucleotide exchange factor (GEF) replaces GDP with GTP to activate the signalling function of the GTPase. Conversely, a GTPase-activating protein (GAP) stimulates hydrolysis of GTP into GDP

The TOR complexes

TOR is found in two functionally and structurally distinct multiprotein complexes, named TORC1 and TORC2 (Avruch et al, 2009Kim & Guan, 2011Soulard et al, 2009Wullschleger et al, 2006Zoncu et al, 2011a). TORC1 regulates several cellular processes including protein synthesis, ribosome biogenesis, nutrient uptake and autophagy. TORC2, in turn, regulates actin cytoskeleton organization, cell survival, lipid synthesis and probably other processes. TORC1 and TORC2 are rapamycin-sensitive and rapamycin-insensitive, respectively, although in some organisms, for example A. thaliana and T. brucei, this rule does not apply (Barquilla et al, 2008Mahfouz et al, 2006). Nevertheless, long-term treatment with rapamycin can also indirectly inhibit TORC2 in mammalian cell lines (Sarbassov et al, 2006). Furthermore, there is accumulating evidence that not all TORC1 readouts are rapamycin-sensitive (Choo & Blenis, 2009Dowling et al, 2010Peterson et al, 2011).

Upstream of TOR

Four main inputs regulate mTORC1: nutrients, growth factors, the bioenergetic status of the cell and oxygen availability. It is well established that growth factors activate mTORC1 through the PI3K–AKT pathway. Once activated, AKT phosphorylates and inhibits the heterodimeric complex TSC1–TSC2, a GAP for Rheb and thus an inhibitor of mTORC1 (Avruch et al, 2009). The TSC1–TSC2 heterodimer is a ‘reception centre’ for various stimuli that are then transduced to mTORC1, including growth factor signals transduced through the AKT and ERK pathways, hypoxia through HIF1 and REDD1, and energy status through AMPK (Wullschleger et al, 2006). In addition to the small GTPases Rheb and Rag (see below), PA also binds to and activates mTORC1 (Fang et al, 2001). Pharmacological or genetic inhibition of PA production, through the inhibition of PLD, impairs activation of mTORC1 by nutrients and growth factors (Fang et al, 2001). Moreover, elevated PLD activity leads to rapamycin resistance in human breast cancer cells (Chen et al, 2003), further supporting a role for PA as an mTORC1 regulator. As discussed below, the small GTPase RalA participates in the mechanism by which PA activates mTORC1 (Maehama et al, 2008Xu et al, 2011).

In the case of nutrients, amino acids in particular, several elements mediate the activation of TORC1. As discussed below, the Rag GTPases are necessary to activate TORC1 in response to amino acids (Binda et al, 2009Kim et al, 2008Sancak et al, 2008). In mammals, it has also been proposed that amino acids stimulate an increase in intracellular calcium concentration, which in turn activates mTORC1 through the class III PI3K Vps34 (Gulati et al, 2008).

Downstream of TOR

TORC1 regulates growth-related processes such as transcription, ribosome biogenesis, protein synthesis, nutrient transport and autophagy (Wullschleger et al, 2006). In mammals, the best-characterized substrates of mTORC1 are S6K and 4E-BP1, through which mTORC1 stimulates protein synthesis. mTORC1 activates S6K, which is a positive regulator of protein synthesis, and inhibits 4E-BP1, which is a negative regulator of protein synthesis. Upon phosphorylation by mTORC1, 4E-BP1 releases eIF4E. Once released from 4E-BP1, eIF4E interacts with the eIF4G subunit of the eIF4F complex, allowing initiation of translation. In mammals, 4E-BP1 participates mainly in the regulation of cell proliferation and metabolism (Dowling et al, 2010). In S. cerevisiae, the main substrate of TORC1 is the S6K orthologue Sch9 (Urban et al, 2007). Sch9 is required for the activation of ribosome biogenesis and translation initiation stimulated by TORC1. Furthermore, it participates in TORC1-dependent inhibition of G0 phase entry.

Regulation of TOR by Rheb

The small GTPase Rheb was first identified in 1994 in a screen for genes induced in neurons in response to synaptic activity (Yamagata et al, 1994), and was first described to interact with the Raf1 kinase (Yee & Worley, 1997). A later report showed that loss of Rhb1, the Rheb orthologue in S. pombe, causes a starvation-like growth arrest (Mach et al, 2000). In 2003, several independent groups working with mammalian cells in vitro and Drosophila in vivo demonstrated that Rheb is the target of the TSC1–TSC2 GAP and a TORC1 activator (Avruch et al, 2009).

Interestingly, the Rheb–mTOR interaction both in vivo and in vitro does not depend on GTP loading of Rheb. This is unusual for GTPases as GTP loading usually regulates effector binding. However, GTP loading of Rheb is crucial for the activation of mTOR kinase activity (Sancak et al, 2007). Conversely, mTOR becomes inactive after association with a nucleotide-deficient Rheb (Long et al, 2005a; Fig 2). Similar results were obtained in S. pombe, making use of mutations that hyperactivate Rheb by increasing its overall GTP : GDP binding ratio (Urano et al, 2005). In contrast to the situation in mammals, interaction of Rheb with SpTOR2 in fission yeast is detected only with a hyperactive Rheb mutant. This suggests that, in S. pombe, Rheb binds to SpTOR2 in a GTP-dependent manner.

Rheb activates TORC1

Rheb activates TORC1

http://www.ncbi.nlm.nih.gov/pmc/articles/PMC3271343/bin/embor2011257f2.gif

Figure 2 Rheb activates TORC1 both directly and indirectly. GTP-bound Rheb interacts directly with TORC1 to activate TORC1 kinase. GTP-bound Rheb also activates RalA, which activates PLD to increase production of PA. PA in turn interacts with TORC1

In addition to the direct interaction between mTOR and Rheb, activation of PA production by Rheb is an additional mechanism by which Rheb might regulate mTORC1. Rheb binds to and activates PLD in a GTP-dependent manner (Sun et al, 2008). PLD produces PA, which binds directly to and upregulates mTORC1. This finding reveals cross-talk between the TSC–Rheb and the PA pathways in the regulation of mTORC1 signalling. A recent study by Yoon and colleagues further demonstrated the role of PLD in mTORC1 regulation (Yoon et al, 2011). They showed that amino acids activate PLD through translocation of PLD to the lysosomal compartment. This translocation is positively regulated by human Vps34 and is necessary for the activation of mTORC1 by amino acids. These authors propose the existence of a Vps34–PLD1 pathway that activates mTORC1 in parallel to the Rag pathway (Yoon et al, 2011).

Although Rheb is required for the activation of mTORC1 by amino acids, Rheb itself does not participate in amino acid sensing, and GTP-loading of Rheb is not affected by amino acid depletion (Long et al, 2005b). Furthermore, amino acid depletion inhibits mTORC1 even in TSC2−/− fibroblasts (Roccio et al, 2006). Nevertheless, interaction of mTORC1 with Rheb depends on amino acid availability (Long et al, 2005b). As discussed below, the current model proposes that amino acids mediate translocation of mTORC1 to the lysosomal surface where mTORC1 interacts with and is activated by GTP-loaded Rheb (Sancak et al, 2008).

Regulation of TOR by Rag

Rag GTPases have unique features among the Ras GTPase subfamily members: they form heterodimers and lack a membrane-targeting sequence (Nakashima et al, 1999Sekiguchi et al, 2001). Gtr1 in S. cerevisiaewas the first member of this GTPase subfamily to be identified (Bun-Ya et al, 1992). The mammalian RagA and RagB GTPases were later described as Gtr1 orthologues (Hirose et al, 1998). Gtr2 in yeast (Nakashima et al, 1999) and its mammalian orthologues RagC and RagD (Sekiguchi et al, 2001) were subsequently discovered due to their ability to form heterodimers with Gtr1 in yeast and RagA and RagB in mammals, respectively. The crystal structure of the Gtr1–Gtr2 complex has been determined recently (Gong et al, 2011). Gtr1 and Gtr2 have similar structures, organized in two domains: an amino-terminal GTPase domain (designated as the G domain) and a carboxy-terminal domain. The Gtr1–Gtr2 heterodimer presents a pseudo-twofold symmetry resembling a horseshoe. The crystal structure reveals that Gtr1–Gtr2 dimerization results from extensive contacts between the C-terminal domains of both proteins, while the G domains do not contact each other (Gong et al, 2011).

Rag proteins mediate the activation of TORC1 in response to amino acids.

Rag proteins mediate the activation of TORC1 in response to amino acids.

http://www.ncbi.nlm.nih.gov/pmc/articles/PMC3271343/bin/embor2011257f3.gif

Figure 3 Rag proteins mediate the activation of TORC1 in response to amino acids. The RagA/B–RagC/D heterodimer is anchored to the MP1–p14–p18 complex on the surface of the lysosome.

Overexpressed Rheb is mislocalized throughout the cell, and therefore interaction of mTORC1 with Rheb does not require amino-acid-induced translocation of mTORC1 to the lysosome. The model is further supported by observations in Drosophila showing that expression of a constitutively active mutant of RagA significantly increases the size of individual cells, whereas expression of a dominant negative mutant of RagA reduces cell size (Kim et al, 2008). Moreover, Rag plays a role in TORC1-mediated inhibition of autophagy both in Drosophila (Kim et al, 2008) and in human cells (Narita et al, 2011).

mTOR and small GTPases are therapeutic targets in the treatment of cancer (Berndt et al, 2011Dazert & Hall, 2011). Aberrant activation of GTPases, including Ras, Rho, Rab or Ran GTPases, promotes cell transformation and cancer (Agola et al, 2011Ly et al, 2010Pylayeva-Gupta et al, 2011), in some cases by acting in the mTOR pathway. Targeting GTPases by using farnesyltransferase inhibitors or geranylgeranyltransferase inhibitors affects signal transduction pathways, cell cycle progression, proliferation and cell survival. Both types of inhibitor are currently under investigation for cancer therapy, although only a small subset of patients responds to these inhibitors (Berndt et al, 2011). A better understanding of the relationship between GTPases and mTOR is essential for the design of combined therapies.

From a mechanistic point of view, research on TOR in different systems is continually adding new insight on the role of TOR in cell biology. However, what is lacking is an integration of the various proposed regulators of TOR, in particular small GTPases (see Sidebar A).

Sidebar A | In need of answers

  1. How are amino acids sensed by the cell?
  2. What is the mechanism by which amino acids regulate the GTP-loading of Rag proteins? What are the GEF and GAP for the Rag proteins?
  3. Is there a GEF that regulates the GTP-loading of Rheb?
  4. What is the molecular mechanism by which Rheb activates TORC1?
  5. How is the dual effect of Rac1 being both upstream and downstream from TOR regulated?
  6. How are the diverse GTPases that impinge on TOR integrated?

7.8.5 PI3K.Akt signaling in osteosarcoma

Zhang J1Yu XH2Yan YG1Wang C1Wang WJ3.
Clin Chim Acta. 2015 Apr 15; 444:182-192.
http://dx.doi.org:/10.1016/j.cca.2014.12.041

Highlights

  • Activation of the PI3K/Akt signaling regulates various cellular functions.
  • The PI3K/Akt signaling may play a key role in the progression of osteosarcoma.
  • Targeting the PI3K/Akt signaling has therapeutic potential for osteosarcoma.

Osteosarcoma (OS) is the most common nonhematologic bone malignancy in children and adolescents. Despite the advances of adjuvant chemotherapy and significant improvement of survival, the prognosis remains generally poor. As such, the search for more effective anti-OS agents is urgent. The phosphatidylinositol 3-kinase (PI3K)/Akt pathway is thought to be one of the most important oncogenic pathways in human cancer. An increasing body of evidence has shown that this pathway is frequently hyperactivated in OS and contributes to disease initiation and development, including tumorigenesis, proliferation, invasion, cell cycle progression, inhibition of apoptosis, angiogenesis, metastasis and chemoresistance. Inhibition of this pathway through small molecule compounds represents an attractive potential therapeutic approach for OS. The aim of this review is to summarize the roles of the PI3K/Akt pathway in the development and progression of OS, and to highlight the therapeutic potential of targeting this signaling pathway. Knowledge obtained from the application of these compounds will help in further understanding the pathogenesis of OS and designing subsequent treatment strategies.

PK.Akt signaling

PK.Akt signaling

http://ars.els-cdn.com/content/image/1-s2.0-S0009898115001059-gr1.sml

PI3K/Akt signaling

PI3K.Akt signaling pathway

PI3K.Akt signaling pathway

http://ars.els-cdn.com/content/image/1-s2.0-S0009898115001059-gr2.sml

PI3K/Akt signaling pathway

PK.Akt therapeutic target

PK.Akt therapeutic target

http://ars.els-cdn.com/content/image/1-s2.0-S0009898115001059-gr3.sml

PK/Akt therapeutic target

7.8.6 The mTORC1-S6K1 Pathway Regulates Glutamine Metabolism through the eIF4B-Dependent Control of c-Myc Translation

Csibi A1Lee G1Yoon SO1Tong H2,…, Fendt SM4Roberts TM2Blenis J5.
Curr Biol. 2014 Oct 6; 24(19):2274-80.
http://dx.doi.org:/10.1016/j.cub.2014.08.007

Growth-promoting signaling molecules, including the mammalian target of rapamycin complex 1 (mTORC1), drive the metabolic reprogramming of cancer cells required to support their biosynthetic needs for rapid growth and proliferation. Glutamine is catabolyzed to α-ketoglutarate (αKG), a tricarboxylic acid (TCA) cycle intermediate, through two deamination reactions, the first requiring glutaminase (GLS) to generate glutamate and the second occurring via glutamate dehydrogenase (GDH) or transaminases. Activation of the mTORC1 pathway has been shown previously to promote the anaplerotic entry of glutamine to the TCA cycle via GDH. Moreover, mTORC1 activation also stimulates the uptake of glutamine, but the mechanism is unknown. It is generally thought that rates of glutamine utilization are limited by mitochondrial uptake via GLS, suggesting that, in addition to GDH, mTORC1 could regulate GLS. Here we demonstrate that mTORC1 positively regulates GLS and glutamine flux through this enzyme. We show that mTORC1 controls GLS levels through the S6K1-dependent regulation of c-Myc (Myc). Molecularly, S6K1 enhances Myc translation efficiency by modulating the phosphorylation of eukaryotic initiation factor eIF4B, which is critical to unwind its structured 5′ untranslated region (5’UTR). Finally, our data show that the pharmacological inhibition of GLS is a promising target in pancreatic cancers expressing low levels of PTEN.

Highlights

  • The mTORC1 pathway positively regulates GLS and glutamine flux
  • mTORC1 controls the translation efficiency of Myc mRNA
  • S6K1 regulates Myc translation through eIF4B phosphorylation
  • Inhibition of GLS decreases the growth of pancreatic cancer cells

Figure 1. The mTORC1 Pathway Regulates GLS1 (A–C and E) GLS protein levels in whole cell lysates from Tsc2 WT and Tsc22/2 MEFs treated with rapamycin (Rapa) for 8 hr (A); HEK293T cells stably expressing Rheb WT, the mutant S16H Rheb, or EV and treated with rapamycin for 24 hr (B); Tsc22/2 MEFs treated with rapamycin at the indicated time points (C); and Tsc2 WT and Tsc22/2 MEFs treated with the indicated compounds for 8 hr (E). The concentrations of the compounds were as follows: rapamycin, 20 ng/ml; LY294002 (LY), 20 mM; and BEZ235, 10 mM. (D) Time course of glutamine consumption in Tsc22/2 MEFs incubated with or without 20ng/ml rapamycin for 24 hr. Each time data point is an average of triplicate experiments. (F) Intracellular glutamine levels in Tsc22/2 MEFs treated with rapamycin for 24 hr. (G) Glutamineflux inTsc22/2 MEFs expressing an EV or re-expressingTSC2 treated with theindicated compounds for 24hr.The concentrations of the compounds were as follows: rapamycin 20 ng/ml; LY294002, 20 mM; BEZ235, 10 mM; BPTES, 10 mM; and 6-diazo-5-oxo-l-norleucine, 1mM. The mean is shown. Error bars represent the SEM from at least three biological replicates. Numbers below the immunoblot image represent quantification normalized to the loading control. See also Figure S1.

Figure2. The mTORC1 Pathway Regulates GLS1 via Myc GLS and Myc protein levels in whole cell lysates from BxPC3 cells transfected with a nontargeting control (NTC) siRNA or four independent siRNAs against Myc for 72 hr (A), Tsc2 WT and Tsc22/2 MEFs treated with rapamycin (20 ng/ml) for 8 hr (B), and Tsc22/2 MEFs stably expressing Myc or EV and treated with rapamycin (20 ng/ml) for 24 hr (C).

Figure 3. The mTORC1 Substrate S6K1 Controls GLS through Myc mRNA Translation (A) Normalized luciferase light units of Tsc22/2 MEFs stably expressing a Myc-responsive firefly luciferase construct (Myc-Luc) or vector control (pCignal Lenti-TRE Reporter). Myc transcriptional activity was measured after treatment with rapamycin (20 ng/ml) or PF4708671 (10 mM) for 8 hr. (B) GLS and Myc protein levels in whole cell lysates from HEK293T cells expressing HA-S6K1-CA (F5A-R3A-T389E) or EV treated with rapamycin (20 ng/ml) for 24 hr. HA, hemagglutinin. (CandD) Intracellular glutamine levels of Tsc22/2 MEFs stably expressing S6K-CA(F5A/R5A/T389E, mutating either the three arginines or all residues within the RSPRR motif to alanines shows the same effect; [10]) or empty vector and treated with rapamycin (20 ng/ml) or DMSO for 48 hr (C) or transfected with NTC siRNA or siRNA against both S6K1/2 (D). 24 hr posttransfection, cells transfected with NTC siRNA were treated with PF4708671 (10 mM) or DMSO for 48 hr. (E) Glutamine consumption of Tsc22/2 MEFs transfected with NTC siRNA or siRNA against both S6K1/2. 72 hr posttransfection, media were collected, and levels of glutamine in the media were determined. (F) Normalized luciferase light units of Tsc2WTMEFs transfected with thepDL-N reporter construct containing the 50 UTR of Myc under the control of Renilla luciferase. Firefly luciferase was used as an internal control. 48hr posttransfection, cells were treated with rapamycin (20ng/ml) or PF4708671 (10mM) for 8h. (G) Relative levels of Myc, Gls, and Actin mRNA in each polysomal gradient fraction. mRNA levels were measured by quantitative PCR and normalized to the 5S rRNA level. HEK293T cells were treated with rapamycin (20 ng/ml) for 24 hr, and polysomes were fractionated on sucrose density gradients. The values are averaged from two independent experiments performed in duplicate, and the error bars denote SEM (n = 4). (Hand I) GLS and Myc protein levels in whole cell lysates from Tsc22/2 MEFs transfected with NTC siRNA or two independent siRNAs against eIF4B for 72hr (H) and Tsc22/2 MEFs stably expressing eIF4B WT, mutant S422D, or EV) and treated with rapamycin for 24 hr (I). The mean is shown. Error bars represent the SEM from at least three biological replicates. The asterisk denotes a nonspecific band. The numbers below the immunoblot image represent quantification normalized to the loading control. See also Figures S2 and S3.

Figure 4. Inhibition of GLS Reduces the Growth of Pancreatic Cancer Cells (A) GLS and Myc protein levels in whole cell lysates from BxPC3, MIAPaCa-2, or AsPC-1 cells treated with rapamycin (20 ng/ml) or BEZ235 (1 mM) for 24 hr. (B) Glutamine consumption of BxPC3 or AsPC-1 cells 48 hr after plating. (Cand D) Soft agar assays with BxPC3 or AsPC-1 cells treated with BPTES (10 mM), the combination of BPTES (10 mM) + OAA (2 mM) (C) and BxPC3 or AsPC-1 cells treated with BPTES, and the combination of BPTES (10 mM) + NAC (10 mM) (D). NS, not significant. The mean is shown. Error bars represent the SEM from at least three biological replicates.

7.8.7 Localization of mouse mitochondrial SIRT proteins

Nakamura Y1Ogura MTanaka DInagaki N.
Biochem Biophys Res Commun. 2008 Feb 1; 366(1):174-9
http://www.ncbi.nlm.nih.gov/pubmed/18054327#

Yeast silent information regulator 2 (SIR2) is involved in extension of yeast longevity by calorie restriction, and SIRT3, SIRT4, and SIRT5 are mammalian homologs of SIR2 localized in mitochondria. We have investigated the localization of these three SIRT proteins of mouse. SIRT3, SIRT4, and SIRT5 proteins were localized in different compartments of the mitochondria. When SIRT3 and SIRT5 were co-expressed in the cell, localization of SIRT3 protein changed from mitochondria to nucleus. These results suggest that the SIRT3, SIRT4, and SIRT5 proteins exert distinct functions in mitochondria. In addition, the SIRT3 protein might function in nucleus

Fig. 1. Localization of SIRT3, SIRT4, and SIRT5 in mitochondria. (A) Confocal microscopy. SIRT3-myc (upper panels), SIRT4-myc (middle panels), and SIRT5-FLAG (lower panels) were expressed in COS7 cells and immunostained with anti-myc antibody or anti-FLAG antibody. Mitochondria and nuclei were stained by MitoTracker Red and DAPI, respectively, and fluorescent images were obtained using a confocal microscope. (B) Fractionation of post-nuclear supernatant. SIRT3-myc, SIRT4-myc, and SIRT5-FLAG proteins each was expressed in COS7 cells, and the obtained PNS was fractionated into mitochondria-enriched precipitate (P1), microsome-enriched precipitate (P2), and supernatant (S) fractions. The three fractions were separated by SDS–PAGE and then analyzed by Western blotting using anti-myc antibody for SIRT3-myc and SIRT4-myc or anti-FLAG antibody for SIRT5-FLAG. Hsp60, calnexin, and GAPDH were used as endogenous markers for mitochondria, microsome, and cytosol, respectively. (C) Alkaline treatment of mitochondria. Mitochondria prepared from the COS7 cells expressing each of the SIRT3-myc, SIRT4-myc, and SIRT5-FLAG proteins were treated with Na2CO3. The reaction mixture was centrifuged to separate the precipitate and supernatant fractions, containing membrane-integrated proteins and soluble proteins, respectively. The two fractions were analyzed by Western blotting. Cytochrome c (cytc) and hsp60 were used as endogenous protein markers for mitochondrial soluble protein. (D) Submitochondrial fractionation. The mitochondria from COS7 cells expressing one of three SIRT proteins were treated with either H2O (hypotonic) or TX-100, and then treated with trypsin. The reaction mixtures were analyzed by Western blotting. Cytochrome c and hsp60 were used as endogenous markers for mitochondrial intermembrane space protein and matrix protein, respectively.

Fig. 2. Localization of SIRT3 when co-expressed with SIRT5. (A) Confocal microscopic analysis of COS7 cells expressing two of the three mitochondrial SIRT proteins. SIRT3-myc and SIRT5-FLAG (upper panels), SIRT3-myc and SIRT4-FLAG (middle panels), and SIRT4-myc and SIRT5-FLAG (lower panels) were co-expressed in COS7 cells, and immunostained using antibodies against myc tag and FLAG tag. Nuclei were stained by DAPI. (B) Subcellular fractionation of PNS. PNS of COS7 cells co-expressing SIRT3-myc and SIRT5-FLAG was fractionated into mitochondria-enriched precipitate (P1), microsome-enriched precipitate (P2), and supernatant (S) fractions, and these fractions along with whole cell lysate were analyzed by Western blotting. (C) Subcellular fractionation using digitonin. COS7 cells expressing either SIRT3-myc (left) or SIRT5-FLAG (middle) or both (right) were solubilized by digitonin, and the obtained lysate was centrifuged and fractionated into nuclear-enriched insoluble (INS), and soluble (SOL) fractions. Hsp60 and laminA/C were used as endogenous markers for mitochondria protein and nucleus protein, respectively.

Because the segment containing amino acid residues 66– 88 potentially forms a basic amphiphilic a-helical structure, it could serve as a MTS. To examine the role of this segment, SIRT3 mutant SIRT3mt, in which the four amino acid residues 72–75 were replaced by four alanine residues, was constructed (Fig. 3A). When SIRT3mt alone was expressed in COS7 cells, SIRT3mt protein was not detected in mitochondria but was widely distributed in the cell in confocal microscopic analysis (Fig. 3B, upper panels). In addition, when SIRT3mt and SIRT5 were co-expressed, the distribution of SIRT3mt protein was not changed compared to that expressed alone (Fig. 3B, lower panels). In fractionation of PNS, SIRT3mt protein was fractionated into S fraction both when SIRT3mt was expressed alone and when SIRT3mt and SIRT5 were co-expressed. SIRT5 protein was localized in mitochondria when SIRT3mt and SIRT5 were co-expressed (Fig. 3C). These results indicate that the MTS is necessary not only for targeting SIRT3 to mitochondria in the absence of SIRT5 but also for targeting SIRT3 to nucleus in the presence of SIRT5.

Fig. 3. Effect of disruption of putative mitochondrial targeting signal of SIRT3. (A) Alanine replacement of putative MTS of SIRT3. Four residues of the putative MTS of SIRT3 (amino acid residues 72–75) were replaced with four alanine residues. In the SIRT3mt sequence, amino acid residues identical with wild-type SIRT3 protein are indicated with dots. (B) Confocal microscopy. Immunofluorescent images of COS7 cells expressing SIRT3mt-myc alone (upper panels) or both SIRT3mt-myc and SIRT5-FLAG (lower panels) are shown. Mitochondria and nuclei were stained by MitoTracker Red and DAPI, respectively. (C) Subcellular fractionation of PNS. PNSs of COS7 cells expressing SIRT3mt-myc alone (an upper panel) or co-expressing SIRT3mt-myc and SIRT5-FLAG (middle and lower panels) were centrifuged and fractionated into mitochondria-enriched precipitate (P1), microsome-enriched precipitate (P2), and supernatant (S) fractions. The fractions were analyzed by Western blotting.

Fig. 4. Effect of disruption of putative nuclear localization signal of SIRT3. (A) Comparison of the amino acid sequences of putative NLS of SIRT3, SIRT3nu, and SV40 large T antigen. Three basic amino acid residues of the putative NLS of SIRT3 (amino acid residues 214–216) were replaced with three alanine residues. In the SIRT3nu sequence, amino acid residues identical with wild-type SIRT3 protein are indicated with dots. The classical NLS of SV40 large T antigen also is shown (SV40). (B) Confocal microscopy. Immunofluorescent images of COS7 cells expressing SIRT3nu-myc alone (upper panels) or both SIRT3nu-myc and SIRT5-FLAG (lower panels) are shown. Mitochondria and nuclei were stained by MitoTracker Red and DAPI, respectively. (C) Subcellular fractionation of PNS. PNSs of the COS7 cells expressing SIRT3nu-myc alone (an upper panel) or co-expressing SIRT3numyc and SIRT5-FLAG (middle and lower panels) were fractionated into mitochondria-enriched precipitate (P1), microsome-enriched precipitate (P2), and supernatant (S) fractions. The fractions were analyzed by Western blotting.

The sequence containing amino acid sequence 213-219 of the SIRT3 closely resembles the putative protein classical NLS of the SV40 T antigen (Fig. 4A). To examine whether this sequence functions as a NLS, the mutant SIRT3 protein SIRT3nu, in which the three basic amino acid residues (214–216) in the putative NLS of SIRT3 were replaced by three alanine residues (Fig. 4A), was constructed. When SIRT3nu alone was expressed in COS7 cells, it was localized in mitochondria (Fig. 4B, upper panels). In the cells co-expressing SIRT3nu and SIRT5, a shift of SIRT3nu protein to the nucleus was not observed, and SIRT3nu protein and a part of SIRT5 protein were scattered widely in the cell in confocal microscopic analysis (Fig. 4B, lower panels). In fractionation of PNS, all of the SIRT3nu protein and nearly half of the SIRT5 protein were shifted from P1 fraction to S fraction by co-expression (Figs. 1B and 4C). These results suggest that the segment containing amino acid residues 213–219 of SIRT3 plays an important role in the localization shift of SIRT3 protein to nucleus when co-expressed with SIRT5. Furthermore, SIRT5 may well hamper SIRT3nu localization in mitochondria through interaction with SIRT3nu. However, further study is required to elucidate the mechanism of the localization shift of SIRT3 protein. Interestingly, recent study has reported that human prohibitin 2 (PHB2), known as a repressor of estrogen receptor (ER) activity, is localized in the mitochondrial inner membrane, and translocates to the nucleus in the presence of ER and estradiol [18]. Although the mechanism of regulation of the expression level of SIRT5 remains unknown, SIRT3 might play a role in communication between nucleus and mitochondria in a SIRT5-dependent manner. The function of mitochondrial SIRT proteins is still not well known. In the present study, we determined the exact localization of mouse SIRT3, SIRT4, and SIRT5 proteins in mitochondria. In addition, we demonstrated that SIRT3 can be present in nucleus in the presence of SIRT5. It has been reported that SIRT3 deacetylates proteins that are not localized in mitochondria in vitro such as histone-4 peptide and tubulin [14]. Thus, if SIRT3 is present in nucleus in vivo, SIRT3 protein might well deacetylate nuclear proteins. These results provide useful information for the investigation of the function of these proteins.

References

[1] J.C. Tanny, G.J. Dowd, J. Huang, H. Hilz, D. Moazed, An enzymatic activity in the yeast Sir2 protein that is essential for gene silencing, Cell 99 (1999) 735–745.
[2] S. Imai, C.M. Armstrong, M. Kaeberlein, L. Guarente, Transcriptional silencing and longevity protein Sir2 is an NAD-dependent histone deacetylase, Nature 403 (2000) 795–800.
[3] M. Gotta, S. Strahl-Bolsinger, H. Renauld, T. Laroche, B.K. Kennedy, M. Grunstein, S.M. Gasser, Localization of Sir2p: the nucleolus as a compartment for silent information regulators, EMBO J. 16 (1997) 3243–3255.
[4] I. Muller, M. Zimmermann, D. Becker, M. Flomer, Calendar life span versus budding life span of Saccharomyces cerevisiae, Mech. Aging Dev. 12 (1980) 47–52.
[5] S.J. Lin, M. Kaeberlein, A.A. Andalis, L.A. Sturtz, P.A. Defossez, V.C. Culotta, G.R. Fink, L. Guarente, Calorie restriction extends Saccharomyces cerevisiae lifespan by increasing respiration, Nature 418 (2002) 344–348.
[6] S.J. Lin, P.A. Defossez, L. Guarente, Requirement of NAD and SIR2 for life-span extension by calorie restriction in Saccharomyces cerevisiae, Science 289 (2000) 2126–2128.

7.8.8 SIRT4 Has Tumor-Suppressive Activity and Regulates the Cellular Metabolic Response to DNA Damage by Inhibiting Mitochondrial Glutamine Metabolism

Jeong SM1Xiao CFinley LWLahusen TSouza ALPierce KLi YH, et al.
Cancer Cell. 2013 Apr 15; 23(4):450-63.
http://www.ncbi.nlm.nih.gov/pubmed/23562301#
http://dx.doi.org:/10.1016/j.ccr.2013.02.024

DNA damage elicits a cellular signaling response that initiates cell cycle arrest and DNA repair. Here we find that DNA damage triggers a critical block in glutamine metabolism, which is required for proper DNA damage responses. This block requires the mitochondrial SIRT4, which is induced by numerous genotoxic agents and represses the metabolism of glutamine into TCA cycle. SIRT4 loss leads to both increased glutamine-dependent proliferation and stress-induced genomic instability, resulting in tumorigenic phenotypes. Moreover, SIRT4 knockout mice spontaneously develop lung tumors. Our data uncover SIRT4 as an important component of the DNA damage response pathway that orchestrates a metabolic block in glutamine metabolism, cell cycle arrest and tumor suppression.

DNA damage initiates a tightly coordinated signaling response to maintain genomic integrity by promoting cell cycle arrest and DNA repair. Upon DNA damage, ataxia telangiectasia mutated (ATM) and ataxia telangiectasia and RAD3-related protein (ATR) are activated and induce phosphorylation of Chk1, Chk2 and γ-H2AX to trigger cell cycle arrest and to initiate assembly of DNA damage repair machinery (Abraham, 2001Ciccia and Elledge, 2010Su, 2006). Cell cycle arrest is a critical outcome of the DNA damage response (DDR) and defects in the DDR often lead to increased incorporation of mutations into newly synthesized DNA, the accumulation of chromosomal instability and tumor development (Abbas and Dutta, 2009Deng, 2006Negrini et al., 2010).

The cellular metabolic response to DNA damage is not well elucidated. Recently, it has been shown that DNA damage causes cells to upregulate the pentose phosphate pathway (PPP) to generate nucleotide precursors needed for DNA repair (Cosentino et al., 2011). Intriguingly, a related metabolic switch to increase anabolic glucose metabolism has been observed for tumor cells and is an important component of rapid generation of biomass for cell growth and proliferation (Jones and Thompson, 2009Koppenol et al., 2011). Hence, cells exposed to genotoxic stress face a metabolic challenge; they must be able to upregulate nucleotide biosynthesis to facilitate DNA repair, while at the same time limiting proliferation and inducing cell cycle arrest to limit the accumulation of damaged DNA. The molecular events that regulate this specific metabolic program in response to DNA damage are still unclear.

Sirtuins are a highly conserved family of NAD+-dependent deacetylases, deacylases, and ADP-ribosyltransferases that play various roles in metabolism, stress response and longevity (Finkel et al., 2009;Haigis and Guarente, 2006). In this study, we studied the role of SIRT4, a mitochondria-localized sirtuin, in cellular metabolic response to DNA damage and tumorigenesis.

DNA damage represses glutamine metabolism

To investigate how cells might balance needs for continued nucleotide synthesis, while also preparing for cell cycle arrest, we assessed the metabolic response to DNA damage by monitoring changes in the cellular consumption of two important fuels, glucose and glutamine, after DNA-damage. Strikingly, treatment of primary mouse embryonic fibroblasts (MEFs) with camptothecin (CPT), a topoisomerase 1 inhibitor that causes double-stranded DNA breaks (DSBs), resulted in a pronounced reduction in glutamine consumption (Figure 1A). Glutamine metabolism in mammalian cells is complex and contributes to a number of metabolic pathways. Glutamine is the primary nitrogen donor for protein and nucleotide synthesis, which are essential for cell proliferation (Wise and Thompson, 2010). Additionally, glutamine provides mitochondrial anaplerosis. Glutamine can be metabolized via glutaminase (GLS) to glutamate and NH4+, and further converted to the tricarboxylic acid (TCA) cycle intermediate α-ketoglutarate via glutamate dehydrogenase (GDH) or aminotransferases. This metabolism of glutamine provides an important entry point of carbon to fuel the TCA cycle (Jones and Thompson, 2009), and accounts for the majority of ammonia production in cells (Yang et al., 2009). CPT-induced reduction of glutamine consumption was accompanied by a reduction in ammonia secretion from cells (Figure 1B). Notably, under these conditions, we observed no obvious decrease in glucose uptake and lactate production (Figures 1C and 1D), consistent with previous studies showing that intact glucose utilization through the PPP is important for a normal DNA damage response (Cosentino et al., 2011). Preservation of glucose uptake also suggests that repression of glutamine consumption may be a specific metabolic response to genotoxic stress and not reflective of a non-specific metabolic crisis.

Figure 1 Glutamine metabolism is repressed by genotoxic stress

To examine the metabolic response to other forms of genotoxic stress, we monitored the metabolic response to ultra-violet (UV) exposure in primary MEFs. Similar to CPT treatment, UV exposure reduced glutamine uptake, without significant changes in glucose consumption (Figures 1E and 1F). Similarly two human cell lines, HepG2 and HEK293T, also demonstrated marked reductions in glutamine uptake in response to DNA damaging agents without comparable changes in glucose uptake (Figures 1G and 1HFigures S1A and S1B). Taken together, these results suggest that a variety of primary and tumor cell lines (from mouse or human) respond to genotoxic stress by down-regulating glutamine metabolism.

To examine in more detail the changes in cellular glutamine metabolism after genotoxic stress, we performed a global metabolomic analysis with transformed MEFs before and after DNA damage. As previously reported, we observed that PPP intermediates were increased in response to DNA damage (Figures 1I and 1J). Remarkably, we observed a decrease in measured TCA cycle intermediates after UV exposure (Figures 1I and 1K). Moreover, we found that HepG2 cells showed a similar metabolomic shift in response to DNA damage (Figure S1D). We did not observe a clear, coordinated repression of nucleotides or glutamine-derived amino acids after exposure to DNA damage (Figure S1C).

To determine whether reduction in TCA cycle metabolites was the consequence of reduced glutamine metabolism, we performed a time-course tracer study to monitor the incorporation of [U-13C5]glutamine into TCA cycle intermediates at 0, 2 and 4 hr after UV treatment. We observed that after UV exposure, cells reduced contribution of glutamine to TCA cycle intermediates in a time-dependent manner (Figure 1L). Moreover, the vast majority of the labeled fumarate and malate contained four carbon atoms derived from [U-13 C5]glutamine (Figure S1F, M+3 versus M+4), indicating that most glutamine was used in the non-reductive direction towards succinate, fumarate and malate production. We were able to observe little contribution of glutamine flux into nucleotides or glutathione in control or UV-treated cells at these time points (data not shown), suggesting that the mitochondrial metabolism of glutamine accounts for the majority of glutamine consumption in these cells. Taken together, the metabolic flux analysis demonstrates that DNA damage results in a reduction of mitochondrial glutamine anaplerosis, thus limiting the critical refueling of carbons into the TCA cycle.

To assess the functional relevance of decreased glutamine metabolism after DNA damage, we deprived cells of glucose, thereby shifting cellular dependence to glutamine to maintain viability (Choo et al., 2011Dang, 2010). If DNA damage represses glutamine usage, we reasoned that cells would be more sensitive to glucose deprivation. Indeed, following 72 hr of glucose deprivation, cell death in primary MEFs was significantly elevated at 10 hr after UV exposure (Figure S1E). However, cells cultured with glucose remained viable in these conditions. Thus, these data demonstrate that genotoxic stress limits glutamine entry into the central mitochondrial metabolism of the TCA cycle.

SIRT4 is induced in response to genotoxic stress

Because sirtuins regulate both cellular metabolism and stress responses (Finkel et al., 2009Schwer and Verdin, 2008), we examined whether sirtuins were involved in the metabolic adaptation to DNA damage. We first examined the expression of sirtuins in the response to DNA damage. Specifically, we probed SIRT1, which is involved in stress responses (Haigis and Guarente, 2006), as well as mitochondrial sirtuins (SIRT3–5), which have been shown to regulate amino acid metabolism (Haigis et al., 2006Hallows et al., 2011Nakagawa et al., 2009). Remarkably, SIRT4 mRNA levels were induced by nearly 15-fold at 15 hr after CPT treatment and 5-fold after etoposide (ETS), a topoisomerase 2 inhibitor, in HEK293T cells (Figure 2A). Interestingly, the induction of SIRT4 was significantly higher than the induction of SIRT1 and mitochondrial SIRT3 (~2-fold), sirtuins known to be induced by DNA damage and regulate cellular responses to DNA damage (Sundaresan et al., 2008Vaziri et al., 2001Wang et al., 2006). Moreover, overall mitochondrial mass was increased by only 10% in comparison with control cells (Figure S2A), indicating that the induction of SIRT4 is not an indirect consequence of mitochondrial biogenesis. These data hint that SIRT4 may have an important, previously undetermined role in the DDR.

Figure 2 SIRT4 is induced by DNA damage stimuli

To test the induction of SIRT4 in the general genotoxic stress response, we treated cells with other types of DNA damage, including UV and gamma-irradiation (IR). SIRT4 mRNA levels were also increased by these genotoxic agents (Figures S2B and S2C) and low doses of CPT and UV treatment also induced SIRT4expression (Figures S2D and S2E). We observed similar results with MEFs (Figures 2B and 2DFigure S2F) and HepG2 cells (Figure S2G). DNA damaging agents elevated SIRT4 in p53-inactive HEK293T cells (Figures 2A and 2C) and in p53-null PC3 human prostate cancer cells (Figure S2H), suggesting that SIRT4can be induced in a p53-independent manner.

To examine whether the induction of SIRT4 occurred as a result of cell cycle arrest, we measured SIRT4levels after the treatment of nocodazole, which inhibits microtubule polymerization to block mitosis. While treatment with nocodazole completely inhibited cell proliferation (data not shown), SIRT4 expression was not elevated (Figure S2I). In addition, we analyzed SIRT4 expression in distinct stages of the cell cycle in HepG2 cells synchronized with thymidine block (Figure S2J, Left). SIRT4 mRNA levels were measured at different times after release and were not elevated during G1 or G2/M phases (Figure S2J, Right), suggesting thatSIRT4 is not induced as a general consequence of cell cycle arrest. Next, we re-examined the localization of SIRT4 after DNA damage. SIRT4 localizes to the mitochondria of human and mouse cells under basal, unstressed conditions (Ahuja et al., 2007Haigis et al., 2006). Following CPT treatment, SIRT4 colocalized with MitoTracker, a mitochondrial-selective marker, indicating that SIRT4 retains its mitochondrial localization after exposure to DNA damage (Figure S2K). Taken together, our findings demonstrate that SIRT4 is induced by multiple forms of DNA damage in numerous cell types, perhaps to coordinate the mitochondrial response to genotoxic stress.

SIRT4 represses glutamine anaplerosis

We observed that glutamine anaplerosis is repressed by genotoxic stress (Figure 1) and SIRT4 is induced by DNA damage (Figure 2). Additionally, previous studies reported that SIRT4 represses glutamine anaplerosis (Haigis et al., 2006). We next tested whether SIRT4 directly regulates cellular glutamine metabolism and contribution of glutamine to the TCA cycle. Like DNA damage, SIRT4 overexpression (SIRT4-OE) in HepG2, HeLa or HEK293T cells resulted in the repression of glutamine consumption (Figure 3AFigures S3A–C). Conversely, SIRT4 knockout (KO) MEFs consumed more glutamine than did wild-type (WT) cells (Figure 3B).

Figure 3 SIRT4 represses mitochondrial glutamine metabolism in response to DNA damage

Mitochondrial glutamine catabolism refuels the TCA cycle and is essential for viability in the absence of glucose (Choo et al., 2011Yang et al., 2009). Thus, we examined the effect of SIRT4 on cell survival during glucose deprivation. Overexpression of SIRT4 in HEK293T or HeLa cells increased cell death in glucose-free media compared to control cells (Figure 3CFigure S3D). Importantly, this cell death was completely rescued by the addition of pyruvate or cell permeable dimethyl α-ketoglutarate (DM-KG), demonstrating that SIRT4 overexpression reduced the ability of cells to utilize glutamine for mitochondrial energy production. Moreover, cell death was equally maximized in the absence of glucose and presence of the mitochondrial ATPase inhibitor oligomycin (Figure 3C). These findings are in line with the model that SIRT4 induction with DNA damage limits glutamine metabolism and utilization by the TCA cycle

We next utilized a metabolomic approach to interrogate glutamine usage in the absence of SIRT4. SIRT4 KO MEFs demonstrated elevated levels of TCA cycle intermediates (Figure 3J, WT versus KO), whereas intermediates of glycolysis were comparable with WT cells (data not shown). Nucleotides and other metabolites downstream of glutamine metabolism were not coordinately regulated by SIRT4 loss (Figure S3E and data not shown). Next, we analyzed glutamine flux in WT and SIRT4 KO MEFs in medium containing [U-13C5]glutamine for 2 or 4 hours and measured isotopic enrichment of TCA cycle intermediates. Loss of SIRT4 promoted a higher rate of incorporation of 13C-labeled metabolites derived from [U-13C5]glutamine in all TCA cycle intermediates measured (Figure 3D). These data provide direct evidence that SIRT4 loss drives increased entry of glutamine-derived carbon into the TCA cycle.

Next, we examined the mechanisms involved in this repression of glutamine anaplerosis. GLS is the first required enzyme for mitochondrial glutamine metabolism (Curthoys and Watford, 1995) and its inhibition limits glutamine flux into the TCA cycle (Wang et al., 2010; Le et al., 2012; Yuneva et al., 2012). Treatment with bis-2-(5-phenylacetoamido-1,2,4-thiadiazol-2-yl)ethyl sulfide (BPTES) (Robinson et al., 2007), an inhibitor of GLS1, repressed glutamine uptake and completely rescued the increased glutamine consumption of SIRT4 KO cells (Figure 3E). Moreover, SIRT4 overexpression no longer inhibited glutamine uptake when GLS1 was reduced by using short hairpin RNAs (shRNAs) (Figures 3F and 3G), demonstrating that SIRT4 regulates mitochondrial glutamine metabolism. SIRT4 is a negative regulator of GDH activity (Haigis et al., 2006) and SIRT4 KO MEFs exhibited increased GDH activity in comparison with WT MEFs (Figure S3F). To test whether SIRT4 regulates mitochondrial glutamine metabolism via inhibiting GDH activity, we measured glutamine uptake in WT and SIRT4 KO cells in the presence of EGCG, a GDH inhibitor (Choo et al., 2011Li et al., 2006). The treatment of EGCG partially rescued the increased glutamine uptake of KO cells (Figure S3G), suggesting that GDH contributes to the role of SIRT4 in glutamine metabolism.

SIRT4 represses mitochondrial glutamine metabolism after DNA damage

SIRT4 regulates cell cycle progression and genomic fidelity in response to DNA damage

Figure 4 SIRT4 is involved in cellular DNA damage responses

SIRT4 represses tumor proliferation

Figure 5 SIRT4 has tumor suppressive function

(A and B) Growth curves of WT and SIRT4 KO MEFs (n = 3) cultured in standard media (A) or media supplemented with BPTES (10 μM) (B). Data are means ±SD.

(C and D) Growth curves of Vector and SIRT4-OE HeLa cells (n = 3) cultured in standard media (C) or media supplemented with BPTES (10 μM) (D). Data are means ±SD.

(E) Focus formation assays with transformed WT and SIRT4 KO MEFs (left). Cells were cultured with normal medium or medium without glucose or glutamine for 10 days and stained with crystal violet. The number of colonies was counted (right) (n =3 samples of each condition). n.d., not determined.

(F) Focus formation assays with transformed KO MEFs reconstituted with SIRT4 or a catalytic mutant of SIRT4 (n = 3). Cells were cultured for 8 days and stained with crystal violet.

(G) Contact inhibited cell growth of transformed WT and SIRT4 KO MEFs cultured in the presence of DMSO or BPTES (10 μM) for 14 days (left). The number of colonies was counted (right). Data are means ±SEM. n.s., not significant. *p < 0.05, **p < 0.005. See also Figure S5.

http://www.ncbi.nlm.nih.gov/pmc/articles/PMC3650305/bin/nihms451579f5.jpg

SIRT4 represses tumor formation in vivo

To investigate SIRT4 function in human cancers, we examined changes in SIRT4 expression. SIRT4 mRNA level was reduced in several human cancers, such as small cell lung carcinoma (Garber et al., 2001), gastric cancer (Wang et al., 2012), bladder carcinoma (Blaveri et al., 2005), breast cancer (TCGA) and leukemia (Choi et al., 2007) (Figure 6A). Of note, lower SIRT4 expression associated with shorter time to death in lung tumor patients (Shedden et al., 2008) (Figure 6B). Overall the expression data is consistent with the model that SIRT4 may play a tumor suppressive role in human cancers.

Figure 6 SIRT4 is a mitochondrial tumor suppressor

SIRT4 regulates glutamine metabolism in lung tissue

To test further the biological relevance of this pathway in lung, we examined whether SIRT4 is induced in vivo after exposure to DNA damaging IR treatment. Remarkably, Sirt4 was significantly induced in lung tissue after IR exposure (Figure 7A). We next examined whether IR repressed glutamine metabolism in vivo, as observed in cell culture by examining GDH activity in lung tissue from WT and SIRT4 KO mice with or without IR exposure. GDH activity was elevated in lung tissue extracts from SIRT4 KO mice compared with WT lung tissue (Figure 7B). Importantly, GDH activity was significantly decreased in lung tissue from WT mice after IR exposure, whereas not in lung tissue from KO mice (Figure 7C). Thus, these findings recapitulate our cellular studies and are in line with the model that SIRT4 induction with DNA damage limits mitochondrial glutamine metabolism and utilization.

SIRT4 inhibits mitochondria glutamine metabolism in vivo

SIRT4 inhibits mitochondria glutamine metabolism in vivo

http://www.ncbi.nlm.nih.gov/pmc/articles/PMC3650305/bin/nihms451579f7.gif

Figure 7 SIRT4 inhibits mitochondria glutamine metabolism in vivo

To assess whether the functions of SIRT4 can be reproduced in these lung tumors, cells derived from SIRT4 KO lung tumors were reconstituted with wild type SIRT4 (Figure S7A). As expected, SIRT4 reconstitution reduced glutamine uptake, but not glucose uptake (Figures 7D and 7E) and repressed proliferation (Figure S7B) of lung tumor cells.

Here, we report that SIRT4 has an important role in cellular metabolic response to DNA damage by regulating mitochondrial glutamine metabolism with important implication for the DDR and tumorigenesis. First, we discovered that DNA damage represses cellular glutamine metabolism (Figure 1). Next, we found that SIRT4 is induced by genotoxic stress (Figure 2) and is required for the repression of mitochondrial glutamine metabolism (Figure 3). This metabolic response contributes to the control of cell cycle progression and the maintenance of genomic integrity in response to DNA damage (Figure 4). Loss of SIRT4 increased glutamine-dependent tumor cell proliferation and tumorigenesis (Figure 5). In mice, SIRT4 loss resulted in spontaneous tumor development (Figure 6). We demonstrate that SIRT4 is induced in normal lung tissue in response to DNA damage where it represses GDH activity. Finally, the glutamine metabolism-genomic fidelity axis is recapitulated in lung tumor cells derived from SIRT4 KO mice via SIRT4 reconstitution (Figure 7). Our studies therefore uncover SIRT4 as a important regulator of cellular metabolic response to DNA damage that coordinates repression of glutamine metabolism, genomic stability and tumor suppression.

The DDR is a highly orchestrated and well-studied signaling response that detects and repairs DNA damage. Upon sensing DNA damage, the ATM/ATR protein kinases are activated to phosphorylate target proteins, leading to cell cycle arrest, DNA repair, transcriptional regulation and initiation of apoptosis (Ciccia and Elledge, 2010Su, 2006). Dysregulation of this pathway is frequently observed in many tumors. Emerging evidence has suggested that cell metabolism also plays key roles downstream of the DDR-induced pathways.


7.8.9 Mitochondrial sirtuins and metabolic homeostasis

Pirinen E1Lo Sasso GAuwerx J.
Best Pract Res Clin Endocrinol Metab. 2012 Dec; 26(6):759-70. http://dx.doi.org:/10.1016/j.beem.2012.05.001

The maintenance of metabolic homeostasis requires the well-orchestrated network of several pathways of glucose, lipid and amino acid metabolism. Mitochondria integrate these pathways and serve not only as the prime site of cellular energy harvesting but also as the producer of many key metabolic intermediates. The sirtuins are a family of NAD+-dependent enzymes, which have a crucial role in the cellular adaptation to metabolic stress. The mitochondrial sirtuins SIRT3, SIRT4 and SIRT5 together with the nuclear SIRT1 regulate several aspects of mitochondrial physiology by controlling posttranslational modifications of mitochondrial protein and transcription of mitochondrial genes. Here we discuss current knowledge how mitochondrial sirtuins and SIRT1 govern mitochondrial processes involved in different metabolic pathways.

Mitochondria are organelles composed of a matrix enclosed by a double (inner and outer) membrane (1). Major cellular functions, such as nutrient oxidation, nitrogen metabolism, and especially ATP production, take place in the mitochondria. ATP production occurs in a process referred to as oxidative phosphorylation (OXPHOS), which involves electron transport through a chain of protein complexes (I-IV), located in the inner mitochondrial membrane. These complexes carry electrons from electron donors (e.g. NADH) to electron acceptors (e.g. oxygen), generating a chemiosmotic gradient between the mitochondrial intermembrane space and matrix. The energy stored in this gradient is then used by ATP synthase to produce ATP (1). One well-known side effect of the OXPHOS process is the production of reactive oxygen species (ROS) that can generate oxidative damage in biological macromolecules (1). However, to neutralize the harmful effects of ROS, cells have several antioxidant enzymes, including superoxide dismutase, catalase, and peroxidases (1). The sirtuin silent information regulator 2 (Sir2), the founding member of the sirtuin protein family, was identified in 1984 (2). Sir2 was subsequently characterized as important in yeast replicative aging (3) and shown to posses NAD+-dependent histone deacetylase activity (4), suggesting it could play a role as an energy sensor. A family of conserved Sir2-related proteins was subsequently identified. Given their involvement in basic cellular processes and their potential contribution to the pathogenesis of several diseases (5), the sirtuins became a widely studied protein family.

In mammals the sirtuin family consists of seven proteins (SIRT1-SIRT7), which show different functions, structure, and localization. SIRT1 is mostly localized in the nucleus but, under specific physiological conditions, it shuttles to the cytosol (6). Similar to SIRT1, also SIRT6 (7) and SIRT7 (8) are localized in the nucleus. On the contrary, SIRT2 is mainly present in the cytosol and shuttles into the nucleus during G2/M cell cycle transition (9). Finally, SIRT3, SIRT4, and SIRT5, are mitochondrial proteins (10).

The main enzymatic activity catalyzed by the sirtuins is NAD+-dependent deacetylation, as known for the progenitor Sir2 (4,11). Along with histones also many transcription factors and enzymes were identified as targets for deacetylation by the sirtuins. Remarkably, mammalian sirtuins show additional interesting enzymatic activities. SIRT4 has an important ADP-ribosyltransferase activity (12), while SIRT6 can both deacetylate and ADP-ribosylate proteins (13,14). Moreover, SIRT5 was recently shown to demalonylate and desuccinylate proteins (15,16), in particular the urea cycle enzyme carbamoyl phosphate synthetase 1 (CPS1) (16). The (patho-)physiological context in which the seven mammalian sirtuins exert their functions, as well as their biochemical characteristics, are extensively discussed in the literature (17,18) and will not be addressed in this review; here we will focus on the emerging roles of the mitochondrial sirtuins, and their involvement in metabolism. Moreover, SIRT1 will be discussed as an important enzyme that indirectly affects mitochondrial physiology.

Sirtuins are regulated at different levels. Their subcellular localization, but also transcriptional regulation, post-translational modifications, and substrate availability, all impact on sirtuin activity. Moreover, nutrients and other molecules could affect directly or indirectly sirtuin activity. As sirtuins are NAD+-dependent enzymes, the availability of NAD+ is perhaps one of the most important mechanisms to regulate their activity. Changes in NAD+ levels occur as the result of modification in both its synthesis or consumption (19). Increase in NAD+ amounts during metabolic stress, as prolonged fasting or caloric restriction (CR) (2022), is well documented and tightly connected with sirtuin activation (4,19). Furthermore, the depletion and or inhibition of poly-ADP-ribose polymerase (PARP) 1 (23) or cADP-ribose synthase 38 (24), two NAD+consuming enzymes, increase SIRT1 action.

Analysis of the SIRT1 promoter region identified several transcription factors involved in up- or down-regulation of SIRT1 expression. FOXO1 (25), peroxisome proliferator-activated receptors (PPAR) α/β (26,27), and cAMP response element-binding (28) induce SIRT1 transcription, while PPARγ (29), hypermethylated in cancer 1 (30), PARP2 (31), and carbohydrate response element-binding protein (28) repress SIRT1 transcription. Of note, SIRT1 is also under the negative control of miRNAs, like miR34a (32) and miR199a (33). Furthermore, the SIRT1 protein contains several phosphorylation sites that are targeted by several kinases (34,35), which may tag the SIRT1 protein so that it only exerts activity towards specific targets (36,37). The beneficial effects driven by the SIRT1 activation – discussed below- led the development of small molecules modulators of SIRT1. Of note, resveratrol, a natural plant polyphenol, was shown to increase SIRT1 activity (38), most likely indirectly (22,39,40), inducing lifespan in a range of species ranging from yeast (38) to high-fat diet fed mice (41). The beneficial effect of SIRT1 activation by resveratrol on lifespan, may involve enhanced mitochondrial function and metabolic control documented both in mice (42) and humans (43). Subsequently, several powerful synthetic SIRT1 agonists have been identified (e.g. SRT1720 (44)), which, analogously to resveratrol, improve mitochondrial function and metabolic diseases (45). The precise mechanism of action of these compounds is still under debate; in fact, it may well be that part of their action is mediated by AMP-activated protein kinase (AMPK) activation (21,22,46), as resveratrol was shown to inhibit ATP synthesis by directly inhibiting ATP synthase in the mitochondrial respiratory chain (47), leading to an energy stress with subsequent activation of AMPK. However, at least in β-cells, resveratrol-mediated SIRT1 activation and AMPK activation seem to regulate glucose response in the opposite direction, pointing to the existence of alternative molecular targets (48).

Another hypothesis to explain the pleitropic effects of resveratrol suggests it inhibits cAMP-degrading phosphodiesterase 4 (PDE4), resulting in the cAMP-dependent activation of exchange proteins activated by cyclic AMP (Epac1) (40). The consequent Epac1-mediated increase of intracellular Ca2+ levels may then activate of CamKKβ-AMPK pathway (40), which ultimately will result in an increase in NAD+ levels and SIRT1 activation (21). Interestingly, also PDE4 inhibitors reproduce some of the metabolic benefits of resveratrol representing yet another putative way to activate SIRT1.

The regulation of the activity of the mitochondrial sirtuins is at present poorly understood. SIRT3 expression is induced in white adipose (WAT) and brown adipose tissues upon CR (49), while it is down-regulated in the liver of high-fat fed mice (50). SIRT3 activity changes also in the muscle after fasting (51) and chronic contraction (52). All these processes are associated with increase (20,53) or decrease (50) in NAD+ levels. From a transcriptional point of view, SIRT3 gene expression in brown adipocytes seems under the control of peroxisome proliferator-activated receptor gamma coactivator-1α (PGC-1α) -estrogen-related receptor α (ERRα) axis, and this effect is crucial for full brown adipocyte differentiation (54,55). SIRT4 expression is reported to be reduced during CR (12), while the impact of resveratrol on SIRT4 is still under debate (56). Finally, upon ethanol exposure, SIRT5 gene expression was shown to be decreased together with the NAD+levels (57), probably explaining the protein hyperacetylation caused by alcohol exposure (58).

Metabolic homeostasis

The maintenance of metabolic homeostasis is critical for the survival of all species to sustain body structure and function. Metabolic homeostasis is achieved through complicated interactions between metabolic pathways that govern glucose, lipid and amino acid metabolism. Mitochondria are organelles, which integrate these metabolic pathways by serving a physical site for the production and recycling of metabolic intermediates.

Glucose metabolism

Overview

Glucose homeostasis is regulated through various complex processes including hepatic glucose output, glucose uptake, glucose utilization and storage. The main hormones regulating glucose homeostasis are insulin and glucagon, and the balance between these hormones determines glucose homeostasis. Insulin promotes glucose uptake in peripheral tissues (muscle and WAT), glycolysis and storage of glucose as glycogen in the fed state, while glucagon stimulates hepatic glucose production during fasting. Sirtuins influence many aspects of glucose homeostasis in several tissues such as muscle, WAT, liver and pancreas.

Gluconeogenesis

The body’s ability to synthesise glucose is vital in order to provide an uninterrupted supply of glucose to the brain and survive during starvation. Gluconeogenesis is a cytosolic process, in which glucose is formed from non-carbohydrate sources, such as amino acids, lactate, the glycerol portion of fats and tricarboxylic acid (59) cycle intermediates, during energy demand. This process, which occurs mainly in liver and kidney, shares some enzymes with glycolysis but it employs phosphoenolpyruvate carboxykinase, fructose-1,6-bisphosphatase and glucose-6-phosphatase to control the flow of metabolites towards glucose production. These three enzymes are stimulated by glucagon, epinephrine and glucocorticoids, whereas their activity is suppressed by insulin.

The role of mitochondrial sirtuins in the control of gluconeogenesis is not well established. SIRT3 is suggested to induce fasting-dependent hepatic glucose production from amino acids by deacetylating and activating the mitochondrial conversion of glutamate into the TCA cycle intermediate α-ketoglutarate, via the enzyme glutamate dehydrogenase (GDH) (Fig. 1A) (60,61). As SIRT3−/− mice do not display changes in GDH activity (62), the mechanism requires further clarification. In contrast to SIRT3, SIRT4 inhibits GDH via ADP-ribosylation under basal dietary conditions (Fig. 1A-B) (12). Conversely, SIRT4 activity is suppressed during CR resulting in activation of GDH, which fuels the TCA cycle and possibly also gluconeogenesis (12). Therefore, mitochondrial sirtuins may function to support gluconeogenesis during energy limitation, but further research is required to understand the exact roles of mitochondrial sirtuins in gluconeogenesis.

Summary of mitochondrial sirtuins’ role in mitochondrial pathways

Summary of mitochondrial sirtuins’ role in mitochondrial pathways

Figure 1 Summary of mitochondrial sirtuins’ role in mitochondrial pathways

http://www.ncbi.nlm.nih.gov/pmc/articles/PMC3621019/bin/emss-52490-f0001.gif

Glucose utilization

 Lipid metabolism

Urea metabolism

The recent discoveries in the biology of mitochondria have shed light on the metabolic regulatory roles of the sirtuin family. To maintain proper metabolic homeostasis, sirtuins sense cellular NAD+ levels, which reflect the nutritional status of the cells, and translate this information to adapt the activity of mitochondrial processes via posttranslational modifications and transcriptional regulation. SIRT1 and SIRT3 function to stimulate proper energy production via FAO and SIRT3 also protects from oxidative stress and ammonia accumulation during nutrient deprivation. SIRT4 seems to play role in the regulation of gluconeogenesis, insulin secretion and fatty acid utilization during times of energy limitation, while SIRT5 detoxifies excess ammonia that can accumulate during fasting. However, we are only at the beginning of our understanding of the roles of the mitochondrial sirtuins, SIRT3, SIRT4 and SIRT5 in complex metabolic processes. In the coming years, further research should identify and verify novel sirtuin targets in vivo and in vitro. We need also to elucidate the regulation and tissue-specific functions of these mitochondrial sirtuins, as well as to understand the potential crosstalk and synchrony between the different sirtuins in different subcellular compartments. Ultimately, the understanding of mitochondrial sirtuin functions may open new possibilities, not only for treatment of cancer and metabolic diseases characterized by mitochondrial dysfunction, but also for disease prevention and health maintenance.

7.8.10 Mitochondrial sirtuins

Huang JY1Hirschey MDShimazu THo LVerdin E.
Biochim Biophys Acta. 2010 Aug; 1804(8):1645-51. http://dx.doi.org:/10.1016/j.bbapap.2009.12.021

Sirtuins have emerged as important proteins in aging, stress resistance and metabolic regulation. Three sirtuins, SIRT3, 4 and 5, are located within the mitochondrial matrix. SIRT3 and SIRT5 are NAD(+)-dependent deacetylases that remove acetyl groups from acetyllysine-modified proteins and yield 2′-O-acetyl-ADP-ribose and nicotinamide. SIRT4 can transfer the ADP-ribose group from NAD(+) onto acceptor proteins. Recent findings reveal that a large fraction of mitochondrial proteins are acetylated and that mitochondrial protein acetylation is modulated by nutritional status. This and the identification of targets for SIRT3, 4 and 5 support the model that mitochondrial sirtuins are metabolic sensors that modulate the activity of metabolic enzymes via protein deacetylation or mono-ADP-ribosylation. Here, we review and discuss recent progress in the study of mitochondrial sirtuins and their targets.

mitochondrial sirtuins

mitochondrial sirtuins

http://www.sciencedirect.com/science/article/pii/S1570963909003902

mitochondrial sirtuins
Fig.1 .NAD+ -dependent deacetylation of sirtuins. The two step catalytic reaction mechanism. In this diagram ADPR = acetyl-ADP-ribose, NAM = nicotinamide, 1-O-AADPR = 1-O-acetyl ADP-ribose and βNAD = beta nicotinamide adenine dinucleotide.

Table 1 Shows subcellular localization, substrates and functions of different types of sirtuins.

Fig.2. Sirt3 regulated pathways in mitochondrial metabolism. Schematic diagram demonstrating the different roles of Sirt3 in the regulation of the main metabolic pathways of mitochondria.In this diagram LCAD = long-chain acyl-CoA dehydrogenase, ACeS2 = acetyl coenzyme synthetase 2, Mn SOD = manganese superoxide dismutase, CypD = cyclophilin D, ICDH2 = isocitrate dehydrogenase 2, OTC = ornithine transcarbomylase,TCA = tricaboxylic acid, ROS = reactive oxygen species, mPTP = membrane permeability transition pore, I–V = respiratory chain complex I–V

Fig. 3.(A) Schematic diagram showing different roles of Sirt4 in the regulation of various metabolic pathways. The diagram shows the Sirt4 regulated decrease in insulin level and the increase in availability of ATP inside mitochondria via upregulation of insulin degrading enzyme (IDE) and adenine translocator (ANT). The diagram also shows the Sirt4 regulated decrease in the efficiency of fatty acid oxidation and tricarboxylic acid cycle (TCA) via inhibition of glutamate dehydrogenase (GDH) and malonyl CoA decarboxylase (MCoAD). (B) Schematic diagram indicating the different roles of Sirt5 in regulation of various metabolic pathways. Sirt5 regulates urea production, fatty acid oxidation, tricarboxylic acid cycle (TCA), glycolysis, reactive oxygen species (ROS) metabolism, purine metabolism via regulating carbamoyl phosphate synthetase (CPS), hydroxyl-coenzyme A dehydrogenase (HADH), pyruvate dehydrogenase (PDH), pyruvate kinase (PK), succinate dehydrogenase(SDH) andurate oxidase (UO) respectively

Conclusion and future perspectives

Sirtuins are highly conserved NAD+-dependent protein deacetylases or ADP ribosyl transferases involved in many cellular processes including genome stability, cell survival, oxidative stress responses, metabolism, and aging. Mitochondrial sirtuins, Sirt3, Sirt4 and Sirt5 are important energy sensors and thus can be regarded as master regulators of mitochondrial metabolism. But it is still not known whether specific sirtuins can only function within particular metabolic pathways or two or more sirtuins could affect the same pathways. One of the mitochondrial sirtuins, Sirt3 is a major mitochondrial deacetylase that plays a pivotal role in the acetylation based regulation of numerous mitochondrial proteins. However, the question how mitochondrial proteins become acetylated is still unsolved and the identity of mitochondrial acetyltransferases is mysterious. Although the predominant function of the sirtuins is NAD+ dependent lysine deacetylation, but along with this major function another less characterized activity of these sirtuins includes ADP ribosylation which is mainly done by Sirt4. Moreover, in the case when the mitochondrial sirtuins exhibit both deacetylase and ADP ribosyl transferase activity, the conditions that determine the relative contribution of both of these activities in same or different metabolic pathways require further investigation. Sirt5 another mitochondrial sirtuin, was a puzzle until the recent finding as it possesses unique demalonylase and desuccinylase activities. However, most of the malonylated or succinylated proteins are important metabolic enzymes but as the significance of lysine malonylation and succinylation is still unknown thus it would be interesting to know how lysine malonylation and succinylation alter the functions of various metabolic enzymes. The mitochondrial sirtuins Sirt3, Sirt4 and Sirt5 serve as critical junctions and are required to exert many of the beneficial effect in mitochondrial metabolism. The emerging multidimensional role of mitochondrial sirtuins in regulation of mitochondrial metabolism and bioenergetics may have far-reaching consequences for many diseases associated with mitochondrial dysfunctions. However it is very important to fully elucidate the functions of mitochondrial sirtuins in different tissues to achieve the goal of therapeutic intervention in different metabolic diseases. Although several proteomic studies have provided detailed information that how mitochondrial sirtuin driven modification takes place on various targets in response to different environmental conditions, still the role of sirtuins in mitochondrial physiology and human diseases requires further exploration. Hopefully the progress in the field of sirtuin biology will soon provide insight into the therapeutic applications for targeting mitochondrial sirtuins by bioactive compounds to treat various human age-related diseases.

References

Ahn B.H.,et al.,2008. A role for the mitochondrial deacetylase Sirt3 in regulating energy homeostasis. Proc. Natl. Acad. Sci. U. S. A. 105 (38), 14447–14452. http://dx.doi.org/10.1073/pnas.0803790105.

Ahuja N.,et al., 2007. Regulation of insulin secretion by SIRT4, a mitochondrial ADP ribosyltransferase. J. Biol. Chem. 282 (46), 33583–33592. http://dx.doi.org/10.1074/jbc.M705488200.

Allison, S.J., Milner, J., 2007. SIRT3 is pro-apoptotic and participates in distinct basal apoptotic pathways. Cell Cycle 6, 2669–2677. http://dx.doi.org/10.4161/cc.6.21.4866.

Ashraf, N., et al., 2006. Altered sirtuin expression is associated with node-positive breast cancer. Br. J. Cancer 95, 1056–1061. http://dx.doi.org/10.1038/sj.bjc.6603384.

Bao, J.,et al.,2010. SIRT3 is regulated by nutrient excess and modulates hepatic susceptibility to lipotoxicity. Free Radic. Biol. Med. 49, 1230–1237.

Beal, M.F., 2005. Less stress, longer life. Nat. Med. 11 (6), 598–599. http://dx.doi.org/10.1038/nm0605-598.

Bell, E.L., Guarente,L., 2011. The SirT3 divining rod points to oxidative stress. Mol.Cell 42 (5), 561–568. http://dx.doi.org/10.1016/j.molcel.2011.05.008
(Review).

Bell,E.L., Emerling,B.M., Ricoult,S.J.H., Guarente,L., 2011. SirT3 suppresses hypoxia inducible factor 1α and tumor growth by inhibiting mitochondrial ROS production. Oncogene 30, 2986–2996. http://dx.doi.org/10.1038/onc.2011.37.

Bellizzi,D.,Rose,G.,Cavalcante,P.,Covello,G.,et al., 2005. A novel VNTR enhancer within the SIRT3 gene, a human homologue of SIR2, is associated with survival at oldest ages. Genomics 85, 258–263.
http://dx.doi.org/10.1016/j.ygeno.2004.11.003.

7.8.11 Sirtuin regulation of mitochondria: energy production, apoptosis, and signaling

Verdin E1Hirschey MDFinley LWHaigis MC.
Trends Biochem Sci. 2010 Dec; 35(12):669-75.
http://dx.doi.org:/10.1016/j.tibs.2010.07.003

Sirtuins are a highly conserved family of proteins whose activity can prolong the lifespan of model organisms such as yeast, worms and flies. Mammals contain seven sirtuins (SIRT1-7) that modulate distinct metabolic and stress response pathways. Three sirtuins, SIRT3, SIRT4 and SIRT5, are located in the mitochondria, dynamic organelles that function as the primary site of oxidative metabolism and play crucial roles in apoptosis and intracellular signaling. Recent findings have shed light on how the mitochondrial sirtuins function in the control of basic mitochondrial biology, including energy production, metabolism, apoptosis and intracellular signaling.

Mitochondria play critical roles in energy production, metabolism, apoptosis, and intracellular signaling [13]. These highly dynamic organelles have the ability to change their function, morphology and number in response to physiological conditions and stressors such as diet, exercise, temperature, and hormones [4]. Proper mitochondrial function is crucial for maintenance of metabolic homeostasis and activation of appropriate stress responses. Not surprisingly, changes in mitochondrial number and activity are implicated in aging and age-related diseases, including diabetes, neurodegenerative diseases, and cancer [1]. Despite the important link between mitochondrial dysfunction and human diseases, in most cases, the molecular causes for dysfunction have not been identified and remain poorly understood.

One of the principal bioenergetic functions of mitochondria is to generate ATP through the process of oxidative phosphorylation (OXPHOS), which occurs in the inner-mitochondrial membrane. Mitochondria are unique bi-membrane organelles that contain their own circular genome (mtDNA) encoding 13 protein subunits involved in electron transport. The remainder of the estimated 1000-1500 mitochondrial proteins are encoded by the nuclear genome and imported into mitochondria from the cytoplasm [56]. These imported proteins can be found either in the matrix, associated with inner or outer mitochondrial membranes or in the inner membrane space (Figure 1). Dozens of nuclear-encoded protein subunits form complexes with the mtDNA-encoded subunits to form electron transport complexes I-IV and ATP synthase, again highlighting the need for precise coordination between these two genomes. The transcriptional coactivator PGC-1α, a master regulator of mitochondrial biogenesis and function, is responsive to a variety of metabolic stresses, ensuring that the number and capacity of mitochondria keeps pace with the energetic demands of tissues [7].

Network of mitochondrial sirtuins

Network of mitochondrial sirtuins

http://www.ncbi.nlm.nih.gov/pmc/articles/instance/2992946/bin/nihms239607f1.gif

Network of mitochondrial sirtuins. Mitochondria can metabolize fuels, such as fatty acids, amino acids, and pyruvate, derived from glucose. Electrons pass through electron transport complexes (I-IV; red) generating a proton gradient, which is used to drive ATP synthase (AS; red) to generate ATP. SIRT3 (gold) binds complexes I and II, regulating cellular energy levels in the cell [4355]. Moreover, SIRT3 binds and deacetylates acetyl-CoA synthetase 2 (AceCS2) [3940] and glutamate dehydrogenase (GDH) [3347], thereby activating their enzymatic activities. SIRT3 also binds and activates long-chain acyl-CoA dehydrogenase (LCAD) [46]. SIRT4 (light purple) binds and represses GDH activity via ADP-ribosylation [21]. In the rate-limiting step of the urea cycle, SIRT5 (light blue) deacetylates and activates carbamoyl phosphate synthetase 1 (CPS1) [4849].

As high-energy electrons derived from glucose, amino acids or fatty acids fuels are passed through a series of protein complexes (I-IV), their energy is used to pump protons from the mitochondrial matrix through the inner membrane into the inner-membrane space, generating a proton gradient known as the mitochondrial membrane potential (Dψm) (Figure 1). Ultimately, the electrons reduce oxygen to form water, and the protons flow down their gradient through ATP synthase, driving the formation of ATP from ADP. Protons can also flow through uncoupling proteins (UCPs), dissipating their potential energy as heat. Reactive oxygen species (ROS) are a normal side-product of the respiration process [18]. In addition, an increase in Dψm, whether caused by impaired OXPHOS or by an overabundance of nutrients relative to ADP, will result in aberrant electron migration in the electron transport chain and elevated ROS production [1]. ROS react with lipids, protein and DNA, generating oxidative damage. Consequently, cells have evolved robust mechanisms to guard against an increase in oxidative stress accompanying ROS production [9].

Mitochondria are the primary site of ROS production within the cell, and increased oxidative stress is proposed to be one of the causes of mammalian aging [1210]. Major mitochondrial age-related changes are observed in multiple tissues and include decreased Dψm, increased ROS production and an increase in oxidative damage to mtDNA, proteins, and lipids [1114]. As a result, mitochondrial bioenergetic changes that occur with aging have been extensively reviewed [1517].

Silent information regulator (SIR) 2 protein and its orthologs in other species, termed sirtuins, promote an increased lifespan in model organisms such as yeast, worms and flies. Mammals contain seven sirtuins (SIRT1–7) that are characterized by an evolutionary conserved sirtuin core domain [1819]. This domain contains the catalytic activity and invariant amino acid residues involved in binding NAD+, a metabolic co-substrate. All sirtuins exhibit two major enzymatic activities in vitro: NAD+-dependent protein deacetylase activity and ADP-ribosyltransferase activity. Except for SIRT4, well-defined acetylated substrates have been identified for the other sirtuins. So far, only ADP-ribosyltransferase activity has been described for SIRT4 [2021]. Thus, these enzymes couple their biochemical and biological functions to an organism’s energetic state via their dependency on NAD+. A decade of research, largely focused on SIRT1, has revealed that mammalian sirtuins regulate metabolism and cellular survival. In brief, SIRT1–7 target distinct acetylated protein substrates and are localized in distinct subcellular compartments. SIRT1, SIRT6 and SIRT7 are found in nucleus, SIRT2 is primarily cytosolic and SIRT3, 4 and 5 are found in the mitochondria. The mitochondrial-only localization of SIRT3 is controversial and other groups have reported non-mitochondrial localization of this sirtuin [2223]. The biology and biochemistry of the seven mammalian sirtuins have been extensively discussed in the literature [2426] and is not the topic of this review. Instead, we focus on the mitochondrial sirtuins, their substrates, and their impact on mitochondrial biology.

The mitochondrial sirtuins, SIRT3–5 [212729], participate in the regulation of ATP production, metabolism, apoptosis and cell signaling. Unlike SIRT1, a 100 kDa protein, the mitochondrial sirtuins are small, ranging from 30–40 kDa. Thus, their amino acid sequence consists mostly of an N-terminal mitochondrial targeting sequence and the sirtuin core domain, with small flanking regions. Whereas, SIRT3 and SIRT5 function as NAD+-dependent deacetylases on well defined substrates, SIRT4 has no identified acetylated substrate and only shows ADP-ribosyltransferase activity. It is likely, however, that SIRT4 possesses substrate-specific NAD+-dependent deacetylase activity, as has been demonstrated for SIRT6 [30,31]. The three-dimensional structures for the core domains of human SIRT3 and human SIRT5 have been solved and reveal remarkable structural conservation with other sirtuins, such as the ancestral yeast protein and human SIRT2 (Figure 2) [3234]. Given its sequence conservation with the other sirtuins [18], it is likely that SIRT4 adopts a similar three-dimensional conformation.

Figure 2 Structure and alignment of sirtuins

Role of mitochondrial sirtuins in metabolism and energy production

The NAD+ dependence of sirtuins provided the first clue that these enzymes function as metabolic sensors. For instance, sirtuin activity can increase when NAD+ levels are abundant, such as times of nutrient deprivation. In line with this model, mass spectrometry studies have revealed that metabolic proteins, such as tricarboxylic acid (TCA) cycle enzymes, fatty acid oxidation enzymes and subunits of oxidative phosphorylation complexes are acetylated in response to metabolic stress [3537].

Fatty acid oxidation

Consistent with the hypothesis that nutrient stress alters sirtuin activity, a recent report identified significant metabolic abnormalities in Sirt3-/- mice during fasting [38]. In this study, hepatic SIRT3 protein expression increased during fasting, suggesting that both its levels and enzymatic activity are elevated during nutrient deprivation. SIRT3 activates hepatic lipid catabolism via deacetylation of long-chain acyl-CoA dehydrogenase (LCAD), a central enzyme in the fatty acid oxidation pathway. Sirt3-/- mice have diminished fatty acid oxidation, develop fatty liver, have low ATP production, and show a defect in thermogenesis and hypoglycemia during a cold test [38].

Surprisingly, many of the phenotypes observed in Sirt3-/- mice were also observed in mice lacking acetyl-CoA synthetase 2 (AceCS2), a previously identified substrate of SIRT3 [3940]. For example, fasting ATP levels were reduced by 50% in skeletal muscle of AceCS2-/- mice, in comparison to wild type (WT) mice. As a result, fasted AceCS2-/- mice were hypothermic and had reduced capacity for exercise. By converting acetate into acetyl CoA, AceCS2 provides an alternate energy source during times of metabolic challenges, such as thermogenesis or fasting. Interestingly, Acadl-deficient mice (Acadl encodes LCAD) also show cold intolerance, reduced ATP, and hypoglycemia under fasting conditions [41]. These overlapping phenotypes between Sirt3-/-AceCS2-/- and Acadl-/- mice indicate that the regulation of LCAD and AceCS2 acetylation by SIRT3 represents an important adaptive signal during the fasting response (Figure 2).

Electron transport chain

Of all mitochondrial proteins, oxidative phosphorylation complexes are among the most heavily acetylated. One study reported that 511 lysine residues in complexes I-IV and ATP synthase are modified by acetylation [37], hinting that a mitochondrial sirtuin might deacetylate these residues. Indeed, SIRT3 interacts with and deacetylates complex I subunits (including NDUFA9) [42], succinate dehydrogenase (complex II) [43]. SIRT3 has also been shown to bind ATP synthase in a proteomic analysis [44]. SIRT3 also regulates mitochondrial translation, a process which can impact electron transport [45]. Mice lacking SIRT3 demonstrate reduced ATP levels in many tissues [42 46]; however, additional work is required to determine if reduced ATP levels in Sirt3-/- mice is a direct result of OX PHOS hyperacetylation or an indirect effect, via decreased fatty acid oxidation, or a combination of both effects.

Less is known about the roles of SIRT4 and SIRT5 in electron transport. SIRT4 binds adenine nucleotide translocator (ANT), which transports ATP into the cytosol and ADP into the mitochondrial matrix, thereby providing a substrate for ATP synthase [20]. SIRT5 physically interacts with cytochrome C. The biological significance of these interactions, however, remains unknown [21].

TCA cycle

Enzymes for the TCA cycle (also called the Kreb’s cycle) are located in the mitochondrial matrix; this compartmentalization provides a way for cells to utilize metabolites from carbohydrates, fats and proteins. Numerous TCA cycle enzymes are modified by acetylation, although the functional consequences of acetylation have been examined for only a few of these proteins. SIRT3 interacts with several TCA cycle enzymes, including succinate dehydrogenase (SDH, see above [43]) and isocitrate dehydrogenase 2 (ICDH2) [33]. ICDH2 catalyzes the irreversible oxidative decarboxylation of isocitrate to form alpha-ketoglutarate and CO2, while converting NAD+ to NADH. Although the biological significance of these interactions is not yet known, it seems possible that SIRT3 might regulate flux through the TCA cycle.

Role of mitochondrial sirtuins in signaling

During cellular stress or damage, mitochondria release a variety of signals to the cytosol and the nucleus to alert the cell of changes in mitochondrial function. In response, the nucleus generates transcriptional changes to activate a stress response or repair the damage. For example, mitochondrial biogenesis requires a sophisticated transcriptional program capable of responding to the energetic demands of the cell by coordinating expression of both nuclear and mitochondrial encoded genes [4]. Unlike anterograde transcriptional control of mitochondria from nuclear transcription regulators such as PGC-1α, the retrograde signaling pathway, from the mitochondria to the nucleus is poorly understood in mammals. Although there is no evidence directly linking sirtuins to a mammalian retrograde signaling pathway, changes in mitochondrial sirtuin activity could influence signals transmitted from the mitochondria. Interestingly, the nuclear sirtuin SIRT1 deacetylates and activates PGC-1α, a key factor in the transcriptional regulation of genes involved in fatty acid oxidation and oxidative phosphorylation (Figure 3) [5051]. Thus, mitochondrial and nuclear sirtuins might exist in a signaling communication loop to control metabolism.

mitochondria-at-nexus-of-cellular-signaling-nihms239607f3

mitochondria-at-nexus-of-cellular-signaling-nihms239607f3

http://www.ncbi.nlm.nih.gov/pmc/articles/instance/2992946/bin/nihms239607f3.gif

Mitochondria at nexus of cellular signaling. Mitochondria and mitochondrial sirtuins play a central role in intra- and extra-cellular signaling. Circulating fatty acids and acetate provide whole body energy homeostasis. The mitochondrial metabolites NAD+, NADH, ATP, Ca2+, ROS, ketone bodies, and acetyl-CoA participate in intracellular signaling.

Numerous signaling pathways are activated by changes in mitochondrial release of metabolites and molecules, such as Ca2+, ATP, NAD+, NADH, nitric oxide (NO), and ROS (Figure 3). Of these, Ca2+ is the best studied as a mitochondrial messenger. Mitochondria are important regulators of Ca2+ storage and homeostasis, and mitochondrial Ca2+ uptake is directly tied to the membrane potential of the organelle. Membrane potential serves as a gauge of mitochondrial function: disruption of OXPHOS, interruption in the supply or catabolism of nutrients or loss of structural integrity generally result in a fall in membrane potential, and, in turn, decreased mitochondrial Ca2+ uptake. Subsequent increases in cytosolic free Ca2+ will activate calcineurin and several Ca2+-dependent kinases [52] and affect a wide variety of transcription factors to produce appropriate cell-specific transcriptional responses [53]. Through regulation of nutrient oxidation and electron transport or yet to be identified target(s), mitochondrial sirtuins could influence mAlthough the effect of sirtuins on intracellular calcium signaling has not been studied directly, sirtuin effects on ATP production have been shown. ANT facilitates the exchange of mitochondrial ATP with cytosolic ADP. As a result the cytosolic ATP:ADP ratio reflects changes in mitochondrial energy production. A fall in ATP production activates AMP-activated protein kinase (AMPK), which directly stimulates mitochondrial energy production, inhibits protein synthesis through regulation of mammalian target of rapamycin (mTOR), and influences mitochondrial transcriptional programs [54]. SIRT3 regulates ATP levels in a variety of tissues, suggesting that its activity could have an important role in ATP-mediated retrograde signaling [46,55]. Indeed, recent studies have shown that SIRT3 regulates AMPK activation [5658]. Furthermore, SIRT4 interacts with ANT [20], raising the possibility that SIRT4 activity also influences the ATP:ADP ratio or membrane potential and modulates important mitochondrial signals.

NAD+ and NADH levels are intimately connected with mitochondrial energy production and regulate mitochondrial sirtuin activity. Unlike NAD+, however, NADH is not a sirtuin co-substrate. Indeed, changes in the NAD+:NADH ratio can change the redox state of the cell and alter the activity of enzymes such as poly-ADP-ribose polymerases and sirtuins, with subsequent effects on signaling cascades and gene expression [5961]. Changes in mitochondrial sirtuin activity could change the balance of these metabolites within the mitochondria. For example, fatty acid oxidation reduces NAD+ to NADH, which is oxidized back to NAD+ by OXPHOS. However, it is unclear whether changes in NAD+/NADH can be transmitted outside the organelle. The inner mitochondrial membrane is impermeable to NAD+ and NADH; however, the mitochondrial malate-aspartate shuttle could transfer reducing equivalents across the mitochondrial membranes.

Mitochondrial sirtuin control of apoptosis

Apoptosis is a cellular process of programmed cell death. Mitochondria play an important role in apoptosis by the activation of mitochondrial outer membrane permeabilization, which represents the irrevocable point of no return in committing a cell to death. Outer membrane permeabilization leads to the release of caspase-activating molecules, caspase-independent death effectors, and disruption of ATP production. Despite the central role for mitochondria in the control of apoptosis, surprisingly little is known about how mitochondrial sirtuins participate in apoptotic programs. SIRT3 plays a pro-apoptotic role in both BCL2-53- and JNK-regulated apoptosis [63]. Additionally, cells lacking SIRT3 show decreased stress-induced apoptosis, lending further support for a pro-apoptotic role for SIRT3 [62]. Furthermore, recent work points to a tumor suppressive role for SIRT3: SIRT3 levels are decreased in human breast cancers and Sirt3 null mice develop mammary tumors after 12 months [62]. The mechanism for the tumor suppressive function of SIRT3 is incompletely understood, but involves repression of ROS and protection against DNA damage [62]. In conflicting studies, SIRT3 has been shown to be anti-apoptotic. For example, in the cellular response to DNA damage when mitochondrial NAD+ levels fall below critical levels, SIRT3 and SIRT4 display anti-apoptotic activity, protecting cells from death [64]. SIRT3 has also been shown to be cardioprotective, in part by activation of ROS clearance genes [65]. In future studies, it will be important to elucidate the balance achieved by SIRT3 between stress resistance (anti-apoptosis) and tumor suppression (pro-apoptosis). Additionally, the role of SIRT4 and SIRT5 in regulating metabolism suggests that these mitochondrial sirtuins could also contribute to apoptosis in tumor suppressive or stress resistant manners.

Concluding remarks

An elegant coordination of metabolism by mitochondrial sirtuins is emerging where SIRT3, SIRT4 and SIRT5 serve at critical junctions in mitochondrial metabolism by acting as switches to facilitate energy production during nutrient adaptation and stress. Rather than satisfy, these studies lead to more questions. How important are changes in global mitochondrial acetylation to mitochondrial biology and is acetylation status a readout for sirtuin activity? What are other substrates for SIRT4 and SIRT5? What molecular factors dictate substrate specificity for mitochondrial sirtuins? Moreover, further studies will provide insight into the therapeutic applications for targeting mitochondrial sirtuins to treat human diseases. It is clear that many discoveries have yet to be made in this exciting area of biology.

Body of review in energetic metabolic pathways in malignant T cells

Antigen stimulation of T cell receptor (TCR) signaling to nuclear factor (NF)-B is required for T cell proliferation and differentiation of effector cells.
The TCR-to-NF-B pathway is generally viewed as a linear sequence of events in which TCR engagement triggers a cytoplasmic cascade of protein-protein interactions and post-translational modifications, ultimately culminating in the nuclear translocation of NF-B.
Activation of effect or T cells leads to increased glucose uptake, glycolysis, and lipid synthesis to support growth and proliferation.
Activated T cells were identified with CD7, CD5, CD3, CD2, CD4, CD8 and CD45RO. Simultaneously, the expression of CD95 and its ligand causes apoptotic cells death by paracrine or autocrine mechanism, and during inflammation, IL1-β and interferon-1α. The receptor glucose, Glut 1, is expressed at a low level in naive T cells, and rapidly induced by Myc following T cell receptor (TCR) activation. Glut1 trafficking is also highly regulated, with Glut1 protein remaining in intracellular vesicles until T cell activation.

Dr. Aurel,
Targu Jiu

  1. sjwilliamspa

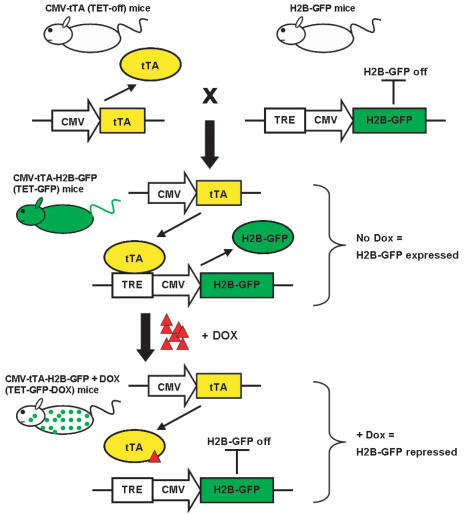
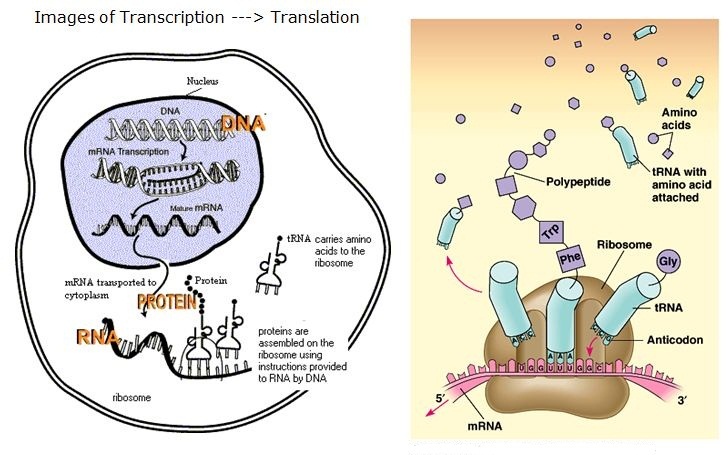
    Wouldn’t then the preferred target be mTORC instead of Sirtuins if mTORC represses Sirtuin activity?

  2. The answer may not be so simple, perhaps a conundrum.

    In conflicting studies, SIRT3 has been shown to be anti-apoptotic. For example, in the cellular response to DNA damage when mitochondrial NAD+ levels fall below critical levels, SIRT3 and SIRT4 display anti-apoptotic activity, protecting cells from death [64].

    For anti-cancer activity, apoptosis is a desired effect. This reminds me of the problem 15 years ago with the drug that would be effective against sepsis, the best paper of the year in NEJM. It failed.

    We tend to not appeciate the intricacies of biological interactions and fail to see bypass reactions. Pleotropy comes up again and again. The seminal work from Britton Chances lab on the NAD+/NADH ratio have been overlooked.

Read Full Post »

2.0 Genomics and Epigenetics: Genetic Errors and Methodologies – Cancer and Other Diseases

Writer and Curator: Larry H Bernstein, MD, FCAP

This is the second article in a series concerning genomic expression, The first of which was concerned with the expanded technologies in use for study of genomic expression.  This portion will also cover more of genetic errors as well as methodologies, but not all examples are in the realm of cancer.

I shall start with a New York Times editorial on July 24, 2015 by Angelina Jolie Pitt on her experience with BRCA1 gene and her family history.  It is very instructive on how she worked through her experience.

http://www.nytimes.com/2015/03/24/opinion/angelina-jolie-pitt-diary-of-a-surgery.html?

Two years ago she was found to have a positive test for BRCA1, carrying an 87 percent risk for breast cancer and a 50 percent risk for ovarian cancer.  At that time she had a preventive mastectomy.  The decision was not easy, but it also brought into consideration that her mother and grandmother both died of breast cancer.  She did not have an oophorectomy at that time because on considering the advice of medical experts, she would have been left with no estrogen support. She wanted to delay her early vegetative senescence.  She has reached the age of 39 years and on the advice of medical expert opinion, she proceeded with salpingo-oophorectomy, at age 39 years, a decade before  her  mother had developed cancer.  But her delay was to allow her to recover and adjust emotionally to her ongoing situation, with a remaining risk for ovarian cancer.

She tested negative for CA-1251-5 at this time prior to surgery. But the CA-125 test could well be negative with early onset ovarian cancer. It may be considered a better test for following treatment than for early diagnosis. Her choice was to sacrifice early menopause to the ability to live through her childrens’ childhood development.  This was a well thought out decision.  In addition, there were abnormal inflammatory markers that were not specific for cancer rsik, but were worth taking into account.  The procedure itself was simpler than the mastectomy.

23op-ed-thumbStandard

http://static01.nyt.com/images/2015/03/23/opinion/23op-ed/23op-ed-master315.jpg

2.1  CA-125 and Ovarian Cancer

2.1.1  lmmunoradiometric Assay of CA 125 in Effusions: Comparison with Carcinoembryonic Antigen

Marguerite M. Pinto, MD,‘ Larry H. Bernstein, MD,* Dennis A. Brogan, MPH, MT

and Elaine Criscuolo, CT(ASCP) CMIACS

The levels of CA 125 antigen were measured in 167 effusions from 150 patients using radioimmunoassay, and the results compared with the levels of carcinoembryonic antigen (CEA) in the fluids. The results indicate that an elevated fluid CA 125 level (>14,000 U/ml-68,000 U/ml) and a negative fluid CEA level (4 ng/ml) is suggestive of serous and endometrioid carcinoma of ovary, and adenocarcinoma of the endometrium and fallopian tube. Alternatively, an elevated fluid CEA level (14 ng/ml-600 ng/ml) and a negative CA 125 level (20-5000 U/ml) is seen in metastatic carcinomas of breast, lung, gastrointestinal tract, and mucinous ystadenocarcinoma. Lymphomas, melanomas, and benign effusions are negative for both antigens. The combined use of CEA and CA 125 antigen in fluids is useful in the differential diagnosis of adenocarcinoma of unknown primary. Cancer 59:218-222, 1987.

2.1.2 CA-125 in fine-needle aspirates of solid tumors: comparison with cytologic diagnosis and carcinoembryonic antigen (CEA) assay.

Marguerite M. Pinto, S Kotta

Diagnostic Cytopathology 03/1996; 14(2):121-5.
http://dx.doi.org:/10.1002/(SICI)1097-0339(199603)14:2<121::AID-DC4>3.0.CO;2-M

One hundred and twenty-two fine needle aspirates (FNA) from female patients were studied to determine whether CA-125 assay contributed to cytologic diagnosis and CEA assay. Cytologic examination was done on Papanicolaou-stained smears and cell blocks, CEA by EIA (Abbott Laboratory, > 5 ng/ml cutoff) and CA-125 by RIA (Abbott Laboratory, North Chicago, IL, > 66 mu/ml cutoff). Final diagnosis were correlated with histologic diagnosis when available, clinical, radiologic studies, and follow-up. Results: 29 benign, 93 malignant. Sensitivities and specificities: cytology, 91%, 100%; CEA: 59%, 86%; CA-125, 50%, 55%. CEA plus cytology sensitivity, 97%. CA-125 content was highest in endometrial/ovarian carcinoma (39,899 mu/ml) and < 5,000 mu/ml in other tumors and benign FNA in contrast to CEA which showed highest levels in carcinomas of colon, pancreas, and lung (> 280 ng/ml). While elevated CEA enhances the sensitivity of cytologic diagnosis of carcinomas of the colon, pancreas, and lung, low CEA and high CA-125 content supports an ovarian/endometrial primary.

2.1.3  Diagnostic efficiency of carcinoembryonic antigen and CA125 in the cytological evaluation of effusions.

Pinto MM, Bernstein LH, Rudolph RA, Brogan DA, Rosman M.
Arch Pathol Lab Med. 1992 Jun; 116(6):626-31.

In our previous study, the combination of the concentrations of carcinoembryonic antigen (CEA) and CA125 and the findings from cytological examination in 189 benign and malignant pleural and peritoneal effusions was useful in the diagnosis/classification of malignant effusions. Sensitivity of CEA (level, greater than 5 ng/mL) was 68%; specificity was 99% for the diagnosis of malignant effusions secondary to carcinoma of the lung, breast, gastrointestinal tract, and mucinous carcinoma of the ovary. Sensitivity of CA125 (level, greater than 5000 U/mL) was 85%; specificity was 96% for the diagnosis of malignant effusions in carcinoma of the ovary, fallopian tube, and endometrium. We now expanded the study to include 840 pleural and peritoneal effusions (benign, n = 520; malignant, n = 320) and analyzed the data by the statistical method of Rudolph and colleagues. Based on new cutoff values, ie, CEA level at 6.3 ng/mL and CA125 level at 3652 U/mL, the sensitivities for detection of malignant effusions secondary to carcinomas of the lung, breast, and gastrointestinal tract and mucinous carcinoma of the ovary varied between 75% and 100%; specificity was 98%. Sensitivity of CA125 for detection of malignant effusions from müllerian epithelial carcinoma was 71%; specificity was 99%. The elevated CEA fluid level alone helped to diagnose malignant effusions of the gastrointestinal tract in 54%, breast in 19%, and lung in 16%. The high CA125 fluid level was predictive of müllerian epithelial carcinoma. Adjunctive use of CEA and CA125 levels in fluid enhances the sensitivity of cytological diagnosis and may be predictive of the primary site in patients who present with carcinoma of an unknown primary source.

2.2 Carcinoembryonic antigen in diagnostics

2.2.1 Carcinoembryonic antigen content in fine needle aspirates of the lung. A diagnostic adjunct to cytology.

Pinto MM1, Ha DJ.
Acta Cytol. 1992 May-Jun; 36(3):277-82

Carcinoembryonic Antigen (CEA) was measured in 59 consecutive fine needle aspirates (FNAs) of the lung from 58 patients to determine if the CEA content would enhance the sensitivity of the cytologic diagnosis. Twenty-eight males and 30 females with tumors 1-40 cm in diameter were studied. Final diagnoses were correlated with the clinical history, radiologic studies, tissue (when available) and follow-up. Image-guided FNAs were performed by radiologists using a 22-gauge Chiba needle and 20-mL syringe with one to four passes per specimen. Cytologic examination included rapid assessment in the radiology suite and a final diagnosis in 24 hours. CEA was measured by enzyme immunoassay using monoclonal antibody. Nine benign aspirates and 50 malignant aspirates were diagnosed. The sensitivity of cytology was 86% and specificity, 100%. Using 5 ng/mL as the cutoff, the sensitivity of CEA for malignant aspirates was 50% and specificity, 90%. The combined sensitivity of CEA and cytology was 95%. The mean CEA in malignant aspirates was 131 ng/mL and in benign aspirates, 2.41. The highest mean CEA was seen in adenocarcinoma, 402.6 ng/mL. Lower CEA content was seen in epidermoid carcinoma (58.6 ng/mL), large cell carcinoma (8.09), oat cell carcinoma, metastatic carcinoma of the kidney and breast, thymoma and lymphoma (each less than 1 ng/mL). Elevated CEA alone was diagnostic in two aspirates of bronchioloalveolar carcinoma; carcinoma with an unknown primary source, three; and large cell carcinoma, one. The adjunctive use of CEA in FNAs of the lung enhances the sensitivity of the cytologic diagnosis.

2.2.2  Relationship between serum CA125 half life and survival in ovarian cancer

Table
Gupta and Lis Journal of Ovarian Research 2009 2:13
http://dx.doi.org:/10.1186/1757-2215-2-13

First Author, Year, Study Place Data Collection Study
Design
Sample
Size
RR/HR, (95% CI),
P-Value
Riedinger JM, 2006, France 1988 to
1996
R 553 2.04 (1.58-2.63), < 0.0001
Gadducci A, 2004, Italy 1996 to2002 R 71 3.11 (1.22-7.98), 0.0181
Munstedt K, 1997, Germany 1987 to1994 R 85 0.6184
Gadducci A, 1995, Italy 1986 to1992 R 225 2.13 (1.23-3.68), 0.0073
Rosman M, 1994, Connecticut 1985 to
1989
R 51 3.6 (1.8-7.4), < 0.001
Yedema C A, 1993, Netherlands 1984 to
1990
R 60 9.17 (1.49-56.3), 0.01
Hawkins RE, 1989, London NA P 29 3.7 (0.7-20.1), 0.001;27.8 (4.0-193), 0.001

1CA125 half-life was independent prognostic indicator for survival
2FIGO stage, tumor grade, residual disease, CA125
http://www.ovarianresearch.com/content/2/1/13/table/T6

3.3.0      DNA double strand breaks

2.3.1.  Collaboration and competition – DNA double-strand break repair pathways

Kass EM, Jasin M
FEBS Letters 2010; 584:3703-3708
http://dx.doi.org:/jfebslet.2010.07.057

DNA double-strand breaks occur in replication and exogenous sources pose risk to genome stability. There are two pathways to repair.  They are non-homologous end joining and homologous recombination. Both pathways cooperate and compete at double-strand break sites.

2.3.2 DNA Double-Strand Break Repair Inhibitors as Cancer Therapeutics

Srivastava M, Rashavan SC
Chem & Biol 2015 Jan; pp17-29
http://dx.doi.org:/10.1016/jchembiol.2014.11.013

Homologous recombination and non-homologous end joining are the two major repair pathways expressed in eukaryotes.  For double-strand breaks, and the DSB repair gene is vulnerable to chemotherapy and radiation therapy, accounting for treatment resistance. Therefore, targeting DSB repair is attractive. Blocking the residual repair using inhibitors can potentiate treatment.

2.3.3  Animation published in DNA Repair: Helleday T, Lo J, van Gent DC, Engelward BP. DNA double-strand break repair: From mechanistic understanding to cancer treatment. DNA Repair. (14 Mar 2007)
2.3.3.1 http://web.mit.edu/engelward-lab/animations/DSBR.html

2.3.3.2 https://www.youtube.com/watch?v=eg8rpYFsqCA

2.3.4 Homology-dependent double strand break repair. Oxford Academic (Oxford University Press)

https://www.youtube.com/watch?v=86JCMM5kb2A

2.4.0 Managing DNA data sets

2.4.1 Bionimbus –  a cloud for managing, analyzing and sharing large genomics datasets

The Bionimbus Protected Data Cloud (PDC) is a collaboration between the Open Science Data Cloud (OSDC) and the IGSB (IGSB,) the Center for Research Informatics (CRI), the Institute for Translational Medicine (ITM), and the University of Chicago Comprehensive Cancer Center (UCCCC). The PDC allows users authorized by NIH to compute over human genomic data from dbGaP in a secure compliant fashion. Currently, selected datasets from the The Cancer Genome Atlas (TCGA) are available in the PDC.

https://bionimbus-pdc.opensciencedatacloud.org/

2.4.1.2 Accounting for uncertainty in DNA sequencing data

O’Rawe JA, Ferson S, Lyon GJ
Trends in Genetics 2015 Feb; 31(2):61-66
http://dx.doi.org:/10.101/jtig.2014.12.002

This article reviews uncertainty in quantification in DNA sequency applications and sources of error propagation, and it proposes methods to account for errors and uncertainties.

2.5.0 Linking Traits to Mechanisms and UPR response/proteostasis

2.5.1 Stress-Independent Activation of XBP1s and/or ATF6 Reveals –Three Linking traits based on their shared molecular mechanisms

Shoulders MD, Ryno LM, Genereux JC,…Wiseman BL
Cell Reports 2013 Apr; 3, pp 1279-1292
http://dx.doi.org:/10.1016/j.celrep.2013.03.024

The unfolded protein response (UPR) maintains ER proteostasis through the transcription factors XP1s and ATF6. This study measured orthogonal small molecule-mediated activation of transcription factors nXP1s and/or ATF6 using transcriptomics and quantitative proteomics. The finding is that three ER proteostasis environmants differentially influence

  1. Folding
  2. Traffiking, and
  3. Degradation of destabilized ER client proteins

Without affecting endogenous proteome. The proteostasis network is remodeled with the potential for selective restoration of the aberrant ER proteostasis.

2.5.2 Biological and chemical approaches to diseases of proteostasis deficiency.

Powers ET, Morimoto RI, Dillin A, Kelly JW, Balch WE
Annu Rev Biochem. 2009; 78:959-91.
http://dx.doi.org:/10.1146/annurev.biochem.052308.114844

Many diseases appear to be caused by the misregulation of protein maintenance. Such diseases of protein homeostasis, or “proteostasis,” include loss-of-function diseases (cystic fibrosis) and gain-of-toxic-function diseases (Alzheimer’s, Parkinson’s, and Huntington’s disease). Proteostasis is maintained by the proteostasis network, which comprises pathways that control protein synthesis, folding, trafficking, aggregation, disaggregation, and degradation. The decreased ability of the proteostasis network to cope with inherited misfolding-prone proteins, aging, and/or metabolic/environmental stress appears to trigger or exacerbate proteostasis diseases. Herein, we review recent evidence supporting the principle that proteostasis is influenced both by an adjustable proteostasis network capacity and protein folding energetics, which together determine the balance between folding efficiency, misfolding, protein degradation, and aggregation. We review how small molecules can enhance proteostasis by binding to and stabilizing specific proteins (pharmacologic chaperones) or by increasing the proteostasis network capacity (proteostasis regulators). We propose that such therapeutic strategies, including combination therapies, represent a new approach for treating a range of diverse human maladies.

2.5.3 Extracellular Chaperones and Proteostasis

Amy R. Wyatt, Justin J. Yerbury, Heath Ecroyd, and Mark R. Wilson
Annual Review of Biochemistry 2013 Jun; 82: 295-322
http://dx.doi.org:/10.1146/annurev-biochem-072711-163904

There exists a family of currently untreatable, serious human diseases that arise from the inappropriate misfolding and aggregation of extracellular proteins. At present our understanding of mechanisms that operate to maintain proteostasis in extracellular body fluids is limited, but it has significantly advanced with the discovery of a small but growing family of constitutively secreted extracellular chaperones. The available evidence strongly suggests that these chaperones act as both sensors and disposal mediators of misfolded proteins in extracellular fluids, thereby normally protecting us from disease pathologies. It is critically important to further increase our understanding of the mechanisms that operate to effect extracellular proteostasis, as this is essential knowledge upon which to base the development of effective therapies for some of the world’s most debilitating, costly, and intractable diseases.

http://www.proteostasis.com/our-technology/proteostasis-network.html

proteostasis model

http://www.proteostasis.com/images/stories/technology/illustration1.gif

2.6.0 Transcription

2.6.1 Looping Back to Leap Forward. Transcription Enters a New Era

Levine M, Cattoglio C, Tijan R
Cell 2014 Mar; 157: 13-22.
http://dx.doi.org:/10.1016/j.cell.2014.02.009

Organism complexity is not in gene number, but lies in gene regulation. The human genbome contains hundreds of thousands of enhancers, and genes are embedded in a milieu of enhancers . Proliferation of cis-regulatory DNAs is accompanied by complexity and functional diversity of transcription machinery recognizing distal enhancers and promotors, and high-order spatial organization. This article reviews the dynamic communication of remote enhancers with target promoters.

2.6.2 Activating gene expression in mammalian cells with promoter-targeted duplex RNAs.

Janowski BA, Younger ST, Hardy DB, Ram R, Huffman KE, Corey DR.
Nat Chem Biol. 2007 Mar; 3(3):166-73
http://dx.doi.org:/10.1038/nchembio860

The ability to selectively activate or inhibit gene expression is fundamental to understanding complex cellular systems and developing therapeutics. Recent studies have demonstrated that duplex RNAs complementary to promoters within chromosomal DNA are potent gene silencing agents in mammalian cells. Here we report that chromosome-targeted RNAs also activate gene expression. We have identified multiple duplex RNAs complementary to the progesterone receptor (PR) promoter that increase expression of PR protein and RNA after transfection into cultured T47D or MCF7 human breast cancer cells. Upregulation of PR protein reduced expression of the downstream gene encoding cyclooygenase 2 but did not change concentrations of estrogen receptor, which demonstrates that activating RNAs can predictably manipulate physiologically relevant cellular pathways. Activation decreased over time and was sequence specific. Chromatin immunoprecipitation assays indicated that activation is accompanied by reduced acetylation at histones H3K9 and H3K14 and by increased di- and trimethylation at histone H3K4. These data show that, like proteins, hormones and small molecules, small duplex RNAs interact at promoters and can activate or repress gene expression.
2.6.3 Tight control of gene expression in mammalian cells by tetracycline-responsive promoters.

M Gossen and H Bujard
Proc Natl Acad Sci U S A. 1992 Jun 15; 89(12): 5547–5551.

Control elements of the tetracycline-resistance operon encoded in Tn10 of Escherichia coli have been utilized to establish a highly efficient regulatory system in mammalian cells. By fusing the tet repressor with the activating domain of virion protein 16 of herpes simplex virus, a tetracycline-controlled transactivator (tTA) was generated that is constitutively expressed in HeLa cells. This transactivator stimulates transcription from a minimal promoter sequence derived from the human cytomegalovirus promoter IE combined with tet operator sequences. Upon integration of a luciferase gene controlled by a tTA-dependent promoter into a tTA-producing HeLa cell line, high levels of luciferase expression were monitored. These activities are sensitive to tetracycline. Depending on the concentration of the antibiotic in the culture medium (0-1 microgram/ml), the luciferase activity can be regulated over up to five orders of magnitude. Thus, the system not only allows differential control of the activity of an individual gene in mammalian cells but also is suitable for creation of “on/off” situations for such genes in a reversible way.

Diagrams of two regulatable gene expression systems.

Diagrams of two regulatable gene expression systems.

http://www.intechopen.com/source/html/16788/media/image5.jpeg

schematic-representation-of-transgenic-mouse-breeding-scheme-h2b-gfp-mice-should-not-express-gfp-in-the-absence-of-a-tetracycline-regulatable-transactivator

schematic-representation-of-transgenic-mouse-breeding-scheme-h2b-gfp-mice-should-not-express-gfp-in-the-absence-of-a-tetracycline-regulatable-transactivator

http://openi.nlm.nih.gov/imgs/512/321/2408727/2408727_pone.0002357.g001.png

2.7.0 Epigenetics and Cancer

2.7.1 Epigenetics and cancer metabolism

Johnson C, Warmoes MO, Shen X, Locasale JW
Cancer Letters 2015;  356:309-314.
http://dx.doi.org:/10.1016/j.canlet.2013.09.043

Cancer is characterized by adaptive metabolic changes for proliferation and survival of the neoplastic cell, which is accompanied by dysfunctional metabolic enzyme changes in a specific nutrient supplied environment. The oncogenic change uses epigenetic level enzymes that catalyze posttranslational modifications of the DNA/histone expression with metabolites including cofactors and substrates for reactions. This interaction of epigenetics and metabolism provides new insights for anti-cancer therapy.

2.7.2 Cancer Epigenetics. From Mechanism to Therapy

Dawson MA, Konzarides T
Cell 2012 Jul; 150:12-27
http://dx.doi.org:/10.1016/j.cell.2012.06.013

Carcinogenesis requires all of the following:

  • DNA methylation
  • Histone modification
  • Nucleosome remodeling
  • RNA mediated targeting

This article reviews basic principles of epigenetic pathways that are dysregulated in carcinogenesis.

2.7.4 A subway review of cancer pathways

Hahn WC, Weinberg RA
Nature Reviews: Cancer
http://www.nature.com/nrc/poster/subpathways/index.html

Cancer arises from the stepwise accumulation of genetic changes that confer upon an incipient neoplastic cell the properties of unlimited, self-sufficient growth and resistance to normal homeostatic regulatory mechanisms. Advances in human genetics and molecular and cellular biology have identified a collection of cell phenotypes � the main destinations in the subway map below � that are required for malignant transformation1. Specific molecular pathways (subway lines) are responsible for programming these behaviours. Although the connections between cancer-cell wiring and function remain incompletely explored and specified � hence the many lines under construction � the broad outlines of the molecular circuitry of the cancer cell can now be sketched. Further advances in understanding these pathways and their interconnections will accelerate the development of molecularly targeted therapies that promise to change the practice of oncology.

cancer subway map

cancer subway map

http://www.nature.com/nrc/poster/subpathways/images/map.gif

Subway map designed by Claudia Bentley.

Read Full Post »

Diet and Cholesterol

Writer and Curator: Larry H. Bernstein, MD, FCAP 


Introduction

We are all familiar with the conundrum of diet and cholesterol.  As previously described, cholesterol is made by the liver. It is the backbone for the synthesis of sex hormones, corticosteroids, bile, and vitamin D. It is also under regulatory control, and that is not fully worked out, but it has health consequences. The liver is a synthetic organ that is involved with glycolysis, gluconeogenesis, cholesterol synthesis, and unlike the heart and skeletal muscles – which are energy transducers – the liver is anabolic, largely dependent on NADPH.  The mitochondria, which are associated with aerobic metabolism, respiration, are also rich in the liver.  The other part of this story is the utilization of lipids synthesized by the liver in the vascular endothelium.  The vascular endothelium takes up and utilizes/transforms cholesterol, which is involved in the degenerative development of pathogenic plaque.  Plaque is associated with vascular rigidity, rupture and hemorrhage, essential in myocardial inmfarction. What about steroid hormones?  There is some evidence that sex hormone differences may be a factor in coronary vascular disease and cardiac dysfunction.  The evidence that exercise is beneficial is well established, but acute coronary events can occur during exercise.  WE need food, and food is at the center of the discussion – diet and cholesterol.  The utilization of food varies regionally, and is dependent on habitat.  But it is also strongly influence by culture.  We explore this further in what follows.

A high fat, high cholesterol diet leads to changes in metabolite patterns in pigs – A metabolomic study

Jianghao Sun, Maria Monagas, Saebyeol Jang, Aleksey Molokin, et al.
Food Chemistry 173 (2015) 171–178
http://dx.doi.org/10.1016/j.foodchem.2014.09.161

Non-targeted metabolite profiling can identify biological markers of dietary exposure that lead to a better understanding of interactions between diet and health. In this study, pigs were used as an animal model to discover changes in metabolic profiles between regular basal and high fat/high cholesterol diets. Extracts of plasma, fecal and urine samples from pigs fed high fat or basal regular diets for 11 weeks were analysed using ultra-high performance liquid chromatography with high-resolution mass spectrometry (UHPLC–HRMS) and chemometric analysis. Cloud plots from XCMS online were used for class separation of the most discriminatory metabolites. The major metabolites contributing to the discrimination were identified as bile acids (BAs), lipid metabolites, fatty acids, amino acids and phosphatidic acid (PAs), phosphatidylglycerol (PGs), glycerophospholipids (PI), phosphatidylcholines (PCs) and tripeptides. These results suggest the developed approach can be used to identify biomarkers associated with specific feeding diets and possible metabolic disorders related to diet.

Nutritional metabolomics is a rapidly developing sub-branch of metabolomics, used to profile small-molecules to support integration of diet and nutrition in complex bio-systems research. Recently, the concept of ‘‘food metabolome’’ was introduced and defined as all metabolites derived from food products. Chemical components in foods are absorbed either directly or after digestion, undergo extensive metabolic modification in the gastrointestinal tract and liver and then appear in the urine and feces as final metabolic products. It is well known that diet has a close relationship with the long-term health and well-being of individuals. Hence, investigation of the ‘‘food metabolome’’ in biological samples, after feeding specific diets, has the potential to give objective information about the short- and long-term dietary intake of individuals, and to identify potential biomarkers of certain dietary patterns. Previous studies have identified potential biomarkers after consumption of specific fruits, vegetables, cocoa, and juices. More metabolites were revealed by using metabolomic approaches compared with the detection of pre-defined chemicals found in those foods.

Eating a high-fat and high cholesterol diet is strongly associated with conditions of obesity, diabetes and metabolic syndrome, that are increasingly recognized as worldwide health concerns. For example, a high fat diet is a major risk factor for childhood obesity, cardiovascular diseases and hyperlipidemia. Little is known on the extent to which changes in nutrient content of the human diet elicit changes in metabolic profiles. There are several reports of metabolomic profiling studies on plasma, serum, urine and liver from high fat-diet induced obese mice, rats and humans. Several potential biomarkers of obesity and related diseases, including lysophosphatidylcholines (lysoPCs), fatty acids and branched-amino acids (BCAAs) have been reported.

To model the metabolite response to diet in humans, pigs were fed a high fat diet for 11 weeks and the metabolite profiles in plasma, urine and feces were analyzed. Non-targeted ultra high performance liquid chromatography tandem with high resolution mass spectrometry (UHPLC–MS) was utilized for metabolomics profiling. Bile acids (BAs), lipid metabolites, fatty acids, amino acids and phosphatidic acid (PAs), phosphatidylglycerol (PGs), glycerophospholipids (PI), phosphatidylcholines (PCs), tripeptides and isoflavone conjugates were found to be the final dietary metabolites that differentiated pigs fed a high-fat and high cholesterol diet versus a basal diet. The results of this study illustrate the capacity of this metabolomic profiling approach to identify new metabolites and to recognize different metabolic patterns associated with diet.

Body weight, cholesterol and triglycerides were measured for all the pigs studied. There was no significant body weight gain between pigs fed diet A and diet B after 11 weeks of treatment. The serum cholesterol and triglyceride levels were significantly higher in pigs fed with diet B compared with the control group at the end of experiment.

Plasma, urine and fecal samples were analyzed in both positive and negative ionization mode. To obtain reliable and high-quality metabolomic data, a pooled sample was used as a quality control (QC) sample to monitor the run. The QC sample (a composite of equal volume from 10 real samples) was processed as real samples and placed in the sample queue to monitor the stability of the system. All the samples were submitted in random for analysis. The quantitative variation of the ion features across the QC samples was less than 15%. The ion features from each possible metabolite were annotated by XCMS online to confirm the possible fragment ions, isotopic ions and possible adduct ions. The reproducibility of the chromatography was determined by the retention time variation profiles that were generated by XCMS. The retention time deviation was less than 0.3 min for plasma samples, less than 0.3 min for fecal samples, and less than 0.2 min for urine samples, respectively. On the basis of these results of data quality assessment, the differences between the test samples from different pigs proved more likely to reflect varied metabolite profiles rather than analytical variation. The multivariate analysis results from the QC sample showed the deviation of the analytical system was acceptable.
Good separation can be observed between pigs on the two diets, which is also reflected in the goodness of prediction (Q2), of 0.64 using data from the positive ionization mode. For negative ionization mode data, better separation appears with a Q2of 0.73.

Cloud plot is a new multidimensional data visualization method for global metabolomic data (Patti et al., 2013). Data characteristics, such as the p-value, fold change, retention time, mass-to-charge ratio and signal intensity of features, can be presented simultaneously using the cloud plot. In this study, the cloud plot was used to illustrate the ion features causing the group separation. In Fig. 2 and 82 features with p < 0.05 and fold change >2, including visualisation of the p-value, the directional fold change, the retention time and the mass to charge ratio of features, are shown. Also, the total ion chromato-grams for each sample were shown. The upper panel in (2A) shows the chromatograms of plasma samples from pigs fed the high fat diet, while the lower panel shows the chromatograms of samples from pigs fed the regular diet. Features whose intensity is increased are shown in green, whereas features whose intensity is decreased are shown in pink (2A). The size of each bubble corresponds to the log fold change of the feature: the larger the bubble, the larger the fold changes. The statistical significance of the fold change, as calculated by a Welch t-test with unequal variances, is represented by the intensity of the feature’s color where features with low p-values are brighter compared to features with high p-values. The Y coordinate for each feature corresponds to the mass-to-charge ratio of the compound, as determined by mass spectrometry. Each feature is also color coded, such as features that are shown with a black outline have database hits in METLIN, whereas features shown without a black outline do not have any database hits.

From the cloud plot (Fig. 2A), 82 discriminating ion features from positive data and 48 discriminating ions features from negative data were considered as of great importance for class separation. After filtering out the fragment ions, isotope annotations, and adduct ions, thirty-one metabolites were tentatively assigned using a Metlin library search (Table S4).

Among the assigned metabolites detected, five of the highest abundant metabolites were identified as bile acid and bile acid conjugates (Fig. 2B). This series of compounds shared the following characteristics; the unconjugated bile acids showed [M-H] ion as base peak in the negative mode.

The characteristic consistent with bile acid hyodeoxycholic acid (HDCA) was confirmed with a reference standard. For the conjugated bile acids (usually with glycine and taurine), the [M-H] and [M+H]+ are always observed as the base peaks. For example, the ion feature m/z 448.3065 at 21.18 min was identified as chenodeoxycholic acid glycine conjugate. The neutral loss of 62 amu (H2O + CO2) was considered as a characteristic fragmentation pathway for bile acid glycine conjugates. This above mentioned characteristic can easily identify a series of bile acids compounds. The five metabolite ions detected in plasma were significantly different between pigs fed the high fat diet (Fig. 2B, red bars) and regular diet (Fig. 2B, blue bars) for 11 weeks, and were identified as chenodeoxycholic acid glycine conjugate, tauroursodeoxycholic acid, hyodeoxycholic acid, deoxycholic acid glycine conjugate and glycocholic acid; chenodeoxycholic acid glycine and hyodeoxycholic acid.

Figures 1-4 , not shown.
Fig 1. The PCA score plot of plasma (A) (+)ESI data with all the ion features; (B) (+)ESI data with selected ion features; (C) (-)ESI data with all ion features; (D) (-)ESI data with selected ion features. Samples were taken from pigs fed diet A (BS, blue) and diet B (HF, red). (For interpretation of the references to color in this figure legend, the reader is referred to the web version of this article.)

Fig 2. Cloud plot showing 82 discriminatory ion features (negative ion data) in plasma, and (B) box-plot of data set of the five most abundant bile acids identified in plasma (negative ion data) samples.

Fig. 3. PCA score plot of fecal samples from pigs fed diet A (BS, blue) and diet B (HF, red) (A) week 0, (B) week 2, (C) week 4 (D) week 6, (E) week 11 for distal samples (F) week 11 for proximal colon samples. (For interpretation of the references to color in this figure legend, the reader is referred to the web version of this article.)

Fig. 4. PCA and PLS-DA score plot of urine samples from (+)ESI-data (A and C) and (-)ESI-data (B and D) taken at the end of the study (week 11) from pigs fed diet A (BS, blue) and diet B (HF, red). (For interpretation of the references to color in this figure legend, the reader is referred to the web version of this article.)

Plasma, fecal and urine metabolites from pigs fed either a high fat or regular diet were investigated using a UHPLC–HRMS based metabolomic approach. Their metabolic profiles were compared by multivariate statistical analysis.
Diet is logically believed to have a close relationship with metabolic profiles. Feeding a high fat and high cholesterol diet to pigs for 11 weeks resulted in
an increase in bile acids and their derivatives in plasma, fecal and urine samples, though at this stage, there was no significant weight gain observed.

In a previous study, a significantly higher level of muricholic acid, but not cholic acid, was found in pigs fed a high fat diet. The gut microbiota of these pigs were altered by diet and considered to regulate bile acid metabolism by reducing the levels of tauro-beta-muricholic acid. In our study, the unconjugated bile acids, hyodeoxycholic acid and deoxycholic acid were found to be significantly higher in the fecal samples of pigs fed a high-fat diet.

Chenodeoxycholic acid glycine was 8.6 times higher in pigs fed a high fat and high cholesterol diet compared to those fed a regular diet. These results confirm that feeding a high fat and high cholesterol diet leads to a changing metabolomic pattern over time, represented by excretion of certain bile acids in the feces. We also found that several metabolites associated with lipid metabolism were increased in the feces of pigs fed the high-fat diet. Feeding the high fat diet to pigs for 11 weeks did not induce any overt expression of disease, except for significantly higher levels of circulating cholesterol and triglycerides in the blood. It is likely, however, that longer periods of feeding would increase expression of metabolic syndrome disorders and features of cardiovascular disease in pigs, as have been previously demonstrated. Products of lipid metabolism that changed early in the dietary treatment could be useful as biomarkers. This may be important because the composition of the fats in the diet, used in this study, was complex and from multiple sources including lard, soybean oil and coconut oil.

In summary, a number of metabolite differences were detected in the plasma, urine and feces of pigs fed a high fat and high cholesterol diet versus a regular diet that significantly increased over time. PCA showed a clear separation of metabolites in all biological samples tested from pigs fed the different diets. This methodology could be used to associate metabolic profiles with early markers of disease expression or the responsiveness of metabolic profiles to alterations in the diet. The ability to identify metabolites from bio-fluids, feces, and tissues that change with alterations in the diet has the potential to identify new biomarkers and to better understand mechanisms related to diet and health.

Amino acid, mineral, and polyphenolic profiles of black vinegar, and its lipid lowering and antioxidant effects in vivo

Chung-Hsi Chou, Cheng-Wei Liu, Deng-Jye Yang, Yi-Hsieng S Wuf, Yi-Chen Chen
Food Chemistry 168 (2015) 63–69
http://dx.doi.org/10.1016/j.foodchem.2014.07.035

Black vinegar (BV) contains abundant essential and hydrophobic amino acids, and polyphenolic contents, especially catechin and chlorogenic acid via chemical analyses. K and Mg are the major minerals in BV, and Ca, Fe, Mn, and Se are also measured. After a 9-week experiment, high-fat/cholesterol-diet (HFCD) fed hamsters had higher (p < 0.05) weight gains, relative visceral-fat sizes, serum/liver lipids, and serum cardiac indices than low-fat/cholesterol diet (LFCD) fed ones, but BV supplementation decreased (p < 0.05) them which may resulted from the higher (p < 0.05) fecal TAG and TC contents. Serum ALT value, and hepatic thiobarbituric acid reactive substances (TBARS), and hepatic TNF-α and IL-1β contents in HFCD-fed hamsters were reduced (p < 0.05) by supplementing BV due to increased (p < 0.05) hepatic glutathione (GSH) and trolox equivalent antioxidant capacity (TEAC) levels, and catalase (CAT) and glutathione peroxidase (GPx) activities. Taken together, the component profiles of BV contributed the lipid lowering and antioxidant effects on HFCD fed hamsters.

World Health Organization (WHO) reported that more than 1.4 billion adults were overweight (WHO, 2013). As we know, imbalanced fat or excess energy intake is one of the most important environmental factors resulted in not only increased serum/liver lipids but also oxidative stress, further leading cardiovascular disorders and inflammatory responses. Food scientists strive to improve serum lipid profile and increase serum antioxidant capacity via  medical foods or functional supplementation.

Vinegar is not only used as an acidic seasoning but also is shown to have some beneficial effects, such as digestive, appetite stimulation, antioxidant, exhaustion recovering effects, lipid lowering effects, and regulations of blood pressure. Polyphenols exist in several food categories, such as vegetable, fruits, tea, wine, juice, and vinegar that have effects against lipid peroxidation, hypertension, hyperlipidemia, inflammation, DNA damage, and. Black vinegar (BV) (Kurosu) is produced from unpolished rice with rice germ and bran through a stationary surface fermentation and contains higher amounts of amino acids and organic acids than other vinegars. Black vinegar is also characterised as a health food rather than only an acidic seasoning because it was reported to own a DPPH radical scavenging ability and decrease the adipocyte size in rat models. Moreover, the extract of BV shows the highest radical scavenging activity in a DPPH radical system than rice, grain, apple, and wine vinegars. The extract suppresses increased lipid peroxidation in mouse skin treated with 12-o-tetradecanoylphorbol-13-acetate.

This study focused on the nutritional compositions in BV, and the in-vivo lipid lowering and antioxidant effects. First, the amino acid, mineral, and polyphenolic profile of BV were identified. Hypolipidemic hamsters induced by a high-fat/cholesterol diet (HFCD) were orally administered with different doses of BV. Serum lipid profile and liver damage indices liver and fecal lipid contents, as well as hepatic antioxidant capacities [thiobarbituric acid reactive substances (TBARS), glutathione (GSH), trolox equivalent antioxidant capacity (TEAC), and activities of superoxide dismutase (SOD), catalase (CAT), and glutathione peroxidase (GPx)] and hepatic cytokine levels were assayed to demonstrated physiological functions of BV.

Higher serum AST, ALT, and free fatty acids, as well as hepatic cholesterol, triacylglycerol, MDA, hydroperoxide, and cytokine (IL-1β and TNF-α) levels were easily observed in a high-fat-consumption rodent. Several reports indicated some amino acids antioxidant activities in vitro and in vivo. Acidic amino acids, such as Asp and Glu and hydrophobic amino acids, such as Ile, Leu, and Val display high antioxidant properties. Recently, an in vivo study indicated that a pepsin hydrolyzation significantly enhanced Asp, Glu, Leu, and Val contents in chicken livers; meanwhile, chicken-liver hydrolysates showed an antioxidant capacity in brain and liver of D-galactose treated mice. In addition, it was also reported that Mg and Se play important roles in SOD and GPx activities, respectively. Uzun and Kalender (2013) used chlorpyrifos, an organophosphorus insecticide, to induce hepatotoxic and hematologic changes in rats, but they observed that catechin can attenuate the chlorpyrifos-induced hepatotoxicity by increasing GPx and glutathione-S-transferase activities and decreasing MDA contents. Meanwhile, chlorogenic acid elevated SOD, CAT, and GPx activities with concomitantly decreased lipid peroxidation of liver and kidney in streptozotocin-nicotinamide induced type-2 diabetic rats. Hence, it is reasonable to assume that increased antioxidant capacities and decreased damage in livers of HFCD fed hamsters supplemented with BV should be highly related to the components, i.e. amino acid profile, mineral profile, and polyphenol contents, as well as the lowered liver lipid accumulations.

In analyses of amino acids, minerals and polyphenols, BV contained abundant essential amino acids and hydrophobic amino acids. Mg, K, Ca, Fe, Mn, and Se were measured in BV where K and Mg were major. Gallic acid, catechin, chlorogenic acid, p-hydroxybezoic acid, p-cumeric acid, ferulic acid, and sinapic acid were also identified in BV where catechin and chlorogenic acid were the majorities. Meanwhile, the lipid-lowering and antioxidant effects of BV were also investigated via a hamster model. BV supplementation apparently decreased weight gain (g and %), relative size of visceral fat, serum/liver TC levels, serum cardiac index, and hepatic TBARS values and damage indices (serum ALT and hepatic TNF-α and IL-1β) but increased fecal lipid contents and hepatic antioxidant capacities (GSH level, TEAC level, CAT activity, and GPx activity) in HFCD fed hamsters. To sum up, those benefits could be attributed to a synergetic effect of compounds in BV.

Analysis of pecan nut (Carya illinoinensis) unsaponifiable fraction – Effect of ripening stage on phytosterols and phytostanols composition

Intidhar Bouali, Hajer Trabelsi, Wahid Herchi, Lucy Martine, et al.
Food Chemistry 164 (2014) 309–316
http://dx.doi.org/10.1016/j.foodchem.2014.05.029

Changes in 4-desmethylsterol, 4-monomethylsterol, 4,4-dimethylsterol and phytostanol composition were quantitatively and qualitatively investigated during the ripening of three varieties of Tunisian grown pecan nuts. These components have many health benefits, especially in lowering LDL-cholesterol and preventing heart disease. The phytosterol composition of whole pecan kernel was quantified by Gas Chromatography–Flame Ionization Detection (GC–FID) and identified by Gas Chromatography–Mass Spectrometry (GC–MS). Fifteen phytosterols and one phytostanol were quantified. The greatest amount of phytosterols (2852.5 mg/100 g of oil) was detected in Mahan variety at 20 weeks after the flowering date (WAFD). Moore had the highest level of phytostanols (7.3 mg/100 g of oil) at 20 WAFD. Phytosterol and phytostanol contents showed a steep decrease during pecan nut development. Results from the quantitative characterization of pecan nut oils revealed that β-sitosterol, D5-avenasterol, and campesterol were the most abundant phytosterol compounds at all ripening stages.

Association between HMW adiponectin, HMW-total adiponectin ratio and early-onset coronary artery disease in Chinese population

Ying Wang, Aihua Zheng, Yunsheng Yan, Fei Song, et al.
Atherosclerosis 235 (2014) 392-397
http://dx.doi.org/10.1016/j.atherosclerosis.2014.05.910

Objective: Adiponectin is an adipose-secreting protein that shows atheroprotective property and has inverse relation with coronary artery disease (CAD). High-molecular weight (HMW) adiponectin is reported as the active form of adiponectin. In the present study, we aimed to investigate the association between total adiponectin, HMW adiponectin, HMW-total adiponectin ratio and the severity of coronary atherosclerosis, and to compare their evaluative power for the risk of CAD. Methods: Serum levels of total and HMW adiponectin were measured in 382 early-onset CAD (EOCAD) patients and 305 matched controls undergoing coronary angiography by enzyme-linked immunosorbent assay (ELISA). Gensini score was used to evaluate the severity of coronary atherosclerosis. Results: CAD onset age was positively correlated with HMW adiponectin (r = 0.383, P < 0.001) and HMW-total adiponectin ratio (r = 0.429, P < 0.001) in EOCAD patients. Total and HMW adiponectin and HMW-total adiponectin ratio were all inversely correlated with Gensini score (r=0.417, r=0.637, r=0.578, respectively; all P < 0.001). Multivariate binary logistic regression analysis demonstrated that HMW adiponectin and HMW-total adiponectin ratio were both inversely correlated with the risk of CAD (P < 0.05). ROC analysis indicated that areas under the ROC curves of HMW adiponectin and HMW-total adiponectin ratio were larger than that of total adiponectin (P < 0.05). Conclusions: Adiponectin is cardioprotective against coronary atherosclerosis onset in EOCAD patients. HMW adiponectin and HMW-total adiponectin ratio show stronger negative associations with the severity of coronary atherosclerosis than total adiponectin does. HMW adiponectin and HMW-total adiponectin ratio are effective biomarkers for the risk of CAD in Chinese population.

Gender and age were well matched between patients and controls. EOCAD patients were tended to have a history of diabetes or hypertension, more current smoking, and more use of lipid lowering drugs. Levels of total cholesterol, LDL-c, FPG, HbA1c and triglycerides were significantly higher in the patients than in controls, while HDL-cholesterol, total adiponectin, HMW adiponectin, and HMW-total adiponectin ratio were significantly lower in the patients. EOCAD patients developed different degrees of coronary atherosclerosis, and had significantly higher levels of high-sensitivity CRP and larger circumferences of waist and hip than controls.

Spearman correlation coefficients between selected cardiovascular risk factors, Gensini score and adiponectin were significant. Total and HMW adiponectin and HMW-total adiponectin ratio were all inversely correlated with Gensini score, BMI and pack years of cigarette smoking. Total and HMW adiponectin were negatively associated with triglycerides and circumference of waist and hip. LDL-cholesterol and high-sensitivity CRP were inversely correlated with HMW adiponectin and HMW-total adiponectin ratio, while HDL-cholesterol and age were positively correlated with them. FPG was only inversely associated with HMW-total adiponectin ratio.

All participants were divided into four groups according to their Gensini score, group A (control, n = 305), group B (<20, n = 154), group C (20-40, n = 121) and group D (>40, n = 105). With the increasing of Gensini score, a stepwise downward trend was observed in levels of total and HMW adiponectin and HMW-total adiponectin ratio (P < 0.001). Specifically, total adiponectin of four groups were 1.58 (0.61-4.36) mg/ml, 1.21 (0.70-2.83) mg/ml, 1.00 (0.73-1.88) mg/ml, and 0.76 (0.37-1.19) mg/ml, respectively. Except group A with B and group B with C, the differences of pairwise comparisons among all the other groups were statistically significant (all P < 0.05). HMW adiponectin of four groups were 0.91 (0.39-3.26) mg/ml, 0.55 (0.32-1.49) mg/ml, 0.46 (0.21-0.876) mg/ml, and 0.23 (0.14-0.39) mg/ml, respectively. The differences of pairwise comparisons among all the other groups were statistically significant (all P < 0.05) except group B with C. HMW-total adiponectin ratio of four groups were 0.58 (0.31-0.81), 0.47 (0.26-0.69), 0.41 (0.24-0.57), and 0.36 (0.21-0.42), respectively. The differences of pairwise comparisons among all the other groups were statistically significant (all P < 0.05) except group B with C. In the model of multivariate binary logistic regression analysis, after adjustment for conventional cardiovascular risk factors, HMW adiponectin (OR = 0.234, P < 0.011) and HMW-total adiponectin ratio (OR = 0.138, P < 0.005) remained inversely correlated with the risk of CAD, while no significant association was observed between total adiponectin and CAD

Areas under the ROC curves were compared pairwise to identify the diagnostic power for CAD among total adiponectin, HMW adiponectin, and HMW-total adiponectin ratio. HMW adiponectin and HMW-total adiponectin ratio showed greater capability for identifying CAD than total adiponectin did (0.797 vs. 0.674, 0.806 vs. 0.674; respectively, all P < 0.05); however, no significant difference was observed between HMW and HMW-total ratio (P > 0.05).

Associations between total adiponectin, HMW adiponectin, HMW-total adiponectin ratio and the severity of coronary atherosclerosis

Associations between total adiponectin, HMW adiponectin, HMW-total adiponectin ratio and the severity of coronary atherosclerosis in EOCAD patients (evaluated by Gensini score). *P < 0.05; **P < 0.001; ***P < 0.005 by Mann-Whitney U test.

Compares diagnostic power

Compares diagnostic power

Fig. Compares diagnostic power among total adiponectin, HMW adiponectin and HMW-total adiponectin ratio for CAD by ROC curves. Diagnostic power for CAD was based on discriminating patients with or without coronary atherosclerosis. The area under the curve for HMW-total adiponectin ratio (dotted black line) was larger than that for total adiponectin (fine black line) (0.806 [95%CI 0.708-0.903] vs. 0.674 [95%CI 0.552-0.797], P < 0.05) and HMW adiponectin (bold black line) (0.806 [95%CI 0.708-0.903] vs. 0.797 [95%CI 0.706-0.888], no statistically difference). Sensitivity, specificity and optimal cut off value for them were total adiponectin (57.38%, 75.86%, 1.11 mg/ml), HMW (55.74%, 93.1%, 0.49 mg/ml) and H/T (78.69%, 75.86%, 0.52), respectively.

There are two strengths in our study. One is the precise Gensini scoring system to carefully evaluate stenosis of coronary artery or branches > 0% diameter as coronary lesion, another is the specific study subjects of EOCAD in a Chinese Han population that is particularly genetically determined and not influenced by racial/ethnic disparities. The limitations of our study lie in the interference of medications such as the effect of lipid lowering drugs on the levels of adiponectin, and cardiovascular risk factors. Smoking is a conventional cardiovascular risk factor, whose interaction with HMW adiponectin level is rarely investigated, but it has been revealed to be associated with HMW adiponectin level in men according to the study from Kawamoto R et al. We did not adjust the result for the pack/year variable in the multivariate logistic regression analysis for the limitation of small sample size of male subjects in our study. The relatively small study sample also restrained our conclusion generalizable to all populations. Future researches in larger study samples and different populations are in need to validate our findings, and to explore the association of smoking with adiponectin in male subgroup analysis, and to investigate the potential mechanisms by which adiponectin affects the progression of coronary atherosclerosis.

In summary, the present study has demonstrated that adiponectin is protective against coronary atherosclerosis onset in EOCAD patients. HMW adiponectin and HMW-total adiponectin ratio show stronger negative associations with the severity of coronary atherosclerosis than total adiponectin does. HMW adiponectin and HMW-total adiponectin ratio are more effective biomarkers for the risk of CAD than total adiponectin.

Berberis aristata combined with Silybum marianum on lipid profile in patients not tolerating statins at high doses

Giuseppe Derosa, Davide Romano, Angela D’Angelo, Pamela Maffioli
Atherosclerosis 239 (2015) 87-92
http://dx.doi.org/10.1016/j.atherosclerosis.2014.12.043

Aim: To evaluate the effects of Berberis aristata combined with Silybum marianum in dyslipidemic patients intolerant to statins at high doses.
Methods: 137 euglycemic, dyslipidemic subjects, with previous adverse events to statins at high doses, were enrolled. Statins were stopped for 1 month (run-in), then they were re-introduced at the half of the previously taken dose. At randomization, patients tolerating the half dose of statin, were assigned to
add placebo or B. aristata/S. marianum 588/105 mg, 1 tablet during the lunch and 1 tablet during the dinner, for six months. We evaluated lipid profile and safety parameters variation at randomization, and after 3, and 6 months.
Results: B. aristata/S. marianum reduced fasting plasma glucose (-9 mg/dl), insulin (-0.7 mU/ml), and HOMA-index (-0.35) levels compared to baseline and also to placebo. Lipid profile did not significantly change after 6 months since the reduction of statin dosage and the introduction of B. aristata/S. marianum, while it worsened in the placebo group both compared to placebo and with active treatment (+23.4 mg/dl for total cholesterol, +19.6 mg/dl for LDL-cholesterol, +23.1 mg/dl for triglycerides with placebo compared to B. aristata/S. marianum). We did not record any variations of safety parameters
in either group. Conclusions: B. aristata/S. marianum can be considered as addition to statins in patients not tolerating high dose of these drugs.

Statins, also known as 3-hydroxy-3-methylglutaryl-coenzyme A (HMG-CoA) reductase inhibitors, are effective medications for reducing the risk of death and future cardiovascular disease. In the latest years, however, statin intolerance (including adverse effects related to quality of life, leading to decisions to decrease or stop the use of an otherwise-beneficial drug) has come to the forefront of clinical concern, whereas the safety of statins has come to be regarded as largely favorable. Statin intolerance is defined as any adverse symptoms, signs, or laboratory abnormalities attributed by the patient or physician to the statin and in most cases perceived by the patient to interfere unacceptably with activities of daily living, leading to a decision to stop or reduce statin therapy. The physician might also decide to stop or reduce statin therapy on the basis of clinical/laboratory assessment [abnormal liver function tests, creatine phosphokinase values (CPK)] suggesting undue risk. Adverse events are more common at higher doses of statins, and often contribute to patients low adherence to treatment. For this reason, researchers are testing alternative strategies for lipid treatment when statin intolerance is recognized. One strategy to reduce the risk of statin-induced adverse events includes using a low-dose of statin combined with nonstatin drugs in order to achieve the goals of therapy. Nonstatin drugs include nutraceuticals; in the latest years relatively large number of dietary supplements and nutraceuticals have been studied for their supposed or demonstrated ability to reduce cholesterolemia in humans, in particular Berberis Aristata, has been studied in randomized clinical trials and proved to be effective in improving lipid profile. In particular, B. aristata acts up-regulating LDL-receptor (LDL-R) expression independent of sterol regulatory element binding proteins, but dependent on extracellular signal-regulated kinases (ERK) and c-Jun N-terminal kinase (JNK) activation leading to total cholesterol (TC) and LDL-C reduction of about 30 and 25%, respectively. Hwever, B. aristata is a problem in terms of oral bioavailability, affected by a P-glycoprotein (P-gp) mediated gut extrusion process. P-gp seems to reduce by about 90% the amount of B. aristata able to cross the enterocytes, but the use of a potential P-gp inhibitor could ameliorate its oral poor bioavailability improving its effectiveness. Among the potential Pgp inhibitors, silymarin from S. marianum, an herbal drug used as liver protectant, could be considered a good candidate due to its high safety profile.

Analyzing the results of our study, it can appear, at a first glance, that B. aristata/S. marianum has a neutral effect of lipid profile that did not change during the study after the addition of the nutraceutical combination. This lack of effect, however, is only apparent, because, when we analyzed what happens in placebo group, we observed a worsening of lipid profile after statin dose reduction. In other words, the addition of B. aristata/S. marianum neutralized the worsening of lipid profile observed with placebo after statins dose reduction. These results are in line with what was reported by Kong et al., who evaluated the effects of a combination of berberine and simvastatin in sixty-three outpatients diagnosed with hypercholesterolemia. As compared with monotherapies, the combination showed an improved lipid lowering effect with 31.8% reduction of serum LDL-C, and similar efficacies were observed in the reduction of TC as well as Tg in patients. Considering the results of this study, B. aristata/S. marianum can be considered as addition to statins in patients not tolerating high dose of these drugs.

CETP inhibitors downregulate hepatic LDL receptor and PCSK9 expression in vitro and in vivo through a SREBP2 dependent mechanism

Bin Dong, Amar Bahadur Singh, Chin Fung, Kelvin Kan, Jingwen Liu
Atherosclerosis 235 (2014) 449-462
http://dx.doi.org/10.1016/j.atherosclerosis.2014.05.931

Background: CETP inhibitors block the transfer of cholesteryl ester from HDL-C to VLDL-C and LDL-C, thereby raising HDL-C and lowering LDL-C. In this study, we explored the effect of CETP inhibitors on hepatic LDL receptor (LDLR) and PCSK9 expression and further elucidated the underlying regulatory mechanism. Results: We first examined the effect of anacetrapib (ANA) and dalcetrapib (DAL) on LDLR and PCSK9 expression in hepatic cells in vitro. ANA exhibited a dose-dependent inhibition on both LDLR and PCSK9 expression in CETP-positive HepG2 cells and human primary hepatocytes as well as CETP-negative mouse primary hepatocytes (MPH). Moreover, the induction of LDLR protein expression by rosuvastatin in MPH was blunted by cotreatment with ANA. In both HepG2 and MPH ANA treatment reduced the amount of mature form of SREBP2 (SREBP2-M). In vivo, oral administration of ANA to dyslipidemic C57BL/6J mice at a daily dose of 50 mg/kg for 1 week elevated serum total cholesterol by approximately 24.5% (p < 0.05%) and VLDL-C by 70% (p < 0.05%) with concomitant reductions of serum PCSK9 and liver LDLR/SREBP2-M protein. Finally, we examined the in vitro effect of two other strong CETP inhibitors evacetrapib and torcetrapib on LDLR/PCSK9 expression and observed a similar inhibitory effect as ANA in a concentration range of 1-10 µM. Conclusion: Our study revealed an unexpected off-target effect of CETP inhibitors that reduce the mature form of SREBP2, leading to attenuated transcription of hepatic LDLR and PCSK9. This negative regulation of SREBP pathway by ANA manifested in mice where CETP activity was absent and affected serum cholesterol metabolism.

Effect of Eclipta prostrata on lipid metabolism in hyperlipidemic animals

Yun Zhao, Lu Peng, Wei Lu, Yiqing Wang, Xuefeng Huang, et al.
Experimental Gerontology 62 (2015) 37–44
http://dx.doi.org/10.1016/j.exger.2014.12.017

Eclipta prostrata (Linn.) Linn. is a traditional Chinese medicine and has previously been reported to have hypolipidemic effects. However, its mechanism of action is not well understood. This study was conducted to identify the active fraction of Eclipta, its toxicity, its effect on hyperlipidemia, and its mechanism of action. The ethanol extract (EP) of Eclipta and fractions EPF1–EPF4, obtained by eluting with different concentrations of ethanol from a HPD-450 macroporous resin column chromatography of the EP, were screened in hyperlipidemic mice for lipid lowering activity, and EPF3 was the most active fraction. The LD50 of EPF3 was undetectable because no mice died with administration of EPF3 at 10.4 g/kg. Then, 48 male hamsters were used and randomly assigned to normal chow diet, high-fat diet, high-fat diet with Xuezhikang (positive control) or EPF3 (75, 150 and 250 mg/kg) groups. We evaluated the effects of EPF3 on body weight gain, liver weight gain, serum lipid concentration, antioxidant enzyme activity, and the expression of genes involved in lipid metabolism in hyperlipidemic hamsters. The results showed that EPF3 significantly decreased body-weight gain and liver-weight gain and reduced the serum lipid levels in hyperlipidemic hamsters. EPF3 also increased the activities of antioxidant enzymes; upregulated the mRNA expression of peroxisome proliferator-activated receptor α (PPARα), low density lipoprotein receptor (LDLR), lecithin-cholesterol transferase (LCAT) and scavenger receptor class B type Ι receptor (SR-BI); and down-regulated the mRNA expression of 3-hydroxy-3-methyl-glutaryl-CoA reductase (HMGR) in the liver. These results indicate that EPF3 ameliorates hyperlipidemia, in part, by reducing oxidative stress and modulating the transcription of genes involved in lipid metabolism.

Although Eclipta has long been used as a food additive, no studies or reports have clearly shown any liver or kidney toxicity from its use. Therefore, E. prostrata is safe and beneficial for preventing hyperlipidemia in experimental animals and can be used as an alternative medicine for the regulation of dyslipidemia.

Effect of high fiber products on blood lipids and lipoproteins in hamsters

HE Martinez-Floresa, Y Kil Chang, F Martinez-Bustosc, V Sgarbieri
Nutrition Research 24 (2004) 85–93
http://dx.doi.org:/10.1016/S0271-5317(03)00206-9

Serum and liver lipidemic responses in hamsters fed diets containing 2% cholesterol and different dietary fiber sources were studied. The following diets were made from: a) the control diet made from extruded cassava starch (CSH) contained 9.3% cellulose, b) cassava starch extruded with 9.7% resistant starch (CS-RS), c) cassava starch extruded with 9.9% oat fiber (CS-OF), d) the reference diet contained 9.5% cellulose, and no cholesterol was added. Total cholesterol, LDLVLDL-cholesterol and triglycerides were significantly lower (P < 0.05) in serum of hamsters fed on the CS-RS (17.87%, 62.92% and 9.17%, respectively) and CS-OF (15.12%, 67.41% and 18.35%, respectively) diets, as compared to hamster fed with the CSH diet. Similar results were found in the livers of hamsters fed on the CS-RS and CS-OF diets, as compared to hamsters fed with the CSH diet. The diets containing these fibers could be used as active ingredients in human diets to improve the human health.

A new piece in the puzzling effect of n-3 fatty acids on atherosclerosis?

Wilfried Le Goff
Atherosclerosis 235 (2014) 358-362
http://dx.doi.org/10.1016/j.atherosclerosis.2014.03.038

Omega-3 fatty acids (ω-3) FA are reported to be protective against cardiovascular disease (CVD), notably through their beneficial action on atherosclerosis development. In this context dietary intake of long chain marine eicosapentaenoic acid (EPA) and docosahexaenoic acid (DHA) is recommended and randomised trials largely support that EPA and DHA intake is associated with a reduction of CVD. However, mechanisms governing the atheroprotective action of ω-3 FA are still unclear and numerous studies using mouse models conducted so far do not allow to reach a precise view of the cellular and molecular effects of ω-3 FA on atherosclerosis. In the current issue of Atherosclerosis, Chang et al. provide important new information on the anti-atherogenic properties of ω-3 FA by analyzing the incremental replacement of saturated FA by pure fish oil as a source of EPA and DHA in Ldlr -/- mice fed a high fat/high cholesterol diet.

Cardiovascular disease (CVD) is the leading causes of death in the world and is frequently associated with atherosclerosis, a pathology characterized by the accumulation of lipids, mainly cholesterol in the arterial wall. Among major risk factors for CVD, circulating levels of lipids and more especially those originating from diets are closely linked to development of atherosclerosis. In this context, not only cholesterol, but also dietary fatty acids (FA) may appear particularly deleterious in regards to atherosclerosis and associated CVD. However, although saturated fats are proatherogenic, omega-3 fatty acids (ω-3 FA), and more especially long-chain marine eicosapentaenoic acid (EPA) and docosahexaenoic acid (DHA), exert atheroprotective properties through several potential underlying mechanisms. Therefore, the intake of EPA and DHA is recommended around the world and randomised trials with ω-3 FA confirmed that EPA and DHA intake reduced risk for CVD events. However benefits of ω-3 FA intake were challenged by recent clinical trials that failed to replicate protective effects of EPA + DHA on CVD, raising the controversy on the healthy side of marine ω-3 FA.

Animal models are commonly employed in order to decipher mechanisms by which ω-3 FA exert their beneficial actions regarding lipid metabolism and atherosclerosis. Since the last past 20 years, mouse models, and more especially genetically modified mouse models, became the reference model to evaluate the effects of dietary fatty acids, especially ω-3 FA, on atherosclerosis development [7-20]. However, the use of different mouse models of atherosclerosis (Apoe-/-, Ldlr-/-, double Apoe-/- x Ldlr-/- , Ldlr-/- x hApoB mice), as well as diet composition (chow, high cholesterol, high fat, high cholesterol/high fat), source of ω-3 FA supplementation (fish oil, perilla seed oil, flaxseed, pure ALA, EPA or DHA), duration of the diet (from 4 to 32 weeks), size of atherosclerotic lesions in control animals (from 51 to 700.103 mm2) in

those studies led to heterogeneous results and therefore to a partial understanding of the effects of ω-3 FA on atherosclerosis.

Contrary to what observed in Apoe-/- mice, dietary supplementation of Ldlr-/- mice with ω-3 FA led to a reproducible reduction of aortic atherosclerosis, although to various degrees, confirming that Ldlr-/- mice constitute the most appropriate model for studying the atheroprotective effects of ω-3 FA. When evaluated, the decrease of atherosclerosis upon ω-3 FA-rich diet was accompanied by a reduction in the macrophage content as well as inflammation in aortic lesions highlighting the major impact of ω-3 FA on monocyte recruitment and subsequent macrophage accumulation in the arterial wall. However, although supplementation with ω-3 FA allows an efficacious lowering of plasma lipid levels in humans, studies in mouse models suggest that the antiatherogenic action of ω-3 FA is independent of any effects on plasma cholesterol or triglyceride levels. However, that must be asserted with caution as lipid metabolism is quite different in mouse in comparison to humans, highlighting the need to study in the future the effects of ω-3 FA on atherosclerosis in a mouse model exhibiting a more “humanized” lipid metabolism as achieved in hApoB/CETP mice.

In a previous issue of Atherosclerosis, Chang et al. reevaluate the impact of fish oil ω-3 FA on atherosclerosis development by operating an incremental replacement of saturated fats (SAT) by ω-3 FA (pure fish oil, EPA- and DHA-rich) in Ldlr-/- mice fed a high-fat (21%, w/w)/high-cholesterol (0.2%, w/w) diet for a 12-week period. This experimental approach is quite pertinent as dietary fat intake in developed countries, as in United States, derived mostly from saturated FA and is poor in ω-3 FA. Then, using this strategy the authors were able to evaluate the potential beneficial effects of a supplementation with fish oil ω-3 FA in a dietary context for which ω-3 FA intake is relevant.

Here, Chang et al. demonstrated that the progressive increase of dietary intake of fish oil ω-3 FA (EPA and DHA) abrogated the deleterious effects of a SAT diet, thereby suggesting that a dietary ω-3 FA intake on a SAT background is potentially efficient to decrease CVD in humans. Indeed, replacement of SAT by fish oil ω-3 FA markedly reduced plasma cholesterol and triglycerides levels and abolished diet-induced atherosclerosis mediated by SAT in Ldlr-/-mice. To note that in the present study, Ldlr-/- mice only developed small atherosclerosic lesions (~100.103 mm2) after 12 weeks of diet with SAT.

As previously reported, decreased atherosclerotic lesions were accompanied by a reduced content of aortic macrophages and inflammation. Based on their previous works, the authors proposed that the reduction of atherosclerosis upon ω-3 FA resulted from an impairment of cholesterol uptake by arterial macrophages consecutive to the decrease of Lipoprotein Lipase (LPL) expression in those cells. Indeed, beyond its lipolysis action on triglycerides, LPL was reported to promote lipid accumulation, in particular in macrophages, by binding to lipoproteins and cell surface proteoglycans and then acting as a bridging molecule that facilitates cellular lipid uptake. Coherent with this mechanism, macrophage LPL expression was reported to promote foam cell formation and atherosclerosis. In the present study, replacement of SAT by ω-3 FA both decreased expression and altered distribution of arterial LPL. Such a mechanism for ω-3 FA (EPA and DHA) was proposed by this group in earlier studies to favor reduction of arterial LDL-cholesterol. It is noteworthy that lipid rafts alter distribution of LPL at the cell surface and subsequently the LPL dependent accumulation of lipids in macrophages and foam cell formation. As incorporation of ω-3 FA, such as DHA, into cell membrane phospholipids disrupts lipid rafts organization, it cannot be exclude that reduction of lipid accumulation in arterial macrophages upon addition of ω-3 FA results in part from an impairment of the localization and of the anchoring function of LPL at the cell surface of macrophages. Indeed Chang et al. observed that progressive replacement of SAT by ω-3 FA affected aortic FA composition leading to a pronounced increase of arterial EPA and DHA, then suggesting that content of ω-3 FA in macrophage membrane may be equally altered. However, the implication of LPL in the atheroprotective effects of ω-3 FA need to be validated using an appropriate mouse model for which LPL expression may be controlled.

Among the various mechanisms by which ω-3 FA exert anti-inflammatory properties, EPA and DHA repressed inflammation by shutting down NF-kB activation in macrophages. Since expression of TLR-4 and NF-kB target genes, IL-6 and TNFα, in aorta from mice fed diets containing ω-3 FA were decreased when compared to SAT, those results strongly support the contention that ω-3 FA repress inflammation by inhibiting the TLR4/NF-kB signaling cascade likely through the macrophage ω-3 FA receptor GPR120.

Although further studies are needed to explore the complete spectrum of actions of ω-3 FA on atherosclerosis development and CVD, this study provides important information that supports that ω-3 FA intake is a pertinent strategy to reduce risk of CVD.

Effects of dietary hull-less barley β-glucan on the cholesterol metabolism of hypercholesterolemic hamsters

Li-Tao Tong, Kui Zhong, Liya Liu, Xianrong Zhou, Ju Qiu, Sumei Zhou
Food Chemistry 169 (2015) 344–349
http://dx.doi.org/10.1016/j.foodchem.2014.07.157

The aim of the present study is to investigate the hypocholesterolemic effects of dietary hull-less barley β-glucan (HBG) on cholesterol metabolism in hamsters which were fed a hypercholesterolemic diet. The hamsters were divided into 3 groups and fed experimental diets, containing 5‰ HBG or 5‰ oat β-glucan (OG), for 30 days. The HBG, as well as OG, lowered the concentration of plasma LDL-cholesterol significantly. The excretion of total lipids and cholesterol in feces were increased in HBG and OG groups compared with the control group. The activity of 3-hydroxy-3-methyl glutaryl-coenzyme A (HMG-CoA) reductase in liver was reduced significantly in the HBG group compared with the control and OG groups. The activity of cholesterol 7-α hydroxylase (CYP7A1) in the liver, in the HBG and OG groups, was significantly increased compared with the control group. The concentrations of acetate, propionate and total short chain fatty acids (SCFAs) were not significantly different between the HBG and control groups. These results indicate that dietary HBG reduces the concentration of plasma LDL cholesterol by promoting the excretion of fecal lipids, and regulating the activities of HMG-CoA reductase and CYP7A1 in hypercholesterolemic hamsters.

Effects of dietary wheat bran arabinoxylans on cholesterolmetabolism of hypercholesterolemic hamsters

Li-Tao Tong, Kui Zhong, Liya Liu, Ju Qiu, Lina Guo, et al.
Carbohydrate Polymers 112 (2014) 1–5
http://dx.doi.org/10.1016/j.carbpol.2014.05.061

The aim of the present study is to investigate the effects of dietary wheat bran arabinoxylans (AXs) on cholesterol metabolism in hypercholesterolemic hamsters. The hamsters were divided into 3 groups and fed the experimental diets containing AXs or oat β-glucan at a dose of 5 g/kg for 30 days. As the results,the AXs lowered plasma total cholesterol and LDL-cholesterol concentrations, and increased excretions of total lipids, cholesterol and bile acids, as well as oat β-glucan. The AXs reduced the activity of 3-hydroxy-3-methyl glutaryl-coenzyme A (HMG-CoA) reductase, and increased the activity of cholesterol 7-α hydroxylase (CYP7A1) in liver. Moreover, the AXs increased propionate and the total short-chain fatty acids (SCFAs) concentrations. These results indicated that dietary AXs reduced the plasma total cholesterol and LDL-cholesterol concentrations by promoting the excretion of fecal lipids, regulating the activities of HMG-CoA reductase and CYP7A1, and increasing colonic SCFAs in hamsters.

High-fructose feeding promotes accelerated degradation of hepatic LDL receptor and hypercholesterolemia in hamsters via elevated circulating PCSK9 levels

Bin Dong, Amar Bahadur Singh, Salman Azhar, Nabil G. Seidah, Jingwen Liu
Atherosclerosis 239 (2015) 364-374
http://dx.doi.org/10.1016/j.atherosclerosis.2015.01.013

Background: High fructose diet (HFD) induces dyslipidemia and insulin resistance in experimental animals and humans with incomplete mechanistic understanding. By utilizing mice and hamsters as in vivo models, we investigated whether high fructose consumption affects serum PCSK9 and liver LDL receptor (LDLR) protein levels. Results: Feeding mice with an HFD increased serum cholesterol and reduced serum PCSK9 levels as compared with the mice fed a normal chow diet (NCD). In contrast to the inverse relationship in mice, serum PCSK9 and cholesterol levels were co-elevated in HFD-fed hamsters. Liver tissue analysis revealed that PCSK9 mRNA and protein levels were both reduced in mice and hamsters by HFD feeding, however, liver LDLR protein levels were markedly reduced by HFD in hamsters but not in mice. We further showed that circulating PCSK9 clearance rates were significantly lower in hamsters fed an HFD as compared with the hamsters fed NCD, providing additional evidence for the reduced hepatic LDLR function by HFD consumption. The majority of PCSK9 in hamster serum was detected as a 53 kDa N-terminus cleaved protein. By conducting in vitro studies, we demonstrate that this 53 kDa truncated hamster PCSK9 is functionally active in promoting hepatic LDLR degradation. Conclusion: Our studies for the first time demonstrate that high fructose consumption increases serum PCSK9 concentrations and reduces liver LDLR protein levels in hyper-lipidemic hamsters. The positive correlation between circulating cholesterol and PCSK9 and the reduction of liver LDLR protein in HFD-fed hamsters suggest that hamster is a better animal model than mouse to study the modulation of PCSK9/LDLR pathway by atherogenic diets.

High-oleic canola oil consumption enriches LDL particle cholesteryl oleate content and reduces LDL proteoglycan binding in humans

Peter J.H. Jones, Dylan S. MacKay, Vijitha K. Senanayake, Shuaihua Pu, et al.
Atherosclerosis 238 (2015) 231-238
http://dx.doi.org/10.1016/j.atherosclerosis.2014.12.010

Oleic acid consumption is considered cardio-protective according to studies conducted examining effects of the Mediterranean diet. However, animal models have shown that oleic acid consumption increases LDL particle cholesteryl oleate content which is associated with increased LDL-proteoglycan binding and atherosclerosis. The objective was to examine effects of varying oleic, linoleic and docosahexaenoic acid consumption on human LDL-proteoglycan binding in a non-random subset of the Canola Oil Multi-center Intervention Trial (COMIT) participants. COMIT employed a randomized, double-blind, five-period, crossover trial design. Three of the treatment oil diets: 1) a blend of corn/safflower oil (25:75); 2) high oleic canola oil; and 3) DHA-enriched high oleic canola oil were selected for analysis of LDL-proteoglycan binding in 50 participants exhibiting good compliance. LDL particles were isolated from frozen plasma by gel filtration chromatography and LDL cholesteryl esters quantified by mass-spectrometry. LDL-proteoglycan binding was assessed using surface plasmon resonance. LDL particle cholesterol ester fatty acid composition was sensitive to the treatment fatty acid compositions, with the main fatty acids in the treatments increasing in the LDL cholesterol esters. The corn/safflower oil and high-oleic canola oil diets lowered LDL-proteoglycan binding relative to their baseline values (p < 0.0005 and p < 0.0012, respectively). At endpoint, high-oleic canola oil feeding resulted in lower LDL-proteoglycan binding than corn/safflower oil (p < 0.0243) and DHA-enriched high oleic canola oil (p < 0.0249), although high-oleic canola oil had the lowest binding at baseline (p < 0.0344). Our findings suggest that high-oleic canola oil consumption in humans increases cholesteryl oleate percentage in LDL, but in a manner not associated with a rise in LDL-proteoglycan binding.

Read Full Post »

Summary and Perspectives: Impairments in Pathological States: Endocrine Disorders, Stress Hypermetabolism and Cancer

Summary and Perspectives: Impairments in Pathological States: Endocrine Disorders, Stress Hypermetabolism and Cancer

Author and Curator: Larry H. Bernstein, MD, FCAP

Article ID #160: Summary and Perspectives: Impairments in Pathological States: Endocrine Disorders, Stress Hypermetabolism and Cancer. Published on 11/9/2014

WordCloud Image Produced by Adam Tubman

This summary is the last of a series on the impact of transcriptomics, proteomics, and metabolomics on disease investigation, and the sorting and integration of genomic signatures and metabolic signatures to explain phenotypic relationships in variability and individuality of response to disease expression and how this leads to  pharmaceutical discovery and personalized medicine.  We have unquestionably better tools at our disposal than has ever existed in the history of mankind, and an enormous knowledge-base that has to be accessed.  I shall conclude here these discussions with the powerful contribution to and current knowledge pertaining to biochemistry, metabolism, protein-interactions, signaling, and the application of the -OMICS to diseases and drug discovery at this time.

The Ever-Transcendent Cell

Deriving physiologic first principles By John S. Torday | The Scientist Nov 1, 2014
http://www.the-scientist.com/?articles.view/articleNo/41282/title/The-Ever-Transcendent-Cell/

Both the developmental and phylogenetic histories of an organism describe the evolution of physiology—the complex of metabolic pathways that govern the function of an organism as a whole. The necessity of establishing and maintaining homeostatic mechanisms began at the cellular level, with the very first cells, and homeostasis provides the underlying selection pressure fueling evolution.

While the events leading to the formation of the first functioning cell are debatable, a critical one was certainly the formation of simple lipid-enclosed vesicles, which provided a protected space for the evolution of metabolic pathways. Protocells evolved from a common ancestor that experienced environmental stresses early in the history of cellular development, such as acidic ocean conditions and low atmospheric oxygen levels, which shaped the evolution of metabolism.

The reduction of evolution to cell biology may answer the perennially unresolved question of why organisms return to their unicellular origins during the life cycle.

As primitive protocells evolved to form prokaryotes and, much later, eukaryotes, changes to the cell membrane occurred that were critical to the maintenance of chemiosmosis, the generation of bioenergy through the partitioning of ions. The incorporation of cholesterol into the plasma membrane surrounding primitive eukaryotic cells marked the beginning of their differentiation from prokaryotes. Cholesterol imparted more fluidity to eukaryotic cell membranes, enhancing functionality by increasing motility and endocytosis. Membrane deformability also allowed for increased gas exchange.

Acidification of the oceans by atmospheric carbon dioxide generated high intracellular calcium ion concentrations in primitive aquatic eukaryotes, which had to be lowered to prevent toxic effects, namely the aggregation of nucleotides, proteins, and lipids. The early cells achieved this by the evolution of calcium channels composed of cholesterol embedded within the cell’s plasma membrane, and of internal membranes, such as that of the endoplasmic reticulum, peroxisomes, and other cytoplasmic organelles, which hosted intracellular chemiosmosis and helped regulate calcium.

As eukaryotes thrived, they experienced increasingly competitive pressure for metabolic efficiency. Engulfed bacteria, assimilated as mitochondria, provided more bioenergy. As the evolution of eukaryotic organisms progressed, metabolic cooperation evolved, perhaps to enable competition with biofilm-forming, quorum-sensing prokaryotes. The subsequent appearance of multicellular eukaryotes expressing cellular growth factors and their respective receptors facilitated cell-cell signaling, forming the basis for an explosion of multicellular eukaryote evolution, culminating in the metazoans.

Casting a cellular perspective on evolution highlights the integration of genotype and phenotype. Starting from the protocell membrane, the functional homolog for all complex metazoan organs, it offers a way of experimentally determining the role of genes that fostered evolution based on the ontogeny and phylogeny of cellular processes that can be traced back, in some cases, to our last universal common ancestor.  ….

As eukaryotes thrived, they experienced increasingly competitive pressure for metabolic efficiency. Engulfed bacteria, assimilated as mitochondria, provided more bioenergy. As the evolution of eukaryotic organisms progressed, metabolic cooperation evolved, perhaps to enable competition with biofilm-forming, quorum-sensing prokaryotes. The subsequent appearance of multicellular eukaryotes expressing cellular growth factors and their respective receptors facilitated cell-cell signaling, forming the basis for an explosion of multicellular eukaryote evolution, culminating in the metazoans.

Casting a cellular perspective on evolution highlights the integration of genotype and phenotype. Starting from the protocell membrane, the functional homolog for all complex metazoan organs, it offers a way of experimentally determining the role of genes that fostered evolution based on the ontogeny and phylogeny of cellular processes that can be traced back, in some cases, to our last universal common ancestor.

Given that the unicellular toolkit is complete with all the traits necessary for forming multicellular organisms (Science, 301:361-63, 2003), it is distinctly possible that metazoans are merely permutations of the unicellular body plan. That scenario would clarify a lot of puzzling biology: molecular commonalities between the skin, lung, gut, and brain that affect physiology and pathophysiology exist because the cell membranes of unicellular organisms perform the equivalents of these tissue functions, and the existence of pleiotropy—one gene affecting many phenotypes—may be a consequence of the common unicellular source for all complex biologic traits.  …

The cell-molecular homeostatic model for evolution and stability addresses how the external environment generates homeostasis developmentally at the cellular level. It also determines homeostatic set points in adaptation to the environment through specific effectors, such as growth factors and their receptors, second messengers, inflammatory mediators, crossover mutations, and gene duplications. This is a highly mechanistic, heritable, plastic process that lends itself to understanding evolution at the cellular, tissue, organ, system, and population levels, mediated by physiologically linked mechanisms throughout, without having to invoke random, chance mechanisms to bridge different scales of evolutionary change. In other words, it is an integrated mechanism that can often be traced all the way back to its unicellular origins.

The switch from swim bladder to lung as vertebrates moved from water to land is proof of principle that stress-induced evolution in metazoans can be understood from changes at the cellular level.

http://www.the-scientist.com/Nov2014/TE_21.jpg

A MECHANISTIC BASIS FOR LUNG DEVELOPMENT: Stress from periodic atmospheric hypoxia (1) during vertebrate adaptation to land enhances positive selection of the stretch-regulated parathyroid hormone-related protein (PTHrP) in the pituitary and adrenal glands. In the pituitary (2), PTHrP signaling upregulates the release of adrenocorticotropic hormone (ACTH) (3), which stimulates the release of glucocorticoids (GC) by the adrenal gland (4). In the adrenal gland, PTHrP signaling also stimulates glucocorticoid production of adrenaline (5), which in turn affects the secretion of lung surfactant, the distension of alveoli, and the perfusion of alveolar capillaries (6). PTHrP signaling integrates the inflation and deflation of the alveoli with surfactant production and capillary perfusion.  THE SCIENTIST STAFF

From a cell-cell signaling perspective, two critical duplications in genes coding for cell-surface receptors occurred during this period of water-to-land transition—in the stretch-regulated parathyroid hormone-related protein (PTHrP) receptor gene and the β adrenergic (βA) receptor gene. These gene duplications can be disassembled by following their effects on vertebrate physiology backwards over phylogeny. PTHrP signaling is necessary for traits specifically relevant to land adaptation: calcification of bone, skin barrier formation, and the inflation and distention of lung alveoli. Microvascular shear stress in PTHrP-expressing organs such as bone, skin, kidney, and lung would have favored duplication of the PTHrP receptor, since sheer stress generates radical oxygen species (ROS) known to have this effect and PTHrP is a potent vasodilator, acting as an epistatic balancing selection for this constraint.

Positive selection for PTHrP signaling also evolved in the pituitary and adrenal cortex (see figure on this page), stimulating the secretion of ACTH and corticoids, respectively, in response to the stress of land adaptation. This cascade amplified adrenaline production by the adrenal medulla, since corticoids passing through it enzymatically stimulate adrenaline synthesis. Positive selection for this functional trait may have resulted from hypoxic stress that arose during global episodes of atmospheric hypoxia over geologic time. Since hypoxia is the most potent physiologic stressor, such transient oxygen deficiencies would have been acutely alleviated by increasing adrenaline levels, which would have stimulated alveolar surfactant production, increasing gas exchange by facilitating the distension of the alveoli. Over time, increased alveolar distension would have generated more alveoli by stimulating PTHrP secretion, impelling evolution of the alveolar bed of the lung.

This scenario similarly explains βA receptor gene duplication, since increased density of the βA receptor within the alveolar walls was necessary for relieving another constraint during the evolution of the lung in adaptation to land: the bottleneck created by the existence of a common mechanism for blood pressure control in both the lung alveoli and the systemic blood pressure. The pulmonary vasculature was constrained by its ability to withstand the swings in pressure caused by the systemic perfusion necessary to sustain all the other vital organs. PTHrP is a potent vasodilator, subserving the blood pressure constraint, but eventually the βA receptors evolved to coordinate blood pressure in both the lung and the periphery.

Gut Microbiome Heritability

Analyzing data from a large twin study, researchers have homed in on how host genetics can shape the gut microbiome.
By Tracy Vence | The Scientist Nov 6, 2014

Previous research suggested host genetic variation can influence microbial phenotype, but an analysis of data from a large twin study published in Cell today (November 6) solidifies the connection between human genotype and the composition of the gut microbiome. Studying more than 1,000 fecal samples from 416 monozygotic and dizygotic twin pairs, Cornell University’s Ruth Ley and her colleagues have homed in on one bacterial taxon, the family Christensenellaceae, as the most highly heritable group of microbes in the human gut. The researchers also found that Christensenellaceae—which was first described just two years ago—is central to a network of co-occurring heritable microbes that is associated with lean body mass index (BMI).  …

Of particular interest was the family Christensenellaceae, which was the most heritable taxon among those identified in the team’s analysis of fecal samples obtained from the TwinsUK study population.

While microbiologists had previously detected 16S rRNA sequences belonging to Christensenellaceae in the human microbiome, the family wasn’t named until 2012. “People hadn’t looked into it, partly because it didn’t have a name . . . it sort of flew under the radar,” said Ley.

Ley and her colleagues discovered that Christensenellaceae appears to be the hub in a network of co-occurring heritable taxa, which—among TwinsUK participants—was associated with low BMI. The researchers also found that Christensenellaceae had been found at greater abundance in low-BMI twins in older studies.

To interrogate the effects of Christensenellaceae on host metabolic phenotype, the Ley’s team introduced lean and obese human fecal samples into germ-free mice. They found animals that received lean fecal samples containing more Christensenellaceae showed reduced weight gain compared with their counterparts. And treatment of mice that had obesity-associated microbiomes with one member of the Christensenellaceae family, Christensenella minuta, led to reduced weight gain.   …

Ley and her colleagues are now focusing on the host alleles underlying the heritability of the gut microbiome. “We’re running a genome-wide association analysis to try to find genes—particular variants of genes—that might associate with higher levels of these highly heritable microbiota.  . . . Hopefully that will point us to possible reasons they’re heritable,” she said. “The genes will guide us toward understanding how these relationships are maintained between host genotype and microbiome composition.”

J.K. Goodrich et al., “Human genetics shape the gut microbiome,” Cell,  http://dx.doi.org:/10.1016/j.cell.2014.09.053, 2014.

Light-Operated Drugs

Scientists create a photosensitive pharmaceutical to target a glutamate receptor.
By Ruth Williams | The Scentist Nov 1, 2014
http://www.the-scientist.com/?articles.view/articleNo/41279/title/Light-Operated-Drugs/

light operated drugs MO1

light operated drugs MO1

http://www.the-scientist.com/Nov2014/MO1.jpg

The desire for temporal and spatial control of medications to minimize side effects and maximize benefits has inspired the development of light-controllable drugs, or optopharmacology. Early versions of such drugs have manipulated ion channels or protein-protein interactions, “but never, to my knowledge, G protein–coupled receptors [GPCRs], which are one of the most important pharmacological targets,” says Pau Gorostiza of the Institute for Bioengineering of Catalonia, in Barcelona.

Gorostiza has taken the first step toward filling that gap, creating a photosensitive inhibitor of the metabotropic glutamate 5 (mGlu5) receptor—a GPCR expressed in neurons and implicated in a number of neurological and psychiatric disorders. The new mGlu5 inhibitor—called alloswitch-1—is based on a known mGlu receptor inhibitor, but the simple addition of a light-responsive appendage, as had been done for other photosensitive drugs, wasn’t an option. The binding site on mGlu5 is “extremely tight,” explains Gorostiza, and would not accommodate a differently shaped molecule. Instead, alloswitch-1 has an intrinsic light-responsive element.

In a human cell line, the drug was active under dim light conditions, switched off by exposure to violet light, and switched back on by green light. When Gorostiza’s team administered alloswitch-1 to tadpoles, switching between violet and green light made the animals stop and start swimming, respectively.

The fact that alloswitch-1 is constitutively active and switched off by light is not ideal, says Gorostiza. “If you are thinking of therapy, then in principle you would prefer the opposite,” an “on” switch. Indeed, tweaks are required before alloswitch-1 could be a useful drug or research tool, says Stefan Herlitze, who studies ion channels at Ruhr-Universität Bochum in Germany. But, he adds, “as a proof of principle it is great.” (Nat Chem Biol, http://dx.doi.org:/10.1038/nchembio.1612, 2014)

Enhanced Enhancers

The recent discovery of super-enhancers may offer new drug targets for a range of diseases.
By Eric Olson | The Scientist Nov 1, 2014
http://www.the-scientist.com/?articles.view/articleNo/41281/title/Enhanced-Enhancers/

To understand disease processes, scientists often focus on unraveling how gene expression in disease-associated cells is altered. Increases or decreases in transcription—as dictated by a regulatory stretch of DNA called an enhancer, which serves as a binding site for transcription factors and associated proteins—can produce an aberrant composition of proteins, metabolites, and signaling molecules that drives pathologic states. Identifying the root causes of these changes may lead to new therapeutic approaches for many different diseases.

Although few therapies for human diseases aim to alter gene expression, the outstanding examples—including antiestrogens for hormone-positive breast cancer, antiandrogens for prostate cancer, and PPAR-γ agonists for type 2 diabetes—demonstrate the benefits that can be achieved through targeting gene-control mechanisms.  Now, thanks to recent papers from laboratories at MIT, Harvard, and the National Institutes of Health, researchers have a new, much bigger transcriptional target: large DNA regions known as super-enhancers or stretch-enhancers. Already, work on super-enhancers is providing insights into how gene-expression programs are established and maintained, and how they may go awry in disease.  Such research promises to open new avenues for discovering medicines for diseases where novel approaches are sorely needed.

Super-enhancers cover stretches of DNA that are 10- to 100-fold longer and about 10-fold less abundant in the genome than typical enhancer regions (Cell, 153:307-19, 2013). They also appear to bind a large percentage of the transcriptional machinery compared to typical enhancers, allowing them to better establish and enforce cell-type specific transcriptional programs (Cell, 153:320-34, 2013).

Super-enhancers are closely associated with genes that dictate cell identity, including those for cell-type–specific master regulatory transcription factors. This observation led to the intriguing hypothesis that cells with a pathologic identity, such as cancer cells, have an altered gene expression program driven by the loss, gain, or altered function of super-enhancers.

Sure enough, by mapping the genome-wide location of super-enhancers in several cancer cell lines and from patients’ tumor cells, we and others have demonstrated that genes located near super-enhancers are involved in processes that underlie tumorigenesis, such as cell proliferation, signaling, and apoptosis.

Super-enhancers cover stretches of DNA that are 10- to 100-fold longer and about 10-fold less abundant in the genome than typical enhancer regions.

Genome-wide association studies (GWAS) have found that disease- and trait-associated genetic variants often occur in greater numbers in super-enhancers (compared to typical enhancers) in cell types involved in the disease or trait of interest (Cell, 155:934-47, 2013). For example, an enrichment of fasting glucose–associated single nucleotide polymorphisms (SNPs) was found in the stretch-enhancers of pancreatic islet cells (PNAS, 110:17921-26, 2013). Given that some 90 percent of reported disease-associated SNPs are located in noncoding regions, super-enhancer maps may be extremely valuable in assigning functional significance to GWAS variants and identifying target pathways.

Because only 1 to 2 percent of active genes are physically linked to a super-enhancer, mapping the locations of super-enhancers can be used to pinpoint the small number of genes that may drive the biology of that cell. Differential super-enhancer maps that compare normal cells to diseased cells can be used to unravel the gene-control circuitry and identify new molecular targets, in much the same way that somatic mutations in tumor cells can point to oncogenic drivers in cancer. This approach is especially attractive in diseases for which an incomplete understanding of the pathogenic mechanisms has been a barrier to discovering effective new therapies.

Another therapeutic approach could be to disrupt the formation or function of super-enhancers by interfering with their associated protein components. This strategy could make it possible to downregulate multiple disease-associated genes through a single molecular intervention. A group of Boston-area researchers recently published support for this concept when they described inhibited expression of cancer-specific genes, leading to a decrease in cancer cell growth, by using a small molecule inhibitor to knock down a super-enhancer component called BRD4 (Cancer Cell, 24:777-90, 2013).  More recently, another group showed that expression of the RUNX1 transcription factor, involved in a form of T-cell leukemia, can be diminished by treating cells with an inhibitor of a transcriptional kinase that is present at the RUNX1 super-enhancer (Nature, 511:616-20, 2014).

Fungal effector Ecp6 outcompetes host immune receptor for chitin binding through intrachain LysM dimerization 
Andrea Sánchez-Vallet, et al.   eLife 2013;2:e00790 http://elifesciences.org/content/2/e00790#sthash.LnqVMJ9p.dpuf

LysM effector

LysM effector

http://img.scoop.it/ZniCRKQSvJOG18fHbb4p0Tl72eJkfbmt4t8yenImKBVvK0kTmF0xjctABnaLJIm9

While host immune receptors

  • detect pathogen-associated molecular patterns to activate immunity,
  • pathogens attempt to deregulate host immunity through secreted effectors.

Fungi employ LysM effectors to prevent

  • recognition of cell wall-derived chitin by host immune receptors

Structural analysis of the LysM effector Ecp6 of

  • the fungal tomato pathogen Cladosporium fulvum reveals
  • a novel mechanism for chitin binding,
  • mediated by intrachain LysM dimerization,

leading to a chitin-binding groove that is deeply buried in the effector protein.

This composite binding site involves

  • two of the three LysMs of Ecp6 and
  • mediates chitin binding with ultra-high (pM) affinity.

The remaining singular LysM domain of Ecp6 binds chitin with

  • low micromolar affinity but can nevertheless still perturb chitin-triggered immunity.

Conceivably, the perturbation by this LysM domain is not established through chitin sequestration but possibly through interference with the host immune receptor complex.

Mutated Genes in Schizophrenia Map to Brain Networks
From www.nih.gov –  Sep 3, 2013

Previous studies have shown that many people with schizophrenia have de novo, or new, genetic mutations. These misspellings in a gene’s DNA sequence

  • occur spontaneously and so aren’t shared by their close relatives.

Dr. Mary-Claire King of the University of Washington in Seattle and colleagues set out to

  • identify spontaneous genetic mutations in people with schizophrenia and
  • to assess where and when in the brain these misspelled genes are turned on, or expressed.

The study was funded in part by NIH’s National Institute of Mental Health (NIMH). The results were published in the August 1, 2013, issue of Cell.

The researchers sequenced the exomes (protein-coding DNA regions) of 399 people—105 with schizophrenia plus their unaffected parents and siblings. Gene variations
that were found in a person with schizophrenia but not in either parent were considered spontaneous.

The likelihood of having a spontaneous mutation was associated with

  • the age of the father in both affected and unaffected siblings.

Significantly more mutations were found in people

  • whose fathers were 33-45 years at the time of conception compared to 19-28 years.

Among people with schizophrenia, the scientists identified

  • 54 genes with spontaneous mutations
  • predicted to cause damage to the function of the protein they encode.

The researchers used newly available database resources that show

  • where in the brain and when during development genes are expressed.

The genes form an interconnected expression network with many more connections than

  • that of the genes with spontaneous damaging mutations in unaffected siblings.

The spontaneously mutated genes in people with schizophrenia

  • were expressed in the prefrontal cortex, a region in the front of the brain.

The genes are known to be involved in important pathways in brain development. Fifty of these genes were active

  • mainly during the period of fetal development.

“Processes critical for the brain’s development can be revealed by the mutations that disrupt them,” King says. “Mutations can lead to loss of integrity of a whole pathway,
not just of a single gene.”

These findings support the concept that schizophrenia may result, in part, from

  • disruptions in development in the prefrontal cortex during fetal development.

James E. Darnell’s “Reflections”

A brief history of the discovery of RNA and its role in transcription — peppered with career advice
By Joseph P. Tiano

James Darnell begins his Journal of Biological Chemistry “Reflections” article by saying, “graduate students these days

  • have to swim in a sea virtually turgid with the daily avalanche of new information and
  • may be momentarily too overwhelmed to listen to the aging.

I firmly believe how we learned what we know can provide useful guidance for how and what a newcomer will learn.” Considering his remarkable discoveries in

  • RNA processing and eukaryotic transcriptional regulation

spanning 60 years of research, Darnell’s advice should be cherished. In his second year at medical school at Washington University School of Medicine in St. Louis, while
studying streptococcal disease in Robert J. Glaser’s laboratory, Darnell realized he “loved doing the experiments” and had his first “career advancement event.”
He and technician Barbara Pesch discovered that in vivo penicillin treatment killed streptococci only in the exponential growth phase and not in the stationary phase. These
results were published in the Journal of Clinical Investigation and earned Darnell an interview with Harry Eagle at the National Institutes of Health.

Darnell arrived at the NIH in 1956, shortly after Eagle  shifted his research interest to developing his minimal essential cell culture medium, still used. Eagle, then studying cell metabolism, suggested that Darnell take up a side project on poliovirus replication in mammalian cells in collaboration with Robert I. DeMars. DeMars’ Ph.D.
adviser was also James  Watson’s mentor, so Darnell met Watson, who invited him to give a talk at Harvard University, which led to an assistant professor position
at the MIT under Salvador Luria. A take-home message is to embrace side projects, because you never know where they may lead: this project helped to shape
his career.

Darnell arrived in Boston in 1961. Following the discovery of DNA’s structure in 1953, the world of molecular biology was turning to RNA in an effort to understand how
proteins are made. Darnell’s background in virology (it was discovered in 1960 that viruses used RNA to replicate) was ideal for the aim of his first independent lab:
exploring mRNA in animal cells grown in culture. While at MIT, he developed a new technique for purifying RNA along with making other observations

  • suggesting that nonribosomal cytoplasmic RNA may be involved in protein synthesis.

When Darnell moved to Albert Einstein College of Medicine for full professorship in 1964,  it was hypothesized that heterogenous nuclear RNA was a precursor to mRNA.
At Einstein, Darnell discovered RNA processing of pre-tRNAs and demonstrated for the first time

  • that a specific nuclear RNA could represent a possible specific mRNA precursor.

In 1967 Darnell took a position at Columbia University, and it was there that he discovered (simultaneously with two other labs) that

  • mRNA contained a polyadenosine tail.

The three groups all published their results together in the Proceedings of the National Academy of Sciences in 1971. Shortly afterward, Darnell made his final career move
four short miles down the street to Rockefeller University in 1974.

Over the next 35-plus years at Rockefeller, Darnell never strayed from his original research question: How do mammalian cells make and control the making of different
mRNAs? His work was instrumental in the collaborative discovery of

  • splicing in the late 1970s and
  • in identifying and cloning many transcriptional activators.

Perhaps his greatest contribution during this time, with the help of Ernest Knight, was

  • the discovery and cloning of the signal transducers and activators of transcription (STAT) proteins.

And with George Stark, Andy Wilks and John Krowlewski, he described

  • cytokine signaling via the JAK-STAT pathway.

Darnell closes his “Reflections” with perhaps his best advice: Do not get too wrapped up in your own work, because “we are all needed and we are all in this together.”

Darnell Reflections - James_Darnell

Darnell Reflections – James_Darnell

http://www.asbmb.org/assets/0/366/418/428/85528/85529/85530/8758cb87-84ff-42d6-8aea-96fda4031a1b.jpg

Recent findings on presenilins and signal peptide peptidase

By Dinu-Valantin Bălănescu

γ-secretase and SPP

γ-secretase and SPP

Fig. 1 from the minireview shows a schematic depiction of γ-secretase and SPP

http://www.asbmb.org/assets/0/366/418/428/85528/85529/85530/c2de032a-daad-41e5-ba19-87a17bd26362.png

GxGD proteases are a family of intramembranous enzymes capable of hydrolyzing

  • the transmembrane domain of some integral membrane proteins.

The GxGD family is one of the three families of

  • intramembrane-cleaving proteases discovered so far (along with the rhomboid and site-2 protease) and
  • includes the γ-secretase and the signal peptide peptidase.

Although only recently discovered, a number of functions in human pathology and in numerous other biological processes

  • have been attributed to γ-secretase and SPP.

Taisuke Tomita and Takeshi Iwatsubo of the University of Tokyo highlighted the latest findings on the structure and function of γ-secretase and SPP
in a recent minireview in The Journal of Biological Chemistry.

  • γ-secretase is involved in cleaving the amyloid-β precursor protein, thus producing amyloid-β peptide,

the main component of senile plaques in Alzheimer’s disease patients’ brains. The complete structure of mammalian γ-secretase is not yet known; however,
Tomita and Iwatsubo note that biochemical analyses have revealed it to be a multisubunit protein complex.

  • Its catalytic subunit is presenilin, an aspartyl protease.

In vitro and in vivo functional and chemical biology analyses have revealed that

  • presenilin is a modulator and mandatory component of the γ-secretase–mediated cleavage of APP.

Genetic studies have identified three other components required for γ-secretase activity:

  1. nicastrin,
  2. anterior pharynx defective 1 and
  3. presenilin enhancer 2.

By coexpression of presenilin with the other three components, the authors managed to

  • reconstitute γ-secretase activity.

Tomita and Iwatsubo determined using the substituted cysteine accessibility method and by topological analyses, that

  • the catalytic aspartates are located at the center of the nine transmembrane domains of presenilin,
  • by revealing the exact location of the enzyme’s catalytic site.

The minireview also describes in detail the formerly enigmatic mechanism of γ-secretase mediated cleavage.

SPP, an enzyme that cleaves remnant signal peptides in the membrane

  • during the biogenesis of membrane proteins and
  • signal peptides from major histocompatibility complex type I,
  • also is involved in the maturation of proteins of the hepatitis C virus and GB virus B.

Bioinformatics methods have revealed in fruit flies and mammals four SPP-like proteins,

  • two of which are involved in immunological processes.

By using γ-secretase inhibitors and modulators, it has been confirmed

  • that SPP shares a similar GxGD active site and proteolytic activity with γ-secretase.

Upon purification of the human SPP protein with the baculovirus/Sf9 cell system,

  • single-particle analysis revealed further structural and functional details.

HLA targeting efficiency correlates with human T-cell response magnitude and with mortality from influenza A infection

From www.pnas.org –  Sep 3, 2013 4:24 PM

Experimental and computational evidence suggests that

  • HLAs preferentially bind conserved regions of viral proteins, a concept we term “targeting efficiency,” and that
  • this preference may provide improved clearance of infection in several viral systems.

To test this hypothesis, T-cell responses to A/H1N1 (2009) were measured from peripheral blood mononuclear cells obtained from a household cohort study
performed during the 2009–2010 influenza season. We found that HLA targeting efficiency scores significantly correlated with

  • IFN-γ enzyme-linked immunosorbent spot responses (P = 0.042, multiple regression).

A further population-based analysis found that the carriage frequencies of the alleles with the lowest targeting efficiencies, A*24,

  • were associated with pH1N1 mortality (r = 0.37, P = 0.031) and
  • are common in certain indigenous populations in which increased pH1N1 morbidity has been reported.

HLA efficiency scores and HLA use are associated with CD8 T-cell magnitude in humans after influenza infection.
The computational tools used in this study may be useful predictors of potential morbidity and

  • identify immunologic differences of new variant influenza strains
  • more accurately than evolutionary sequence comparisons.

Population-based studies of the relative frequency of these alleles in severe vs. mild influenza cases

  • might advance clinical practices for severe H1N1 infections among genetically susceptible populations.

Metabolomics in drug target discovery

J D Rabinowitz et al.

Lewis-Sigler Institute for Integrative Genomics, Princeton University, Princeton, NJ.
Cold Spring Harbor Symposia on Quantitative Biology 11/2011; 76:235-46.
http://dx.doi.org:/10.1101/sqb.2011.76.010694 

Most diseases result in metabolic changes. In many cases, these changes play a causative role in disease progression. By identifying pathological metabolic changes,

  • metabolomics can point to potential new sites for therapeutic intervention.

Particularly promising enzymatic targets are those that

  • carry increased flux in the disease state.

Definitive assessment of flux requires the use of isotope tracers. Here we present techniques for

  • finding new drug targets using metabolomics and isotope tracers.

The utility of these methods is exemplified in the study of three different viral pathogens. For influenza A and herpes simplex virus,

  • metabolomic analysis of infected versus mock-infected cells revealed
  • dramatic concentration changes around the current antiviral target enzymes.

Similar analysis of human-cytomegalovirus-infected cells, however, found the greatest changes

  • in a region of metabolism unrelated to the current antiviral target.

Instead, it pointed to the tricarboxylic acid (TCA) cycle and

  • its efflux to feed fatty acid biosynthesis as a potential preferred target.

Isotope tracer studies revealed that cytomegalovirus greatly increases flux through

  • the key fatty acid metabolic enzyme acetyl-coenzyme A carboxylase.
  • Inhibition of this enzyme blocks human cytomegalovirus replication.

Examples where metabolomics has contributed to identification of anticancer drug targets are also discussed. Eventual proof of the value of

  • metabolomics as a drug target discovery strategy will be
  • successful clinical development of therapeutics hitting these new targets.

 Related References

Use of metabolic pathway flux information in targeted cancer drug design. Drug Discovery Today: Therapeutic Strategies 1:435-443, 2004.

Detection of resistance to imatinib by metabolic profiling: clinical and drug development implications. Am J Pharmacogenomics. 2005;5(5):293-302. Review. PMID: 16196499

Medicinal chemistry, metabolic profiling and drug target discovery: a role for metabolic profiling in reverse pharmacology and chemical genetics.
Mini Rev Med Chem.  2005 Jan;5(1):13-20. Review. PMID: 15638788 [PubMed – indexed for MEDLINE] Related citations

Development of Tracer-Based Metabolomics and its Implications for the Pharmaceutical Industry. Int J Pharm Med 2007; 21 (3): 217-224.

Use of metabolic pathway flux information in anticancer drug design. Ernst Schering Found Symp Proc. 2007;(4):189-203. Review. PMID: 18811058

Pharmacological targeting of glucagon and glucagon-like peptide 1 receptors has different effects on energy state and glucose homeostasis in diet-induced obese mice. J Pharmacol Exp Ther. 2011 Jul;338(1):70-81. http://dx.doi.org:/10.1124/jpet.111.179986. PMID: 21471191

Single valproic acid treatment inhibits glycogen and RNA ribose turnover while disrupting glucose-derived cholesterol synthesis in liver as revealed by the
[U-C(6)]-d-glucose tracer in mice. Metabolomics. 2009 Sep;5(3):336-345. PMID: 19718458

Metabolic Pathways as Targets for Drug Screening, Metabolomics, Dr Ute Roessner (Ed.), ISBN: 978-953-51-0046-1, InTech, Available from: http://www.intechopen.com/books/metabolomics/metabolic-pathways-as-targets-for-drug-screening

Iron regulates glucose homeostasis in liver and muscle via AMP-activated protein kinase in mice. FASEB J. 2013 Jul;27(7):2845-54.
http://dx.doi.org:/10.1096/fj.12-216929. PMID: 23515442

Metabolomics and systems pharmacology: why and how to model the human metabolic network for drug discovery

Drug Discov. Today 19 (2014), 171–182     http://dx.doi.org:/10.1016/j.drudis.2013.07.014

Highlights

  • We now have metabolic network models; the metabolome is represented by their nodes.
  • Metabolite levels are sensitive to changes in enzyme activities.
  • Drugs hitchhike on metabolite transporters to get into and out of cells.
  • The consensus network Recon2 represents the present state of the art, and has predictive power.
  • Constraint-based modelling relates network structure to metabolic fluxes.

Metabolism represents the ‘sharp end’ of systems biology, because changes in metabolite concentrations are

  • necessarily amplified relative to changes in the transcriptome, proteome and enzyme activities, which can be modulated by drugs.

To understand such behaviour, we therefore need (and increasingly have) reliable consensus (community) models of

  • the human metabolic network that include the important transporters.

Small molecule ‘drug’ transporters are in fact metabolite transporters, because

  • drugs bear structural similarities to metabolites known from the network reconstructions and
  • from measurements of the metabolome.

Recon2 represents the present state-of-the-art human metabolic network reconstruction; it can predict inter alia:

(i) the effects of inborn errors of metabolism;

(ii) which metabolites are exometabolites, and

(iii) how metabolism varies between tissues and cellular compartments.

However, even these qualitative network models are not yet complete. As our understanding improves

  • so do we recognise more clearly the need for a systems (poly)pharmacology.

Introduction – a systems biology approach to drug discovery

It is clearly not news that the productivity of the pharmaceutical industry has declined significantly during recent years

  • following an ‘inverse Moore’s Law’, Eroom’s Law, or
  • that many commentators, consider that the main cause of this is
  • because of an excessive focus on individual molecular target discovery rather than a more sensible strategy
  • based on a systems-level approach (Fig. 1).
drug discovery science

drug discovery science

Figure 1.

The change in drug discovery strategy from ‘classical’ function-first approaches (in which the assay of drug function was at the tissue or organism level),
with mechanistic studies potentially coming later, to more-recent target-based approaches where initial assays usually involve assessing the interactions
of drugs with specified (and often cloned, recombinant) proteins in vitro. In the latter cases, effects in vivo are assessed later, with concomitantly high levels of attrition.

Arguably the two chief hallmarks of the systems biology approach are:

(i) that we seek to make mathematical models of our systems iteratively or in parallel with well-designed ‘wet’ experiments, and
(ii) that we do not necessarily start with a hypothesis but measure as many things as possible (the ’omes) and

  • let the data tell us the hypothesis that best fits and describes them.

Although metabolism was once seen as something of a Cinderella subject,

  • there are fundamental reasons to do with the organisation of biochemical networks as
  • to why the metabol(om)ic level – now in fact seen as the ‘apogee’ of the ’omics trilogy –
  •  is indeed likely to be far more discriminating than are
  • changes in the transcriptome or proteome.

The next two subsections deal with these points and Fig. 2 summarises the paper in the form of a Mind Map.

metabolomics and systems pharmacology

metabolomics and systems pharmacology

http://ars.els-cdn.com/content/image/1-s2.0-S1359644613002481-gr2.jpg

Metabolic Disease Drug Discovery— “Hitting the Target” Is Easier Said Than Done

David E. Moller, et al.   http://dx.doi.org:/10.1016/j.cmet.2011.10.012

Despite the advent of new drug classes, the global epidemic of cardiometabolic disease has not abated. Continuing

  • unmet medical needs remain a major driver for new research.

Drug discovery approaches in this field have mirrored industry trends, leading to a recent

  • increase in the number of molecules entering development.

However, worrisome trends and newer hurdles are also apparent. The history of two newer drug classes—

  1. glucagon-like peptide-1 receptor agonists and
  2. dipeptidyl peptidase-4 inhibitors—

illustrates both progress and challenges. Future success requires that researchers learn from these experiences and

  • continue to explore and apply new technology platforms and research paradigms.

The global epidemic of obesity and diabetes continues to progress relentlessly. The International Diabetes Federation predicts an even greater diabetes burden (>430 million people afflicted) by 2030, which will disproportionately affect developing nations (International Diabetes Federation, 2011). Yet

  • existing drug classes for diabetes, obesity, and comorbid cardiovascular (CV) conditions have substantial limitations.

Currently available prescription drugs for treatment of hyperglycemia in patients with type 2 diabetes (Table 1) have notable shortcomings. In general,

Therefore, clinicians must often use combination therapy, adding additional agents over time. Ultimately many patients will need to use insulin—a therapeutic class first introduced in 1922. Most existing agents also have

  • issues around safety and tolerability as well as dosing convenience (which can impact patient compliance).

Pharmacometabolomics, also known as pharmacometabonomics, is a field which stems from metabolomics,

  • the quantification and analysis of metabolites produced by the body.

It refers to the direct measurement of metabolites in an individual’s bodily fluids, in order to

  • predict or evaluate the metabolism of pharmaceutical compounds, and
  • to better understand the pharmacokinetic profile of a drug.

Alternatively, pharmacometabolomics can be applied to measure metabolite levels

  • following the administration of a pharmaceutical compound, in order to
  • monitor the effects of the compound on certain metabolic pathways(pharmacodynamics).

This provides detailed mapping of drug effects on metabolism and

  • the pathways that are implicated in mechanism of variation of response to treatment.

In addition, the metabolic profile of an individual at baseline (metabotype) provides information about

  • how individuals respond to treatment and highlights heterogeneity within a disease state.

All three approaches require the quantification of metabolites found

relationship between -OMICS

relationship between -OMICS

http://upload.wikimedia.org/wikipedia/commons/thumb/e/eb/OMICS.png/350px-OMICS.png

Pharmacometabolomics is thought to provide information that

Looking at the characteristics of an individual down through these different levels of detail, there is an

  • increasingly more accurate prediction of a person’s ability to respond to a pharmaceutical compound.
  1. the genome, made up of 25 000 genes, can indicate possible errors in drug metabolism;
  2. the transcriptome, made up of 85,000 transcripts, can provide information about which genes important in metabolism are being actively transcribed;
  3. and the proteome, >10,000,000 members, depicts which proteins are active in the body to carry out these functions.

Pharmacometabolomics complements the omics with

  • direct measurement of the products of all of these reactions, but with perhaps a relatively
  • smaller number of members: that was initially projected to be approximately 2200 metabolites,

but could be a larger number when gut derived metabolites and xenobiotics are added to the list. Overall, the goal of pharmacometabolomics is

  • to more closely predict or assess the response of an individual to a pharmaceutical compound,
  • permitting continued treatment with the right drug or dosage
  • depending on the variations in their metabolism and ability to respond to treatment.

Pharmacometabolomic analyses, through the use of a metabolomics approach,

  • can provide a comprehensive and detailed metabolic profile or “metabolic fingerprint” for an individual patient.

Such metabolic profiles can provide a complete overview of individual metabolite or pathway alterations,

This approach can then be applied to the prediction of response to a pharmaceutical compound

  • by patients with a particular metabolic profile.

Pharmacometabolomic analyses of drug response are

Pharmacogenetics focuses on the identification of genetic variations (e.g. single-nucleotide polymorphisms)

  • within patients that may contribute to altered drug responses and overall outcome of a certain treatment.

The results of pharmacometabolomics analyses can act to “inform” or “direct”

  • pharmacogenetic analyses by correlating aberrant metabolite concentrations or metabolic pathways to potential alterations at the genetic level.

This concept has been established with two seminal publications from studies of antidepressants serotonin reuptake inhibitors

  • where metabolic signatures were able to define a pathway implicated in response to the antidepressant and
  • that lead to identification of genetic variants within a key gene
  • within the highlighted pathway as being implicated in variation in response.

These genetic variants were not identified through genetic analysis alone and hence

  • illustrated how metabolomics can guide and inform genetic data.

en.wikipedia.org/wiki/Pharmacometabolomics

Benznidazole Biotransformation and Multiple Targets in Trypanosoma cruzi Revealed by Metabolomics

Andrea Trochine, Darren J. Creek, Paula Faral-Tello, Michael P. Barrett, Carlos Robello
Published: May 22, 2014   http://dx.doi.org:/10.1371/journal.pntd.0002844

The first line treatment for Chagas disease, a neglected tropical disease caused by the protozoan parasite Trypanosoma cruzi,

  • involves administration of benznidazole (Bzn).

Bzn is a 2-nitroimidazole pro-drug which requires nitroreduction to become active. We used a

  • non-targeted MS-based metabolomics approach to study the metabolic response of T. cruzi to Bzn.

Parasites treated with Bzn were minimally altered compared to untreated trypanosomes, although the redox active thiols

  1. trypanothione,
  2. homotrypanothione and
  3. cysteine

were significantly diminished in abundance post-treatment. In addition, multiple Bzn-derived metabolites were detected after treatment.

These metabolites included reduction products, fragments and covalent adducts of reduced Bzn

  • linked to each of the major low molecular weight thiols:
  1. trypanothione,
  2. glutathione,
  3. g-glutamylcysteine,
  4. glutathionylspermidine,
  5. cysteine and
  6. ovothiol A.

Bzn products known to be generated in vitro by the unusual trypanosomal nitroreductase, TcNTRI,

  • were found within the parasites,
  • but low molecular weight adducts of glyoxal, a proposed toxic end-product of NTRI Bzn metabolism, were not detected.

Our data is indicative of a major role of the

  • thiol binding capacity of Bzn reduction products
  • in the mechanism of Bzn toxicity against T. cruzi.


Read Full Post »

Infinity and AbbVie partner to develop and commercialise Duvelisib for cancer… for the treatment of chronic lymphocytic leukemia

Reporter: Stephen J. Williams, PhD

Duvelisib is a dual phosphoinositide-3-kinase (PI3K) delta and PI3K gamma inhibitor.  The delta and gamma isozymes are selectively expressed in leukocytes.    This article (at Dr. Melvin Crasto’s blog newdrugapprovals.org) discusses the synthesis of Duvelisib and mentions additional clinical trials underway including a phase II trial for the treatment of patients with mild asthma undergoing allergen challenge, for the treatment of rheumatoid arthritis and for the treatment of refractory indolent non-Hodgkin’s lymphoma. Phase I clinical trials for the treatment of advanced hematological malignancies (including T-cell lymphoma and mantle cell lymphoma).  The drug was originally developed at Takeda subsidiary Intellikine.

SOURCE

http://newdrugapprovals.org/2014/09/09/infinity-and-abbvie-partner-to-develop-and-commercialise-duvelisib-for-cancer-for-the-treatment-of-chronic-lymphocytic-leukemia/

Read Full Post »

Introduction to Protein Synthesis and Degradation

Curator: Larry H. Bernstein, MD, FCAP

Updated 8/31/2019


Introduction to Protein Synthesis and Degradation

This chapter I made to follow signaling, rather than to precede it. I had already written much of the content before reorganizing the contents. The previous chapters on carbohydrate and on lipid metabolism have already provided much material on proteins and protein function, which was persuasive of the need to introduce signaling, which entails a substantial introduction to conformational changes in proteins that direct the trafficking of metabolic pathways, but more subtly uncovers an important role for microRNAs, not divorced from transcription, but involved in a non-transcriptional role.  This is where the classic model of molecular biology lacked any integration with emerging metabolic concepts concerning regulation. Consequently, the science was bereft of understanding the ties between the multiple convergence of transcripts, the selective inhibition of transcriptions, and the relative balance of aerobic and anaerobic metabolism, the weight of the pentose phosphate shunt, and the utilization of available energy source for synthetic and catabolic adaptive responses.

The first subchapter serves to introduce the importance of transcription in translational science.  The several subtitles that follow are intended to lay out the scope of the transcriptional activity, and also to direct attention toward the huge role of proteomics in the cell construct.  As we have already seen, proteins engage with carbohydrates and with lipids in important structural and signaling processes.  They are integrasl to the composition of the cytoskeleton, and also to the extracellular matrix.  Many proteins are actually enzymes, carrying out the transformation of some substrate, a derivative of the food we ingest.  They have a catalytic site, and they function with a cofactor – either a multivalent metal or a nucleotide.

The amino acids that go into protein synthesis include “indispensable” nutrients that are not made for use, but must be derived from animal protein, although the need is partially satisfied by plant sources. The essential amino acids are classified into well established groups. There are 20 amino acids commonly found in proteins.  They are classified into the following groups based on the chemical and/or structural properties of their side chains :

  1. Aliphatic Amino Acids
  2. Cyclic Amino Acid
  3. AAs with Hydroxyl or Sulfur-containing side chains
  4. Aromatic Amino Acids
  5. Basic Amino Acids
  6. Acidic Amino Acids and their Amides

Examples include:

Alanine                  aliphatic hydrophobic neutral
Arginine                 polar hydrophilic charged (+)
Cysteine                polar hydrophobic neutral
Glutamine             polar hydrophilic neutral
Histidine                aromatic polar hydrophilic charged (+)
Lysine                   polar hydrophilic charged (+)
Methionine            hydrophobic neutral
Serine                   polar hydrophilic neutral
Tyrosine                aromatic polar hydrophobic

Transcribe and Translate a Gene

  1. For each RNA base there is a corresponding DNA base
  2. Cells use the two-step process of transcription and translation to read each gene and produce the string of amino acids that makes up a protein.
  3. mRNA is produced in the nucleus, and is transferred to the ribosome
  4. mRNA uses uracil instead of thymine
  5. the ribosome reads the RNA sequence and makes protein
  6. There is a sequence combination to fit each amino acid to a three letter RNA code
  7. The ribosome starts at AUG (start), and it reads each codon three letters at a time
  8. Stop codons are UAA, UAG and UGA


protein synthesis

protein synthesis

http://learn.genetics.utah.edu/content/molecules/transcribe/images/TandT.png

mcell-transcription-translation

mcell-transcription-translation

http://www.vcbio.science.ru.nl/images/cellcycle/mcell-transcription-translation_eng_zoom.gif

transcription_translation

transcription_translation


http://www.biologycorner.com/resources/transcription_translation.JPG


What about the purine inosine?

Inosine triphosphate pyrophosphatase – Pyrophosphatase that hydrolyzes the non-canonical purine nucleotides inosine triphosphate (ITP), deoxyinosine triphosphate (dITP) as well as 2′-deoxy-N-6-hydroxylaminopurine triposphate (dHAPTP) and xanthosine 5′-triphosphate (XTP) to their respective monophosphate derivatives. The enzyme does not distinguish between the deoxy- and ribose forms. Probably excludes non-canonical purines from RNA and DNA precursor pools, thus preventing their incorporation into RNA and DNA and avoiding chromosomal lesions.

Gastroenterology. 2011 Apr;140(4):1314-21.  http://dx.doi.org:/10.1053/j.gastro.2010.12.038. Epub 2011 Jan 1.

Inosine triphosphate protects against ribavirin-induced adenosine triphosphate loss by adenylosuccinate synthase function.

Hitomi Y1, Cirulli ET, Fellay J, McHutchison JG, Thompson AJ, Gumbs CE, Shianna KV, Urban TJ, Goldstein DB.

Genetic variation of inosine triphosphatase (ITPA) causing an accumulation of inosine triphosphate (ITP) has been shown to protect patients against ribavirin (RBV)-induced anemia during treatment for chronic hepatitis C infection by genome-wide association study (GWAS). However, the biologic mechanism by which this occurs is unknown.

Although ITP is not used directly by human erythrocyte ATPase, it can be used for ATP biosynthesis via ADSS in place of guanosine triphosphate (GTP). With RBV challenge, erythrocyte ATP reduction was more severe in the wild-type ITPA genotype than in the hemolysis protective ITPA genotype. This difference also remains after inhibiting adenosine uptake using nitrobenzylmercaptopurine riboside (NBMPR).

ITP confers protection against RBV-induced ATP reduction by substituting for erythrocyte GTP, which is depleted by RBV, in the biosynthesis of ATP. Because patients with excess ITP appear largely protected against anemia, these results confirm that RBV-induced anemia is due primarily to the effect of the drug on GTP and consequently ATP levels in erythrocytes.

Ther Drug Monit. 2012 Aug;34(4):477-80.  http://dx.doi.org:/10.1097/FTD.0b013e31825c2703.

Determination of inosine triphosphate pyrophosphatase phenotype in human red blood cells using HPLC.

Citterio-Quentin A1, Salvi JP, Boulieu R.

Thiopurine drugs, widely used in cancer chemotherapy, inflammatory bowel disease, and autoimmune hepatitis, are responsible for common adverse events. Only some of these may be explained by genetic polymorphism of thiopurine S-methyltransferase. Recent articles have reported that inosine triphosphate pyrophosphatase (ITPase) deficiency was associated with adverse drug reactions toward thiopurine drug therapy. Here, we report a weak anion exchange high-performance liquid chromatography method to determine ITPase activity in red blood cells and to investigate the relationship with the occurrence of adverse events during azathioprine therapy.

The chromatographic method reported allows the analysis of IMP, inosine diphosphate, and ITP in a single run in <12.5 minutes. The method was linear in the range 5-1500 μmole/L of IMP. Intraassay and interassay precisions were <5% for red blood cell lysates supplemented with 50, 500, and 1000 μmole/L IMP. Km and Vmax evaluated by Lineweaver-Burk plot were 677.4 μmole/L and 19.6 μmole·L·min, respectively. The frequency distribution of ITPase from 73 patients was investigated.

The method described is useful to determine the ITPase phenotype from patients on thiopurine therapy and to investigate the potential relation between ITPase deficiency and the occurrence of adverse events.


System wide analyses have underestimated protein abundances and the importance of transcription in mammals

Jingyi Jessica Li1, 2, Peter J Bickel1 and Mark D Biggin3

PeerJ 2:e270; http://dx.doi.org:/10.7717/peerj.270

Using individual measurements for 61 housekeeping proteins to rescale whole proteome data from Schwanhausser et al. (2011), we find that the median protein detected is expressed at 170,000 molecules per cell and that our corrected protein abundance estimates show a higher correlation with mRNA abundances than do the uncorrected protein data. In addition, we estimated the impact of further errors in mRNA and protein abundances using direct experimental measurements of these errors. The resulting analysis suggests that mRNA levels explain at least 56% of the differences in protein abundance for the 4,212 genes detected by Schwanhausser et al. (2011), though because one major source of error could not be estimated the true percent contribution should be higher.We also employed a second, independent strategy to determine the contribution of mRNA levels to protein expression.We show that the variance in translation rates directly measured by ribosome profiling is only 12% of that inferred by Schwanhausser et al. (2011), and that the measured and inferred translation rates correlate poorly (R2 D 0.13). Based on this, our second strategy suggests that mRNA levels explain 81% of the variance in protein levels. We also determined the percent contributions of transcription, RNA degradation, translation and protein degradation to the variance in protein abundances using both of our strategies. While the magnitudes of the two estimates vary, they both suggest that transcription plays a more important role than the earlier studies implied and translation a much smaller role. Finally, the above estimates only apply to those genes whose mRNA and protein expression was detected. Based on a detailed analysis by Hebenstreit et al. (2012), we estimat that approximately 40% of genes in a given cell within a population express no mRNA. Since there can be no translation in the ab-sence of mRNA, we argue that differences in translation rates can play no role in determining the expression levels for the 40% of genes that are non-expressed.


Related studies that reveal issues that are not part of this chapter:

  1. Ubiquitylation in relationship to tissue remodeling
  2. Post-translational modification of proteins
    1. Glycosylation
    2. Phosphorylation
    3. Methylation
    4. Nitrosylation
    5. Sulfation – sulfotransferases
      cell-matrix communication
    6. Acetylation and histone deacetylation (HDAC)
      Connecting Protein Phosphatase to 1α (PP1α)
      Acetylation complexes (such as CBP/p300 and PCAF)
      Sirtuins
      Rel/NF-kB Signal Transduction
      Homologous Recombination Pathway of Double-Strand DNA Repair
    7. Glycination
    8. cyclin dependent kinases (CDKs)
    9. lyase
    10. transferase


This year, the Lasker award for basic medical research went to Kazutoshi Mori (Kyoto University) and Peter Walter (University of California, San Francisco) for their “discoveries concerning the unfolded protein response (UPR) — an intracellular quality control system that

detects harmful misfolded proteins in the endoplasmic reticulum and signals the nucleus to carry out corrective measures.”

About UPR: Approximately a third of cellular proteins pass through the Endoplasmic Reticulum (ER) which performs stringent quality control of these proteins. All proteins need to assume the proper 3-dimensional shape in order to function properly in the harsh cellular environment. Related to this is the fact that cells are under constant stress and have to make rapid, real time decisions about survival or death.

A major indicator of stress is the accumulation of unfolded proteins within the Endoplasmic Reticulum (ER), which triggers a transcriptional cascade in order to increase the folding capacity of the ER. If the metabolic burden is too great and homeostasis cannot be achieved, the response shifts from

damage control to the induction of pro-apoptotic pathways that would ultimately cause cell death.

This response to unfolded proteins or the UPR is conserved among all eukaryotes, and dysfunction in this pathway underlies many human diseases, including Alzheimer’s, Parkinson’s, Diabetes and Cancer.


The discovery of a new class of human proteins with previously unidentified activities

In a landmark study conducted by scientists at the Scripps Research Institute, The Hong Kong University of Science and Technology, aTyr Pharma and their collaborators, a new class of human proteins has been discovered. These proteins [nearly 250], called Physiocrines belong to the aminoacyl tRNA synthetase gene family and carry out novel, diverse and distinct biological functions.

The aminoacyl tRNA synthetase gene family codes for a group of 20 ubiquitous enzymes almost all of which are part of the protein synthesis machinery. Using recombinant protein purification, deep sequencing technique, mass spectroscopy and cell based assays, the team made this discovery. The finding is significant, also because it highlights the alternate use of a gene family whose protein product normally performs catalytic activities for non-catalytic regulation of basic and complex physiological processes spanning metabolism, vascularization, stem cell biology and immunology


Muscle maintenance and regeneration – key player identified

Muscle tissue suffers from atrophy with age and its regenerative capacity also declines over time. Most molecules discovered thus far to boost tissue regeneration are also implicated in cancers.  During a quest to find safer alternatives that can regenerate tissue, scientists reported that the hormone Oxytocin is required for proper muscle tissue regeneration and homeostasis and that its levels decline with age.

Oxytocin could be an alternative to hormone replacement therapy as a way to combat aging and other organ related degeneration.

Oxytocin is an age-specific circulating hormone that is necessary for muscle maintenance and regeneration (June 2014)


Proc Natl Acad Sci U S A. 2014 Sep 30;111(39):14289-94.   http://dx.doi.org:/10.1073/pnas.1407640111. Epub 2014 Sep 15.

Role of forkhead box protein A3 in age-associated metabolic decline.

Ma X1, Xu L1, Gavrilova O2, Mueller E3.

Aging is associated with increased adiposity and diminished thermogenesis, but the critical transcription factors influencing these metabolic changes late in life are poorly understood. We recently demonstrated that the winged helix factor forkhead box protein A3 (Foxa3) regulates the expansion of visceral adipose tissue in high-fat diet regimens; however, whether Foxa3 also contributes to the increase in adiposity and the decrease in brown fat activity observed during the normal aging process is currently unknown. Here we report that during aging, levels of Foxa3 are significantly and selectively up-regulated in brown and inguinal white fat depots, and that midage Foxa3-null mice have increased white fat browning and thermogenic capacity, decreased adipose tissue expansion, improved insulin sensitivity, and increased longevity. Foxa3 gain-of-function and loss-of-function studies in inguinal adipose depots demonstrated a cell-autonomous function for Foxa3 in white fat tissue browning. Furthermore, our analysis revealed that the mechanisms of Foxa3 modulation of brown fat gene programs involve the suppression of peroxisome proliferator activated receptor γ coactivtor 1 α (PGC1α) levels through interference with cAMP responsive element binding protein 1-mediated transcriptional regulation of the PGC1α promoter.


Asymmetric mRNA localization contributes to fidelity and sensitivity of spatially localized systems

RJ Weatheritt, TJ Gibson & MM Babu
Nature Structural & Molecular Biology 24 Aug, 2014; 21: 833–839 http://dx.do.orgi:/10.1038/nsmb.2876

Although many proteins are localized after translation, asymmetric protein distribution is also achieved by translation after mRNA localization. Why are certain mRNA transported to a distal location and translated on-site? Here we undertake a systematic, genome-scale study of asymmetrically distributed protein and mRNA in mammalian cells. Our findings suggest that asymmetric protein distribution by mRNA localization enhances interaction fidelity and signaling sensitivity. Proteins synthesized at distal locations frequently contain intrinsically disordered segments. These regions are generally rich in assembly-promoting modules and are often regulated by post-translational modifications. Such proteins are tightly regulated but display distinct temporal dynamics upon stimulation with growth factors. Thus, proteins synthesized on-site may rapidly alter proteome composition and act as dynamically regulated scaffolds to promote the formation of reversible cellular assemblies. Our observations are consistent across multiple mammalian species, cell types and developmental stages, suggesting that localized translation is a recurring feature of cell signaling and regulation.


An overview of the potential advantages conferred by distal-site protein synthesis, inferred from our analysis.


An overview of the potential advantages conferred by distal-site protein synthesis

An overview of the potential advantages conferred by distal-site protein synthesis


Turquoise and red filled circle represents off-target and correct interaction partners, respectively. Wavy lines represent a disordered region within a distal site synthesis protein. Grey and red line in graphs represents profiles of t…

http://www.nature.com/nsmb/journal/v21/n9/carousel/nsmb.2876-F5.jpg


Tweaking transcriptional programming for high quality recombinant protein production

Since overexpression of recombinant proteins in E. coli often leads to the formation of inclusion bodies, producing properly folded, soluble proteins is undoubtedly the most important end goal in a protein expression campaign. Various approaches have been devised to bypass the insolubility issues during E. coli expression and in a recent report a group of researchers discuss reprogramming the E. coli proteostasis [protein homeostasis] network to achieve high yields of soluble, functional protein. The premise of their studies is that the basal E. coli proteostasis network is insufficient, and often unable, to fold overexpressed proteins, thus clogging the folding machinery.

By overexpressing a mutant, negative-feedback deficient heat shock transcription factor [σ32 I54N] before and during overexpression of the protein of interest, reprogramming can be achieved, resulting in high yields of soluble and functional recombinant target protein. The authors explain that this method is better than simply co-expressing/over-expressing chaperones, co-chaperones, foldases or other components of the proteostasis network because reprogramming readies the folding machinery and up regulates the essential folding components beforehand thus  maintaining system capability of the folding machinery.

The Heat-Shock Response Transcriptional Program Enables High-Yield and High-Quality Recombinant Protein Production in Escherichia coli (July 2014)


 Unfolded proteins collapse when exposed to heat and crowded environments

Proteins are important molecules in our body and they fulfil a broad range of functions. For instance as enzymes they help to release energy from food and as muscle proteins they assist with motion. As antibodies they are involved in immune defence and as hormone receptors in signal transduction in cells. Until only recently it was assumed that all proteins take on a clearly defined three-dimensional structure – i.e. they fold in order to be able to assume these functions. Surprisingly, it has been shown that many important proteins occur as unfolded coils. Researchers seek to establish how these disordered proteins are capable at all of assuming highly complex functions.

Ben Schuler’s research group from the Institute of Biochemistry of the University of Zurich has now established that an increase in temperature leads to folded proteins collapsing and becoming smaller. Other environmental factors can trigger the same effect.

Measurements using the “molecular ruler”

“The fact that unfolded proteins shrink at higher temperatures is an indication that cell water does indeed play an important role as to the spatial organisation eventually adopted by the molecules”, comments Schuler with regard to the impact of temperature on protein structure. For their studies the biophysicists use what is known as single-molecule spectroscopy. Small colour probes in the protein enable the observation of changes with an accuracy of more than one millionth of a millimetre. With this “molecular yardstick” it is possible to measure how molecular forces impact protein structure.

With computer simulations the researchers have mimicked the behaviour of disordered proteins.
(Courtesy of Jose EDS Roselino, PhD.


MLKL compromises plasma membrane integrity

Necroptosis is implicated in many diseases and understanding this process is essential in the search for new therapies. While mixed lineage kinase domain-like (MLKL) protein has been known to be a critical component of necroptosis induction, how MLKL transduces the death signal was not clear. In a recent finding, scientists demonstrated that the full four-helical bundle domain (4HBD) in the N-terminal region of MLKL is required and sufficient to induce its oligomerization and trigger cell death.

They also found a patch of positively charged amino acids on the surface of the 4HBD that bound to phosphatidylinositol phosphates (PIPs) and allowed the recruitment of MLKL to the plasma membrane that resulted in the formation of pores consisting of MLKL proteins, due to which cells absorbed excess water causing them to explode. Detailed knowledge about how MLKL proteins create pores offers possibilities for the development of new therapeutic interventions for tolerating or preventing cell death.

MLKL compromises plasma membrane integrity by binding to phosphatidylinositol phosphates (May 2014)


Mitochondrial and ER proteins implicated in dementia

Mitochondria and the endoplasmic reticulum (ER) form tight structural associations that facilitate a number of cellular functions. However, the molecular mechanisms of these interactions aren’t properly understood.

A group of researchers showed that the ER protein VAPB interacted with mitochondrial protein PTPIP51 to regulate ER-mitochondria associations and that TDP-43, a protein implicated in dementia, disturbs this interaction to regulate cellular Ca2+ homeostasis. These studies point to a new pathogenic mechanism for TDP-43 and may also provide a potential new target for the development of new treatments for devastating neurological conditions like dementia.

ER-mitochondria associations are regulated by the VAPB-PTPIP51 interaction and are disrupted by ALS/FTD-associated TDP-43. Nature (June 2014)


A novel strategy to improve membrane protein expression in Yeast

Membrane proteins play indispensable roles in the physiology of an organism. However, recombinant production of membrane proteins is one of the biggest hurdles facing protein biochemists today. A group of scientists in Belgium showed that,

by increasing the intracellular membrane production by interfering with a key enzymatic step of lipid synthesis,

enhanced expression of recombinant membrane proteins in yeast is achieved.

Specifically, they engineered the oleotrophic yeast, Yarrowia lipolytica, by

deleting the phosphatidic acid phosphatase, PAH1 gene,

which led to massive proliferation of endoplasmic reticulum (ER) membranes.

For all 8 tested representatives of different integral membrane protein families, they obtained enhanced protein accumulation.


An unconventional method to boost recombinant protein levels

MazF is an mRNA interferase enzyme in E.coli that functions as and degrades cellular mRNA in a targeted fashion, at the “ACA” sequence. This degradation of cellular mRNA causes a precipitous drop in cellular protein synthesis. A group of scientists at the Robert Wood Johnson Medical School in New Jersey, exploited the degeneracy of the genetic code to modify all “ACA” triplets within their gene of interest in a way that the corresponding amino acid (Threonine) remained unchanged. Consequently, induction of MazF toxin caused degradation of E.coli cellular mRNA but the recombinant gene transcription and protein synthesis continued, causing significant accumulation of high quality target protein. This expression system enables unparalleled signal to noise ratios that could dramatically simplify structural and functional studies of difficult-to-purify, biologically important proteins.


Tandem fusions and bacterial strain evolution for enhanced functional membrane protein production

Membrane protein production remains a significant challenge in its characterization and structure determination. Despite the fact that there are a variety of host cell types, E.coli remains the popular choice for producing recombinant membrane proteins. A group of scientists in Netherlands devised a robust strategy to increase the probability of functional membrane protein overexpression in E.coli.

By fusing Green Fluorescent Protein (GFP) and the Erythromycin Resistance protein (ErmC) to the C-terminus of a target membrane protein they wer e able to track the folding state of their target protein while using Erythromycin to select for increased expression. By increasing erythromycin concentration in the growth media and testing different membrane targets, they were able to identify four evolved E.coli strains, all of which carried a mutation in the hns gene, whose product is implicated in genome organization and transcriptional silencing. Through their experiments the group showed that partial removal of the transcriptional silencing mechanism was related to production of proteins that were essential for functional overexpression of membrane proteins.


The role of an anti-apoptotic factor in recombinant protein production

In a recent study, scientists at the Johns Hopkins University and Frederick National Laboratory for Cancer Research examined an alternative method of utilizing the benefits of anti-apoptotic gene expression to enhance the transient expression of biotherapeutics, specifically, through the co-transfection of Bcl-xL along with the product-coding target gene.

Chinese Hamster Ovary(CHO) cells were co-transfected with the product-coding gene and a vector containing Bcl-xL, using Polyethylenimine (PEI) reagent. They found that the cells co-transfected with Bcl-xL demonstrated reduced apoptosis, increased specific productivity, and an overall increase in product yield.

B-cell lymphoma-extra-large (Bcl-xL) is a mitochondrial transmembrane protein and a member of the Bcl-2 family of proteins which are known to act as either pro- or anti-apoptotic proteins. Bcl-xL itself acts as an anti-apoptotic molecule by preventing the release of mitochondrial contents such as cytochrome c, which would lead to caspase activation. Higher levels of Bcl-xL push a cell toward survival mode by making the membranes pores less permeable and leaky.

Introduction to Protein Synthesis and Degradation Updated 8/31/2019

N-Terminal Degradation of Proteins: The N-End Rule and N-degrons

In both prokaryotes and eukaryotes mitochondria and chloroplasts, the ribosomal synthesis of proteins is initiated with the addition of the N-formyl methionine residue.  However in eukaryotic cytosolic ribosomes, the N terminal was assumed to be devoid of the N-formyl group.  The unformylated N-terminal methionine residues of eukaryotes is then  often N-acetylated (Ac) and creates specific degradation signals, the Ac N-end rule.  These N-end rule pathways are proteolytic systems which recognize these N-degrons resulting in proteosomal degradation or autophagy.  In prokaryotes this system is stimulated by certain amino acid deficiencies and in eukaryotes is dependent on the Psh1 E3 ligase.

Two papers in the journal Science describe this N-degron in more detail.

Structured Abstract
INTRODUCTION

In both bacteria and eukaryotic mitochondria and chloroplasts, the ribosomal synthesis of proteins is initiated with the N-terminal (Nt) formyl-methionine (fMet) residue. Nt-fMet is produced pretranslationally by formyltransferases, which use 10-formyltetrahydrofolate as a cosubstrate. By contrast, proteins synthesized by cytosolic ribosomes of eukaryotes were always presumed to bear unformylated N-terminal Met (Nt-Met). The unformylated Nt-Met residue of eukaryotic proteins is often cotranslationally Nt-acetylated, a modification that creates specific degradation signals, Ac/N-degrons, which are targeted by the Ac/N-end rule pathway. The N-end rule pathways are a set of proteolytic systems whose unifying feature is their ability to recognize proteins containing N-degrons, thereby causing the degradation of these proteins by the proteasome or autophagy in eukaryotes and by the proteasome-like ClpAP protease in bacteria. The main determinant of an N‑degron is a destabilizing Nt-residue of a protein. Studies over the past three decades have shown that all 20 amino acids of the genetic code can act, in cognate sequence contexts, as destabilizing Nt‑residues. The previously known eukaryotic N-end rule pathways are the Arg/N-end rule pathway, the Ac/N-end rule pathway, and the Pro/N-end rule pathway. Regulated degradation of proteins and their natural fragments by the N-end rule pathways has been shown to mediate a broad range of biological processes.

RATIONALE

The chemical similarity of the formyl and acetyl groups and their identical locations in, respectively, Nt‑formylated and Nt-acetylated proteins led us to suggest, and later to show, that the Nt-fMet residues of nascent bacterial proteins can act as bacterial N-degrons, termed fMet/N-degrons. Here we wished to determine whether Nt-formylated proteins might also form in the cytosol of a eukaryote such as the yeast Saccharomyces cerevisiae and to determine the metabolic fates of Nt-formylated proteins if they could be produced outside mitochondria. Our approaches included molecular genetic techniques, mass spectrometric analyses of proteins’ N termini, and affinity-purified antibodies that selectively recognized Nt-formylated reporter proteins.

RESULTS

We discovered that the yeast formyltransferase Fmt1, which is imported from the cytosol into the mitochondria inner matrix, can generate Nt-formylated proteins in the cytosol, because the translocation of Fmt1 into mitochondria is not as efficacious, even under unstressful conditions, as had previously been assumed. We also found that Nt‑formylated proteins are greatly up-regulated in stationary phase or upon starvation for specific amino acids. The massive increase of Nt-formylated proteins strictly requires the Gcn2 kinase, which phosphorylates Fmt1 and mediates its retention in the cytosol. Notably, the ability of Gcn2 to retain a large fraction of Fmt1 in the cytosol of nutritionally stressed cells is confined to Fmt1, inasmuch as the Gcn2 kinase does not have such an effect, under the same conditions, on other examined nuclear DNA–encoded mitochondrial matrix proteins. The Gcn2-Fmt1 protein localization circuit is a previously unknown signal transduction pathway. A down-regulation of cytosolic Nt‑formylation was found to increase the sensitivity of cells to undernutrition stresses, to a prolonged cold stress, and to a toxic compound. We also discovered that the Nt-fMet residues of Nt‑formylated cytosolic proteins act as eukaryotic fMet/N-degrons and identified the Psh1 E3 ubiquitin ligase as the recognition component (fMet/N-recognin) of the previously unknown eukaryotic fMet/N-end rule pathway, which destroys Nt‑formylated proteins.

CONCLUSION

The Nt-formylation of proteins, a long-known pretranslational protein modification, is mediated by formyltransferases. Nt-formylation was thought to be confined to bacteria and bacteria-descended eukaryotic organelles but was found here to also occur at the start of translation by the cytosolic ribosomes of a eukaryote. The levels of Nt‑formylated eukaryotic proteins are greatly increased upon specific stresses, including undernutrition, and appear to be important for adaptation to these stresses. We also discovered that Nt-formylated cytosolic proteins are selectively destroyed by the eukaryotic fMet/N-end rule pathway, mediated by the Psh1 E3 ubiquitin ligase. This previously unknown proteolytic system is likely to be universal among eukaryotes, given strongly conserved mechanisms that mediate Nt‑formylation and degron recognition.

The eukaryotic fMet/N-end rule pathway.

(Top) Under undernutrition conditions, the Gcn2 kinase augments the cytosolic localization of the Fmt1 formyltransferase, and possibly also its enzymatic activity. Consequently, Fmt1 up-regulates the cytosolic fMet–tRNAi (initiator transfer RNA), and thereby increases the levels of cytosolic Nt-formylated proteins, which are required for the adaptation of cells to specific stressors. (Bottom) The Psh1 E3 ubiquitin ligase targets the N-terminal fMet-residues of eukaryotic cytosolic proteins, such as Cse4, Pgd1, and Rps22a, for the polyubiquitylation-mediated, proteasome-dependent degradation.

” data-icon-position=”” data-hide-link-title=”0″>

The eukaryotic fMet/N-end rule pathway.

(Top) Under undernutrition conditions, the Gcn2 kinase augments the cytosolic localization of the Fmt1 formyltransferase, and possibly also its enzymatic activity. Consequently, Fmt1 up-regulates the cytosolic fMet–tRNAi (initiator transfer RNA), and thereby increases the levels of cytosolic Nt-formylated proteins, which are required for the adaptation of cells to specific stressors. (Bottom) The Psh1 E3 ubiquitin ligase targets the N-terminal fMet-residues of eukaryotic cytosolic proteins, such as Cse4, Pgd1, and Rps22a, for the polyubiquitylation-mediated, proteasome-dependent degradation.


A glycine-specific N-degron pathway mediates the quality control of protein N-myristoylation. Richard T. Timms1,2Zhiqian Zhang1,2David Y. Rhee3J. Wade Harper3Itay Koren1,2,*,Stephen J. Elledge1,2

Science  05 Jul 2019: Vol. 365, Issue 6448

The second paper describes a glycine specific N-degron pathway in humans.  Specifically the authors set up a screen to identify specific N-terminal degron motifs in the human.  Findings included an expanded repertoire for the UBR E3 ligases to include substrates with arginine and lysine following an intact initiator methionine and a glycine at the extreme N-terminus, which is a potent degron.

Glycine N-degron regulation revealed

For more than 30 years, N-terminal sequences have been known to influence protein stability, but additional features of these N-end rule, or N-degron, pathways continue to be uncovered. Timms et al. used a global protein stability (GPS) technology to take a broader look at these pathways in human cells. Unexpectedly, glycine exposed at the N terminus could act as a potent degron; proteins bearing N-terminal glycine were targeted for proteasomal degradation by two Cullin-RING E3 ubiquitin ligases through the substrate adaptors ZYG11B and ZER1. This pathway may be important, for example, to degrade proteins that fail to localize properly to cellular membranes and to destroy protein fragments generated during cell death.

Science, this issue p. eaaw4912

Structured Abstract

INTRODUCTION

The ubiquitin-proteasome system is the major route through which the cell achieves selective protein degradation. The E3 ubiquitin ligases are the major determinants of specificity in this system, which is thought to be achieved through their selective recognition of specific degron motifs in substrate proteins. However, our ability to identify these degrons and match them to their cognate E3 ligase remains a major challenge.

RATIONALE

It has long been known that the stability of proteins is influenced by their N-terminal residue, and a large body of work over the past three decades has characterized a collection of N-end rule pathways that target proteins for degradation through N-terminal degron motifs. Recently, we developed Global Protein Stability (GPS)–peptidome technology and used it to delineate a suite of degrons that lie at the extreme C terminus of proteins. We adapted this approach to examine the stability of the human N terminome, allowing us to reevaluate our understanding of N-degron pathways in an unbiased manner.

RESULTS

Stability profiling of the human N terminome identified two major findings: an expanded repertoire for UBR family E3 ligases to include substrates that begin with arginine and lysine following an intact initiator methionine and, more notably, that glycine positioned at the extreme N terminus can act as a potent degron. We established human embryonic kidney 293T reporter cell lines in which unstable peptides that bear N-terminal glycine degrons were fused to green fluorescent protein, and we performed CRISPR screens to identify the degradative machinery involved. These screens identified two Cul2 Cullin-RING E3 ligase complexes, defined by the related substrate adaptors ZYG11B and ZER1, that act redundantly to target substrates bearing N-terminal glycine degrons for proteasomal degradation. Moreover, through the saturation mutagenesis of example substrates, we defined the composition of preferred N-terminal glycine degrons specifically recognized by ZYG11B and ZER1.

We found that preferred glycine degrons are depleted from the native N termini of metazoan proteomes, suggesting that proteins have evolved to avoid degradation through this pathway, but are strongly enriched at annotated caspase cleavage sites. Stability profiling of N-terminal peptides lying downstream of all known caspase cleavages sites confirmed that Cul2ZYG11Band Cul2ZER1 could make a substantial contribution to the removal of proteolytic cleavage products during apoptosis. Last, we identified a role for ZYG11B and ZER1 in the quality control of N-myristoylated proteins. N-myristoylation is an important posttranslational modification that occurs exclusively on N-terminal glycine. By profiling the stability of the human N-terminome in the absence of the N-myristoyltransferases NMT1 and NMT2, we found that a failure to undergo N-myristoylation exposes N-terminal glycine degrons that are otherwise obscured. Thus, conditional exposure of glycine degrons to ZYG11B and ZER1 permits the selective proteasomal degradation of aberrant proteins that have escaped N-terminal myristoylation.

CONCLUSION

These data demonstrate that an additional N-degron pathway centered on N-terminal glycine regulates the stability of metazoan proteomes. Cul2ZYG11B– and Cul2ZER1-mediated protein degradation through N-terminal glycine degrons may be particularly important in the clearance of proteolytic fragments generated by caspase cleavage during apoptosis and in the quality control of protein N-myristoylation.

The glycine N-degron pathway.

Stability profiling of the human N-terminome revealed that N-terminal glycine acts as a potent degron. CRISPR screening revealed two Cul2 complexes, defined by the related substrate adaptors ZYG11B and ZER1, that recognize N-terminal glycine degrons. This pathway may be particularly important for the degradation of caspase cleavage products during apoptosis and the removal of proteins that fail to undergo N-myristoylation.

” data-icon-position=”” data-hide-link-title=”0″>

The glycine N-degron pathway.

Stability profiling of the human N-terminome revealed that N-terminal glycine acts as a potent degron. CRISPR screening revealed two Cul2 complexes, defined by the related substrate adaptors ZYG11B and ZER1, that recognize N-terminal glycine degrons. This pathway may be particularly important for the degradation of caspase cleavage products during apoptosis and the removal of proteins that fail to undergo N-myristoylation.


Read Full Post »

Summary of Signaling and Signaling Pathways

Summary of Signaling and Signaling Pathways

Author and Curator: Larry H Bernstein, MD, FCAP

In the imtroduction to this series of discussions I pointed out JEDS Rosalino’s observation about the construction of a complex molecule of acetyl coenzyme A, and the amount of genetic coding that had to go into it.  Furthermore, he observes –  Millions of years later, or as soon as, the information of interaction leading to activity and regulation could be found in RNA, proteins like reverse transcriptase move this information to a more stable form (DNA). In this way it is easier to understand the use of CoA to make two carbon molecules more reactive.

acetylCoA

acetylCoA

In the tutorial that follows we find support for the view that mechanisms and examples from the current literature, which give insight into the developments in cell metabolism, are achieving a separation from inconsistent views introduced by the classical model of molecular biology and genomics, toward a more functional cellular dynamics that is not dependent on the classic view.  The classical view fits a rigid framework that is to genomics and metabolomics as Mendelian genetics if to multidimentional, multifactorial genetics.  The inherent difficulty lies in two places:

  1. Interactions between differently weighted determinants
  2. A large part of the genome is concerned with regulatory function, not expression of the code

The goal of the tutorial was to achieve an understanding of how cell signaling occurs in a cell.  Completion of the tutorial would provide

  1. a basic understanding signal transduction and
  2. the role of phosphorylation in signal transduction.
Regulation of the integrity of endothelial cell–cell contacts by phosphorylation of VE-cadherin

Regulation of the integrity of endothelial cell–cell contacts by phosphorylation of VE-cadherin

In addition – detailed knowledge of –

  1. the role of Tyrosine kinases and
  2. G protein-coupled receptors in cell signaling.
serine

serine

threonine

threonine

protein kinase

protein kinase

We are constantly receiving and interpreting signals from our environment, which can come

  • in the form of light, heat, odors, touch or sound.

The cells of our bodies are also

  • constantly receiving signals from other cells.

These signals are important to

  • keep cells alive and functioning as well as
  • to stimulate important events such as
  • cell division and differentiation.

Signals are most often chemicals that can be found

  • in the extracellular fluid around cells.

These chemicals can come

  • from distant locations in the body (endocrine signaling by hormones), from
  • nearby cells (paracrine signaling) or can even
  • be secreted by the same cell (autocrine signaling).

Notch-mediated juxtacrine signal between adjacent cells. 220px-Notchccr

Signaling molecules may trigger any number of cellular responses, including

  • changing the metabolism of the cell receiving the signal or
  • result in a change in gene expression (transcription) within the nucleus of the cell or both.
controlling the output of ribosomes.

controlling the output of ribosomes.

To which I would now add..

  • result in either an inhibitory or a stimulatory effect

The three stages of cell signaling are:

Cell signaling can be divided into 3 stages:

Reception: A cell detects a signaling molecule from the outside of the cell.

Transduction: When the signaling molecule binds the receptor it changes the receptor protein in some way. This change initiates the process of transduction. Signal transduction is usually a pathway of several steps. Each relay molecule in the signal transduction pathway changes the next molecule in the pathway.

Response: Finally, the signal triggers a specific cellular response.

signal transduction

signal transduction

http://www.hartnell.edu/tutorials/biology/images/signaltransduction_simple.jpg

The initiation is depicted as follows:

Signal Transduction – ligand binds to surface receptor

Membrane receptors function by binding the signal molecule (ligand) and causing the production of a second signal (also known as a second messenger) that then causes a cellular response. These types of receptors transmit information from the extracellular environment to the inside of the cell.

  • by changing shape or
  • by joining with another protein
  • once a specific ligand binds to it.

Examples of membrane receptors include

  • G Protein-Coupled Receptors and
Understanding these receptors and identifying their ligands and the resulting signal transduction pathways represent a major conceptual advance.

Understanding these receptors and identifying their ligands and the resulting signal transduction pathways represent a major conceptual advance.

  • Receptor Tyrosine Kinases.
intracellular signaling

intracellular signaling

http://www.hartnell.edu/tutorials/biology/images/membrane_receptor_tk.jpg

Intracellular receptors are found inside the cell, either in the cytopolasm or in the nucleus of the target cell (the cell receiving the signal).

Note that though change in gene expression is stated, the change in gene expression does not here imply a change in the genetic information – such as – mutation.  That does not have to be the case in the normal homeostatic case.

This point is the differentiating case between what JEDS Roselino has referred as

  1. a fast, adaptive reaction, that is the feature of protein molecules, and distinguishes this interaction from
  2. a one-to-one transcription of the genetic code.

The rate of transcription can be controlled, or it can be blocked.  This is in large part in response to the metabolites in the immediate interstitium.

This might only be

  • a change in the rate of a transcription or a suppression of expression through RNA.
  • Or through a conformational change in an enzyme
 Swinging domains in HECT E3 enzymes

Swinging domains in HECT E3 enzymes

Since signaling systems need to be

  • responsive to small concentrations of chemical signals and act quickly,
  • cells often use a multi-step pathway that transmits the signal quickly,
  • while amplifying the signal to numerous molecules at each step.

Signal transduction pathways are shown (simplified):

Signal Transduction

Signal Transduction

Signal transduction occurs when an

  1. extracellular signaling molecule activates a specific receptor located on the cell surface or inside the cell.
  2. In turn, this receptor triggers a biochemical chain of events inside the cell, creating a response.
  3. Depending on the cell, the response alters the cell’s metabolism, shape, gene expression, or ability to divide.
  4. The signal can be amplified at any step. Thus, one signaling molecule can cause many responses.

In 1970, Martin Rodbell examined the effects of glucagon on a rat’s liver cell membrane receptor. He noted that guanosine triphosphate disassociated glucagon from this receptor and stimulated the G-protein, which strongly influenced the cell’s metabolism. Thus, he deduced that the G-protein is a transducer that accepts glucagon molecules and affects the cell. For this, he shared the 1994 Nobel Prize in Physiology or Medicine with Alfred G. Gilman.

Guanosine monophosphate structure

Guanosine monophosphate structure

In 2007, a total of 48,377 scientific papers—including 11,211 e-review papers—were published on the subject. The term first appeared in a paper’s title in 1979. Widespread use of the term has been traced to a 1980 review article by Rodbell: Research papers focusing on signal transduction first appeared in large numbers in the late 1980s and early 1990s.

Signal transduction involves the binding of extracellular signaling molecules and ligands to cell-surface receptors that trigger events inside the cell. The combination of messenger with receptor causes a change in the conformation of the receptor, known as receptor activation.

This activation is always the initial step (the cause) leading to the cell’s ultimate responses (effect) to the messenger. Despite the myriad of these ultimate responses, they are all directly due to changes in particular cell proteins. Intracellular signaling cascades can be started through cell-substratum interactions; examples are the integrin that binds ligands in the extracellular matrix and steroids.

Integrin

Integrin

Most steroid hormones have receptors within the cytoplasm and act by stimulating the binding of their receptors to the promoter region of steroid-responsive genes.

steroid hormone receptor

steroid hormone receptor

Various environmental stimuli exist that initiate signal transmission processes in multicellular organisms; examples include photons hitting cells in the retina of the eye, and odorants binding to odorant receptors in the nasal epithelium. Certain microbial molecules, such as viral nucleotides and protein antigens, can elicit an immune system response against invading pathogens mediated by signal transduction processes. This may occur independent of signal transduction stimulation by other molecules, as is the case for the toll-like receptor. It may occur with help from stimulatory molecules located at the cell surface of other cells, as with T-cell receptor signaling. Receptors can be roughly divided into two major classes: intracellular receptors and extracellular receptors.

Signal transduction cascades amplify the signal output

Signal transduction cascades amplify the signal output

Signal transduction cascades amplify the signal output

G protein-coupled receptors (GPCRs) are a family of integral transmembrane proteins that possess seven transmembrane domains and are linked to a heterotrimeric G protein. Many receptors are in this family, including adrenergic receptors and chemokine receptors.

Arrestin binding to active GPCR kinase (GRK)-phosphorylated GPCRs blocks G protein coupling

signal transduction pathways

signal transduction pathways

Arrestin binding to active GPCR kinase (GRK)-phosphorylated GPCRs blocks G protein coupling

Arrestin binding to active GPCR kinase (GRK)-phosphorylated GPCRs blocks G protein coupling

Signal transduction by a GPCR begins with an inactive G protein coupled to the receptor; it exists as a heterotrimer consisting of Gα, Gβ, and Gγ. Once the GPCR recognizes a ligand, the conformation of the receptor changes to activate the G protein, causing Gα to bind a molecule of GTP and dissociate from the other two G-protein subunits.

The dissociation exposes sites on the subunits that can interact with other molecules. The activated G protein subunits detach from the receptor and initiate signaling from many downstream effector proteins such as phospholipases and ion channels, the latter permitting the release of second messenger molecules.

Receptor tyrosine kinases (RTKs) are transmembrane proteins with an intracellular kinase domain and an extracellular domain that binds ligands; examples include growth factor receptors such as the insulin receptor.

 insulin receptor and and insulin receptor signaling pathway (IRS)

insulin receptor and and insulin receptor signaling pathway (IRS)

To perform signal transduction, RTKs need to form dimers in the plasma membrane; the dimer is stabilized by ligands binding to the receptor.

RTKs

RTKs

The interaction between the cytoplasmic domains stimulates the autophosphorylation of tyrosines within the domains of the RTKs, causing conformational changes.

Allosteric_Regulation.svg

Subsequent to this, the receptors’ kinase domains are activated, initiating phosphorylation signaling cascades of downstream cytoplasmic molecules that facilitate various cellular processes such as cell differentiation and metabolism.

Signal-Transduction-Pathway

Signal-Transduction-Pathway

As is the case with GPCRs, proteins that bind GTP play a major role in signal transduction from the activated RTK into the cell. In this case, the G proteins are

  • members of the Ras, Rho, and Raf families, referred to collectively as small G proteins.

They act as molecular switches usually

  • tethered to membranes by isoprenyl groups linked to their carboxyl ends.

Upon activation, they assign proteins to specific membrane subdomains where they participate in signaling. Activated RTKs in turn activate

  • small G proteins that activate guanine nucleotide exchange factors such as SOS1.

Once activated, these exchange factors can activate more small G proteins, thus

  • amplifying the receptor’s initial signal.

The mutation of certain RTK genes, as with that of GPCRs, can result in the expression of receptors that exist in a constitutively activate state; such mutated genes may act as oncogenes.

Integrin


Integrin

Integrin

Integrin-mediated signal transduction

An overview of integrin-mediated signal transduction, adapted from Hehlgens et al. (2007).

Integrins are produced by a wide variety of cells; they play a role in

  • cell attachment to other cells and the extracellular matrix and
  • in the transduction of signals from extracellular matrix components such as fibronectin and collagen.

Ligand binding to the extracellular domain of integrins

  • changes the protein’s conformation,
  • clustering it at the cell membrane to
  • initiate signal transduction.

Integrins lack kinase activity; hence, integrin-mediated signal transduction is achieved through a variety of intracellular protein kinases and adaptor molecules, the main coordinator being integrin-linked kinase.

As shown in the picture, cooperative integrin-RTK signaling determines the

  1. timing of cellular survival,
  2. apoptosis,
  3. proliferation, and
  4. differentiation.
integrin-mediated signal transduction

integrin-mediated signal transduction

Integrin signaling

Integrin signaling

ion channel

A ligand-gated ion channel, upon binding with a ligand, changes conformation

  • to open a channel in the cell membrane
  • through which ions relaying signals can pass.

An example of this mechanism is found in the receiving cell of a neural synapse. The influx of ions that occurs in response to the opening of these channels

  1. induces action potentials, such as those that travel along nerves,
  2. by depolarizing the membrane of post-synaptic cells,
  3. resulting in the opening of voltage-gated ion channels.
RyR and Ca+ release from SR

RyR and Ca+ release from SR

An example of an ion allowed into the cell during a ligand-gated ion channel opening is Ca2+;

  • it acts as a second messenger
  • initiating signal transduction cascades and
  • altering the physiology of the responding cell.

This results in amplification of the synapse response between synaptic cells

  • by remodelling the dendritic spines involved in the synapse.

In eukaryotic cells, most intracellular proteins activated by a ligand/receptor interaction possess an enzymatic activity; examples include tyrosine kinase and phosphatases. Some of them create second messengers such as cyclic AMP and IP3,

cAMP

cAMP

Inositol_1,4,5-trisphosphate.svg

Inositol_1,4,5-trisphosphate.svg

  • the latter controlling the release of intracellular calcium stores into the cytoplasm.

Many adaptor proteins and enzymes activated as part of signal transduction possess specialized protein domains that bind to specific secondary messenger molecules. For example,

  • calcium ions bind to the EF hand domains of calmodulin,
  • allowing it to bind and activate calmodulin-dependent kinase.
calcium movement and RyR2 receptor

calcium movement and RyR2 receptor

PIP3 and other phosphoinositides do the same thing to the Pleckstrin homology domains of proteins such as the kinase protein AKT.

Signals can be generated within organelles, such as chloroplasts and mitochondria, modulating the nuclear
gene expression in a process called retrograde signaling.

Recently, integrative genomics approaches, in which correlation analysis has been applied on transcript and metabolite profiling data of Arabidopsis thaliana, revealed the identification of metabolites which are putatively acting as mediators of nuclear gene expression.

http://fpls.com/unraveling_retrograde_signaling_pathways:_finding_candidate_signaling_molecules_via_metabolomics_and_systems_biology_driven_approaches

Related articles

  1. Systems Biology Approach Reveals Genome to Phenome Correlation in Type 2 Diabetes (plosone.org)
  2. Gene Expression and Thiopurine Metabolite Profiling in Inflammatory Bowel Disease – Novel Clues to Drug Targets and Disease Mechanisms? (plosone.org)
  3. Activation of the Jasmonic Acid Plant Defence Pathway Alters the Composition of Rhizosphere

Nutrients 2014, 6, 3245-3258; http://dx.doi.org:/10.3390/nu6083245

Omega-3 (ω-3) fatty acids are one of the two main families of long chain polyunsaturated fatty acids (PUFA). The main omega-3 fatty acids in the mammalian body are

  • α-linolenic acid (ALA), docosahexaenoic acid (DHA) and eicosapentaenoic acid (EPA).

Central nervous tissues of vertebrates are characterized by a high concentration of omega-3 fatty acids. Moreover, in the human brain,

  • DHA is considered as the main structural omega-3 fatty acid, which comprises about 40% of the PUFAs in total.

DHA deficiency may be the cause of many disorders such as depression, inability to concentrate, excessive mood swings, anxiety, cardiovascular disease, type 2 diabetes, dry skin and so on.

On the other hand,

  • zinc is the most abundant trace metal in the human brain.

There are many scientific studies linking zinc, especially

  • excess amounts of free zinc, to cellular death.

Neurodegenerative diseases, such as Alzheimer’s disease, are characterized by altered zinc metabolism. Both animal model studies and human cell culture studies have shown a possible link between

  • omega-3 fatty acids, zinc transporter levels and
  • free zinc availability at cellular levels.

Many other studies have also suggested a possible

  • omega-3 and zinc effect on neurodegeneration and cellular death.

Therefore, in this review, we will examine

  • the effect of omega-3 fatty acids on zinc transporters and
  • the importance of free zinc for human neuronal cells.

Moreover, we will evaluate the collective understanding of

  • mechanism(s) for the interaction of these elements in neuronal research and their
  • significance for the diagnosis and treatment of neurodegeneration.

Epidemiological studies have linked high intake of fish and shellfish as part of the daily diet to

  • reduction of the incidence and/or severity of Alzheimer’s disease (AD) and senile mental decline in

Omega-3 fatty acids are one of the two main families of a broader group of fatty acids referred to as polyunsaturated fatty acids (PUFAs). The other main family of PUFAs encompasses the omega-6 fatty acids. In general, PUFAs are essential in many biochemical events, especially in early post-natal development processes such as

  • cellular differentiation,
  • photoreceptor membrane biogenesis and
  • active synaptogenesis.

Despite the significance of these

two families, mammals cannot synthesize PUFA de novo, so they must be ingested from dietary sources. Though belonging to the same family, both

  • omega-3 and omega-6 fatty acids are metabolically and functionally distinct and have
  • opposing physiological effects. In the human body,
  • high concentrations of omega-6 fatty acids are known to increase the formation of prostaglandins and
  • thereby increase inflammatory processes [10].

the reverse process can be seen with increased omega-3 fatty acids in the body.

Many other factors, such as

  1. thromboxane A2 (TXA2),
  2. leukotriene
  3. B4 (LTB4),
  4. IL-1,
  5. IL-6,
  6. tumor necrosis factor (TNF) and
  7. C-reactive protein,

which are implicated in various health conditions, have been shown to be increased with high omega-6 fatty acids but decreased with omega-3 fatty acids in the human body.

Dietary fatty acids have been identified as protective factors in coronary heart disease, and PUFA levels are known to play a critical role in

  • immune responses,
  • gene expression and
  • intercellular communications.

omega-3 fatty acids are known to be vital in

  • the prevention of fatal ventricular arrhythmias, and
  • are also known to reduce thrombus formation propensity by decreasing platelet aggregation, blood viscosity and fibrinogen levels

.Since omega-3 fatty acids are prevalent in the nervous system, it seems logical that a deficiency may result in neuronal problems, and this is indeed what has been identified and reported.

The main

In another study conducted with individuals of 65 years of age or older (n = 6158), it was found that

  • only high fish consumption, but
  • not dietary omega-3 acid intake,
  • had a protective effect on cognitive decline

In 2005, based on a meta-analysis of the available epidemiology and preclinical studies, clinical trials were conducted to assess the effects of omega-3 fatty acids on cognitive protection. Four of the trials completed have shown

a protective effect of omega-3 fatty acids only among those with mild cognitive impairment conditions.

A  trial of subjects with mild memory complaints demonstrated

  • an improvement with 900 mg of DHA.

We review key findings on

  • the effect of the omega-3 fatty acid DHA on zinc transporters and the
  • importance of free zinc to human neuronal cells.

DHA is the most abundant fatty acid in neural membranes, imparting appropriate

  • fluidity and other properties,

and is thus considered as the most important fatty acid in neuronal studies. DHA is well conserved throughout the mammalian species despite their dietary differences. It is mainly concentrated

  • in membrane phospholipids at synapses and
  • in retinal photoreceptors and
  • also in the testis and sperm.

In adult rats’ brain, DHA comprises approximately

  • 17% of the total fatty acid weight, and
  • in the retina it is as high as 33%.

DHA is believed to have played a major role in the evolution of the modern human –

  • in particular the well-developed brain.

Premature babies fed on DHA-rich formula show improvements in vocabulary and motor performance.

Analysis of human cadaver brains have shown that

  • people with AD have less DHA in their frontal lobe
  • and hippocampus compared with unaffected individuals

Furthermore, studies in mice have increased support for the

  • protective role of omega-3 fatty acids.

Mice administrated with a dietary intake of DHA showed

  • an increase in DHA levels in the hippocampus.

Errors in memory were decreased in these mice and they demonstrated

  • reduced peroxide and free radical levels,
  • suggesting a role in antioxidant defense.

Another study conducted with a Tg2576 mouse model of AD demonstrated that dietary

  • DHA supplementation had a protective effect against reduction in
  • drebrin (actin associated protein), elevated oxidation, and to some extent, apoptosis via
  • decreased caspase activity.


Zinc

Zinc is a trace element, which is indispensable for life, and it is the second most abundant trace element in the body. It is known to be related to

  • growth,
  • development,
  • differentiation,
  • immune response,
  • receptor activity,
  • DNA synthesis,
  • gene expression,
  • neuro-transmission,
  • enzymatic catalysis,
  • hormonal storage and release,
  • tissue repair,
  • memory,
  • the visual process

and many other cellular functions. Moreover, the indispensability of zinc to the body can be discussed in many other aspects,  as

  • a component of over 300 different enzymes
  • an integral component of a metallothioneins
  • a gene regulatory protein.

Approximately 3% of all proteins contain

  • zinc binding motifs .

The broad biological functionality of zinc is thought to be due to its stable chemical and physical properties. Zinc is considered to have three different functions in enzymes;

  1. catalytic,
  2. coactive and

Indeed, it is the only metal found in all six different subclasses

of enzymes. The essential nature of zinc to the human body can be clearly displayed by studying the wide range of pathological effects of zinc deficiency. Anorexia, embryonic and post-natal growth retardation, alopecia, skin lesions, difficulties in wound healing, increased hemorrhage tendency and severe reproductive abnormalities, emotional instability, irritability and depression are just some of the detrimental effects of zinc deficiency.

Proper development and function of the central nervous system (CNS) is highly dependent on zinc levels. In the mammalian organs, zinc is mainly concentrated in the brain at around 150 μm. However, free zinc in the mammalian brain is calculated to be around 10 to 20 nm and the rest exists in either protein-, enzyme- or nucleotide bound form. The brain and zinc relationship is thought to be mediated

  • through glutamate receptors, and
  • it inhibits excitatory and inhibitory receptors.

Vesicular localization of zinc in pre-synaptic terminals is a characteristic feature of brain-localized zinc, and

  • its release is dependent on neural activity.

Retardation of the growth and development of CNS tissues have been linked to low zinc levels. Peripheral neuropathy, spina bifida, hydrocephalus, anencephalus, epilepsy and Pick’s disease have been linked to zinc deficiency. However, the body cannot tolerate excessive amounts of zinc.

The relationship between zinc and neurodegeneration, specifically AD, has been interpreted in several ways. One study has proposed that β-amyloid has a greater propensity to

  • form insoluble amyloid in the presence of
  • high physiological levels of zinc.

Insoluble amyloid is thought to

  • aggregate to form plaques,

which is a main pathological feature of AD. Further studies have shown that

  • chelation of zinc ions can deform and disaggregate plaques.

In AD, the most prominent injuries are found in

  • hippocampal pyramidal neurons, acetylcholine-containing neurons in the basal forebrain, and in
  • somatostatin-containing neurons in the forebrain.

All of these neurons are known to favor

  • rapid and direct entry of zinc in high concentration
  • leaving neurons frequently exposed to high dosages of zinc.

This is thought to promote neuronal cell damage through oxidative stress and mitochondrial dysfunction. Excessive levels of zinc are also capable of

  • inhibiting Ca2+ and Na+ voltage gated channels
  • and up-regulating the cellular levels of reactive oxygen species (ROS).

High levels of zinc are found in Alzheimer’s brains indicating a possible zinc related neurodegeneration. A study conducted with mouse neuronal cells has shown that even a 24-h exposure to high levels of zinc (40 μm) is sufficient to degenerate cells.

If the human diet is deficient in zinc, the body

  • efficiently conserves zinc at the tissue level by compensating other cellular mechanisms

to delay the dietary deficiency effects of zinc. These include reduction of cellular growth rate and zinc excretion levels, and

  • redistribution of available zinc to more zinc dependent cells or organs.

A novel method of measuring metallothionein (MT) levels was introduced as a biomarker for the

  • assessment of the zinc status of individuals and populations.

In humans, erythrocyte metallothionein (E-MT) levels may be considered as an indicator of zinc depletion and repletion, as E-MT levels are sensitive to dietary zinc intake. It should be noted here that MT plays an important role in zinc homeostasis by acting

  • as a target for zinc ion binding and thus
  • assisting in the trafficking of zinc ions through the cell,
  • which may be similar to that of zinc transporters

Zinc Transporters

Deficient or excess amounts of zinc in the body can be catastrophic to the integrity of cellular biochemical and biological systems. The gastrointestinal system controls the absorption, excretion and the distribution of zinc, although the hydrophilic and high-charge molecular characteristics of zinc are not favorable for passive diffusion across the cell membranes. Zinc movement is known to occur

  • via intermembrane proteins and zinc transporter (ZnT) proteins

These transporters are mainly categorized under two metal transporter families; Zip (ZRT, IRT like proteins) and CDF/ZnT (Cation Diffusion Facilitator), also known as SLC (Solute Linked Carrier) gene families: Zip (SLC-39) and ZnT (SLC-30). More than 20 zinc transporters have been identified and characterized over the last two decades (14 Zips and 8 ZnTs).

Members of the SLC39 family have been identified as the putative facilitators of zinc influx into the cytosol, either from the extracellular environment or from intracellular compartments (Figure 1).

The identification of this transporter family was a result of gene sequencing of known Zip1 protein transporters in plants, yeast and human cells. In contrast to the SLC39 family, the SLC30 family facilitates the opposite process, namely zinc efflux from the cytosol to the extracellular environment or into luminal compartments such as secretory granules, endosomes and synaptic vesicles; thus decreasing intracellular zinc availability (Figure 1). ZnT3 is the most important in the brain where

  • it is responsible for the transport of zinc into the synaptic vesicles of
  • glutamatergic neurons in the hippocampus and neocortex,

Figure 1: Subcellular localization and direction of transport of the zinc transporter families, ZnT and ZIP. Arrows show the direction of zinc mobilization for the ZnT (green) and ZIP (red) proteins. A net gain in cytosolic zinc is achieved by the transportation of zinc from the extracellular region and organelles such as the endoplasmic reticulum (ER) and Golgi apparatus by the ZIP transporters. Cytosolic zinc is mobilized into early secretory compartments such as the ER and Golgi apparatus by the ZnT transporters. Figures were produced using Servier Medical Art, http://www.servier.com/.   http://www.hindawi.com/journals/jnme/2012/173712.fig.001.jpg

Figure 2: Early zinc signaling (EZS) and late zinc signaling (LZS). EZS involves transcription-independent mechanisms where an extracellular stimulus directly induces an increase in zinc levels within several minutes by releasing zinc from intracellular stores (e.g., endoplasmic reticulum). LSZ is induced several hours after an external stimulus and is dependent on transcriptional changes in zinc transporter expression. Components of this figure were produced using Servier Medical Art, http://www.servier.com/ and adapted from Fukada et al. [30].

omega-3 fatty acids in the mammalian body are

  1. α-linolenic acid (ALA),
  2. docosahexenoic acid (DHA) and
  3. eicosapentaenoic acid (EPA).

In general, seafood is rich in omega-3 fatty acids, more specifically DHA and EPA (Table 1). Thus far, there are nine separate epidemiological studies that suggest a possible link between

  • increased fish consumption and reduced risk of AD
  • and eight out of ten studies have reported a link between higher blood omega-3 levels

DHA and Zinc Homeostasis

Many studies have identified possible associations between DHA levels, zinc homeostasis, neuroprotection and neurodegeneration. Dietary DHA deficiency resulted in

  • increased zinc levels in the hippocampus and
  • elevated expression of the putative zinc transporter, ZnT3, in the rat brain.

Altered zinc metabolism in neuronal cells has been linked to neurodegenerative conditions such as AD. A study conducted with transgenic mice has shown a significant link between ZnT3 transporter levels and cerebral amyloid plaque pathology. When the ZnT3 transporter was silenced in transgenic mice expressing cerebral amyloid plaque pathology,

  • a significant reduction in plaque load
  • and the presence of insoluble amyloid were observed.

In addition to the decrease in plaque load, ZnT3 silenced mice also exhibited a significant

  • reduction in free zinc availability in the hippocampus
  • and cerebral cortex.

Collectively, the findings from this study are very interesting and indicate a clear connection between

  • zinc availability and amyloid plaque formation,

thus indicating a possible link to AD.

DHA supplementation has also been reported to limit the following:

  1. amyloid presence,
  2. synaptic marker loss,
  3. hyper-phosphorylation of Tau,
  4. oxidative damage and
  5. cognitive deficits in transgenic mouse model of AD.

In addition, studies by Stoltenberg, Flinn and colleagues report on the modulation of zinc and the effect in transgenic mouse models of AD. Given that all of these are classic pathological features of AD, and considering the limiting nature of DHA in these processes, it can be argued that DHA is a key candidate in preventing or even curing this debilitating disease.

In order to better understand the possible links and pathways of zinc and DHA with neurodegeneration, we designed a study that incorporates all three of these aspects, to study their effects at the cellular level. In this study, we were able to demonstrate a possible link between omega-3 fatty acid (DHA) concentration, zinc availability and zinc transporter expression levels in cultured human neuronal cells.

When treated with DHA over 48 h, ZnT3 levels were markedly reduced in the human neuroblastoma M17 cell line. Moreover, in the same study, we were able to propose a possible

  • neuroprotective mechanism of DHA,

which we believe is exerted through

  • a reduction in cellular zinc levels (through altering zinc transporter expression levels)
  • that in turn inhibits apoptosis.

DHA supplemented M17 cells also showed a marked depletion of zinc uptake (up to 30%), and

  • free zinc levels in the cytosol were significantly low compared to the control

This reduction in free zinc availability was specific to DHA; cells treated with EPA had no significant change in free zinc levels (unpublished data). Moreover, DHA-repleted cells had

  • low levels of active caspase-3 and
  • high Bcl-2 levels compared to the control treatment.

These findings are consistent with previous published data and further strengthen the possible

  • correlation between zinc, DHA and neurodegeneration.

On the other hand, recent studies using ZnT3 knockout (ZnT3KO) mice have shown the importance of

  • ZnT3 in memory and AD pathology.

For example, Sindreu and colleagues have used ZnT3KO mice to establish the important role of

  • ZnT3 in zinc homeostasis that modulates presynaptic MAPK signaling
  • required for hippocampus-dependent memory

Results from these studies indicate a possible zinc-transporter-expression-level-dependent mechanism for DHA neuroprotection.

Read Full Post »

Complex Models of Signaling: Therapeutic Implications

Complex Models of Signaling: Therapeutic Implications

Curator: Larry H. Bernstein, MD, FCAP

Updated 6/24/2019

Fishy Business: Effect of Omega-3 Fatty Acids on Zinc Transporters and Free Zinc Availability in Human Neuronal Cells

Damitha De Mel and Cenk Suphioglu *

NeuroAllergy Research Laboratory (NARL), School of Life and Environmental Sciences, Faculty of Science, Engineering and Built Environment, Waurn Ponds, Victoria, Australia.

Nutrients 2014, 6, 3245-3258; http://dx.doi.org:/10.3390/nu6083245

Omega-3 (ω-3) fatty acids are one of the two main families of long chain polyunsaturated fatty acids (PUFA). The main omega-3 fatty acids in the mammalian body are

  • α-linolenic acid (ALA), docosahexaenoic acid (DHA) and eicosapentaenoic acid (EPA).

Central nervous tissues of vertebrates are characterized by a high concentration of omega-3 fatty acids. Moreover, in the human brain,

  • DHA is considered as the main structural omega-3 fatty acid, which comprises about 40% of the PUFAs in total.

DHA deficiency may be the cause of many disorders such as depression, inability to concentrate, excessive mood swings, anxiety, cardiovascular disease, type 2 diabetes, dry skin and so on.

On the other hand,

  • zinc is the most abundant trace metal in the human brain.

There are many scientific studies linking zinc, especially

  • excess amounts of free zinc, to cellular death.

Neurodegenerative diseases, such as Alzheimer’s disease, are characterized by altered zinc metabolism. Both animal model studies and human cell culture studies have shown a possible link between

  • omega-3 fatty acids, zinc transporter levels and
  • free zinc availability at cellular levels.

Many other studies have also suggested a possible

  • omega-3 and zinc effect on neurodegeneration and cellular death.

Therefore, in this review, we will examine

  • the effect of omega-3 fatty acids on zinc transporters and
  • the importance of free zinc for human neuronal cells.

Moreover, we will evaluate the collective understanding of

  • mechanism(s) for the interaction of these elements in neuronal research and their
  • significance for the diagnosis and treatment of neurodegeneration.

Epidemiological studies have linked high intake of fish and shellfish as part of the daily diet to

  • reduction of the incidence and/or severity of Alzheimer’s disease (AD) and senile mental decline in

Omega-3 fatty acids are one of the two main families of a broader group of fatty acids referred to as polyunsaturated fatty acids (PUFAs). The other main family of PUFAs encompasses the omega-6 fatty acids. In general, PUFAs are essential in many biochemical events, especially in early post-natal development processes such as

  • cellular differentiation,
  • photoreceptor membrane biogenesis and
  • active synaptogenesis.

Despite the significance of these

two families, mammals cannot synthesize PUFA de novo, so they must be ingested from dietary sources. Though belonging to the same family, both

  • omega-3 and omega-6 fatty acids are metabolically and functionally distinct and have
  • opposing physiological effects. In the human body,
  • high concentrations of omega-6 fatty acids are known to increase the formation of prostaglandins and
  • thereby increase inflammatory processes [10].

the reverse process can be seen with increased omega-3 fatty acids in the body.

Many other factors, such as

  1. thromboxane A2 (TXA2),
  2. leukotriene
  3. B4 (LTB4),
  4. IL-1,
  5. IL-6,
  6. tumor necrosis factor (TNF) and
  7. C-reactive protein,

which are implicated in various health conditions, have been shown to be increased with high omega-6 fatty acids but decreased with omega-3 fatty acids in the human body.

Dietary fatty acids have been identified as protective factors in coronary heart disease, and PUFA levels are known to play a critical role in

  • immune responses,
  • gene expression and
  • intercellular communications.

omega-3 fatty acids are known to be vital in

  • the prevention of fatal ventricular arrhythmias, and
  • are also known to reduce thrombus formation propensity by decreasing platelet aggregation, blood viscosity and fibrinogen levels

.Since omega-3 fatty acids are prevalent in the nervous system, it seems logical that a deficiency may result in neuronal problems, and this is indeed what has been identified and reported.

The main omega-3 fatty acids in the mammalian body are

  1. α-linolenic acid (ALA),
  2. docosahexenoic acid (DHA) and
  3. eicosapentaenoic acid (EPA).

In general, seafood is rich in omega-3 fatty acids, more specifically DHA and EPA (Table 1). Thus far, there are nine separate epidemiological studies that suggest a possible link between

  • increased fish consumption and reduced risk of AD
  • and eight out of ten studies have reported a link between higher blood omega-3 levels

Table 1. Total percentage of omega-3 fatty acids in common foods and supplements.

Food/Supplement EPA DHA ALA Total %
Fish
SalmonSardine

Anchovy

Halibut

Herring

Mackerel

Tuna

Fresh Bluefin

XX

X

X

X

X

X

X

XX

X

X

X

X

X

X

>50%>50%

>50%

>50%

>50%

>50%

>50%

>50%

Oils/Supplements
Fish oil capsulesCod liver oils

Salmon oil

Sardine oil

XX

X

X

XX

X

X

>50%>50%

>50%

>50%

Black currant oilCanola oil Mustard seed oils

Soybean oil

Walnut oil

Wheat germ oil

XX

X

X

X

X

10%–50%10%–50%

10%–50%

10%–50%

10%–50%

10%–50%

Seeds and other foods
Flaxseeds/LinseedsSpinach

Wheat germ Human milk

Peanut butter

Soybeans

Olive oil

Walnuts

XX

X

X

X

X

X

X

>50%>50%

10%–50%

10%–50%

<10%

<10%

<10%

<10%


Table adopted from Maclean C.H. et al. [18].

In another study conducted with individuals of 65 years of age or older (n = 6158), it was found that

  • only high fish consumption, but
  • not dietary omega-3 acid intake,
  • had a protective effect on cognitive decline

In 2005, based on a meta-analysis of the available epidemiology and preclinical studies, clinical trials were conducted to assess the effects of omega-3 fatty acids on cognitive protection. Four of the trials completed have shown

a protective effect of omega-3 fatty acids only among those with mild cognitive impairment conditions.

A  trial of subjects with mild memory complaints demonstrated

  • an improvement with 900 mg of DHA.

We review key findings on

  • the effect of the omega-3 fatty acid DHA on zinc transporters and the
  • importance of free zinc to human neuronal cells.

DHA is the most abundant fatty acid in neural membranes, imparting appropriate

  • fluidity and other properties,

and is thus considered as the most important fatty acid in neuronal studies. DHA is well conserved throughout the mammalian species despite their dietary differences. It is mainly concentrated

  • in membrane phospholipids at synapses and
  • in retinal photoreceptors and
  • also in the testis and sperm.

In adult rats’ brain, DHA comprises approximately

  • 17% of the total fatty acid weight, and
  • in the retina it is as high as 33%.

DHA is believed to have played a major role in the evolution of the modern human –

  • in particular the well-developed brain.

Premature babies fed on DHA-rich formula show improvements in vocabulary and motor performance.

Analysis of human cadaver brains have shown that

  • people with AD have less DHA in their frontal lobe
  • and hippocampus compared with unaffected individuals

Furthermore, studies in mice have increased support for the

  • protective role of omega-3 fatty acids.

Mice administrated with a dietary intake of DHA showed

  • an increase in DHA levels in the hippocampus.

Errors in memory were decreased in these mice and they demonstrated

  • reduced peroxide and free radical levels,
  • suggesting a role in antioxidant defense.

Another study conducted with a Tg2576 mouse model of AD demonstrated that dietary

  • DHA supplementation had a protective effect against reduction in
  • drebrin (actin associated protein), elevated oxidation, and to some extent, apoptosis via
  • decreased caspase activity.


Zinc

Zinc is a trace element, which is indispensable for life, and it is the second most abundant trace element in the body. It is known to be related to

  • growth,
  • development,
  • differentiation,
  • immune response,
  • receptor activity,
  • DNA synthesis,
  • gene expression,
  • neuro-transmission,
  • enzymatic catalysis,
  • hormonal storage and release,
  • tissue repair,
  • memory,
  • the visual process

and many other cellular functions. Moreover, the indispensability of zinc to the body can be discussed in many other aspects,  as

  • a component of over 300 different enzymes
  • an integral component of a metallothioneins
  • a gene regulatory protein.

Approximately 3% of all proteins contain

  • zinc binding motifs .

The broad biological functionality of zinc is thought to be due to its stable chemical and physical properties. Zinc is considered to have three different functions in enzymes;

  1. catalytic,
  2. coactive and

Indeed, it is the only metal found in all six different subclasses

of enzymes. The essential nature of zinc to the human body can be clearly displayed by studying the wide range of pathological effects of zinc deficiency. Anorexia, embryonic and post-natal growth retardation, alopecia, skin lesions, difficulties in wound healing, increased hemorrhage tendency and severe reproductive abnormalities, emotional instability, irritability and depression are just some of the detrimental effects of zinc deficiency.

Proper development and function of the central nervous system (CNS) is highly dependent on zinc levels. In the mammalian organs, zinc is mainly concentrated in the brain at around 150 μm. However, free zinc in the mammalian brain is calculated to be around 10 to 20 nm and the rest exists in either protein-, enzyme- or nucleotide bound form. The brain and zinc relationship is thought to be mediated

  • through glutamate receptors, and
  • it inhibits excitatory and inhibitory receptors.

Vesicular localization of zinc in pre-synaptic terminals is a characteristic feature of brain-localized zinc, and

  • its release is dependent on neural activity.

Retardation of the growth and development of CNS tissues have been linked to low zinc levels. Peripheral neuropathy, spina bifida, hydrocephalus, anencephalus, epilepsy and Pick’s disease have been linked to zinc deficiency. However, the body cannot tolerate excessive amounts of zinc.

The relationship between zinc and neurodegeneration, specifically AD, has been interpreted in several ways. One study has proposed that β-amyloid has a greater propensity to

  • form insoluble amyloid in the presence of
  • high physiological levels of zinc.

Insoluble amyloid is thought to

  • aggregate to form plaques,

which is a main pathological feature of AD. Further studies have shown that

  • chelation of zinc ions can deform and disaggregate plaques.

In AD, the most prominent injuries are found in

  • hippocampal pyramidal neurons, acetylcholine-containing neurons in the basal forebrain, and in
  • somatostatin-containing neurons in the forebrain.

All of these neurons are known to favor

  • rapid and direct entry of zinc in high concentration
  • leaving neurons frequently exposed to high dosages of zinc.

This is thought to promote neuronal cell damage through oxidative stress and mitochondrial dysfunction. Excessive levels of zinc are also capable of

  • inhibiting Ca2+ and Na+ voltage gated channels
  • and up-regulating the cellular levels of reactive oxygen species (ROS).

High levels of zinc are found in Alzheimer’s brains indicating a possible zinc related neurodegeneration. A study conducted with mouse neuronal cells has shown that even a 24-h exposure to high levels of zinc (40 μm) is sufficient to degenerate cells.

If the human diet is deficient in zinc, the body

  • efficiently conserves zinc at the tissue level by compensating other cellular mechanisms

to delay the dietary deficiency effects of zinc. These include reduction of cellular growth rate and zinc excretion levels, and

  • redistribution of available zinc to more zinc dependent cells or organs.

A novel method of measuring metallothionein (MT) levels was introduced as a biomarker for the

  • assessment of the zinc status of individuals and populations.

In humans, erythrocyte metallothionein (E-MT) levels may be considered as an indicator of zinc depletion and repletion, as E-MT levels are sensitive to dietary zinc intake. It should be noted here that MT plays an important role in zinc homeostasis by acting

  • as a target for zinc ion binding and thus
  • assisting in the trafficking of zinc ions through the cell,
  • which may be similar to that of zinc transporters

Zinc Transporters

Deficient or excess amounts of zinc in the body can be catastrophic to the integrity of cellular biochemical and biological systems. The gastrointestinal system controls the absorption, excretion and the distribution of zinc, although the hydrophilic and high-charge molecular characteristics of zinc are not favorable for passive diffusion across the cell membranes. Zinc movement is known to occur

  • via intermembrane proteins and zinc transporter (ZnT) proteins

These transporters are mainly categorized under two metal transporter families; Zip (ZRT, IRT like proteins) and CDF/ZnT (Cation Diffusion Facilitator), also known as SLC (Solute Linked Carrier) gene families: Zip (SLC-39) and ZnT (SLC-30). More than 20 zinc transporters have been identified and characterized over the last two decades (14 Zips and 8 ZnTs).

Members of the SLC39 family have been identified as the putative facilitators of zinc influx into the cytosol, either from the extracellular environment or from intracellular compartments (Figure 1).

The identification of this transporter family was a result of gene sequencing of known Zip1 protein transporters in plants, yeast and human cells. In contrast to the SLC39 family, the SLC30 family facilitates the opposite process, namely zinc efflux from the cytosol to the extracellular environment or into luminal compartments such as secretory granules, endosomes and synaptic vesicles; thus decreasing intracellular zinc availability (Figure 1). ZnT3 is the most important in the brain where

  • it is responsible for the transport of zinc into the synaptic vesicles of
  • glutamatergic neurons in the hippocampus and neocortex,


Figure 1. Putative cellular localization of some of the different human zinc transporters (i.e., Zip1- Zip4 and ZnT1- ZnT7). Arrows indicate the direction of zinc passage by the appropriate putative zinc transporters in a generalized human cell. Although there are fourteen Zips and eight ZnTs known so far, only the main zinc transporters are illustrated in this figure for clarity and brevity.

Figure 1: Subcellular localization and direction of transport of the zinc transporter families, ZnT and ZIP. Arrows show the direction of zinc mobilization for the ZnT (green) and ZIP (red) proteins. A net gain in cytosolic zinc is achieved by the transportation of zinc from the extracellular region and organelles such as the endoplasmic reticulum (ER) and Golgi apparatus by the ZIP transporters. Cytosolic zinc is mobilized into early secretory compartments such as the ER and Golgi apparatus by the ZnT transporters. Figures were produced using Servier Medical Art, http://www.servier.com/.   http://www.hindawi.com/journals/jnme/2012/173712.fig.001.jpg

zinc transporters

zinc transporters


Early zinc signaling (EZS) and late zinc signaling (LZS)

Early zinc signaling (EZS) and late zinc signaling (LZS)

http://www.hindawi.com/journals/jnme/2012/floats/173712/thumbnails/173712.fig.002_th.jpg


Figure 2: Early zinc signaling (EZS) and late zinc signaling (LZS). EZS involves transcription-independent mechanisms where an extracellular stimulus directly induces an increase in zinc levels within several minutes by releasing zinc from intracellular stores (e.g., endoplasmic reticulum). LSZ is induced several hours after an external stimulus and is dependent on transcriptional changes in zinc transporter expression. Components of this figure were produced using Servier Medical Art, http://www.servier.com/ and adapted from Fukada et al. [30].


DHA and Zinc Homeostasis

Many studies have identified possible associations between DHA levels, zinc homeostasis, neuroprotection and neurodegeneration. Dietary DHA deficiency resulted in

  • increased zinc levels in the hippocampus and
  • elevated expression of the putative zinc transporter, ZnT3, in the rat brain.

Altered zinc metabolism in neuronal cells has been linked to neurodegenerative conditions such as AD. A study conducted with transgenic mice has shown a significant link between ZnT3 transporter levels and cerebral amyloid plaque pathology. When the ZnT3 transporter was silenced in transgenic mice expressing cerebral amyloid plaque pathology,

  • a significant reduction in plaque load
  • and the presence of insoluble amyloid were observed.

In addition to the decrease in plaque load, ZnT3 silenced mice also exhibited a significant

  • reduction in free zinc availability in the hippocampus
  • and cerebral cortex.

Collectively, the findings from this study are very interesting and indicate a clear connection between

  • zinc availability and amyloid plaque formation,

thus indicating a possible link to AD.

DHA supplementation has also been reported to limit the following:

  1. amyloid presence,
  2. synaptic marker loss,
  3. hyper-phosphorylation of Tau,
  4. oxidative damage and
  5. cognitive deficits in transgenic mouse model of AD.

In addition, studies by Stoltenberg, Flinn and colleagues report on the modulation of zinc and the effect in transgenic mouse models of AD. Given that all of these are classic pathological features of AD, and considering the limiting nature of DHA in these processes, it can be argued that DHA is a key candidate in preventing or even curing this debilitating disease.

In order to better understand the possible links and pathways of zinc and DHA with neurodegeneration, we designed a study that incorporates all three of these aspects, to study their effects at the cellular level. In this study, we were able to demonstrate a possible link between omega-3 fatty acid (DHA) concentration, zinc availability and zinc transporter expression levels in cultured human neuronal cells.

When treated with DHA over 48 h, ZnT3 levels were markedly reduced in the human neuroblastoma M17 cell line. Moreover, in the same study, we were able to propose a possible

  • neuroprotective mechanism of DHA,

which we believe is exerted through

  • a reduction in cellular zinc levels (through altering zinc transporter expression levels)
  • that in turn inhibits apoptosis.

DHA supplemented M17 cells also showed a marked depletion of zinc uptake (up to 30%), and

  • free zinc levels in the cytosol were significantly low compared to the control

This reduction in free zinc availability was specific to DHA; cells treated with EPA had no significant change in free zinc levels (unpublished data). Moreover, DHA-repleted cells had

  • low levels of active caspase-3 and
  • high Bcl-2 levels compared to the control treatment.

These findings are consistent with previous published data and further strengthen the possible

  • correlation between zinc, DHA and neurodegeneration.

On the other hand, recent studies using ZnT3 knockout (ZnT3KO) mice have shown the importance of

  • ZnT3 in memory and AD pathology.

For example, Sindreu and colleagues have used ZnT3KO mice to establish the important role of

  • ZnT3 in zinc homeostasis that modulates presynaptic MAPK signaling
  • required for hippocampus-dependent memory

Results from these studies indicate a possible zinc-transporter-expression-level-dependent mechanism for DHA neuroprotection.

Collectively from these studies, the following possible mechanism can be proposed (Figure 2).

possible benefits of DHA in neuroprotection through reduction of ZnT3 transporter

possible benefits of DHA in neuroprotection through reduction of ZnT3 transporter


Figure 2. Proposed neuroprotection mechanism of docosahexaenoic acid (DHA) in reference to synaptic zinc. Schematic diagram showing possible benefits of DHA in neuroprotection through reduction of ZnT3 transporter expression levels in human neuronal cells, which results in a reduction of zinc flux and thus lowering zinc concentrations in neuronal synaptic vesicles, and therefore contributing to a lower incidence of neurodegenerative diseases (ND), such as Alzheimer’s disease (AD).

More recent data from our research group have also shown a link between the expression levels of histone H3 and H4 proteins in human neuronal cells in relation to DHA and zinc. Following DHA treatment, both H3 and H4 levels were up-regulated. In contrast, zinc treatment resulted in a down-regulation of histone levels. Both zinc and DHA have shown opposing effects on histone post-translational modifications, indicating a possible distinctive epigenetic pattern. Upon treatment with zinc, M17 cells displayed an increase in histone deacetylase (HDACs) and a reduction in histone acetylation. Conversely, with DHA treatment, HDAC levels were significantly reduced and the acetylation of histones was up-regulated. These findings also support a possible interaction between DHA and zinc availability.

Conclusions

It is possible to safely claim that there is more than one potential pathway by which DHA and zinc interact at a cellular level, at least in cultured human neuronal cells. Significance and importance of both DHA and zinc in neuronal survival is attested by the presence of these multiple mechanisms.
Most of these reported studies were conducted using human neuroblastoma cells, or similar cell types, due to the lack of live mature human neuronal cells. Thus, the results may differ from results achieved under actual human physiological conditions due to the structural and functional differences between these cells and mature human neurons. Therefore, an alternative approach that can mimic the human neuronal cells more effectively would be advantageous.

Sphingosine-1-phosphate signaling as a therapeutic target          

E Giannoudaki, DJ Swan, JA Kirby, S Ali

Applied Immunobiology and Transplantation Research Group, Institute of Cellular Medicine, Faculty of Medical Sciences, Newcastle University, Newcastle upon Tyne, UK

Cell Health and Cytoskeleton 2012; 4: 63–72

S1P is a 379Da member of the lysophospholipid family. It is the direct metabolite of sphingosine through the action of two sphingosine kinases, SphK1 and SphK2. The main metabolic pathway starts with the hydrolysis of sphingomyelin, a membrane sphingolipid, into ceramide by the enzyme sphingomyelinase and the subsequent production of sphingosine by ceramidase (Figure 1). Ceramide can also be produced de novo in the endoplasmic reticulum (ER) from serine and palmitoyl coenzyme A through multiple intermediates. S1P production is regulated by various S1P-specific and general lipid phosphatases, as well as S1P lyase, which irreversibly degrades S1P into phosphoethanolamine and hexadecanal. The balance between intracellular S1P and its metabolite ceramide can determine cellular fate. Ceramide promotes apoptosis, while S1P suppresses cell death and promotes cell survival. This creates an S1P ceramide “rheostat” inside the cells. S1P lyase expression in tissue is higher than it is in erythrocytes and platelets, the main “suppliers” of S1P in blood. This causes a tissue–blood gradient of S1P, which is important in many S1P-mediated responses, like the lymphocyte egress from lymphoid organs.

S1P signaling overview

S1P is produced inside cells; however, it can also be found extracellularly, in a variety of different tissues. It is abundant in the blood, at concentrations of 0.4–1.5 μM, where it is mainly secreted by erythrocytes and platelets. Blood S1P can be found separately, but mainly it exists in complexes with high-density lipoprotein (HDL) (∼60%).  Many of the cardioprotective effects of HDL are hypothesized to involve S1P. Before 1996, S1P was thought to act mainly intracellularly as a second messenger. However, the identification of several GPCRs that bind S1P led to the initiation of many studies on

  • extracellular S1P signaling through those receptors.

There are five receptors that have been identified currently. These can be coupled with different G-proteins. Assuming that each receptor coupling with a G protein has a slightly different function, one can recognize the complexity of S1P receptor signaling.

S1P as a second messenger

S1P is involved in many cellular processes through its GPCR signaling; studies demonstrate that S1P also acts at an intracellular level. Intracellular S1P plays a role in maintaining the balance of cell survival signal toward apoptotic signals, creating a

  • cell “rheostat” between S1P and its precursor ceramide.

Important evidence that S1P can act intracellularly as a second messenger came from yeast (Saccharomyces cerevisiae) and plant (Arabidopsis thaliana) cells. Yeast cells do not express any S1P receptors, although they can be affected by S1P during heat-shock responses. Similarly, Arabidopsis has only one GPCR-like protein, termed “GCR1,” which does not bind S1P, although S1P regulates stomata closure during drought.

Sphingosine-1-phosphate

Sphingosine-1-phosphate

In mammals, the sphingosine kinases have been found to localize in different cell compartments, being responsible for the accumulation of S1P in those compartments to give intracellular signals. In mitochondria, for instance,

  • S1P was recently found to interact with prohibitin 2,

a conserved protein that maintains mitochondria assembly and function. According to the same study,

SphK2 is the major producer of S1P in mitochondria and the knockout of its gene can cause

  • disruption of mitochondrial respiration and cytochrome c oxidase function.

SphK2 is also present in the nucleus of many cells and has been implicated to cause cell cycle arrest, and it causes S1P accumulation in the nucleus. It seems that nuclear S1P is affiliated with the histone deacetylases HDAC1 and HDAC2,

  • inhibiting their activity, thus having an indirect effect in epigenetic regulation of gene expression.

In the ER, SphK2 has been identified to translocate during stress, and promote apoptosis. It seems that S1P has specific targets in the ER that cause apoptosis, probably through calcium mobilization signals.

Sphingosine 1-phosphate (S1P) is a small bioactive lipid molecule that is involved in several processes both intracellularly and extracellularly. It acts intracellularly

  • to promote the survival and growth of the cell,

through its interaction with molecules in different compartments of the cell.

It can also exist at high concentrations extracellularly, in the blood plasma and lymph. This causes an S1P gradient important for cell migration. S1P signals through five G protein-coupled receptors, S1PR1–S1PR5, whose expression varies in different types of cells and tissue. S1P signaling can be involved in physiological and pathophysiological conditions of the cardiovascular, nervous, and immune systems and diseases such as ischemia/reperfusion injury, autoimmunity, and cancer. In this review, we discuss how it can be used to discover novel therapeutic targets.

The involvement of S1P signaling in disease

In a mouse model of myocardial ischemia-reperfusion injury (IRI), S1P and its carrier, HDL, can help protect myocardial tissue and decrease the infarct size. It seems they reduce cardiomyocyte apoptosis and neutrophil recruitment to the ischemic tissue and may decrease leukocyte adhesion to the endothelium. This effect appears to be S1PR3 mediated, since in S1PR3 knockout mice it is alleviated.

Ischemia activates SphK1, which is then translocated to the plasma membrane. This leads to an increase of intracellular S1P, helping to promote cardiomyocyte survival against apoptosis, induced by ceramide. SphK1 knockout mice cannot be preconditioned against IRI, whereas SphK1 gene induction in the heart protects it from IRI. Interestingly, a recent study shows SphK2 may also play a role, since its knockout reduces the cardioprotective effects of preconditioning. Further, administration of S1P or sphingosine during reperfusion results in better recovery and attenuation of damage to cardiomyocytes. As with preconditioning, SphK1 deficiency also affects post-conditioning of mouse hearts after ischemia reperfusion (IR).

S1P does not only protect the heart from IRI. During intestinal IR, multiple organs can be damaged, including the lungs. S1P treatment of mice during intestinal IR seems to have a protective effect on lung injury, probably due to suppression of iNOS-induced nitric oxide generation. In renal IRI, SphK1 seems to be important, since its deficiency increased the damage in kidney tissue, whereas the lentiviral overexpression of the SphK1 gene protected from injury. Another study suggests that, after IRI, apoptotic renal cells release S1P, which recruits macrophages through S1PR3 activation and might contribute to kidney regeneration and restoration of renal epithelium. However, SphK2 is negatively implicated in hepatic IRI, its inhibition helping protect hepatocytes and restoring mitochondrial function.

Further studies are implicating S1P signaling or sphingosine kinases in several kinds of cancer as well as autoimmune diseases.

Figure 2 FTY720-P causes retention of T cells in the lymph nodes.

Notes: C57BL/6 mice were injected with BALB/c splenocytes in the footpad to create an allogenic response then treated with FTY720-P or vehicle every day on days 2 to 5. On day 6, the popliteal lymph nodes were removed. Popliteal node-derived cells were mixed with BALB/c splenocytes in interferon gamma (IFN-γ) cultured enzyme-linked immunosorbent spot reactions. Bars represent the mean number of IFN-γ spot-forming cells per 1000 popliteal node-derived cells, from six mice treated with vehicle and seven with FTY720-P. **P , 0.01.  (not shown)

Fingolimod (INN, trade name Gilenya, Novartis) is an immunomodulating drug, approved for treating multiple sclerosis. It has reduced the rate of relapses in relapsing-remitting multiple sclerosis by over half. Fingolimod is a sphingosine-1-phosphate receptor modulator, which sequesters lymphocytes in lymph nodes, preventing them from contributing to an autoimmune reaction.

Fingolimod3Dan

Fingolimod3Dan


http://upload.wikimedia.org/wikipedia/commons/thumb/4/48/Fingolimod3Dan.gif/200px-Fingolimod3Dan.gif

The S1P antagonist FTY720 has been approved by the US Food and Drug Administration to be used as a drug against multiple sclerosis (MS). FTY720 is in fact a prodrug, since it is phosphorylated in vivo by SphK2 into FTY720-P, an S1P structural analog, which can activate S1PR1, 3, 4, and 5. FTY720-P binding to S1PR1 causes internalization of the receptor, as does S1P – but instead of recycling it back to the cell surface, it promotes its ubiquitination and degradation at the proteasome. This has a direct effect on lymphocyte trafficking through the lymph nodes, since it relies on S1PR1 signaling and S1P gradient (Figure 2). In MS, it stops migrating lymphocytes into the brain, but it may also have direct effects on the CNS through neuroprotection. FTY720 can pass the blood–brain barrier and it could be phosphorylated by local sphingosine kinases to act through S1PR1 and S1PR3 receptors that are mainly expressed in the CNS. In MS lesions, astrocytes upregulate those two receptors and it has been shown that FTY720-P treatment in vitro inhibits astrocyte production of inflammatory cytokines. A recent study confirms the importance of S1PR3 signaling on activated astrocytes, as well as SphK1, that are upregulated and promote the secretion of the potentially neuroprotective cytokine CXCL-1.

There are several studies implicating the intracellular S1P ceramide rheostat to cancer cell survival or apoptosis and resistance to chemotherapy or irradiation in vitro. Studies with SphK1 inhibition in pancreatic, prostate cancers, and leukemia, show increased ceramide/S1P ratio and induction of apoptosis. However, S1P receptor signaling plays conflicting roles in cancer cell migration and metastasis.

Modulation of S1P signaling: therapeutic potential

S1P signaling can be involved in many pathophysiological conditions. This means that we could look for therapeutic targets in all the molecules taking part in S1P signaling and production, most importantly the S1P receptors and the sphingosine kinases. S1P agonists and antagonists could also be used to modulate S1P signaling during pathological conditions.

S1P can have direct effects on the cardiovascular system. During IRI, intracellular S1P can protect the cardiomyocytes and promote their survival. Pre- or post-conditioning of the heart with S1P could be used as a treatment, but upregulation of sphingosine kinases could also increase intracellular S1P bioavailability. S1P could also have effects on endothelial cells and neutrophil trafficking. Vascular endothelial cells mainly express S1PR1 and S1PR3; only a few types express S1PR2. S1PR1 and S1PR3 activation on these cells has been shown to enhance their chemotactic migration, probably through direct phosphorylation of S1PR1 by Akt, in a phosphatidylinositol 3-kinase and Rac1-dependent signaling pathway. Moreover, it stimulates endothelial cell proliferation through an ERK pathway. S1PR2 activation, however, inhibits endothelial cell migration, morphogenesis, and angiogenesis, most likely through Rho-dependent inhibition of Rac signaling pathway, as Inoki et al showed in mouse cells with the use of S1PR1 and S1PR3 specific antagonists.

Regarding permeability of the vascular endothelium and endothelial barrier integrity, S1P receptors can have different effects. S1PR1 activation enhances endothelial barrier integrity by stimulation of cellular adhesion and upregulation of adhesion molecules. However, S1PR2 and S1PR3 have been shown to have barrier-disrupting effects in vitro, and vascular permeability increasing effects in vivo. All the effects S1P can have on vascular endothelium and smooth muscle cells suggest that activation of S1PR2, not S1PR1 and S1PR3, signaling, perhaps with the use of S1PR2 specific agonists, could be used therapeutically to inhibit angiogenesis and disrupt vasculature, suppressing tumor growth and progression.

An important aspect of S1P signaling that is being already therapeutically targeted, but could be further investigated, is immune cell trafficking. Attempts have already been made to regulate lymphocyte cell migration with the use of the drug FTY720, whose phosphorylated form can inhibit the cells S1PR1-dependent egress from the lymph nodes, causing lymphopenia. FTY720 is used as an immunosuppressant for MS but is also being investigated for other autoimmune conditions and for transplantation. Unfortunately, Phase II and III clinical trials for the prevention of kidney graft rejection have not shown an advantage over standard therapies. Moreover, FTY720 can have some adverse cardiac effects, such as bradycardia. However, there are other S1PR1 antagonists that could be considered instead, including KRP-203, AUY954, and SEW2871. KRP-203 in particular has been shown to prolong rat skin and heart allograft survival and attenuate chronic rejection without causing bradycardia, especially when combined with other immunomodulators.

There are studies that argue S1P pretreatment has a negative effect on neutrophil chemotaxis toward the chemokine CXCL-8 (interleukin-8) or the potent chemoattractant formyl-methionyl-leucyl-phenylalanine. S1P pretreatment might also inhibit trans-endothelial migration of neutrophils, without affecting their adhesion to the endothelium. S1P effects on neutrophil migration toward CXCL-8 might be the result of S1PRs cross-linking with the CXCL-8 receptors in neutrophils, CXCR-1 and CXCR-2. Indeed, there is evidence suggesting S1PR4 and S1PR3 form heterodimers with CXCR-1 in neutrophils. Another indication that S1P plays a role in neutrophil trafficking is a recent paper on S1P lyase deficiency, a deficiency that impairs neutrophil migration from blood to tissue in knockout mice.

S1P lyase and S1PRs in neutrophils may be new therapeutic targets against IRI and inflammatory conditions in general. Consistent with these results, another study has shown that inhibition of S1P lyase can have a protective effect on the heart after IRI and this effect is alleviated when pretreated with an S1PR1 and S1PR3 antagonist. Inhibition was achieved with a US Food and Drug Administration-approved food additive, 2-acetyl-4-tetrahydroxybutylimidazole, providing a possible new drug perspective. Another S1P lyase inhibitor, LX2931, a synthetic analog of 2-acetyl-4-tetrahydroxybutylimidazole, has been shown to cause peripheral lymphopenia when administered in mice, providing a potential treatment for autoimmune diseases and prevention of graft rejection in transplantation. This molecule is currently under Phase II clinical trials in rheumatoid arthritis patients.

S1P signaling research has the potential to discover novel therapeutic targets. S1P signaling is involved in many physiological and pathological processes. However, the complexity of S1P signaling makes it necessary to consider every possible pathway, either through its GPCRs, or intracellularly, with S1P as a second messenger. Where the activation of one S1P receptor may lead to the desired outcome, the simultaneous activation of another S1P receptor may lead to the opposite outcome. Thus, if we are to target a specific signaling pathway, we might need specific agonists for S1P receptors to activate one S1P receptor pathway, while, at the same time, we might need to inhibit another through S1P receptor antagonists.

Evidence of sphingolipid signaling in cancer

Biologically active lipids are important cellular signaling molecules and play a role in cell communication and cancer cell proliferation, and cancer stem cell biology.  A recent study in ovarian cancer cell lines shows that exogenous sphingosine 1 phosphate (SIP1) or overexpression of the sphingosine kinase (SPHK1) increases ovarian cancer cell proliferation, invasion and contributes to cancer stem cell like phenotype.  The diabetes drug metformin was shown to be an inhibitor of SPHK1 and reduce ovarian cancer tumor growth.

 2019 Apr;17(4):870-881. doi: 10.1158/1541-7786.MCR-18-0409. Epub 2019 Jan 17.

SPHK1 Is a Novel Target of Metformin in Ovarian Cancer.

Abstract

The role of phospholipid signaling in ovarian cancer is poorly understood. Sphingosine-1-phosphate (S1P) is a bioactive metabolite of sphingosine that has been associated with tumor progression through enhanced cell proliferation and motility. Similarly, sphingosine kinases (SPHK), which catalyze the formation of S1P and thus regulate the sphingolipid rheostat, have been reported to promote tumor growth in a variety of cancers. The findings reported here show that exogenous S1P or overexpression of SPHK1 increased proliferation, migration, invasion, and stem-like phenotypes in ovarian cancer cell lines. Likewise, overexpression of SPHK1 markedly enhanced tumor growth in a xenograft model of ovarian cancer, which was associated with elevation of key markers of proliferation and stemness. The diabetes drug, metformin, has been shown to have anticancer effects. Here, we found that ovarian cancer patients taking metformin had significantly reduced serum S1P levels, a finding that was recapitulated when ovarian cancer cells were treated with metformin and analyzed by lipidomics. These findings suggested that in cancer the sphingolipid rheostat may be a novel metabolic target of metformin. In support of this, metformin blocked hypoxia-induced SPHK1, which was associated with inhibited nuclear translocation and transcriptional activity of hypoxia-inducible factors (HIF1α and HIF2α). Further, ovarian cancer cells with high SPHK1 were found to be highly sensitive to the cytotoxic effects of metformin, whereas ovarian cancer cells with low SPHK1 were resistant. Together, the findings reported here show that hypoxia-induced SPHK1 expression and downstream S1P signaling promote ovarian cancer progression and that tumors with high expression of SPHK1 or S1P levels might have increased sensitivity to the cytotoxic effects of metformin. IMPLICATIONS: Metformin targets sphingolipid metabolism through inhibiting SPHK1, thereby impeding ovarian cancer cell migration, proliferation, and self-renewal.

Nrf2:INrf2(Keap1) Signaling in Oxidative Stress

James W. Kaspar, Suresh K. Niture, and Anil K. Jaiswal*

Department of Pharmacology, University of Maryland School of Medicine, Baltimore, MD

Free Radic Biol Med. 2009 Nov 1; 47(9): 1304–1309. http://dx.doi.org:/10.1016/j.freeradbiomed.2009.07.035

Nrf2:INrf2(Keap1) are cellular sensors of chemical and radiation induced oxidative and electrophilic stress. Nrf2 is a nuclear transcription factor that

  • controls the expression and coordinated induction of a battery of defensive genes encoding detoxifying enzymes and antioxidant proteins.

This is a mechanism of critical importance for cellular protection and cell survival. Nrf2 is retained in the cytoplasm by an inhibitor INrf2. INrf2 functions as an adapter for

  • Cul3/Rbx1 mediated degradation of Nrf2.
  • In response to oxidative/electrophilic stress,
  • Nrf2 is switched on and then off by distinct

early and delayed mechanisms.

Oxidative/electrophilic modification of INrf2cysteine151 and/or PKC phosphorylation of Nrf2serine40 results in the escape or release of Nrf2 from INrf2. Nrf2 is stabilized and translocates to the nucleus, forms heterodimers with unknown proteins, and binds antioxidant response element (ARE) that leads to coordinated activation of gene expression. It takes less than fifteen minutes from the time of exposure

  • to switch on nuclear import of Nrf2.

This is followed by activation of a delayed mechanism that controls

  • switching off of Nrf2 activation of gene expression.

GSK3β phosphorylates Fyn at unknown threonine residue(s) leading to

  • nuclear localization of Fyn.

Fyn phosphorylates Nrf2tyrosine568 resulting in

  • nuclear export of Nrf2,
  • binding with INrf2 and
  • degradation of Nrf2.

The switching on and off of Nrf2 protects cells against free radical damage, prevents apoptosis and promotes cell survival.

NPRA-mediated suppression of AngII-induced ROS production contributes to the antiproliferative effects of B-type natriuretic peptide in VSMC

Pan Gao, De-Hui Qian, Wei Li,  Lan Huang
Mol Cell Biochem (2009) 324:165–172

http://dx.doi.org/10.1007/s11010-008-9995-y

Excessive proliferation of vascular smooth cells (VSMCs) plays a critical role in the pathogenesis of diverse vascular disorders, and inhibition of VSMCs proliferation has been proved to be beneficial to these diseases.

In this study, we investigated the antiproliferative effect of

  • B-type natriuretic peptide (BNP), a natriuretic peptide with potent antioxidant capacity,

on rat aortic VSMCs, and the possible mechanisms involved. The results indicate that

  • BNP potently inhibited Angiotensin II (AngII)-induced VSMCs proliferation,

as evaluated by [3H]-thymidine incorporation assay. Consistently, BNP significantly decreased

  • AngII-induced intracellular reactive oxygen species (ROS)
  • and NAD(P)H oxidase activity.

8-Br-cGMP, a cGMP analog,

  • mimicked these effects.

To confirm its mechanism, siRNA of natriuretic peptide receptor-A(NRPA) strategy technology was used

  • to block cGMP production in VSMCs, and
  • siNPRA attenuated the inhibitory effects of BNP in VSMCs.

Taken together, these results indicate that

  • BNP was capable of inhibiting VSMCs proliferation by
  • NPRA/cGMP pathway,

which might be associated with

  • the suppression of ROS production.

These results might be related, at least partly, to the anti-oxidant property of BNP.

Cellular prion protein is required for neuritogenesis: fine-tuning of multiple signaling pathways involved in focal adhesions and actin cytoskeleton dynamics

A Alleaume-Butaux, C Dakowski, M Pietri, S Mouillet-Richard, Jean-Marie Launay, O Kellermann, B Schneider

1INSERM, UMR-S 747, 2Paris Descartes University, Sorbonne Paris, 3Public Hospital of Paris, Department of Biochemistry, Paris, France; 4Pharma Research Department, Hoffmann La Roche Ltd, Basel, Switzerland

Cell Health and Cytoskeleton 2013; 5: 1–12

Neuritogenesis is a complex morphological phenomena accompanying neuronal differentiation. Neuritogenesis relies on the initial breakage of the rather spherical symmetry of neuroblasts and the formation of buds emerging from the postmitotic neuronal soma. Buds then evolve into neurites, which later convert into an axon or dendrites. At the distal tip of neurites, the growth cone integrates extracellular signals and guides the neurite to its target. The acquisition of neuronal polarity depends on deep modifications of the neuroblast cytoskeleton characterized by the remodeling and activation of focal adhesions (FAs) and localized destabilization of the actin network in the neuronal sphere.Actin instability in unpolarized neurons allows neurite sprouting, ie, the protrusion of microtubules, and subsequent neurite outgrowth. Once the neurite is formed, actin microfilaments recover their stability and exert a sheathed action on neurites, a dynamic process necessary for the maintenance and integrity of neurites.

A combination of extrinsic and intrinsic cues pilots the architectural and functional changes in FAs and the actin network along neuritogenesis. This process includes neurotrophic factors (nerve growth factor, brain derived neurotrophic factor, neurotrophin, ciliary neurotrophic factor, glial derived neurotrophic factor) and their receptors, protein components of the extracellular matrix (ECM) (laminin, vitronectin, fibronectin), plasma membrane integrins and neural cell adhesion molecules (NCAM), and intracellular molecular protagonists such as small G proteins (RhoA, Rac, Cdc42) and their downstream targets.

Neuritogenesis is a dynamic phenomenon associated with neuronal differentiation that allows a rather spherical neuronal stem cell to develop dendrites and axon, a prerequisite for the integration and transmission of signals. The acquisition of neuronal polarity occurs in three steps:

(1) neurite sprouting, which consists of the formation of buds emerging from the postmitotic neuronal soma;

(2) neurite outgrowth, which represents the conversion of buds into neurites, their elongation and evolution into axon or dendrites; and

(3) the stability and plasticity of neuronal polarity.

In neuronal stem cells, remodeling and activation of focal adhesions (FAs) associated with deep modifications of the actin cytoskeleton is a prerequisite for neurite sprouting and subsequent neurite outgrowth. A multiple set of growth factors and interactors located in the extracellular matrix and the plasma membrane orchestrate neuritogenesis

  • by acting on intracellular signaling effectors,
  • notably small G proteins such as RhoA, Rac, and Cdc42,
  • which are involved in actin turnover and the dynamics of FAs.

The cellular prion protein (PrPC), a glycosylphosphatidylinositol

  • (GPI)-anchored membrane protein

mainly known for its role in a group of fatal

  • neurodegenerative diseases,

has emerged as a central player in neuritogenesis.

Here, we review the contribution of PrPC to neuronal polarization and detail the current knowledge on the

  • signaling pathways fine-tuned by PrPC
  • to promote neurite sprouting, outgrowth, and maintenance.

We emphasize that PrPC-dependent neurite sprouting is a process in which PrPC

  • governs the dynamics of FAs and the actin cytoskeleton
  • via β1 integrin signaling.

The presence of PrPC is necessary to render neuronal stem cells

  • competent to respond to neuronal inducers and
  • to develop neurites.

In differentiating neurons, PrPC exerts

  • a facilitator role towards neurite elongation.

This function relies on the interaction of PrPC with a set of diverse partners such as

  1. elements of the extracellular matrix,
  2. plasma membrane receptors,
  3. adhesion molecules, and
  4. soluble factors that control actin cytoskeleton turnover through Rho-GTPase signaling.

Once neurons have reached their terminal stage of differentiation and acquired their polarized morphology, PrPC also

  • takes part in the maintenance of neurites.

By acting on tissue nonspecific alkaline phosphatase, or

  • matrix metalloproteinase type 9,

PrPC stabilizes interactions between

  • neurites and the extracellular matrix.

Keywords: prion, neuronal differentiation

Read Full Post »

« Newer Posts - Older Posts »