Hematologic Malignancies [2.4.3]
Writer and Curator: Larry H. Bernstein, MD, FCAP
Updated on 4/14/2016
Hematologic Malignancies
Not excluding lymphomas [solid tumors]
The following series of articles are discussions of current identifications, classification, and treatments of leukemias, myelodysplastic syndromes and myelomas.
6.2 Hematological Malignancies
6.2.1 Ontogenesis of blood elements
6.2.1.1 Erythropoiesis
6.2.1.2 White blood cell series: myelopoiesis
6.2.1.3 Thrombocytogenesis
6.2.2 Classification of hematopoietic cancers
6.2.2.1 Primary Classification
6.2.2.1.1 Acute leukemias
6.2.2.1.1 Myelodysplastic syndromes
6.2.2.1.2 Acute myeloid leukemia
6.2.2.1.3 Acute lymphoblastic leukemia
6.2.2.2 Myeloproliferative Disorders
6.2.2.2.1 Chronic myeloproliferative disorders
6.2.2.2.2 Chronic myelogenous leukemia and related disorders
6.2.2.2.3 Myelofibrosis, including chronic idiopathic
6.2.2.2.4 Polycythemia, including polycythemia rubra vera
6.2.2.2.5 Thrombocytosis, including essential thrombocythemia
6.2.2.3 Chronic lymphoid leukemia and other lymphoid leukemias
6.2.2.4 Lymphomas
6.2.2.4.1 Non-Hodgkin Lymphoma
6.2.2.4.2 Hodgkin lymphoma
6.2.2.5 Lymphoproliferative disorders associated with immunodeficiency
6.2.2.6 Plasma Cell dyscrasias
6.2.2.7 Mast cell disease and Histiocytic neoplasms
6.2.3 Secondary Classification
6.2.3.1 Nuance – PathologyOutlines
6.2.3.1..1-8
6.2.4 Diagnostics
6.2.4.1 Computer-aided diagnostics
6.2.4.1.1 Back-to-Front Design
6.2.4.1.2 Realtime Clinical Expert Support
6.2.4.1.3 Regression: A richly textured method for comparison and classification of predictor variables
6.2.4.1.4 Converting Hematology Based Data into an Inferential Interpretation
6.2.4.1.5 A model for Thalassemia Screening using Hematology Measurements
6.2.4.1.6 Measurement of granulocyte maturation may improve the early diagnosis of the septic state.
6.2.4.1.7 The automated malnutrition assessment.
6.2.4.2 Molecular Diagnostics
6.2.4.2.1 Genomic Analysis of Hematological Malignancies
6.2.4.2.2 Next-generation sequencing in hematologic malignancies: what will be the dividends?
6.2.4.2.3 Leveraging cancer genome information in hematologic malignancies.
6.2.4.2.4 p53 mutations are associated with resistance to chemotherapy and short survival in hematologic malignancies
6.2.4.2.5 Genomic approaches to hematologic malignancies
6.2.5 Treatment of hematopoietic cancers
6.2.5.1 Treatments for leukemia by type
6.2.5.1.1 Acute lymphocytic leukemias
6.2.5.1.2 Treatment of Acute Lymphoblastic Leukemia
6.2.5.1.3 Acute Lymphoblastic Leukemia
6.2.5.1.4 Gene-Expression Patterns in Drug-Resistant Acute Lymphoblastic Leukemia Cells and Response to Treatment
6.2.5.1.5 Leukemias Treatment & Management
6.2.5.1.6 Treatments and drugs
6.2.5.2 Acute Myeloid Leukemia
6.2.5.2.1 New treatment approaches in acute myeloid leukemia: review of recent clinical studies
6.2.5.2.2 Novel approaches to the treatment of acute myeloid leukemia.
6.2.5.2.3 Current treatment of acute myeloid leukemia
6.2.5.2.4 Adult Acute Myeloid Leukemia Treatment (PDQ®)
6.2.5.3 Treatment for CML
6.2.5.3.1 Chronic Myelogenous Leukemia Treatment (PDQ®)
6.2.5.3.2 What`s new in chronic myeloid leukemia research and treatment?
6.2.5.4 Chronic Lymphocytic Leukemia
6.2.5.4.1 Chronic Lymphocytic Leukemia Treatment (PDQ®)
6.2.5.4.2 Results from the Phase 3 Resonate™ Trial
6.2.5.4.3 Typical treatment of chronic lymphocytic leukemia
6.2.5.5 Lymphoma treatment
6.2.5.5.1 Overview
6.2.5.5.2 Chemotherapy
6.2.6 Primary treatments
6.2.6.1 Total body irradiation (TBI)
6.2.6.2 Bone marrow (BM) transplantation
6.2.6.2.1 Autologous stem cell transplantation
6.2.6.2.2 Hematopoietic stem cell transplantation
6.2.7 Supportive Therapies
6.2.7.1 Blood transfusions
6.2.7.2 Erythropoietin
6.2.7.3 G-CSF (granulocyte-colony stimulating factor)
6.2.7.4 Plasma exchange (plasmapheresis)
6.2.7.5 Platelet transfusions
6.2.7.6 Steroids
6.2.1 Ontogenesis of the blood elements: hematopoiesis
http://www.britannica.com/EBchecked/topic/69747/blood-cell-formation
Blood cells are divided into three groups: the red blood cells (erythrocytes), the white blood cells (leukocytes), and the blood platelets (thrombocytes). The white blood cells are subdivided into three broad groups: granulocytes, lymphocytes, and monocytes.
Blood cells do not originate in the bloodstream itself but in specific blood-forming organs, notably the marrow of certain bones. In the human adult, the bone marrow produces all of the red blood cells, 60–70 percent of the white cells (i.e., the granulocytes), and all of the platelets. The lymphatic tissues, particularly the thymus, the spleen, and the lymph nodes, produce the lymphocytes (comprising 20–30 percent of the white cells). The reticuloendothelial tissues of the spleen, liver, lymph nodes, and other organs produce the monocytes (4–8 percent of the white cells). The platelets, which are small cellular fragments rather than complete cells, are formed from bits of the cytoplasm of the giant cells (megakaryocytes) of the bone marrow.
In the human embryo, the first site of blood formation is the yolk sac. Later in embryonic life, the liver becomes the most important red blood cell-forming organ, but it is soon succeeded by the bone marrow, which in adult life is the only source of both red blood cells and the granulocytes. Both the red and white blood cells arise through a series of complex, gradual, and successive transformations from primitive stem cells, which have the ability to form any of the precursors of a blood cell. Precursor cells are stem cells that have developed to the stage where they are committed to forming a particular kind of new blood cell.
In a normal adult the red cells of about half a liter (almost one pint) of blood are produced by the bone marrow every week. Almost 1 percent of the body’s red cells are generated each day, and the balance between red cell production and the removal of aging red cells from the circulation is precisely maintained.

Cells-in-the-Bone-Marrow-1024×747
http://interactive-biology.com/wp-content/uploads/2012/07/Cells-in-the-Bone-Marrow-1024×747.png
6.2.1.1 Erythropoiesis
http://www.interactive-biology.com/3969/erythropoiesis-formation-of-red-blood-cells/
Erythropoiesis – Formation of Red Blood Cells
Because of the inability of erythrocytes (red blood cells) to divide to replenish their own numbers, the old ruptured cells must be replaced by totally new cells. They meet their demise because they don’t have the usual specialized intracellular machinery, which controls cell growth and repair, leading to a short life span of 120 days.
This short life span necessitates the process erythropoiesis, which is the formation of red blood cells. All blood cells are formed in the bone marrow. This is the erythrocyte factory, which is soft, highly cellar tissue that fills the internal cavities of bones.
Erythrocyte differentiation takes place in 8 stages. It is the pathway through which an erythrocyte matures from a hemocytoblast into a full-blown erythrocyte. The first seven all take place within the bone marrow. After stage 7 the cell is then released into the bloodstream as a reticulocyte, where it then matures 1-2 days later into an erythrocyte. The stages are as follows:
- Hemocytoblast, which is a pluripotent hematopoietic stem cell
- Common myeloid progenitor, a multipotent stem cell
- Unipotent stem cell
- Pronormoblast
- Basophilic normoblast also called an erythroblast.
- Polychromatophilic normoblast
- Orthochromatic normoblast
- Reticulocyte
These characteristics can be seen during the course of erythrocyte maturation:
- The size of the cell decreases
- The cytoplasm volume increases
- Initially there is a nucleus and as the cell matures the size of the nucleus decreases until it vanishes with the condensation of the chromatin material.
Low oxygen tension stimulates the kidneys to secrete the hormone erythropoietin into the blood, and this hormone stimulates the bone marrow to produce erythrocytes.
Rarely, a malignancy or cancer of erythropoiesis occurs. It is referred to as erythroleukemia. This most likely arises from a common myeloid precursor, and it may occur associated with a myelodysplastic syndrome.
Summary of erythrocyte maturation
6.2.1.2 White blood cell series: myelopoiesis
http://www.nlm.nih.gov/medlineplus/ency/presentations/100151_3.htm
http://www.nlm.nih.gov/medlineplus/ency/images/ency/fullsize/15220.jpg
There are various types of white blood cells (WBCs) that normally appear in the blood: neutrophils (polymorphonuclear leukocytes; PMNs), band cells (slightly immature neutrophils), T-type lymphocytes (T cells), B-type lymphocytes (B cells), monocytes, eosinophils, and basophils. T and B-type lymphocytes are indistinguishable from each other in a normal slide preparation. Any infection or acute stress will result in an increased production of WBCs. This usually entails increased numbers of cells and an increase in the percentage of immature cells (mainly band cells) in the blood. This change is referred to as a “shift to the left” People who have had a splenectomy have a persistent mild elevation of WBCs. Drugs that may increase WBC counts include epinephrine, allopurinol, aspirin, chloroform, heparin, quinine, corticosteroids, and triamterene. Drugs that may decrease WBC counts include antibiotics, anticonvulsants, antihistamine, antithyroid drugs, arsenicals, barbiturates, chemotherapeutic agents, diuretics and sulfonamides. (Updated by: David C. Dugdale, III, MD)
https://www.med-ed.virginia.edu/courses/path/innes/nh/wcbmaturation.cfm
Note that the mature forms of the myeloid series (neutrophils, eosinophils, basophils), all have lobed (segmented) nuclei. The degree of lobation increases as the cells mature.
The earliest recognizable myeloid cell is the myeloblast (10-20m dia) with a large round to oval nucleus. There is fine diffuse immature chromatin (without clumping) and a prominant nucleolus.
The cytoplasm is basophilic without granules. Although one may see a small golgi area adjacent to the nucleus, granules are not usually visible by light microscopy. One should not see blast cells in the peripheral blood.

myeloblast x100b
https://www.med-ed.virginia.edu/courses/path/innes/images/nhjpeg/nh%20myeloblast%20x100b.jpeg
The promyelocyte (10-20m) is slightly larger than a blast. Its nucleus, although similar to a myeloblast shows slight chromatin condensation and less prominent nucleoli. The cytoplasm contains striking azurophilic granules or primary granules. These granules contain myeloperoxidase, acid phosphatase, and esterase enzymes. Normally no promyelocytes are seen in the peripheral blood.
At the point in development when secondary granules can be recognized, the cell becomes a myelocyte.

promyelocyte x100
https://www.med-ed.virginia.edu/courses/path/innes/images/nhjpeg/nh%20promyelocyte%20×100%20a.jpeg
Myelocytes (10-18m) are not normally found in the peripheral blood. Nucleoli may not be seen in the late myelocyte. Primary azurophilic granules are still present, but secondary granules predominate. Secondary granules (neut, eos, or baso) first appear adjacent to the nucleus. In neutrophils this is the “dawn” of neutrophilia.
Metamyelocytes (10-18m) have kidney shaped indented nuclei and dense chromatin along the nuclear membrane. The cytoplasm is faintly pink, and they have secondary granules (neutro, eos, or baso). Zero to one percent of the peripheral blood white cells may be metamyelocytes (juveniles).

metamyelocyte x100
https://www.med-ed.virginia.edu/courses/path/innes/images/nhjpeg/nh%20metamyelocyte%20×100.jpeg
Bands, slightly smaller than juveniles, are marked by a U-shaped or deeply indented nucleus.

band neutrophilx100a
https://www.med-ed.virginia.edu/courses/path/innes/images/nhjpeg/nh%20band%20x100a.jpeg
Segmented (segs) or polymorphonuclear (PMN) leukocytes (average 14 m dia) are distinguished by definite lobation with thin thread-like filaments of chromatin joining the 2-5 lobes. 45-75% of the peripheral blood white cells are segmented neutrophils.
https://www.med-ed.virginia.edu/courses/path/innes/images/nhjpeg/nh%20neutrophil%20×100%20d.jpeg
6.2.1.3 Thrombocytogenesis
The incredible journey: From megakaryocyte development to platelet formation
Kellie R. Machlus1,2 and Joseph E. Italiano Jr
JCB 2013; 201(6): 785-796
http://dx.doi.org:/10.1083/jcb.201304054
Large progenitor cells in the bone marrow called megakaryocytes (MKs) are the source of platelets. MKs release platelets through a series of fascinating cell biological events. During maturation, they become polyploid and accumulate massive amounts of protein and membrane. Then, in a cytoskeletal-driven process, they extend long branching processes, designated proplatelets, into sinusoidal blood vessels where they undergo fission to release platelets.

megakaryocyte production of platelets
http://dm5migu4zj3pb.cloudfront.net/manuscripts/26000/26891/medium/JCI0526891.f4.jpg

platelets and the immune continuum nri2956-f3
http://www.nature.com/nri/journal/v11/n4/images/nri2956-f3.jpg
6.2.2 Classification of hematological malignancies
Practical Diagnosis of Hematologic Disoreders. 4th edition. Vol 2.
Kjeldsberg CR, Ed. ASCP Press. 2006. Chicago, IL.
6.2.2.1 Primary Classification
6.2.2.1.1 Acute leukemias
6.2.2.1.1 Myelodysplastic syndromes
6.2.2.1.2 Acute myeloid leukemia
6.2.2.1.3 Acute lymphoblastic leukemia
6.2.2.2 Myeloproliferative Disorders
6.2.2.2.1 Chronic myeloproliferative disorders
6.2.2.2.2 Chronic myelogenous leukemia and related disorders
6.2.2.2.3 Myelofibrosis, including chronic idiopathic
6.2.2.2.4 Polycythemia, including polycythemia rubra vera
6.2.2.2.5 Thrombocytosis, including essential thrombocythemia
6.2.2.3 Chronic lymphoid leukemia and other lymphoid leukemias
6.2.2.4 Lymphomas
6.2.2.4.1 Non-Hodgkin Lymphoma
6.2.2.4.2 Hodgkin lymphoma
6.2.2.5 Lymphoproliferative disorders associated with immunodeficiency
6.2.2.6 Plasma Cell dyscrasias
6.2.2.7 Mast cell disease and Histiocytic neoplasms
6.2.3 Secondary Classification
6.2.3.1 Nuance – PathologyOutlines
Nat Pernick, Ed.
http://www.pathologyoutlines.com/leukemia.html
This site is up-to-date and revised periodically. It is the best site for pathology information.
6.2.4 Diagnostics
6.2.4.1 Computer-aided diagnostics
6.2.4.1.1 Back-to-Front Design
Robert Didner
Bell Laboratories
Decision-making in the clinical setting
Didner, R Mar 1999 Amer Clin Lab
Mr. Didner is an Independent Consultant in Systems Analysis, Information Architecture (Informatics) Operations Research, and Human Factors Engineering (Cognitive Psychology), Decision Information Designs, 29 Skyline Dr., Morristown, NJ07960, U.S.A.; tel.: 973-455-0489; fax/e-mail: bdidner@hotmail.com
A common problem in the medical profession is the level of effort dedicated to administration and paperwork necessitated by various agencies, which contributes to the high cost of medical care. Costs would be reduced and accuracy improved if the clinical data could be captured directly at the point they are generated in a form suitable for transmission to insurers or machine transformable into other formats. Such a capability could also be used to improve the form and the structure of information presented to physicians and support a more comprehensive database linking clinical protocols to outcomes, with the prospect of improving clinical outcomes. Although the problem centers on the physician’s process of determining the diagnosis and treatment of patients and the timely and accurate recording of that process in the medical system, it substantially involves the pathologist and laboratorian, who interact significantly throughout the in-formation-gathering process. Each of the currently predominant ways of collecting information from diagnostic protocols has drawbacks. Using blank paper to collect free-form notes from the physician is not amenable to computerization; such free-form data are also poorly formulated, formatted, and organized for the clinical decision-making they support. The alternative of preprinted forms listing the possible tests, results, and other in-formation gathered during the diagnostic process facilitates the desired computerization, but the fixed sequence of tests and questions they present impede the physician from using an optimal decision-making sequence. This follows because:
- People tend to make decisions and consider information in a step-by-step manner in which intermediate decisions are intermixed with data acquisition steps.
- The sequence in which components of decisions are made may alter the decision outcome.
- People tend to consider information in the sequence it is requested or displayed.
- Since there is a separate optimum sequence of tests and questions for each cluster of history and presenting symptoms, there is no one sequence of tests and questions that can be optimal for all presenting clusters.
- As additional data and test results are acquired, the optimal sequence of further testing and data acquisition changes, depending on the already acquired information.
Therefore, promoting an arbitrary sequence of information requests with preprinted forms may detract from outcomes by contributing to a non-optimal decision-making sequence. Unlike the decisions resulting from theoretical or normative processes, decisions made by humans are path dependent; that is, the out-come of a decision process may be different if the same components are considered in a different sequence.
Proposed solution
This paper proposes a general approach to gathering data at their source in computer-based form so as to improve the expected outcomes. Such a means must be interactive and dynamic, so that at any point in the clinical process the patient’s presenting symptoms, history, and the data already collected are used to determine the next data or tests requested. That de-termination must derive from a decision-making strategy designed to produce outcomes with the greatest value and supported by appropriate data collection and display techniques. The strategy must be based on the knowledge of the possible outcomes at any given stage of testing and information gathering, coupled with a metric, or hierarchy of values for assessing the relative desirability of the possible outcomes.
A value hierarchy
- The numbered list below illustrates a value hierarchy. In any particular instance, the higher-numbered values should only be considered once the lower- numbered values have been satisfied. Thus, a diagnostic sequence that is very time or cost efficient should only be considered if it does not increase the likelihood (relative to some other diagnostic sequence) that a life-threatening disorder may be missed, or that one of the diagnostic procedures may cause discomfort.
- Minimize the likelihood that a treatable, life-threatening disorder is not treated.
- Minimize the likelihood that a treatable, discomfort-causing disorder is not treated.
- Minimize the likelihood that a risky procedure(treatment or diagnostic procedure) is inappropriately administered.
- Minimize the likelihood that a discomfort-causing procedure is inappropriately administered.
- Minimize the likelihood that a costly procedure is inappropriately administered.
- Minimize the time of diagnosing and treating thepatient.8.Minimize the cost of diagnosing and treating the patient.
The above hierarchy is relative, not absolute; for many patients, a little bit of testing discomfort may be worth a lot of time. There are also some factors and graduations intentionally left out for expository simplicity (e.g., acute versus chronic disorders).This value hierarchy is based on a hypothetical patient. Clearly, the hierarchy of a health insurance carrier might be different, as might that of another patient (e.g., a geriatric patient). If the approach outlined herein were to be followed, a value hierarchy agreed to by a majority of stakeholders should be adopted.
Efficiency
Once the higher values are satisfied, the time and cost of diagnosis and treatment should be minimized. One way to do so would be to optimize the sequence in which tests are performed, so as to minimize the number, cost, and time of tests that need to be per-formed to reach a definitive decision regarding treatment. Such an optimum sequence could be constructed using Claude Shannon’s information theory.
According to this theory, the best next question to ask under any given situation (assuming the question has two possible outcomes) is that question that divides the possible outcomes into two equally likely sets. In the real world, all tests or questions are not equally valuable, costly, or time consuming; therefore, value(risk factors), cost, and time should be used as weighting factors to optimize the test sequence, but this is a complicating detail at this point.
A value scale
For dynamic computation of outcome values, the hierarchy could be converted into a weighted value scale so differing outcomes at more than one level of the hierarchy could be readily compared. An example of such a weighted value scale is Quality Adjusted Life Years (QALY).
Although QALY does not incorporate all of the factors in this example, it is a good conceptual starting place.
The display, request, decision-making relationship
For each clinical determination, the pertinent information should be gathered, organized, formatted, and formulated in a way that facilitates the accuracy, reliability, and efficiency with which that determination is made. A physician treating a patient with high cholesterol and blood pressure (BP), for example, may need to know whether or not the patient’s cholesterol and BP respond to weight changes to determine an appropriate treatment (e.g., weight control versus medication). This requires searching records for BP, certain blood chemicals (e.g., HDLs, LDLs, triglycerides, etc.), and weight from several
sources, then attempting to track them against each other over time. Manually reorganizing this clinical information each time it is used is extremely inefficient. More important, the current organization and formatting defies principles of human factors for optimally displaying information to enhance human information-processing characteristics, particularly for decision support.
While a discussion of human factors and cognitive psychology principles is beyond the scope of this paper, following are a few of the system design principles of concern:
- Minimize the load on short-term memory.
- Provide information pertinent to a given decision or component of a decision in a compact, contiguous space.
- Take advantage of basic human perceptual and pat-tern recognition facilities.
- Design the form of an information display to com-plement the decision-making task it supports.
F i g u re 1 shows fictitious, quasi-random data from a hypothetical patient with moderately elevated cholesterol. This one-page display pulls together all the pertinent data from six years of blood tests and related clinical measurements. At a glance, the physician’s innate pattern recognition, color, and shape perception facilities recognize the patient’s steadily increasing weight, cholesterol, BP, and triglycerides as well as the declining high-density lipoproteins. It would have taken considerably more time and effort to grasp this information from the raw data collection and blood test reports as they are currently presented in independent, tabular time slices.
Design the formulation of an information display to complement the decision-making task.
The physician may wish to know only the relationship between weight and cardiac risk factors rather than whether these measures are increasing or decreasing, or are within acceptable or marginal ranges. If so, Table 1 shows the correlations between weight and the other factors in a much more direct and simple way using the same data as in Figure 1. One can readily see the same conclusions about relations that were drawn from Figure 1.This type of abstract, symbolic display of derived information also makes it easier to spot relationships when the individual variables are bouncing up and down, unlike the more or less steady rise of most values in Figure 1. This increase in precision of relationship information is gained at the expense of other types of information (e.g., trends). To display information in an optimum form then, the system designer must know what the information demands of the task are at the point in the task when the display is to be used.
Present the sequence of information display clusters to complement an optimum decision-making strategy.
Just as a fixed sequence of gathering clinical, diagnostic information may lead to a far from optimum outcome, there exists an optimum sequence of testing, considering information, and gathering data that will lead to an optimum outcome (as defined by the value hierarchy) with a minimum of time and expense. The task of the information system designer, then, is to provide or request the right information, in the best form, at each stage of the procedure. For ex-ample, Figure 1 is suitable for the diagnostic phase since it shows the current state of the risk factors and their trends. Table 1, on the other hand, might be more appropriate in determining treatment, where there may be a choice of first trying a strict dietary treatment, or going straight to a combination of diet plus medication. The fact that Figure 1 and Table 1 have somewhat redundant information is not a problem, since they are intended to optimally provide information for different decision-making tasks. The critical need, at this point, is for a model of how to determine what information should be requested, what tests to order, what information to request and display, and in what form at each step of the decision-making process. Commitment to a collaborative relationship between physicians and laboratorians and other information providers would be an essential requirement for such an undertaking. The ideal diagnostic data-collection instrument is a flexible, computer-based device, such as a notebook computer or Personal Digital Assistant (PDA) sized device.
Barriers to interactive, computer-driven data collection at the source
As with any major change, it may be difficult to induce many physicians to change their behavior by interacting directly with a computer instead of with paper and pen. Unlike office workers, who have had to make this transition over the past three decades, most physicians’ livelihoods will not depend on converting to computer interaction. Therefore, the transition must be made attractive and the changes less onerous. Some suggestions follow:
- Make the data collection a natural part of the clinical process.
- Ensure that the user interface is extremely friendly, easy to learn, and easy to use.
- Use a small, portable device.
- Use the same device for collection and display of existing information (e.g., test results and his-tory).
- Minimize the need for free-form written data entry (use check boxes, forms, etc.).
- Allow the entry of notes in pen-based free-form (with the option of automated conversion of numeric data to machine-manipulable form).
- Give the physicians a more direct benefit for collecting data, not just a means of helping a clerk at an HMO second-guess the physician’s judgment.
- Improve administrative efficiency in the office.
- Make the data collection complement the clinical decision-making process.
- Improve information displays, leading to better outcomes.
- Make better use of the physician’s time and mental effort.
Conclusion
The medical profession is facing a crisis of information. Gathering information is costing a typical practice more and more while fees are being restricted by third parties, and the process of gathering this in-formation may be detrimental to current outcomes. Gathered properly, in machine-manipulable form, these data could be reformatted so as to greatly improve their value immediately in the clinical setting by leading to decisions with better outcomes and, in the long run, by contributing to a clinical data warehouse that could greatly improve medical knowledge. The challenge is to create a mechanism for data collection that facilitates, hastens, and improves the outcomes of clinical activity while minimizing the inconvenience and resistance to change on the part of clinical practitioners. This paper is intended to provide a high-level overview of how this may be accomplished, and start a dialogue along these lines.
References
- Tversky A. Elimination by aspects: a theory of choice. Psych Rev 1972; 79:281–99.
- Didner RS. Back-to-front design: a guns and butter approach. Ergonomics 1982; 25(6):2564–5.
- Shannon CE. A mathematical theory of communication. Bell System Technical J 1948; 27:379–423 (July), 623–56 (Oct).
- Feeny DH, Torrance GW. Incorporating utility-based quality-of-life assessment measures in clinical trials: two examples. Med Care 1989; 27:S190–204.
- Smith S, Mosier J. Guidelines for designing user interface soft-ware. ESD-TR-86-278, Aug 1986.
- Miller GA. The magical number seven plus or minus two. Psych Rev 1956; 65(2):81–97.
- Sternberg S. High-speed scanning in human memory. Science 1966; 153: 652–4.
Table 1
Correlation of weight with other cardiac risk factors
| Cholesterol |
0.759384 |
| HDL |
0.53908 |
| LDL |
0.177297 |
| BP-syst. |
0.424728 |
| BP-dia. |
0.516167 |
| Triglycerides |
0.637817 |
Figure 1 Hypothetical patient data.
(not shown)
6.2.4.1.2 Realtime Clinical Expert Support
http://pharmaceuticalintelligence.com/2015/05/10/realtime-clinical-expert-support/
6.2.4.1.3 Regression: A richly textured method for comparison and classification of predictor variables
http://pharmaceuticalintelligence.com/2012/08/14/regression-a-richly-textured-method-for-comparison-and-classification-of-predictor-variables/
6.2.4.1.4 Converting Hematology Based Data into an Inferential Interpretation
Larry H. Bernstein, Gil David, James Rucinski and Ronald R. Coifman
In Hematology – Science and Practice
Lawrie CH, Ch 22. Pp541-552.
InTech Feb 2012, ISBN 978-953-51-0174-1
https://www.researchgate.net/profile/Larry_Bernstein/publication/221927033_Converting_Hematology_Based_Data_into_an_Inferential_Interpretation/links/0fcfd507f28c14c8a2000000.pdf
6.2.4.1.5 A model for Thalassemia Screening using Hematology Measurements
https://www.researchgate.net/profile/Larry_Bernstein/publication/258848064_A_model_for_Thalassemia_Screening_using_Hematology_Measurements/links/0c9605293c3048060b000000.pdf
A model for automated screening of thalassemia in hematology (math study).
Kneifati-Hayek J, Fleischman W, Bernstein LH, Riccioli A, Bellevue R.
Lab Hematol. 2007; 13(4):119-23. http://dx.doi.org:/10.1532/LH96.07003.
The results of 398 patient screens were collected. Data from the set were divided into training and validation subsets. The Mentzer ratio was determined through a receiver operating characteristic (ROC) curve on the first subset, and screened for thalassemia using the second subset. HgbA2 levels were used to confirm beta-thalassemia.
RESULTS: We determined the correct decision point of the Mentzer index to be a ratio of 20. Physicians can screen patients using this index before further evaluation for beta-thalassemia (P < .05).
CONCLUSION: The proposed method can be implemented by hospitals and laboratories to flag positive matches for further definitive evaluation, and will enable beta-thalassemia screening of a much larger population at little to no additional cost.
6.2.4.1.6 Measurement of granulocyte maturation may improve the early diagnosis of the septic state.
Bernstein LH, Rucinski J. Clin Chem Lab Med. 2011 Sep 21;49(12):2089-95.
http://dx.doi.org:/10.1515/CCLM.2011.688.
6.2.4.1.7 The automated malnutrition assessment.
David G, Bernstein LH, Coifman RR. Nutrition. 2013 Jan; 29(1):113-21.
http://dx.doi.org:/10.1016/j.nut.2012.04.017
6.2.4.2 Molecular Diagnostics
6.2.4.2.1 Genomic Analysis of Hematological Malignancies
Acute lymphoblastic leukemia (ALL) is the most common hematologic malignancy that occurs in children. Although more than 90% of children with ALL now survive to adulthood, those with the rarest and high-risk forms of the disease continue to have poor prognoses. Through the Pediatric Cancer Genome Project (PCGP), investigators in the Hematological Malignancies Program are identifying the genetic aberrations that cause these aggressive forms of leukemias. Here we present two studies on the genetic bases of early T-cell precursor ALL and acute megakaryoblastic leukemia.
- Early T-Cell Precursor ALL Is Characterized by Activating Mutations
- The CBFA2T3-GLIS2Fusion Gene Defines an Aggressive Subtype of Acute Megakaryoblastic Leukemia in Children
Early T-cell precursor ALL (ETP-ALL), which comprises 15% of all pediatric T-cell leukemias, is an aggressive disease that is typically resistant to contemporary therapies. Children with ETP-ALL have a high rate of relapse and an extremely poor prognosis (i.e., 5-year survival is approximately 20%). The genetic basis of ETP-ALL has remained elusive. Although ETP-ALL is associated with a high burden of DNA copy number aberrations, none are consistently found or suggest a unifying genetic alteration that drives this disease.
Through the efforts of the PCGP, Jinghui Zhang, PhD (Computational Biology), James R. Downing, MD (Pathology), Charles G. Mullighan, MBBS(Hons), MSc, MD (Pathology), and colleagues analyzed the whole-genome sequences of leukemic cells and matched normal DNA from 12 pediatric patients with ETP-ALL. The identified genetic mutations were confirmed in a validation cohort of 52 ETP-ALL specimens and 42 non-ETP T-lineage ALLs (T-ALL).
In the journal Nature, the investigators reported that each ETP-ALL sample carried an average of 1140 sequence mutations and 12 structural variations. Of the structural variations, 51% were breakpoints in genes with well-established roles in hematopoiesis or leukemogenesis (e.g., MLH2,SUZ12, and RUNX1). Eighty-four percent of the structural variations either caused loss of function of the gene in question or resulted in the formation of a fusion gene such as ETV6-INO80D. The ETV6 gene, which encodes a protein that is essential for hematopoiesis, is frequently mutated in leukemia. Among the DNA samples sequenced in this study, ETV6 was altered in 33% of ETP-ALL but only 10% of T-ALL cases.
6.2.4.2.2 Next-generation sequencing in hematologic malignancies: what will be the dividends?
Jason D. Merker, Anton Valouev, and Jason Gotlib
Ther Adv Hematol. 2012 Dec; 3(6): 333–339.
http://dx.doi.org:/10.1177/2040620712458948
The application of high-throughput, massively parallel sequencing technologies to hematologic malignancies over the past several years has provided novel insights into disease initiation, progression, and response to therapy. Here, we describe how these new DNA sequencing technologies have been applied to hematolymphoid malignancies. With further improvements in the sequencing and analysis methods as well as integration of the resulting data with clinical information, we expect these technologies will facilitate more precise and tailored treatment for patients with hematologic neoplasms.
6.2.4.2.3 Leveraging cancer genome information in hematologic malignancies.
Rampal R1, Levine RL.
J Clin Oncol. 2013 May 20; 31(15):1885-92.
http://dx.doi.org:/10.1200/JCO.2013.48.7447
The use of candidate gene and genome-wide discovery studies in the last several years has led to an expansion of our knowledge of the spectrum of recurrent, somatic disease alleles, which contribute to the pathogenesis of hematologic malignancies. Notably, these studies have also begun to fundamentally change our ability to develop informative prognostic schema that inform outcome and therapeutic response, yielding substantive insights into mechanisms of hematopoietic transformation in different tissue compartments. Although these studies have already had important biologic and translational impact, significant challenges remain in systematically applying these findings to clinical decision making and in implementing new technologies for genetic analysis into clinical practice to inform real-time decision making. Here, we review recent major genetic advances in myeloid and lymphoid malignancies, the impact of these findings on prognostic models, our understanding of disease initiation and evolution, and the implication of genomic discoveries on clinical decision making. Finally, we discuss general concepts in genetic modeling and the current state-of-the-art technology used in genetic investigation.
6.2.4.2.4 p53 mutations are associated with resistance to chemotherapy and short survival in hematologic malignancies
E Wattel, C Preudhomme, B Hecquet, M Vanrumbeke, et AL.
Blood, (Nov 1), 1994; 84(9): pp 3148-3157
http://www.bloodjournal.org/content/bloodjournal/84/9/3148.full.pdf
We analyzed the prognostic value of p53 mutations for response to chemotherapy and survival in acute myeloid leukemia (AML), myelodysplastic syndrome (MDS), and chronic lymphocytic leukemia (CLL). Mutations were detected by single-stranded conformation polymorphism (SSCP) analysis of exons 4 to 10 of the P53 gene, and confirmed by direct sequencing. A p53 mutation was found in 16 of 107 (15%) AML, 20 of 182 (11%) MDS, and 9 of 81 (11%) CLL tested. In AML, three of nine (33%) mutated cases and 66 of 81 (81%) nonmutated cases treated with intensive chemotherapy achieved complete remission (CR) (P = .005) and none of five mutated cases and three of six nonmutated cases treated by low-dose Ara C achieved CR or partial remission (PR) (P = .06). Median actuarial survival was 2.5 months in mutated cases, and 15 months in nonmutated cases (P < lo-‘). In the MDS patients who received chemotherapy (intensive chemotherapy or low-dose Ara C), 1 of 13 (8%) mutated cases and 23 of 38 (60%) nonmutated cases achieved CR or PR (P = .004), and median actuarial survival was 2.5 and 13.5 months, respectively (P C lo-’). In all MDS cases (treated and untreated), the survival difference between mutated cases and nonmutated cases was also highly significant. In CLL, 1 of 8 (12.5%) mutated cases treated by chemotherapy (chlorambucil andlor CHOP andlor fludarabine) responded, as compared with 29 of 36 (80%) nonmutated cases (P = .02). In all CLL cases, survival from p53 analysis was significantly shorter in mutated cases (median 7 months) than in nonmutated cases (median not reached) (P < IO-’). In 35 of the 45 mutated cases of AML, MDS, and CLL, cytogenetic analysis or SSCP and sequence findings showed loss of the nonmutated P53 allele. Our findings show that p53 mutations are a strong prognostic indicator of response to chemotherapy and survival in AML, MDS, and CLL. The usual association of p53 mutations to loss of the nonmutated P53 allele, in those disorders, ie, to absence of normal p53 in tumor cells, suggests that p53 mutations could induce drug resistance, at least in part, by interfering with normal apoptotic pathways in tumor cells.
6.2.4.2.5 Genomic approaches to hematologic malignancies
Benjamin L. Ebert and Todd R. Golub
Blood. 2004; 104:923-932
https://www.broadinstitute.org/mpr/publications/projects/genomics/Review%20Genomics%20of%20Heme%20Malig,%20Blood%202004.pdf
In the past several years, experiments using DNA microarrays have contributed to an increasingly refined molecular taxonomy of hematologic malignancies. In addition to the characterization of molecular profiles for known diagnostic classifications, studies have defined patterns of gene expression corresponding to specific molecular abnormalities, oncologic phenotypes, and clinical outcomes. Furthermore, novel subclasses with distinct molecular profiles and clinical behaviors have been identified. In some cases, specific cellular pathways have been highlighted that can be therapeutically targeted. The findings of microarray studies are beginning to enter clinical practice as novel diagnostic tests, and clinical trials are ongoing in which therapeutic agents are being used to target pathways that were identified by gene expression profiling. While the technology of DNA microarrays is becoming well established, genome-wide surveys of gene expression generate large data sets that can easily lead to spurious conclusions. Many challenges remain in the statistical interpretation of gene expression data and the biologic validation of findings. As data accumulate and analyses become more sophisticated, genomic technologies offer the potential to generate increasingly sophisticated insights into the complex molecular circuitry of hematologic malignancies. This review summarizes the current state of discovery and addresses key areas for future research.
6.2.4.3 Flow cytometry
Introduction to Flow Cytometry: Blood Cell Identification
Dana L. Van Laeys
https://www.labce.com/flow_cytometry.aspx
No other laboratory method provides as rapid and detailed analysis of cellular populations as flow cytometry, making it a valuable tool for diagnosis and management of several hematologic and immunologic diseases. Understanding this relevant methodology is important for any medical laboratory scientist.
Whether you have no previous experience with flow cytometry or just need a refresher, this course will help you to understand the basic principles, with the help of video tutorials and interactive case studies.
Basic principles include:
- Immunophenotypic features of various types of hematologic cells
- Labeling cellular elements with fluorochromes
- Blood cell identification, specifically B and T lymphocyte identification and analysis
- Cell sorting to isolate select cell population for further analysis
- Analyzing and interpreting result reports and printouts
6.2.5 Treatments
6.2.5.1 Treatments for leukemia by type
6.2.5.1.1 Acute lymphocytic leukemias
6.2.5.1.1.1 Treatment of Acute Lymphoblastic Leukemia
Ching-Hon Pu, and William E. Evans
N Engl J Med Jan 12, 2006; 354:166-178
http://dx.doi.org:/10.1056/NEJMra052603
Although the overall cure rate of acute lymphoblastic leukemia (ALL) in children is about 80 percent, affected adults fare less well. This review considers recent advances in the treatment of ALL, emphasizing issues that need to be addressed if treatment outcome is to improve further.
6.2.5.1.1.2 Acute Lymphoblastic Leukemia
Ching-Hon Pui, Mary V. Relling, and James R. Downing
N Engl J Med Apr 8, 2004; 350:1535-1548
http://dx.doi.org:/10.1056/NEJMra023001
This comprehensive survey emphasizes how recent advances in the knowledge of molecular mechanisms involved in acute lymphoblastic leukemia have influenced diagnosis, prognosis, and treatment.
6.2.5.1.1.3 Gene-Expression Patterns in Drug-Resistant Acute Lymphoblastic Leukemia Cells and Response to Treatment
Amy Holleman, Meyling H. Cheok, Monique L. den Boer, et al.
N Engl J Med 2004; 351:533-42
Childhood acute lymphoblastic leukemia (ALL) is curable with chemotherapy in approximately 80 percent of patients. However, the cause of treatment failure in the remaining 20 percent of patients is largely unknown.
Methods We tested leukemia cells from 173 children for sensitivity in vitro to prednisolone, vincristine, asparaginase, and daunorubicin. The cells were then subjected to an assessment of gene expression with the use of 14,500 probe sets to identify differentially expressed genes in drug-sensitive and drug-resistant ALL. Gene-expression patterns that differed according to sensitivity or resistance to the four drugs were compared with treatment outcome in the original 173 patients and an independent cohort of 98 children treated with the same drugs at another institution.
Results We identified sets of differentially expressed genes in B-lineage ALL that were sensitive or resistant to prednisolone (33 genes), vincristine (40 genes), asparaginase (35 genes), or daunorubicin (20 genes). A combined gene-expression score of resistance to the four drugs, as compared with sensitivity to the four, was significantly and independently related to treatment outcome in a multivariate analysis (hazard ratio for relapse, 3.0; P=0.027). Results were confirmed in an independent population of patients treated with the same medications (hazard ratio for relapse, 11.85; P=0.019). Of the 124 genes identified, 121 have not previously been associated with resistance to the four drugs we tested.
Conclusions Differential expression of a relatively small number of genes is associated with drug resistance and treatment outcome in childhood ALL.
6.2.5.1.1.4 Leukemias Treatment & Management
Author: Lihteh Wu, MD; Chief Editor: Hampton Roy Sr
http://emedicine.medscape.com/article/1201870-treatment
The treatment of leukemia is in constant flux, evolving and changing rapidly over the past few years. Most treatment protocols use systemic chemotherapy with or without radiotherapy. The basic strategy is to eliminate all detectable disease by using cytotoxic agents. To attain this goal, 3 phases are typically used, as follows: remission induction phase, consolidation phase, and maintenance therapy phase.
Chemotherapeutic agents are chosen that interfere with cell division. Tumor cells usually divide more rapidly than host cells, making them more vulnerable to the effects of chemotherapy. Primary treatment will be under the direction of a medical oncologist, radiation oncologist, and primary care physician. Although a general treatment plan will be outlined, the ophthalmologist does not prescribe or manage such treatment.
- The initial treatment of ALL uses various combinations of vincristine, prednisone, and L-asparaginase until a complete remission is obtained.
- Maintenance therapy with mercaptopurine is continued for 2-3 years following remission.
- Use of intrathecal methotrexate with or without cranial irradiation to cover the CNS varies from facility to facility.
- Daunorubicin, cytarabine, and thioguanine currently are used to obtain induction and remission of AML.
- Maintenance therapy for 8 months may lengthen remission. Once relapse has occurred, AML generally is curable only by bone marrow transplantation.
- Presently, treatment of CLL is palliative.
- CML is characterized by a leukocytosis greater than 100,000 cells. Emergent treatment with leukopheresis sometimes is necessary when leukostastic complications are present. Otherwise, busulfan or hydroxyurea may control WBC counts. During the chronic phase, treatment is palliative.
- When CML converts to the blastic phase, approximately one third of cases behave as ALL and respond to treatment with vincristine and prednisone. The remaining two thirds resemble AML but respond poorly to AML therapy.
- Allogeneic bone marrow transplant is the only curative therapy for CML. However, it carries a high early mortality rate.
- Leukemic retinopathy usually is not treated directly. As the hematological parameters normalize with systemic treatment, many of the ophthalmic signs resolve. There are reports that leukopheresis for hyperviscosity also may alleviate intraocular manifestations.
- When definite intraocular leukemic infiltrates fail to respond to systemic chemotherapy, direct radiation therapy is recommended.
- Relapse, manifested by anterior segment involvement, should be treated by radiation. In certain cases, subconjunctival chemotherapeutic agents have been injected.
- Optic nerve head infiltration in patients with ALL is an emergency and requires prompt radiation therapy to try to salvage some vision.
6.2.5.1.1.5 Treatments and drugs
http://www.mayoclinic.org/diseases-conditions/leukemia/basics/
treatment/con-20024914
Common treatments used to fight leukemia include:
- Chemotherapy. Chemotherapy is the major form of treatment for leukemia. This drug treatment uses chemicals to kill leukemia cells.
Depending on the type of leukemia you have, you may receive a single drug or a combination of drugs. These drugs may come in a pill form, or they may be injected directly into a vein.
- Biological therapy. Biological therapy works by using treatments that help your immune system recognize and attack leukemia cells.
- Targeted therapy. Targeted therapy uses drugs that attack specific vulnerabilities within your cancer cells.
For example, the drug imatinib (Gleevec) stops the action of a protein within the leukemia cells of people with chronic myelogenous leukemia. This can help control the disease.
- Radiation therapy. Radiation therapy uses X-rays or other high-energy beams to damage leukemia cells and stop their growth. During radiation therapy, you lie on a table while a large machine moves around you, directing the radiation to precise points on your body.
You may receive radiation in one specific area of your body where there is a collection of leukemia cells, or you may receive radiation over your whole body. Radiation therapy may be used to prepare for a stem cell transplant.
- Stem cell transplant. A stem cell transplant is a procedure to replace your diseased bone marrow with healthy bone marrow.
Before a stem cell transplant, you receive high doses of chemotherapy or radiation therapy to destroy your diseased bone marrow. Then you receive an infusion of blood-forming stem cells that help to rebuild your bone marrow.
You may receive stem cells from a donor, or in some cases you may be able to use your own stem cells. A stem cell transplant is very similar to a bone marrow transplant.
6.2.5.1.2 Acute Myeloid Leukemia
6.2.5.1.2.1 New treatment approaches in acute myeloid leukemia: review of recent clinical studies.
Norsworthy K1, Luznik L, Gojo I.
Rev Recent Clin Trials. 2012 Aug; 7(3):224-37.
http://www.ncbi.nlm.nih.gov/pubmed/22540908
Standard chemotherapy can cure only a fraction (30-40%) of younger and very few older patients with acute myeloid leukemia (AML). While conventional allografting can extend the cure rates, its application remains limited mostly to younger patients and those in remission. Limited efficacy of current therapies and improved understanding of the disease biology provided a spur for clinical trials examining novel agents and therapeutic strategies in AML. Clinical studies with novel chemotherapeutics, antibodies, different signal transduction inhibitors, and epigenetic modulators demonstrated their clinical activity; however, it remains unclear how to successfully integrate novel agents either alone or in combination with chemotherapy into the overall therapeutic schema for AML. Further studies are needed to examine their role in relation to standard chemotherapy and their applicability to select patient populations based on recognition of unique disease and patient characteristics, including the development of predictive biomarkers of response. With increasing use of nonmyeloablative or reduced intensity conditioning and alternative graft sources such as haploidentical donors and cord blood transplants, the benefits of allografting may extend to a broader patient population, including older AML patients and those lacking a HLA-matched donor. We will review here recent clinical studies that examined novel pharmacologic and immunologic approaches to AML therapy.
6.2.5.1.2.2 Novel approaches to the treatment of acute myeloid leukemia.
Roboz GJ1
Hematology Am Soc Hematol Educ Program. 2011:43-50.
http://dx.doi.org:/10.1182/asheducation-2011.1.43.
Approximately 12 000 adults are diagnosed with acute myeloid leukemia (AML) in the United States annually, the majority of whom die from their disease. The mainstay of initial treatment, cytosine arabinoside (ara-C) combined with an anthracycline, was developed nearly 40 years ago and remains the worldwide standard of care. Advances in genomics technologies have identified AML as a genetically heterogeneous disease, and many patients can now be categorized into clinicopathologic subgroups on the basis of their underlying molecular genetic defects. It is hoped that enhanced specificity of diagnostic classification will result in more effective application of targeted agents and the ability to create individualized treatment strategies. This review describes the current treatment standards for induction, consolidation, and stem cell transplantation; special considerations in the management of older AML patients; novel agents; emerging data on the detection and management of minimal residual disease (MRD); and strategies to improve the design and implementation of AML clinical trials.
Age ≥ 60 years has consistently been identified as an independent adverse prognostic factor in AML, and there are very few long-term survivors in this age group.5 Poor outcomes in elderly AML patients have been attributed to both host- and disease-related factors, including medical comorbidities, physical frailty, increased incidence of antecedent myelodysplastic syndrome and myeloproliferative disorders, and higher frequency of adverse cytogenetics.28 Older patients with multiple poor-risk factors have a high probability of early death and little chance of long-term disease-free survival with standard chemotherapy. In a retrospective analysis of 998 older patients treated with intensive induction at the M.D. Anderson Cancer Center, multivariate analysis identified age ≥ 75 years, unfavorable karyotype, poor performance status, creatinine > 1.3 mg/dL, duration of antecedent hematologic disorder > 6 months, and treatment outside a laminar airflow room as adverse prognostic indicators.29 Patients with 3 or more of these factors had expected complete remission rates of < 20%, 8-week mortality > 50%, and 1-year survival < 10%. The Medical Research Council (MRC) identified cytogenetics, WBC count at diagnosis, age, and de novo versus secondary disease as critical factors influencing survival in > 2000 older patients with AML, but cautioned in their conclusions that less objective factors, such as clinical assessment of “fitness” for chemotherapy, may be equally important in making treatment decisions in this patient population.30 It is hoped that data from comprehensive geriatric assessments of functional status, cognition, mood, quality of life, and other measures obtained during ongoing cooperative group trials will improve our ability to predict how older patients will tolerate treatment.
6.5.1.2.3 Current treatment of acute myeloid leukemia.
Roboz GJ1.
Curr Opin Oncol. 2012 Nov; 24(6):711-9.
http://dx.doi.org:/10.1097/CCO.0b013e328358f62d.
The objectives of this review are to discuss standard and investigational nontransplant treatment strategies for acute myeloid leukemia (AML), excluding acute promyelocytic leukemia.
RECENT FINDINGS: Most adults with AML die from their disease. The standard treatment paradigm for AML is remission induction chemotherapy with an anthracycline/cytarabine combination, followed by either consolidation chemotherapy or allogeneic stem cell transplantation, depending on the patient’s ability to tolerate intensive treatment and the likelihood of cure with chemotherapy alone. Although this approach has changed little in the last three decades, increased understanding of the pathogenesis of AML and improvements in molecular genomic technologies are leading to novel drug targets and the development of personalized, risk-adapted treatment strategies. Recent findings related to prognostically relevant and potentially ‘druggable’ molecular targets are reviewed.
SUMMARY: At the present time, AML remains a devastating and mostly incurable disease, but the combination of optimized chemotherapeutics and molecularly targeted agents holds significant promise for the future.
6.5.1.2.4 Adult Acute Myeloid Leukemia Treatment (PDQ®)
http://www.cancer.gov/cancertopics/pdq/treatment/adultAML/healthprofessional/page9
About This PDQ Summary
This summary is reviewed regularly and updated as necessary by the PDQ Adult Treatment Editorial Board, which is editorially independent of the National Cancer Institute (NCI). The summary reflects an independent review of the literature and does not represent a policy statement of NCI or the National Institutes of Health (NIH).
Board members review recently published articles each month to determine whether an article should:
- be discussed at a meeting,
- be cited with text, or
- replace or update an existing article that is already cited.
Treatment Option Overview for AML
Successful treatment of acute myeloid leukemia (AML) requires the control of bone marrow and systemic disease and specific treatment of central nervous system (CNS) disease, if present. The cornerstone of this strategy includes systemically administered combination chemotherapy. Because only 5% of patients with AML develop CNS disease, prophylactic treatment is not indicated.[1–3]
Treatment is divided into two phases: remission induction (to attain remission) and postremission (to maintain remission). Maintenance therapy for AML was previously administered for several years but is not included in most current treatment clinical trials in the United States, other than for acute promyelocytic leukemia. (Refer to the Adult Acute Myeloid Leukemia in Remission section of this summary for more information.) Other studies have used more intensive postremission therapy administered for a shorter duration of time after which treatment is discontinued.[4] Postremission therapy appears to be effective when given immediately after remission is achieved.[4]
Since myelosuppression is an anticipated consequence of both the leukemia and its treatment with chemotherapy, patients must be closely monitored during therapy. Facilities must be available for hematologic support with multiple blood fractions including platelet transfusions and for the treatment of related infectious complications.[5] Randomized trials have shown similar outcomes for patients who received prophylactic platelet transfusions at a level of 10,000/mm3 rather than 20,000/mm3.[6] The incidence of platelet alloimmunization was similar among groups randomly assigned to receive pooled platelet concentrates from random donors; filtered, pooled platelet concentrates from random donors; ultraviolet B-irradiated, pooled platelet concentrates from random donors; or filtered platelets obtained by apheresis from single random donors.[7] Colony-stimulating factors, for example, granulocyte colony–stimulating factor (G-CSF) and granulocyte-macrophage colony–stimulating factor (GM-CSF), have been studied in an effort to shorten the period of granulocytopenia associated with leukemia treatment.[8] If used, these agents are administered after completion of induction therapy. GM-CSF was shown to improve survival in a randomized trial of AML in patients aged 55 to 70 years (median survival was 10.6 months vs. 4.8 months). In this Eastern Cooperative Oncology Group (ECOG) (EST-1490) trial, patients were randomly assigned to receive GM-CSF or placebo following demonstration of leukemic clearance of the bone marrow;[9] however, GM-CSF did not show benefit in a separate similar randomized trial in patients older than 60 years.[10] In the latter study, clearance of the marrow was not required before initiating cytokine therapy. In a Southwest Oncology Group (NCT00023777) randomized trial of G-CSF given following induction therapy to patients older than 65 years, complete response was higher in patients who received G-CSF because of a decreased incidence of primary leukemic resistance. Growth factor administration did not impact on mortality or on survival.[11,12] Because the majority of randomized clinical trials have not shown an impact of growth factors on survival, their use is not routinely recommended in the remission induction setting.
The administration of GM-CSF or other myeloid growth factors before and during induction therapy, to augment the effects of cytotoxic therapy through the recruitment of leukemic blasts into cell cycle (growth factor priming), has been an area of active clinical research. Evidence from randomized studies of GM-CSF priming have come to opposite conclusions. A randomized study of GM-CSF priming during conventional induction and postremission therapy showed no difference in outcomes between patients who received GM-CSF and those who did not receive growth factor priming.[13,14][Level of evidence: 1iiA] In contrast, a similar randomized placebo-controlled study of GM-CSF priming in patients with AML aged 55 to 75 years showed improved disease-free survival (DFS) in the group receiving GM-CSF (median DFS for patients who achieved complete remission was 23 months vs. 11 months; 2-year DFS was 48% vs. 21%), with a trend towards improvement in overall survival (2-year survival was 39% vs. 27%, P = .082) for patients aged 55 to 64 years.[15][Level of evidence: 1iiDii]
References
- Kebriaei P, Champlin R, deLima M, et al.: Management of acute leukemias. In: DeVita VT Jr, Lawrence TS, Rosenberg SA: Cancer: Principles and Practice of Oncology. 9th ed. Philadelphia, Pa: Lippincott Williams & Wilkins, 2011, pp 1928-54.
- Wiernik PH: Diagnosis and treatment of acute nonlymphocytic leukemia. In: Wiernik PH, Canellos GP, Dutcher JP, et al., eds.: Neoplastic Diseases of the Blood. 3rd ed. New York, NY: Churchill Livingstone, 1996, pp 283-302.
- Morrison FS, Kopecky KJ, Head DR, et al.: Late intensification with POMP chemotherapy prolongs survival in acute myelogenous leukemia–results of a Southwest Oncology Group study of rubidazone versus adriamycin for remission induction, prophylactic intrathecal therapy, late intensification, and levamisole maintenance. Leukemia 6 (7): 708-14, 1992. [PUBMED Abstract]
- Cassileth PA, Lynch E, Hines JD, et al.: Varying intensity of postremission therapy in acute myeloid leukemia. Blood 79 (8): 1924-30, 1992. [PUBMED Abstract]
- Supportive Care. In: Wiernik PH, Canellos GP, Dutcher JP, et al., eds.: Neoplastic Diseases of the Blood. 3rd ed. New York, NY: Churchill Livingstone, 1996, pp 779-967.
- Rebulla P, Finazzi G, Marangoni F, et al.: The threshold for prophylactic platelet transfusions in adults with acute myeloid leukemia. Gruppo Italiano Malattie Ematologiche Maligne dell’Adulto. N Engl J Med 337 (26): 1870-5, 1997. [PUBMED Abstract]
- Leukocyte reduction and ultraviolet B irradiation of platelets to prevent alloimmunization and refractoriness to platelet transfusions. The Trial to Reduce Alloimmunization to Platelets Study Group. N Engl J Med 337 (26): 1861-9, 1997. [PUBMED Abstract]
- Geller RB: Use of cytokines in the treatment of acute myelocytic leukemia: a critical review. J Clin Oncol 14 (4): 1371-82, 1996. [PUBMED Abstract]
- Rowe JM, Andersen JW, Mazza JJ, et al.: A randomized placebo-controlled phase III study of granulocyte-macrophage colony-stimulating factor in adult patients (> 55 to 70 years of age) with acute myelogenous leukemia: a study of the Eastern Cooperative Oncology Group (E1490). Blood 86 (2): 457-62, 1995. [PUBMED Abstract]
- Stone RM, Berg DT, George SL, et al.: Granulocyte-macrophage colony-stimulating factor after initial chemotherapy for elderly patients with primary acute myelogenous leukemia. Cancer and Leukemia Group B. N Engl J Med 332 (25): 1671-7, 1995. [PUBMED Abstract]
- Dombret H, Chastang C, Fenaux P, et al.: A controlled study of recombinant human granulocyte colony-stimulating factor in elderly patients after treatment for acute myelogenous leukemia. AML Cooperative Study Group. N Engl J Med 332 (25): 1678-83, 1995. [PUBMED Abstract]
- Godwin JE, Kopecky KJ, Head DR, et al.: A double-blind placebo-controlled trial of granulocyte colony-stimulating factor in elderly patients with previously untreated acute myeloid leukemia: a Southwest oncology group study (9031). Blood 91 (10): 3607-15, 1998. [PUBMED Abstract]
- Buchner T, Hiddemann W, Wormann B, et al.: GM-CSF multiple course priming and long-term administration in newly diagnosed AML: hematologic and therapeutic effects. [Abstract] Blood 84 (10 Suppl 1): A-95, 27a, 1994.
- Löwenberg B, Boogaerts MA, Daenen SM, et al.: Value of different modalities of granulocyte-macrophage colony-stimulating factor applied during or after induction therapy of acute myeloid leukemia. J Clin Oncol 15 (12): 3496-506, 1997. [PUBMED Abstract]
- Witz F, Sadoun A, Perrin MC, et al.: A placebo-controlled study of recombinant human granulocyte-macrophage colony-stimulating factor administered during and after induction treatment for de novo acute myelogenous leukemia in elderly patients. Groupe Ouest Est Leucémies Aiguës Myéloblastiques (GOELAM). Blood 91 (8): 2722-30, 1998. [PUBMED Abstract]
6.2.5.1.3 Treatment for CML
6.2.5.1.3.1 Chronic Myelogenous Leukemia Treatment (PDQ®)
http://www.cancer.gov/cancertopics/pdq/treatment/CML/Patient/page4
Treatment Option Overview
Key Points for This Section
There are different types of treatment for patients with chronic myelogenous leukemia.
Six types of standard treatment are used:
- Targeted therapy
- Chemotherapy
- Biologic therapy
- High-dose chemotherapy with stem cell transplant
- Donor lymphocyte infusion (DLI)
- Surgery
New types of treatment are being tested in clinical trials.
Patients may want to think about taking part in a clinical trial.
Patients can enter clinical trials before, during, or after starting their cancer treatment.
Follow-up tests may be needed.
There are different types of treatment for patients with chronic myelogenous leukemia.
Different types of treatment are available for patients with chronic myelogenous leukemia (CML). Some treatments are standard (the currently used treatment), and some are being tested in clinical trials. A treatment clinical trial is a research study meant to help improve current treatments or obtain information about new treatments for patients with cancer. When clinical trials show that a new treatment is better than the standard treatment, the new treatment may become the standard treatment. Patients may want to think about taking part in a clinical trial. Some clinical trials are open only to patients who have not started treatment.
Six types of standard treatment are used:
Targeted therapy
Targeted therapy is a type of treatment that uses drugs or other substances to identify and attack specific cancer cells without harming normal cells. Tyrosine kinase inhibitors are targeted therapy drugs used to treat chronic myelogenous leukemia.
Imatinib mesylate, nilotinib, dasatinib, and ponatinib are tyrosine kinase inhibitors that are used to treat CML.
See Drugs Approved for Chronic Myelogenous Leukemia for more information.
Chemotherapy
Chemotherapy is a cancer treatment that uses drugs to stop the growth of cancer cells, either by killing the cells or by stopping them from dividing. When chemotherapy is taken by mouth or injected into a vein or muscle, the drugs enter the bloodstream and can reach cancer cells throughout the body (systemic chemotherapy). When chemotherapy is placed directly into the cerebrospinal fluid, an organ, or a body cavity such as the abdomen, the drugs mainly affect cancer cells in those areas (regional chemotherapy). The way the chemotherapy is given depends on the type and stage of the cancer being treated.
See Drugs Approved for Chronic Myelogenous Leukemia for more information.
Biologic therapy
Biologic therapy is a treatment that uses the patient’s immune system to fight cancer. Substances made by the body or made in a laboratory are used to boost, direct, or restore the body’s natural defenses against cancer. This type of cancer treatment is also called biotherapy or immunotherapy.
See Drugs Approved for Chronic Myelogenous Leukemia for more information.
High-dose chemotherapy with stem cell transplant
High-dose chemotherapy with stem cell transplant is a method of giving high doses of chemotherapy and replacing blood-forming cells destroyed by the cancer treatment. Stem cells (immature blood cells) are removed from the blood or bone marrow of the patient or a donor and are frozen and stored. After the chemotherapy is completed, the stored stem cells are thawed and given back to the patient through an infusion. These reinfused stem cells grow into (and restore) the body’s blood cells.
See Drugs Approved for Chronic Myelogenous Leukemia for more information.
Donor lymphocyte infusion (DLI)
Donor lymphocyte infusion (DLI) is a cancer treatment that may be used after stem cell transplant.Lymphocytes (a type of white blood cell) from the stem cell transplant donor are removed from the donor’s blood and may be frozen for storage. The donor’s lymphocytes are thawed if they were frozen and then given to the patient through one or more infusions. The lymphocytes see the patient’s cancer cells as not belonging to the body and attack them.
Surgery
Splenectomy
6.2.5.1.3.2 What`s new in chronic myeloid leukemia research and treatment?
http://www.cancer.org/cancer/leukemia-chronicmyeloidcml/detailedguide/leukemia-chronic-myeloid-myelogenous-new-research
Combining the targeted drugs with other treatments
Imatinib and other drugs that target the BCR-ABL protein have proven to be very effective, but by themselves these drugs don’t help everyone. Studies are now in progress to see if combining these drugs with other treatments, such as chemotherapy, interferon, or cancer vaccines (see below) might be better than either one alone. One study showed that giving interferon with imatinib worked better than giving imatinib alone. The 2 drugs together had more side effects, though. It is also not clear if this combination is better than treatment with other tyrosine kinase inhibitors (TKIs), such as dasatinib and nilotinib. A study going on now is looking at combing interferon with nilotinib.
Other studies are looking at combining other drugs, such as cyclosporine or hydroxychloroquine, with a TKI.
New drugs for CML
Because researchers now know the main cause of CML (the BCR-ABL gene and its protein), they have been able to develop many new drugs that might work against it.
In some cases, CML cells develop a change in the BCR-ABL oncogene known as a T315I mutation, which makes them resistant to many of the current targeted therapies (imatinib, dasatinib, and nilotinib). Ponatinib is the only TKI that can work against T315I mutant cells. More drugs aimed at this mutation are now being tested.
Other drugs called farnesyl transferase inhibitors, such as lonafarnib and tipifarnib, seem to have some activity against CML and patients may respond when these drugs are combined with imatinib. These drugs are being studied further.
Other drugs being studied in CML include the histone deacetylase inhibitor panobinostat and the proteasome inhibitor bortezomib (Velcade).
Several vaccines are now being studied for use against CML.
6.2.5.1.4. Chronic Lymphocytic Leukemia
6.2.5.1.4.1 Chronic Lymphocytic Leukemia Treatment (PDQ®)
General Information About Chronic Lymphocytic Leukemia
Key Points for This Section
- Chronic lymphocytic leukemia is a type of cancer in which the bone marrow makes too many lymphocytes (a type of white blood cell).
- Leukemia may affect red blood cells, white blood cells, and platelets.
- Older age can affect the risk of developing chronic lymphocytic leukemia.
- Signs and symptoms of chronic lymphocytic leukemia include swollen lymph nodes and tiredness.
- Tests that examine the blood, bone marrow, and lymph nodes are used to detect (find) and diagnose chronic lymphocytic leukemia.
- Certain factors affect treatment options and prognosis (chance of recovery).
- Chronic lymphocytic leukemia is a type of cancer in which the bone marrow makes too many lymphocytes (a type of white blood cell).
Chronic lymphocytic leukemia (also called CLL) is a blood and bone marrow disease that usually gets worse slowly. CLL is one of the most common types of leukemia in adults. It often occurs during or after middle age; it rarely occurs in children.
http://www.cancer.gov/images/cdr/live/CDR755927-750.jpg
Anatomy of the bone; drawing shows spongy bone, red marrow, and yellow marrow. A cross section of the bone shows compact bone and blood vessels in the bone marrow. Also shown are red blood cells, white blood cells, platelets, and a blood stem cell.
Anatomy of the bone. The bone is made up of compact bone, spongy bone, and bone marrow. Compact bone makes up the outer layer of the bone. Spongy bone is found mostly at the ends of bones and contains red marrow. Bone marrow is found in the center of most bones and has many blood vessels. There are two types of bone marrow: red and yellow. Red marrow contains blood stem cells that can become red blood cells, white blood cells, or platelets. Yellow marrow is made mostly of fat.
Leukemia may affect red blood cells, white blood cells, and platelets.
Normally, the body makes blood stem cells (immature cells) that become mature blood cells over time. A blood stem cell may become a myeloid stem cell or a lymphoid stem cell.
A myeloid stem cell becomes one of three types of mature blood cells:
- Red blood cells that carry oxygen and other substances to all tissues of the body.
- White blood cells that fight infection and disease.
- Platelets that form blood clots to stop bleeding.
A lymphoid stem cell becomes a lymphoblast cell and then one of three types of lymphocytes (white blood cells):
- B lymphocytes that make antibodies to help fight infection.
- T lymphocytes that help B lymphocytes make antibodies to fight infection.
- Natural killer cells that attack cancer cells and viruses.

Blood cell development. CDR526538-750
http://www.cancer.gov/images/cdr/live/CDR526538-750.jpg
Blood cell development; drawing shows the steps a blood stem cell goes through to become a red blood cell, platelet, or white blood cell. A myeloid stem cell becomes a red blood cell, a platelet, or a myeloblast, which then becomes a granulocyte (the types of granulocytes are eosinophils, basophils, and neutrophils). A lymphoid stem cell becomes a lymphoblast and then becomes a B-lymphocyte, T-lymphocyte, or natural killer cell.
Blood cell development. A blood stem cell goes through several steps to become a red blood cell, platelet, or white blood cell.
In CLL, too many blood stem cells become abnormal lymphocytes and do not become healthy white blood cells. The abnormal lymphocytes may also be called leukemia cells. The lymphocytes are not able to fight infection very well. Also, as the number of lymphocytes increases in the blood and bone marrow, there is less room for healthy white blood cells, red blood cells, and platelets. This may cause infection, anemia, and easy bleeding.
This summary is about chronic lymphocytic leukemia. See the following PDQ summaries for more information about leukemia:
- Adult Acute Lymphoblastic Leukemia Treatment.
- Childhood Acute Lymphoblastic Leukemia Treatment.
- Adult Acute Myeloid Leukemia Treatment.
- Childhood Acute Myeloid Leukemia/Other Myeloid Malignancies Treatment.
- Chronic Myelogenous Leukemia Treatment.
- Hairy Cell Leukemia Treatment
Older age can affect the risk of developing chronic lymphocytic leukemia.
Anything that increases your risk of getting a disease is called a risk factor. Having a risk factor does not mean that you will get cancer; not having risk factors doesn’t mean that you will not get cancer. Talk with your doctor if you think you may be at risk. Risk factors for CLL include the following:
- Being middle-aged or older, male, or white.
- A family history of CLL or cancer of the lymph system.
- Having relatives who are Russian Jews or Eastern European Jews.
Signs and symptoms of chronic lymphocytic leukemia include swollen lymph nodes and tiredness.
Usually CLL does not cause any signs or symptoms and is found during a routine blood test. Signs and symptoms may be caused by CLL or by other conditions. Check with your doctor if you have any of the following:
- Painless swelling of the lymph nodes in the neck, underarm, stomach, or groin.
- Feeling very tired.
- Pain or fullness below the ribs.
- Fever and infection.
- Weight loss for no known reason.
Tests that examine the blood, bone marrow, and lymph nodes are used to detect (find) and diagnose chronic lymphocytic leukemia.
The following tests and procedures may be used:
Physical exam and history : An exam of the body to check general signs of health, including checking for signs of disease, such as lumps or anything else that seems unusual. A history of the patient’s health habits and past illnesses and treatments will also be taken.
Complete blood count (CBC) with differential : A procedure in which a sample of blood is drawn and checked for the following:
The number of red blood cells and platelets.
The number and type of white blood cells.
The amount of hemoglobin (the protein that carries oxygen) in the red blood cells.
The portion of the blood sample made up of red blood cells.
6.2.5.1.4.2 Results from the Phase 3 Resonate™ Trial
Significantly improved progression free survival (PFS) vs ofatumumab in patients with previously treated CLL
- Patients taking IMBRUVICA® had a 78% statistically significant reduction in the risk of disease progression or death compared with patients who received ofatumumab1
- In patients with previously treated del 17p CLL, median PFS was not yet reached with IMBRUVICA® vs 5.8 months with ofatumumab (HR 0.25; 95% CI: 0.14, 0.45)1
Significantly prolonged overall survival (OS) with IMBRUVICA® vs ofatumumab in patients with previously treated CLL
- In patients with previously treated CLL, those taking IMBRUVICA® had a 57% statistically significant reduction in the risk of death compared with those who received ofatumumab (HR 0.43; 95% CI: 0.24, 0.79; P<0.05)1
6.2.5.1.4.3 Typical treatment of chronic lymphocytic leukemia
http://www.cancer.org/cancer/leukemia-chroniclymphocyticcll/detailedguide/leukemia-chronic-lymphocytic-treating-treatment-by-risk-group
Treatment options for chronic lymphocytic leukemia (CLL) vary greatly, depending on the person’s age, the disease risk group, and the reason for treating (for example, which symptoms it is causing). Many people live a long time with CLL, but in general it is very difficult to cure, and early treatment hasn’t been shown to help people live longer. Because of this and because treatment can cause side effects, doctors often advise waiting until the disease is progressing or bothersome symptoms appear, before starting treatment.
If treatment is needed, factors that should be taken into account include the patient’s age, general health, and prognostic factors such as the presence of chromosome 17 or chromosome 11 deletions or high levels of ZAP-70 and CD38.
Initial treatment
Patients who might not be able to tolerate the side effects of strong chemotherapy (chemo), are often treated with chlorambucil alone or with a monoclonal antibody targeting CD20 like rituximab (Rituxan) or obinutuzumab (Gazyva). Other options include rituximab alone or a corticosteroid like prednisione.
In stronger and healthier patients, there are many options for treatment. Commonly used treatments include:
- FCR: fludarabine (Fludara), cyclophosphamide (Cytoxan), and rituximab
- Bendamustine (sometimes with rituximab)
- FR: fludarabine and rituximab
- CVP: cyclophosphamide, vincristine, and prednisone (sometimes with rituximab)
- CHOP: cyclophosphamide, doxorubicin, vincristine (Oncovin), and prednisone
- Chlorambucil combined with prednisone, rituximab, obinutuzumab, or ofatumumab
- PCR: pentostatin (Nipent), cyclophosphamide, and rituximab
- Alemtuzumab (Campath)
- Fludarabine (alone)
Other drugs or combinations of drugs may also be also used.
If the only problem is an enlarged spleen or swollen lymph nodes in one region of the body, localized treatment with low-dose radiation therapy may be used. Splenectomy (surgery to remove the spleen) is another option if the enlarged spleen is causing symptoms.
Sometimes very high numbers of leukemia cells in the blood cause problems with normal circulation. This is calledleukostasis. Chemo may not lower the number of cells until a few days after the first dose, so before the chemo is given, some of the cells may be removed from the blood with a procedure called leukapheresis. This treatment lowers blood counts right away. The effect lasts only for a short time, but it may help until the chemo has a chance to work. Leukapheresis is also sometimes used before chemo if there are very high numbers of leukemia cells (even when they aren’t causing problems) to prevent tumor lysis syndrome (this was discussed in the chemotherapy section).
Some people who have very high-risk disease (based on prognostic factors) may be referred for possible stem cell transplant (SCT) early in treatment.
Second-line treatment of CLL
If the initial treatment is no longer working or the disease comes back, another type of treatment may help. If the initial response to the treatment lasted a long time (usually at least a few years), the same treatment can often be used again. If the initial response wasn’t long-lasting, using the same treatment again isn’t as likely to be helpful. The options will depend on what the first-line treatment was and how well it worked, as well as the person’s health.
Many of the drugs and combinations listed above may be options as second-line treatments. For many people who have already had fludarabine, alemtuzumab seems to be helpful as second-line treatment, but it carries an increased risk of infections. Other purine analog drugs, such as pentostatin or cladribine (2-CdA), may also be tried. Newer drugs such as ofatumumab, ibrutinib (Imbruvica), and idelalisib (Zydelig) may be other options.
If the leukemia responds, stem cell transplant may be an option for some patients.
Some people may have a good response to first-line treatment (such as fludarabine) but may still have some evidence of a small number of leukemia cells in the blood, bone marrow, or lymph nodes. This is known as minimal residual disease. CLL can’t be cured, so doctors aren’t sure if further treatment right away will be helpful. Some small studies have shown that alemtuzumab can sometimes help get rid of these remaining cells, but it’s not yet clear if this improves survival.
Treating complications of CLL
One of the most serious complications of CLL is a change (transformation) of the leukemia to a high-grade or aggressive type of non-Hodgkin lymphoma called diffuse large cell lymphoma. This happens in about 5% of CLL cases, and is known as Richter syndrome. Treatment is often the same as it would be for lymphoma (see our document called Non-Hodgkin Lymphoma for more information), and may include stem cell transplant, as these cases are often hard to treat.
Less often, CLL may transform to prolymphocytic leukemia. As with Richter syndrome, these cases can be hard to treat. Some studies have suggested that certain drugs such as cladribine (2-CdA) and alemtuzumab may be helpful.
In rare cases, patients with CLL may have their leukemia transform into acute lymphocytic leukemia (ALL). If this happens, treatment is likely to be similar to that used for patients with ALL (see our document called Leukemia: Acute Lymphocytic).
Acute myeloid leukemia (AML) is another rare complication in patients who have been treated for CLL. Drugs such as chlorambucil and cyclophosphamide can damage the DNA of blood-forming cells. These damaged cells may go on to become cancerous, leading to AML, which is very aggressive and often hard to treat (see our document calledLeukemia: Acute Myeloid).
CLL can cause problems with low blood counts and infections. Treatment of these problems were discussed in the section “Supportive care in chronic lymphocytic leukemia.”
6.2.5.1.5 Lymphoma treatment
6.2.5.1.5.1 Overview
http://www.emedicinehealth.com/lymphoma/page8_em.htm#lymphoma_treatment
The most widely used therapies are combinations of chemotherapyand radiation therapy.
- Biological therapy, which targets key features of the lymphoma cells, is used in many cases nowadays.
The goal of medical therapy in lymphoma is complete remission. This means that all signs of the disease have disappeared after treatment. Remission is not the same as cure. In remission, one may still have lymphoma cells in the body, but they are undetectable and cause no symptoms.
- When in remission, the lymphoma may come back. This is called recurrence.
- The duration of remission depends on the type, stage, and grade of the lymphoma. A remission may last a few months, a few years, or may continue throughout one’s life.
- Remission that lasts a long time is called durable remission, and this is the goal of therapy.
- The duration of remission is a good indicator of the aggressiveness of the lymphoma and of the prognosis. A longer remission generally indicates a better prognosis.
Remission can also be partial. This means that the tumor shrinks after treatment to less than half its size before treatment.
The following terms are used to describe the lymphoma’s response to treatment:
- Improvement: The lymphoma shrinks but is still greater than half its original size.
- Stable disease: The lymphoma stays the same.
- Progression: The lymphoma worsens during treatment.
- Refractory disease: The lymphoma is resistant to treatment.
The following terms to refer to therapy:
- Induction therapy is designed to induce a remission.
- If this treatment does not induce a complete remission, new or different therapy will be initiated. This is usually referred to as salvage therapy.
- Once in remission, one may be given yet another treatment to prevent recurrence. This is called maintenance therapy.
6.2.5.1.5.2 Chemotherapy
Many different types of chemotherapy may be used for Hodgkin lymphoma. The most commonly used combination of drugs in the United States is called ABVD. Another combination of drugs, known as BEACOPP, is now widely used in Europe and is being used more often in the United States. There are other combinations that are less commonly used and not listed here. The drugs that make up these two more common combinations of chemotherapy are listed below.
ABVD: Doxorubicin (Adriamycin), bleomycin (Blenoxane), vinblastine (Velban, Velsar), and dacarbazine (DTIC-Dome). ABVD chemotherapy is usually given every two weeks for two to eight months.
BEACOPP: Bleomycin, etoposide (Toposar, VePesid), doxorubicin, cyclophosphamide (Cytoxan, Neosar), vincristine (Vincasar PFS, Oncovin), procarbazine (Matulane), and prednisone (multiple brand names). There are several different treatment schedules, but different drugs are usually given every two weeks.
The type of chemotherapy, number of cycles of chemotherapy, and the additional use of radiation therapy are based on the stage of the Hodgkin lymphoma and the type and number of prognostic factors.
6.2.5.1.5.3 Adult Non-Hodgkin Lymphoma Treatment (PDQ®)
http://www.cancer.gov/cancertopics/pdq/treatment/adult-non-hodgkins/Patient/page1
Key Points for This Section
Adult non-Hodgkin lymphoma is a disease in which malignant (cancer) cells form in the lymph system.
Because lymph tissue is found throughout the body, adult non-Hodgkin lymphoma can begin in almost any part of the body. Cancer can spread to the liver and many other organs and tissues.
Non-Hodgkin lymphoma in pregnant women is the same as the disease in nonpregnant women of childbearing age. However, treatment is different for pregnant women. This summary includes information on the treatment of non-Hodgkin lymphoma during pregnancy
Non-Hodgkin lymphoma can occur in both adults and children. Treatment for children, however, is different than treatment for adults. (See the PDQ summary on Childhood Non-Hodgkin Lymphoma Treatment for more information.)
There are many different types of lymphoma.
Lymphomas are divided into two general types: Hodgkin lymphoma and non-Hodgkin lymphoma. This summary is about the treatment of adult non-Hodgkin lymphoma. For information about other types of lymphoma, see the following PDQ summaries:
Age, gender, and a weakened immune system can affect the risk of adult non-Hodgkin lymphoma.
If cancer is found, the following tests may be done to study the cancer cells:
- Immunohistochemistry : A test that uses antibodies to check for certain antigens in a sample of tissue. The antibody is usually linked to a radioactive substance or a dye that causes the tissue to light up under a microscope. This type of test may be used to tell the difference between different types of cancer.
- Cytogenetic analysis : A laboratory test in which cells in a sample of tissue are viewed under a microscope to look for certain changes in the chromosomes.
- Immunophenotyping : A process used to identify cells, based on the types of antigens ormarkers on the surface of the cell. This process is used to diagnose specific types of leukemia and lymphoma by comparing the cancer cells to normal cells of the immune system.
Certain factors affect prognosis (chance of recovery) and treatment options.
The prognosis (chance of recovery) and treatment options depend on the following:
- The stage of the cancer.
- The type of non-Hodgkin lymphoma.
- The amount of lactate dehydrogenase (LDH) in the blood.
- The amount of beta-2-microglobulin in the blood (for Waldenström macroglobulinemia).
- The patient’s age and general health.
- Whether the lymphoma has just been diagnosed or has recurred (come back).
Stages of adult non-Hodgkin lymphoma may include E and S.
Adult non-Hodgkin lymphoma may be described as follows:
E: “E” stands for extranodal and means the cancer is found in an area or organ other than the lymph nodes or has spread to tissues beyond, but near, the major lymphatic areas.
S: “S” stands for spleen and means the cancer is found in the spleen.
Stage I adult non-Hodgkin lymphoma is divided into stage I and stage IE.
- Stage I: Cancer is found in one lymphatic area (lymph node group, tonsils and nearby tissue, thymus, or spleen).
- Stage IE: Cancer is found in one organ or area outside the lymph nodes.
Stage II adult non-Hodgkin lymphoma is divided into stage II and stage IIE.
- Stage II: Cancer is found in two or more lymph node groups either above or below the diaphragm (the thin muscle below the lungs that helps breathing and separates the chest from the abdomen).
- Stage IIE: Cancer is found in one or more lymph node groups either above or below the diaphragm. Cancer is also found outside the lymph nodes in one organ or area on the same side of the diaphragm as the affected lymph nodes.
Stage III adult non-Hodgkin lymphoma is divided into stage III, stage IIIE, stage IIIS, and stage IIIE+S.
- Stage III: Cancer is found in lymph node groups above and below the diaphragm (the thin muscle below the lungs that helps breathing and separates the chest from the abdomen).
- Stage IIIE: Cancer is found in lymph node groups above and below the diaphragm and outside the lymph nodes in a nearby organ or area.
- Stage IIIS: Cancer is found in lymph node groups above and below the diaphragm, and in the spleen.
- Stage IIIE+S: Cancer is found in lymph node groups above and below the diaphragm, outside the lymph nodes in a nearby organ or area, and in the spleen.
In stage IV adult non-Hodgkin lymphoma, the cancer:
- is found throughout one or more organs that are not part of a lymphatic area (lymph node group, tonsils and nearby tissue, thymus, or spleen), and may be in lymph nodes near those organs; or
- is found in one organ that is not part of a lymphatic area and has spread to organs or lymph nodes far away from that organ; or
- is found in the liver, bone marrow, cerebrospinal fluid (CSF), or lungs (other than cancer that has spread to the lungs from nearby areas).
Adult non-Hodgkin lymphomas are also described based on how fast they grow and where the affected lymph nodes are in the body. Indolent & aggressive.
The treatment plan depends mainly on the following:
- The type of non-Hodgkin’s lymphoma
- Its stage (where the lymphoma is found)
- How quickly the cancer is growing
- The patient’s age
- Whether the patient has other health problems
- If there are symptoms present such as fever and night sweats (see above)
6.2.5.1.6 Primary treatments
6.2.5.1.6.1 Radiation Therapy for leukemias and lymphomas
http://www.lls.org/treatment/types-of-treatment/radiation-therapy
Radiation therapy, also called radiotherapy or irradiation, can be used to treat leukemia, lymphoma, myeloma and myelodysplastic syndromes. The type of radiation used for radiotherapy (ionizing radiation) is the same that’s used for diagnostic x-rays. Radiotherapy, however, is given in higher doses.
Radiotherapy works by damaging the genetic material (DNA) within cells, which prevents them from growing and reproducing. Although the radiotherapy is directed at cancer cells, it can also damage nearby healthy cells. However, current methods of radiotherapy have been improved upon, minimizing “scatter” to nearby tissues. Therefore its benefit (destroying the cancer cells) outweighs its risk (harming healthy cells).
When radiotherapy is used for blood cancer treatment, it’s usually part of a treatment plan that includes drug therapy. Radiotherapy can also be used to relieve pain or discomfort caused by an enlarged liver, lymph node(s) or spleen.
Radiotherapy, either alone or with chemotherapy, is sometimes given as conditioning treatment to prepare a patient for a blood or marrow stem cell transplant. The most common types used to treat blood cancer are external beam radiation (see below) and radioimmunotherapy.
External Beam Radiation
External beam radiation is the type of radiotherapy used most often for people with blood cancers. A focused radiation beam is delivered outside the body by a machine called a linear accelerator, or linac for short. The linear accelerator moves around the body to deliver radiation from various angles. Linear accelerators make it possible to decrease or avoid skin reactions and deliver targeted radiation to lessen “scatter” of radiation to nearby tissues.
The dose (total amount) of radiation used during treatment depends on various factors regarding the patient, disease and reason for treatment, and is established by a radiation oncologist. You may receive radiotherapy during a series of visits, spread over several weeks (from two to 10 weeks, on average). This approach, called dose fractionation, lessens side effects. External beam radiation does not make you radioactive.
6.2.5.1.6.2 bone marrow (BM) transplantation
http://www.nlm.nih.gov/medlineplus/ency/article/003009.htm
There are three kinds of bone marrow transplants:
Autologous bone marrow transplant: The term auto means self. Stem cells are removed from you before you receive high-dose chemotherapy or radiation treatment. The stem cells are stored in a freezer (cryopreservation). After high-dose chemotherapy or radiation treatments, your stems cells are put back in your body to make (regenerate) normal blood cells. This is called a rescue transplant.
Allogeneic bone marrow transplant: The term allo means other. Stem cells are removed from another person, called a donor. Most times, the donor’s genes must at least partly match your genes. Special blood tests are done to see if a donor is a good match for you. A brother or sister is most likely to be a good match. Sometimes parents, children, and other relatives are good matches. Donors who are not related to you may be found through national bone marrow registries.
Umbilical cord blood transplant: This is a type of allogeneic transplant. Stem cells are removed from a newborn baby’s umbilical cord right after birth. The stem cells are frozen and stored until they are needed for a transplant. Umbilical cord blood cells are very immature so there is less of a need for matching. But blood counts take much longer to recover.
Before the transplant, chemotherapy, radiation, or both may be given. This may be done in two ways:
Ablative (myeloablative) treatment: High-dose chemotherapy, radiation, or both are given to kill any cancer cells. This also kills all healthy bone marrow that remains, and allows new stem cells to grow in the bone marrow.
Reduced intensity treatment, also called a mini transplant: Patients receive lower doses of chemotherapy and radiation before a transplant. This allows older patients, and those with other health problems to have a transplant.
A stem cell transplant is usually done after chemotherapy and radiation is complete. The stem cells are delivered into your bloodstream usually through a tube called a central venous catheter. The process is similar to getting a blood transfusion. The stem cells travel through the blood into the bone marrow. Most times, no surgery is needed.
Donor stem cells can be collected in two ways:
Bone marrow harvest. This minor surgery is done under general anesthesia. This means the donor will be asleep and pain-free during the procedure. The bone marrow is removed from the back of both hip bones. The amount of marrow removed depends on the weight of the person who is receiving it.
Leukapheresis. First, the donor is given 5 days of shots to help stem cells move from the bone marrow into the blood. During leukapheresis, blood is removed from the donor through an IV line in a vein. The part of white blood cells that contains stem cells is then separated in a machine and removed to be later given to the recipient. The red blood cells are returned to the donor.
Why the Procedure is Performed
A bone marrow transplant replaces bone marrow that either is not working properly or has been destroyed (ablated) by chemotherapy or radiation. Doctors believe that for many cancers, the donor’s white blood cells can attach to any remaining cancer cells, similar to when white cells attach to bacteria or viruses when fighting an infection.
Your doctor may recommend a bone marrow transplant if you have:
Certain cancers, such as leukemia, lymphoma, and multiple myeloma
A disease that affects the production of bone marrow cells, such as aplastic anemia, congenital neutropenia, severe immunodeficiency syndromes, sickle cell anemia, thalassemia
Had chemotherapy that destroyed your bone
6.2.5.1.6.2.1 Autologous stem cell transplantation
6.2.5.1.6.2.1.1 Phase II trial of 131I-B1 (anti-CD20) antibody therapy with autologous stem cell transplantation for relapsed B cell lymphomas
O.W Press, F Appelbaum, P.J Martin, et al.
http://www.thelancet.com/journals/lancet/article/PIIS0140-6736(95)92225-3/abstract
25 patients with relapsed B-cell lymphomas were evaluated with trace-labelled doses (2·5 mg/kg, 185-370 MBq [5-10 mCi]) of 131I-labelled anti-CD20 (B1) antibody in a phase II trial. 22 patients achieved 131I-B1 biodistributions delivering higher doses of radiation to tumor sites than to normal organs and 21 of these were treated with therapeutic infusions of 131I-B1 (12·765-29·045 GBq) followed by autologous hemopoietic stem cell reinfusion. 18 of the 21 treated patients had objective responses, including 16 complete remissions. One patient died of progressive lymphoma and one died of sepsis. Analysis of our phase I and II trials with 131I-labelled B1 reveal a progression-free survival of 62% and an overall survival of 93% with a median follow-up of 2 years. 131I-anti-CD20 (B1) antibody therapy produces complete responses of long duration in most patients with relapsed B-cell lymphomas when given at maximally tolerated doses with autologous stem cell rescue.
6.2.5.2.6.2.1.2 Autologous (Self) Transplants
http://www.leukaemia.org.au/treatments/stem-cell-transplants/autologous-self-transplants
An autologous transplant (or rescue) is a type of transplant that uses the person’s own stem cells. These cells are collected in advance and returned at a later stage. They are used to replace stem cells that have been damaged by high doses of chemotherapy, used to treat the person’s underlying disease.
In most cases, stem cells are collected directly from the bloodstream. While stem cells normally live in your marrow, a combination of chemotherapy and a growth factor (a drug that stimulates stem cells) called Granulocyte Colony Stimulating Factor (G-CSF) is used to expand the number of stem cells in the marrow and cause them to spill out into the circulating blood. From here they can be collected from a vein by passing the blood through a special machine called a cell separator, in a process similar to dialysis.
Most of the side effects of an autologous transplant are caused by the conditioning therapy used. Although they can be very unpleasant at times it is important to remember that most of them are temporary and reversible.
6.2.5.2.6.2.1.3 Hematopoietic stem cell transplantation
Hematopoietic stem cell transplantation (HSCT) is the transplantation of multipotent hematopoietic stem cells, usually derived from bone marrow, peripheral blood, or umbilical cord blood. It may be autologous (the patient’s own stem cells are used) or allogeneic (the stem cells come from a donor).
Hematopoietic Stem Cell Transplantation
Author: Ajay Perumbeti, MD, FAAP; Chief Editor: Emmanuel C Besa, MD
http://emedicine.medscape.com/article/208954-overview
Hematopoietic stem cell transplantation (HSCT) involves the intravenous (IV) infusion of autologous or allogeneic stem cells to reestablish hematopoietic function in patients whose bone marrow or immune system is damaged or defective.
The image below illustrates an algorithm for typically preferred hematopoietic stem cell transplantation cell source for treatment of malignancy.
An algorithm for typically preferred hematopoietic stem cell transplantation cell source for treatment of malignancy: If a matched sibling donor is not available, then a MUD is selected; if a MUD is not available, then choices include a mismatched unrelated donor, umbilical cord donor(s), and a haploidentical donor.
6.2.5.3 Supportive Therapies
6.2.5.3.1 Blood transfusions – risks and complications of a blood transfusion
- Allogeneic transfusion reaction (acute or delayed hemolytic reaction)
- Allergic reaction
- Viruses Infectious Diseases
The risk of catching a virus from a blood transfusion is very low.
HIV. Your risk of getting HIV from a blood transfusion is lower than your risk of getting killed by lightning. Only about 1 in 2 million donations might carry HIV and transmit HIV if given to a patient.
Hepatitis B and C. The risk of having a donation that carries hepatitis B is about 1 in 205,000. The risk for hepatitis C is 1 in 2 million. If you receive blood during a transfusion that contains hepatitis, you’ll likely develop the virus.
Variant Creutzfeldt-Jakob disease (vCJD). This disease is the human version of Mad Cow Disease. It’s a very rare, yet fatal brain disorder. There is a possible risk of getting vCJD from a blood transfusion, although the risk is very low. Because of this, people who may have been exposed to vCJD aren’t eligible blood donors.
- Fever
- Iron Overload
- Lung Injury
- Graft-Versus-Host Disease
Graft-versus-host disease (GVHD) is a condition in which white blood cells in the new blood attack your tissues.
6.2.5.3.2 Erythropoietin
Erythropoietin, (/ɨˌrɪθrɵˈpɔɪ.ɨtɨn/, UK /ɛˌrɪθroʊ.poʊˈiːtɪn/) also known as EPO, is a glycoprotein hormone that controls erythropoiesis, or red blood cell production. It is a cytokine (protein signaling molecule) for erythrocyte (red blood cell) precursors in the bone marrow. Human EPO has a molecular weight of 34 kDa.
Also called hematopoietin or hemopoietin, it is produced by interstitial fibroblasts in the kidney in close association with peritubular capillary and proximal convoluted tubule. It is also produced in perisinusoidal cells in the liver. While liver production predominates in the fetal and perinatal period, renal production is predominant during adulthood. In addition to erythropoiesis, erythropoietin also has other known biological functions. For example, it plays an important role in the brain’s response to neuronal injury.[1] EPO is also involved in the wound healing process.[2]
Exogenous erythropoietin is produced by recombinant DNA technology in cell culture. Several different pharmaceutical agents are available with a variety ofglycosylation patterns, and are collectively called erythropoiesis-stimulating agents (ESA). The specific details for labelled use vary between the package inserts, but ESAs have been used in the treatment of anemia in chronic kidney disease, anemia in myelodysplasia, and in anemia from cancer chemotherapy. Boxed warnings include a risk of death, myocardial infarction, stroke, venous thromboembolism, and tumor recurrence.[3]
6.2.5.3.4 G-CSF (granulocyte-colony stimulating factor)
Granulocyte-colony stimulating factor (G-CSF or GCSF), also known as colony-stimulating factor 3 (CSF 3), is a glycoprotein that stimulates the bone marrow to produce granulocytes and stem cells and release them into the bloodstream.
There are different types, including
- Lenograstim (Granocyte)
- Filgrastim (Neupogen, Zarzio, Nivestim, Ratiograstim)
- Long acting (pegylated) filgrastim (pegfilgrastim, Neulasta) and lipegfilgrastim (Longquex)
Pegylated G-CSF stays in the body for longer so you have treatment less often than with the other types of G-CSF.
6.2.5.3.5 Plasma exchange (plasmapheresis)
http://emedicine.medscape.com/article/1895577-overview
Plasmapheresis is a term used to refer to a broad range of procedures in which extracorporeal separation of blood components results in a filtered plasma product.[1, 2] The filtering of plasma from whole blood can be accomplished via centrifugation or semipermeable membranes.[3] Centrifugation takes advantage of the different specific gravities inherent to various blood products such as red cells, white cells, platelets, and plasma.[4] Membrane plasma separation uses differences in particle size to filter plasma from the cellular components of blood.[3]
Traditionally, in the United States, most plasmapheresis takes place using automated centrifuge-based technology.[5] In certain instances, in particular in patients already undergoing hemodialysis, plasmapheresis can be carried out using semipermeable membranes to filter plasma.[4]
In therapeutic plasma exchange, using an automated centrifuge, filtered plasma is discarded and red blood cells along with replacement colloid such as donor plasma or albumin is returned to the patient. In membrane plasma filtration, secondary membrane plasma fractionation can selectively remove undesired macromolecules, which then allows for return of the processed plasma to the patient instead of donor plasma or albumin. Examples of secondary membrane plasma fractionation include cascade filtration,[6] thermofiltration, cryofiltration,[7] and low-density lipoprotein pheresis.
The Apheresis Applications Committee of the American Society for Apheresis periodically evaluates potential indications for apheresis and categorizes them from I to IV based on the available medical literature. The following are some of the indications, and their categorization, from the society’s 2010 guidelines.[2]
- The only Category I indication for hemopoietic malignancy is Hyperviscosity in monoclonal gammopathies
6.2.5.3.6 Platelet transfusions
6.2.5.3.6.1 Indications for platelet transfusion in children with acute leukemia
Scott Murphy, Samuel Litwin, Leonard M. Herring, Penelope Koch, et al.
Am J Hematol Jun 1982; 12(4): 347–356
http://onlinelibrary.wiley.com/doi/10.1002/ajh.2830120406/abstract;jsessionid=A6001D9D865EA1EBC667EF98382EF20C.f03t01
http://dx.doi.org:/10.1002/ajh.2830120406
In an attempt to determine the indications for platelet transfusion in thrombocytopenic patients, we randomized 56 children with acute leukemia to one of two regimens of platelet transfusion. The prophylactic group received platelets when the platelet count fell below 20,000 per mm3 irrespective of clinical events. The therapeutic group was transfused only when significant bleeding occurred and not for thrombocytopenia alone. The time to first bleeding episode was significantly longer and the number of bleeding episodes were significantly reduced in the prophylactic group. The survival curves of the two groups could not be distinguished from each other. Prior to the last month of life, the total number of days on which bleeding was present was significantly reduced by prophylactic therapy. However, in the terminal phase (last month of life), the duration of bleeding episodes was significantly longer in the prophylactic group. This may have been due to a higher incidence of immunologic refractoriness to platelet transfusion. Because of this terminal bleeding, comparison of the two groups for total number of days on which bleeding was present did not show a significant difference over the entire study period.
6.2.5.3.6.2 Clinical and laboratory aspects of platelet transfusion therapy
Yuan S, Goldfinger D
http://www.uptodate.com/contents/clinical-and-laboratory-aspects-of-platelet-transfusion-therapy
INTRODUCTION — Hemostasis depends on an adequate number of functional platelets, together with an intact coagulation (clotting factor) system. This topic covers the logistics of platelet use and the indications for platelet transfusion in adults. The approach to the bleeding patient, refractoriness to platelet transfusion, and platelet transfusion in neonates are discussed elsewhere.
Pooled platelets – A single unit of platelets can be isolated from every unit of donated blood, by centrifuging the blood within the closed collection system to separate the platelets from the red blood cells (RBC). The number of platelets per unit varies according to the platelet count of the donor; a yield of 7 x 10¹⁰ platelets is typical [1]. Since this number is inadequate to raise the platelet count in an adult recipient, four to six units are pooled to allow transfusion of 3 to 4 x 10¹¹ platelets per transfusion [2]. These are called whole blood-derived or random donor pooled platelets.
Advantages of pooled platelets include lower cost and ease of collection and processing (a separate donation procedure and pheresis equipment are not required). The major disadvantage is recipient exposure to multiple donors in a single transfusion and logistic issues related to bacterial testing.
Apheresis (single donor) platelets – Platelets can also be collected from volunteer donors in the blood bank, in a one- to two-hour pheresis procedure. Platelets and some white blood cells are removed, and red blood cells and plasma are returned to the donor. A typical apheresis platelet unit provides the equivalent of six or more units of platelets from whole blood (ie, 3 to 6 x 10¹¹ platelets) [2]. In larger donors with high platelet counts, up to three units can be collected in one session. These are called apheresis or single donor platelets.
Advantages of single donor platelets are exposure of the recipient to a single donor rather than multiple donors, and the ability to match donor and recipient characteristics such as HLA type, cytomegalovirus (CMV) status, and blood type for certain recipients.
Both pooled and apheresis platelets contain some white blood cells (WBC) that were collected along with the platelets. These WBC can cause febrile non-hemolytic transfusion reactions (FNHTR), alloimmunization, and transfusion-associated graft-versus-host disease (ta-GVHD) in some patients.
Platelet products also contain plasma, which can be implicated in adverse reactions including transfusion-related acute lung injury (TRALI) and anaphylaxis. (See ‘Complications of platelet transfusion’ .)
6.2. + Steroids
Like this:
Like Loading...
Read Full Post »


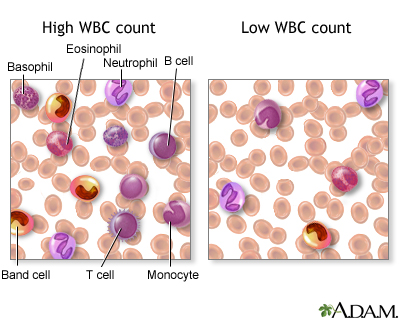