A Concise Review of Cardiovascular Biomarkers of Hypertension
Curator: Larry H. Bernstein, MD, FCAP
LPBI
Revised 5/25/2016
Introduction
While a large body of work had been done on cholesterol synthesis, HDL and LDL cholesterol, triglycerides, and lipoproteins for a quarter century, and the concept of metabolic syndrome was emerging, there was neither a unifying concept nor a sufficient multivariable approach to apply the use of laboratory markers to clinical practice. The mathematical foundation for such an evaluation of the biological markers and the computational tools were maturing at the turn of the 20th century, and the interest in outcomes research for improved healthcare practice was maturing. In addition, there was now heavy investment in health information systems that would support emerging health networks of a rapidly consolidating patient base. This has become important for the pharmaceutical industry and for allied health sciences to enable a suitable method of measuring the effectiveness of drug and of lifestyle changes to improve the population health.
The importance of finding biomarkers for hypertension is significant as stated above. I refer to observations in a lecture by Teresa Seeman, Ph.D., Professor, UCLA Geffen School of Medicine (1).
The missed cased of hypertension in the U.S. alone has been examined by the NHANES studies. Table I
shows the poor identification of this serious chronic condition. The next table (Table II)*, also from NHANES (Seeman study) looks at Allostatic Load for biomarkers using component biomarker measurement criterion cutpoints. Table III* gives the odds ratios for mortality by Allostatic Load Score.
An explanatory problem for our difficulty with diagnosis of a number of hypertension disease “subsets” is that there is peripheral hypertension that might be idiopathic, or it might be related to coexisting diseases with both inflammatory and vascular structural dynamics nature. In addition, this may be concurrent with pulmonary hypertension, systemic hypertension, and progressive renal disease. This discussion is reserved for later. As stated, the late or missed diagnosis of systemic or essential idiopathic hypertension is illustrated in the three Seeman tables (1).
Table 1
Table 2
Table 3
Table 1*. Missed cases by “self report”
| Self-reports
vs undiagnosed |
study |
NHANES 88-94 |
NHANES 99-2004 |
NHANES 2005-08 |
| Hypertension %unaware |
BP > 140/90 |
42.7 |
43.5 |
39.06 |
SR-controlled
SR-high
Unaware |
|
7.45
10
13.88 |
8.35
10.85
16.12 |
6.5
10.18
19.98 |
| High cholesterol |
Chol > 220 g/dl |
55.93 |
49.3 |
47.05 |
SR-controlled
SR- high
Unaware |
|
11.02
8.68
12.12 |
8.47
8.72
18.5 |
7.22
8.12
23.46 |
| Diabetes |
HgA1C > 6.4% |
|
|
|
| SR-controlled
SR- high
Unaware |
|
2.41
3.43
1.64 |
1.76
5.01
3.09 |
2.11
5.51
3.09 |
*modified from Seeman
Table II* USHANES: Allostatic Load – component cutpoints
| Biomarker |
Total N |
High Risk |
Percent (%) |
Cutpoint |
| DBP (mm Hg) |
15,489 |
1,180 |
7.62 |
90 |
| SBP (mm Hg) |
15,491 |
3,461 |
22.34 |
140 |
| Pulse Rate |
15,117 |
1,009 |
6.67 |
90 |
| HgA1C (%) |
15,441 |
1,482 |
9.60 |
6.4 |
| WHR |
14,824 |
6,778 |
45.72 |
0.94 |
| HDL Cholesterol (mg/dl) |
15,187 |
3,440 |
22.65 |
40 |
| Total Cholesterol
(mg/dl) |
15,293 |
3,196 |
20.90 |
240 |
*From T. Seaman, UCLA Geffen SOM
Table III*. Odds of mortality by Allostatic Load Score.
| ALS |
Odds Ratio |
| 7-8 |
5 |
| 6 |
2.6 |
| 5 |
2.3 |
| 4 |
2.1 |
| 3 |
1.8 |
| 2 |
1.5 |
| 1 |
1.4 |
*From T. Seaman, UCLA Geffen SOM
I refer to cardiovascular diseases in reference to an aggregate of diseases affecting the heart, the circulatory system from large artery to the capillary, the lungs and kidneys, excluding the lymphatics.
These major disease entities are both separate and interrelated, not necessarily found in the same combinations. However, they account for a growing proportion of illness, apart from cancers, that affect the aging population of western societies. In the discussion that follows, I shall construct a picture of the pathophysiology of cardiovascular diseases, describe the major biomarkers for the assessment of these, point out the relationship of these to hypertension, and try to develop a more targeted approach to the assessment of hypertension and related disorders.
Chronic kidney disease (CKD) is defined as persistent kidney damage accompanied by a reduction in the glomerular filtration rate (GFR) and the presence of albuminuria. The rise in incidence of CKD is attributed to an aging populace and increases in hypertension (HTN), diabetes, and obesity within the U.S. population. CKD is associated with a host of complications including electrolyte imbalances, mineral and bone disorders, anemia, dyslipidemia, and HTN. It is well known that CKD is a risk factor for cardiovascular disease (CVD), and that a reduced GFR and albuminuria are independently associated with an increase in cardiovascular and all-cause mortality.
The relationship between CKD and HTN is cyclic, as CKD can contribute to or cause HTN (3). Elevated BP leads to damage of blood vessels within the kidney, as well as throughout the body. This damage impairs the kidney’s ability to filter fluid and waste from the blood, leading to an increase of fluid volume in the blood—thus causing an increase in BP.
A cursory description of the blood circulation
The full circulation involves the heart as a pump, and the arteries and veins, comprising small and large vessels, and capillaries at the point of delivery of oxygen and capture of carbon dioxide, and of transfer of substrates to tissues. The brain, liver, pancreas and spleen, and endocrines are not further considered here, except for a consideration on neuro-humoral peptides that have emerged in the regulation of blood pressure and are essential to the stress response. The lung and the liver are both important with respect to the exchange of air and metabolites, and both have secondary circulations, the pulmonary and the portal vascular circulations. In the case of the lungs, the vena cava flows into the right atrium, which delivers unoxygenated blood to the lungs via the right ventricle and right pulmonary artery, which returns to the left atrium by way of the right pulmonary vein. The blood from the left atrium that flows into the left ventricle is ejected into the aorta. The coronary arteries that nourish the heart are at the base of the aorta. The heart muscle is a syncytium, unlike striated muscle, and it is densely packed with mitochondria, suitable for continuous contraction under vasovagal control. This is the anatomical construct, but the physiology is still being clarified because normal function and disease are both a matter of regulatory control.
In order to understand hypertension, we have to view the heart functioning over a long period of time.
In a still frame picture, we envision the left ventricle contracts emptying the oxygenated blood into the circulation. The ejection of blood into the aorta is called systole, by which the blood is delivered by the force of contraction into the circulation. The filling pressure is called diastole. So we have a filling and an emptying, and heard by the stethoscope is a lub-dub, synchronously repeated. A normal systolic blood pressure is below 120. A systolic blood pressure of 120 to 139 means you have prehypertension, or borderline high blood pressure. Even people with prehypertension are at a higher risk of developing heart disease. A systolic blood pressure number of 140 or higher is considered to be hypertension, or high blood pressure. The diastolic blood pressure number or the bottom number indicates the pressure in the arteries when the heart rests between beats. A normal diastolic blood pressure number is less than 80. A diastolic blood pressure between 80 and 89 indicates prehypertension. A diastolic blood pressure number of 90 or higher is considered to be hypertension or high blood pressure. So now we have identified a systolic and a diastolic high blood pressure. Systolic pressure increases with vigorous activity, and becomes normal when the activity resides. The systolic blood pressure increases with age. Over time, consistently high blood pressure weakens and damages the blood vessels so affected. Moreover, changes in the body’s normal functions may cause high blood pressure, including changes to kidney fluid and salt balances, the renin-angiotensin-aldosterone system, sympathetic nervous system activity, and blood vessel structure and function.
Starling’s Law of the Heart
Two principal intrinsic mechanisms, namely the Frank-Starling mechanism and rate induced regulation, enable the myocardium to adapt to changes in hemodynamic conditions. The Frank-Starling mechanism (also referred to as Starling’s law of the heart), is invoked in response to changes in the resting length of the myocardial fibers. Rate-induced regulation is invoked in response to changes in the frequency of the heartbeat. (3-9).
Frank and Starling (3, 4) showed that an increase in diastolic volume caused an increase in systolic performance. The stretch effect persists across a range of myocardial contractile states, but during exercise it plays only a lesser role augmenting ventricular function maximal exercise. This is because in healthy human subjects adrenergic reflex mechanisms modulate myocardial performance, heart rate, vascular impedance and coronary flow during exercise and changes in these variables can overshadow the effect of fiber stretch or even prevent an increase in end-diastolic volume during stress (5). (See you- tube (6).
According to Lakatta muscle length modulates the extent of myofilament calcium ion (Ca2+) activation (7-9). Similarly, the fiber length during a contraction, which is determined in part by the load encountered during shortening, also determines the extent of myofilament Ca2+ activation. Therefore, the terms preload, afterload and myocardial contractile state lose part of their significance in light of current knowledge.
Biology and High Blood Pressure
Researchers continue to study how various changes in normal body functions cause high blood pressure. The key functions affected in high blood pressure include (10):
Kidney Fluid and Salt Balances
The kidneys normally regulate the body’s salt balance by retaining sodium and water and excreting potassium. Imbalances in this kidney function can expand blood volumes, which can cause high blood pressure.
Renin-Angiotensin-Aldosterone System
The renin-angiotensin-aldosterone system makes angiotensin and aldosterone hormones. Angiotensin narrows or constricts blood vessels, which can lead to an increase in blood pressure. Aldosterone controls how the kidneys balance fluid and salt levels. Increased aldosterone levels or activity may change this kidney function, leading to increased blood volumes and high blood pressure.
Sympathetic Nervous System Activity
The sympathetic nervous system has important functions in blood pressure regulation, including heart rate, blood pressure, and breathing rate. Researchers are investigating whether imbalances in this system cause high blood pressure.
Blood Vessel Structure and Function
Changes in the structure and function of small and large arteries may contribute to high blood pressure. The angiotensin pathway and the immune system may stiffen small and large arteries, which can affect blood pressure.
Two or more types of hypertension
Systemic hypertension
Idiopathic hypertension
Hypertension from chronic renal disease
Pulmonary artery hypertension
Hypertension associated with systemic chronic inflammatory disease (rheumatoid arthritis and other collagen vascular diseases)
Genetic Causes of High Blood Pressure
Much of the understanding of the body systems involved in high blood pressure has come from genetic studies. High blood pressure often runs in families. Years of research have identified many genes and other mutations associated with high blood pressure, some in the renal salt regulatory and renin-angiotensin-aldosterone pathways. However, these known genetic factors only account for 2 to 3 percent of all cases. Emerging research suggests that certain DNA changes during fetal development also may cause the development of high blood pressure later in life.
Environmental Causes of High Blood Pressure
Environmental causes of high blood pressure include unhealthy lifestyle habits, being overweight or obese, and medicines.
Other medical causes of high blood pressure include other medical conditions such as chronic kidney disease, sleep apnea, thyroid problems, or certain tumors.
The common complications of hypertension and their signs and symptoms include:
http://www.nhlbi.nih.gov/health/health-topics/topics/hbp/causes10
Pulse Pressure and Stroke Volume
The pulse pressure is the difference between systolic (the upper number) and diastolic (the lower number) (11).
Systemic pulse pressure = Psystolic – Pdiastolic
The pulse pressure is 40 mmHg for a typical blood pressure reading of 120/80 mmHg.
Pulse pressure (PP) is proportional to stroke volume (SV), the amount of blood pumped from the heart in one beat, and inversely proportional to the compliance or flexibility of the blood vessels, mainly the aorta.
A low (also called narrow) pulse pressure means that not much blood is being expelled from the heart, and can be caused by a number of factors, including severe blood loss due to trauma, congestive heart failure, shock, a narrowing of the valve leading from the heart to the aorta (stenosis), and fluid accumulating around the heart (tamponade).
High (or wide) pulse pressures occur during exercise, as stroke volume increases and the overall resistance to blood flow decreases. It can also occur for many reasons, such as hardening of the arteries (which can have numerous causes), various deficiencies in the aorta (mainly) or other arteries, including leaks, fistulas, and a usually-congenital condition known as AVM, pain/anxiety, fever, anemia, pregnancy, and more. Certain medications for high blood pressure can widen pulse pressure, while others narrow it. A chronic increase in pulse pressure is a risk factor for heart disease, and can lead to the type of arrhythmia called atrial fibrillation or A-Fib.
Hypertension Background and Definition
The prevalence of CKD has steadily increased over the past two decades, and was reported to affect over 13% of the U.S. population in 2004. In 2009, more than 570,000 people in the United States were classified as having end-stage renal disease (ESRD), including nearly 400,000 dialysis patients and over 17,000 transplant recipients. A patient is determined to have ESRD when he or she requires replacement therapy, including dialysis or kidney transplantation. A National Health Examination Survey (NHANES) spanning 2005-2006 showed that 29% of US adults 18 years of age and older were hypertensive, and of those with high blood pressure (BP), 78% were aware they were hypertensive, 68% were being treated with antihypertensive agents, and only 64% of treated individuals had controlled hypertension (12, 13). In addition, data from NHANES 1999-2006 estimated that 30% of adults 20 years of age and older have prehypertension, defined as an untreated SBP of 120-139 mm Hg or untreated DBP of 80-89 mmHg (12, 13).
Hypertension is the most important modifiable risk factor for coronary heart disease (the leading cause of death in North America), stroke (the third leading cause), congestive heart failure, end-stage renal disease, and peripheral vascular disease. The 2010 Institute for Clinical Systems Improvement (ICSI) guideline (14) on the diagnosis and treatment of hypertension indicates that systolic blood pressure (SBP) should be the major factor to detect, evaluate, and treat hypertension In adults aged 50 years and older. The 2013 joint European Society of Hypertension (ESH) (15) and the European Society of Cardiology (ESC) (16) guidelines recommend that ambulatory blood-pressure monitoring (ABPM) be incorporated into the assessment of cardiovascular risk factors and hypertension.
The JNC 7 (17) identifies the following as major cardiovascular risk factors:
- Hypertension: component of metabolic syndrome
- Tobacco use, particularly cigarettes, including chewing tobacco
- Elevated LDL cholesterol (or total cholesterol ≥240 mg/dL) or low HDL cholesterol: component of metabolic syndrome
- Diabetes mellitus: component of metabolic syndrome
- Obesity (BMI ≥30 kg/m 2): component of metabolic syndrome
- Age greater than 55 years for men or greater than 65 years for women: increased risk begins at the respective ages; the Adult Treatment Panel III used earlier age cut points to suggest the need for earlier action
- Estimated glomerular filtration rate less than 60 mL/min
- Microalbuminuria
- Family history of premature cardiovascular disease (men < 55 years; women < 65 years)
- Lack of exercise
The Eighth Report of the JNC (JNC 8), released in December 2013 no longer recommends just thiazide-type diuretics as initial therapy in most patients. In essence, the JNC 8 recommends treating to 150/90 mm Hg in patients over age 60 years; for everybody else, the goal BP is 140/90 (18).
Biomarkers Associated with Hypertension
The biomarkers associated with hypertension are for the most part derived from features that characterize the disordered physiology. We might first consider the measurement of blood pressure. Then it becomes necessary to analyze the physiological elements that largely contribute to blood pressure. Finally, there are several biomarkers that have loomed large as measures are myocardial function or myocardial cell death, and are also not independent of renal function, that are indicators of short term and long term cardiovascular status. Having already indicated the importance of measurement of pulse, diastolic and systolic blood pressure in the routine examination of physical status, which is related to cardiac output we shall pay attention to the pulse pressure and pulse wave velocity. These were defined in the preceding discussion. They are critically related to the development of hypertension and in the long term, they emerge significantly earlier than either congestive heart failure, chronic kidney disease, acute coronary syndrome, stroke, or cardio-renal syndrome.
Even though cardiovascular disease (CVD), the leading cause of death in developed countries, is not predicted by classic risk factors, there are elements of the risk factor association that need further exploration and will be dissected, such as activity level, obesity, lipids, diabetes mellitus, family history and stress. Further analysis will point to endocrine and/or metabolic factors that drive cardiovascular risk.
In taking into account the blood pressure measurements, we consider the pulse pressure (PP) and the pulse wave velocity (PWV). If we refer back to the stroke volume and the Law of the Heart, the systolic blood pressure (SBP) is increased with increased left ventricular output that raises the left ventricular (LV) afterload. This coincides with a decrease in diastolic pressure (DBP) that accompanies a change in coronary artery perfusion (CAP). Thus, many studies point to increased SBP as a strong risk factor for stroke and CVD. However, there are sufficient studies that indicate the brachial artery pulse pressure (PP) is a strong determinant of CVD and stroke, and these two elements, SBP and brachial artery PP, may be an indicator of increased arterial stiffness in hypertensive patients and the general population. Brachial PP is also a determinant of recurrent events after acute coronary syndrome (ACS) or with left ventricular hypertrophy (LVH), or the risk of CHF in the aging population, and of all-cause-mortality in the general population. In addition, the aortic PWV calculated from the Framingham equations was a suitable predictor of CVD risk. In a classic study of arterial stiffness and of CVD and all-cause mortality in an essential hypertension cohort at the Broussais Hospital between 1980 and 1996 (19), the carotid-femoral PWV was measured as an indicator of aortic stiffness, and it was found to be significantly associated with all-cause and CVD mortality independent of previous CVD, age, and diabetes. They tested the hypothesis that aortic stiffness is a predictor of cardiovascular and all-cause mortality in hypertensive patients based on the consideration that the elastic properties of the aorta and central arteries are the major determinants of systemic arterial impedance, and the PWV measured along the aortic and aorto-iliac pathway is the most clinically relevant. They assessed arterial stiffness by measuring the PWV using the Moens-Korteweg equation based on the increase of the square root of the elasticity modulus in stiffer arteries (20).
PWV as a Diagnostic Test
To assess the performance of PWV considered as a diagnostic test, with the use of receiver operating characteristic (ROC) curves, they calculated sensitivities, specificities, positive predictive values, and negative predictive values of PWV at different cutoff values, first to detect the presence of AA in the overall population and second to detect patients with high 10-year cardiovascular mortality risk in the subgroup of 462 patients without AA with age range from 30 to 74 years. Optimal cutoff values of PWV were defined as the maximization of the sum of sensitivity and specificity.
The main finding of the study was that PWV was a strong predictor of cardiovascular risks as determined by the Framingham equations in a population of treated or untreated subjects with essential hypertension (21). They measured the PWV from foot-to-foot transit time in the aorta for a noninvasive evaluation of regional aortic stiffness, which allows an estimate of the distance traveled by the pulse. The presence of a PWV > 13 m/s, taken alone, appeared as a strong predictor of cardiovascular mortality with high performance values (21). Their work and other studies (22, 23) established increased pulse pressure, the major hemodynamic consequence of increased aortic PWV, as a strong independent predictor of cardiac mortality, mainly MI, in populations of normotensive and hypertensive subjects.
In addition to the findings above, the PWV was found to be an independent predictor of future increase in SBP and of incident hypertension in the Baltimore study (21). The authors reported that in a subset of 306 subjects who were normotensive at baseline, hypertension developed in 105 (34%) during a median follow-up of 4.3 years (range 2 to 12 years). PWV was also an independent predictor of incident hypertension (hazard ratio 1.10 per 1 m/s increase in PWV, 95% confidence interval 1.00 to 1.30, p = 0.03) in individuals with a follow-up duration greater than the median. The authors (21) concluded that carotid-femoral PWV measured using nondirectional transcutaneous Doppler probes (model 810A, 9 to 10-Mhz probes, Parks Medical Electronics, Inc., Aloha, Oregon) could be done to identify normotensive individuals who should be targeted for the implementation of interventions aimed at preventing or delaying the progression of subclinical arterial stiffening and the onset of hypertension. They reported that age, BMI, and MAP were independently associated with higher SBP on the last visit (Table IV); in addition, PWV was also independently associated with higher SBP on the last visit, and explained 4% of its variance. As shown in Table V, age, BMI, and MAP (p = 0.09, p = 0.009, p < 0.0001 respectively for the interaction terms with time) were predictors of the longitudinal changes in SBP. In addition, PWV was also an independent predictor of the longitudinal increase in SBP (p = 0.003 for the interaction term with time).
In addition, they report that in the group with follow-up duration greater than the median (in which all subjects remained normotensive for the first 4.3 years), beyond age (hazard ratio [HR] 1.02 per 1 year, 95% confidence interval [CI] 0.99 to 1.04, p = 0.2) and SBP (HR 1.05 per 1 mm Hg, 95% CI 1.01 to 1.09, p = 0.006), both HDL (HR 0.96 per 1 mg/dl, 95% CI 0.93 to 0.99, p = 0.02) and PWV (HR 1.10 per 1 m/s, 95% CI 1.00 to 1.30, p = 0.03) (Fig. 1) were independent predictors of incident HTN.
Their findings in a longitudinal projection indicate that PWV, a marker of central arterial stiffening, is an independent determinant of longitudinal SBP increase in healthy BLSA volunteers, and an independent risk factor for incident hypertension among normotensive subjects followed up for longer than 4 years. The study was accompanied by a commentary in the same journal that states: “Pulse wave velocity (PWV) is a simple measure of the time taken by the pressure wave to travel over a specific distance. By virtue of its intrinsic relation to the mechanical properties of the artery by the Moens–Kortweg formula (PWV=√(Eh/2)Rρ; where E is the Young’s Modulus of the arterial wall, h the wall thickness, R the end- diastolic radius and ρ is the density of blood)(20), and buoyed a number of longitudinal studies that reported on the independent predictive value of PWV measurement for cardiovascular events and mortality in various populations, PWV is now widely accepted as the ‘gold standard’ measure of arterial stiffness.
Table IV Multiple Regression Analysis Evaluating the Predictors of Last Visit SBP 21
| Variable |
Parameter
Estimate |
Standard
Error |
p Value |
| Age (yrs) |
0.32 |
0.06 |
<0.0001 |
| Gender (men) |
0.65 |
1.78 |
0.71 |
| Race (white) |
−1.22 |
2.00 |
0.54 |
| Smoking (ever) |
2.48 |
1.61 |
0.12 |
| BMI (kg/m2)* |
0.61 |
0.22 |
0.006 |
| MAP (mm Hg)* |
0.60 |
0.08 |
<0.0001 |
| PWV (m/s)* |
1.56 |
0.38 |
<0.0001 |
| Heart rate (beats/min) |
0.08 |
0.06 |
0.20 |
| Total cholesterol (mg/dl) |
−0.005 |
0.02 |
0.83 |
| Triglycerides (mg/dl) |
−0.009 |
0.01 |
0.50 |
| HDL cholesterol (mg/dl) |
−0.001 |
0.07 |
0.98 |
| Glucose (mg/dl) |
−0.02 |
0.06 |
0.75 |
Table V Predictors of Longitudinal SBP Derived From a Linear Mixed-Effects Regression Model 21
| Variable |
Coefficient |
Standardized
Coefficient |
95% Confidence
Interval |
p Value |
| Time (yrs) |
3.14 |
0.14 |
0.61 to 5.66 |
0.02 |
| Age (yrs) |
−0.37 |
0.25 |
−0.68 to −0.06 |
0.02 |
| Age2 (yrs2)* |
0.006 |
0.08 |
0.002 to 0.008 |
<0.0001 |
| Gender (men) |
0.61 |
0.03 |
−1.26 to 2.47 |
0.52 |
| BMI (kg/m2)* |
0.25 |
0.11 |
−0.01 to 0.50 |
0.06 |
| MAP (mmHg)* |
1.03 |
0.47 |
0.93 to 1.12 |
<0.0001 |
| PWV (m/s) |
0.29 |
0.12 |
−0.16 to 0.74 |
0.21 |
| Time × age* |
0.02 |
0.04 |
−0.002 to 0.038 |
0.09 |
| Time × BMI* |
0.10 |
0.06 |
0.02 to 0.183 |
0.009 |
| Time × MAP* |
−0.08 |
−0.12 |
−0.11 to −0.05 |
<0.0001 |
| Time × PWV* |
0.22 |
0.08 |
0.07 to 0.36 |
0.003 |
Figure 1 21
http://content.onlinejacc.org/data/Journals/JAC/23115/10065_gr1.jpeg
Figure 2.21
http://content.onlinejacc.org/data/Journals/JAC/23115/10065_gr2.jpeg
The interest in this physiological measure is illustrated by the increasing number and diversity of research publications in this arena related to human hypertension, relating PWV to pathophysiological processes (for example, homocysteine, inflammation and extracellular matrix turnover and disorders related to hypertension, such as sleep apnea). The epidemiology, genetic associations and prognostic implications of PWV (and arterial stiffness) have also been reported as has the relationship to hemodynamics, cardiac structure and function.” (24) Furthermore, arterial stiffening may be “characterized by an increase in (central) PP and changes in the morphology of the arterial waveform, both of which can now be measured non-invasively using tonometers from commercially available devices. Wave reflection is typically characterized by aortic pressure augmentation (ΔP) and the augmentation index (ΔP/PP) (Figure 3)(24). Higher augmented pressure, as an index of wave reflection, has been linked to adverse clinical outcomes in different populations.”
Figure 3.24
Analysis of the pressure waveform. The initial systolic pressure is labelled as P1 and augmented pressure ( P) is typically measured as the difference between peak pressure (P2) and P1. Augmentation index is P/PP. PP, pulse pressure. http://www.nature.com/jhh/journal/v22/n10/images/jhh200847f1.gif 24
A review by Payne et al. (25) states that aortic stiffness and arterial pulse wave reflections determine elevated central systolic pressure and are associated with risk of adverse cardiovascular outcomes. This is because an impaired compensatory mechanism through matrix metalloproteinases of remodeling to compensate for changes in wall stress, possibly related to angiotensin II and inhibition of the vascular adhesion protein semicarbazide-sensitive amine oxidase, related to reduced elastin fiber cross-linking. This has implications for pharmacological agents that target age-related advanced glycation end-product cross-links. This also brings into consideration NO playing a considerable role. But they caution that the endogenous NO synthase inhibitors asymmetric dimethylarginine and L-NG-monomethyl arginine associated with clinical atherosclerosis don’t appear to be associated with arterial stiffening. The matter leaves much to be explained. The mechanisms underlying arterial stiffness could well require insights into inflammation, calcification, vascular growth and remodeling, and endothelial dysfunction. Nevertheless, arterial stiffness is independently associated with cardiovascular outcome in most of the situations where it has been examined. Given this train of thinking, O’Rourke (26) considers a progressive arterial dilatation with repeated cycles of stress that leads to degeneration of the arterial wall and increases the pressure wave impulse and wave velocity, augmenting the pressure in late systole. Drugs may reduce wave reflection, but have no direct effect on arterial stiffness. However, reduction in wave reflection decreases aortic systolic pressure augmentation. DK Arnett (26) depicts the effect of persistently elevated blood pressure in the following diagram (Figure 4).
Figure 4.26 Both transient and sustained stiffening of the artery are likely to be present in hypertension.
An initial elevation in blood pressure may establish a positive feedback in which hypertension biomechanically increases arterial stiffness without any structural change. This elevated blood pressure might later lead to additional vascular hypertrophy and hyperplasia, collagen deposition, and atherosclerosis, and fixed elevations in arterial stiffness. As to a genetic factor, she refers to a gene contributing to pulse pressure on chromosome 8 located at 32 cM, which also contains the lipoprotein lipase (LPL) gene which has been associated with hypertension. LPL may be an important candidate gene for pulse pressure. She specifically identifies a relationship between genetic regions contributing to aortic compliance in African American sibships ascertained for hypertension in Figure 5 (27). These results suggest there may be influential genetic regions contributing to aortic compliance in African American sibships ascertained for hypertension (27). Collectively, these two studies, the first to our knowledge, indicate the presence of genetic factors influencing hypertension.
Other authors state that PWV has a direct relationship to intrinsic elasticity of the arterial wall, and it is an independent predictor of CVD related morbidity and mortality, but it is not associated with classical risk factors for atherosclerosis (28). They point out that PWV doesn’t increase during early stages of atherosclerosis, as measured by intima-media thickness and non-calcified atheroma, but it does increase in the presence of aortic calcification that occurs with advanced atherosclerotic plaque. Age-related
PWV measurement. Carotid-to-femoral PWV is calculated by dividing the distance (d) between the two arterial sites by the difference in time of pressure wave arrival between the carotid (t1) and femoral artery (t2) referenced to the R wave of the electrocardiogram.
Figure 5. Linkage of arterial compliance on chromosome 2: HyperGEN27
Widening of the pulse pressure is the major cause of age-related increase in prevalence of hypertension and is related to arterial stiffening. (28) Commonly used points for measuring the PWV are the carotid and femoral artery because they are superficial and easy to access. Arterial distensibility is measured by the Bramwell and Hill equation (29): PWV = √(V × ΔP/ρ × ΔV), where ρ is blood density. This is shown in Figure 6.
Figure 6 28
View larger version:
Furthermore, these authors (28) report arterial stiffness increases with age by approximately 0.1 m/s/y in East Asian populations with low prevalences of atherosclerosis, but some authors have found accelerated stiffening between 50 and 60 years of age. In contrast, stiffness of peripheral arteries increases less or not at all with increasing age. Again, ageing of the arterial media is associated with increased expression of matrix metalloproteinases (MMP), which are members of the zinc-dependent endopeptidase family and are involved in degradation of vascular elastin and collagen fibers. Several different types of MMP exist in the vascular wall, but in relation to arterial stiffness, much interest has focused on MMP-2 and MMP-9. This concludes the discussion of PP and PWV in the evolution of hypertension.
Diagnostic Biomarkers of essential hypertension.
Ioannidis and Tzoulaki (30) reviewed the literature on 10 popular ‘‘new’’ biomarkers and found that each one had accrued more than 6000 publications.1 The predictive effects of these popular blood biomarkers for coronary heart disease in the general population are listed in Table VI (31).
Table VI.* Predictive Value of New Biomarkers 30,31
| Biomarker |
Adjusted Relative Risk (95% C.I.) |
| Triglycerides |
0.99 (0.94–1.05) |
| C-reactive protein |
1.39 (1.32–1.47) |
| Fibrinogen |
1.45 (1.34–1.57) |
| Interleukin 6 |
1.27 (1.19–1.35) |
| BNP or NT-proBNP |
1.42 (1.24–1.63) |
| Serum albumin |
1.2 (1.1–1.3) |
| ICAM-1 |
(0.75–1.64) |
| Homocysteine |
1.05 (1.03–1.07) |
| Uric acid |
1.09 (1.03–1.16) |
*Ionnidis and Tzoulaki from Giles
The majority of these biomarkers show small effects, if any, even in combination. Giles (31) points out that an elevated homocysteine level might be of great importance to a young person with a myocardial infarction and a positive family history of similar occurrences. Emerging biomarkers, eg, asymmetric and symmetric dimethylarginine and galectin-3, are promising more specific biomarkers based on pathophysiologies for cardiovascular disease. Even then, blood pressure remains the biomarker par excellence for hypertension and for many other cardiovascular entities.
The importance of blood pressure was highlighted by the report of the cardiovascular lifetime risk pooling project.(10) Starting at 55 years of age, 61,585 men and women were followed over an average of 14 years, ie, 700,000 person-years. Individuals who maintained or decreased their blood pressure to normal levels had the lowest remaining lifetime risk for cardiovascular disease (22–41%) compared with individuals who had or developed hypertension by 55 years of age (42–69%). The study indicated that efforts should continue to emphasize the importance of lowering blood pressure and avoiding or delaying the incidence of hypertension to reduce the lifetime risk for cardiovascular disease
A small study involving 120 hypertensive patients with or without heart failure tried to establish a multi-biomarker approach to heart failure (HF) in hypertensive patients using N-terminal pro BNP (32). The following biomarkers were included in the study: Collagen III N-terminal propeptide (PIIINP), cystatin C (CysC), lipocalin-2/NGAL, syndecan-4, tumor necrosis factor-α (TNF-α), interleukin 1 receptor type I (IL1R1), galectin-3, cardiotrophin-1 (CT-1), transforming growth factor β (TGF-β) and N-terminal pro-brain natriuretic peptide (NT-proBNP). The highest discriminative value for HF was observed for NT-proBNP (area under the receiver operating characteristic curve (AUC) = 0.873) and TGF-β (AUC = 0.878). On the basis of ROC curve analysis they found that CT-1 > 152 pg/mL, TGF-β < 7.7 ng/mL, syndecan > 2.3 ng/mL, NT-proBNP > 332.5 pg/mL, CysC > 1 mg/L and NGAL > 39.9 ng/mL were significant predictors of overt HF. There was only a small improvement in predictive ability of the multi-biomarker panel including the four biomarkers with the best performance in the detection of HF (NT-proBNP, TGF-β, CT-1, CysC) compared to the panel with NT-proBNP, TGF-β and CT-1 (absent CysC). The biomarkers with different pathophysiological backgrounds (NT-proBNP, TGF-β, CT-1) give additive prognostic value for incident compared to NT-proBNP alone.
Inflammation has been associated with pathophysiology of hypertension and vascular damage. Resistant hypertensive patients (RHTN) have unfavorable prognosis due to poor blood pressure control and higher prevalence of target organ damage. Endothelial dysfunction and arterial stiffness are involved in such condition. Previous studies showed that RHTN patients have higher arterial stiffness and endothelial dysfunction than controlled hypertensive and normotensive subjects. The relationship between high blood pressure levels and arterial stiffness may be explained in part, by inflammatory pathways. Previous studies also found that hypertensive subjects have higher levels of inflammatory cytokines including TNF-α, IL-10, IL-1β and CRP. Moreover, IL-1β correlates with arterial stiffness and levels of blood pressure, which are particularly high in patients with resistant hypertension. Increased inflammatory cytokines levels might be related to the development of vascular damage and to the higher cardiovascular risk of resistant hypertensive patients. Elevated BP may cause cardiovascular structural and functional alterations leading to organ damage such as left ventricular hypertrophy, arterial and renal dysfunction. TNF-α inhibition reduced systolic BP and endothelial inflammation in SHR [33]. They also found that IL-1β correlates with arterial stiffness and levels of blood pressure, even after adjust for age and glucose [33]. These investigators then demonstrated that isoprostane levels, an oxidative stress marker, were associated with endothelial dysfunction in these patients [33].
Chao et al. carried out studies of kallistatin (34-36). Kallistatin is an endogenous protein in human plasma as a tissue Kallikrein-Binding Protein (KBP). Tissue kallikrein is a serine protease that releases vasodilating kinin peptides from kininogen substrate. The tissue kallikrein-kinin system is involved in mediating beneficial effects in hypertension as well as cardiac, cerebral and renal injury. KBP was later identified as a serine protease inhibitor (serpin) because of its ability to inhibit tissue kallikrein activity, and was subsequently named “kallistatin”. Kallistatin is mainly expressed in the liver, but is also present in the heart, kidney and blood vessel. Kallistatin protein contains two structural elements: an active site and a heparin-binding domain. The active site of kallistatin is crucial for complex formation with tissue kallikrein, and thus tissue kallikrein inhibition.
Kallistatin is expressed in tissues relevant to cardiovascular function, and has consequently been shown to have vasodilating properties. Kallistatin has pleiotropic effects in vasodilation and inhibition of inflammation, angiogenesis, oxidative stress, fibrosis, and cancer progression. Injection of a neutralizing Kallistatin antibody into hypertensive rats aggravates cardiovascular and renal injury in association with increased inflammation, oxidative stress and tissue remodeling. Neither the blood pressure-lowering effect nor the vasorelaxation ability of kallistatin is abolished by icatibant (Hoe140, a kinin B2 receptor antagonist), indicating that kallistatin-mediated vasodilation is unrelated to the tissue kallikrein-kinin system.
The findings reported indicate that kallistatin exerts beneficial effects against hypertension and organ damage. Kallistatin levels in circulation, body fluids or tissues were lower in patients with liver disease, septic syndrome, diabetic retinopathy, severe pneumonia, inflammatory bowel disease, and cancer of the colon and prostate. In addition, reduced plasma kallistatin levels are associated with adiposity and metabolic risk in apparently healthy African American youths. Considered a negative acute-phase protein, circulating kallistatin levels as well as hepatic expression are rapidly reduced within 24 hours after Lipopolysaccharide (LPS) induced endotoxemia in mice. Similarly, circulating kallistatin levels are markedly decreased in patients with septic syndrome and liver disease. Taking together, the studies indicate that kallistatin exhibits potent anti-inflammatory activity.
The pathogenesis of hypertension and cardiovascular and renal diseases is tightly linked to increased oxidative stress and reduced NO bioavailability (37-39). Time-dependent elevation of circulating oxygen species are associated with reduced kallistatin levels in animal models of hypertension and cardiovascular and renal injury. Stimulation of NO formation by kallistatin may lead to inhibition of oxidative stress and thus multi-organ damage. On the other hand, endogenous kallistatin depletion by neutralizing antibody increased oxidative stress and aggravated cardiovascular and renal damage.
A human kallistatin gene polymorphism has been shown to correlate with a decreased risk of developing acute kidney injury during septic shock. Kallistatin levels are markedly reduced in both humans and mice with sepsis syndrome. However, kallistatin administration protects against lethality and organ injury in animal models of toxic septic shock. Moreover, kallistatin levels are decreased in patients with liver disease, septic shock, inflammatory bowel disease, severe pneumonia and acute respiratory distress syndrome. Taken together, the results indicate that kallistatin has the potential to be a molecular biomarker for patients with sepsis, cardiovascular and metabolic disorders.
Pulmonary hypertension (PH) is defined as a mean pulmonary artery pressure of .25 mmHg at rest or .30 mmHg with exercise. Right heart catheterization is required for the definitive diagnosis. Subsequent investigations are instituted to further characterize the disease. The 6-min walk test (6MWT), a measure of exercise capacity, and the New York Heart Association (NYHA)/World Health Organization (WHO) functional classification, a measure of severity, are used to follow the clinical course while receiving treatment, and these both correlate with disease severity and prognosis (43).
Pulmonary arterial hypertension (PAH) is a progressive disease of the pulmonary vasculature that leads to exercise limitation, right heart failure, and death. There is a need for biomarkers that can aid in early detection, disease surveillance, and treatment monitoring in PAH. Several potential molecules have been investigated; however, only brain natriuretic peptide is currently recommended at diagnosis and for follow-up of PAH patients.
ANP is released from storage granules in atrial tissue, while BNP is secreted from ventricular tissue in a constitutive fashion. ANP secretion is stimulated by atrial stretch caused by atrial volume overload; BNP is released in response to ventricular stretch. Natriuretic peptides act on the kidney, causing natriuresis and diuresis, and relax vascular smooth muscle, causing arterial and venous dilatation, leading to reduced blood pressure and ventricular preload. ANP and BNP are released as prohormones and then cleaved into the active peptide and an inactive N-terminal fragment (43).
Natriuretic peptide precursors are released in response to atrial and ventricular stretch, cleaved into active molecules and inactive precursors and convert guanosine 59-triphosphate (GTP) to cyclic guanosine monophosphate (cGMP), leading to their various physiological actions.
There are a number of confounding factors in the interpretation of natriuretic peptide levels, including left heart disease, sex, age and renal dysfunction. Since most studies exclude patients with left heart disease and renal dysfunction, it becomes problematic extrapolating these results to an unselected population (43).
Endothelin-1 (ET-1) is a peptide found in abundance in the human lung and, through action of endothelin receptors (ETA and ETB) on vascular smooth muscle cells, is implicated in the pathogenesis of PAH. Endothelin receptor antagonists are approved for the treatment of PAH. Levels of circulating ET-1 and related molecules are logical biomarkers of interest in PAH. ET-1 is elevated in PAH compared to controls, and correlates with pulmonary hemodynamic parameters. In addition, higher ET-1 levels are associated with increased mortality in patients treated for PAH. ET-1’s precursor, big-ET-1, has a longer half-life and hence is more stable than ET-1.
Endothelin-1 ET-1 is a potent endogenous vasoconstrictor and proliferative cytokine. The ET-1 gene is translated to prepro-ET-1 which is then cleaved, by the action of an intracellular endopeptidase, to form the biologically inactive big ET-1. ET-converting enzymes further cleave this to form functional ET-1 . There are two ET receptor isoforms, termed type A (ETA), located predominantly on vascular smooth muscle cells, and type B (ETB), predominantly expressed on vascular endothelial cells but also on arterial smooth muscle. Activation of both receptor subtypes, when located on vascular smooth muscle, results in vasoconstriction and cell proliferation. In addition, the endothelial ETB receptor mediates vasodilatation and clearance of ET-1 (43).
Prepro-ET-1 is cleaved to inactive big ET-1 and then further cleaved to form active ET-1. This acts on vascular smooth muscle via the ETA and ETB receptors, causing vasoconstriction and cell proliferation, and on endothelial cells via ETB receptors, releasing nitric oxide (NO) and prostacyclin (PGI2), causing vasorelaxation.
As a biomarker, ADMA has been evaluated in several different classes of PH (43, 44). In IPAH, plasma levels are significantly higher than in healthy, matched controls. In such patients, plasma ADMA correlates positively with right atrial pressure, and negatively with mixed venous oxygen saturation, stroke volume, cardiac index and survival. On stepwise multiple regression analysis, ADMA is an independent predictor of mortality and, using Kaplan–Meier survival curves, patients with supramedian ADMA levels have significantly worse survival than those with inframedian levels.
Patients with idiopathic PAH, plasma levels of Ang-1 and Ang-2 were higher in PAH patients as compared to healthy controls. Moreover, higher plasma levels of Ang-2 were associated with lower CI and mixed venous oxygen saturation (SvO2) and higher PVR, and, with therapy initiation, changes in Ang-2 correlated with changes in hemodynamics (45, 46).
Endostatin is an antiangiogenic peptide. It is synthesized by myocardium, is detectable in the peripheral circulation of patients with decompensated heart failure, and predicts mortality.48 In PAH, reduced RV myocardial oxygen delivery is felt to contribute to a transition from RV adaptation to failure (46).
Cyclic guanosine monophosphate (cGMP) is an intracellular second messenger of nitric oxide and an indirect marker of natriuretic peptide production (46).
Human pentraxin 3 (PTX3) is a protein synthesized by vascular cells that regulates angiogenesis, inflammation, and cell proliferation (46).
N-terminal propeptide of procollagen III (PIIINP), carboxy-terminal telopeptide of collagen I (CITP), matrix metalloproteinase-9 (MMP-9), and tissue inhibitor of metalloproteinase I (TIMP-1)(46).
Osteopontin (OPN) is a matricellular protein that mediates cell migration, adhesion, remodeling, and survival of the vascular and inflammatory cells (46).
F2-isoprostane is a marker of lipid peroxidation of arachidonic acid, which stimulates endothelial cell proliferation and ET-1 synthesis and may play a role in the pathogenesis of PAH (46).
Circulating fibrocytes are bone marrow-derived cells (CD45 /collagen I ) that contribute to organ fibrosis and extracellular matrix deposition (46).
Circulating miRs (46)
Despite many other substances being investigated as potential biomarkers in PAH, more research is needed to validate the results of small studies and assess their clinical utility. Widespread clinical use of current investigational biomarkers will require validated clinical laboratory techniques and increased knowledge of levels in the healthy population as well as other disease states.
Here are important tests in clinical practice (47):
6-min walk distance
Cardiac index
WHO FC
PIIINP
Higher tertiles associated with worse disease
worse renal function
higher right atrial pressure (RAP)
CITP – vascular remodeling
Recent guidelines (17, 18) encourage the use of screening examinations, such as an echocardiogram (UCG), in high-risk populations for the early detection of PAH . To detect PAH in patients with connective tissue disease (CTD), the obvious screening tests are an UCG and spirometry, including assessment of the diffusing capacity of the lung for carbon monoxide (DLCO). Previous studies have suggested that B-type natriuretic peptide (BNP) and its N-terminal prohormone (NT-proBNP) are potential biomarkers for PAH. However, neither BNP nor NT-pro BNP are specific biomarkers of the degeneration of the pulmonary artery; rather, they are biomarkers of cardiac burden resulting from right heart failure.
Human pentraxin 3 (PTX3) is a specific biomarker for PAH, reflecting pulmonary vascular proteins. They are divided into short and long pentraxins on the basis of their primary structure.
C-Reactive protein (CRP) and serum amyloid P are the classic short pentraxins that are produced in the liver in response to systemic inflammatory cytokines (48). In contrast, PTX3 is one of the long pentraxins. It is synthesized by local vascular cells, such as smooth muscle cells, endothelial cells and fibroblasts, as well as innate immunity cells at sites of inflammation. PTX3 plays a key role in the regulation of cell proliferation and angiogenesis (49).
Increased plasma PTX3 levels have been reported in patients with acute myocardial injury in the
24 h after admission to hospital, with levels returning to normal after 3 days. Similarly, PTX3 levels are higher in patients with unstable angina pectoris, with the changes in PTX3 levels found to be independent of other coronary risk factors, such as obesity and diabetes mellitus. Finally, high serum PTX3 levels have been reported in patents with vasculitis, such as small-vessel vasculitis and Takayasu aortitis.
Mean plasma PTX3 concentrations in the CTD-PAH and CTD patients were 5.02+0.69 ng/mL (range 1.82–12.94 ng/mL) and 2.40+0.14 ng/mL (range 0.70–4.29 ng/mL), respectively (Table 2). Log transformation of the data revealed significantly higher PTX3 levels in CTD-PAH than in CTD patients (1.49+0.12 vs. 0.82+0.06 log ng/mL, respectively; P = 0.001).(not shown)(50)
Figure 1. Serum pentraxin 3 (PTX3) concentrations in 50 patients with pulmonary arterial hypertension (PAH) and 100 healthy controls, and their correlation with serum concentrations of other biomarkers. A: Comparison of PTX3 concentrations in PAH patients and healthy controls. Mean plasma PTX3 concentrations were 4.4060.37 and 1.94+0.09 ng/mL in the controls and PAH patients, respectively. B: Distribution of log-transformed PTX3 concentrations in PAH patients and healthy controls. C: Log-transformed PTX3 concentrations were significantly higher in patients with PAH than in healthy controls (1.34+0.07 vs. 0.55+0.05 log ng/mL, respectively; P,0.001). D, E: There was no correlation between plasma concentrations of PTX3 and either B-type natriuretic peptide (BNP; r=0.33, P=0.02) or C-reactive protein (CRP; r=0.21, P=0.14) in PAH patients. (not shown) (50)
Table 2. Clinical characteristics and biomarkers in patients with connective tissue disease, with or without pulmonary arterial hypertension.
CTD-PAH ( n =17) CTD alone ( n =34) P -value
Age (years) 56.3+4.6 56.3+2.7 0.990
No. women (%) 15 (88) 31(91) 0.745
No. with SSc (%) 10 (59) 20 (59) 1
No. with heart failure (%) 1 (6) 0 –
No. being treated for PAH (%) 17 (100) 0 –
Serum PTX3 (mg/dL) 5.02+0.69 2.40+0.14 0.001
Serum CRP (mg/dL) 0.24+0.09 0.22+0.04 0.936
Serum BNP (pg/mL) 189.3+74. 4 49.3+12.1 0.014
….. CTD, connective tissue disease; PAH, pulmonary arterial hypertension; SSc, scleroderma;
Figure 3. Receiver operating characteristic (ROC) curves for pentraxin 3 (PTX3) and other biomarkers in patients with connective tissue disease (CTD). The areas under the ROC curve (AUCROC) for PTX3 was 0.866 (95% confidence interval (CI) 0.757–0.974). The star indicates the threshold concentration of 2.85 ng/mL PTX3 that maximized true-positive and false-negative results (sensitivity 94.1%, specificity 73.5%). The AUCROC for C-reactive protein (CRP) was 0.518 (95% CI 0.333–0.704), whereas that for B-type natriuretic peptide (BNP) was 0.670 (95% CI 0.497–0.842). (50) http://dx.doi.org:/10.1371/journal.pone.0045834.g003
This study was to determine whether PTX3, the regulation of which is independent of that of the systemic inflammatory marker CRP, is a useful biomarker for diagnosing PAH. The investigators found that PTX3 may be a more sensitive biomarker for PAH than BNP, which is, to date, the most established biomarker for PAH, especially in patients with CTD-PAH. Their findings suggest that PTX3 does not reflect the cardiac burden due to the pulmonary hypertension, but rather the activity of pulmonary vascular degeneration because PTX3 levels were significantly decreased after active treatment specifically for PAH (50). PLoS ONE 7(9): e45834. http://dx.doi.org:/10.1371/journal.pone.0045834.
Pharmacologic treatment for pulmonary arterial hypertension (PAH) remains suboptimal and mortality rates are still high, even with pulmonary vasodilator therapy. In addition, we have only an incomplete understanding of the pathobiology of PAH, which is characterized at the tissue level by fibrosis, hypertrophy and plexiform remodeling of the distal pulmonary arterioles. Novel therapeutic approaches that might target pulmonary vascular remodeling, rather than pulmonary vaso-reactivity, require precise patient phenotyping both in terms of clinical status and disease subtype. However, current risk stratification models are cumbersome and not precise enough for choosing or assessing the results of therapeutic intervention. Biomarkers used in patients with left heart failure, such as troponin-T and N-terminal pro-B-type natriuretic peptide (NT-proBNP) are elevated in PAH patients but tend to simply reflect increased circulating plasma volumes and elevated right heart pressure, rather than conveying information about disease mechanism.
In this issue of Heart, Calvier and colleagues (see page 390) (51)propose galectin-3 as a useful biomarker in PAH. The rationale for this hypothesis is that elevated aldosterone levels induce an increase in serum levels of galectin-3, a β-galactoside-binding lectin expressed by circulating myocytes, endothelial cells and other cardiovascular cell types. Among other effects, activation of the aldosterone/galactin-3 pathway promotes fibrosis (51), suggesting that elevated levels will correlate with the severity of PAH due to increased pulmonary arteriolar remodeling. To test this hypothesis, serum levels were measured in a total of 57 patients – 41 with idiopathic PAH (iPAH) and 16 with PAH associated with a connective tissue disorder (CTD). The magnitude of elevation in serum levels of aldosterone, galectin-3 and NT-proBNP each correlated with the severity of PAH. However, as shown in figure 1, although serum levels of galectin-3 were elevated in both iPAH and PAH-CTD patients, aldosterone was elevated only in those with iPAH.
In addition, elevated vascular cell adhesion molecule 1 (VCAM-1) and proinflammatory, anti-angiogenic interleukin 12 (IL-12) in were elevated only in PAH-CTD patients, not in those in iPAH. These data suggest that aldosterone and galectin-3 can be used as biomarkers “in tandem” that reflect both the severity and cause of PAH (52).
In the accompanying editorial, Maron (see page 335) summarizes the knowledge gaps in PAH and concludes: “Taken together, Calvier and colleagues provide a key contribution to an underdeveloped area of pulmonary vascular medicine and in doing so identify galectin-3/aldosterone as promising biomarker(s) for informing both disease pathobiology and clinical status in PAH. The rationale of this pursuit in PAH was based, in part, on lessons earned from left heart failure in which the importance of systemically circulating vasoactive factors to clinical trajectory is well established. In this regard, the current work not only develops a novel scientific avenue worthy of further investigation, but also adds to the evolving body of evidence implicating a role for neurohumoral activation in the pathophysiology of PAH”.
Rheumatoid arthritis (RA) affects about 1% of the population and is known to be a significant risk factor for cardiovascular disease, with a 3-fold increased risk of myocardial infarction, a 2-fold increased risk of sudden death and a 50% increase in cardiovascular mortality rates. However, outcomes after PCI in RA patients have not been well characterized and there is little data on the possible effects of disease modifying therapy for RA on risk of restenosis after percutaneous coronary intervention (PCI). In a single center retrospective cohort study, Sintek and colleagues (53)(see page 363) compared the primary endpoint of repeat target vessel revascularization (TVR) in 143 RA patients matched to 541 other.
Pathophysiological targets of differing imaging modalities, demonstrate targets for tracers/contrast agents/pharmacotherapy used in SPECT, PET, MRI and echocardiography to assess myocardial viability. (Not shown. Adapted from Schuster et al., J Am Coll Cardiol 2012; 59:359–70.)
Ischemic cardiomyopathy implies significant left ventricular systolic dysfunction with an underlying pathophysiology that includes myocardial scarring, hibernation and stunning, or a combination of these disease states. The role of imaging in assessment of myocardial viability is emphasized (not shown) (54) with brief summaries of the role of echocardiography, single photon emission computed tomography (SPECT), positron emission tomography (PET), and magnetic resonance imaging (MRI). The effects of revascularization in patients with ischemic cardiomyopathy remain controversial. Instead, the key elements of evidence based therapy for ischemic cardiomyopathy are standard medical therapy for heart failure combined with implantable cardiac defibrillation (ICD) and/or biventricular pacing device therapy in appropriate patients.
The relationship between the heart and the kidney in hypertension and heart failure
Hypertension is undoubtedly a factor in the treatment of chronic kidney disease because of the relationship between kidney function and BP components that have been studied in people with CKD, diabetes, and hypertension. Cystatin C was used to evaluate the association between kidney function and both SBP and DBP and 24-h creatinine clearance (CrCl) among 906 participants in the Heart and Soul Study. (56). The study investigators hypothesized that although both creatinine and cystatin C are freely filtered at the glomerulus, a major difference between them is that creatinine is secreted by renal tubules, whereas cystatin C is metabolized by the proximal tubule and only a small fraction appears in the urine. In addition, Cystatin C has also been shown to be a stronger predictor of adverse outcomes than serum creatinine. Based on the more linear relationship of cystatin C with GFR, they hypothesized that cystatin C would have a stronger association with SBP than conventional measures of kidney function. Their results found that SBP was linearly associated with cystatin C concentrations (1.19 ± 0.55 mm Hg increase per 0.4 mg/L cystatin C, P = .03) across the range of kidney functions, but only in subjects with CrCl <60 mL/min (6.4 ± 2.13 mm Hg increase per 28 mL/min, P = .003), not >60 mL/min. Further, the DBP was not associated with cystatin C or CrCl. However, PP was linearly associated with both cystatin C (1.28 ± 0.55 mm Hg per 0.4 mg/L cystatin, P = .02) and CrCl <60 mL/min (7.27 ± 2.16 mm Hg per 28 mL/min, P = .001). The relationship between SBP and cystatin C by decile is shown in Figure 7 and Table 3.
Figure 7.
Mean systolic blood pressure (SBP) and diastolic blood pressure (DBP) by decile of kidney function measured as cystatin C. http://www.ncbi.nlm.nih.gov/pmc/articles/PMC2771570/bin/nihms-153474-f0001.jpg
Table 3
Linear regression of systolic blood pressure by kidney function (N = 906)
|
|
Age-adjusted |
Multivariable adjusted* |
| Measure |
N |
β coefficient |
P |
β coefficient |
P |
| Cystatin-C (per 0.4 mg/L [SD] increase) |
|
1.75 ± 0.72 |
.01 |
1.19 ± 0.55 |
.03 |
| Overall |
|
|
|
|
|
| >1.0 |
551 |
2.23 ± 0.07 |
.03 |
1.23 ± 0.03 |
.04 |
| <1.0 |
355 |
1.59 ± 0.04 |
.71 |
0.54 ± 0.01 |
.87 |
| Spline P value for difference in slopes |
|
|
|
|
.85 |
| 24-h CrCl (per 28 mL/min [SD] decrease) |
|
|
|
|
|
| Overall |
|
1.96 ± 0.76 |
.01 |
0.91 ± 0.61 |
.14 |
| <60 |
222 |
11.20 ± 2.74 |
<.001 |
6.40 ± 2.13 |
.003 |
| >60 |
684 |
0.31 ± 0.99 |
.42 |
0.36 ± 0.77 |
.64 |
| Spline P-value for difference in slopes |
|
|
|
|
.01 |
|
|
|
|
|
|
|
|
|
|
|
|
The results for both Cystatin C and for eGFR are in agreement with incidence rates for heart failure (57)categorized by ejection fraction (EF) and kidney function over 1992−2000 in the Cardiovascular Health Study. Estimated glomerular filtration rate (mL/min per 1.73 m2) is labeled as “eGFR”. (http://www.ncbi.nlm.nih.gov/pmc/articles/PMC2258307/bin/nihms-39968-f0002.jpg).
The association of cystatin C with risk for SHF appeared linear across quartiles of cystatin C (57) and slightly stronger at the highest categories of cystatin C, whereas the lower three quartiles of cystatin C had similar risks for DHF. Participants with an estimated GFR ≥ 60 mL/min per 1.73 m2 had an equal likelihood of developing DHF or SHF, whereas participants with an estimated GFR < 60 mL/min per 1.73 m2 had a greater likelihood of developing SHF.
When an interaction term for HF type (SHF or DHF) was inserted into a fully adjusted standard Cox proportional hazards model with HF with either type of EF as the outcome, the association of continuous cystatin C with SHF was significantly greater than the association of cystatin C with DHF ( P value for interaction < 0.001). The association of estimated GFR and SHF compared with DHF was weaker (P value for interaction = 0.06 for the fully adjusted model).
Ascending quartiles of cystatin C were associated with increasing adjusted risk for the development of “unclassified” HF, defined by the absence of a point-of-care EF measurement. The magnitude of the fully adjusted hazard ratios for the association between cystatin C and risk of unclassified HF were intermediate between those described for DHF and SHF [hazard ratios (95% confidence intervals) for each higher quartile of cystatin C 1.00 (reference), 1.12 (0.80−1.57), 1.84 (1.34−2.51), 2.18 (1.58−3.00)]. The authors state that increased left atrial filling pressures trigger the release of atrial natriuretic peptide and inhibition of vasopressin, which leads to decreased renal sympathetic tone and diuresis early in the pathogenesis of HF (57). They suggest that even relatively small decrements in k58idney function contribute to the risk of SHF.
Aldosterone plays a key role in homeostatic control and maintenance of blood pressure (BP) by regulation of extracellular volume, vascular tone, and cardiac output. Taking this assumption further, a study unrelated to that above explored the magnitude of the effect of relative aldosterone excess in predicting peripheral as well as aortic blood pressure in a cohort of patients undergoing coronary angiography. (58) They found that mean peripheral systolic blood pressure (SBP) and diastolic blood pressure (DBP) of the entire cohort were 141 ± 24 mm Hg and 81 ± 11 mm Hg, respectively. Median SBP and aortic SBP increased steadily and significantly from aldosterone/renin ratio (ARR), respectively; p < 0.0001 for both) after multivariate adjustment for parameters potentially influencing BP. ARR emerged as the second most significant independent predictor (after age) of mean SBP and as the most important predictor of mean DBP in this patient cohort. The authors stress the importance of the ARR in modulating BP over a much wider range than is currently appreciated, as it was already known that the ARR was positively associated with pulse wave velocity in young normotensive healthy adults, indicating that relative aldosterone excess might affect arterial remodeling and precede BP rise as a result of increased vascular stiffness. In this study the ARR was calculated as the PAC/PRC ratio (pg/ml/pg/ml). An ARR >50 pg/ml had a sensitivity and specificity of ARR of 89% and 96%, respectively, for primary aldosteronism. The ARR was modeled as a continuous ratio (with log-transformed values). The study carried out a multivariate stepwise regression analysis for predictors of BP (not shown). They illustrate (not shown) that marked increases in PRC are a major characteristic of lower ARR categories, and that across a broad range of ARR values, inappropriately elevated aldosterone levels exert a strong effect on BP values and constitute the most important and second-most important predictor of DBP and SBP, respectively.
Cystatin C may be ordered when a health practitioner is not satisfied with the results of other tests, such as a creatinine or creatinine clearance, or wants to check for early kidney dysfunction, particularly in the elderly, and/or wants to monitor known impairment over time. In diverse populations it has been found to improve the estimate of GFR when combined in an equation with blood creatinine. A high level in the blood corresponds to a decreased glomerular filtration rate (GFR) and hence to kidney dysfunction. Since cystatin C is produced throughout the body at a constant rate and removed and broken down by the kidneys, it should remain at a steady level in the blood if the kidneys are working efficiently and the GFR is normal.
Chronic kidney disease (CKD) is defined as the presence of: persistent and usually progressive reduction in GFR (GFR <60 mL/min/1.73 m2) and/or albuminuria (>30 mg of urinary albumin per gram of urinary creatinine), regardless of GFR. Cystatin C is an index of GFR, especially in patients where serum creatinine may be misleading (eg, very obese, elderly, or malnourished patients); for such patients, use of CKD-EPI cystatin C equation is recommended to estimate GFR. Cystatin C eGFR may have advantages over creatinine eGFR in certain patient groups in whom muscle mass is abnormally high or low (for example quadriplegics, very elderly, or malnourished individuals). Blood levels of cystatin C also equilibrate more quickly than creatinine, and therefore, serum cystatin C may be more accurate than serum creatinine when kidney function is rapidly changing (59) (for example amongst hospitalized individuals).
It is a low molecular weight (13,250 kD) cysteine proteinase inhibitor that is produced by all nucleated cells and found in body fluids, including serum. Since it is formed at a constant rate and freely filtered by the kidneys, its serum concentration is inversely correlated with the glomerular filtration rate (GFR); that is, high values indicate low GFRs while lower values indicate higher GFRs, similar to creatinine. While both cystatin C and creatinine are freely filtered by glomeruli, cystatin C is reabsorbed and metabolized by proximal renal tubules. Thus, under normal conditions, cystatin C does not enter the final excreted urine to any significant degree, and the serum concentration is unaffected by infections, inflammatory or neoplastic states, or by body mass, diet, or drugs. GFR can be estimated (eGFR) from serum cystatin C utilizing an equation which includes the age and gender of the patient (CKD-EPI cystatin C equation, developed by Inker et al. (59) It demonstrated good correlation with measured iothalamate clearance in patients with all common causes of kidney disease, including kidney transplant recipients.
According to the National Kidney Foundation Kidney Disease Outcome Quality Initiative (K/DOQI) classification, among patients with CKD, irrespective of diagnosis, the stage of disease should be assigned based on the level of kidney function:
Table 4
| Stage |
Description |
GFR mL/min/BSA |
| 1 |
Kidney damage with normal or increased GFR |
90 |
| 2 |
Kidney damage with mild decrease in GFR |
60-89 |
| 3 |
Moderate decrease in GFR |
30-59 |
| 4 |
Severe decrease in GFR |
15-29 |
| 5 |
Kidney failure |
<15 (or dialysis) |
(http://www2.kidney.org/professionals/kdoqi/guidelines_ckd/p4_class_g1.htm)
In a study to evaluate cystatin C as a measure of renal function in comparison to serum creatinine, 500 patients had cystatin C measured by nephelometry and glomerular filtration rate (GFR) measured by nonradiolabeled iothalamate clearance (59). In addition, serum creatinine was measured and the patients’ medical records reviewed. The correlation of 1/cystatin C with GFR (r=0.90) was significantly superior than 1/creatinine (r=0.82, p<0.05) with GFR. The superior correlation of 1/cystatin C with GFR was observed in the various clinical subgroups of patients studied (ie, subjects with no suspected renal disease, renal transplant patients, recipients of some other transplant, patients with glomerular disease, and patients with non-glomerular renal disease). The findings indicated that cystatin C may be superior to serum creatinine for the assessment of GFR in a wide spectrum of patients (59). Others have similarly found that cystatin C correlates better than serum creatinine for assessment of GFR. (60)
Patients were screened for 3 chronic kidney disease (CKD) studies in the United States (n = 2,980) and a clinical population in Paris, France (n = 438)(61). GFR was measured by using urinary clearance of iodine125-iothalamate in the US studies and chromium51-EDTA in the Paris study. GFR was calculated using the 4 new equations based on serum cystatin C alone, serum cystatin C, serum creatinine, or both with age, sex, and race. New equations were developed by using linear regression with log GFR as the outcome in two thirds of data from US studies. Internal validation was performed in the remaining one third of data from US CKD studies; external validation was performed in the Paris study.
Mean mGFR, serum creatinine, and serum cystatin C values were 48 mL/min/1.73 m2 (5th to 95th percentile, 15 to 95), 2.1 mg/dL, and 1.8 mg/L, respectively. For the new equations, coefficients for age, sex, and race were significant in the equation with serum cystatin C, but 2- to 4-fold smaller than in the equation with serum creatinine (62, 63). Measures of performance in new equations were consistent across the development and internal and external validation data sets. Percentages of estimated GFR within 30% of mGFR for equations based on serum cystatin C alone, serum cystatin C, serum creatinine, or both levels with age, sex, and race were 81%, 83%, 85%, and 89%, respectively. The equation using serum cystatin C level alone yields estimates with small biases in age, sex, and race subgroups, which are improved in equations including these variables. It is concluded that Serum cystatin C level alone provides GFR estimates not linked to muscle mass, and that an equation including serum cystatin C level in combination with serum creatinine level, age, sex, and race provides the most accurate estimates.
The authors report that absence of urinary excretion has made it difficult to rigorously evaluate cystatin C as a filtration marker and to examine its non-GFR determinants. They also point out that a high level of variation in the cystatin C assay (64, 65), and standardization and calibration of clinical laboratories will be important to obtain accurate GFR estimation using cystatin C, as has been shown for creatinine.
The study reported above was followed by a major study by Inker LA, et al. (59). Their findings are summarized as follows. Mean measured GFRs were 68 and 70 ml per minute per 1.73 m2 of body-surface area in the development and validation data sets, respectively. In the validation data set, the creatinine–cystatin C equation performed better than equations that used creatinine or cystatin C alone. Bias was similar among the three equations, with a median difference between measured and estimated GFR of 3.9 ml per minute per 1.73 m2 with the combined equation, as compared with 3.7 and 3.4 ml per minute per 1.73 m2 with the creatinine equation and the cystatin C equation (P=0.07 and P=0.05), respectively. Precision was improved with the combined equation (interquartile range of the difference, 13.4 vs. 15.4 and 16.4 ml per minute per 1.73 m2, respectively [P=0.001 and P<0.001]), and the results were more accurate (percentage of estimates that were >30% of measured GFR, 8.5 vs. 12.8 and 14.1, respectively [P<0.001 for both comparisons]). In participants whose estimated GFR based on creatinine was 45 to 74 ml per minute per 1.73 m2, the combined equation improved the classification of measured GFR as either less than 60 ml per minute per 1.73 m2 or greater than or equal to 60 ml per minute per 1.73 m2 (net reclassification index, 19.4% [P<0.001]) and correctly reclassified 16.9% of those with an estimated GFR of 45 to 59 ml per minute per 1.73 m2 as having a GFR of 60 ml or higher per minute per 1.73 m2.
Other studies have established the importance of cystatin C levels(66, 67) and the factors influencing cystatin C levels on renal function measurement (68), including an implication that cystatin C, an alternative measure of kidney function, was a stronger predictor of the risk of cardiovascular events and death than either creatinine or the estimated GFR (69). This includes the Dallas Heart Study (30) finding that cystatin C was independently associated with a specific cardiac phenotype of concentric hypertrophy, including increased LV mass, concentricity, and wall thickness, but it was not associated with LV systolic function or volume. This association was particularly robust in hypertensives and blacks. The Cystatin C concentrations within stages of CKD are shown in Table 5 (70).
Table 5
| |
|
|
Cystatin C level |
| Stage a |
Description |
GFR range a (ml/min/1.73 m2) |
Native kidney disease b |
Transplant recipient c |
| 1 |
Normal or increased GFR |
90 |
0.80 |
0.87 |
| 2 |
Mildly decreased GFR |
60 to 89 |
0.80 to 1.09 |
0.87 to 1.23 |
| 3 |
Moderately decreased GFR |
30 to 59 |
1.10 to 1.86 |
1.24 to 2.24 |
| 4 |
Severely decreased GFR |
15 to 29 |
1.87 to 3.17 |
2.25 to 4.10 |
| 5 |
Kidney Failure |
<15 |
>3.17 |
>4.10 |
a GFR estimates and CKD stage will be inaccurate if there is a calibration difference with the Dade-Behring BN II Nephelometer assay used in this study.
b Using the prediction equation: GFR=66.8 (cystatin C)-1.30.
c Using the prediction equation: GFR=76.6 (cystatin C)-1.16.
Copeptin, a novel marker
Urinary albumin excretion is a powerful predictor of progressive cardiovascular and renal disease. Copeptin is the inactive C-terminal fragment of the vasopressin precursor. It is a reliable marker of vasopressin secretion serves as a useful substitute for circulating vasopressin concentration. This allows for the indirect measurement of vasopressin in epidemiological studies. Moreover, it has been shown that copeptin is a candidate biomarker for pneumonia 32), a predictor of outcome in heart failure, and is a powerful predictor of renal disease associated with albumin excretion (71). Figure 8 shows the association between copeptin and 24-hour urinary volume, 24-h urinary osmolality and osmolality (71).
Figure 8
Association between quintiles of copeptin and median 24-h UAE (upper panel) and prevalence of microalbuminuria (lower panel) for males and females. Differences between the quintiles were tested by Kruskal–Wallis test. UAE, urinary albumin excretion.
Table 6 shows the association between copeptin concentration and urinary albumin excretion (UAE) in a log-log plot (71).
| Model |
Corrected for |
β |
95% CI for β |
P |
| Males |
|
|
|
|
| 1 |
− (Crude) |
0.25 |
0.20–0.30 |
<0.001 |
| 2 |
As 1+age |
0.21 |
0.16–0.26 |
<0.001 |
| 3 |
As 2+MAP, BMI, smoking, glucose, cholesterol, CRP, and eGFR |
0.10 |
0.05–0.16 |
<0.001 |
| 4 |
As 3+diuretics and ACEi/ARB. |
0.09 |
0.04–0.15 |
0.001 |
| |
|
|
|
|
| Females |
| 1 |
− (Crude) |
0.19 |
0.15–0.23 |
<0.001 |
| 2 |
As 1+age |
0.17 |
0.14–0.22 |
<0.001 |
| 3 |
As 2+MAP, BMI, smoking, glucose, cholesterol, CRP, and eGFR |
0.16 |
0.11–0.21 |
<0.001 |
| 4 |
As 3+diuretics and ACEi/ARB. |
0.17 |
0.12–0.21 |
<0.001 |
ACEi, angiotensin-converting enzyme inhibitor; ARB, angiotensin-II-receptor blocker; BMI, body mass index; CHD, coronary heart disease; CI, confidence interval; CRP, C-reactive protein; eGFR, estimated glomerular filtration rate; MAP, mean arterial pressure.
Log copeptin concentration was entered in the regression analyses as independent and log UAE as the dependent variable. Copeptin was associated with UAE in all age groups, but this association is the strongest when subjects are older. Twenty-four-hour urinary volume and 24-h urinary osmolarity were significantly different, with 24-h urinary volume being higher and 24-h urinary osmolarity being lower in the oldest age group when compared with the youngest age group. In both males and females, high copeptin concentration (a surrogate for vasopressin) is associated with low 24-h urinary volume and high 24-h urinary osmolarity. However, urinary osmolarity was independently associated with UAE, but it was weaker than that between copeptin and UAE. This might indicate that induction of specific glomerular hyperfiltration or decreased tubular albumin reabsorption are associated with this relationship. In addition, subjects with higher levels of copeptin had lower renal function. These investigators concluded that copeptin (a reliable substitute for vasopressin) is associated with UAE and microalbuminuria, consistent with the hypothesis that vasopressin induces UAE (72). Other studies indicated that copeptin levels are increased in patients with pulmonary artery hypertension (73), and
higher serum copeptin levels, a surrogate for arginine vasopressin (AVP) release, are associated not only with systolic and diastolic blood pressure but also with several components of metabolic syndrome (74) including obesity, elevated concentration of triglycerides, albuminuria, and serum uric acid level.
Natriuretic peptides in the evaluation of heart failure
The brain type natriuretic peptide (BNP) and the N-terminal pro B-type natriuretic peptide (NT proBNP), but not yet the atrial natriuretic peptide have gained prominence in the evaluation of patients with CHF, which may be with or without preserved ejection fraction . Richards et al. (75) make the following points.
- Threshold values of B-type natriuretic peptide (BNP) and N-terminal prohormone B-type natriuretic peptide (NT-proBNP) validated for diagnosis of undifferentiated acutely decompensated heart failure (ADHF) remain useful in patients with heart failure with preserved ejection fraction (HFPEF), with minor loss of diagnostic performance.
- BNP and NT-proBNP measured on admission with ADHF are powerfully predictive of in-hospital mortality in both HFPEF and heart failure with reduced EF (HFREF), with similar or greater risk in HFPEF as in HFREF associated with any given level of either peptide.
- In stable treated heart failure, plasma natriuretic peptide concentrations often fall below cut-point values used for the diagnosis of ADHF in the emergency department; in HFPEF, levels average approximately half those in HFREF.
- BNP and NT-proBNP are powerful independent prognostic markers in both chronic HFREF and chronic HFPEF, and the risk of important clinical adverse outcomes for a given peptide level is similar regardless of left ventricular ejection fraction.
- Serial measurement of BNP or NT-proBNP to monitor status and guide treatment in chronic heart failure may be more applicable in HFREF than in HFPEF.
In addition, they point out the following:
BNP and NT-proBNP fall below ADHF thresholds in stable HFREF in approximately 50% and 20% of cases, respectively. Levels in stable HFPEF are even lower, approximately half those in HFREF.
Whereas BNPs have 90% sensitivity for asymptomatic LVEF of less than 40% in the community (a precursor state for HFREF), they offer no clear guide to the presence of early community based HFPEF.
Guidelines recommend BNP and NT-proBNP as adjuncts to the diagnosis of acute and chronic HF and for risk stratification. Refinements for application to HFPEF are needed.
The prognostic power of NPs is similar in HFREF and HFPEF. Defined levels of BNP and NT-proBNP correlate with similar short-term and long-term risks of important clinical adverse outcomes in both HFREF and HFPEF.
They provide a diagnostic algorithm for suspected heart failure (75)(Figure 9).
Figure 9
Diagnostic algorithm for suspected heart failure presenting either acutely or nonacutely
Diagnostic algorithm for suspected heart failure presenting either acutely or nonacutely. a In the acute setting, mid-regional pro–atrial natriuretic peptide may also be used (cutoff point 120 pmol/L; ie, <120 pmol/L 5 heart failure unlikely). b Other causes of elevated natriuretic peptide levels in the acute setting are an acute coronary syndrome, atrial or ventricular arrhythmias, pulmonary embolism, and severe chronic obstructive pulmonary disease with elevated right heart pressures, renal failure, and sepsis. Other causes of an elevated natriuretic level in the nonacute setting are old age (>75 years), atrial arrhythmias, left ventricular hypertrophy, chronic obstructive pulmonary disease, and chronic kidney disease. c Exclusion cutoff points for natriuretic peptides are chosen to minimize the false-negative rate while reducing unnecessary referrals for echocardiography. Treatment may reduce natriuretic peptide concentration, and natriuretic peptide concentrations may not be markedly elevated in patients with heart failure with preserved ejection fraction.
Patients with acute pulmonary symptoms and with acute myocardial infarct present with dyspnea to the Emergency Department. The evaluation is made particularly difficult in a patient for whom there is no prior history. Maisel et al. (76) presented the utility of the midregion proadrenomedullin (MR-proADM) in all patients presenting with acute shortness of breath. They found that MR-proADM was superior to BNP or troponin for predicting 90-day all-cause mortality in patients presenting with acute dyspnea (c index = 0.755, p < 0.0001). Furthermore, MR-proADM added significantly to all clinical variables (all adjusted hazard ratios: HR=3.28), and it was also superior to all other biomarkers.
There is a large body of recent work that has enlarged our view of hypertension, kidney disease, cardiovascular disease, including heart failure with (HFpEF) or without preserved ejection fraction. I shall here refer to my review in Leaders in Pharmaceutical Innovation (78). The piece contains a study that I published (79) with collaborators in Brooklyn, Bridgeport and Philadelphia that is no longer available from the publisher.
The natriuretic peptides, B-type natriuretic peptide (BNP) and NT-proBNP that have emerged as tools for diagnosing congestive heart failure (CHF) are affected by age and renal insufficiency (RI). NTproBNP is used in rejecting CHF and as a marker of risk for patients with acute coronary syndromes. This observational study was undertaken to evaluate the reference value for interpreting NT-proBNP concentrations. The hypothesis is that increasing concentrations of NT-proBNP are associated with the effects of multiple co-morbidities, not merely CHF,
resulting in altered volume status or myocardial filling pressures.
NT-proBNP was measured in a population with normal trans-thoracic echocardiograms
(TTE) and free of anemia or renal impairment. Exclusion conditions were the following
co-morbidities:
- anemia as defined by WHO,
- atrial fibrillation (AF),
- elevated troponin T exceeding 0.070 mg/dl,
- systolic or diastolic blood pressure exceeding 140 and 90 respectively,
- ejection fraction less than 45%,
- left ventricular hypertrophy (LVH),
- left ventricular wall relaxation impairment, and
- renal insufficiency (RI) defined by creatinine clearance < 60ml/min using
the MDRD formula .
Study participants were seen in acute care for symptoms of shortness of breath suspicious for CHF requiring evaluation with cardiac NTproBNP assay. The median NT-proBNP for patients under 50 years is 60.5 pg/ml with an upper limit of 462 pg/ml, and for patients over 50 years the median was 272.8 pg/ml with an upper limit of 998.2 pg/ml.
We suggested that NT-proBNP levels can be more accurately interpreted only after removal of the major co-morbidities that affect an increase in this peptide in serum. The PRIDE study guidelines (http://www.pridestudy.org/) should be applied until presence or absence of comorbidities is diagnosed. With no comorbidities, the reference range for normal over 50 years of age remains steady at ~1000 pg/ml. The effect shown in previous papers likely is due to increasing concurrent comorbidity with age.
We observed the following changes with respect to NTproBNP and age:
(i) Sharp increase in NT-proBNP at over age 50
(ii) Increase in NT-proBNP at 7% per decade over 50
(iii) Decrease in eGFR at 4% per decade over 50
(iv) Slope of NT-proBNP increase with age is related to proportion of patients with eGFR less than 90
(v) NT-proBNP increase can be delayed or accelerated based on disease comorbidities
The mean and 95% CI of NTproBNP (CHF removed) by the National Kidney Foundation staging for eGFR interval (eGFR scale: 0, > 120; 1, 90 to 119;2, 60 to 89; 3, 40 to 59; 4, 15 to 39; 5, under 15 ml/min). We created a new variable to minimize the effects of age and eGFR variability by correcting these large effects in the whole sample population.
Adjustment of the NT-proBNP for both eGFR and for age over 50 differences. We have carried out a normalization to adjust for both eGFR and for age over 50:
(i) Take Log of NT-proBNP and multiply by 1000
(ii) Divide the result by eGFR (using MDRD9 or Cockroft Gault10)
(iii) Compare results for age under 50, 50-70, and over 70 years
(iv) Adjust to age under 50 years by multiplying by 0.66 and 0.56.
Figure 10
NKF staging by GFRe interval and NT-proBNP (CHF removed).
The equation does not require weight because the results are reported normalized
to 1.73 m2 body surface area, which is an accepted average adult surface area.
This is illustrated in Figure 11.
Figure 11
Plot of 1000*log (NT-proBNP)/GFR vs age at eGFR over 90 and 60 ml/min
Figure 12 compares the reference ranges for NTproBNP before and after adjustment.
- before adjustment; b) after adjustment. c) the scatterplot for 1000xlog(NT proBNP) versus 1000xlog(NT-proBNP/eGFR). Superimposed scatterplot and regression line with centroid and
confidence interval for 1000*log(NT-proBNP)/eGFR vs age (anemia removed)
at eGFR over 40 and 90 ml/min. (Black: eGFR > 90, Blue: eGFR > 40)
More recent work is enlightening. Hijazi et al. (80) studied the incremental value of measuring N-terminal pro–B-type natriuretic peptide (NT-proBNP) levels in addition to established risk factors (including the CHA2DS2VASc [heart failure, hypertension, age 75 years and older, diabetes, and previous stroke or transient ischemic attack, vascular disease, age 65 to 74 years, and sex category) for the prediction of cardiovascular and bleeding events. They concluded that NT-proBNP levels are often elevated in atrial fibrillation (AF) and it is independently associated with an increased risk for stroke and mortality. NT-proBNP improves risk stratification beyond the CHA2DS2VASc score and might be a novel tool for improved stroke prediction in AF. The
efficacy of apixaban compared with warfarin was independent of the NT-proBNP level. Moreover, natriuretic peptides are regulatory hormones associated with cardiac remodeling, namely, left ventricular hypertrophy and systolic/diastolic dysfunction. Another study reported that the risk of death of patients with plasma NT-proBNP 133 pg/mL (third tertile of the distribution) was 3.3 times that of patients with values 50.8 pg/mL (first tertile; hazard ratio: 3.30 [95% CI: 0.90 to 12.29]). This predictive value was independent of, and superior to, that of 2 ECG indexes of left ventricular hypertrophy, the Sokolov-Lyon index and the amplitude of the R wave in lead aVL and it persisted in patients without ECG left ventricular hypertrophy (81).
Many patients presenting with acute dyspnea (including those with ADHF) have multiple coexisting medical disorders that may complicate their diagnosis and management. These patients presenting with acute dyspnea may have longer hospital length of stay and are at high risk for repeat hospitalization or death. In this presentation testing for brain natriuretic peptide (BNP) or NT-proBNP has been shown to be valuable for an accurate and efficient diagnosis and prognostication of HF (82).
The biological activity of BNP, the product of an intracellular peptide (proBNP108) that is converted to NT-proBNP, includes stimulation of natriuresis and vasorelaxation; inhibition of renin, aldosterone, and sympathetic nervous activity; inhibition of fibrosis; and improvement in myocardial relaxation.
Figure 13
Biology of the natriuretic peptide system. BNP indicates brain natriuretic peptide; NT-proBNP, amino-terminal pro-B-type natriuretic peptide; and DPP-IV, dipeptidyl peptidase-4.
The authors remind us that approximately 20% of patients with acute dyspnea have BNP or NT-proBNP levels that are above the cutoff point to exclude HF but too low to definitively identify it (82). Knowledge of the differential diagnosis of non-HF elevation of NP, as well as interpretation of the BNP or NT-proBNP value in the context of a clinical assessment is essential. Across all stages of HF, elevated BNP or NT-proBNP concentrations are at least comparable prognostic predictors of mortality and cardiovascular events relative to traditional predictors of outcome in this setting, with increasing NP concentrations predicting worse prognosis in a linear fashion. This prognostic value may be used to stratify patients at the highest risk of adverse outcomes (see Figure 2 In this page). Age-adjusted Kaplan-Meier survival curve of mortality at 1 year associated with an elevated amino-terminal pro-B-type natriuretic peptide (NT-proBNP) concentration at emergency department presentation with dyspnea in those with acutely decompensated heart failure. Reproduced from Januzzi et al22. (82)
The importance of determining diastolic and systolic function and for measurement of pulmonary artery pressure by echocardiography is clear, as NT-proBNP levels may be increased with increase in pulmonary pressure as well as conditions that increase cardiac output. Although Hijazi et al. used the Cockcroft-Gault (CG) equation to determine the glomerular filtration rate (GFR) the CG equation may find higher eGFR in older individuals (80). In addition, elevated NT-proBNP independently predicts all-cause mortality and morbidity of patients with AF. A prominent disease with elevated NT-proBNP is a respiratory system disease, such as chronic obstructive pulmonary disease, pulmonary embolism, and interstitial lung disease, in which B-type natriuretic peptide levels are elevated in response to the pressure of the right side of the heart. The authors conclude that one should keep in mind that NT-proBNP alone may be inadequate.
NT-proBNP level is used for the detection of acute CHF and as a predictor of survival. However, a number of factors, including renal function, may affect the NT-proBNP levels. This study aims to provide a more precise way of interpreting NT-proBNP levels based on GFR, independent of age. This study includes 247 pts in whom CHF and known confounders of elevated NT-proBNP were excluded, to show the relationship of GFR in association with age. The effect of eGFR on NT-proBNP level was adjusted by dividing 1000 x log(NT-proBNP) by eGFR then further adjusting for age in order to determine a normalized NT-proBNP value. The normalized NT-proBNP levels were affected by eGFR independent of the age of the patient. A normalizing function based on eGFR eliminates the need for an age-based reference ranges for NT-proBNP (79).
The routine use of natiuretic peptides in severely dyspneic patients has recently been called into question. We hypothesized that the diagnostic utility of Amino Terminal pro Brain Natiuretic Peptide (NT-proBNP) is diminished in a complex elderly population (83)
We studied 502 consecutive patients in whom NT-proBNP values were obtained to evaluate severe dyspnea in the emergency department (84). The diagnostic utility of NT-proBNP for the diagnosis of congestive heart failure (CHF) was assessed utilizing several published guidelines, as well as the manufacturer’s suggested age dependent cut-off points. The area under the receiver operator curve (AUC) for NT-proBNP was 0.70. Using age-related cut points, the diagnostic accuracy of NT-proBNP for the diagnosis of CHF was below prior reports (70% vs. 83%). Age and estimated creatinine clearance correlated directly with NT-proBNP levels, while hematocrit correlated inversely. Both age > 50 years and to a lesser extent hematocrit < 30% affected the diagnostic accuracy of NT-proBNP, while renal function had no effect. In multivariate analysis, a prior history of CHF was the best predictor of current CHF, odds ratio (OR) = 45; CI: 23-88.
The diagnostic accuracy of NT-proBNP for the evaluation of CHF appears less robust in an elderly population with a high prevalence of prior CHF. Age and hematocrit levels, may adversely affect the diagnostic accuracy off NT-proBNP (85).
Obesity and hypertension.
Obesity is associated with an increased risk of hypertension. In the past 5 years there have been dramatic advances into the genetic and neurobiological mechanisms of obesity with the discovery of leptin and novel neuropeptide pathways regulating appetite and metabolism. In this brief review, we argue that these mounting advances into the neurobiology of obesity have and will continue to provide new insights into the regulation of arterial pressure in obesity. We focus our comments on the sympathetic, vascular, and renal mechanisms of leptin and melanocortin receptor agonists and on the regulation of arterial pressure in rodent models of genetic obesity. Three concepts are proposed (86).
First, the effect of obesity on blood pressure may depend critically on the genetic-neurobiological mechanisms underlying the obesity. Second, obesity is not consistently associated with increased blood pressure, at least in rodent models. Third, the blood pressure response to obesity may be critically influenced by modifying alleles in the genetic background.
Leptin plays an important role in regulation of body weight through regulation of food intake and sympathetically mediated thermogenesis. The hypothalamic melanocortin system, via activation of the melanocortin-4 receptor (MC4-R), decreases appetite and weight, but its effects on sympathetic nerve activity (SNA) are unknown. In addition, it is not known whether sympathoactivation to leptin is mediated by the melanocortin system.
The following study (87) tested the interactions between these systems in regulation of brown adipose tissue (BAT) and renal and lumbar SNA in anesthetized Sprague-Dawley rats. Intracerebroventricular administration of the MC4-R agonist MT-II (200 to 600 pmol) produced a dose-dependent sympathoexcitation affecting BAT and renal and lumbar beds. This response was completely blocked by the MC4-R antagonist SHU9119 (30 pmol ICV). Administration of leptin (1000 m g/kg IV) slowly increased BAT SNA (baseline, 4166 spikes/s; 6 hours, 196628 spikes/s; P50.001) and renal SNA (baseline, 116616 spikes/s; 6 hours, 169626 spikes/s; P50.014).
Intracerebroventricular administration of SHU9119 did not inhibit leptin-induced BAT sympathoexcitation (baseline, 3567 spikes/s; 6 hours, 158634 spikes/s; P50.71 versus leptin alone). However, renal sympathoexcitation to leptin was completely blocked by SHU9119 (baseline, 142617 spikes/s; 6 hours, 146625 spikes/s; P50.007 versus leptin alone). The study (87) demonstrates that the hypothalamic melanocortin system can act to increase sympathetic nerve traffic to thermogenic BAT and other tissues. Our data also suggest that leptin increases renal SNA through activation of hypothalamic melanocortin receptors. In contrast, sympathoactivation to thermogenic BAT by leptin appears to be independent of the melanocortin system.
Troponins
The introduction of the first generation troponins T and I was an important event leading to the declining use of creatine kinase isoenzyme MB because of the short half-life in the circulation of CKMB and the possibility of missing a late presenting ACS. The situation then would call for the measurement of lactate dehydrogenase isoenzyme 1 (H-type), which had a decline in use. The troponins T and I are proteins associated with the muscle contractile element with high specificity for the cardiomyocyte apparatus, which increased rapidly after ACS and which had estimated diagnostic cutoffs of 0.08 mg/dl and 1 mg/dl respectively. The choice of marker was largely dependent of the instrument platform. These biomarkers went through several generations of improvement to improve the diagnostic sensitivity to a cutoff at 2 SD of the lower limit of detection, magnifying confusion in interpretation that had always existed. These cardiospecific markers are elevated in patients with hypertension and specifically, long term CKD. This was clarified by introducing the terms Type 1 and Type 2 myocardial infarct, designating the classic ACS due to plaque rupture as Type 1. However, the type 2 class might well be non-homogeneous. In any case, these are the best we have in detecting myocardial ischemic damage with biomarker release.
Discussion
This discussion has covered a large body of research involving hypertension, the kidney, and cardiovascular humoral mechanisms of control with a broad brush. The work that has been done is far more than is cited. There are several biomarkers that we have considered. They are not only laboratory based measurements. They are: PWV, cystatin C, eGFR, copeptin, BNP or NT-BNP, Midregional prohormone adrenomedullin (MR-ADM), urinary albumin excretion, and the aldosterone/renin ratio.
The preceding discussion reminds us of the story of the blind men palpating an elephant, set in a poem by John Godfrey Saxe. These blind men were asked to tell of their experiences palpating different parts of an elephant, without seeing the entire animal Figure 1. Each of the blind men was able to palpate one part of the elephant, and thus was able to describe it in terms that were “partly in the right.” However, because none of them was able to encompass the entire elephant in their hands, they were also “in the wrong,” in that they failed to identify the whole elephant (88).
The blind men and the elephant. Poem by John Godfrey Saxe (Cartoon originally copyrighted by the authors (88); G. Renee Guzlas, artist). http://www.nature.com/ki/journal/v62/n5/thumbs/4493262f1bth.gif
These authors advanced the “elephant” as the increased oxidative burden in the uremic milieu of patients with chronic kidney disease. I introduce the concept in the diagnostic dilemma about what biomarkers are diagnostically informative in hypertension and ischemic CVD poses a conundrum. In reviewing the full gamut of biomarkers, we have a replay of the Lone Ranger and the silver bullet. The problem is that there is no “silver” bullet. We are accustomed to rely on clinical observations that are themselves weak covariates in actual experience. The studies that have been done to validate the effectiveness of key biomarkers are well designed and show relevance in the populations studied. However, they are insufficient by themselves in the emergent care population.
Impediments to a solution to the problem
Tests are ordered by physicians based on the findings in a clinical history and physical examination. Test that are ordered are reimbursed by insurance carriers, Medicare and Medicaid based on a provisional diagnosis. The provisional diagnosis generates an ICD10 code, which has been most recently revised with a weighted input from the insurers that is not in favor of considered clinical evidence. Moreover, the provider of care is graded based on the number of patients seen and the tests performed on a daily basis over any period. Given this situation, and in addition, the requirement to interact with an outmoded information system that is more helpful to the insurer and less helpful to the provider, it is not surprising that there is a large burnout of the nursing and physician practitioner workforce. If the diagnosis is inconclusive at the time of patient examination, then the work is not reimbursable based on ICD10 coding requirements that are disease specific. This problem breaks down into a workload and a reimbursement inconsistency, neither of which makes sense in terms of the original studies on Diagnosis Related Groups (89) at Yale by Robert Fetter’s group. The problem is made worse by the design and selection of healthcare information systems.
Many have pointed out the flaws in current EHR design that impede the optimum use of data and hinder workflow. Researchers have suggested that EHRs can be part of a learning health system to better capture and use data to improve clinical practice, create new evidence, educate, and support research efforts. The health care system suffers from both inefficient and ineffective use of data. Data are suboptimally displayed to users, undernetworked, underutilized, and wasted. Errors, inefficiencies, and increased costs occur on the basis of unavailable data in a system that does not coordinate the exchange of information, or adequately support its use (90). Clinicians’ schedules are stretched to the limit and yet the system in which they work exerts little effort to streamline and support carefully engineered care processes. Information for decision-making is difficult to access in the context of hurried real-time workflows(91)
The solution to the problem
The current design of the Electronic Medical Record (EMR) is a linear presentation of portions of the record by services, by diagnostic method, and by date, to cite examples. This allows perusal through a graphical user interface (GUI) that partitions the information or necessary reports in a workstation entered by keying to icons. This requires that the medical practitioner finds the history, medications, laboratory reports, cardiac imaging and EKGs, and radiology in different workspaces. The introduction of a DASHBOARD has allowed a presentation of drug reactions, allergies, primary and secondary diagnoses, and critical information about any patient the care giver needing access to the record. The advantage of this innovation is obvious. The startup problem is what information is presented and how it is displayed, which is a source of variability and a key to its success.
Gil David and Larry Bernstein have developed, in consultation with Prof. Ronald Coifman, in the Yale University Applied Mathematics Program, a software system that is the equivalent of an intelligent Electronic Health Records Dashboard (92)( that provides empirical medical reference and suggests quantitative diagnostics options.
The most commonly ordered test used for managing patients worldwide is the hemogram that often incorporates the review of a peripheral smear. While the hemogram has undergone progressive modification of the measured features over time the subsequent expansion of the panel of tests has provided a window into the cellular changes in the production, release or suppression of the formed elements from the blood-forming organ to the circulation. In the hemogram one can view data reflecting the characteristics of a broad spectrum of medical conditions.
How we frame our expectations is so important that it determines the data we collect to examine the process. In the absence of data to support an assumed benefit, there is no proof of validity at whatever cost. This has meaning for hospital operations, for nonhospital laboratory operations, for companies in the diagnostic business, and for planning of health systems.
| In 1983, a vision for creating the EMR was introduced by Lawrence Weed, expressed by McGowan and Winstead-Fry (93) |
The data presented has to be comprehended in context with vital signs, key symptoms, and an accurate medical history. Consequently, the limits of memory and cognition are tested in medical practice on a daily basis. We deal with problems in the interpretation of data presented to the physician, and how through better design of the software that presents this data the situation could be improved. The computer architecture that the physician uses to view the results is more often than not presented as the designer would prefer, and not as the end-user would like.
Eugene Rypka contributed greatly to clarifying the extraction of features (94) in a series of articles, which set the groundwork for the methods used today in clinical microbiology. The method he describes is termed S-clustering, and will have a significant bearing on how we can view hematology data. He describes S-clustering as extracting features from endogenous data that amplify or maximize structural information to create distinctive classes. The method classifies by taking the number of features with sufficient variety to map into a theoretic standard. The mapping is done by a truth table, and each variable is scaled to assign values for each: message choice. The number of messages and the number of choices forms an N-by N table. He points out that the message choice in an antibody titer would be converted from 0 + ++ +++ to 0 1 2 3.
Bernstein and colleagues had a series of studies using Kullback-Liebler Distance (effective information) for clustering to examine the latent structure of the elements commonly used for diagnosis of myocardial infarction (95-97)(CK-MB, LD and the isoenzyme-1 of LD), protein-energy malnutrition (serum albumin, serum transthyretin, condition associated with protein malnutrition (see Jeejeebhoy and subjective global assessment), prolonged period with no oral intake), prediction of respiratory distress syndrome of the newborn (RDS), and prediction of lymph nodal involvement of prostate cancer, among other studies. The exploration of syndromic classification has made a substantial contribution to the diagnostic literature, but has only been made useful through publication on the web of calculators and nomograms (such as Epocrates and Medcalc) accessible to physicians through an iPhone. These are not an integral part of the EMR, and the applications require an anticipation of the need for such processing.
Gil David et al. (90, 92) introduced an AUTOMATED processing of the data available to the ordering physician and can anticipate an enormous impact in diagnosis and treatment of perhaps half of the top 20 most common causes of hospital admission that carry a high cost and morbidity. For example: anemias (iron deficiency, vitamin B12 and folate deficiency, and hemolytic anemia or myelodysplastic syndrome); pneumonia; systemic inflammatory response syndrome (SIRS) with or without bacteremia; multiple organ failure and hemodynamic shock; electrolyte/acid base balance disorders; acute and chronic liver disease; acute and chronic renal disease; diabetes mellitus; protein-energy malnutrition; acute respiratory distress of the newborn; acute coronary syndrome; congestive heart failure; disordered bone mineral metabolism; hemostatic disorders; leukemia and lymphoma; malabsorption syndromes; and cancer(s)[breast, prostate, colorectal, pancreas, stomach, liver, esophagus, thyroid, and parathyroid]. The same approach has also been applied to the problem of hospital malnutrition, but it has not been sufficiently applied to hypertension, cardiovascular diseases, acute coronary syndrome, chronic renal failure.
We have developed (David G, Bernstein L, and Coifman) (92) a software system that is the equivalent of an intelligent Electronic Health Records Dashboard that provides empirical medical reference and suggests quantitative diagnostics options. The primary purpose is to gather medical information, generate metrics, analyze them in realtime and provide a differential diagnosis, meeting the highest standard of accuracy. The system builds its unique characterization and provides a list of other patients that share this unique profile, therefore utilizing the vast aggregated knowledge (diagnosis, analysis, treatment, etc.) of the medical community. The main mathematical breakthroughs are provided by accurate patient profiling and inference methodologies in which anomalous subprofiles are extracted and compared to potentially relevant cases. As the model grows and its knowledge database is extended, the diagnostic and the prognostic become more accurate and precise. We anticipate that the effect of implementing this diagnostic amplifier would result in higher physician productivity at a time of great human resource limitations, safer prescribing practices, rapid identification of unusual patients, better assignment of patients to observation, inpatient beds, intensive care, or referral to clinic, shortened length of patients ICU and bed days.
The main benefit is a real time assessment as well as diagnostic options based on comparable cases, flags for risk and potential problems as illustrated in the following case acquired on 04/21/10. The patient was diagnosed by our system with severe SIRS at a grade of 0.61 .
Method for data organization and classification via characterization metrics.
The database is organized to enable linking a given profile to known profiles. This is achieved by associating a patient to a peer group of patients having an overall similar profile, where the similar profile is obtained through a randomized search for an appropriate weighting of variables. Given the selection of a patients’ peer group, we build a metric that measures the dissimilarity of the patient from its group. This is achieved through a local iterated statistical analysis in the peer group.
This characteristic metric is used to locate other patients with similar unique profiles, for each of whom we repeat the procedure described above. This leads to a network of patients with similar risk condition. Then, the classification of the patient is inferred from the medical known condition of some of the patients in the linked network.
How do we organize the data and linkages provided in the first place?
Predictors: PWV, cystatin C, creatinine, urea, eGFR, copeptin, BNP or NT-BNP, TnI or TnT, Midregional prohormone adrenomedullin (MR-ADM), urinary albumin excretion, and the aldosterone/renin ratio, homocysteine, transthyretin, glucose, albumin, chol/LDL, LD, Na+, K+, Cl–, HCO3–, pH.
Conditions: AMI, CRF, ARF, hypertension, HFpEF, HFcEF, ADHF, obesity, PHT, RVHF, pulmonary edema, PEM
Other variables: sex (M,F), age, BMI. …
Conditioning data: take log transform for large ascending values, OR take deciles of variables, if necessary. This could apply to NT-proBNP, BNP, TnI, TnT, CK and LD.
Arrange predictor variables in columns and patient-sequence in rows. This is a bidimentional table. The problem is to assign diagnoses to each patient-in sequence. There can be more than one diagnosis.
In reality the patient-sequence or identifier is not relevant. Only the condition assignment is. The condition assignments are made in a column adjacent to the patient, and they fall into rows.
The construct appears to be a 2×2, but it is actually an n-dimensional matrix. Each patient position has one or more diagnoses.
Multivariate statistical analysis is used to extend this analysis to two or more predictors. In this case a multiple linear regression or a linear discriminant function would be used to predict a dependent variable from two or more independent variables. If there is linear association dependency of the variables is assumed and the test of hypotheses requires that the variances of the predictors are normally distributed. A method using a log-linear model circumvents the problem of the distributional dependency in a method called ordinal regression. There is also a relationship of analysis of variance, a method of examining differences between the means of two or more groups. Then there is linear discriminant analysis, a method by which we examine the linear separation between groups rather than the linear association between groups. Finally, the neural network is a nonlinear, nonparametric model for classifying data with several variables into distinct classes. In this case we might imagine a curved line drawn around the groups to divide the classes. The focus of this discussion will be the use of linear regression and explore other methods for classification purposes (98).
The real issue is how a combination of variables falls into a table with meaningful information. We are concerned with accurate assignment into uniquely variable groups by information in test relationships. One determines the effectiveness of each variable by its contribution to information gain in the system. The reference or null set is the class having no information. Uncertainty in assigning to a classification is only relieved by providing sufficient information. One determines the effectiveness of each variable by its contribution to information gain in the system. The possibility for realizing a good model for approximating the effects of factors supported by data used for inference owes much to the discovery of Kullback-Liebler distance or “information” (99), and Akaike (100) found a simple relationship between K-L information and Fisher’s maximized log-likelihood function. A solid foundation in this work was elaborated by Eugene Rypka (101). Of course, this was made far less complicated by the genetic complement that defines its function, which made more accessible the study of biochemical pathways. In addition, the genetic relationships in plant genetics were accessible to Ronald Fisher for the application of the linear discriminant function. In the last 60 years the application of entropy comparable to the entropy of physics, information, noise, and signal processing, has been fully developed by Shannon, Kullback, and others, and has been integrated with modern statistics, as a result of the seminal work of Akaike, Leo Goodman, Magidson and Vermunt, and unrelated work by Coifman. Dr. Magidson writes about Latent Class Model evolution:
The recent increase in interest in latent class models is due to the development of extended algorithms which allow today’s computers to perform LC analyses on data containing more than just a few variables, and the recent realization that the use of such models can yield powerful improvements over traditional approaches to segmentation, as well as to cluster, factor, regression and other kinds of analysis.
Perhaps the application to medical diagnostics had been slowed by limitations of data capture and computer architecture as well as lack of clarity in definition of what are the most distinguishing features needed for diagnostic clarification. Bernstein and colleagues (102-104) had a series of studies using Kullback-Liebler Distance (effective information) for clustering to examine the latent structure of the elements commonly used for diagnosis of myocardial infarction (CK-MB, LD and the isoenzyme-1 of LD), protein-energy malnutrition (serum albumin, serum transthyretin, condition associated with protein malnutrition (see Jeejeebhoy and subjective global assessment), prolonged period with no oral intake), prediction of respiratory distress syndrome of the newborn (RDS), and prediction of lymph nodal involvement of prostate cancer, among other studies. The exploration of syndromic classification has made a substantial contribution to the diagnostic literature, but has only been made useful through publication on the web of calculators and nomograms (such as Epocrates and Medcalc) accessible to physicians through an iPhone. These are not an integral part of the EMR, and the applications require an anticipation of the need for such processing.
Gil David et al. introduced an AUTOMATED processing of the data (104) available to the ordering physician and can anticipate an enormous impact in diagnosis and treatment of perhaps half of the top 20 most common causes of hospital admission that carry a high cost and morbidity. For example: anemias (iron deficiency, vitamin B12 and folate deficiency, and hemolytic anemia or myelodysplastic syndrome); pneumonia; systemic inflammatory response syndrome (SIRS) with or without bacteremia; multiple organ failure and hemodynamic shock; electrolyte/acid base balance disorders; acute and chronic liver disease; acute and chronic renal disease; diabetes mellitus; protein-energy malnutrition; acute respiratory distress of the newborn; acute coronary syndrome; congestive heart failure; disordered bone mineral metabolism; hemostatic disorders; leukemia and lymphoma; malabsorption syndromes; and cancer(s)[breast, prostate, colorectal, pancreas, stomach, liver, esophagus, thyroid, and parathyroid].
Our database organized to enable linking a given profile to known profiles(102-104). This is achieved by associating a patient to a peer group of patients having an overall similar profile, where the similar profile is obtained through a randomized search for an appropriate weighting of variables. Given the selection of a patients’ peer group, we build a metric that measures the dissimilarity of the patient from its group. This is achieved through a local iterated statistical analysis in the peer group.
We then use this characteristic metric to locate other patients with similar unique profiles, for each of whom we repeat the procedure described above. This leads to a network of patients with similar risk condition. Then, the classification of the patient is inferred from the medical known condition of some of the patients in the linked network. Given a set of points (the database) and a newly arrived sample (point), we characterize the behavior of the newly arrived sample, according to the database. Then, we detect other points in the database that match this unique characterization. This collection of detected points defines the characteristic neighborhood of the newly arrived sample. We use the characteristic neighborhood in order to classify the newly arrived sample. This process of differential diagnosis is repeated for every newly arrived point. The medical colossus we have today has become a system out of control and beset by the elephant in the room – an uncharted complexity.
References
- http://www.geronet.ucla.edu/research/researchers/385
- Chronic Kidney Disease and Hypertension: A Destructive Combination. Buffet L, Ricchetti C. http://www.medscape.com/viewarticle/766696
- Frank O. Zur Dynamik des Herzmuskels. J Biol. 1895;32:370-447. Translation from German: Chapman CP, Wasserman EB. On the dynamics of cardiac muscle. Am Heart J. 1959; 58:282-317.
- Starling EH. Linacre Lecture on the Law of the Heart. London, England: Longmans; 1918.
- ftp://www.softchalk.com/Step1softchalksyllabus/starlings%20Law%20.pdf
- https://youtu.be/5SO58NndlPI
- Lakatta EG. Starling’s Law of the Heart Is Explained by an Intimate Interaction of Muscle Length and Myofilament Calcium Activation. J Am Coll Cardiol 1987; 10:1157-64.
- Lakatta EG, DiFrancesco D. J Mol Cell Cardiol. 2009 Aug; 47(2):157-70.
http://dx.doi.org:/10.1016/j.yjmcc.2009.03.022. What keeps us ticking: a funny current, a calcium clock, or both?
- Lakatta EG, Maltsev VA, Vinogradova TM. A coupled SYSTEM of intracellular Ca2+ clocks and surface membrane voltage clocks controls the time keeping mechanism of the heart’s pacemaker. Circ Res.2010 Mar 5; 106(4):659-73. http://dx.doi.org:/10.1161/CIRCRESAHA.109.206078.
- NHLBI, NIH, Health. http://www.nhlbi.nih.gov/health/health-topics/topics/hbp/causes
- Clark CE and Powell RJ. The differential blood pressure sign in general practice: prevalence and prognostic value. Family Practice 2002; 19:439–441.
- Madhur MS. Medscape. http://emedicine.medscape.com/article/241381-treatment
- Roger VL, Go AS, Lloyd-Jones DM, et al. Heart disease and stroke statistics–2012 update: a report from the American Heart Association. Circulation. 2012 Jan 3. 125(1):e2-e220. [Medline].
- Institute for Clinical Systems Improvement (ICSI). Hypertension diagnosis and treatment. Bloomington, Minn: Institute for Clinical Systems Improvement (ICSI); 2010.
- Whelton PK, Appel LJ, Sacco RL, Anderson CA, Antman EM, Campbell N, et al. Sodium, Blood Pressure, and Cardiovascular Disease: Further Evidence Supporting the American Heart Association Sodium Reduction Recommendations. Circulation. 2012 Nov 2. [Medline].
- O’Riordan M. New European Hypertension Guidelines Released: Goal Is Less Than 140 mm Hg for All. Medscape [serial online]. Available at http://www.medscape.com/viewarticle/806367. Accessed: June 24, 2013.
- Chobanian AV, Bakris GL, Black HR, Cushman WC, Green LA, Izzo JL Jr, et al. Seventh report of the Joint National Committee on Prevention, Detection, Evaluation, and Treatment of High Blood Pressure. Hypertension. 2003 Dec. 42(6):1206-52. [Medline].
- [Guideline] James PA, Oparil S, Carter BL, et al. 2014 Evidence-based guideline for the management of high blood pressure in adults: report from the panel members appointed to the Eighth Joint National Committee (JNC 8). JAMA. 2013 Dec 18. [Medline]. [Full Text].
- Laurent S, Boutouyrie P, Asmar R, et al. Aortic stiffness is an independent predictor of all-cause and cardiovascular mortality in hypertensive patients. Hypertension. 2001 May; 37(5):1236-41.
http://hyper.ahajournals.org/content/37/5/1236.long http://dx.doi.org:/10.1161/01.HYP.37.5.1236
- Shahmirzadi D, Li RX, Konofagou EE. Pulse-Wave Propagation in Straight-Geometry Vessels
for Stiffness Estimation: Theory, Simulations, Phantoms and In Vitro Findings. J Biomechanical Engineering Oct 26, 2012; 134(114502): 1-7. http://dx.doi.org:/10.1115/1.4007747
- Najjar SS, Scuteri A, Shetty V, …, Lakatta EG. Pulse wave velocity is an independent predictor of the longitudinal increase in systolic blood pressure and of incident hypertension in the Baltimore Longitudinal Study of Aging. J Am Coll Cardiol.2008 Apr 8; 51(14):1377-83. http://dx.doi.org:/10.1016/j.jacc.2007.10.065
- Lim HS and Lip GYH. Arterial stiffness: beyond pulse wave velocity and its measurement. Journal of Human Hypertension (2008) 22, 656–658; http://dx.doi.org:/10.1038/jhh.2008.4
- Payne RA, Wilkinson IB, Webb DJ. Arterial Stiffness and Hypertension – Emerging Concepts. Hypertension.2010; 55: 9-14. http://dx.doi.org:/10.1161/HYPERTENSIONAHA.107.090464
- http://www.nature.com/jhh/journal/v22/n10/images/jhh200847f1.gif
- O’Rourke M. Arterial stiffness, systolic blood pressure, and logical treatment of arterial hypertension. Hypertension. 1990 Apr; 15(4):339-47. http://www.fac.org.ar/scvc/llave/hbp/arnett/arnetti.htm
- Arnett DK1, Tyroler HA, …., Howard G, Heiss G. Hypertension and subclinical carotid artery atherosclerosis in blacks and whites. The Atherosclerosis Risk in Communities Study. ARIC Investigators. Arch Intern Med. 1996 Sep 23; 156(17):1983-9. http://archinte.jamanetwork.com/article.aspx?articleid=622453
- Cecelja M, Chowienczyk P. Role of arterial stiffness in cardiovascular disease. JRSM Cardiovascular Disease July 2012; 1(4):11 http://cvd.sagepub.com/content/1/4/11.full
- Peralta CA, Whooley MA, Ix JH, and Shlipak MG . Kidney Function and Systolic Blood Pressure New Insights from Cystatin C: Data from the Heart and Soul Study. Am J Hypertens. 2006 Sep; 19(9):939–946. http://dx.doi.org:/10.1016/j.amjhyper.2006.02.007
- Asmar R, Benetos A, Topouchian J, Laurent P, Pannier B, Brisac AM , Target R, Levy BI.
Assessment of Arterial Distensibility by Automatic Pulse Wave Velocity Measurement: Validation and Clinical Application Studies. Hypertension. 1995; 26: 485-490. http://dx.doi.org:/10.1161/01.HYP.26.3.485
- Ioannidis JPA, Tzoulaki I. Minimal and null predictive effects for the most popular blood biomarkers of cardiovascular disease. Circ Res. 2012; 110:658–662.
- Giles T. Biomarkers, Cardiovascular Disease, and Hypertension. J Clin Hypertension 2013; 15(1) http://dx.doi.org:/10.1111/jch.12014
- Bielecka-Dabrowa A, Gluba-Brzózka A, Michalska-Kasiczak M, Misztal M, Rysz J and Banach M. The Multi-Biomarker Approach for Heart Failure in Patients with Hypertension. Int. J. Mol. Sci. 2015; 16: 10715-10733; http://dx.doi.org:/10.3390/ijms160510715
- Barbaro N, Moreno H. Inflammatory biomarkers associated with arterial stiffness in resistant hypertension. Inflamm Cell Signal 2014; 1: e330. http://dx.doi.org:/10.14800/ics.330.
- Chao J, Schmaier A, Chen LM, Yang Z, Chao L. Kallistatin, a novel human tissue kallikrein inhibitor: levels in body fluids, blood cells, and tissues in health and disease. J Lab Clin Med. 1996 Jun; 127(6):612-20. http://www.ncbi.nlm.nih.gov/pubmed/8648266
- Chao J, Chao L. Functional Analysis of Human Tissue Kallikrein in Transgenic Mouse Models. Hypertension. 1996; 27: 491-494. http://dx.doi.org://10.1161/01.HYP.27.3.491
- Chao J, Bledsoe G and Chao L. Kallistatin: A Novel Biomarker for Hypertension, Organ Injury and Cancer. Austin Biomark Diagn. 2015; 2(2): 1019).
- Touyz RM , Schiffrin EL. Reactive oxygen species in vascular biology: implications in hypertension. Histochem, Cell Biol Oct 2004; 122(4):339-352. http://link.springer.com/article/10.1007/s00418-004-0696-7
- Nozik-Grayck E1, Stenmark KR. Role of reactive oxygen species in chronic hypoxia-induced pulmonary hypertension and vascular remodeling. Adv Exp Med Biol. 2007; 618:101-12.
http://www.ncbi.nlm.nih.gov/pubmed/18269191
- Paravicin TM and Touyz RM. NADPH Oxidases, Reactive Oxygen Species, and Hypertension. Diabetes Care 2008 Feb; 31(Supplement 2): S170-S180. http://dx.doi.org/10.2337/dc08-s247
- Schiffrin EL. Endothelin: role in hypertension. Biol Res. 1998; 31(3):199-208. Review.
- Schiffrin EL. Role of endothelin-1 in hypertension and vascular disease. Am J Hypertens. 2001 Jun;14(6 Pt 2):83S-89S. Review.
- Schiffrin EL. Endothelin and endothelin antagonists in hypertension. J Hypertens. 1998 Dec; 16(12 Pt 2):1891-5. Review.
- Warwick G, Thomas PS and Yates DH. Biomarkers in pulmonary hypertension.
Eur Respir J 2008; 32: 503–512 http://dx.doi.org:/10.1183/09031936.00160307
- Zhang S, Yang T, Xu X, Wang M, Zhong L, et al. Oxidative stress and nitric oxide signaling related biomarkers in patients with pulmonary hypertension: a case control study. BMC Pulm Med. 2015; 15: 50. http://dx.doi.org:/1186/s12890-015-0045-8
- Kierszniewska-Stępień D, Pietras T, Ciebiada M, Górski P, and Stępień H. Concentration of angiopoietins 1 and 2 and their receptor Tie-2 in peripheral blood in patients with chronic obstructive pulmonary disease. Postepy Dermatol Alergol. 2015 Dec; 32(6): 443–448. http://dx.doi.org:/5114/pdia.2014.44008
- Circulating Biomarkers in Pulmonary Arterial Hypertension. Al-Zamani M, Trammell AW, Safdar Z. Adv Pulm Hypertension 2015; 14(1):21-27.
- Safdar et al. Hea rt Fai lure JACC 2014; 2(4): 412– 21.
- Camozzi M, Zacchigna S, Rusnati M, Coltrini D, et al. Pentraxin 3 Inhibits Fibroblast Growth Factor 2–Dependent Activation of Smooth Muscle Cells In Vitro and Neointima Formation In Vivo. Arterioscler Thromb Vasc Biol. 2005; 25:1837-1842. http://atvb.ahajournals.org/content/25/9/1837.full.pdf
- Presta M, Camozzi M, Salvatori G, and Rusnatia M. Role of the soluble pattern recognition receptor PTX3 in vascular biology. J Cell Mol Med. 2007 Jul; 11(4): 723–738.
http://dx.doi.org:/1111/j.1582-4934.2007.00061.x
- Tamura Y, Ono T, Kuwana M, Inoue K, Takei M, Yamamoto T, Kawakami T, et al. Human pentraxin 3 (PTX3) as a novel biomarker for the diagnosis of pulmonary arterial hypertension.
PLoS One. 2012;7(9):e45834. http://dx.doi.org:/10.1371/journal.pone.0045834.
- Calvier L, Legchenko E, Grimm L, Sallmon H, Hatch A, Plouffe BD, Schroeder C, et al. Galectin-3 and aldosterone as potential tandem biomarkers in pulmonary arterial hypertension. Heart. 2016 Mar 1; 102(5):390-6. http://dx.doi.org:/10.1136/heartjnl-2015-308365
- Otto CM. Heart 2016; 102:333–334. Heartbeat: Biomarkers and pulmonary artery hypertension. http://dx.doi.org:/10.1136/heartjnl-2015-309220
- Sintek MA, Sparrow CT, Mikuls TR, Lindley KJ, Bach RG, et al. Repeat revascularisation outcomes after percutaneous coronary intervention in patients with rheumatoid arthritis. Heart. 2016 Mar 1; 102(5):363-9. http://dx.doi.org:/10.1136/heartjnl-2015-308634.
- Camici PG, Wijns W, Borgers M, De Silva R, et al. Pathophysiological Mechanisms of Chronic Reversible Left Ventricular Dysfunction due to Coronary Artery Disease (Hibernating Myocardium). Circulation. 1997; 96: 3205-3214. http://dx.doi.org:/10.1161/01.CIR.96.9.3205
- Rahimtoola SH, Dilsizian V, Kramer CM, Marwick TH, and Jean-Louis J. Vanoverschelde.
Chronic Ischemic Left Ventricular Dysfunction: From Pathophysiology to Imaging and its Integration into Clinical Practice. JACC Cardiovasc Imaging. 2008 Jul 7; 1(4): 536–555.
http://dx.doi.org:/10.1016/j.jcmg.2008.05.009
- Peralta CA, Whooley MA, Ix JH, Shlipak MG. Kidney function and systolic blood pressure new insights from cystatin C: data from the Heart and Soul Study. Am J Hypertens. 2006 Sep; 19(9):939-46. http://dx.doi.org:/10.1016/j.amjhyper.2006.02.007
- Moran A, Katz R, Nicolas L. Smith NL, Fried LF, Sarnak MJ, …, Shlipak, MG. Cystatin C Concentration as a Predictor of Systolic and Diastolic Heart Failure. J Card Fail. 2008 Feb; 14(1): 19–26. http://dx.doi.org:/10.1016/j.cardfail.2007.09.002
- Tomaschitz A, Maerz W, Pilz S, at al. Aldosterone/Renin Ratio Determines Peripheral and Blood Pressure Values Over a Broad Range. J Am Coll Cardiol 2010-5-11; 55(19):2171-2180.
- Inker LA, Schmid CH, Tighiouart H, et al: Estimating glomerular filtration rate from serum creatinine and cystatin C. N Engl J Med 2012 Jul; 367(1):20-29. http://dx.doi.org:/10.1056/NEJMoa1114248
- Buehrig CK, Larson TS, Bergert JH, et al: Cystatin C is superior to serum creatinine for the assessment of renal function. J Am Soc Nephrol 2001; 12:194A
- Grubb AO: Cystatin C – properties and use as a diagnostic marker. Adv Clin Chem 2000; 35:63-99
- Stevens LA, Coresh J, Schmid CH, Feldman H, et al. Estimating GFR using serum cystatin C alone and in combination with serum creatinine: a pooled analysis of 3,418 individuals with CKD.
Am J Kidney Dis. 2008 Mar; 51(3):395-406. http://dx.doi.org:/10.1053/j.ajkd.2007.11.018
- Levey AS, Coresh J, Greene T, et al. Using standardized serum creatinine values in the modification of diet in renal disease study equation for estimating glomerular filtration rate. Ann Intern Med. 2006;145:247–254.
- Stevens LA, Coresh J, Greene T, Levey AS. Assessing kidney function – measured and estimated glomerular filtration rate. N Engl J Med. 2006; 354:2473–2483.
- Grubb A, Nyman U, Bjork J, et al. Simple cystatin C-based prediction equations for glomerular filtration rate compared with the Modification of Diet in Renal Disease Prediction Equation for adults and the Schwartz and the Counahan-Barratt Prediction Equations for children. Clin Chem. 2005; 51:1420–1431.
- Weir MR. Improving the Estimating Equation for GFR — A Clinical Perspective. N Engl J Med 2012; 367:75-76. http://dx.doi.org:/10.1056/NEJMe1204489
- Shlipak MG, Sarnak MJ, Katz R, Fried LF, et al. Cystatin C and the Risk of Death and Cardiovascular Events among Elderly Persons. http://journal.9med.net/qikan/article.php?id=216331
- Knight EL, Verhave JC, Spiegelman D, et al. Factors influencing serum cystatin C levels other than renal function and the impact on renal function measurement. Kidney International 2004; 65:1416–1421; http://dx.doi.org:/10.1111/j.1523-1755.2004.00517.x
- Parag C. Patel, Colby R. Ayers, Sabina A. Murphy, et al. Association of Cystatin C with Left Ventricular Structure and Function (The Dallas Heart Study). Circulation: Heart Failure. 2009; 2: 98-104. http://dx.doi.org:/10.1161/CIRCHEARTFAILURE.108.807271.
- Rule AD, Bergstralh EJ, Slezak JM, Bergert J, Larson TS. Glomerular filtraton rate estimated by cystatin C among different clinical presentations. Kidney Int. 2006; 69:399–405. http://dx.doi.org:/10.1038/sj.ki.5000073
- Muller B, Morgenthaler N, Stolz D, et al. Circulating levels of copeptin, a novel biomarker, in lower respiratory tract infections. Eur J Clin Invest 2007;37, 145–152.
- Stoiser B, Mortl D, Hulsmann M, et al. Copeptin, a fragment of the vasopressin precursor, as a novel predictor of outcome in heart failure. Eur J Clin Invest Nov 2006; 36(11):771–778.
http://dx.doi.org:/10.1111/j.1365-2362.2006.01724.x
- Meijer E, Bakker SJL, Helbesma N, et al. Copeptin, a surrogate marker of vasopressin, is associated with microalbuminuria in a large population cohort. Kidney Intl 2010; 77:29–36.
http://dx.doi.org:/10.1038/ki.2009.397
- Nickel NP, Lichtinghagen R, Golpon H, et al. Circulating levels of copeptin predict outcome in patients with pulmonary arterial hypertension. Respir Res. Nov 19, 2013; 14:130. http://dx.doi.org:/10.1186/1465-9921-14-130
- Tenderenda-Banasiuk E, Wasilewska A, Filonowicz R, et al. Serum copeptin levels in adolescents with primary hypertension. Pediatr Nephrol. 2014; 29(3): 423–429. doi: 10.1007/s00467-013-2683-5
- Richards M, Januzzi JL, and Troughton RW. Natriuretic Peptides in Heart Failure with Preserved Ejection Fraction. Heart Failure Clin 2014; 10:453–470. http://dx.doi.org/10.1016/j.hfc.2014.04.006
- Maisel A, Mueller C, Nowak M and Peacock WF, et al. Midregion Prohormone Adrenomedullin and Prognosis in Patients Presenting with Acute Dyspnea Results from the BACH (Biomarkers in Acute Heart Failure) Trial. J Am Coll Cardiol 2011; 58(10):1057–67. http://dx.doi.org:/10.1016/j.jacc.2011.06.006.
- Bernstein LH. Heart-Lung-Kidney: Essential Ties. Leaders in Pharmaceutical Innovation. http://pharmaceuticalinnovations.com
- Bernstein LH, Zions MY, Alam ME, et al. What is the best approximation of reference normal for NT-proBNP? Clinical levels for enhanced assessment of NT-proBNP (CLEAN). J Med Lab and Diag 04/2011; 2:16-21. http://www.academicjournals.org/jmld
- Hijazi Z., Wallentin L., Siegbahn A., et al; N-terminal pro-B-type natriuretic peptide for risk assessment in patients with atrial fibrillation: insights from the ARISTOTLE trial (Apixaban for the Prevention of Stroke in Subjects With Atrial Fibrillation. J Am Coll Cardiol. 2013; 61:2274-2284
- Paget V, Legedz L, Gaudebout N, et al. N-Terminal Pro-Brain Natriuretic Peptide A Powerful Predictor of Mortality in Hypertension. Hypertension. 2011; 57:702-709 http://hyper.ahajournals.org/content/57/4/702.full.pdf]
- Kim Han-Naand Januzzi JL. Natriuretic Peptide Testing in Heart Failure. Circulation 2011; 123: 2015-2019. http://dx.doi.org:/10.1161/CIRCULATIONAHA.110.979500
- Balta S, Demirkol S, Aydogan M, and Celik T. Higher N-Terminal Pro–B-Type Natriuretic Peptide May Be Related to Very Different Conditions. J Am Coll Cardiol. 2013; 62(17):1634-1635. http://dx.doi.org:/10.1016/j.jacc.2013.04.093
- Bernstein LH1, Zions MY, Haq SA, et al. Effect of renal function loss on NT-proBNP level variations. Clin Biochem. 2009 Jul; 42(10-11): 1091-8. http://dx.doi.org:/10.1016/j.clinbiochem.2009.02.027
- Afaq MA, Shoraki A, Oleg I, Bernstein L, and Stuart W. Zarich. Validity of Amino Terminal pro-Brain Natiuretic Peptide in a Medically Complex Elderly Population. J Clin Med Res. 2011 Aug; 3(4): 156–163. doi: 10.4021/jocmr606w
- Mark AL, Correia M, MorganDA, et al. New Concepts From the Emerging Biology of Obesity. Hypertension. 1999; 33[part II]:537-541.
- Himmelfarb J, Stenvinkel P, Ikizler TA and Hakim RM. The elephant in uremia: Oxidant stress as a unifying concept of cardiovascular disease in uremia. Kidney International (2002) 62, 1524–1538; http://dx.doi.org:/10.1046/j.1523-1755.2002.00600.x http://www.nature.com/ki/journal/v62/n5/full/4493262a.html
- The blind men and the elephant. Poem by John Godfrey Saxe (Cartoon originally copyrighted by the authors; G. Renee Guzlas, artist). http://www.nature.com/ki/journal/v62/n5/thumbs/4493262f1bth.gif
- Fetter RB. Diagnosis Related Groups: Understanding Hospital Performance. Interfaces Jan. – Feb., 1991; 21(1), Franz Edelman Award Papers: 6-26
- Bernstein LH. Inadequacy of EHRs. Pharmaceutical Intelligence. http://pharmaceuticalintelligence.com/2015/11/05/inadequacy-of-ehrs/
- Celi LA, Marshall JD, Lai Y, Stone DJ. Disrupting Electronic Health Records Systems: The Next Generation. JMIR Med Inform 2015 (23.10.15); 3(4) :e34
http://dx.doi.org:/10.2196/medinform.4192
- Realtime Clinical Expert Support. Pharmaceutical Intelligence. http://pharmaceuticalintelligence.com/2015/05/10/realtime-clinical-expert-support/
- McGowan JJ and Winstead-Fry P. Problem Knowledge Couplers: reengineering evidence-based medicine through interdisciplinary development, decision support, and research. Bull Med Libr Assoc. 1999 October; 87(4):462–470.)
- Rypka EW and Babb R. Automatic construction and use of an identification scheme. In MEDICAL RESEARCH ENGINEERING Apr 19709; (2):9-19. https://www.researchgate.net/publication/17720773_Automatic_construction_and_use_of_an_identification_scheme
- Rudolph, R. A., Bernstein, L. H. and Babb, J. Information induction for predicting acute myocardial infarction. Clinical Chemistry 1988; 34: 2031-2038.
- Bernstein LH, Qamar A, McPherson C, Zarich S. Evaluating a new graphical ordinal logit method (GOLDminer) in the diagnosis of myocardial infarction utilizing clinical features and laboratory data. Yale J Biol Med 1999; 72:259-268.
- Bernstein LH, Good IJ, Holtzman, Deaton ML, Babb J. Diagnosis of acute myocardial infarction from two measurements of creatine kinase isoenzyme MB with use of nonparametric probability estimation. Clin Chem 1989; 35(3):444-447.
- Bernstein LH. Regression: A richly textured method for comparison and classification of predictor variables. http://pharmaceuticalintelligence.com/2012/08/14/regression-a-richly-textured-method-for-comparison-and-classification-of-predictor-variables/
- Posada D and Buckley TR. Model Selection and Model Averaging in Phylogenetics: Advantages of Akaike Information Criterion and Bayesian Approaches over Likelihood Ratio Tests. Syst. Biol. 200; 53(5):793–808. http://dx.doi.org:/10.1080/10635150490522304
- Kullback S. and Leibler R. On Information and Sufficiency. Ann Math Statistics. Mar 1951; 22(1):79-86. http://www.csee.wvu.edu/~xinl/library/papers/math/statistics/Kullback_Leibler_1951.pdf
- Bernstein LH, David G, Rucinski J, Coifman RR. Converting Hematology Based Data Into an Inferential Interpretation. In INTECH Open Access Publisher, 2012. https://books.google.com/books/about/Converting_Hematology_Based_Data_Into_an.html
- Bernstein LH, David G, Coifman RR. Generating Evidence Based Interpretation of Hematology Screens via Anomaly Characterization. Open Clin Chem J 2011; 4:10-16
- Bernstein LH. Automated Inferential Diagnosis of SIRS, sepsis, septic shock. Medical Informatics View. http://pharmaceuticalintelligence.com/2012/08/01/automated-inferential-diagnosis-of-sirs-sepsis-septic-shock/
- Bernstein LH, David G, Coifman RR. The Automated Nutritional Assessment. Nutrition 2013; 29: 113-121
Other related articles published in this Open Access Online Scientific Journal include the following:
Biomarkers and risk factors for cardiovascular events, endothelial dysfunction, and thromboembolic complications
Commentary on Biomarkers for Genetics and Genomics of Cardiovascular Disease: Views by Larry H Bernstein, MD, FCAP
Summary – Volume 4, Part 2: Translational Medicine in Cardiovascular Diseases
Pathophysiological Effects of Diabetes on Ischemic-Cardiovascular Disease and on Chronic Obstructive Pulmonary Disease (COPD)
Assessing Cardiovascular Disease with Biomarkers
Endothelial Function and Cardiovascular Disease
Adenosine Receptor Agonist Increases Plasma Homocysteine
Inadequacy of EHRs
Innervation of Heart and Heart Rate
Biomarker Guided Therapy
Pharmacogenomics
The Union of Biomarkers and Drug Development
Natriuretic Peptides in Evaluating Dyspnea and Congestive Heart Failure
Epilogue: Volume 4 – Translational, Post-Translational and Regenerative Medicine in Cardiology
Atherosclerosis Independence: Genetic Polymorphisms of Ion Channels Role in the Pathogenesis of Coronary Microvascular Dysfunction and Myocardial Ischemia (Coronary Artery Disease (CAD))
Erythropoietin (EPO) and Intravenous Iron (Fe) as Therapeutics for Anemia in Severe and Resistant CHF: The Elevated N-terminal proBNP Biomarker
Biomarkers: Diagnosis and Management, Present and Future
Genetic Analysis of Atrial Fibrillation
Landscape of Cardiac Biomarkers for Improved Clinical Utilization
Fractional Flow Reserve (FFR) & Instantaneous wave-free ratio (iFR): An Evaluation of Catheterization Lab Tools for Ischemic Assessment
Dealing with the Use of the High Sensitivity Troponin (hs cTn) Assays
Cardiotoxicity and Cardiomyopathy Related to Drugs Adverse Effects
Amyloidosis with Cardiomyopathy
Accurate Identification and Treatment of Emergent Cardiac Events
The potential contribution of informatics to healthcare is more than currently estimated
Realtime Clinical Expert Support
Metabolomics is about Metabolic Systems Integration
Automated Inferential Diagnosis of SIRS, sepsis, septic shock
Like this:
Like Loading...
Read Full Post »


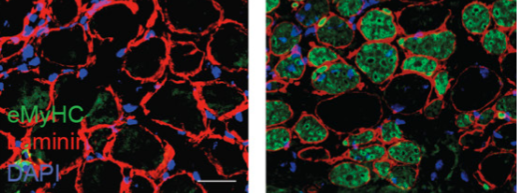
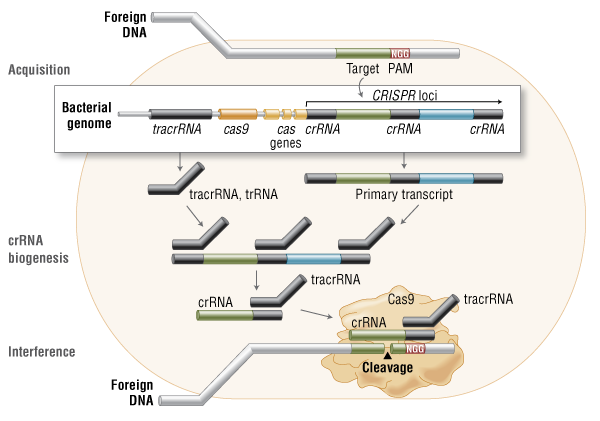
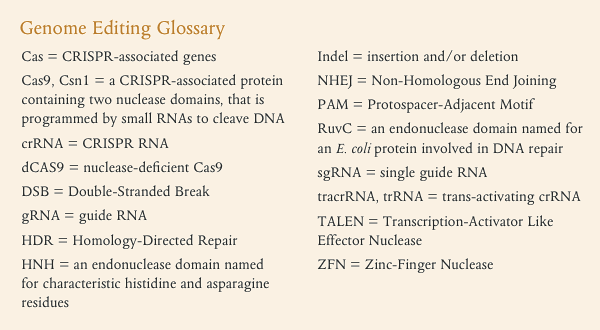
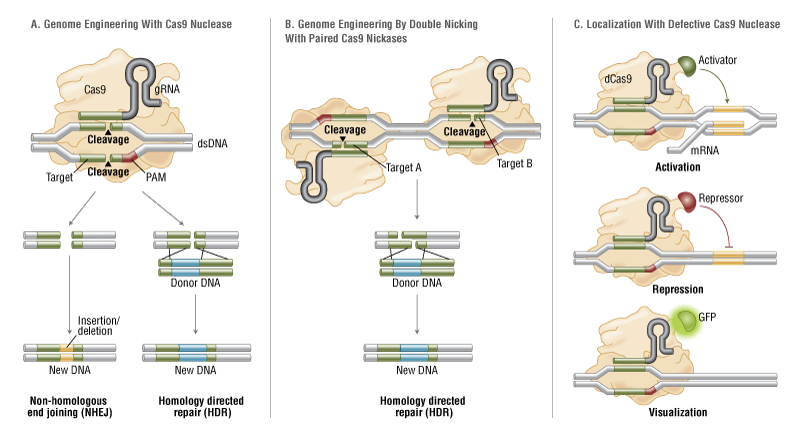
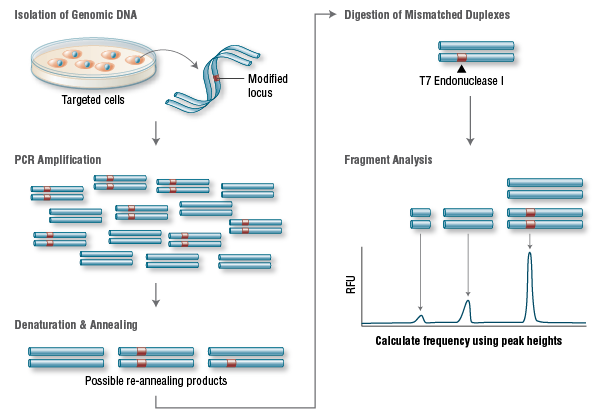