• Home
  • >>>>>>>>>>>>> 2026 & BEYOND MASTER PLAN >>>>>>>>>>>>>>>>
  • Virtual Data Room (VDR) for Strategic Customized Slide Decks
  • TRAINABLE DATA ASSETS IN CORPORATE LEGACY & ORGANIZATION’s STRATEGIC MEMORY (2012 – 2025)
  • 2.0 LPBI Executive Summary
  • 1.0 LPBI Executive Summary
  • Founder’s Vision
  • Portfolio of IP Assets
  • Knowledge PORTALS System (KPS)
  • 1.0 LPBI – 2012-2020 VISTA
  • LPBI Group’s History
  • 2.0 LPBI – 2021-2025 VISION
  • BioMed e-Series
  • Press Coverage
  • Investor Relations
  • Our TEAM
  • Founder’s Bio
  • Funding, Deals & Partnerships
  • 1.0 LPBI Group News
  • 1.0 LPBI CALENDAR
  • 2.0 LPBI Group News
  • Testimonials about LPBI
  • DrugDiscovery @LPBI Group
  • Medical 3D Printing
  • e-VOICES Podcasting
  • LPBI Newsletters
  • Customer Surveys
  • Health Care INVESTOR’s Corner ($)
  • 2021 Summer Internship Portal
  • 2021-2025 Medical Text Analysis (NLP)
  • Artificial Intelligence: Genomics & Cancer
  • Blockchain Transactions Network Ecosystem
  • 1.0 LPBI Brochure
  • 2.0 LPBI Brochure
  • 2.0 LPBI – Calendar of Zooms
  • Coronavirus, SARS-CoV-2 Portal
  • LPBI India
  • SOP Web STAT
  • Synthetic Biology in Drug Discovery
  • Certificate One Year
  • NFT: Redefined Format of IP Assets
  • Audio English-Spanish: BioMed e-Series
  • Five Bilingual BioMed e-Series
  • Press Releases
  • Intangibles CIM
  • BioMed Audio Podcast Library @LPBI Group
  • Medical School Education: Use of LPBI Group’s Contents
  • ChatGPT + Wolfram PlugIn
  • Medicine with GPT-4 & ChatGPT
  • AGI, generativeAI, Grok, DeepSeek & Expert Models in Healthcare
  • Multimodal Healthcare Foundation Model
  • Cell Therapy in Regenerative Medicine, 2026 and Beyond
  • Contact Us

Leaders in Pharmaceutical Business Intelligence Group, LLC, Doing Business As LPBI Group, Newton, MA

Healthcare analytics, AI solutions for biological big data, providing an AI platform for the biotech, life sciences, medical and pharmaceutical industries, as well as for related technological approaches, i.e., curation and text analysis with machine learning and other activities related to AI applications to these industries.

Feeds:
Posts
Comments

Archive for the ‘Cell Biology’ Category

Summary and Perspectives: Impairments in Pathological States: Endocrine Disorders, Stress Hypermetabolism and Cancer

Posted in Academic Publishing, Anaerobic Glycolysis, Best evidence, Bio Instrumentation in Experimental Life Sciences Research, Biochemical pathways, Biological Networks, Biomarkers & Medical Diagnostics, Biomedical Measurement Science, Ca2+ triggered activation, Cachexia, Calcium Signaling, Cancer and Current Therapeutics, CANCER BIOLOGY & Innovations in Cancer Therapy, Cardiomyopathy, Cardiovascular Research, Cell Biology, Cerebrovascular and Neurodegenerative Diseases, Clinical Diagnostics, Commercialization, Curation, Dehydrogenase, Diabetes Mellitus, Discovery process, Disease Biology, Drug Toxicity, Endocrine Diseases, Enzyme Induction, Enzymes and isoenzymes, Evolutionary cognition, Experimental validation, Explanatory, Frontiers in Cardiology and Cardiovascular Disorders, Gene Regulation and Evolution, Genetics & Pharmaceutical, Genome Biology, Hematology, Hematopoiesis, Historical relevance, Human Immune System in Health and in Disease, Infectious Disease & New Antibiotic Targets, Inferential analysis, Innovations, Intellectual Property, Interviews with Scientific Leaders, Investment in Technological Breakthrough, Kinase, Lipid metabolism, Liver & Digestive Diseases Research, Loss of function gene, Metabolism, Metabolomics, Methods, Methylation, Mutant Gene Expression, Myocardial Ischemia, Myocardial Metabolism, Na-K transport, Neurohumoral Transmission, Neurological Diseases, Nitric Oxide in Health and Disease, Nutrition, Nutrition and Phytochemistry, Origins of Cardiovascular Disease, Oxidative phosphorylation, Personalized and Precision Medicine & Genomic Research, Pharmaceutical Analytics, Pharmaceutical Discovery, Pharmacodynamics and Pharmacokinetics, Phosphorylation, Population Health Management, Proteomics, Pyridine nucleotides, Pyruvate Kinase, Quality Assurance, RNA Biology, Signaling, Signaling & Cell Circuits, Small Molecules in Development of Therapeutic Drugs, Statistical Methods for Research Evaluation, Stem Cells for Regenerative Medicine, Systemic Inflammatory Response Related Disorders, Technology Advance Assessment of, Technology Transfer: Biotech and Pharmaceutical, Transcriptomics, Translational Effectiveness, Translational Research, Translational Science, Ubiquitinylation, Warburg effect, tagged Amyloid, Cancer - General, cardiovascular and lung disease, Diabetes Mellitus, disease application, Drug discovery, endocrine disease, Metabolomics, neurodegeneration, Personalized medicine, Proteomics, steroid hormones, transcription factors, Transcriptomics, vitamins and cofactors on November 9, 2014| Leave a Comment »

Summary and Perspectives: Impairments in Pathological States: Endocrine Disorders, Stress Hypermetabolism and Cancer

Author and Curator: Larry H. Bernstein, MD, FCAP

Article ID #160: Summary and Perspectives: Impairments in Pathological States: Endocrine Disorders, Stress Hypermetabolism and Cancer. Published on 11/9/2014

WordCloud Image Produced by Adam Tubman

This summary is the last of a series on the impact of transcriptomics, proteomics, and metabolomics on disease investigation, and the sorting and integration of genomic signatures and metabolic signatures to explain phenotypic relationships in variability and individuality of response to disease expression and how this leads to  pharmaceutical discovery and personalized medicine.  We have unquestionably better tools at our disposal than has ever existed in the history of mankind, and an enormous knowledge-base that has to be accessed.  I shall conclude here these discussions with the powerful contribution to and current knowledge pertaining to biochemistry, metabolism, protein-interactions, signaling, and the application of the -OMICS to diseases and drug discovery at this time.

The Ever-Transcendent Cell

Deriving physiologic first principles By John S. Torday | The Scientist Nov 1, 2014
http://www.the-scientist.com/?articles.view/articleNo/41282/title/The-Ever-Transcendent-Cell/

Both the developmental and phylogenetic histories of an organism describe the evolution of physiology—the complex of metabolic pathways that govern the function of an organism as a whole. The necessity of establishing and maintaining homeostatic mechanisms began at the cellular level, with the very first cells, and homeostasis provides the underlying selection pressure fueling evolution.

While the events leading to the formation of the first functioning cell are debatable, a critical one was certainly the formation of simple lipid-enclosed vesicles, which provided a protected space for the evolution of metabolic pathways. Protocells evolved from a common ancestor that experienced environmental stresses early in the history of cellular development, such as acidic ocean conditions and low atmospheric oxygen levels, which shaped the evolution of metabolism.

The reduction of evolution to cell biology may answer the perennially unresolved question of why organisms return to their unicellular origins during the life cycle.

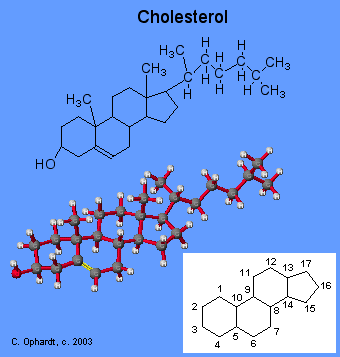
As primitive protocells evolved to form prokaryotes and, much later, eukaryotes, changes to the cell membrane occurred that were critical to the maintenance of chemiosmosis, the generation of bioenergy through the partitioning of ions. The incorporation of cholesterol into the plasma membrane surrounding primitive eukaryotic cells marked the beginning of their differentiation from prokaryotes. Cholesterol imparted more fluidity to eukaryotic cell membranes, enhancing functionality by increasing motility and endocytosis. Membrane deformability also allowed for increased gas exchange.

Acidification of the oceans by atmospheric carbon dioxide generated high intracellular calcium ion concentrations in primitive aquatic eukaryotes, which had to be lowered to prevent toxic effects, namely the aggregation of nucleotides, proteins, and lipids. The early cells achieved this by the evolution of calcium channels composed of cholesterol embedded within the cell’s plasma membrane, and of internal membranes, such as that of the endoplasmic reticulum, peroxisomes, and other cytoplasmic organelles, which hosted intracellular chemiosmosis and helped regulate calcium.

As eukaryotes thrived, they experienced increasingly competitive pressure for metabolic efficiency. Engulfed bacteria, assimilated as mitochondria, provided more bioenergy. As the evolution of eukaryotic organisms progressed, metabolic cooperation evolved, perhaps to enable competition with biofilm-forming, quorum-sensing prokaryotes. The subsequent appearance of multicellular eukaryotes expressing cellular growth factors and their respective receptors facilitated cell-cell signaling, forming the basis for an explosion of multicellular eukaryote evolution, culminating in the metazoans.

Casting a cellular perspective on evolution highlights the integration of genotype and phenotype. Starting from the protocell membrane, the functional homolog for all complex metazoan organs, it offers a way of experimentally determining the role of genes that fostered evolution based on the ontogeny and phylogeny of cellular processes that can be traced back, in some cases, to our last universal common ancestor.  ….

As eukaryotes thrived, they experienced increasingly competitive pressure for metabolic efficiency. Engulfed bacteria, assimilated as mitochondria, provided more bioenergy. As the evolution of eukaryotic organisms progressed, metabolic cooperation evolved, perhaps to enable competition with biofilm-forming, quorum-sensing prokaryotes. The subsequent appearance of multicellular eukaryotes expressing cellular growth factors and their respective receptors facilitated cell-cell signaling, forming the basis for an explosion of multicellular eukaryote evolution, culminating in the metazoans.

Casting a cellular perspective on evolution highlights the integration of genotype and phenotype. Starting from the protocell membrane, the functional homolog for all complex metazoan organs, it offers a way of experimentally determining the role of genes that fostered evolution based on the ontogeny and phylogeny of cellular processes that can be traced back, in some cases, to our last universal common ancestor.

Given that the unicellular toolkit is complete with all the traits necessary for forming multicellular organisms (Science, 301:361-63, 2003), it is distinctly possible that metazoans are merely permutations of the unicellular body plan. That scenario would clarify a lot of puzzling biology: molecular commonalities between the skin, lung, gut, and brain that affect physiology and pathophysiology exist because the cell membranes of unicellular organisms perform the equivalents of these tissue functions, and the existence of pleiotropy—one gene affecting many phenotypes—may be a consequence of the common unicellular source for all complex biologic traits.  …

The cell-molecular homeostatic model for evolution and stability addresses how the external environment generates homeostasis developmentally at the cellular level. It also determines homeostatic set points in adaptation to the environment through specific effectors, such as growth factors and their receptors, second messengers, inflammatory mediators, crossover mutations, and gene duplications. This is a highly mechanistic, heritable, plastic process that lends itself to understanding evolution at the cellular, tissue, organ, system, and population levels, mediated by physiologically linked mechanisms throughout, without having to invoke random, chance mechanisms to bridge different scales of evolutionary change. In other words, it is an integrated mechanism that can often be traced all the way back to its unicellular origins.

The switch from swim bladder to lung as vertebrates moved from water to land is proof of principle that stress-induced evolution in metazoans can be understood from changes at the cellular level.

http://www.the-scientist.com/Nov2014/TE_21.jpg

A MECHANISTIC BASIS FOR LUNG DEVELOPMENT: Stress from periodic atmospheric hypoxia (1) during vertebrate adaptation to land enhances positive selection of the stretch-regulated parathyroid hormone-related protein (PTHrP) in the pituitary and adrenal glands. In the pituitary (2), PTHrP signaling upregulates the release of adrenocorticotropic hormone (ACTH) (3), which stimulates the release of glucocorticoids (GC) by the adrenal gland (4). In the adrenal gland, PTHrP signaling also stimulates glucocorticoid production of adrenaline (5), which in turn affects the secretion of lung surfactant, the distension of alveoli, and the perfusion of alveolar capillaries (6). PTHrP signaling integrates the inflation and deflation of the alveoli with surfactant production and capillary perfusion.  THE SCIENTIST STAFF

From a cell-cell signaling perspective, two critical duplications in genes coding for cell-surface receptors occurred during this period of water-to-land transition—in the stretch-regulated parathyroid hormone-related protein (PTHrP) receptor gene and the β adrenergic (βA) receptor gene. These gene duplications can be disassembled by following their effects on vertebrate physiology backwards over phylogeny. PTHrP signaling is necessary for traits specifically relevant to land adaptation: calcification of bone, skin barrier formation, and the inflation and distention of lung alveoli. Microvascular shear stress in PTHrP-expressing organs such as bone, skin, kidney, and lung would have favored duplication of the PTHrP receptor, since sheer stress generates radical oxygen species (ROS) known to have this effect and PTHrP is a potent vasodilator, acting as an epistatic balancing selection for this constraint.

Positive selection for PTHrP signaling also evolved in the pituitary and adrenal cortex (see figure on this page), stimulating the secretion of ACTH and corticoids, respectively, in response to the stress of land adaptation. This cascade amplified adrenaline production by the adrenal medulla, since corticoids passing through it enzymatically stimulate adrenaline synthesis. Positive selection for this functional trait may have resulted from hypoxic stress that arose during global episodes of atmospheric hypoxia over geologic time. Since hypoxia is the most potent physiologic stressor, such transient oxygen deficiencies would have been acutely alleviated by increasing adrenaline levels, which would have stimulated alveolar surfactant production, increasing gas exchange by facilitating the distension of the alveoli. Over time, increased alveolar distension would have generated more alveoli by stimulating PTHrP secretion, impelling evolution of the alveolar bed of the lung.

This scenario similarly explains βA receptor gene duplication, since increased density of the βA receptor within the alveolar walls was necessary for relieving another constraint during the evolution of the lung in adaptation to land: the bottleneck created by the existence of a common mechanism for blood pressure control in both the lung alveoli and the systemic blood pressure. The pulmonary vasculature was constrained by its ability to withstand the swings in pressure caused by the systemic perfusion necessary to sustain all the other vital organs. PTHrP is a potent vasodilator, subserving the blood pressure constraint, but eventually the βA receptors evolved to coordinate blood pressure in both the lung and the periphery.

Gut Microbiome Heritability

Analyzing data from a large twin study, researchers have homed in on how host genetics can shape the gut microbiome.
By Tracy Vence | The Scientist Nov 6, 2014

Previous research suggested host genetic variation can influence microbial phenotype, but an analysis of data from a large twin study published in Cell today (November 6) solidifies the connection between human genotype and the composition of the gut microbiome. Studying more than 1,000 fecal samples from 416 monozygotic and dizygotic twin pairs, Cornell University’s Ruth Ley and her colleagues have homed in on one bacterial taxon, the family Christensenellaceae, as the most highly heritable group of microbes in the human gut. The researchers also found that Christensenellaceae—which was first described just two years ago—is central to a network of co-occurring heritable microbes that is associated with lean body mass index (BMI).  …

Of particular interest was the family Christensenellaceae, which was the most heritable taxon among those identified in the team’s analysis of fecal samples obtained from the TwinsUK study population.

While microbiologists had previously detected 16S rRNA sequences belonging to Christensenellaceae in the human microbiome, the family wasn’t named until 2012. “People hadn’t looked into it, partly because it didn’t have a name . . . it sort of flew under the radar,” said Ley.

Ley and her colleagues discovered that Christensenellaceae appears to be the hub in a network of co-occurring heritable taxa, which—among TwinsUK participants—was associated with low BMI. The researchers also found that Christensenellaceae had been found at greater abundance in low-BMI twins in older studies.

To interrogate the effects of Christensenellaceae on host metabolic phenotype, the Ley’s team introduced lean and obese human fecal samples into germ-free mice. They found animals that received lean fecal samples containing more Christensenellaceae showed reduced weight gain compared with their counterparts. And treatment of mice that had obesity-associated microbiomes with one member of the Christensenellaceae family, Christensenella minuta, led to reduced weight gain.   …

Ley and her colleagues are now focusing on the host alleles underlying the heritability of the gut microbiome. “We’re running a genome-wide association analysis to try to find genes—particular variants of genes—that might associate with higher levels of these highly heritable microbiota.  . . . Hopefully that will point us to possible reasons they’re heritable,” she said. “The genes will guide us toward understanding how these relationships are maintained between host genotype and microbiome composition.”

J.K. Goodrich et al., “Human genetics shape the gut microbiome,” Cell,  http://dx.doi.org:/10.1016/j.cell.2014.09.053, 2014.

Light-Operated Drugs

Scientists create a photosensitive pharmaceutical to target a glutamate receptor.
By Ruth Williams | The Scentist Nov 1, 2014
http://www.the-scientist.com/?articles.view/articleNo/41279/title/Light-Operated-Drugs/

light operated drugs MO1

light operated drugs MO1

http://www.the-scientist.com/Nov2014/MO1.jpg

The desire for temporal and spatial control of medications to minimize side effects and maximize benefits has inspired the development of light-controllable drugs, or optopharmacology. Early versions of such drugs have manipulated ion channels or protein-protein interactions, “but never, to my knowledge, G protein–coupled receptors [GPCRs], which are one of the most important pharmacological targets,” says Pau Gorostiza of the Institute for Bioengineering of Catalonia, in Barcelona.

Gorostiza has taken the first step toward filling that gap, creating a photosensitive inhibitor of the metabotropic glutamate 5 (mGlu5) receptor—a GPCR expressed in neurons and implicated in a number of neurological and psychiatric disorders. The new mGlu5 inhibitor—called alloswitch-1—is based on a known mGlu receptor inhibitor, but the simple addition of a light-responsive appendage, as had been done for other photosensitive drugs, wasn’t an option. The binding site on mGlu5 is “extremely tight,” explains Gorostiza, and would not accommodate a differently shaped molecule. Instead, alloswitch-1 has an intrinsic light-responsive element.

In a human cell line, the drug was active under dim light conditions, switched off by exposure to violet light, and switched back on by green light. When Gorostiza’s team administered alloswitch-1 to tadpoles, switching between violet and green light made the animals stop and start swimming, respectively.

The fact that alloswitch-1 is constitutively active and switched off by light is not ideal, says Gorostiza. “If you are thinking of therapy, then in principle you would prefer the opposite,” an “on” switch. Indeed, tweaks are required before alloswitch-1 could be a useful drug or research tool, says Stefan Herlitze, who studies ion channels at Ruhr-Universität Bochum in Germany. But, he adds, “as a proof of principle it is great.” (Nat Chem Biol, http://dx.doi.org:/10.1038/nchembio.1612, 2014)

Enhanced Enhancers

The recent discovery of super-enhancers may offer new drug targets for a range of diseases.
By Eric Olson | The Scientist Nov 1, 2014
http://www.the-scientist.com/?articles.view/articleNo/41281/title/Enhanced-Enhancers/

To understand disease processes, scientists often focus on unraveling how gene expression in disease-associated cells is altered. Increases or decreases in transcription—as dictated by a regulatory stretch of DNA called an enhancer, which serves as a binding site for transcription factors and associated proteins—can produce an aberrant composition of proteins, metabolites, and signaling molecules that drives pathologic states. Identifying the root causes of these changes may lead to new therapeutic approaches for many different diseases.

Although few therapies for human diseases aim to alter gene expression, the outstanding examples—including antiestrogens for hormone-positive breast cancer, antiandrogens for prostate cancer, and PPAR-γ agonists for type 2 diabetes—demonstrate the benefits that can be achieved through targeting gene-control mechanisms.  Now, thanks to recent papers from laboratories at MIT, Harvard, and the National Institutes of Health, researchers have a new, much bigger transcriptional target: large DNA regions known as super-enhancers or stretch-enhancers. Already, work on super-enhancers is providing insights into how gene-expression programs are established and maintained, and how they may go awry in disease.  Such research promises to open new avenues for discovering medicines for diseases where novel approaches are sorely needed.

Super-enhancers cover stretches of DNA that are 10- to 100-fold longer and about 10-fold less abundant in the genome than typical enhancer regions (Cell, 153:307-19, 2013). They also appear to bind a large percentage of the transcriptional machinery compared to typical enhancers, allowing them to better establish and enforce cell-type specific transcriptional programs (Cell, 153:320-34, 2013).

Super-enhancers are closely associated with genes that dictate cell identity, including those for cell-type–specific master regulatory transcription factors. This observation led to the intriguing hypothesis that cells with a pathologic identity, such as cancer cells, have an altered gene expression program driven by the loss, gain, or altered function of super-enhancers.

Sure enough, by mapping the genome-wide location of super-enhancers in several cancer cell lines and from patients’ tumor cells, we and others have demonstrated that genes located near super-enhancers are involved in processes that underlie tumorigenesis, such as cell proliferation, signaling, and apoptosis.

Super-enhancers cover stretches of DNA that are 10- to 100-fold longer and about 10-fold less abundant in the genome than typical enhancer regions.

Genome-wide association studies (GWAS) have found that disease- and trait-associated genetic variants often occur in greater numbers in super-enhancers (compared to typical enhancers) in cell types involved in the disease or trait of interest (Cell, 155:934-47, 2013). For example, an enrichment of fasting glucose–associated single nucleotide polymorphisms (SNPs) was found in the stretch-enhancers of pancreatic islet cells (PNAS, 110:17921-26, 2013). Given that some 90 percent of reported disease-associated SNPs are located in noncoding regions, super-enhancer maps may be extremely valuable in assigning functional significance to GWAS variants and identifying target pathways.

Because only 1 to 2 percent of active genes are physically linked to a super-enhancer, mapping the locations of super-enhancers can be used to pinpoint the small number of genes that may drive the biology of that cell. Differential super-enhancer maps that compare normal cells to diseased cells can be used to unravel the gene-control circuitry and identify new molecular targets, in much the same way that somatic mutations in tumor cells can point to oncogenic drivers in cancer. This approach is especially attractive in diseases for which an incomplete understanding of the pathogenic mechanisms has been a barrier to discovering effective new therapies.

Another therapeutic approach could be to disrupt the formation or function of super-enhancers by interfering with their associated protein components. This strategy could make it possible to downregulate multiple disease-associated genes through a single molecular intervention. A group of Boston-area researchers recently published support for this concept when they described inhibited expression of cancer-specific genes, leading to a decrease in cancer cell growth, by using a small molecule inhibitor to knock down a super-enhancer component called BRD4 (Cancer Cell, 24:777-90, 2013).  More recently, another group showed that expression of the RUNX1 transcription factor, involved in a form of T-cell leukemia, can be diminished by treating cells with an inhibitor of a transcriptional kinase that is present at the RUNX1 super-enhancer (Nature, 511:616-20, 2014).

Fungal effector Ecp6 outcompetes host immune receptor for chitin binding through intrachain LysM dimerization 
Andrea Sánchez-Vallet, et al.   eLife 2013;2:e00790 http://elifesciences.org/content/2/e00790#sthash.LnqVMJ9p.dpuf

LysM effector

LysM effector

http://img.scoop.it/ZniCRKQSvJOG18fHbb4p0Tl72eJkfbmt4t8yenImKBVvK0kTmF0xjctABnaLJIm9

While host immune receptors

  • detect pathogen-associated molecular patterns to activate immunity,
  • pathogens attempt to deregulate host immunity through secreted effectors.

Fungi employ LysM effectors to prevent

  • recognition of cell wall-derived chitin by host immune receptors

Structural analysis of the LysM effector Ecp6 of

  • the fungal tomato pathogen Cladosporium fulvum reveals
  • a novel mechanism for chitin binding,
  • mediated by intrachain LysM dimerization,

leading to a chitin-binding groove that is deeply buried in the effector protein.

This composite binding site involves

  • two of the three LysMs of Ecp6 and
  • mediates chitin binding with ultra-high (pM) affinity.

The remaining singular LysM domain of Ecp6 binds chitin with

  • low micromolar affinity but can nevertheless still perturb chitin-triggered immunity.

Conceivably, the perturbation by this LysM domain is not established through chitin sequestration but possibly through interference with the host immune receptor complex.

Mutated Genes in Schizophrenia Map to Brain Networks
From www.nih.gov –  Sep 3, 2013

Previous studies have shown that many people with schizophrenia have de novo, or new, genetic mutations. These misspellings in a gene’s DNA sequence

  • occur spontaneously and so aren’t shared by their close relatives.

Dr. Mary-Claire King of the University of Washington in Seattle and colleagues set out to

  • identify spontaneous genetic mutations in people with schizophrenia and
  • to assess where and when in the brain these misspelled genes are turned on, or expressed.

The study was funded in part by NIH’s National Institute of Mental Health (NIMH). The results were published in the August 1, 2013, issue of Cell.

The researchers sequenced the exomes (protein-coding DNA regions) of 399 people—105 with schizophrenia plus their unaffected parents and siblings. Gene variations
that were found in a person with schizophrenia but not in either parent were considered spontaneous.

The likelihood of having a spontaneous mutation was associated with

  • the age of the father in both affected and unaffected siblings.

Significantly more mutations were found in people

  • whose fathers were 33-45 years at the time of conception compared to 19-28 years.

Among people with schizophrenia, the scientists identified

  • 54 genes with spontaneous mutations
  • predicted to cause damage to the function of the protein they encode.

The researchers used newly available database resources that show

  • where in the brain and when during development genes are expressed.

The genes form an interconnected expression network with many more connections than

  • that of the genes with spontaneous damaging mutations in unaffected siblings.

The spontaneously mutated genes in people with schizophrenia

  • were expressed in the prefrontal cortex, a region in the front of the brain.

The genes are known to be involved in important pathways in brain development. Fifty of these genes were active

  • mainly during the period of fetal development.

“Processes critical for the brain’s development can be revealed by the mutations that disrupt them,” King says. “Mutations can lead to loss of integrity of a whole pathway,
not just of a single gene.”

These findings support the concept that schizophrenia may result, in part, from

  • disruptions in development in the prefrontal cortex during fetal development.

James E. Darnell’s “Reflections”

A brief history of the discovery of RNA and its role in transcription — peppered with career advice
By Joseph P. Tiano

James Darnell begins his Journal of Biological Chemistry “Reflections” article by saying, “graduate students these days

  • have to swim in a sea virtually turgid with the daily avalanche of new information and
  • may be momentarily too overwhelmed to listen to the aging.

I firmly believe how we learned what we know can provide useful guidance for how and what a newcomer will learn.” Considering his remarkable discoveries in

  • RNA processing and eukaryotic transcriptional regulation

spanning 60 years of research, Darnell’s advice should be cherished. In his second year at medical school at Washington University School of Medicine in St. Louis, while
studying streptococcal disease in Robert J. Glaser’s laboratory, Darnell realized he “loved doing the experiments” and had his first “career advancement event.”
He and technician Barbara Pesch discovered that in vivo penicillin treatment killed streptococci only in the exponential growth phase and not in the stationary phase. These
results were published in the Journal of Clinical Investigation and earned Darnell an interview with Harry Eagle at the National Institutes of Health.

Darnell arrived at the NIH in 1956, shortly after Eagle  shifted his research interest to developing his minimal essential cell culture medium, still used. Eagle, then studying cell metabolism, suggested that Darnell take up a side project on poliovirus replication in mammalian cells in collaboration with Robert I. DeMars. DeMars’ Ph.D.
adviser was also James  Watson’s mentor, so Darnell met Watson, who invited him to give a talk at Harvard University, which led to an assistant professor position
at the MIT under Salvador Luria. A take-home message is to embrace side projects, because you never know where they may lead: this project helped to shape
his career.

Darnell arrived in Boston in 1961. Following the discovery of DNA’s structure in 1953, the world of molecular biology was turning to RNA in an effort to understand how
proteins are made. Darnell’s background in virology (it was discovered in 1960 that viruses used RNA to replicate) was ideal for the aim of his first independent lab:
exploring mRNA in animal cells grown in culture. While at MIT, he developed a new technique for purifying RNA along with making other observations

  • suggesting that nonribosomal cytoplasmic RNA may be involved in protein synthesis.

When Darnell moved to Albert Einstein College of Medicine for full professorship in 1964,  it was hypothesized that heterogenous nuclear RNA was a precursor to mRNA.
At Einstein, Darnell discovered RNA processing of pre-tRNAs and demonstrated for the first time

  • that a specific nuclear RNA could represent a possible specific mRNA precursor.

In 1967 Darnell took a position at Columbia University, and it was there that he discovered (simultaneously with two other labs) that

  • mRNA contained a polyadenosine tail.

The three groups all published their results together in the Proceedings of the National Academy of Sciences in 1971. Shortly afterward, Darnell made his final career move
four short miles down the street to Rockefeller University in 1974.

Over the next 35-plus years at Rockefeller, Darnell never strayed from his original research question: How do mammalian cells make and control the making of different
mRNAs? His work was instrumental in the collaborative discovery of

  • splicing in the late 1970s and
  • in identifying and cloning many transcriptional activators.

Perhaps his greatest contribution during this time, with the help of Ernest Knight, was

  • the discovery and cloning of the signal transducers and activators of transcription (STAT) proteins.

And with George Stark, Andy Wilks and John Krowlewski, he described

  • cytokine signaling via the JAK-STAT pathway.

Darnell closes his “Reflections” with perhaps his best advice: Do not get too wrapped up in your own work, because “we are all needed and we are all in this together.”

Darnell Reflections - James_Darnell

Darnell Reflections – James_Darnell

http://www.asbmb.org/assets/0/366/418/428/85528/85529/85530/8758cb87-84ff-42d6-8aea-96fda4031a1b.jpg

Recent findings on presenilins and signal peptide peptidase

By Dinu-Valantin Bălănescu

γ-secretase and SPP

γ-secretase and SPP

Fig. 1 from the minireview shows a schematic depiction of γ-secretase and SPP

http://www.asbmb.org/assets/0/366/418/428/85528/85529/85530/c2de032a-daad-41e5-ba19-87a17bd26362.png

GxGD proteases are a family of intramembranous enzymes capable of hydrolyzing

  • the transmembrane domain of some integral membrane proteins.

The GxGD family is one of the three families of

  • intramembrane-cleaving proteases discovered so far (along with the rhomboid and site-2 protease) and
  • includes the γ-secretase and the signal peptide peptidase.

Although only recently discovered, a number of functions in human pathology and in numerous other biological processes

  • have been attributed to γ-secretase and SPP.

Taisuke Tomita and Takeshi Iwatsubo of the University of Tokyo highlighted the latest findings on the structure and function of γ-secretase and SPP
in a recent minireview in The Journal of Biological Chemistry.

  • γ-secretase is involved in cleaving the amyloid-β precursor protein, thus producing amyloid-β peptide,

the main component of senile plaques in Alzheimer’s disease patients’ brains. The complete structure of mammalian γ-secretase is not yet known; however,
Tomita and Iwatsubo note that biochemical analyses have revealed it to be a multisubunit protein complex.

  • Its catalytic subunit is presenilin, an aspartyl protease.

In vitro and in vivo functional and chemical biology analyses have revealed that

  • presenilin is a modulator and mandatory component of the γ-secretase–mediated cleavage of APP.

Genetic studies have identified three other components required for γ-secretase activity:

  1. nicastrin,
  2. anterior pharynx defective 1 and
  3. presenilin enhancer 2.

By coexpression of presenilin with the other three components, the authors managed to

  • reconstitute γ-secretase activity.

Tomita and Iwatsubo determined using the substituted cysteine accessibility method and by topological analyses, that

  • the catalytic aspartates are located at the center of the nine transmembrane domains of presenilin,
  • by revealing the exact location of the enzyme’s catalytic site.

The minireview also describes in detail the formerly enigmatic mechanism of γ-secretase mediated cleavage.

SPP, an enzyme that cleaves remnant signal peptides in the membrane

  • during the biogenesis of membrane proteins and
  • signal peptides from major histocompatibility complex type I,
  • also is involved in the maturation of proteins of the hepatitis C virus and GB virus B.

Bioinformatics methods have revealed in fruit flies and mammals four SPP-like proteins,

  • two of which are involved in immunological processes.

By using γ-secretase inhibitors and modulators, it has been confirmed

  • that SPP shares a similar GxGD active site and proteolytic activity with γ-secretase.

Upon purification of the human SPP protein with the baculovirus/Sf9 cell system,

  • single-particle analysis revealed further structural and functional details.

HLA targeting efficiency correlates with human T-cell response magnitude and with mortality from influenza A infection

From www.pnas.org –  Sep 3, 2013 4:24 PM

Experimental and computational evidence suggests that

  • HLAs preferentially bind conserved regions of viral proteins, a concept we term “targeting efficiency,” and that
  • this preference may provide improved clearance of infection in several viral systems.

To test this hypothesis, T-cell responses to A/H1N1 (2009) were measured from peripheral blood mononuclear cells obtained from a household cohort study
performed during the 2009–2010 influenza season. We found that HLA targeting efficiency scores significantly correlated with

  • IFN-γ enzyme-linked immunosorbent spot responses (P = 0.042, multiple regression).

A further population-based analysis found that the carriage frequencies of the alleles with the lowest targeting efficiencies, A*24,

  • were associated with pH1N1 mortality (r = 0.37, P = 0.031) and
  • are common in certain indigenous populations in which increased pH1N1 morbidity has been reported.

HLA efficiency scores and HLA use are associated with CD8 T-cell magnitude in humans after influenza infection.
The computational tools used in this study may be useful predictors of potential morbidity and

  • identify immunologic differences of new variant influenza strains
  • more accurately than evolutionary sequence comparisons.

Population-based studies of the relative frequency of these alleles in severe vs. mild influenza cases

  • might advance clinical practices for severe H1N1 infections among genetically susceptible populations.

Metabolomics in drug target discovery

J D Rabinowitz et al.

Lewis-Sigler Institute for Integrative Genomics, Princeton University, Princeton, NJ.
Cold Spring Harbor Symposia on Quantitative Biology 11/2011; 76:235-46.
http://dx.doi.org:/10.1101/sqb.2011.76.010694 

Most diseases result in metabolic changes. In many cases, these changes play a causative role in disease progression. By identifying pathological metabolic changes,

  • metabolomics can point to potential new sites for therapeutic intervention.

Particularly promising enzymatic targets are those that

  • carry increased flux in the disease state.

Definitive assessment of flux requires the use of isotope tracers. Here we present techniques for

  • finding new drug targets using metabolomics and isotope tracers.

The utility of these methods is exemplified in the study of three different viral pathogens. For influenza A and herpes simplex virus,

  • metabolomic analysis of infected versus mock-infected cells revealed
  • dramatic concentration changes around the current antiviral target enzymes.

Similar analysis of human-cytomegalovirus-infected cells, however, found the greatest changes

  • in a region of metabolism unrelated to the current antiviral target.

Instead, it pointed to the tricarboxylic acid (TCA) cycle and

  • its efflux to feed fatty acid biosynthesis as a potential preferred target.

Isotope tracer studies revealed that cytomegalovirus greatly increases flux through

  • the key fatty acid metabolic enzyme acetyl-coenzyme A carboxylase.
  • Inhibition of this enzyme blocks human cytomegalovirus replication.

Examples where metabolomics has contributed to identification of anticancer drug targets are also discussed. Eventual proof of the value of

  • metabolomics as a drug target discovery strategy will be
  • successful clinical development of therapeutics hitting these new targets.

 Related References

Use of metabolic pathway flux information in targeted cancer drug design. Drug Discovery Today: Therapeutic Strategies 1:435-443, 2004.

Detection of resistance to imatinib by metabolic profiling: clinical and drug development implications. Am J Pharmacogenomics. 2005;5(5):293-302. Review. PMID: 16196499

Medicinal chemistry, metabolic profiling and drug target discovery: a role for metabolic profiling in reverse pharmacology and chemical genetics.
Mini Rev Med Chem.  2005 Jan;5(1):13-20. Review. PMID: 15638788 [PubMed – indexed for MEDLINE] Related citations

Development of Tracer-Based Metabolomics and its Implications for the Pharmaceutical Industry. Int J Pharm Med 2007; 21 (3): 217-224.

Use of metabolic pathway flux information in anticancer drug design. Ernst Schering Found Symp Proc. 2007;(4):189-203. Review. PMID: 18811058

Pharmacological targeting of glucagon and glucagon-like peptide 1 receptors has different effects on energy state and glucose homeostasis in diet-induced obese mice. J Pharmacol Exp Ther. 2011 Jul;338(1):70-81. http://dx.doi.org:/10.1124/jpet.111.179986. PMID: 21471191

Single valproic acid treatment inhibits glycogen and RNA ribose turnover while disrupting glucose-derived cholesterol synthesis in liver as revealed by the
[U-C(6)]-d-glucose tracer in mice. Metabolomics. 2009 Sep;5(3):336-345. PMID: 19718458

Metabolic Pathways as Targets for Drug Screening, Metabolomics, Dr Ute Roessner (Ed.), ISBN: 978-953-51-0046-1, InTech, Available from: http://www.intechopen.com/books/metabolomics/metabolic-pathways-as-targets-for-drug-screening

Iron regulates glucose homeostasis in liver and muscle via AMP-activated protein kinase in mice. FASEB J. 2013 Jul;27(7):2845-54.
http://dx.doi.org:/10.1096/fj.12-216929. PMID: 23515442

Metabolomics and systems pharmacology: why and how to model the human metabolic network for drug discovery

  • Douglas B. Kell, ,
  • Royston Goodacre

Drug Discov. Today 19 (2014), 171–182     http://dx.doi.org:/10.1016/j.drudis.2013.07.014

Highlights

  • We now have metabolic network models; the metabolome is represented by their nodes.
  • Metabolite levels are sensitive to changes in enzyme activities.
  • Drugs hitchhike on metabolite transporters to get into and out of cells.
  • The consensus network Recon2 represents the present state of the art, and has predictive power.
  • Constraint-based modelling relates network structure to metabolic fluxes.

Metabolism represents the ‘sharp end’ of systems biology, because changes in metabolite concentrations are

  • necessarily amplified relative to changes in the transcriptome, proteome and enzyme activities, which can be modulated by drugs.

To understand such behaviour, we therefore need (and increasingly have) reliable consensus (community) models of

  • the human metabolic network that include the important transporters.

Small molecule ‘drug’ transporters are in fact metabolite transporters, because

  • drugs bear structural similarities to metabolites known from the network reconstructions and
  • from measurements of the metabolome.

Recon2 represents the present state-of-the-art human metabolic network reconstruction; it can predict inter alia:

(i) the effects of inborn errors of metabolism;

(ii) which metabolites are exometabolites, and

(iii) how metabolism varies between tissues and cellular compartments.

However, even these qualitative network models are not yet complete. As our understanding improves

  • so do we recognise more clearly the need for a systems (poly)pharmacology.

Introduction – a systems biology approach to drug discovery

It is clearly not news that the productivity of the pharmaceutical industry has declined significantly during recent years

  • following an ‘inverse Moore’s Law’, Eroom’s Law, or
  • that many commentators, consider that the main cause of this is
  • because of an excessive focus on individual molecular target discovery rather than a more sensible strategy
  • based on a systems-level approach (Fig. 1).
drug discovery science

drug discovery science

Figure 1.

The change in drug discovery strategy from ‘classical’ function-first approaches (in which the assay of drug function was at the tissue or organism level),
with mechanistic studies potentially coming later, to more-recent target-based approaches where initial assays usually involve assessing the interactions
of drugs with specified (and often cloned, recombinant) proteins in vitro. In the latter cases, effects in vivo are assessed later, with concomitantly high levels of attrition.

Arguably the two chief hallmarks of the systems biology approach are:

(i) that we seek to make mathematical models of our systems iteratively or in parallel with well-designed ‘wet’ experiments, and
(ii) that we do not necessarily start with a hypothesis but measure as many things as possible (the ’omes) and

  • let the data tell us the hypothesis that best fits and describes them.

Although metabolism was once seen as something of a Cinderella subject,

  • there are fundamental reasons to do with the organisation of biochemical networks as
  • to why the metabol(om)ic level – now in fact seen as the ‘apogee’ of the ’omics trilogy –
  •  is indeed likely to be far more discriminating than are
  • changes in the transcriptome or proteome.

The next two subsections deal with these points and Fig. 2 summarises the paper in the form of a Mind Map.

metabolomics and systems pharmacology

metabolomics and systems pharmacology

http://ars.els-cdn.com/content/image/1-s2.0-S1359644613002481-gr2.jpg

Metabolic Disease Drug Discovery— “Hitting the Target” Is Easier Said Than Done

David E. Moller, et al.   http://dx.doi.org:/10.1016/j.cmet.2011.10.012

Despite the advent of new drug classes, the global epidemic of cardiometabolic disease has not abated. Continuing

  • unmet medical needs remain a major driver for new research.

Drug discovery approaches in this field have mirrored industry trends, leading to a recent

  • increase in the number of molecules entering development.

However, worrisome trends and newer hurdles are also apparent. The history of two newer drug classes—

  1. glucagon-like peptide-1 receptor agonists and
  2. dipeptidyl peptidase-4 inhibitors—

illustrates both progress and challenges. Future success requires that researchers learn from these experiences and

  • continue to explore and apply new technology platforms and research paradigms.

The global epidemic of obesity and diabetes continues to progress relentlessly. The International Diabetes Federation predicts an even greater diabetes burden (>430 million people afflicted) by 2030, which will disproportionately affect developing nations (International Diabetes Federation, 2011). Yet

  • existing drug classes for diabetes, obesity, and comorbid cardiovascular (CV) conditions have substantial limitations.

Currently available prescription drugs for treatment of hyperglycemia in patients with type 2 diabetes (Table 1) have notable shortcomings. In general,

  • their efficacy profiles fall short of achieving accepted treatment goals (American Diabetes Association, 2011).

Therefore, clinicians must often use combination therapy, adding additional agents over time. Ultimately many patients will need to use insulin—a therapeutic class first introduced in 1922. Most existing agents also have

  • issues around safety and tolerability as well as dosing convenience (which can impact patient compliance).

Pharmacometabolomics, also known as pharmacometabonomics, is a field which stems from metabolomics,

  • the quantification and analysis of metabolites produced by the body.

It refers to the direct measurement of metabolites in an individual’s bodily fluids, in order to

  • predict or evaluate the metabolism of pharmaceutical compounds, and
  • to better understand the pharmacokinetic profile of a drug.

Alternatively, pharmacometabolomics can be applied to measure metabolite levels

  • following the administration of a pharmaceutical compound, in order to
  • monitor the effects of the compound on certain metabolic pathways(pharmacodynamics).

This provides detailed mapping of drug effects on metabolism and

  • the pathways that are implicated in mechanism of variation of response to treatment.

In addition, the metabolic profile of an individual at baseline (metabotype) provides information about

  • how individuals respond to treatment and highlights heterogeneity within a disease state.

All three approaches require the quantification of metabolites found

  • in bodily fluids and tissue, such as blood or urine, and
  • can be used in the assessment of pharmaceutical treatment options for numerous disease states.
relationship between -OMICS

relationship between -OMICS

http://upload.wikimedia.org/wikipedia/commons/thumb/e/eb/OMICS.png/350px-OMICS.png

Pharmacometabolomics is thought to provide information that

  • complements that gained from other omics, namely genomics, transcriptomics, and proteomics.

Looking at the characteristics of an individual down through these different levels of detail, there is an

  • increasingly more accurate prediction of a person’s ability to respond to a pharmaceutical compound.
  1. the genome, made up of 25 000 genes, can indicate possible errors in drug metabolism;
  2. the transcriptome, made up of 85,000 transcripts, can provide information about which genes important in metabolism are being actively transcribed;
  3. and the proteome, >10,000,000 members, depicts which proteins are active in the body to carry out these functions.

Pharmacometabolomics complements the omics with

  • direct measurement of the products of all of these reactions, but with perhaps a relatively
  • smaller number of members: that was initially projected to be approximately 2200 metabolites,

but could be a larger number when gut derived metabolites and xenobiotics are added to the list. Overall, the goal of pharmacometabolomics is

  • to more closely predict or assess the response of an individual to a pharmaceutical compound,
  • permitting continued treatment with the right drug or dosage
  • depending on the variations in their metabolism and ability to respond to treatment.

Pharmacometabolomic analyses, through the use of a metabolomics approach,

  • can provide a comprehensive and detailed metabolic profile or “metabolic fingerprint” for an individual patient.

Such metabolic profiles can provide a complete overview of individual metabolite or pathway alterations,

  • providing a more realistic depiction of disease phenotypes.

This approach can then be applied to the prediction of response to a pharmaceutical compound

  • by patients with a particular metabolic profile.

Pharmacometabolomic analyses of drug response are

  • often coupled or followed up with pharmacogenetics studies.

Pharmacogenetics focuses on the identification of genetic variations (e.g. single-nucleotide polymorphisms)

  • within patients that may contribute to altered drug responses and overall outcome of a certain treatment.

The results of pharmacometabolomics analyses can act to “inform” or “direct”

  • pharmacogenetic analyses by correlating aberrant metabolite concentrations or metabolic pathways to potential alterations at the genetic level.

This concept has been established with two seminal publications from studies of antidepressants serotonin reuptake inhibitors

  • where metabolic signatures were able to define a pathway implicated in response to the antidepressant and
  • that lead to identification of genetic variants within a key gene
  • within the highlighted pathway as being implicated in variation in response.

These genetic variants were not identified through genetic analysis alone and hence

  • illustrated how metabolomics can guide and inform genetic data.

en.wikipedia.org/wiki/Pharmacometabolomics

Benznidazole Biotransformation and Multiple Targets in Trypanosoma cruzi Revealed by Metabolomics

Andrea Trochine, Darren J. Creek, Paula Faral-Tello, Michael P. Barrett, Carlos Robello
Published: May 22, 2014   http://dx.doi.org:/10.1371/journal.pntd.0002844

The first line treatment for Chagas disease, a neglected tropical disease caused by the protozoan parasite Trypanosoma cruzi,

  • involves administration of benznidazole (Bzn).

Bzn is a 2-nitroimidazole pro-drug which requires nitroreduction to become active. We used a

  • non-targeted MS-based metabolomics approach to study the metabolic response of T. cruzi to Bzn.

Parasites treated with Bzn were minimally altered compared to untreated trypanosomes, although the redox active thiols

  1. trypanothione,
  2. homotrypanothione and
  3. cysteine

were significantly diminished in abundance post-treatment. In addition, multiple Bzn-derived metabolites were detected after treatment.

These metabolites included reduction products, fragments and covalent adducts of reduced Bzn

  • linked to each of the major low molecular weight thiols:
  1. trypanothione,
  2. glutathione,
  3. g-glutamylcysteine,
  4. glutathionylspermidine,
  5. cysteine and
  6. ovothiol A.

Bzn products known to be generated in vitro by the unusual trypanosomal nitroreductase, TcNTRI,

  • were found within the parasites,
  • but low molecular weight adducts of glyoxal, a proposed toxic end-product of NTRI Bzn metabolism, were not detected.

Our data is indicative of a major role of the

  • thiol binding capacity of Bzn reduction products
  • in the mechanism of Bzn toxicity against T. cruzi.


Share this:

  • Share on X (Opens in new window) X
  • Share on LinkedIn (Opens in new window) LinkedIn
  • Share on Facebook (Opens in new window) Facebook
  • Print (Opens in new window) Print
  • Email a link to a friend (Opens in new window) Email

Like this:

Like Loading…

Read Full Post »

Introduction to Impairments in Pathological States: Endocrine Disorders, Stress Hypermetabolism and Cancer

Posted in Alzheimer's Disease, Biochemical pathways, Biological Networks, Biomarkers & Medical Diagnostics, Bone Disease and Musculoskeletal Disease, Ca2+ triggered activation, Calcium Signaling, Cancer and Current Therapeutics, CANCER BIOLOGY & Innovations in Cancer Therapy, Cell Biology, Cerebrovascular and Neurodegenerative Diseases, Chemical Biology and its relations to Metabolic Disease, Clinical Diagnostics, Curation, Diabetes Mellitus, Disease Biology, Endocrine Diseases, Enzyme Induction, Frontiers in Cardiology and Cardiovascular Disorders, Gene Regulation, Gene Regulation and Evolution, Genome Biology, Hematology, Human Immune System in Health and in Disease, Innovations, Lipid metabolism, Metabolism, Metabolomics, Neurohumoral Transmission, Nutrition, Personalized and Precision Medicine & Genomic Research, Pharmaceutical Discovery, PKC, Proteins, Proteomics, RNA Biology, Signaling & Cell Circuits, Warburg effect, tagged Cancer - General, disease targets, inflammatory diseases, integrative therapeutics, Metabolism on November 8, 2014| Leave a Comment »

Introduction to Impairments in Pathological States: Endocrine Disorders, Stress Hypermetabolism and Cancer

Author and Curator: Larry H. Bernstein, MD, FCAP 


This leads into a series of presentations and the metabolic imbalance central to findings of endocrine, metabolic, inflammatory, immune diseases and cancer.  All of this has been a result of discoveries based on the methods of study of genomiocs, proteomics, transcriptomics, and metabolomics that have preceded this.  In some cases there has been the use of knockout methods. The completion of the human genomic and other catalogues have been instrumental in the past few years.  In all cases there has been a thorough guidance by a biological concept of mechanism based on gene expression, metabolic disturbance, signaling pathways, and up- or down- regulation of metabolic circuits.  It is interesting to recall that a concept of metabolic circuits was not yet formulated at the time of the mid 20th century physiology, except perhaps with respect to the coagulation pathways, and to some extent, glycolysis, gluconeogenesis, the hexose monophosphate shunt, and mitochondrial respiration, which were linear strings of enzyme substrate reactions that intersected and that had flow restraints not then understood as to the complexity we now appreciate.  We did know the importance of cytochrome c, the adenine and pyridine nucleotides, and the energy balance.  Electron microscopy had opened the door to understanding the mechanism of contraction of skeletal muscle and myocardium, but it also opened the door to understanding kidney structure and function, explaining the “mesangium”.  The first cardiac maker was discovered by Arthur Karmen in the serum alanine and aspartate aminotransferases, with a consequent differentiation between hepatic and myocardial damage.  This was followed by lactic dehydrogenase and the H- and M-type isoenzymes in the 1960s, and in the next decade, by the MB-isoenzyme of creatine kinase.  Troponins T and then I would not be introduced until the mid 1980s, and they have become a gold standard for the diagnosis of myocardial infarction.

In the 1980s we also saw the development of antiplatelet therapy that rapidly advanced interventional cardiology.  But advances in surgical as well as medical intervention also proceeded as the understanding of the lipid metabolism was opened by the work of Brown and Goldstein, and UTSW Medical Campus, and major advances in treatment came at Baylor and UT Medical Center in Houston, and at the Cleveland Clinic.  The next important advance came with the discovery of nitric oxide synthase role in endothelium and oxidative stress.  The field of endocrinology saw advances as well for a solid period of 30 years in a comparable period for the adrenals, thyroid, and pituitary glands, and for the understanding of the male and female sex hormones, and discoveries in breast, ovarian, and prostate cancer.  There were cancer markers, such as, CA125 and CA15-3, and PSA.  This had more of an impact on timely surgical intervention, and if not that, post surgical followup.  Despite a long time into the war on cancer, introduced by President Lynden Johnson, the fundamental knowledge needed was not sufficient.  In the meantime, there were advances in the treatment of diabetes, with eventual introduction of the insulin pump for type I diabetes.  The problem of Type 2 DM increased in prevalence, reaching into the childhood age group, with ascendent obesity.  An epidemiological pattern of disease comorbidities was emergent.  Our population has aged out, and with it we are seeing an increase in dementias, especially Alzheimer’s disease.  But the knowledge of the brain has lagged far behind.

What follows is a series of chapters that address what has currently been advanced with repect to the alignment of our knowledge of the last decade and pharmacetical discovery.  Pharmaceuticals were suitable for bacterial infections until the 1990s, when we saw the rise of resistance to penicillins and Vancomycin, and we had issues with gram negative enterobacter, salmonella, and E. coli strains.  That has been and is a significant challenge.  The elucidation of the gut microbiome in recent years will help to relieve this problem.  The problem of the variety and different aggressive types of cancer has been another challenge.  The door has been opened to better diagnostic tools with respsct to imaging and targeted biomarkers for localization.  I am not dealing with imaging, which is not the subject here.

HLA targeting efficiency correlates with human T-cell response magnitude and with mortality from influenza A infection

From http://www.pnas.org –      Sep 3, 2013 4:24 PM

Experimental and computational evidence suggests that HLAs preferentially bind

  • conserved regions of viral proteins, a concept we term “targeting efficiency,” and
  • that this preference may provide improved clearance of infection in several viral systems.

To test this hypothesis, T-cell responses to A/H1N1 (2009)

  • were measured from peripheral blood mononuclear cells
  • obtained from a household cohort study performed during the 2009–2010 influenza season.

We found that HLA targeting efficiency scores

  • significantly correlated with IFN-γ
    enzyme-linked immunosorbent spot responses (P = 0.042, multiple regression).

A further population-based analysis found that

  • the carriage frequencies of the alleles with the lowest targeting efficiencies, A*24,
  • were associated with pH1N1 mortality (r = 0.37, P = 0.031) and
  • are common in certain indigenous populations in which
  • increased pH1N1 morbidity has been reported.

HLA efficiency scores and HLA use are associated with

  • CD8 T-cell magnitude in humans after influenza infection.

The computational tools used in this study may be useful predictors of

  • potential morbidity and identify immunologic differences of new variant influenza strains
  • more accurately than evolutionary sequence comparisons.

Population-based studies of the relative frequency of these alleles

  • in severe vs. mild influenza cases might advance clinical practices
  • for severe H1N1 infections among genetically susceptible populations.

A deeper look into cholesterol synthesis

By Swathi Parasuraman

The human body needs cholesterol to maintain membrane fluidity, and

  • it acts as a precursor molecule for several important biochemical pathways.

Its regulation requires strict control, as it can cause problems if it’s produced in excess. In 1964, Konrad Bloch received a Nobel Prize for his work elucidating the mechanisms of cholesterol synthesis. His work

  • eventually contributed to the discovery of statins, drugs used today to lower blood cholesterol levels.

The biosynthesis of cholesterol is a complex process with more than 20 steps. One of the first enzymes is

  • 3-hydroxy-3-methylglutaryl-CoA reductase, also known as HMGCR, the main target of statins.

As links between intermediates in cholesterol synthesis and various diseases are being discovered continually, more information about the regulatory role of the post-HMGCR pathway is needed.

In a recent minireview in The Journal of Biological Chemistry, Laura Sharpe and Andrew Brown of the University of New South Wales describe

  • multiple ways various enzymes other than HMGCR
  • are implicated in the modulation of cholesterol synthesis.

One such enzyme is squalene monooxygenase, which, like HMGCR, can be destroyed

  • by the proteasome when cholesterol levels are high.

The minireview also explains how pathway intermediates

  • can have functions distinct from those of cholesterol.

For example, intermediate 7-dehydrocholesterol usually is converted to cholesterol by the enzyme DHCR7

  • but is also a vitamin D precursor.

To synthesize the enzymes necessary to make cholesterol,

  • SREBPs, short for sterol regulatory element binding proteins, have special functions.

Along with transcriptional cofactors, they activate gene expression

  1. in response to low sterol levels and, conversely,
  2. are suppressed when there is enough cholesterol around.

Additionally, SREBPs control production of

  • nicotinamide adenine dinucleotide phosphate, or NADPH,
  • which is the reducing agent required to carry out the different steps in the pathway.

Lipid carrier proteins also can facilitate cholesterol synthesis. One example is SPF, or supernatant protein factor,

  1. which transfers substrate from an inactive to an active pool or
  2. from one enzyme site to another.

Furthermore, translocation of several cholesterogenic enzymes

  • from the endoplasmic reticulum to other cell compartments can occur under various conditions,
  • thereby regulating levels and sites of intracellular cholesterol accumulation.

Immunology in the gut mucosa:

20 Feb 2013 by Kausik Datta, posted in Immunology, Science (Nature)

The human gut can be the scene for devastating conditions such as inflammatory bowel disease,

  • which arises through an improperly controlled immune response.

The gut is often the body’s first point of contact with microbes; every mouthful of food is accompanied by a cargo of micro-organisms that go on to encounter the mucosa, the innermost layer of the gut. Most microbes are destroyed by the harsh acidic environment in the stomach, but a hardy few make it through to the intestines.

The intestinal surface is covered with finger-like protrusions called villi,

whose primary function is the absorption of nutrients.

These structures and the underlying tissues

  • host the body’s largest population of immune cells.

Scattered along the intestinal mucosa are

  • dome-like structures called Peyer’s Patches.

These are enriched in lymphoid tissue, making them key sites for

  • coordinating immune responses to pathogens,
  • whilst promoting tolerance to harmless microbes and food.

The villi contain a network of blood vessels to transport nutrients from food to the rest of the body. Lymphatics

  • from both the Peyer’s Patches and the villi
  • drain into the mesenteric lymph nodes.

Within the villi is a network of loose connective tissue called the lamina propria, and

  • at the base of the villi are the crypts which host the stem cells that replenish the epithelium.

The epithelium together with its overlying mucus forms

  • a barrier against microbial invasion.

A mix of immune cells including T- and B-lymphocytes, macrophages, and dendritic cells are

  • embedded within the matrix of the Peyer’s Patches, .

A key function of the Peyer’s Patch is the sampling of antigens present in the gut. The Peyer’s Patch has a thin mucous layer and specialized phagocytic cells, called M-cells, which

  • transport material across the epithelial barrier via a process called transcytosis.

Dendritic cells extend dendrites between epithelial cells to sample antigens that are then

  • broken down and used for presenting to lymphocytes.

Sampling antigens in this way typically results in so-called tolerogenic activation, where

  • the immune system initiates an anti-inflammatory response.

With their cargo of antigens, these Dendritic Cells then

  • traffic to the T-cell zones of the Peyer’s Patch.

Upon encounter with specific T-cells, the Dendritic Cells

  • convert them into an immunomodulatory cell called regulatory T-cell or T-reg.

Defects in the function of these cells are associated with

  • inflammatory bowel disease in both animals and humans.

These T-regs migrate to lamina propria of the villi via the lymphatics. Here, the T-regs

  • secrete a molecule called Interleukin (IL)-10,
  • which exerts a suppressive action on immune cells within the lamina propria
  • and upon the epithelial layer itself.

IL10 is, therefore, critical in maintaining immune quiescence

  • and preventing unnecessary inflammation.

However, a breakdown in this process of immune homeostasis results in gut pathology and

  • when this occurs over a prolonged period and in an uncontrolled manner,
  • it can lead to inflammatory bowel disease.

Chemical, mechanical or pathogen-triggered barrier disruption

  • coupled with particular genetic susceptibilities may all combine to set off inflammation.

Epithelium coming into contact with bacteria

  • is activated, leading to bacterial influx.

Alarm molecules released by the epithelium

  • activates immune cells, and T-regs in the vicinity
  • scale down their IL10 secretion to enable an immune response to proceed.

Dendritic cells are also activated by this environment, and

  • start to release key inflammatory molecules,
  • such as IL6, IL12, and IL23.

Effector T-cells also appear on the scene and

  • these coordinate an escalation of the immune response
  • by secreting their own inflammatory molecules,
  • Tumor Necrosis Factor (TNF)-α, Interferon (IFN)-γ and IL17.

Soon after the effector T-cells are arrived, a voracious phagocyte called a neutrophil is recruited. Neutrophils are critical for the clearance of the bacteria. One weapon in the neutrophil armory is

  • the ability to undergo self-destruction.

This leaves behind a jumble of DNA saturated with enzymes, called the Neutrophil Extracellular Trap.

Although this can effectively destroy the bacterial invaders

  • and plug any breaches in the epithelial wall,
  • it also causes collateral damage to tissues.

Slowly the tide begins to turn and the bacterial invasion is repulsed. Any remaining neutrophils die off,

  • and are cleared by macrophages.

Epithelial integrity is restored by replacement of damaged cells with new ones from the intestinal crypts. Finally T-regs are recruited once again to calm the immune response.

Targeting the molecules involved in gut pathology is leading to

  • effective therapies for inflammatory bowel disease.

Notes:

T- and B-lymphocytes, Macrophages, and Dendritic Cells: These are all important immune effector cells. Macrophages and Dendritic cells are primary defence cells that can eat up (‘phagocytosis’) microbes and destroy them; they also can present parts of these microbes to lymphocytes. T-lymphocytes or T-cells help B-lymphocytes or B-cells recognize the antigen and form antibodies against it. Other types of T-cells can themselves kill microbes. All these cells also secrete various chemical substances, called cytokines and chemokines, which act as molecular messengers in recruiting various immune cells, coordinating and fine-tuning the immune response. Some of these cytokines are called Interleukins, shortened to IL.

Anti-inflammatory response: A type of immune response in which molecular messengers are used to scale down heavy-handed immune cell activity and switch off processes that recruit immune cells. This helps the body recognize and selectively tolerate beneficial substances such as commensalic microbes that live in the gut.

Neutrophils: These are highly versatile immune effector cells. Usually, they are one of the first cells recruited to the site of infection or tissue damage via message spread by molecular messengers. Neutrophils can themselves elaborate cytokines and chemokines, and have the ability to directly kill microbes.

Oxazoloisoindolinones with in vitro antitumor activity selectively activate a p53-pathway through potential inhibition of the p53-MDM2 interaction.

J Soares, et al. Eur J Pharm Sci 10/2014; http://dx.doi.org:/10.1016/j.ejps.2014.10.006

An appealing target for anticancer treatment is

  • the p53 tumor suppressor protein.

This protein is inactivated in half of human tumors

  • due to endogenous negative regulators such as MDM2.

Therefore, restoring the p53 activity through

  • the inhibition of its interaction with MDM2
  • is considered a valuable therapeutic strategy
  • against cancers with a wild-type p53 status.

We report the synthesis of nine enantiopure phenylalaninol-derived oxazolopyrrolidone lactams

  • and the evaluation of their biological effects as p53-MDM2 interaction inhibitors.

Using a yeast-based screening assay, two oxazoloisoindolinones,

  • were identified as potential p53-MDM2 inhibitors.

The molecular mechanism of oxazoloisoindolinone 3a validated

  • in human colon adenocarcinoma HCT116 cells with wild-type p53 (HCT116 p53(+/+)) and
  • in its isogenic derivative without p53 (HCT116 p53(-/-)).

we demonstrated that oxazoloisoindolinone 3a exhibited

  • a p53-dependent in vitro antitumor activity through
  • induction of G0/G1-phase cell cycle arrest and apoptosis.

The selective activation of a p53-apoptotic pathway by oxazoloisoindolinone 3a was further supported

  • by the occurrence of PARP cleavage only in p53-expressing HCT116 cells.

Oxazoloisoindolinone 3a led

  • to p53 protein stabilization
  • to the up-regulation of p53 transcriptional activity &
  • increased expression levels of several p53 target genes,
  • as p21, MDM2, BAX and PUMA,
  • in p53(+/+) but not in p53(-/-) HCT116 cells.

the ability of oxazoloisoindolinone 3a to block the p53-MDM2 interaction in HCT116 p53(+/+) cells was confirmed by co-immunoprecipitation.

molecular docking analysis of the interactions

  • between the compounds and MDM2 revealed that
  • oxazoloisoindolinone 3a binds to MDM2.

this work adds the oxazoloisoindolinone scaffold to the activators of a wild-type p53-pathway with promising antitumor activity.

it may open the way to the development of

  • a new class of p53-MDM2 interaction inhibitors.

TrypanoCyc: a community-led biochemical pathways database for Trypanosoma brucei.

Sanu Shameer, et al. Nucleic Acids Research10/2014;
http://dx.doi.org/10.1093/nar/gku944

The metabolic network of a cell represents the catabolic and anabolic reactions that interconvert small molecules (metabolites) through the activity of enzymes, transporters and non-catalyzed chemical reactions. Our understanding of individual metabolic networks is increasing as we learn more about the enzymes that are active in particular cells under particular conditions and as technologies advance to allow detailed measurements of the cellular metabolome.

Metabolic network databases are important in allowing us to

  • contextualise data sets emerging from transcriptomic, proteomic and metabolomic experiments.

Here we present a dynamic database, TrypanoCyc (http://www.metexplore.fr/trypanocyc/), which describes

  • the generic and condition-specific metabolic network of Trypanosoma brucei, a parasitic protozoan
  • responsible for human and animal African trypanosomiasis.

In addition to enabling navigation through the BioCyc-based TrypanoCyc interface, we have implemented a network

  • representation of the information through MetExplore,

yielding a novel environment in which to visualise the metabolism of this important parasite.

Share this:

  • Share on X (Opens in new window) X
  • Share on LinkedIn (Opens in new window) LinkedIn
  • Share on Facebook (Opens in new window) Facebook
  • Print (Opens in new window) Print
  • Email a link to a friend (Opens in new window) Email

Like this:

Like Loading…

Read Full Post »

Summary to Metabolomics

Posted in Academic Publishing, Advanced Drug Manufacturing Technology, Anaerobic Glycolysis, Best evidence, Bio Instrumentation in Experimental Life Sciences Research, Biochemical pathways, Biological Networks, Biomarkers & Medical Diagnostics, Biomedical Measurement Science, Bone Disease and Musculoskeletal Disease, Ca2+ triggered activation, Cachexia, Calcium Signaling, Calmodulin Kinase and Contraction, Cancer and Current Therapeutics, Cardiomyopathy, Cardiovascular Research, Cell Biology, Cerebrovascular and Neurodegenerative Diseases, Chemical Biology and its relations to Metabolic Disease, Clinical Diagnostics, Computational Biology/Systems and Bioinformatics, Curation, Cytoskeleton, Developmental biology, Diabetes Mellitus, Discovery process, Disease Biology, Endocrine Diseases, Enzyme Induction, Enzymes and isoenzymes, Experimental validation, Explanatory, Frontiers in Cardiology and Cardiovascular Disorders, Gene Regulation, Gene Regulation and Evolution, Genetics & Pharmaceutical, Genome Biology, Genomic Expression, Hematology, Hematopoiesis, Historical relevance, Human Immune System in Health and in Disease, Inferential analysis, Innovations, Inosine nucleotides, Ionic Transporters Na+, Lipid metabolism, Liver & Digestive Diseases Research, Mass automation of plasma proteins, Metabolism, Metabolomics, Methods, Methylation, Molecular Genetics & Pharmaceutical, Myocardial Metabolism, Na-K transport, Neurohumoral Transmission, Neurological Diseases, Nitric Oxide in Health and Disease, Nutrition, Nutrition and Phytochemistry, Oxidative phosphorylation, Personalized and Precision Medicine & Genomic Research, Pharmaceutical Analytics, Pharmaceutical Discovery, Pharmaceutical R&D Investment, Pharmacogenomics, Pharmacologic toxicities, Phosphorylation, PKC, Population Health Management, Proteomics, Pyridine nucleotides, Pyruvate Kinase, Regenerative Biology and Medicine, RNA Biology, S-nitrosylation, Signaling, Signaling & Cell Circuits, Small Molecules in Development of Therapeutic Drugs, Synaptic vesicle, Systemic Inflammatory Response Related Disorders, Technology Advance Assessment of, Theoretic convergence, Transcriptomics, Translational Research, Translational Science, Ubiquitinylation, Warburg effect, tagged cell regulation, Metabolomics, metabonomics, signaling pathways, Targeted therapy on November 8, 2014| Leave a Comment »

Summary to Metabolomics

Author and Curator: Larry H. Bernstein, MD, FCAP 

This concludes a long step-by-step journey into rediscovering biological processes from the genome as a framework to the remodeled and reconstituted cell through a number of posttranscription and posttranslation processes that modify the proteome and determine the metabolome.  The remodeling process continues over a lifetime. The process requires a balance between nutrient intake, energy utilization for work in the lean body mass, energy reserves, endocrine, paracrine and autocrine mechanisms, and autophagy.  It is true when we look at this in its full scope – What a creature is man?

http://masspec.scripps.edu/metabo_science/recommended_readings.php
 Recommended Readings and Historical Perspectives
  • Want EJ, Nordstrom A, Morita H, Siuzdak G
    From Exogenous to Endogenous: The Inevitable Imprint of Mass Spectrometry in Metabolomics
    Journal of Proteome Research, 2007, 6(2), 459-468
  • Dettmer K, Aronov PA, Hammock BD
    Mass spectrometry-based metabolomics
    Mass Spectrom Rev., 2007, 26(1), 51-78
  • Doerr A
    Annotating the unannotated.
    Nat Methods., 2007, 4(1), 8-9
  • Wishart DS, Tzur D, Knox C, Eisner R, Guo AC, Young N, Cheng D, Jewell K, Arndt D, Sawhney S, Fung C, Nikolai L, Lewis M, Coutouly MA, Forsythe I, Tang P, Shrivastava S, Jeroncic K, Stothard P, Amegbey G, Block D, Hau DD, Wagner J, Miniaci J, Clements M,
    HMDB: the Human Metabolome Database
    Nucleic Acids Res., 2007, 35, D521-6
  • Pietilainen KH, Sysi-Aho M, Rissanen A, Seppanen-Laakso T, Yki-Jarvinen H, Kaprio J, Oresic M
    Acquired Obesity Is Associated with Changes in the Serum Lipidomic Profile Independent of Genetic Effects – A Monozygotic Twin Study
    Plos One, 2007, 2(e218), 1-14
  • Smith CA, Want EJ, O’Maille G, Abagyan R, Siuzdak G
    XCMS: Processing mass spectrometry data for metabolite profiling using nonlinear peak alignment, matching and identification
    Analytical Chemistry, 2006, 78, 779-787
  • Stella C, Beckwith-Hall B, Cloarec O, Holmes E, Lindon JC, Powell J, van der Ouderaa F, Bingham S, Cross AJ, Nicholson JK
    Susceptibility of human metabolic phenotypes to dietary modulation
    J Proteome Res., 2006, 5(10), 2780-8
  • Teahan O, Gamble S, Holmes E, Waxman J, Nicholson JK, Bevan C, Keun HC
    Impact of analytical bias in metabonomic studies of human blood serum and plasma
    Anal Chem., 2006, 78(13), 4307-18
  • Mendes P
    Metabolomics and the challenges ahead
    Brief Bioinform., 2006, 7(2), 127
  • Rischer H, Oksman-Caldentey KM
    Unintended effects in genetically modified crops: revealed by metabolomics?
    Trends Biotechnol., 2006, 24(3), 102-4
  • Plumb RS, Johnson KA, Rainville P, Shockcor JP, Williams R, Granger JH, Wilson ID
    The detection of phenotypic differences in the metabolic plasma profile of three strains of Zucker rats at 20 weeks of age using ultra-performance liquid chromatography/orthogonal acceleration time-of-flight mass spectrometry
    Rapid Commun Mass Spectrom., 2006, 20(19), 2800-6
  • Smith CA, O’Maille G, Want EJ, Qin C, Trauger SA, Brandon TR, Custodio DE, Abagyan R, Siuzdak G
    METLIN: A Metabolite Mass Spectral Database
    Therapeutic Drug Monitoring, 2005, 27(6), 747-751
  • Brown SC, Kruppa G, Dasseux JL
    Metabolomics applications of FT-ICR mass spectrometry
    Mass Spectrom Rev., 2005, 24(2), 223-31
  • Catchpole GS, Beckmann M, Enot DP, Mondhe M, Zywicki B, Taylor J, Hardy N, Smith A, King RD, Kell DB, Fiehn O, Draper J
    Hierarchical metabolomics demonstrates substantial compositional similarity between genetically modified and conventional potato crops
    Proc Natl Acad Sci U S A, 2005, 102(40), 14458-62
  • Gibney MJ, Walsh M, Brennan L, Roche HM, German B, van Ommen B
    Metabolomics in human nutrition: opportunities and challenges
    Am J Clin Nutr., 2005, 82(3), 497-503
  • Morris M, Watkins SM
    Focused metabolomic profiling in the drug development process: advances from lipid profiling
    Curr Opin Chem Biol., 2005, 9(4), 407-12
  • Ippolito JE, Xu J, Jain S, Moulder K, Mennerick S, Crowley JR, Townsend RR, Gordon JI
    An integrated functional genomics and metabolomics approach for defining poor prognosis in human neuroendocrine cancers
    Proc Natl Acad Sci., 2005, 102(28), 9901-6
  • Jonsson P, Gullberg J, Nordstrom A, Kusano M, Kowalczyk M, Sjostrom M, Moritz T.
    A strategy for identifying differences in large series of metabolomic samples analyzed by GC/MS
    Anal Chem., 2004, 76(6), 1738-45
  • Griffin JL
    Metabolic profiles to define the genome: can we hear the phenotypes?
    Philos Trans R Soc Lond B Biol Sci., 2004, 359(1446), 857-71
  • German JB, Bauman DE, Burrin DG, Failla ML, Freake HC, King JC, Klein S, Milner JA, Pelto GH, Rasmussen KM, Zeisel SH
    Metabolomics in the opening decade of the 21st century: building the roads to individualized health
    J Nutr., 2004, 134(10), 2729-32
  • Coen M, Ruepp SU, Lindon JC, Nicholson JK, Pognan F, Lenz EM, Wilson ID
    Integrated application of transcriptomics and metabonomics yields new insight into the toxicity due to paracetamol in the mouse
    J Pharm Biomed Anal., 2004, 35(1), 93-105
  • Hirai MY, Yano M, Goodenowe DB, Kanaya S, Kimura T, Awazuhara M, Arita M, Fujiwara T, Saito K
    Integration of transcriptomics and metabolomics for understanding of global responses to nutritional stresses in Arabidopsis thaliana
    Proc Natl Acad Sci, 2004, 101(27), 10205-10
  • Mendes P.
    Emerging bioinformatics for the metabolome
    Brief Bioinform., 2002, 3(2), 134-45
  • Fiehn O
    Metabolomics–the link between genotypes and phenotypes
    Plant Mol Biol., 2002, 48(1-2), 155-71
  • Watkins SM, Reifsnyder PR, Pan HJ, German JB, Leiter EH
    Lipid metabolome-wide effects of the PPARgamma agonist rosiglitazone
    J Lipid Res., 2002, 43(11), 1809-17
  • Raamsdonk LM, Teusink B, Broadhurst D, Zhang N, Hayes A, Walsh MC, Berden JA, Brindle KM, Kell DB, Rowland JJ, Westerhoff HV, van Dam K, Oliver SG
    A functional genomics strategy that uses metabolome data to reveal the phenotype of silent mutations
    Nat Biotechnol., 2001, 19(1), 45-50
  • Nicholson JK, Lindon JC, Holmes E
    Metabonomics’: understanding the metabolic responses of living systems to pathophysiological stimuli via multivariate statistical analysis of biological NMR spectroscopic data
    Xenobiotica, 1999, 29(11), 1181-9

Metabolomics is the scientific study of chemical processes involving metabolites. Specifically, metabolomics is the “systematic study of the unique chemical fingerprints that specific cellular processes leave behind”, the study of their small-molecule metabolite profiles.[1] The metabolome represents the collection of all metabolites in a biological cell, tissue, organ or organism, which are the end products of cellular processes.[2] mRNA gene expression data and proteomic analyses reveal the set of gene products being produced in the cell, data that represents one aspect of cellular function. Conversely, metabolic profiling can give an instantaneous snapshot of the physiology of that cell. One of the challenges of systems biology and functional genomics is to integrate proteomic, transcriptomic, and metabolomic information to provide a better understanding of cellular biology.

The term “metabolic profile” was introduced by Horning, et al. in 1971 after they demonstrated that gas chromatography-mass spectrometry (GC-MS) could be used to measure compounds present in human urine and tissue extracts. The Horning group, along with that of Linus Pauling and Arthur B. Robinson led the development of GC-MS methods to monitor the metabolites present in urine through the 1970s.

Concurrently, NMR spectroscopy, which was discovered in the 1940s, was also undergoing rapid advances. In 1974, Seeley et al. demonstrated the utility of using NMR to detect metabolites in unmodified biological samples.This first study on muscle highlighted the value of NMR in that it was determined that 90% of cellular ATP is complexed with magnesium. As sensitivity has improved with the evolution of higher magnetic field strengths and magic angle spinning, NMR continues to be a leading analytical tool to investigate metabolism. Efforts to utilize NMR for metabolomics have been influenced by the laboratory of Dr. Jeremy Nicholson at Birkbeck College, University of London and later at Imperial College London. In 1984, Nicholson showed 1H NMR spectroscopy could potentially be used to diagnose diabetes mellitus, and later pioneered the application of pattern recognition methods to NMR spectroscopic data.

In 2005, the first metabolomics web database, METLIN, for characterizing human metabolites was developed in the Siuzdak laboratory at The Scripps Research Institute and contained over 10,000 metabolites and tandem mass spectral data. As of September 2012, METLIN contains over 60,000 metabolites as well as the largest repository of tandem mass spectrometry data in metabolomics.

On 23 January 2007, the Human Metabolome Project, led by Dr. David Wishart of the University of Alberta, Canada, completed the first draft of the human metabolome, consisting of a database of approximately 2500 metabolites, 1200 drugs and 3500 food components. Similar projects have been underway in several plant species, most notably Medicago truncatula and Arabidopsis thaliana for several years.

As late as mid-2010, metabolomics was still considered an “emerging field”. Further, it was noted that further progress in the field depended in large part, through addressing otherwise “irresolvable technical challenges”, by technical evolution of mass spectrometry instrumentation.

Metabolome refers to the complete set of small-molecule metabolites (such as metabolic intermediates, hormones and other signaling molecules, and secondary metabolites) to be found within a biological sample, such as a single organism. The word was coined in analogy with transcriptomics and proteomics; like the transcriptome and the proteome, the metabolome is dynamic, changing from second to second. Although the metabolome can be defined readily enough, it is not currently possible to analyse the entire range of metabolites by a single analytical method. The first metabolite database(called METLIN) for searching m/z values from mass spectrometry data was developed by scientists at The Scripps Research Institute in 2005. In January 2007, scientists at the University of Alberta and the University of Calgary completed the first draft of the human metabolome. They catalogued approximately 2500 metabolites, 1200 drugs and 3500 food components that can be found in the human body, as reported in the literature. This information, available at the Human Metabolome Database (www.hmdb.ca) and based on analysis of information available in the current scientific literature, is far from complete.

Each type of cell and tissue has a unique metabolic ‘fingerprint’ that can elucidate organ or tissue-specific information, while the study of biofluids can give more generalized though less specialized information. Commonly used biofluids are urine and plasma, as they can be obtained non-invasively or relatively non-invasively, respectively. The ease of collection facilitates high temporal resolution, and because they are always at dynamic equilibrium with the body, they can describe the host as a whole.

Metabolites are the intermediates and products of metabolism. Within the context of metabolomics, a metabolite is usually defined as any molecule less than 1 kDa in size.
A primary metabolite is directly involved in the normal growth, development, and reproduction. A secondary metabolite is not directly involved in those processes.  By contrast, in human-based metabolomics, it is more common to describe metabolites as being either endogenous (produced by the host organism) or exogenous. Metabolites of foreign substances such as drugs are termed xenometabolites. The metabolome forms a large network of metabolic reactions, where outputs from one enzymatic chemical reaction are inputs to other chemical reactions.

Metabonomics is defined as “the quantitative measurement of the dynamic multiparametric metabolic response of living systems to pathophysiological stimuli or genetic modification”. The word origin is from the Greek μεταβολή meaning change and nomos meaning a rule set or set of laws. This approach was pioneered by Jeremy Nicholson at Imperial College London and has been used in toxicology, disease diagnosis and a number of other fields. Historically, the metabonomics approach was one of the first methods to apply the scope of systems biology to studies of metabolism.

There is a growing consensus that ‘metabolomics’ places a greater emphasis on metabolic profiling at a cellular or organ level and is primarily concerned with normal endogenous metabolism. ‘Metabonomics’ extends metabolic profiling to include information about perturbations of metabolism caused by environmental factors (including diet and toxins), disease processes, and the involvement of extragenomic influences, such as gut microflora. This is not a trivial difference; metabolomic studies should, by definition, exclude metabolic contributions from extragenomic sources, because these are external to the system being studied.

Toxicity assessment/toxicology. Metabolic profiling (especially of urine or blood plasma samples) detects the physiological changes caused by toxic insult of a chemical (or mixture of chemicals).

Functional genomics. Metabolomics can be an excellent tool for determining the phenotype caused by a genetic manipulation, such as gene deletion or insertion. Sometimes this can be a sufficient goal in itself—for instance, to detect any phenotypic changes in a genetically-modified plant intended for human or animal consumption. More exciting is the prospect of predicting the function of unknown genes by comparison with the metabolic perturbations caused by deletion/insertion of known genes.

Nutrigenomics is a generalised term which links genomics, transcriptomics, proteomics and metabolomics to human nutrition. In general a metabolome in a given body fluid is influenced by endogenous factors such as age, sex, body composition and genetics as well as underlying pathologies. The large bowel microflora are also a very significant potential confounder of metabolic profiles and could be classified as either an endogenous or exogenous factor. The main exogenous factors are diet and drugs. Diet can then be broken down to nutrients and non- nutrients.

http://en.wikipedia.org/wiki/Metabolomics

Jose Eduardo des Salles Roselino

The problem with genomics was it was set as explanation for everything. In fact, when something is genetic in nature the genomic reasoning works fine. However, this means whenever an inborn error is found and only in this case the genomic knowledge afterwards may indicate what is wrong and not the completely way to put biology upside down by reading everything in the DNA genetic as well as non-genetic problems.

Coordination of the transcriptome and metabolome by the circadian clock PNAS 2012

Coordination of the transcriptome and metabolome by the circadian clock PNAS 2012

analysis of metabolomic data and differential metabolic regulation for fetal lungs, and maternal blood plasma

conformational changes leading to substrate efflux.img

conformational changes leading to substrate efflux.img

The cellular response is defined by a network of chemogenomic response signatures.

The cellular response is defined by a network of chemogenomic response signatures.

Dynamic Construct of the –Omics

Dynamic Construct of the –Omics

 genome cartoon

genome cartoon

central dogma phenotype

central dogma phenotype

Share this:

  • Share on X (Opens in new window) X
  • Share on LinkedIn (Opens in new window) LinkedIn
  • Share on Facebook (Opens in new window) Facebook
  • Print (Opens in new window) Print
  • Email a link to a friend (Opens in new window) Email

Like this:

Like Loading…

Read Full Post »

Transcription Modulation

Posted in Biochemical pathways, Cancer and Current Therapeutics, Cell Biology, Chemical Biology and its relations to Metabolic Disease, Computational Biology/Systems and Bioinformatics, Curation, Disease Biology, Experimental validation, FDA Regulatory Affairs, Gene Regulation, Genetics & Pharmaceutical, Hematology, Metabolism, Metabolomics, Pharmaceutical Analytics, Pharmaceutical Discovery, Population Health Management, Proteomics, RNA Biology, Signaling, Signaling & Cell Circuits, Small Molecules in Development of Therapeutic Drugs, Transcriptomics, Translational Effectiveness, tagged downregulation, Quality Control, scientific validation, signaling maps, transcription, transcription factors, transcriptome, upregulation on November 5, 2014| Leave a Comment »

Transcription Modulation

Author and Curator: Larry H. Bernstein, MD, FCAP 


This portion of the transcription series deals with transcription factors and the effects of their binding on metabolism. This also has implications for pharmaceutical target identification.

The Functional Consequences of Variation in Transcription Factor Binding
DA. Cusanovich, B Pavlovic, JK. Pritchard*, Y Gilad*
1 Department of Human Genetics, 2 Howard Hughes Medical Institute, University of Chicago, Chicago, IL 3 Departments of Genetics and Biology and Howard Hughes Medical Institute, Stanford University, Stanford, CA.
PLoS Genet 2014;10(3):e1004226.  http://dx.doi.org:/10.1371/journal.pgen.1004226

One goal of human genetics is to understand how the information for precise and dynamic gene expression programs is encoded in the genome. The interactions of transcription factors (TFs) with DNA regulatory elements clearly

  • play an important role in determining gene expression outputs, yet
  • the regulatory logic underlying functional transcription factor binding is poorly understood.

An important question in genomics is to understand how a class of proteins called ‘‘transcription factors’’ controls the expression level of other genes in the genome in a cell type-specific manner – a process that is essential to human development. One major approach to this problem is to study where these transcription factors bind in the genome, but this does not tell us about the effect of that binding on gene expression levels and

  • it is generally accepted that much of the binding does not strongly influence gene expression.

To address this issue, we artificially reduced the concentration of 59 different transcription factors in the cell and then

  • examined which genes were impacted by the reduced transcription factor level.

Our results implicate some attributes

  • that might influence what binding is functional, but they also suggest that
  • a simple model of functional vs. non-functional binding may not suffice.

Many studies have focused on characterizing the genomic locations of TF binding, but

  • it is unclear whether TF binding at any specific locus has
  • functional consequences with respect to gene expression output.

We knocked down 59 TFs and chromatin modifiers in one HapMap lymphoblastoid cell line

  • to evaluate the context of functional TF binding.

We then identified genes whose expression was affected by the knockdowns

  • by intersecting the gene expression data with transcription factor binding data
    (based on ChIP-seq and DNase-seq)
  • within 10 kb of the transcription start sites of expressed genes.

This combination of data allowed us to infer functional TF binding.
Only a small subset of genes bound by a factor were

  • differentially expressed following the knockdown of that factor,
  • suggesting that most interactions between TF and chromatin
  • do not result in measurable changes in gene expression levels
  • of putative target genes.

We found that functional TF binding is enriched

  • in regulatory elements that harbor a large number of TF binding sites,
  • at sites with predicted higher binding affinity, and
  • at sites that are enriched in genomic regions annotated as ‘‘active enhancers.’’

We aim to be able to predict the expression pattern of a gene based on its regulatory
sequence alone. However, the regulatory code of the human genome is much more complicated than

  • the triplet code of protein coding sequences, and is highly context-specific,
  • depending on cell-type and other factors.

Moreover, regulatory regions are not necessarily organized into

  • discrete, easily identifiable regions of the genome and
  • may exert their influence on genes over large genomic distances

Genomic studies addressing questions of the regulatory logic of the human genome have largely taken one of two approaches.

  1. collecting transcription factor binding maps using techniques such as ChIPseq
    and DNase-seq
  2. mapping various quantitative trait loci (QTL), such as gene expression levels
    (eQTLs) [7], DNA methylation (meQTLs) [8] and chromatin accessibility (dsQTLs)

Cumulatively, binding map studies and QTL map studies have

  • led to many insights into the principles and mechanisms of gene regulation.

However, there are questions that neither mapping approach on its own is well equipped to address. One outstanding issue is

  • the fraction of factor binding in the genome that is ‘‘functional’’,
    which we define here to mean that
  • disturbing the protein-DNA interaction leads to a measurable
  • downstream effect on gene regulation.

Transcription factor knockdown could be used to address this problem, whereby

  • the RNA interference pathway is employed to greatly reduce
  • the expression level of a specific target gene by using small interfering RNAs (siRNAs).

The response to the knockdown can then be measured by collecting RNA after the knockdown and

  • measuring global changes in gene expression patterns
  • after specifically attenuating the expression level of a given factor.

Combining a TF knockdown approach with TF binding data can help us to

  • distinguish functional binding from non-functional binding

This approach has previously been applied to the study of human TFs, although for the most part studies have only focused on

  • the regulatory relationship of a single factor with its downstream targets.

The FANTOM consortium knocked down 52 different transcription factors in

  • the THP-1 cell line, an acute monocytic leukemia-derived cell line, and
  • used a subset of these to validate certain regulatory predictions based on binding motif enrichments.

We and others previously studied the regulatory architecture of gene expression in

  • the model system of HapMap lymphoblastoid cell lines (LCLs) using both
  • binding map strategies and QTL mapping strategies.

We now sought to use knockdown experiments targeting transcription factors in a HapMap LCL

  • to refine our understanding of the gene regulatory circuitry of the human genome.

Therefore, We integrated the results of the knockdown experiments with previous data on TF binding to

  • better characterize the regulatory targets of 59 different factors and
  • to learn when a disruption in transcription factor binding
  • is most likely to be associated with variation in the expression level of a nearby gene.

Gene expression levels following the knockdown were compared to

  • expression data collected from six samples that were transfected with negative control siRNA.

The expression data from all samples were normalized together using

  • quantile  normalization followed by batch correction using the RUV-2 method.

We then performed several quality control analyses to confirm

  1. that the quality of the data was high,
  2. that there were no outlier samples, and
  3. that the normalization methods reduced the influence of confounders

In order to identify genes that were expressed at a significantly different level

  • in the knockdown samples compared to the negative controls,
  • we used likelihood-ratio tests within the framework of a fixed effect linear model.

Following normalization and quality control of the arrays,

  • we identified genes that were differentially expressed between
  • the three knockdown replicates of each factor and the six controls.

Depending on the factor targeted, the knockdowns resulted in

  • between 39 and 3,892 differentially expressed genes at an FDR of 5%
    (Figure 1B; see Table S3 for a summary of the results).

The knockdown efficiency for the 59 factors ranged

  • from 50% to 90% (based on qPCR; Table S1).

The qPCR measurements of the knockdown level were significantly

  • correlated with estimates of the TF expression levels
  • based on the microarray data (P =0.001; Figure 1C).

Reassuringly, we did not observe a significant correlation between

  • the knockdown efficiency of a given factor and
  • the number of genes classified as differentially expressed foci.

Because we knocked down 59 different factors in this experiment

  • we were able to assess general patterns associated with the perturbation of transcription factors
  • beyond merely the number of affected target genes.

Globally, despite the range in the number of genes we identified as

  • differentially expressed in each knockdown,
  • the effect sizes of the differences in expression were relatively modest and
  • consistent in magnitude across all knockdowns.

The median effect size following the knockdown experiment for genes classified as

  • differentially expressed at an FDR of 5% in any knockdown was
  • a 9.2% difference in expression level between the controls and the knockdown (Figure 2),
  • while the median effect size for any individual knockdown experiment ranged between 8.1% and 11.0%.
    (this was true whether we estimated the knockdown effect based on qPCR (P = 0.10; Figure 1D) or microarray (P = 0.99; not shown) data.

Nor did we observe a correlation between

  • variance in qPCR-estimated knockdown efficiency (between replicates) and
  • the number of genes differentially expressed (P = 0.94; Figure 1E).

We noticed that the large variation in the number of differentially expressed genes

  • extended even to knockdowns of factors from the same gene family.

Figure 1. Differential expression analysis.
(a) Examples of differential expression analysis results for the genes HCST and IRF4. The top two panels are ‘MA plots’ of the mean Log2(expression level) between the knockdown arrays and the controls for each gene (x-axis) to the Log2(Fold-Change) between the knockdowns and controls (y-axis). Differentially expressed genes at an FDR of 5% are plotted in yellow (points 50% larger). The gene targeted by the siRNA is highlighted in red. The bottom two panels are ‘volcano plots’ of the Log2(Fold-Change) between the knockdowns and controls (x-axis) to the P-value for differential expression (y-axis). The dashed line marks the 5% FDR threshold. Differentially expressed genes at an FDR of 5% are plotted in yellow (points 50% larger). The red dot marks the gene targeted by the siRNA.
(b) Barplot of number of differentially expressed genes in each knockdown experiment.
(c) Comparison of the knockdown level measured by qPCR (RNA sample collected 48 hours posttransfection) and the knockdown level measured by microarray.
(d) Comparison of the level of knockdown of the transcription factor at 48 hrs (evaluated by qPCR; x-axis) and the number of genes differentially expressed in the knockdown experiment (y-axis).
(e) Comparison of the variance in knockdown efficiency between replicates for each transcription factor (evaluated by qPCR; x-axis) and the number of differentially expressed genes in the knockdown experiment (y-axis).

Differential expression analysis

Differential expression analysis

http://dx.doi.org:/10.1371/journal.pgen.1004226.g001

Figure 2. Effect sizes for differentially expressed genes.
Boxplots of absolute Log2(fold-change) between knockdown arrays and control arrays for all genes identified as differentially expressed in each experiment. Outliers are not plotted. The gray bar indicates the interquartile range across all genes differentially expressed in all knockdowns. Boxplots are ordered by the number of genes differentially expressed in each experiment. Outliers were not plotted.

Effect sizes for differentially expressed genes

Effect sizes for differentially expressed genes

http://dx.doi.org:/10.1371/journal.pgen.1004226.g002

Knocking down SREBF2 (1,286 genes differentially expressed), a key regulator of cholesterol homeostasis,

  • results in changes in the expression of genes that are
  • significantly enriched for cholesterol and sterol biosynthesis annotations.

While not all factors exhibited striking enrichments for relevant functional categories and pathways,

  • the overall picture is that perturbations of many of the factors
  • primarily affected pathways consistent with their known biology.

In order to assess functional TF binding, we next incorporated

  • binding maps together with the knockdown expression data.

We combined binding data based on DNase-seq footprints in 70 HapMap LCLs, reported by Degner et al. (Table S5)

  • and from ChIP-seq experiments in LCL GM12878, published by ENCODE.

We were thus able to obtain genome wide binding maps for a total of 131 factors that were either

  • directly targeted by an siRNA in our experiment (29 factors) or were
  • differentially expressed in one of the knockdown experiments.

We classified a gene as a bound target of a particular factor when

  • binding of that factor was inferred within 10kb of the transcription start site (TSS) of the target gene.

Using this approach, we found that the 131 TFs were bound

  • in proximity to a median of 1,922 genes per factor (range 11 to 7,053 target genes).

We considered binding of a factor to be functional if the target gene

  • was differentially expressed after perturbing the expression level the bound transcription factor.

We then asked about the concordance between

  • the transcription factor binding data and the knockdown expression data.
  •  the extent to which differences in gene expression levels following the knockdowns
  • might be predicted by binding of the transcription factors
  • within the putative regulatory regions of the responsive genes. and also
  • what proportion of putative target (bound) genes of a given TF were
  • differentially expressed following the knockdown of the factor.

Focusing only on the binding sites classified using the DNase-seq data
(which were assigned to a specific instance of the binding motif, unlike the ChIP data),

  • we examined sequence features that might distinguish functional binding.

In particular, whether binding at conserved sites was more likely to be functional  and

  • whether binding sites that better matched the known PWM for the factor were more likely to be functional.

We did not observe a significant shift in the conservation of functional binding sites (Wilcoxon rank sum P = 0.34),

  • but we did observe that binding around differentially expressed genes occurred at sites
  • that were significantly better matches to the canonical binding motif.

Figure 3. Intersecting binding data and expression data for each knockdown.
(a) Example Venn diagrams showing the overlap of binding and differential expression for the knockdowns of HCST and IRF4 (the same genes as in Figure 1).
(b) Boxplot summarizing the distribution of the fraction of all expressed genes that are bound by the targeted gene or downstream factors.
(c) Boxplot summarizing the distribution of the fraction of bound genes that are classified as differentially expressed, using an FDR of either 5% or 20%.

Intersecting binding data and expression data for each knockdown

Intersecting binding data and expression data for each knockdown

http://dx.doi.org:/10.1371/journal.pgen.1004226.g003

Considering bound targets determined from either the ChIP-seq or DNase-seq data, we observed that

  • differentially expressed genes were associated with both
  • a higher number of binding events for the relevant factors within 10 kb of the TSS (P,10216; Figure 4A)
  • as well as with a larger number of different binding factors
    (considering the siRNA-targeted factor and any TFs that were DE in the knockdown; P,10216; Figure 4B).

Figure 4. Degree of binding correlated with function. Boxplots comparing
(a) the number of sites bound, and
(b) the number of differentially expressed transcription factors binding events near functionally or non-functionally bound genes. We considered binding for siRNA-targeted factor and any factor differentially expressed in the knockdown.
(c) Focusing only on genes differentially expressed in common between each pairwise set of knockdowns we tested for enrichments of functional binding (y-axis). Pairwise comparisons between knockdown experiments were binned by the fraction of differentially expressed transcription factors in common between the two experiments. For these boxplots, outliers were not plotted.

Degree of binding correlated with function

Degree of binding correlated with function

http://dx.doi.org:/10.1371/journal.pgen.1004226.g004

We examined the distribution of binding about the TSS. Most factor binding was concentrated

  • near the TSS whether or not the genes were classified as differentially expressed (Figure 5A).
  • the distance from the TSS to the binding sites was significantly longer for differentially expressed genes (P,10216; Fig. 5B).

Figure 5. Distribution of functional binding about the TSS.
(a) A density plot of the distribution of bound sites within 10 kb of the TSS for both functional and non-functional genes. Inset is a zoom-in of the region +/21 kb from the TSS (b) Boxplots comparing the distances from the TSS to the binding sites for functionally bound genes and non-functionally bound genes. For the boxplots, 0.001 was added before log10 transforming the distances and outliers were not plotted.

Distribution of functional binding about the TSS

Distribution of functional binding about the TSS

http://dx.doi.doi:/10.1371/journal.pgen.1004226.g005

We investigated the distribution of factor binding across various chromatin states, as defined by Ernst et al. This dataset lists

  • regions of the genome that have been assigned to different activity states
  • based on ChIP-seq data for various histone modifications and CTCF binding.

For each knockdown, we separated binding events

  • by the genomic state in which they occurred and then
  • tested whether binding in that state was enriched around differentially expressed genes.

After correcting for multiple testing of genes that were differentially expressed.

  • 19 knockdowns showed significant enrichment for binding in ‘‘strong enhancers’’
  • four knockdowns had significant enrichments for ‘‘weak enhancers’’,
  • eight knockdowns showed significant depletion of binding in ‘‘active promoters’’ ,
  • six knockdowns had significant depletions for ‘‘transcription elongation’’,

Did the factors tended to have a consistent effect (either up- or down-regulation)

  • on the expression levels of genes they purportedly regulated?

All factors we tested are associated with both up- and down-regulation of downstream targets (Figure 6).

A slight majority of downstream target genes were expressed at higher levels

  • following the knockdown for 15 of the 29 factors for which we had binding information (Figure 6B).

The factor that is associated with the largest fraction (68.8%) of up-regulated target genes following the knockdown is EZH2,

  • the enzymatic component of the Polycomb group complex.

On the other end of the spectrum was JUND, a member of the AP-1 complex, for which

  • 66.7% of differentially expressed targets were down-regulated following the knockdown.

Figure 6. Magnitude and direction of differential expression after knockdown.
(a) Density plot of all Log2(fold-changes) between the knockdown arrays and controls for genes that are differentially expressed at 5% FDR in one of the knockdown experiments as well as bound by the targeted transcription factor.
(b) Plot of the fraction of differentially expressed putative direct targets that were up-regulated in each of the knockdown experiments.

Magnitude and direction of differential expression after knockdown

Magnitude and direction of differential expression after knockdown

http://dx.doi.org:/10.1371/journal.pgen.1004226.g006

We found no correlation between the number of paralogs and the fraction of bound targets that were differentially expressed. We also did not observe a significant correlation when we considered whether

  • the percent identity of the closest paralog might be predicative of
  • the fraction of bound genes that were differentially expressed following the knockdown (Figure S8).

While there is compelling evidence for our inferences, the current chromatin functional annotations

  • do not fully explain the regulatory effects of the knockdown experiments.

For example, the enrichments for binding in ‘‘strong enhancer’’ regions of the genome range from 7.2% to 50.1% (median = 19.2%),

  • much beyond what is expected by chance alone, but far from accounting for all functional binding.

In addition to considering

  • the distinguishing characteristics of functional binding, we also examined
  • the direction of effect that perturbing a transcription factor had on the expression level of its direct targets.

We specifically addressed whether

  • knocking down a particular factor tended to drive expression of its putatively direct (namely, bound) targets up or down,
  • which can be used to infer that the factor represses or activates the target, respectively.

Transcription factors have traditionally been thought of primarily as activators, and previous work from our group is consistent with that notion. Surprisingly, the most straightforward inference from the present study is that

  • many of the factors function as repressors at least as often as they function as activators.
  1. EZH2 had a negative regulatory relationship with the largest fraction of direct targets (68.8%),
    consistent with – the known role of EZH2 as the active member of the Polycomb group complex PC2
  2. while JUND seemed to have a positive regulatory relationship with the largest fraction of direct targets (66.7%),
    and with – the biochemical characterization of the AP-1 complex (of which JUND is a component) as a transactivator.

More generally, however, our results, combined with the previous work from our group and others make for a complicated view

  • of the role of transcription factors in gene regulation as
  • it seems difficult to reconcile the inference from previous work that
  • many transcription factors should primarily act as activators with the results presented here.

One somewhat complicated hypothesis, which nevertheless can resolve the apparent discrepancy, is that

  • the ‘‘repressive’’ effects we observe for known activators may be
  • at sites in which the activator is acting as a weak enhancer of transcription and
  • that reducing the cellular concentration of the factor
  • releases the regulatory region to binding by an alternative, stronger activator.

To more explicitly address the effect that our proximity-based definition of target genes might have on our analyses, we reanalyzed

  • the overlap between factor binding and differential expression following the knockdowns
  • using an independent, empirically determined set of target genes.

Thurman et al. used correlations in DNase hypersensitivity between

  • intergenic hypersensitive sites and promoter hypersensitive sites across diverse tissues
  • to assign intergenic regulatory regions to specific genes,
  • independently of proximity to a particular promoter.

We performed this alternative analysis in which we

  • assigned binding events to genes based on the classification of Thurman et al.

We then considered the overlap between binding and differential expression in this new data set. The results were largely

  • consistent with our proximity-based observations.

A median of 9.5% of genes that were bound by a factor were

  • also differentially expressed following the knockdown of that factor
    (compared to 11.1% when the assignment of binding sites to genes is based on proximity).

From the opposite perspective, a median of 28.0% of differentially expressed genes were bound by that factor
(compared to 32.3% for the proximity based definition). The results of this analysis are summarized in Table S7.

Our results should not be considered a comprehensive census of regulatory events in the human genome. Instead, we adopted a gene-centric approach,

  • focusing only on binding events near the genes for which we could measure expression
  • to learn some of the principles of functional transcription factor binding.

In light of our observations a reassessment of our estimates of binding may be warranted. In particular, because functional binding is skewed away from promoters (our system is apparently not well-suited to observe functional promoter binding, perhaps because of protection by large protein complexes),

  • a more conservative estimate of the fraction of binding that is indeed functional would not consider data within the promoter.

Importantly, excluding the putative promoter region from our analysis (i.e. only considering a window .1 kb from the TSS and ,10 kb from the TSS)

  • does not change our conclusions.

Considering this smaller window,

  • a median of 67.0% of expressed genes are still classified as bound by
  1. either the knocked down transcription factor or
  2. a downstream factors that is differentially expressed in each experiment,

yet a median of only 8.1% of the bound genes are

  • also differentially expressed after the knockdowns.

Much of what distinguishes functional binding (as we define it) has yet to be explained. We are unable to explain much of the differential expression observed in our experiments by the presence of least one relevant binding event. This may not be altogether surprising, as

  • we are only considering binding in a limited window around the transcription start site.

To address these issues, more factors should be perturbed to further evaluate the robustness of our results and to add insight. Together, such studies will help us develop a more sophisticated understanding of functional transcription factor binding in particular, the gene regulatory logic more generally.

Assessing quality and completeness of human transcriptional regulatory pathways on a genome-wide scale

E Shmelkov, Z Tang, I Aifantis, A Statnikov*
Biology Direct 2011; 6(15).  http://www.biology-direct.com/content/6/1/15

Recently the biological pathways have become a common and probably the most popular form of representing biochemical information for hypothesis generation and validation. These maps store wide knowledge of complex molecular interactions and regulations occurring in the living organism in a simple and obvious way, often using intuitive graphical notation. Two major types of biological pathways could be distinguished.

  1. Metabolic pathways incorporate complex networks of protein-based interactions and modifications, while
  2. signal transduction and transcriptional regulatory pathways are usually considered to provide information on mechanisms of transcription

While there are a lot of data collected on human metabolic processes,

  • the content of signal transduction and transcriptional regulatory pathways varies greatly in quality and completeness.

An indicative comparison of MYC transcriptional targets reported in ten different pathway databases reveals that these databases differ greatly from each other (Figure 1). Given that MYC is involved

  • in the transcriptional regulation of approximately 15% of all genes,

one cannot argue that the majority of pathway databases that contain

  • less than thirty putative transcriptional targets of MYC are even close to complete.

More importantly, to date there have been no prior genome-wide evaluation studies (that are based on genome-wide binding and gene expression assays) assessing pathway databases

Background: While pathway databases are becoming increasingly important in most types of biological and translational research, little is known about the quality and completeness of pathways stored in these databases. The present study conducts a comprehensive assessment of transcriptional regulatory pathways in humans for seven well-studied transcription factors:

  1. MYC,
  2. NOTCH1,
  3. BCL6,
  4. TP53,
  5. AR,
  6. STAT1,
  7. RELA.

The employed benchmarking methodology first involves integrating

  • genome-wide binding with functional gene expression data
  • to derive direct targets of transcription factors.

Then the lists of experimentally obtained direct targets

  • are compared with relevant lists of transcriptional targets from 10 commonly used pathway databases.

Results: The results of this study show that for the majority of pathway databases,

  • the overlap between experimentally obtained target genes and
  • targets reported in transcriptional regulatory pathway databases is
  • surprisingly small and often is not statistically significant.

The only exception is MetaCore pathway database which

  • yields statistically significant intersection with experimental results in 84% cases.

The lists of experimentally derived direct targets obtained in this study can be used

  • to reveal new biological insight in transcriptional regulation,  and we
  • suggest novel putative therapeutic targets in cancer.

Conclusions: Our study opens a debate on validity of using many popular pathway databases to obtain transcriptional regulatory targets. We conclude that the choice of pathway databases should be informed by

  • solid scientific evidence and rigorous empirical evaluation.

In the current study we perform

(1) an evaluation of ten commonly used pathway databases,

  • assessing the transcriptional regulatory pathways, considered in the current study as
  • the interactions of the type ‘transcription factor-transcriptional targets’.

This involves integration of human genome wide functional microarray or RNA-seq gene expression data with

  • protein-DNA binding data from ChIP-chip, ChIP-seq, or ChIP-PET platforms
  • to find direct transcriptional targets of the seven well known transcription factors:
  • MYC, NOTCH1, BCL6, TP53, AR, STAT1, and RELA.

The choice of transcription factors is based on their important role in oncogenesis and availability of binding and expression data in the public domain.

(2) the lists of experimentally derived direct targets are used to assess the quality and completeness of 84 transcriptional regulatory pathways from four publicly available (BioCarta, KEGG, WikiPathways and Cell Signaling Technology) and six commercial (MetaCore, Ingenuity Pathway Analysis, BKL TRANSPATH, BKL TRANSFAC, Pathway Studio and GeneSpring Pathways) pathway databases.

(3) We measure the overlap between pathways and experimentally obtained target genes and assess statistical significance of this overlap, and we demonstrate that experimentally derived lists of direct transcriptional targets

  • can be used to reveal new biological insight on transcriptional regulation.

We show this by analyzing common direct transcriptional targets of

  • MYC, NOTCH1 and RELA
  • that act in interconnected molecular pathways.

Detection of such genes is important as it could reveal novel targets of cancer therapy.

Figure 1 Number of genes in common between MYC transcriptional targets derived from ten different pathway databases. Cells are colored according to their values from white (low values) to red (high values). (not shown)

statistical methodology for comparison

statistical methodology for comparison

Figure 2 Illustration of statistical methodology for comparison between a gold-standard and a pathway database

Since we are seeking to compare gene sets from different studies/databases, it is essential to transform genes to standard identifiers. That is why we transformed all
gene sets to the HUGO Gene Nomenclature Committee approved gene symbols and names. In order to assess statistical significance of the overlap between the resulting gene sets, we used the hypergeometric test at 5% a-level with false discovery rate correction for multiple comparisons by the method of Benjamini and Yekutieli. The alternative hypothesis of this test is that two sets of genes (set A from pathway
database and set B from experiments) have greater number of genes in common than two randomly selected gene sets with the same number of genes as in sets A and B. For example, consider that for some transcription factor there are 300 direct targets in the pathway database #1 and 700 in the experimentally derived list (gold-standard), and their intersection is 16 genes (Figure 2a). If we select on random from a total of
20,000 genes two sets with 300 and 700 genes each, their overlap would be greater or equal to 16 genes in 6.34% times. Thus, this overlap will not be statistically significant at 5% a-level (p = 0.0634). On the other hand, consider that for the pathway database #2, there are 30 direct targets of that transcription factor, and their intersection with the 700-gene gold-standard is only 6 genes. Even though the size of this intersection is rather small, it is unlikely to randomly select 30 genes (out of 20,000) with an overlap greater or equal to 6 genes with a 700-gene gold-standard (p = 0.0005, see Figure 2a). This overlap is statistically significant at 5% a-level.

We also calculate an enrichment fold change ratio (EFC) for every intersection between a gold-standard and a pathway database. For a given pair of a gold-standard and a pathway database, EFC is equal to the observed number of genes in their intersection, divided by the expected size of intersection under the null hypothesis (plus machine epsilon, to avoid division by zero). Notice however that larger values of EFC may correspond to databases that are highly incomplete and contain only a few relations. For example, consider that for some transcription factor there are 300 direct targets in the pathway database #1 and 50 in the experimentally derived list (gold-standard), and their intersection is 30 genes (Figure 2b). If we select on random from a total of 20,000 genes two sets with 300 and 50 genes each, their expected overlap under the null hypothesis will be equal to 0.75. Thus, the EFC ratio will be equal to 40 (= 30/0.75). On the other hand, consider that for the pathway database #2, there are 2 direct
targets of that transcription factor, and their intersection with the 50-gene gold-standard is only 1 gene. Even though the expected overlap under the null hypothesis will be equal to 0.005 and EFC equal to 200 (5 times bigger than for the database #1), the size of this intersection with the gold-standard is 30 times less than for database #1 (Figure 2b).

Figure 3 Comparison between different pathway databases and experimentally derived gold-standards for all considered transcription factors. Value in a given cell is a number of overlapping genes between a gold-standard and a pathway-derived gene set. Cells
are colored according to their values from white (low values) to red (high values). Underlined values in red represent statistically significant intersections. (not shown)

Figure 4 Summary of the pathway databases assessment. Green cells represent statistically significant intersections between experimentally derived gold-standards and transcriptional regulatory pathways. White cells denote results that are not statistically significant. Numbers are the enrichment fold change ratios (EFC) calculated for each intersection. (not shown)

At the core of this study was creation of gold-standards of transcriptional regulation in humans that can be compared with target genes reported in transcriptional regulatory pathways. We focused on seven well known transcription factors and obtained gold-standards

  • by integrating genome-wide transcription factor-DNA binding data (from ChIP-chip, ChIP-seq, or ChIP-PET platforms)
  • with functional gene expression microarray and RNA-seq data.

The latter data allows to survey changes in the transcriptomes on a genome-wide scale

  • after the inhibition or over-expression of the transcription factor in question.

However, change in the expression of a particular gene could be caused either by the direct effect of the removal or introduction of a given transcription factor, as well as by an indirect effect, through the change in expression level of some other gene(s). It is essential

  • to integrate data from these two sources to
  • obtain an accurate list of gene targets that are directly regulated by a transcription factor.

It is worth noting that tested pathway databases typically do not give distinction between cell-lines, experimental conditions, and other details relevant to experimental systems in which data were obtained. These databases in a sense propose a ‘universal’ list of transcriptional targets. However, it is known that

  • transcriptional regulation in a cell is dynamic and works differently for different systems and stimuli.

This accentuates the major limitation of pathway databases and emphasizes

  • importance of deriving a specific list of transcriptional targets for the current experimental system.

In this study we followed the latter approach by developing gold-standards for specific cell characterized biological systems and experimental conditions.

The approach used here  for building gold-standards of direct mechanistic knowledge has several limitations. (see article).  Nevertheless, our results suggest that multiple transcription factors can co-operate and control both physiological differentiation and malignant transformation, as demonstrated utilizing combinatorial gene-profiling for

  • NOTCH1, MYC and RELA targets.

These studies might lead us to multi-pathway gene expression “signatures”

  • essential for the prediction of genes that could be targeted in cancer treatments.

In agreement with this hypothesis, several of the genes identified in our analysis have been suggested to be putative therapeutic targets in leukemia, with either preclinical or clinical trials underway (CDK4, CDK6, GSK3b, MYC, LCK, NFkB2, BCL2L1, NOTCH1).

Single-molecule tracking in live cells reveals distinct target-search strategies of transcription factors in the nucleus

I Izeddin†, V Récamier†‡, L Bosanac, II Cissé, L Boudarene, et al.
1Functional Imaging of Transcription, Institut de Biologie de l’Ecole Normale Supérieure (IBENS), Inserm, and CNRS UMR; 2Laboratoire Kastler Brossel, CNRS UMR, Departement de Physique et Institut de Biologie
de l’Ecole Normale Supérieure (IBENS), Paris, Fr; 3Transcription Imaging Consortium, Janelia Farm Research Campus, Howard Hughes Medical Institute, Ashburn, US; + more.
Biophysics and structural biology | Cell biology eLife 2014;3:e02230. http://dx.doi.org:/10.7554/eLife.02230

Transcription factors are

  • proteins that control the expression of genes in the nucleus, and
  • they do this by binding to other proteins or DNA.

First, however, these regulatory proteins need to overcome the challenge of

  • finding their targets in the nucleus, which is crowded with other proteins and DNA.

Much research to date has focused on measuring how fast proteins can diffuse and spread out throughout the nucleus. However these measurements only make sense if these proteins have access to the same space within the nucleus.

Now, Izeddin, Récamier et al. have developed a new technique to track

  • single protein molecules in the nucleus of mammalian cells.

A transcription factor called c-Myc and another protein called P-TEFb

  • were tracked and while they diffused at similar rates,
  • they ‘explored’ the space inside the nucleus in very different ways.

Izeddin, Récamier et al. found that c-Myc explores the nucleus in a so-called ‘non-compact’ manner: this means that it

  • can move almost everywhere inside the nucleus, and has an equal chance
  • of reaching any target regardless of its position in this space.

P-TEFb, on the other hand, searches

  • the nucleus in a ‘compact’ way.

This means that it is constrained to follow a specific path

  • through the nucleus and is therefore guided to its potential targets.

Izeddin, Récamier et al. explain that

  • the different ‘search strategies’ used by these two proteins
  • influence how long it takes them to find their targets and
  • how far they can travel in a given time.

These findings, together with information about

  • where and when different proteins interact in the nucleus,

will be essential to understand how the organization of the genome within the nucleus

  • can control the expression of genes.

The next challenge will now be to

  • uncover what determines a
  • protein’s search strategy in the nucleus, as well as
  • the potential ways that this strategy might be regulated.

Mueller et al., 2010; Normanno et al., 2012). These transient interactions are essential to ensure a fine regulation of binding site occupancy—by competition or by altering the TF concentration—but must also be persistent enough to enable the assembly of multicomponent complexes (Dundr, 2002; Darzacq and Singer, 2008; Gorski et al., 2008; Cisse et al., 2013).
In parallel to the experimental evidence of the fast diffusive motion of nuclear factors, our understanding of the intranuclear space has evolved from a homogeneous environment to an organelle where spatial arrangement among genes and regulatory sequences play an important role in transcriptional control (Heard and Bickmore, 2007). The nucleus of eukaryotes displays a hierarchy of organized structures (Gibcus and Dekker, 2013) and is often referred to as a
crowded environment.
How crowding influences transport properties of macromolecules and organelles in the cell is a fundamental question in quantitative molecular biology. While a restriction of the available space for diffusion can slow down transport processes, it can also channel molecules towards their targets increasing their chance to meet interacting partners. A widespread observation in quantitative cell biology is that the diffusion of molecules is anomalous, often attributed to crowding in the nucleoplasm, cytoplasm, or in the membranes of the cell (Höfling and Franosch, 2013). An open debate remains on how to determine whether diffusion is anomalous or normal (Malchus and Weiss, 2009; Saxton, 2012), and the mechanisms behind anomalous diffusion (Saxton, 2007). The answer to these questions bears important consequences for the understanding of the biochemical reactions of the cell.
The problem of diffusing molecules in non-homogenous media has been investigated in different fields. Following the seminal work of de Gennes (1982a), (1982b) in polymer physics, the study of diffusivity of particles and their reactivity has been generalized to random or disordered media (Kopelman, 1986; Lindenberg et al., 1991). These works have set a framework to interpret the mobility of macromolecular complexes in the cell, and recently in terms of kinetics of biochemical reactions (Condamin et al., 2007). Experimental evidence has also been found, showing the influence
of the glass-like properties of the bacterial cytoplasm in the molecular dynamics of intracellular processes (Parry et al., 2014). These studies demonstrate that the geometry of the medium in which diffusion takes place has important repercussions for the search kinetics of molecules. The notion of compact and non-compact exploration was introduced by de Gennes (1982a) in the context of dense polymers and describes two fundamental types of diffusive behavior. While a non-compact explorer leaves a significant number of available sites unvisited, a compact explorer performs a redundant
exploration of the space. In chemistry, the influence of compactness is well established to describe dimensional effects on reaction rates (Kopelman, 1986).
In this study, we aim to elucidate the existence of different types of mobility of TFs in the eukaryotic nucleus, as well as the principles governing nuclear exploration of factors relevant to transcriptional control. To this end, we used single-molecule (SM) imaging to address the relationship between the nuclear geometry and the search dynamics of two nuclear factors having distinct functional roles: the proto-oncogene c-Myc and the positive transcription elongation factor (P-TEFb). c-Myc is a basic helix-loop-helix DNA-binding transcription factor that binds to E-Boxes; 18,000 E-boxes are found in the genome, and c-Myc affects the transcription of numerous genes (Gallant and Steiger, 2009).
Recently, c-Myc has been demonstrated to be a general transcriptional activator upregulating transcription of nearly all genes (Lin et al., 2012; Nie et al., 2012). P-TEFb is an essential actor in the transcription regulation driven by RNA Polymerase II. P-TEFb is a cyclin-dependent kinase, comprising a CDK9 and a Cyclin T subunit. It phosphorylates the elongation control factors SPT5 and NELF to allow productive elongation of class II gene transcription (Wada et al., 1998). The carboxy-terminal domain (CTD) of the catalytic subunit RPB1 of polymerase II is also a major target of P-TEFb (Zhou et al., 2012). c-Myc and P-TEFb are therefore two good examples of transcriptional regulators binding to numerous sites in the nucleus; the latter binds to the transcription machinery itself and the former directly to DNA.

Single particle tracking (SPT) constitutes a powerful method to probe the mobility of molecules in living cells (Lord et al., 2010). In the nucleus, SPT has been first employed to investigate the dynamics of mRNAs (Fusco et al., 2003; Shav-Tal et al., 2004) or for rheological measurements of the nucleoplasm using inert probes (Bancaud et al., 2009). Recently, the tracking of single nuclear factors has been facilitated by the advent of efficient in situ tagging methods such as Halo
tags (Mazza et al., 2012). An alternative approach takes advantage of photoconvertible tags (Lippincott-Schwartz and Patterson, 2009) and photoactivated localization microscopy (PALM) (Betzig et al., 2006; Hess et al., 2006). Single particle tracking PALM (sptPALM) was first used to achieve high-density diffusion maps of membrane proteins (Manley et al., 2008). However, spt-PALM experiments have typically been limited to proteins with slow mobility (Manley et al., 2008) or those that undergo restricted motions (Frost et al., 2010; English et al., 2011).

Recently, by inclusion of light-sheet illumination, it has been used to determine the binding characteristics of TFs to DNA (Gebhardt et al., 2013). In this study, we developed a new sptPALM procedure adapted for the recording of individual proteins rapidly diffusing in the nucleus of mammalian cells. We used the photoconvertible fluorophore Dendra2 (Gurskaya et al., 2006) and took advantage of tilted illumination (Tokunaga et al., 2008). A careful control of the photoconversion rate minimized the background signal due to out-of-focus activated molecules, and we could thus follow the motion of individual proteins freely diffusing within the nuclear volume. With this sptPALM technique, we recorded large data sets (on the order of 104 single translocations in a single imaging session), which were essential for a proper statistical analysis of the search dynamics.
We applied our technique to several nuclear proteins and found that diffusing factors do not sense a unique nucleoplasmic architecture: c-Myc and P-TEFb adopt different nuclear space-exploration strategies, which drastically change the way they reach their specific targets. The differences observed between the two factors were not due to their diffusive kinetic parameters but to the geometry of their exploration path. c-Myc and our control protein, ‘free’ Dendra2, showed free diffusion in a three-dimensional nuclear space. In contrast, P-TEFb explored the nuclear volume by sampling a space of reduced dimensionality, displaying characteristics of exploration constrained in fractal structures.
The role of the space-sampling mode in the search strategy has long been discussed from a theoretical point of view (de Gennes, 1982a; Kopelman, 1986; Lindenberg et al., 1991). Our experimental results support the notion that it could indeed be a key parameter for diffusion-limited chemical reactions in the closed environment of the nucleus (Bénichou et al., 2010). We discuss the implications of our observations in terms of gene expression control, and its relation to the spatial organization of genes within the nucleus.

Share this:

  • Share on X (Opens in new window) X
  • Share on LinkedIn (Opens in new window) LinkedIn
  • Share on Facebook (Opens in new window) Facebook
  • Print (Opens in new window) Print
  • Email a link to a friend (Opens in new window) Email

Like this:

Like Loading…

Read Full Post »

Biotech Chinese and Israeli Strategic Collaboration: Pontifax and WuXi PharmaTech (Cayman) Inc. (NYSE: WX)

Posted in Cell Biology, Gene Regulation and Evolution, Genetics & Pharmaceutical, Genome Biology, Genomic Testing: Methodology for Diagnosis, Global Partnering & Biotech Investment, Medical Devices R&D Investment, Pharmaceutical Discovery, Pharmaceutical Drug Discovery, Pharmaceutical Industry Competitive Intelligence, Pharmaceutical R&D Investment, Pharmacogenomics, Regulated Clinical Trials: Design, Methods, Components and IRB related issues, Small Molecules in Development of Therapeutic Drugs, Technology Transfer: Biotech and Pharmaceutical, Translational Science on November 3, 2014| Leave a Comment »

Biotech Chinese and Israeli Strategic Collaboration: Pontifax and WuXi PharmaTech (Cayman) Inc. (NYSE: WX)

UPDATED on 12/15/2015

China’s WuXi raises a $290M VC fund with eyes on ‘cross-border’ biotech bets

By Damian Garde


WuXi PharmaTech, China’s largest CRO, closed an oversubscribed $290 million venture fund, turning its attention to biopharma startups at home and in the U.S.

Wuxi PharmaTech CEO Ge Li

The fund, which the company said exceeded its $200 million target, will bankroll investments in early-stage biotech and healthcare companies. WuXi’s first foray into VC, a $63 million fund debuted in 2011, bought the CRO stakes in 18 companies including U.S. biotechs Juno Therapeutics ($JUNO) and Agios Pharmaceuticals ($AGIO), plus Chinese upstarts Hua Medicine and Adagene.

Now WuXi wants to broaden its venture arm and deepen its presence in the growing biotech VC scene on two continents. The company plans to place its bets through deal-scouting offices in Shanghai and Boston, leaning on its fast-growing U.S. operation and decades of work in its native country.

“China and the United States are the two largest and most dynamic healthcare markets in the world and countries where our firm has deep investment expertise and experience,” WuXi Chief Financial Officer Edward Hu said in a statement. “The cross-border nature of our investment strategy and our appetite for early-stage innovation and entrepreneurship have aligned us well with the macro-trends in both countries.”

The move comes a week after WuXi abandoned its public listing and went private in a $3.3 billion deal led by founder and CEO Ge Li. The CRO, on pace for about $800 million in revenue this year, has been broadening its business model beyond traditional outsourced clinical trials, buying big into genomics and signing risk-sharing R&D deals with its pharma partners. And Li, joined by a syndicate of investors, believes its brightest future lies away from the public markets.

– read the statement

Related Articles:

WuXi Healthcare plots a $250M biotech venture fund for U.S., China

CRO giant WuXi is going private in a $3.3B deal

Biotech notches another $2B VC quarter, but can it last?

SOURCE 

From: Gerard Loiseau <gerard.loiseau@bluewin.ch>

Date: Tuesday, December 15, 2015 at 12:38 PM

To: Aviva Lev-Ari <AvivaLev-Ari@alum.berkeley.edu>

Subject: China !!

UPDATED on 11/5/2015

WuXi pads its revenue on the way to a big buyout decision

By Damian Garde

Wuxi PharmaTech CEO Ge Li

Chinese CRO WuXi PharmaTech ($WX) extended its run of quarterly growth on the eve of a shareholder vote that could take the company private in a multibillion-dollar deal.

In the third quarter, WuXi boosted its revenue 23.1% to $213.6 million, driven by 18% growth in lab services, a 19.6% jump in small-molecule manufacturing services and a 66% leap in biologics services. Profits, however, tumbled by nearly 50% to $16.1 million due largely to charges related to foreign exchange and losses tied to joint ventures with PRA Health Sciences ($PRAH) and AstraZeneca ($AZN), the company said.

WuXi is not providing a forward-looking guidance because it is preparing for the possibility of becoming a private company in the coming months. In April a group led by founder and CEO Ge Li made an offer to take the company off the market in a $3.3 billion deal. A special committee formed by WuXi’s board has voted in favor of the transaction, and the idea will come before a shareholder vote on Nov. 25.

If the deal is approved, WuXi will become part of a newly formed parent company through an all-cash transaction that trades $46 for each of WuXi’s American-traded securities. The total represents a 16.5% premium over WuXi’s closing price before the offer came to light.

Meanwhile, the company has continued to expand its business beyond traditional CRO work and more in line with Li’s long-stated vision of becoming “an open-access capability and technology platform that enables anyone and any company [to] discover and develop therapeutic products to benefit patients.” That has meant embracing genomics through its NextCODE subsidiary, which has signed deals with hospitals around the world to provide patient screening, and expanding its footprint to include capacity for cell therapies and other next-generation therapeutics.

WuXi AppTec Launches Representative Office in Israel, Forms Strategic Collaboration with Pontifax

SHANGHAI, Oct. 30, 2014 /PRNewswire/ — WuXi PharmaTech (Cayman) Inc. (NYSE: WX), a leading open-access R&D capability and technology platform company serving the pharmaceutical, biotechnology, and medical device industries, with operations in China and the United States, today announced the establishment of a representative office in the Tel Aviv area of Israel.

The new office will promote WuXi’s broad platform of integrated R&D services to local customers. It will also collaborate with Pontifax, a leading healthcare-dedicated venture capital firm based in Israel, to invest in promising technologies in Israel, particularly those that can potentially advance WuXi’s capabilities.

“We welcome WuXi’s presence in Israel and believe the new representative office will be mutually beneficial to WuXi and the Israeli biotech industry,” said Tomer Kariv, CEO of Pontifax.

“We are excited to establish a presence in Israel and to contribute to one of the most dynamic healthcare innovation ecosystems in the world,” said Dr. Ge Li, chairman and CEO of WuXi PharmaTech. “We value the expertise that Pontifax has developed in Israel’s biotech industry and look forward to working closely with them to help many of their portfolio companies and other startup companies. This step advances WuXi’s mission of helping entrepreneurs in the global life sciences industry to realize their dreams of developing innovative products to benefit the world’s patients.”

About WuXi PharmaTech

WuXi PharmaTech (NYSE: WX) is a leading open-access R&D capability and technology platform company serving the pharmaceutical, biotechnology, and medical device industries, with operations in China and the United States. As a research-driven and customer-focused company, WuXi PharmaTech provides pharmaceutical, biotechnology, and medical device companies with a broad and integrated portfolio of laboratory and manufacturing services throughout the drug and medical device R&D process. WuXi PharmaTech’s services are designed to help its global partners in shortening the cycle and lowering the cost of drug and medical device R&D. The operating subsidiaries of WuXi PharmaTech are known as WuXi AppTec. Please visit http://www.wuxiapptec.com.

For further information please contact:

Dana Yarden, MD, MBA
Executive Director, Israel Business Development
+972-9-9725617 or +972-54-8085692
dana_yarden@wuxiapptec.com

Ronald Aldridge
Director of Investor Relations
+1-201-585-2048
ron_aldridge@wuxiapptec.com

Aaron Shi
Associate Director of Corporate Communications
+86-21-5046-4362
aaron_shi@wuxiapptec.com

SOURCE WuXi PharmaTech

WuXi PharmaTech

Web Site: http://www.wuxiapptec.com

SOURCE

From: “PR Newswire for Journalists” <push_services@prnewswire.com>
Sent: Thursday, October 30, 2014 5:42 PM

Corporate Profile


Services & Solutions by WuXi AppTec WuXi PharmaTech (pronounced woo-shee pharma-tek) is a leading global contract R&D services provider serving the pharmaceutical, biotech, and medical device industries. The company is headquartered in Shanghai and has operations in both China and the United States. We provide a broad and integrated portfolio of laboratory and manufacturing services throughout the R&D process. Our services are designed to help our global partners shorten the time and lower the cost of R&D. The parent company is known as WuXi PharmaTech, and its operating divisions are known as WuXi AppTec (pronounced woo-shee app-tek)
WuXi PharmaTech is the product of the merger in early 2008 of WuXi PharmaTech Inc., a chemistry-based company founded in China in 2000, and AppTec Laboratory Services Inc., a U.S. company founded in 2001 with expertise in medical-device and biologics testing. WuXi PharmaTech Inc. expanded its services rapidly throughout the decade, offering discovery chemistry services in 2001; process development in 2003; research manufacturing in 2004; bioanalytical chemistry in 2005; discovery biology in 2006; toxicology and formulation in 2007; commercial manufacturing in 2009; genomics, clinical trial management and research reagents in 2011; and biologics discovery, development and manufacturing in 2012.Biopharmaceutical and medical device research and development is complex, high-risk, and expensive for our customers. Improving R&D productivity is vitally important not only for the continued success of life sciences companies but also for the health of our families and each of us. Our competitive advantage rests on these elements:

  • an experienced international management team;
  • a highly educated and trained workforce of about 7,000 employees, including about 6,000 scientists, the majority with advanced degrees;
  • broad technical expertise;
  • operational excellence;
  • world-class facilities in both China and the United States;
  • an intense focus on a diversified, high-quality customer base;
  • a flexible contractual approach; and
  • strong procedures to protect customers’ intellectual property.

The company’s client list includes most of the major pharmaceutical and biotechnology companies. As our customers recognize the value we bring, they give WuXi AppTec larger and more valuable contracts. In recognition of the key contributions we made to their success, WuXi AppTec has received awards from leading pharmaceutical customers, including Pfizer, Merck, AstraZeneca, Novartis, Genentech, Millennium, and other companies.

WuXi is recognized as a strong growth company that has delivered solid financial performance since its inception. Revenues totaled $499.9 million and GAAP net income totaled $86.6 million in 2012. Our management has strategies in place to build on this record and to sustain long-term growth. Key drivers of growth in 2012 are our expanding capabilities and capacity and high-quality services in China-based Laboratory Services; increasing utilization of our integrated drug development services for API manufacturing, IND-enabling toxicology studies and IND filings with the China SFDA and global regulatory authorities; strong growth in testing revenues for both biologics and medical devices in our U.S.-based Laboratory Services; an expanding pipeline in both research manufacturing and commercial manufacturing; and the ramp-up of biologics drug discovery, development, and manufacturing services. Success in these areas is expected to deliver strong customer benefit and drive growth in shareholder value for many years to come. Our goal is to be the outsourcing partner of choice from bench to market.

SOURCE
http://ir.wuxiapptec.com/phoenix.zhtml?c=212698&p=irol-homeProfile&t=&id=&

Services and Solutions – WuXi AppTec – WuXi PharmaTech

  • Genome Center

  • Clinical & Regulatory Services

  • Bioanalytical Services

  • Toxicology Services

  • Chemistry Services

  • Medical Device Services

  • Biologics Services

  • Development Services

  • API Development and Manufacturing (STA)

  • Lab Testing Division (LTD)

  • International Discovery Service Unit (IDSU)

  • Discovery Services

  • Biological Reagents – Abgent

  • Unsurpassed Development Capabilities
  • ELITE™ Custom Antibody Service
  • WuXi Venture Fund

Discovery Services

WuXi AppTec provides pharmaceutical discovery services across the entire spectrum of the drug discovery process. Our pharmaceutical discovery services can be fully integrated to provide a flexible and customized solution for client’s specific project needs.

Lab Testing Division (LTD)

Lab Testing Division (LTD) is comprised of seven business units. LTD’s integrated services and solutions in the fields of Chemistry and Biology span from early screening to preclinical development and into clinical sample analysis. Leveraging other established WuXi businesses in MedChem, synthesis and formulation, LTD is well positioned to enable customers to accelerate their discovery processes and empower them to bring new, innovative medicines to patients.

API Development and Manufacturing (STA)

Shanghai Syn-The-All Pharmaceutical Co. Ltd. (“STA”) is a wholly owned subsidiary of WuXi AppTec which provides an integrated platform with “end-to-end” small molecule APIs/intermediates development and manufacturing capabilities from preclinical to commercial stages. We proudly support over 100 life-science clients worldwide and manufacture over 100 APIs per year.

Development Services

WuXi AppTec provides end-to-end API services from process R&D, to API manufacturing at phase I, II, III and commercial scale. The services also include pre-formulation studies, analytical development, stability evaluation and formulation development, all the way to CMC services. All of these services are integrated to help our clients quickly and seamlessly move NCEs from preclinical stage to patients.

Biologics Services

WuXi AppTec provides a seamless, high-quality, single-source approach for the development, testing and manufacture of biotherapeutics. This single- source strategy can reduce the time-to-clinic and can significantly decrease the cost of our customers’ drug development efforts.

Medical Device Services

WuXi AppTec is uniquely positioned to support product development from concept to commercialization, with industry leading comprehensive testing programs that help ensure regulatory submission success.

Chemistry Services

WuXi AppTec offers a complete spectrum of chemistry services, all led by experts in their respective fields: from synthetic chemistry to chiral separations, from small molecule to peptide/peptidomimetics, from nucleoside to fluorinated building blocks, from milligram synthesis to kilogram GLP scale-up, and from reagent service to compound management.

Toxicology Services

WuXi AppTec’s toxicology services feature a full-range of in-vivo and in-vitro non-clinical safety evaluation programs. As the uniqueness of each product requires a case-by-case approach, we partner with clients to ensure that all study components meet specific program objectives.

Bioanalytical Services

WuXi AppTec offers comprehensive and FDA/OECD/SFDA GLP-compliant bioanalysis services to support preclinical and clinical development for small molecule drugs, biologics, vaccines and PD biomarkers.

Clinical and Regulatory Services

WuXi AppTec has strong experience in clinical trial management and regulatory affairs consultation; our experts are able to provide in-depth support to help clients bring new drugs and devices to the market smarter and faster.

Genome Center

WuXi Genome Center is a leading global genomic sequencing provider. It offers a complete solution to tackle biological and clinical challenges by combining components of genomics, bioinformatics, disease biology and clinical expertise to advance drug discovery, clinical development, and personalized medicine.

Biological Reagents

Abgent, a WuXi AppTec company, is a leading provider of antibodies and related services for biomedical research and drug discovery. Our competencies lie in the development of high quality antibodies and related reagents for the study of neurodegenerative diseases, stem cells, autophagy, and model organisms. Our antibodies are rigorously validated and optimized to ensure accurate and consistent performance.

SOURCE

http://www.wuxiapptec.com/services.html
For further information please contact:

Pontifax: Investor Details

Investments

18 Investments in 13 CompaniesExits

2 IPOs

– See more at: http://www.crunchbase.com/organization/pontifax#sthash.7o6U0khk.dpuf

Founders:

Ran Nussbaum, Tomer Kariv

Headquarters:

Herzliya, Israel

  • Office

    8 Hama 3236 Nofim St.

    Herzliya Pituach

    Herzliya, 46725

    ISRAEL

– See more at: http://www.crunchbase.com/organization/pontifax#sthash.7o6U0khk.dpuf

Description:

Venture capital Firm

– See more at: http://www.crunchbase.com/organization/pontifax#sthash.7o6U0khk.dpuf

Current Team (3)

UPDATE

  • Cb default image 98x98

    Tomer Kariv

    Founder and CEO
  • Cb default image 98x98

    Ran Nussbaum

    Co-Founder, Managing Partner, and Partner
  • Cb default image 98x98

    Michael Sela

    Chairman

– See more at: http://www.crunchbase.com/organization/pontifax#sthash.7o6U0khk.dpuf

Founded: 2004
Type: Venture Capital that does Early Stage Venture, Later Stage Venture, and Private Equity InvestmentsSectors:Biotechnology, Health Care, Pharmaceuticals

Pontifax Ltd. is a venture capital firm specialzing in investments in incubation, seed or startups, early, and mid stage. It seeks to invest in life sciences sector. The firm seeks to invest in companies based in Israel

– See more at: http://www.crunchbase.com/organization/pontifax#sthash.7o6U0khk.dpuf

Categories favored by Pontifax

  • Cb default image

    Biotechnology
    8 companies
  • Cb default image

    Health Care
    4 companies
  • Cb default image

    Medical Devices
    2 companies
  • Cb default image

    Pharmaceuticals
    2 companies
  • Cb default image

    Medical
    1 company

– See more at: http://www.crunchbase.com/organization/pontifax/insights/categories#sthash.EKcOI6Ij.dpuf

Investments
18 Investments in 13 CompaniesExits
2 IPOs &
Founders:Ran Nussbaum, Tomer Kariv
Headquarters:HerzliyaDescription:Venture capital Firm

– See more at: http://www.crunchbase.com/organization/pontifax#sthash.fWmB2WSO.dpuf

All Investments made by Pontifax

COMPANY INVESTMENTS
Arno TherapeuticsArno Therapeutics Private Equity

October 30, 2013
HeadSense MedicalHeadSense Medical Not Disclosed

July 8, 2013
Rewalk RoboticsRewalk Robotics Series D

June 17, 2013
TheraCoatTheraCoat Series A

May 21, 2013
cCAM BiotherapeuticscCAM Biotherapeutics Series A

September 15, 2012
Stimatix GIStimatix GI Not Disclosed

March 7, 2011
Avraham PharmaceuticalsAvraham Pharmaceuticals Series A

July 13, 2010
AposenseAposense Not Disclosed

May 23, 2010
Applied Immune TechnologiesApplied Immune Technologies Not Disclosed

April 26, 2010
ProtAbProtAb Series A

April 23, 2010
AposenseAposense Not Disclosed

August 20, 2008
CollplantCollplant Not Disclosed

April 1, 2008
CollplantCollplant Not Disclosed

April, 2007
CollplantCollplant Not Disclosed

February 13, 2007
CollplantCollplant Not Disclosed

September 4, 2006
CritiSenseCritiSense Not Disclosed

June 21, 2006
CritiSenseCritiSense Not Disclosed

June 8, 2005

Pontifax has co-invested with these investors

  • 02b04e0d61d7876150bee2cc466a9e58

    Docor International Management
    4 companies
  • 6096ae9e5d1e3e104436edb08e96b885

    Clal Biotechnology
    3 companies
  • 87efc57ff3eb26ebc027537da4998129

    Arkin Holdings
    1 company
  • Cb default image

    Bargal R&D Investment
    1 company
  • Cb default image

    Bellco Capital
    1 company
  • D3d9166d63a6d7753542c2e1155ba346

    Bridge Investment Fund
    1 company
  • Cb default image

    Commercial Capital LLC
    1 company
  • Cb default image

    Federman & Sons
    1 company
  • 5feb9500716b62dd07cc1d637dea8a52

    GE Healthcare
    1 company
  • E25bdc53bdc114eb8787f37929a4430d

    GE Ventures
    1 company
  • 6441558051350816ddd43bd5d532e323

    HBL Hadasit Bio Holdings
    1 company
  • 931713698c5e38fd2028106b946a14f6

    Israel Healthcare Ventures
    1 company
  • Cb default image

    Meitav Underwriting
    1 company
  • Cb default image

    Modgal Industries
    1 company
  • B1ce9d2887c930e2d5d82b64a7eebcb9

    OrbiMed Advisors
    1 company
  • Dtnvqetcgpwkkob18g1a

    OurCrowd
    1 company
  • 63acf575568e1a1288d8b5f8ceb3dfec

    Perceptive Advisors
    1 company
  • A3b47ab6cbb85e3ab8926172b9cd18a2

    Phoenix Insurance
    1 company
  • 704ba721dc396d01f5a4344ba79e333e

    Polar Investments
    1 company
  • Cb default image

    Sabby Capital
    1 company
  • Bcce6ed0baba102b263072bdf2049689

    SCP Vitalife Partners
    1 company
  • 6a662c8686252f8a1ffbdeaea9afbe82

    Shanghai Fosun Pharmaceutical
    1 company
  • Cfh1qsicbmkzr9limcuc

    Soros Fund Management
    1 company
  • Cb default image

    Technorov
    1 company
  • 69cf5930576ab39c372bd903593a14f6

    U.S. Venture Partners
    1 company
  • 1abc8818a43c22fb044e9a0b03db8d4e

    Yissum Research Development
    1 company
  • 12e735385fa05514d54620da463f0045

    Ziegler Meditech Equity Partners
    1 company
SOURCE
The Business Graph

410 Townsend Street
San Francisco, CA 94107

– See more at: http://www.crunchbase.com/organization/pontifax/insights/co-investors#sthash.ivYx5BBy.dpuf

– See more at: http://www.crunchbase.com/organization/pontifax/investments#sthash.DB87s0tR.dpuf

Share this:

  • Share on X (Opens in new window) X
  • Share on LinkedIn (Opens in new window) LinkedIn
  • Share on Facebook (Opens in new window) Facebook
  • Print (Opens in new window) Print
  • Email a link to a friend (Opens in new window) Email

Like this:

Like Loading…

Read Full Post »

Powering the Cell: Mitochondria

Posted in Cell Biology, Cell Biology, Signaling & Cell Circuits on November 3, 2014| Leave a Comment »

Powering the Cell: Mitochondria

Reporter: Aviva Lev-Ari, PhD, RN

VIEW VIDEO

http://labroots.com/user/account-file/view-video/type/public-wall/id/826

Posted by: Robert Woodard

Date: Thursday, Oct 30, 2014

Views: 1890

Link: https://www.youtube.com/watch?v=RrS2uROUjK4

Together Harvard University and XVIVO developed this 3D animation journey for Harvard’s undergraduate Molecular and Cellular Biology students about the microscopic world of mitochondria. The animation highlights the creation of Adenosine Triphosphate (ATP) — mobile molecules which store chemical energy derived from the breakdown of carbon-based food. ATP molecules act as a kind of currency, imparting


Share this:

  • Share on X (Opens in new window) X
  • Share on LinkedIn (Opens in new window) LinkedIn
  • Share on Facebook (Opens in new window) Facebook
  • Print (Opens in new window) Print
  • Email a link to a friend (Opens in new window) Email

Like this:

Like Loading…

Read Full Post »

Integrins, Cadherins, Signaling and the Cytoskeleton

Posted in Academic Publishing, Biological Networks, Bone Disease and Musculoskeletal Disease, Calcium Signaling, Calmodulin Kinase and Contraction, Cardiomyopathy, Cell Biology, Chemical Biology and its relations to Metabolic Disease, Curation, Cytoskeleton, Developmental biology, Disease Biology, Frontiers in Cardiology and Cardiovascular Disorders, Gene Regulation, Gene Regulation and Evolution, Ionic Transporters Na+, Metabolism, Metabolomics, Mg++, Na-K transport, Na-K-ATPase, Personalized and Precision Medicine & Genomic Research, Phosphorylation, Population Health Management, Proteins, Proteomics, Signaling, Signaling & Cell Circuits, Skeletal muscle regeneration, Translational Science, tagged ATP, cell migration, cell movement, cell signaling, cell-cell interaction, cytoskeletom, Extracellular matrix, Integrins, ion transfer, kinesins, mechanotransduction, microtubules, Repair, replication, tubulins on October 30, 2014| Leave a Comment »

Integrins, Cadherins, Signaling and the Cytoskeleton

Curator: Larry H. Bernstein, MD, FCAP 


We have reviewed the cytoskeleton, cytoskeleton pores and ionic translocation under lipids. We shall now look at this again, with specific attention to proteins, transporters and signaling.

Integrins and extracellular matrix in mechanotransduction

Lindsay Ramage
Queen’s Medical Research Institute, University of Edinburgh,

Edinburgh, UK
Cell Health and Cytoskeleton 2012; 4: 1–9

https://s3.amazonaws.com/academia.edu.documents/37116869/CHC-21829-integrins-and-extracellular-matrix-in-mechanotransduction_122311.pdf?response-content-disposition=inline%3B%20filename%3DCell_Health_and_Cytoskeleton_Integrins_a.pdf&X-Amz-Algorithm=AWS4-HMAC-SHA256&X-Amz-Credential=AKIAIWOWYYGZ2Y53UL3A%2F20191231%2Fus-east-1%2Fs3%2Faws4_request&X-Amz-Date=20191231T021009Z&X-Amz-Expires=3600&X-Amz-SignedHeaders=host&X-Amz-Signature=b376084e0e1c31c399ee7fe96eb81b1b65d3346d647192e9ebeff96f577e117d

Integrins are a family of cell surface receptors which

  • mediate cell–matrix and cell–cell adhesions.

Among other functions they provide an important

  • mechanical link between the cells external and intracellular environments while
  • the adhesions that they form also have critical roles in cellular signal-transduction.

Cell–matrix contacts occur at zones in the cell surface where

  • adhesion receptors cluster and when activated
  • the receptors bind to ligands in the extracellular matrix.

The extracellular matrix surrounds the cells of tissues and forms the

  • structural support of tissue which is particularly important in connective tissues.

Cells attach to the extracellular matrix through

  • specific cell-surface receptors and molecules
  • including integrins and transmembrane proteoglycans.

Integrins work alongside other proteins such as

  • cadherins,
  • immunoglobulin superfamily
  • cell adhesion molecules,
  • selectins, and
  • syndecans

to mediate

  • cell–cell and
  • cell–matrix interactions and communication.

Activation of adhesion receptors triggers the formation of matrix contacts in which

  • bound matrix components,
  • adhesion receptors,
  • and associated intracellular cytoskeletal and signaling molecules

form large functional, localized multiprotein complexes.

Cell–matrix contacts are important in a variety of different cell and

tissue properties including

  1. embryonic development,
  2. inflammatory responses,
  3. wound healing,
  4. and adult tissue homeostasis.

This review summarizes the roles and functions of integrins and extracellular matrix proteins in mechanotransduction.

Integrins are a family of αβ heterodimeric receptors which act as

  • cell adhesion molecules
  • connecting the ECM to the actin cytoskeleton.

The actin cytoskeleton is involved in the regulation of

  1. cell motility,
  2. cell polarity,
  3. cell growth, and
  4. cell survival.

The integrin family consists of around 25 members which are composed of differing

  • combinations of α and β subunits.

The combination of αβ subunits determines

  • binding specificity and
  • signaling properties.

In mammals around 19 α and eight β subunits have been characterized.

Both α and β integrin subunits contain two separate tails, which

  • penetrate the plasma membrane and possess small cytoplasmic domains which facilitate
  • the signaling functions of the receptor.

There is some evidence that the β subunit is the principal

site for

  • binding of cytoskeletal and signaling molecules,

whereas the α subunit has a regulatory role. The integrin

tails

  • link the ECM to the actin cytoskeleton within the cell and with cytoplasmic proteins,

such as talin, tensin, and filamin. The extracellular domains of integrin receptors bind the ECM ligands.

The ECM is a complex mixture of matrix molecules, including -glycoproteins, collagens, laminins, glycosaminoglycans, proteoglycans,
and nonmatrix proteins, – including growth factors.
These can be categorized as insoluble molecules within the ECM, soluble molecules, and/or matrix-associated biochemicals, such as systemic hormones or growth factors and cytokines that act locally.

The integrin receptor formed from the binding of α and β subunits is shaped like a globular head supported by two rod-like legs (Figure 1). Most of the contact between the two subunits occurs in the head region, with the intracellular tails of the subunits forming the legs of the receptor.6 Integrin recognition of ligands is not constitutive but is regulated by alteration of integrin affinity for ligand binding. For integrin binding to ligands to occur the integrin must be primed and activated, both of which involve conformational changes to the receptor.

The integrins are composed of well-defined domains used for protein–protein interactions. The α-I domains of α integrin subunits comprise the ligand binding sites. X-ray crystallography has identified an α-I domain within the β subunit and a β propeller domain within the α subunit which complex to form the ligand-binding head of the integrin.

The use of activating and conformation-specific antibodies also suggests that the β chain is extended in the active integrin. It has since been identified that the hybrid domain in the β chain is critical for integrin activation, and a swing-out movement of this leg activates integrins.

http://www.ks.uiuc.edu/Publications/Stories/tcbg_ytt/pdfs/dbp6.pdf

DBP6: Integrin

Integrin

Integrin

Integrin.large

Integrin.large

Linking integrin conformation to function

Figure  Integrin binding to extracellular matrix (ECM). Conformational changes to integrin structure and clustering of subunits which allow enhanced function of the receptor.

integrin coupled to F-actin via linker

integrin coupled to F-actin via linker

http://dx.dio.org:/integrin-coupled-to-f-actin-via-linker-nrm3896-f4.jpg

Integrin extracellular binding activity is regulated from inside the cell and binding to the ECM induces signals that are transmitted into the cell.15 This bidirectional signaling requires

  • dynamic,
  • spatially, and
  • temporally regulated formation and
  • disassembly of multiprotein complexes that
    form around the short cytoplasmic tails of integrins.

Ligand binding to integrin family members leads to clustering of integrin molecules in the plasma membrane and recruitment of actin filaments and intracellular signaling molecules to the cytoplasmic domain of the integrins. This forms focal adhesion complexes which are able to maintain

  • not only adhesion to the ECM
  • but are involved in complex signaling pathways

which include establishing

  1. cell polarity,
  2. directed cell migration, and
  3. maintaining cell growth and survival.

Initial activation through integrin adhesion to matrix recruits up to around 50 diverse signaling molecules

  • to assemble the focal adhesion complex
  • which is capable of responding to environmental stimuli efficiently.

Mapping of the integrin

  • adhesome binding and signaling interactions

identified a network of 156 components linked together which can be modified by 690 interactions.

The binding of the adaptor protein talin to the β subunit cytoplasmic tail is known to have a key role in integrin activation. This is thought to occur through the disruption of

  • inhibitory interactions between α and β subunit cytoplasmic tails.

Talin also binds

  • to actin and to cytoskeletal and signaling proteins.

This allows talin to directly link activated integrins

to signaling events and the cytoskeleton.


Genetic programming occurs with the binding of integrins to the ECM

Signal transduction pathway activation arising from integrin-

ECM binding results in changes in gene expression of cells

and leads to alterations in cell and tissue function. Various

different effects can arise depending on the

  1. cell type,
  2. matrix composition, and
  3. integrins activated.

One way in which integrin expression is important in genetic programming is in the fate and differentiation of stem cells.
Osteoblast differentiation occurs through ECM interactions

with specific integrins

  • to initiate intracellular signaling pathways leading to osteoblast-specific gene expression
  • disruption of interactions between integrins and collagen;
  • fibronectin blocks osteoblast differentiation and

Disruption of α2 integrin prevents osteoblast differentiation, and activation of the transcription factor

  • osteoblast-specific factor 2/core-binding factor α1.

It was found that the ECM-integrin interaction induces osteoblast-specific factor 2/core-binding factor α1 to

  • increase its activity as a transcriptional enhancer
  • rather than increasing protein levels.

It was also found that modification of α2 integrin alters

  • induction of the osteocalcin promoter;
  • inhibition of α2 prevents activation of the osteocalcin promoter,
  • overexpression enhanced osteocalcin promoter activity.

It has been suggested that integrin-type I collagen interaction is necessary for the phosphorylation and activation of osteoblast-specific transcription factors present in committed osteoprogenitor cells.

A variety of growth factors and cytokines have been shown to be important in the regulation of integrin expression and function in chondrocytes. Mechanotransduction in chondrocytes occurs through several different receptors and ion channels including integrins. During osteoarthritis the expression of integrins by chondrocytes is altered, resulting in different cellular transduction pathways which contribute to tissue pathology.

In normal adult cartilage, chondrocytes express α1β1, α10β1 (collagen receptors), α5β1, and αvβ5 (fibronectin) receptors. During mechanical loading/stimulation of chondrocytes there is an influx of ions across the cell membrane resulting from activation of mechanosensitive ion channels which can be inhibited by subunit-specific anti-integrin blocking antibodies or RGD peptides. Using these strategies it was identified that α5β1 integrin is a major mechanoreceptor in articular chondrocyte responses to mechanical loading/stimulation.

Osteoarthritic chondrocytes show a depolarization response to 0.33 Hz stimulation in contrast to the hyperpolarization response of normal chondrocytes. The mechanotransduction pathway in chondrocytes derived from normal and osteoarthritic cartilage both involve recognition of the mechanical stimulus by integrin receptors resulting in the activation of integrin signaling pathways leading to the generation of a cytokine loop. Normal and osteoarthritic chondrocytes show differences at multiple stages of the mechanotransduction cascade (Figure 3). Early events are similar; α5β1 integrin and stretch activated ion channels are activated and result in rapid tyrosine phosphorylation events. The actin cytoskeleton is required for the integrin-dependent Mechanotransduction leading to changes in membrane potential in normal but not osteoarthritic chondrocytes.

Cell–matrix interactions are essential for maintaining the integrity of tissues. An intact matrix is essential for cell survival and proliferation and to allow efficient mechanotransduction and tissue homeostasis. Cell–matrix interactions have been extensively studied in many tissues and this knowledge is being used to develop strategies to treat pathology. This is particularly important in tissues subject to abnormal mechanical loading, such as musculoskeletal tissues. Integrin-ECM interactions are being used to enhance tissue repair mechanisms in these tissues through differentiation of progenitor cells for in vitro and in vivo use. Knowledge of how signaling cascades are differentially regulated in response to physiological and pathological external stimuli (including ECM availability and mechanical loading/stimulation) will enable future strategies to be developed to prevent and treat the progression of pathology associated with integrin-ECM interactions.

Cellular adaptation to mechanical stress: role of integrins, Rho, cytoskeletal tension and mechanosensitive ion channels

  1. Matthews, DR. Overby, R Mannix and DE. Ingber
    1Vascular Biology Program, Departments of Pathology and Surgery, Children’s Hospital, and 2Department of Pediatrics, Massachusetts General Hospital, Harvard Medical School, Boston, MA J Cell Sci 2006; 119: 508-518. http://dx.doi.org:/10.1242/jcs.02760

To understand how cells sense and adapt to mechanical stress, we applied tensional forces to magnetic microbeads bound to cell-surface integrin receptors and measured changes in bead isplacement with sub-micrometer resolution using optical microscopy. Cells exhibited four types of mechanical responses: (1) an immediate viscoelastic response;

(2) early adaptive behavior characterized by pulse-to-pulse attenuation in response to oscillatory forces;

(3) later adaptive cell stiffening with sustained (>15 second) static stresses; and

(4) a large-scale repositioning response with prolonged (>1 minute) stress.

Importantly, these adaptation responses differed biochemically. The immediate and early responses were affected by

  • chemically dissipating cytoskeletal prestress (isometric tension), whereas
  • the later adaptive response was not.

The repositioning response was prevented by

  • inhibiting tension through interference with Rho signaling,

similar to the case of the immediate and early responses, but it was also prevented by

  • blocking mechanosensitive ion channels or
  • by inhibiting Src tyrosine kinases.

All adaptive responses were suppressed by cooling cells to 4°C to slow biochemical remodeling. Thus, cells use multiple mechanisms to sense and respond to static and dynamic changes in the level of mechanical stress applied to integrins.

Microtubule-Stimulated ADP Release, ATP Binding, and Force Generation In Transport Kinesins

J Atherton, I Farabella, I-Mei Yu, SS Rosenfeld, A Houdusse, M Topf, CA Moores

1Institute of Structural and Molecular Biology, Department of Biological Sciences, Birkbeck College, University of London, London, United Kingdom; 2Structural Motility, Institut Curie, Centre National de la Recherche Scientifique, Paris, France; 3Department of Cancer Biology, Lerner Research Institute, Cleveland Clinic, Cleveland, United States
eLife 2014;3:e03680. http://dx.doi.org:/10.7554/eLife.03680

Kinesins are a large family of microtubule (MT)-based motors that play important roles in many cellular activities including

  • mitosis,
  • motility, and
  • intracellular transport

Their involvement in a range of pathological processes also highlights their significance as therapeutic targets and the importance of understanding the molecular basis of their function They are defined by their motor domains that contain both the microtubule (MT) and ATP binding sites. Three ATP binding motifs—the P-loop, switch I, switch II–are highly conserved among kinesins, myosin motors, and small GTPases. They share a conserved mode of MT binding such that MT binding, ATP binding, and hydrolysis are functionally coupled for efficient MT-based work.

The interior of a cell is a hive of activity, filled with proteins and other items moving from one location to another. A network of filaments called microtubules forms tracks along which so-called motor proteins carry these items. Kinesins are one group of motor proteins, and a typical kinesin protein has one end (called the ‘motor domain’) that can attach itself to the microtubules.

The other end links to the cargo being carried, and a ‘neck’ connects the two. When two of these proteins work together, flexible regions of the neck allow the two motor domains to move past one another, which enable the kinesin to essentially walk along a microtubule in a stepwise manner.

Atherton et al. use a technique called cryo-electron microscopy to study—in more detail than previously seen—the structure of the motor domains of two types of kinesin called kinesin-1 and kinesin-3. Images were taken at different stages of the cycle used by the motor domains to extract the energy from ATP molecules. Although the two kinesins have been thought to move along the microtubule tracks in different ways, Atherton et al. find that the core mechanism used by their motor domains is the same.

When a motor domain binds to the microtubule, its shape changes, first stimulating release of the breakdown products of ATP from the previous cycle. This release makes room for a new ATP molecule to bind. The structural changes caused by ATP binding are relatively small but produce larger changes in the flexible neck region that enable individual motor domains within a kinesin pair to co-ordinate their movement and move in a consistent direction. This mechanism involves tight coupling between track binding and fuel usage and makes kinesins highly efficient motors.

A number of kinesins drive long distance transport of cellular cargo with dimerisation allowing them to take multiple 8 nm ATP-driven steps toward MT plus ends. Their processivity depends on communication between the two motor domains, which is achieved via the neck linker that connects each motor domain to the dimer-forming coiled-coil

Kinesins are a superfamily of microtubule-based

  • ATP-powered motors, important for multiple, essential cellular functions.

How microtubule binding stimulates their ATPase and controls force generation is not understood. To address this fundamental question, we visualized microtubule-bound kinesin-1 and kinesin-3 motor domains at multiple steps in their ATPase cycles—including their nucleotide-free states—at ∼7 Å resolution using cryo-electron microscopy.

All our reconstructions have, as their asymmetric unit, a triangle-shaped motor domain bound to an αβ-tubulin dimer within the MT lattice (Figure 1). The structural comparisons below are made with respect to the MT surface, which, at the resolution of our structures (∼7 Å, Table 1), is the same (CCC > 0.98 for all). As is well established across the superfamily, the major and largely invariant point of contact between kinesin motor domains and the MT is helix-α4, which lies at the tubulin intradimer interface (Figure 1C, Kikkawa et al., 2001).

However, multiple conformational changes are seen throughout the rest of each domain in response to bound nucleotide (Figure 1D). Below, we describe the conformational changes in functionally important regions of each motor domain starting with the nucleotide-binding site, from which all other conformational changes emanate.

The nucleotide-binding site (Figure 2) has three major elements: (1) the P-loop (brown) is visible in all our reconstructions;

(2) loop9 (yellow, contains switch I) undergoes major conformational changes through the ATPase cycle; and

(3) loop11 (red, contains switch II) that connects strand-β7 to helix-α4,

the conformation and flexibility of which is determined by MT binding and motor nucleotide state.

Movement and extension of helix-α6 controls neck linker docking

the N-terminus of helix-α6 is closely associated with elements of the nucleotide binding site suggesting that its conformation alters in response to different nucleotide states. In addition, because the orientation of helix-α6 with respect to helix-α4 controls neck linker docking and because helix-α4 is held against the MT during the ATPase cycle,

  • conformational changes in helix-α6 control movement of the neck linker.

Mechanical amplification and force generation involves conformational changes across the motor domain

A key conformational change in the motor domain following Mg-ATP binding is peeling of the central β-sheet from the C-terminus of helix-α4 increasing their separation (Figure 3—figure supplement 2); this is required to accommodate rotation of helix-α6 and consequent neck linker docking (Figure 3B–E).

Peeling of the central β-sheet has previously been proposed to arise from tilting of the entire motor domain relative to static MT contacts, pivoting around helix-α4 (the so-called ‘seesaw’ model; Sindelar, 2011). Specifically, this model predicts that the major difference in the motor before and after Mg-ATP binding would be the orientation of the motor domain with respect to helix-α4.

Kinesin mechanochemistry and the extent of mechanistic conservation within the motor superfamily are open questions, critical to explain how MT binding, and ATP binding and hydrolysis drive motor activity. Our structural characterisation of two transport motors now allows us to propose a model that describes the roles of mechanochemical elements that together drive conserved MT-based motor function.

Model of conserved MT-bound kinesin mechanochemistry. Loop11/N-terminus of helix-α4 is flexible in ADP-bound kinesin in solution, the neck linker is also flexible while loop9 chelates ADP. MT binding is sensed by loop11/helix-α4 N-terminus, biasing them towards more ordered conformations.

We propose that this favours crosstalk between loop11 and loop9, stimulating ADP release. In the NN conformation, both loop11 and loop9 are well ordered and primed to favour ATP binding, while helix-α6—which is required for mechanical amplification–is closely associated with the MT on the other side of the motor domain. ATP binding draws loop11 and loop9 closer together; causing

(1) tilting of most of the motor domain not contacting the MT towards the nucleotide-binding site,

(2) rotation, translation, and extension of helix-α6 which we propose contributes to force generation, and

(3) allows neck linker docking and biases movement of the 2nd head towards the MT plus end.

In both motors, microtubule binding promotes

  • ordered conformations of conserved loops that
  • stimulate ADP release,
  • enhance microtubule affinity and
  • prime the catalytic site for ATP binding.

ATP binding causes only small shifts of these nucleotide-coordinating loops but induces

  • large conformational changes elsewhere that
  • allow force generation and
  • neck linker docking towards the microtubule plus end.

Family-specific differences across the kinesin–microtubule interface account for the

  • distinctive properties of each motor.

Our data thus provide evidence for a

conserved ATP-driven

  • mechanism for kinesins and
  • reveal the critical mechanistic contribution of the microtubule interface.

Phosphorylation at endothelial cell–cell junctions: Implications for VE-cadherin function

I Timmerman, PL Hordijk, JD van Buul

Cell Health and Cytoskeleton 2010; 2: 23–31
Endothelial cell–cell junctions are strictly regulated in order to

  • control the barrier function of endothelium.

Vascular endothelial (VE)-cadherin is one of the proteins that is crucial in this process. It has been reported that

  • phosphorylation events control the function of VE-cadherin.

This review summarizes the role of VE-cadherin phosphorylation in the regulation of endothelial cell–cell junctions and highlights how this affects vascular permeability and leukocyte extravasation.

The vascular endothelium is the inner lining of blood vessels and

  • forms a physical barrier between the vessel lumen and surrounding tissue;
  • controlling the extravasation of fluids,
  • plasma proteins and leukocytes.

Changes in the permeability of the endothelium are tightly regulated. Under basal physiological conditions, there is a continuous transfer of substances across the capillary beds. In addition the endothelium can mediate inducible,

  • transient hyperpermeability
  • in response to stimulation with inflammatory mediators,
  • which takes place primarily in postcapillary venules.

However, when severe, inflammation may result in dysfunction of the endothelial barrier in various parts of the vascular tree, including large veins, arterioles and capillaries. Dysregulated permeability is observed in various pathological conditions, such as tumor-induced angiogenesis, cerebrovascular accident and atherosclerosis.

Two fundamentally different pathways regulate endothelial permeability,

  • the transcellular and paracellular pathways.

Solutes and cells can pass through the body of endothelial cells via the transcellular pathway, which includes

  • vesicular transport systems, fenestrae, and biochemical transporters.

The paracellular route is controlled by

  • the coordinated opening and closing of endothelial junctions and
  • thereby regulates traffic across the intercellular spaces between endothelial cells.

Endothelial cells are connected by

  • tight, gap and
  • adherens junctions,

of which the latter, and particularly the adherens junction component,

  • vascular endothelial (VE)-cadherin,
  • are of central importance for the initiation and stabilization of cell–cell contacts.

Although multiple adhesion molecules are localized at endothelial junctions, blocking the adhesive function of VE-cadherin using antibodies is sufficient to disrupt endothelial junctions and to increase endothelial monolayer permeability both in vitro and in vivo. Like other cadherins, VE-cadherin mediates adhesion via homophilic, calcium-dependent interactions.

This cell–cell adhesion

  • is strengthened by binding of cytoplasmic proteins, the catenins,
  • to the C-terminus of VE-cadherin.

VE-cadherin can directly bind β-catenin and plakoglobin, which

  • both associate with the actin binding protein α-catenin.

Initially, α-catenin was thought to directly anchor cadherins to the actin cytoskeleton, but recently it became clear that

  • α-catenin cannot bind to both β-catenin and actin simultaneously.

Data using purified proteins show that

  • monomeric α-catenin binds strongly to cadherin-bound β-catenin;
  • in contrast to the dimer which has a higher affinity for actin filaments,
  • indicating that α-catenin might function as a molecular switch regulating cadherin-mediated cell–cell adhesion and actin assembly.

Thus, interactions between the cadherin complex and the actin cytoskeleton are more complex than previously thought. Recently, Takeichi and colleagues reported that

  • the actin binding protein EPLIN (epithelial protein lost in neoplasm)
  • can associate with α-catenin and thereby
  • link the E-cadherin–catenin complex to the actin cytoskeleton.

Although this study was performed in epithelial cells,

  • an EPLIN-like molecule might serve as
  • a bridge between the cadherin–catenin complex and
  • the actin cytoskeleton in endothelial cells.

Next to β-catenin and plakoglobin, p120-catenin also binds directly to the intracellular tail of VE-cadherin.

Numerous lines of evidence indicate that

  • p120-catenin promotes VE-cadherin surface expression and stability at the plasma membrane.

Different models are proposed that describe how p120-catenin regulates cadherin membrane dynamics, including the hypothesis

  • that p120-catenin functions as a ‘cap’ that prevents the interaction of VE-cadherin
  • with the endocytic membrane trafficking machinery.

In addition, p120-catenin might regulate VE-cadherin internalization through interactions with small GTPases. Cytoplasmic p120-catenin, which is not bound to VE-cadherin, has been shown to

  • decrease RhoA activity,
  • elevate active Rac1 and Cdc42, and thereby is thought
  • to regulate actin cytoskeleton organization and membrane trafficking.

The intact cadherin-catenin complex is required for proper functioning of the adherens junction. Mutant forms of VE-cadherin which

  • lack either the β-catenin, plakoglobin or p120 binding regions reduce the strength of cell–cell adhesion.

Moreover, our own results showed that

  • interfering with the interaction between α-catenin and β-catenin,
  • using a cell-permeable peptide which encodes the binding site in α-catenin for β-catenin,
  • resulted in an increased permeability of the endothelial monolayer.

Several mechanisms may be involved in the regulation of the organization and function of the cadherin–catenin complex, including endocytosis of the complex, VE-cadherin cleavage and actin cytoskeleton reorganization. The remainder of this review primarily focuses on the

  • role of tyrosine phosphorylation in the control of VE-cadherin-mediated cell–cell adhesion.

Regulation of the adhesive function of VE-cadherin by tyrosine phosphorylation

It is a widely accepted concept that tyrosine phosphorylation of components of the VE–cadherin-catenin complex

  • Correlates with the weakening of cell–cell adhesion.

One of the first reports that supported this idea showed that the level of phosphorylation of VE-cadherin was

  • high in loosely confluent endothelial cells, but
  • low in tightly confluent monolayers,

when intercellular junctions are stabilized.

In addition, several conditions that induce tyrosine phosphorylation

of adherens junction components, like

  • v-Src transformation
  • and inhibition of phosphatase activity by pervanadate,

have been shown to shift cell–cell adhesion from a strong to a weak state. More physiologically relevant;

permeability-increasing agents such as

  • histamine,
  • tumor necrosis factor-α (TNF-α),
  • thrombin,
  • platelet-activating factor (PAF) and
  • vascular endothelial growth factor (VEGF)

increase tyrosine phosphorylation of various components of the cadherin–catenin complex.

A general idea has emerged that

  • tyrosine phosphorylation of the VE-cadherin complex
  • leads to the uncoupling of VE-cadherin from the actin cytoskeleton
  • through dissociation of catenins from the cadherin.

However, tyrosine phosphorylation of VE-cadherin is required for efficient transmigration of leukocytes.

This suggests that VE-cadherin-mediated cell–cell contacts

  1. are not just pushed open by the migrating leukocytes, but play
  2. a more active role in the transmigration process.

A schematic overview of leukocyte adhesion-induced signals leading to VE-cadherin phosphorylation

Regulation of the integrity of endothelial cell–cell contacts by phosphorylation of VE-cadherin

Regulation of the integrity of endothelial cell–cell contacts by phosphorylation of VE-cadherin

Regulation of the integrity of endothelial cell–cell contacts by phosphorylation of VE-cadherin.

Notes: A) Permeability-inducing agents such as thrombin, histamine and VEGF, induce tyrosine phosphorylation (pY) of VE-cadherin and the associated catenins. Although the specific consequences of catenin tyrosine phosphorylation in endothelial cells are still unknown, VE-cadherin tyrosine phosphorylation results in opening of the cell–cell junctions (indicated by arrows) and enhanced vascular permeability. How tyrosine phosphorylation affects VE-cadherin adhesiveness is not yet well understood; disrupted binding of catenins, which link the cadherin to the actin cytoskeleton, may be involved. VEGF induces phosphorylation of VE-cadherin at specific residues, Y658 and Y731, which have been reported to regulate p120-catenin and β-catenin binding, respectively. Moreover, VEGF stimulation results in serine phosphorylation (pSer) of VE-cadherin, specifically at residue S665, which leads to its endocytosis. B) Adhesion of leukocytes to endothelial cells via ICAM-1 increases endothelial permeability by inducing phosphorylation of VE-cadherin on tyrosine residues. Essential mediators, such as the kinases Pyk2 and Src, and signaling routes involving reactive oxygen species (ROS) and Rho, have been shown to act downstream of ICAM-1. Different tyrosine residues within the cytoplasmic domain of VE-cadherin are involved in the extravasation of neutrophils and lymphocytes, including Y658 and Y731. (β: β-catenin, α: α-catenin, γ: γ-catenin/plakoglobin).

N-glycosylation status of E-cadherin controls cytoskeletal dynamics through the organization of distinct β-catenin- and γ-catenin-containing AJs

BT Jamal, MN Nita-Lazar, Z Gao, B Amin, J Walker, MA Kukuruzinska
Cell Health and Cytoskeleton 2009; 1: 67–80

N-glycosylation of E-cadherin has been shown to inhibit cell–cell adhesion. Specifically, our recent studies have provided evidence that the reduction of E-cadherin N-glycosylation promoted the recruitment of stabilizing components, vinculin and serine/ threonine protein phosphatase 2A (PP2A), to adherens junctions (AJs) and enhanced the association of AJs with the actin cytoskeleton. Here, we examined the details of how

  • N-glycosylation of E-cadherin affected the molecular organization of AJs and their cytoskeletal interactions.

Using the hypoglycosylated E-cadherin variant, V13, we show that

  • V13/β-catenin complexes preferentially interacted with PP2A and with the microtubule motor protein dynein.

This correlated with dephosphorylation of the microtubule-associated protein tau, suggesting that

  • increased association of PP2A with V13-containing AJs promoted their tethering to microtubules.

On the other hand, V13/γ-catenin complexes associated more with vinculin, suggesting that they

  • mediated the interaction of AJs with the actin cytoskeleton.
  • N-glycosylation driven changes in the molecular organization of AJs were physiologically significant because transfection of V13 into A253 cancer cells, lacking both mature AJs and tight junctions (TJs), promoted the formation of stable AJs and enhanced the function of TJs to a greater extent than wild-type E-cadherin.

These studies provide the first mechanistic insights into how N-glycosylation of E-cadherin drives changes in AJ composition through

  • the assembly of distinct β-catenin- and γ-catenin-containing scaffolds that impact the interaction with different cytoskeletal components.

Cytoskeletal Basis of Ion Channel Function in Cardiac Muscle

Matteo Vatta, and Georgine Faulkner,

1 Departments of Pediatrics (Cardiology), Baylor College of Medicine, Houston, TX 2 Department of Reproductive and Developmental Sciences, University of Trieste, Trieste, Italy
3 Muscular Molecular Biology Unit, International Centre for Genetic Engineering and Biotechnology, Padriciano, Trieste, Italy

Future Cardiol. 2006 July 1; 2(4): 467–476. http://dx.doi.org:/10.2217/14796678.2.4.467

The heart is a force-generating organ that responds to

  • self-generated electrical stimuli from specialized cardiomyocytes.

This function is modulated

  • by sympathetic and parasympathetic activity.

In order to contract and accommodate the repetitive morphological changes induced by the cardiac cycle, cardiomyocytes

  • depend on their highly evolved and specialized cytoskeletal apparatus.

Defects in components of the cytoskeleton, in the long term,

  • affect the ability of the cell to compensate at both functional and structural levels.

In addition to the structural remodeling,

  • the myocardium becomes increasingly susceptible to altered electrical activity leading to arrhythmogenesis.

The development of arrhythmias secondary to structural remodeling defects has been noted, although the detailed molecular mechanisms are still elusive. Here I will review

  • the current knowledge of the molecular and functional relationships between the cytoskeleton and ion channels

and, I will discuss the future impact of new data on molecular cardiology research and clinical practice.

Myocardial dysfunction in the end-stage failing heart is very often associated with increasing

  • susceptibility to ventricular tachycardia (VT) and ventricular fibrillation (VF),

both of which are common causes of sudden cardiac death (SCD).

Among the various forms of HF,

myocardial remodeling due to ischemic cardiomyopathy (ICM) or dilated cardiomyopathy (DCM)

  • is characterized by alterations in baseline ECG,

which includes the

  • prolongation of the QT interval,
  • as well as QT dispersion,
  • ST-segment elevation, and
  • T-wave abnormalities,

especially during exercise. In particular, subjects with

severe left ventricular chamber dilation such as in DCM can have left bundle branch block (LBBB), while right bundle branch block (RBBB) is more characteristic of right ventricular failure.  LBBB and RBBB have both been repeatedly associated with AV block in heart failure.

The impact of volume overload on structural and electro-cardiographic alterations has been noted in cardiomyopathy patients treated with left ventricular assist device (LVAD) therapy, which puts the heart at mechanical rest. In LVAD-treated subjects,

  • QRS- and both QT- and QTc duration decreased,
  • suggesting that QRS- and QT-duration are significantly influenced by mechanical load and
  • that the shortening of the action potential duration contributes to the improved contractile performance after LVAD support.

Despite the increasing use of LVAD supporting either continuous or pulsatile blood flow in patients with severe HF, the benefit of this treatment in dealing with the risk of arrhythmias is still controversial.

Large epidemiological studies, such as the REMATCH study, demonstrated that the

  • employment of LVAD significantly improved survival rate and the quality of life, in comparison to optimal medical management.

An early postoperative period study after cardiac unloading therapy in 17 HF patients showed that in the first two weeks after LVAD implantation,

  • HF was associated with a relatively high incidence of ventricular arrhythmias associated with QTc interval prolongation.

In addition, a recent retrospective study of 100 adult patients with advanced HF, treated with an axial-flow HeartMate LVAD suggested that

  • the rate of new-onset monomorphic ventricular tachycardia (MVT) was increased in LVAD treated patients compared to patients given only medical treatment,

while no effect was observed on the development of polymorphic ventricular tachycardia (PVT)/ventricular fibrillation (VF).

The sarcomere

The myocardium is exposed to severe and continuous biomechanical stress during each contraction-relaxation cycle. When fiber tension remains uncompensated or simply unbalanced,

  • it may represent a trigger for arrhythmogenesis caused by cytoskeletal stretching,
  • which ultimately leads to altered ion channel localization, and subsequent action potential and conduction alterations.

Cytoskeletal proteins not only provide the backbone of the cellular structure, but they also

  • maintain the shape and flexibility of the different sub-cellular compartments, including the
  1. plasma membrane,
  2. the double lipid layer, which defines the boundaries of the cell and where
  • ion channels are mainly localized.

The interaction between the sarcomere, which is the basic for the passive force during diastole and for the restoring force during systole. Titin connects

  • the Z-line to the M-line of the sarcomeric structure
    (Figure 1).

In addition to the strategic

  • localization and mechanical spring function,
  • titin is a length-dependent sensor during
  • stretch and promotes actin-myosin interaction

Titin is stabilized by the cross-linking protein

  • telethonin (T-Cap), which localizes at the Z-line and is also part of titin sensor machinery (Figure 1).

The complex protein interactions in the sarcomere entwine telethonin to other

  • Z-line components through the family of the telethonin-binding proteins of the Z-disc, FATZ, also known as calsarcin and myozenin.

FATZ binds to

  1. calcineurin,
  2. γ-filamin as well as the
  3. spectrin-like repeats (R3–R4) of α-actinin-2,

the major component of the Z-line and a pivotal

  • F-actin cross-linker (Figure 1).contractile unit of striated muscles, and
  • the sarcolemma,

the plasma membrane surrendering the muscle fibers in skeletal muscle and the muscle cell of the cardiomyocyte,

  • determines the mechanical plasticity of the cell, enabling it to complete and re-initiate each contraction-relaxation cycle.

At the level of the sarcomere,

  • actin (thin) and myosin (thick) filaments generate the contractile force,

while other components such as titin, the largest protein known to date, are responsible for

  • the passive force during diastole and for the restoring force during systole, and (titin).
  • the Z-line to the M-line of the sarcomeric structure
    (Figure 1).

In addition to the strategic

  • localization and mechanical spring function,
  • it acts as a length-dependent sensor during stretch and
  • promotes actin-myosin interaction.

Stabilized by the cross-linking protein telethonin (T-Cap),

  • titin localizes at the Z-line and is
  • part of titin sensor machinery

Another cross-linker of α-actinin-2 in the complex Z-line scaffold is

  • the Z-band alternatively spliced PDZ motif protein (ZASP),
  • which has an important role in maintaining Z-disc stability

in skeletal and cardiac muscle (Figure 1).

ZASP contains a PDZ motif at its N-terminus,

  • which interacts with C-terminus of α-actinin-2,
  • and a conserved sequence called the ZASP like motif (ZM)
  • found in the alternatively spliced exons 4 and 6.

It has also been reported

  • to bind to the FATZ (calsarcin) family of Z-disc proteins (Figure 1).

The complex protein interactions in the sarcomere entwine telethonin to other Z-line components through the family of the telethonin-binding proteins of the

  1. Z-disc,
  2. FATZ, also known as calsarcin and
  3. myozenin

FATZ binds to calcineurin,

  1. γ-filamin as well as the
  2. spectrin-like repeats (R3–R4) of α-actinin-2, the major component of the Z-line and a pivotal F-actin cross-linker (Figure 1).
sarcomere structure

sarcomere structure

Figure 1. Sarcomere structure

The diagram illustrates the sarcomeric structure. The Z-line determines the boundaries of the contractile unit, while Titin connects the Z-line to the M-line and acts as a functional spring during contraction/relaxation cycles.

Sarcomeric Proteins and Ion Channels

In addition to systolic dysfunction characteristic of dilated cardiomyopathy (DCM) and diastolic dysfunction featuring hypertrophic cardiomyopathy (HCM), the clinical phenotype of patients with severe cardiomyopathy is very often associated with a high incidence of cardiac arrhythmias. Therefore, besides fiber stretch associated with mechanical and hemodynamic impairment, cytoskeletal alterations due to primary genetic defects or indirectly to alterations in response to cellular injury can potentially

  1. affect ion channel anchoring, and trafficking, as well as
  2. functional regulation by second messenger pathways,
  3. causing an imbalance in cardiac ionic homeostasis that will trigger arrhythmogenesis.

Intense investigation of

  • the sarcomeric actin network,
  • the Z-line structure, and
  • chaperone molecules docking in the plasma membrane,

has shed new light on the molecular basis of

  • cytoskeletal interactions in regulating ion channels.

In 1991, Cantiello et al., demonstrated that

  • although the epithelial sodium channel and F-actin are in close proximity,
  • they do not co-localize.

Actin disruption using cytochalasin D, an agent that interferes with actin polymerization, increased Na+ channel activity in 90% of excised patches tested within 2 min, which indicated that

  • the integrity of the filamentous actin (F-actin) network was essential
  • for the maintenance of normal Na+ channel function.

Later, the group of Dr. Jonathan Makielski demonstrated that

  • actin disruption induced a dramatic reduction in Na+ peak current and
  • slowed current decay without affecting steady-state voltage-dependent availability or recovery from inactivation.

These data were the first to support a role for the cytoskeleton in cardiac arrhythmias.

F-actin is intertwined in a multi-protein complex that includes

  • the composite Z-line structure.

Further, there is a direct binding between

  • the major protein of the Z-line, α-actinin-2 and
  • the voltage-gated K+ channel 1.5 (Kv1.5), (Figure 2).

The latter is expressed in human cardiomyocytes and localizes to

  • the intercalated disk of the cardiomyocyte
  • in association with connexin and N-cadherin.

Maruoka et al. treated HEK293 cells stably expressing Kv1.5 with cytochalasin D, which led to

  • a massive increase in ionic and gating IK+ currents.

This was prevented by pre-incubation with phalloidin, an F-actin stabilizing agent. In addition, the Z-line protein telethonin binds to the cytoplasmic domain of minK, the beta subunit of the potassium channel KCNQ1 (Figure 2).

Molecular interactions between the cytoskeleton and ion channels

Molecular interactions between the cytoskeleton and ion channels

Figure 2. Molecular interactions between the cytoskeleton and ion channels

The figure illustrates the interactions between the ion channels on the sarcolemma, and the sarcomere in cardiac myocytes. Note that the Z-line is connected to the cardiac T-tubules. The diagram illustrates the complex protein-protein interactions that occur between structural components of the cytoskeleton and ion channels. The cytoskeleton is involved in regulating the metabolism of ion channels, modifying their expression, localization, and electrical properties. The cardiac sodium channel Nav1.5 associates with the DGC, while potassium channels such as Kv1.5, associate with the Z-line.

Ion Channel Subunits and Trafficking

Correct localization is essential for ion channel function and this is dependent upon the ability of auxiliary proteins to

  • shuttle ion channels from the cytoplasm to their final destination such as
  • the plasma membrane or other sub-cellular compartments.

In this regard, Kvβ-subunits are

  • cytoplasmic components known to assemble with the α-subunits of voltage-dependent K+ (Kv) channels
  • at their N-terminus to form stable Kvα/β hetero-oligomeric channels.

When Kvβ is co-expressed with Kv1.4 or Kv1.5, it enhances Kv1.x channel trafficking to the cell membrane without changing the overall protein channel content. The regulatory Kvβ subunits, which are also expressed in cardiomyocytes, directly decrease K+ current by

  • accelerating Kv1.x channel inactivation.

Therefore, altered expression or mutations in Kvβ subunits could cause abnormal ion channel transport to the cell surface, thereby increasing the risk of cardiac arrhythmias.

Ion Channel Protein Motifs and Trafficking

Cell membrane trafficking in the Kv1.x family may occur in a Kvβ subunit-independent manner through specific motifs in their C-terminus. Mutagenesis of the final asparagine (N) in the Kv1.2 motif restores the leucine (L) of the Kv1.4 motif

  • re-establishing high expression levels at the plasma membrane in a Kvβ-independent manner

Cytoskeletal Proteins and Ion Channel Trafficking

Until recently, primary arrhythmias such as LQTS have been almost exclusively regarded as ion channelopathies. Other mutations have been identified with regard to channelopathies. However, the conviction that primary mutations in ion channels were solely responsible for

  • the electrical defects associated with arrhythmias

has been shaken by the identification of mutations in the

  • ANK2 gene encoding the cytoskeletal protein ankyrin-B

that is associated with LQTS in animal models and humans.

Ankyrin-B acts as a chaperone protein, which shuttles the cardiac sodium channel from the cytoplasm to the membrane. Immunohistochemical analysis has localized ankyrin-B to the Zlines/T-tubules on the plasma membrane in the myocardium. Mutations in ankyrin-B associated with LQTS

  • alter sodium channel trafficking due to loss of ankyrin-B localization at the Z-line/transverse (T)-tubules.

Reduced levels of ankyrin-B at cardiac Z-lines/T-tubules were associated with the deficiency of ankyrin-B-associated proteins such as Na/K-ATPase, Na/Ca exchanger (NCX) and inositol-1, 4, 5-trisphosphate receptors (InsP3R).

Dystrophin component of the Dystrophin Glycoprotien Complex (DGC)

Synchronized contraction is essential for cardiomyocytes, which are connected to each other via the extracellular matrix (ECM) through the DGC. The N-terminus domain of dystrophin

  • binds F-actin, and connects it to the sarcomere, while
  • the cysteine-rich (CR) C-terminus domain ensures its connection to the sarcolemma (Figure 2).

The central portion of dystrophin, the rod domain, is composed of

  • rigid spectrin-like repeats and four hinge portions (H1–H4) that determine the flexibility of the protein.

Dystrophin possesses another F-actin binding domain in the Rod domain region, between the basic repeats 11- 17 (DysN-R17).

Dystrophin, originally identified as the gene responsible for Duchenne and Becker muscular dystrophies (DMD/BMD), and later for the X-linked form of dilated cardiomyopathy (XLCM), exerts a major function in physical force transmission in striated muscle. In addition to its structural significance, dystrophin and other DGC proteins such as syntrophins are required for the

  • correct localization,
  • clustering and
  • regulation of ion channel function.

Syntrophins have been implicated in ion channel regulation.  Syntrophins contain two pleckstrin homology (PH) domains, a PDZ domain, and a syntrophin-unique (SU) C-terminal region. The interaction between syntrophins and dystrophin occurs at the PH domain distal to the syntrophin N-terminus and through the highly conserved SU domain. Conversely, the PH domain proximal to the N-terminal portion of the protein and the PDZ domain interact with other membrane components such as

  1. phosphatidyl inositol-4, 5-bisphosphate,
  2. neuronal NOS (nNOS),
  3. aquaporin-4,
  4. stress-activated protein kinase-3, and
  5. 5,

thereby linking all these molecules to the dystrophin complex (Figure 2).

Among the five known isoforms of syntrophin, the 59 KDa α1-syntrophin isoform is the most highly represented in human heart, whereas in skeletal muscle it is only present on the

  • sarcolemma of fast type II fibers.

In addition, the skeletal muscle γ2-syntrophin was found at high levels only at the

  • postsynaptic membrane of the neuromuscular junctions.

In addition to syntrophin, other scaffolding proteins such as caveolin-3 (CAV3), which is present in the caveolae, flask-shaped plasma membrane microdomains, are involved

  • in signal transduction and vesicle trafficking in myocytes,
  • modulating cardiac remodeling during heart failure.

CAV3 and α1-syntrophin, localizes at the T-tubule and are part of the DGC. In addition, α1-syntrophin binds Nav1.5, while

  • caveolin-3 binds the Na+/Ca2+ exchanger, Nav1.5 and the L-type Ca2+ channel as well as nNOS and the DGC (Figure 2).

Although ankyrin-B is the only protein found mutated in patients with primary arrhythmias, other proteins such as caveolin-3 and the syntrophins if mutated may alter ion channel function.

Conclusions

It is important to be aware of the enormous variety of clinical presentations that derive from distinct variants in the same pool of genetic factors. Knowledge of these variants could facilitate tailoring the therapy of choice for each patient. In particular, the recent findings of structural and functional links between

  • the cytoskeleton and ion channels

could expand the therapeutic interventions in

  • arrhythmia management in structurally abnormal myocardium, where aberrant binding
  • between cytoskeletal proteins can directly or indirectly alter ion channel function.

Executive Summary

Arrhythmogenesis and myocardial structure

  • Rhythm alterations can develop as a secondary consequence of myocardial structural abnormalities or as a result of a primary defect in the cardiac electric machinery.
  • Until recently, no molecular mechanism has been able to fully explain the occurrence of arrhythmogenesis in heart failure, however genetic defects that are found almost exclusively in ion channel genes account for the majority of primary arrhythmias such as long QT syndromes and Brugada syndrome. The contractile apparatus is linked to ion channels
  • The sarcomere, which represents the contractile unit of the myocardium not only generates the mechanical force necessary to exert the pump function, but also provides localization and anchorage to ion channels.
  • Alpha-actinin-2, and telethonin, two members of the Z-line scaffolding protein complex in the striated muscle associate with the potassium voltage-gated channel alpha subunit Kv1.5 and the beta subunit KCNE1 respectively.
  • Mutations in KCNE1 have previously been associated with the development of arrhythmias in LQTS subjects.
  • Mutations in both alpha-actinin-2, and telethonin were identified in individuals with cardiomyopathy. The primary defect is structural leading to ventricular dysfunction, but the secondary consequence is arrhythmia.

Ion channel trafficking and sub-cellular compartments

  • Ion channel trafficking from the endoplasmic reticulum (ER) to the Golgi complex is an important check-point for regulating the functional channel molecules on the plasma membrane. Several molecules acting as chaperones bind to and shuttle the channel proteins to their final localization on the cell surface
  • Ion channel subunits such as Kvβ enhance Kv1.x ion channel presentation on the sarcolemma. The α subunits of the Kv1.x potassium channels can be shuttled in a Kvβ-independent manner through specific sequence motif at Kv1.x protein level.
  • In addition, cytoskeletal proteins such as ankyrin-G bind Nav1.5 and are involved in the sodium channel trafficking. Another member of the ankyrin family, ankyrin-B was found mutated in patients with LQTS but the pathological mechanism of ankyrin-B mutations is still obscure, although the sodium current intensity is dramatically reduced.

The sarcolemma and ion channels

  • The sarcolemma contains a wide range of ion channels, which are responsible for the electrical propagating force in the myocardium.
  • The DGC is a protein complex, which forms a scaffold for cytoskeletal components and ion channels.
  • Dystrophin is the major component of the DGC and mutations in dystrophin and DGC cause muscular dystrophies and X-linked cardiomyopathies (XLCM) in humans. Cardiomyopathies are associated with arrhythmias
  • Caveolin-3 and syntrophins associate with Nav1.5, and are part of the DGC. Syntrophins can directly modulate Nav1.5 channel function.

Conclusions

  • The role of the cytoskeleton in ion channel function has been hypothesized in the past, but only recently the mechanism underlying the development of arrhythmias in structurally impaired myocardium has become clearer.
  • The recently acknowledged role of the cytoskeleton in ion channel function suggests that genes encoding cytoskeletal proteins should be regarded as potential candidates for variants involved in the susceptibility to arrhythmias, as well as the primary target of genetic mutations in patients with arrhythmogenic syndromes such as LQTS and Brugada syndrome.
  • Studies of genotype-phenotype correlation and and patient risk stratification for mutations in cytoskeletal proteins will help to tailor the therapy and management of patients with arrhythmias.

Share this:

  • Share on X (Opens in new window) X
  • Share on LinkedIn (Opens in new window) LinkedIn
  • Share on Facebook (Opens in new window) Facebook
  • Print (Opens in new window) Print
  • Email a link to a friend (Opens in new window) Email

Like this:

Like Loading…

Read Full Post »

Pharmacological Action of Steroid Hormones

Posted in Biochemical pathways, Biological Networks, Gene Regulation and Evolution, Cancer and Current Therapeutics, CANCER BIOLOGY & Innovations in Cancer Therapy, Cell Biology, Chemical Biology and its relations to Metabolic Disease, Curation, Developmental biology, Disease Biology, Disease Biology, Small Molecules in Development of Therapeutic Drugs, Endocrine Diseases, Explanatory, Gene Regulation, Historical relevance, Lipid metabolism, Metabolism, Metabolomics, Molecular Genetics & Pharmaceutical, Nutrigenomics, Nutrition, Pharmaceutical Analytics, Pharmacologic toxicities, Reproductive Andrology, Embryology, Genomic Endocrinology, Preimplantation Genetic Diagnosis and Reproductive Genomics, Technology Advance Assessment of, Translational Science, tagged DNA regulation, drug effects, steroid hormone receptors, steroid hormones on October 27, 2014| Leave a Comment »

Pharmacological Action of Steroid Hormones

Curator: Larry H. Bernstein, MD, FCAP


Hormone Receptors

Steroid hormone receptors are found on the plasma membrane, in the cytosol and also in the nucleus of target cells. They are generally intracellular receptors (typically cytoplasmic) and initiate signal transduction for steroid hormones which lead to changes in gene expression over a time period of hours to days. The best studied steroid hormone receptors are members of the nuclear receptor subfamily 3 (NR3) that include receptors for estrogen (group NR3A)[1] and 3-ketosteroids (group NR3C).[2] In addition to nuclear receptors, several G protein-coupled receptors and ion channels act as cell surface receptors for certain steroid hormones.


Steroid Hormone Receptors and their Response Elements

Steroid hormone receptors are proteins that have a binding site for a particular steroid molecule. Their response elements are DNA sequences that are bound by the complex of the steroid bound to its Steroid receptor.

The response element is part of the promoter of a gene. Binding by the receptor activates or represses, as the case may be, the gene controlled by that promoter.

It is through this mechanism that steroid hormones turn genes on (or off).


steroid hormone receptor

steroid hormone receptor

http://users.rcn.com/jkimball.ma.ultranet/BiologyPages/S/Sigler.jpg


This image (courtesy of P. B. Sigler) shows a stereoscopic view of the glucocorticoid response element (DNA, the double helix shown in yellow at the left of each panel) with the glucocorticoid receptor (a protein homodimer, right portion of each panel) bound to it.


The DNA sequence of the glucocorticoid response element is

  • 5′ AGAACAnnnTGTTCT 3′
  • 3′ TCTTGTnnnACAAGA 5′

where n represents any nucleotide. (Note the inverted repeats.)


The glucocorticoid receptor, like all steroid hormone receptors, is a zinc-finger transcription factor; the zinc atoms are the four yellow spheres. Each is attached to four cysteines.


For a steroid hormone to regulate (turn on or off) gene transcription, its receptor must:

  1. bind to the hormone (cortisol in the case of the glucocorticoid receptor)
  2. bind to a second copy of itself to form a homodimer
  3. be in the nucleus, moving from the cytosol if necessary
  4. bind to its response element
  5. bind to other protein cofactors

Each of these functions depend upon a particular region of the protein (e.g., the zinc fingers for binding DNA). Mutations in any one region may upset the function of that region without necessarily interfering with other functions of the receptor.

Positive and Negative Response Elements

Some of the hundreds of glucocorticoid response elements in the human genome activate gene transcription when bound by the hormone/receptor complex. Others inhibit gene transcription when bound by the hormone/receptor complex.

Example: When the stress hormone cortisol — bound to its receptor — enters the nucleus of a liver cell, the complex binds to

the positive response elements of the many genes needed for gluconeogenesis — the conversion of protein and fat into glucose resulting in a rise in the level of blood sugar.

the negative response element of the insulin receptor gene thus diminishing the ability of the cells to remove glucose from the blood. (This hyperglycemic effect is enhanced by the binding of the cortisol/receptor complex to a negative response element in the beta cells of the pancreas thus reducing the production of insulin.)

Note that every type of cell in the body contains the same response elements in its genome. What determines if a given cell responds to the arrival of a hormone depends on the presence of the hormone’s receptor in the cell.

Visual Evidence of Hormone Binding

This autoradiograph (courtesy of Madhabananda Sar and Walter E. Stumpf) shows the endometrial cells from the uterus of a guinea pig 15 minutes after an injection of radioactive progesterone. The radioactivity has concentrated within the nuclei of the endometrial cells as shown by the dark grains superimposed on the images of the nuclei. The same effect is seen when radioactive estrogens are administered.

The cells of the endometrium are target cells for both progesterone and estrogens, preparing the uterus for possible pregnancy. [Link to discussion]


Endometrium

Endometrium

http://users.rcn.com/jkimball.ma.ultranet/BiologyPages/E/Endometrium.jpg

Nontarget cells (e.g. liver cells or lymphocytes) show no accumulation of female sex hormones. Although their DNA contains the response elements, their cells do not have the protein receptors needed.

 The Nuclear Receptor Superfamily


Retinoids

Retinoids

http://users.rcn.com/jkimball.ma.ultranet/BiologyPages/R/Retinoids.png

 The zinc-finger proteins that serve as receptors for glucocorticoids and progesterone are members of a large family of similar proteins that serve as receptors for a variety of small, hydrophobic molecules. These include:

  1. other steroid hormones like
  2. the mineralocorticoid aldosterone
  3. estrogens
  4. the thyroid hormone, T3
  5. calcitriol, the active form of vitamin D
  6. retinoids: vitamin A (retinol) and its relatives
    1. retinal
    2. retinoic acid (tretinoin — also available as the drug Retin-A®); and its isomer
  7. isotretinoin (sold as Accutane® for the treatment of acne).
  8. bile acids
  9. fatty acids.
The three dimensional crystal structure of holo-retinol binding protein (RBP–ROH)

The three dimensional crystal structure of holo-retinol binding protein (RBP–ROH)


vitamin_d_synthesis


Chemical structures of vitamin A (retinol)

Chemical structures of vitamin A (retinol)


vit D and receptor complex

vit D and receptor complex


These bind members of the superfamily called peroxisome-proliferator-activated receptors (PPARs). They got their name from their initial discovery as the receptors for

  • drugs that increase the number and size of peroxisomes in cells.

In every case, the receptors consist of at least

  • three functional modules or domains.

From N-terminal to C-terminal, these are:

  1. a domain needed
  2. the zinc-finger domain needed for DNA binding (to the response element)
  3. the domain responsible for binding the particular hormone as well as the second unit of the dimer.
  4. for the receptor to activate the promoters of the genes being controlled

The Steroid Hormone Receptors

Klinge, C, Rao, C, Glob. libr. women’s med.,

(ISSN: 1756-2228) 2008;
http://dx.doi.org:/10.3843/GLOWM.10281
Structure of The Steroid Hormone Receptor Protein

In order to understand how steroid hormone receptors regulate gene function, it is important to know the structure of the receptor proteins as well as the identity and cellular function of the genes that they regulate. Members of the steroid receptor superfamily share direct amino acid homology and a common structure (Fig. 1).

Fig. 1 Relative lengths of several members of the steroid/nuclear hormone receptor superfamily, shown schematically as linearized proteins with common structural and functional domains. Variability between members of the steroid hormone receptor family is due primarily to differences in the length and amino acid sequence of the amino (N)-terminal domain. Adapted from Wahli W, Martinez E. Superfamily of steroid nuclear receptors: Positive and negative regulators of gene expression. FASEB J 1991;5:2243-2249.

lengths of steroid hormone receptor superfamily

lengths of steroid hormone receptor superfamily

http://resources.ama.uk.com/glowm_www/graphics/figures/v5/0040/001f.gif

Molecular cloning of the complementary DNA (cDNA) for each of the major steroid receptors has greatly enhanced our understanding of the structure–function relationships for these molecules. The receptor proteins have five or six domains called A–F from N- to C-terminus, encoded by 8–9 exons.  The receptors contain three major functional domains that have been shown experimentally to operate as independent “cassettes”,13 unrestricted as to position within the molecule. The three major functional domains (Fig. 2) of the receptor are:


  1. A variable N-terminus (domains A and B) that confers immunogenicity and modulates transcription in a gene and cell-specific manner through its N-terminal Activation Function-1 (AF-1);
  2. A central DNA-binding domain (DBD, consisting of the C domain), comprised of two functionally distinct zinc fingers through which the receptor physically interacts directly with the DNA helix;
  3. The ligand-binding domain (LBD, domains E and in some receptors F) that contains Activation Function-2 (AF-2).


Fig. 2 Schematic representation of the common structural and functional domains of the steroid hormone receptors. The horizontal lines indicate the domains of the receptor. Adapted from Wahli W, Martinez E. Superfamily of steroid nuclear receptors: Positive and negative regulators of gene expression. FASEB J 1991;5:2243-2249.


http://resources.ama.uk.com/glowm_www/graphics/figures/v5/0040/002f.gif


The F domain is thought to play a role in distinguishing estrogen agonists from antagonists, perhaps through interaction with cell-specific factors. Domain-swapping experiments in which the DBD of estrogen receptor α (ERα) was switched with that of the glucocorticoid receptor (GR), yielded a chimeric receptor that bound to specific DNA sequences bound by GR, but up-regulated transcription of glucocorticoid-responsive target genes when treated with estrogen, thus demonstrating the specificity of the DNA-binding domain in target gene regulation.

The amino (N)-terminal domain is hypervariable (less than 15% homology among steroid receptors) in both size and amino acid sequence, ranging in length from 25 amino acids to 603 amino acids and constituting the major source of size differences between receptors. The AF-1 domain in this region is involved in activation of gene transcription, but does not depend on ligand binding. In rat GR, the AF-1 region is called tau 1 or enh2 and constitutes aa 108–317. Tau 1 is necessary for transcriptional activation and repression. Deletion of the C-terminal LBD of GR yields constitutive (hormone-independent) transcriptional activation, implying that the N-terminal regions harbor autonomous transcriptional activation functions.


Some steroid receptors exist as isoforms, encoded by the same gene, but differing in their N-terminus. The progesterone and androgen receptors (PR and AR) exist in two distinct forms, A and B, synthesized from the same mRNA by alternate splicing. The two PR receptor isoforms differ by 128 amino acids in the N-terminal region, yielding PR-A = 90 kDa and PR-B = 120 kDa, that have strikingly differing capacities to regulate transcription. In contrast, AR-A and AR-B isoforms show minimal differences in activation of a reporter gene in response to androgen agonists or antagonists in transiently transfected cells.

Receptors in this superfamily contain several key structural elements which enable them to bind to their respective ligands with high affinity and specificity, recognize and bind to discrete response elements within the DNA sequence of target genes with high affinity and specificity, and regulate gene transcription.

The central core or DNA-binding domain (DBD) is highly conserved and shows 60–95% homology among steroid receptors.1 The DBD varies in size from 66 to 70 amino acids, and is hydrophilic due to its high content of basic amino acids. The major function of this region is to bind to specific hormone response elements (HREs) of the target gene. DNA-binding is achieved through the tetrahedral coordination of zinc (Zn) by four cysteine residues in each of two extensions, that form two structurally distinct “Zn fingers” (Fig. 3). Zn fingers are common among gene regulatory proteins. Specificity of HRE binding is determined by the more highly conserved hydrophilic first Zn finger (C1), while the second Zn finger (C2) is involved in dimerization and stabilizing DNA binding by ionic interactions with the phosphate backbone of the DNA.18 The D box is involved in HRE half-site spacing recognition. The highly conserved DBD shared by AR, GR, mineralocorticoid receptor (MR), and PR enables them to bind to the same HRE, called the glucocorticoid response element (GRE). The more C-terminal part of the C2 Zn finger and amino acids in the hinge region are involved in receptor dimerization in coordination with amino acids in the hinge region and the LBD.


Fig. 3 Schematic diagram of type II zinc finger proteins characteristic of the DNA-binding domain structure of members of the steroid hormone receptor superfamily. Zinc fingers are common features of many transcription factors, allowing proteins to bind to DNA. Each circle represents one amino acid. The CI zinc finger interacts specifically with five base pairs of DNA and determines the DNA sequence recognized by the particular steroid receptor. The three shaded amino acids indicated by the arrows in the knuckle of the CI zinc finger are in the “P box” that allows HRE sequence discrimination between the GR and ERα. The vertically striped aa within the knuckle of the CII zinc finger constitutes the “D box” that is important for dimerization and contacts with the DNA phosphate backbone. Adapted from Tsai M-J, O’Malley BW. Molecular mechanisms of action of steroid/thyroid receptor superfamily members. Annu Rev Biochem 1994;63:451-483; Gronemeyer H. Transcription activation by estrogen and progesterone receptors. Annu Rev Genet 1991;25:89-123.

type II zinc finger proteins

type II zinc finger proteins

http://resources.ama.uk.com/glowm_www/graphics/figures/v5/0040/003f.gif

The hinge region or D domain is a 40–50 amino acid sequence separating the DNA-binding and ligand-binding domains that contains sequences for receptor dimerization and ligand-dependent and independent nuclear localization sequences (NLSs). The hinge region interacts with nuclear corepressor proteins, and with L7/SPA, a 27 kDa protein that increases the partial agonist activity of certain antagonist-liganded steroid hormone receptors, i.e., tamoxifen-liganded ERα, RU486-occupied PR, or RU486-occupied GR. ….

The carboxy (C)-terminal or ligand-binding domain (LBD) is poorly conserved, ranging in size from 218 to 264 amino acids and is hydrophobic. This region contains the ligand-binding site and dictates hormone binding specificity.

Two human GR isoforms, GRα and GRβ, derived from the same gene by differential splicing at the C-terminus, have been reported. While GRα and GRβ share the first eight exons, they differ in their last two exons, i.e., exons 9α or 9β, spliced into the respective mRNA.40 GRβ was reported to localize in the cell nucleus in the absence of ligand and to block hGRα activity. …

Sequences within the LBD form the binding site for hsp90 that blocks the DBD in the cytosolic, nonliganded GR.40 The CII and CIII regions (Fig. 2) show homology among members of the steroid/nuclear receptor superfamily and are important in forming the ligand binding pocket. …


The Bifunctional Role of Steroid Hormones: Implications for Therapy in Prostate Cancer

Paul Mathew, MD
Review Article | May 15, 2014 | Oncology Journal, Genitourinary Cancers, Prostate Cancer

In a biomarker-driven study reported in 1941, Drs. Huggins and Hodges of the University of Chicago demonstrated reduction in elevated levels of serum acid phosphatase in five men with metastatic prostate cancer treated with estrogens and orchiectomy, whereas three men who received testosterone injections after orchiectomy exhibited increased serum levels of the enzyme. Hitherto, serum elevations of acid phosphatase had been associated strictly with prostate cancer, and Huggins and Hodges thus concluded that androgens activated prostate cancer. Nevertheless, in the years that followed, several investigators experimented with testosterone injections in prostate cancer. Pearson[3] of the Sloan-Kettering Institute reviewed the inconsistent biochemical and clinical responses to testosterone injections associated with these studies and puzzled over two case studies of his own, one of a hormone-naive patient, another of a castration-resistant patient, both of whom had responded to testosterone injection: “These observations invite the development of new concepts to explain the response of these prostatic cancers to alterations in the endocrine environment.”

Table 1: Sex Steroids as Tumor Suppressors (not shown)

ABSTRACT: Ablation of the androgen-signaling axis is currently a dominant theme in developmental therapeutics in prostate cancer. Highly potent inhibitors of androgen biosynthesis and androgen receptor (AR) function have formally improved survival in castration-resistant metastatic disease. Resistance to androgen-ablative strategies arises through diverse mechanisms. Strategies to preserve and extend the success of hormonal therapy while mitigating the emergence of resistance have long been of interest. In preclinical models, intermittent hormonal ablative strategies delay the emergence of resistant stem-cell–driven phenotypes, but clinical studies in hormone-naive disease have not observed more than noninferiority over continual androgen ablation. In castration-resistant disease, response and improvement in subjective quality of life with therapeutic testosterone has been observed, but so too has symptomatic and life-threatening disease acceleration. The multifunctional and paradoxical role of steroid hormones in regulating proliferation and differentiation, as well as cell death, requires deeper understanding. The lack of molecular biomarkers that predict the outcome of hormone supplementation in a particular clinical context remains an obstacle to individualized therapy. Biphasic patterns of response to hormones are identifiable in vitro, and endocrine-regulated neoplasms that proliferate after prolonged periods of hormone deprivation appear preferentially sex steroid–suppressible. This review examines the relevance of a translational framework for studying therapeutic androgens in prostate cancer.


Protection and Damage from Acute and Chronic Stress: Allostasis and Allostatic Overload and Relevance to the Pathophysiology of Psychiatric Disorders

Bruce S. Mcewen*

Annals of the New York Academy of Sciences 12 JAN 2006;
1032 (Biobehavioral Stress Response: Protective and Damaging Effects): Pp1–328

http://dx.doi.org:/10.1196/annals.1314.001


Keywords:

stress;psychiatric disorders;depression;allostasis;allostatic overload;homeostasis

Abstract: Stress promotes adaptation, but prolonged stress leads over time to wear-and-tear on the body (allostatic load). Neural changes mirror the pattern seen in other body systems, that is, short-term adaptation vs. long-term damage. Allostatic load leads to impaired immunity, atherosclerosis, obesity, bone demineralization, and atrophy of nerve cells in the brain. Many of these processes are seen in major depressive illness and may be expressed also in other chronic anxiety disorders. The brain controls the physiological and behavioral coping responses to daily events and stressors. The hippocampal formation expresses high levels of adrenal steroid receptors and is a malleable brain structure that is important for certain types of learning and memory. It is also vulnerable to the effects of stress and trauma. The amygdala mediates physiological and behavioral responses associated with fear. The prefrontal cortex plays an important role in working memory and executive function and is also involved in extinction of learning. All three regions are targets of stress hormones. In animal models, neurons in the hippocampus and prefrontal cortex respond to repeated stress by showing atrophy, whereas neurons in amygdala show a growth response. Yet, these are not necessarily “damaged” and may be treatable with the right medications.

Share this:

  • Share on X (Opens in new window) X
  • Share on LinkedIn (Opens in new window) LinkedIn
  • Share on Facebook (Opens in new window) Facebook
  • Print (Opens in new window) Print
  • Email a link to a friend (Opens in new window) Email

Like this:

Like Loading…

Read Full Post »

Sex Hormones, Adrenal Cortisol, Prostaglandins

Posted in Biological Networks, Cancer and Current Therapeutics, Cell Biology, Disease Biology, Gene Regulation, Gene Regulation and Evolution, Lipid metabolism, Lipids, Metabolism, Metabolomics, Molecular Genetics & Pharmaceutical, Nutrition, Translational Science, tagged adrenal corticosteroids, Estrogen, Progesterone, prostaglandins, sex hormones, steroid hormones, testosterone on October 27, 2014| Leave a Comment »

Sex Hormones, Adrenal Cortisol, Prostaglandins


Curator: Larry H. Bernstein, MD, FCAP

Steroids

A major class of lipids, steroids, have a ring structure of three cyclohexanes and one
cyclopentane in a fused ring system as shown below. There are a variety of functional
groups that may be attached. The main feature, as in all lipids, is the large number of
carbon-hydrogens which make steroids non-polar.

Steroids include such well known compounds as cholesterol, sex hormones, birth
control pills, cortisone, and anabolic steroids.

cholesterol

cholesterol

http://www.elmhurst.edu/~chm/vchembook/images/556cholesterol.gif

 The best known and most abundant steroid in the body is cholesterol. Cholesterol is
formed in brain tissue, nerve tissue, and the blood stream. It is the major compound
found in gallstones and bile salts. Cholesterol also contributes to the formation of
deposits on the inner walls of blood vessels. This topic was covered in the previous
discussion of the lipids series, and extensively in cardiovascular topics.

Cholesterol is synthesized by the liver from carbohydrates and proteins as well as fat.
Therefore, the elimination of cholesterol rich foods from the diet does not necessarily
lower blood cholesterol levels. Some studies have found that if certain unsaturated fats
and oils are substituted for saturated fats, the blood cholesterol level decreases.
The research is incomplete on this problem.

Cholesterol exists as an ester with fatty acids.What is the functional group at carbon 3
which is used to make an ester?
OH is alcohol

What is the feature on carbon 17?
Branched long hydrocarbon chain

Sex Hormones

sex hormones

sex hormones

http://www.elmhurst.edu/~chm/vchembook/images/556sexhormones.gif

 The primary sex hormones, testosterone and estrogen, are responsible for the
development of secondary sex characteristics. Two female sex hormones,
progesterone and estrogen or estradiol control the ovulation cycle. Notice
that the male and female hormones have only slight differences in structures,
but yet have very different physiological effects.

Testosterone promotes the normal development of male genital organs and
is synthesized from cholesterol in the testes. It also promotes secondary male
sexual characteristics such as deep voice, facial and body hair.

Estrogen, along with progesterone regulates changes occurring in the uterus
and ovaries known as the menstrual cycle. Estrogen is synthesized from
testosterone by making the first ring aromatic which results in the loss of a
methyl group and formation of an alcohol group.

List three functional groups in progesterone?
C#3 & #17 are ketones; C#4&5 are alkenes;

What is difference between progesterone and testosterone?
testosterone has C#17 alcohol vs ketone on progesterone

What is difference between testosterone and estrogen?
Estrogen has C#3 alcohol, + aromatic first ring;
no methyl group on C#17

Adrenocorticoid Hormones

The adrenocorticoid hormones are products of the adrenal glands.

The most important mineralcorticoid is aldosterone, which regulates the
reabsorption of sodium and chloride ions in the kidney tubules and increases
the loss of potassium ions.Aldosterone is secreted when blood sodium ion
levels are too low to cause the kidney to retain sodium ions. If sodium
levels are elevated, aldosterone is not secreted, so that some sodium
will be lost in the urine. Aldosterone also controls swelling in the tissues.

Cortisol, the most important glucocortinoid, has the function of increasing
glucose and glycogen concentrations in the body. These reactions are
completed in the liver by taking fatty acids from lipid storage cells and
amino acids from body proteins to make glucose and glycogen.

In addition, cortisol is elevated in the circulation with cytokine mediated
(IL1, IL1, TNFα) inflammatory reaction, called the systemic inflammatory
response syndrome. Its ketone derivative, cortisone, has the ability
to relieve inflammatory effects. Cortisone or similar synthetic derivatives
such as prednisolone are used to treat inflammatory diseases, rheumatoid
arthritis, and bronchial asthma. There are many side effects with the use
of cortisone drugs, such as bone resorption, so there use must be
monitored carefully.  Cortisol is increased pathologically with the growth
of a pituitary gland tumor that secretes adrenocorticotropic hormone
(ACTH), called Addison’s Disease, which is also associated with
hirsuit features.

What is the only difference between cortisol and aldosterone?
Aldosterone has C#13 aldehyde instead of methyl group

cortisone

cortisone

http://www.elmhurst.edu/~chm/vchembook/images/556cortisone.gif

Prostaglandins

Prostaglandins, are like hormones in that they act as chemical messengers,
but do not move to other sites, but work right within the cells where
they are synthesized. (PARACRINE)

Prostaglandins are unsaturated carboxylic acids, consisting of of a 20 carbon
skeleton that also contains a five member ring. They are biochemically
synthesized from the fatty acid, arachidonic acid.

arachidonic acid

arachidonic acid

http://www.elmhurst.edu/~chm/vchembook/images/551arachidonic.gif

 The unique shape of the arachidonic acid caused by a series of cis double
bonds
 helps to put it into position to make the five member ring.

Prostaglandins are unsaturated carboxylic acids, consisting of a

  • 20 carbon skeleton that also contains
  • a five member ring and
  • are based upon the fatty acid, arachidonic acid.

There are a variety of structures one, two, or three double bonds. On the
five member ring there may also be double bonds, a ketone, or alcohol groups.

In PGE2, list all of the functional groups.
one acid; two alkenes; two alcohols; one ketone

What is difference the C=C double bonds?
the upper is cis; the lower is trans.

prostaglandin PGE2

prostaglandin PGE2

http://www.elmhurst.edu/~chm/vchembook/images/556prostaglandin.gif

Functions of Prostaglandins 

There are a variety of physiological effects including:

  1. Activation of the inflammatory response, production of pain, and fever.
    When tissues are damaged, white blood cells flood to the site to
    try to minimize tissue destruction. Prostaglandins are produced
    as a result.
  2. Blood clots form when a blood vessel is damaged. A type of
    prostaglandin called thromboxane stimulates constriction and
    clotting of platelets. Conversely, PGI2, is produced to have the
    opposite effect on the walls of blood vessels where clots
    should not be forming.
  3. Certain prostaglandins are involved with the induction of labor
    and other reproductive processes. PGE2 causes uterine
    contractions and has been used to induce labor.
  4. Prostaglandins are involved in several other organs such as
    the gastrointestinal tract (inhibit acid synthesis and increase
    secretion of protective mucus), increase blood flow in kidneys,
    and leukotriens promote constriction of bronchi associated
    with asthma.

When you see that prostaglandins induce inflammation, pain, and fever,
what comes to mind but aspirin. Aspirin blocks an enzyme called
cyclooxygenase, COX-1 and COX-2, which is involved with the ring
closure and addition of oxygen to arachidonic acid converting to
prostaglandins.

The acetyl group on aspirin is hydrolzed and then bonded to the
alcohol group of serine as an ester. This has the effect of blocking
the channel in the enzyme and arachidonic can not enter the active
site of the enzyme.

By inhibiting or blocking this enzyme, the synthesis of prostaglandins
is blocked, which in turn relives some of the effects of pain and fever.

cox1 aspirin

cox1 aspirin

http://www.elmhurst.edu/~chm/vchembook/images/556coxaspirin.gif

 http://www.elmhurst.edu/~chm/vchembook/

 Sphingolipids

Sphingolipids are a second type of lipid found in cell membranes, particularly
nerve cells and brain tissues. They do not contain glycerol, but retain the
two alcohols with the middle position occupied by an amine.

As shown in the graphic, sphingosine has three parts, a three carbon
chain with two alcohols and amine attached and a long hydrocarbon chain.

http://www.elmhurst.edu/~chm/vchembook/images/556sphingosine.gif

 Structure of Sphingomyelin

In sphingomyelin, the base sphingosine has several other groups attached
as shown in the graphic on the left. A fatty acid is attached to the amine
through amide bond. Phosphate is attached through a phosphate ester bond,
and again through a phosphate ester bond to choline.

The human brain and spinal cord is made up of gray and white regions.
The white region is made of nerve axons wrapped in a white lipid coating,
the myelin sheath, which provides insulation to allow rapid conduction of
electrical signals. Multiple sclerosis caused by a gradual degradation of
the myelin sheath.

Sphingomyleins are located throughout the body in nerve cell membranes.
They make up about 25 % of the lipids in the myelin sheath that surrounds
and insulates cells of the central nervous system.

Niemann-Pick disease is caused by a deficiency of an enzyme that breaks
down excessive sphingomyelin, which then builds up on the liver, spleen,
brain, and bone marrow. An effected child usually dies within several years.

sphingomyelin

sphingomyelin

http://www.elmhurst.edu/~chm/vchembook/images/556sphingomyelin.gif

Glycolipids and Cerebrosides

Glycolipids are complex lipids that contain carbohydrates. Cerebrosides are an
example which contain the sphingosine backbone attached to a fatty acid and
a carbohydrate. The carbohydrates are most often glucose or galactose. Those
that contain several carbohydrates are called gangliosides. The example on the
left is shown with glucose. Glucocerebroside has the specific function to be in
the cell membranes of macrophages, (cells that protect the body by destroying
foreign microorganisms. Galactocerebroside is found almost exclusively in the
membranes of brain cells.

There are several genetic diseases resulting from the absence of specific enzymes
which breakdown the glycolipids. Tay-Sachs, which mainly effects Jewish children,
results in a build up of gangliosides and result in death in several years. Gaucher’s
disease results in the excessive build up of glucocerebroside resulting in severe
anemia and enlarged liver and spleen.

cerebroside

cerebroside

http://www.elmhurst.edu/~chm/vchembook/images/556cerebroside.gif

Share this:

  • Share on X (Opens in new window) X
  • Share on LinkedIn (Opens in new window) LinkedIn
  • Share on Facebook (Opens in new window) Facebook
  • Print (Opens in new window) Print
  • Email a link to a friend (Opens in new window) Email

Like this:

Like Loading…

Read Full Post »

Antimalarial flow synthesis closer to commercialisation

Posted in Advanced Drug Manufacturing Technology, Antimalarial Preparation, CE Mark & Global Regulatory Affairs: process management and strategic planning - GCP, Cell Biology, Chemical Biology and its relations to Metabolic Disease, Commercialization, Curation, Disease Biology, Disease Biology, Small Molecules in Development of Therapeutic Drugs, Experimental validation, FDA, CE Mark & Global Regulatory Affairs: process management and strategic planning - GCP, GLP, ISO 14155, Intellectual Property, Innovations, Commercialization, Investment in technological breakthrough, International Global Work in Pharmaceutical, Investment in Technological Breakthrough, ISO 10993 for Product Registration: FDA & CE Mark for Development of Medical Devices and Diagnostics, Technology Advance Assessment of, tagged antimalarial, artemisin, drud preparation, flow chemistry, Malaria on October 26, 2014| Leave a Comment »

Antimalarial flow synthesis closer to commercialisation.

Share this:

  • Share on X (Opens in new window) X
  • Share on LinkedIn (Opens in new window) LinkedIn
  • Share on Facebook (Opens in new window) Facebook
  • Print (Opens in new window) Print
  • Email a link to a friend (Opens in new window) Email

Like this:

Like Loading…

Read Full Post »

« Newer Posts - Older Posts »

  • Follow Blog via Email

    Enter your email address to follow this blog and receive notifications of new posts by email.

    Join 2,038 other subscribers
  • Recent Posts

    • Novartis and Bristol Myers Squibb halt CAR-T trial for autoimmune diseases over patient deaths: a potential issue with cell-based manufacturing September 15, 2026
    • FDA Contemplates Changes in Trial Design, Drug Development, and Use of AI in Clinical Trials September 15, 2026
    • FDA Moves Forward With Its Guidance Framework for Rare Disease Trials: 2026 August 3, 2026
    • Artificial Intelligence TRANSFORMS Medicine, Biotech and Healthcare, How? August 3, 2026
    • In Memoriam: Nobel Laureate J. Michael Bishop for discovery of Retroviral Oncogenes July 31, 2026
    • Companies Actively Engaging Artificial Intellegence for Drug Design: 2026 July 31, 2026
    • AI-Native Drug Discovery Landscape 2026 – How LPBI Group Differentiates in the New Era of Foundation Models July 19, 2026
    • In Memoriam: In Remembrance of Cancer Researchers who passed in 2026 July 13, 2026
    • Urgent Request for Action on Proposed Rule Affecting Federal Funding Grant Review July 7, 2026
    • 2026 Tang Prize in Biopharmaceutical Science Awarded to Three Pioneers of Cellular Immunotherapy Revolutionizing Treatments for Blood Cancers and Solid Tumors July 5, 2026
  • Archives

  • Categories

  • Meta

    • Log in
    • Entries feed
    • Comments feed
    • WordPress.org
    • 1 2012pharmaceutical
    • 1 sjwilliamspa

Powered by WordPress.com.

WPThemes.


Loading Comments...
%d