Warburg Effect and Mitochondrial Regulation -2.1.3
Writer and Curator: Larry H Bernstein, MD, FCAP
2.1.3 Warburg Effect and Mitochondrial Regulation
Word Cloud by Daniel Menzin
2.1.3.1 Regulation of Substrate Utilization by the Mitochondrial Pyruvate Carrier
NM Vacanti, AS Divakaruni, CR Green, SJ Parker, RR Henry, TP Ciaraldi, et a..
Molec Cell 6 Nov 2014; 56(3):425–435
http://dx.doi.org/10.1016/j.molcel.2014.09.024
Highlights
- Oxidation of fatty acids and amino acids is increased upon MPC inhibition
•Respiration, proliferation, and biosynthesis are maintained when MPC is inhibited
•Glutaminolytic flux supports lipogenesis in the absence of MPC
•MPC inhibition is distinct from hypoxia or complex I inhibition
Summary
Pyruvate lies at a central biochemical node connecting carbohydrate, amino acid, and fatty acid metabolism, and the regulation of pyruvate flux into mitochondria represents a critical step in intermediary metabolism impacting numerous diseases. To characterize changes in mitochondrial substrate utilization in the context of compromised mitochondrial pyruvate transport, we applied 13C metabolic flux analysis (MFA) to cells after transcriptional or pharmacological inhibition of the mitochondrial pyruvate carrier (MPC). Despite profound suppression of both glucose and pyruvate oxidation, cell growth, oxygen consumption, and tricarboxylic acid (TCA) metabolism were surprisingly maintained. Oxidative TCA flux was achieved through enhanced reliance on glutaminolysis through malic enzyme and pyruvate dehydrogenase (PDH) as well as fatty acid and branched-chain amino acid oxidation. Thus, in contrast to inhibition of complex I or PDH, suppression of pyruvate transport induces a form of metabolic flexibility associated with the use of lipids and amino acids as catabolic and anabolic fuels.

oxidation-of-fatty-acids-and-amino-acids
Graphical Abstract – Oxidation of fatty acids and amino acids is increased upon MPC inhibition
Figure 2. MPC Regulates Mitochondrial Substrate Utilization (A) Citrate mass isotopomer distribution (MID) resulting from culture with [U-13C6]glucose (UGlc). (B) Percentage of 13C-labeled metabolites from UGlc. (C) Percentage of fully labeled lactate, pyruvate, and alanine from UGlc. (D) Serine MID resulting from culture with UGlc. (E) Percentage of fully labeled metabolites derived from [U-13C5]glutamine (UGln). (F) Schematic of UGln labeling of carbon atoms in TCA cycle intermediates arising via glutaminoloysis and reductive carboxylation. Mitochondrion schematic inspired by Lewis et al. (2014). (G and H) Citrate (G) and alanine (H) MIDs resulting from culture with UGln. (I) Maximal oxygen consumption rates with or without 3 mM BPTES in medium supplemented with 1 mM pyruvate. (J) Percentage of newly synthesized palmitate as determined by ISA. (K) Contribution of UGln and UGlc to lipogenic AcCoA as determined by ISA. (L) Contribution of glutamine to lipogenic AcCoA via glutaminolysis (ISA using a [3-13C] glutamine [3Gln]) and reductive carboxylation (ISA using a [5-13C]glutamine [5Gln]) under normoxia and hypoxia. (M) Citrate MID resulting from culture with 3Gln. (N) Contribution of UGln and exogenous [3-13C] pyruvate (3Pyr) to lipogenic AcCoA. 2KD+Pyr refers to Mpc2KD cells cultured with 10 mM extracellular pyruvate. Error bars represent SD (A–E, G, H, and M), SEM(I), or 95% confidence intervals(J–L, and N).*p<0.05,**p<0.01,and ***p<0.001 by ANOVA with Dunnett’s post hoc test (A–E and G–I) or * indicates significance by non-overlapping 95% confidence intervals (J–L and N).
Figure 3. Mpc Knockdown Increases Fatty Acid Oxidation. (A) Schematic of changes in flux through metabolic pathways in Mpc2KD relative to control cells. (B) Citrate MID resulting from culture with [U-13C16] palmitate conjugated to BSA (UPalm). (C) Percentage of 13C enrichment resulting from culture with UPalm. (D) ATP-linked and maximal oxygen consumption rate, with or without 20m Metomoxir, with or without 3 mM BPTES. Culture medium supplemented with 0.5 mM carnitine. Error bars represent SD (B and C) or SEM (D). *p < 0.05, **p < 0.01, and ***p < 0.001 by two-tailed, equal variance, Student’s t test(B–D), or by ANOVA with Dunnett’s post hoc test (D).
Figure 4. Metabolic Reprogramming Resulting from Pharmacological Mpc Inhibition Is Distinct from Hypoxia or Complex I Inhibition
2.1.3.2 Oxidation of Alpha-Ketoglutarate Is Required for Reductive Carboxylation in Cancer Cells with Mitochondrial Defects
AR Mullen, Z Hu, X Shi, L Jiang, …, WM Linehan, NS Chandel, RJ DeBerardinis
Cell Reports 12 Jun 2014; 7(5):1679–1690
http://dx.doi.org/10.1016/j.celrep.2014.04.037
Highlights
- Cells with mitochondrial defects use bidirectional metabolism of the TCA cycle
•Glutamine supplies the succinate pool through oxidative and reductive metabolism
•Oxidative TCA cycle metabolism is required for reductive citrate formation
•Oxidative metabolism produces reducing equivalents for reductive carboxylation
Summary
Mammalian cells generate citrate by decarboxylating pyruvate in the mitochondria to supply the tricarboxylic acid (TCA) cycle. In contrast, hypoxia and other impairments of mitochondrial function induce an alternative pathway that produces citrate by reductively carboxylating α-ketoglutarate (AKG) via NADPH-dependent isocitrate dehydrogenase (IDH). It is unknown how cells generate reducing equivalents necessary to supply reductive carboxylation in the setting of mitochondrial impairment. Here, we identified shared metabolic features in cells using reductive carboxylation. Paradoxically, reductive carboxylation was accompanied by concomitant AKG oxidation in the TCA cycle. Inhibiting AKG oxidation decreased reducing equivalent availability and suppressed reductive carboxylation. Interrupting transfer of reducing equivalents from NADH to NADPH by nicotinamide nucleotide transhydrogenase increased NADH abundance and decreased NADPH abundance while suppressing reductive carboxylation. The data demonstrate that reductive carboxylation requires bidirectional AKG metabolism along oxidative and reductive pathways, with the oxidative pathway producing reducing equivalents used to operate IDH in reverse.
Proliferating cells support their growth by converting abundant extracellular nutrients like glucose and glutamine into precursors for macromolecular biosynthesis. A continuous supply of metabolic intermediates from the tricarboxylic acid (TCA) cycle is essential for cell growth, because many of these intermediates feed biosynthetic pathways to produce lipids, proteins and nucleic acids (Deberardinis et al., 2008). This underscores the dual roles of the TCA cycle for cell growth: it generates reducing equivalents for oxidative phosphorylation by the electron transport chain (ETC), while also serving as a hub for precursor production. During rapid growth, the TCA cycle is characterized by large influxes of carbon at positions other than acetyl-CoA, enabling the cycle to remain full even as intermediates are withdrawn for biosynthesis. Cultured cancer cells usually display persistence of TCA cycle activity despite robust aerobic glycolysis, and often require mitochondrial catabolism of glutamine to the TCA cycle intermediate AKG to maintain rapid rates of proliferation (Icard et al., 2012, Hiller and Metallo, 2013).
Some cancer cells contain severe, fixed defects in oxidative metabolism caused by mutations in the TCA cycle or the ETC. These include mutations in fumarate hydratase (FH) in renal cell carcinoma and components of the succinate dehydrogenase (SDH) complex in pheochromocytoma, paraganglioma, and gastrointestinal stromal tumors (Tomlinson et al., 2002, Astuti et al., 2001, Baysal et al., 2000, Killian et al., 2013, Niemann and Muller, 2000). All of these mutations alter oxidative metabolism of glutamine in the TCA cycle. Recently, analysis of cells containing mutations in FH, ETC Complexes I or III, or exposed to the ETC inhibitors metformin and rotenone or the ATP synthase inhibitor oligomycin revealed that turnover of TCA cycle intermediates was maintained in all cases (Mullen et al., 2012). However, the cycle operated in an unusual fashion characterized by conversion of glutamine-derived AKG to isocitrate through a reductive carboxylation reaction catalyzed by NADP+/NADPH-dependent isoforms of isocitrate dehydrogenase (IDH). As a result, a large fraction of the citrate pool carried five glutamine-derived carbons. Citrate could be cleaved to produce acetyl-CoA to supply fatty acid biosynthesis, and oxaloacetate (OAA) to supply pools of other TCA cycle intermediates. Thus, reductive carboxylation enables biosynthesis by enabling cells with impaired mitochondrial metabolism to maintain pools of biosynthetic precursors that would normally be supplied by oxidative metabolism. Reductive carboxylation is also induced by hypoxia and by pseudo-hypoxic states caused by mutations in the von Hippel-Lindau (VHL) tumor suppressor gene (Metallo et al., 2012, Wise et al., 2011).
Interest in reductive carboxylation stems in part from the possibility that inhibiting the pathway might induce selective growth suppression in tumor cells subjected to hypoxia or containing mutations that prevent them from engaging in maximal oxidative metabolism. Hence, several recent studies have sought to understand the mechanisms by which this pathway operates. In vitro studies of IDH1 indicate that a high ratio of NADPH/NADP+ and low citrate concentration activate the reductive carboxylation reaction (Leonardi et al., 2012). This is supported by data demonstrating that reductive carboxylation in VHL-deficient renal carcinoma cells is associated with a low concentration of citrate and a reduced ratio of citrate:AKG, suggesting that mass action can be a driving force to determine IDH directionality (Gameiro et al., 2013b). Moreover, interrupting the supply of mitochondrial NADPH by silencing the nicotinamide nucleotide transhydrogenase (NNT) suppresses reductive carboxylation (Gameiro et al., 2013a). This mitochondrial transmembrane protein catalyzes the transfer of a hydride ion from NADH to NADP+ to generate NAD+ and NADPH. Together, these observations suggest that reductive carboxylation is modulated in part through the mitochondrial redox state and the balance of substrate/products.
Here we used metabolomics and stable isotope tracing to better understand overall metabolic states associated with reductive carboxylation in cells with defective mitochondrial metabolism, and to identify sources of mitochondrial reducing equivalents necessary to induce the reaction. We identified high levels of succinate in some cells using reductive carboxylation, and determined that most of this succinate was formed through persistent oxidative metabolism of AKG. Silencing this oxidative flux by depleting the mitochondrial enzyme AKG dehydrogenase substantially altered the cellular redox state and suppressed reductive carboxylation. The data demonstrate that bidirectional/branched AKG metabolism occurs during reductive carboxylation in cells with mitochondrial defects, with oxidative metabolism producing reducing equivalents to supply reductive metabolism.
Shared metabolomic features among cell lines with cytb or FH mutations
To identify conserved metabolic features associated with reductive carboxylation in cells harboring defective mitochondrial metabolism, we analyzed metabolite abundance in isogenic pairs of cell lines in which one member displayed substantial reductive carboxylation and the other did not. We used a pair of previously described cybrids derived from 143B osteosarcoma cells, in which one cell line contained wild-type mitochondrial DNA (143Bwt) and the other contained a mutation in the cytb gene (143Bcytb), severely reducing complex III function (Rana et al., 2000, Weinberg et al., 2010). The 143Bwt cells primarily use oxidative metabolism to supply the citrate pool while the 143Bcytb cells use reductive carboxylation (Mullen et al., 2012). The other pair, derived from FH-deficient UOK262 renal carcinoma cells, contained either an empty vector control (UOK262EV) or a stably re-expressed wild-type FH allele (UOK262FH). Metabolites were extracted from all four cell lines and analyzed by triple-quadrupole mass spectrometry. We first performed a quantitative analysis to determine the abundance of AKG and citrate in the four cell lines. Both 143Bcytb and UOK262EV cells had less citrate, more AKG, and lower citrate:AKG ratios than their oxidative partners (Fig. S1A-C), consistent with findings from VHL-deficient renal carcinoma cells (Gameiro et al., 2013b).
Next, to identify other perturbations, we profiled the relative abundance of more than 90 metabolites from glycolysis, the pentose phosphate pathway, one-carbon/nucleotide metabolism, the TCA cycle, amino acid degradation, and other pathways (Tables S1 and S2). Each metabolite was normalized to protein content, and relative abundance was determined between cell lines from each pair. Hierarchical clustering (Fig 1A) and principal component analysis (Fig 1B) revealed far greater metabolomic similarities between the members of each pair than between the two cell lines using reductive carboxylation. Only three metabolites displayed highly significant (p<0.005) differences in abundance between the two members of both pairs, and in all three cases the direction of the difference (i.e. higher or lower) was shared in the two cell lines using reductive carboxylation. Proline, a nonessential amino acid derived from glutamine in an NADPH-dependent biosynthetic pathway, was depleted in 143Bcytb and UOK262EV cells (Fig. 1C). 2-hydroxyglutarate (2HG), the reduced form of AKG, was elevated in 143Bcytb and UOK262EV cells (Fig. 1D), and further analysis revealed that while both the L- and D-enantiomers of this metabolite were increased, L-2HG was quantitatively the predominant enantiomer (Fig. S1D). It is likely that 2HG accumulation was related to the reduced redox ratio associated with cytb and FH mutations. Although the sources of 2HG are still under investigation, promiscuous activity of the TCA cycle enzyme malate dehydrogenase produces L-2HG in an NADH-dependent manner (Rzem et al., 2007). Both enantiomers are oxidized to AKG by dehydrogenases (L-2HG dehydrogenase and D-2HG dehydrogenase). It is therefore likely that elevated 2-HG is a consequence of a reduced NAD+/NADH ratio. Consistent with this model, inborn errors of the ETC result in 2-HG accumulation (Reinecke et al., 2011). Exposure to hypoxia (<1% O2) has also been demonstrated to reduce the cellular NAD+/NADH ratio (Santidrian et al., 2013) and to favor modest 2HG accumulation in cultured cells (Wise et al., 2011), although these levels were below those noted in gliomas expressing 2HG-producing mutant alleles of isocitrate dehydrogenase-1 or -2 (Dang et al., 2009).
Figure 1 Metabolomic features of cells using reductive carboxylation
Finally, the TCA cycle intermediate succinate was markedly elevated in both cell lines (Fig. 1E). We tested additional factors previously reported to stimulate reductive AKG metabolism, including a genetic defect in ETC Complex I, exposure to hypoxia, and chemical inhibitors of the ETC (Mullen et al., 2012, Wise et al., 2011, Metallo et al., 2012). These factors had a variable effect on succinate, with impairments of Complex III or IV strongly inducing succinate accumulation, while impairments of Complex I either had little effect or suppressed succinate (Fig. 1F).
Oxidative glutamine metabolism is the primary route of succinate formation
UOK262EV cells lack FH activity and accumulate large amounts of fumarate (Frezza et al., 2011); elevated succinate was therefore not surprising in these cells, because succinate precedes fumarate by one reaction in the TCA cycle. On the other hand, TCA cycle perturbation in 143Bcytb cells results from primary ETC dysfunction, and reductive carboxylation is postulated to be a consequence of accumulated AKG (Anastasiou and Cantley, 2012, Fendt et al., 2013). Accumulation of AKG is not predicted to result in elevated succinate. We previously reported that 143Bcytb cells produce succinate through simultaneous oxidative and reductive glutamine metabolism (Mullen et al., 2012). To determine the relative contributions of these two pathways, we cultured 143Bwt and 143Bcytb with [U-13C]glutamine and monitored time-dependent 13C incorporation in succinate and other TCA cycle intermediates. Oxidative metabolism of glutamine generates succinate, fumarate and malate containing four glutamine-derived 13C nuclei on the first turn of the cycle (m+4), while reductive metabolism results in the incorporation of three 13C nuclei in these intermediates (Fig. S2). As expected, oxidative glutamine metabolism was the predominant source of succinate, fumarate and malate in 143Bwt cells (Fig. 2A-C). In 143Bcytb, fumarate and malate were produced primarily through reductive metabolism (Fig. 2E-F). Conversely, succinate was formed primarily through oxidative glutamine metabolism, with a minor contribution from the reductive carboxylation pathway (Fig. 2D). Notably, this oxidatively-derived succinate was detected prior to that formed through reductive carboxylation. This indicated that 143Bcytb cells retain the ability to oxidize AKG despite the observation that most of the citrate pool bears the labeling pattern of reductive carboxylation. Together, the labeling data in 143Bcytb cells revealed bidirectional metabolism of carbon from glutamine to produce various TCA cycle intermediates.
Figure 2 Oxidative glutamine metabolism is the primary route of succinate formation in cells using reductive carboxylation to generate citrate
Pyruvate carboxylation contributes to the TCA cycle in cells using reductive carboxylation
Because of the persistence of oxidative metabolism, we determined the extent to which other routes of metabolism besides reductive carboxylation contributed to the TCA cycle. We previously reported that silencing the glutamine-catabolizing enzyme glutaminase (GLS) depletes pools of fumarate, malate and OAA, eliciting a compensatory increase in pyruvate carboxylase (PC) to supply the TCA cycle (Cheng et al., 2011). In cells with defective oxidative phophorylation, production of OAA by PC may be preferable to glutamine oxidation because it diminishes the need to recycle reduced electron carriers generated by the TCA cycle. Citrate synthase (CS) can then condense PC-derived OAA with acetyl-CoA to form citrate. To examine the contribution of PC to the TCA cycle, cells were cultured with [3,4-13C]glucose. In this labeling scheme, glucose-derived pyruvate is labeled in carbon 1 (Fig. S3). This label is retained in OAA if pyruvate is carboxylated, but removed as CO2 during conversion of pyruvate to acetyl-CoA by pyruvate dehydrogenase (PDH).
Figure 3 Pyruvate carboxylase contributes to citrate formation in cells using reductive carboxylation
Oxidative metabolism of AKG is required for reductive carboxylation
Oxidative synthesis of succinate from AKG requires two reactions: the oxidative decarboxylation of AKG to succinyl-CoA by AKG dehydrogenase, and the conversion of succinyl-CoA to succinate by succinyl-CoA synthetase. In tumors with mutations in the succinate dehydrogenase (SDH) complex, large accumulations of succinate are associated with epigenetic modifications of DNA and histones to promote malignancy (Kaelin and McKnight, 2013, Killian et al., 2013). We therefore tested whether succinate accumulation per se was required to induce reductive carboxylation in 143Bcytb cells. We used RNA interference directed against the gene encoding the alpha subunit (SUCLG1) of succinyl-CoA synthetase, the last step in the pathway of oxidative succinate formation from glutamine (Fig. 4A). Silencing this enzyme greatly reduced succinate levels (Fig. 4B), but had no effect on the labeling pattern of citrate from [U-13C]glutamine (Fig. 4C). Thus, succinate accumulation is not required for reductive carboxylation.
Figure 5 AKG dehydrogenase is required for reductive carboxylation
Figure 6 AKG dehydrogenase and NNT contribute to NAD+/NADH ratio
Finally, we tested whether these enzymes also controlled the NADP+/NADPH ratio in 143Bcytb cells. Silencing either OGDH or NNT increased the NADP+/NADPH ratio (Fig. 6F,G), whereas silencing IDH2reduced it (Fig. 6H). Together, these data are consistent with a model in which persistent metabolism of AKG by AKG dehydrogenase produces NADH that supports reductive carboxylation by serving as substrate for NNT-dependent NADPH formation, and that IDH2 is a major consumer of NADPH during reductive carboxylation (Fig. 6I).
Reductive carboxylation of AKG initiates a non-conventional form of metabolism that produces TCA cycle intermediates when oxidative metabolism is impaired by mutations, drugs or hypoxia. Because NADPH-dependent isoforms of IDH are reversible, supplying supra-physiological pools of substrates on either side of the reaction drives function of the enzyme as a reductive carboxylase or an oxidative decarboxylase. Thus, in some circumstances reductive carboxylation may operate in response to a mass effect imposed by drastic changes in the abundance of AKG and isocitrate/citrate. However, reductive carboxylation cannot occur without a source of reducing equivalents to produce NADPH. The current work demonstrates that AKG dehydrogenase, an NADH-generating enzyme complex, is required to maintain a low NAD+/NADH ratio for reductive carboxylation of AKG. Thus, reductive carboxylation not only coexists with oxidative metabolism of AKG, but depends on it. Furthermore, silencing NNT, a consumer of NADH, also perturbs the redox ratio and suppresses reductive formation of citrate. These observations suggest that the segment of the oxidative TCA cycle culminating in succinate is necessary to transmit reducing equivalents to NNT for the reductive pathway (Fig 6I).
Succinate accumulation was observed in cells with cytb or FH mutations. However, this accumulation was dispensable for reductive carboxylation, because silencing SUCLG1 expression had no bearing on the pathway as long as AKG dehydrogenase was active. Furthermore, succinate accumulation was not a universal finding of cells using reductive carboxylation. Rather, high succinate levels were observed in cells with distal defects in the ETC (complex III: antimycin, cytb mutation; complex IV: hypoxia) but not defects in complex I (rotenone, metformin, NDUFA1 mutation). These differences reflect the known suppression of SDH activity when downstream components of the ETC are impaired, and the various mechanisms by which succinate may be formed through either oxidative or reductive metabolism. Succinate has long been known as an evolutionarily conserved anaerobic end product of amino acid metabolism during prolonged hypoxia, including in diving mammals (Hochachka and Storey, 1975, Hochachka et al., 1975). The terminal step in this pathway is the conversion of fumarate to succinate using the NADH-dependent “fumarate reductase” system, essentially a reversal of succinate dehydrogenase/ETC complex II (Weinberg et al., 2000, Tomitsuka et al., 2010). However, this process requires reducing equivalents to be passed from NADH to complex I, then to Coenzyme Q, and eventually to complex II to drive the reduction of fumarate to succinate. Hence, producing succinate through reductive glutamine metabolism would require functional complex I. Interestingly, the fumarate reductase system has generally been considered as a mechanism to maintain a proton gradient under conditions of defective ETC activity. Our data suggest that the system is part of a more extensive reorganization of the TCA cycle that also enables reductive citrate formation.
In summary, we demonstrated that branched AKG metabolism is required to sustain levels of reductive carboxylation observed in cells with mitochondrial defects. The organization of this branched pathway suggests that it serves as a relay system to maintain the redox requirements for reductive carboxylation, with the oxidative arm producing reducing equivalents at the level of AKG dehydrogenase and NNT linking this activity to the production of NADPH to be used in the reductive carboxylation reaction. Hence, impairment of the oxidative arm prevents maximal engagement of reductive carboxylation. As both NNT and AKG dehydrogenase are mitochondrial enzymes, the work emphasizes the flexibility of metabolic systems in the mitochondria to fulfill requirements for redox balance and precursor production even when the canonical oxidative function of the mitochondria is impaired.
2.1.3.3 Rewiring Mitochondrial Pyruvate Metabolism. Switching Off the Light in Cancer Cells
Peter W. Szlosarek, Suk Jun Lee, Patrick J. Pollard
Molec Cell 6 Nov 2014; 56(3): 343–344
http://dx.doi.org/10.1016/j.molcel.2014.10.018
Figure 1. MPC Expression and Metabolic Targeting of Mitochondrial Pyruvate High MPC expression (green) is associated with more favorable tumor prognosis, increased pyruvate oxidation, and reduced lactate and ROS, whereas low expression or mutated MPC is linked to poor tumor prognosis and increased anaplerotic generation of OAA. Dual targeting of MPC and GDH with small molecule inhibitors may ameliorate tumorigenesis in certain cancer types.
The study by Yang et al., (2014) provides evidence for the metabolic flexibility to maintain TCA cycle function. Using isotopic labeling, the authors demonstrated that inhibition of MPCs by a specific compound (UK5099) induced glutamine-dependent acetyl-CoA formation via glutamate dehydrogenase (GDH). Consequently, and in contrast to single agent treatment, simultaneous administration of MPC and GDH inhibitors drastically abrogated the growth of cancer cells (Figure 1). These studies have also enabled a fresh perspective on metabolism in the clinic and emphasized a need for high-quality translational studies to assess the role of mitochondrial pyruvate transport in vivo. Thus, integrating the biomarker of low MPC expression with dual inhibition of
MPC and GDH as a synthetic lethal strategy (Yang et al., 2014) is testable and may offer a novel therapeutic window for patients (DeBerardinis and Thompson, 2012). Indeed, combinatorial targeting of cancer metabolism may prevent early drug resistance and lead to enhanced tumor control, as shown recently for antifolate agents combined with arginine deprivation with modulation of intracellular glutamine (Szlosarek, 2014). Moreover, it will be important to assess both intertumoral and intratumoral metabolic heterogeneity going forward, as tumor cells are highly adaptable with respect to the precursors used to fuel the TCA cycle in the presence of reduced pyruvate transport. The observation by Vacanti et al. (2014) that the flux of BCAAs increased following inhibition of MPC activity may also underlie the increase in BCAAs detected in the plasma of patients several years before a clinical diagnosis of pancreatic cancer (Mayers et al., 2014). Since measuring pyruvate transport via the MPC is technically challenging, the use of 18-FDG positron emission tomography and more recently magnetic spectroscopy with hyperpolarized 13C-labeled pyruvate will need to be incorporated into these future studies (Brindle et al., 2011).
References
Bricker, D.K., Taylor, E.B., Schell, J.C., Orsak, T., Boutron, A., Chen, Y.C., Cox, J.E., Cardon, C.M., Van Vranken, J.G., Dephoure, N., et al. (2012). Science 337, 96–100.
Brindle, K.M., Bohndiek, S.E., Gallagher, F.A., and Kettunen, M.I. (2011). Magn. Reson. Med. 66, 505–519.
DeBerardinis, R.J., and Thompson, C.B. (2012). Cell 148, 1132–1144.
Herzig, S., Raemy, E., Montessuit, S., Veuthey, J.L., Zamboni, N., Westermann, B., Kunji, E.R., and Martinou, J.C. (2012). Science 337, 93–96.
Mayers, J.R., Wu, C., Clish, C.B., Kraft, P., Torrence, M.E., Fiske, B.P., Yuan, C., Bao, Y., Townsend, M.K., Tworoger, S.S., et al. (2014). Nat. Med. 20, 1193–1198.
Metallo, C.M., and Vander Heiden, M.G. (2013). Mol. Cell 49, 388–398.
Schell, J.C., Olson, K.A., Jiang, L., Hawkins, A.J., Van Vranken, J.G., et al. (2014). Mol. Cell 56, this issue, 400–413.
Szlosarek, P.W. (2014). Proc. Natl. Acad. Sci. USA 111, 14015–14016.
Vacanti, N.M., Divakaruni, A.S., Green, C.R., Parker, S.J., Henry, R.R., et al. (2014). Mol. Cell 56, this issue, 425–435.
Yang, C., Ko, B., Hensley, C.T., Jiang, L., Wasti, A.T., et al. (2014). Mol. Cell 56, this issue, 414–424.
2.1.3.4 Betaine is a positive regulator of mitochondrial respiration
Lee I
Biochem Biophys Res Commun. 2015 Jan 9; 456(2):621-5.
http://dx.doi.org:/10.1016/j.bbrc.2014.12.005
Highlights
- Betaine enhances cytochrome c oxidase activity and mitochondrial respiration.
• Betaine increases mitochondrial membrane potential and cellular energy levels.
• Betaine’s anti-tumorigenic effect might be due to a reversal of the Warburg effect.
Betaine protects cells from environmental stress and serves as a methyl donor in several biochemical pathways. It reduces cardiovascular disease risk and protects liver cells from alcoholic liver damage and nonalcoholic steatohepatitis. Its pretreatment can rescue cells exposed to toxins such as rotenone, chloroform, and LiCl. Furthermore, it has been suggested that betaine can suppress cancer cell growth in vivo and in vitro. Mitochondrial electron transport chain (ETC) complexes generate the mitochondrial membrane potential, which is essential to produce cellular energy, ATP. Reduced mitochondrial respiration and energy status have been found in many human pathological conditions including aging, cancer, and neurodegenerative disease. In this study we investigated whether betaine directly targets mitochondria. We show that betaine treatment leads to an upregulation of mitochondrial respiration and cytochrome c oxidase activity in H2.35 cells, the proposed rate limiting enzyme of ETC in vivo. Following treatment, the mitochondrial membrane potential was increased and cellular energy levels were elevated. We propose that the anti-proliferative effects of betaine on cancer cells might be due to enhanced mitochondrial function contributing to a reversal of the Warburg effect.
2.1.3.5 Mitochondrial dysfunction in human non-small-cell lung cancer cells to TRAIL-induced apoptosis by reactive oxygen species and Bcl-XL/p53-mediated amplification mechanisms
Y-L Shi, S Feng, W Chen, Z-C Hua, J-J Bian and W Yin
Cell Death and Disease (2014) 5, e1579
http://dx.doi.org:/10.1038/cddis.2014.547
Tumor necrosis factor-related apoptosis-inducing ligand (TRAIL) is a promising agent for anticancer therapy; however, non-small-cell lung carcinoma (NSCLC) cells are relatively TRAIL resistant. Identification of small molecules that can restore NSCLC susceptibility to TRAIL-induced apoptosis is meaningful. We found here that rotenone, as a mitochondrial respiration inhibitor, preferentially increased NSCLC cells sensitivity to TRAIL-mediated apoptosis at subtoxic concentrations, the mechanisms by which were accounted by the upregulation of death receptors and the downregulation of c-FLIP (cellular FLICE-like inhibitory protein). Further analysis revealed that death receptors expression by rotenone was regulated by p53, whereas c-FLIP downregulation was blocked by Bcl-XL overexpression. Rotenone triggered the mitochondria-derived reactive oxygen species (ROS) generation, which subsequently led to Bcl-XL downregulation and PUMA upregulation. As PUMA expression was regulated by p53, the PUMA, Bcl-XL and p53 in rotenone-treated cells form a positive feedback amplification loop to increase the apoptosis sensitivity. Mitochondria-derived ROS, however, promote the formation of this amplification loop. Collectively, we concluded that ROS generation, Bcl-XL and p53-mediated amplification mechanisms had an important role in the sensitization of NSCLC cells to TRAIL-mediated apoptosis by rotenone. The combined TRAIL and rotenone treatment may be appreciated as a useful approach for the therapy of NSCLC that warrants further investigation.
Abbreviations: c-FLIP, cellular FLICE-like inhibitory protein; DHE, dihydroethidium; DISC, death-inducing signaling complex; DPI, diphenylene iodonium; DR4/DR5, death receptor 4/5; EB, ethidium bromide; FADD, Fas-associated protein with death domain; MnSOD, manganese superoxide; NAC, N-acetylcysteine; NSCLC, non-small-cell lung carcinoma; PBMC, peripheral blood mononuclear cells; ROS, reactive oxygen species; TRAIL, tumor necrosis factor-related apoptosis-inducing ligand; UPR, unfolded protein response.
Tumor necrosis factor-related apoptosis-inducing ligand (TRAIL) has emerged as a promising cancer therapeutic because it can selectively induce apoptosis in tumor cells in vitro, and most importantly, in vivo with little adverse effect on normal cells.1 However, a number of cancer cells are resistant to TRAIL, especially highly malignant tumors such as lung cancer.2, 3 Lung cancer, especially the non-small-cell lung carcinoma (NSCLC) constitutes a heavy threat to human life. Presently, the morbidity and mortality of NSCLC has markedly increased in the past decade,4 which highlights the need for more effective treatment strategies.
TRAIL has been shown to interact with five receptors, including the death receptors 4 and 5 (DR4 and DR5), the decoy receptors DcR1 and DcR2, and osteoprotegerin.5 Ligation of TRAIL to DR4 or DR5 allows for the recruitment of Fas-associated protein with death domain (FADD), which leads to the formation of death-inducing signaling complex (DISC) and the subsequent activation of caspase-8/10.6 The effector caspase-3 is activated by caspase-8, which cleaves numerous regulatory and structural proteins resulting in cell apoptosis. Caspase-8 can also cleave the Bcl-2 inhibitory BH3-domain protein (Bid), which engages the intrinsic apoptotic pathway by binding to Bcl-2-associated X protein (Bax) and Bcl-2 homologous antagonist killer (BAK). The oligomerization between Bcl-2 and Bax promotes the release of cytochrome c from mitochondria to cytosol, and facilitates the formation of apoptosome and caspase-9 activation.7 Like caspase-8, caspase-9 can also activate caspase-3 and initiate cell apoptosis. Besides apoptosis-inducing molecules, several apoptosis-inhibitory proteins also exist and have function even when apoptosis program is initiated. For example, cellular FLICE-like inhibitory protein (c-FLIP) is able to suppress DISC formation and apoptosis induction by sequestering FADD.8, 9, 10, 11
Until now, the recognized causes of TRAIL resistance include differential expression of death receptors, constitutively active AKT and NF-κB,12, 13overexpression of c-FLIP and IAPs, mutations in Bax and BAK gene.2 Hence, resistance can be overcome by the use of sensitizing agents that modify the deregulated death receptor expression and/or apoptosis signaling pathways in cancer cells.5 Many sensitizing agents have been developed in a variety of tumor cell models.2 Although the clinical effectiveness of these agents needs further investigation, treatment of TRAIL-resistant tumor cells with sensitizing agents, especially the compounds with low molecular weight, as well as prolonged plasma half-life represents a promising trend for cancer therapy.
Mitochondria emerge as intriguing targets for cancer therapy. Metabolic changes affecting mitochondria function inside cancer cells endow these cells with distinctive properties and survival advantage worthy of drug targeting, mitochondria-targeting drugs offer substantial promise as clinical treatment with minimal side effects.14, 15, 16 Rotenone is a potent inhibitor of NADH oxidoreductase in complex I, which demonstrates anti-neoplastic activity on a variety of cancer cells.17, 18, 19, 20, 21 However, the neurotoxicity of rotenone limits its potential application in cancer therapy. To avoid it, rotenone was effectively used in combination with other chemotherapeutic drugs to kill cancerous cells.22
In our previous investigation, we found that rotenone was able to suppress membrane Na+,K+-ATPase activity and enhance ouabain-induced cancer cell death.23 Given these facts, we wonder whether rotenone may also be used as a sensitizing agent that can restore the susceptibility of NSCLC cells toward TRAIL-induced apoptosis, and increase the antitumor efficacy of TRAIL on NSCLC. To test this hypothesis, we initiated this study.
Rotenone sensitizes NSCLC cell lines to TRAIL-induced apoptosis
Four NSCLC cell lines including A549, H522, H157 and Calu-1 were used in this study. As shown in Figure 1a, the apoptosis induced by TRAIL alone at 50 or 100 ng/ml on A549, H522, H157 and Calu-1 cells was non-prevalent, indicating that these NSCLC cell lines are relatively TRAIL resistant. Interestingly, when these cells were treated with TRAIL combined with rotenone, significant increase in cell apoptosis was observed. To examine whether rotenone was also able to sensitize normal cells to TRAIL-mediated apoptosis, peripheral blood mononuclear cell (PBMC) isolated from human blood were used. As a result, rotenone failed to sensitize human PBMC to TRAIL-induced apoptosis, indicating that the sensitizing effect of rotenone is tumor cell specific. Of note, the apoptosis-enhancing effect of rotenone occurred independent of its cytotoxicity, because the minimal dosage required for rotenone to cause toxic effect on NSCLC cell lines was 10 μM, however, rotenone augmented TRAIL-mediated apoptosis when it was used as little as 10 nM.
http://www.nature.com/cddis/journal/v5/n12/fig_tab/cddis2014547f1.html#figure-title
To further confirm the effect of rotenone, cells were stained with Hoechst and observed under fluorescent microscope (Figure 1b). Consistently, the combined treatment of rotenone with TRAIL caused significant nuclear fragmentation in A549, H522, H157 and Calu-1 cells. Rotenone or TRAIL treatment alone, however, had no significant effect.
Caspases activation is a hallmark of cell apoptosis. In this study, the enzymatic activities of caspases including caspase-3, -8 and -9 were measured by flow cytometry by using FITC-conjugated caspases substrate (Figure 1c). As a result, rotenone used at 1 μM or TRAIL used at 100 ng/ml alone did not cause caspase-3, -8 and -9 activation. The combined treatment, however, significantly increased the enzymatic activities of them. Moreover, A549 or H522 cell apoptosis by TRAIL combined with rotenone was almost completely suppressed in the presence of z-VAD.fmk, a pan-caspase inhibitor (Figure 1d). All of these data indicate that both intrinsic and extrinsic pathways are involved in the sensitizing effect of rotenone on TRAIL-mediated apoptosis in NSCLC.
Upregulation of death receptors expression is required for rotenone-mediated sensitization to TRAIL-induced apoptosis
Sensitization to TRAIL-induced apoptosis has been explained in some studies by upregulation of death receptors,24 whereas other results show that sensitization can occur without increased TRAIL receptor expression.25 As such, we examined TRAIL receptors expression on NSCLC cells after treatment with rotenone. Rotenone increased DR4 and DR5 mRNA levels in A549 cells in a time or concentration-dependent manner (Figures 2a and b), also increased DR4 and DR5 protein expression levels (Supplementary Figure S1). Notably, rotenone failed to increase DR5 mRNA levels in H157 and Calu-1 cells (Supplementary Figure S2). To observe whether the increased DR4 and DR5 mRNA levels finally correlated with the functional molecules, we examined the surface expression levels of DR4 and DR5 by flow cytometry. The results, as shown in Figure 2c demonstrated that the cell surface expression levels of DR4 and DR5 were greatly upregulated by rotenone in either A549 cells or H522 cells.
http://www.nature.com/cddis/journal/v5/n12/fig_tab/cddis2014547f2.html#figure-title
To analyze whether the upregulation of DR4 and DR5 is a ‘side-effect’, or contrarily, necessary for rotenone-mediated sensitization to TRAIL-induced apoptosis, we blocked upregulation of the death receptors by small interfering RNAs (siRNAs) against DR4 and DR5 (Supplementary Figure S3). The results showed that blocking DR4 and DR5 expression alone significantly reduced the rate of cell apoptosis in A549 cells (Figure 2d). However, the highest inhibition of apoptosis was observed when upregulation of both receptors was blocked in parallel, thus showing an additive effect of blocking DR4 and DR5 at the same time. Similar results were also obtained in H522 cells
To analyze whether the upregulation of DR4 and DR5 is a ‘side-effect’, or contrarily, necessary for rotenone-mediated sensitization to TRAIL-induced apoptosis, we blocked upregulation of the death receptors by small interfering RNAs (siRNAs) against DR4 and DR5 (Supplementary Figure S3). The results showed that blocking DR4 and DR5 expression alone significantly reduced the rate of cell apoptosis in A549 cells (Figure 2d). However, the highest inhibition of apoptosis was observed when upregulation of both receptors was blocked in parallel, thus showing an additive effect of blocking DR4 and DR5 at the same time. Similar results were also obtained in H522 cells.
Rotenone-induced p53 activation regulates death receptors upregulation
TRAIL receptors DR4 and DR5 are regulated at multiple levels. At transcriptional level, studies suggest that several transcriptional factors including NF-κB, p53 and AP-1 are involved in DR4 or DR5 gene transcription.2 The NF-κB or AP-1 transcriptional activity was further modulated by ERK1/2, JNK and p38 MAP kinase activity. Unexpectedly, we found here that none of these MAP kinases inhibitors were able to suppress the apoptosis mediated by TRAIL plus rotenone (Figure 3a). To find out other possible mechanisms, we observed that rotenone was able to stimulate p53 phosphorylation as well as p53 protein expression in A549 and H522 cells (Figure 3b). As a p53-inducible gene, p21 mRNA expression was also upregulated by rotenone treatment in a time-dependent manner (Figure 3c). To characterize the effect of p53, A549 cells were transfected with p53 siRNA. The results, as shown in Figure 3d-1 demonstrated that rotenone-mediated surface expression levels of DR4 and DR5 in A549 cells were largely attenuated by siRNA-mediated p53 expression silencing. Control siRNA, however, failed to reveal such effect. Similar results were also obtained in H522 cells (Figure 3d-2). Silencing of p53 expression in A549 cells also partially suppressed the apoptosis induced by TRAIL plus rotenone (Figure 3e).
http://www.nature.com/cddis/journal/v5/n12/fig_tab/cddis2014547f3.html#figure-title
Rotenone suppresses c-FLIP expression and increases the sensitivity of A549 cells to TRAIL-induced apoptosis
The c-FLIP protein has been commonly appreciated as an anti-apoptotic molecule in death receptor-mediated cell apoptosis. In this study, rotenone treatment led to dose-dependent downregulation of c-FLIP expression, including c-FLIPL and c-FLIPs in A549 cells (Figure 4a-1), H522 cells (Figure 4a-2), H441 and Calu-1 cells (Supplementary Figure S4). To test whether c-FLIP is essential for the apoptosis enhancement, A549 cells were transfected with c-FLIPL-overexpressing plasmids. As shown in Figure 4b-1, the apoptosis of A549 cells after the combined treatment was significantly reduced when c-FLIPL was overexpressed. Similar results were also obtained in H522 cells (Figure 4b-2).
http://www.nature.com/cddis/journal/v5/n12/fig_tab/cddis2014547f4.html#figure-title
Bcl-XL is involved in the apoptosis enhancement by rotenone
Notably, c-FLIP downregulation by rotenone in NSCLC cells was irrelevant to p53 signaling (data not shown). To identify other mechanism involved, we found that anti-apoptotic molecule Bcl-XL was also found to be downregulated by rotenone in a dose-dependent manner (Figure 5a). Notably, both Bcl-XL and c-FLIPL mRNA levels remained unchanged in cells after rotenone treatment (Supplementary Figure S5). Bcl-2 is homolog to Bcl-XL. But surprisingly, Bcl-2 expression was almost undetectable in A549 cells. To examine whether Bcl-XL is involved, A549 cells were transfected with Bcl-XL-overexpressing plasmid. As compared with mock transfectant, cell apoptosis induced by TRAIL plus rotenone was markedly suppressed under the condition of Bcl-XL overexpression (Figure 5b). To characterize the mechanisms, surface expression levels of DR4 and DR5 were examined. As shown in Figure 5c, the increased surface expression of DR4 and DR5 in A549 cells, or in H522 cells were greatly reduced after Bcl-XLoverexpression (Figure 5c). In addition, Bcl-XL overexpression also significantly prevented the downregulation of c-FLIPL and c-FLIPs expression in A549 cells by rotenone treatment (Figure 5d).
http://www.nature.com/cddis/journal/v5/n12/fig_tab/cddis2014547f5.html#figure-title
Rotenone suppresses the interaction between BCL-XL/p53 and increases PUMA transcription
Lines of evidence suggest that Bcl-XL has a strong binding affinity with p53, and can suppress p53-mediated tumor cell apoptosis.26 In this study, FLAG-tagged Bcl-XL and HA-tagged p53 were co-transfected into cells; immunoprecipitation experiment was performed by using FLAG antibody to immunoprecipitate HA-tagged p53. As a result, we found that at the same amount of p53 protein input, rotenone treatment caused a concentration-dependent suppression of the protein interaction between Bcl-XL and p53 (Figure 6a). Rotenone also significantly suppressed the interaction between endogenous Bcl-XL and p53 when polyclonal antibody against p53 was used to immunoprecipitate cellular Bcl-XL (Figure 6b). Recent study highlighted the importance of PUMA in BCL-XL/p53 interaction and cell apoptosis.27 We found here that rotenone significantly increased PUMA gene transcription (Figure 6c) and protein expression (Figure 6d) in NSCLC cells, but not in transformed 293T cell. Meanwhile, this effect was attenuated by silencing of p53 expression (Figure 6e).
http://www.nature.com/cddis/journal/v5/n12/fig_tab/cddis2014547f6.html#figure-title
Mitochondria-derived ROS are responsible for the apoptosis-enhancing effect of rotenone
As an inhibitor of mitochondrial respiration, rotenone was found to induce reactive oxygen species (ROS) generation in a variety of transformed or non-transformed cells.20, 22 Consistently, by using 2′,7′-dichlorofluorescin diacetate (DCFH) for the measurement of intracellular H2O2 and dihydroethidium (DHE) for O2.−, we found that rotenone significantly triggered the .generation of H2O2(Figure 7a) and O2.− (Figure 7b) in A549 and H522 cells. To identify the origin of ROS production, we first incubated cells with diphenylene iodonium (DPI), a potent inhibitor of plasma membrane NADP/NADPH oxidase. The results showed that DPI failed to suppress rotenone-induced ROS generation (Figure 7c). Then, we generated A549 cells deficient in mitochondria DNA by culturing cells in medium supplemented with ethidium bromide (EB). These mtDNA-deficient cells were subject to rotenone treatment, and the result showed that rotenone-induced ROS production were largely attenuated in A549 ρ° cells, but not wild-type A549 cells, suggesting ROS are mainly produced from mitochondria (Figure 7d). Notably, the sensitizing effect of rotenone on TRAIL-induced apoptosis in A549 cells was largely dependent on ROS, because the antioxidant N-acetylcysteine (NAC) treatment greatly suppressed the cell apoptosis, as shown in annexin V/PI double staining experiment (Figure 7e), cell cycle analysis (Figure 7f) and caspase-3 cleavage activity assay (Figure 7g). Finally, in A549 cells stably transfected with manganese superoxide (MnSOD) and catalase, apoptosis induced by TRAIL and rotenone was partially reversed (Figure 7h). All of these data suggest that mitochondria-derived ROS, including H2O2 and O2.−, are responsible for the apoptosis-enhancing effect of rotenone.
http://www.nature.com/cddis/journal/v5/n12/fig_tab/cddis2014547f7.html#figure-title
Rotenone promotes BCl-XL degradation and PUMA transcription in ROS-dependent manner
To understand why ROS are responsible for the apoptosis-enhancing effect of rotenone, we found that rotenone-induced suppression of BCL-XL expression can be largely reversed by NAC treatment (Figure 8a). To examine whether this effect of rotenone occurs at posttranslational level, we used cycloheximide (CHX) to halt protein synthesis, and found that the rapid degradation of Bcl-XL by rotenone was largely attenuated in A549 ρ0 cells (Figure 8b). Similarly, rotenone-induced PUMA upregulation was also significantly abrogated in A549 ρ0 cells (Figure 8c). Finally, A549 cells were inoculated into nude mice to produce xenografts tumor model. In this model, the therapeutic effect of TRAIL combined with rotenone was evaluated. Notably, in order to circumvent the potential neurotoxic adverse effect of rotenone, mice were challenged with rotenone at a low concentration of 0.5 mg/kg. The results, as shown in Figure 8d revealed that while TRAIL or rotenone alone remained unaffected on A549 tumor growth, the combined therapy significantly slowed down the tumor growth. Interestingly, the tumor-suppressive effect of TRAIL plus rotenone was significantly attenuated by NAC (P<0.01). After experiment, tumors were removed and the caspase-3 activity in tumor cells was analyzed by flow cytometry. Consistently, the caspase-3 cleavage activities were significantly activated in A549 cells from animals challenged with TRAIL plus rotenone, meanwhile, this effect was attenuated by NAC (Figure 8e). The similar effect of rotenone also occurred in NCI-H441 xenografts tumor model (Supplementary Figure S6).
http://www.nature.com/cddis/journal/v5/n12/fig_tab/cddis2014547f8.html#figure-title
Restoration of cancer cells susceptibility to TRAIL-induced apoptosis is becoming a very useful strategy for cancer therapy. In this study, we provided evidence that rotenone increased the apoptosis sensitivity of NSCLC cells toward TRAIL by mechanisms involving ROS generation, p53 upregulation, Bcl-XL and c-FLIP downregulation, and death receptors upregulation. Among them, mitochondria-derived ROS had a predominant role. Although rotenone is toxic to neuron, increasing evidence also demonstrated that it was beneficial for improving inflammation, reducing reperfusion injury, decreasing virus infection or triggering cancer cell death. We identified here another important characteristic of rotenone as a tumor sensitizer in TRAIL-based cancer therapy, which widens the application potential of rotenone in disease therapy.
As Warburg proposed the cancer ‘respiration injury’ theory, increasing evidence suggest that cancer cells may have mitochondrial dysfunction, which causes cancer cells, compared with the normal cells, are under increased generation of ROS.33 The increased ROS in cancer cells have a variety of biological effects. We found here that rotenone preferentially increased the apoptosis sensitivity of cancer cells toward TRAIL, further confirming the concept that although tumor cells have a high level of intracellular ROS, they are more sensitive than normal cells to agents that can cause further accumulation of ROS.
Cancer cells stay in a stressful tumor microenvironment including hypoxia, low nutrient availability and immune infiltrates. These conditions, however, activate a range of stress response pathways to promote tumor survival and aggressiveness. In order to circumvent TRAIL-mediated apoptotic clearance, the expression levels of DR4 and DR5 in many types of cancer cells are nullified, but interestingly, they can be reactivated when cancer cells are challenged with small chemical molecules. Furthermore, those small molecules often take advantage of the stress signaling required for cancer cells survival to increase cancer cells sensitivity toward TRAIL. For example, the unfolded protein response (UPR) has an important role in cancer cells survival, SHetA2, as a small molecule, can induce UPR in NSCLC cell lines and augment TRAIL-induced apoptosis by upregulating DR5 expression in CHOP-dependent manner. Here, we found rotenone manipulated the oxidative stress signaling of NSCLC cells to increase their susceptibility to TRAIL. These facts suggest that cellular stress signaling not only offers opportunity for cancer cells to survive, but also renders cancer cells eligible for attack by small molecules. A possible explanation is that depending on the intensity of stress, cellular stress signaling can switch its role from prosurvival to death enhancement. As described in this study, although ROS generation in cancer cells is beneficial for survival, rotenone treatment further increased ROS production to a high level that surpasses the cell ability to eliminate them; as a result, ROS convert its role from survival to death.
2.1.3.6 PPARs and ERRs. molecular mediators of mitochondrial metabolism
Weiwei Fan, Ronald Evans
Current Opinion in Cell Biology Apr 2015; 33:49–54
http://dx.doi.org/10.1016/j.ceb.2014.11.002
Since the revitalization of ‘the Warburg effect’, there has been great interest in mitochondrial oxidative metabolism, not only from the cancer perspective but also from the general biomedical science field. As the center of oxidative metabolism, mitochondria and their metabolic activity are tightly controlled to meet cellular energy requirements under different physiological conditions. One such mechanism is through the inducible transcriptional co-regulators PGC1α and NCOR1, which respond to various internal or external stimuli to modulate mitochondrial function. However, the activity of such co-regulators depends on their interaction with transcriptional factors that directly bind to and control downstream target genes. The nuclear receptors PPARs and ERRs have been shown to be key transcriptional factors in regulating mitochondrial oxidative metabolism and executing the inducible effects of PGC1α and NCOR1. In this review, we summarize recent gain-of-function and loss-of-function studies of PPARs and ERRs in metabolic tissues and discuss their unique roles in regulating different aspects of mitochondrial oxidative metabolism.
Energy is vital to all living organisms. In humans and other mammals, the vast majority of energy is produced by oxidative metabolism in mitochondria [1]. As a cellular organelle, mitochondria are under tight control of the nucleus. Although the majority of mitochondrial proteins are encoded by nuclear DNA (nDNA) and their expression regulated by the nucleus, mitochondria retain their own genome, mitochondrial DNA (mtDNA), encoding 13 polypeptides of the electron transport chain (ETC) in mammals. However, all proteins required for mtDNA replication, transcription, and translation, as well as factors regulating such activities, are encoded by the nucleus [2].
The cellular demand for energy varies in different cells under different physiological conditions. Accordingly, the quantity and activity of mitochondria are differentially controlled by a transcriptional regulatory network in both the basal and induced states. A number of components of this network have been identified, including members of the nuclear receptor superfamily, the peroxisome proliferator-activated receptors (PPARs) and the estrogen-related receptors (ERRs) [3, 4 and 5].
The Yin-Yang co-regulators
A well-known inducer of mitochondrial oxidative metabolism is the peroxisome proliferator-activated receptor γ coactivator 1α (PGC1α) [6], a nuclear cofactor which is abundantly expressed in high energy demand tissues such as heart, skeletal muscle, and brown adipose tissue (BAT) [7]. Induction by cold-exposure, fasting, and exercise allows PGC1α to regulate mitochondrial oxidative metabolism by activating genes involved in the tricarboxylic acid cycle (TCA cycle), beta-oxidation, oxidative phosphorylation (OXPHOS), as well as mitochondrial biogenesis [6 and 8] (Figure 1).
http://ars.els-cdn.com/content/image/1-s2.0-S0955067414001410-gr1.jpg
Figure 1. PPARs and ERRs are major executors of PGC1α-induced regulation of oxidative metabolism. Physiological stress such as exercise induces both the expression and activity of PGC1α, which stimulates energy production by activating downstream genes involved in fatty acid and glucose metabolism, TCA cycle, β-oxidation, OXPHOS, and mitochondrial biogenesis. The transcriptional activity of PGC1α relies on its interactions with transcriptional factors such as PPARs (for controlling fatty acid metabolism) and ERRs (for regulating mitochondrial OXPHOS).
The effect of PGC1α on mitochondrial regulation is antagonized by transcriptional corepressors such as the nuclear receptor corepressor 1 (NCOR1) [9 and 10]. In contrast to PGC1α, the expression of NCOR1 is suppressed in conditions where PGC1α is induced such as during fasting, high-fat-diet challenge, and exercise [9 and 11]. Moreover, the knockout of NCOR1 phenotypically mimics PGC1α overexpression in regulating mitochondrial oxidative metabolism [9]. Therefore, coactivators and corepressors collectively regulate mitochondrial metabolism in a Yin-Yang fashion.
However, both PGC1α and NCOR1 lack DNA binding activity and rather act via their interaction with transcription factors that direct the regulatory program. Therefore the transcriptional factors that partner with PGC1α and NCOR1 mediate the molecular signaling cascades and execute their inducible effects on mitochondrial regulation.
PPARs: master executors controlling fatty acid oxidation
Both PGC1α and NCOR1 are co-factors for the peroxisome proliferator-activated receptors (PPARα, γ, and δ) [7, 11, 12 and 13]. It is now clear that all three PPARs play essential roles in lipid and fatty acid metabolism by directly binding to and modulating genes involved in fat metabolism [13, 14, 15, 16, 17,18 and 19]. While PPARγ is known as a master regulator for adipocyte differentiation and does not seem to be involved with oxidative metabolism [14 and 20], both PPARα and PPARδ are essential regulators of fatty acid oxidation (FAO) [3, 13, 15, 19 and 21] (Figure 1).
PPARα was first cloned as the molecular target of fibrates, a class of cholesterol-lowering compounds that increase hepatic FAO [22]. The importance of PPARα in regulating FAO is indicated in its expression pattern which is restricted to tissues with high capacity of FAO such as heart, liver, BAT, and oxidative muscle [23]. On the other hand, PPARδ is ubiquitously expressed with higher levels in the digestive tract, heart, and BAT [24]. In the past 15 years, extensive studies using gain-of-function and loss-of-function models have clearly demonstrated PPARα and PPARδ as the major drivers of FAO in a wide variety of tissues.
ERRS: master executors controlling mitochondrial OXPHOS
ERRs are essential regulators of mitochondrial energy metabolism [4]. ERRα is ubiquitously expressed but particularly abundant in tissues with high energy demands such as brain, heart, muscle, and BAT. ERRβ and ERRγ have similar expression patterns, both are selectively expressed in highly oxidative tissues including brain, heart, and oxidative muscle [45]. Instead of endogenous ligands, the transcriptional activity of ERRs is primarily regulated by co-factors such as PGC1α and NCOR1 [4 and 46] (Figure 1).
Of the three ERRs, ERRβ is the least studied and its role in regulating mitochondrial function is unclear [4 and 47]. In contrast, when PGC1α is induced, ERRα is the master regulator of the mitochondrial biogenic gene network. As ERRα binds to its own promoter, PGC1α can also induce an autoregulatory loop to enhance overall ERRα activity [48]. Without ERRα, the ability of PGC1α to induce the expression of mitochondrial genes is severely impaired. However, the basal-state levels of mitochondrial target genes are not affected by ERRα deletion, suggesting induced mitochondrial biogenesis is a transient process and that other transcriptional factors such as ERRγ may be important maintaining baseline mitochondrial OXPHOS [41•, 42 and 43]. Consistent with this idea, ERRγ (which is active even when PGC1α is not induced) shares many target genes with ERRα [49 and 50].
Conclusion and perspectives
Taken together, recent studies have clearly demonstrated the essential roles of PPARs and ERRs in regulating mitochondrial oxidative metabolism and executing the inducible effects of PGC1α (Figure 1). Both PPARα and PPARδ are key regulators for FA oxidation. While the function of PPARα seems more restricted in FA uptake, beta-oxidation, and ketogenesis, PPARδ plays a broader role in controlling oxidative metabolism and fuel preference, with its target genes involved in FA oxidation, mitochondrial OXPHOS, and glucose utilization. However, it is still not clear how much redundancy exists between PPARα and PPARδ, a question which may require the generation of a double knockout model. In addition, more effort is needed to fully understand how PPARα and PPARδ control their target genes in response to environmental changes.
Likewise, ERRα and ERRγ have been shown to be key regulators of mitochondrial OXPHOS. Knockout studies of ERRα suggest it to be the principal executor of PGC1α induced up-regulation of mitochondrial genes, though its role in exercise-dependent changes in skeletal muscle needs further investigation. Transgenic models have demonstrated ERRγ’s powerful induction of mitochondrial biogenesis and its ability to act in a PGC1α-independent manner. However, it remains to be elucidated whether ERRγ is sufficient for basal-state mitochondrial function in general, and whether ERRα can compensate for its function.
2.1.3.7 Metabolic control via the mitochondrial protein import machinery
Opalińska M, Meisinger C.
Curr Opin Cell Biol. 2015 Apr; 33:42-48
http://dx.doi.org:/10.1016/j.ceb.2014.11.001
Mitochondria have to import most of their proteins in order to fulfill a multitude of metabolic functions. Sophisticated import machineries mediate targeting and translocation of preproteins from the cytosol and subsequent sorting into their suborganellar destination. The mode of action of these machineries has been considered for long time as a static and constitutively active process. However, recent studies revealed that the mitochondrial protein import machinery is subject to intense regulatory mechanisms that include direct control of protein flux by metabolites and metabolic signaling cascades.
2.1.3.8 The Protein Import Machinery of Mitochondria—A Regulatory Hub
AB Harbauer, RP Zahedi, A Sickmann, N Pfanner, C Meisinger
Cell Metab 4 Mar 2014; 19(3):357–372
Mitochondria are essential cell. They are best known for their role as cellular powerhouses, which convert the energy derived from food into an electrochemical proton gradient across the inner membrane. The proton gradient drives the mitochondrial ATP synthase, thus providing large amounts of ATP for the cell. In addition, mitochondria fulfill central functions in the metabolism of amino acids and lipids and the biosynthesis of iron-sulfur clusters and heme. Mitochondria form a dynamic network that is continuously remodeled by fusion and fission. They are involved in the maintenance of cellular ion homeostasis, play a crucial role in apoptosis, and have been implicated in the pathogenesis of numerous diseases, in particular neurodegenerative disorders.
Mitochondria consist of two membranes, outer membrane and inner membrane, and two aqueous compartments, intermembrane space and matrix (Figure 1). Proteomic studies revealed that mitochondria contain more than 1,000 different proteins (Prokisch et al., 2004, Reinders et al., 2006, Pagliarini et al., 2008 and Schmidt et al., 2010). Based on the endosymbiotic origin from a prokaryotic ancestor, mitochondria contain a complete genetic system and protein synthesis apparatus in the matrix; however, only ∼1% of mitochondrial proteins are encoded by the mitochondrial genome (13 proteins in humans and 8 proteins in yeast). Nuclear genes code for ∼99% of mitochondrial proteins. The proteins are synthesized as precursors on cytosolic ribosomes and are translocated into mitochondria by a multicomponent import machinery. The protein import machinery is essential for the viability of eukaryotic cells. Numerous studies on the targeting signals and import components have been reported (reviewed in Dolezal et al., 2006,Neupert and Herrmann, 2007, Endo and Yamano, 2010 and Schmidt et al., 2010), yet for many years little has been known on the regulation of the import machinery. This led to the general assumption that the protein import machinery is constitutively active and not subject to detailed regulation.
Figure 1. Protein Import Pathways of Mitochondria. Most mitochondrial proteins are synthesized as precursors in the cytosol and are imported by the translocase of the outer mitochondrial membrane (TOM complex). (A) Presequence-carrying (cleavable) preproteins are transferred from TOM to the presequence translocase of the inner membrane (TIM23 complex), which is driven by the membrane potential (Δψ). The proteins either are inserted into the inner membrane (IM) or are translocated into the matrix with the help of the presequence translocase-associated motor (PAM). The presequences are typically cleaved off by the mitochondrial processing peptidase (MPP). (B) The noncleavable precursors of hydrophobic metabolite carriers are bound to molecular chaperones in the cytosol and transferred to the receptor Tom70. After translocation through the TOM channel, the precursors bind to small TIM chaperones in the intermembrane space and are membrane inserted by the Δψ-dependent carrier translocase of the inner membrane (TIM22 complex).
(C) Cysteine-rich proteins destined for the intermembrane space (IMS) are translocated through the TOM channel in a reduced conformation and imported by the mitochondrial IMS import and assembly (MIA) machinery. Mia40 functions as precursor receptor and oxidoreductase in the IMS, promoting the insertion of disulfide bonds into the imported proteins. The sulfhydryl oxidase Erv1 reoxidizes Mia40 for further rounds of oxidative protein import and folding. (D) The precursors of outer membrane β-barrel proteins are imported by the TOM complex and small TIM chaperones and are inserted into the outer membrane by the sorting and assembly machinery (SAM complex). (E) Outer membrane (OM) proteins with α-helical transmembrane segments are inserted into the membrane by import pathways that have only been partially characterized. Shown is an import pathway via the mitochondrial import (MIM) complex
Studies in recent years, however, indicated that different steps of mitochondrial protein import are regulated, suggesting a remarkable diversity of potential mechanisms. After an overview on the mitochondrial protein import machinery, we will discuss the regulatory processes at different stages of protein translocation into mitochondria. We propose that the mitochondrial protein import machinery plays a crucial role as regulatory hub under physiological and pathophysiological conditions. Whereas the basic mechanisms of mitochondrial protein import have been conserved from lower to higher eukaryotes (yeast to humans), regulatory processes may differ between different organisms and cell types. So far, many studies on the regulation of mitochondrial protein import have only been performed in a limited set of organisms. Here we discuss regulatory principles, yet it is important to emphasize that future studies will have to address which regulatory processes have been conserved in evolution and which processes are organism specific.
Protein Import Pathways into Mitochondria
The classical route of protein import into mitochondria is the presequence pathway (Neupert and Herrmann, 2007 and Chacinska et al., 2009). This pathway is used by more than half of all mitochondrial proteins (Vögtle et al., 2009). The proteins are synthesized as precursors with cleavable amino-terminal extensions, termed presequences. The presequences form positively charged amphipathic α helices and are recognized by receptors of the translocase of the outer mitochondrial membrane (TOM complex) (Figure 1A) (Mayer et al., 1995, Brix et al., 1997, van Wilpe et al., 1999, Abe et al., 2000, Meisinger et al., 2001 and Saitoh et al., 2007). Upon translocation through the TOM channel, the cleavable preproteins are transferred to the presequence translocase of the inner membrane (TIM23 complex). The membrane potential across the inner membrane (Δψ, negative on the matrix side) exerts an electrophoretic effect on the positively charged presequences (Martin et al., 1991). The presequence translocase-associated motor (PAM) with the ATP-dependent heat-shock protein 70 (mtHsp70) drives preprotein translocation into the matrix (Chacinska et al., 2005 and Mapa et al., 2010). Here the presequences are typically cleaved off by the mitochondrial processing peptidase (MPP). Some cleavable preproteins contain a hydrophobic segment behind the presequence, leading to arrest of translocation in the TIM23 complex and lateral release of the protein into the inner membrane (Glick et al., 1992, Chacinska et al., 2005 and Meier et al., 2005). In an alternative sorting route, some cleavable preproteins destined for the inner membrane are fully or partially translocated into the matrix, followed by insertion into the inner membrane by the OXA export machinery, which has been conserved from bacteria to mitochondria (“conservative sorting”) (He and Fox, 1997, Hell et al., 1998, Meier et al., 2005 and Bohnert et al., 2010). …
Regulatory Processes Acting at Cytosolic Precursors of Mitochondrial Proteins
Two properties of cytosolic precursor proteins are crucial for import into mitochondria. (1) The targeting signals of the precursors have to be accessible to organellar receptors. Modification of a targeting signal by posttranslational modification or masking of a signal by binding partners can promote or inhibit import into an organelle. (2) The protein import channels of mitochondria are so narrow that folded preproteins cannot be imported. Thus preproteins should be in a loosely folded state or have to be unfolded during the import process. Stable folding of preprotein domains in the cytosol impairs protein import. …
Import Regulation by Binding of Metabolites or Partner Proteins to Preproteins
Binding of a metabolite to a precursor protein can represent a direct means of import regulation (Figure 2A, condition 1). A characteristic example is the import of 5-aminolevulinate synthase, a mitochondrial matrix protein that catalyzes the first step of heme biosynthesis (Hamza and Dailey, 2012). The precursor contains heme binding motifs in its amino-terminal region, including the presequence (Dailey et al., 2005). Binding of heme to the precursor inhibits its import into mitochondria, likely by impairing recognition of the precursor protein by TOM receptors (Lathrop and Timko, 1993, González-Domínguez et al., 2001,Munakata et al., 2004 and Dailey et al., 2005). Thus the biosynthetic pathway is regulated by a feedback inhibition of mitochondrial import of a crucial enzyme, providing an efficient and precursor-specific means of import regulation dependent on the metabolic situation.
Figure 2. Regulation of Cytosolic Precursors of Mitochondrial Proteins
(A) The import of a subset of mitochondrial precursor proteins can be positively or negatively regulated by precursor-specific reactions in the cytosol. (1) Binding of ligands/metabolites can inhibit mitochondrial import. (2) Binding of precursors to partner proteins can stimulate or inhibit import into mitochondria. (3) Phosphorylation of precursors in the vicinity of targeting signals can modulate dual targeting to the endoplasmic reticulum (ER) and mitochondria. (4) Precursor folding can mask the targeting signal. (B) Cytosolic and mitochondrial fumarases are derived from the same presequence-carrying preprotein. The precursor is partially imported by the TOM and TIM23 complexes of the mitochondrial membranes and the presequence is removed by the mitochondrial processing peptidase (MPP). Folding of the preprotein promotes retrograde translocation of more than half of the molecules into the cytosol, whereas the other molecules are completely imported into mitochondria.
Regulation of Mitochondrial Protein Entry Gate by Cytosolic Kinases
Figure 3. Regulation of TOM Complex by Cytosolic Kinases
(A) All subunits of the translocase of the outer mitochondrial membrane (TOM complex) are phosphorylated by cytosolic kinases (phosphorylated amino acid residues are indicated by stars with P). Casein kinase 1 (CK1) stimulates the assembly of Tom22 into the TOM complex. Casein kinase 2 (CK2) stimulates the biogenesis of Tom22 as well as the mitochondrial import protein 1 (Mim1). Protein kinase A (PKA) inhibits the biogenesis of Tom22 and Tom40, and inhibits the activity of Tom70 (see B). Cyclin-dependent kinases (CDK) are possibly involved in regulation of TOM. (B) Metabolic shift-induced regulation of the receptor Tom70 by PKA. Carrier precursors bind to cytosolic chaperones (Hsp70 and/or Hsp90). Tom70 has two binding pockets, one for the precursor and one for the accompanying chaperone (shown on the left). When glucose is added to yeast cells (fermentable conditions), the levels of intracellular cAMP are increased and PKA is activated (shown on the right). PKA phosphorylates a serine of Tom70 in vicinity of the chaperone binding pocket, thus impairing chaperone binding to Tom70 and carrier import into mitochondria.
Casein Kinase 2 Stimulates TOM Biogenesis and Protein Import
Metabolic Switch from Respiratory to Fermentable Conditions Involves Protein Kinase A-Mediated Inhibition of TOM
Network of Stimulatory and Inhibitory Kinases Acts on TOM Receptors, Channel, and Assembly Factors
Protein Import Activity as Sensor of Mitochondrial Stress and Dysfunction
Figure 4. Mitochondrial Quality Control and Stress Response
(A) Import and quality control of cleavable preproteins. The TIM23 complex cooperates with several machineries: the TOM complex, a supercomplex consisting of the respiratory chain complexes III and IV, and the presequence translocase-associated motor (PAM) with the central chaperone mtHsp70. Several proteases/peptidases involved in processing, quality control, and/or degradation of imported proteins are shown, including mitochondrial processing peptidase (MPP), intermediate cleaving peptidase (XPNPEP3/Icp55), mitochondrial intermediate peptidase (MIP/Oct1), mitochondrial rhomboid protease (PARL/Pcp1), and LON/Pim1 protease. (B) The transcription factor ATFS-1 contains dual targeting information, a mitochondrial targeting signal at the amino terminus, and a nuclear localization signal (NLS). In normal cells, ATFS-1 is efficiently imported into mitochondria and degraded by the Lon protease in the matrix. When under stress conditions the protein import activity of mitochondria is reduced (due to lower Δψ, impaired mtHsp70 activity, or peptides exported by the peptide transporter HAF-1), some ATFS-1 molecules accumulate in the cytosol and can be imported into the nucleus, leading to induction of an unfolded protein response (UPRmt).
Regulation of PINK1/Parkin-Induced Mitophagy by the Activity of the Mitochondrial Protein Import Machinery
Figure 5. Mitochondrial Dynamics and Disease
(A) In healthy cells, the kinase PINK1 is partially imported into mitochondria in a membrane potential (Δψ)-dependent manner and processed by the inner membrane rhomboid protease PARL, which cleaves within the transmembrane segment and generates a destabilizing N terminus, followed by retro-translocation of cleaved PINK1 into the cytosol and degradation by the ubiquitin-proteasome system (different views have been reported if PINK1 is first processed by MPP or not; Greene et al., 2012, Kato et al., 2013 and Yamano and Youle, 2013). Dissipation of Δψ in damaged mitochondria leads to an accumulation of unprocessed PINK1 at the TOM complex and the recruitment of the ubiquitin ligase Parkin to mitochondria. Mitofusin 2 is phosphorylated by PINK1 and likely functions as receptor for Parkin. Parkin mediates ubiquitination of mitochondrial outer membrane proteins (including mitofusins), leading to a degradation of damaged mitochondria by mitophagy. Mutations of PINK1 or Parkin have been observed in monogenic cases of Parkinson’s disease. (B) The inner membrane fusion protein OPA1/Mgm1 is present in long and short isoforms. A balanced formation of the isoforms is a prerequisite for the proper function of OPA1/Mgm1. The precursor of OPA1/Mgm1 is imported by the TOM and TIM23 complexes. A hydrophobic segment of the precursor arrests translocation in the inner membrane, and the amino-terminal targeting signal is cleaved by MPP, generating the long isoforms. In yeast mitochondria, the import motor PAM drives the Mgm1 precursor further toward the matrix such that a second hydrophobic segment is cleaved by the inner membrane rhomboid protease Pcp1, generating the short isoform (s-Mgm1). In mammals, the m-AAA protease is likely responsible for the balanced formation of long (L) and short (S) isoforms of OPA1. A further protease, OMA1, can convert long isoforms into short isoforms in particular under stress conditions, leading to an impairment of mitochondrial fusion and thus to fragmentation of mitochondria.
….
Mitochondrial research is of increasing importance for the molecular understanding of numerous diseases, in particular of neurodegenerative disorders. The well-established connection between the pathogenesis of Parkinson’s disease and mitochondrial protein import has been discussed above. Several observations point to a possible connection of mitochondrial protein import with the pathogenesis of Alzheimer’s disease, though a direct role of mitochondria has not been demonstrated so far. The amyloid-β peptide (Aβ), which is generated from the amyloid precursor protein (APP), was found to be imported into mitochondria by the TOM complex, to impair respiratory activity, and to enhance ROS generation and fragmentation of mitochondria (Hansson Petersen et al., 2008, Ittner and Götz, 2011 and Itoh et al., 2013). An accumulation of APP in the TOM and TIM23 import channels has also been reported (Devi et al., 2006). The molecular mechanisms of how mitochondrial activity and dynamics may be altered by Aβ (and possibly APP) and how mitochondrial alterations may impact on the pathogenesis of Alzheimer’s disease await further analysis.
It is tempting to speculate that regulatory changes in mitochondrial protein import may be involved in tumor development. Cancer cells can shift their metabolism from respiration toward glycolysis (Warburg effect) (Warburg, 1956, Frezza and Gottlieb, 2009, Diaz-Ruiz et al., 2011 and Nunnari and Suomalainen, 2012). A glucose-induced downregulation of import of metabolite carriers into mitochondria may represent one of the possible mechanisms during metabolic shift to glycolysis. Such a mechanism has been shown for the carrier receptor Tom70 in yeast mitochondria (Schmidt et al., 2011). A detailed analysis of regulation of mitochondrial preprotein translocases in healthy mammalian cells as well as in cancer cells will represent an important task for the future.
Conclusion
In summary, the concept of the “mitochondrial protein import machinery as regulatory hub” will promote a rapidly developing field of interdisciplinary research, ranging from studies on molecular mechanisms to the analysis of mitochondrial diseases. In addition to identifying distinct regulatory mechanisms, a major challenge will be to define the interactions between different machineries and regulatory processes, including signaling networks, preprotein translocases, bioenergetic complexes, and machineries regulating mitochondrial membrane dynamics and contact sites, in order to understand the integrative system controlling mitochondrial biogenesis and fitness.
2.1.3.9 Exosome Transfer from Stromal to Breast Cancer Cells Regulates Therapy Resistance Pathways
MC Boelens, Tony J. Wu, Barzin Y. Nabet, et al.
Cell 23 Oct 2014; 159(3): 499–513
http://www.sciencedirect.com/science/article/pii/S0092867414012392
Highlights
- Exosome transfer from stromal to breast cancer cells instigates antiviral signaling
• RNA in exosomes activates antiviral STAT1 pathway through RIG-I
• STAT1 cooperates with NOTCH3 to expand therapy-resistant cells
• Antiviral/NOTCH3 pathways predict NOTCH activity and resistance in primary tumors
Summary
Stromal communication with cancer cells can influence treatment response. We show that stromal and breast cancer (BrCa) cells utilize paracrine and juxtacrine signaling to drive chemotherapy and radiation resistance. Upon heterotypic interaction, exosomes are transferred from stromal to BrCa cells. RNA within exosomes, which are largely noncoding transcripts and transposable elements, stimulates the pattern recognition receptor RIG-I to activate STAT1-dependent antiviral signaling. In parallel, stromal cells also activate NOTCH3 on BrCa cells. The paracrine antiviral and juxtacrine NOTCH3 pathways converge as STAT1 facilitates transcriptional responses to NOTCH3 and expands therapy-resistant tumor-initiating cells. Primary human and/or mouse BrCa analysis support the role of antiviral/NOTCH3 pathways in NOTCH signaling and stroma-mediated resistance, which is abrogated by combination therapy with gamma secretase inhibitors. Thus, stromal cells orchestrate an intricate crosstalk with BrCa cells by utilizing exosomes to instigate antiviral signaling. This expands BrCa subpopulations adept at resisting therapy and reinitiating tumor growth.

stromal-communication-with-cancer-cells
Graphical Abstract
2.1.3.10 Emerging concepts in bioenergetics and cancer research
Obre E, Rossignol R
Int J Biochem Cell Biol. 2015 Feb; 59:167-81
http://dx.doi.org:/10.1016/j.biocel.2014.12.008
The field of energy metabolism dramatically progressed in the last decade, owing to a large number of cancer studies, as well as fundamental investigations on related transcriptional networks and cellular interactions with the microenvironment. The concept of metabolic flexibility was clarified in studies showing the ability of cancer cells to remodel the biochemical pathways of energy transduction and linked anabolism in response to glucose, glutamine or oxygen deprivation. A clearer understanding of the large-scale bioenergetic impact of C-MYC, MYCN, KRAS and P53 was obtained, along with its modification during the course of tumor development. The metabolic dialog between different types of cancer cells, but also with the stroma, also complexified the understanding of bioenergetics and raised the concepts of metabolic symbiosis and reverse Warburg effect. Signaling studies revealed the role of respiratory chain-derived reactive oxygen species for metabolic remodeling and metastasis development. The discovery of oxidative tumors in human and mice models related to chemoresistance also changed the prevalent view of dysfunctional mitochondria in cancer cells. Likewise, the influence of energy metabolism-derived oncometabolites emerged as a new means of tumor genetic regulation. The knowledge obtained on the multi-site regulation of energy metabolism in tumors was translated to cancer preclinical studies, supported by genetic proof of concept studies targeting LDHA, HK2, PGAM1, or ACLY. Here, we review those different facets of metabolic remodeling in cancer, from its diversity in physiology and pathology, to the search of the genetic determinants, the microenvironmental regulators and pharmacological modulators.
2.1.3.11 Protecting the mitochondrial powerhouse
M Scheibye-Knudsen, EF Fang, DL Croteau, DM Wilson III, VA Bohr
Trends in Cell Biol, Mar 2015; 25(3):158–170
Highlights
- Mitochondrial maintenance is essential for cellular and organismal function.
• Maintenance includes reactive oxygen species (ROS) regulation, DNA repair, fusion–fission, and mitophagy.
• Loss of function of these pathways leads to disease.
Mitochondria are the oxygen-consuming power plants of cells. They provide a critical milieu for the synthesis of many essential molecules and allow for highly efficient energy production through oxidative phosphorylation. The use of oxygen is, however, a double-edged sword that on the one hand supplies ATP for cellular survival, and on the other leads to the formation of damaging reactive oxygen species (ROS). Different quality control pathways maintain mitochondria function including mitochondrial DNA (mtDNA) replication and repair, fusion–fission dynamics, free radical scavenging, and mitophagy. Further, failure of these pathways may lead to human disease. We review these pathways and propose a strategy towards a treatment for these often untreatable disorders.
Discussion
Radoslav Bozov –
Larry, pyruvate is a direct substrate for synthesizing pyrimidine rings, as well as C-13 NMR study proven source of methyl groups on SAM! Think about what cancer cells care for – dis-regulated growth through ‘escaped’ mutability of proteins, ‘twisting’ pathways of ordered metabolism space-time wise! mtDNA is a back up, evolutionary primitive, however, primary system for pulling strings onto cell cycle events. Oxygen (never observed single molecule) pulls up electron negative light from emerging super rich energy carbon systems. Therefore, ATP is more acting like a neutralizer – resonator of space-energy systems interoperability! You cannot look at a compartment / space independently , as dimension always add 1 towards 3+1.


 : 0.74 and 0.70, respectively). Expression of p16INK4a was observed in all endometrial biopsies. Compared with Ki-67 expression and detection of high-risk human papillomavirus, p16INK4a was less likely to be positive in samples from women with negative, reactive, and atypical biopsies. Although expression of p16INK4ain endometrial epithelium may be problematic in terms of screening, the potential of p16INK4a as a screening test warrants investigation.
 , and for analysis was grouped into the negative category. For Ki-67, the results were also reported in a semiquantitative fashion as cells in the lower 1/3 of the epithelium staining (i.e., usually basilar cell staining), cells in the middle 1/3–2/3 staining, or cells in the upper 1/3 staining (
 1+ staining (24 of 208 -original diagnosis, 12 of 112 recut diagnosis). 57% of the CIN I cases had


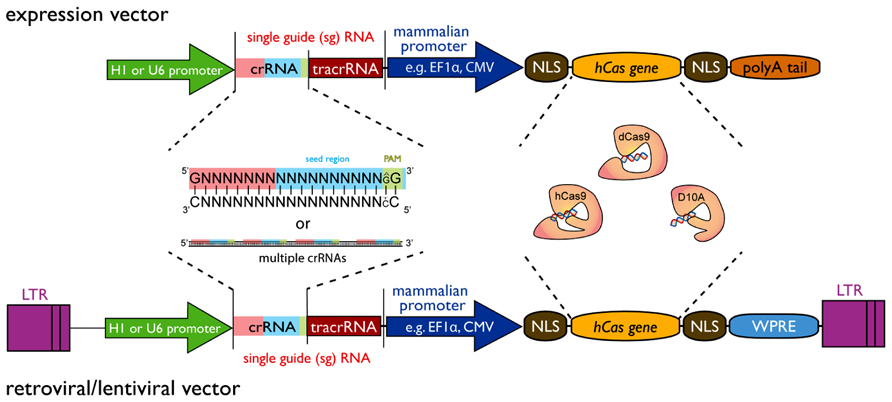
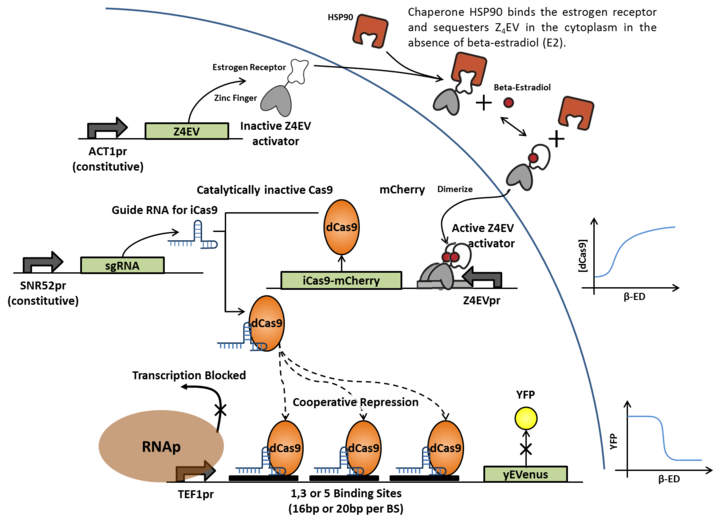
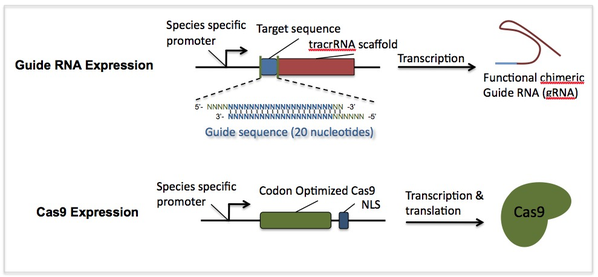
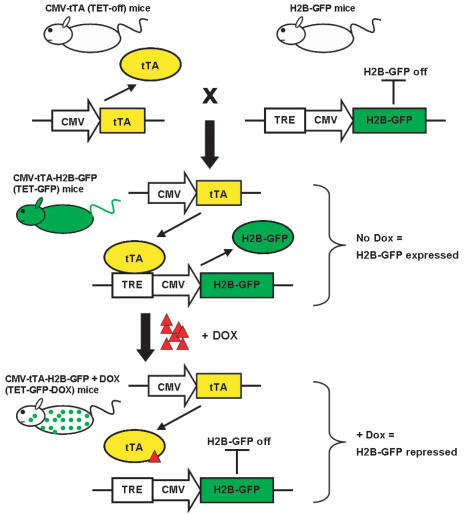
Warburg Effect revisited
It is very interesting the series of commentaries following Warburg Effect revisited. However, it comes as no surprise that almost all of them have small or greater emphasis in the molecular biology (changes in gene expression) events of the metabolic regulation involved.
I would like to comment on some aspects: 1- Warburg did the initial experiments following Pasteur line of reasoning that aimed at carbon flow through the cell (yeast in his case) instead of describing anything inside the cell. It is worth to recall that for the sake of his study, Pasteur considered anything inside the cell under the domain of divine forces. He, at least in defence of his work, entirely made outside the cell, considered that inside the cells was beyond human capability of understanding – He has followed vitalism as his line of reasoning in defence of his work – Interestingly, the same scientist that has ruled out spontaneous generation when Pasteurization was started. Therefore, Pasteur measured everything outside the cell (mainly sugar, ethanol – the equivalent of our lactic acid end product of anaerobic metabolism) and found that as soon as yeasts were placed in the presence of oxygen, sugar was consumed at low speed in comparison with the speed measured in anaerobiosis and ethanol was also produced at reduced speed. This is an indication of a fast biological regulatory mechanism that obviously, do not require changes in gene expression. As previously said, Warburg work translated for republishing in the Journal Biological Chemistry mentioned “grana” for mitochondria calling attention on an “inside-the-cell” component. It seems that, there is not a unique, single site of metabolism, where the Pasteur Effect – Warburg Effect seems to be elicited by the shift from anaerobiosis to aerobiosis or vice versa.
In order to find a core for the mechanism the best approach seems to take into account one of the most important contributions of one of the greatest north-American biochemists, Briton Chance. He has made it with his polarographic method of following continuously the oxygen consumption of the cell´s mitochondria.
Mitochondria burn organic carbon molecules under a very stringent control mechanism of oxidative-phosphorylation ATP production. Measured in the form of changes in the speed of oxygen consumption over time as Respiratory Control Ratio (RCR). When no ATP is required by the cell, oxygen consumption goes at low speed (basal or state II or IV). When ADP is offered to the mitochondria as an indication that ATP synthesis is necessary, oxygen consumption is activated in state III respiration. Low respiration means low burning activity of organic (carbon) molecules what in this case, means indirectly low glucose consumption. While high respiration is the converse – greater glucose consumption.
Aerobic metabolism of glucose to carbonic acid and water provides a change in free energy enough for 38 molecules of ATP (the real production is +/- 32 ATP in aerobic condition) while glucose to lactic acid metabolism in anaerobiosis leads to 2 ATP production after discounting the other 2 required at initial stages of glucose metabolism.
The low ATP yield in anaerobiosis explains the fast glucose metabolism in anaerobiosis while the control by RCR in mitochondria explains the reduction in glucose metabolism under aerobiosis as long as the ATP requirements of the cell remains the same – This is what it is assumed to happen in quiescent cells. Not necessarily in fast growing cells as cancer cells are. However, this will not be discussed here. In my first experiments in the early seventies, with M. Rouxii a dimorphic mold-yeast biological system the environmental change (aerobic – anaerobic) led to morphogenetic change presented as morphogenetic expression of the Pasteur Effect. In this case, the enzyme that replaces mitochondria in ATP production (Pyruvate Kinase) converting phosphoenolpyruvate into pyruvate together with ADP into ATP, shows changes that can be interpreted as change in gene expression together with new self-assembly of enzyme subunits. (Dimer AA – yeast in anaerobic growth or sporangiospores- converted into dimer AB in aerobic mold). In Leloir opinions at that time, PK I (AA) was only highly glycosylated, while PK II (AB) was less glycosylated without changes in gene expression.
In case you read comments posted, you will see that the reference to aerobic glycolysis, continues to be made together with, new deranged forms of reasoning as is indicated by referring to: Mitochondrial role in ion homeostasis…
Homeostasis is a regulation of something, ions, molecules, pH etc. that is kept outside the cell, therefore any role for mitochondria on it is only made indirectly, by its ATP production.
However, mitochondria has a role together with other cell components in the regulation of for instance, intracellular Ca levels (Something that is not a homeostatic regulation). This is a very important point for the following reason: Homeostasis is maintained as a composite result of several differentiated cellular, tissue and organ functions. Differentiated function is something clearly missing in cancer cells. The best form to refer to the mitochondrial function regarding ions is to indicate a mitochondrial role in ion fluxes.
In short, to indicate how an environmental event or better saying condition could favour genetic changes instead of being caused by genetic changes is to follow the same line of reasoning that is followed in understanding the role of cardioplegia. To stop heart beating is adequate for heart surgery it is also adequate for heart cells by sparing the ATP use during surgery and therefore, offering better recovery condition to the heart afterwards.
In the case, here considered, even assuming that the genome is not made more unstable during hypoxic condition it is quite possible to understand that sharing ATP with both differentiated cell function and replication may led quality control of DNA in short supply of much needed ATP and this led to maintenance of mutations as well as less organized genome.
Thank you. I enjoy reading your comments. They are very instructive. I don’t really think that I comprehend the use of the term “epigenetics” and longer. In fact, it was never clear to me when I first heard it used some years ago.
The term may have been closely wedded to the classic hypothesis of a unidirectional DNA–> RNA–> protein model that really has lost explanatory validity for the regulated cell in its environment. The chromatin has an influence, and protein-protein interactions are everywhere. As you point out, these are adjusting to a fast changing substrate milieu, and the genome is not involved. But in addition, the proteins may well have a role in suppression or activation of signaling pathways, and thereby, may well have an effect on gene expression. I don’t have any idea about how it would work, but mutations would appear to follow the metabolic condition of the cell over time. It would appear to be – genomic modification.
In aerobic glucose metabolism, the oxidation of citric acid requires ADP and Mg²+, which will increase the speed of the reaction: Iso-citric acid + NADP (NAD) — isocitrate dehydrogenase (IDH) = alpha-ketoglutaric acid. In the Krebs cycle (the citric cycle), IDH1 and IDH2 are NADP+-dependent enzymes that normally catalyze the inter-conversion of D-isocitrate and alpha-ketoglutarate (α-KG). The IDH1 and IDH2 genes are mutated in > 75% of different malignant diseases. Two distinct alterations are caused by tumor-derived mutations in IDH1 or IDH2: the loss of normal catalytic activity in the production of α-ketoglutarate (α-KG) and the gain of catalytic activity to produce 2-hydroxyglutarate (2-HG), [22].
This product is a competitive inhibitor of multiple α-KG-dependent dioxygenases, including demethylases, prolyl-4-hydroxylase and the TET enzymes family (Ten-Eleven Translocation-2), resulting in genome-wide alternations in histones and DNA methylation. [23]
IDH1 and IDH2 mutations have been observed in myeloid malignancies, including de novo and secondary AML (15%–30%), and in pre-leukemic clone malignancies, including myelodysplastic syndrome and myeloproliferative neoplasm (85% of the chronic phase and 20% of transformed cases in acute leukemia), [24].
Normally, cells in the body communicate via intra-cytoplasmic channels and maintain the energetic potential across cell membranes, which is 1-2.5 µmol of ATP in the form of ATP-ADP/ATP-ADP-IMP. These normal energetic values occur during normal cell division. If the intra-cellular and extra-cellular levels of Mg2+ are high, the extra-cellular charges of the cells will not be uniformly distributed.
This change in distribution induces a high net positive charge for the cell and induces a loss of contact inhibition via the electromagnetic induction of oscillation [28, 29, 30]. Thereafter, malignant cells become invasive and metastasize.
,,,,,,,,,,,,,,,,,,,,,,,,,,,,,,,,,,,,,,,,,,,,,,,,,,,,,,,,,,,,,,,,,,,,,,,,,,,,,,,,,,,,,,,,,,,,,,,,,,,,,,,,,,,,,,,,,,,,,,,,
-22. Hartmann C, Meyer J, Balss J. Capper D, et al. Type and frequency of IDH1 and IDH2 mutations are related to astrocytic and oligodendroglial differentiation and age: a study of 1,010 diffuse gliomas. Acta Neuropathol 2009; 118: 464-474.
23. Raymakers R.A, Langemeijer S.M., Kuiper R.P, Berends M, et al. Acquired mutations in TET2 are common in myelodysplastic syndromes. Nat. Genet 2009; 41; 838–849.
24 Wagner K, Damm F, Gohring G., Gorlich K et al. Impact of IDH1 R132 mutations and an IDH1 single nucleotide polymorphism in cytogenetically normal acute myeloid leukemia: SNP rs11554137 is an adverse prognostic factor. J. Clin. Oncol.2010; 28: 2356–2364.
Plant Molecular Biology 1989; 1: 271–303.
29. Chien MM, Zahradka CE, Newel MC, Fred JW. Fas induced in B cells apoptosis require an increase in free cytosolic magnesium as in early event. J Biol Chem.1999; 274: 7059-7066.
30. Milionis H J, Bourantas C L, Siamopoulos C K, Elisaf MS. Acid bases and electrolytes abnormalities in Acute Leukemia. Am J Hematol 1999; (62): 201-207.
31. Thomas N Seyfried; Laura M Shelton.Cancer as a Metabolic Disease. Nutr Metab 2010; 7: 7
– Aurelian Udristioiu, M.D,
– Lab Director, EuSpLM,
– City Targu Jiu, Romania
AACC, National Academy of Biochemical Chemistry (NACB) Member, Washington D.C, USA.