Studies of Respiration Lead to Acetyl CoA
Curator: Larry H. Bernstein, MD, FCAP
In this series of discussions it has become clear that the studies of carbohydrate metabolism were highlighted by Meyerhof’s work on the glycolytic pathway, and the further elucidation of a tie between Warburg’s studies of impaired respiration for malignant aerobic cells relying on glycolysis, comparanle to Pasteur’s observations 60 years earlier by for yeast. The mitochondrion was unknown at the time, and it took many years to discover the key role played by oxidative phosphorylation and Fritz Lipmann’s discovery of “acetyl coenzyme A, and the later explanation of electron transport. This was crucial to understanding cellular energetics, which explains the high energy of fatty acid catabolism from stored adipose tissue. I shall here embark on a journey to trace these important connected developments.
- Signaling and signaling pathways
- Signaling transduction tutorial.
- Carbohydrate metabolism
3.1 Selected References to Signaling and Metabolic Pathways in Leaders in Pharmaceutical Intelligence
- Lipid metabolism
4.1 Studies of respiration lead to Acetyl CoA
- Protein synthesis and degradation
- Subcellular structure
- Impairments in pathological states: endocrine disorders; stress hypermetabolism; cancer.
Phosphorylation
In some reactions, the purpose of phosphorylation is to “activate” or “volatize” a molecule, increasing its energy so it is able to participate in a subsequent reaction with a negative free-energy change. All kinases require a divalent metal ion such as Mg2+ or Mn2+ to be present, which stabilizes the high-energy bonds of the donor molecule (usually ATP or ATP derivative) and allows phosphorylation to occur.This is a major focus of this discussion.
In other reactions, phosphorylation of a protein substrate can inhibit its activity (as when AKT phosphorylates the enzyme GSK-3). When src is phosphorylated on a particular tyrosine, it folds on itself, and thus masks its own kinase domain, and is thus turned “off”. In still other reactions, phosphorylation of a protein causes it to be bound to other proteins which have “recognition domains” for a phosphorylated tyrosine, serine, or threonine motif. In the late 1990s it was recognized that phosphorylation of some proteins causes them to be degraded by the ATP-dependent ubiquitin/proteasome pathway. This is all that needs to be said at this time about proteins.
Oxidative Phosphorylation
ATP is the molecule that supplies energy to metabolism. Almost all aerobic organisms carry out oxidative phosphorylation. This pathway is probably so pervasive because it is a highly efficient way of releasing energy, compared to alternative fermentation processes such as anaerobic glycolysis.
During oxidative phosphorylation, electrons are transferred from electron donors to electron acceptors such as oxygen, in redox reactions. These redox reactions release energy, which is used to form ATP. In eukaryotes, these redox reactions are carried out by a series of protein complexes within the cell’s intermembrane wall mitochondria, whereas, in prokaryotes, these proteins are located in the cells’ intermembrane space.
O t to W a r b u r g
Nobel Lecture, December 10, 1931
The oxygen-transferring ferment of respiration
The effects of iron are very great, and it follows that oxidation and reduction of the ferment iron must occur extremely rapidly. In fact, almost every molecule of oxygen that comes into contact with an atom of ferment iron reacts with it. Complex-bound bivalent iron in compounds reacts, in vitro as well as in the cell, with molecular oxygen. tt is not yet possible to reduce in vitro trivalent iron with the cell fuel: it is always necessary to add a substance of unknown composition, a ferment, that activates the combustible material for the attack of the iron. It must, therefore, be concluded that activation of the combustible substance in the breathing cell precedes the attack of the ferment iron; this corresponds with “hydrogen activation” as postulated in the theory of Wieland and Thunberg. According to the results of a joint research with W. Christian, this is a cleavage comparable with those known as fermentation.
It is possible that the interplay of splitting ferment and oxygen-transferring ferment does not fully explain the mechanism of cellular respiration; that the iron that reacts with the molecular oxygen does not directly oxidize the activated combustible substances, but that it exerts its effects indirectly through still other iron compounds – the three non-auto-oxidizable cell hemes of MacMunn, which occur in living cells according to the spectroscopic observations of MacMunn and Keilin, and which are reduced in the cell under exclusion of oxygen. It is still not possible to answer the question whether the MacMunn hemes form part of the normal respiratory cycle, i.e., whether respiration is not a simple iron catalysis but a four-fold one. The available spectroscopic observations are also consistent with the view that the MacMunn hemes in the cell are only reduced when the concentration of activated combustible substance is physiologically above normal. This will suffice to indicate that oxygen transfer by the iron of the oxygen transferring ferment is not the whole story of respiration. Respiration requires not only oxygen-transferring ferment and combustible substance, but oxygen-transferring ferment and the living cell.
Inhibition of cellular respiration by prussic acid was discovered some 50 years ago by Claude Bernard, and has interested both chemists and biologists ever since. It takes place as the result of a reaction between the prussic acid and the oxygen-transferring ferment iron, that is, with the ferment iron in trivalent form. [In the prussic acid reaction] the oxidizing OH-group of the trivalent ferment-iron is replaced by the non-oxidizing CN-group, thus bringing transfer of oxygen to a standstill. Prussic acid inhibits reduction of the ferment iron. Inhibition of respiration by carbon monoxide was discovered only a few years ago. [Given] the initial reaction in respiration, then, in the presence of carbon monoxide, the competing reaction will also occur and, varying with the pressures of the carbon monoxide and of the oxygen, more or less of the ferment iron will be removed from the catalytic process on account of fixation of carbon monoxide to the ferment iron. Unlike prussic acid, therefore, carbon monoxide affects the bivalent iron of the ferment. Carbon monoxide inhibits oxidation of the ferment iron.
Thus inhibition of respiration by carbon monoxide, unlike that by prussic acid, depends upon the partial pressure of oxygen. The toxic action of prussic acid in the human subject is based on its inhibitory action on cellular respiration. The toxic effect of carbon monoxide on man has nothing to do with inhibition of cellular respiration by carbon monoxide but is based on the reaction of carbon monoxide with blood iron. For, the effect of carbon monoxide on blood iron occurs at pressures of carbon monoxide far from the level at which cellular respiration would be inhibited.
If carbon monoxide is added to the oxygen in which living cells breathe, respiration ceases, as has already been mentioned, but if exposure to ultraviolet or visible light is administered, respiration recurs. By alternate illumination and darkness it is possible to cause respiration and cessation of respiration in living, breathing cells in mixtures of carbon monoxide and oxygen. In the dark, the iron of the oxygen-transferring ferment becomes bound to carbon monoxide, whereas in the light the carbon monoxide is split off from the iron which is, thus, liberated for oxygen transfer. This fact was discovered in 1926 in collaboration with Fritz Kubowitz. Photochemical dissociation of iron carbonyl compounds was discovered in 1891 by Mond and Langer, by exposing iron pentacarbonyl. This reaction is specific for carbonyl compounds of iron, most of which appear to dissociate in the presence of light, e.g., carbon-monoxide hemoglobin (John Haldane, 1897) carbon-monoxide hemochromogen (Anson and Mirsky, 1925), carbon-monoxide pyridine hemochromogen (H. A. Krebs, 1928), and carbon-monoxide ferrocysteine (W. Cremer, 1929).
When the photochemical dissociation of iron carbonyl compounds is measured quantitatively (we followed hereby Emil Warburg’s photochemical experiments), by using monochromatic light and comparing the amount of light energy absorbed with the amount of carbon monoxide set free, it is found that Einstein’s law of photochemical equivalence is very exactly fulfilled. The number of FeCO-groups set free is equal to the number of light quanta absorbed, and this is independent of the wavelength employed.
Photochemical dissociation of iron carbonyl compounds can be used to determine the absorption spectrum of a catalytic oxygen-transferring iron compound. One combines the catalyst in the dark with carbon monoxide, and so abolishes the oxygen-transferring power of the iron. If then this is exposed to monochromatic light of various wavelengths and of measured quantum intensity, and the effect of light W measured the increase in the rate of catalysis – it is found that the effects of the light are proportional to the quanta absorbed. The arrangement becomes very simple if the catalyst is present, as is usually the case, in infinitesimally low concentration in the exposed system. Then the thickness of the layers related to the amount of absorption of light can be considered to be infinitely thin, the number of quanta absorbed is proportional to the number of quanta supplied by irradiation.
In collaboration with Erwin Negelein, this principle was employed to measure the relative absorption spectrum of the oxygen-transferring respiratory ferment. The respiration of living cells was inhibited by carbon monoxide which was mixed with the oxygen. We then irradiated with monochromatic light of various wavelengths and of measured quantum intensity, and [measured] the increase of respiration together with the relative absorption spectrum. Only practically colorless cells are suitable for this type of experiment, [which requires] a layer infinitely thin with regard to light absorption.
Imagine living cells whose respiration is inhibited by carbon monoxide. If these are irradiated, respiration does not increase suddenly from the dark to the light-value, but there is a definite, although very short, interval until the combination of carbon monoxide with the ferment is broken down by the light. Even without calculation, it is obvious that the rate of increase in the effect of light must be related to the depth of colour of the ferment. If the ferment absorbs strongly, the -monoxide compound will be rapidly broken down, and vice versa.
The time of increase of the action of light can be measured. The time taken for a given intensity of light to cause dissociation of approximately half the carbon-monoxide compound of the ferment can be measured and, from this time, and from the effective intensity of light, the absolute absorption coefficient of the ferment for every wavelength can be calculated. The absorption capacity of the ferment, measured in accordance with this principle, was found to be of the same order as the power of light absorption of our strongest pigments. If one imagines a ferment solution of molar concentration, a layer of 2 x 10⁻⁶ cm thickness would weaken the blue mercury line 436 µµ up by half. The fact that the ferment in spite of this cannot be seen in the cells is due to its low concentration.
Monochromators and color filters were used to isolate the lines from these sources of light. If the absorption coefficient is entered as a function of the wavelength, the absorption spectrum of the carbon-monoxide compound of the ferment is obtained. The principal absorption-band or y-band lies in the blue.
This is the spectrum of a heme compound, according to the position of the bands, the intensity state of the bands, and the absolute magnitude of the absorption coefficients.
It appeared essential to have a control to ascertain whether heme as an oxidation catalyst of carbon monoxide and prussic acid really behaves like the ferment. If cysteine is dissolved in water containing pyridine, and a trace of heme is added, and this is shaken with air, the cysteine is catalytically oxidized by the oxygen-transferring power of the heme. According to Krebs, the catalysis is inhibited by carbon monoxide in the dark, but the inhibition ceases when the mixture is illuminated. Prussic acid too acts on this model on cellular respiration, inasmuch as it combines with the trivalent heme and inhibits its reduction. Just as in life, inhibition by carbon monoxide is dependent on the oxygen pressure, while inhibition by prussic acid is independent of the oxygen pressure.
In conjunction with Negelein, this model was also used to test the ferment experiments quantitatively. Heme catalysis in the model was inhibited by carbon monoxide in the dark. Then monochromatic light of known quantum intensity was used to irradiate it, and the absorption spectrum of the catalyst calculated from the effect of the light which was known from direct measurements on the pure substance. The calculation gave the absorption spectrum of the heme that had been added as a catalyst, and so the method was verified as a technique for the determination of the ferment spectrum, both the calculation and the measurement method.
The positions of the principal band and a-band of the ferment are:
Principal band α-band
433 µµ 590 µµ
These will be referred to as the “ferment bands” because the ferment was the first for which they were determined. Hemes are the complex iron compounds of the porphyrins, in which two valencies of the iron are bound to nitrogen. The porphyrins, of which Hans Fischer determined the chemical structure, are tetrapyrrole compounds in which the four pyrrole nuclei are held together by four interposed methane groups in the cr-position. Green, red, and mixed shades of hemes are known. If magnesium is replaced by iron in chlorophyll, green hemes are obtained. Their color is due to a strong band in the red which is already recognized in chlorophyll. The ferment does not absorb in the red and cannot, therefore, be a green heme. Red hemes are the usual hemes in blood pigment and in its related substances, such as mesoheme and deuteroheme. Coproheme is also a red heme which is an iron compound of the coproporphyrin that H. Fischer recognized in the body. Other red hemes are 20 µµ further from the red than the ferment bands. It follows that the ferment is not a red heme.
The pheoporphyrins are closely related to blood pigment but, as H. Fischer showed, pheoporphyrin a is simply mesoporphyrin in which the one propionic acid has been oxidized so that ring closure with the porphyrin nucleus is made possible. Pheoporphyrin a is a reduction product of chlorophyll a or an oxidation product of blood pigment, and connects together, in an amazingly simple manner, the principal pigments of the organic world the blood pigment and the leaf pigment.
Chlorophyll b has, in general, bands of longer wavelength than chlorophyll a, and for this reason,
- Christian and I applied Fischer’s reduction method to it. In this way we obtained pheoheme b, which, when linked with protein, corresponds with the ferment in respect to the position of the principal band. The principal band of the carbon-monoxide compound of pheohemoglobin b is 435 µµ.
- However, while the principal band of pheohemoglobin corresponds with the ferment bands within the permitted limits, the α-band shifts so far beyond them because it lies too near the red. It is, nevertheless, interesting that
- when ‘chlorophyll b is reduced, one obtains a pheoporphyrin of which the heme of all the pheohemes that have been demonstrated up to the present time is the most like the ferment.
Still nearer the ferment in its spectrum, is a heme occurring in Nature. This is
- spirographis heme, which has been isolated from chlorocruorin, the blood pigment of the bristle-worm Spirographis,
in collaboration with Negelein and Haas, the bands of spirographis heme, coupled to globin, are :
- carbon-monoxyhemoglobin of spirographis: principle band, 434 µµ; α-band, 594 µµ.
Spirographis heme differs from the red hemes by the surplus or ketone oxygen-atom, and is classified as pheoheme. Like Fischer’s pheohemes, spirographis heme is intermediate between chlorophyll and blood pigment in respect of
- the degree of oxidation of the side-chains.
The two hemes with a spectrum most like that of the ferment – pheoheme b and spirographis heme – possess a remarkable property. If they are dissolved in dilute sodium-hydroxide solution, in the form of ferrous compounds,
- the absorption bands slowly wander towards the blue, near the bands of blood heme. In this way,
- mixed-color hemes have been converted into red hemes.
On acidification, the change reverts: the <<blood bands>> disappear and
- the ferment bands appear.
This experiment shows that
- oxidation of the side-chains does not suffice to give rise to the ferment bands, but
- some process of the type of anhydride formation must also occur.
The unique intermediate status of the ferment-like hemes demonstrated by these simple experiments suggests
- the suspicion that blood pigment and leaf pigments have both arisen from the ferment –
- blood pigments by reduction, and leaf pigment by oxidation.
- For evidently, the ferment existed earlier than hemoglobin and chlorophyll.
The investigations on the oxygen-transferring ferment have been supported from the start by the Notgemeinschaft der deutschen Wissenschaft and the Rockefeller Foundation, without whose help they could not have been carried out. I have to thank both organizations here.
A L B E R T S Z E N T- GY Ö R G Y I Nobel Lecture, December 11, 1937
Oxidation, energy transfer, and vitamins
A living cell requires energy not only for all its functions, but also
- for the maintenance of its structure.
- The source of this energy is the sun’s radiation.
Energy from the sun’s rays is trapped by green plants, and
- converted into a bound form, invested in a chemical reaction.
When sunlight falls on green-plants, they liberate oxygen from carbon dioxide, and
- store up carbon, bound to the elements of water, as carbohydrate.
The radiant energy is now locked up in this carbohydrate molecule. This molecule is our food. When energy is required,
- the carbohydrate is again combined with oxygen to form carbon dioxide, oxidized, and energy released.
Investigations during the last few decades have brought hydrogen instead of carbon, and instead of CO2 water, the mother of all life, into the foreground. It is becoming increasingly probable that
- radiant energy is used primarily to break water down into its elements,
- while CO2, serves only to fix the elusive hydrogen thus released.
While this concept of energy fixation was still being developed, the importance of hydrogen in the reversal of this process, whereby energy is liberated by oxidation, had already been confirmed by H. Wieland’s experiments.
Our body really only knowns one fuel, hydrogen. The foodstuff, carbohydrate, is essentially a packet of hydrogen, a hydrogen supplier, a hydrogen donor, and the main event during its combustion is
- the splitting off of hydrogen.
So the combustion of hydrogen is
- the real energy-supplying reaction;
To the elucidation of reaction (6), which seems so simple, I have devoted all my energy for the last fifteen years.
When I first ventured into this territory, the foundations had already been laid by the two pioneers H. Wieland and
O. Warburg, and Wieland’s teaching had been applied by Th. Thunberg to the realm of animal physiology.Wieland and Thunberg showed, with regard to foodstuffs, how
- the first step in oxidation is the “activation” of hydrogen, whereby
- the bonds linking it to the food molecule are loosened, and
- hydrogen prepared for splitting off.
But at the same time oxygen is also, as Warburg showed,
- activated for the reaction by an enzyme.
- the hydrogen-activating enzymes are called dehydrases or dehydrogenases.
Warburg called his oxygen-activating catalyst, “respiratory enzyme”.These concepts of Wieland and Warburg were apparently contradictory, and
- my first task was to show that the two processes are complementary to one another, and that
- in muscle cells activated oxygen oxidizes activated hydrogen.
This picture was enriched by the English worker D. Keilin, who showed that
- activated oxygen does not oxidize activated hydrogen directly, but
- that a dye, cytochrome, is interposed between them.
In keeping with this function, the “respiratory enzyme” is now also called “cytochrome oxidase”.
About ten years ago, when I tried to construct this system of respiration artificially and added together the respiratory enzyme with cytochrome and some foodstuff together with its dehydrogenase, I could justifiably expect that this system would use up oxygen and oxidize the food. But the system remained inactive. I found that
- the dehydrogenation of certain donors is linked to the presence of a co-enzyme.
Analysis of this co-enzyme showed it to be a nucleotide, identical with v. Euler’s co-zymase, which H. v. Euler and R. Nilsson had already shown to accelerate the process of dehydration. As a result of Warburg’s investigations,this co-dehydrogenase has recently come very much into the foreground. Warburg showed that
- it contains a pyridine base, and that it accepts hydrogen directly
[pyridine nucleotide, triphosphopyridine nucleotide, TPN]
from food when the latter is dehydrogenated. It is therefore, the primary H-acceptor.
While working on the isolation of the co-enzyme with Banga, I found a remarkable dye, which showed clearly by its reversible oxidation that it, too, played a part in the respiration. We called this new dye cytoflav. Later Warburg showed that
- this substance exercised its function in combination with a protein.
He called this protein complex of the dye, “yellow enzyme”. R. Kuhn, to whom we owe the structural analysis of the dye, called the dye lactoflavin and, with Györgyi and Wagner-Jauregg, showed it to be identical with vitamin B,.But the respiratory system stayed inactive even
- after the addition of both these new components, codehydrogenase and yellow enzyme.
The C4-dicarboxylic acids and their activators which Thunberg discovered are
- interposed between cytochrome and the activation of hydrogen as intermediate hydrogen-carriers.
In the case of carbohydrate, hydrogen from the food is first taken up by oxaloacetic acid, which
- is reacted with the cytoplasmic malic dehydrogenase (and pyridine nucleotide –
reduced DPN[H]), and thereby activated.
By taking up two hydrogen atoms, oxaloacetic acid is changed into malic acid.
- OAA + NADH – (MDH) – malate + NAD+ + H+
This malic acid now passes on the H-atoms, and thus reverts to oxaloacetic acid,
- which can again take up new H-atoms.
Malate + NAD+ + H+ — MDH – OAA + NADH
The H-atoms released by malic acid are taken up by fumaric acid, which is similarly
- activated by the so-called succinic dehydrogenase.
The uptake of two H-atoms
- converts the fumarate to succinate, to succinic acid.
The two H-atoms of succinic acid are then
- oxidized away by the cytochrome.
Finally the cytochrome is oxidized by the respiratory enzyme, and
- the respiratory enzyme by oxygen.
The function of the C4-dicarboxylic acids is not to be pictured as consisting of a certain amount of C4-dicarboxylic acid in the cell which is alternately oxidized and reduced. Fig. 2 corresponds more to the real situation. The protoplasmic surface, which is represented by the semi-circle, has single molecules of oxaloacetate and fumarate attached to it as prosthetic groups. These fused, activated dicarboxylic molecules then temporarily bind the hydrogen from the food. The co-dehydrogenases and the yellow enzymes also take part in this system. I have attempted to add them in at the right place.
This diagram, which will probably still undergo many more modifications, states that the “foodstuff” – H-donor – starts by
- passing its hydrogen, which has been activated by dehydrase, to the co-dehydrogenase.
- The coenzyme passes it to the oxaloacetic acid*.
- The malic acid then passes it on again to a co-enzyme,
- which passes the hydrogen to the yellow enzyme.
- The yellow enzyme passes the hydrogen to the fumarate.
- The succinate so produced is then oxidized by cytochrome,
- the cytochrome by respiratory enzyme,
- the respiratory enzyme by oxygen.
So the reaction 2H + O – H2O, which seems such a simple one,
- breaks down into a long series of separate reactions.
With each new step, with each transfer between substances,
- the hydrogen loses some of its energy,
- finally combining with oxygen in its lowest-energy compound.
So each hydrogen atom is gradually oxidized in a long series of reactions, and
- its energy released in stages.
This oxidation of hydrogen in stages seems to be one of the basic principles of biological oxidation. The reason for it is probably mainly that
- the cell would not be able to harness and transfer to other processes
- the large amount of energy which would be released by direct oxidation.
The cell needs small change if it is to be able to
- pay for its functions without losing too much in the process.
So it oxidizes the H-atom by stages, converting the large banknote into small change.
About half of all plants – contain a polyphenol, generally a pyrocatechol derivative, together with an enzyme, polyphenoloxidase, which oxidizes polyphenol with the help of oxygen. The current interpretation of the mode of action of this oxidase was a confused one. I succeeded in showing that the situation was simply this, that
the oxidase oxidizes the polyphenol to quinone with oxygen.
- In the intact plant the quinone is reduced back again
- with hydrogen made available from the foodstuff.
Phenol therefore acts as a hydrogen-carrier between oxygen and the H-donor, and we are here again faced with a probably still imperfectly understood system for
- the stepwise combustion of hydrogen.
——————————————————————————————————————————–
Vitamin C
If benzidine is added to a peroxide in the presence of peroxidase, a deep-blue color appears immediately, which is caused by the oxidation of the benzidine. This reaction does not occur without peroxidase. I simply used some juice which had been squeezed from these plants instead of a purified peroxidase, and added benzidine and peroxide, and the blue pigment appeared, after a small delay of about a second. Analysis of this delay showed that it was due to the presence of a powerful reducing substance, which reduced the oxidized benzidine again, until it had itself been used up. Thanks to the invitation from F. G. Hopkins and the help of the Rockefeller Foundation, I was able ten years ago to transfer my workshop to Cambridge, where for the first time I was able to pay more serious attention to chemistry. Soon I succeeded in isolating the substance in question from adrenals and various plants, and in showing that it corresponded to the formula C6H8O6 and was related to the carbohydrates. This last circumstance induced me to apply to Prof. W. N. Haworth, who immediately recognized the chemical interest of the substance and asked me for a larger quantity to permit analysis of its structure.
The Mayo Foundation and Prof. Kendall came to my help on a large scale, and made it possible for me to work, regardless of expense, on the material from large American slaughter-houses. The result of a year’s
work-was 25 g of a crystalline substance, which was given the name “hexuronic acid”. I shared this amount of the substance with Prof. Haworth. He undertook to investigate the exact structural formula of the substance. I used the other half of my preparation to gain a deeper understanding of the substance’s function. The substance could not replace the adrenals, but caused the disappearance of pigmentation in patients with Addison’s disease.
In 1930 I settled down in my own country at the University of Szeged. I also received a first-rate young American collaborator, J. L. Svirbely, who had experience in vitamin research, but besides this experience brought only the conviction that my hexuronic acid was not identical with vitamin C. In the autumn of 1931 our first experiments were completed, and showed unmistakably that hexuronic acid was power- fully anti-scorbutic, and that the anti-scorbutic acitvity of plant juices corresponded to their hexuronic acid content. We did not publish our results till the following year after repeating our experiments. At this time Tillmans was already directing attention to the connection between the reducing strength and the vitamin activity of plant juices. At the same time King and Waugh also reported crystals obtained from lemon juice, which were active anti-scorbutically and resembled our hexuronic acid.
My town, Szeged, is the centre of the Hungarian paprika industry. Since this fruit travels badly, I had not had the chance of trying it earlier. The sight of this healthy fruit inspired me one evening with a last hope, and that same night investigation revealed that this fruit represented an unbelievably rich source of hexuronic acid, which, with Haworth, I re-baptized ascorbic acid. I also had the privilege of providing my two prize-winning colleagues P. Karrer and W. N. Haworth with abundant material, and making its structural analysis possible for them. I myself produced with Varga the mono-acetone derivative of ascorbic acid, which forms magnificent crystals; from which, after repeated dissolving and recrystallization, ascorbic acid can be separated again with undiminished activity. This was the first proof that ascorbic acid was identical with vitamin C.
————————————————————————————————————————————-
Returning to the processes of oxidation, I now tried to analyse further the system of respiration in plants, in which ascorbic acid and peroxidase played an important part. I had already found in Rochester that the peroxidase plants contain an enzyme which reversibly oxidizes ascorbic acid with two valencies in the presence of oxygen. Further analysis showed that here again a system of respiration was in question, in which hydrogen was oxidized by stages. I would like, in the interests of brevity, to summarize the end result of these experiments, which I carried out with St. Huszák. Ascorbic acid oxidase oxidizes the acid with oxygen to reversible dehydroascorbic acid, whereby the oxygen unites with the two labile H-atoms from the acid to form hydrogen peroxide. This peroxide reacts with peroxidase and oxidizes a second molecule of ascorbic acid. Both these molecules of dehydro-ascorbic acid again take up hydrogen from the foodstuff, possibly by means of SH-groups. But peroxidase does not oxidize ascorbic acid directly. Another substance is interposed between the two, which belongs to the large group of yellow, water-soluble phenol-benzol-r-pyran plant dyes (flavone, flavonol, flavanone). Here the peroxidase oxidizes the phenol group to the quinone, which then oxidizes the ascorbic acid directly, taking up both its H-atoms.
At the time that I had just detected the rich vitamin content of the paprika, I was asked by a colleague of mine for pure vitamin C. This colleague himself suffered from a serious haemorrhagic diathesis. Since I still did not have enough of this crystalline substance at my disposal then, I sent him paprikas. My colleague was cured. But later we tried in vain to obtain the same therapeutic effect with pure vitamin C. Guided by my earlier studies into the peroxidase system, I investigated with my friend St. Rusznyák and his collaborators Armentano and Bentsáth the effect of the other link in the chain, the flavones. Certain members of this group of substances, the flavanone hesperidin (Fig. 5) and the formerly unknown eriodictyolglycoside, a mixture of which we had isolated from lemons and named citrin, now had the same therapeutic effect as paprika itself.
H U G O T H E O R E L L Nobel Lecture, December 12, 1955
The nature and mode of action of oxidation enzymes
Practically all chemical reactions in living nature are started and directed in their course by enzymes. This being the case, Man has of course since time immemorial seen examples of what we now call enzymatic reactions, e.g. fermentation and decay. It would thus be possible to trace the history of enzymes back to the ancient Greeks, or still further for that matter. But it would be rather pointless, since to observe a phenomenon is not the same thing as to explain it. It is more correct to say that our knowledge of enzymes is essentially a product of twentieth-century research.
Jöns Jacob Berzelius, wrote in his yearbook in 1835: “…The catalytic force appears actually to consist thought herein that through their mere presence, and not through their affinity, bodies are able to arouse affinities which at this temperature are slumbering…” Enzymes are the catalyzers of the biological world, and Berzelius’ description of catalytic force is surprisingly far-sighted… if one could once understand the mechanism it would doubtless prove that the forces of ordinary chemistry would suffice to explain also these as yet mysterious reactions.
The year 1926 was a memorable one. The German chemist Richard Willstitter gave a lecture then in Deutsche Chemische Gesellschaft, in which he summarized the experiences gained in his attempts over many years to produce pure enzymes. Willstätter drew the conclusion that the enzymes did not belong to any known class of chemical substances, and that the effects of the enzymes derived from a new natural force, thus taking the view that 90 years earlier Berzelius thought to be improbable. That same year, through an irony of fate, the American researcher J. B. Sumner published a work in which he claimed to have crystallized in pure form an enzyme, urease. In the ensuing years J. H. Northrop and his collaborators crystallized out a further three enzyme preparations, pepsin, trypsin, and chymotrypsin, like urease, hydrolytic enzymes that split linkages by introducing water. If these discoveries had been undisputed from the outset it would probably not have been 20 years before Sumner, together with Northrop and Stanley, received a Nobel Prize.
When in 1933 I went on a Rockefeller fellowship to Otto Warburg’s institute in Berlin, Warburg and Christian had in the previous year produced a yellow-coloured preparation of an oxidation enzyme from yeast. The yellow colour was of particular interest: it faded away on reduction and returned on oxidation with e.g. oxygen, so that it was evident that the yellow pigment had to do with the actual enzymatic process of oxido-reduction. It was possible to free the yellow pigment from the high-molecular carrier substance, whose nature was still unknown, for example by treatment with acid methyl alcohol, whereupon the enzyme effect disappeared. Through simultaneous works by Warburg in Berlin, Kuhn in Heidelberg and Karrer in Zurich the constitution of the yellow pigment (lactoflavin, later riboflavin or vitamin B,) was determined. It was here for the first time possible to localize the enzymatic effect to a definite atomic constellation: hydrogen freed from the substrate (hexose monophosphate) is, with the aid of a special enzyme system (TPN-Zwischenferment) whose nature was elucidated somewhat later, placed on the nitrogen atoms of the flavin (1) and (10), giving rise to the colourless leucoflavin. This is reoxidized by oxygen, hydrogen peroxide being formed, and may afterwards be reduced again, and so forth. This cyclic process then continues until the entire amount of substrate has been deprived of two hydrogen atoms and been transformed into phosphogluconic acid; and a corresponding amount of hydrogen peroxide has been formed. At the end of the process the yellow enzyme is still there in unchanged form, and has thus apparently, as Berzelius expressed himself, aroused a chemical affinity through its mere presence.
The polysaccharides, which constituted 80-90% of the entire weight, were completely removed, together with some inactive colourless proteins. After fractionated precipitations with ammonium sulphate I produced a crystalline preparation which on ultracentrifuging and electrophoresis appeared homogeneous. The enzyme was a protein with the molecular weight 75,000 and strongly yellow-colored by the flavin part. The result of the Flavin analysis was 1 mol flavin per 1 mol protein. With dialysis against diluted hydrochloric acid at low temperature the yellow pigment was separated from the protein, which then became colorless. In the enzyme test the flavin part and the protein separately were inactive, but if the flavin part and the protein were mixed at approximately neutral reaction the enzyme effect returned, and the original effect came back when one mixed them in the molecular proportions 1 : 1. That in this connection a combination between the pigment and the protein came about was obvious, moreover, for other reasons: the green-yellow colour of the flavin part changed to pure yellow,and its strong. yellow fluorescence disappeared with linking to the protein.
In my electrophoretic experiments lactoflavin behaved as a neutral body, while the pigment part separated from the yellow enzyme moved rapidly towards the anode and was thus an acid. An analysis for phosphorus showed 1 P per mol flavin, and when after a time (1934) I succeeded in isolating the natural pigment component this proved to be a lactoflavin phosphoric acid ester, thus a kind of nucleotide, and it was obvious that the phosphoric acid served to link the pigment part to the protein. I will now show some simple experiments with the yellow enzyme, its colored part, which we now generally refer to as FMN (flavin mononucleotide), and the colorless enzyme protein.
- The ferment-solution is pure yellow, the FMN-solution green-yellow,owing to the 1st that the light-absorption band in the blue of the free FMN is displaced somewhat in the long-wave direction on being linked with the protein component. A reducing agent (Na2S2O4) is now added to the one cuvette, it is indifferent which. The colour disappears in consequence of the formation of leucoflavin. Oxygen-gas is bubbled through the solution: the colour comes back as soon as the excess of reducing agent has been consumed. The experiment demonstrates the reaction cycle of the yellow enzyme: reduction through hydrogen from the substrate side, reoxidation with oxygen-gas.
- A flask containing FMN-solution so diluted that its yellow color is not descernible to the eye is placed on a lamp giving long-wave ultraviolet light. The solution gives a strong, yellow fluorescence which disappears on reduction and returns on bubbling with oxygen-gas.
- Two flasks are placed on the fluorescence lamp. The one contains a diluted solution of the free protein in phosphate buffer (pH 7), the other phosphate buffer alone. An equal amount of FMN-solution is dripped into each flask. In the flask with protein the fluorescence is at once extinguished,
but in the flask with buffer-solution alone it remains. The experiment demonstrates the resynthesis of yellow enzyme, and since the fluorescence is extinguished by the protein, one may draw the conclusion that some group in the protein is in this connection linked to the imino-group NH(3) of the flavin, which according to Kuhn must be free for the fluorescence to appear.
The significance of these investigations on the yellow enzyme may be summarized
as follows.
- The reversible splitting of the yellow enzyme to apo-enzyme + coenzyme in the simple molecular relation 1 : 1 proved that we had here to do with a pure enzyme; the experiments would have been incomprehensible if the enzyme itself had been only an impurity.
- This enzyme was thus demonstrably a protein. In the sequel all the enzymes which have been isolated have proved to be proteins.
- The first coenzyme, FMN, was isolated and found to be a vitamin phosphoric acid ester. This has since proved to be something occurring widely in nature: the vitamins nicotinic acid amide, thiamine and pyridoxine form in an analogous way nucleotide-like coenzymes, which like the nucleic acids
themselves combine reversibly with proteins.
During the past 20 years a large number of flavoproteins with various enzyme effects have been produced. Instead of FMN many of them contain a dinucleotide, FAD, which consists of FMN + adenylic acid.
We constructed a very sensitive apparatus to record changes in the intensity of the fluorescence, and were thus able to follow the rapidity with which the fluorescence diminishes when FMN and protein are combined, or increases when they are split. Under suitable conditions the speed of combination is very high. Thanks to the great sensitivity of the fluorescent method my Norwegian collaborator Agnar Nygaard and I were able to make accurate determinations of the speed-constant simply by working in extremely diluted solutions, where the speed of combination is low because an FMN molecule so seldom happens to collide with a protein-molecule. We then varied the degree of acidity, ionic milieu and temperature, and we treated the protein with a large number of different reagents which affect in a known way different groups in proteins. In this way we succeeded with a rather high degree of certainty in ascertaining that phosphoric acid in FMN is linked to primary amino-groups in the protein, and the imino-group (3) in FMN to the phenolic hydroxyl group in a tyrosine residue, whereby the fluorescence is extinguished.
We still do not quite understand how through its linkage to the coenzyme the enzyme-protein “activates” the latter to a rapid absorption and giving off of hydrogen. But something we do know. The so-called oxido-reduction potential of the enzyme is in any case of great importance, and it is determined by a simple relation to the dissociation constants for the oxidized and for the reduced coenzyme-enzyme complex. The dissociation constants are in their turn functions of the velocity constants for the combination between coenzyme and enzyme and for the reverse process, and these velocity constants we have been able to determine both in the yellow ferment and in a number of enzyme systems. Without going into any details I may mention that the linkage of coenzyme to enzyme was found to have surprisingly big effects upon the potential of the former.
Alcohol dehydrogenase
Alcohol dehydrogenases occur in both the animal and the vegetable kingdoms, e.g. in liver, in yeast, and in peas. They are colourless proteins which together with DPN may either oxidize alcohol to aldehyde, as occurs chiefly in the liver, or conversely reduce aldehyde to alcohol, as occurs in yeast.
The yeast enzyme was crystallized by Negelein & Wulf (1936) in Warburg’s institute, the liver enzyme (from horse liver) by Bonnichsen & Wassén at our institute in Stockholm in 1948. These two enzymes have come to play a certain general rôle in biochemistry on account of the fact that it has been possible to investigate their kinetics more accurately than is the case with other enzyme systems. The liver enzyme especially, we have on repeated occasions studied with particular thoroughness, since especially favourable experimental conditions here presented themselves. For all reactions with DPN-system it is possible to follow the reaction DPN+ + 2H =+ DPNH + H+ spectrophotometrically, since DPNH has an absorption-band in the more long-wave ultraviolet region, at 340 rnp, and thousands of such experiments have been performed all over the world. A couple of years ago, moreover, we began to apply our fluorescence method, which is based on the fact that DPNH but not DPN fluoresces, even if considerably more weakly than the flavins. Asregards the liver enzyme there is a further effect, which proved extremely useful for certain spectrophotometrical determinations of reaction speeds; together with Bonnichsen I found in 1950 that the 340 rnp band of the reduced coenzyme was displaced, on combination with liver alcohol dehydrogenase, to 325 rnp, and together with Britton Chance we were thus able with the help of his extremely refined rapid spectrophotometric methods to determine the velocity constant for this very rapid reaction. This reaction belongs to the 3 bost problem involving the enzyme, the coenzyme, and the substrate, and both the coenzyme and the substrate occur in both oxidized and reduced forms.
It is a curious whim of nature that the same coenzyme which in the yeast makes alcohol by attaching hydrogen to aldehyde also occurs in the liver to remove from alcohol the same hydrogen, so that the alcohol becomes aldehyde again, which is then oxidized further
————————————————————————————————————————————–
Heme proteins
In 1936 we had obtained cytochrome approximately 80% pure, and in 1939 close to 100%.It is a beautiful red, iron-porphyrin-containing protein which functions as a link in the chain of the cell-respiration enzymes, the iron atom now taking up and now giving off an electron, and the iron thus alternating valency between the 3-valent ferri and the 2-valent ferro stages. It is a very pleasant substance to work with, not merely because it is lovely to look at, but also because it is uncommonly stable and durable. From 100 kg horse heart one can produce 3-4 grams of pure cytochrome c. The molecule weighs about 12,000 and contains one mol iron porphyrin per-mol.
Exp. 4. Two cuvettes each contain a solution of ferricytochrome c. The colour is blood-red. To the one are added some grains of sodium hydrosulphite: the color is changed to violet-red (ferrocytochrome). Oxygen is now bubbled through the ferrocytochrome-solution: no visible change occurs. The ferrocyto-chrome can thus not be oxidized by oxygen. A small amount of cytochrome oxidase is now added: the ferricytochrome color returns.
From this experiment we can draw the conclusion that reduced cytochrome c cannot react with molecular oxygen. In a chain of oxidation enzymes it will thus not be able to be next to the oxygen. The incapacity of cytochrome to react with oxygen was a striking fact that required an explanation. Another peculiarity was the extremely firm linkage between the red heme pigment and the protein part; in contradistinction to the majority of other heme protides, the pigment cannot be split off by the addition of acetone acidified with hydrochloric acid. Further, there was a displacement of the light-absorption bands which indicated that the two unsaturated vinyl groups occurring in ordinary protohemin were saturated in the hematin of
the cytochrome. In 1938 we succeeded in showing that the porphyrin part of the cytochrome was linked to the protein by means of two sulphur bridges from cysteine residues in the protein of the porphyrin in such a way that the vinyl groups were saturated and were converted to α-thioether groups. The firmness of the linkage and the displacement of the spectral bands were herewith explained. This was the first time that it had been possible to show the nature of chemical linkages between a “prosthetic” group (in this case iron porphyrin) and the protein part in an enzyme.
The light-absorption bands of the cytochrome showed that it is a so-called hemochromogen, which means that two as a rule nitrogen-containing groups are linked to the iron, in addition to the four pyrrol-nitrogen atoms in the porphyrin. From magnetic measurements that I made at Linus Pauling’s institute in Pasadena and from amino-acid analyses, titration curves and spectrophotometry together with Å. Åkeson it emerged (1941) that the nitrogen-containing, hemochromogen-forming groups in cytochrome c were histidine residues, or to be more specific, their imidazole groups. Recently we have got a bit farther. Tuppy & Bodo in Vienna began last year with Sanger’s method to elucidate the amino-acid sequence in the hemin-containing peptide fragment that one obtains with the proteolytic breaking down of cytochrome c, and succeeded in determining the sequence of the amino acids nearest the heme. The experiments were continued and supplemented by Tuppy, Paléus & Ehrenberg at our institute in Stockholm with the following result:
The peptide chain 1-12 (“Val”) = the amino acid valine, “Glu” = glutamine,”Lys” = lysine, and so forth) is by means of two cysteine-S-bridges and a linkage histidine-Fe linked to the heme. When in 1954 Linus Pauling delivered his Nobel Lecture in Stockholm he showed a new kind of models for the study of the steric configuration of peptide chains, which as we know may form helices or “pleated sheets” of various kinds. It struck me then that it would be extremely interesting to study the question as to which of these possibilities might be compatible with the sulphur bridges to the hemin part and with the linkage of nitrogen containing groups to the iron. Pauling was kind enough to make me a present of his peptide-model pieces, which I shall show presently. This is thus the second time they figure in a Lecture.
Anders Ehrenberg and I now made a hemin model on the same scale as the peptide pieces and constructed models of hemin peptides with every conceivable variant of hydrogen bonding. It proved that many variants could be definitely excluded on steric grounds, and others were improbable for other reasons. Of the original, at least 20 alternatives, finally only one remained – a left-twisting a-helix with the cysteine residue no. 4 linked to the porphyrin side-chain in 4-position, and cysteine no. 7 to the side-chain in 2-position. The imidazole residue fitted exactly to linkage with the iron atom. The peptide spiral becomes parallel with the plane of the heme disc.
Through calculations on the basis of the known partial specific volume of the cytochrome we now consider it extremely probable that the heme plate in cytochrome c is surrounded by peptide spirals on all sides in such a way that the heme iron is entirely screened off from contact with oxygen; here is the explanation of our experiment in which we were unable to oxidize reduced cytochrome c with oxygen-gas. The oxygen simply cannot get at the iron atom. There is, on the other hand, a possibility for electrons to pass in and out in the iron atom via the imidazole groups. It strikes us as interesting that even at this stage the special mode of reacting of the cytochrome is beginning to be understood from what we know of its chemical constitution.
F r i t z L i p m a n n Nobel Lecture, December 11, 1953
Development of the acetylation problem: a personal account
In my development, the recognition of facts and the rationalization of these facts into a unified picture, have interplayed continuously. After my apprenticeship with Otto Meyerhof, a first interest on my own became the phenomenon we call the Pasteur effect, this peculiar depression of the wasteful fermentation in the respiring cell. By looking for a chemical explanation of this economy measure on the cellular level, I was prompted into a study of the mechanism of pyruvic acid oxidation, since it is at the pyruvic stage where respiration branches off from fermentation. For this study I chose as a promising system a relatively simple looking pyruvic acid oxidation enzyme in a certain strain of Lactobacillus delbrueckii1. The decision to explore this particular reaction started me on a rather continuous journey into partly virgin territory to meet with some unexpected discoveries, but also to encounter quite a few nagging disappointments
The most important event during this whole period, I now feel, was the accidental observation that in the L. delbrueckii system, pyruvic acid oxidation was completely dependent on the presence of inorganic phosphate. This observation was made in the course of attempts to replace oxygen by methylene blue. To measure the methylene blue reduction manometrically, I had to switch to a bicarbonate buffer instead of the otherwise routinely used phosphate. In bicarbonate, to my surprise, as shown in Fig. 1, pyruvate oxidation was very slow, but the addition of a little phosphate caused a remarkable increase in rate. The next figure, Fig. 2, shows the phosphate effect more drastically, using a preparation from which all phosphate was removed by washing with acetate buffer. Then it appeared that the reaction was really fully dependent on phosphate. In spite of such a phosphate dependence, the phosphate balance measured by the ordinary Fiske-Subbarow procedure did not at first indicate any phosphorylative step. Nevertheless, the suspicion remained that phosphate in some manner was entering into the reaction and that a phosphorylated intermediary was formed. As a first approximation, a coupling of this pyruvate
oxidation with adenylic acid phosphorylation was attempted. And, indeed, addition of adenylic acid to the pyruvic oxidation system brought out a net disappearance of inorganic phosphate, accounted for as adenosine triphosphate (Table 11). In parallel with the then just developing fermentation now concluded that the missing link in the reaction chain was acetyl phosphate. In partial confirmation it was shown that a crude preparation of acetyl phosphate, synthesized by the old method of Kämmerer and Carius2
would transfer phosphate to adenylic acid (Table 2). However, it still took quite some time from then on to identify acetyl phosphate definitely as the initial product of the pyruvic oxidation in this system3,4.
At the time when these observations were made, about a dozen years ago, there was, to say the least, a tendency to believe that phosphorylation was rather specifically coupled with the glycolytic reaction. Here, however, we had found a coupling of phosphorylation with a respiratory system. This observation immediately suggested a rather sweeping biochemical significance, of transformations of electron transfer potential, respiratory or fermentative, to phosphate bond energy and therefrom to a wide range of biosynthetic reactions7.
There was a further unusual feature in this pyruvate oxidation system in that the product emerging from the process not only carried an energy-rich phosphoryl radical such as already known, but the acetyl phosphate was even more impressive through its energy-rich acetyl. It rather naturally became a contender for the role of “active” acetate, for the widespread existence of which the isotope experience had already furnished extensive evidence. I became, therefore, quite attracted by the possibility that acetyl phosphate could serve two rather different purposes, either to transfer its phosphoryl group into the phosphate pool, or to supply its active acetyl for biosynthesis of carbon structures. Thus acetyl phosphate should be able to serve as acetyl donor as well as phosphoryl donor, transferring, as shown in Fig. 3, on either side of the oxygen center, such as indicated by Bentley’s early experiments on cleavage7a of acetyl phosphate in H2 18O.
These two novel aspects of the energy problem, namely
(1) the emergence of an energy-rich phosphate bond from a purely respiratory reaction; and
(2) the presumed derivation of a metabolic building-block through this same there towards a general concept of transfer of activated groupings by carrier as the fundamental reaction in biosynthesis8,9.
Although in the related manner the appearance of acetyl phosphate as a metabolic intermediary first
focussed attention to possible mechanisms for the metabolic elaboration of group activation, it soon turned out that the relationship between acetyl phosphate and acetyl transfer was much more complicated than anticipated. reaction, prompted me to propose
- not only the generalization of the phosphate bond as a versatile energy distributing system,
- but also to aim there towards a general concept of transfer of activated groupings by carrier as the fundamental reaction in biosynthesis8,9.
Although in the related manner the appearance of acetyl phosphate as a metabolic intermediary first focussed attention to possible mechanisms for the metabolic elaboration of group activation, it soon turned out that the relationship between acetyl phosphate and acetyl transfer was much more complicated than anticipated.
It appeared that as an energy source the particle bound oxidative phosphorylation of the kind observed first by Herman Kalckar14 could be replaced by ATP, as had first been observed with the acetylation of choline in brain preparations by Nachmansohn and his group15,16. Using ATP and acetate as precursors, it was possible to set up a homogeneous particle-free acetylation system obtained by extraction of acetone pigeon liver. In this extract acetyl phosphate was unable to replace the ATP acetate as acetyl precursor.
In spite of this disappointment with acetyl phosphate, our decision to turn to a study of acetylation started then to be rewarding in another way. During these studies we became aware of the participation of a heat-stable factor which disappeared from our enzyme extracts on aging or dialysis. This cofactor was present in boiled extracts of all organs, as well as in microorganisms and yeast. It could not be replaced by any other known cofactor. Therefore, it was suspected that we were dealing with a new coenzyme. From then on, for a number of years, the isolation and identification of this coenzyme became the prominent task of our laboratory. The problem now increased in volume and I had the very good fortune that a group of exceedingly able people were attracted to the laboratory; first Constance Tuttle, then Nathan O. Kaplan and shortly afterwards, G. David Novelli, and then others.
Early data on the replacement of this heat-stable factor by boiled extracts are shown in the next table (Table 3). The pigeon liver acetylation system proved to be a very convenient assay system for the new coenzyme17 since on aging for 4 hours at room temperature, the cofactor was completely autolyzed.
Fortunately, on the other hand, the enzyme responsible for the decomposition of this factor was quite unstable and faded out during the aging, while the acetylation apoenzymes were unaffected.
The next figure, Fig. 4, shows coenzyme A (CoA) assay curves obtained with acetone pigeon liver extract. Finding pig liver a good source for the coenzyme, we set out to collect a reasonably large quantity of a highly purified preparation and then to concentrate on the chemistry with this material. In this analysis we paid particular attention to the possibility of finding in this obviously novel cofactor one of the vitamins.
The subsequence finding of a B-vitamin in the preparation gave us further confidence that we were dealing here with a key substance. We still felt, however, slightly dissatisfied with the proof for pantothenic acid. Therefore, to liberate the chemically rather unstable pantothenic acid from CoA, we made use of observations on enzymatic cleavage of the coenzyme. Two enzyme preparations, intestinal phosphatase and an enzyme in pigeon liver extract, had caused independent inactivation. It then was found that through combined action of these two enzymes, pantothenic acid was liberated18,19.
The two independent enzymatic cleavages indicated early that in CoA existed two independent sites of attachment to the pantothenic acid molecule. One of these obviously was a phosphate link, linking presumably to one of a hydroxyl group in pantothenic acid. The other moiety attached to pantothenic acid, which, cleaved off by liver enzyme, remained unidentified for a long time. In addition to pantothenic acid, our sample of 40 per cent purity had been found to contain about 2 per cent sulfur by elementary analysis and identified by cyanide-nitroprusside test as a potential SH grouping 20,21. Furthermore, the coenzyme preparation contained large amounts of adenylic acid21.
Units Coenzyme
Fig. 4. Concentration-activity curves for coenzyme A preparations of different purity. The arrow indicates the point of 1 unit on the curve. (o) crude coenzyme, 0.25 unit per mg; (x) purified coenzyme, 130 units per mg.
In the subsequent elaboration of the structure, the indications by enzyme analysis for the two sites of attachment to pantothenic acid have been most helpful. The phosphate link was soon identified as a pyrophosphate bridge22; 5-adenylic acid was identified by Novelli23 as enzymatic split product and by Baddiley 24, through chemical cleavage. At the same time, Novelli made observations which indicated the presence of a third phosphate in addition to the pyrophosphate bridge. These indications were confirmed by analysis of a nearly pure preparation which was obtained by Gregoryas from Streptomyces fradiae in collaboration with the research group at the Upjohn Company26.
It was at this period that we started to pay more and more attention to the sulfur in the coenzyme. As shown in Table 5, our purest preparation contained 4.13 per cent sulfur corresponding to one mole per mole of pantothenate. We also found26 that dephosphorylation of CoA yielded a compound containing pantothenic acid and the sulfur carrying moiety, which we suspected as bound through the carboxyl. Through the work of Snell and his group27, the sulfur-containing moiety proved to be attached to pantothenic acid through a link broken by our liver enzyme. It was identified as thioethanolamine by Snell and his group, linked peptidically to pantothenic acid.
Through analysis and synthesis, Baddiley now identified the point of attachment of the phosphate bridge to pantothenic acid in 4-position24 and Novelli et al.28 completed the structure analysis by enzymatic synthesis of “dephospho-CoA” from pantetheine-4’-phosphates and ATP. Furthermore, the attachment of the third phosphate was identified by Kaplan29 to attach in s-position on the ribose of the 5-adenylic acid (while in triphosphopyridine nucleotide it happens to be in 2-position). Therefore, the structure was now
established, as shown in Fig. 5.
Fig. 5. Structure of coenzyme A
The metabolic function of CoA
Parallel with this slow but steady elaboration of the structure, all the time we explored intensively metabolic mechanisms in the acetylation field. By use of the enzymatic assay, as shown in Tables 6, 7, 8, and 9, CoA was found present in all living cells, animals, plants and microorganisms17. Furthermore,
the finding that all cellular pantothenic acid could be accounted for by CoA17 made it clear that CoA represented the only functional form of this vitamin. The finding of the vitamin furnished great impetus; nevertheless, a temptation to connect the pantothenic acid with the acetyl transfer function has
blinded us for a long time to other possibilities.
The first attempts to further explore the function of CoA were made with pantothenic acid-deficient cells and tissues. A deficiency of pyruvate oxidation in pantothenic acid-deficient Proteus morganii, an early isolated observation by Dorfman30 and Hills31, now fitted rather well into the picture. We soon became quite interested in this effect, taking it as an indication for participation of CoA in citric acid synthesis. A parallel between CoA levels and pyruvate oxidation in Proteus morganii was demonstrated32. Using panto thenic aciddeficient yeast, Novelli et al.33 demonstrated a CoA-dependence of acetate oxidation (Fig. 5a) and Olson and Kaplan34 found with duck liver a striking parallel between CoA content and pyruvic utilization, which is shown in Fig. 6.
But more important information was being gathered on -the enzymatic level. The first example of a generality of function was obtained by comparing the activation of apoenzymes for choline- and sulfonamide-acetylation respectively, using our highly purified preparations9 of CoA. As shown in Fig. 7, similar activation curves obtained for the two respective enzymes. Through these experiments, the heat-stable factor for choline acetylation that had been found by Nachmansohn and Berman35 and by Feldberg and Mann36 was identified with CoA. The next most significant step toward a generalization of CoA function for acetyl transfer was made by demonstrating its functioning in the enzymatic synthesis of acetoacetate. The CoA effect in acetoacetate synthesis was studied by Morris Soodak37, who obtained for this reaction a reactivation curve quite similar to those for enzymatic acetylation, as shown in Fig. 8.
Soon afterwards Stern and Ochoa38 showed a CoA-dependent citrate synthesis with a pigeon liver fraction similar to the one used by Soodak for acetoacetate synthesis. In our laboratory, Novelli et al. confirmed and extended this observation with extracts of Escherichia coli39.
In the course of this work, which more and more clearly defined the acetyl transfer function of CoA, Novelli once more tried acetyl phosphate. To our surprise and satisfaction, it then appeared, as shown in Table 9, that in Escherichia coli extracts in contrast to the animal tissue, acetyl phosphate was more than twice as active as acetyl donor for citrate synthesis than ATP acetate 39. Acetyl phosphate, therefore, functioned as a patent microbial acetyl donor. Acetyl transfer from acetyl phosphate, like that from ATP-acetate, was CoA-dependent, as shown in Table 9. Furthermore, a small amount of “microbial conversion factor”, as we called it first, primed acetyl phosphate for activity with pigeon liver acetylation systems40, as shown in Table 10.
Eventually the microbial conversion factor was identified by Stadtman et al.40 with the transacetylase first encountered by Stadtman and Barker in extracts of Clostridium kluyveri41 and likewise, although not clearly defined as such, in extracts of Escherichia coli and Clostridium butylicum by Lipmann and Tuttle42. The definition of such a function was based on the work of Doudoroff et al.43 on transglucosidation with sucrose phosphorylase. Their imaginative use of isotope exchange for closer definition of enzyme mechanisms has been most influential. Like glucose-I-phosphate with sucrose phosphorylase, acetyl phosphate with these various microbial preparations equilibrates its phosphate rapidly with the inorganic phosphate of the solution. As in Doudoroff et al. experiments, first a covalent substrate enzyme derivative had been proposed 43. However, then Stadtman et al.40, with the new experience of CoA dependent acetyl transfer, could implicate CoA in this equilibration between acetyl- and inorganic phosphate and thus could define the transacetylase as an enzyme equilibrating acetyl between phosphate and CoA:
In the course of these various observations, it became quite clear that there existed in cellular metabolism an acetyl distribution system centering around CoA as the acetyl carrier which was rather similar to the ATP-centered phosphoryl distribution system. The general pattern of group transfer became recognizable, with donor and acceptor enzymes being connected through the CoA —- acetyl CoA shuttle. A clearer definition of the donor-acceptor enzyme scheme was obtained through acetone fractionation of our standard system for acetylation of sulfonamide into two separate enzyme fractions, which were inactive separately but showed the acetylation effect when combined. A fraction, A-40, separating out with 40 per cent acetone, was shown by Chou44 to contain the donor enzyme responsible for the ATP-CoA-acetate reaction, while with more acetone precipitated, the acceptor function, A-60, the acetoarylamine kinase as we propose to call this type of enzyme. The need for a combination of the two for overall acetyl transfer is shown in Fig. 9. This showed that a separate system was responsible for acetyl CoA formation through interaction of ATP, CoA and acetate (cf. below) and that the overall acetylation was a two-step reaction:
These observations crystallized into the definition of a metabolic acetyl transfer territory as pictured in Fig. 10. This picture had developed from the growing understanding of enzymatic interplay involving metabolic generation of acyl CoA and transfer of the active acyl to various acceptor systems. A most important, then still missing link in the picture was supplied through the brilliant work of Feodor Lynen45 who chemically identified acetyl CoA as the thioester of CoA. Therewith the thioester link was introduced as a new energy-rich bond and this discovery added a very novel facet to our understanding of the mechanisms of metabolic energy transformation.
Enzyme Localization In The Anaerobic Mitochondria Of Ascaris L Umbricoides
Robert S. Rew And Howard J. Saz
From the Department of Biology, University of Notre Dame, Notre Dame, Indiana 46556
Mitochondria from the muscle of the parasitic nematode Ascaris lumbricoides var. suum function anaerobically in electron transport-associated phosphorylations under physiological conditions. These helminth organelles have been fractionated into inner and outer membrane, matrix, and intermembrane space fractions. The distributions of enzyme systems were determined and compared with corresponding distributions reported in mammalian mitochondria. Succinate and pyruvate dehydrogenases as well as NADH oxidase, Mg++-dependent ATPase, adenylate kinase, citrate synthase, and cytochrome c reductases were determined to be distributed as in mammalian mitochondria. In contrast with the mammalian systems, fumarase and NAD-linked “malic” enzyme were isolated primarily from the intermembrane space fraction of the worm mitochondria. These enzymes required for the anaerobic energy-generating system in Ascaris and would be expected to give rise to NADH in the intermembrane space. The need for and possible mechanism of a proton translocation system to obtain energy generation is suggested. Downloaded from jcb.rupress.org
David Keilin’s Respiratory Chain Concept and its Chemiosmotic Consequences
Peter Mitchell Nobel Lecture, 8 December, 1978
Glynn Research Institute, Bodmin, Cornwall, U. K.
“for his contribution to the understanding of biological energy transfer through the formulation of the chemiosmotic theory”
Peter D. Mitchell (1920-1992) received the Nobel Prize in 1978 for developing the Chemiosmotic Theory to explain ATP synthesis resulting from membrane-associated electron transport [Ubiquinone and the Proton Pump].
Mitchell is the last of the gentleman scientists. He first proposed the chemiosmotic principle in a 1961 Nature article while he was at the University of Edinburgh. Shortly after that, ill health forced him to move to Cornwall where he renovated an old manor house and converted it into a research laboratory. From then on, he and his research colleague, Jennifer Moyle, continued to work on the chemiosmotic theory while being funded by his private research foundation. [Peter Mitchell: Wikipedia]
The Chemiosmotic Theory was controversial in 1978 and it still has not been fully integrated into some biochemistry textbooks in spite of the fact that it is now proven. The main reason for the resistance is that it overthrows much of traditional biochemistry and introduces a new way of thinking. It is a good example of a “paradigm shift” in biology.
Because he was such a private, and eccentric, scientist there are very few photos of Peter Mitchell or his research laboratory at Glynn House . The best description of him is in his biography Wandering in the Gardens of the Mind: Peter Mitchell and the Making of Glynn by John Prebble, and Bruce Weber. A Nature review by E.C. Slater [Metabolic Gardening] gives some of the flavor and mentions some of the controversy.

Wandering_in_the_Gardens_of_the_Mind_Peter_Mitchell

Peter_Mitchell
http://pharmaceuticalintelligence.com/wp-content/uploads/2014/08/44abe-peter_mitchell.jpg
http://pharmaceuticalintelligence.com/wp-content/uploads/2014/08/77938-wandering_in_the_gardens_of_the_mind_peter_mitchell.jpg
Many scientists believe that the Chemiosmotic Theory was the second greatest contribution to biology in the 2oth century (after the discovery of the structure of DNA). Mitchell had to overcome many critics including Hans Krebs. The case is strong.
In the 1960s, ATP was known to be the energy currency of life, but the mechanism by which ATP was created in the mitochondria was assumed to be by substrate-level phosphorylation. Mitchell’s chemiosmotic hypothesis was the basis for understanding the actual process of oxidative phosphorylation. At the time, the biochemical mechanism of ATP synthesis by oxidative phosphorylation was unknown.
Mitchell realised that the movement of ions across an electrochemical potential difference could provide the energy needed to produce ATP. His hypothesis was derived from information that was well known in the 1960s. He knew that living cells had a membrane potential; interior negative to the environment. The movement of charged ions across a membrane is thus affected by the electrical forces (the attraction of positive to negative charges). Their movement is also affected by thermodynamic forces, the tendency of substances to diffuse from regions of higher concentration. He went on to show that ATP synthesis was coupled to this electrochemical gradient.[11]
His hypothesis was confirmed by the discovery of ATP synthase, a membrane-bound protein that uses the potential energy of the electrochemical gradient to make ATP.
Growth, development and metabolism are some of the central phenomena in the study of biological organisms. The role of energy is fundamental to such biological processes. The ability to harness energy from a variety of metabolic pathways is a property of all living organisms. Life is dependent on energy transformations; living organisms survive because of exchange of energy within and without.
In a living organism, chemical bonds are broken and made as part of the exchange and transformation of energy. Energy is available for work (such as mechanical work) or for other processes (such as chemical synthesis and anabolic processes in growth), when weak bonds are broken and stronger bonds are made. The production of stronger bonds allows release of usable energy.
One of the major triumphs of bioenergetics is Peter D. Mitchell‘s chemiosmotic theory of how protons in aqueous solution function in the production of ATP in cell organelles such as mitochondria.[5] This work earned Mitchell the 1978 Nobel Prize for Chemistry. Other cellular sources of ATP such as glycolysis were understood first, but such processes for direct coupling of enzyme activity to ATP production are not the major source of useful chemical energy in most cells. Chemiosmotic coupling is the major energy producing process in most cells, being utilized in chloroplasts and several single celled organisms in addition to mitochondria.
Cotransport
In August 1960, Robert K. Crane presented for the first time his discovery of the sodium-glucose cotransport as the mechanism for intestinal glucose absorption.[2] Crane’s discovery of cotransport was the first ever proposal of flux coupling in biology and was the most important event concerning carbohydrate absorption in the 20th century.[3][4]
The free energy (ΔG) gained or lost in a reaction can be calculated: ΔG = ΔH – TΔS
where G = Gibbs free energy, H = enthalpy, T = temperature, and S = entropy.
How inositol pyrophosphates control cellular phosphate homeostasis?
Adolfo Saiardi*
Cell Biology Unit, Medical Research Council Laboratory for Molecular Cell Biology, Department of Cell and Developmental Biology,
University College London, Gower Street, London WC1E 6BT, United Kingdom
Advances in Biological Regulation 52 (2012) 351–359
Phosphorus in his phosphate PO43_ configuration is an essential constituent of all life forms. Phosphate diesters are at the core of nucleic acid structure, while phosphate monoester transmits information under the control of protein kinases and phosphatases. Due to these fundamental roles in biology it is not a surprise that phosphate cellular homeostasis is under tight control.
Inositol pyrophosphates are organic molecules with the highest proportion of phosphate groups, and they are capable of regulating many biological processes, possibly by controlling energetic metabolism and adenosine triphosphate (ATP) production.
Furthermore, inositol pyrophosphates influence inorganic polyphosphates (polyP) synthesis. The polymer polyP is solely constituted by phosphate groups and beside other known functions, it also plays a role in buffering cellular free phosphate [Pi] levels, an event that is ultimately necessary to generate ATP and inositol pyrophosphate.
Two distinct classes of proteins the inositol hexakisphosphates kinases (IP6Ks) and the diphosphoinositol pentakisphosphate kinases (PP-IP5Ks or IP7Ks) are capable of synthesizing inositol pyrophosphates.
IP6Ks utilize ATP as a phosphate donor to phosphorylate IP6 to IP7, generation the isomer 5PP-IP5 (Fig. 1A), and inositol pentakisphosphate I(1,3,4,5,6)P5 to PP-IP4 (Saiardi et al., 1999, 2000; Losito et al., 2009). Furthermore, at least in vitro, IP6Ks generate more complex molecules containing two or more pyrophosphate moieties, or even three-phosphate species (Draskovic et al., 2008; Saiardi et al., 2001). Three IP6K isoforms referred to as IP6K1, 2, 3 exist in mammal; however, there is a single IP6K in the yeast Saccharomyces cerevisiae called Kcs1.
The PP-IP5Ks enzymes, synthesize inositol pyrophosphate from IP6, but not from IP5, (Losito et al., 2009) generating the isomer 1PP-IP5. Kinetic studies performed in vitro suggested that IP7, the 5PP-IP5 isomer generated by IP6Ks, is the primary substrate of this new enzyme, and this finding was confirmed in vivo by analysing PP-IP5K null yeast (vip1D) that accumulate the un-metabolized substrate IP7 (Azevedo et al., 2009; Onnebo and Saiardi, 2009). Thus PP-IP5K is responsible for IP8,
isomer 1,5PP2-IP4 synthesis (Fig. 1A). Two PP-IP5K isoforms referred to as PP-IP5Ka and b exist in mammal while a single PP-IP5K called Vip1 is present in S. cerevisiae.
Inositol pyrophosphates are hydrolysed by the diphosphoinositol-polyphosphate phosphohydrolases (DIPPs) (Safrany et al., 1998). Four mammalian enzymes DIPP1,2,3,4 have been identified, while only one DIPP protein exists in S. cerevisiae called Ddp1. These phosphatases are promiscuous enzymes able to hydrolyse inositol pyrophosphate as well as nucleotide analogues, such as diadenosine hexaphosphate (Ap6A) (Caffrey et al., 2000; Fisher et al., 2002). More recently, it has been shown that DIPPs also degrade polyP (Lonetti et al., 2011). Inositol pyrophosphates control the most disparate biological processes, from telomere length to vesicular trafficking. It is conceivable that all these function can be focused on the fact that inositol pyrophosphates are controlling cellular energy metabolism and consequently, ATP production. We have recently, demonstrated that inositol pyrophosphates control glycolysis and mitochondrial oxidative phosphorylation by both inhibiting the glycolytic flux and increasing mitochondrial activity (Szijgyarto et al., 2011).
Another important molecule to briefly introduce is polyP (Fig. 1B). The interested reader is encouraged to read the following comprehensive reviews (Kornberg et al., 1999; Rao et al., 2009). The polyP polymer likely represents a phosphate buffer that is synthesized and degraded in function of the phosphate needs of the cells. Furthermore, it also functions as a chelator of metal ions, thereby regulating cellular cation homeostasis. However, polyP also possesses more classical signalling roles.
In bacteria for example, it influences pathogenicity (Brown and Kornberg, 2008) and in mammalian cells it has been proposed to regulate fibrinolysis and platelet aggregation (Caen and Wu, 2010). In prokaryotes, polyP synthesis is carried out by a family of conserved polyP kinases (PPKs), whereas degradation is mediated by several polyP phosphatases (Rao et al., 2009). In higher eukaryotes polyP synthesis remains poorly characterized.
In humans alteration of phosphate metabolism is implicated in several pathological states. Higher serum phosphate leads to vascular calcification and cardiovascular complications. Although only very small amount of phosphate circulates in the serum, its concentration is tightly regulated and it is independent from dietary phosphorus intake (de Boer et al., 2009). Therefore, it is not surprising that intense research efforts are aimed to elucidate phosphate uptake and metabolism. IP6K2 was initially cloned while searching for a novel mammalian intestinal phosphate transporter that the group of Murer identified as PiUS (Phosphate inorganic Uptake Stimulator) (Norbis et al., 1997). Once transfected into Xenopus oocytes, PiUS stimulated the cellular uptake of radioactive phosphate.
Subsequently, two groups discovered that PiUS was capable of converting IP6 to IP7 and rename it to IP6K2 (Saiardi et al., 1999; Schell et al., 1999). The ability of inositol pyrophosphate to control the uptake of phosphate is an evolutionary conserved feature; in fact, kcs1D yeast with undetectable level of IP7 exhibits a reduced uptake of phosphate from the culture medium (Saiardi et al., 2004).
In mammals, regulation of phosphate homeostasis is not restricted to IP6K2, all three mammalian IP6Ks are likely to play a role. A genome-wide study aimed at identifying genetic variations associated with changes of serum phosphorus concentration identified IP6K3 (Kestenbaum et al., 2010). This human genetic study identified two independent single nucleotide polymorphisms (SNP) at locus 6p21.31, which are localised within the first intron of the IP6K3 gene. Interestingly, this study that analysed more than 16,000 humans identified SNP variant in only seven genes. Three of which, the sodium phosphate cotransporter type IIa, the calcium sensing receptor and the fibroblast growth factor 23, are well known regulators of phosphate homeostasis. These evidences support a role for IP6K3 in controlling serum phosphate levels in humans (Kestenbaum et al., 2010).
The hypothesis
Although, inositol pyrophosphate may have acquired unique organism-specific functions, the conserved ability of this class of molecules to regulate phosphate metabolism suggests an evolutionary ancient role. In this last paragraph, I will formulate few hypotheses that I hope will stimulate further research aimed at elucidating the biological link between phosphate, inositol pyrophosphates and polyP.
Inositol pyrophosphates regulate the entry of phosphate into the cells (Norbis et al., 1997), suggesting that they could affect phosphate uptake either directly (by stimulating a transporter, for example) or a indirectly by helping ‘fixing’ free phosphates in organic molecules. The cytosolic concentration of free phosphate [Pi] cannot fluctuate widely. Therefore, cellular entry of phosphates and its utilization may well be coupled. For example, the synthesis of polyP may be linked to phosphate entry in the cell. Inositol pyrophosphate control of energy metabolism (Szijgyarto et al., 2011) affects not only ATP levels but it can also alter the entire cellular balance of adenine nucleotides. Given that phosphate transfer reactions mainly use ATP as a vehicle for the phosphate groups, inositol pyrophosphate could affect phosphate metabolism by regulating the adenylate cellular pool. Moreover, it is tempting to speculate the existence of a feedback mechanism that coordinates the metabolic balance between ATP, phosphate and inositol pyrophosphates.
Inositol pyrophosphates could either contribute to the regulation of polyP synthesis, play a role in polyP degradation, or both. The yeast polyP polymerase has been identified with the subunit four (Vtc4) of the vacuolar membrane transporter chaperone (VTC) complex (Hothorn et al., 2009). Interestingly, pyrophosphates (Pi–Pi) dramatically accelerate the polyP polymerase reaction. It would therefore be interesting to determine whether the pyrophosphate moiety of IP7 can stimulate polyP vacuolar synthesis in a similar fashion. Similarly, it would be interesting to analyse the effect of inositol pyrophosphates on controlling the activity of the actin-like DdIPK2 enzyme. It should be noted however, that the existence even in yeast or Dictyostelium of other enzymes able to synthesize different polyP pools cannot be excluded. Thus, we will be able to validate and fully appreciate the role played by inositol pyrophosphates on polyP synthesis only after the identification of higher eukaryotes polyp synthesizing peptide/s.
The most abundant form of organic phosphate on earth is IP6, or phytic acid, a molecule that is highly abundant in plant seeds from which was originally characterised. In plant seeds, IP6 represents a phosphate storage molecule that it is hydrolysed during germination, releasing phosphates and cations. It will be an astonishing twist of event if inositol pyrophosphates were controlling the levels of their own precursor IP6 (Raboy, 2003), although due to the evolutionary conserved ability of inositol pyrophosphate to control phosphate homeostasis we should not be entirely surprised.
Although it is not yet clear how inositol pyrophosphates regulate cellular metabolism, understanding how inositol pyrophosphates influence phosphates homeostasis will help to clarify this important link.
Auesukaree C, Tochio H, Shirakawa M, Kaneko Y, Harashima S. Plc1p, Arg82p, and Kcs1p, enzymes involved in inositol pyrophosphate synthesis, are essential for phosphate regulation and polyphosphate accumulation in Saccharomyces cerevisiae. J Biol Chem 2005;280:25127–33.
Azevedo C, Burton A, Ruiz-Mateos E, Marsh M, Saiardi A. Inositol pyrophosphate mediated pyrophosphorylation of AP3B1 regulates HIV-1 Gag release. Proc Natl Acad Sci U S A 2009;106:21161–6.
Bennett M, Onnebo SM, Azevedo C, Saiardi A. Inositol pyrophosphates: metabolism and signaling. Cell Mol Life Sci 2006;63:552–64.
Boer VM, Crutchfield CA, Bradley PH, Botstein D, Rabinowitz JD. Growth-limiting intracellular metabolites in yeast growing under diverse nutrient limitations. Mol Biol Cell 2010;21:198–211.
Brown MR, Kornberg A. The long and short of it – polyphosphate, PPK and bacterial survival. Trends Biochem Sci 2008;33:284–90.
Burton A, Hu X, Saiardi A. Are inositol pyrophosphates signalling molecules? J Cell Physiol 2009;220:8–15.
Caen J, Wu Q. Hageman factor, platelets and polyphosphates: early history and recent connection. J Thromb Haemost 2010;8:1670–4.
Caffrey JJ, Safrany ST, Yang X, Shears SB. Discovery of molecular and catalytic diversity among human diphosphoinositol polyphosphate phosphohydrolases. An expanding Nudt family. J Biol Chem 2000;275:12730–6.
A Mitochondrial RNAi Screen Defines Cellular Bioenergetic Determinants and Identifies an Adenylate Kinase as a Key Regulator of ATP Levels
Nathan J. Lanning,1 Brendan D. Looyenga,1,2 Audra L. Kauffman,1 Natalie M. Niemi,1 Jessica Sudderth,3
Ralph J. DeBerardinis,3 and Jeffrey P. MacKeigan1,*
Cell Reports http://dx.doi.org/10.1016/j.celrep.2014.03.065
Altered cellular bioenergetics and mitochondrial function are major features of several diseases, including cancer, diabetes, and neurodegenerative disorders. Given this important link to human health, we sought to define proteins within mitochondria that are critical for maintaining homeostatic ATP levels.
We screened an RNAi library targeting >1,000 nuclear-encoded genes whose protein products localize to the mitochondria in multiple metabolic conditions in order to examine their effects on cellular ATP levels. We identified a mechanism by which electron transport chain (ETC) perturbation under glycolytic conditions increased ATP production through enhanced glycolytic flux, thereby highlighting the cellular potential for metabolic plasticity.
Additionally, we identified a mitochondrial adenylate kinase (AK4) that regulates cellular ATP levels and AMPK signaling and whose expression significantly correlates with glioma patient survival. This study maps the bioenergetic landscape of >1,000 mitochondrial proteins in the context of varied metabolic substrates and begins to link key metabolic genes with clinical outcome.
Comments to be further addressed by JES Roselino
I will add some observations or at least one single observation.
Just at the beginning, when phosphorylation of proteins is presented, I assume you must mention that some proteins are activated by phosphorylation. This is fundamental in order to present self –organization reflex upon fast regulatory mechanisms. Even from an historical point of view. The first observation arrived from a sample due to be studied on the following day of glycogen synthetase. It was unintended left overnight out of the refrigerator. The result was it has changed from active form of the previous day to a non-active form. The story could have being finished here, if the researcher did not decide to spent this day increasing substrate levels (it could be a simple case of denaturation of proteins that changes its conformation despite the same order of amino acids). He kept on trying and found restoration of maximal activity. This assay was repeated with glycogen phosphorylase and the result was the opposite it increases its activity. This lead to the discovery of cAMP activated protein kinase and the assembly of a very complex system in the glycogen granule that is not a simple carbohydrate polymer. Instead it has several proteins assembled and preserves the capacity to receive from a single event (rise in cAMP) two opposing signals with maximal efficiency, stops glycogen synthesis, as long as levels of glucose 6 phosphate are low and increases glycogen phosphorylation as long as AMP levels are high).
I did everything I was able to do by the end of 1970 in order to repeat this assays with PK I, PKII and PKIII of M. Rouxii and Sutherland route to cAMP failed in this case. I ask Leloir to suggest to my chief (SP) the idea of AA, AB, BB subunits as was observed in lactic dehydrogenase (tetramer) indicating this as his idea. The reason was my “chief”(SP) more than once, have said it to me: “Leave these great ideas for the Houssay, Leloir etc…We must do our career with small things.” However, as she also have a faulty ability for recollection she also uses to arrive some time later, with the very same idea but in that case, as her idea.
Leloir, said to me: I will not offer your interpretation to her as mine. I think it is not phosphorylation, however I think it is glycosylation that explains the changes in the isoenzymes with the same molecular weight preserved. This dialogue explains why during “What is life” reading with him he asked me if from biochemist in exile, to biochemist I talked everything to him. Since I have considered that Schrödinger did not have confronted Darlington & Haldane for being in exile. Also, may explain why Leloir could have answered a bad telephone call from P. Boyer, Editor of The Enzymes in a way that suggest the the pattern could be of covalent changes over a protein. Our FEBS and Eur J. Biochemistry papers on pyruvate kinase of M. Rouxii is wrongly quoted in this way on his review about pyruvate kinase of that year(1971).
Another aspect I think you must call attention, in my opinion, is the following, show in detail with different colors what carbons belongs to CoA a huge molecule, in comparison with the single two carbons of acetate that will produce the enormous jump in energy yield in comparison with anaerobic glycolysis. The idea is how much must have being spent in DNA sequences to build that molecule in order to use only two atoms of carbon. Very limited aspects of biology could be explained in this way. In case we follow an alternative way of thinking, it becomes clearer that proteins were made more stable by interaction with other molecules (great and small). Afterwards, it rather easy to understand how the stability of protein-RNA complexes where transmitted to RNA (vibrational +solvational reactivity stability pair of conformational energy). Latter, millions of years, or as soon as, the information of interaction leading to activity and regulation could be found in RNA, proteins like reverse transcriptase move this information to a more stable form (DNA). In this way it is easier to understand the use of CoA to make two carbon molecules more reactive.
Yours,
JES Roselino
Like this:
Like Loading...
Read Full Post »


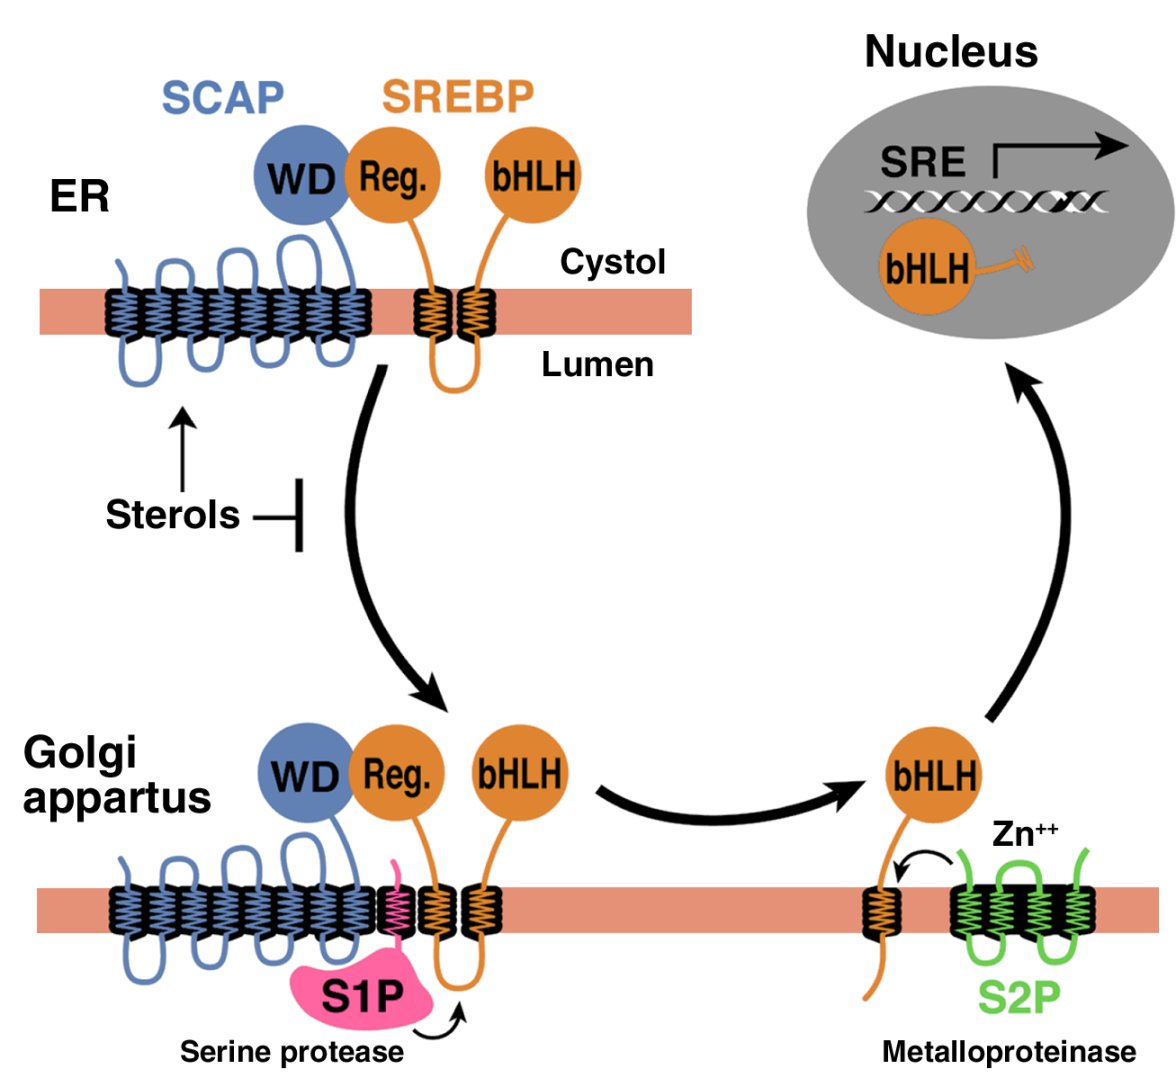
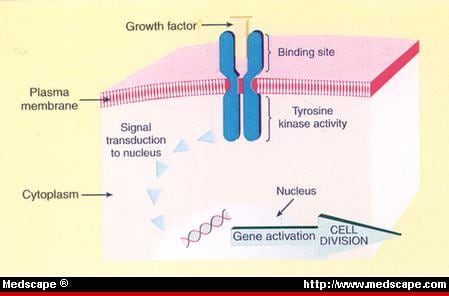