Feeds:
Posts
Comments

Archive for the ‘Discovery process’ Category

Hematological Cancer Classification

Author and Curator: Larry H. Bernstein, MD, FCAP


Introduction to leukemias and lymphomas


2.4.1 Ontogenesis of the blood elements: hematopoiesis

http://www.britannica.com/EBchecked/topic/69747/blood-cell-formation

Blood cells are divided into three groups: the red blood cells (erythrocytes), the white blood cells (leukocytes), and the blood platelets (thrombocytes). The white blood cells are subdivided into three broad groups: granulocytes, lymphocytes, and monocytes.

Blood cells do not originate in the bloodstream itself but in specific blood-forming organs, notably the marrow of certain bones. In the human adult, the bone marrow produces all of the red blood cells, 60–70 percent of the white cells (i.e., the granulocytes), and all of the platelets. The lymphatic tissues, particularly the thymus, the spleen, and the lymph nodes, produce the lymphocytes (comprising 20–30 percent of the white cells). The reticuloendothelial tissues of the spleen, liver, lymph nodes, and other organs produce the monocytes (4–8 percent of the white cells). The platelets, which are small cellular fragments rather than complete cells, are formed from bits of the cytoplasm of the giant cells (megakaryocytes) of the bone marrow.

In the human embryo, the first site of blood formation is the yolk sac. Later in embryonic life, the liver becomes the most important red blood cell-forming organ, but it is soon succeeded by the bone marrow, which in adult life is the only source of both red blood cells and the granulocytes. Both the red and white blood cells arise through a series of complex, gradual, and successive transformations from primitive stem cells, which have the ability to form any of the precursors of a blood cell. Precursor cells are stem cells that have developed to the stage where they are committed to forming a particular kind of new blood cell.

In a normal adult the red cells of about half a liter (almost one pint) of blood are produced by the bone marrow every week. Almost 1 percent of the body’s red cells are generated each day, and the balance between red cell production and the removal of aging red cells from the circulation is precisely maintained.

Cells-in-the-Bone-Marrow-1024x747

http://interactive-biology.com/wp-content/uploads/2012/07/Cells-in-the-Bone-Marrow-1024×747.png

Erythropoiesis

http://www.interactive-biology.com/3969/erythropoiesis-formation-of-red-blood-cells/

Erythropoiesis – Formation of Red Blood Cells

Because of the inability of erythrocytes (red blood cells) to divide to replenish their own numbers, the old ruptured cells must be replaced by totally new cells. They meet their demise because they don’t have the usual specialized intracellular machinery, which controls cell growth and repair, leading to a short life span of 120 days.

This short life span necessitates the process erythropoiesis, which is the formation of red blood cells. All blood cells are formed in the bone marrow. This is the erythrocyte factory, which is soft, highly cellar tissue that fills the internal cavities of bones.

Erythrocyte differentiation takes place in 8 stages. It is the pathway through which an erythrocyte matures from a hemocytoblast into a full-blown erythrocyte. The first seven all take place within the bone marrow. After stage 7 the cell is then released into the bloodstream as a reticulocyte, where it then matures 1-2 days later into an erythrocyte. The stages are as follows:

  1. Hemocytoblast, which is a pluripotent hematopoietic stem cell
  2. Common myeloid progenitor, a multipotent stem cell
  3. Unipotent stem cell
  4. Pronormoblast
  5. Basophilic normoblast also called an erythroblast.
  6. Polychromatophilic normoblast
  7. Orthochromatic normoblast
  8. Reticulocyte

These characteristics can be seen during the course of erythrocyte maturation:

  • The size of the cell decreases
  • The cytoplasm volume increases
  • Initially there is a nucleus and as the cell matures the size of the nucleus decreases until it vanishes with the condensation of the chromatin material.

Low oxygen tension stimulates the kidneys to secrete the hormone erythropoietin into the blood, and this hormone stimulates the bone marrow to produce erythrocytes.

Rarely, a malignancy or cancer of erythropoiesis occurs. It is referred to as erythroleukemia. This most likely arises from a common myeloid precursor, and it may occur associated with a myelodysplastic syndrome.

Summary of erythrocyte maturation

White blood cell series: myelopoiesis

http://www.nlm.nih.gov/medlineplus/ency/presentations/100151_3.htm

http://www.nlm.nih.gov/medlineplus/ency/images/ency/fullsize/15220.jpg

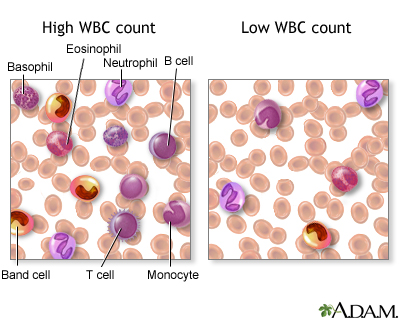
There are various types of white blood cells (WBCs) that normally appear in the blood: neutrophils (polymorphonuclear leukocytes; PMNs), band cells (slightly immature neutrophils), T-type lymphocytes (T cells), B-type lymphocytes (B cells), monocytes, eosinophils, and basophils. T and B-type lymphocytes are indistinguishable from each other in a normal slide preparation. Any infection or acute stress will result in an increased production of WBCs. This usually entails increased numbers of cells and an increase in the percentage of immature cells (mainly band cells) in the blood. This change is referred to as a “shift to the left” People who have had a splenectomy have a persistent mild elevation of WBCs. Drugs that may increase WBC counts include epinephrine, allopurinol, aspirin, chloroform, heparin, quinine, corticosteroids, and triamterene. Drugs that may decrease WBC counts include antibiotics, anticonvulsants, antihistamine, antithyroid drugs, arsenicals, barbiturates, chemotherapeutic agents, diuretics and sulfonamides.   (Updated by: David C. Dugdale, III, MD)

https://www.med-ed.virginia.edu/courses/path/innes/nh/wcbmaturation.cfm

Note that the mature forms of the myeloid series (neutrophils, eosinophils, basophils), all have lobed (segmented) nuclei. The degree of lobation increases as the cells mature.

The earliest recognizable myeloid cell is the myeloblast (10-20m dia) with a large round to oval nucleus. There is fine diffuse immature chromatin (without clumping) and a prominant nucleolus.

The cytoplasm is basophilic without granules. Although one may see a small golgi area adjacent to the nucleus, granules are not usually visible by light microscopy. One should not see blast cells in the peripheral blood.

myeloblast x100b

https://www.med-ed.virginia.edu/courses/path/innes/images/nhjpeg/nh%20myeloblast%20x100b.jpeg

The promyelocyte (10-20m) is slightly larger than a blast. Its nucleus, although similar to a myeloblast shows slight chromatin condensation and less prominent nucleoli. The cytoplasm contains striking azurophilic granules or primary granules. These granules contain myeloperoxidase, acid phosphatase, and esterase enzymes. Normally no promyelocytes are seen in the peripheral blood.

At the point in development when secondary granules can be recognized, the cell becomes a myelocyte.

promyelocyte x100

https://www.med-ed.virginia.edu/courses/path/innes/images/nhjpeg/nh%20promyelocyte%20×100%20a.jpeg

Myelocytes (10-18m) are not normally found in the peripheral blood. Nucleoli may not be seen in the late myelocyte. Primary azurophilic granules are still present, but secondary granules predominate. Secondary granules (neut, eos, or baso) first appear adjacent to the nucleus. In neutrophils this is the “dawn” of neutrophilia.

Metamyelocytes (10-18m) have kidney shaped indented nuclei and dense chromatin along the nuclear membrane. The cytoplasm is faintly pink, and they have secondary granules (neutro, eos, or baso). Zero to one percent of the peripheral blood white cells may be metamyelocytes (juveniles).

metamyelocyte x100

https://www.med-ed.virginia.edu/courses/path/innes/images/nhjpeg/nh%20metamyelocyte%20×100.jpeg

Bands, slightly smaller than juveniles, are marked by a U-shaped or deeply indented nucleus.

band neutrophilx100a

https://www.med-ed.virginia.edu/courses/path/innes/images/nhjpeg/nh%20band%20x100a.jpeg

Segmented (segs) or polymorphonuclear (PMN) leukocytes (average 14 m dia) are distinguished by definite lobation with thin thread-like filaments of chromatin joining the 2-5 lobes. 45-75% of the peripheral blood white cells are segmented neutrophils.

https://www.med-ed.virginia.edu/courses/path/innes/images/nhjpeg/nh%20neutrophil%20×100%20d.jpeg

Thrombocytogenesis

The incredible journey: From megakaryocyte development to platelet formation

Kellie R. Machlus1,2 and Joseph E. Italiano Jr
JCB 2013; 201(6): 785-796
http://dx.doi.org:/10.1083/jcb.201304054

Large progenitor cells in the bone marrow called megakaryocytes (MKs) are the source of platelets. MKs release platelets through a series of fascinating cell biological events. During maturation, they become polyploid and accumulate massive amounts of protein and membrane. Then, in a cytoskeletal-driven process, they extend long branching processes, designated proplatelets, into sinusoidal blood vessels where they undergo fission to release platelets.

megakaryocyte production of platelets

http://dm5migu4zj3pb.cloudfront.net/manuscripts/26000/26891/medium/JCI0526891.f4.jpg

platelets and the immune continuum nri2956-f3

http://www.nature.com/nri/journal/v11/n4/images/nri2956-f3.jpg

2.4.2 Classification of hematological malignancies
Practical Diagnosis of Hematologic Disoreders. 4th edition. Vol 2.
Kjeldsberg CR, Ed.  ASCP Press.  2006. Chicago, IL.

2.4.2.1 Primary Classification

Acute leukemias

Myelodysplastic syndromes

Acute myeloid leukemia

Acute lymphoblastic leukemia

Myeloproliferative Disorders

Chronic myeloproliferative disorders

Chronic myelogenous leukemia and related disorders

Myelofibrosis, including chronic idiopathic

Polycythemia, including polycythemia rubra vera

Thrombocytosis, including essential thrombocythemia

Chronic lymphoid leukemia and other lymphoid leukemias

Lymphomas

Non-Hodgkin Lymphoma

Hodgkin lymphoma

Lymphoproliferative disorders associated with immunodeficiency

Plasma Cell dyscrasias

Mast cell disease and Histiocytic neoplasms

2.4.2.2 Secondary Classification

2.4.2.3 Nuance – PathologyOutlines
Nat Pernick, Ed.

Leukemia – Acute

Primary references acute leukemia-general AML general AML classification transient abnormal myelopoiesis

Recurrent genetic abnormalities: AML with t(6;9) AML with t(8;21) AML with 11q23 abnormalities AML with inv(16) or t(16;16) AML with Down syndrome AML with FLT3 mutations AML with myelodysplastic related changes AML therapy related APL microgranular variant APL with t(15;17) APL with t(V;17) APL therapy related

AML not otherwise categorized: minimally differentiated (M0) without maturation (M1) with maturation (M2) M3 myelomonocytic monoblastic and monocytic erythroid megakaryoblastic CD13/CD33 negative basophilic myeloid sarcoma acute panmyelosis with myelofibrosis with Philadelphia chromosome with pseudo Chediak-Higashi anomaly hypocellular

ALL: general WHO classification with eosinophilia

PreB ALL: general t(9;22) t(v;11q23) t(1;19) t(5;14) t(12;21) hyperdiploidy hypodiploidy mature B ALL/Burkitt

Other ALL: T ALL ambiguous lineage mixed phenotype

AML and related malignancies

Acute myeloid leukemias with recurrent genetic abnormalities:

  • AML with t(8;21)(q22;q22); RUNX1-RUNX1T1
  • AML with inv(16)(p13.1;q22) or t(16;16)(p13.1;q22); CBF&beta-MYH11
  • Acute promyelocytic leukemia with t(15;17)(q22;q12); PML/RAR&alpha and variants
  • AML with t(9;11)(p22;q23); MLLT3-MLL
  • AML with t(6;9)(p23;q34); DEK-NUP214
  • AML with inv(3)(q21q26.2) or t(3;3)(q21;q26.2); RPN1-EVI1
  • AML (megakaryoblastic) with t(1;22)(p13;q13); RBM15-MKL1
  • AML with mutated NPM1*
  • AML with mutated CEBPA*

* provisional

Acute myeloid leukemia with myelodysplasia related changes

Therapy related acute myeloid leukemia

  • Alkylating agent related
  • Topoisomerase II inhibitor related (some maybe lymphoid)

Acute myeloid leukemia not otherwise categorized:

  • AML minimally differentiated (M0)
  • AML without maturation (M1)
  • AML with maturation (M2)
  • Acute myelomonocytic leukemia (M4)
  • Acute monoblastic and monocytic leukemia (M5a, M5b)
  • Acute erythroid leukemia (M6)
  • Acute megakaryoblastic leukemia (M7)
  • Acute basophilic leukemia
  • Acute panmyelosis with myelofibrosis

Myeloid Sarcoma

Myeloid proliferations related to Down syndrome:

  • Transient abnormal myelopoeisis
  • Myeloid leukemia associated with Down syndrome

Blastic plasmacytoid dentritic cell neoplasm:

Acute leukemia of ambiguous lineage:

  • Acute undifferentiated leukemia
  • Mixed phenotype acute leukemia with t(9;22)(q34;q11.2); BCR-ABL1
  • Mixed phenotype acute leukemia with t(v;11q23); MLL rearranged
  • Mixed phenotype acute leukemia, B/myeloid, NOS
  • Mixed phenotype acute leukemia, T/myeloid, NOS
  • Mixed phenotype acute leukemia, NOS, rare types
  • Other acute leukemia of ambiguous lineage
  • References: WHO Classification of Tumours of Haematopoietic and Lymphoid Tissue (IARC, 2008), Discovery Medicine 2010, eMedicine

Acute lymphocytic leukemia

General
=================================================================

  • WHO classification system includes former FAB classifications ALL-L1 and L2
    ● FAB L3 is now considered Burkitt lymphoma

WHO classification of acute lymphoblastic leukemia
=================================================================

Precursor B lymphoblastic leukemia / lymphoblastic lymphoma:
● ALL with t(9;22)(q34;q11.2); BCR-ABL (Philadelphia chromosome)
● ALL with t(v;11q23) (MLL rearranged)
● ALL with t(1;19)(q23;p13.3); TCF3-PBX1 (E2A-PBX1)
● ALL with t(12;21)(p13;q22); ETV6-RUNX1 (TEL-AML1)
● Hyperdiploid > 50
● Hypodiploid
● t(5;14)(q31;q32); IL3-IGH

Precursor T lymphoblastic leukemia / lymphoma

Additional references
=================================================================

Mixed phenotype acute leukemia (MPAL)

General
=================================================================

  • De novo acute leukemia containing separate populations of blasts of more than one lineage (bilineal or bilineage), or a single population of blasts co-expressing antigens of more than one lineage (biphenotypic)Excludes:
    ● Acute myeloid leukemia (AML) with recurrent translocations t(8;21), t(15;17) or inv(16)
    ● Leukemias with FGFR1 mutations
    ● Chronic myelogenous leukemia (CML) in blast crisis
    ● Myelodysplastic syndrome (MDS)-related AML and therapy-related AML, even if they have MPAL immunophenotypeCriteria for biphenotypic leukemia:
    ● Score of 2 or more for each of two separate lineages:The European Group for the Immunological Classification of Leukemias (EGIL) scoring system2008 WHO classification of acute leukemias of ambiguous lineage 

Prognosis
=================================================================

  • Poor, overall survival of 18 months
    ● Young age, normal karyotype and ALL induction therapy are associated with favorable survival
    ● Ph+ is a predictor for poor prognosis
    ● Bone marrow transplantation should be considered in first remission

Major Categories

MPAL with t(9;22)(q34;q11.2); BCR-ABL1
=================================================================

  • 20% of all MPAL
    ● Blasts with t(9;22)(q34;q11.2) translocation or BCR-ABL1 rearrangement (Ph+) without history of CML
    ● Majority in adults
    ● High WBC counts● Most of the cases B/myeloid phenotype
    ● Rare T/myeloid, B and T lineage, or trilineage leukemiasMorphology:
    ● Many cases show a dimorphic blast population, one resembling myeloblasts and the other lymphoblastsCytogenetic abnormalities:
    ● Conventional karyotyping for t(9;22), FISH or PCR for BCR-ABL1 translocation
    ● Additional complex karyotypes
    ● Ph+ is a poor prognostic factor for MPAL, with a reported median survival of 8 months
    ● Worse than patients of all other types of MPAL

MPAL with t(v;11q23); MLL rearranged
=================================================================

  • Meeting the diagnostic criteria for MPAL with blasts bearing a translocation involving the 11q23 breakpoint (MLL gene)
    ● MPAL with MLL rearranged rare
    ● More often seen in children and relatively common in infancy
    ● High WBC counts
    ● Poor prognosis
    ● Dimorphic blast population, with one resembling monoblasts and the other resembling lymphoblasts
    ● Lymphoblast population often shows a CD19+, CD10- B precursor immunophenotype, frequently CD15+
    ● Expression of other B markers usually weak
    ● Translocations involving MLL gene include t(4;11)(q21;q23), t(11;19)(q23;p13), and t(9;11)(p22;q23)
    ● Cases with chromosome 11q23 deletion should not be classified in this category

B cell acute lymphoblastic leukemia (ALL) / lymphoblastic lymphoma (LBL)

General

=================================================================

  • Current 2008 WHO classification: B lymphoblastic leukemia / lymphoma, NOS or B lymphoblastic leukemia / lymphoma with recurrent genetic abnormalities
  • See also lymphomas: B cell chapter
  • Also called B cell acute lymphoblastic leukemia / lymphoblastic lymphoma, pre B ALL / LBL
  • Usually children
  • B acute lymphoblastic leukemia presents with pancytopenia due to extensive marrow involvement, stormy onset of symptoms, bone pain due to marrow expansion, hepatosplenomegaly due to neoplastic infiltration, CNS symptoms due to meningeal spread and testicular involvement
  • B acute lymphoblastic lymphoma often presents with cutaneous nodules, bone or nodal involvement, < 25% lymphoblasts in bone marrow and peripheral blood; aleukemic cases are usually asymptomatic
  • Depending on specific leukemia, arises in either hematopoietic stem cell or B-cell progenitor
  • Tumors are derived from pre-germinal center naive B cells with unmutated VH region genes
  • Have multiple immunophenotyping aberrancies relative to normal B cell precursors (hematogones); at relapse, 73% show loss of 1+ aberrance and 60% show new aberrancies (Am J Clin Pathol 2007;127:39)

Prognostic features

=================================================================

  • Favorable prognosis: age 1-10 years, female, white; preB phenotype, hyperdiploidy>50, t(12,21), WBC count at presentation <50×108/L, non-traumatic tap with no blasts in CNS, rapid response to chemotherapy < 5% blasts on morphology on day 15, remission status after induction <5% blasts on morphology and <0.01% blast on flow or PCR, CD10+
  • Intermediate prognosis: hyperdiploidy 47-50, diploid, 6q- and rearrangements of 8q24
  • Unfavorable prognosis: under age 1 (usually have 11q23 translocations) or over age 10; t(9;22) (but not if age 59+ years, Am J Clin Pathol 2002;117:716); male, > 50×108/L WBC at presentation, hypodiploidy, near tetraploidy, 17p- and MLL rearrangements t(v;11q23); CD10-; non-traumatic tap with > 5% blasts or traumatic tap (7%); also increased microvessel staining using CD105 in children (Leuk Res 2007;31:1741), MDR1 expression in children (Oncol Rep 2004;12:1201) and adults (Blood 2002;100:974), 25%+ blasts on morphology on day 15, remission status after induction ≥ 5% blasts on morphology and ≥ 0.1% blasts on flow or PCR

Case reports

=================================================================

  • 12 month old girl and 13 month old boy with mature phenotype but no translocations (Arch Pathol Lab Med 2003;127:1340)
  • 56 year old man with ALL arising from follicular lymphoma (Arch Pathol Lab Med 2002;126:997)
  • 76 year old man with basal cell carcinoma (Diagn Pathol 2007;2:32)
  • With hemophagocytic lymphohistiocytosis (Pediatr Blood Cancer 2008;50:381)

Treatment

================================================================

  • Chemotherapy cures more children than adults; adolescents benefit from intensive regimens (Hematology Am Soc Hematol Educ Program 2005:123)

Micro description

=================================================================

  • Bone marrow smears: small to intermediate blast-like cells with scant, variably basophilic cytoplasm, round / oval or convoluted nuclei, fine chromatin and indistinct nucleoli; frequent mitotic figures; may have “starry sky” appearance similar to Burkitt lymphoma; may have large lymphoblasts with 1-4 prominent nucleoli resembling myeloblasts; usually no sclerosis
  • Bone marrow biopsy: usually markedly hypercellular with reduction of trilinear maturation; cells have minimal cytoplasm, medium sized nuclei that are often convoluted, moderately dense chromatin and indistinct nucleoli, brisk mitotic activity
  • Other tissues: may have “starry sky” appearance similar to Burkitt lymphoma; collagen dissection, periadipocyte growth pattern and single cell linear filing

Chronic Leukemia

Chronic Myeloid Neoplasms

Myelodysplastic syndromes (MDS): general, WHO classification, childhood, refractory anemia, refractory anemia with ringed sideroblasts, refractory cytopenia with multilineage dysplasia, refractory anemia with excess blasts, 5q-syndrome, therapy related, unclassified, arsenic toxicity

Myeloproliferative neoplasms (MPN): general, WHO classification, chronic eosinophilic leukemia, chronic myelogenous leukemia, chronic neutrophilic leukemia, essential thrombocythemia, hypereosinophilic syndrome, mast cell disease, polycythemia vera, primary myelofibrosis, unclassifiable

MDS/MPN: general, WHO classification, atypical CML, chronic myelomonocytic leukemia (CMML), chronic myelomonocytic leukemia with eosinophilia, juvenile myelomonocytic leukemia, unclassifiable

Myeloid neoplasms associated with eosinophilia and abnormalities of PDGFRA, PDGFRB, or FGFR1: PDGFRA, PDGFRB, FGFR1

Miscellaneous: transient myeloproliferative disorder of Downís syndrome

Lymphoma and plasma cell neoplasms

Lymph nodes: normal development-general B cells T cells NK cells normal histology grossing lymph nodes features to report

Molecular testing: theory FISH northern blot PCR southern blot

Non-Hodgkin lymphoma: general cytogenetics staging staging-pediatric morphologic clues hemophagocytic syndrome chemotherapeutic atypia

B cell disorders: general post-rituximab bone marrow biopsy classification-historical WHO classification

B cell lymphoma subtypes: age-related EBV-associated ALK positive large cell Burkitt unclassifiable-intermediate between Burkitt and diffuse large B cell lymphoma CLL
diffuse large B cell: 
diffuse-NOS CD5+ T cell / histiocyte rich primary cutaneous-general primary cutaneous-leg primary sites-other
follicular: 
general childhood cutaneous GI
hairy cell leukemia HCL variant intravascular large B cell lymphomatoid granulomatosis lymphoplasmacytic mantle cell-classic mantle cell-blastoid marginal zone-general marginal zone-MALT MALT-primary sites marginal zone-nodal mediastinal (thymic) plasmablastic pre B lymphoblastic leukemia/lymphoma primary effusion prolymphocytic leukemia pyothorax associated SLL splenic marginal zone splenic lymphoma with villous lymphocytes

Plasma cell neoplasms: general myeloma plasmacytoma heavy chain disease primary amyloidosis MGUS Osteosclerotic myeloma (POEMS) cryoglobulinemia

T/NK cell disorders: general WHO classification adult T cell aggressive NK cell leukemia anaplastic large cell ALK+ ALK- angioimmunoblastic T cell blastic plasmacytoid chronic lymphoproliferative disorders of NK cells cutaneous CD4+ small/medium sized T cell lymphoma cutaneous CD30 positive T cell lymphoproliferative disorders cutaneous gamma delta T cell lymphoma enteropathy epidermotropic CD8+ T cell lymphoma hepatosplenic indolent T cell proliferations mycosis fungoides NK/T cell lymphoma-nasal type nodal CD8+ cytotoxic T cell nonB nonT lymphoblastic peripheral T cell lymphoma, NOS primary effusion lymphoma Sezary syndrome staging subcutaneous panniculitis-like T cell large granular lymphocytic leukemia T cell lymphoblastic leukemia/lymphoma T cell prolymphocytic leukemia

Hodgkin lymphoma: general/staging classic lymphocyte depleted lymphocyte rich classical mixed cellularity nodular lymphocyte predominant nodular sclerosis

Post-transplantation: general WHO classification plasmacytic hyperplasia/IM-like lesions polymorphic B cell lymphoproliferative disorders monomorphic B cell lymphoproliferative disorders other graft versus host disease

Other: AIDS associated-general AIDS associated-examples EBV+ T cell lymphoproliferative disorders of childhood primary immune disorders related

Myeloproliferative neoplasms (MPN)

WHO 2008 – Myeloproliferative neoplasms (MPN) 

General
=================================================================

  • Chronic myelogenous leukemia
    ● Polycythemia vera
    ● Essential thrombocythemia
    ● Primary myelofibrosis
    ● Chronic neutrophilic leukemia
    ● Chronic eosinophilic leukemia, not otherwise categorized
    ● Mast cell disease
    ● MPNs, unclassifiable

WHO 2001 – Chronic myeloproliferative diseases 

Definition
=================================================================

  • Chronic myelogenous leukemia (Philadelphia chromosome, t(9;22)(q34;q11), BCR-ABL positive)
    ● Chronic neutrophilic leukemia
    ● Chronic eosinophilic leukemia (and the hypereosinophilic syndrome)
    ● Polycythemia vera
    ● Chronic idiopathic myelofibrosis (with extramedullary hematopoiesis)
    ● Essential thrombocythemia
    ● Chronic myeloproliferative disease, unclassifiable

Additional references
=================================================================

The World Health Organization (WHO) classification of the myeloid neoplasms  James W. Vardiman, Nancy Lee Harris, and Richard D. Brunning
Blood 2002; 100(7)  http://dx.doi.org/10.1182/blood-2002-04-1199

Lymphoma – Non B cell neoplasms

T/NK cell disorders/WHO classification (2008)

Principles of classification
=================================================================

  • Based on all available information (morphology, immunophenotype, genetics, clinical)
    ● No one antigenic marker is specific for any neoplasm (except ALK1)
    ● Immune profiling less helpful in subclassification of T cell lymphomas then B cell lymphomas
    ● Certain antigens commonly associated with specific disease entities but not entirely disease specific
    ● CD30: common in anaplastic large cell lymphoma but also classic Hodgkin lymphoma and other B and T cell lymphomas
    ● CD56: characteristic for nasal NK/T cell lymphoma, but also other T cell neoplasms and plasma cell disorders
    ● Variation of immunophenotype within a given disease (hepatosplenic T cell lymphoma: usually γδ but some are αβ)
    ● Recurrent genetic alterations have been identified for many B cell lymphomas but not for most T cell lymphomas
    ● No attempt to stratify lymphoid malignancies by grade
    ● Recognize the existence of grey zone lymphomas
    ● This multiparameter approach has been validated in international studies as highly reproducible

WHO 2008 classification of tumors of hematopoietic and lymphoid tissues (T/NK)
=================================================================

Precursor T-lymphoid neoplasms
● T lymphoblastic leukemia/lymphoma, 9837/3

Mature T cell and NK cell neoplasms
● T cell prolymphocytic leukemia, 9834/3
● T cell large granular lymphocytic leukemia, 9831/3
● Chronic lymphoproliferative disorder of NK cells, 9831/3
● Aggressive NK cell leukemia, 9948/3
● Systemic EBV-positive T cell lymphoproliferative disease of childhood, 9724/3
● Hydroa vacciniforme-like lymphoma, 9725/3
● Adult T cell leukemia/lymphoma, 9827/3
● Extranodal NK/T cell lymphoma, nasal type, 9719/3
● Enteropathy-associated T cell lymphoma, 9717/3
● Hepatosplenic T cell lymphoma, 9716/3
● Subcutaneous panniculitis-like T cell lymphoma, 9708/3
● Mycosis fungoides, 9700/3
● Sézary syndrome, 9701/3
● Primary cutaneous CD30-positive T cell lymphoproliferative disorders
● Lymphomatoid papulosis, 9718/1
● Primary cutaneous anaplastic large cell lymphoma, 9718/3
● Primary cutaneous gamma-delta T cell lymphoma, 9726/3
● Primary cutaneous CD8-positive aggressive epidermotropic cytotoxic T cell lymphoma, 9709/3
● Primary cutaneous CD4-positive small/medium T cell lymphoma, 9709/3
● Peripheral T cell lymphoma, NOS, 9702/3
● Angioimmunoblastic T cell lymphoma, 9705/3
● Anaplastic large cell lymphoma, ALK-positive, 9714/3
● Anaplastic large cell lymphoma, ALK-negative, 9702/3

Chronic Lymphocytic Leukemia

Chronic Lymphocytic Leukemia Staging
Author: Sandy D Kotiah, MD; Chief Editor: Jules E Harris, MD
Medscape Sep 6, 2013
http://emedicine.medscape.com/article/2006578-overview

General considerations in the staging of chronic lymphocytic leukemia (CLL) and the revised Rai (United States) and Binet (Europe) staging systems for CLL are provided below.[1, 2, 3]

See Chronic Leukemias: 4 Cancers to Differentiate, a Critical Images slideshow, to help detect chronic leukemias and determine the specific type present.

General considerations

  • CLL and small lymphocytic lymphoma (SLL) are different manifestations of the same disease; SLL is diagnosed when the disease is mainly nodal, and CLL is diagnosed when the disease is seen in the blood and bone marrow
  • CLL is diagnosed by > 5000 monoclonal lymphocytes/mm3 for longer than 3mo; the bone marrow usually has more than 30% monoclonal lymphocytes and is either normocellular or hypercellular
  • Monoclonal B lymphocytosis is a precursor form of CLL that is defined by a monoclonal B cell lymphocytosis < 5000 monoclonal lymphocytes/mm3; all lymph nodes smaller than 1.5 cm; no anemia; and no thrombocytopenia

Revised Rai staging system (United States)

Low risk (formerly stage 0)[1] :

  • Lymphocytosis, lymphocytes in blood > 15000/mcL, and > 40% lymphocytes in the bone marrow

Intermediate risk (formerly stages I and II):

  • Lymphocytosis as in low risk with enlarged node(s) in any site, or splenomegaly or hepatomegaly or both

High risk (formerly stages III and IV):

  • Lymphocytosis as in low risk and intermediate risk with disease-related anemia (hemoglobin level < 11.0 g/dL or hematocrit < 33%) or platelets < 100,000/mcL

Binet staging system (Europe)

Stage A:

  • Hemoglobin ≥ 10 g/dL, platelets ≥ 100,000/mm3, and < 3 enlarged areas

Stage B:

  • Hemoglobin ≥ 10 g/dL, platelets ≥ 100,000/mm3, and ≥ 3 enlarged areas

Stage C:

  • Hemoglobin < 10 g/dL, platelets < 100,000/mm3, and any number of enlarged areas

Read Full Post »

Therapeutic Implications for Targeted Therapy from the Resurgence of Warburg ‘Hypothesis’

Writer and Curator: Larry H. Bernstein, MD, FCAP 

(Note that each portion of the discussion is followed by a reference)

It is now a time to pause after almost a century of a biological scientific discoveries that have transformed the practice of medicine and impacted the lives of several generations of young minds determined to probe the limits of our knowledge.  In the century that we have entered into the scientific framework of medicine has brought together a difficult to grasp evolution of the emergence of human existence from wars, famine, droughts, storms, infectious diseases, and insect born pestilence with betterment of human lives, only unevenly divided among societal classes that have existed since time immemorial. In this short time span there have emerged several generations of physicians who have benefited from a far better medical education that their forebears could have known. In this expansive volume on cancer, we follow an incomplete and continuing challenge to understand cancer, a disease that has become associated with longer life spans in developed nations.

While there are significant improvements in the diagnosis and treatment of cancers, there is still a personal as well as locality factor in the occurrence of this group of diseases, which has been viewed incorrectly as a “dedifferentiation” of mature tissue types and the emergence of a cell phenotype that is dependent on glucose, reverts to a cancer “stem cell type” (loss of stemness), loses cell to cell adhesion, loses orderly maturation, and metastasizes to distant sites. At the same time, physician and nurses are stressed in the care of patients by balancing their daily lives and maintaining a perspective.

The conceptual challenge of cancer diagnosis and management has seemed insurmountable, but owes much to the post World War I activities of Otto Heinrich Warburg. It was Warburg who made the observation that cancer cells metabolize glucose by fermentation in much the way Pasteur 60 years earlier observed fermentation of yeast cells. This metabolic phenomenon occurs even in the presence of an oxygen supply, which would provide a huge deficit in ATP production compared with respiration. The cancer cell is “addicted to glucose” and produced lactic acid. Warburg was awarded the Nobel Prize in Medicine for this work in 1931.

In the last 15 years there has been a resurgence of work on the Warburg effect that sheds much new light on the process that was not previously possible, with significant therapeutic implications.  In the first place, the metabolic mechanism for the Warburg effect was incomplete even at the beginning of the 21st century.  This has been partly rectified with the enlightening elucidation of genome modifications, cellular metabolic regulation, and signaling pathways.

The following developments have become central to furthering our understanding of malignant transformation.

  1. There is usually an identifiable risk factor, such as, H. pylori, or of a chronic inflammatory state, as in the case of Barrett’s esophagus.
  2. There are certain changes in glucose metabolism that have been unquestionably been found in the evolution of this disease. The changes are associated with major changes in metabolic pathways, miRN signaling, and the metabolism geared to synthesis of cells with an impairment of the cell death cycle. In these changes, mitochondrial function is central to both the impaired respiration and the autophagy geared to the synthesis of cancer cells.

The emergence of this cell prototype is characterized by the following, again related to the Warburg effect:

  1. Cancer cells oxidize a decreased fraction of the pyruvate generated from glycolysis
  2. The mitochondrial pyruvate carrier (MPC), composed of the products of the MPC1 and MPC2 genes, modulates fractional pyruvate oxidation. MPC1 is deleted or underexpressed in multiple cancers and correlates with poor prognosis.
  3. Cancer cells tend to express a partially inhibited splice variant of pyruvate kinase (PK-M2), leading to decreased pyruvate production.
  4. The two proteins that mediate pyruvate conversion to lactate and its export, M-type lactate dehydrogenase and the monocarboxylate transporter MCT-4, are commonly upregulated in cancer cells leading to decreased pyruvate oxidation.
  5. The enzymatic step following mitochondrial entry is the conversion of pyruvate to acetyl-CoA by the pyruvate dehydrogenase (PDH) complex. Cancer cells frequently exhibit increased expression of the PDH kinase PDK1, which phosphorylates and inactivates PDH. This PDH regulatory mechanism is required for oncogene induced transformation and reversed in oncogene-induced senescence.
  6. The PDK inhibitor dichloroacetate has shown some clinical efficacy, which correlates with increased pyruvate oxidation. One of the simplest mechanisms to explain decreased mitochondrial pyruvate oxidation in cancer cells, a loss of mitochondrial pyruvate import, has been observed repeatedly over the past 40 years. This process has been impossible to study at a molecular level until recently, however, as the identities of the protein(s) that mediate mitochondrial pyruvate uptake were unknown.
  7. The mitochondrial pyruvate carrier (MPC) as a multimeric complex that is necessary for efficient mitochondrial pyruvate uptake. The MPC contains two distinct proteins, MPC1 and MPC2; the absence of either leads to a loss of mitochondrial pyruvate uptake and utilization in yeast, flies, and mammalian cells.

A Role for the Mitochondrial Pyruvate Carrier as a Repressor of the Warburg Effect and Colon Cancer Cell Growth

John C. Schell, Kristofor A. Olson, Lei Jiang, Amy J. Hawkins, et al.
Molecular Cell Nov 6, 2014; 56: 400–413.
http://dx.doi.org/10.1016/j.molcel.2014.09.026

In addition to the above, the following study has therapeutic importance:

Glycolysis has become a target of anticancer strategies. Glucose deprivation is sufficient to induce growth inhibition and cell death in cancer cells. The increased glucose transport in cancer cells has been attributed primarily to the upregulation of glucose transporter 1 (Glut1),  1 of the more than 10 glucose transporters that are responsible for basal glucose transport in almost all cell types. Glut1 has not been targeted until very recently due to the lack of potent and selective inhibitors.

First, Glut1 antibodies were shown to inhibit cancer cell growth. Other Glut1 inhibitors and glucose transport inhibitors, such as fasentin and phloretin, were also shown to be effective in reducing cancer cell growth. A group of inhibitors of glucose transporters has been recently identified with IC50 values lower than 20mmol/L for inhibiting cancer cell growth. However, no animal or detailed mechanism studies have been reported with these inhibitors.

Recently, a small molecule named STF-31 was identified that selectively targets the von Hippel-Lindau (VHL) deficient kidney cancer cells. STF-31 inhibits VHL deficient cancer cells by inhibiting Glut1. It was further shown that daily intraperitoneal injection of a soluble analogue of STF-31 effectively reduced the growth of tumors of VHL-deficient cancer cells grafted on nude mice. On the other hand, STF-31 appears to be an inhibitor with a narrow cell target spectrum.

These investigators recently reported the identification of a group of novel small compounds that inhibit basal glucose transport and reduce cancer cell growth by a glucose deprivation–like mechanism. These compounds target Glut1 and are efficacious in vivo as anticancer agents. A novel representative compound WZB117 not only inhibited cell growth in cancer cell lines but also inhibited cancer growth in a nude mouse model. Daily intraperitoneal injection of WZB117 resulted in a more than 70% reduction in the size of human lung cancer of A549 cell origin. Mechanism studies showed that WZB117 inhibited glucose transport in human red blood cells (RBC), which express Glut1 as their sole glucose transporter. Cancer cell treatment with WZB117 led to decreases in levels of Glut1 protein, intracellular ATP, and glycolytic enzymes. All these changes were followed by increase in ATP sensing enzyme AMP-activated protein kinase (AMPK) and declines in cyclin E2 as well as phosphorylated retinoblastoma, resulting in cell-cycle arrest, senescence, and necrosis. Addition of extracellular ATP rescued compound-treated cancer cells, suggesting that the reduction of intracellular ATP plays an important role in the anticancer mechanism of the molecule.

A Small-Molecule Inhibitor of Glucose Transporter 1 Downregulates Glycolysis, Induces Cell-Cycle Arrest, and Inhibits Cancer Cell Growth In Vitro and In Vivo

Yi Liu, Yanyan Cao, Weihe Zhang, Stephen Bergmeier, et al.
Mol Cancer Ther Aug 2012; 11(8): 1672–82
http://dx.doi.org://10.1158/1535-7163.MCT-12-0131

Alterations in cellular metabolism are among the most consistent hallmarks of cancer. These investigators have studied the relationship between increased aerobic lactate production and mitochondrial physiology in tumor cells. To diminish the ability of malignant cells to metabolize pyruvate to lactate, M-type lactate dehydrogenase levels were knocked down by means of LDH-A short hairpin RNAs. Reduction in LDH-A activity resulted in stimulation of mitochondrial respiration and decrease of mitochondrial membrane potential. It also compromised the ability of these tumor cells to proliferate under hypoxia. The tumorigenicity of the LDH-A-deficient cells was severely diminished, and this phenotype was reversed by complementation with the human ortholog LDH-A protein. These results demonstrate that LDH-A plays a key role in tumor maintenance.

The results are consistent with a functional connection between alterations in glucose metabolism and mitochondrial physiology in cancer. The data also reflect that the dependency of tumor cells on glucose metabolism is a liability for these cells under limited-oxygen conditions. Interfering with LDH-A activity as a means of blocking pyruvate to lactate conversion could be exploited therapeutically. Because individuals with complete deficiency of LDH-A do not show any symptoms under ordinary circumstances, the genetic data suggest that inhibition of LDH-A activity may represent a relatively nontoxic approach to interfere with tumor growth.

Attenuation of LDH-A expression uncovers a link between glycolysis, mitochondrial physiology, and tumor maintenance

Valeria R. Fantin Julie St-Pierre and Philip Leder
Cancer Cell Jun 2006; 9: 425–434.
http://dx.doi.org:/10.1016/j.ccr.2006.04.02

The widespread clinical use of positron-emission tomography (PET) for the detection of aerobic glycolysis in tumors and recent findings have rekindled interest in Warburg’s theory. Studies on the physiological changes in malignant conversion provided a metabolic signature for the different stages of tumorigenesis; during tumorigenesis, an increase in glucose uptake and lactate production have been detected. The fully transformed state is most dependent on aerobic glycolysis and least dependent on the mitochondrial machinery for ATP synthesis.

Tumors ferment glucose to lactate even in the presence of oxygen (aerobic glycolysis; Warburg effect). The pentose phosphate pathway (PPP) allows glucose conversion to ribose for nucleic acid synthesis and glucose degradation to lactate. The nonoxidative part of the PPP is controlled by transketolase enzyme reactions. We have detected upregulation of a mutated transketolase transcript (TKTL1) in human malignancies, whereas transketolase (TKT) and transketolase-like-2 (TKTL2) transcripts were not upregulated. Strong TKTL1 protein expression was correlated to invasive colon and urothelial tumors and to poor patients outcome. TKTL1 encodes a transketolase with unusual enzymatic properties, which are likely to be caused by the internal deletion of conserved residues. We propose that TKTL1 upregulation in tumors leads to enhanced, oxygen-independent glucose usage and a lactate based matrix degradation. As inhibition of transketolase enzyme reactions suppresses tumor growth and metastasis, TKTL1 could be the relevant target for novel anti-transketolase cancer therapies. We suggest an individualized cancer therapy based on the determination of metabolic changes in tumors that might enable the targeted inhibition of invasion and metastasis.

Other important links between cancer-causing genes and glucose metabolism have been already identified. Activation of the oncogenic kinase Akt has been shown to stimulate glucose uptake and metabolism in cancer cells and renders these cells susceptible to death in response to glucose withdrawal. Such tumor cells have been shown to be dependent on glucose because the ability to induce fatty acid oxidation in response to glucose deprivation is impaired by activated Akt. In addition, AMP-activated protein kinase (AMPK) has been identified as a link between glucose metabolism and the cell cycle, thereby implicating p53 as an essential component of metabolic cell-cycle control.

Expression of transketolase TKTL1 predicts colon and urothelial cancer patient survival: Warburg effect reinterpreted

S Langbein, M Zerilli, A zur Hausen, W Staiger, et al.
British Journal of Cancer (2006) 94, 578–585.
http://dx.doi.org:/10.1038/sj.bjc.6602962

The unique metabolic profile of cancer (aerobic glycolysis) might confer apoptosis resistance and be therapeutically targeted. Compared to normal cells, several human cancers have high mitochondrial membrane potential (DJm) and low expression of the K+ channel Kv1.5, both contributing toapoptosis resistance. Dichloroacetate (DCA) inhibits mitochondrial pyruvate dehydrogenase kinase (PDK), shifts metabolism from glycolysis to glucose oxidation, decreases DJm, increases mitochondrial H2O2, and activates Kv channels in all cancer, but not normal, cells; DCA upregulates Kv1.5 by an NFAT1-dependent mechanism. DCA induces apoptosis, decreases proliferation, and inhibits tumor growth, without apparent toxicity. Molecular inhibition of PDK2 by siRNA mimics DCA. The mitochondria-NFAT-Kv axis and PDK are important therapeutic targets in cancer; the orally available DCA is a promising selective anticancer agent.

Cancer progression and its resistance to treatment depend, at least in part, on suppression of apoptosis. Although mitochondria are recognized as regulators of apoptosis, their importance as targets for cancer therapy has not been adequately explored or clinically exploited. In 1930, Warburg suggested that mitochondrial dysfunction in cancer results in a characteristic metabolic phenotype, that is, aerobic glycolysis (Warburg, 1930). Positron emission tomography (PET) imaging has now confirmed that most malignant tumors have increased glucose uptake and metabolism. This bioenergetic feature is a good marker of cancer but has not been therapeutically pursued..

The small molecule DCA is a metabolic modulator that has been used in humans for decades in the treatment of lactic acidosis and inherited mitochondrial diseases. Without affecting normal cells, DCA reverses the metabolic electrical remodeling that we describe in several cancer lines (hyperpolarized mitochondria, activated NFAT1, downregulated Kv1.5), inducing apoptosis and decreasing tumor growth. DCA in the drinking water at clinically relevant doses for up to 3 months prevents and reverses tumor growth in vivo, without apparent toxicity and without affecting hemoglobin, transaminases, or creatinine levels. The ease of delivery, selectivity, and effectiveness  make DCA an attractive candidate for proapoptotic cancer therapy which can be rapidly translated into phase II–III clinical trials.

A Mitochondria-K+ Channel Axis Is Suppressed in Cancer and Its Normalization Promotes Apoptosis and Inhibits Cancer Growth

Sebastien Bonnet, Stephen L. Archer, Joan Allalunis-Turner, et al.

Cancer Cell Jan 2007; 11: 37–51.
http://dx.doi.org:/10.1016/j.ccr.2006.10.020

Tumor cells, just as other living cells, possess the potential for proliferation, differentiation, cell cycle arrest, and apoptosis. There is a specific metabolic phenotype associated with each of these conditions, characterized by the production of both energy and special substrates necessary for the cells to function in that particular state. Unlike that of normal living cells, the metabolic phenotype of tumor cells supports the proliferative state. Aim: To present the metabolic hypothesis that (1) cell transformation and tumor growth are associated with the activation of metabolic enzymes that increase glucose carbon utilization for nucleic acid synthesis, while enzymes of the lipid and amino acid synthesis pathways are activated in tumor growth inhibition, and (2) phosphorylation and allosteric and transcriptional regulation of intermediary metabolic enzymes and their substrate availability together mediate and sustain cell transformation from one condition to another. Conclusion: Evidence is presented that demonstrates opposite changes in metabolic phenotypes induced by TGF-β, a cell transforming agent, and tumor growth-inhibiting phytochemicals such as genistein and Avemar, or novel synthetic antileukemic drugs such as STI571 (Gleevec).  Intermediary metabolic enzymes that mediate the growth signaling pathways and promote malignant cell transformation may serve as high efficacy nongenetic novel targets for cancer therapies.

A Metabolic Hypothesis of Cell Growth and Death in Pancreatic Cancer

Laszlo G. Boros, Wai-Nang Paul Lee, and Vay Liang W. Go
Pancreas 2002; 24(1):26–33

Clear cell renal cell carcinoma (ccRCC) is the most common pathological subtype of kidney cancer. Here, we integrated an unbiased genome-wide RNA interference screen for ccRCC survival regulators with an analysis of recurrently overexpressed genes in ccRCC to identify new therapeutic targets in this disease. One of the most potent survival regulators, the monocarboxylate transporter MCT4 (SLC16A3), impaired ccRCC viability in all eight ccRCC lines tested and was the seventh most overexpressed gene in a meta-analysis of five ccRCC expression datasets.

MCT4 silencing impaired secretion of lactate generated through glycolysis and induced cell cycle arrest and apoptosis. Silencing MCT4 resulted in intracellular acidosis, and reduction in intracellular ATP production together with partial reversion of the Warburg effect in ccRCC cell lines. Intra-tumoral heterogeneity in the intensity of MCT4 protein expression was observed in primary ccRCCs.

MCT4 protein expression analysis based on the highest intensity of expression in primary ccRCCs was associated with poorer relapse-free survival, whereas modal intensity correlated with Fuhrman nuclear grade. Consistent with the potential selection of subclones enriched for MCT4 expression during disease progression, MCT4 expression was greater at sites of metastatic disease. These data suggest that MCT4 may serve as a novel metabolic target to reverse the Warburg effect and limit disease progression in ccRCC.

Clear cell carcinoma (ccRCC) is the commonest subtype of renal cell carcinoma, accounting for 80% of cases. These tumors are highly resistant to cytotoxic chemotherapy and until recently, systemic treatment options for advanced ccRCC were limited to cytokine based therapies, such as interleukin-2 and interferon-α. Recently, anti-angiogenic drugs and mTOR inhibitors, all targeting the HIF–VEGF axis which is activated in up to 91% of ccRCCs through loss of the VHL tumor suppressor gene [1], have been shown to be effective in metastatic ccRCC [2–5]. Although these drugs increase overall survival to more than 2 years [6], resistance invariably occurs, making the identification of new molecular targets a major clinical need to improve outcomes in patients with metastatic ccRCC.

Genome-wide RNA interference analysis of renal carcinoma survival regulators identifies MCT4 as a Warburg effect metabolic target

Marco Gerlinger, Claudio R Santos, Bradley Spencer-Dene, et al.
J Pathol 2012; 227: 146–156
http://dx.doi.org:/10.1002/path.4006

Hypoxia-inducible factor 1 (HIF-1) plays a key role in the reprogramming of cancer metabolism by activating transcription of genes encoding glucose transporters and glycolytic enzymes, which take up glucose and convert it to lactate; pyruvate dehydrogenase kinase 1, which shunts pyruvate away from the mitochondria; and BNIP3, which triggers selective mitochondrial autophagy. The shift from oxidative to glycolytic metabolism allows maintenance of redox homeostasis and cell survival under conditions of prolonged hypoxia. Many metabolic abnormalities in cancer cells increase HIF-1 activity. As a result, a feed-forward mechanism can be activated that drives HIF-1 activation and may promote tumor progression.

Metastatic cancer is characterized by reprogramming of cellular metabolism leading to increased uptake of glucose for use as both an anabolic and a catabolic substrate. Increased glucose uptake is such a reliable feature that it is utilized clinically to detect metastases by positron emission tomography using 18F-fluorodeoxyglucose (FDG-PET) with a sensitivity of >90% [1]. As with all aspects of cancer biology, the details of metabolic reprogramming differ widely among individual tumors. However, the role of specific signaling pathways and transcription factors in this process is now understood in considerable detail. This review will focus on the involvement of hypoxia-inducible factor 1 (HIF-1) in both mediating metabolic reprogramming and responding to metabolic alterations. The placement of HIF-1 both upstream and downstream of cancer metabolism results in a feed-forward mechanism that may play a major role in the development of the invasive, metastatic, and lethal cancer phenotype.

O2 concentrations are significantly reduced in many human cancers compared with the surrounding normal tissue. The median PO2 in breast cancers is 10 mmHg, as compared with65 mmHg in normal breast tissue. Reduced O2 availability induces HIF-1, which regulates the transcription of hundreds of genes that encode proteins involved in every aspect of cancer biology, including: cell immortalization and stem cell maintenance; genetic instability; glucose and energy metabolism; vascularization; autocrine growth factor signaling; invasion and metastasis; immune evasion; and resistance to chemotherapy and radiation therapy.

HIF-1 is a transcription factor that consists of an O2 regulated HIF-1a and a constitutively expressed HIF-1b subunit. In well-oxygenated cells, HIF-1a is hydroxylated on proline residue 402 (Pro-402) and/or Pro-564 by prolyl hydroxylase domain protein 2 (PHD2), which uses O2 and a-ketoglutarate as substrates in a reaction that generates CO2 and succinate as byproducts. Prolylhydroxylated HIF-1a is bound by the von Hippel–Lindau tumor suppressor protein (VHL), which recruits an E3-ubiquitin ligase that targets HIF-1a for proteasomal degradation (Figure 1a). Asparagine 803 in the transactivation domain is hydroxylated in well-oxygenated cells by factor inhibiting HIF-1 (FIH-1), which blocks the binding of the coactivators p300 and CBP. Under hypoxic conditions, the prolyl and asparaginyl hydroxylation reactions are inhibited by substrate (O2) deprivation and/or the mitochondrial generation of reactive oxygen species (ROS), which may oxidize Fe(II) present in the catalytic center of the hydroxylases.

The finding that acute changes in PO2 increase mitochondrial ROS production suggests that cellular respiration is optimized at physiological PO2 to limit ROS generation and that any deviation in PO2 – up or down – results in increased ROS generation. If hypoxia persists, induction of HIF-1 leads to adaptive mechanisms to reduce ROS and re-establish homeostasis, as described below. Prolyl and asparaginyl hydroxylation provide a molecular mechanism by which changes in cellular oxygenation can be transduced to the nucleus as changes in HIF-1 activity.

HIF-1: upstream and downstream of cancer metabolism

Gregg L Semenza
Current Opinion in Genetics & Development 2010, 20:51–56

This review comes from a themed issue on Genetic and cellular mechanisms of oncogenesis Edited by Tony Hunter and Richard Marais

http://dx.doi.org:/10.1016/j.gde.2009.10.009

Hypoxia-inducible factor 1 (HIF-1) regulates the transcription of many genes involved in key aspects of cancer biology, including immortalization, maintenance of stem cell pools, cellular dedifferentiation, genetic instability, vascularization, metabolic reprogramming, autocrine growth factor signaling, invasion/metastasis, and treatment failure. In animal models, HIF-1 overexpression is associated with increased tumor growth, vascularization, and metastasis, whereas HIF-1 loss-of-function has the opposite effect, thus validating HIF-1 as a target. In further support of this conclusion, immunohistochemical detection of HIF-1a overexpression in biopsy sections is a prognostic factor in many cancers. A growing number of novel anticancer agents have been shown to inhibit HIF-1 through a  variety of molecular mechanisms. Determining which combination of drugs to administer to any given patient remains a major obstacle to improving cancer treatment outcomes.

Intratumoral hypoxia The majority of locally advanced solid tumors contain regions of reduced oxygen availability. Intratumoral hypoxia results when cells are located too far from a functional blood vessel for diffusion of adequate amounts of O2 as a result of rapid cancer cell proliferation and the formation of blood vessels that are structurally and functionally abnormal. In the most extreme case, O2 concentrations are below those required for survival, resulting in cell death and establishing a selection for cancer cells in which apoptotic pathways are inactivated, anti-apoptotic pathways are activated, or invasion/metastasis pathways that promote escape from the hypoxic microenvironment are activated. This hypoxic adaptation may arise by alterations in gene expression or by mutations in the genome or both and is associated with reduced patient survival.

Hypoxia-inducible factor 1 (HIF-1) The expression of hundreds of genes is altered in each cell exposed to hypoxia. Many of these genes are regulated by HIF-1. HIF-1 is a heterodimer formed by the association of an O2-regulated HIF1a subunit with a constitutively expressed HIF-1b subunit. The structurally and functionally related HIF-2a protein also dimerizes with HIF-1b and regulates an overlapping battery of target genes. Under nonhypoxic conditions, HIF-1a (as well as HIF-2a) is subject to O2-dependent prolyl hydroxylation and this modification is required for binding of the von Hippel–Lindau tumor suppressor protein (VHL), which also binds to Elongin C and thereby recruits a ubiquitin ligase complex that targets HIF-1a for ubiquitination and proteasomal degradation. Under hypoxic conditions, the rate of hydroxylation and ubiquitination declines, resulting in accumulation of HIF-1a. Immunohistochemical analysis of tumor biopsies has revealed high levels of HIF-1a in hypoxic but viable tumor cells surrounding areas of necrosis.

Genetic alterations in cancer cells increase HIF-1 activity In the majority of clear-cell renal carcinomas, VHL function is lost, resulting in constitutive activation of HIF-1. After re-introduction of functional VHL, renal carcinoma cell lines are no longer tumorigenic, but can be made tumorigenic by expression of HIF2a in which the prolyl residues that are subject to hydroxylation have been mutated. In addition to VHL loss-of-function, many other genetic alterations that inactivate tumor suppressors

Evaluation of HIF-1 inhibitors as anticancer agents

Gregg L. Semenza
Drug Discovery Today Oct 2007; 12(19/20).
http://dx.doi.org:/10.1016/j.drudis.2007.08.006

Hypoxia-inducible factor-1 (HIF-1), which is present at high levels in human tumors, plays crucial roles in tumor promotion by upregulating its target genes, which are involved in anaerobic energy metabolism, angiogenesis, cell survival, cell invasion, and drug resistance. Therefore, it is apparent that the inhibition of HIF-1 activity may be a strategy for treating cancer. Recently, many efforts to develop new HIF-1-targeting agents have been made by both academic and pharmaceutical industry laboratories. The future success of these efforts will be a new class of HIF-1-targeting anticancer agents, which would improve the prognoses of many cancer patients. This review focuses on the potential of HIF-1 as a target molecule for anticancer therapy, and on possible strategies to inhibit HIF-1 activity. In addition, we introduce YC-1 as a new anti-HIF-1, anticancer agent. Although YC-1 was originally developed as a potential therapeutic agent for thrombosis and hypertension, recent studies demonstrated that YC-1 suppressed HIF-1 activity and vascular endothelial growth factor expression in cancer cells. Moreover, it halted tumor growth in immunodeficient mice without serious toxicity during the treatment period. Thus, we propose that YC-1 is a good lead compound for the development of new anti-HIF-1, anticancer agents.

Although many anticancer regimens have been introduced to date, their survival benefits are negligible, which is the reason that a more innovative treatment is required. Basically, the identification of the specific molecular features of tumor promotion has allowed for rational drug discovery in cancer treatment, and drugs have been screened based upon the modulation of specific molecular targets in tumor cells. Target-based drugs should satisfy the following two conditions.

First, they must act by a described mechanism.

Second, they must reduce tumor growth in vivo, associated with this mechanism.

Many key factors have been found to be involved in the multiple steps of cell growth signal-transduction pathways. Targeting these factors offers a strategy for preventing tumor growth; for example, competitors or antibodies blocking ligand–receptor interaction, and receptor tyrosine kinase inhibitors, downstream pathway inhibitors (i.e., RAS farnesyl transferase inhibitors, mitogen-activated protein kinase and mTOR inhibitors), and cell-cycle arresters (i.e., cyclin-dependent kinase inhibitors) could all be used to inhibit tumor growth.

In addition to the intracellular events, tumor environmental factors should be considered to treat solid tumors. Of these, hypoxia is an important cancer-aggravating factor because it contributes to the progression of a more malignant phenotype, and to the acquisition of resistance to radiotherapy and chemotherapy. Thus, transcription factors that regulate these hypoxic events are good targets for anticancer therapy and in particular HIF-1 is one of most compelling targets. In this paper, we introduce the roles of HIF-1 in tumor promotion and provide a summary of new anticancer strategies designed to inhibit HIF-1 activity.

New anticancer strategies targeting HIF-1

Eun-Jin Yeo, Yang-Sook Chun, Jong-Wan Park
Biochemical Pharmacology 68 (2004) 1061–1069
http://dx.doi.org:/10.1016/j.bcp.2004.02.040

Classical work in tumor cell metabolism focused on bioenergetics, particularly enhanced glycolysis and suppressed oxidative phosphorylation (the ‘Warburg effect’). But the biosynthetic activities required to create daughter cells are equally important for tumor growth, and recent studies are now bringing these pathways into focus. In this review, we discuss how tumor cells achieve high rates of nucleotide and fatty acid synthesis, how oncogenes and tumor suppressors influence these activities, and how glutamine metabolism enables macromolecular synthesis in proliferating cells.

Otto Warburg’s demonstration that tumor cells rapidly use glucose and convert the majority of it to lactate is still the most fundamental and enduring observation in tumor metabolism. His work, which ushered in an era of study on tumor metabolism focused on the relationship between glycolysis and cellular bioenergetics, has been revisited and expanded by generations of tumor biologists. It is now accepted that a high rate of glucose metabolism, exploited clinically by 18FDGPET scanning, is a metabolic hallmark of rapidly dividing cells, correlates closely with transformation, and accounts for a significant percentage of ATP generated during cell proliferation. A ‘metabolic transformation’ is required for tumorigenesis. Research over the past few years has reinforced this idea, revealing the conservation of metabolic activities among diverse tumor types, and proving that oncogenic mutations can promote metabolic autonomy by driving nutrient uptake to levels that often exceed those required for cell growth and proliferation.

In order to engage in replicative division, a cell must duplicate its genome, proteins, and lipids and assemble the components into daughter cells; in short, it must become a factory for macromolecular biosynthesis. These activities require that cells take up extracellular nutrients like glucose and glutamine and allocate them into metabolic pathways that convert them into biosynthetic precursors (Figure 1). Tumor cells can achieve this phenotype through changes in the expression of enzymes that determine metabolic flux rates, including nutrient transporters and enzymes [8– 10]. Current studies in tumor metabolism are revealing novel mechanisms for metabolic control, establishing which enzyme isoforms facilitate the tumor metabolic phenotype, and suggesting new targets for cancer therapy.

The ongoing challenge in tumor cell metabolism is to understand how individual pathways fit together into the global metabolic phenotype of cell growth. Here we discuss two biosynthetic activities required by proliferating tumor cells: production of ribose-5 phosphate for nucleotide biosynthesis and production of fatty acids for lipid biosynthesis. Nucleotide and lipid biosynthesis share three important characteristics.

  • First, both use glucose as a carbon source.
  • Second, both consume TCA cycle intermediates, imposing the need for a mechanism to replenish the cycle.
  • Third, both require reductive power in the form of NADPH.

In this Essay, we discuss the possible drivers, advantages, and potential liabilities of the altered metabolism of cancer cells (Figure 1, not shown). Although our emphasis on the Warburg effect reflects the focus of the field, we would also like to encourage a broader approach to the study of cancer metabolism that takes into account the contributions of all interconnected small molecule pathways of the cell.

The Tumor Microenvironment Selects for Altered Metabolism One compelling idea to explain the Warburg effect is that the altered metabolism of cancer cells confers a selective advantage for survival and proliferation in the unique tumor microenvironment. As the early tumor expands, it outgrows the diffusion limits of its local blood supply, leading to hypoxia and stabilization of the hypoxia-inducible transcription factor, HIF. HIF initiates a transcriptional program that provides multiple solutions to hypoxic stress (reviewed in Kaelin and Ratcliffe, 2008). Because a decreased dependence on aerobic respiration becomes advantageous, cell metabolism is shifted toward glycolysis by the increased expression of glycolytic enzymes, glucose transporters, and inhibitors of mitochondrial metabolism. In addition, HIF stimulates angiogenesis (the formation of new blood vessels) by upregulating several factors, including most prominently vascular endothelial growth factor (VEGF).

Blood vessels recruited to the tumor microenvironment, however, are disorganized, may not deliver blood effectively, and therefore do not completely alleviate hypoxia (reviewed in Gatenby and Gillies, 2004). The oxygen levels within a tumor vary both spatially and temporally, and the resulting rounds of fluctuating oxygen levels potentially select for tumors that constitutively upregulate glycolysis. Interestingly, with the possible exception of tumors that have lost the von Hippel-Lindau protein (VHL), which normally mediates degradation of HIF, HIF is still coupled to oxygen levels, as evident from the heterogeneity of HIF expression within the tumor microenvironment. Therefore, the Warburg effect—that is, an uncoupling of glycolysis from oxygen levels—cannot be explained solely by upregulation of HIF. Other molecular mechanisms are likely to be important, such as the metabolic changes induced by oncogene activation and tumor suppressor loss.

Oncogene Activation Drives Changes in Metabolism Not only may the tumor microenvironment select for a deranged metabolism, but oncogene status can also drive metabolic changes. Since Warburg’s time, the biochemical study of cancer metabolism has been overshadowed by efforts to identify the mutations that contribute to cancer initiation and progression. Recent work, however, has demonstrated that the key components of the Warburg effect—

  • increased glucose consumption,
  • decreased oxidative phosphorylation, and
  • accompanying lactate production—
  • are also distinguishing features of oncogene activation.

The signaling molecule Ras, a powerful oncogene when mutated, promotes glycolysis (reviewed in Dang and Semenza, 1999; Ramanathan et al., 2005). Akt kinase, a well-characterized downstream effector of insulin signaling, reprises its role in glucose uptake and utilization in the cancer setting (reviewed in Manning and Cantley, 2007), whereas the Myc transcription factor upregulates the expression of various metabolic genes (reviewed in Gordan et al., 2007). The most parsimonious route to tumorigenesis may be activation of key oncogenic nodes that execute a proliferative program, of which metabolism may be one important arm. Moreover, regulation of metabolism is not exclusive to oncogenes.

Cancer Cell Metabolism: Warburg & Beyond

Hsu PP & Sabatini DM
Cell  Sep 5, 2008; 134, 703-705
http://dx.doi.org:/10.1016/j.cell.2008.08.021

Tumor cells respond to growth signals by the activation of protein kinases, altered gene expression and significant modifications in substrate flow and redistribution among biosynthetic pathways. This results in a proliferating phenotype with altered cellular function. These transformed cells exhibit unique anabolic characteristics, which includes increased and preferential utilization of glucose through the non-oxidative steps of the pentose cycle for nucleic acid synthesis but limited de novo fatty  acid   synthesis   and   TCA   cycle   glucose   oxidation. This  primarily nonoxidative anabolic profile reflects an undifferentiated highly proliferative aneuploid cell phenotype and serves as a reliable metabolic biomarker to determine cell proliferation rate and the level of cell transformation/differentiation in response to drug treatment.

Novel drugs effective in particular cancers exert their anti-proliferative effects by inducing significant reversions of a few specific non-oxidative anabolic pathways. Here we present evidence that cell transformation of various mechanisms is sustained by a unique disproportional substrate distribution between the two branches of the pentose cycle for nucleic acid synthesis, glycolysis and the TCA cycle for fatty acid synthesis and glucose oxidation. This can be demonstrated by the broad labeling and unique specificity of [1,2-13C2]glucose to trace a large number of metabolites in the metabolome. Stable isotope-based dynamic metabolic profiles (SIDMAP) serve the drug discovery process by providing a powerful new tool that integrates the metabolome into a functional genomics approach to developing new drugs. It can be used in screening kinases and their metabolic targets, which can therefore be more efficiently characterized, speeding up and improving drug testing, approval and labeling processes by saving trial and error type study costs in drug testing.

Metabolic Biomarker and Kinase Drug Target Discovery in Cancer Using Stable Isotope-Based Dynamic Metabolic Profiling (SIDMAP)

László G. Boros, Daniel J. Brackett and George G. Harrigan
Current Cancer Drug Targets, 2003, 3, 447-455 447

Pyruvate constitutes a critical branch point in cellular carbon metabolism. We have identified two proteins, Mpc1 and Mpc2, as essential for mitochondrial pyruvate transport in yeast, Drosophila, and humans. Mpc1 and Mpc2 associate to form an ~150 kilodalton complex in the inner mitochondrial membrane. Yeast and Drosophila mutants lacking MPC1 display impaired pyruvate metabolism, with an accumulation of upstream metabolites and a depletion of tricarboxylic acid cycle intermediates. Loss of yeast Mpc1 results in defective mitochondrial pyruvate uptake, while silencing of MPC1 or MPC2 in mammalian cells impairs pyruvate oxidation. A point mutation in MPC1 provides resistance to a known inhibitor of the mitochondrial pyruvate carrier. Human genetic studies of three families with children suffering from lactic acidosis and hyperpyruvatemia revealed a causal locus that mapped to MPC1, changing single amino acids that are conserved throughout eukaryotes. These data demonstrate that Mpc1 and Mpc2 form an essential part of the mitochondrial pyruvate carrier.

A Mitochondrial Pyruvate Carrier Required for Pyruvate Uptake in Yeast, Drosophila , and Humans

Daniel K. Bricker, Eric B. Taylor, John C. Schell, Thomas Orsak, et al.
Science Express 24 May 2012
http://dx.doi.org:/10.1126/science.1218099

Adenosine deaminase acting on RNA (ADAR) enzymes convert adenosine (A) to inosine (I) in double-stranded (ds) RNAs. Since Inosine is read as Guanosine, the biological consequence of ADAR enzyme activity is an A/G conversion within RNA molecules. A-to-I editing events can occur on both coding and non-coding RNAs, including microRNAs (miRNAs), which are small regulatory RNAs of ~20–23 nucleotides that regulate several cell processes by annealing to target mRNAs and inhibiting their translation. Both miRNA precursors and mature miRNAs undergo A-to-I RNA editing, affecting the miRNA maturation process and activity. ADARs can also edit 3′ UTR of mRNAs, further increasing the interplay between mRNA targets and miRNAs. In this review, we provide a general overview of the ADAR enzymes and their mechanisms of action as well as miRNA processing and function. We then review the more recent findings about the impact of ADAR-mediated activity on the miRNA pathway in terms of biogenesis, target recognition, and gene expression regulation.

Review ADAR Enzyme and miRNA Story: A Nucleotide that Can Make the Difference 

Sara Tomaselli, Barbara Bonamassa, Anna Alisi, Valerio Nobili, Franco Locatelli and Angela Gallo
Int. J. Mol. Sci. 19 Nov 2013; 14, 22796-22816 http://dx.doi.org:/10.3390/ijms141122796

The fermented wheat germ extract (FWGE) nutraceutical (Avemar™), manufactured under “good manufacturing practice” conditions and, fulfilling the self-affirmed “generally recognized as safe” status in the United States, has been approved as a “dietary food for special medical purposes for cancer patients” in Europe. In this paper, we report the adjuvant use of this nutraceutical in the treatment of high-risk skin melanoma patients. Methods: In a randomized, pilot, phase II clinical trial, the efficacy of dacarbazine (DTIC)-based adjuvant chemotherapy on survival parameters of melanoma patients was compared to that of the same treatment supplemented with a 1-year long administration of FWGE. Results: At the end of an additional 7-year-long follow-up period, log-rank analyses (Kaplan-Meier estimates) showed significant differences in both progression-free (PFS) and overall survival (OS) in favor of the FWGE group. Mean PFS: 55.8 months (FWGE group) versus 29.9 months (control group), p  0.0137. Mean OS: 66.2 months (FWGE group) versus 44.7 months (control group), p < 0.0298. Conclusions: The inclusion of Avemar into the adjuvant protocols of high-risk skin melanoma patients is highly recommended.

Adjuvant Fermented Wheat Germ Extract (Avemar™) Nutraceutical Improves Survival of High-Risk Skin Melanoma Patients: A Randomized, Pilot, Phase II Clinical Study with a 7-Year Follow-Up

LV Demidov, LV Manziuk, GY Kharkevitch, NA Pirogova, and EV Artamonova
Cancer Biotherapy & Radiopharmaceuticals 2008; 23(4)
http://dx.doi.org:/10.1089/cbr.2008.0486

Cancer cells possess unique metabolic signatures compared to normal cells, including shifts in aerobic glycolysis, glutaminolysis, and de novo biosynthesis of macromolecules. Targeting these changes with agents (drugs and dietary components) has been employed as strategies to reduce the complications associated with tumorigenesis. This paper highlights the ability of several food components to suppress tumor-specific metabolic pathways, including increased expression of glucose transporters, oncogenic tyrosine kinase, tumor-specific M2-type pyruvate kinase, and fatty acid synthase, and the detection of such effects using various metabonomic technologies, including liquid chromatography/mass spectrometry (LC/MS) and stable isotope-labeled MS. Stable isotope-mediated tracing technologies offer exciting opportunities for defining specific target(s) for food components. Exposures, especially during the early transition phase from normal to cancer, are critical for the translation of knowledge about food components into effective prevention strategies. Although appropriate dietary exposures needed to alter cellular metabolism remain inconsistent and/or ill-defined, validated metabonomic biomarkers for dietary components hold promise for establishing effective strategies for cancer prevention.

Bioactive Food Components and Cancer-Specific Metabonomic Profiles

Young S. Kim and John A. Milner
Journal of Biomedicine and Biotechnology 2011, Art ID 721213, 9 pages
http://dx.doi.org:/10.1155/2011/721213

This reviewer poses the following observation.  The importance of the pyridine nucleotide reduced/oxidized ratio has not been alluded to here, but the importance cannot be understated. It has relevance to the metabolic functions of anabolism and catabolism of the visceral organs.  The importance of this has ties to the pentose monophosphate pathway. The importance of the pyridine nucleotide transhydrogenase reaction remains largely unexplored.  In reference to the NAD-redox state, the observation was made by Nathan O. Kaplan that the organs may be viewed with respect to their primary functions in anabolic or high energy catabolic activities. Thus we find that the endocrine organs are largely tied to anabolic functioning, and to NADP, whereas cardiac and skeletal muscle are highly dependent on NAD. The consequence of this observed phenomenon appears to be related to a difference in the susceptibility to malignant transformation.  In the case of the gastrointestinal tract, the rate of turnover of the epithelium is very high. However, with the exception of the liver, there is no major activity other than cell turnover. In the case of the liver, there is a major commitment to synthesis of lipids, storage of fuel, and synthesis of proteins, which is largely anabolic, but there is also a major activity in detoxification, which is not.  In addition, the liver has a double circulation. As a result, a Zahn infarct is uncommon.  Now we might also consider the heart.  The heart is a muscle syncytium with a high need for oxygen.  Cutting of the oxygen supply makes the myocytes vulnerable to ischemic insult and abberant rhythm abnormalities.  In addition, the cardiomyocyte can take up lactic acid from the circulation for fuel, which is tied to the utilization of lactate from vigorous skeletal muscle activity.  The skeletal muscle is tied to glycolysis in normal function, which has a poor generation of ATP, so that the recycling of excess lactic acid is required by cardiac muscle and hepatocytes.  This has not been a part of the discussion, but this reviewer considers it important to remember in considering the organ-specific tendencies to malignant transformation.

Comment (Aurelian Udristioiu):

Otto Warburg observed that many cancers lose their capacity for mitochondrial respiration, limiting ATP production to anaerobic glycolytic pathways. The phenomenon is particularly prevalent in aggressive malignancies, most of which are also hypoxic [1].
Hypoxia induces a stochastic imbalance between the numbers of reduced mitochondrial species vs. available oxygen, resulting in increased reactive oxygen species (ROS) whose toxicity can lead to apoptotic cell death.
Mechanism involves inhibition of glycolytic ATP production via a Randle-like cycle while increased uncoupling renders cancers unable to produce compensatory ATP from respiration-.generation in the presence of intact tricarboxylic acid (TCA) enzyme.
One mitochondrial adaptation to increased ROS is over-expression of the uncoupling protein 2 (UCP2) that has been reported in multiple human cancer cell lines [2-3]. Increased UCP2 expression was also associated with reduced ATP production in malignant oxyphilic mouse leukemia and human lymphoma cell lines [4].
Hypoxia reduces the ability of cells to maintain their energy levels, because less ATP is obtained from glycolysis than from oxidative phosphorylation. Cells adapt to hypoxia by activating the expression of mutant genes in glycolysis.
-Severe hypoxia causes a high mutation rate, resulting in point mutations that may be explained by reduced DNA mismatch repairing activity.
The most direct induction of apoptosis caused by hypoxia is determined by the inhibition of the electron carrier chain from the inner membrane of the mitochondria. The lack of oxygen inhibits the transport of protons and thereby causes a decrease in membrane potential. Cell survival under conditions of mild hypoxia is mediated by phosphoinositide-3 kinase (PIK3) using severe hypoxia or anoxia, and then cells initiate a cascade of events that lead to apoptosis [5].
After DNA damage, a very important regulator of apoptosis is the p53 protein. This tumor suppressor gene has mutations in over 60% of human tumors and acts as a suppressor of cell division. The growth-suppressive effects of p53 are considered to be mediated through the transcriptional trans-activation activity of the protein. In addition to the maturational state of the clonal tumor, the prognosis of patients with CLL is dependent of genetic changes within the neoplastic cell population.

1.Warburg O. On the origin of cancer cells. Science 1956; 123 (3191):309-314
PubMed Abstract ; Publisher Full Text

2.Giardina TM, Steer JH, Lo SZ, Joyce DA. Uncoupling protein-2 accumulates rapidly in the inner mitochondrial membrane during mitochondrial reactive oxygen stress in macrophages. Biochim Biophys Acta 2008, 1777(2):118-129. PubMed Abstract | Publisher Full Text

3. Horimoto M, Resnick MB, Konkin TA, Routhier J, Wands JR, Baffy G. Expression of uncoupling protein-2 in human colon cancer. Clin Cancer Res 2004; 10 (18 Pt1):6203-6207. PubMed Abstract | Publisher Full Text

4. Randle PJ, England PJ, Denton RM. Control of the tricarboxylate cycle and it interactions with glycolysis during acetate utilization in rat heart. Biochem J 1970; 117(4):677-695. PubMed Abstract | PubMed Central Full Text

5. Gillies RJ, Robey I, Gatenby RA. Causes and consequences of increased glucose metabolism of cancers. J Nucl Med 2008; 49(Suppl 2):24S-42S. PubMed Abstract | Publisher Full Text

Shortened version of Comment –

Hypoxia induces a stochastic imbalance between the numbers of reduced mitochondrial species vs. available oxygen, resulting in increased reactive oxygen species (ROS) whose toxicity can lead to apoptotic cell death.
Mechanism involves inhibition of glycolytic ATP production via a Randle-like cycle while increased uncoupling renders cancers unable to produce compensatory ATP from respiration-.generation in the presence of intact tricarboxylic acid (TCA) enzyme.
One mitochondrial adaptation to increased ROS is over-expression of the uncoupling protein 2 (UCP2) that has been reported in multiple human cancer cell lines. Increased UCP2 expression was also associated with reduced ATP production in malignant oxyphilic mouse leukemia and human lymphoma cell lines.
Severe hypoxia causes a high mutation rate, resulting in point mutations that may be explained by reduced DNA mismatch repairing activity.

Read Full Post »

Artificial Intelligence Versus the Scientist: Who Will Win?

Will DARPA Replace the Human Scientist: Not So Fast, My Friend!

Writer, Curator: Stephen J. Williams, Ph.D.

Article ID #168: Artificial Intelligence Versus the Scientist: Who Will Win?. Published on 3/2/2015

WordCloud Image Produced by Adam Tubman

scientistboxingwithcomputer

Last month’s issue of Science article by Jia You “DARPA Sets Out to Automate Research”[1] gave a glimpse of how science could be conducted in the future: without scientists. The article focused on the U.S. Defense Advanced Research Projects Agency (DARPA) program called ‘Big Mechanism”, a $45 million effort to develop computer algorithms which read scientific journal papers with ultimate goal of extracting enough information to design hypotheses and the next set of experiments,

all without human input.

The head of the project, artificial intelligence expert Paul Cohen, says the overall goal is to help scientists cope with the complexity with massive amounts of information. As Paul Cohen stated for the article:

“‘

Just when we need to understand highly connected systems as systems,

our research methods force us to focus on little parts.

                                                                                                                                                                                                               ”

The Big Mechanisms project aims to design computer algorithms to critically read journal articles, much as scientists will, to determine what and how the information contributes to the knowledge base.

As a proof of concept DARPA is attempting to model Ras-mutation driven cancers using previously published literature in three main steps:

  1. Natural Language Processing: Machines read literature on cancer pathways and convert information to computational semantics and meaning

One team is focused on extracting details on experimental procedures, using the mining of certain phraseology to determine the paper’s worth (for example using phrases like ‘we suggest’ or ‘suggests a role in’ might be considered weak versus ‘we prove’ or ‘provide evidence’ might be identified by the program as worthwhile articles to curate). Another team led by a computational linguistics expert will design systems to map the meanings of sentences.

  1. Integrate each piece of knowledge into a computational model to represent the Ras pathway on oncogenesis.
  2. Produce hypotheses and propose experiments based on knowledge base which can be experimentally verified in the laboratory.

The Human no Longer Needed?: Not So Fast, my Friend!

The problems the DARPA research teams are encountering namely:

  • Need for data verification
  • Text mining and curation strategies
  • Incomplete knowledge base (past, current and future)
  • Molecular biology not necessarily “requires casual inference” as other fields do

Verification

Notice this verification step (step 3) requires physical lab work as does all other ‘omics strategies and other computational biology projects. As with high-throughput microarray screens, a verification is needed usually in the form of conducting qPCR or interesting genes are validated in a phenotypical (expression) system. In addition, there has been an ongoing issue surrounding the validity and reproducibility of some research studies and data.

See Importance of Funding Replication Studies: NIH on Credibility of Basic Biomedical Studies

Therefore as DARPA attempts to recreate the Ras pathway from published literature and suggest new pathways/interactions, it will be necessary to experimentally validate certain points (protein interactions or modification events, signaling events) in order to validate their computer model.

Text-Mining and Curation Strategies

The Big Mechanism Project is starting very small; this reflects some of the challenges in scale of this project. Researchers were only given six paragraph long passages and a rudimentary model of the Ras pathway in cancer and then asked to automate a text mining strategy to extract as much useful information. Unfortunately this strategy could be fraught with issues frequently occurred in the biocuration community namely:

Manual or automated curation of scientific literature?

Biocurators, the scientists who painstakingly sort through the voluminous scientific journal to extract and then organize relevant data into accessible databases, have debated whether manual, automated, or a combination of both curation methods [2] achieves the highest accuracy for extracting the information needed to enter in a database. Abigail Cabunoc, a lead developer for Ontario Institute for Cancer Research’s WormBase (a database of nematode genetics and biology) and Lead Developer at Mozilla Science Lab, noted, on her blog, on the lively debate on biocuration methodology at the Seventh International Biocuration Conference (#ISB2014) that the massive amounts of information will require a Herculaneum effort regardless of the methodology.

Although I will have a future post on the advantages/disadvantages and tools/methodologies of manual vs. automated curation, there is a great article on researchinformation.info “Extracting More Information from Scientific Literature” and also see “The Methodology of Curation for Scientific Research Findings” and “Power of Analogy: Curation in Music, Music Critique as a Curation and Curation of Medical Research Findings – A Comparison” for manual curation methodologies and A MOD(ern) perspective on literature curation for a nice workflow paper on the International Society for Biocuration site.

The Big Mechanism team decided on a full automated approach to text-mine their limited literature set for relevant information however was able to extract only 40% of relevant information from these six paragraphs to the given model. Although the investigators were happy with this percentage most biocurators, whether using a manual or automated method to extract information, would consider 40% a low success rate. Biocurators, regardless of method, have reported ability to extract 70-90% of relevant information from the whole literature (for example for Comparative Toxicogenomics Database)[3-5].

Incomplete Knowledge Base

In an earlier posting (actually was a press release for our first e-book) I had discussed the problem with the “data deluge” we are experiencing in scientific literature as well as the plethora of ‘omics experimental data which needs to be curated.

Tackling the problem of scientific and medical information overload

pubmedpapersoveryears

Figure. The number of papers listed in PubMed (disregarding reviews) during ten year periods have steadily increased from 1970.

Analyzing and sharing the vast amounts of scientific knowledge has never been so crucial to innovation in the medical field. The publication rate has steadily increased from the 70’s, with a 50% increase in the number of original research articles published from the 1990’s to the previous decade. This massive amount of biomedical and scientific information has presented the unique problem of an information overload, and the critical need for methodology and expertise to organize, curate, and disseminate this diverse information for scientists and clinicians. Dr. Larry Bernstein, President of Triplex Consulting and previously chief of pathology at New York’s Methodist Hospital, concurs that “the academic pressures to publish, and the breakdown of knowledge into “silos”, has contributed to this knowledge explosion and although the literature is now online and edited, much of this information is out of reach to the very brightest clinicians.”

Traditionally, organization of biomedical information has been the realm of the literature review, but most reviews are performed years after discoveries are made and, given the rapid pace of new discoveries, this is appearing to be an outdated model. In addition, most medical searches are dependent on keywords, hence adding more complexity to the investigator in finding the material they require. Third, medical researchers and professionals are recognizing the need to converse with each other, in real-time, on the impact new discoveries may have on their research and clinical practice.

These issues require a people-based strategy, having expertise in a diverse and cross-integrative number of medical topics to provide the in-depth understanding of the current research and challenges in each field as well as providing a more conceptual-based search platform. To address this need, human intermediaries, known as scientific curators, are needed to narrow down the information and provide critical context and analysis of medical and scientific information in an interactive manner powered by web 2.0 with curators referred to as the “researcher 2.0”. This curation offers better organization and visibility to the critical information useful for the next innovations in academic, clinical, and industrial research by providing these hybrid networks.

Yaneer Bar-Yam of the New England Complex Systems Institute was not confident that using details from past knowledge could produce adequate roadmaps for future experimentation and noted for the article, “ “The expectation that the accumulation of details will tell us what we want to know is not well justified.”

In a recent post I had curated findings from four lung cancer omics studies and presented some graphic on bioinformatic analysis of the novel genetic mutations resulting from these studies (see link below)

Multiple Lung Cancer Genomic Projects Suggest New Targets, Research Directions for

Non-Small Cell Lung Cancer

which showed, that while multiple genetic mutations and related pathway ontologies were well documented in the lung cancer literature there existed many significant genetic mutations and pathways identified in the genomic studies but little literature attributed to these lung cancer-relevant mutations.

KEGGinliteroanalysislungcancer

  This ‘literomics’ analysis reveals a large gap between our knowledge base and the data resulting from large translational ‘omic’ studies.

Different Literature Analyses Approach Yeilding

A ‘literomics’ approach focuses on what we don NOT know about genes, proteins, and their associated pathways while a text-mining machine learning algorithm focuses on building a knowledge base to determine the next line of research or what needs to be measured. Using each approach can give us different perspectives on ‘omics data.

Deriving Casual Inference

Ras is one of the best studied and characterized oncogenes and the mechanisms behind Ras-driven oncogenenis is highly understood.   This, according to computational biologist Larry Hunt of Smart Information Flow Technologies makes Ras a great starting point for the Big Mechanism project. As he states,” Molecular biology is a good place to try (developing a machine learning algorithm) because it’s an area in which common sense plays a minor role”.

Even though some may think the project wouldn’t be able to tackle on other mechanisms which involve epigenetic factors UCLA’s expert in causality Judea Pearl, Ph.D. (head of UCLA Cognitive Systems Lab) feels it is possible for machine learning to bridge this gap. As summarized from his lecture at Microsoft:

“The development of graphical models and the logic of counterfactuals have had a marked effect on the way scientists treat problems involving cause-effect relationships. Practical problems requiring causal information, which long were regarded as either metaphysical or unmanageable can now be solved using elementary mathematics. Moreover, problems that were thought to be purely statistical, are beginning to benefit from analyzing their causal roots.”

According to him first

1) articulate assumptions

2) define research question in counter-inference terms

Then it is possible to design an inference system using calculus that tells the investigator what they need to measure.

To watch a video of Dr. Judea Pearl’s April 2013 lecture at Microsoft Research Machine Learning Summit 2013 (“The Mathematics of Causal Inference: with Reflections on Machine Learning”), click here.

The key for the Big Mechansism Project may me be in correcting for the variables among studies, in essence building a models system which may not rely on fully controlled conditions. Dr. Peter Spirtes from Carnegie Mellon University in Pittsburgh, PA is developing a project called the TETRAD project with two goals: 1) to specify and prove under what conditions it is possible to reliably infer causal relationships from background knowledge and statistical data not obtained under fully controlled conditions 2) develop, analyze, implement, test and apply practical, provably correct computer programs for inferring causal structure under conditions where this is possible.

In summary such projects and algorithms will provide investigators the what, and possibly the how should be measured.

So for now it seems we are still needed.

References

  1. You J: Artificial intelligence. DARPA sets out to automate research. Science 2015, 347(6221):465.
  2. Biocuration 2014: Battle of the New Curation Methods [http://blog.abigailcabunoc.com/biocuration-2014-battle-of-the-new-curation-methods]
  3. Davis AP, Johnson RJ, Lennon-Hopkins K, Sciaky D, Rosenstein MC, Wiegers TC, Mattingly CJ: Targeted journal curation as a method to improve data currency at the Comparative Toxicogenomics Database. Database : the journal of biological databases and curation 2012, 2012:bas051.
  4. Wu CH, Arighi CN, Cohen KB, Hirschman L, Krallinger M, Lu Z, Mattingly C, Valencia A, Wiegers TC, John Wilbur W: BioCreative-2012 virtual issue. Database : the journal of biological databases and curation 2012, 2012:bas049.
  5. Wiegers TC, Davis AP, Mattingly CJ: Collaborative biocuration–text-mining development task for document prioritization for curation. Database : the journal of biological databases and curation 2012, 2012:bas037.

Other posts on this site on include: Artificial Intelligence, Curation Methodology, Philosophy of Science

Inevitability of Curation: Scientific Publishing moves to embrace Open Data, Libraries and Researchers are trying to keep up

A Brief Curation of Proteomics, Metabolomics, and Metabolism

The Methodology of Curation for Scientific Research Findings

Scientific Curation Fostering Expert Networks and Open Innovation: Lessons from Clive Thompson and others

The growing importance of content curation

Data Curation is for Big Data what Data Integration is for Small Data

Cardiovascular Original Research: Cases in Methodology Design for Content Co-Curation The Art of Scientific & Medical Curation

Exploring the Impact of Content Curation on Business Goals in 2013

Power of Analogy: Curation in Music, Music Critique as a Curation and Curation of Medical Research Findings – A Comparison

conceived: NEW Definition for Co-Curation in Medical Research

Reconstructed Science Communication for Open Access Online Scientific Curation

Search Results for ‘artificial intelligence’

 The Simple Pictures Artificial Intelligence Still Can’t Recognize

Data Scientist on a Quest to Turn Computers Into Doctors

Vinod Khosla: “20% doctor included”: speculations & musings of a technology optimist or “Technology will replace 80% of what doctors do”

Where has reason gone?

Read Full Post »

The Reconstruction of Life Processes requires both Genomics and Metabolomics to explain Phenotypes and Phylogenetics

Writer and Curator: Larry H. Bernstein, MD, FCAP 


phylogenetics

phylogenetics

http://upload.wikimedia.org/wikipedia/commons/thumb/1/12/CollapsedtreeLabels-simplified.svg/200px-CollapsedtreeLabels-simplified.svg.png


This discussion that completes and is an epicrisis (summary and critical evaluation) of the series of discussions that preceded it.

  1. Innervation of Heart and Heart Rate
  2. Action of hormones on the circulation
  3. Allogeneic Transfusion Reactions
  4. Graft-versus Host reaction
  5. Unique problems of perinatal period
  6. High altitude sickness
  7. Deep water adaptation
  8. Heart-Lung-and Kidney
  9. Acute Lung Injury

The concept inherent in this series is that the genetic code is an imprint that is translated into a message.  It is much the same as a blueprint, or a darkroom photographic image that has to be converted to a print. It is biologically an innovation of evolutionary nature because it establishes a simple and reproducible standard for the transcription of the message through the transcription of the message using strings of nucleotides (oligonucleotides) that systematically transfer the message through ribonucleotides that communicate in the cytoplasm with the cytoskeleton based endoplasmic reticulum (ER), composing a primary amino acid sequence.  This process is a quite simple and convenient method of biological activity.  However, the simplicity ends at this step.  The metabolic components of the cell are organelles consisting of lipoprotein membranes and a cytosol which have particularly aligned active proteins, as in the inner membrane of the mitochondrion, or as in the liposome or phagosome, or the structure of the  ER, each of which is critical for energy transduction and respiration, in particular, for the mitochondria, cellular remodeling or cell death, with respect to the phagosome, and construction of proteins with respect to the ER, and anaerobic glycolysis and the hexose monophosphate shunt in the cytoplasmic domain.  All of this refers to structure and function, not to leave out the membrane assigned transport of inorganic, and organic ions (electrolytes and metabolites).

I have identified a specific role of the ER, the organelles, and cellular transactions within and between cells that is orchestrated.  But what I have outlined is a somewhat limited and rigid model that does not reach into the dynamics of cellular transactions.  The DNA has expression that may be old, no longer used messages, and this is perhaps only part of a significant portion of “dark matter”.  There is also nuclear DNA that is enmeshed with protein, mRNA that is a copy of DNA, and mDNA  is copied to ribosomal RNA (rRNA).  There is also rDNA. The classic model is DNA to RNA to protein.  However, there is also noncoding RNA, which plays an important role in regulation of transcription.

This has been discussed in other articles.  But the important point is that proteins have secondary structure through disulfide bonds, which is determined by position of sulfur amino acids, and by van der Waal forces, attraction and repulsion. They have tertiary structure, which is critical for 3-D structure.  When like subunits associate, or dissimilar oligomers, then you have heterodimers and oligomers.  These constructs that have emerged over time interact with metabolites within the cell, and also have an important interaction with the extracellular environment.

When you take this into consideration then a more complete picture emerges. The primitive cell or the multicellular organism lives in an environment that has the following characteristics – air composition, water and salinity, natural habitat, temperature, exposure to radiation, availability of nutrients, and exposure to chemical toxins or to predators.  In addition, there is a time dimension that proceeds from embryonic stage to birth in mammals, a rapid growth phase, a tapering, and a decline.  The time span is determined by body size, fluidity of adaptation, and environmental factors.  This is covered in great detail in this work.  The last two pieces are in the writing stage that completes the series. Much content has already be presented in previous articles.

The function of the heart, kidneys and metabolism of stressful conditions have already been extensively covered in http://pharmaceuticalintelligence.com  in the following and more:

The Amazing Structure and Adaptive Functioning of the Kidneys: Nitric Oxide – Part I

http://pharmaceuticalintelligence.com/2012/11/26/the-amazing-structure-and-adaptive-functioning-of-the-kidneys/

Nitric Oxide and iNOS have Key Roles in Kidney Diseases – Part II

http://pharmaceuticalintelligence.com/2012/11/26/nitric-oxide-and-inos-have-key-roles-in-kidney-diseases/

The pathological role of IL-18Rα in renal ischemia/reperfusion injury – Nature.com

http://pharmaceuticalintelligence.com/2014/10/24/the-pathological-role-of-il-18r%CE%B1-in-renal-ischemiareperfusion-injury-nature-com/

Summary, Metabolic Pathways

http://pharmaceuticalintelligence.com/2014/10/23/summary-metabolic-pathways/


Read Full Post »

Depth Underwater and Underground

Writer and Curator: Larry H. Bernstein, MD, FCAP 


Introduction

Deep diving for mammals is dangerous for humans and land based animals for too long, and it has dangerous consequences, most notable in nitrogen emboli  with very deep underwater diving. Other mammals live in water and have adapted to a water habitat.  This is another topic that needs further exploration.

Deep diving has different meanings depending on the context. Even in recreational diving the meaning may vary:

In recreational diving, a depth below about 30 metres (98 ft), where nitrogen narcosis becomes a significant hazard for most divers, may be considered a “deep dive”

In technical diving, a depth below about 60 metres (200 ft) where hypoxic breathing gas becomes necessary to avoid oxygen toxicity may be considered a “deep dive”.

Early experiments carried out by Comex S.A. (Compagnie maritime d’expertises) using hydrox and trimix attained far greater depths than any recreational technical diving. One example being the Comex Janus IV open-sea dive to 501 metres (1,644 ft) in 1977. The open-sea diving depth record was achieved in 1988 by a team of Comex divers who performed pipe line connection exercises at a depth of 534 metres (1,752 ft) in the Mediterranean Sea as part of the Hydra 8 program. These divers needed to breathe special gas mixtures because they were exposed to very high ambient pressure (more than 50 times atmospheric pressure).

Then there is the adaptation to the water habitat as a living environment. The two main types of aquatic ecosystems are marine ecosystems and freshwater ecosystems.

http://en.wikipedia.org/wiki/Deep_diving

Marine ecosystems are part of the earth’s aquatic ecosystem. The habitats that make up this vast system range from the productive nearshore regions to the barren ocean floor. The marine waters may be fully saline, brackish or nearly fresh. The saline waters have a salinity of 35-50 ppt (= parts per thousand). The freshwater has a salinity of less than 0.5 ppt. The brackish water lies in between these 2. Marine habitats are situated from the coasts, over the continental shelf to the open ocean and deep sea. The ecosystems are sometimes linked with each other and are sometimes replacing each other in other geographical regions. The reason why habitats differ from another is because of the physical factors that influence the functioning and diversity of the habitats. These factors are temperature, salinity, tides, currents, wind, wave action, light and substrate.

Marine ecosystems are home to a host of different species ranging from planktonic organisms that form the base of the marine food web to large marine mammals. Many species rely on marine ecosystems for both food and shelter from predators. They are very important to the overall health of both marine and terrestrial environments. Coastal habitats are those above the spring high tide limit or above the mean water level in non-tidal waters.  They are close to the sea and include habitats such as coastal dunes and sandy shores, beaches , cliffs and supralittoral habitats. Coastal habitats alone account for approximately 30% of all marine biological productivity.

http://www.marbef.org/wiki/marine_habitats_and_ecosystems

All plant and animal life forms are included from the microscopic picoplankton all the way to the majestic blue whale, the largest creature in the sea—and for that matter in the world. It wasn’t until the writings of Aristotle from 384-322 BC that specific references to marine life were recorded. Aristotle identified a variety of species including crustaceans, echinoderms, mollusks, and fish.
Today’s classification system was developed by Carl Linnaeus external link as an important tool for use in the study of biology and for use in the protection of biodiversity. Without very specific classification information and a naming system to identify species’ relationships, scientists would be limited in attempts to accurately describe the relationships among species. Understanding these relationships helps predict how ecosystems can be altered by human or natural factors.

Preserving biodiversity is facilitated by taxonomy. Species data can be better analyzed to determine the number of different species in a community and to determine how they might be affected by environmental stresses. Family, or phylogenetic, trees for species help predict environmental impacts on individual species and their relatives.

http://marinebio.org/oceans/marine-taxonomy/

For generations, whales and other marine mammals have intrigued humans. 2,400 years ago, Aristotle, a Greek scientist and philosopher, recognized that whales are mammals, not fish, because they nurse their young and breathe air like other mammals. There are numerous myths and legends surrounding marine mammals. The Greeks believed that killing a dolphin was as bad as murdering a human. An Amazon legend said that river dolphins came to shore dressed as men to woo pretty girls during fiestas. During the Middle Ages, there were numerous legends surrounding the narwhals’ amazing tusk, which was thought to have come from the unicorn.

Insert movie

Marine mammals evolved from their land dwelling ancestors over time by developing adaptations to life in the water. To aid swimming, the body has become streamlined and the number of body projections has been reduced. The ears have shrunk to small holes in size and shape. Mammary glands and sex organs are not part of the external physiology, and posterior (hind) limbs are no longer present.

Mechanisms to prevent heat loss have also been developed. The cylindrical body shape with small appendages reduces the surface area to volume ratio of the body, which reduces heat loss. Marine mammals also have a counter current heat exchange mechanism created by convergent evolution external link where the heat from the arteries is transferred to the veins as they pass each other before getting to extremities, thus reducing heat loss. Some marine mammals also have a thick layer of fur with a water repellent undercoat and/or a thick layer of blubber that can’t be compressed. The blubber provides insulation, a food reserve, and aids with buoyancy. These heat loss adaptations can also lead to overheating for animals that spend time out of the water. To prevent overheating, seals or sea lions will swim close to the surface with their front flippers waving in the air. They also flick sand onto themselves to keep the sun from directly hitting their skin. Blood vessels can also be expanded to act as a sort of radiator.

One of the major behavioral adaptations of marine mammals is their ability to swim and dive. Pinnipeds swim by paddling their flippers while sirenians and cetaceans move their tails or flukes up and down.

Some marine mammals can swim at relatively high speeds. Sea lions swim up to 35 kph and orcas can reach 50 kph. The fastest marine mammal, however, is the common dolphin, which reaches speeds up to 64 kph. While swimming, these animals take very quick breaths. For example, fin whales can empty and refill their huge lungs in less than 2 seconds. Marine mammals’ larynx and esophagus close automatically when they open their mouths to catch prey during dives. Oxygen is stored in hemoglobin in the blood and in myoglobin in the muscles. The lungs are also collapsible so that air is pushed into the windpipe preventing excess nitrogen from being absorbed into the tissues. Decreasing pressure can cause excess nitrogen to expand in the tissues as animals ascend to shallower depths, which can lead to decompression sickness,  aka “the bends.” Bradycardia, the reduction of heart rate by 10 to 20%, also takes place to aid with slowing respiration during dives and the blood flow to non-essential body parts. These adaptations allow sea otters to stay submerged for 4 to 5 minutes and dive to depths up to 55 m. Pinnipeds can often stay down for 30 minutes and reach average depths of 150-250 m. One marine mammal with exceptional diving skills is the Weddell seal, which can stay submerged for at least 73 minutes at a time at depths up to 600 m. The length and depth of whale dives depends on the species. Baleen whales feed on plankton near the surface of the water and have no need to dive deeply so they are rarely seen diving deeper than 100 m external link. Toothed whales seek larger prey at deeper depths and some can stay down for hours at depths of up to 2,250 m external link.

http://marinebio.org/oceans/marine-mammals/

Human Experience

Albert Behnke: Nitrogen Narcosis

Casey A. Grover and David H. Grover
The Journal of Emergency Medicine, 2014; 46(2):225–227
http://dx.doi.org/10.1016/j.jemermed.2013.08.080

As early as 1826, divers diving to great depths noted that descent often resulted in a phenomenon of intoxication and euphoria. In 1935, Albert Behnke discovered nitrogen as the cause of this clinical syndrome, a condition now known as nitrogen narcosis. Nitrogen narcosis consists of the development of euphoria, a false sense of security, and impaired judgment upon underwater descent using compressed air below 34 atmospheres (99 to 132 feet). At greater depths, symptoms can progress to loss of consciousness. The syndrome remains relatively unchanged in modern diving when compressed air is used. Behnke’s use of non-nitrogencontaining gas mixtures subsequent to his discovery during the 1939 rescue of the wrecked submarine USS Squalus pioneered the use of non-nitrogencontaining gas mixtures, which are used by modern divers when working at great depth to avoid the effects of nitrogen narcosis.

Behnke’s first duty station as a licensed physician was as assistant medical officer for Submarine Division 20 in San Diego, which was then commanded by one of the Navy’s rising stars, Captain Chester W. Nimitz of World War II fame.
In this setting, Dr. Behnke spent his free time constructively by learning to dive, using the traditional ‘‘hard-hat’’ gear aboard the USS Ortalon, a submarine rescue vessel to which he also rotated. Diving was not a notable specialty of the Navy at the time, and the service was slow in developing the infrastructure for it. Dr. Behnke devoted his efforts to research on the topic of diving medicine, as well as developing a more sound understanding of the biophysics of diving. In 1932, he wrote a letter to the Surgeon General describing some of his observations on arterial gas embolism, which earned him some accolades from the Navy and resulted in his transfer to Harvard’s School of Public Health as a graduate fellow. After 2 years at Harvard, the Navy assigned duty to Dr. Behnke at the Navy’s submarine escape training tower at Pearl Harbor. He worked extensively here on developing techniques for rescuing personnel from disabled submarines on the sea floor. In 1937, he was one of three Navy physicians assigned to the Navy’s Experimental Diving Unit. This team worked on improving the rescue system, plus updating the diving recompression tables originally developed by the British in 1908.

The intoxicating effects of diving were first described by a French physician named Colladon in 1826, who reported that descent in a diving bell resulted in his feeling a ‘‘state of excitement as though I had drunk some alcoholic liquor’’.
The etiology of this phenomenon remained largely unknown until the 1930s, when the British military researcher Damant again highlighted the issue, and reported very unpredictable behavior in his divers during descents as deep as 320 feet during the British Admiralty Deep Sea diving trials. Two initial theories arose as to the etiology for this effect, the first being from psychological causes by Hill and Phillip in 1932, and the second being from oxygen toxicity by Haldane in 1935.

Dr. Behnke and his colleagues at the Harvard School of Public Health had another idea as to the etiology of this phenomenon. In 1935, based on observation of individuals in experiments with a pressure chamber, Dr. Behnke published an article in the American Journal of Physiology in which he posited that nitrogen was the etiology of the intoxicating effects of diving.

Nitrogen narcosis, described as ‘‘rapture of the deep’’ by Jacques Cousteau, still remains a relatively common occurrence in modern diving, despite major advances in diving technology since Behnke’s initial description of the pathophysiologic cause of the condition in 1935. The development of symptoms of this condition varies from diver to diver, but usually begins when a depth of 4 atmospheres (132 feet) is reached in divers using compressed air. More sensitive divers can develop symptoms at only 3 atmospheres (99 feet), and other divers may not be affected up to depths as high as 6 atmospheres (198 feet). Interestingly, tolerance to nitrogen narcosis can be developed by frequent diving and exposure to the effects of compressed air at depth.

  1. Acott C. A brief history of diving and decompression illness. SPUMS J 1999;29:98–109.
    2. Bornmann R. Dr. Behnke, founder of UHMS, dies. Pressure 1992; 21:14.
    3. Behnke AR, Thomson RM, Motley P. The psychologic effects from breathing air at 4 atmospheric pressures. Am J Physiol 1935; 112:554–8.
    4. Behnke AR, Johnson FS, Poppen JR, Motley P. The effect of oxygen on man at pressures from 1 to 4 atmospheres. AmJ Physiol 1934; 110:565–72.

Exhaled nitric oxide concentration and decompression-induced bubble formation: An index of decompression severity in humans?

J.-M. Pontier, Buzzacott, J. Nastorg, A.T. Dinh-Xuan, K. Lambrechts
Nitric Oxide 39 (2014) 29–34
http://dx.doi.org/10.1016/j.niox.2014.04.005

Introduction: Previous studies have highlighted a decreased exhaled nitric oxide concentration (FE NO) in divers after hyperbaric exposure in a dry chamber or following a wet dive. The underlying mechanisms of this decrease remain however unknown. The aim of this study was to quantify the separate effects of submersion, hyperbaric hyperoxia exposure and decompression-induced bubble formation on FE NO after a wet dive.
Methods: Healthy experienced divers (n = 31) were assigned to either

  • a group making a scuba-air dive (Air dive),
  • a group with a shallow oxygen dive protocol (Oxygen dive) or

a group making a deep dive breathing a trimix gas mixture (deep-dive).
Bubble signals were graded with the KISS score. Before and after each dive FE NO values were measured using a hand-held electrochemical analyzer.
Results: There was no change in post-dive values of FE NO values (expressed in ppb = parts per billion) in the Air dive group (15.1 ± 3.6 ppb vs. 14.3 ± 4.7 ppb, n = 9, p = 0.32). There was a significant decrease in post-dive values of FE NO in the Oxygen dive group (15.6 ± 6 ppb vs. 11.7 ± 4.7 ppb, n = 9, p = 0.009). There was an even more pronounced decrease in the deep dive group (16.4 ± 6.6 ppb vs. 9.4 ± 3.5 ppb, n = 13, p < 0.001) and a significant correlation between KISS bubble score >0 (n = 13) and percentage decrease in post-dive FE NO values (r = -0.53, p = 0.03). Discussion: Submersion and hyperbaric hyperoxia exposure cannot account entirely for these results suggesting the possibility that, in combination, one effect magnifies the other. A main finding of the present study is a significant relationship between reduction in exhaled NO concentration and dive-induced bubble formation. We postulate that exhaled NO concentration could be a useful index of decompression severity in healthy human divers.

Brain Damage in Commercial Breath-Hold Divers

Kiyotaka Kohshi, H Tamaki, F Lemaıtre, T Okudera, T Ishitake, PJ Denoble
PLoS ONE 9(8): e105006 http://dx.doi.org:/10.1371/journal.pone.0105006

Background: Acute decompression illness (DCI) involving the brain (Cerebral DCI) is one of the most serious forms of diving related injuries which may leave residual brain damage. Cerebral DCI occurs in compressed air and in breath-hold divers, likewise. We conducted this study to investigate whether long-term breath-hold divers who may be exposed to repeated symptomatic and asymptomatic brain injuries, show brain damage on magnetic resonance imaging (MRI).
Subjects and Methods: Our study subjects were 12 commercial breath-hold divers (Ama) with long histories of diving work in a district of Japan. We obtained information on their diving practices and the presence or absence of medical problems, especially DCI events. All participants were examined with MRI to determine the prevalence of brain lesions.
Results: Out of 12 Ama divers (mean age: 54.965.1 years), four had histories of cerebral DCI events, and 11 divers demonstrated ischemic lesions of the brain on MRI studies. The lesions were situated in the cortical and/or subcortical area (9 cases), white matters (4 cases), the basal ganglia (4 cases), and the thalamus (1 case). Subdural fluid collections were seen in 2 cases. Conclusion: These results suggest that commercial breath-hold divers are at a risk of clinical or subclinical brain injury which may affect the long-term neuropsychological health of divers.

Decompression illness

Richard D Vann, Frank K Butler, Simon J Mitchell, Richard E Moon
Lancet 2010; 377: 153–64

Decompression illness is caused by intravascular or extravascular bubbles that are formed as a result of reduction in environmental pressure (decompression). The term covers both arterial gas embolism, in which alveolar gas or venous gas emboli (via cardiac shunts or via pulmonary vessels) are introduced into the arterial circulation, and decompression sickness, which is caused by in-situ bubble formation from dissolved inert gas. Both syndromes can occur in divers, compressed air workers, aviators, and astronauts, but arterial gas embolism also arises from iatrogenic causes unrelated to decompression. Risk of decompression illness is
affected by immersion, exercise, and heat or cold. Manifestations range from itching and minor pain to neurological symptoms, cardiac collapse, and death. First aid treatment is 100% oxygen and definitive treatment is recompression to increased pressure, breathing 100% oxygen. Adjunctive treatment, including fluid administration and prophylaxis against venous thromboembolism in paralyzed patients, is also recommended. Treatment is, in most cases, effective although residual deficits can remain in serious cases, even after several recompressions.

Bubbles can have mechanical, embolic, and biochemical effects with manifestations ranging from trivial to fatal. Clinical manifestations can be caused by direct effects from extravascular (autochthonous) bubbles such as mechanical distortion of tissues causing pain, or vascular obstruction causing stroke-like signs and symptoms. Secondary effects can cause delayed symptom onset up to 24 h after surfacing. Endothelial damage by intravascular bubbles can cause capillary leak, extravasation of plasma, and haemoconcentration. Impaired endothelial function, as measured by decreased effects of vasoactive compounds, has been reported in animals and might occur in man. Hypotension can occur in severe cases. Other effects include platelet activation and deposition, leucocyte-endothelial adhesion, and possibly consequences of vascular occlusion believed to occur in thromboembolic stroke such as ischaemia-reperfusion injury, and apoptosis.

Classification of initial and of all eventual manifestations of decompression illness in 2346 recreational diving accidents reported to the Divers Alert Network from 1998 to 2004 For all instances of pain, 58% consisted of joint pain, 35% muscle pain, and 7% girdle pain. Girdle pain often portends spinal cord involvement. Constitutional symptoms included headache, lightheadedness, inappropriate fatigue, malaise, nausea or vomiting, and anorexia. Muscular discomfort included stiffness, pressure, cramps, and spasm but excluded pain. Pulmonary manifestations included dyspnoea and cough.

Other than depth and time, risk of decompression sickness is affected by other factors that affect inert gas exchange and bubble formation, such as immersion (vs dry hyperbaric chamber exposure), exercise, and temperature. Immersion decreases venous pooling and increases venous return and cardiac output. Warm environments improve peripheral perfusion by promoting vasodilation, whereas cool temperatures decrease perfusion through vasoconstriction. Exercise increases both peripheral perfusion and temperature. The effect of environmental conditions on risk of decompression sickness is dependent on the phase of the pressure exposure. Pressure, exercise, immersion, or a hot environment increase inert gas uptake and risk of decompression sickness. During decom-pression these factors increase inert gas elimination and therefore decrease the risk of decompression sickness. Conversely, uptake is reduced during rest or in a cold environment, hence a diver resting in a cold environment on the bottom has decreased risk of decompression sickness. Rest or low temperatures during decompression increase the risk. If exercise occurs after decompression when super-saturation is present, bubble formation increases and risk of decompression sickness rises.

Exercise at specific times before a dive can decrease the risk of serious decompression sickness in animals and incidence of venous gas emboli in both animals and man. The mechanisms of these effects are unknown but might involve modulation of nitric oxide production and effects on endothelium. Venous gas emboli and risk of decompression sickness increase slightly with age and body-mass index.

Arterial gas embolism should be suspected if a diver has a new onset of altered consciousness, confusion, focal cortical signs, or seizure during ascent or within a few minutes after surfacing from a compressed gas dive.

If the diver spends much time at depth and might have absorbed substantial inert gas before surfacing, arterial gas embolism and serious decompression sickness can coexist, and in such cases, spinal cord manifestations can predominate. Other organ systems, such as the heart, can also be affected, but the clinical diagnosis of gas embolism is not reliable without CNS manifestations. Arterial gas embolism is rare in altitude exposure; if cerebral symptoms occur after altitude exposure, the cause is usually decompression sickness.

Nondermatomal hypoaesthesia and truncal ataxia are common in neurological decompression sickness and can be missed by cursory examination. Pertinent information includes level of consciousness and mental status, cranial nerve function, and motor strength. Coordination can be affected disproportionately, and abnormalities can be detected by assessment of finger-nose movement, and, with eyes open and closed, ability to stand and walk and do heel-toe walking backwards and forwards. Many of these simple tests can be done on the scene by untrained companions.

Panel: Differential diagnosis of decompression illness
Inner-ear barotrauma
Middle-ear or maxillary sinus overinfl ation
Contaminated diving gas and oxygen toxic effects
Musculoskeletal strains or trauma sustained before, during, or after diving
Seafood toxin ingestion (ciguatera, pufferfish, paralytic shellfish poisoning)
Immersion pulmonary edema
Water aspiration
Decompression chamber

Decompression chamber

Decompression chamber. fluidic or pneumatic ventilator is shown at the left. The infusion pump is contained within a plastic cover, in which 100% nitrogen is used to decrease the fi re risk in the event of an electrical problem. The monitor screen is outside the chamber and can be seen through the viewing port. Photo from Duke University Medical Center, with permission.

Long-term outcomes of 69 divers with spinal cord decompressionsickness, by manifestation
n %
No residual symptoms 34 49·3
Any residual symptom 35 50·7
Mild paraesthesias, weakness, or pain 14 20·3
Some impairment of daily activities 21 30·4
Difficulty walking 11 15·9
Impaired micturition 13 18·8
Impaired defecation 15 21·7
Impaired sexual function 15 21·7

Decompression illness occurs in a small population but is an international problem that few physicians are trained to recognise or manage. Although its manifestations are often mild, the potential for permanent injury exists in severe cases, especially if unrecognised or inadequately treated. Emergency medical personnel should be aware of manifestations of decompression illness in the setting of a patient with a history of recent diving or other exposure to substantial pressure change, and should contact an appropriate consultation service for advice.

Diving Medicine: Contemporary Topics and Their Controversies

Michael B. Strauss and Robert C. Borer, Jr
Am J Emerg Med 2001; 19:232-238
http://dx.doi.org:/10.1053/ajem.2001.22654

SCUBA diving is a popular recreational sport. Although serious injuries occur infrequently, when they do knowledge of diving medicine and/or where to obtain appropriate consultation is essential. The emergency physician is likely to be the first physician contact the injured diver has. We discuss 8 subjects
in diving medicine which are contemporary, yet may have controversies associated with them. From this information the physician dealing primarily with the injured diver will have a basis for understanding and managing, as
well as where to find additional help, for his/her patients’ diving injuries.

Over the past 10 years, new knowledge and equipment improvements have made diving safer and more enjoyable. Estimates of actively participating sports divers show a striking increase over this time interval while the number of SCUBA diving deaths annually has remained nearly level at approximately 100. A further indicator of recreational diving safety is that reflected in the nearly constant number of diving injuries (1000 per annum) over the most recent 5 reported years, or approximately 0.53 to 3.4 incidents/10,000 dives.

Divers Alert Network.
The Divers Alert Network (DAN) is a nonprofit organization directed and staffed by experts in the specialty of diving medicine.6 DAN provides immediate consultation for both divers and physicians in the diagnosis and initial management of diving injuries. This 24-hour service is available free world-wide through a dedicated emergency telephone line: 1-919-684-4326. The DAN staff will also identify the nearest appropriate recompression treatment facility and knowledgeable physicians for an expedient referral. General diving medical inquiries can be answered during normal weekday hours either through an information telephone line: 1-919-684-2948 or through an interactive web site http://www.diversalertnetwork.org.

Use of 100% Oxygen for Initial, on the Scene, Management of Diving Accidents
The breathing of pure oxygen is crucial for the initial management of the diving related problems of arterial gas embolism (AGE), decompression sickness (DCS), pulmonary barotrauma (thoracic squeeze), aspiration pneumonitis, and hypoxic encephalopathy associated with near drowning. In 1985, Dick reported that in many cases the neurologic symptoms of AGE and DCS were resolved with the immediate breathing of pure oxygen on the surface. The breathing of pure oxygen reduces bubble size by increasing the differential pressure for the inert gas to diffuse out of the bubble and it also speeds the washout of inert gas from body tissues. The early elimination of the bubble prevents hypoxia and the interaction of the bubble with the blood vessel lining. This interaction leads to secondary problems of capillary leak, bleeding, inflammation, ischemia, and cell death. These secondary problems are the reasons not all DCS symptoms resolve with recompression chamber treatment. The immediate use of pure oxygen for the medical management of these diving problems is analogous to the use of cardiopulmonary resuscitation for the witnessed cardiac arrest; the sooner initiated the better the results.

Diving Education

Medical Fitness for Diving

Asthma has the potential risk for AGE. Neuman reviewed the subject of asthma and diving. He and his coauthors recommend that asthmatics who are asymptomatic, not on medications and have no exercised induced abnormality on pulmonary function studies be allowed to dive.

Conditions leading to loss of consciousness, such as insulin dependent diabetes and epilepsy, can result in drowning. Carefully controlled diving studies in diabetics, who are free from complications, are now defining the safe requirements for diving. Epilepsy remains as a disqualification except in individuals with a history of febrile seizures ending prior to 5 years of age.

Availability of Hyperbaric Oxygen Treatment Facilities

The availability of these chambers makes it possible for divers who become symptomatic after SCUBA diving to readily receive recompression treatment. This is important because the closer the initiation of recompression treatment to the onset of DCS (and AGE) signs and symptoms, the greater the likelihood of full recovery.

Improved Diving Equipment

Mixed and Rebreather Gas Diving
Mixed gas diving involves changing the breathing gas from air which has 20% oxygen to higher oxygen percentages (nitrox). As the amount of oxygen is increased in the gas mixture, the amount of the inert gas (nitrogen) is reduced. With oxygen enriched air there is less tissue deposition of inert gas per unit of time under water for any given depth. However, because of increased oxygen partial pressures, the seizure threshold for oxygen toxicity is lowered. For normal sports diving activities, oxygen toxicity with mixed gas diving is only a theoretical concern.

Decompression Illness is More Than Bubbles

When AGE occurs, DCS symptoms may be concurrent or appear during or after recompression treatment even though the decompression tables were not violated on the dive. When DCS occurs in this situation it appears resistant to recompression treatment (Neuman) perhaps because of the inflammatory reaction generated by the bubble-blood vessel interaction from the AGE. In cases of DCI where components of both DCS and AGE are suspected, the diver should be observed for a minimum of 24 hours after the recompression treatment is completed for the delayed onset of DCS.

No theory of DCS discounts the primary role of bubbles in this condition. However, new information suggests that there are precursors to bubble formation and post-bubbling events that occur as a consequence of the bubbles. As mentioned earlier, venous gas emboli are a common occurrence diving ascent and ordinarily are filtered out harmlessly by the lungs. Precursors to DCS include stasis, dehydration and too rapid of ascents. These conditions allow the ubiquitous VGE to enlarge, coalesce and occlude the venous side of the circulation. Massive venous bubbling to the lungs can cause pulmonary vessel obstruction described as the chokes. If right to left shunts occur in the heart, VGE can become AGE to the brain. If the arterial flow is slow enough and/or the gradients large enough, autochthonus (ie, spontaneous) bubbles can form in the arterial circulation and lead to any of the consequences of AGE. In such situations it could be difficult to determine whether the DCI event was from AGE or DCS even after careful analysis of the dive profile. Hollenbeck’s model for diving paraplegia includes the setting of venous stasis (Batson’s plexus of veins) in the spinal canal, bubble formation, bubble enlargement possibly from off gassing of the spinal cord, blood vessel occlusion, and venous side infarctions of the spinal cord.
Contemporary Management of DCS

Problem Intervention Effect
Bubble Recompression
with HBO
Reduce bubble size
1. Washout inert gas.
2. Change bubble composition by diffusion.
Stasis and dehydration Hydration: oral fluids if alert, IV fluids otherwise. Improve blood flow.
InflammationCell Ischemia ? Anti-inflammatory medicationsHBO Reduce interaction between bubble and blood vessel endothelium.
Improve oxygen availability to hypoxic tissues, reduce edema and also reduces the interaction between bubble and blood vessel endothelium.

.

Conclusions

We anticipate that in the future there will be further improvements for the safety and enjoyment of the recreational SCUBA diver. For example, the dive computer of the future will be able to individualize dive profiles for different personal medical parameters such as age, body composition and fitness level. Diver locators could quickly target a missing diver and save time and gas consumption as well as prevent serious diving mishaps. Drugs may be developed that would minimize the effect of bubbles interacting with body tissues and prevent DCS and AGE.

Extracorporeal membrane oxygenation therapy for pulmonary decompression illness

Yutaka Kondo, Masataka Fukami and Ichiro Kukita
Kondo et al. Critical Care 2014; 18:438 http://ccforum.com/content/18/3/438/10.1186/cc13935

Pulmonary decompression illness is rarely observed in clinical settings, and most patients die prior to hospitalization. We administered ECMO therapy to rescue a patient, even though this therapy has rarely been reported with good outcome in patients with decompression illness. In addition, we had to select venovenous ECMO even with the patient showing right ventricular failure. A lot of physicians may select venoarterial ECMO if the patient shows right ventricular failure, but the important physiological mechanism of pulmonary decompression illness is massive air embolism in the pulmonary arteries, and the bubbles diminish within the first 24 hours. The management of decompression illness therefore differs substantially from the usual right-sided heart failure.

Extremes of barometric pressure

Jane E Risdall, David P Gradwell
Anaesthesia and Intensive Care Medicine 16:2
Ascent to elevated altitude, commonly achieved through flight, by climbing or by residence in highland regions, exposes the individual to reduced ambient pressure. Although there are physical manifestations of this exposure as a consequence of Boyle’s law, the primary physiological challenge is of hypobaric hypoxia. The acute physiological and longer-term adaptive responses of the cardiovascular, respiratory, hematological and neurological systems to altitude are described, together with an outline of the presentation and management of acute mountain sickness, high-altitude pulmonary edema and high-altitude cerebral edema. While many millions experience modest exposure to altitude as a result of flight in pressurized aircraft, fewer individuals are exposed to increased ambient pressure. The pressure changes during diving and hyperbaric exposures result in greater changes in gas load and gas toxicity. Physiological effects include the consequences of increased work of breathing and redistribution of circulating volume. Neurological manifestations may be the direct result of pressure or a consequence of gas toxicity at depth. Increased tissue gas loads may result in decompression illness on return to surface or subsequent ascent in flight.

  • understand the physical effects of changes in ambient pressure and the physiological consequences on the cardiovascular respiratory and neurological systems
  • gain an awareness that exposure to reduced ambient pressure produces both acute and more chronic effects, with differing signs, symptoms and time to onset at various altitudes
  • develop an awareness of the toxic effects of ‘inert’ gases at increased ambient pressures and the pathogenesis and management of decompression illness

Decompression illness According to Henry’s law, at a constant temperature the amount of gas which dissolves in a liquid is proportional to the pressure of that gas or its partial pressure, if it is part of a mixture of gases. Breathing gases at increased ambient pressure will increase the amount of each gas dissolved in the fluid phases of body tissues. On ascent this excess gas has to be given up. If the ascent is controlled at a sufficiently slow rate, elimination will be via the respiratory system. If the ascent is too fast, excess gas may come out of solution and form free bubbles in the tissues or circulation. Bubbles may contain any of the gases in the breathing mixture, but it is the presence of inert gas bubbles (nitrogen or helium) that are thought most likely to give rise to problems, since the elimination of excess oxygen is achieved by metabolism as well as ventilation. These bubbles may act as venous emboli or may trigger inflammatory tissue responses giving rise to symptoms of decompression illness (DCI). Signs and symptoms of DCI may appear up to 48 hours after exposure to increased ambient pressure and include joint pains, motor and sensory deficits, dyspnoea, cough and skin rashes.

Neurological effects of deep diving

Marit Grønning, Johan A. Aarli
Journal of the Neurological Sciences 304 (2011) 17–21
http://dx.doi.org:/10.1016/j.jns.2011.01.021

Deep diving is defined as diving to depths more than 50 m of seawater (msw), and is mainly used for occupational and military purposes. A deep dive is characterized by the compression phase, the bottom time and the decompression phase. Neurological and neurophysiologic effects are demonstrated in divers during the compression phase and the bottom time. Immediate and transient neurological effects after deep dives have been shown in some divers. However, the results from the epidemiological studies regarding long term neurological effects from deep diving are conflicting and still not conclusive.

Possible immediate neurological effects of deep diving
Syndrome Pressure
Hyperoxia/oxygen seizures >152 kPa (5 msw)
HypoxiaHypercapnia
Nitrogen narcosis >354 kPa (25 msw)
High pressure nervous syndrome >1.6 MPa (150 msw)
Neurological decompression sickness

Neurological effects have been demonstrated, both clinically and neurophysiologically in divers during the compression phase and the bottom time. Studies of divers before and after deep dives have shown immediate and transient neurological effects in some divers. However, the results from the epidemiological and clinical studies regarding long term neurological effects from deep diving are conflicting and still not conclusive. Prospective clinical studies with sufficient power and sensitivity are needed to solve this important issue.

Today deep diving to more than 100 msw is routinely performed globally in the oil- and gas industry. In the North Sea remote underwater intervention and maintenance is performed by the use of remotely operated vehicles (ROV), both in conjunction to and as an alternative to manned underwater operations. There will, however, always be a need for human divers in the technically more advanced underwater operations and for contingency repair operations.

P300 latency indexes nitrogen narcosis

Barry Fowler, Janice Pogue and Gerry Porlier
Electroencephalography, and clinical Neurophysiology, 1990, 75:221-229

This experiment investigated the effects of nitrogen narcosis on reaction time (RT) and P300 latency and amplitude, Ten subjects breathed either air or a non-narcotic 20% oxygen-80% helium (heliox) mixture in a hyperbaric chamber at 6.5, 8.3 and 10 atmospheres absolute (ATA), The subjects responded under controlled accuracy conditions to visually presented male or female names in an oddball paradigm. Single-trial analysis revealed a strong relationship between RT and P300 latency, both of which were slowed in a dose-related manner by hyperbaric air but not by heliox. A clear-cut dose-response relationship could not be established for P300 amplitude. These results indicate that P300 latency indexes nitrogen narcosis and are interpreted as support for the slowed processing model of inert gas narcosis.

Adaptation to Deep Water Habitat

Effects of hypoxia on ionic regulation, glycogen utilization and antioxidative ability in the gills and liver of the aquatic air-breathing fish Trichogaster microlepis

Chun-Yen Huang, Hui-Chen Lina, Cheng-Huang Lin
Comparative Biochemistry and Physiology, Part A 179 (2015) 25–34
http://dx.doi.org/10.1016/j.cbpa.2014.09.001

We examined the hypothesis that Trichogaster microlepis, a fish with an accessory air-breathing organ, uses a compensatory strategy involving changes in both behavior and protein levels to enhance its gas exchange ability. This compensatory strategy enables the gill ion-regulatory metabolism to maintain homeostasis during exposure to hypoxia. The present study aimed to determinewhether ionic regulation, glycogen utilization and antioxidant activity differ in terms of expression under hypoxic stresses; fish were sampled after being subjected to 3 or 12 h of hypoxia and 12 h of recovery under normoxia. The air-breathing behavior of the fish increased under hypoxia. No morphological modification of the gills was observed. The expression of carbonic anhydrase II did not vary among the treatments. The Na+/K+-ATPase enzyme activity did not decrease, but increases in Na+/K+-ATPase protein expression and ionocyte levels were observed. The glycogen utilization increased under hypoxia as measured by glycogen phosphorylase protein expression and blood glucose level, whereas the glycogen content decreased. The enzyme activity of several components of the antioxidant system in the gills, including catalase, glutathione peroxidase, and superoxidase dismutase, increased in enzyme activity. Based on the above data, we concluded that T. microlepis is a hypoxia-tolerant species that does not exhibit ion-regulatory suppression but uses glycogen to maintain energy utilization in the gills under hypoxic stress. Components of the antioxidant system showed increased expression under the applied experimental treatments.

Divergence date estimation and a comprehensive molecular tree of extant cetaceans

Michael R. McGowen , Michelle Spaulding, John Gatesy
Molecular Phylogenetics and Evolution 53 (2009) 891–906
http://dx.doi.org/10.1016/j.ympev.2009.08.018

Cetaceans are remarkable among mammals for their numerous adaptations to an entirely aquatic existence, yet many aspects of their phylogeny remain unresolved. Here we merged 37 new sequences from the nuclear genes RAG1 and PRM1 with most published molecular data for the group (45 nuclear loci, transposons, mitochondrial genomes), and generated a supermatrix consisting of 42,335 characters. The great majority of these data have never been combined. Model-based analyses of the supermatrix produced a solid, consistent phylogenetic hypothesis for 87 cetacean species. Bayesian analyses corroborated odontocete (toothed whale) monophyly, stabilized basal odontocete relationships, and completely resolved branching events within Mysticeti (baleen whales) as well as the problematic speciose clade Delphinidae (oceanic dolphins). Only limited conflicts relative to maximum likelihood results were recorded, and discrepancies found in parsimony trees were very weakly supported. We utilized the Bayesian supermatrix tree to estimate divergence dates among lineages using relaxed-clock methods. Divergence estimates revealed rapid branching of basal odontocete lineages near the Eocene–Oligocene boundary, the antiquity of river dolphin lineages, a Late Miocene radiation of balaenopteroid mysticetes, and a recent rapid radiation of Delphinidae beginning [1]10 million years ago. Our comprehensive,  time calibrated tree provides a powerful evolutionary tool for broad-scale comparative studies of Cetacea.

Mitogenomic analyses provide new insights into cetacean origin and evolution

Ulfur Arnason, Anette Gullberg, Axel Janke
Gene 333 (2004) 27–34
http://dx.doi.org:/10.1016/j.gene.2004.02.010

The evolution of the order Cetacea (whales, dolphins, porpoises) has, for a long time, attracted the attention of evolutionary biologists. Here we examine cetacean phylogenetic relationships on the basis of analyses of complete mitochondrial genomes that represent all extant cetacean families. The results suggest that the ancestors of recent cetaceans had an explosive evolutionary radiation 30–35 million years before present. During this period, extant cetaceans divided into the two primary groups, Mysticeti (baleen whales) and Odontoceti (toothed whales). Soon after this basal split, the Odontoceti diverged into the four extant lineages, sperm whales, beaked whales, Indian river dolphins and delphinoids (iniid river dolphins, narwhals/belugas, porpoises and true dolphins). The current data set has allowed test of two recent morphological hypotheses on cetacean origin. One of these hypotheses posits that Artiodactyla and Cetacea originated from the extinct group Mesonychia, and the other that Mesonychia/Cetacea constitutes a sister group to Artiodactyla. The current results are inconsistent with both these hypotheses. The findings suggest that the claimed morphological similarities between Mesonychia and Cetacea are the result of evolutionary convergence rather than common ancestry.

The order Cetacea traditionally includes three suborders: the extinct Archaeoceti and the recent Odontoceti and Mysticeti. It is commonly believed that the evolution of ancestral cetaceans from terrestrial to marine (aquatic) life was accompanied by a fast and radical morphological adaptation. Such a scenario may explain why it was, for a long time, difficult to morphologically establish the position of Cetacea in the mammalian tree and even to settle whether Cetacea constituted a monophyletic group.

Biochemical analyses in the 1950s  and 1960s had shown a closer relationship between cetaceans and artiodactyls (even-toed hoofed mammals) than between cetaceans and any other eutherian order and karyological studies in the late 1960s and early 1970s unequivocally supported cetacean monophyly (Arnason, 1969, 1974). The nature of the relationship between cetaceans and artiodactyls was resolved in phylogenetic studies of mitochondrial (mt) cytochrome b (cytb) genes (Irwin and Arnason, 1994; Arnason and Gullberg, 1996) that placed Cetacea within the order Artiodactyla itself as the sister group of the Hippopotamidae (see also Sarich, 1993). The Hippopotamidae/ Cetacea relationship was subsequently supported in studies of nuclear data (Gatesy et al., 1996; Gatesy, 1997) and statistically established in analysis of complete mt genomes (Ursing and Arnason, 1998). The relationship has also been confirmed in analyses of combined nuclear and mt sequences (Gatesy et al., 1999; Cassens et al., 2000) and in studies of short interspersed repetitive elements (SINEs). Artiodactyla and Cetacea are now commonly referred to as Cetartiodactyla.

Previous analyses of the complete cytb gene of more than 30 cetacean species (Arnason and Gullberg, 1996) identified five primary lineages of recent cetaceans, viz., Mysticeti and the four odontocete lineages Physeteridae (sperm whales), Platanistidae (Indian river dolphins), Ziphiidae (beaked whales) and Delphinoidea (iniid river dolphins, porpoises, narwhals and dolphins). However, these studies left unresolved the relationships of the five lineages as well as those between the three delphinoid families Monodontidae (narwhals, belugas), Phocoenidae (porpoises) and Delphinidae (dolphins). Similarly, the relationships between the four mysticete families Balaenidae (right whales), Neobalaenidae (pygmy right whales), Eschrichtiidae (gray whales) and Balaenopteridae (rorquals) were not conclusively resolved in analyses of cytb genes.

Fig. (not shown). Cetartiodactyl relationships and the estimated times of their divergences. The tree was established on the basis of maximum likelihood analysis of the concatenated amino acid (aa) sequences of 12 mt protein-coding genes. Length of alignment 3610 aa. Support values for branches A–H are shown in the insert.
Cetruminantia (branch A) receives moderate support and Cetancodonta (B) strong support. Cetacea (C) splits into monophyletic Mysticeti (baleen whales) and monophyletic Odontoceti (toothed whales). Odontoceti has four basal lineages, Physeteridae (sperm whales: represented by the sperm and pygmy sperm whales), Ziphiidae (beaked whales: bottlenose and Baird’s beaked whales), Platanistidae (Indian river dolphins: Indian river dolphin) and Delphinoidea. Delphinoidea encompasses the families Iniidae (iniid river dolphins: Amazon river dolphin, La Plata dolphin), Monodontidae (narwhals/belugas: narwhal), Phocoenidae (porpoises: harbour porpoise) and Delphinidae (dolphins: white-beaked dolphin). The common odontocete branch and the branches separating the four cetacean lineages are short. These relationships are therefore somewhat unstable (cf. Section 3.1 and Table 1). Iniid river dolphins (F) are solidly nested within the Delphinoidea (E). Thus, traditional river dolphins (Platanistidae + Iniidae) do not form a monophyletic unit. Molecular estimates of divergence times (Sanderson 2002) were based on two calibration points, A/C-60 and O/M-35 (cf. Section 3.2). Due to the short lengths of internal branches, some estimates for these divergences overlap. NJ: neighbor joining; MP: maximum parsimony; LBP: local bootstrap probability; QP: quartet puzzling. The bar shows the number of aa substitutions per site.

The limited molecular resolution among basal cetacean lineages has been known for some time. Studies of hemoglobin and myoglobin (Goodman, 1989; Czelusniak et al., 1990) have either joined Physeteridae and Mysticeti to the exclusion of Delphinoidea (myoglobin data) or Mysticeti and Delphinoidea to the exclusion of Physeteridae (hemoglobin data). Thus, neither of the data sets identified monophyletic Odontoceti by joining the two odontocete lineages (Physeteridae and Delphinoidea) to the exclusion of Mysticeti. A similar instability was recognized and cautioned against in analyses of some mt data, notably, sequences of rRNA genes (Arnason et al., 1993b). The suggestion (Milinkovitch et al., 1993) of a sister group relationship between Physeteridae and the mysticete family Balaenopteridae (rorquals) was based on a myoglobin data set (which joins Physeteridae and Mysticeti to the exclusion of Delphinoidea) that was complemented with partial data of the mt 16S rRNA gene.

The cetancodont divergence times calculated using A/C-60 and O/M-35 as references have been included in Fig. 1. As a result of the short branches separating several cetacean lineages, the estimates of these divergences overlap. The same observation has been made in calculations based on SINE flanking sequences (Nikaido et al., 2001). There is a general consistency between the current and the flanking sequence datings, except for those involving the Balaenopteridae, which are somewhat younger in our analysis than in the SINEs study. The currently estimated age of the divergence between Hippopotamus and Cetacea (c53.5 MYBP) is consistent with the age (>50 MY) of the oldest archaeocete fossils identified so far (Bajpai and Gingerich, 1998). This suggests that the ages allocated to the two references, A/C-60 (the divergence between ruminant artiodactyls and cetancodonts) and O/M-35 (the divergence between odontocetes and mysticetes) are reasonably accurate.

The dating of the divergence between the blue and fin whales is of interest regarding hybridization between closely related mammalian species. Previous molecular analyses (Arnason et al., 1991b; Spilliaert et al., 1991) demonstrated the occurrence of hybridization between these two species. These studies, which were based on three hybrids (one female and two males), showed that either species could be the mother or father in these hybridizations. The two male hybrids had rudimentary testes, whereas the female hybrid was in her second pregnancy. This suggests that the blue and fin whales may be close to the limit for permissible species hybridization among mammals.

The current data set has allowed examination of the coherence between the molecular results and two prevalent morphological hypotheses related to cetacean evolution. The first hypothesis, which in essence originates from Van Valen (1966, 1968), postulates that monophyletic Artiodactyla and monophyletic Cetacea evolved separately from the extinct Palaeocene group Mesonychia. This hypothesis was recently reinforced in a morphological study (Thewissen et al., 2001) that included mesonychians, two archaeocete taxa (Ambuloocetus and Pakicetus) and some extant and fossil artiodactyls. The study of Thewissen et al. (2001) showed a sister group relationship between monophyletic Artiodactyla and monophyletic Cetacea, with Mesonychia as the basal sister group of Artiodactyla/Cetacea, a conclusion consistent with the palaeontological age of Mesonychia relative to that of Artiodactyla and Cetacea. The second hypothesis favours a sister group relationship between Mesonychia and Cetacea with the Mesonychia/Cetacea clade as the sister group of monophyletic Artiodactyla (O’Leary and Geisler, 1999; see also Gatesy and O’Leary, 2001).

Although the position of Mesonychia differs in the two morphological hypotheses, both correspond to a sister group relationship between Cetacea and monophyletic Artiodactyla among extant cetartiodactyls. Thus, both hypotheses can be tested against the current data set. The result of such a test has been included in Table 1, topology (m)(not shown). As evident, both these morphological hypotheses are incongruent with the mitogenomic findings.

Morphological studies have not provided an answer to the question whether mysticetes and odontocetes had separate origins among the archaeocetes (Fordyce and de Muizon, 2001). However, the long common cetacean branch and the short branches separating the five extant cetacean lineages strongly suggest an origin of modern cetaceans from the same archaeocete group (probably the Dorudontidae).

The limbs of Ambulocetus constitute somewhat of an evolutionary enigma. As evident in Thewissen et al.’s (1994) paper, Ambulocetus has very large hind limbs compared to its forelimbs, a difference that is less pronounced in later silhouette drawings of the animal. It is nevertheless evident that evolution from the powerful hindlimbs of Ambulocetus to their rudimentation in archaeocetes constitutes a remarkable morphological reversal if Ambulocetus is connected to the cetacean branch after the separation of the hippopotamid and cetacean lineages.

For natural reasons, systematic schemes have traditionally been based on external morphological characteristics. The rates of morphological and molecular evolution are rarely (if ever) strictly correlated, however, and this may give rise to inconsistency between traditional systematics and molecular findings. The emerging consensus that the order Cetacea resides within another traditional order, Artiodactyla, makes apparent the incongruity in cetartiodactyl nomenclature (Graur and Higgins, 1994). In this instance, a possible solution for maintaining reasonable consistency between nomenclature and phylogeny would be to recognize Cetartiodactyla as an order with three suborders: Suina, Tylopoda and Cetruminantia. According to such a scheme, Cetacea would (together with the Hippopotamidae) constitute a parvorder within the infraorder Cetancodonta.

Cytochrome b and Bayesian inference of whale phylogeny

Laura May-Collado, Ingi Agnarsson
Molecular Phylogenetics and Evolution 38 (2006) 344–354
http://dx.doi.org//10.1016/j.ympev.2005.09.019

In the mid 1990s cytochrome b and other mitochondrial DNA data reinvigorated cetacean phylogenetics by proposing many novel

and provocative hypotheses of cetacean relationships. These results sparked a revision and reanalysis of morphological datasets, and the collection of new nuclear DNA data from numerous loci. Some of the most controversial mitochondrial hypotheses have now become benchmark clades, corroborated with nuclear DNA and morphological data; others have been resolved in favor of more traditional views. That major conflicts in cetacean phylogeny are disappearing is encouraging. However, most recent papers aim specifically to resolve higher-level conflicts by adding characters, at the cost of densely sampling taxa to resolve lower-level relationships. No molecular study to date has included more than 33 cetaceans. More detailed molecular phylogenies will provide better tools for evolutionary studies. Until more genes are available for a high number of taxa, can we rely on readily available single gene mitochondrial data? Here, we estimate the phylogeny of 66 cetacean taxa and 24 outgroups based on Cytb sequences. We judge the reliability of our phylogeny based on the recovery of several deep-level benchmark clades. A Bayesian phylogenetic analysis recovered all benchmark clades and for the Wrst time supported Odontoceti monophyly based exclusively on analysis of a single mitochondrial gene. The results recover the monophyly, with the exception of only one taxa within Cetacea, and the most recently proposed super- and subfamilies. In contrast, parsimony never recovered all benchmark clades and was sensitive to a priori weighting decisions. These results provide the most detailed phylogeny of Cetacea to date and highlight the utility of both Bayesian methodology in general, and of Cytb in cetacean phylogenetics. They furthermore suggest that dense taxon sampling, like dense character sampling, can overcome problems in phylogenetic reconstruction.

Some long standing debates are all but resolved: our understanding of deeper level cetacean phylogeny has grown strong. However, the strong focus of most recent studies, aiming specifically to resolve these higher level conflicts by adding mostly characters rather than taxa, has left our understanding of lower level relationships among whale species lagging behind. Mitogenomic data, for example, is available only for 16 cetacean species, and no molecular study to date has included more than 33 cetaceans. It seems timely to focus on more detailed (genus, and species level) molecular phylogenies. These will provide better tools for detailed evolutionary studies, and are necessary to test existing morphological phylogenetic hypotheses, and current cetacean classification.

We judge the reliability of our phylogeny based on the recovery of the previously mentioned benchmark clades, in addition to the less controversial clades Perissodactyla, Euungulata (sensu Waddell et al., 2001; Perissodactyla+ Cetartiodactyla), Cetacea, and Mysticeti. Because Cytb is thought to be most reliable at lower taxonomic levels (due to high substitution rates), recovering ‘known’ deeper clades gives credibility to these new findings which have not been addressed by studies using few taxa. We compare the performance of Bayesian analyses versus parsimony under four different models, and briefly examine the sensitivity of the results to taxon sampling. We use our results to discuss agreement and remaining conflict in cetacean phylogenetics, and provide comments on current classification.

The Bayesian analysis recovered all seven benchmark clades. Support for five of the benchmark clades is high (100 posterior probabilities) but rather low for Cetancodonta (79) and marginal for the monophyly of Odontoceti. The analysis also recovered all but one family level, and most sub- and superfamily level cetacean taxa. The results broadly corroborate current cetacean classiffcation, while also pointing to some lower-level groups that may need redefinition.

Many recent cetacean phylogenetic studies include relatively few taxa, in part due to a focus on generating more characters to resolve higher level phylogenetics. While addressing crucial questions and providing the backbone for lower level phylogenies, such studies have limited utility for classification, and for comparative evolutionary studies. In some cases sparse taxon sampling may also confound the results. Of course, taxon sampling is usually simply constrained by the availability of character data, but for some reason many studies have opted to include only one, or a few outgroup taxa, even if many are available.

We find that as long as outgroup taxon sampling was extensive, Bayesian analyses of Cytb recovered all the a priori identified benchmark clades. When only a few outgroups were chosen, however, the Bayesian analysis negated Odontoceti monophyly, as have many previous parsimony analyses of mitochondrial DNA. Furthermore, in almost every detailed comparison possible our results mirror the findings O’Leary et al. (2004), the most ‘character-complete’ (but including relatively few cetacean taxa) analysis to date (37,000 characters from morphology, SINE, and 51 gene fragments). This result gives credibility to our findings, including previously untested lower level clades.

  • Monophyly and placement of Mysticeti (baleen whales).
  • Monophyly of Odontoceti (toothed whales)
  • Delphinoids
  • River Dolphins
  • Beaked and sperm whales

A major goal of phylogenetics is a phylogeny of life (i.e., many taxa), based on multiple lines of evidence (many characters of many types). However, when phylogenies based on relatively few characters can be judged reliable based on external evidence (taxonomic congruence with other phylogenies using many characters, but few taxa), they seem like very promising and useful ‘first guess’ hypotheses. The evolution of sexual dimorphism, echolocation, social behavior, and whistles and other communicative signals, and major ecological shifts (e.g., transition to fresh water) are among the numerous interesting questions in cetacean biology that this phylogeny can help answer.

Deep-diving sea lions exhibit extreme bradycardia in long duration dives

Birgitte I. McDonald1, and Paul J. Ponganis
The Journal of Experimental Biology (2014) 217, 1525-1534 http://dx.doi.org:/10.1242/jeb.098558

Heart rate and peripheral blood flow distribution are the primary determinants of the rate and pattern of oxygen store utilization and ultimately breath-hold duration in marine endotherms. Despite this, little is known about how otariids (sea lions and fur seals) regulate heart rate (fH) while diving. We investigated dive fH in five adult female California sea lions (Zalophus californianus) during foraging trips by instrumenting them with digital electrocardiogram (ECG) loggers and time depth recorders. In all dives, dive fH (number of beats/duration; 50±9 beats min−1) decreased compared with surface rates (113±5 beats min−1), with all dives exhibiting an instantaneous fH below resting (<54 beats min−1) at some point during the dive. Both dive fH and minimum instantaneous fH significantly decreased with increasing dive duration. Typical instantaneous fH profiles of deep dives (>100 m) consisted of:

(1) an initial rapid decline in fH resulting in the lowest instantaneous fH of the dive at the end of descent, often below 10 beats min−1 in dives longer than 6 min in duration;
(2) a slight increase in fH to ~10–40 beats min−1 during the bottom portion of the dive; and
(3) a gradual increase in fH during ascent with a rapid increase prior to surfacing.

Thus, fH regulation in deep-diving sea lions is not simply a progressive bradycardia. Extreme bradycardia and the presumed associated reductions in pulmonary and peripheral blood flow during late descent of deep dives should

(a) contribute to preservation of the lung oxygen store,
(b) increase dependence of muscle on the myoglobin-bound oxygen store,
(c) conserve the blood oxygen store and
(d) help limit the absorption of nitrogen at depth.

This fH profile during deep dives of sea lions may be characteristic of deep-diving marine endotherms that dive on inspiration as similar fH profiles have been recently documented in the emperor penguin, another deep diver that dives on inspiration.

The resting ƒH measured in this study (54±6 beats min−1) was lower than predicted for an animal of similar size (~80 beats min−1 for an 80 kg mammal). In part, this may be due to the fact that the sea lions were probably sleeping. The resting ƒH in our study was also lower than previous measurements in captive juvenile California sea lions (87±17 beats min−1, average mass 30 kg)  and wild Antarctic fur seals (78±5 beats min−1, body mass 30–50 kg). However, we found a significant negative relationship between mass and resting ƒH even with our small sample size of five sea lions (resting ƒH = –0.58 Mb +100.26, r2=0.81, F1,3=12.37, P=0.039). For a 30 kg sea lion, this equation predicts a resting ƒH of 83 beats min−1, which is similar to what was measured previously in juvenile sea lions, suggesting this equation may be useful in estimating resting ƒH in sea lions.

The sea lions exhibited a distinct sinus arrhythmia fluctuating between a minimum of 42±9 and a maximum of 87±12 beats min−1, comparable to the sinus arrhythmias described in other diving birds and mammals, including sea lions. The minimum instantaneous ƒH during the sinus arrhythmia was similar to the mean minimum ƒH in dives less than 3 min (37±7 beats min−1), indicating that in dives less than 3 min (estimated cADL), ƒH only decreased to levels observed during exhalation at rest. This is consistent with observations in emperor penguins and elephant seals, where it was proposed that in dives shorter than the aerobic dive limit (ADL) the reduction in ƒH is regulated by a mechanism of cardiorespiratory control similar to that governing the respiratory sinus arrhythmia, with a further reduction only occurring in dives longer than the ADL.

Fig. 3. (not shown) Instantaneous fH and dive depth profiles of a California sea lion (CSL12_2). Data are from (A) a short, shallow dive (1.3 min, 45 m), (B) a mid-duration dive (4.8 min, 239 m) and (C) a long-duration dive (8.5 min, 305 m). Minimum instantaneous fH reached 37 beats min−1 in the short dive
(A) 19 beats min−1 in the mid-duration dive
(B) and 7 beats min−1 in the long duration dive
(C) Prominent features typical of mid- and long-duration dives include

  • a surface interval tachycardia (pre- and post-dive);
  • a steady rapid decrease in fH during initial descent;
  • a gradual decline in fH towards the end of descent with the lowest fH of the dive at the end of descent;
  • a slight increase and sometimes variable fH during the bottom portion of the dive; and
  • a slow increase in fH during ascent,
  • often ending in a rapid increase just before surfacing.

We obtained the first diving ƒH data from wild sea lions on natural foraging trips, demonstrating how they regulate ƒH over a range of dive durations. Sea lions always decreased dive ƒH from surface ƒH values; however, individual sea lions exhibited different dive ƒH, accounting for a significant amount of the variation in the relationship between dive duration and ƒH (intra-individual correlation: 75–81%)). The individual differences in dive ƒH exhibited in this study suggest that different dive capacities of individual sea lions may partially account for the range of dive strategies exhibited in a previous study (Villegas-Amtmann et al., 2011). Despite the individual differences in ƒH, the pattern of the dive ƒH response was similar in all the sea lions. As predicted, sea lions only consistently displayed a true bradycardia on mid- to long- duration dives (>4 min) (Fig. 5A). Additionally, as seen in freely diving phocids, dive ƒH and minimum ƒH were negatively related to dive duration, with the longest duration dives having the lowest dive ƒH and displaying the most intense bradycardia, often below 10 beats min−1 (Fig. 5A,B).

Profiles of mean fH at 10 s intervals of dives

Profiles of mean fH at 10 s intervals of dives

Fig 4.  Profiles of mean fH at 10 s intervals of dives for (A) six duration categories and (B) five depth categories. Standard error bars are shown. Data were pooled from 461 dives performed by five sea lions. The number of dives in each category and the number of sea lions performing the dives in each category are provided in the keys.

The mild bradycardia and the dive ƒH profiles observed in the shorter duration dives (<3 min) were similar to those observed in trained juvenile California sea lions and adult Stellar sea lions, but much more intense than ƒH observed in freely diving Antarctic fur seals. Surprisingly, although dive ƒH of trained Steller sea lions was similar, Steller sea lions regularly exhibited lower minimum ƒH, with minimum ƒH almost always less than 20 beats min−1 in dives less than 2 min in duration. In the wild, California sea lions rarely exhibited a minimum ƒH less than 20 beats min−1 in similar duration dives (Fig. 5B), suggesting greater blood oxygen transport during these natural short-duration dives.

Fig. 5. (not shown)  fH decreases with increasing dive duration. Dive duration versus (A) dive fH (total number of beats/dive duration), (B) minimum instantaneous fH and (C) bottom fH (total beats at bottom of dive/bottom time) for California sea lions (461 dives from five sea lions).

Although California sea lions are not usually considered exceptional divers, they exhibited extreme bradycardia, comparable to that of the best diving phocids, during their deep dives. In dives greater than 6 min in duration, minimum ƒH was usually less than 10 beats min−1 and sometimes as low as 6 beats mins−1 (Fig. 5B), which is similar to extreme divers such as emperor penguins (3 beats min−1), elephant seals (3 beats min−1), grey seals (2 beats min−1) and Weddell seals (<10 beats min−1), and even as low as what was observed in forced submersion studies. Thus, similar to phocids, the extreme bradycardia exhibited during forced submersions is also a routine component of the sea lion’s physiological repertoire, allowing them to perform long-duration dives.

While the degree of bradycardia observed in long dives of California sea lions was similar to the extreme bradycardia observed in phocids, the ƒH profiles were quite different. In general, phocid ƒH decreases abruptly upon submergence. The intensity of the initial phocid bradycardia either remains relatively stable or intensifies as the dive progresses, and does not start to increase until the seal begins its ascent. In contrast, the ƒH profiles of sea lions were more complex, showing a more gradual decrease during descent, with the minimum ƒH of the dive usually towards the end of descent (Figs 3, 6). There was often a slight increase in ƒH during the bottom portion of the dive, and as soon as the sea lions started to ascend, the ƒH slowly started to increase, often becoming irregular during the middle of ascent, before increasing rapidly as the sea lion approached the surface.

Fig. 6. (not shown) Instantaneous fH and dive depth profiles of the longest dive (10.0 min, 385 m) from a California sea lion (CSL12_1). During this dive, instantaneous fH reached 7 beats min−1 and was less than 20 beats min−1 for over 5.5 min. Post-dive fH was high in the first 0.5–1 min after surfacing, but then declined to ~100 beats min−1 towards the end of the surface interval.

Implications for pulmonary gas exchange

The moderate dive ƒH in short, shallow dives compared with the much slower ƒH of deep long-duration dives suggests more pulmonary blood flow and greater potential for reliance on lung O2. Most of these dives were to depths of less than 100 m (well below the estimated depth of lung collapse near 200 m), so maintenance of a moderate ƒH during these dives may allow sea lions to maximise use of the potentially significant lung O2 stores (~16% of total body O2 stores) throughout the dive. This is supported by venous blood O2 profiles, where, occasionally, there was no decrease in venous blood O2 between the beginning and end of the dive; this can only occur if pulmonary gas exchange continues throughout the dive. Greater utilization of the lung O2 store in sea lions is consistent with higher dive ƒH in other species that both dive on inspiration and typically perform shallow dives (dolphins, porpoises, some penguin species), and in deeper diving species when they perform shallow dives (emperor penguins).

In deeper dives of sea lions, although ƒH was lower and bradycardia more extreme, the diving ƒH profiles suggest that pulmonary gas exchange is also important. In long-duration dives, even though ƒH started to decrease upon or shortly after submergence, the decrease was not as abrupt as in phocids. Additionally, in long deep dives, despite having overall low dive ƒH, there were more heart beats before resting ƒH was reached compared with short, shallow dives. In dives less than 3 min in duration, there were ~10–15 beats until instantaneous ƒH reached resting values. In longer duration dives (>3 min), there were usually ~30–40 beats before instantaneous ƒH reached resting values. We suggest the greater number of heart beats early in these deeper dives enables more gas exchange and blood O2 uptake at shallow depths, thus allowing utilisation of the postulated larger respiratory O2 stores in deeper dives The less abrupt decline in ƒH we observed in sea lions is similar to the more gradual declines documented in emperor penguins and porpoises, where it has also been proposed that the gradual decrease in ƒH allows them to maximise pulmonary gas exchange at shallower depths. However, as sea lions swam deeper, ƒH decreased further (Figs 3, 6), and by 200 m depth (the approximate depth of lung collapse, instantaneous ƒH was 14 beats min−1. Such an extreme decline in ƒH in conjunction with increased pulmonary shunting due to lung compression at greater depths will result in minimization of both O2 and N2 uptake by blood, even before the depth of full lung collapse (100% pulmonary shunt) is reached.

Implications for blood flow

ƒH is often used as a proxy to estimate blood flow and perfusion during diving because of the relative ease of its measurement. This is based on the assumption that stroke volume does not change during diving in sea lions, and, hence, changes in ƒH directly reflect changes in cardiac output. As breath-hold divers maintain arterial pressure while diving, changes in cardiac output should be associated with changes in peripheral vascular resistance and changes in blood flow to tissues. In Weddell seals, a decrease in cardiac output of ~85% during forced submersions resulted in an 80–100% decrease in tissue perfusion in all tissues excluding the brain, adrenal glands and lung. Sea lions exhibited extremely low instantaneous ƒH values that often remained low for significant portions of the dive (Figs 4, 6), suggesting severe decreases in tissue perfusion in dives greater than 5 min in duration. In almost all dives greater than 6 min in duration, instantaneous ƒH reached 10 beats min−1, and stayed below 20 beats min−1 for more than a minute. At a ƒH of 20 beats min−1, cardiac output will be ~36% of resting cardiac output and only about 18% of average surface cardiac output. At these levels of cardiac suppression, most of this flow should be directed towards the brain and heart.

Conclusions

We successfully obtained diving ƒH profiles from a deep-diving otariid during natural foraging trips. We found that

(1) ƒH decreases during all dives, but true and more intense bradycardia only occurred in longer duration dives and
(2) in the longest duration dives, ƒH and presumed cardiac output were as low as 20% of resting values.

We conclude that, although initial high ƒH promotes gas exchange early in deep dives, the extremely low ƒH in late descent of deep dives (a) preserves lung O2, (b) conserves blood O2, (c) increases the dependence of muscle on myoglobin-bound O2 and (d) limits N2 absorption at depth. This ƒH profile, especially during the late descent/early bottom phase of deep dives is similar to that of deep-diving emperor penguins, and may be characteristic of deep diving endotherms that dive on inspiration.

Dive duration was the fixed effect in all models, and to account for the lack of independence caused by having many dives from the same individual, individual (sea lion ID) was included as a random effect. Covariance and random effect structures of the full models were evaluated using Akaike’s information criterion (AIC) and examination of residual plots. AICs from all the tested models are presented with the best model in bold.

Additionally, dives were classified as short-duration (less than 3 min, minimum cADL), mid-duration (3–5 min, range of cADLs) or long-duration (>5 min) dives. Differences in pre-dive ƒH, dive ƒH, minimum ƒH, post-dive ƒH, and heart beats to resting between the categories were investigated using mixed effects ANOVA, followed by post hoc Tukey tests. In all models, dive duration category was the fixed effect and individual (sea lion ID) was included as a random effect. Model fit was accessed by examination of the residuals. All means are expressed ±s.d. and results of the Tukey tests were considered significant at P<0.05. Statistical analysis was performed in R.

Investigating Annual Diving Behaviour by Hooded Seals (Cystophora cristata) within the Northwest Atlantic Ocean

Julie M. Andersen, Mette Skern-Mauritzen, Lars Boehme
PLoS ONE 8(11): e80438. http://dx.doi.org:/10.1371/journal.pone.0080438

With the exception of relatively brief periods when they reproduce and molt, hooded seals, Cystophora cristata, spend most of the year in the open ocean where they undergo feeding migrations to either recover or prepare for the next fasting period. Valuable insights into habitat use and diving behavior during these periods have been obtained by attaching Satellite Relay Data Loggers (SRDLs) to 51 Northwest (NW) Atlantic hooded seals (33 females and 18 males) during icebound fasting periods (200422008). Using General Additive Models (GAMs) we describe habitat use in terms of First Passage Time (FPT) and analyze how bathymetry, seasonality and FPT influence the hooded seals’ diving behavior described by maximum dive depth, dive duration and surface duration. Adult NW Atlantic hooded seals exhibit a change in diving activity in areas where they spend .20 h by increasing maximum dive depth, dive duration and surface duration, indicating a restricted search behavior. We found that male and female hooded seals are spatially segregated and that diving behavior varies between sexes in relation to habitat properties and seasonality. Migration periods are described by increased dive duration for both sexes with a peak in May, October and January. Males demonstrated an increase in dive depth and dive duration towards May (post-breeding/pre-molt) and August–October (post-molt/pre-breeding) but did not show any pronounced increase in surface duration. Females dived deepest and had the highest surface duration between December and January (post-molt/pre-breeding). Our results suggest that the smaller females may have a greater need to recover from dives than that of the larger males. Horizontal segregation could have evolved as a result of a resource partitioning strategy to avoid sexual competition or that the energy requirements of males and females are different due to different energy expenditure during fasting periods.

Novel locomotor muscle design in extreme deep-diving whales

P. Velten, R. M. Dillaman, S. T. Kinsey, W. A. McLellan and D. A. Pabst
The Journal of Experimental Biology 216, 1862-1871
http://dx.doi.org:/10.1242/jeb.081323

Most marine mammals are hypothesized to routinely dive within their aerobic dive limit (ADL). Mammals that regularly perform deep, long-duration dives have locomotor muscles with elevated myoglobin concentrations that are composed of predominantly large, slow-twitch (Type I) fibers with low mitochondrial volume densities (Vmt). These features contribute to extending ADL by increasing oxygen stores and decreasing metabolic rate. Recent tagging studies, however, have challenged the view that two groups of extreme deep-diving cetaceans dive within their ADLs. Beaked whales (including Ziphius cavirostris and Mesoplodon densirostris) routinely perform the deepest and longest average dives of any air-breathing vertebrate, and short-finned pilot whales (Globicephala macrorhynchus) perform high-speed sprints at depth. We investigated the locomotor muscle morphology and estimated total body oxygen stores of several species within these two groups of cetaceans to determine whether they

(1) shared muscle design features with other deep divers and
(2) performed dives within their calculated ADLs.

Muscle of both cetaceans displayed high myoglobin concentrations and large fibers, as predicted, but novel fiber profiles for diving mammals. Beaked whales possessed a sprinterʼs fiber-type profile, composed of ~80% fast-twitch (Type II) fibers with low Vmt. Approximately one-third of the muscle fibers of short-finned pilot whales were slow-twitch, oxidative, glycolytic fibers, a rare fiber type for any mammal. The muscle morphology of beaked whales likely decreases the energetic cost of diving, while that of short-finned pilot whales supports high activity events. Calculated ADLs indicate that, at low metabolic rates, both beaked and short-finned pilot whales carry sufficient onboard oxygen to aerobically support their dives.

Serial cross-sections of the m. longissimus dorsi of Mesoplodon densirostris

Serial cross-sections of the m. longissimus dorsi of Mesoplodon densirostris

Fig. Serial cross-sections of the m. longissimus dorsi of Mesoplodon densirostris (A–D) and Globicephala macrorhynchus (E–H). Scale bars, 50μm. Muscle sections stained for the alkaline (A,E) and acidic (B,F) preincubations of myosin ATPase were used to distinguish Type I and II fibers. Muscle sections stained for succinate dehydrogenase (C,G) and α-glycerophosphate dehydrogenase (D,H) were used to distinguish glycolytic (gl), oxidative (o) and intermediate (i) fibers.

Previous studies of the locomotor muscles of deep-diving marine mammals have demonstrated that these species share a suite of adaptations that increase onboard oxygen stores while slowing the rate at which these stores are utilized, thus extending ADL. Their locomotor muscles display elevated myoglobin concentrations and are composed predominantly of large Type I fibers. Vmt are also lower in deep divers than in shallow divers or athletic terrestrial species. The results of this study indicate that beaked whales and short-finned pilot whales do not uniformly display these characteristics and that each possesses a novel fiber profile compared with those of other deep divers.

The phylogeny of Cetartiodactyla: The importance of dense taxon sampling, missing data, and the remarkable promise of cytochrome b to provide reliable species-level phylogenies

Ingi Agnarsson, Laura J. May-Collado
Molecular Phylogenetics and Evolution 48 (2008) 964–985
http://dx.doi.org:/10.1016/j.ympev.2008.05.046

We perform Bayesian phylogenetic analyses on cytochrome b sequences from 264 of the 290 extant cetartiodactyl mammals (whales plus even-toed ungulates) and two recently extinct species, the ‘Mouse Goat’ and the ‘Irish Elk’. Previous primary analyses have included only a small portion of the species diversity within Cetartiodactyla, while a complete supertree analysis lacks resolution and branch lengths limiting its utility for comparative studies. The benefits of using a single-gene approach include rapid phylogenetic estimates for a large number of species. However, single-gene phylogenies often differ dramatically from studies involving multiple datasets suggesting that they often are unreliable. However, based on recovery of benchmark clades—clades supported in prior studies based on multiple independent datasets—and recovery of undisputed traditional taxonomic groups, Cytb performs extraordinarily well in resolving cetartiodactyl phylogeny when taxon sampling is dense. Missing data, however, (taxa with partial sequences) can compromise phylogenetic accuracy, suggesting a tradeoff between the benefits of adding taxa and introducing question marks. In the full data, a few species with a short sequences appear misplaced, however, sequence length alone seems a poor predictor of this phenomenon as other taxa.

The mammalian superorder Cetartiodactyla (whales and eventoed ungulates) contains nearly 300 species including many of immense commercial importance (cow, pig, and sheep) and of conservation interest and aesthetic value (antelopes, deer, giraffe, dolphins, and whales) (MacDonald, 2006). Certain members of this superorder count among the best studied organisms on earth, whether speaking morphologically, behaviorally, physiologically or genetically. Understanding the interrelationships among cetartiodactyl species, therefore, is of obvious importance with equally short sequences were not conspicuously misplaced. Although we recommend awaiting a better supported phylogeny based on more character data to reconsider classification and taxonomy within Cetartiodactyla, the new phylogenetic hypotheses provided here represent the currently best available tool for comparative species-level studies within this group. Cytb has been sequenced for a large percentage of mammals and appears to be a reliable phylogenetic marker as long as taxon sampling is dense. Therefore, an opportunity exists now to reconstruct detailed phylogenies of most of the major mammalian clades to rapidly provide much needed tools for species-level comparative studies.

Our results support the following relationship among the four major cetartiodactylan lineages (((Tylopoda ((Cetancodonta (Ruminantia + Suina))), with variable support. This arrangement has not been suggested previously, to our knowledge (see review in O’Leary and Gatesy, 2008 and discussion).

Relationships among clades within Cetancodonta are identical to those found by May-Collado and Agnarsson (2006).

Within Ruminantia all our analyzes suggest the following relationships among families: (((((Tragulidae((((Antilocapridae(((Giraffidae(( Cervidae(Moschidae + Bovidae))))) with relatively high support, supporting the subdivision of Ruminantia into Tragulina and Pecora.
In the rare cases where our results are inconsistent with benchmark clades, ad hoc explanations seem reasonable. The placement of M. meminna (Tragulidae) within Bovidae is likely an artifact of missing data, although remarkably it is the only conspicuous misplacement of a species across the whole phylogeny at the family level (while three species appear to be misplaced at the subfamily level within Cervidae in the full analysis, see Fig. 5a). This is supported by the fact that the placement of Moschiola receives low support, and the removal of Moschiola prior to analysis increases dramatically the support for clades close to where it nested (not shown, analysis available from authors), suggesting it had a tendency to ‘jump around’. Two other possibilities cannot be ruled out, however. One, that possibly the available sequence in Genbank may be mislabeled. And second, it should be kept in mind that the validity of Tragulidae has never been tested with molecular data including more than two species.

Oxygen and carbon dioxide fluctuations in burrows of subterranean blind mole rats indicate tolerance to hypoxic–hypercapnic stresses

Imad Shams, Aaron Avivi, Eviatar Nevo
Comparative Biochemistry and Physiology, Part A 142 (2005) 376 – 382
http://dx.doi.org:/10.1016/j.cbpa.2005.09.003

The composition of oxygen (O2), carbon dioxide (CO2), and soil humidity in the underground burrows from three species of the Israeli subterranean mole rat Spalax ehrenbergi superspecies were studied in their natural habitat. Two geographically close populations of each species from contrasting soil types were probed. Maximal CO2 levels (6.1%) and minimal O2 levels (7.2%) were recorded in northern Israel in the breeding mounds of S. carmeli in a flooded, poor drained field of heavy clay soil with very high volumetric water content. The patterns of gas fluctuations during the measurement period among the different Spalax species studied were similar. The more significant differentiation in gas levels was not among species, but between neighboring populations inhabiting heavy soils or light soils: O2 was lower and CO2 was higher in the heavy soils (clay and basaltic) compared to the relatively light soils (terra rossa and rendzina). The extreme values of gas concentration, which occurred during the rainy season, seemed to fluctuate with partial flooding of the tunnels, animal digging activity, and over-crowded breeding mounds inhabited by a nursing female and her offspring. The gas composition and soil water content in neighboring sites with different soil types indicated large differences in the levels of hypoxic–hypercapnic stress in different populations of the same species. A growing number of genes associated with hypoxic stress have been shown to exhibit structural and functional differences between the subterranean Spalax and the aboveground rat (Rattus norvegicus), probably reflecting the molecular adaptations that Spalax went through during 40 million years of evolution to survive efficiently in the severe fluctuations in gas composition in the underground habitat.

map of the studied sites

map of the studied sites

Schematic map of the studied sites: S. galili (2n =52): 1— Rehania (chalk); 2— Dalton (basaltic); S. golani (2n =54): 3— Majdal Shams (terra tossa); 4—Masa’ada (basaltic soils); S. carmeli (2n =58): 5— Al-Maker (heavy clay); 6— Muhraqa (terra rossa).

Comparison of gas composition (O2 and CO2) and water content between light and heavy soils inhabited by S. carmeli

Comparison of gas composition (O2 and CO2) and water content between light and heavy soils inhabited by S. carmeli

Comparison of gas composition (O2 and CO2) and water content between light and heavy soils inhabited by S. carmeli, Al-Maker (heavy soil) and Muhraqa (light soil). AverageTSD of measurements in the burrows of approximately 10 animals at a given date is presented. **p <0.01, T-test and Mann– Whitney test).

Subterranean mammals, which live in closed underground burrow systems, experience an atmosphere that is different from the atmosphere above-ground. Gas exchange between these two atmospheres depends on diffusion through the soil, which in turn, depends on soil particle size, water content, and burrow depth. Heavy soils (clay and basaltic), hold water and have little air space for gas diffusion. A large deviation from external gas composition is found in the burrows of Spalax living in these soil types. The maximal measured concentration of CO2 was 6.1% in Spalax breeding mounds, which is one of the highest concentrations among studied mammals in natural conditions. At the same time 7.2% O2 was measured in water saturated heavy clay soil

seasonal variation from August to March in mean O2, CO2, and soil water content

seasonal variation from August to March in mean O2, CO2, and soil water content

Example of seasonal variation from August to March in mean O2, CO2, and soil water content (VWC) in the Al-Maker population (2n =58, heavy soil). Values are presented as mean TSD.

In this study new data were presented for a wild mammal that survives in an extreme hypoxic–hypercapnic environment. Interestingly, the very low concentrations of O2 experienced by Spalax are correlated with the expression pattern of hypoxia related genes.  So far, we have shown higher and longer-term mRNA expression of erythropoietin, the main factor that regulates the level of circulating red blood cells, in subterranean Spalax compared to the above-ground rat in response to hypoxic stress, as well as differences in the response of erythropoietin to hypoxia in different populations of Spalax experiencing different hypoxic stress in nature. We also demonstrated that erythropoietin pattern of expression is different in Spalax than in Rattus throughout development, a pattern suggesting more efficient hypoxic tolerance in Spalax starting as early as in the embryonic stages. Furthermore, vascular endothelial growth factor (VEGF), which is a critical angiogenic factor that responds to hypoxia, is constitutively expressed at maximal levels in Spalax muscles, the most energy consuming tissue during digging. This level is 1.6-fold higher than in Rattus muscles and is correlated with significantly higher blood vessel concentration in the Spalax muscles compared to the Rattus muscles. Likewise, myoglobin the globin involved in oxygen homeostasis in skeletal muscles, exhibits different expression pattern under normoxia and in response to hypoxia in Spalax muscles compared to rat muscles as well as between different populations of Spalax exposed to different hypoxic stress in nature (unpublished results). Similarly, neuroglobin, a brain-specific globin involved in reversible oxygen binding, i.e., presumably in cellular homeostasis, is expressed differently in the Spalax brain compared to Rattus brain. Like erythropoietin and myoglobin also neuroglobin is expressed differently in Spalax populations experiencing different oxygen supply (unpublished results). Furthermore, Spalax p53 harbors two amino acid substitutions in its binding domain, which are identical to mutations found in p53 of human cancer cells. These substitutions endow Spalax p53 with several-fold higher activation of cell arrest and DNA repair genes compared to human p53 and favor activation of DNA repair genes over apoptotic genes. The study of specific tumoral variants indicates that such preference of growth arrest over apoptosis possibly results as a response to the hypoxic environmental stress known in tumors. Differences in the structure of other molecules related to homeostasis, namely, hemoglobin, haptoglobin (Nevo, 1999), and cytoglobin (unpublished) were also observed in Spalax.

Stress, adaptation, and speciation in the evolution of the blind mole rat, Spalax, in Israel

Eviatar Nevo
Molecular Phylogenetics and Evolution 66 (2013) 515–525
http://dx.doi.org/10.1016/j.ympev.2012.09.008

Environmental stress played a major role in the evolution of the blind mole rat superspecies Spalax ehrenbergi, affecting its adaptive evolution and ecological speciation underground. Spalax is safeguarded all of its life underground from aboveground climatic fluctuations and predators. However, it encounters multiple stresses in its underground burrows including darkness, energetics, hypoxia, hypercapnia, food scarcity, and pathogenicity. Consequently, it evolved adaptive genomic, proteomic, and phenomic complexes to cope with those stresses. Here I describe some of these adaptive complexes, and their theoretical and applied perspectives. Spalax mosaic molecular and organismal evolution involves reductions or regressions coupled with expansions or progressions caused by evolutionary tinkering and natural genetic engineering. Speciation of Spalax in Israel occurred in the Pleistocene, during the last 2.00–2.35 Mya, generating four species associated intimately with four climatic regimes with increasing aridity stress southwards and eastwards representing an ecological speciational adaptive trend: (Spalax golani, 2n = 54?S. galili, 2n = 52?S. carmeli, 2n = 58?S. judaei, 2n = 60). Darwinian ecological speciation occurred gradually with relatively little genetic change by Robertsonian chromosomal and genic mutations. Spalax genome sequencing has just been completed. It involves multiple adaptive complexes to life underground and is an evolutionary model to a few hundred underground mammals. It involves great promise in the future for medicine, space flight, and deep-sea diving.

Stress is a major driving force of evolution (Parsons, 2005; Nevo, 2011). Parsons defined stress as the ‘‘environmental factor causing potential injurious changes to biological systems with a potential for impacts on evolutionary processes’’. The global climatic transition from the middle Eocene to the early Oligocene (45–35 Ma = Million years ago) led to extensive convergent evolution underground of small subterranean mammals across the planet (Nevo, 1999; Lacey et al., 2000; Bennett and Faulkes, 2000; Begall et al., 2007). The subterranean ecotope provided small mammals with shelter from predators and extreme aboveground climatic stressful fluctuations of temperature and humidity. However, they had to evolve genomic adaptive complexes for the immense underground stresses of darkness, energy for burrowing in solid soil, low productivity and food scarcity, hypoxia, hypercapnia, and high infectivity. These stresses have been described in Nevo (1999, 2011) and Nevo et al. (2001); and Nevo list of Spalax publication at http://evolution.haifa.ac.il with many cited references relevant to these stresses).

blind subterranean mole rat of the Spalax ehrenbergi superspecies

blind subterranean mole rat of the Spalax ehrenbergi superspecies

The blind subterranean mole rat of the Spalax ehrenbergi superspecies in Israel. An extreme example of adaptation to life underground

Circadian rhythm and genes

adaptive circadian genes. We identified the circadian rhythm of Spalax
(Nevo et al., 1982) and described, cloned, sequenced, and expressed several circadian genes in Spalax. These include Clock, MOP3, three Period (Per), and cryptochromes (Avivi et al., 2001, 2002, 2003). The Spalax circadian genes are differentially conserved, yet characterized by a significant number of amino acid substitutions. The glutamine-rich area of Clock, which is assumed to function in circadian rhythmicity, is expanded in Spalax compared with that of mice and humans and is different in amino acid composition from that of rats. All three Per genes of Spalax oscillate with a periodicity of 24 h in the suprachaismatic nucleus, eye, and Harderian gland and are expressed in peripheral organs. Per genes are involved in clock resetting. Spalax Per 3 is unique in mammals though its function is still unresolved. The Spalax Per genes contribute to the unique adaptive circadian rhythm to life underground. The cryptochrome (Cry) genes, found in animals and plants, act both as photoreceptors and as ingredients of the negative feedback mechanism of the biological Clock. The CRY 1 protein is significantly closer to the human homolog than to that of mice, as was also shown in parts of the immunogenetic system. Both Cry 1 and Cry 2 mRNAs were found in the SCN, eye, harderian gland, and in peripheral tissues. Remarkably, the distinctly hypertrophied harderian gland is central in Spalax’s unique underground circadian rhythmicity (Pevet et al., 1984).

  • Spalax eye mosaic evolution
  • Gene expression in the eye of Spalax
  • Brain evolution in Spalax to underground stresses
  • Spalax: four species in Israel

The morphological, physiological, and behavioral Spalax eye patterns are underlain by gene expression representing regressive and progressive associated transcripts. Regressive transcripts involve B-2 microglobulin, transketolase, four keratins, alpha enolase, and different heat shock proteins. Several proteins may be involved in eye degeneration. These include heat shock protein 90alpha (hsp90alpha), found also in the blind fish Astyanax mexicanus, two transcripts of programmed cell death proteins, oculospanin, and peripherin 2, both belonging to the Tetraspanin family, in which 60 different mutations cause eye degeneration in humans. Several progressive transcripts in the Spalax eye are found in the retina of many mammals involving gluthatione, peroxidase 4, B spectrin, and Ankyrin; the last two characterize rod cells in the retina. Some transcripts are involved in metabolic processing of retinal, a vertebrate key component in phototransduction, and a relative of vitamin A.

cross section of the developing eye of the mole rat

cross section of the developing eye of the mole rat

Light micrographs showing cross section of the developing eye of the mole rat Spalax ehrenbergi. (A) Optic cup and lens vesicle initially develop normally (x100). (B) Eye at a later embryonic stage. Note appearance of iris-ciliary body rudiment (arrows), and development of the lens nucleus (L). ON, optic nerve (x100). (C) Eye at a still later fetal stage. Note massive growth of the iris-ciliary body complex colobomatous opening (arrow) (x100). (D) Early postnatal stage. The iris-ciliary body complex completely fills the chamber. The lens is vascularized and vacuolated (x100). (E) Adult eye. Eyelids are completely closed and pupil is absent. Note atrophic appearance of the optic disc region (arrow) (x65). (F) Higher magnification of the adult retina. The different retinal layers are retained: PE, pigment epithelium: RE, receptor layer; ON, outer nuclear layer: IN, inner nuclear layer; GC, ganglion cell layer (x500) (from Sanyal et al., 1990, Fig. 1).

The brains of subterranean mammals underwent dramatic evolution in accordance with underground stresses for digging and photoperiodic perception associated with vibrational, tactile, vocal, olfactory, and magnetic communication systems replacing sight, as is seen in Spalax. The brain of Spalax is twice as large as that of the laboratory rat of the same body size. The somatosensory region in the isocortex of Spalax is 1.7 times, the thalamic nuclei 1.3 times, and the motor cortex 3.1 times larger than in the sighted laboratory rat Rattus norvegicus matched to body size.

The ecological stress determinant in Spalax brain evolution is highlighted by the four species of the Spalax ehrenbergi superspecies in Israel. They differentiated chromosomally (by means of Robertsonian mutations and fission), allopatrically, and clinally southwards into four species associated with different climatic regimes, following the gradient of increasing aridity stress and decreasing predictability southwards towards the desert: Spalax galili (2n = 52) ->S. golani (2n = 54)->S. carmeli (2n = 58)->S. judaei (2n = 60), and eastwards S. galili ->S. golani (2n = 52–>54) (Fig. 2). This chromosomal speciation trend southwards is associated with the regional aridity stress southwards (and eastwards) in Israel, budding new species adapted genomically, proteomically, and phenomically (i.e., in morphology, physiology, and behavior) to increasing stresses of higher solar radiation, temperature, and drought southwards (Nevo, 1999; Nevo et al., 2001; Nevo
list of Spalax at http://evolution.haifa.ac.il). A uniquely recent discovery of incipient sympatric ecological speciation at a microscale in Spalax triggered by local stresses occurs within Spalax galili.

retinal input to primary visual structures in Spalax

retinal input to primary visual structures in Spalax

Relative degree of retinal input to primary visual structures in Spalax, hamster, rat, and Spalacopus cyanus (South American Octodontidae, ‘‘coruro’’). These rodents are of similar body size (120–140 g). B. Relative degree of change in the proportions of retinal input to different primary visual structures in Spalax compared with measures obtained in other rodents. A relative progressive development in Spalax is seen in structures involved in photoperiodic and neuroendocrine functions (SCN, BNST).The main regressive feature is the drastic relative reduction of retinal input to the superior colliculus. The main regressive feature is the drastic reduction of retinal input to the superior colliculus. The relative size of other visual structures in Spalax is modified compared to that of the other species. c. Comparison of the absolute size (volume, mm3 x 10-4) of visual structures in Spalax and other rodents. The size of the SCN is equivalent in all species. The vLGN and dLGN are reduced by 87–93% in Spalax. The retino-recipient layers of the superior colliculus are reduced by 97%. Abbreviations: SCN: suprachiasmatic nucleus; BNST: bed nucleus of the stria terminalis; dLGN: dorsal lateral geniculate nucleus; SC: superior colliculus [From Cooper et al., 1993 (Fig 3)].

Subterranean life has a high energetic cost if an animal has to burrow in order to obtain its food. For a 150 g Thomomys bottae, burrowing 1 m may be 360–3400 times more expensive energetically than moving the same distance on the surface (Vleck, 1979). Mean rates of oxygen consumption during burrowing at 22 oC are from 2.8 to 7.1 times the RMR. Vleck developed a model examining the energetics of foraging by burrowing and found that, in the desert, Thomomys adjusts the burrow segment length to minimize the cost of burrowing. Since burrowing becomes less economic as body size increases, Vleck (1981) predicted that the maximum possible body size that a subterranean mammal can attain depends on a balance between habitat productivity and the cost of burrowing in local soils. Vleck’s cost of burrowing hypothesis has been verified in multiple cases. Heth (1989) demonstrated longer burrows in the rendzina soil and shorter ones in the terra rossa soil, associating lower productivity in the former for Spalax.

Food is a limiting factor for subterranean mammals. The abundance and distribution of food explain some of the ecological, physiological, and behavioral characteristics of subterranean mammals. In a field test of Spalax foraging strategy, we concluded that Spalax was a generalist due to the constraints of the subterranean ecotope. Restricted foraging time primarily during the winter when soil is wet, and the high energetic investment of tunneling to get to food items is significantly reduced than in summertime.
We also identified a decrease in the basic metabolic rate towards the desert, i.e., economizing energetics. The maintenance of adequate O2 transport in a subterranean mammal confronting hypoxia requires adaptation along the O2 transport system, achieved by increasing the flow of O2 in the convection systems (ventilation and perfusion) and by reduction of oxygen pressure (PO2) gradients at the diffusion barriers (lung blood, blood-tissue (Arieli, 1990). The PO2 gradient between blood capillaries and respiring mitochondria capillaries is large, and any adaptation at this level could be significant for O2 transport. Reduction of diffusion distance in a muscle can be achieved, like in Spalax, by increasing the number of capillaries that surround muscle fiber or by reducing fiber areas.

Geographic distribution in Israel of the four chromosomal species belonging to the S. ehrenbergi superspecies

Geographic distribution in Israel of the four chromosomal species belonging to the S. ehrenbergi superspecies

Geographic distribution in Israel of the four chromosomal species belonging to the S. ehrenbergi superspecies that are separated by narrow hybrid zones (2n = 52, 54, 58, and 60, now named as S. galili, S. golani, S. carmeli, and S. judaei, respectively; see Nevo et al., 2001).

Spalacid evolution, based on mtDNA, is driven by climatic oscillations and stresses. The underground ecotope provided subterranean mammals with shelter from extreme climate (temperature and humidity) fluctuations, and predators. However, they had to extensively and intensively adapt to the multiple underground stresses (darkness, energetic, low productivity and
food scarcity, hypoxia, hypercapnia, and high infectivity). All subterranean mammals, including spalacids as an extreme case, share convergent molecular and organismal adaptations to their shared unique underground ecotope. Evolution underground, as exemplified here in spalacids, led to mosaic molecular and organismal evolutionary syndromes to cope with multiple stresses.

Speciation involves all rates – from gradual to rapid. Subterranean mammals, with the spalacid example discussed above, provide uniquely rich evolutionary global tests of speciation and adaptation, convergence, regression, progression, and mosaic evolutionary processes. Adaptation and speciation underground was one of the most dramatic natural experiments verifying Darwinian evolution.

The Spalax genome sequencing has just been completed. It is being analyzed and will soon be published in 2012. This will be a milestone in understanding how numerous mammals across the globe, who found underground shelter from climatic fluctuations and stresses above ground, cope with the new suite of stresses they encountered underground, demanding a new engineering overhaul on all organizational levels, selecting for adaptive complexes to cope with the new underground stresses. The main current and future challenges are to compare and contrast genome sequences and identify the genomic basis of adaptation and speciation.

This global Cenozoic experiment could answer the following open questions: How heterozygous is the whole genome? How prevalent are retrotransposons and what is their functional role? How many genes are involved in the Spalax genome and how are they regulated? What are the genic and regulatory networks resisting the multiple stresses underground? How much of the Spalax genome is conserved and how much is reorganized to cope with the underground stresses? How is the solitary blind mole rat, Spalax, different from the social naked mole rat Heterocephalus? How are the processes of reduction, expansion, and genetic tinkering and engineering reflected across the genome? How effective is copy number variation in regulation? Is there similarity in the transcriptomes of subterranean mammals? How could we harness the rich genome repertoire of Spalax to revolutionize medicine, especially in the realm of hypoxia tolerance and the related major diseases of the western world, e.g., cancer, stroke, and cardiovascular diseases? What is the phylogenetic origin of Spalax? How much of the Spalax genome represents its phylogenetic roots and how much of coding and noncoding genomic regions are shared with other subterranean mammals across the globe in adapting to life underground?

The Atmospheric Environment of the Fossorial Mole Rat (Spalax Ehrenbergi): Effects of Season, Soil Texture, Rain, Temperature and Activity

  1. Arieli
    Comp Biochen Physiol. 1978; 63A:569-5151. The fossorial mole rat (Spalax ehrenbergi) may inhabit heavy soil with low gas permeability.
  2. Air composition in burrows in heavy soil deviates from atmospheric air more than that of burrows in light soil.
  3. In winter and spring O2 and CO2 concentrations in breeding mounds were 16.5% O2 and 2.5-3x CO2 and the extreme values measured were 14.0% O2 and 4.8% Cot.
  4. Hypoxia and hypercapnia in the burrow develop shortly after rain and when ambient temperature drops.
  5. Composition of the burrows air is influenced by the solubility of CO2 in soil water and by faster penetration of oxygen than outflowing of CO2.

Hypo-osmotic stress-induced physiological and ion-osmoregulatory responses in European sea bass (Dicentrarchus labrax) are modulated differentially by nutritional status

Amit Kumar Sinha, AF Dasan, R Rasoloniriana, N Pipralia, R Blust, G De Boeck
Comparative Biochemistry and Physiology, Part A 181 (2015) 87–99
http://dx.doi.org/10.1016/j.cbpa.2014.11.024

We investigated the impact of nutritional status on the physiological, metabolic and ion-osmoregulatory performance of European sea bass (Dicentrarchus labrax)when acclimated to seawater (32 ppt), brackishwater (20 and 10 ppt) and hyposaline water (2.5 ppt) for 2 weeks. Following acclimation to different salinities, fish were either fed or fasted (unfed for 14 days). Plasma osmolality, [Na+], [Cl−] and muscle water contentwere severely altered in fasted fish acclimated to 10 and 2.5 ppt in comparison to normal seawater-acclimated fish, suggesting ion regulation and acid–base balance disturbances. In contrast to feed-deprived fish, fed fish were able to avoid osmotic perturbation more effectively. This was accompanied by an increase in Na+/K+-ATPase expression and activity, transitory activation of H+-ATPase (only at 2.5 ppt) and down-regulation of Na+/K+/2Cl− gene expression. Ammonia excretion rate was inhibited to a larger extent in fasted fish acclimated to low salinities while fed fish were able to excrete efficiently. Consequently, the build-up of ammonia in the plasma of fed fish was relatively lower. Energy stores, especially glycogen and lipid, dropped in the fasted fish at low salinities and progression towards the anaerobic metabolic pathway became evident by an increase in plasma lactate level. Overall, the results indicate no osmotic stress in both feeding treatments within the salinity range of 32 to 20 ppt. However, at lower salinities (10–2.5 ppt) feed deprivation tends to reduce physiological, metabolic, ion-osmo-regulatory and molecular compensatory mechanisms and thus limits the fish’s abilities to adapt to a hypo-osmotic environment.

The absence of ion-regulatory suppression in the gills of the aquatic air-breathing fish Trichogaster lalius during oxygen stress

Chun-Yen Huang, Hsueh-Hsi Lin, Cheng-Huang Lin, Hui-Chen Lin
Comparative Biochemistry and Physiology, Part A 179 (2015) 7–16
http://dx.doi.org/10.1016/j.cbpa.2014.08.017

The strategy for most teleost to survive in hypoxic or anoxic conditions is to conserve energy expenditure, which can be achieved by suppressing energy-consuming activities such as ion regulation. However, an air-breathing fish can cope with hypoxic stress using a similar adjustment or by enhancing gas exchange ability, both behaviorally and physiologically. This study examined Trichogaster lalius, an air-breathing fish without apparent gill modification, for their gill ion-regulatory abilities and glycogen utilization under a hypoxic  treatment. We recorded air-breathing frequency, branchial morphology, and the expression of ion-regulatory proteins (Na+/K+-ATPase and vacuolar-type H+-ATPase) in the 1st and 4th gills and labyrinth organ (LO), and the expression of glycogen utilization (GP, glycogen phosphorylase protein expression and glycogen content) and other protein responses (catalase, CAT; carbonic anhydrase II, CAII; heat shock protein 70, HSP70; hypoxia-inducible factor-1α, HIF-1α; proliferating cell nuclear antigen, PCNA; superoxidase dismutase, SOD) in the gills of T. lalius after 3 days in hypoxic and restricted conditions. No morphological modification of the 1st and 4th gills was observed. The air breathing behavior of the fish and CAII protein expression both increased under hypoxia. Ion-regulatory abilities were not suppressed in the hypoxic or restricted groups, but glycogen utilization was enhanced within the groups. The expression of HIF-1α, HSP70 and PCNA did not vary among the treatments. Regarding the antioxidant system, decreased CAT enzyme activity was observed among the groups. In conclusion, during hypoxic stress, T. lalius did not significantly reduce energy consumption but enhanced gas exchange ability and glycogen expenditure.

The combined effect of hypoxia and nutritional status on metabolic and ionoregulatory responses of common carp (Cyprinus carpio)

Sofie Moyson, HJ Liew, M Diricx, AK Sinha, R Blusta, G De Boeck
Comparative Biochemistry and Physiology, Part A 179 (2015) 133–143
http://dx.doi.org/10.1016/j.cbpa.2014.09.017

In the present study, the combined effects of hypoxia and nutritional status were examined in common carp (Cyprinus carpio), a relatively hypoxia tolerant cyprinid. Fish were either fed or fasted and were exposed to hypoxia (1.5–1.8mgO2 L−1) at or slightly above their critical oxygen concentration during 1, 3 or 7 days followed by a 7 day recovery period. Ventilation initially increased during hypoxia, but fasted fish had lower ventilation frequencies than fed fish. In fed fish, ventilation returned to control levels during hypoxia, while in fasted fish recovery only occurred after reoxygenation. Due to this, C. carpio managed, at least in part, to maintain aerobic metabolism during hypoxia: muscle and plasma lactate levels remained relatively stable although they tended to be higher in fed fish (despite higher ventilation rates). However, during recovery, compensatory responses differed greatly between both feeding regimes: plasma lactate in fed fish increased with a simultaneous breakdown of liver glycogen indicating increased energy use, while fasted fish seemed to economize energy and recycle decreasing plasma lactate levels into increasing liver glycogen levels. Protein was used under both feeding regimes during hypoxia and subsequent recovery: protein levels reduced mainly in liver for fed fish and in muscle for fasted fish. Overall, nutritional status had a greater impact on energy reserves than the lack of oxygen with a lower hepatosomatic index and lower glycogen stores in fasted fish. Fasted fish transiently increased Na+/K+-ATPase activity under hypoxia, but in general ionoregulatory balance proved to be only slightly disturbed, showing that sufficient energy was left for ion regulation.

The effect of temperature and body size on metabolic scope of activity in juvenile Atlantic cod Gadus morhua L.

Bjørn Tirsgaard, Jane W. Behrens, John F. Steffensen
Comparative Biochemistry and Physiology, Part A 179 (2015) 89–94
http://dx.doi.org/10.1016/j.cbpa.2014.09.033

Changes in ambient temperature affect the physiology and metabolism and thus the distribution of fish. In this study we used intermittent flow respirometry to determine the effect of temperature (2, 5, 10, 15 and 20 °C) and wet body mass (BM) (~30–460 g) on standard metabolic rate (SMR, mg O2 h−1), maximum metabolic rate (MMR, mg O2 h−1) and metabolic scope (MS, mg O2 h−1) of juvenile Atlantic cod. SMR increased with BM irrespectively of temperature, resulting in an average scaling exponent of 0.87 (0.82–0.92). Q10 values were 1.8–2.1 at temperatures between 5 and 15 °C but higher (2.6–4.3) between 2 and 5 °C and lower (1.6–1.4) between 15 and 20 °C in 200 and 450 g cod. MMR increased with temperature in the smallest cod (50 g) but in the larger cod MMR plateaued between 10, 15 and 20 °C. This resulted in a negative correlation between the optimal temperature for MS (Topt) and BM, Topt being respectively 14.5, 11.8 and 10.9 °C in a 50, 200 and 450 g cod. Irrespective of BM cold water temperatures resulted in a reduction (30–35%) of MS whereas the reduction of MS at warm temperatures was only evident for larger fish (200 and 450 g), caused by plateauing of MMR at 10 °C and above. Warm temperatures thus seem favorable for smaller (50 g) juvenile cod, but not for larger conspecifics (200 and 450 g).

Read Full Post »

Highlights of a Green Evolution

Reporter and Curator: Larry H Bernstein, MD, FCAP 


Chlorophyll

chlorophyll coloration to leaves

chlorophyll coloration to leaves

Paul May
School of Chemistry, University of Bristol
VRML, Jmol, and Chime versions

Chlorophyll is the molecule that absorbs sunlight and uses its energy to
synthesize carbohydrates from CO2 and water. This process is known as
photosynthesis. Animals and humans obtain their food supply by eating plants.

In 1780, the famous English chemist Joseph Priestley found that plants could “restore air which has been injured by the burning of candles.” He placed a mint
plant into a vessel of water for several days, then found that “the air would neither extinguish a candle, nor was it all inconvenient to a mouse which I put into it”.
He discovered that plants produce oxygen. Then, in 1794,  Antoine Lavoisier
discovered oxidation.  It fell to a Dutchman, Jan Ingenhousz,  to make the next
major contribution to the mechanism of photosynthesis.
Having heard of Priestley’s experiments, he  spent a summer near London doing
over 500 experiments, to discover that light plays a major role in photosynthesis.
He noted that plants not only have the faculty to correct bad air in six to ten days,
but they perform this in a few hours; owing to the influence of light of the sun
upon the plant.

Very soon after, more pieces of the puzzle were found by two chemists working
in Geneva. Jean Senebier, found that “fixed air” (CO2) was taken up during photosynthesis, and Theodore de Saussure discovered that the other reactant
necessary was water. The final contribution came from a German surgeon,
Julius Robert Mayer ,

Julius Robert Mayer

Julius Robert Mayer

who recognised that plants convert solar energy into chemical energy. He said:
“Nature has put itself the problem of how to catch in flight light streaming to
the Earth and to store the most elusive of all powers in rigid form. The plants
take in one form of power, light; and produce another power, chemical
difference.” The actual chemical equation which takes place is the reaction
between carbon dioxide and water, catalyzed by sunlight, to produce glucose
and a waste product, oxygen. The glucose sugar is either directly used as an
energy source by the plant for metabolism or growth, or is polymerized to form
starch, so it can be stored until needed. The waste oxygen is excreted into the
atmosphere, where it is made use of by plants and animals for respiration.

http://www.chm.bris.ac.uk/motm/chlorophyll/photosth.gif

Chlorophyll as a Photoreceptor

Chlorophyll is the molecule that traps this ‘most elusive of all powers’ – and is
called a photoreceptor. It is found in the chloroplasts of green plants,
and is what makes green plants, green. The basic structure of a chlorophyll
molecule is a porphyrin ring, co-ordinated to a central atom. This is very
similar in structure to the heme group found in hemoglobin, except that in
heme the central atom is iron, whereas in chlorophyll it is magnesium.

chphyll

http://www.chm.bris.ac.uk/motm/chlorophyll/chphyll.gif

Click for 3D structure file

Click for 3D structure file

There are actually 2 main types of chlorophyll, named a and b. They differ only
slightly, in the composition of a sidechain (in a it is – H3, in b it is CHO). Both of these
two chlorophylls are very effective photoreceptors because they contain a network of
alternating single and double bonds, and the orbitals can delocalize stabilizing the
structure. Such delocalised polyenes have very strong absorption bands in the visible
regions of the spectrum, allowing the plant to absorb the energy from sunlight.

chloroabs

http://www.chm.bris.ac.uk/motm/chlorophyll/chloroabs.gif

The different side groups in the 2 chlorophylls ‘tune’ the absorption spectrum to
slightly different wavelengths, so that light that is not significantly absorbed by
chlorophyll a, at, say, 460nm, will instead be captured by chlorophyll b, which
absorbs strongly at that wavelength. Thus these two kinds of chlorophyll
complement each other in absorbing sunlight. Plants can obtain all their energy
requirements from the blue and red parts of the spectrum, however, there is still
a large spectral region, between 500-600nm, where very little light is absorbed.

This light is in the green region of the spectrum, and since it is reflected, this
is the reason plants appear green. Chlorophyll absorbs so strongly that it can
mask other less intense colours. Some of these more delicate colours (from
molecules such as carotene and quercetin) are revealed when the chlorophyll
molecule decays in the Autumn, and the woodlands turn red, orange,and
golden brown. Chlorophyll can also be damaged when vegetation is cooked,
since the central Mg atom is replaced by hydrogen ions. This affects the energy
levels within the molecule, causing its absorbance spectrum to alter. Thus cooked
leaves change colour – often becoming a paler, insipid yellowy green.

As the chlorophyll in leaves decays in the autumn, the green colour fades and is
replaced by the oranges and reds of carotenoids.

Chlorophyll in Plants

The chlorophyll molecule is the active part that absorbs the sunlight, but just as with
hemoglobin, in order to do its job (synthesising carbohydrates) it needs to be attached
to the backbone of a very complicated protein. This protein may look haphazard in
design, but it has exactly the correct structure to orient the chlorophyll molecules in
the optimal position to enable them to react with nearby CO2 and H2O molecules in
a very efficient manner. Several chlorophyll molecules are lurking inside this bacterial
photoreceptor protein (right).

References:

Introduction to Organic Chemistry, Streitweiser and Heathcock (MacMillan, New York,
1981).

Biochemistry, L. Stryer (W.H. Freeman and Co, San Francisco, 1975).

Wikipedia – Chlorophyll

Chlorophyll (also chlorophyl) is a green pigment found in cyanobacteria and the
chloroplasts of algae and plants.  Its name is derived from the Greek words χλωρός,
chloros (“green”) and φύλλον, phyllon (“leaf”).  Chlorophyll is an extremely important
biomolecule, critical in photosynthesis, which allows plants to absorb energy from light. Chlorophyll absorbs light most strongly in the blue portion of the
electromagnetic spectrum, followed by the red portion. Conversely, it is a poor
absorber of green and near-green portions of the spectrum, hence the green
color of chlorophyll-containing tissues. chlorophyll was first isolated by
Joseph Bienaimé Caventou and Pierre Joseph Pelletier in 1817.

Absorption maxima of chlorophylls against the spectrum of white light

Chlorofilab.svg

Chlorophyll is found in high concentrations in chloroplasts of plant cells.

Clorofila_3
http://upload.wikimedia.org/wikipedia/commons/thumb/0/05/Clorofila_3.jpg/
120px-Clorofila_3.jpg

These chlorophyll maps show milligrams of chlorophyll per cubic meter of seawater
each month. Places where chlorophyll amounts were very low, indicating very low
numbers of phytoplankton, are blue. Places where chlorophyll concentrations were
high, meaning many phytoplankton were growing, are yellow.

chlophyll world map

chlophyll world map

http://upload.wikimedia.org/wikipedia/commons/thumb/e/e3/
MY1DMM_CHLORA.ogv/220px–MY1DMM_CHLORA.ogv.jpg

Chlorophyll and photosynthesis

Chlorophyll is vital for photosynthesis, which allows plants to absorb energy from light.

Chlorophyll molecules are specifically arranged in and around photosystems that are
embedded in the thylakoid membranes of chloroplasts. In these complexes,
chlorophyll serves two primary functions. The function of the vast majority of
chlorophyll (up to several hundred molecules per photosystem) is to absorb light and
transfer that light energy by resonance energy transfer to a specific chlorophyll pair
in the reaction center of the photosystems.

The two currently accepted photosystem units are Photosystem II and Photosystem I,
which have their own distinct reaction center chlorophylls, named P680 and P700,
respectively. These pigments are named after the wavelength (in nanometers) of their
red-peak absorption maximum. The identity, function and spectral properties of the
types of chlorophyll in each photosystem are distinct and determined by each other
and the protein structure surrounding them. Once extracted from the protein into a
solvent (such as acetone or methanol), these chlorophyll pigments can be separated
in a simple paper chromatography experiment and, based on the number of polar
groups between chlorophyll a and chlorophyll b, will chemically separate out on the
paper.

The function of the reaction center chlorophyll is to use the energy absorbed by and
transferred to it from the other chlorophyll pigments in the photosystems to undergo
a charge separation, a specific redox reaction in which the chlorophyll donates an
electron into a series of molecular intermediates called an electron transport chain.
The charged reaction center chlorophyll (P680+) is then reduced back to its ground
state by accepting an electron. In Photosystem II, the electron that reduces P680+
ultimately comes from the oxidation of water into O2 and H+ through several
intermediates.

This reaction is how photosynthetic organisms such as plants produce O2 gas, and
is the source for practically all the O2 in Earth’s atmosphere. Photosystem I typically
works in series with Photosystem II; thus the P700+ of Photosystem I is usually
reduced, via many intermediates in the thylakoid membrane, by electrons ultimately
from Photosystem II. Electron transfer reactions in the thylakoid membranes are
complex, however, and the source of electrons used to reduce P700+ can vary.

The electron flow produced by the reaction center chlorophyll pigments is used to
shuttle H+ ions across the thylakoid membrane, setting up a chemiosmotic potential
used mainly to produce ATP chemical energy; and those electrons ultimately reduce
NADP+ to NADPH, a universal reductant used to reduce CO2 into sugars as well as
for other biosynthetic reductions.

Reaction center chlorophyll–protein complexes are capable of directly absorbing light
and performing charge separation events without other chlorophyll pigments, but the
absorption cross section (the likelihood of absorbing a photon under a given light
intensity) is small. Thus, the remaining chlorophylls in the photosystem and antenna
pigment protein complexes associated with the photosystems all cooperatively absorb
and funnel light energy to the reaction center. Besides chlorophyll a, there are other
pigments, called accessory pigments, which occur in these pigment–protein
antenna complexes.

Chemical structure

Chlorophyll is a chlorin pigment, which is structurally similar to and produced through the same metabolic pathway as other porphyrin pigments such as heme. At the center
of the chlorin ring is a magnesium ion. This was discovered in 1906, and was the first
time that magnesium had been detected in living tissue. or the structures depicted in

this article, some of the ligands attached to the Mg2+ center are omitted for clarity.
The chlorin ring can have several different side chains, usually including a long
phytol chain. There are a few different forms that occur naturally, but the most
widely distributed form in terrestrial plants is chlorophyll a.

Chlorophyll-a-3D

Chlorophyll-a-3D

http://upload.wikimedia.org/wikipedia/commons/thumb/9/92/
Chlorophyll-a-3D-vdW.png/220px-Chlorophyll-a-3D-vdW.png

Space-filling model of the chlorophyll a molecule

After initial work done by German chemist Richard Willstätter spanning from 1905 to
1915, the general structure of chlorophyll a was elucidated by Hans Fischer in 1940.
By 1960, when most of the stereochemistry of chlorophyll a was known, Robert Burns
Woodward published a total synthesis of the molecule. In 1967, the last remaining
stereochemical elucidation was completed by Ian Fleming, and in 1990 Woodward
and co-authors published an updated synthesis. Chlorophyll was announced to be
present in cyanobacteria and other oxygenic microorganisms that form stromatolites
in 2010; a molecular formula of C55H70O6N4Mg and a structure of (2-formyl)-chlorophyll a were deduced based on NMR, optical and mass spectra.

When leaves degreen in the process of plant senescence, chlorophyll is converted
to a group of colourless tetrapyrroles known as nonfluorescent chlorophyll catabolites
(NCC’s) with the general structure:

These compounds have also been identified in several ripening fruits

Nonfluorescentchlorophilcatabolites.svg

http://upload.wikimedia.org/wikipedia/commons/thumb/c/c7/Nonfluorescent
chlorophilcatabolites.svg/241px-Nonfluorescentchlorophilcatabolites.svg.png

Absorbance spectra of free chlorophyll a (blue) and b (red) in a solvent. The spectra
of chlorophyll molecules are slightly modified in vivo depending on specific pigment-
protein interactions.

Chlorophyll_ab_spectra

Chlorophyll_ab_spectra

http://upload.wikimedia.org/wikipedia/commons/thumb/2/23/Chlorophyll_ab_
spectra-en.svg/220px-Chlorophyll_ab_spectra-en.svg.png

Complementary light absorbance of anthocyanins with chlorophylls

Anthocyanins are other plant pigments. The absorbance pattern responsible for the
red color of anthocyanins may be complementary to that of green chlorophyll in
photosynthetically active tissues such as young Quercus coccifera leaves. It may
protect the leaves from attacks by plant eaters that may be attracted by green color.

Superposition of spectra of chlorophyll a and b with oenin (malvidin 3O glucoside),
a typical anthocyanidin, showing that, while chlorophylls absorb in the blue and
yellow/red parts of the visible spectrum, oenin absorbs mainly in the green part
of the spectrum, where chlorophylls don’t absorb at all.

Superposition of spectra of chlorophyll a and b with oenin

Superposition of spectra of chlorophyll a and b with oenin

http://upload.wikimedia.org/wikipedia/commons/thumb/f/f0/Spectra_Chlorophyll_
ab_oenin_%281%29.PNG/220px-Spectra_Chlorophyll_ab_oenin_%281%29.PNG

Many important natural substances are chelates. In chelates a central metal ion is
bonded to a large organic molecule, a molecule composed of carbon, hydrogen, and
other elements such as oxygen and nitrogen. One such chelate is chlorophyll, the
green pigment of plants. In chlorophyll the central ion is magnesium, and the large
organic molecule is a porphyrin. The porphyrin contains four nitrogen atoms that form
bonds to magnesium in a square planar arrangement. There are several forms of
chlorophyll. The structure of one form, chlorophyll a, is shown.

chlrphyl

http://scifun.chem.wisc.edu/chemweek/chlrphyl/chlrphyl.gif

(As you can see from the molecular structure, the “chloro” in chlorophyll does not
mean that it contains the element chlorine. The chloro portion of the word is from
the Greek chloros, which means yellowish green. The name of the element chlorine
comes from the same source. Chlorine is a yellowish green gas.)

Chlorophyll is one of the most important chelates in nature. It is capable of
channeling the energy of sunlight into chemical energy through the process of
photosynthesis. In photosynthesis, the energy absorbed by chlorophyll transforms
carbon dioxide and
water into carbohydrates and oxygen.

CO2 + H2O ——- (CH2O) + O2

(In this equation, (CH2O) is the empirical formula of carbohydrates.) The chemical
energy stored by photosynthesis in carbohydrates drives biochemical reactions in
nearly all living organisms.

In the photosynthetic reaction, carbon dioxide is reduced by water; in other words,
electrons are transferred from water to carbon dioxide. Chlorophyll assists this
transfer. When chlorophyll absorbs light energy, an electron in chlorophyll is excited
from a lower energy state to a higher energy state. In this higher energy state, this
electron is more readily transferred to another molecule. This starts a chain of
electron-transfer steps, which ends with an electron transferred to carbon dioxide.

Meanwhile, the chlorophyll which gave up an electron can accept an electron from
another molecule. This is the end of a process which starts with the removal of an
electron from water. Thus, chlorophyll is at the center of the photosynthetic
oxidation-reduction reaction between carbon dioxide and water.

Other molecules with structures similar to that of chlorophyll play important roles in
other biochemical electron-transfer (oxidation-reduction) reactions. Heme consists
of a porphyrin similar to that in chlorophyll and an iron(II) ion in the center of the
porphyrin. Heme is bright red. In the red blood cells of vertebrates, heme is bound
to proteins forming hemoglobin. Hemoglobin combines with oxygen in the lungs, gills,
or other respiratory surfaces and releases it in the tissues. In muscle cells, myoglobin,
the name given to hemoglobin in muscles, stores oxygen as an electron source for
energy-releasing oxidation-reduction reactions.

Another relative of chlorophyll is vitamin B12. Vitamin B12 contains a cobalt ion at
the center of the porphyrin. Like heme, vitamin B12 is bright red. It is essential to
digestion and nutritional absorption in animals. The exact way it functions is not
known. Because vitamin B12 is not produced by higher plants, a strictly vegetarian
diet can lead to vitamin B12 deficiency. However, it is produced by molds and
bacteria which grow on most foods.

The intense color of chlorophyll suggests that it may be useful as a commercial
pigment. In fact, chlorophyll a is a green dye (Natural Green 3) used in soaps and
cosmetics. The absorption spectrum of chlorophyll (below) shows that it absorbs
strongly in the red and blue-violet regions of the visible spectrum. Because it absorbs
red and blue-violet light, the light it reflects and transmits appears green. Commercial
pigments with structures similar to chlorophyll have been produced in a range of colors.
Some of these have slightly modified porphyrins, such as having hydrogen atoms
replaced with chlorine atoms. Others have different metal ions. For example, one
bright blue pigment has a copper(I) ion at the center of the porphyrin and is used
primarily in coloring fabrics.

http://scifun.chem.wisc.edu/chemweek/chlrphyl/clrphlsp.gif

Read Full Post »

The Colors of Life Function

Writer and Curator: Larry H. Bernstein, MD, FCAP 

2.5.1 Type 1 Copper Proteins

The Cu(II) state of this category has an intense blue color due to a thiolate ligand
to Cu(II) charge transfer, and unusual EPR properties arising from the asymmetrical
Cu site (distorted trigonal-pyramidal). The proteins all have a low molecular
mass and have, so far, rather arbitrarily been divided into sub-groups, such as
azurins, plastocyanins, pseudoazurins, amicyanins and various other blue
proteins. Of these the azurins, amicyanins, pseudo-azurins and plastocyanins
apparently have similar copper coordination by two histidine, one cysteine and
one methionine residue. Where the function of Type I copper proteins is known,
it is invariably electron transfer. As yet the names for these proteins are all trivial
and are often derived from source, function or color. The different classes are
usually discerned on the basis of their primary and tertiary structure.

The first bacterial blue proteins to be described were called azurins. Rusticyanin is
another example of a bacterial protein. It has unusual properties with a reduction
potential of 680 mV, and is functional at pH 2. The azurins have well-defined electron
-transfer functions.

The so-called pseudo-azurins differ from the azurins in the N-terminal amino acid
sequence and the optical spectra, which resemble those of plastocyanins.

The blue proteins known as plastocyanins occur in plants, blue-green and green
algae. Their electron transfer role is well defined, i.e. from the bc1 complex
(EC 1.10.2.2) to the photooxidized P-700.

Amicyanins are electron carriers between methylamine dehydrogenase and
cytochrome c, with a characteristic amino acid sequence.

Of the remaining blue proteins stellacyanin is a well- known example. Umecyanin,
plantacyanin and mavicyanin are also considered to belong to this group.
Although these proteins undergo redox reactions in vitro, their true biological
function remains unknown. Most of these proteins exhibit an unusual EPR signal
in which the copper hyperfine splitting pattern is poorly resolved. There is good
evidence that at least for stellacyanin, methionine does not function as a ligand
for copper.

2.5.2 Type 2 Copper Proteins

The copper centres in these proteins are spectroscopically consistent with square
planar or pyramidal coordination, containing oxygen and/or nitrogen ligation.
The Cu(II) is EPR active, with a ‘normal’ signal. There is no intense blue color.
This group includes the copper/zinc superoxide dismutase (EC 1.15.1.1),
dopamine b-monooxygenase (EC 1.14.17.1), galactose oxidase (EC 1.1.3.9)
and the various copper-containing amine oxidases. Some members of this last
group may also contain an organic prosthetic group, such as PQQ
(see section 10), or a modified amino-acid residue.

2.5.3 Type 3 Copper Proteins

In this group a pair of copper atoms comprise a dinuclear centre, with no EPR
activity as for single Cu’s. The best known example of an enzyme containing a
single Type 3 centre is tyrosinase (catechol oxidase, EC 1.10.3.1). This protein
contains a metal center which is a structural analogue of the dinuclear copper
center in hemocyanin (ref 31).

2.5.4 Multi-Copper Oxidases

In addition to the above, there are several proteins with catalytic activity that
contain Types 1, 2 and 3 centres in various stoichiometric ratios. These
include L-ascorbate oxidase (EC 1.10.3.3), laccase (EC 1.10.3.2) and
ceruloplasmin (ferro-oxidase, EC 1.16.3.1), the latter two having aromatic diamine
and diphenol oxidase activity. There is growing evidence that in these proteins
the Type 2 and Type 3 copper centres are juxtaposed. Recently it has been
shown that in L-ascorbate oxidase, a trinuclear copper site is present, consisting
of a type 3 copper site, very close (3.9 Å) and possibly bridged to a type 2 copper
site (ref 32). There is a view that ceruloplasmin functions as a ferro-oxidase
and the Fe(III) produced in this reaction can then oxidize the same substrates
as laccase.

2.5.5 Copper Centres in Cytochrome Oxidase

There are two copper centres that appear to be unique. Both are present in
cytochrome-c oxidase (EC 1.9.3.1). The first appears to be an isolated metal ion
and has been referred to as Cud and CuA. The second appears to be part
of a dinuclear centre with cytochrome a3. It has been referred to as Cuu,
Cua3 and CuB. At the moment the ascriptions CuA and CuB are most frequently
used; however, the recent discovery (ref 33) of a cytochrome oxidase in which
cytochrome a has been replaced by cytochrome b, leads to the recommendation
that CuB shall be referred to as Cua3.

There is a striking similarity between two of the Cu centres of N2O reductase
and CuA (ref 34, 35).

2.5.6 Molybdenum enzymes (general)

Molybdenum enzymes contain molybdenum at the catalytic center responsible
for reaction with substrate. They may be divided into those that contain
the iron-molybdenum cofactor and those that contain the pterin-molybdenum
cofactor.

2.5.7 Additional centers

If a molybdenum enzyme contains flavin, it may be called either a molybdenum
flavoprotein or a flavomolybdenum protein, as indicated above. Other centers
should be treated similarly, e.g. an iron-sulfur molybdenum protein.

2.5.8 Molybdenum enzymes containing the iron-molybdenum cofactor

The only enzymes at present known to belong to this group are the nitrogenases
(EC 1.18.6.1; and EC 1.19.6.1): see pp 89-116 in (ref 36) and pp 91-100 in (ref 37).

2.5.9 Molybdenum enzymes containing the pterin-molybdenum cofactor

These enzymes [see pp 411-415 in (ref 36) and (ref 38)] may be divided
into those in which the molybdenum bears a cyanide-labile sulfido (or thio
– see Note 1) ligand i.e. containing the S2- ligand as Mo=S) and those
lacking this ligand. The former group includes xanthine oxidase (EC 1.1.3.22),
xanthine dehydrogenase (EC 1.1.1.204), aldehyde oxidase (EC 1.2.3.1) and
purine hydroxylase (EC: see Note 2 and 3). These may be called ‘molybdenum-
containing hydroxylase’ as is widely done. Molybdenum enzymes lacking the
sulfide (thio) ligand include sulfite oxidase (EC 1.8.3.1), NAD(P)+-independent
aldehyde dehydrogenase and nitrate reductases (assimilatory and dissimilatory)
(EC 1.6.6.1-3).

2.5.10 Molybdenum enzymes containing the pterin-molybdenum cofactor

These enzymes [see pp 411-415 in (ref 36) and (ref 38)] may be divided into those
in which the molybdenum bears a cyanide-labile sulfido (or thio – see Note 1)
ligand i.e. containing the S2- ligand as Mo=S) and those lacking this ligand. The
former group includes xanthine oxidase (EC 1.1.3.22), xanthine dehydrogenase
(EC 1.1.1.204), aldehyde oxidase (EC 1.2.3.1) and purine hydroxylase. These
may be called ‘molybdenum-containing hydroxylase’ as is widely done.
Molybdenum enzymes lacking the sulfide (thio) ligand include sulfite oxidase
(EC 1.8.3.1), NAD(P)+-independent aldehyde dehydrogenase and nitrate
reductases (assimilatory and dissimilatory) (EC 1.6.6.1-3).

2.5.11 Metal-Substituted Metalloproteins

Scientists from several areas, dealing with spectroscopy and electron-transfer
mechanisms, often use metalloproteins in which a metal at the active site has
been substituted by another metal ion, like Co, Zn, Hg, Cd. Examples are zinc-
substituted cytochromes and cobalt-substituted ferredoxins.

The names for such modified proteins are easily given by using indications
like: ‘zinc-substituted ….’. In case of multi-metal proteins, where ambiguity might
arise about which metal has been substituted, one could easily add in parentheses
the name of the metal that has been replaced, such as: cobalt- substituted [Fe]
nitrogenase.

In formulae fragments or short names one could use the following notation:
[3Fe1Co-4S]2+, cytochrome c'[Fe[arrow right]CoFe], plastocyanin[Cu
[arrow right]Hg].

Ambler, R.P. (1980) in From Cyclotrons to Cytochromes (Kaplan, N.O. &
Robinson, A., eds) Academic Press, New York

Moore, G. & Pettigrew, F.(1987) Cytochromes c, Springer-Verlag, Berlin

Bartsch, R.G. (1963) in Bacterial Photosynthesis (Gest, H., San Pietro, A. &
Vernon, L.P., ed.) p. 315, Antioch Press, Yellow Springs, Ohio.

Stiefel, E.I. & Cramer, S.P. (1985) in Molybdenum Enzymes (Spiro, T.G., ed.),
Wiley-Interscience, New York, 89-116.

Smith B.E. et al. (1988), in Nitrogen Fixation Hundred Years After (Bothe,
H., de Bruijn, F.J. & Newton, W.E., ed.), Gustav Fischer, Stuttgart, New York,
91-100

Type-2 copper-containing enzymes.
MacPherson IS1, Murphy ME.
Cell Mol Life Sci. 2007 Nov;64(22):2887-99.

Type-2  Cu sites are found in all the major branches of life and are often
involved in the catalysis of oxygen species. Four type-2 Cu protein
families are selected as model systems for review: amine oxidases,
Cu monooxygenases, nitrite reductase/multicopper oxidase, and
CuZn superoxide dismutase. For each model protein, the availability
of multiple crystal structures and detailed enzymological studies provides
a detailed molecular view of the type-2 Cu site and delineation of the
mechanistic role of the Cu in biological function. Comparison of these
model proteins leads to the identification of common properties of the
Cu sites and insight into the evolution of the trinuclear active site found
in multicopper oxidases.

Copper proteins and copper enzymes.
Cass AE, Hill HA.
Ciba Found Symp. 1980;79:71-91.
http://www.chm.bris.ac.uk/motm/caeruloplasmin/copper_proteins/t1.htm

The copper proteins that function in homeostasis, electron transport, dioxygen
transport and oxidation are discussed. Particular emphasis is placed on the
role of the ligands, their type and disposition which, in conjunction with other
residues in the active site, determine the role of the copper ion. It is proposed that
copper proteins can be considered in four groups. Those in Group I contain a
single copper ion in an approximately tetrahedral environment with nitrogen and
sulphur-containing ligands. Group II proteins have a single copper ion in a square-
planar-like arrangement. Group III proteins have two copper ions in close
proximity. Group IV consists of multi-opper proteins, composed of sites
representative of the other three groups.

Such centers owe their name to the intense blue coloration of the corresponding
Cu(II) proteins. The color is particularly distinctive since the metal centers are
so optically diluted in these metalloenzymes that only intense absorption in the
visible region, resulting from symmetry allowed electronic transitions, can give
rise to conspicuous colors. In contrast, the comparatively pale blue color of normal
Cu(II)) is the result of forbidden electronic transitions between d-orbitals of
different symmetry; in Cu2+(aq) this gives a molar extinction coefficient of
10 M-1cm-1 from a broad absorption between 10,000 cm-1 and 15,000 cm-1
compared to about 3000 M-1cm-1 observed for blue Cu(II) centers.  For the
T1 centers the intense absorption is attributed to a ligand-to-metal charge
transfer between the Cu2+ and a bonded cysteinate ligand. Typically, as in
azurin or plastocyanin this occurs around 16,000 cm-1. Ceruloplasmin has
three T1 centers, and the blue absorption is at 16,400 cm-1 (610nm).

Plastocyanine geometry

around the copper Crystal structures show a very irregular ‘tetrahedral’ coordination
with two sulphurs from methionine and cysteinate, and two histidine nitrogens.
However a comparison of azurin with plastocyanin shows that the geometry
is in some ways closer to a trigonal bipyramid, with and without one extra apical
ligand, so that azurin has a weakly bound glutamine oxygen, and plastocyanine
does not. The T1 coppers in caruloplasmin are in plastocyanine-type domains.
Each of these are coordinated to two histidines and a cysteine, in two of the T1
domains there is also a methionine residue, the third T1 domain has a leucine
residue which may only have a van der Waals type contact with the copper.

T1 copper centers are functional in the reversible electron transfer:

Cu2+ + e-   =   Cu+

The strongly distorted geometry represents a compromise (entactic-state
situation) between d10 Cu(I), with its preferred tetrahedral or trigonal
coordination through soft sulfur ligands, and d9 Cu(II) with preferential
square planar or square pyramidal geometry and nitrogen ligand
coordination.   This irregular, high energy arrangement at the metal
center resembles the transition-state geometry between the tetrahedral
and square planar equilibrium configurations of the two oxidation states
involved and permits enhanced rates of electron transfer. The potential
range for proteins with T1 copper centers runs from 180 mV in
stellacyanin to 680 mV in rusticyanin.

Zinc proteins: enzymes, storage proteins, transcription factors, and replication
proteins.
Coleman JE.
Annu Rev Biochem. 1992;61:897-946.

In the past five years there has been a great expansion in our knowledge of
the role of zinc in the structure and function of proteins. Not only is zinc
required for essential catalytic functions in enzymes (more than 300 are known
at present), but also it stabilizes and even induces the folding of protein
subdomains. The latter functions have been most dramatically illustrated
by the discovery of the essential role of zinc in the folding of the DNA-binding
domains of eukaryotic transcription factors, including the zinc
finger transcription factors, the large family of hormone receptor proteins,
and the zinc cluster transcription factors from yeasts. Similar functions are
highly probable for the zinc found in the RNA polymerases and the zinc-
containing accessory proteins involved in nucleic acid replication. The rapid
increase in the number and nature of the proteins in which zinc functions
is not unexpected since zinc is the second most abundant trace metal found in
eukaryotic organisms, second only to iron. If one subtracts the amount of iron
found in hemoglobin, zinc becomes the most abundant trace metal found
in the human body.

Zinc Coordination Spheres in Protein Structures
ACS ChemWorx
Mikko Laitaoja , Jarkko Valjakka , and Janne Jänis
Inorg. Chem., 2013, 52 (19), pp 10983–10991
http://dx.doi.org:/10.1021/ic401072d
Sept 23, 2013

Synopsis
A statistical analysis in terms of zinc coordinating amino acids, metal-to-ligand
bond lengths, coordination number, and structural classification was performed,
revealing coordination spheres from classical tetrahedral cysteine/histidine binding
sites to more complex binuclear sites with carboxylated lysine residues. According
to the results, coordination spheres of hundreds of crystal structures in the PDB
could be misinterpreted due to symmetry-related molecules or missing electron
densities for ligands.

Protein-folding location can regulate manganese-binding versus copper- or
zinc-binding.
Tottey S, Waldron KJ, Firbank SJ, Reale B, Bessant C, Sato K, Cheek TR, et al.
Nature. 2008 Oct 23;455(7216):1138-42. http://dx.doi.org:/10.1038/nature07340

Metals are needed by at least one-quarter of all proteins. Although metallo-
chaperones insert the correct metal into some proteins, they have not been
found for the vast majority, and the view is that most metalloproteins acquire
their metals directly from cellular pools. However, some metals form more
stable complexes with proteins than do others. For instance, as described
in the Irving-Williams series, Cu(2+) and Zn(2+) typically form more stable
complexes than Mn(2+). Thus it is unclear what cellular mechanisms manage
metal acquisition by most nascent proteins. To investigate this question, we
identified the most abundant Cu(2+)-protein, CucA (Cu(2+)-cupin A), and the
most abundant Mn(2+)-protein, MncA (Mn(2+)-cupin A), in the periplasm of
the cyanobacterium Synechocystis PCC 6803. Each of these newly identified
proteins binds its respective metal via identical  ligands within a cupin fold.
Consistent with the Irving-Williams series, MncA only binds Mn(2+) after
folding in solutions containing at least a 10(4) times molar excess of Mn(2+)
over Cu(2+) or Zn(2+). However once MncA has bound Mn(2+), the metal
does not exchange with Cu(2+). MncA and CucA have signal peptides for
different export pathways into the periplasm, Tat and Sec respectively. Export
by the Tat pathway allows MncA to fold in the cytoplasm, which contains only
tightly bound copper or Zn(2+) (refs 10-12) but micromolar Mn(2+) (ref. 13). In
contrast, CucA folds in the periplasm to acquire Cu(2+). These results reveal
a mechanism whereby the compartment in which a protein folds overrides its
binding preference to control its metal content. They explain why the cytoplasm
must contain only tightly bound and buffered copper and Zn(2+).

Predicting copper-, iron-, and zinc-binding proteins in pathogenic species of the
Paracoccidioides genus
GB Tristão, L do Prado Assunção, LPA dos Santos, CL Borges, MG Silva-Bailão,
CM de Almeida Soares, G Cavallaro and AM Bailão*
Front. Microbiol., 9 Jan 2015 http://dx.doi.org:/10.3389/fmicb.2014.00761

Approximately one-third of all proteins have been estimated to contain at least
one metal cofactor, and these proteins are referred to as metalloproteins. These
represent one of the most diverse classes of proteins, containing metal ions that
bind to specific sites to perform catalytic, regulatory and structural functions.
Bioinformatic tools have been developed to predict metalloproteins encoded by
an organism based only on its genome sequence. Its function and the type of
metal binder can also be predicted via a bioinformatics approach.  Paracoccidioides
complex includes termodimorphic pathogenic fungi that are found as saprobic
mycelia in the environment and as yeast, the parasitic form, in host tissues. They
are the etiologic agents of Paracoccidioidomycosis, a prevalent systemic mycosis
in Latin America. Many metalloproteins are important for the virulence of several
pathogenic microorganisms. Accordingly, the present work aimed to predict the
copper, iron and zinc proteins encoded by the genomes of three phylogenetic species
of Paracoccidioides (Pb01, Pb03, andPb18). The metalloproteins were identified
using bioinformatics approaches based on structure, annotation and domains. Cu-,
Fe-, and Zn-binding proteins represent 7% of the total proteins encoded by
Paracoccidioides spp. genomes. Zinc proteins were the most abundant metallo-
proteins, representing 5.7% of the fungus proteome, whereas copper and iron
proteins represent 0.3 and 1.2%, respectively. Functional classification revealed that
metalloproteins are related to many cellular processes. Furthermore, it was observed
that many of these metalloproteins serve as virulence factors in the biology of the
fungus. Thus, it is concluded that the Cu, Fe, and Zn metalloproteomes of the
Paracoccidioides spp. are of the utmost importance for the biology and virulence
of these particular human pathogens.

Zinc finger proteins: new insights into structural and functional diversity
John H Laity, Brian M Lee, Peter E Wright
Current Opinion in Structural Biology Feb 2001; 11(1): 39–46
http://epigenie.com/key-epigenetic-players/chromatin-modifying-and-dna-
binding-proteins/zinc-finger-proteins/

Zinc finger proteins are among the most abundant proteins in eukaryotic genomes.
Their functions are extraordinarily diverse and include DNA recognition, RNA
packaging, transcriptional activation, regulation of apoptosis, protein folding
and assembly, and lipid binding. Zinc finger structures are as diverse as their
functions. Structures have recently been reported for many new zinc finger
domains with novel topologies, providing important insights into structure/function
relationships. In addition, new structural studies of proteins containing the
classical Cys2His2 zinc finger motif have led to novel insights into mechanisms
of DNA binding and to a better understanding of their broader functions in
transcriptional regulation.

Zinc Finger Proteins

Zinc finger (ZnF) proteins are a massive, diverse family of proteins that serve a
wide variety of biological functions. Due to their diversity, it is difficult to come up
with a simple definition of what unites all ZnF proteins; however, the most common
approach is to define them as all small, functional domains that require coordination
by at least one zinc ion (Laity et al., 2001). The zinc ion serves to stabilize the
integration of the protein itself, and is generally not involved in binding targets.
The “finger” refers to the secondary structures (α-helix and β-sheet) that are
held together by the Zn ion. Zinc finger containing domains typically serve
as interactors, binding DNA, RNA, proteins or small molecules (Laity et al., 2001).

ZnF Protein Families

Cys2His2 was the first domain discovered (also known as Krüppel-type). It was
initially discovered as a repeating domain in the IIIA transcription factor in
Xenopus laevis (Brown et al., 1985; Miller et al., 1985). IIIA has nine repeats
of the 30 amino acids that make up the Cys2His2 domain. Each domain forms
a left-handed ββα secondary structure, and coordinates a Zn ion between
two cysteines on the β-sheet hairpin and two histidines in the α-helix, hence
the name Cys2His2 (Lee et al., 1989). These resides are highly conserved,
as well as a general hydrophobic core that allows the helix to form. The other
residues can show great sequence diversity (Michael et al., 1992). Cys2His2
zinc fingers that bind DNA tend to have 2-4 tandem domains as part of a
larger protein. The residues of the alpha helices form specific contacts with a
specific DNA sequence motif by “reading” the nucleotides in major groove
of DNA (Elrod-Erickson et al., 1996; Pavletich and Pabo, 1991). Cys2His2
proteins are the biggest group of transcription factors in most species. Non-
DNA binding proteins can have much more flexible tertiary structure.
Examples of Cys2His2 proteins include the Inhibitor of Apoptosis (IAP) family
of proteins and the CTFC transcription factor.

Treble clef fingers are a very diverse group of ZnF protiens both in terms of
structure and function. What makes them a family is a shared fold at their core
that looks a little like a musical treble clef, especially if you squint (Grishin,
2001). Most treble clef finger motifs have a β hairpin, a variable loop region,
a β hairpin, and an α helix. The “knuckle” of the β hairpin and the α helix contain
the Cys-x-x-Cys sequence necessary to coordinate the Zn ion. Treble clef
fingers often form the core of protein structures, for example the L24E and
S14 ribosomal proteins and the RING finger family.

Zinc ribbons are a little less structurally complex than the other two major groups.
Zinc ribbons contain two zinc knuckles, often β hairpins, coordinating a zinc ion via
a two Cys residures separated by 2-4 other residues on one knuckle, and a Cys-x-x-
Cys on the other (Hahn and Roberts, 2000). Examples of zinc ribbon-containing
proteins include the basal transcription factors TFIIS and TFIIB that for a complex
with RNAPII to bind DNA, and the Npl4 nuclear core protein that uses a zinc ribbon
to bind ubiquitin (Alam et al., 2004). Cys2His2, treble clef fingers, and zinc ribbons
form the majority of zinc fingers, but there are several other smaller groups that
don’t fit neatly into these three. Green fluorescent protein as a marker for gene
expression.

Metallothionein proteins expression, copper and zinc concentrations, and lipid
peroxidation level in a rodent model for amyotrophic lateral sclerosis
E Tokuda, Shin-Ichi Ono,  K Ishige, A Naganuma, Y Ito, T Suzuki
Toxicology Jan 2007; 229(1–2): 33–41

It has been hypothesized that copper-mediated oxidative stress contributes to the
pathogenesis of familial amyotrophic lateral sclerosis (ALS), a fatal motor neuron
disease in humans. To verify this hypothesis, we examined the copper and zinc
concentrations and the amounts of lipid peroxides, together with that of the
expression of metallothionein (MT) isoforms in a mouse model [superoxide
dismutase1 transgenic (SOD1 Tg) mouse] of ALS. The expression of MT-I and
MT-II (MT-I/II) isoforms were measured together with Western blotting, copper
level, and lipid peroxides amounts increased in an age-dependent manner in the
spinal cord, the region responsible for motor paralysis. A significant increase was
already seen as early as 8-week-old SOD1 Tg mice, at which time the mice had not
yet exhibited motor paralysis, and showed a further increase at 16 weeks of age,
when paralysis was evident. Inversely, the spinal zinc level had significantly
decreased at both 8 and 16 weeks of age. The third isoform, the MT-III level,
remained at the same level as an 8-week-old wild-type mouse, finally increasing
to a significant level at 16 weeks of age. It has been believed that a mutant SOD1
protein, encoded by a mutant SOD1, gains a novel cytotoxic function while
maintaining its original enzymatic activity, and causes motor neuron death
(gain-of-toxic function). Copper-mediated oxidative stress seems to be a probable
underlying pathogenesis of gain-of-toxic function. Taking the above current
concepts and the classic functions of MT into account, MTs could have a disease
modifying property: the MT-I/II isoform for attenuating the gain-of-toxic function
at the early stage of the disease, and the MT-III isoform at an advanced stage.

Prion protein expression level alters regional copper, iron and zinc content in
the mouse brain
MJ Pushie,  IJ Pickering, GR Martin, S Tsutsui, FR Jirik and GN George
Metallomics, 2011,3, 206-214 http://dx.doi.org:/10.1039/C0MT00037J

The central role of the prion protein (PrP) in a family of fatal neurodegenerate
diseases has garnered considerable research interest over the past two decades.
Moreover, the role of PrP in neuronal development, as well as its apparent role
in metal homeostasis, is increasingly of interest. The host-encoded form of the
prion protein (PrPC) binds multiple copper atoms via its N-terminal domain
and can influence brain copper and iron levels. The importance of PrPC to the
regulation of brain metal homeostasis and metal distribution, however, is not
fully understood. We therefore employed synchrotron-based X-ray fluorescence
imaging to map the level and distributions of several key metals in the brains of
mice that express different levels of PrPC. Brain sections from wild-type, prion
gene knockout (Prnp−/−) and PrPC over-expressing mice revealed striking
variation in the levels of iron, copper, and even zinc in specific brain regions as
a function of PrPC expression. Our results indicate that one important function
of PrPC may be to regulate the amount and distribution of specific metals within
the central nervous system. This raises the possibility that PrPC levels, or its
activity, might regulate the progression of diseases in which altered metal
homeostasis is thought to play a pathogenic role such as Alzheimer’s,
Parkinson’s and Wilson’s diseases and disorders such as hemochromatosis.

Zinc & Copper Imbalances: Immense Biochemical Implications
Mar 27, 2013 by Michael McEvoy
http://metabolichealing.com/zinc-copper-imbalances-immense-biochemical-
implications/

The status of zinc and copper levels may have profound implications for
many people. Much has been written about the significance of these two
trace elements for many, many years. Many health conditions may be
directly caused by abnormal zinc and copper levels.

With all of the recent attention given to methylation status, gene mutations,
MTHFR, and the associated neurological and mental/behavioral disorders
that may ensue, zinc and copper status remains a pivotal ratio in these regards.

While zinc toxicity and copper deficiency are possible, the subject of this
article is on the more common imbalance: copper toxicity and zinc deficiency.

The Physiological Roles Of Zinc & Copper

Zinc and copper are antagonists. The balance between these two trace
elements is an example of the effects of biological dualism. While zinc
toxicity is possible, far more common is zinc deficiency and copper toxicity.
Both zinc and copper play essential roles in the body, and there can be a
number of causes for why imbalances ensue.

It may be easier to identify the roles that zinc doesn’t play in the body,
than the roles it does play. Zinc is an essential trace element that activates
several hundred enzymatic reactions. These reactions are fundamental
to life and biological activity. Some of the activities that zinc are involved in:

  • DNA & RNA synthesis
  • Gene expression
  • Nervous system function
  • Immune function & immune signaling such as cell
    apoptosis
  • Neuronal transmission
  • Brain function
  • Zinc possesses powerful anabolic activities in the cells
  • Formation of zinc proteins known as “zinc fingers”
  • Zinc is essential for blood clotting and platelet formation
  • Zinc is involved in Vitamin A synthesis
  • Folate is made available through zinc enzyme reactions
  • Along with copper, Zinc makes up the antioxidant
    enzyme
    system, ZnCu superoxide dismutase
  • Steroidal hormone synthesis
  • Growth & development of children
  • Testosterone and semen formation
  • The highest concentration of zinc is found in the
    male prostate gland

Copper is an essential trace element serving many important functions
as well. However, copper is well documented to induce several toxic effects
in the body, when elevated. Because copper is a pro-oxidant when free and
unbound, it can quickly generate free radicals.

The major sources for copper toxicity are: exposure to industrial forms
of copper such as copper pipes, copper cookware, birth control, exposure
to copper-based fungicides. Diets high in copper and low in zinc may play
a role in copper toxicity. Pyrrole disorder, which causes depletion of zinc,
may result in elevated levels of copper.

Some of the essential roles copper plays in the body:

  • Connective tissue formation
  • ATP synthesis
  • Iron metabolism
  • Brain health via neurotransmitter synthesis
  • Gene transcription
  • Synthesis of the antioxidant superoxide dismutase
  • Skin pigmentation
  • Nerve tissue: myelin sheath formation
  • Copper tends to rise when estrogen is dominant

Perhaps one of the first reports that zinc and copper imbalances play
a role in human health and disease was their detection in mental
disorders made by Carl Pfeiffer, MD, PhD. Dr. Pfeiffer identified a
condition known as pyrrole disorder, sometimes referred to as
pyrroluria or “mauve factor”.

As it turns out, pyrrole disorder is a major biochemical imbalance
in many people with chronic illnesses such as chronic Lyme disease,
autism, schizophrenia, depression, bi-polar, and chronic fatigue
syndrome. Pyrroles are a byproduct of hemoglobin synthesis.
Apparently, some individuals are more predisposed towards producing
higher amounts of pyrroles. When pyrroles are excessive, they irreversibly
bind to zinc and vitamin B6, causing their excretion. Consequently,
it is common that once zinc levels become depleted, copper levels tend to rise.

Copper Toxicity

Problems associated with copper toxicity include: pyrrole disorder,
estrogen dominance, schizophrenia, depression, anxiety disorder,
chronic fatigue, migraines, liver toxicity, thyroid conditions, chronic
candida yeast infections, PMS, to name a few. Some research has
even implicated copper toxicity with Alzheimer’s Disease and with
cardiovascular disease. Perhaps one of the primary mechanisms
through which copper toxicity can damage tissues is through its
initiation of oxidative stress and free radical formation. Free copper
ions that are not bound to copper proteins such as ceruloplasmin,
are pro-oxidants, and are highly reactive.

Empirical research from clinicians, indicates that there are different
types of copper imbalances. For example, if there is a lot of free,
unbound copper present, this may cause a situation of nutritive
copper deficiency. Another copper imbalance is when high pyrroles
depress zinc levels, and copper levels concomintantly rise. If high
pyrroles are present, B6 will also be lost in high amounts. In a general
but very real sense, all forms of copper excess will affect zinc status,
due to the dualistic nature of zinc and copper.

Copper & Estrogen

It has been known for many years that copper can cause a rise in
estrogen, and conversely estrogen may raise copper. Estrogen
dominance has been extensively studied in its role in breast
cancer development. One possible, critical role that can cause
estrogen to become carcinogenic, is through its oxidation induced by
copper. 
Once oxidized, estrogen forms volatile hydroxyl radicals and
the associated DNA damage and “mutagenesis”.

Zinc Deficiency

As mentioned previously, pyrrole disorder will directly depress
zinc status, causing high levels of its excretion. When zinc is
lost, copper rises. Because of their essential roles in neuro-
transmitter synthesis, low zinc and high copper levels can
directly effect cognition, behavior and thought processes.
Zinc has been studied in biochemical reactions involving
calcium-driven, synaptic neurotransmission, as well as in
glutamate/GABA balance and with limbic brain function.

Zinc & Reproduction

Zinc is essential for steroidal hormone synthesis, and is a
well known catalyst for testosterone synthesis, as well as
leutinizing hormone. Zinc has demonstrated its ability to
prevent miscarriage and toxicity during pregnancy. The male
prostate gland reportedly contains the highest concentration
of zinc in the body.

Zinc & Brain Function

Much attention has been given to excitotoxicity, such as the
effects induced by MSG (monosodium glutamtate). Excess
stimulation of the excitatory neurotransmitter glutamate,
may cause severe physical and psychological reactions in
certain individuals. Zinc has been studied for its ability to
enhance GABA 
(glutamate’s antagonistic neurotransmitter)
activity and to suppress excess glutamate.

Studies on mice demonstrated that when depleted of zinc
for two weeks, the mice developed seizures, most likely due
to GABA deficiencies and glutamate excess.

There is an emerging body of evidence that demonstrates
that Alzheimer’s disease may involve copper toxicity and
zinc deficiency. Not only can excess copper cause zinc
depletion, but so can excess lead.

The hippocampus, a major part of the limbic brain, records
memories and is responsible for processing meaningful
experiences. Numerous studies site that if hippocampal
cells are deprived of zinc, the hippocampal cells die. In
addition to hippocampus cell death induced by zinc
deprivation, the amygdala, the other major limbic gland
experiences cell death as well, when deprived of zinc.

Green Fluorescent Protein

Chalfie M, Tu Y, Euskirchen G, Ward WW, Prasher DC.
Science. 1994 Feb 11;263(5148):802-5.
http://www.ncbi.nlm.nih.gov/pubmed/8303295

A complementary DNA for the Aequorea victoria green fluorescent protein (GFP)
produces a fluorescent product when expressed in prokaryotic (Escherichia coli)
or eukaryotic (Caenorhabditis elegans) cells. Because exogenous substrates and
cofactors are not required for this fluorescence, GFP expression can be used
to monitor gene expression and protein localization in living organisms.

http://en.wikipedia.org/wiki/Green_fluorescent_protein

The green fluorescent protein (GFP) is a protein composed of 238 amino acid
residues (26.9 kDa) that exhibits bright green fluorescence when exposed
to light in the blue to ultraviolet range. Although many other marine organisms
have similar green fluorescent proteins, GFP traditionally refers to the protein
first isolated from the jellyfish Aequorea victoria. The GFP from A. victoria
has a major excitation peak at a wavelength of 395 nm and a minor one at
475 nm. Its emission peak is at 509 nm, which is in the lower green portion
of the visible spectrum. The fluorescence quantum yield (QY) of GFP is 0.79.
The GFP from the sea pansy (Renilla reniformis) has a single major excitation
peak at 498 nm.

In cell and molecular biology, the GFP gene is frequently used as a reporter of
expression. In modified forms it has been used to make biosensors, and many
animals have been created that express GFP as a proof-of-concept that a gene
can be expressed throughout a given organism. The GFP gene can be introduced
into organisms and maintained in their genome through breeding, injection with a
viral vector, or cell transformation. To date, the GFP gene has been introduced
and expressed in many Bacteria, Yeast and other Fungi, fish (such as zebrafish),
plant, fly, and mammalian cells, including human. Martin Chalfie, Osamu Shimomura,
and Roger Y. Tsien were awarded the 2008 Nobel Prize in Chemistry on 10 October
2008 for their discovery and development of the green fluorescent protein.

http://www.conncoll.edu/ccacad/zimmer/GFP-ww/GFP-1.htm

In Aequorea victoria a protein called aequorin releases blue light upon binding
with calcium. This blue light is then totally absorbed by the GFP, which in turn
gives off the green light as in the animation below.

In 1994 GFP was cloned. Now GFP is found in laboratories all over the world where
it is used in every conceivable plant and animal. Flatworms, algae, E. coli and pigs
have all been made to fluoresce with GFP.

The importance of GFP was recognized in 2008 when the Nobel Committee awarded
Osamu Shimomura, Marty Chalfie and Roger Tsien the Chemistry Nobel Prize ”
for the discovery and development of the green fluorescent protein, GFP.”

Why is it so popular? Well, I like to think of GFP as the microscope of the twenty-
first century. Using GFP we can see when proteins are made, and where they can go.
This is done by joining the GFP gene to the gene of the protein of interest so that
when the protein is made it will have GFP hanging off it. Since GFP fluoresces, one
can shine light at the cell and wait for the distinctive green fluorescence associated
with GFP to appear.

A variant of yellow fluorescent protein with fast and efficient maturation for
cell-biological applications
T Nagai, K Ibata, E Sun Park, M Kubota, K Mikoshiba & A Miyawaki
Nature Biotechnology 20, 87 – 90 (2002)  http://dx.doi.org:/10.1038/nbt0102-87

The green fluorescent protein (GFP) from the jellyfish Aequorea victoria
has provided a myriad of applications for biological systems. Over the last
several years, mutagenesis studies have improved folding properties of GFP.
However, slow maturation is still a big obstacle to the use of GFP variants for
visualization. These problems are exacerbated when GFP variants are expressed
at 37°C and/or targeted to certain organelles. Thus, obtaining GFP variants that
mature more efficiently is crucial for the development of expanded research
applications. Among Aequorea GFP variants, yellow fluorescent proteins (YFPs)
are relatively acid-sensitive,and uniquely quenched by chloride ion (Cl−)3. For
YFP to be fully and stably fluorescent, mutations that decrease the sensitivity
to both pH and Cl− are desired. Here we describe the development of an
improved version of YFP named “Venus”. Venus contains a novel mutation,
F46L, which at 37°C greatly accelerates oxidation of the chromophore, the rate-
limiting step of maturation. As a result of other mutations, F64L/M153T/
V163A/S175G, Venus folds well and is relatively tolerant of exposure
to acidosis and Cl−. We succeeded in efficiently targeting a neuropeptide
Y-Venus fusion protein to the dense-core granules of PC12 cells. Its secretion
was readily monitored by measuring release of fluorescence into the medium.
The use of Venus as an acceptor allowed early detection of reliable signals of
fluorescence resonance energy transfer (FRET) for Ca2+ measurements in brain
slices. With the improved speed and efficiency of maturation and the increased
resistance to environment, Venus will enable fluorescent labelings that were not
possible before.

Rhodopsin-like Protein from the Purple Membrane of Halobacterium halobium
DIETER OESTERHELT &  WALTHER STOECKENIUS
Nature New Biology 29 Sep 1971; 233, 149-152  | http://dx.doi.org:/10.1038/
newbio233149a0

HALOPHILIC bacteria require high concentrations of sodium chloride and lower
concentrations of KCl and MgCl2 for growth. The cell membrane dissociates into
fragments of varying size when the salt is removed1. One characteristic fragment—
termed the “purple membrane” because of its characteristic deep purple colour—
has been isolated in relatively pure form from Halobacterium halobium. We can
now show that the purple colour is due to retinal bound to an opsin-like protein,
the only protein present in this membrane fragment.

References

Stoeckenius, W. , and Rowen, R. , J. Cell Biol., 34, 365 (1967).

Stoeckenius, W. , and Kunau, W. H. , J. Cell Biol., 38, 337 (1968).

Blaurock, A. E. , and Stoeckenius, W. , Nature New Biology, 233, 152 (1971).

Sehgal, S. N. , and Gibbons, N. E. , Canad. J. Microbiol., 6, 165 (1960).

Kelly, M. , Norgård, S. , and Liaach-Jensen, S. , Acta Chem. Scand., 2A, 2169 (1970).

Shapiro, A. L. , Vinnela, E. , and Maizel, jun., J. V. , Biochem. Biophys. Res.
Commun., 28, 815 (1967).

The monomerization of the Purple protein, a member of the GFP-family
Corning, Brooke

Green fluorescent protein (GFP) has been used extensively since its discovery
in the 1960s to report and visualize gene expression. For years it has been the only
known naturally occurring fluorescent pigment that is encoded by a single gene,
making it extremely useful in various fields of biology, because the expression of
this gene directly leads to the appearance of the fluorescent green color. Recently,
however, many more proteins with similar properties to GFP, and available in a
variety of colors, have been isolated from the class of marine organisms called
Anthozoa, which includes the corals. This increase in the availability of colored
proteins in GFP family in turn has expanded the number of available biotech-
nology applications. However, some of these newly discovered GFP-like
proteins do not have wild-type forms that readily allow for the creation of
fusion proteins, particularly because of oligomerization. It is widely accepted
that almost all members of the GFP-family form dimers or tetramers in their
functional forms.

This study investigates a GFP-ike protein, Purple, isolated from two species,
Galaxea fascicularis and Montipora efflorescens. Purple protein forms oligomers
when expressed, which would then interfere with the normal expression of a  protein
to be tagged in gene fusion experiments. We selectively mutated 3 amino acids,
which we believed were responsible for oligomerization in Purple. These 3
residues were chosen based on sequence similarities to a very similar protein,
a mutant form of the Rtms5 chromoprotein from Montipora efflorescens. While
we had hoped that the resulting triple-mutant Purple protein would form
monomers in vivo while retaining its purple coloration, this turned out to
be incorrect. The resulting mutants had lost their ability to turn purple. However,
we also determined that we had successfully changed the oligomerization
state of Purple by examining the relative molecular mass of one our
mutant proteins, which turned out to be half the size of the original
purple protein. It is possible that by adding additional mutations in
the future, the original spectral properties could be recovered. If
successful, this would further expand the utility of the GFP family.

Rhodopsin, also known as visual purple, from Ancient Greek ῥόδον
(rhódon, “rose”), due to its pinkish color, and ὄψις (ópsis, “sight”), is
a light-sensitive receptor protein. It is a biological pigment in photo-
receptor cells of the retina. Rhodopsin is the primary pigment found
in rod photoreceptors. Rhodopsins belong to the G-protein-coupled
receptor (GPCR) family. They are extremely sensitive to light, enabling
vision in low-light conditions. Exposed to light, the pigment
immediately photobleaches, and it takes about 45 minutes to regenerate
fully in humans. Its discovery was reported by German physiologist
Franz Christian Boll in 1876.

Read Full Post »

The Life and Work of Allan Wilson

Curator: Larry H. Bernstein, MD, FCAP


Allan Charles Wilson (18 October 1934 – 21 July 1991) was a Professor of Biochemistry at the University of California, Berkeley, a pioneer in the use of molecular approaches to understand evolutionary change and reconstruct phylogenies, and a revolutionary contributor to the study of human evolution. He was one of the most controversial figures in post-war biology; his work attracted a great deal of attention both from within and outside the academic world. He is the only New Zealander to have won the MacArthur Fellowship.

He is best known for experimental demonstration of the concept of the molecular clock (with his doctoral student Vincent Sarich), which was theoretically postulated by Linus Pauling and Emile Zuckerkandl, revolutionary insights into the nature of the molecular anthropology of higher primates and human evolution, called Mitochondrial Eve hypothesis (with his doctoral students Rebecca L. Cann and Mark Stoneking).

Allan Wilson was born in Ngaruawahia, New Zealand, and raised on his family’s rural dairy farm at Helvetia, Pukekohe, about twenty miles south of Auckland. At his local Sunday School, the vicar’s wife was impressed by young Allan’s interest in evolution and encouraged Allan’s mother to enroll him at the elite King’s College secondary school in Auckland. There he excelled in mathematics, chemistry, and sports.

Wilson already had an interest in evolution and biochemistry, but intended to be the first in his family to attend university by pursuing studies in agriculture and animal science. Wilson met Professor Campbell Percy McMeekan, a New Zealand pioneer in animal science, who suggested that Wilson attend the University of Otago in southern New Zealand to further his study in biochemistry rather than veterinary science. Wilson gained a BSc from the University of Otago in 1955, majoring in both zoology and biochemistry.

The bird physiologist Donald S. Farner met Wilson as an undergraduate at Otago and invited him to Washington State University at Pullman as his graduate student. Wilson obliged and completed a master’s degree in zoology at WSU under Farner in 1957, where he worked on the effects of photoperiod on the physiology of birds.

Wilson then moved to the University of California, Berkeley, to pursue his doctoral research. At the time the family thought Allan would only be gone two years. Instead, Wilson remained in the United States, gaining his PhD at Berkeley in 1961 under the direction of biochemist Arthur Pardee for work on the regulation of flavin biosynthesis in bacteria. From 1961 to 1964, Wilson studied as a post-doc under biochemist Nathan O. Kaplan at Brandeis University in Waltham, Massachusetts. In Kaplan’s lab, working with lactate and malate dehydrogenases, Wilson was first introduced to the nascent field of molecular evolution. Nate Kaplan was one of the very earliest pioneers to address phylogenetic problems with evidence from protein molecules, an approach that Wilson later famously applied to human evolution and primate relationships. After Brandeis, Wilson returned to Berkeley where he set up his own lab in the Biochemistry department, remaining there for the rest of his life.

Wilson joined the UC Berkeley faculty of biochemistry in 1964, and was promoted to full professor in 1972. His first major scientific contribution was published as Immunological Time-Scale For Hominid Evolution in the journal Science in December 1967. With his student Vincent Sarich, he showed that evolutionary relationships of the human species with other primates, in particular the Great Apes (chimpanzees, gorillas, and orangutans), could be inferred from molecular evidence obtained from living species, rather than solely from fossils of extinct creatures.

Their microcomplement fixation method (see complement system) measured the strength of the immune reaction between an antigen (serum albumin) from one species and an antibody raised against the same antigen in another species. The strength of the antibody-antigen reaction was known to be stronger between more closely related species: their innovation was to measure it quantitatively among many species pairs as an “immunological distance”. When these distances were plotted against the divergence times of species pair with well-established evolutionary histories, the data showed that the molecular difference increased linearly with time, in what was termed a “molecular clock”. Given this calibration curve, the time of divergence between species pairs with unknown or uncertain fossil histories could be inferred. Most controversially, their data suggested that divergence times between humans, chimpanzees, and gorillas were on the order of 3~5 million years, far less than the estimates of 9~30 million years accepted by conventional paleoanthropologists from fossil hominids such as Ramapithecus. This ‘recent origin’ theory of human/ape divergence remained controversial until the discovery of the “Lucy” fossils in 1974.

Wilson and another PhD student Mary-Claire King subsequently compared several lines of genetic evidence (immunology, amino acid differences, and protein electrophoresis) on the divergence of humans and chimpanzees, and showed that all methods agreed that the two species were >99% similar.[4][19] Given the large organismal differences between the two species in the absence of large genetic differences, King and Wilson argued that it was not structural gene differences that were responsible for species differences, but gene regulation of those differences, that is, the timing and manner in which near-identical gene products are assembled during embryology and development. In combination with the “molecular clock” hypothesis, this contrasted sharply with the accepted view that larger or smaller organismal differences were due to large or smaller rates of genetic divergence.

In the early 1980s, Wilson further refined traditional anthropological thinking with his work with PhD students Rebecca Cann and Mark Stoneking on the so-called “Mitochondrial Eve” hypothesis.[20] In his efforts to identify informative genetic markers for tracking human evolutionary history, he focused on mitochondrial DNA (mtDNA) — genes that are found in mitochondria in the cytoplasm of the cell outside the nucleus. Because of its location in the cytoplasm, mtDNA is passed exclusively from mother to child, the father making no contribution, and in the absence of genetic recombination defines female lineages over evolutionary timescales. Because it also mutates rapidly, it is possible to measure the small genetic differences between individual within species by restriction endonuclease gene mapping. Wilson, Cann, and Stoneking measured differences among many individuals from different human continental groups, and found that humans from Africa showed the greatest inter-individual differences, consistent with an African origin of the human species (the so-called “Out of Africa” hypothesis). The data further indicated that all living humans shared a common maternal ancestor, who lived in Africa only a few hundreds of thousands of years ago.

This common ancestor became widely known in the media and popular culture as the Mitochondrial Eve. This had the unfortunate and erroneous implication that only a single female lived at that time, when in fact the occurrence of a coalescent ancestor is a necessary consequence of population genetic theory, and the Mitochondrial Eve would have been only one of many humans (male and female) alive at that time.[2][3] This finding was, like his earlier results, not readily accepted by anthropologists. Conventional hypothesis was that various human continental groups had evolved from diverse ancestors, over several million of years since divergence from chimpanzees. The mtDNA data, however, strongly suggested that all humans descended from a common, quite recent, African mother.

Wilson became ill with leukemia, and after a bone marrow transplant, died on Sunday, 21 July 1991, at the Fred Hutchinson Memorial Cancer Research Center in Seattle. He had been scheduled to give the keynote address at an international conference the same day. He was 56, at the height of his scientific recognition and powers.

Wilson’s success can be attributed to his strong interest and depth of knowledge in biochemistry and evolutionary biology, his insistence of quantification of evolutionary phenomena, and has early recognition of new molecular techniques that could shed light on questions of evolutionary biology. After development of quantitative immunological methods, his lab was the first to recognize restriction endonuclease mapping analysis as a quantitative evolutionary genetic method, which led to his early use of DNA sequencing, and the then-nascent technique of PCR to obtain large DNA sets for genetic analysis of populations. He trained scores of undergraduate, graduate (34 people, 17 each of men and women, received their doctoral degrees in his lab), and post-doctoral students in molecular evolutionary biology, including sabbatical visitors from six continents. His lab published more than 300 technical papers, and was recognized as a mecca for those wishing to enter the field of molecular evolution in the 1970s and 1980s.

The Allan Wilson Centre for Molecular Ecology and Evolution was established in 2002 in his honour to advance knowledge of the evolution and ecology of New Zealand and Pacific plant and animal life, and human history in the Pacific. The Centre is under the Massey University, at Palmerston North, New Zealand, and is a national collaboration involving the University of Auckland, Victoria University of Wellington, the University of Otago, University of Canterbury and the New Zealand Institute for Plant and Food Research.

A 41-minutes documentary film of his life entitled Allan Wilson, Evolutionary: Biochemist, Biologist, Giant of Molecular Biology was released by Films Media Group in 2008.


Allan Charles Wilson. 18 October 1934 — 21 July 1991

Rebecca L. Cann

Department of Cell and Molecular Biology, University of Hawaii at Manoa, Biomedical Sciences Building T514, 1960 East–West Rd, Honolulu, HI 96822, USA

Abstract

Allan Charles Wilson was born on 18 October 1934 at Ngaruawahia, New Zealand. He died in Seattle, Washington, on 21 July 1991 while undergoing treatment for leukemia.  Allan was known as a pioneering and highly innovative biochemist, helping to define the field of molecular evolution and establish the use of a molecular clock to measure evolutionary change between living species. The molecular clock, a method of measuring the timescale of evolutionary change between two organisms on the basis of the number of mutations that they have accumulated since last sharing a common genetic ancestor, was an idea initially championed by Émile Zuckerkandl and Linus Pauling (Zuckerkandl & Pauling 1962), on the basis of their observations that the number of changes in an amino acid sequence was roughly linear with time in the aligned hemoglobin proteins of animals. Although it is now not unusual to see the words ‘molecular evolution’ and ‘molecular phylogeny’ together, when Allan formed his own biochemistry laboratory in 1964 at the University of California, Berkeley, many scientists in the field of evolutionary biology considered these ideas complete heresy. Allan’s death at the relatively young age of 56 years left behind his wife, Leona (deceased in 2009), a daughter, Ruth (b. 1961), and a son, David (b. 1964), as well his as mother, Eunice (deceased in 2002), a younger brother, Gary Wilson, and a sister, Colleen Macmillan, along with numerous nieces, nephews and cousins in New Zealand, Australia and the USA. In this short span of time, he trained more than 55 doctoral students and helped launch the careers of numerous postdoctoral fellows.

Allan Charles Wilson, Biochemistry; Molecular Biology: Berkeley

1934-1991

Professor

The sudden death of Allan Wilson, of leukemia, on 21 July 1991, at the age of 56, and at the height of his powers, robbed the Berkeley campus and the international scientific community of one of its most active and respected leaders.

Read Full Post »

Larry H Bernstein, MD, Reporter

Leaders in Pharmaceutical Intelligence

Lasker~Koshland
Special Achievement Award in Medical Science

Award Description

Mary-Claire King
For bold, imaginative, and diverse contributions to medical science and human rights — she discovered the BRCA1 gene locus that causes hereditary breast cancer and deployed DNA strategies that reunite missing persons or their remains with their families.

The 2014 Lasker~Koshland Award for Special Achievement in Medical Science honors a scientist who has made bold, imaginative, and diverse contributions to medical science and human rights. Mary-Claire King(University of Washington, Seattle) discovered the BRCA1 gene locus that causes hereditary breast cancer and deployed DNA strategies that reunite missing persons or their remains with their families. Her work has touched families around the world.

As a statistics graduate student in the late 1960s, King took the late Curt Stern’s genetics course just for fun. The puzzles she encountered there—problems posed by Stern—enchanted her. She was delighted to learn that people could be paid to solve such problems, and that mathematics holds their key. She decided to study genetics and never looked back.

During her Ph.D. work with the late Allan Wilson (University of California, Berkeley), King discovered that the sequences of human and chimpanzee proteins are, on average, more than 99 percent identical; DNA sequences that do not code for proteins differ only a little more. The two primates therefore are much closer cousins than suggested by fossil studies of the time. The genetic resemblance seemed to contradict obvious distinctions: Human brains outsize those of chimps; their limbs dwarf ours; and modes of communication, food gathering, and other lifestyle features diverge dramatically. King and Wilson proposed that these contrasts arise not from disparities in DNA sequences that encode proteins, but from a small number of differences in DNA sequences that turn the protein-coding genes on and off.

Just as genetic changes drive species in new directions, they also can propel cells toward malignancy. From an evolutionary perspective, the topic of breast cancer began to intrigue King. The illness runs in families and is clearly inherited, yet many affected women have no close relatives with the disease. It is especially deadly for women whose mothers succumbed to it—and risk increases for those who have a mother or sister with breast cancer, particularly if the cancer struck bilaterally or before menopause. Unlike the situation with lung cancer, no environmental exposure distinguishes sisters who get breast cancer from those who remain disease free.

By studying a rare familial cancer, Alfred Knudsen (Lasker Clinical Medical Research Award, 1998) had shown in the early 1970’s how an inherited genetic defect could increase vulnerability to cancer. In the model he advanced, some families harbor a damaged version of a gene that normally encourages proper cellular behavior. Genetic mishaps occur during a person’s lifetime, and a second “hit” in a cell with the first physiological liability nudges the injured cell toward malignancy. A similar story might play out in families with a high incidence of breast cancer, King reasoned. She began to hunt for the theoretical pernicious gene in 1974.

2014_illustration_special
The hunt
Many geneticists doubted that susceptibility to breast cancer would map to a single gene; even if it did, finding the culprit seemed unlikely for numerous reasons. First, most cases are not familial and the disease is common—so common that inherited and non-inherited cases could occur in the same families. Furthermore, the malady might not strike all women who carry a high-risk gene, and different families might carry different high-risk genes. Prevailing views held that the ailment arises from the additive effects of multiple undefined genetic and environmental insults and from complicated interactions among them. No one had previously tacked such complexities, and an attempt to unearth a breast cancer gene seemed woefully naïve.

To test whether she could find evidence that particular genes increase the odds of getting breast cancer, King applied mathematical methods to data from more than 1500 families of women younger than 55 years old with newly diagnosed breast cancer. The analysis, published in 1988, suggested that four percent of the families carry a single gene that predisposes individuals to the illness.

The most convincing way to validate this idea was to track down the gene. Toward this end, King analyzed DNA from 329 participating relatives with 146 cases of invasive breast cancer. In many of the 23 families to which the participants belonged, the scourge struck young women, often in both breasts, and in some families, even men.

In late 1990, King (by then a professor at the University of California, Berkeley) hit her quarry. She had zeroed in on a suspicious section of chromosome 17 that carried particular genetic markers in women with breast cancer in the most severely affected families. Somewhere in that stretch of DNA lay the gene, which she named BRCA1.

This discovery spurred an international race to find the gene. Four years later, scientists at Myriad Genetics, Inc. isolated it. Alterations in either BRCA1 or a second breast-cancer susceptibility gene, BRCA2, found by Michael Stratton and colleagues (Institute of Cancer Research, UK) increase risk of ovarian as well as breast cancer. The proteins encoded by these genes help maintain cellular health by repairing marred DNA. When theBRCA1 or BRCA2 proteins fail to perform their jobs, genetic integrity is compromised, thus setting the stage for cancer.

About 12 percent of women in the general population get breast cancer at some point in their lives. In contrast, 65 percent of women who inherit an abnormal version of BRCA1 and about 45 percent of women who inherit an abnormal version of BRCA2 develop breast cancer by the time they are 70 years old. Individuals with troublesome forms of BRCA1 and BRCA2 can now be identified, monitored, counseled, and treated appropriately.

Harmful versions of other genes also predispose women to breast cancer, ovarian cancer, or both. Several years ago, King devised a scheme to screen for all of these genetic miscreants. This strategy allows genetic testing and risk determination for breast and ovarian cancer; it is already in clinical practice.

Genetic tools, human rights
King has applied her expertise to aid people who suffer from ills perpetrated by humans as well as genes. She helped find the “lost children” of Argentina—those who had been kidnapped as infants or born while their mothers were in prison during the military regime of the late 1970s and early 1980s. Some of these youngsters had been illegally adopted, many by military families. In 1983, King began identifying individuals, first with a technique that was originally designed to match potential organ transplant donors and recipients. She then developed an approach that relies on analysis of DNA from mitochondria—a cellular component that passes specifically from mother to child, and is powerful for connecting people to their female forebears. King helped prove genetic relationships and thus facilitated the reunion of more than 100 of the children with their families.

Later, the Argentinian government asked if she could help identify dead bodies of individuals thought to have been murdered. King harnessed the same method to figure out who had been buried in mass graves. She established that teeth, whose enamel coating protects DNA in the dental pulp from degradation, offer a valuable resource when attempting to trace remains in situations where long periods have elapsed since the time of death.

This and related approaches have been used to identify soldiers who went missing in action, including the remains of an American serviceman who was buried beneath the Tomb of the Unknowns in Arlington National Cemetery for 14 years, as well as victims of natural disasters and man-made tragedies such as 9/11.

Mary-Claire King has employed her intellect, dedication, and ethical sensibilities to generate knowledge that has catalyzed profound changes in health care, and she has applied her expertise to promote justice where nefarious governments have terrorized their citizens.

by Evelyn Strauss

Read Full Post »

The History of Hematology and Related Sciences

Curator: Larry H. Bernstein, MD, FCAP


The History of Hematology and Related Sciences: A Historical Review of Hematological Diagnosis from 1880 -1980


Blood Description: The Analysis of Blood Elements a Window into Diseases

Diagnosing bacterial infection (BI) remains a challenge for the attending physician. An ex vivo infection model based on human fixed polymorphonuclear neutrophils (PMNs) gives an autofluorescence signal that differs significantly between stimulated and unstimulated cells. We took advantage of this property for use in an in vivo pneumonia mouse model and in patients hospitalized with bacterial pneumonia. A 2-fold decrease was observed in autofluorescence intensity for cytospined PMNs from broncho-alveolar lavage (BAL) in the pneumonia mouse model and a 2.7-fold decrease was observed in patients with pneumonia when compared with control mice or patients without pneumonia, respectively. This optical method provided an autofluorescence mean intensity cut-off, allowing for easy diagnosis of BI. Originally set up on a confocal microscope, the assay was also effective using a standard epifluorescence microscope. Assessing the autofluorescence of PMNs provides a fast, simple, cheap and reliable method optimizing the efficiency and the time needed for early diagnosis of severe infections. Rationalized therapeutic decisions supported by the results from this method can improve the outcome of patients suspected of having an infection.

Monsel A, Le´cart S, Roquilly A, Broquet A, Jacqueline C, et al. (2014) Analysis of Autofluorescence in Polymorphonuclear Neutrophils: A New Tool for Early Infection Diagnosis. PLoS ONE 9(3): e92564.
http://dx.doi.org:/10.1371/journal.pone.0092564

This study was designed to validate or refute the reliability of total lymphocyte count (TLC) and other hematological parameters as a substitute for CD4 cell counts. Participants consisted of two groups, including 416 antiretroviral naive (G1) and 328 antiretroviral experienced (G2) patients. CD4+ T cell counts were performed using a Cyflow machine. Hematological parameters were analyzed using a hematology analyzer. The median ± SEM CD4 count (range) of participants in G1 was 199 ± 10.9 (5–1840 cells/μL) and the median ± SEM TLC (range) was 1. 61 ± 0.05 (0.07–6.63 × 10³/μL). The corresponding values among G2 were 421 ± 15.8 (13–1801) and 2.13 ± 0.04 (0.06–5.58), respectively. Using a threshold value of 1.2 × 10³/μL for TLC alone, the sensitivity of G1 was 88.4% (specificity (SP) 67.4%, the positive predictive value (PPV) 53.5% and negative predictive value (NPV) of 93.2% for CD4 , 200 cells/μL, the sensitivity for G2 was 83.3%, SP 85.3%, PPV 23.8%, and NPV of 93.2%. Using multiple parameters, including TLC , 1.2 × 10³/μL, hemoglobin , 10 g/dL, and platelets , 150 × 103/L, the sensitivity increased to 96.0% (SP, 82.7%; PPV, 80%; NPV, 96.7%) among G1, while no change was observed in the G2 cohort. TLC , 1.2 × 10³/μL alone is an insensitive predictor of CD4 count of , 200 cells/μL. Incorporating hemoglobin , 10 g/dL, and platelets , 150 × 103/L enhances the ability of TLC , 1.2 × 10³/μL to predict CD4 count , 200 cells/μL among the antiretroviral-naïve cohort. We recommend the use of multiple, inexpensively measured hematological parameters in the form of an algorithm for predicting CD4 count level.

Evaluating Total Lymphocyte Counts and Other Hematological Parameters as a Substitute for CD4 Counts in the Management of HIV Patients in Northeastern Nigeria. BA Denue, AU Abja, IM Kida, AH Gabdo, AA Bukar and CB Akawu.
Retrovirology: Research and Treatment 2013:5 9–16 http://dx.doi.org:/10.4137/RRT.S11562

Sepsis is a syndrome that results in high morbidity and mortality. We investigated the delta neutrophil index (DN) as a predictive marker of early mortality in patients with gram-negative bacteremia. Retrospective study. The DN was measured at onset of bacteremia and 24 hours and 72 hours later. The DN was calculated using an automatic hematology analyzer. Factors associated with 10-day mortality were assessed using logistic regression. A total of 172 patients with gram-negative bacteremia were included in the analysis; of these, 17 patients died within 10 days of bacteremia onset. In multivariate analysis, Sequental organ failure assessment scores (odds ratio [OR]: 2.24, 95% confidence interval [CI]: 1.31 to 3.84; P = 0.003), DN-day 1 ≥ 7.6% (OR: 305.18, 95% CI: 1.73 to 53983.52; P = 0.030) and DN-day 3 ≥ DN day 1 (OR: 77.77, 95% CI: 1.90 to 3188.05; P = 0.022) were independent factors associated with early mortality in gram-negative bacteremia. Of four multivariate models developed and tested using various factors, the model using both DN-day 1 ≥ 7.6% and DN-day 3 ≥ DN-day 1 was most predictive early mortality. DN may be a useful marker of early mortality in patients with gram-negative bacteremia. We found both DN-day 1 and DN trend to be significantly associated with early mortality.

Delta Neutrophil Index as a Prognostic Marker of Early Mortality in Gram Negative Bacteremia. HW Kim, JH Yoon, SJ Jin, SB Kim, NS Ku, SJ Jeong,
et al. Infect Chemother 2014;46(2):94-102. pISSN 2093-2340·eISSN 2092-6448
http://dx.doi.org/10.3947/ic.2014.46.2.94
Various indices derived from red blood cell (RBC) parameters have been described for distinguishing thalassemia and iron deficiency. We studied the microcytic to hypochromic RBC ratio as a discriminant index in microcytic anemia and compared it to traditional indices in a learning set and confirmed our findings in a validation set. The learning set comprised samples from 371 patients with microcytic anemia mean cell volume (MCV < 80 fL), which were measured on a CELL-DYN Sapphire analyzer and various discriminant functions calculated. Optimal cutoff values were established using ROC analysis. These values were used in the validation set of 338 patients. In the learning set, a microcytic to hypochromic RBC ratio >6.4 was strongly indicative of thalassemia (area under the curve 0.948). Green-King and England-Fraser indices showed comparable area under the ROC curve. However, the microcytic to hypochromic ratio had the highest sensitivity (0.964). In the validation set, 91.1% of microcytic patients were correctly classified using the M/H ratio. Overall, the microcytic to hypochromic ratio as measured in CELL-DYN Sapphire performed equally well as the Green-King index in identifying thalassemia carriers, but with higher sensitivity, making it a quick and inexpensive screening tool.
Differential diagnosis of microcytic anemia: the role of microcytic and hypochromic erythrocytes. E. Urrechaga, J.J.M.L. Hoffmann, S. Izquierdo, J.F. Escanero. Intl Jf Lab Hematology Aug 2014. http://dx.doi.org:/10.1111/ijlh.12290

Achievement of complete response (CR) to therapy in chronic lymphocytic leukemia (CLL) has become a feasible goal, directly correlating with prolonged survival. It has been established that the classic definition of CR actually encompasses a variety of disease loads, and more sensitive multiparameter flow cytometry [and polymerase chain reaction methods] can detect the disease burden with a much higher sensitivity. Detection of malignant cells with a sensitivity of 1 tumor cell in 10,000 cells (10–4), using the above-mentioned sophisticated techniques, is the current cutoff for minimal residual disease (MRD). Tumor burdens lower than 10–4 are defined as MRD-negative. Several studies in CLL have determined the achievement of MRD negativity as an independent favorable prognostic factor, leading to prolonged disease-free and overall survival, regardless of the treatment protocol or the presence of other pre-existing prognostic indicators. Minimal residual disease evaluation using flow cytometry is a sensitive and applicable approach which is expected to become an integral part of future prospective trials in CLL designed to assess the role of MRD surveillance in treatment tailoring.

Minimal Residual Disease Surveillance in Chronic Lymphocytic Leukemia by Fluorescence-Activated Cell Sorting. S Ringelstein-Harlev, R Fineman.
Rambam Maimonides Med J. Oct 2014   5 (4)  e0027. http://dx.doi.org:/10.5041/RMMJ.10161

Natural Killer cells (CD3-CD16+CD56+) are a major players in innate immunity, both as direct cytotoxic effectors as well as regulators for other innate immunity cell types. We have shown that, using the FlowCellect™ human NK cell characterization kit, one can achieve accurate phenotyping on a variety of sample types, including whole blood samples. Using the same kit to perform an NK cell cytotoxicity test, we demonstrate that unbound K562 target cells can be clearly distinguished from those that have been engaged by CD56+ NK cells, and each of these populations can be further investigated for viability using the eFluor 660® dye.

Analysis of NK cell subpopulations in whole blood

Analysis of NK cell subpopulations in whole blood

Analysis of NK cell subpopulations in whole blood

A

Proportion of K562 target cells bound to NK cells

Proportion of K562 target cells bound to NK cells

In a 5:1 effector cell:target cell population, 8% of the K562 cells were bound to NK cells (Figure 3B). 84% of the bound K562 cells were viable (Figure 3C) stained with fixable viability dye), while 96% of the unbound K562 cells were viable (Figure 3D). (B,C,D not shown)

Characterization of Natural Killer Cells Using Flow Cytometry.
EMD Millipore is a division of Merck KGaA, Darmstadt, Germany.

Red blood cell distribution width (RDW) is increased in liver disease. Its clinical significance, however, remains largely unknown. The aim of this study was to identify whether RDW was a prognostic index for liver disease. Retrospective: 33 patients with non-cirrhotic HBV chronic hepatitis, 125 patients with liver cirrhosis after HBV infection, 81 newly diagnosed primary epatocellular carcinoma (pHCC) patients, 17 alcoholic liver cirrhosis patients and 42 patients with primary biliary cirrhosis (PBC). Sixty-six healthy individuals represented the control cohort. The relationship between RDW on admission and clinical features: The association between RDW and hospitalization outcome was estimated by receiver operating curve (ROC) analysis and a multivariable logistic regression model. Increased RDW was observed in liver disease patients. RDW was positively correlated with serum bilirubin and creatinine levels, prothrombin time, and negatively correlated with platelet counts and serum albumin concentration. A subgroup analysis, considering the different etiologies, revealed similar findings. Among the patients with liver cirrhosis, RDW increased with worsening of Child-Pugh grade. In patients with PBC, RDW positively correlated with Mayo risk score. Increased RDW was associated with worse hospital outcome, as shown by the AUC [95% confidence interval (CI)] of 0.76 (0.67 – 0.84). RDW above 15.15% was independently associated with poor hospital outcome after adjustment for serum bilirubin, platelet count, prothrombin time, albumin and age, with the odds ratio (95% CI) of 13.29 (1.67 – 105.68). RDW is a potential prognostic index for liver disease.

Red blood cell distribution width is a potential prognostic index for liver disease
Z Hua , Y Suna , Q Wanga , Z Han , Y Huang , X Liu , C Ding, et al.
Clin Chem Lab Med 2013; 51(7):1403–1408.
http://dx.doi.org:/10.1515/cclm-2012-0704

Blood Plasma and Red Blood Cells

Whole blood consists of red and white blood cells, as well as platelets suspended in a liquid referred to as blood plasma. According to the American Red Cross, plasma is 92% water and makes up 55% of blood volume. The permeability of blood plasma is equal to 1.

Red blood cells make up slightly lower blood volume than blood plasma — about 45% of whole blood. As you probably already know, these types of blood cells contain hemoglobin, which in turn consists of iron that helps transport oxygen throughout the body. The permeability of red blood cells is slightly less than 1,
(1 – 3.9e-6). Or to put it in words, red blood cell particles are diamagnetic.

Due to their magnetic properties, red blood cells may be separated from the plasma via a magnetophoretic approach. If the blood were to be in a channel subject to a magnetophoretic force, we could control where the red blood cells and the plasma go within the channels. In other words, because the red blood cells have different permeability, they can be separated from the flow channel. However, such methodology is beyond the year 1980.

Timeline of Major Hematology Landmarks

1877 Paul Ehrlich develops techniques to stain blood cells to improve microscopic visualization.

1897 The Diseases of Infancy and Childhood contains a 20-page chapter on diseases of the blood and is the first American pediatric medical textbook to provide significant hematologic information.

1821–1902 Rudolph Virchow, during a long and illustrious career, demonstrates the importance of fibrin in the blood coagulation process, coins the terms embolism and thrombosis, identifies the disease leukemia, and theorizes that leukocytes are made in response to inflammation.

1901 Karl Landsteiner and colleagues identify blood groups of A, B, AB, and O.

1907 Ludvig Hektoen suggests that the safety of transfusion might be improved by crossmatching blood between donors and patients to exclude incompatible mixtures. Reuben Ottenberg performs the first blood transfusion using blood typing and crossmatching in New York. Ottenberg also observes the Mendelian inheritance of blood groups and recognizes the “universal” utility of group O donors.

1910 The first clinical description of sickle cell published in medical literature.

1914 Sodium citrate is found to prevent blood from clotting, allowing blood to be stored between collection and transfusion.

1924 Pediatrics is the first comprehensive American publication on pediatric hematology.

1925 Alfred P. Hart performs the first exchange transfusion.

1925 Thomas Cooley describes a Mediterranean hematologic syndrome of anemia, erythroblastosis, skeletal disorders, and splenomegaly that is later called Cooley’s anemia and now thalassemia.

1936 Chicago’s Cook County Hospital establishes the first true “blood bank” in the United States.

1938 Dr. Louis Diamond (known as the “father of American pediatric hematology”) along with Dr. Kenneth Blackfan describes the anemia still known as Diamond-Blackfan anemia.

1941 The Atlas of the Blood of Children is published by Blackfan, Diamond, and Leister.

1945 Coombs, Mourant, and Race describe the use of antihuman globulin (later known as the “Coombs Test”) to identify “incomplete” antibodies.

1954 The blood product cryoprecipitate is developed to treat bleeds in people with hemophilia.

1950s The “butterfly” needle and intercath are developed, making IV access easier and safer.

1961 The role of platelet concentrates in reducing mortality from hemorrhage in cancer patients is recognized.

1962 The first antihemophilic factor concentrate to treat coagulation disorders in hemophilia patients is developed through fractionation.

1969 S. Murphy and F. Gardner demonstrate the feasibility of storing platelets at room temperature, revolutionizing platelet transfusion therapy.

1971 Hepatitis B surface antigen testing of blood begins in the United States.

1972 Apheresis is used to extract one cellular component, returning the rest of the blood to the donor.

1974 Hematology of Infancy and Childhood is published by Nathan and Oski.

As I write today my hospital celebrates its 150th anniversary. Great Ormond Street Children’s Hospital was founded on 14 February 1852 by the visionary Dr Charles West followed his belief that hospital care allied to research in children’s diseases would reduce child mortality from above 50% by the age of 15 years. It is foolish to believe that we can progress in medicine without a knowledge of the past and that much of life is based upon experience. When putting together a series of articles on the history of haematology, initially published in BJH, this was the main raison d’être, along with the belief that the practice of medicine has become increasingly serious but should also be fun and interesting and even occasionally uplifting to the spirit.

The central problem of any survey of the history of haematology is usually the question of balance. Achieving a degree of balance among themes and topics that will be satisfactory to practicing haematologists/physicians with an interest in blood diseases is essentially impossible. Our preference has been for themes of general interest rather than those of a purely scientific view into a field that has led the way in understanding the molecular basis of human disease.

  1. M. Hann, London, 2002; O. P. Smith, Dublin, 2002.

Origins of the Discipline `Neonatal Haematology’, 1925-75

In every modern neonatal intensive care unit (NICU), haematological problems are encountered daily. Many of these problems involve varieties of anaemia, neutropenia or thrombocytopenia that are unique to NICU patients. A characteristic aspect of these unique problems is that, if the neonate survives, the haematological problem will remit and will not recur later in life, nor will it evolve into a chronic illness (although the problem might occur in a future newborn sibling). This characteristic comes about because the common haematological problems of NICU patients are not genetic defects but are environmental stresses (such as infection, alloimmunization or a variety of maternal illnesses) that are imposed on a developmentally immature haematopoietic system.

In the USA, and in some parts of Europe, the unique haematological problems that occur among NICU patients are diagnosed and treated by neonatologists, not by paediatric haematologists. Although these haematological conditions were generally first described by haematologists, the conditions occur, obviously, in neonates. Thus, the neonatologist, who is familiar with intensive care management of neonates, has also become familiar with the diagnosis and management of the neonate’s common haematological disorders. A growing number of neonatologists have sought specific additional training in haematology, with the goals of discovering the mechanisms underlying the unique haematological problems of NICU patients and improving the management and outcome of the patients who have these conditions. These physicians have remained as neonatologists and they do not practice paediatric haematology, although their research contributions certainly come under the purview of haematology, or more precisely under the discipline of `neonatal haematology’. In many places in Europe, it is the haematologists rather than the neonatologists who have an academic and clinical interest in neonatal haematology.

The roots of the discipline of neonatal haematology can be traced to the early application of haematological methods to animal and human embryos and fetuses, such as found in the reports of Maximow (1924) and Wintrobe & Schumacker (1936). The clinical underpinnings of this discipline include reports of anaemia (Fikelstein, 1911) and jaundice (Blomfeld, 1901; YlppoÈ, 1913) among neonates.

Before the 1930s, very few studies and very few published clinical case reports originated from premature nurseries. Such nurseries had dubious beginnings, which were criticized by some physicians as more resembling circus exhibitions than medical care wards (Bonar, 1932). These units generally had mortality rates greatly exceeding 50% on the day of admission, with the majority of the first-day survivors having late deaths or serious long-term morbidity.

It was not until publication of the review of premature nursery care at the Children’s Hospital of Michigan, in 1932, that it was clear that some units had instituted systematic attempts to monitor and improve outcomes. A special care nursery had been established at the Children’s Hospital in 1926 and, in 1932, Drs Marsh Poole and Thomas Cooley reported their experience in that unit (Poole & Cooley, 1932). The report included  incubator design with temperature and humidity control, growth curves of patients on various feeding practices, mortality statistics and attempts to determine causes of death.

At the time premature nursery care was beginning to merit academic credentials, reports were published of haematological problems that were unique to the neonate. These papers included the seminal publication on erythroblastosis fetalis by Drs Diamond (Fig 1), Blackfan and Baty (Diamond et al, 1932), and the report of sepsis neonatorum at the Yale New Haven Hospital by Ethyl C. Dunham (Fig 2) (Dunham,

1933).

The first major textbook devoted to clinical haematology, as well as the first textbook of neonatology, contained very little information about what are today’s common NICU haematological problems. For instance, in the first edition of Clinical Hematology by Dr Maxwell M. Wintrobe (Fig 3), of the Johns Hopkins University Hospital (Wintrobe, 1942), several topics related to paediatric haematology were reviewed, but discussions of the haematological problems of neonates were limited to three – erythroblastosis fetalis, haemorrhagic disease of the newborn and the `anaemia of prematurity’. Similarly, Premature Infants: A Manual for

Physicians, the original neonatology textbook, published in 1948 by Dr Ethyl C. Dunham (Fig 2; Dunham, 1948), had only a few pages devoted to haematological problems – the same three discussed by Dr Wintrobe. Also, the classic neonatology text book, `The Physiology of the Newborn Infant’, published in 1945 by Dr Clement A. Smith, contained almost no discussion of haematological problems (Smith, 1945). hrombocytopenia, which is now diagnosed among 25-30% of NICU patients, and neutropenia, now diagnosed in 8-10% of NICU patients, were not mentioned.

The first article published in Paediatrics (1948) dealing with a neonatal haematological problem was in volume two, in which Dr Diamond detailed his technique for performing a replacement transfusion (which later became known as an `exchange’ transfusion) as a treatment for erythroblastosis fetalis (Diamond, 1949). The second paper published by Paediatrics containing aspects of neonatal haematology was 1 year later, when Sliverman & Homan (1949) described leucopenia among neonates with sepsis. Most of the 25 infants they described, who were treated at Babies Hospital in New York over an 11-year period, had `late-onset’ sepsis, beginning after 3 days of life. They reported 14 neonates with Escherichia coli sepsis and four with streptococcal or staphylococcal sepsis, and observed that leucopenia occurred occasionally among these patients but was uncommon. (Indeed, today neutropenia remains uncommon in `late-onset’ sepsis, but common in congenital or `early onset’ sepsis.)

Louis K. Diamond, MD, at Children's Hospital, Boston,

Louis K. Diamond, MD, at Children’s Hospital, Boston,

Louis K. Diamond, MD, at Children’s Hospital, Boston, MA. , date unknown (obtained with the kind assistance of Charles F. Simmons, MD, Harvard University).

Diagnosing neutropenia, anaemia or thrombocytopenia in a neonate obviously requires knowledge of the expected normal range for neutrophil concentration, haematocrit and platelet concentration in the appropriate reference population. Early contributions to neonatal haematology included the publications of these reference ranges. The landmark studies included the range of blood leucocyte and neutrophil concentrations in neonates published in 1935 by Dr Katsuji Kato from the Department of Paediatrics at the University of Chicago (Kato, 1935). He tabulated the leucocyte concentrations and differential counts of 1081 children, ranging from birth to 15 years of age. A striking finding of his report (Fig 4) was the very high neutrophil counts during the first hours and days of life. Blood neutrophil concentrations among neonates with infections were published during the early and mid-1970s by Dr Marietta Xanthou (Fig 5) at the Hammersmith Hospital in London (Xanthou, 1970, 1972), and by Drs Barbara Manroe and Charles Rosenfeld (Fig 6) at the University of Texas Southwestern Medical Center in Dallas, Texas (Manroe et al, 1977).

Normal values for haemoglobin, haematocrit, erythrocyte indices and leucocyte concentrations were refined by DeMarsh et al (1942, 1948), and in a series of publications in the early 1950s in Archives of Diseases of Children by Gairdner et al (1952a, b). These were followed by observations on human fetal haematopoiesis by Thomas and Yoffey in the British Journal of Haematology (Thomas & Yoffey, 1962, 1964), and by the work on blood volume during the 1960s (Usher et al, 1963, Usher & Lind, 1965; Yao et al, 1967, 1968). Normal ranges for blood platelet counts in ill and well preterm and term infants were published in the early 1970s (Sell et al, 1973; Corrigan, 1974).

The first publication addressing the problem of neutropenia accompanying fatal early onset bacterial sepsis was that of Tygstrup et al (1968). This was a report of a near-term male with congenital Listeria sepsis who lived for only 4 h. The platelet count was 80*109/l and the leucocyte count was 13´7*109/l, but no granulocytes were observed on the differential count, which consisted of 84% lymphocytes, 8% monocytes and 8% leucocyte precursors. A sternal marrow aspirate was taken of the infant shortly before death that revealed myeloblasts, promyelocytes and myelocytes, but no band or segmented neutrophils.

An important advance in understanding the blood neutrophil count during neonatal sepsis occurred with the back-to-back papers in Archives of Diseases of Childhood in 1972 by Dr Marietta Xanthou of Hammersmith Hospital, London (Xanthou, 1972), and Drs Gregory and Hey of Babies’ Hospital, Newcastle upon Tyne (Gregory & Hey, 1972). Both papers reported that neonates who had life threatening (or indeed fatal) infections became neutropenic prior to death. Dr Xanthou reported 35 ill preterm and term babies within their first 28 d of life. Twenty-four were ill but not infected, and these had normal blood neutrophil concentrations and morphology. However, among the 11 who were ill with a bacterial infection, neutrophilia was observed in the survivors, but neutropenia, a `left shift’, and toxic granulation were observed in the non-survivors. Consistent with this observation, Gregory and Hey reported three neonates who died with overwhelming bacterial sepsis and noted that all had profound neutropenia. Neutrophilia was common among the survivors and neutropenia, a “left shift’, and specific neutrophil morphological changes were seen among those who subsequently died.

A pivotal publication that launched the search for mechanistic information and successful treatments was that of Dr Barbara Manroe, a fellow in Neonatal Medicine, and her mentor Dr Charles Rosenfeld (Fig 6) from the University of Texas, South-western, Parkland Hospital in Dallas, Texas (Manroe et al, 1977). They evaluated 45 neonates who had culture-proven group B streptococcal infection and found that 39 had abnormal leucocyte counts: 25 neutrophilia and 14 neutropenia, and that 41 had a `left shift’. This paper was the first to quantify the `left shift’ using a method that has since become popular in neonatology – the ratio of immature neutrophils to total neutrophils on the differential cell count.

From these beginning, hundreds of studies using experimental models and clinical observations and trials were published, detailing the kinetic and molecular mechanisms accounting for this common variety of neutropenia. Marked improvements in the survival of neonates with this condition have come about through combined efforts, including early maternal screening for GBS carriage, early anti-microbial administration to ill neonates, non-specific antibody administration and a variety of measures to improve supportive care of neonates with early onset sepsis.

In the early 1930s, Dr Helen Mackay worked as a paediatrician in Mother’s Hospital, a maternity hospital located in the north-east section of London. Acting on the observation of Lichtenstein (1921) that infants of subnormal birth weight regularly became anaemic in the first months of life, she measured and reported serial heel-stick haemoglobin levels on 150 infants during their first 6 months. Thirty-nine of these infants weighed under five pounds at birth (six were under four pounds), 52 weighed five to six pounds, and 59 weighed six pounds and upwards. She showed that babies of the lightest birth weights had the most rapid fall in haemoglobin and that these fell to lower levels than those of babies of heavier birth weight (MacKay et al, 1935). Figure 7 contrasts this fall in babies weighing `3-4 lbs odd at birth’ with those weighing `5 lbs odd at birth’.

Her attempts to prevent the anaemia of prematurity failed,  but her work constituted the first clear definition of the `anaemia of prematurity’ and showed that iron administration did not prevent this condition. In the early 1950s, Douglas Gairdner, John Marks and Janet D. Roscoe, of the Department of Pathology of Cambridge Maternity Hospital, published pioneering studies in blood formation in infancy (Gairdner et al, 1952a, b). Studying 105 blood samples and 102 bone marrow samples, they concluded that `erythropoiesis ceases when the oxygen saturation just after birth increases from about 65% in the umbilical vein to .95% just after birth’. Publications by Dr Irving Schulman, in the mid- to late 1950s, defined three phases of the anaemia of prematurity and provided a mechanistic explanation for the anaemia (Schulman & Smith, 1954; Schulman, 1959). His work illustrated that the early and intermediate phases of this anaemia occur in the face of relative iron excess and are unaffected by prophylactic iron administration.

Haemoglobin levels during the first 25 weeks of life among

Haemoglobin levels during the first 25 weeks of life among

Haemoglobin levels during the first 25 weeks of life among neonates in London [by permission; Archives Diseases of Children, (MacKay, 1935)].

In 1963, Dr Sverre Halvorsen of the Department of Paediatrics at Rikshospatalet in Oslo, Norway (Fig 9), provided an underlying explanation for the observations made by MacKay, Gairdner and Schulman (Halvorson, 1963). He observed that, compared with the blood of healthy adults, umbilical cord blood of healthy neonates had a high erythropoietin concentration, but the concentration was considerably higher in the plasma of severely erythroblastotic, anaemic infants. Among the healthy infants, erythropoietin levels fell to unmeasurably low concentrations after delivery, but levels remained elevated in hypoxic and cyanotic infants. Dr Per Haavardsholm Finne, also of the Children’s Department, Paediatric Research Institute and Department of Obstetrics and Gynaecology at Rikshospitalet in Oslo, observed high oncentrations of erythropoietin in the amniotic fluid and the umbilical cord blood after fetal hypoxia (Finne, 1964, 1967).

In subsequent studies, Dr Halvorsen observed lower plasma erythropoietin concentrations in the cord blood of preterm infants at delivery than in term neonates at delivery (Halvorsen & Finne, 1968). These observations supported the concept of Gairdner et al (1952a, b) that the postnatal fall in erythropoiesis (the `physiologic anaemia’ of neonates) is as a result of an increase in oxygen delivery to tissues following birth and is mediated by a fall in circulating erythropoietin concentration. The observations gave rise to the postulate that the `anaemia of prematurity’ was an exaggeration of this physiological anaemia and involved a limitation of preterm infants to appropriately increase erythropoietin production.

Many landmark reports of haematological findings of neonates that were published between 1925 and 1975 were not detailed in this review because they were outside the restricted topics selected.

Robert D. Christensen, MD, Gainesville, FL
Brit J Haem 2001; 113: 853-860

Towards Molecular Medicine; Reminiscences of the Haemoglobin Field

When historians of medicine in the twentieth century start to piece together the complex web of events that led from a change of emphasis of medical research from studies of patients and their organs to disease at the levels of cells and molecules they will undoubtedly have their attention drawn to the haemoglobin field, particularly the years that followed Linus Pauling’s seminal paper in 1949 which described sickle-cell anaemia as a `molecular disease’. These are personal reminiscences of some of the highlights of those exciting times, and of those who made them happen.

One of my first patients serving the RAMC was a Nepalese Ghurka child who was kept alive from the first few months of life with regular blood transfusion without a diagnosis. Henry Kunkel published a paper which described how, using electrophoresis in slabs of starch, he had found a minor component of human haemoglobin (Hb), Hb A2, the proportion of which was elevated in some carriers of thalassaemia. After several weeks spent knee deep in potato starch, we found that the Ghurka child’s parents had increased Hb A2 levels and, hence, that she was likely to be homozygous for thalassaemia. I was hauled up before the Director General of Medical Services for the Far East Land Forces and told that I could be court marshalled for not getting permission from the War House (Office) to publish information about military personnel. `And, in any case’, he added, `it is bad form to tell the world that one of our pukka regiments has bad genes; don’t do it again’.

Just before the end of my National Service I arranged to go to Johns Hopkins Hospital in Baltimore to train in genetics and haematology. I was told that I was wasting my time working on haemoglobin because there was `nothing left to do’. `Start exploring red cell enzymes’, he suggested. On arriving in Baltimore in 1960 it turned out that human genetics, and the haemoglobin field in particular, were bubbling with excitement and potential. The only lessons for those contemplating careers in medical research from this chapter of academic and military gaffs are that, regardless of the working conditions, when there are sick people there are always interesting research questions to be asked.

The excitement of the haemoglobin field in 1960 reflected the chance amalgamation of several disciplines in the 1950s, particularly X-ray crystallography, protein chemistry, human genetics and haematology.

From the early 1930s the structure of proteins became one of the central problems of biochemistry. At that time, the only way of tackling this problem was by X-ray crystallography. In 1937 Felix Haurowitz suggested to Max Perutz (Fig 1) that an X-ray study of haemoglobin might be a good subject for his doctoral thesis. He was given some large crystals of horse methaemoglobin which gave excellent Xray diffraction patterns.

Max Perutz

Max Perutz

However, there was a major snag; an X-ray diffraction pattern provided only half the information required to solve the structure of a protein, that is the amplitudes of diffracted rays, while the other half, their phases, could not be determined. But in 1953, they discovered that it could be solved in two dimensions by comparison of the diffraction patterns of a crystal of native haemoglobin with that of haemoglobin reacted with mecuribenzoate, which combines with its two reactive sulphydryl groups. In short, to solve the structure in three dimensions required the comparison of the diffraction patterns of at least three crystals, one native and two with heavy atoms combined with different sites on the haemoglobin molecule. In 1959 this approach yielded the first three-dimensional model of haemoglobin, at 5´5 AÊ resolution.

Protein chemistry evolved side-by-side with X-ray crystallography during the 1950s. In 1951 Fred Sanger solved the structure of insulin, a remarkable tour de force which showed that proteins have unique chemical structures and amino acid sequences. Sanger had perfected methods for fractionation and characterization of small peptides by paper chromatography or electrophoresis. In 1956 Vernon Ingram (Fig 2), who, like Max Perutz, was a refugee from Germany, was set the task of studying the structure of haemoglobin from patients with sickle-cell anaemia. Ingram separated the peptides produced after globin had been hydrolysed with the enzyme trypsin, which cuts only at lysine and arginine residues. Although these amino acids accounted for 60 residues per mol of haemoglobin, only 30 tryptic peptides were obtained, indicating that haemoglobin consists of two identical half molecules. Re-examination of the amino-terminal sequences of haemoglobin by groups in the United States and Germany showed 2 mols of valine ± leucine and 2 mols of valine ± histidine ± leucine per mol of globin. These findings, which were in perfect agreement with the X-ray crystallographic results, suggested that haemoglobin is a tetramer composed of two pairs of unlike peptide chains, which were called α and β.

A seminal advance, and one which was to mark the beginning of molecular medicine, was the chance result of an overnight conversation on a train journey between Denver and Chicago. Linus Pauling, the protein chemist, and William Castle (Fig 3), one of the founding fathers of experimental haematology, were returning from a meeting in Denver and Castle mentioned to Pauling that he and his colleagues had noticed that when red cells from patients with sickle-cell anaemia are deoxygenated and sickle they show birefringence in polarized light.

Five generations of Boston haematology. Seated is William Castle. Standing (left to right) are Stuart Orkin, David Nathan and Alan Michelson. The picture on the left is of Dean David Edsall of Harvard Medical School who established the Thorndyke Laboratory at the Boston City Hospital. He was succeeded by Dean Peabody, who recruited both George Minot, who won the Nobel Prize for his work on pernicious anaemia, and William Castle, who should have also received it.

Pauling guessed that this might reflect a structural difference between normal and sickle-cell haemoglobin which could be detected by a change in charge. He gave this problem to one of his postdoctoral students, a young medical graduate called Harvey Itano. At that time they knew that a Swede, Arne Tiselius, had invented a machine for separating proteins according to their charge by electrophoresis. As there was no machine of this kind in Pauling’s laboratory, Itano and his colleagues set to and built one. Eventually they found that the haemoglobin of patients with sickle-cell anaemia behaves differently to that of normal people in an electric field, indicating that it must have a different amino acid composition. Even better, the haemoglobin of sickle-cell carriers was a mixture of both types of haemoglobin. This work was published in Science in 1949, under the title `Sickle-cell anaemia: a molecular disease’.

Perutz and Crick suggested to Ingram that he should apply Sanger’s techniques of peptide analysis to see if he could find any difference between normal and sickle cell haemoglobin. After digesting haemoglobin with trypsin, Ingram separated the peptides by electrophoresis and chromatography in two dimensions to produce what he later called `fingerprints’. He recalls that his first efforts looked like a watercolour that had been left out in the rain. But gradually things improved and he was able to show that the fingerprints of Hbs A and S were identical except for the position of one peptide. Using a method that had been developed a few years earlier by Pehr Edman, which allowed a peptide to be degraded one amino acid at a time in a stepwise fashion, Ingram found that this difference was due to the substitution of valine for glutamic acid at position 6 in the β chain of Hb S.

As well as demonstrating how a crippling disease can result from only a single amino acid difference in the haemoglobin molecule, this beautiful work had broader implications for molecular genetics. Although nothing was known about the nature of the genetic code at the time, the findings were compatible with the notion that the primary product of the β-globin gene is a peptide chain, a further development of the one-gene-one-enzyme concept, suggested earlier by Beadle and Tatum from their studies of Neurospora, and a prelude to the later studies of Yanofsky on Escherichia coli, which were to confirm this principle.

With the advent of simple filter paper electrophoresis, haemoglobin analysis became the province of clinical research laboratories during the 1950s and `new’ abnormal haemoglobins appeared almost by the week. Although many scientists were involved it was Hermann Lehmann (Fig 4) who became the father figure. Like Handel, Hermann was born in Halle and, also like the composer, made his home in Great Britain. He came to England as a refugee and at the beginning of the Second World War had a short period of internment as a `friendly alien’ at Huyton, close to Liverpool, an experience shared with many others, including Max Perutz. He travelled widely during his later war service in the RAMC and developed a wide international network which enabled him to discover 81 haemoglobin variants during his career.

Harvey Itano and Elizabeth Robinson showed that Hb Hopkins 2 is an a chain variant. Hence, it was now clear that there must be at least two unlinked loci involved in regulating haemoglobin production, a and b. The discovery of the λ and δ chains of Hbs F and A2, respectively, meant that there must be at least four loci involved. Subsequent family studies and analyses of unusual variants resulting from the production of δβ or λβ fusion chains led to the ordering of the non-α globin genes.

It had been known for some years that children with severe forms of thalassaemia might have persistent production of HbF and it was found later that some carriers might have elevated levels of Hb A2. The seminal observation in favour of this notion came from the study of patients who had inherited the sickle-cell gene from one parent and thalassaemia from the other. Sickle-cell thalassaemia was first described by Ezio Silvestroni and his wife Ida Bianco in 1946, although at the time they could not have known the full significance of their finding.  Phillip Sturgeon and his colleagues in the USA found that the pattern of haemoglobin production in patients with sickle-cell thalassaemia is quite different to that of heterozygotes for the sickle-cell gene; the effect of the thalassaemia gene is to reduce the amount of Hb A to below that of Hb S, i.e. exactly the  opposite to the ratio observed in sickle-cell carriers. As it was known that the sickle-cell mutation occurs in the β globin gene, it could be inferred that the action of the thalassaemia gene was to reduce the amount of β globin production from the normal allele. Indeed, from the few family studies available in 1960 there was a hint that this form of thalassaemia might be an allele of the β globin gene. Another major observation that was made in the mid-50 s was the association of unusual tetramer haemoglobins, β4 (Hb H) and λ4 (Hb Bart’s), with a thalassaemia phenotype. In 1959 Vernon Ingram and Tony Stretton proposed in a seminal article that there are two major classes, α and β, just as there are two major types of structural haemoglobin variants. They extended the ideas of Linus Pauling and Harvey Itano, who had suggested that defective globin synthesis in thalassaemia might be due to `silent’ mutations of the β globin genes, and postulated that the defects might lie outside the structural gene in the area of DNA in the connecting unit. work on the interactions of thalassaemia and haemoglobin variants in the late 1950s had moved the field to a considerably higher level of understanding than is apparent in the earlier papers of Pauling and Itano. In any case, in their paper Ingram and Stretton generously acknowledged the ideas of other workers, including Lehmann, Gerald, Neel and Ceppellini, that had allowed them to develop their conceptual framework of the general nature of thalassaemia. This interpretation of events, and the input of scientists from many different disciplines into these concepts, is supported by the published discussions of several conferences on haemoglobin held in the late 1950s.

Historical Review. Towards Molecular Medicine; Reminiscences of the Haemoglobin Field. D. J. Weatherall, Weatherall Institute of Molecular Medicine, University of Oxford. Brit J  Haem 115:729-738.

The Emerging Understanding of Sickle Cell Disease

The first indisputable case of sickle cell disease in the literature was described in a dental student studying in Chicago between 1904 and 1907 (Herrick, 1910). Coming from the north of the island of Grenada in the eastern Caribbean, he was first admitted to the Presbyterian Hospital, Chicago, in late December 1904 and a blood test showed the features characteristic of homozygous sickle cell (SS) disease. It was a happy coincidence that he was under the care of Dr James Herrick (Fig 1) and his intern Dr Ernest Irons because both had an interest in laboratory investigation and Herrick had previously presented a paper on the value of blood examination in reaching a diagnosis (Herrick, 1904-05). The resulting blood test report by Dr Irons described and contained drawings of the abnormal red cells (Fig 2) and the photomicrographs, showing irreversibly sickled cells.

People with positive sickle tests were divided into asymptomatic cases, `latent sicklers’, and those with features of the disease, `active sicklers’, and it was Dr Lemuel Diggs of Memphis who first clearly distinguished symptomatic cases called sickle cell anaemia from the latent asymptomatic cases which were termed the sickle cell trait (Diggs et al, 1933).

Prospective data collection in 29 cases of the disease showed sickling in all 42 parents tested (Neel, 1949), providing strong support for the theory of homozygous inheritance. A Colonial Medical Officer working in Northern Rhodesia (Beet, 1949) reached similar conclusions at the same time with a study of one large family (the Kapokoso-Chuni pedigree). The implication that sickle cell anaemia should occur in all communities in which the sickle cell trait was common and that its frequency would be determined by the prevalence of the trait did not appear to fit the observations from Africa. Despite a sickle cell trait prevalence of 27% in Angola, Texeira (1944) noted the active form of the disease to be `extremely rare’ and similar observations were made from East Africa. Lehmann and Raper (1949, 1956) found a positive sickling test in 45% of one community, from which homozygous inheritance would have predicted that nearly 10% of children had SS disease, yet not a single case was found. The discrepancy led to a hypothesis that some factor inherited from non-black ancestors in America might be necessary for expression of the disease (Raper, 1950).

The explanation for this apparent discrepancy gradually emerged. Working with the Jaluo tribe in Kenya, Foy et al (1951) found five cases of sickle cell anaemia among very young children and suggested that cases might be dying at an age before those sampled in surveys. A similar hypothesis was advanced by Jelliffe (1952) and was supported by data from the then Belgian Congo (Lambotte-Legrand Lambotte-Legrand, 1951, Lambotte-Legrand, 1952, Vandepitte, 1952). Although most cases were consistent with the concept of homozygous inheritance, exceptions continued to occur. Patients with a non-sickling parent of Mediterranean ancestry were later recognized to have sickle cell-β thalassaemia (Powell et al, 1950; Silvestroni & Bianco, 1952; Sturgeon et al, 1952; Neel et al, 1953a), a condition also widespread in African and Indian subjects that presents a variable syndrome depending on the molecular basis of the β thalassaemia mutation and the amount of HbA produced.

Phenotypically, there are two major groups in subjects of African origin, sickle cell-β+ thalassaemia manifesting 20-30% HbA and mutations at 229(A,G) or 288(C,T), and sickle cell-β0 thalassaemia with no HbA and mutations at IVS2-849(A,G) or IVS2-1(G,A). In Indian subjects, a more severe β thalassaemia mutation IVS1-5(G,C) results in a sickle cell-β+ thalassaemia condition with 3-5% HbA and a relatively severe clinical course.

Other double heterozygote conditions causing sickle cell disease include sickle cell-haemoglobin C (SC) disease, (Kaplan et al, 1951; Neel et al, 1953b), sickle cellhaemoglobin O Arab (Ramot et al, 1960), sickle cellhaemoglobin Lepore Boston (Stammatoyannopoulos & Fessas, 1963) and sickle cell-haemoglobin D Punjab (Cooke & Mack, 1934). The latter condition was first described in siblings in 1934, who were reinvestigated for confirmation of HbD (Itano, 1951), the clinical features reported (Sturgeon et al, 1955) and who were finally identified as HbD Punjab (Babin et al, 1964), representing a remarkable example of longitudinal observation and investigation in the same family over 30 years.

The maintenance of high frequencies of the sickle cell trait in the presence of almost obligatory losses of homozygotes in Equatorial Africa implied that there was either a very high frequency of HbS arizing by fresh mutations or that the sickle cell trait conveyed a survival advantage in the African environment. There followed a remarkable period in the 1950s when three prominent scientists were each addressing this problem in East Africa, Dr Alan Raper and Dr Hermann Lehmann in Uganda and Dr Anthony Allison in Kenya. It was quickly calculated that mutation rates were far too low to balance the loss of HbS genes from deaths of homozygotes (Allison, 1954a). An increased fertility of heterozygotes was proposed (Foy et al, 1954; Allison, 1956a) but never convincingly demonstrated. Raper (1949) was the first to suggest that the sickle cell trait might have a survival advantage against some adverse condition in the tropics and Mackey & Vivarelli (1952) suggested that this factor might be malaria. The close geographical association between the distribution of malaria and the sickle cell gene supported this concept (Allison, 1954b) and led to an exciting period in the history of research in sickle cell disease.

The first observations on malaria and the sickle cell trait were from Northern Rhodesia where Beet (1946, 1947) noted that malarial parasites were less frequent in blood films from subjects with the sickle cell trait. Allison (1954c) drew attention to this association, concluding that persons with the sickle cell trait developed malaria less frequently and less severely than those without the trait. This communication marked the beginning of a considerable controversy.Two studies failed to document differences in parasite densities between `sicklers’ and `non-sicklers’ (Moore et al, 1954; Archibald & Bruce-Chwatt, 1955) and Beutler et al (1955) were unable to reproduce the inoculation experiments of Allison (1954c). Raper (1955) speculated that some feature of Allison’s observations had accentuated a difference of lesser magnitude and postulated that the sickle cell trait might inhibit the establishment of malaria in non-immune subjects. The conflicting results in these and other studies appear to have occurred because the protective effect of the sickle cell trait was overshadowed by the role of acquired immunity. Examination of young children before the development of acquired immunity confirmed both lower parasite rates and densities in children with the sickle cell trait (Colbourne & Edington, 1956; Edington & Laing, 1957; Gilles et al, 1967) and it is now generally accepted that the sickle cell trait confers some protection against falciparum malaria during a critical period of early childhood between the loss of passively acquired immunity and the development of active immunity (Allison, 1957; Rucknagel & Neel, 1961; Motulsky, 1964). The mechanism of such an effect is still debated, although possible factors include selective sickling of parasitized red cells (Miller et al, 1956; Luzzatto et al, 1970) resulting in their more effective removal by the reticulo-endothelial system, inhibition of parasite growth by the greater potassium loss and low pH of sickled red cells (Friedman et al, 1979), and greater endothelial adherence of parasitized red cells (Kaul et al, 1994).

The occurrence of the sickle cell mutation and the survival advantage conferred by malaria together determine the primary distribution of the sickle cell gene. Equatorial Africa is highly malarial and the sickle cell mutation appears to have arisen independently on at least three and probably four separate occasions in the African continent, and the mutations were subsequently named after the areas where they were first described and designated the Senegal, Benin, Bantu and Cameroon haplotypes of the disease (Kulozik et al, 1986; Chebloune et al, 1988; Lapoumeroulie et al, 1992). The disease seen in North and South America, the Caribbean and the UK is predominantly of African origin and mostly of the Benin haplotype, although the Bantu is proportionately more frequent in Brazil (Zago et al, 1992). It is therefore easy to understand the common misconception held in these areas that the disease is of African origin.

However, the sickle cell gene is widespread around the Mediterranean, occurring in Sicily, southern Italy, northern Greece and the south coast of Turkey, although these are all of the Benin haplotype and so, ultimately, of African origin. In the Eastern province of Saudi Arabia and in central India, there is a separate independent occurrence of the HbS gene, the Asian haplotype. The Shiite population of the Eastern Province traditionally marry first cousins, tending to increase the prevalence of SS disease above that expected from the gene frequency (Al-Awamy et al, 1984). Furthermore, extensive surveys performed by the Anthropological Survey of India estimate an average sickle cell trait frequency of 15% across the states of Orissa, Madhya Pradesh and Masharastra which, with the estimated population of 300 million people, implies that there may be more cases of sickle cell disease born in India than in Africa. The Asian haplotype of sickle cell disease is generally associated with very high frequencies of alpha thalassaemia and high levels of fetal haemoglobin, both factors believed to ameliorate the severity of the disease.

The promotion of sickling by low oxygen tension and acid conditions was first recognized by Hahn & Gillespie (1927) and further investigated by others (Lange et al, 1951; Allison, 1956b; Harris et al, 1956). The morphological and some functional characteristics of irreversibly sickled cells were described (Diggs & Bibb, 1939; Shen et al, 1949), but the essential features of the polymerization of reduced HbS molecules had to await the developments of electron microscopy (Murayama, 1966; Dobler & Bertles, 1968; Bertles & Dobler, 1969; White & Heagan, 1970) and Xray diffraction (Perutz & Mitchison, 1950; Perutz et al, 1951). The early observations on the inducement of sickling by hypoxia led to the first diagnostic tests utilizing sealed chambers in which oxygen was removed by white cells (Emmel, 1917), reducing agents such as sodium metabisulphite (Daland & Castle, 1948) or bacteria such as Escherichia coli (Raper, 1969). These slide sickling tests are very reliable with careful sealing and the use of positive controls, but require a microscope and some expertise in its use. An alternative method of detecting HbS utilizes its relative insolubility in hypermolar phosphate buffers (Huntsman et al, 1970), known as the solubility test. Both the slide sickle test and the solubility test detect the presence of HbS, but fail to make the vital distinction between the sickle cell trait and forms of sickle cell disease. This requires the process of haemoglobin electrophoresis, which detects the abnormal mobility of HbS, HbC and many other abnormal haemoglobins within an electric field.

The contributions of several workers on the determinants of sickling (Daland & Castle, 1948), birefringence of deoxygenated sickled cells (Sherman, 1940) the lesser degree of sickling in very young children which implied that it was a feature of adult haemoglobin (Watson, 1948) led Pauling to perform Tiselius moving boundary electrophoresis on haemoglobin solutions from subjects with sickle cell anaemia and the sickle cell trait. The demonstration of electrophoretic and, hence, implied chemical differences between normal, sickle cell trait and sickle cell disease led to the proposal that it was a molecular disease (Pauling et al, 1949). The chance encounter between Castle and Pauling who shared a train compartment returning from a meeting in Denver in 1945, its background and implications, has passed into the folklore of medical research (Conley, 1980; Feldman & Tauber, 1997).

The nature of this difference was soon elucidated. The haem groups appeared identical, suggesting that the difference resided in the globin, but early chemical analyses revealed no distinctive differences (Schroeder et al, 1950; Huisman et al, 1955). Analyses of terminal amino acids also failed to reveal differences, although an excess of valine in HbS was noted but considered an experimental error (Havinga, 1953). The development of more sensitive methods of fingerprinting combining high voltage electrophoresis and chromatography allowed the identification of the essential difference between HbA and HbS. This method enabled the separation of constituent peptides and demonstrated that a peptide in HbS was more positively charged than in HbA (Ingram, 1956). This peptide was found to contain less glutamic acid and more valine, suggesting that valine had replaced glutamic acid (Ingram, 1957). The sequence of this peptide was shown to be Val-His-Leu-Thr-Pro-Val-Glu-Lys in HbS instead of the Val-His-Leu-Thr-Pro-Glu-Glu-Lys in HbA (Hunt & Ingram, 1958), a sequence which was subsequently identified as the amino-terminus of the b chain (Hunt & Ingram, 1959). This amino acid substitution was consistent with the genetic code and was subsequently found to be attributable to the nucleotide change from GAG to GTG (Marotta et al, 1977).

Haemolysis and anaemia. The presence of anaemia and jaundice in the first four cases suggested accelerated haemolysis, which was supported by elevated reticulocyte counts (Sydenstricker et al, 1923) and expansion of the bone marrow (Sydenstricker et al, 1923; Graham, 1924). The bone changes of medullary expansion and cortical thinning were noted in early radiological reports (Vogt & Diamond, 1930; LeWald, 1932; Grinnan, 1935). Drawing on a comparison of sickle cell disease and hereditary spherocytosis, Sydenstricker (1924) introduced the term `haemolytic crisis’ that has persisted in the literature to this day, despite the lack of evidence for such an entity in sickle cell disease. The increased requirements of folic acid and the consequence of a deficiency leading to megaloblastic change was not noted until much later (Zuelzer & Rutzky, 1953; Jonsson et al, 1959; MacIver & Went, 1960).

The haemoglobin level in SS disease of African origin is typically between 6 and 9 g/dl and is well tolerated, partly because of a marked shift in the oxygen dissociation curve (Scriver & Waugh, 1930; Seakins et al, 1973) so that HbS within the red cell behaves with a low oxygen affinity. This explains why patients at their steady state haemoglobin levels rarely show classic symptoms of anaemia and fail to benefit clinically from blood transfusions intended to improve oxygen delivery.

Graham R. Serjeant
Sickle Cell Trust, Kingston, Jamaica
Brit J Haem 2001; 112: 3-18

The Immune Haemolytic Anaemias

The growth in knowledge of the scientific basis of haemolytic anaemias, which have been a main interest of the author, has been remarkable, as have consequent advances in the practice of medicine since the mid-1930s. At that time, the cause and mechanism of important disorders such as the acquired antibody determined (immune) haemolytic anaemias, haemolytic disease of the newborn, hereditary spherocytosis and paroxysmal nocturnal haemoglobinuria were unknown or but partially understood.

According to Crosby (1952), William Hunter of London, in an article on pernicious anaemia published in 1888, was the first to use the term `haemolytic’ to denote an anaemia caused by excessive blood destruction. By the turn of the century, the term was being widely used in clinical literature. Peyton Rous, in his comprehensive review `Destruction of the red blood corpuscles in health and disease’ (Rous, 1923), concluded that the generally held view in the early 1930s was that about one-fifteenth of the erythrocyte mass was destroyed daily. Rous was aware of the pioneer work of Winifred Ashby (1919), who, by following the survival of serologically distinct but compatible transfused erythrocytes, had found that normal erythrocytes might live for up to 100 d in the recipients’ circulation. Subsequent work using radioactive chromium (51Cr) as an erythrocyte label, showed that Ashby’s data and conclusions were in fact correct, i.e. that normal erythrocytes in health circulate in the peripheral blood for approximately 110 d. Erythrocyte labelling with 51Cr also had a further advantage over the Ashby method in addition to enabling the life-span of the patients’ erythrocytes to be assessed in the circulation by surface counting, to detect and measure the accumulation of radioactivity in the spleen and liver, and thereby assess the organs’ role in haemolysis

In the first decade of the twentieth century Widal et al (1908a) and Le Gendre & Brulea (1909) reported that autohaemoagglutination was a striking finding in some cases of icteare heamolytique acquis, and also Chauffard & Trosier (1908) and Chauffard & Vincent (1909) had described the presence of haemolysins in the serum of patients suffering from intense haemolysis. The conclusion was that abnormal immune processes, i.e. the development of auto-antibodies damaging the patients’ own erythrocytes, might play a part in the genesis of some cases of acquired haemolytic anaemia. This was indeed antedated by the classic observations of Donath & Landsteiner (1904) and Eason (1906) on the mechanism of haemolysis in paroxysmal cold haemoglobinuria.

That blood might auto-agglutinate when chilled had been described by Landsteiner (1903) and that an unusual degree of the phenomenon might complicate some types of respiratory disease was reported by Clough & Richter (1918) and later by Wheeler et al (1939). A few years later Peterson et al (1943) and Horstmann & Tatlock (1943) reported that cold auto-agglutinins at high titres were frequently found in the serum of patients who had suffered from the then so called primary atypical pneumonia.

Stats & Wasserman’s (1943) review on cold haemagglutination was a valuable contribution to contemporary knowledge. They listed in a table as many as 94 references to papers published between 1890 and 1943 in which cold haemagglutination had been described. In 32 of the papers the patients referred to had suffered from increased haemolysis

Recognition that cold auto-antibodies played an important role in the pathogenesis of some cases of haemolytic anaemia led to the concept that auto-immune haemolytic anaemia (AIMA) might usefully be classified into warm antibody or cold-antibody types, according to whether the patient is forming (warm) antibodies which react (perhaps optimally) at body temperature or (cold) antibodies which react strongly at low temperatures (e.g. 48C) but progressively less well as the temperature is raised and are perhaps inactive at 37oC. The clinical syndrome suffered by the patient would depend not only on the amount of antibody produced but also on its temperature requirement. Another important advance in understanding has been the realization that both types of AIHA could develop in association with a wide range of underlying disorders (secondary AIHA) as well as `idiopathically’, i.e. for no obvious cause (primary AIHA). The author’s own experience was summarized in a review (Dacie & Worlledge, 1969): 99 out of 210 cases of warm AIHA were judged to be secondary as were 39 out of 85 cases of cold AIHA. Petz & Garratty (1980), summarized the data from six centres: 55% out of a total of 656 cases had been reported as secondary. They listed the disorders with which warm antibody AIHA had been associated as chronic lymphocytic leukaemia, Hodgkin’s disease, non-Hodgkin’s lymphomas, thymomas, multiple myeloma, Waldenstrom’s macroglobulinaemia, systemic lupus erythematosus, scleroderma, rheumatoid arthritis, infectious disease/ childhood viral disorders, hypogammaglobulinaemia, dysglobulinaemias, other immune deficiency syndromes, and ulcerative colitis.

Conley (1981), in an interesting review of warm-antibody AIHA patients seen at the Johns Hopkins Hospital, emphasized how important it was to carry out a careful enquiry into the patient’s past history and also to undertake a prolonged follow-up. He stated that a retrospective review of 33 patients whose illnesses in the past have been designated `idiopathic” had revealed an associated immunologically related disorder in 19 of them. An additional three patients had developed a lymphoma 2±10 years after they had developed AIHA. As already referred to, warm-antibody AIHA is now known to complicate a wide range of underlying diseases, particularly malignant lymphoproliferative disorders, other auto-immune disorders and immune deficiency syndromes. What proportion of patients suffering from a lymphoproliferative disorder develop AIHA is an interesting question. Duehrsen et al (1987) stated that this had occurred in 12 out of 637 patients. Early data on the incidence of a positive DAT in SLE were provided by Harvey et al (1954) – in six out of 34 patients tested the DAT had been positive. Later, Mongan et al (1967), who had studied a large number of patients suffering from a variety of connective tissue disorders, reported that the DAT had been positive in 15 out of 23 patients with SLE, none of whom, however, had suffered from overt haemolytic anaemia. It has also been realized since the 1960s that warm-antibody AIHA may develop in patients suffering from a variety of immune deficiency syndromes, both congenital and acquired.

It was in the mid-1960s that it was realized that, in a significant proportion of patients thought to have `idiopathic’ warm-antibody AIHA, the development of the causal auto-antibodies had been triggered in some way by a drug the patient was taking. The first drug implicated was the antihypertensive drug a-methyldopa (Aldomet) (Carstairs et al, 1966a,b). Following the finding that treating hypertensive patients with a-methyldopa led to the formation of anti-erythrocyte auto-antibodies in a significant percentage of patients, renewed interest was taken in the possibility that other drugs might have the same effect. Two main hypotheses have been advanced in relation to how certain drugs in some patients appear to have caused the development of anti-erythrocyte auto-antibodies. One hypothesis was that the drug or its metabolites act on the immune system so as to impair immune tolerance; the other was that the drug affects antigens at the erythrocyte surface in such a way that a normally active immune system responds by developing anti-erythrocyte antibodies. Clearly, too, the patient’s individuality must be an important factor, for only a proportion of patients receiving the same dosage of the offending drug for the same period of time develop a positive DAT and only a small percentage develop overt AIHA.

An interesting development in the history of the immune haemolytic anaemias was the realization in the mid-1950s that, rather rarely, haemolysis was brought about by the patient developing antibodies that were directed against a drug the patient had been taking and that the erythrocytes were in some way secondarily involved. The first drug to be implicated was Fuadin (stibophen), which had been used to treat a patient with schistosomiasis (Harris, 1954, 1956). The patient’s serum contained an antibody that agglutinated his own or normal erythrocytes and/or sensitized them to agglutination by antiglobulin sera; however, this occurred only in the presence of the drug.

In the late 1940s, several accounts of patients with AIHA who had persistently low platelet counts were published, e.g. Fisher (1947) and Evans & Duane (1949); and it was suggested that the patients might have been forming autoantibodies directed against platelets. This concept was further developed by Evans et al (1951). Eight out of their 18 patients with AIHA were thrombocytopenic; four had clinically obvious purpura. Evans et al (1951) suggested that there exists `a spectrum-like relationship between acquired haemolytic anaemia and thrombocytopenic purpura’; also that `on the one hand, acquired haemolytic anaemia with sensitization of the red cells is often accompanied with thrombocytopenia, while, on the other hand, primary thrombocytopenic purpura is frequently accompanied with red cell sensitization with or without haemolytic anaemia’. Many further case reports of AIHA accompanied by severe thrombocytopenia have since been published

There are two features in the blood film of a patient with an acquired haemolytic anaemia which indicate that he or she is suffering from AIHA; one is auto-agglutination, the other is erythrophagocytosis. Spherocytosis, although often present to a marked degree, is of course found in other types of haemolytic anaemia.

The pioneer French observations on auto-agglutination already referred to were generally overlooked until the late 1930s, and serological studies seem seldom to have been undertaken until the publication of Dameshek & Schwartz’s (1938b) report in which they described the presence of `haemolysins’ in cases of acute apparently acquired haemolytic anaemia. Dameshek & Schwartz (1940) summarized contemporary knowledge in an extensive review. They concluded that it was not improbable that haemolysins of various types and `dosages’ were in fact responsible for many cases of human haemolytic anaemias, including congenital haemolytic anaemia, which they suggested might be caused by the `more or less continued action of an haemolysin’.

Six years were to pass before the concept that an abnormal immune mechanism played a decisive role in some cases of acquired haemolytic anaemia was clearly demonstrated by Boorman et al (1946), who reported that the erythrocytes of five patients with acquired acholuric jaundice had been agglutinated by an antiglobulin serum, i.e. that the newly described antiglobulin reaction or Coombs test (Coombs et al, 1945) was positive, while the test had been negative in 28 patients suffering from congenital acholuric jaundice. This work aroused great interest and was soon confirmed.

Until the 1950s, the auto-antibodies responsible for AIHA were generally concluded to be `non-specific’. According to Wiener et al (1953), `Red cell auto-antibodies react not only with the individual’s own red cells but also with the erythrocytes of all other human beings. The substances on the red blood cell envelope with which the auto-antibodies combine are agglutinogens like the ABO, MN and RhHr systems, except that, in the former case, the blood factors with which the auto-antibodies react are not type specific but are shared by all human beings.’ They suggested that the auto-antibodies might be directed to the `nucleus of the RhHr substance’. Earlier work had, however, indicated that the sensitivity of normal group-compatible erythrocytes to a patient’s auto-antibody might vary considerably (Denys & van den Broucke, 1947; Kuhns & Wagley, 1949). That auto-antibodies might have a clearly defined Rh specificity, e.g. anti-e, was described by Race & Sanger (1954) in the second edition of their book. Referring to Wiener et al (1953), they wrote: `This beautifully clear investigation made the present authors realize that a curious result obtained by one of them (Ruth Sanger) in 1953 in Australia had after all been true; the serum of a man who had died of a haemolytic anaemia 3000 miles away contained anti-e; his cells were clearly CDe-cde’. A similar finding, i.e. an auto-anti-e, was described by Weiner et al (1953).

A further development in the unravelling of a complicated story was the realization that some of the antibodies which appeared to be specific were reacting with more basic antigens, although showing a preference for specific antigens, i.e. some specific auto-antibodies appeared to be less specific than their allo-antibody counterparts. Moreover, some antibodies, reacting with specific antigens, have been shown to be partially or completely absorbable by antigen negative cells.

Many apparently `non-specific’ antidl antibodies have been shown to be not strictly `nonspecific’ but to react with antigens of very high frequency, e.g. to be anti-Wrb, anti-Ena, anti-LW or anti-U. Issitt et al (1980)) listed six additional very common antigens that had been identified as targets for anti-dl auto-antibodies, i.e. Hr, Hro, Rh34, Rh29, Kpb and K13.

In relation to human acquired haemolytic anaemia, the discovery in the late 1940s and 1950s that many cases were apparently brought about by the development of damaging anti-erythrocyte antibodies led to intense interest and speculation into the why and how of auto-antibody formation. Of seminal importance at the time were the experiments and theoretical arguments of Burnet (Burnet & Fenner, 1949; Burnet, 1957, 1959, 1972) and the studies on transplantation immunity of Medawar (Billingham et al, 1953; Medawar, 1961). Of particular interest, too, was the report by Bielschowsky et al (1959) of the occurrence of AIHA in an inbred strain of mice – the NZB/BL strain. Remarkably, by the time the mice were 9-months-old the DAT was positive in almost every mouse. Burnet (1963) referred to the gift of the mice to the Walter and Eliza Hall Institute of Medical Research, Melbourne as `the finest gift the Institute has ever received’.

Exactly how is it that auto-antibodies reacting with an erythrocyte surface antigen result in the cell’s premature destruction? The possible role of auto-agglutination in bringing about haemolysis was emphasized by Castle and colleagues as the result of a series of studies carried out in the 1940s and 1950s. As summarized by Castle et al (1950), an antibody which appears to be incapable of causing `lysis in vitro might bring about the following sequence of events in vivo. (1) Red cell agglutination in the peripheral blood; (2) red cell sequestration and separation from plasma in tissue capillaries; (3) ischaemic injury of tissue cells with release of substances that increase the osmotic and mechanical fragilities of red cells locally; (4) local osmotic lysis of red cells or subsequent escape of mechanically fragile red cells into the blood stream where the traumatic motion of the circulation causes their destruction’.

We can expect, as the years pass, that more and more will be known as to the intricate mechanisms that bring about self-tolerance and the mechanisms underlying the occurrence of auto-immune disorders in general, including the role of infectious agents, drugs and genetic factors. Patients with immune haemolytic anaemias can be expected to benefit from the new knowledge; for in parallel with a better understanding as to how immune self-tolerance breaks down will hopefully be the development of more effective drugs and therapies aimed at controlling the breakdown.

The Immune Haemolytic Anaemias: A Century of Exciting Progress in Understanding.  Sir John Dacie, Emeritus Professor of Haematology.
Brit J Haem 2001; 114: 770-785.

A History of Pernicious Anaemia

This is a review of the ideas and observations that have led to our current understanding of pernicious anaemia (PA). PA is a megaloblastic anaemia (MA) due to atrophy of the mucosa of the body of the stomach which, in turn, is brought about by autoimmune factors.

A case report by Osler & Gardner (1877) in Montreal could be that of PA. This anaemic patient had numbness of the fingers, hands and forearms; the red blood cells were large; at autopsy the gastric mucosa appeared atrophic and the marrow had large numbers of erythroblasts with finely granular nuclei. The increased marrow cellularity had also been noted by Cohnheim (1876).

Ehrlich (1880) (Fig 1) distinguished between cells he termed megaloblasts present in the blood in PA from normoblasts present in anaemia as a result of blood loss. Not only were large red blood cells noted in PA, but irregular red cells, ? poikilocytes, were reported in wet blood preparations by Quincke (1877). Megaloblasts in the marrow during life were first noted by Zadek (1921). Hypersegmented neutrophils in peripheral blood in PA were described by Naegeli (1923) and came to be widely recognized after Cooke’s study (Cooke, 1927). The giant metamyelocytes in the marrow were described by Tempka & Braun (1932).

Paul Ehrlich

Paul Ehrlich

Fig 1. Paul Ehrlich (Wellcome Institute Library, London).

The association between PA and spinal cord lesions was described by Lichtheim (1887) and a full account was published by Russell et al (1900), who coined the term `subacute combined degeneration of the spinal cord’ (SCDC) although they were not convinced of its relation to PA. Arthur Hurst at Guy’s Hospital, London, confirmed the association of the neuropathy with PA and added, too, the association of loss of hydrochloric acid in the gastric juice (Hurst & Bell, 1922). Cabot (1908) found that numbness and tingling of the extremities were present in almost all of his 1200 patients and 10% had ataxia. William Hunter (1901) noted the prevalence of a sore tongue in PA, which was present in 40% of Cabot’s series.

In 1934, the Nobel Prize in medicine and physiology was awarded to Whipple, Minot and Murphy. Was there ever an award more deserved? They saved the lives of their patients and pointed the way forward for further research. What was there in liver that was lacking in patients with PA? The effect of liver in restoring the anaemia in Whipple’s iron-deficient dogs was by supplying iron which is  abundant in liver.

Liver given by mouth also provides Cbl and folic acid. But patients with PA cannot absorb Cbl, although some 1% of an oral dose can cross the intestinal mucosa by passive diffusion; this, presumably, is what happened when large amounts of liver were eaten. Beef liver contains about 110 mg of Cbl per 100 g and about 140 mg of folate per 100 g. Cbl is stable and generally resistant to heat; folate is labile unless preserved with reducing agents. The daily requirement of Cbl by man is l-2 mg. The liver diet, if consumed, had enough of these haematinics to provide a response in most MAs.

George Richard Minot

George Richard Minot

George Richard Minot (Wellcome Institute Library, London).

The availability of liver extracts brought about interest in the nature of the haematological response. An optimal response required a peak rise of reticulocytes 5±7 d after the injection of liver extract and the height of the peak was greatest in those with severe anaemia; the flood of reticulocytes was as a result of a synchronous maturation of a vast number of megaloblasts into red cells. There is a steady rise in the red cell count to reach 3 x 10¹²/l in the 3rd week (Minot & Castle, 1935). Many liver extracts did not have enough antianaemic factor to achieve this and some assayed by the author had only 1-2 mg of Cbl.  It took another 22 years for a pure antianaemic factor to be isolated, although, admittedly, the Second World War intervened; in 1948, an American group led by Karl Folkers and an English group led by E. Lester-Smith published, within weeks of each other, the isolation of a red crystalline substance termed vitamin B12 and subsequently renamed cobalamin.

The structure of this red crystalline compound was studied by the nature of its degradation products and by X-ray crystallography. It soon became apparent that there was a cobalt atom at the heart of the structure and this heavy atom was of great aid to the crystallographers, so much so that, with additional information from the chemists, they were the first to come up with the complete structure. To quote Dorothy Hodgkin: `To be able to write down a chemical structure very largely from purely crystallographic evidence on the arrangement of atoms in space – and the chemical structure of a quite formidably large molecule at that – is for any crystallographer, something of a dream-like situation’. As Lester-Smith (1965) pointed out, it also required some 10 million calculations. In 1964, Dorothy Hodgkin was awarded the Nobel Prize for chemistry.

Barker et al (1958) published an account of the metabolism of glutamate by a Clostridium. The glutamate underwent an isomerization and an orange-coloured co-enzyme was involved that turned out to be Cbl with a deoxyadenosyl group attached to the cobalt.

This Cbl co-enzyme, deoxyadenosylCbl, is the major form of Cbl in tissues; it is also extremely sensitive to light, being changed rapidly to hydroxoCbl. DeoxyadenosylCbl is concerned with the metabolism of methylmalonic acid in man (Flavin & Ochoa, 1957). The other functional form of Cbl is methylCbl involved in conversion of homocysteine to methionine (Sakami & Welch, 1950). Both these pathways are impaired in PA in relapse.

Cbl consists of a ring of four pyrrole units very similar to that present in haem. These, however, have the cobalt atom in the centre instead of iron and the ring is called the corrin nucleus. The cobalamins have a further structure, a base, termed benzimidazole, set at right angles to the corrin nucleus and this may have a link to the cobalt atom (base on position).

By the time Cbl had been isolated from liver it was already known that it was also present in fermentation flasks growing bacteria such as streptomyces species. Other organisms gave higher yields so that kilogram quantities of pure Cbl were obtained; these sources have replaced liver in the production of Cbl. By adding radioactive form of cobalt to the fermentation flasks instead of ordinary cobalt, labelled Cbl became available (Chaiet et al, 1950). The importance of labelled Cbl is that it made it possible to carry out Cbl absorption tests in patients, to design isotope dilution assays for serum Cbl, to design ways of assaying intrinsic factor (IF), to detect antibodies to IF and even to measure glomerular filtratration rate, as free Cbl is excreted by the glomerulus without any reabsorption by the renal tubules.

William Castle at the Thorndike Memorial Laboratory, Boston City Hospital, devised experiments to explore the relationship between gastric juice, the anti-anaemic factor that Castle assumed, correctly, was also present in beef, and the response in PA. The question Castle asked was `Was it possible that the stomach of the normal person could derive something from ordinary food that for him was equivalent to eating liver?’.

The experiment in untreated patients with PA consisted of two consecutive periods of 10 d or more during which daily reticulocyte counts were made. During the first period of 10 d, the PA patient received 200 g of lean beef muscle (steak) each day. There was no reticulocyte response. During the second period, the contents of the stomach of a healthy man were recovered 1 h after the ingestion of 300 g of steak; about 100 g could not be recovered. The gastric contents were incubated for a few hours until liquefied and then given to the PA patient through a tube. This was done daily. On day 6 there was a rise in reticulocytes reaching a peak on day 10, followed by a rise in the red cell count. The response was similar to that obtained with large amounts of oral liver.

Thus, Castle concluded that a reaction was taking place between an unknown intrinsic factor (IF) in the gastric juice and an unknown extrinsic factor in beef muscle. Whereas Minot & Murphy (1926) found that 200-300 g of liver daily was needed to get a response in PA, 10 g liver was adequate when incubated with 10-20 ml normal gastric juice (Reiman & Fritsch, 1934). Castle’s extrinsic factor is the same as the anti-anaemic factor that is Cbl, and IF is needed for its absorption. Presumably the gastric juice in PA lacks IF.

The elegant studies of Hoedemaeker et al (1964) in Holland using autoradiography of frozen sections of human stomach incubated with [57Co]-Cbl showed that IF was produced in the gastric parietal cell. The binding of Cbl to

the parietal cell was abolished by first incubating the section with a serum containing antibodies to IF. The parietal cell in man is thus the source of both hydrochloric acid and IF. The parietal cell is the only source of IF in man as a total gastrectomy is invariably followed by a MA due to Cbl deficiency. IF is a glycoprotein with a molecular weight of 45 000.

Assay of protein fractions of serum after electrophoresis showed that endogenous Cbl is in the position of α-1 globulin. Chromatography of serum after addition of [57Co]-Cbl on Sephadex G-200 showed that Cbl was attached to two proteins, one eluting before the albumin termed transcobalamin I (TCI) and the other after the albumin termed transcobalamin II (TCII). Charles Hall showed that, when labelled Cbl given by mouth is absorbed, it first appears in the position of TCII and later in the position of TCI as well (Hall and Finkler, l965). They concluded that TCII is the prime Cbl transport protein carrying Cbl from the gut into the blood and then to the liver from where it is redistributed by both new TCII as well as TCI. Congenital absence of a functional TCII causes a severe MA in the first few months of life owing to an inability to transport Cbl. Most of the Cbl in serum is on TCI because it has a relatively long half-life of 9±10 d, whereas the half-life of TCII is about 1.5 h. Thus, in assaying the serum Cbl level, it is mainly TCI-Cbl that is being assayed.

With the availability of labelled Cbl, Cbl absorption tests began to be widely used in the 1950s. The commonest method was the urinary excretion test described by Schilling (1953). Here, an oral dose of radioactive Cbl is followed by an injection of 1000 mg of cyano-Cbl. The free cyano-Cbl is largely excreted into the urine over the next 24 h and carries with it about one third of the absorbed labelled Cbl.

Parietal cell antibodies (Taylor et al, 1962) are present in serum in 76-93% of different series of PAs and in the serum of 36% of the relatives of PA patients. The antibody is present in sera from 32% of patients with myxoedema, 28% of patients with Graves’ disease, 20% of relatives of thyroid patients and 23% of patients with Addison’s disease. Parietal cell antibodies are found in between 2-16% of controls, the high 16% figure being in elderly women. There is a higher frequency of PA in women, the female to male ratio being 1.7 to 1.0. The parietal cell antibody is probably important in the production of gastric atrophy. Thyroid antibodies are present in sera from 55% of PAs, in sera from 50% of PA relatives, in 87% of sera from myxoedema patients, in 53% of sera in Graves’ disease and in 46% of relatives of patients with thyroid disease.

There is a high frequency of PA among those disorders that have antibodies against the target organ. Thus, among 286 patients with myxoedema, 9.0% also had PA (Chanarin, 1979), as compared with a frequency of PA of about 1 per 1000 (0.01%) in the general population. Of 102 consecutive patients with vitiligo,
eight also had PA.

Patients with acquired hypogammaglobulinaemia are unable to make humoral antibodies; nevertheless, one third have PA as well. This cannot be as a result of action of IF antibodies and must be because of specific cell-mediated immunity. Tai & McGuigan (1969) demonstrated lymphocyte transformation in the presence of IF in six out of 16 PA patients and Chanarin & James (1974) found 10 out of 51 tests were positive.

Twenty-five patients with PA were tested for the presence of humoral IF antibody in serum and gastric juice and for cell-mediated immunity against IF. All but one gave positive results in one or more tests. It was concluded that these findings establish the autoimmune nature of PA and that the immunity is not merely an interesting byproduct.

Patients with PA treated with steroids show a reversal of the abnormal findings characterizing the disease. If they are still megaloblastic, the anaemia will respond in the first instance (Doig et al, 1957), but in the longer term Cbl neuropathy may be precipitated. The absorption of Cbl improves and may become `normal’ (Frost & Goldwein, 1958). There is a return of IF in the gastric juice (Kristensen and Friis, 1960) and a decline in the amount of IF antibody in serum (Taylor, 1959). In some patients there is return of acid in the gastric juice. Gastric biopsy shows a return of parietal and chief cells (Ardeman & Chanarin, 1965b; Jeffries, 1965). All this is as a result of suppression of cell-mediated immunity against the parietal cell and against IF. Withdrawal of steroids leads to a slow return to the status quo.

The author has dipped freely into the two volumes by the late M. M. Wintrobe. These are: Wintrobe, M.M. (1985) Hematology, the Blossoming of a Science. Lea & Febinge

A History of Pernicious Anaemia
I. Chanarin, Richmond, Surrey
Brit J Haem 111: 407-415
History of Folic Acid

1928 Lucy Wills studied macrocytic anaemia in pregnancy in Bombay, India

1932 Janet Vaughn studied macrocytic anemia associated with coeliac disease and idiopathic steatorrhea (1932) showed a response to marmite

1941 Folic acid extracted from spinach and is a growth factor for S. Faecalis

1941 pteroylglutamic acid synthesized at Amer Cyanamide – Pteridine ring, paraminobenzoic acid, glutamine –  PGA differed from natural compound in some respects

1945 PGA resolved the macrocytic anemia, but not the neuropathy

1979 Stokstad and associates at Berkeley obtained the first purified mammalian enzymes involved in synthesis

Folate antagonists inhibit tumor growth (Hitchings and Elion)(Nobel)

  • Misincorporation of uracil instead of thymine into DNA

Sidney Farber introduced Aminopterine and also Methotrexate for treatment of childhood lymphoblastic leukemia

  • MTX inhibits DHFR enzyme (dihydrofolate reductase) necessary for THF

Wellcome introduces trimethoprim (antibacterial), and also pyramethoprime (antimalarial)

Homocysteine isolated by Du Vineaud, but it was not noticed

Finkelstein and Mudd demonstrated the importance of remethylation for tHy and worked out the transsulfuration pathway

  1. Function of methyl THF is remethylation of homocysteine
  2. Synthesized by MTHFR
Metabolism of folate

Metabolism of folate

Metabolism of folate

Allosterically regulated by S-adenosyl methionine (Stokstad)

MTHF also inhibits glycine methyl transferase controlling excess SAM – transmethylation

JD Finkelstein

JD Finkelstein

James D Finkelstein

  • Homocysteinuria – mental retardation, skeletal malformation, thromboembolic disease; deficiency of cystathionine synthase (controls trans-sulfuration)
  • NTDs – pregnancy
  • Hyperhomocysteinemia and VD

AD Hoffbrand and DG Weir
Brit J Haem 2001; 113: 579-589

The History of Haemophilia in the Royal Families of Europe Queen Victoria.

On 17 July 1998 a historic ceremony of mourning and commemoration took place in the ancestral church of the Peter and Paul Fortress in St Petersburg. President Boris Yeltsin, in a dramatic eleventh-hour change of heart, decided to represent his country when the bones of the last emperor, Tsar Nicholas II, and his family were laid to rest 80 years to the day after their assassination in Yekaterinberg (Binyon, 1998). He described it as ‘ironic that the Orthodox Church, for so long the bedrock of the people’s faith, should find it difficult to give this blessing the country had expected’. ‘I have studied the results of DNA testing carried out in England and abroad and am convinced that the remains are those of the Tsar and his family’ (The Times, 1998a). Unfortunately, politicians and the hierarchy of the Russian Orthodox Church had argued about what to do with the bones previously stored in plastic bags in a provincial city mortuary. Politics, ecclesiastical intrigue, secular ambition, and emotions had fuelled the debate. Yeltsin and the Church wanted to honour a man many consider to be a saint, but many of the older generation are opposed to the rehabilitation of a family which symbolizes the old autocracy.

Our story starts, almost inevitably, with Queen Victoria of England who had nine children by Albert, Prince of Saxe-Coburg-Gotha. Victoria was certainly an obligate carrier for haemophilia as over 20 individuals subsequently inherited the condition (Figs 1 and 2). Princess Alice (1843–78) was Victoria’s third child and second daughter. Having married the Duke of Hesse at an early age, Alice went on to have seven children, one of whom, Frederick (‘Frittie’) was a haemophiliac who died at the age of 3 following a fall from a window.

Prince Leopold with Sir William Jenner at Balmoral in 1877

Prince Leopold with Sir William Jenner at Balmoral in 1877

Prince Leopold with Sir William Jenner at Balmoral in 1877. (Hulton Deutsch Collection Ltd.)

Alexandra was the sixth child and was only 6 years old when her mother and youngest sister died. ‘Sunny’, as she became known, was a favourite of Queen Victoria, who as far as possible directed her upbringing from across the channel: Alexandra (Alix) was forced to eat her baked apples and rice pudding with the same regularity as her English cousins. Alix visited her older sister Elizabeth (Ella) on her marriage to Grand Duke Serge and met Tsarevich Nicholas for the first time: she was 12 and not impressed. Five years later they met again and Alix fell in love, but by now she had been confirmed in the Lutheran Church and religion became the solemn core of her life.

Victoria had other aspirations for Alix. She hoped that she would marry her grandson Albert Victor (The Duke of Clarence) and the eldest son of the Prince of Wales (later Edward VII). The Duke was an unimpressive young man who was somewhat deaf and had limited intellectual abilities. If this arrangement had proceeded then Alix’s haemophilia carrier status would have been introduced into the British Royal Family and the possibility of a British monarch with haemophilia might have become a reality; however, the Duke died in 1892.

Nicholas and Alexandra. Alix and Nicholas were married in 1894 one week after the death of Nicholas’s father (Alexander III). In the same way that Victoria, with her personal aspirations of a marriage between Alix and the Duke of Clarence, had not considered the possibility of haemophilia, neither did the St Petersburg hierarchy consider a marriage to Nicholas undesirable. Haemophilia was already well recognized in Victoria’s descendants. Her youngest son, Leopold, had already died, as had Frittie her grandson. The inheritance of haemophilia had been known for some time since its description by John Conrad Otto (Otto, 1803). However, it was as late as 1913 before the first royal marriage was declined because of the risk of haemophilia, when the Queen of Rumania decided against an association between her son, Crown Prince Ferdinand, and Olga, the eldest daughter of Nicholas and Alexandra. The Queen of Rumania was herself a granddaughter of Queen Victoria and therefore a potential haemophilia carrier!

Alix was received into the Russian Orthodox Church, taking the name of Alexandra Fedorova. The first duty of a Tsarina was to maintain the dynasty and produce a male heir, but between 1895 and 1901 Alix produced four princesses, Olga, Tatiana, Maria and Anastasia. Failure to produce a son made Alix increasingly neurotic and she had at least one false pregnancy. However, in early 1904 she was definitely pregnant.

For a month or so all seemed well with little Alexis, but it was then noticed that the Tsarevitch was bleeding excessively from the umbilicus (a relatively uncommon feature of haemophilia). At first the diagnosis was not admitted by the parents, but eventually the truth had to be faced although even then only by the doctors and immediate family. Alix was grief stricken: ‘she hardly knew a day’s happiness after she realized her boy’s fate’. As a newly diagnosed haemophilia carrier she dwelt morbidly on the fact that she had transmitted the disease. These feelings are well known to some haemophiliac mothers but the situation was different in Russia in the early twentieth century. The people regarded any defect as divine intervention. The Tsar, as head of the Church and leader of the people, must be free of any physical defect, so the Tsarevich’s haemophilia was concealed. The family retreated into greater isolation and were increasingly dominated by the young heir’s affliction (Fig 3).

Up to a third of haemophiliac males do not have a family history of the condition. This is usually thought to be the result of a relatively high mutation rate occurring in either affected males or female carriers. None of Queen Victoria’s ancestors, for many generations, showed any evidence of haemophilia. Victoria was therefore either a victim of a mutation, or the Duke of Kent was not her father.The mutation is unlikely to have been in her mother, Victoire, who had a son and daughter by her first marriage, and there is no sign of haemophilia in their numerous descendants.

Victoire was under considerable pressure to produce an heir. The year before Victoria was born, Princess Charlotte, the only close heir to the throne, had died and the Duke of Kent had somewhat reluctantly agreed to marry Victoire with the aim of producing an heir. The postulate that the Queen’s gardener had a limp has not been substantiated!

The Duke of Kent had no evidence of haemophilia (he was 51 when Victoria was born) but did inherit another condition from his father (George III): porphyria. While a young man in Gibralter he suffered bilious attacks which were recognized as being similar to his father’s complaint.

Had Queen Victoria carried the gene for porphyria we might expect that she would have at least as many descendants with this condition as had haemophilia. Until recently only two possible cases of porphyria have been suggested amongst Victoria’s descendants: Kaiser Wilhelm’s sister and niece (MacAlpine & Hunter, 1969), but they could have inherited it from their Hohenzollern ancestor, Frederick the Great. A recent television programme (Secret History, 1998) claims to have identified two more cases in Victoria’s descendants, Princess Victoria, the Queen’s eldest daughter, and Prince William of Gloucester, nephew of George V. If these two cases are correct then they would tend to confirm that Victoria was indeed the daughter of the Duke of Kent, but the apparent lack of more cases in Victoria’s extended family is difficult to understand. The gene for acute intermittent porphyria has been isolated on chromosome 11. There is still plenty of scope for further genetic analysis on the European Royal Families!

We can only speculate as to the impact on European events over the last 150 years if the marriages within the Royal houses had been different. What is evident is the dramatic effect of haemophilia on the Royal Princes and their families.

Empress Alexandra at the Tsarevich’s bedside during a haemophiliac crisis

Empress Alexandra at the Tsarevich’s bedside during a haemophiliac crisis

Empress Alexandra at the Tsarevich’s bedside during a haemophiliac crisis in 1912. (Radio Times Hulton Picture Library.)

Richard F. Stevens
Royal Manchester Children’s Hospital
Brit J Haem 1999, 105, 25–32

`The longer you can look back ± the further you can look forward’: Winston Churchill in an address to The Royal College of Physicians, London 1944. At the time that Churchill was speaking in 1944, leukaemia was a fatal disease that had been identified 100 years before. The disease was described as the dreaded leukaemias, sinister and poorly understood.

Thomas Hodgkin chose a career in medicine and enrolled as a pupil at Guy’s Hospital in London. Being a Quaker, however, he could not enter the English universities of Oxford and Cambridge and decided to follow the medical courses at Edinburgh. At that times, Aristotelian and Hippocratic medicine were greatly influencing British physicians. Hodgkin, still a medical student, wrote a paper `On the Uses of the Spleen’ where he reported his beliefs on the purposes of the spleen: to regulate fluid volume, clean impurities from the body, supply expandability to the portal system. The subject was a presage of the disease that bears his name.

Hodgkin interrupted his studies at Edinburgh to spend a year in Paris where he met many people who had a great influence in his life and future activities. Among them, were Laennec (Hodgkin played an important role in bringing the stethoscope to Great Britain); Baron von Humboldt who introduced Hodgkin to the field of anthropology; Baron Cuvier, a distinguished anatomist and palaeontologist; and Thomas A. Bowditch, whose expeditions to Africa had a great impact on Hodgkin’s future activities.

In 1825, Thomas Hodgkin returned to London to join the staff at Guy’s Hospital, and in 1826 he was made `Inspector of the Dead’ and `Curator of the Museum of Morbid Anatomy’. In developing the museum he had accumulated, by 1829, over 1600 specimens demonstrating the effects of disease. The correlation of clinical disease to pathological material was quite new: from analyses of pathological specimens Hodgkin was able to describe appendicitis with perforation and peritonitis, the local spread of cancer to draining lymph nodes, noting that the tumour had similar characteristics at both sides, and features of other diseases.

In his historic paper `On Some Morbid Appearances of the Absorbent Glands and Spleen’ (Hodgkin, 1832), he briefly described the clinical histories and gross postmortem findings on six patients from the experience at Guy’s Hospital and included another case sent to him in a detailed drawing by his friend Carswell (Fig 2). In the very first paragraph he wrote: `The morbid alterations of structure which I am about to describe are probably familiar to many practical morbid anatomists, since they can scarcely have failed to have fallen under their observation in the course of cadaveric inspection’. Hodgkin’s studies had convinced him that he was dealing with a primary disease of the absorbent (lymphatic) glands. `This enlargement of the glands appeared to be a primitive affection of those bodies, rather than the result of an irritation propagated to them from some ulcerated surface or other inflamed texture – Unless the word inflammation be allowed to have a more indefinite and loose eaning, this affection – can hardly be attributed to that cause’ was stated on pages 85 and 86 of his 1832 paper. Hodgkin also mentioned that the first reference that he could find to this or similar disease was in fact by Malpighi in 1666.

Wilks (1865) described the disease in detail and, made aware by Bright that the first observations were done by Hodgkin, linked his name permanently to this new entity in a paper entitled `Cases of Enlargement of the Lymphatic Glands and Spleen (or Hodgkin’s Disease) with Remarks’ (Fig 3).

In 1837 Thomas Hodgkin was the outstanding candidate for the position of Assistant Physician at Guy’s Hospital in succession to Thomas Addison who had been promoted to Physician. After 10 years spent as Inspector of the Dead, he had published a great deal, including a two-volume work entitled The Morbid Anatomy of Serous and Mucous Membrane.

Hodgkin, acting in his other capacity, had sent Benjamin Harrison a report on the terrible consequences to native Indians of monopoly trading and on the inhuman treatment they received from officials of the Hudson Bay Company, of which Harrison was the financier. when the opportunity to appoint an Assistant Physician occurred, Harrison exercised an autocratic rule over the hospital and presided at the appointment made by the General Court. Thomas Hodgkin did not get the job and the next day he resigned all his appointments at Guy’s Hospital. Social medicine, medical problems associated with poverty, antislavery, concern for underpriviledged groups such as American Indians and Africans, as well as a strong sense of responsibility defined his life after this separation.

Sternberg (1898) and Reed (1902) are generally credited with the first definitive and thorough descriptions of the histopathology of Hodgkin’s disease. Based on the findings observed in her case series, Dorothy Reed concluded `We believe then, from the descriptions in the literature and the findings in 8 cases examined, that Hodgkin’s disease has a peculiar and typical histological picture and could thus rightly be considered a histopathological disease entity’.

During the successive decades, pathologists began to describe a broader spectrum of histological features. However, it was Jackson and Parker who, in scientific papers and in their well-known book Hodgkin’s Disease and Allied Disorders (Jackson & Parker, 1947), presented the first serious effort at a histopathological classification. They assigned the name `Hodgkin’s granuloma’ to the main body of typical cases. A much more malignant variant, usually characterized by a great abundance of pleomorphic and anaplastic Reed-Sternberg cells and seen in a relativelysmall number of cases was named `Hodgkin’s sarcoma’. A third, similarly infrequent, variant characterized by an extremely slow clinical evolution, a relative paucity of Reed-Sternberg cells and a great abundance of lymphocytes was termed `Hodgkin’s paragranuloma’. It was only approximately 20 years later that Lukes & Butler (1966) reported a characteristic subtype of the heterogeneous `granuloma’ category, to which they assigned the name `nodular sclerosis’. They also proposed a new histopathological classification, still in use to date, with an appreciably greater prognostic relevance and usefulness than the

previous Jackson-Parker classification.

The first human bone marrow transfusion was given to a patient with aplastic anemia in 1939.9 This patient received daily blood transfusions, and an attempt to raise her leukocyte and platelet counts was made using intravenous injection of bone marrow. After World War II and the use of the atomic bomb, researchers tried to find ways to restore the bone marrow function in aplasia caused by radiation exposure. In the 1950s, it was proven in a mouse model that marrow aplasia secondary to radiation can be overcome by syngeneic marrow graft.10 In 1956, Barnes and colleagues published their experiment on two groups of mice with acute leukemia: both groups were irradiated as anti-leukemic therapy and both were salvaged from marrow aplasia by bone marrow transplantation.

The topics of leukemias and lymphomas will not be discussed further in  this discussion.

The related references are:

Leukaemia – A Brief Historical Review from Ancient Times to 1950
British Journal of Haematology, 2001, 112, 282-292

The Story of Chronic Myeloid Leukaemia
British Journal of Haematology, 2000, 110, 2-11

Historical Review of Lymphomas
British Journal of Haematology 2000, 109, 466-476

Historical Review of Hodgkin’s Disease
British Journal of Haematology, 2000, 110, 504-511

Multiple Myeloma: an Odyssey of Discovery
British Journal of Haematology, 2000, 111, 1035-1044

The History of Blood Transfusion
British Journal of Haematology, 2000, 110, 758-767

Hematopoietic Stem Cell Transplantation—50 Years of Evolution and Future Perspectives. Henig I, Zuckerman T.
Rambam Maimonides Med J 2014;5 (4):e0028.
http://dx.doi.org/10.5041/RMMJ.10162

Landmarks in the history of blood transfusion.

1666 Richard Lower (Oxford) conducts experiments involving transfusion of blood from one animal to another

1667 Jean Denis (Paris) transfuses blood from animals to humans

1818 James Blundell (London) is credited with being the first person to transfuse blood from one human to another

1901 Karl Landsteiner (Vienna) discovers ABO blood groups. Awarded Nobel Prize for Medicine in 1930

1908 Alexis Carrel (New York) develops a surgical technique for transfusion, involving anastomosis of vein in the recipient with artery in the donor. Awarded Nobel Prize for Medicine in 1912

1915 Richard Lewinsohn (New York) develops 0.2% sodium citrate as anticoagulant

1921 The first blood donor service in the world was established in London by Percy Oliver

1937 Blood bank established in a Chicago hospital by Bernard Fantus

1940 Landsteiner and Wiener (New York) identify Rhesus antigens in man

1940 Edwin Cohn (Boston) develops a method for fractionation of plasma proteins. The following year, albumin produced by this method was used for the first time to treat victims of the Japanese attack on Pearl Harbour

1945 Antiglobulin test devised by Coombs (Cambridge), which also facilitated identification of several other antigenic systems such as Kell (Coombs et al, 1946), Duffy (Cutbush et al, 1950) and Kidd (Cutbush et al, 1950)

1948 National Blood Transfusion Service (NBTS) established in the UK

1951 Edwin Cohn (Boston) and colleagues develop the first blood cell separator

1964 Judith Pool (Palo Alto, California) develops cryoprecipitate for the treatment of haemophilia

1966 Cyril Clarke (Liverpool) reports the use of anti-Rh antibody to prevent haemolytic disease of the newborn

Read Full Post »

« Newer Posts - Older Posts »