Manipulate Signaling Pathways
Writer and Curator: Larry H Bernstein, MD, FCAP
7.6 Manipulate Signaling Pathways
7.6.1 The Dynamics of Signaling as a Pharmacological Target
7.6.2 A Protein-Tagging System for Signal Amplification in Gene Expression and Fluorescence Imaging
7.6.3 IQGAPs choreograph cellular signaling from the membrane to the nucleus
7.6.4 Signaling cell death from the endoplasmic reticulum stress response
7.6.5 An Enzyme that Regulates Ether Lipid Signaling Pathways in Cancer Annotated by Multidimensional Profiling
7.6.6 Peroxisomes – A Nexus for Lipid Metabolism and Cellular Signaling
7.6.7 A nexus for cellular homeostasis- the interplay between metabolic and signal transduction pathways
7.6.8 Mechanisms-of-intercellular-signaling
7.6.9 Cathepsin B promotes colorectal tumorigenesis, cell invasion, and metastasis
7.6.1 The Dynamics of Signaling as a Pharmacological Target
Marcelo Behar, Derren Barken, Shannon L. Werner, Alexander Hoffmann
Cell 10 Oct 2013; 155(2):448–461
http://dx.doi.org/10.1016/j.cell.2013.09.018
Highlights
- Drugs targeting signaling hubs may block specific dynamic features of the signal
- Specific inhibition of dynamic features may introduce pathway selectivity
- Phase space analysis reveals principles for drug targeting signaling dynamics
- Based on these principles, NFκB dynamics can be manipulated with specificity
Summary
Highly networked signaling hubs are often associated with disease, but targeting them pharmacologically has largely been unsuccessful in the clinic because of their functional pleiotropy. Motivated by the hypothesis that a dynamic signaling code confers functional specificity, we investigated whether dynamic features may be targeted pharmacologically to achieve therapeutic specificity. With a virtual screen, we identified combinations of signaling hub topologies and dynamic signal profiles that are amenable to selective inhibition. Mathematical analysis revealed principles that may guide stimulus-specific inhibition of signaling hubs, even in the absence of detailed mathematical models. Using the NFκB signaling module as a test bed, we identified perturbations that selectively affect the response to cytokines or pathogen components. Together, our results demonstrate that the dynamics of signaling may serve as a pharmacological target, and we reveal principles that delineate the opportunities and constraints of developing stimulus-specific therapeutic agents aimed at pleiotropic signaling hubs.
http://www.cell.com/cms/attachment/2021777732/2041663648/fx1.jpg
Intracellular signals link the cell’s genome to the environment. Misregulation of such signals often cause or exacerbate disease (Lin and Karin, 2007 and Weinberg, 2007) (so-called “signaling diseases”), and their rectification has been a major focus of biomedical and pharmaceutical research (Cohen, 2002, Frelin et al., 2005 and Ghoreschi et al., 2009). For the identification of therapeutic targets, the concept of discrete signaling pathways that transmit intracellular signals to connect cellular sensor/receptors with cellular core machineries has been influential. In this framework, molecular specificity of therapeutic agents correlates well with their functional or phenotypic specificity. However, in practice, clinical outcomes for many drugs with high molecular specificity has been disappointing (e.g., inhibitors of IKK, MAPK, and JNK; Berger and Iyengar, 2011, DiDonato et al., 2012, Röring and Brummer, 2012 and Seki et al., 2012).
Many prominent signaling mediators are functionally pleiotropic, playing roles in multiple physiological functions (Chavali et al., 2010 and Gandhi et al., 2006). Indeed, signals triggered by different stimuli often travel through shared network segments that operate as hubs before reaching the effectors of the cellular response (Bitterman and Polunovsky, 2012 and Gao and Chen, 2010). Hubs’ inherent pleiotropy means that their inhibition may have broad and likely undesired effects (Karin, 2008, Berger and Iyengar, 2011,Force et al., 2007, Oda and Kitano, 2006 and Zhang et al., 2008); this is a major obstacle for the efficacy of drugs targeting prominent signaling hubs such as p53, MAPK, or IKK.
Recent studies have begun to address how signaling networks generate stimulus-specific responses (Bardwell, 2006, Haney et al., 2010, Hao et al., 2008 and Zalatan et al., 2012). For example, the activity of some pleiotropic kinases may be steered to particular targets by scaffold proteins (Park et al., 2003,Schröfelbauer et al., 2012 and Zalatan et al., 2012). Alternatively, or in addition, some signaling hubs may rely on stimulus-specific signal dynamics to activate selective downstream branches in a stimulus-specific manner in a process known as temporal or dynamic coding or multiplexing (Behar and Hoffmann, 2010,Chalmers et al., 2007, Hoffmann et al., 2002, Kubota et al., 2012, Marshall, 1995 and Purvis et al., 2012;Purvis and Lahav, 2013, Schneider et al., 2012 and Werner et al., 2005).
Although the importance of signaling scaffolds and their pharmacological promise is widely appreciated (Klussmann et al., 2008 and Zalatan et al., 2012) and isolated studies have altered the stimulus-responsive signal dynamics (Purvis et al., 2012, Park et al., 2003, Sung et al., 2008 and Sung and Simon, 2004), the capacity for modulating signal dynamics for pharmacological gain has not been addressed in a systematic manner. In this work, we demonstrate by theoretical means that, when signal dynamics are targeted, pharmacological perturbations can produce stimulus-selective results. Specifically, we identify combinations of signaling hub topology and input-signal dynamics that allow for pharmacological perturbations with dynamic feature-specific or input-specific effects. Then, we investigate stimulus-specific drug targeting in the IKK-NFκB signaling hub both in silico and in vivo. Together, our work begins to define the opportunities for pharmacological targeting of signaling dynamics to achieve therapeutic specificity.
Dynamic Signaling Hubs May Be Manipulated to Mute Specific Signals
Previous work has shown how stimulus-specific signal dynamics may allow a signaling hub to selectively route effector functions to different downstream branches (Behar et al., 2007). Here, we investigated the capacity of simple perturbations to kinetic parameters (caused for example by drug treatments) to produce stimulus-specific effects. For this, we examined a simple model of an idealized signaling hub (Figure 1A), reminiscent of the NFκB p53 or of MAPK signaling modules. The hub X∗ reacts with strong but transient activity to stimulus S1 and sustained, slowly rising activity to stimulus S2. These stimulus-specific signaling dynamics are decoded by two effector modules, regulating transcription factors TF1 and TF2. TF1, regulated by a strongly adaptive negative feedback, is sensitive only to fast-changing signals, whereas TF2, regulated by a slowly activating two-state switch, requires sustained signals for activation (Figure 1B). We found it useful to characterize the X∗, TF1, and TF2 responses in terms of two dynamic features, namely the maximum early amplitude (“E,” time < 15′) and the average late amplitude (“L,” 15′ < t < 6 hr). These features, calculated using a mathematical model of the network (see Experimental Procedures) show good fidelity and specificity (Komarova et al., 2005) (Figure 1C), as S1 causes strong activation of TF1 with minimal crosstalk to TF2, and vice versa for S2.
http://ars.els-cdn.com/content/image/1-s2.0-S0092867413011550-gr1.jpg
Figure 1. Pharmacologic Perturbations with Stimulus-Specific Effects
(A) A negative-feedback module transduces input signals S1 and S2, producing outputs that are decoded by downstream effectors circuits that may distinguish between different dynamics.
(B) Unperturbed dynamics of X∗, TF1∗, and TF2∗ in response to S1 (red) and S2 (blue). Definition of early (E) and late (L) parts of the signal is indicated.
(C) Specificity and fidelity of E and L for TF1∗ and TF2∗, as defined in Komarova et al., 2005).
(D) Partial inhibition of X∗ activation (A) abolishes the response to S1, but not S2, whereas a perturbation targeting the feedback regulator (FBR) suppresses the response to S2, but not S1.
(E) Perturbation phenotypes defined as difference between unperturbed and perturbed values of the indicated quantities (arbitrary scales for X∗, TF1∗, and TF2∗). Perturbation A inhibits E and TF1∗, but not TF2∗; perturbation FBR inhibits L and TF2∗, but not TF1∗.
(F) Virtual screening pipeline showing the experimental design and the two analysis branches for characterizing feature- and input-specific effects.
See also in Experimental Procedures and Table S1.
Seeking simple (affecting a single reaction) perturbations that selectively inhibit signaling by S1 or S2, we found that perturbation A, partially inhibiting the activation of X, was capable of suppressing hub activity in response to a range of S1 amplitudes while still allowing for activity in response to S2 (Figure 1D). Consequently, this perturbation significantly reduced TF1 activity in response to S1 but had little effect on TF2 activity elicited by S2. We also found that the most effective way to inhibit S2 signaling was by targeting the deactivation of negative feedback regulator Y (FBR). This perturbation caused almost complete abrogation of late X activity yet allows for significant levels of early activity. As a result, TF2 was nearly completely abrogated in response to S2, but stimulus S1 still produced a solid TF1 response. The early (E) and late (L) amplitudes could be used to quantify the input-signal-specific effects of these perturbations (Figure 1E).
This numerical experiment showed that it is possible to selectively suppress transient or sustained dynamic signals transduced through a common negative-feedback-containing signaling hub. Moreover, the dynamic features E and L could be independently inhibited. To study how prevalent such opportunities for selective inhibition are, we established a computational pipeline for screening reaction perturbations within multiple network topologies and in response to multiple dynamic input signals; the simulation results were analyzed to identify cases of either “input-signal-specific” inhibition or “dynamic feature-specific” inhibition (Figure 1F).
A Computational Screen to Identify Opportunities for Input-Signal-Specific Inhibition
The computational screen involved small libraries of one- and two-component regulatory modules and temporal profiles of input signals (Figure 2A), both commonly found in intracellular signaling networks. All modules (M1–M7, column on left) contained a species X that, upon stimulation by an input signal, is converted into an active form X∗ (the output) that propagates the signal to downstream effectors. One-component modules included a reversible two-state switch (M1) and a three-state cycle with a refractory state (M2). Two-component modules contained a species Y that, upon activation via a feedback (M3 and M5) or feedforward (M4 and M6) loop, either deactivates X (M3 and M4) or inhibits (M5 and M6) its activation. We also included the afore-described topology that mimics the IκB-NFκB or the Mdm2-p53 modules (M7). Mathematical descriptions may be found in the Experimental Procedures. Although many biological signaling networks may conform to one of these simple topologies, others may be abstracted to one that recapitulates the physiologically relevant emergent properties
Figure 2. A Virtual Screen for Stimulus Specificity in Pharmacologic Perturbations
(A) Signaling modules (left) and input library (top) used in the screen. Dotted lines indicate enzymatic reactions (perturbation names indicated in letter code). Time courses of hub activity for each module/input combination for the unperturbed (black) and perturbed cases (blue indicates a decrease, red an increase in parameter value).
(B) Relative sensitivity of the stimulus response to the indicated perturbation (defined as the perturbation’s effect on the area under the curve), normalized per row.
See also Experimental Procedures, Figure S1, and Tables S2 and S3.
The library of stimuli (S1–S10; Figure 2A, top row) comprises ten input functions with different combinations of “fast” and “slow” initiation and decay phases (see Experimental Procedures). The virtual screen was performed by varying the kinetic parameter for each reaction over a range of values, thereby modeling simple perturbations of different strengths and recording the temporal profile of X∗ abundance. To quantify stimulus-specific inhibition, we measured the area under the normalized dose-response curves (time average of X∗ versus perturbation dose) for each module-input combination (Experimental Procedures, Figure 2B, and Figure S1 available online).
Phase Space Analysis Reveals Underlying Regulatory Principles
To understand the origin of dynamic feature-specific inhibition, we investigated the perturbation effects analytically on each module’s phase space, i.e., the space defined by X∗ and Y∗ quasi-equilibrium surfaces (Figures 4 and S4). These surfaces (“q.e. surfaces”) represent the dose response of X∗ as a function of Y∗ and a stationary input signal S (“X surface”) and the dose response of Y∗ as a function of X∗ and S (“Y surface”) (Figure 4A). The points at which the surfaces intersect correspond to the concentrations of X∗ and Y∗ in equilibrium for a given value of S. In the basal state, when S is low, the system is resting at an equilibrium point close to the origin of coordinates. When S increases, the concentrations of X∗ and Y∗ adjust until the signal settles at some stationary value (Figure 4A). Gradually, changing input signals cause the concentrations to follow trajectories close to the q.e. surfaces (quasi-equilibrium dynamics), following the line defined by the intersection of the surfaces (“q.e. line”) in the extreme of infinitely slow inputs. Fast-changing stimuli drive the system out of equilibrium, causing the trajectories to deviate markedly from the q.e. surfaces.
Two main principles emerged: (1) perturbations that primarily affect the shape of a q.e. surface tend to affect steady-state levels or responses that evolve close to quasi-equilibrium, and (2) perturbations that primarily affect the balance of timescales (X∗, Y∗ activation, and S) tend to affect transient out-of-equilibrium parts of the response. These principles reflect the fact that out-of-equilibrium parts of a signal are largely insensitive to the precise shape of the underlying dose-response surfaces (they may still be bounded by them) but depend on the balance between the timescales of the biochemical processes involved. Perturbation of these balances affects how a system approaches steady state (thus affecting out-of-equilibrium and quasi-equilibrium dynamics), but not steady-state levels. To illustrate these principles, we present selected results for modules M3 and M4 and discuss additional cases in the supplement (Figure S3).
Detailed Analysis of Modules M3 and M4, Related to Figure 4
Time courses and projections of the phase space for modules M3 and M4. Color coding similar to Figure 4.
In the feedback-based modules (M3 and M5), the early peak of activity in response to rapidly changing signals is an out-of-equilibrium feature that occurs when the timescale of Y activation is significantly slower than that of X. Under these conditions, the concentration of X∗ increases rapidly (out of equilibrium) before decaying along the X∗ surface (in quasi-equilibrium) as more Y gets activated (Figure 4A, parameters modified to better illustrate the effects being discussed; see Table S2). For input signals that settle at some stationary level of S, Y activation eventually catches up and the concentration of X∗ settles at the equilibrium point where the X∗ and Y∗ curves intersect. Gradually changing signals allow X∗ and Y∗activation to continuously adapt, and the system evolves closer to the q.e. line.
In such modules, perturbation A (X∗ activation) changes both the shape of the q.e. surface for X∗ and the kinetics of activation. When in the unperturbed system Y∗ saturates, perturbation A primarily reduces X∗steady-state level (Figures 4B and 4C, left and center). When Y∗ does not saturate in the unperturbed system, the primary effect is the reduced activation kinetics. Thus the perturbation affects the out-of-equilibrium peak (Figures 4B and 4C, center and right), with only minor reduction of steady-state levels (especially when Y∗’s dose response respect to X∗ is steep). The transition from saturated to not-saturated feedback (as well as the perturbation strength) underlies the dose-dependent switch from L to E observed in the screen. In both saturated and unsaturated regimes, the shift in the shape of the surfaces does change the q.e. line and thus affects responses occurring in quasi-equilibrium. In contrast, perturbation of the feedback recovery (FBR) shifts the Y∗ surface vertically (Figure 4D), specifically affecting the steady-state levels and late signaling; the effect on Y∗ kinetics is limited because the reaction is relatively slow. Perturbation FBA also shifts the Y∗ surface, but the net effect is less specific because the associated increase in the rate of Y∗ activation tends to equalize X∗ and Y∗ kinetics affecting also the out-of-equilibrium peak.
In resting cells, NFκB is held inactive through its association with inhibitors IκBα, β, and ε. Upon stimulation, these proteins are phosphorylated by the kinase IKK triggering their degradation. Free nuclear NFκB activates the expression of target genes, including IκB-encoding genes, which thereby provide negative feedback (Figure 5A). The IκB-NFκB-signaling module is a complex dynamic system; however, by abstracting the control mechanism to its essentials, we show below that the above-described principles can be applied profitably.

IκB-NFκB signaling module
http://ars.els-cdn.com/content/image/1-s2.0-S0092867413011550-gr5.jpg
Figure 5. Modulating NFκB Signaling Dynamics
(A) The IκB-NFκB signaling module.
(B) Equilibrium dose-response relationship for NFκB versus IKK.
(C) Three IKK curves representative of three stimulation regimes; TNFc (red), TNFp (green), and LPS (blue) function as inputs into the model, which computes the corresponding NFκB activity dynamics (bottom). The quasi-equilibrium line (black) was obtained by transforming the IKK temporal profiles by the dose response in (B). Deviation from the quasi-equilibrium line for the TNF response indicates out-of-equilibrium dynamics.
(D) Coarse-grained model of the IκB-NFκB module and predicted effects of perturbations.
(E) Selected perturbations with specific effects on out-of-equilibrium (top three) or steady state (bottom two). (Left to right) Feature maps in the E-L space (E: t < 60 ′, L: 120′ < t < 300′), tangent angle at the unperturbed point (θ > 0 indicates L is more suppressed than E and vice versa), and time courses (green, TNF chronic; red, TNF pulse; blue, LPS). Only inhibitory perturbations are shown. Additional perturbations are shown in Figure S4.
See also Experimental Procedures and Table S7.
Here, we delineate the potential of achieving stimulus-specific inhibition when targeting molecular reactions within pleiotropic signaling hubs. We found that it is theoretically possible to design perturbations that (1) selectively attenuate signaling in response to one stimulus but not another, (2) selectively attenuate undesirable features of dynamic signals or enhance desirable ones, or (3) remodulate output signals to fit a dynamic profile normally associated with a different stimulus.
These opportunities—not all of them possible for every signaling module topology or biological scenario—are governed by two general principles based on timescale and dose-response relationships between upstream signal dynamics and intramodule reaction kinetics (Figure 4 and Table S4). In short, a steady-state or quasi-equilibrium part of a response may be selectively affected by perturbations that introduce changes in the relevant dose-response surfaces. Out-of-equilibrium responses that are not sensitive to the precise shape of a dose-response curve may be selectively attenuated by perturbations that modify the relative timescales. Dose responses and timescales cannot, in general, be modified independently by simple perturbations (combination treatments are required), but as we show, in some cases, one effect dominates resulting in feature or stimulus specificity.
The degree to which specific dynamic features of a signaling profile or the dynamic responses to specific stimuli can be selectively inhibited depends on how distinctly they rely on quasi-equilibrium and out-of-equilibrium control. Signals that contain both features may be partially inhibited by both types of perturbation, limiting the specific inhibition achievable by simple perturbations. In practice, this limited the degree to which NFκB signaling could be inhibited in a stimulus-specific manner (Figure 5) and the associated therapeutic dose window (Figure 6). The most selective stimulus-specific effects can be introduced when a signal is heavily dependent on a particular dynamic feature; for example, suppression of out-of-equilibrium transients will abrogate the response to stimuli that produce such transients. For a selected group of target genes, this specificity at the signal level translated directly to expression patterns (Figure 6B, middle). More generally, selective inhibition of early or late phases of a signal may allow for specific control of early and late response genes (Figure 6C), a concept that remains to be studied at genomic scales. Though the principles are general, how they apply to specific signaling pathways depends not only on the regulatory topology, but also on the dynamic regime determined by the parameters. As demonstrated with the IκB-NFκB module, analysis of a coarse-grained topology in terms of the principles may allow the prediction of perturbations with a desired specificity.
7.6.2 A Protein-Tagging System for Signal Amplification in Gene Expression and Fluorescence Imaging
Marvin E. Tanenbaum, Luke A. Gilbert, Lei S. Qi, Jonathan S. Weissman, Ronald D. Vale
Cell 23 Oct 2014; 159(3): 635–646
http://dx.doi.org/10.1016/j.cell.2014.09.039
Highlights
- SunTag allows controlled protein multimerization on a protein scaffold
- SunTag enables long-term single-molecule imaging in living cells
- SunTag greatly improves CRISPR-based activation of gene expression
Summary
Signals in many biological processes can be amplified by recruiting multiple copies of regulatory proteins to a site of action. Harnessing this principle, we have developed a protein scaffold, a repeating peptide array termed SunTag, which can recruit multiple copies of an antibody-fusion protein. We show that the SunTag can recruit up to 24 copies of GFP, thereby enabling long-term imaging of single protein molecules in living cells. We also use the SunTag to create a potent synthetic transcription factor by recruiting multiple copies of a transcriptional activation domain to a nuclease-deficient CRISPR/Cas9 protein and demonstrate strong activation of endogenous gene expression and re-engineered cell behavior with this system. Thus, the SunTag provides a versatile platform for multimerizing proteins on a target protein scaffold and is likely to have many applications in imaging and controlling biological outputs.
http://ars.els-cdn.com/content/image/1-s2.0-S0092867414012276-fx1.jpg
SunTag, which can recruit multiple copies of an antibody-fusion protein
Development of the SunTag, a System for Recruiting Multiple Protein Copies to a Polypeptide Scaffold Protein multimerization on a single RNA or DNA template is made possible by identifying protein domains that bind with high affinity to a relatively short nucleic acid motif. We therefore sought a protein-based system with similar properties, specifically a protein that can bind tightly to a short peptide sequence (Figures 1A and1B).Antibodies arecapable ofbindingto short,unstructured peptide sequences with high affinity and specificity, and, importantly, peptide epitopes can be designed that differ from naturally occurring sequences in the genome. Furthermore, whereas antibodies generally do not fold properly in the cytoplasm, single-chain variable fragment (scFv) antibodies, in which the epitope-binding regions of the light and heavy chains of the antibody are fused to forma single polypeptide, have been successfully expressed in soluble form in cells (Colby et al., 2004; Lecerf et al., 2001; Wo ¨rn et al., 2000).
We expressed three previously developed single-chain antibodies (Colby et al., 2004; Lecerf et al., 2001; Wo ¨rn et al., 2000) fused to EGFP in U2OS cells and coexpressed their cognate peptides (multimerized in four tandem copies) fused to the cytoplasmic side of the mitochondrial protein mitoNEET (Colca et al., 2004) (referred to here as Mito, Figure S1A). We then assayed whether the antibody-GFP fusion proteins would be recruited to the mitochondria by fluorescence microscopy, which would indicate binding between antibody and peptide (Figure 1B). Of the three antibody-peptide pairs tested, only the GCN4 antibody-peptide pair showed robust and specific binding while not disrupting normal mitochondrial morphology (Figures 1C and S1B). Thus, we focused our further efforts on the GCN4 antibody-peptide pair. The GCN4 antibody was optimized to allow intracellular expression in yeast (Wo ¨rn et al., 2000). In human cells, however, we still observed some protein aggregates of scFv-GCN4-GFP at high expression levels (Figure S2A). To improve scFv-GCN4 stability, we added a variety of N- and C-terminal fusion proteins known to enhance protein solubility and found that fusion of superfolder-GFP (sfGFP) alone
(Pe’delacq et al., 2006) or along with the small solubility tag GB1 (Gronenborn et al., 1991) to the C terminus of the GCN4 antibody almost completely eliminated protein aggregation, even at high expression levels (Figure S2A). Thus, we performed all further experiments with scFv-GCN4-sfGFP-GB1 (hereafter referred to as scFvGCN4-GFP). Very tight binding of the antibody-peptide pair in vivo is critical fortheformation ofmultimersonaproteinscaffoldbackbone.To determine the dissociation rate of the GCN4 antibody-peptide interaction, we performed fluorescence recovery after photobleaching (FRAP) experiments on scFv-GCN4-GFP bound to the mitochondrial-localized mito-mCherry-4xGCN4pep. After photobleaching, very slow GFP recovery was observed (halflife of 5–10 min [Figures 2A and 2B]), indicating that the antibody bound very tightly to the peptide. It is also important to optimize the spacing of the scFv-GCN4 binding sites within the protein scaffold so that they could be saturated by scFvGCN4 because steric hindrance of neighboring peptide binding sites is a concern. We varied the spacing between neighboring GCN4 peptides and quantified the antibody occupancy on the peptide array.
Figure 1. Identification of an Antibody-Peptide Pair that Binds Tightly In Vivo (A) Schematic of the antibody-peptide labeling strategy. (B) Schematic of the experiment described in (C) in which the mitochondrial targeting domain of mitoNEET (yellow box, mito) fused to mCherry and four tandem copies of a peptide recruits a GFP-tagged intracellular antibody to mitochondria. (C) ScFv-GCN4-GFP was coexpressed with either mito-mCherry-4xGCN4peptide (bottom) or mito-mCherry-FKBP as a control (top) in U2OS cells, and cells were imaged using spinning-disk confocal microscopy. Scale bars, 10 mm. See also Figure S1.
Figure 2. Characterization of the Off Rate and Stoichiometry of the Binding Interaction between the scFv-GCN4 Antibody and the GCN4 Peptide Array In Vivo (A) Mito-mCherry-24xGCN4pep was cotransfected with scFv-GCN4-GFP in HEK293 cells, and their colocalization on mitochondria in a single cell is shown (10 s). At 0 s, the mitochondria-localized GFP signal was photobleached in a single z plane using a 472 nm laser, and fluorescence recovery was followed by time-lapse microscopy. Scale bar, 5 mm. (B) The FRAP was quantified for 20 cells. (C–E) Indicated constructs were transfected in HEK293 cells, and images were acquired 24 hr after transfection with identical image acquisition settings. Representative images are shown in (C). Note that the GFP signal intensity in the mito-mCherry-24xGCN4pep + scFv-GCN4-GFP is highly saturated when the same scaling is used as in the other panels. Bottom row shows a zoom of a region of interest: dynamic scaling was different for the GFP and mCherry signals, so that both could be observed. Scale bars, 10 mm. (D and E) Quantifications of the GFP:mCherry fluorescence intensity ratio on mitochondria after normalization. Eachdot represents a single cell, and dashed lines indicates the average value. See also Figure S2.
Figure 3. The SunTag Allows Long-Term Single-Molecule Fluorescence Imaging in the Cytoplasm (A–H) U2OS cells were transfected with indicated SunTag24x constructs together with the scFv-GCN4-GFP-NLS and were imaged by spinning-disk confocal microscopy 24 hr after transfection. (A) A representative image of SunTag24x-CAAX-GFP is shown (left), as well as the fluorescence intensities quantification of the foci (right, blue bars). As a control, U2OS were transfected with sfGFP-CAAX and fluorescence intensities of single sfGFP-CAAX molecules were also quantified (red bars). The average fluorescence intensity of the single sfGFP-CAAX was set to 1. Dotted line marks the outline of the cell (left). Scale bar, 10 mm. (B) Cells expressing K560-SunTag24x-GFP were imaged by spinning disk confocal microscopy (image acquisition every 200 ms). Movement is revealed by a maximum intensity projection of 50 time points (left) and a kymograph (right). Scale bar, 10 mm. (C and D) Cells expressing both EB3-tdTomato and K560-SunTag24x-GFP were imaged, and moving particles were tracked manually. Red and blue tracks (bottom) indicate movement toward the cell interior and periphery, respectively (C). The duration of the movie was 20 s. Scale bar, 5 mm. Dots in (D) represent individual cells with between 5 and 20 moving particles scored per cell. The mean and SD are indicated. (E and F) Cells expressing Kif18b-SunTag24x-GFP were imaged with a 250 ms time interval. Images in (E) show a maximum intensity projection (50 time- points, left) and a kymograph (right). Speeds of moving molecules were quantified from ten different cells (F). Scale bar, 10 mm. (G and H) Cells expressing both mCherry-a-tubulin and K560rig-SunTag24x-GFP were imaged with a 600 ms time interval.The entire cell is shown in (G), whereas H shows zoomed-instills of atime series from the same cell. Open circlestrack two foci on the same microtubule,which is indicated bythe dashed line. Asterisks indicate stationary foci. Scale bars, 10 and 2 mm (G and H), respectively. See also Figure S3 and Movies S1, S2, S3, S4, S5, and S6.
The GCN4 peptide contains many hydrophobic residues (Figure 4B) and is largely unstructured in solution (Berger et al., 1999); thus, the poor expression of the peptide array could be due to its unstructured and hydrophobic nature. To test this idea, we designed several modified peptide sequence that were predicted to increase a-helical propensity and reduce hydrophobicity. One of these optimized peptides (v4, Figure 4B) was expressed moderately well as a 243 peptide array, and even higher expression was achieved with a 103 peptide array (Figure 4C). Importantly, fluorescence imaging revealed that thescFv-GCN4antibody robustlyboundto theGCN4v4peptide array in vivo and FRAP analysis suggests that the scFv-GCN4 antibody dissociates with a similar slow off rate from the GCN4
v4 peptide array as the original peptide (Figures 4D and 4E). Furthermore, K560 motility could be observed when it was tagged with the optimized v4 243 peptide array, indicating that the optimized v4 peptide array did not interfere with protein function (Movie S7). Together, these results identify a second version of the peptide array that can be used for applications requiring higher expression.
Activation of Gene Transcription Using Cas9-SunTag Because the SunTag system could be used for amplification of a fluorescence signal, we tested whether it also could be used to amplify regulatory signals involved in gene expression. Transcription of a gene is strongly enhanced by recruiting multiple copies of transcriptional activators to endogenous or artificial gene promoters (Anderson and Freytag, 1991; Chen et al., 1992; Pettersson and Schaffner, 1990). Thus, we thought that robust, artificial activation of gene transcription might also be achieved by recruiting multiple copies of a synthetic transcriptional activator to a gene using the SunTag.
Figure 4. An Optimized Peptide Array for High Expression (A) Indicated constructs were transfected in HEK293 cells and imaged 24 hr after transfection using wide-field microscopy. All images were acquired using identical acquisition parameters. Representative images are shown (left), and fluorescence intensities were quantified (n = 3) (right). (B) Sequence of the first and second generation GCN4 peptide (modified or added residues are colored blue, hydrophobic residues are red, and linker residues are yellow). (C–E) Indicated constructs were transfected in HEK293 cells and imaged 24 hr after transfection using wide-field (C) or spinning-disk confocal (D and E) microscopy. (C) Representative images are shown (left), and fluorescence intensities were quantified (n = 3) (right). (D and E) GFP signal on mitochondria was photobleached, and fluorescence recovery was determined over time. The graph (E) represents an average of six cells per condition. (E) shows an image of a representative cell before photobleaching. Scale bars in (A) and (C), 50 mm; scale bars in (D) and (E), 10 mm. Error bars in (A) and (C) represent SDs. See also Movie S7.
Figure 5. dCas9-SunTag Allows Genetic Rewiring of Cells through Activation of Endogenous Genes (A) Schematic of gene activation by dCas9-VP64 and dCas9-SunTag-VP64. dCas9 binds to a gene promoter through its sequence-specific sgRNA (red line). Direct fusion of VP64 to dCas9 (top) results in a single VP64 domain at the promoter, which poorly activates transcription of the downstream gene. In contrast, recruitment of many VP64 domains using the SunTag potently activates transcription of the gene (bottom). (B–D) K562 cells stably expressing dCas9-VP64 or dCas9-SunTag-VP64 were infected with lentiviral particles encoding indicated sgRNAs, as well as BFP and a puromycin resistance gene and selected with 0.7 mg/ml puromycin for 3 days to kill uninfected cells. (B and C) Cells were stained for CXCR4 using adirectlylabeleda-CXCR4 antibody, and fluorescence was analyzed by FACS. (D) Trans-well migration assays (see Experimental Procedures) were performed with indicated sgRNAs. Results are displayed as the fold change in directional migrating cells over control cell migration. (E) dCas9-VP64 or dCas9-SunTag-VP64 induced transcription of CDKN1B with several sgRNAs. mRNA levels were quantified by qPCR. (F) Doubling timeofcontrolcells orcells expressing indicated sgRNAs was determined (see Experimental Procedures section). Graphs in (C), (D), and (F) are averages of three independent experiments. Graph in (E) is average of two biological replicates, each with two or three technical replicates. All error bars indicate SEM. See also Figure S4
7.6.3 IQGAPs choreograph cellular signaling from the membrane to the nucleus
Jessica M. Smith, Andrew C. Hedman, David B. Sacks
Trends Cell Biol Mar 2015; 25(3): 171–184
http://dx.doi.org/10.1016/j.tcb.2014.12.005
Highlights
- IQGAP proteins scaffold diverse signaling molecules.
- IQGAPs mediate crosstalk between signaling pathways.
- IQGAP1 regulates nuclear processes, including transcription.
Since its discovery in 1994, recognized cellular functions for the scaffold protein IQGAP1 have expanded immensely. Over 100 unique IQGAP1-interacting proteins have been identified, implicating IQGAP1 as a critical integrator of cellular signaling pathways. Initial research established functions for IQGAP1 in cell–cell adhesion, cell migration, and cell signaling. Recent studies have revealed additional IQGAP1 binding partners, expanding the biological roles of IQGAP1. These include crosstalk between signaling cascades, regulation of nuclear function, and Wnt pathway potentiation. Investigation of the IQGAP2 and IQGAP3 homologs demonstrates unique functions, some of which differ from those of IQGAP1. Summarized here are recent observations that enhance our understanding of IQGAP proteins in the integration of diverse signaling pathways.
http://ars.els-cdn.com/content/image/1-s2.0-S0962892414002153-gr2.sml
7.6.4 Signaling cell death from the endoplasmic reticulum stress response
Shore GC1, Papa FR, Oakes SA
Curr Opin Cell Biol. 2011 Apr; 23(2):143-9
http://dx.doi.org/10.1016%2Fj.ceb.2010.11.003
Inability to meet protein folding demands within the endoplasmic reticulum (ER) activates the unfolded protein response (UPR), a signaling pathway with both adaptive and apoptotic outputs. While some secretory cell types have a remarkable ability to increase protein folding capacity, their upper limits can be reached when pathological conditions overwhelm the fidelity and/or output of the secretory pathway.
The lumen of the ER is a unique cellular environment optimized to carry out the three primary tasks of this organelle:
- calcium storage and release,
- protein folding and secretion, and
- lipid biogenesis [1].
A range of cellular disturbances lead to accumulation of misfolded proteins in the ER, including
- point mutations in secreted proteins that disrupt their proper folding,
- sustained secretory demands on endocrine cells,
- viral infection with ER overload of virus-encoding protein, and
- loss of calcium homeostasis with detrimental effects on ER-resident calcium-dependent chaperones [2–4].
The tripartite UPR consists of three ER transmembrane proteins (IRE1α, PERK, ATF6) that
- alert the cell to the presence of misfolded proteins in the ER and
- attempt to restore homeostasis in this organelle through increasing ER biogenesis,
- decreasing the influx of new proteins into the ER,
- promoting the transport of damaged proteins from the ER to the cytosol for degradation, and
- upregulating protein folding chaperones [5].
The adaptive responses of the UPR can markedly expand the protein folding capacity of the cell and restore ER homeostasis [6]. However, if these adaptive outputs fail to compensate because ER stress is excessive or prolonged, the UPR induces cell death.
The cell death pathways collectively triggered by the UPR include both caspase-dependent apoptosis and caspase-independent necrosis. While many details remain unknown, we are beginning to understand how cells determine when ER stress is beyond repair and communicate this information to the cell death machinery. For the purposes of this review, we focus on the apoptotic outputs triggered by the UPR under irremediable ER stress.

Connections from the UPR to the Mitochondrial Apoptotic Pathway
http://www.ncbi.nlm.nih.gov/pmc/articles/PMC3078187/bin/nihms256554f1.jpg
Figure 1 Connections from the UPR to the Mitochondrial Apoptotic Pathway
Under excessive ER stress, the ER transmembrane sensors IRE1α and PERK send signals through the BCL-2 family of proteins to activate the mitochondrial apoptotic pathway. In response to unfolded proteins, IRE1α oligomerizes and induces endonucleolytic decay of hundreds of ER-localized mRNAs, depleting ER protein folding components and leading to worsening ER stress. Phosphorylated IRE1α also recruits TNF receptor-associated factor 2 (TRAF2) and activates apoptosis signaling kinase 1 (ASK1) and its downstream target c-Jun NH2-terminal kinase (JNK). JNK then activates pro-apoptotic BIM and inhibits anti-apoptotic BCL-2. These conditions result in dimerization of PERK and activation of its kinase domain to phosphorylate eukaryotic translation initiation factor 2α (eIF2α), which causes selective translation of activating transcription factor-4 (ATF4). ATF4 upregulates expression of the CHOP/GADD153 transcription factor, which inhibits the gene encoding anti-apoptotic BCL-2 while inducing expression of pro-apoptotic BIM. ER stress also promotes p53-dependent transcriptional upregulation of Noxa and Puma, two additional pro-apoptotic BH3-only proteins. Furthermore, high levels of UPR signaling induce initiator caspase-2 to proteolytically cleave and activate pro-apoptotic BID upstream of the mitochondrion. In addition to antagonizing pro-survival BCL-2 members, cleaved BID, BIM and PUMA activate Bax and/or Bak. Hence, in response to excessive UPR signaling, the balance of BCL-2 family proteins shifts in the direction of apoptosis and leads to the oligomerization of BAX and BAK, two multi-domain pro-apoptotic BCL-2 family proteins that then drive the permeabilization of the outer mitochondrial membrane, apoptosome formation and activation of executioner caspases such as Caspase-3. Figure adapted with permission from the Journal of Cell Science [58].
The proximal unfolded protein response sensors
UPR signaling is initiated by three ER transmembrane proteins:
- IRE1α,
- PERK, and
The most ancient ER stress sensor, IRE1α, contains
- an ER lumenal domain,
- a cytosolic kinase domain and
- a cytosolic RNase domain [9,10].
In the presence of unfolded proteins, IRE1α’s ER lumenal domains homo-oligomerize, leading
- first to kinase trans-autophosphorylation and
- subsequent RNase activation.
Dissociation of the ER chaperone BiP from IRE1α’s lumenal domain in order to engage unfolded proteins may facilitate IRE1α oligomerization [11]; alternatively, the lumenal domain may bind unfolded proteins directly [12]. PERK’s ER lumenal domain is thought to be activated similarly [13,14]. The ATF6 activation mechanism is less clear. Under ER stress, ATF6 translocates to the Golgi and is cleaved by Site-1 and Site-2 proteases to generate the ATF6(N) transcription factor [15].
All three UPR sensors have outputs that attempt to tilt protein folding demand and capacity back into homeostasis. PERK contains a cytosolic kinase that phosphorylates eukaryotic translation initiation factor 2α (eIF2α), which impedes translation initiation to reduce the protein load on the ER [16]. IRE1α splices XBP1mRNA, to produce the homeostatic transcription factor XBP1s [17,18]. Together with ATF6(N), XBP1s increases transcription of genes that augment ER size and function[19]. When eIF2α is phosphorylated, the translation of the activating transcription factor-4 (ATF4) is actively promoted and leads to the transcription of many pro-survival genes [20]. Together, these transcriptional events act as homeostatic feedback loops to reduce ER stress. If successful in reducing the amount of unfolded proteins, the UPR attenuates.
However, when these adaptive responses prove insufficient, the UPR switches into an alternate mode that promotes apoptosis. Under irremediable ER stress, PERK signaling can induce ATF-4-dependent upregulation of the CHOP/GADD153 transcription factor, which inhibits expression of the gene encoding anti-apoptotic BCL-2 while upregulating the expression of oxidase ERO1α to induce damaging ER oxidation [21,22]. Sustained IRE1α oligomerization leads to activation of apoptosis signal-regulating kinase 1 (ASK1) and its downstream target c-Jun NH2-terminal kinase (JNK) [23,24]. Phosphorylation by JNK has been reported to both activate pro-apoptotic BIM and inhibit anti-apoptotic BCL-2 (see below). Small molecule modulators of ASK1 have been shown to protect cultured cells against ER stress-induced apoptosis, emphasizing the importance of the IRE1α-ASK1-JNK output as a death signal in this pathway [25]. In response to sustained oligomerization, the IRE1α RNase also causes endonucleolytic decay of hundreds of ER-localized mRNAs [26]. By depleting ER cargo and protein folding components, IRE1α-mediated mRNA decay may worsen ER stress, and could be a key aspect of IRE1α’s pro-apoptotic program [27]. Recently, inhibitors of IRE1α’s kinase pocket have been shown to conformationally activate its adjacent RNase domain in a manner that enforces homeostatic XBP1s without causing destructive mRNA decay [27], a potentially exciting strategy for preventing ER stress-induced cell loss.
The BCL-2 family and the Mitochondrial Apoptotic Pathway
A wealth of genetic and biochemical data argues that the intrinsic (mitochondrial) apoptotic pathway is the major cell death pathway induced by the UPR, at least in most cell types. This apoptotic pathway is set in motion when several toxic proteins (e.g., cytochrome c, Smac/Diablo) are released from mitochondria into the cytosol where they lead to activation of downstream effector caspases (e.g., Caspase-3) [30]. The BCL-2 family, a large class of both pro- and anti- survival proteins, tightly regulates the intrinsic apoptotic pathway by controlling the integrity of the outer mitochondrial membrane [31]. This pathway is set in motion when cell injury leads to the transcriptional and/or post-translational activation of one or more BH3-only proteins that share sequence similarity in a short alpha helix (~9–12 a.a.) known as the Bcl-2 homology 3 (BH3) domain [32]. Once activated, BH3-only proteins lead to loss of mitochondrial integrity by disabling mitochondrial protecting proteins that drive the permeabilization of the outer mitochondrial membrane.
ER stress has been reported to activate at least four distinct BH3-only proteins (BID, BIM, NOXA, PUMA) that then signal the mitochondrial apoptotic machinery (i.e., BAX/BAK) [33–35]. Each of these BH3-only proteins is activated by ER stress in a unique way. Cells individually deficient in any of these BH3-only proteins are modestly protected against ER stress-inducing agents, but not nearly as resistant as cells null for their common downstream targets BAX and BAK [36]—the essential gatekeepers to the mitochondrial apoptotic pathway. Moreover, cells genetically deficient in both Bim andPuma are more protected against ER stress-induced apoptosis than Bim or Puma single knockout cells [37].
The ER stress sensor that signals these BH3-only proteins is known in a few cases (i.e., BIM is downstream of PERK); however, we do not yet understand how the UPR communicates with most of the BH3-only proteins. Moreover, it is not known if all of the above BH3-only proteins are simultaneously set in motion by all forms of ER stress or if a subset is activated under specific pathological stimuli that injure this organelle. Understanding the molecular details of how ER damage is communicated to the mitochondrial apoptotic machinery is critical if we want to target disease specific apoptotic signals sent from the ER.
Initiator and Executor Caspases
Caspases, or cysteine-dependent aspartate-directed proteases, play essential roles in both initiating apoptotic signaling (initiator caspases- 2, 4, 8, 12) and executing the final stages of cell demise (executioner caspases- 3, 7, 9) [38]. It is not surprising that the executioner caspases (casp-3,7,9) are critical for cell death resulting from damage to this organelle. Caspase 12 was the first caspase reported to localize to the ER downstream of BAX/BAK-dependent mitochondrial permeabilization becomes activated by UPR signaling in murine cells [39],but humans fail to express a functional Caspase 12 [41. Genetic knockdown or pharmacological inhibition of caspase-2 confers resistance to ER stress-induced apoptosis [42]. How the UPR activates caspase-2 and whether other initiator caspasesare also involved remains to be determined.
Calcium and Cell Death
Although an extreme depletion of ER luminal Ca2+ concentrations is a well-documented initiator of the UPR and ER stress-induced apoptosis or necrosis, it represents a relatively non-physiological stimulus. Ca2+ signaling from the ER is likely coupled to most pathways leading to apoptosis. UPR-induced activation of ERO1-α via CHOP in macrophages results in stimulation of inositol 1,4,5-triphosphate receptor (IP3R) [43]. All three sub-groups of the Bcl-2 family at the ER regulate IP3R activity. A significant fraction of IP3R is a constituent of highly specialized tethers that physically attach ER cisternae to mitochondria (mitochondrial-associated membrane) and regulate local Ca2+ dynamics at the ER-mitochondrion interface [45–46]. This results in propagation of privileged IP3R-mediated Ca2+ oscillations into mitochondria. In an extreme scenario, massive transmission of Ca2+ into mitochondria results in Ca2+ overload and cell death by caspase-dependent and –independent means [46,47]. More refined transmission regulated by the Bcl-2 axis at the ER can influence cristae junctions and the availability of cytochrome c for its release across the outer mitochondrial membrane [48]. Finally, such regulated Ca2+transmission to mitochondria is a key determinant of mitochondrial bioenergetics [49].
ER Stress-Induced Cell Loss and Disease
Mounting evidence suggests that ER stress-induced apoptosis contributes to a range of human diseases of cell loss, including diabetes, neurodegeneration, stroke, and heart disease, to name a few (reviewed in REF [50]). The cause of ER stress in these distinct diseases varies depending on the cell type affected and the intracellular and/or extracellular conditions that disrupt proteostasis. Both mutant SOD1 and mutant huntingtin proteins aggregate, exhaust proteasome activity, and result in secondary accumulations of misfolded proteins in the ER [51–52].
In the case of IRE1α, it may be possible to use kinase inhibitors to activate its cytoprotective signaling and shut down its apoptotic outputs [27]. Whether similar strategies will work for PERK and/or ATF6 remains to be seen. Alternatively, blocking the specific apoptotic signals that emerge from the UPR is perhaps a more straightforward strategy to prevent ER stress-induced cell loss. To this end, small molecular inhibitors of ASK and JNK are currently being tested in a variety preclinical models of ER stress [52–53,56–57]. This is just the beginning, and much work needs to be done to validate the best drugs targets in the ER stress pathway.
Conclusions
The UPR is a highly complex signaling pathway activated by ER stress that sends out both adaptive and apoptotic signals. All three transmembrane ER stress sensors (IRE1α, PERK, AFT6) have outputs that initially decrease the load and increase capacity of the ER secretory pathway in an effort to restore ER homeostasis. However, under extreme ER stress, continuous engagement of IRE1α and PERK results in events that simultaneously exacerbate protein misfolding and signal death, the latter involving caspase-dependent apoptosis and caspase-independent necrosis. Advances in our molecular understanding of how these stress sensors switch from life to death signaling will hopefully lead to new strategies to prevent diseases caused by ER stress-induced cell loss.
7.6.5 An Enzyme that Regulates Ether Lipid Signaling Pathways in Cancer Annotated by Multidimensional Profiling
Chiang KP, Niessen S, Saghatelian A, Cravatt BF.
Chem Biol. 2006 Oct; 13(10):1041-50.
http://dx.doi.org/10.1016/j.chembiol.2006.08.008
Hundreds, if not thousands, of uncharacterized enzymes currently populate the human proteome. Assembly of these proteins into the metabolic and signaling pathways that govern cell physiology and pathology constitutes a grand experimental challenge. Here, we address this problem by using a multidimensional profiling strategy that combines activity-based proteomics and metabolomics. This approach determined that KIAA1363, an uncharacterized enzyme highly elevated in aggressive cancer cells, serves as a central node in an ether lipid signaling network that bridges platelet-activating factor and lysophosphatidic acid. Biochemical studies confirmed that KIAA1363 regulates this pathway by hydrolyzing the metabolic intermediate 2-acetyl monoalkylglycerol. Inactivation of KIAA1363 disrupted ether lipid metabolism in cancer cells and impaired cell migration and tumor growth in vivo. The integrated molecular profiling method described herein should facilitate the functional annotation of metabolic enzymes in any living system.
Elucidation of the metabolic and signaling networks that regulate health and disease stands as a principal goal of postgenomic research. The remarkable complexity of these molecular pathways has inspired the advancement of “systems biology” methods for their characterization [1]. Toward this end, global profiling technologies, such as DNA microarrays 2 and 3 and mass spectrometry (MS)-based proteomics 4 and 5, have succeeded in generating gene and protein signatures that depict key features of many human diseases. However, extricating from these associative relationships the roles that specific biomolecules play in cell physiology and pathology remains problematic, especially for proteins of unknown biochemical or cellular function.
The functions of certain proteins, such as adaptor or scaffolding proteins, can be gleaned from large-scale protein-interaction maps generated by technologies like yeast two-hybrid 6 and 7, protein microarrays [8], and MS analysis of immunoprecipitated protein complexes 9 and 10. In contrast, enzymes contribute to biological processes principally through catalysis. Thus, elucidation of the activities of the many thousands of enzymes encoded by eukaryotic and prokaryotic genomes requires knowledge of their endogenous substrates and products. The functional annotation of enzymes in prokaryotic systems has been facilitated by the clever analysis of gene clusters or operons 11 and 12, which correspond to sets of genes adjacently located in the genome that encode for enzymes participating in the same metabolic cascade. The assembly of eukaryotic enzymes into metabolic pathways is more problematic, however, as their corresponding genes are not, in general, physically organized into operons, but rather are scattered randomly throughout the genome.
We hypothesized that the determination of endogenous catalytic activities for uncharacterized enzymes could be accomplished directly in living systems by the integrated application of global profiling technologies that survey both the enzymatic proteome and its primary biochemical output (i.e., the metabolome). Here, we have tested this premise by utilizing multidimensional profiling to characterize an integral membrane enzyme of unknown function that is highly elevated in human cancer.
Development of a Selective Inhibitor for the Uncharacterized Enzyme KIAA1363
Previous studies using the chemical proteomic technology activity-based protein profiling (ABPP) 15, 16 and 17 have identified enzyme activity signatures that distinguish human cancer cells based on their biological properties, including tumor of origin and state of invasiveness [18]. A primary component of these signatures was the protein KIAA1363, an uncharacterized integral membrane hydrolase found to be upregulated in aggressive cancer cells from multiple tissues of origin. To investigate the role that KIAA1363 plays in cancer cell metabolism and signaling, a selective inhibitor of this enzyme was generated by competitive ABPP 20 and 21.
Previous competitive ABPP screens that target the serine hydrolase superfamily identified a set of trifluoromethyl ketone (TFMK) inhibitors that showed activity in mouse brain extracts [20]. These TFMK inhibitors showed only limited activity in living human cells (data not shown). We postulated that the activity of KIAA1363 inhibitors could be enhanced by replacing the TFMK group with a carbamate, which inactivates serine hydrolases via a covalent mechanism (Figure S1; see the Supplemental Data available with this article online). Carbamate AS115 (Figure 1A) was synthesized and tested for its effects on the invasive ovarian cancer cell line SKOV-3 by competitive ABPP (Figure 1B). AS115 was found to potently and selectively inactivate KIAA1363, displaying an IC50 value of 150 nM, while other serine hydrolase activities were not affected by this agent (IC50 values > 10 μM) (Figures 1B and 1C). AS115 also selectively inhibited KIAA1363 in other aggressive cancer cell lines that possess high levels of this enzyme, including the melanoma lines C8161 and MUM-2B (Figure S2B).
Figure 1. Characterization of AS115, a Selective Inhibitor of the Cancer-Related Enzyme KIAA1363
Profiling the Metabolic Effects of KIAA1363 Inactivation in Cancer Cells
We next compared the global metabolite profiles of SKOV-3 cells treated with AS115 to identify endogenous small molecules regulated by KIAA1363, using a recently described, untargeted liquid chromatography-mass spectrometry (LC-MS) platform for comparative metabolomics [22]. AS115 (10 μM, 4 hr) was found to cause a dramatic reduction in the levels of a specific set of lipophilic metabolites (m/z 317, 343, and 345) in SKOV-3 cells ( Figure 2A). These metabolites did not correspond to any of the typical lipid species found in cells, none of which were significantly altered by AS115 treatment ( Table S1). High-resolution MS of the m/z 317 metabolite provided a molecular formula of C19H40O3 ( Figure 2B), which suggests that this compound might represent a monoalkylglycerol ether bearing a C16:0 alkyl chain (C16:0 MAGE). This structure assignment was corroborated by tandem MS and LC analysis, in which the endogenous m/z 317 product and synthetic C16:0 MAGE displayed equivalent fragmentation and migration patterns, respectively ( Figure S3). By extension, the m/z 343 and 345 metabolites were interpreted to represent the C18:1 and C18:0 MAGEs, respectively. A control carbamate inhibitor, URB597, which targets other hydrolytic enzymes [23], but not KIAA1363, did not affect MAGE levels in cancer cells ( Figure S4).

Pharmacological Inhibition of KIAA1363 Reduces Monoalkylglycerol Ether, MAGE, Levels in Human Cancer Cells
http://ars.els-cdn.com/content/image/1-s2.0-S1074552106003000-gr2.jpg
Figure 2. Pharmacological Inhibition of KIAA1363 Reduces Monoalkylglycerol Ether, MAGE, Levels in Human Cancer Cells
(A) Global metabolite profiling of AS115-treated SKOV-3 cells (10 μM AS115, 4 hr) with untargeted LC-MS methods [22]revealed a specific reduction in a set of structurally related metabolites with m/z values of 317, 343, and 345 (p < 0.001 for AS115- versus DMSO-treated SKOV-3 cells). Results represent the average fold change for three independent experiments. See Table S1for a more complete list of metabolite levels.
(B) High-resolution MS analysis of the sodium adduct of the purified m/z 317 metabolite provided a molecular formula of C19H40O3, which, in combination with tandem MS and LC analysis ( Figure S3), led to the determination of the structure of this small molecule as C16:0 monoalkylglycerol ether (C16:0 MAGE).
Biochemical Characterization of KIAA1363 as a 2-Acetyl MAGE Hydrolase
The correlation between KIAA1363 inactivation and reduced MAGE levels suggests that these lipids are products of a KIAA1363-catalyzed reaction. A primary route for the biosynthesis of MAGEs has been proposed to occur via the enzymatic hydrolysis of their 2-acetyl precursors 24 and 25. This 2-acetyl MAGE hydrolysis activity was first detected in cancer cell extracts over a decade ago [25], but, to date, it has eluded molecular characterization. To test whether KIAA1363 functions as a 2-acetyl MAGE hydrolase, this enzyme was transiently transfected into COS7 cells. KIAA1363-transfected cells possessed significantly higher 2-acetyl MAGE hydrolase activity compared to mock-transfected cells, and this elevated activity was blocked by treatment with AS115 (Figure 3A). In contrast, KIAA1363- and mock-transfected cells showed no differences in their respective hydrolytic activity for 2-oleoyl MAGE, monoacylglycerols, or phospholipids (e.g., platelet-activating factor [PAF], phosphatidylcholine) (Figure S5A). These data indicate that KIAA1363 selectively catalyzes the hydrolysis of 2-acetyl MAGEs to MAGEs.
KIAA1363 Regulates an Ether Lipid Signaling Network that Bridges Platelet-Activating Factor and the Lysophospholipids
Examination of the Kyoto Encyclopedia of Genes and Genomes (KEGG) database [26] suggests that the KIAA1363-MAGE pathway might serve as a unique metabolic node linking the PAF [27] and lysophospholipid [28] signaling systems in cancer cells (Figure 4A). Consistent with a direct pathway leading from MAGEs to these lysophospholipids, addition of 13C-MAGE to SKOV-3 cells resulted in the formation of 13C-labeled alkyl-LPC and alkyl-LPA (Figure 4C).
Conversely, the levels of 2-acetyl MAGE in SKOV-3 cells, as judged by metabolic labeling experiments, were significantly stabilized by treatment with AS115, which, in turn, led to an accumulation of PAF (Figure 4D). A comparison of the metabolite profiles of SKOV-3 and OVCAR-3 cells revealed significantly higher levels of MAGE, alkyl-LPC, and alkyl-LPA in the former line (Figure 4E). These data indicate that the lysophospholipid branch of the MAGE network is elevated in aggressive cancer cells, and that this metabolic shift is regulated by KIAA1363.
Figure 4. KIAA1363 Serves as a Key Enzymatic Node in a Metabolic Network that Connects the PAF and Lysophospholipid Families of Signaling Lipids
Stable Knockdown of KIAA1363 Impairs Tumor Growth In Vivo
Figure 6. KIAA1363 Contributes to Ovarian Tumor Growth and Cancer Cell Migration
The decrease in tumorigenic potential of shKIAA1363 cells was not associated with a change in proliferation potential in vitro (Figure S8). shKIAA1363 cells were, however, impaired in their in vitro migration capacity compared to control cells (Figure 6B). Neither MAGE nor alkyl-LPC impacted cancer cell migration at concentrations up to 1 μM (Figure 6B). In contrast, alkyl-LPA (10 nM) completely rescued the reduced migratory activity of shKIAA1363 cells. Collectively, these results indicate that KIAA1363 contributes to the pathogenic properties of cancer cells in vitro and in vivo, possibly through regulating the levels of the bioactive lipid LPA.
We have determined by integrated enzyme and small-molecule profiling that KIAA1363, a protein of previously unknown function, is a 2-acetyl MAGE hydrolase that serves as a key regulator of a lipid signaling network that contributes to cancer pathogenesis. Although we cannot yet conclude which of the specific metabolites regulated by KIAA1363 supports tumor growth in vivo, the rescue of the reduced migratory phenotype of shKIAA1363 cancer cells by LPA is consistent with previous reports showing that this lipid signals through a family of G protein-coupled receptors to promote cancer cell migration and invasion 28, 29 and 30. LPA is also an established biomarker in ovarian cancer, and the levels of this metabolite are elevated nearly 10-fold in ascites fluid and plasma of patients with ovarian cancer [31]. Our results suggest that additional components in the KIAA1363-ether lipid network, including MAGE, alkyl LPC, and KIAA1363 itself, might also merit consideration as potential diagnostic markers for ovarian cancer. Consistent with this premise, our preliminary analyses have revealed highly elevated levels of KIAA1363 in primary human ovarian tumors compared to normal ovarian tissues (data not shown). The heightened expression of KIAA1363 in several other cancers, including breast 18 and 32, melanoma [18], and pancreatic cancer [33], indicates that alterations in the KIAA1363-ether lipid network may be a conserved feature of tumorigenesis. Considering further that reductions in KIAA1363 activity were found to impair tumor growth of both ovarian and breast cancer cells, it is possible that inhibitors of this enzyme may prove to be of value for the treatment of multiple types of cancer.
7.6.6 Peroxisomes – A Nexus for Lipid Metabolism and Cellular Signaling
Lodhi IJ, Semenkovich CF
Cell Metab. 2014 Mar 4; 19(3):380-92
http://dx.doi.org/10.1016%2Fj.cmet.2014.01.002
Peroxisomes are often dismissed as the cellular hoi polloi, relegated to cleaning up reactive oxygen chemical debris discarded by other organelles. However, their functions extend far beyond hydrogen peroxide metabolism. Peroxisomes are intimately associated with lipid droplets and mitochondria, and their ability to carry out fatty acid oxidation and lipid synthesis, especially the production of ether lipids, may be critical for generating cellular signals required for normal physiology. Here we review the biology of peroxisomes and their potential relevance to human disorders including cancer, obesity-related diabetes, and degenerative neurologic disease.
Peroxisomes are multifunctional organelles present in virtually all eukaryotic cells. In addition to being ubiquitous, they are also highly plastic, responding rapidly to cellular or environmental cues by modifying their size, number, morphology, and function (Schrader et al., 2013). Early ultrastructural studies of kidney and liver cells revealed cytoplasmic particles enclosed by a single membrane containing granular matrix and a crystalline core (Rhodin, 1958). These particles were linked with the term “peroxisome” by Christian de Duve, who first identified the organelle in mammalian cells when enzymes such as oxidases and catalases involved in hydrogen peroxide metabolism co-sedimented in equilibrium density gradients (De Duve and Baudhuin, 1966). Based on these studies, it was originally thought that the primary function of these organelles was the metabolism of hydrogen peroxide. Novikoff and colleagues observed a large number of peroxisomes in tissues active in lipid metabolism such as liver, brain, intestinal mucosa, and adipose tissue (Novikoff and Novikoff, 1982;Novikoff et al., 1980). Peroxisomes in different tissues vary greatly in shape and size, ranging from 0.1-0.5 μM in diameter. In adipocytes, peroxisomes tend to be small in size and localized in the vicinity of lipid droplets. Notably, a striking increase in the number of peroxisomes was observed during differentiation of adipogenic cells in culture (Novikoff and Novikoff, 1982). These findings suggest that peroxisomes may be involved in lipid metabolism.
Lazarow and de Duve hypothesized that peroxisomes in animal cells were capable of carrying out fatty acid oxidation. This was confirmed when they showed that purified rat liver peroxisomes contained fatty acid oxidation activity that was robustly increased by treatment of animals with clofibrate (Lazarow and De Duve, 1976). In a series of experiments, Hajra and colleagues discovered that peroxisomes were also capable of lipid synthesis (Hajra and Das, 1996). Over the past three decades, multiple lines of evidence have solidified the concept that peroxisomes play fundamentally important roles in lipid metabolism. In addition to removal of reactive oxygen species, metabolic functions of peroxisomes in mammalian cells include β-oxidation of very long chain fatty acids, α-oxidation of branched chain fatty acids, and synthesis of ether-linked phospholipids as well as bile acids (Figure 1). β-oxidation also occurs in mitochondria, but peroxisomal β-oxidation involves distinctive substrates and complements mitochondrial function; the processes of α-oxidation and ether lipid synthesis are unique to peroxisomes and important for metabolic homeostasis.

Structure and functions of peroxisomes
http://www.ncbi.nlm.nih.gov/pmc/articles/PMC3951609/bin/nihms-555068-f0001.jpg
Figure 1 Structure and functions of peroxisomes
The peroxisome is a single membrane-enclosed organelle that plays an important role in metabolism. The main metabolic functions of peroxisomes in mammalian cells include β-oxidation of very long chain fatty acids, α-oxidation of branched chain fatty acids, synthesis of bile acids and ether-linked phospholipids and removal of reactive oxygen species. Peroxisomes in many, but not all, cell types contain a dense crystalline core of oxidative enzymes.
Here we highlight the established role of peroxisomes in lipid metabolism and their emerging role in cellular signaling relevant to metabolism. We describe the origin of peroxisomes and factors involved in their assembly, division, and function. We address the interaction of peroxisomes with lipid droplets and implications of this interaction for lipid metabolism. We consider fatty acid oxidation and lipid synthesis in peroxisomes and their importance in brown and white adipose tissue (sites relevant to lipid oxidation and synthesis) and disease pathogenesis.

peroxisomal biogenesis and protein import
http://www.ncbi.nlm.nih.gov/pmc/articles/PMC3951609/bin/nihms-555068-f0002.jpg
Potential pathways to peroxisomal biogenesis. Peroxisomes are generated autonomously through division of pre-existing organelles (top) or through a de novo process involving budding from the ER followed by import of matrix proteins (bottom). B. Peroxisomal membrane protein import. Peroxisomal membrane proteins (PMPs) are imported post-translationally to the peroxisomal membrane. Pex19 is a soluble chaperone that binds to PMPs and transports them to the peroxisomal membrane, where it docks with a complex containing Pex16 and Pex3. Following insertion of the PMP, Pex19 is recycled back to the cytosol.
Regardless of their origin, peroxisomes require a group of proteins called peroxins for their assembly, division, and inheritance. Over 30 peroxins, encoded by Pex genes, have been identified in yeast (Dimitrov et al., 2013). At least a dozen of these proteins are conserved in mammals, where they regulate various aspects of peroxisomal biogenesis, including factors that control assembly of the peroxisomal membrane, factors that interact with peroxisomal targeting sequences allowing proteins to be shuttled to peroxisomes, and factors that act as docking receptors for peroxisomal proteins.
At least three peroxins (Pex3, Pex16 and Pex19) appear to be critical for assembly of the peroxisomal membrane and import of peroxisomal membrane proteins (PMPs) (Figure 2B). Pex19 is a soluble chaperone and import receptor for newly synthesized PMPs (Jones et al., 2004). Pex3 buds from the ER in a pre-peroxisomal vesicle and functions as a docking receptor for Pex19 (Fang et al., 2004). Pex16 acts as a docking site on the peroxisomal membrane for recruitment of Pex3 (Matsuzaki and Fujiki, 2008). Peroxisomal matrix proteins are translated on free ribosomes in the cytoplasm prior to their import. These proteins have specific peroxisomal targeting sequences (PTS) located either at the carboxyl (PTS1) or amino (PTS2) terminus (Gould et al., 1987; Swinkels et al., 1991).
7.6.7 A nexus for cellular homeostasis- the interplay between metabolic and signal transduction pathways
Ana P Gomes, John Blenis
Current Opinion in Biotechnology Aug 2015; 34:110–117
http://dx.doi.org/10.1016/j.copbio.2014.12.007
Highlights
- Signaling networks sense intracellular and extracellular cues to maintain homeostasis.
- PI3K/AKT and Ras/ERK signaling induces anabolic reprogramming.
- mTORC1 is a master node of signaling integration that promotes anabolism.
- AMPK and SIRT1 fine tune signaling networks in response to energetic status.
In multicellular organisms, individual cells have evolved to sense external and internal cues in order to maintain cellular homeostasis and survive under different environmental conditions. Cells efficiently adjust their metabolism to reflect the abundance of nutrients, energy and growth factors. The ability to rewire cellular metabolism between anabolic and catabolic processes is crucial for cells to thrive. Thus, cells have developed, through evolution, metabolic networks that are highly plastic and tightly regulated to meet the requirements necessary to maintain cellular homeostasis. The plasticity of these cellular systems is tightly regulated by complex signaling networks that integrate the intracellular and extracellular information. The coordination of signal transduction and metabolic pathways is essential in maintaining a healthy and rapidly responsive cellular state.

AMPK and SIRT1 fine tune signaling networks in response to energetic status
http://ars.els-cdn.com/content/image/1-s2.0-S0958166914002225-fx1.jpg
AMPK and SIRT1 fine tune signaling networks in response to energetic status
http://ars.els-cdn.com/content/image/1-s2.0-S0958166914002225-gr1.sml
mTORC1 is a master node of signaling integration that promotes anabolism.
http://ars.els-cdn.com/content/image/1-s2.0-S0958166914002225-gr2.sml
Fine-tuning signaling networks
PI3K/Akt signaling-induced anabolic reprogramming
Growth factors and other ligands activate PI3K signaling upon binding and consequent activation of their cell surface receptors, such as receptor tyrosine kinases (RTKs) and G protein-coupled
receptors (GPCRs). This leads to the phosphorylation of membrane phosphatidylinositiol lipids and the recruitment and activation of several protein kinases, which perpetuate the extracellular
signals to modulate intracellular processes [3,4]. One of the most crucial signal propagators regulated by PI3K signaling is protein kinase B/Akt [3,4]. Indeed, Akt rewires metabolism in response
to environmental cues by three distinct means;
(i) by the direct phosphorylation and regulation of metabolic enzymes,
(ii) by activating/inactivating metabolism altering transcriptional factors, and
(iii) by modulating other kinases that themselves regulate metabolism [5].
Akt regulates glucose metabolism, inducing both glucose uptake and glycolytic flux by increasing the expression of the glucose transporter genes and regulating the activity of glycolytic enzymes,
respectively [6–8]. Moreover, the ability of Akt to induce glycolysis is also mediated by the regulation of Hexokinase (HK). HK performs the first step of glycolysis.
Figure 1 Anabolic rewiring induced by PI3K/Akt, Ras/ERK and mTORC1 signaling.
Extracellular signals activate two major signaling cascades controlled by the activation of PI3K and Ras. PI3K and Ras regulate Akt and ERK, which in turn induce changes in intermediate metabolism
to promote anabolic processes. In addition, they also induce the activation of mTORC1, thus further supporting the rewiring of cellular metabolism towards anabolic processes. Through various mechanisms
Akt, ERK and mTORC1 stimulate mRNA translation, aerobic glycolysis, glutamine anaplerosis, lipid synthesis, the pentose phosphate and pyrimidine synthesis, thus producing the major components
necessary for cell growth and proliferation.
Figure 2. Regulation of intermediate metabolism by nutrient and energy sensors.
Nutrient and energy-responsive pathways fine-tune the output of signaling cascades, allowing for the correct balance between the availability of nutrients and the cellular capacity to use them effectively.
AMPK and SIRT1 respond to the energy status of the cells through sensing of AMP and NAD+ levels respectively. When energy is scarce, these sensors are activated inducing a rewiring of intermediate
metabolism to catabolic processes in order to produce energy and restore homeostasis. When nutrients (such as glucose and amino acids) and energy are available, AMPK, SIRT1, SIRT3 and SIRT6 are
repressed and mTORC1 is active, thus promoting a shift towards anabolic processes and energy production. These networks of signaling cascades, their interconnection and regulation allow the cells
to maintain energetic balance and allow for the physiological adaptation to the ever-changing environment.
7.6.8 Mechanisms-of-intercellular-signaling
7.6.8.1 Activation and signaling of the p38 MAP kinase pathway
Tyler Zarubin1 and Jiahuai Han
Cell Research (2005) 15, 11–18
http://dx.doi.org:/10.1038/sj.cr.7290257
The family members of the mitogen-activated protein (MAP) kinases mediate a wide variety of cellular behaviors in response to extracellular stimuli. One of the four main sub-groups, the p38 group of MAP kinases, serve as a nexus for signal transduction and play a vital role in numerous biological processes. In this review, we highlight the known characteristics and components of the p38 pathway along with the mechanism and consequences of p38 activation. We focus on the role of p38 as a signal transduction mediator and examine the evidence linking p38 to inflammation, cell cycle, cell death, development, cell differentiation, senescence and tumorigenesis in specific cell types. Upstream and downstream components of p38 are described and questions remaining to be answered are posed. Finally, we propose several directions for future research on p38.
Cellular behavior in response to extracellular stimuli is mediated through intracellular signaling pathways such as the mitogen-activated protein (MAP) kinase pathways 1. MAP kinases are members of discrete signaling cascades and serve as focal points in response to a variety of extracellular stimuli. Four distinct subgroups within the MAP kinase family have been described:
- extracellular signal-regulated kinases (ERKs),
- c-jun N-terminal or stress-activated protein kinases (JNK/SAPK),
- ERK/big MAP kinase 1 (BMK1), and
- the p38 group of protein kinases.
The focus of this review will be to highlight the characteristics of
- the p38 kinases,
- components of this kinase cascade,
- activation of this pathway, and
- the biological consequences of its activation.
p38 (p38) was first isolated as a 38-kDa protein rapidly tyrosine phosphorylated in response to LPS stimulation 2, 3. p38 cDNA was also cloned as a molecule that binds puridinyl imidazole derivatives which are known to inhibit biosynthesis of inflammatory cytokines such as interleukin-1 (IL-1) and tumor-necrosis factor (TNF) in LPS stimulated monocytes 4. To date, four splice variants of the p38 family have been identified: p38, p38 5, p38 (ERK6, SAPK3) 6, 7, and p38(SAPK4) 8, 9. Of these, p38 and p38 are ubiquitously expressed while p38 and p38 are differentially expressed depending on tissue type. All p38 kinases can be categorized by a Thr-Gly-Tyr (TGY) dual phosphorylation motif 10. Sequence comparisons have revealed that each p38 isoform shares 60% identity within the p38 group but only 40–45% to the other three MAP kinase family members.
Mammalian p38s activation has been shown to occur in response to extracellular stimuli such as UV light, heat, osmotic shock, inflammatory cytokines (TNF- & IL-1), and growth factors (CSF-1) 1, 3, 15, 16, 17,18, 19, 20, 21. This plethora of activators conveys the complexity of the p38 pathway and this matter is further complicated by the observation that activation of p38 is not only dependent on stimulus, but on cell type as well. For example, insulin can stimulate p38 in 3T3-L1 adipocytes 22, but downregulates p38 activity in chick forebrain neuron cells 23. The activation of p38 isoforms can be specifically controlled through different regulators and coactivated by various combinations of upstream regulators 24, 26.
Like all MAP kinases, p38 kinases are activated by dual kinases termed the MAP kinase kinases (MKKs). However, despite conserved dual phosphorylation sites among p38 isoforms, selective activation by distinct MKKs has been observed. There are two main MAPKKs that are known to activate p38, MKK3 and MKK6. It is proposed that upstream kinases can differentially regulate p38 isoforms as evidenced by the inability of MKK3 to effectively activate p38 while MKK6 is a potent activator despite 80% homology between these two MKKs 27. Also, it has been shown that MKK4, an upstream kinase of JNK, can aid in the activation of p38 and p38 in specific cell types 8. This data suggests then, that activation of p38 isoforms can be specifically controlled through different regulators and coactivated by various combinations of upstream regulators. Furthermore, substrate selectivity may be a reason why each MKK has a distinct function. In addition to the activation by upstream kinases, there is a MAPKK-independent mechanism of p38 MAPK activation involving TAB1 (transforming growth factor–activated protein kinase 1 (TAK1)-binding protein) 28. The activation of p38 in this pathway is achieved by the autophosphorylation of p38 after interaction with TAB1.
The activation of p38 in response to the wide range of extracellular stimuli can be seen in part by the diverse range of MKK kinases (MAP3K) that participate in p38 activation. These include TAK1 33, ASK1/MAPKKK5 34, DLK/MUK/ZPK 35, 36, and MEKK4 35, 37, 38. Overexpression of these MAP3Ks leads to activation of both p38 and JNK pathways which is possibly one reason why these two pathways are often co-activated. Also contributing to p38 activation upstream of MAPK kinases are low molecular weight GTP-binding proteins in the Rho family such as Rac1 and Cdc42 40, 41. Rac1 can bind to MEKK1 or MLK1 while Cdc42 can only bind to MLK1 and both result in activation of p38 via MAP3Ks 35, 42.
Dephosphorylation, would seem to play a major role in the downregulation of MAP kinase activity. Many dual-specificity phosphatases have been identified that act upon various members of the MAP kinase pathway and are grouped as the MAP kinase phosphatase (MKP) family 45. Several members can efficiently dephosphorylate p38 and p38 46, 47; however, p38 and p38 are resistant to all known MKP family members.
The first p38 substrate identified was the MAP kinase-activated protein kinase 2 (MAPKAPK2 or MK2) 1, 15, 52. This substrate, along with its closely related family member MK3 (3pk), were both shown to activate various substrates including small heat shock protein 27 (HSP27) 53, lymphocyte-specific protein 1 (LSP1) 54, cAMP response element-binding protein (CREB) 55, transcription factor ATF1 55, SRF 56, and tyrosine hydroxylase 57. p38 regulated/activated kinase (PRAK) is a p38 and/or p38activated kinase that shares 20-30% sequence identity to MK2 and is thought to regulate heat shock protein 27 (HSP27) 61. Mitogen- and stress-activated protein kinase-1 (MSK1) can be directly activated by p38 and ERK, and may mediate activation of CREB 62, 63, 64.
Another group of substrates that are activated by p38 comprise transcription factors. Many transcription factors encompassing a broad range of action have been shown to be phosphorylated and subsequently activated by p38. Examples include activating transcription factor 1, 2 & 6 (ATF-1/2/6), SRF accessory protein (Sap1), CHOP (growth arrest and DNA damage inducible gene 153, or GADD153), p53, C/EBP, myocyte enhance factor 2C (MEF2C), MEF2A, MITF1, DDIT3, ELK1, NFAT, and high mobility group-box protein 1 (HBP1) 17, 55, 66, 67, 68, 69, 70, 71, 72,73, 74, 75, 76. An important cis-element, AP-1 appears to be influenced by p38 through several different mechanisms. Taken together, all the data suggest that the p38 pathway has a wide variety of functions.
Abundant evidence for p38 involvement in apoptosis exists to date and is based on concomitant activation of p38 and apoptosis induced by a variety of agents such as NGF withdrawal and Fas ligation 95, 96, 97. Cysteine proteases (caspases) are central to the apoptotic pathway and are expressed as inactive zymogens 98,99. Caspase inhibitors then can block p38 activation through Fas cross-linking, suggesting p38 functions downstream of caspase activation 97, 100. However, overexpression of dominant active MKK6b can also induce caspase activity and cell death thus implying that p38 may function both upstream and downstream of caspases in apoptosis 101, 102. It must be mentioned that the role of p38 in apoptosis is cell type and stimulus dependent. While p38 signaling has been shown to promote cell death in some cell lines, in different cell lines p38 has been shown to enhance survival, cell growth, and differentiation.
p38 now seems to have a role in tumorigenesis and sensescence. There have been reports that activation of MKK6 and MKK3 led to a senescent phenotype dependent upon p38 MAPK activity. Also, p38 MAPK activity was shown responsible for senescence in response to telomere shortening, H2O2 exposure, and chronic RAS oncogene signaling 117, 118, 119. A common feature of tumor cells is a loss of senescence and p38 may be linked to tumorigenesis in certain cells. It has been reported that p38 activation may be reduced in tumors and that loss of components of the p38 pathway such as MKK3 and MKK6 resulted in increased proliferation and likelihood of tumorigenic conversion regardless of the cell line or the tumor induction agent used in these studies 29.
Although all research done on the p38 pathway cannot be reviewed here, certain conclusions can still be made regarding the operation of p38 as a signal transduction mediator. The p38 family (,,,) is activated by both stress and mitogenic stimuli in a cell dependent manner and certain isoforms can either directly or indirectly target proteins to control pre/post transcription. p38 MAPKs also have the ability to activate other kinases and consequently regulate numerous cellular responses. Because p38 signaling has been implicated in cellular responses including inflammation, cell cycle, cell death, development, cell differentiation, senescence, and tumorigenesis, emphasis must be placed on p38 function with respect to specific cell types.
Regulation of the p38 pathway is not an isolated cascade and many different upstream signals can lead to p38 activation. These signals may be p38 specific (MKK3/6), general MAPKKs (MKK4), or MAPKK independent signals (TAB1). Downstream signaling pathways of p38 are quite divergent and each component may interact with other cellular components, both upstream and downstream, to coordinate cellular processes such as feedback mechanisms. Furthermore, in vivo p38 is not an isolated event and exists in the presence of other MAP kinases and a plethora of other signaling pathways. The subcellular location of p38 activation may also play a critical role determining the resulting effect and may add yet another order of complexity to the investigation of p38 function.
7.6.8.2 Mitogen-Activated Protein Kinase Pathways Mediated by ERK, JNK, and p38 Protein Kinases
Gary L. Johnson and Razvan Lapadat
Science 6 Dec 2002; 298: 1911-1912.
Multicellular organisms have three well-characterized subfamilies of mitogen activated protein kinases (MAPKs) that control a vast array of physiological processes. These enzymes are regulated by a characteristic phosphorelay system in which a series of three protein kinases phosphorylate and activate one another. The extracellular signal–regulated kinases (ERKs) function in the control of cell division, and inhibitors of these enzymes are being explored as anticancer agents. The c-Jun amino-terminal kinases ( JNKs) are critical regulators of transcription, and JNK inhibitors may be effective in control of rheumatoid arthritis. The p38 MAPKs are activated by inflammatory cytokines and environmental stresses.
Protein kinases are enzymes that covalently attach phosphate to the side chain of either serine, threonine, or tyrosine of specific proteins inside cells. Such phosphorylation of proteins can control their enzymatic activity, their interaction with other proteins and molecules, their location in the cell, and their propensity for degradation by proteases. Mitogen-activated protein kinases (MAPKs) compose a family of protein kinases whose function and regulation have been conserved during evolution from unicellular organisms such as brewers’ yeast to complex organisms including humans (1). MAPKs phosphorylate specific serines and threonines of target protein substrates and regulate cellular activities ranging from gene expression, mitosis, movement, metabolism, and programmed death. Because of the many important cellular functions controlled by MAPKs, they have been studied extensively to define their roles in physiology and human disease. MAPK-catalyzed phosphorylation of substrate proteins functions as a switch to turn on or off the activity of the substrate protein.
MAPKs are part of a phosphorelay system composed of three sequentially activated kinases, and, like their substrates, MAPKs are regulated by phosphorylation (Fig. 1) (2). MKK-catalyzed phosphorylation activates the MAPK and increases its activity in catalyzing the phosphorylation of its own substrates. MAPK phosphatases reverse the phosphorylation and return the MAPK to an inactive state. MKKs are highly selective in phosphorylating specific MAPKs. MAPK kinase kinases (MKKKs) are the third component of the phosphorelay system. MKKKs phosphorylate and activate specific MKKs. MKKKs have distinct motifs in their sequences that selectively confer their activation in response to different stimuli.
Fig. 1. MAPK phosphorelay systems.
The modules shown are representative of pathway connections for the respective MAPK phosphorelay systems.There are multiple component MKKKs, MKKs, and MAPKs for each system.For example, there are three Raf proteins (c-Raf1, B-Raf, A-Raf), two MKKs (MKK1 and MKK2), and two ERKs (ERK1 and ERK2) that can compose MAPK phosphorelay systems responsive to growth factors.The ERK, JNK, and p39 pathways in the STKE Connections Map demonstrate the potential complexity of these systems.
ERKs 1 and 2 are both components of a three-kinase phosphorelay module that includes the MKKK c-Raf1, B-Raf, or A-Raf, which can be activated by the proto-oncogene Ras. Mutations that convert Ras to an activated oncogene are common oncogenic mutations in many human tumors. Oncogenic Ras persistently activates the ERK1 and ERK2 pathways, which contributes to the increased proliferative rate of tumor cells. For this reason, inhibitors of the ERK pathways are entering clinical trials as potential anticancer agents.
Regulation of the JNK pathway is extremely complex and is influenced by many MKKKs. As depicted in the STKE JNK Pathway Connections Map, there are 13 MKKKs that regulate the JNKs. This diversity of MKKKs allows a wide range of stimuli to activate this MAPK pathway. JNKs are important in controlling programmed cell death or apoptosis (9). The inhibition of JNKs enhances chemotherapy-induced inhibition of tumor cell growth, suggesting that JNKs may provide a molecular target for the treatment of cancer. The pharmaceutical industry is bringing JNK inhibitors into clinical trials.
Recently, a major paradigm shift for MAPK regulation was developed for p38. The p38 enzyme is activated by the protein TAB1 (12), but TAB1 is not a MKK. Rather, TAB1 appears to be an adaptor or scaffolding protein and has no known catalytic activity. This is the first demonstration that another mechanism exists for the regulation of MAPKs in addition to the MKKK-MKKMAPK regulatory module.
The importance of MAPKs in controlling cellular responses to the environment and in regulating gene expression, cell growth, and apoptosis has made them a priority for research related to many human diseases. The ERK, JNK, and p38 pathways are all molecular targets for drug development, and inhibitors of MAPKs will undoubtedly be one of the next group of drugs developed for the treatment of human disease (13).
7.6.9 Cathepsin B promotes colorectal tumorigenesis, cell invasion, and metastasis
B Bian, S Mongrain, S Cagnol, Marie-Josée Langlois, J Boulanger, et al.
Molec Carcinogen 25 Mar 2015; 54(5). http://dx.doi.org:/10.1002/mc.22312
Cathepsin B is a cysteine proteinase that primarily functions as an endopeptidase within endolysosomal compartments in normal cells. However, during tumoral expansion, the regulation of cathepsin B can be altered at multiple levels, thereby resulting in its overexpression and export outside of the cell. This may suggest a possible role of cathepsin B in alterations leading to cancer progression. The aim of this study was to determine the contribution of intracellular and extracellular cathepsin B in growth, tumorigenesis, and invasion of colorectal cancer (CRC) cells. Results show that mRNA and activated levels of cathepsin B were both increased in human adenomas and in CRCs of all stages. Treatment of CRC cells with the highly selective and non-permeant cathepsin B inhibitor Ca074 revealed that extracellular cathepsin B actively contributed to the invasiveness of human CRC cells while not essential for their growth in soft agar. Cathepsin B silencing by RNAi in human CRC cells inhibited their growth in soft agar, as well as their invasion capacity, tumoral expansion, and metastatic spread in immunodeficient mice. Higher levels of the cell cycle inhibitor p27Kip1 were observed in cathepsin B-deficient tumors as well as an increase in cyclin B1. Finally, cathepsin B colocalized with p27Kip1 within the lysosomes and efficiently degraded the inhibitor. In conclusion, the present data demonstrate that cathepsin B is a significant factor in colorectal tumor development, invasion, and metastatic spreading and may, therefore, represent a potential pharmacological target for colorectal tumor therapy
Colorectal cancer (CRC),a major malignancy worldwide and the second leading cause of cancer death in North America, develops through multiple steps. The ability of cancers to invade and metastasize depends on the action of proteases actively taking center stage in extracellular proteolysis [2]. Of all the proteases, the cysteine protease cathepsin B is of significant importance [3]. Cathepsin B primarily functions as an endopeptidase within endolysosomal compartments in normal cells. However, during malignant transformation cathepsin B can be upregulated [3, 4]. Cathepsin B in tumors can either be secreted, bound to the cell membrane or released by shedding vesicles [4]. Expression and redistribution of active cathepsin B to the basal plasma membrane occurs in late colon adenomas [5, 6] coincident with the activation of KRAS [1]. In line with these results, Cavallo-Medved et al. [7] have demonstrated that trafficking of cathepsin B to caveolae and its secretion are regulated by active KRAS in CRC cells in culture. Accordingly, secretion of cathepsin B, increased in the extracellular environment of CRC [8, 9], is suspected to play an essential role in disrupting extracellular matrix barriers, facilitating invasion and metastasis [10-12]. These data are consistent with the link between cathepsin B protein expression in colorectal carcinomas and shortened patient survival [6].
In a recent prospective cohort study of 558 men and women with colonic tumors [13] 82% of patients had tumors that expressed cathepsin B, irrespective of stage, while the remaining 18% had tumors that did not express cathepsin B. Other studies have suggested that cathepsin B expression or activity may actually peak during early stage cancer and subsequently decline with advanced disease [14, 15]. This points to a possible role of cathepsin B in both early and late alterations leading to colonic cancer.
This study used two strategies to specifically counteract the action of cathepsin B. The first involved the use of RNA interference (RNAi) to inhibit the expression of cathepsin B protein into CRC cells while the second approach employed the highly selective cathepsin inhibitor Ca074 to block extracellular cathepsin B activity. Results suggest that extracellular cathepsin B is involved in cell invasion whereas intracellular cathepsin B controls malignant properties of CRC cells. Further, biochemical analysis suggests that intracellular cathepsin B regulates tumorigenesis by degrading the p27Kip1 cell cycle inhibitor.
mRNA and Activated Levels of Cathepsin B Are Increased in Adenomas and in Colorectal Tumors of All Stages
Cathepsin B expression was analyzed at both the mRNA and protein levels in a series of human paired specimens at various tumor stages. As shown in Figure 1A, increased transcript levels of cathepsin B were observed in colorectal tumors, regardless of tumor stage, including in adenomas. Of note, increased cathepsin B expression was more prominent in tumors exhibiting APC mutations. By contrast, there did not appear to be a significant difference relative to KRAS mutations (Figure 1B). To establish whether these increased mRNA levels could be correlated with increased cathepsin B protein levels and more importantly with increased activity, expression of the active processed forms of the protease (25 and 30 kDa) was analyzed by Western blot. Both pro-cathepsin B and active cathepsin B were also increased in colorectal tumors compared to normal tissues (Figure 1C and D). These data hence suggest that increased transcription contributes to a greater expression of active cathepsin B in CRC.
Extracellular Cathepsin B Contributes to Invasiveness of Human CRC Cells but is Dispensable for Their Growth in Soft Agar
Cathepsin B protein levels were next examined in lysates obtained from various human CRC cell lines. As shown in Figure 2A, the proactive and catalytically active processed forms of cathepsin B were detected at various levels in CRC cell lines. Selected cathepsin B presence was also confirmed in conditioned culture medium of CRC cells, again at various levels (Figure 2A, lower panel). However, while the pro-form of cathepsin B was readily observed in conditioned culture medium of all CRC cells, the catalytically-active processed forms of cathepsin B were not detected in Western blot analyses. Additionally, using a fluorescence-based enzymatic assay, no cathepsin B enzyme activity was detected in conditioned medium. Since the pro-protease form might be activated under acidic pH conditions (peri- or extracellular) and by extracellular components of the extracellular matrix, the impact of extracellular inhibition of cathepsin B activation on CRC cell invasion was verified using Biocoat Matrigel chambers. HT-29, DLD1, and SW480 CRC cell lines secreting different levels of pro-cathepsin B (Figure 2A) were tested. Experiments were performed using the highly selective and non-permeant inhibitor Ca074 to reduce extracellular cathepsin B activity. At 10 μM, Ca074 produced a >99% inhibition of recombinant cathepsin B levels while barely reducing intracellular cathepsin B, that is, 5–8%, even upon 12 h exposure to the inhibitor (data not shown). Of note, treatment with 10 μM Ca074 significantly inhibited Matrigel invasion by approximately 45–60% in HT29, DLD1, and SW480 CRC cell lines (Figure 2B). By contrast, treatment with Ca074 had no significant effect on their capacity to form colonies in soft agarose (Figure 2C).
Cathepsin B Silencing in Human CRC Cells Inhibits Tumorigenicity and Metastasis in Immunodeficient Mice
Suppression of cathepsin B expression was found to significantly attenuate the metastatic potential of CRC cells in vivo in experimental metastasis assays. Indeed, immunodeficient mice injected with control CRC cells into the tail vein showed extensive lung metastasis within 28 d, whereas cells expressing shRNA against cathepsin B exhibited reduced lung colonization (Figure 4A). Cathepsin B silencing also altered the capacity of CRC cells to form tumors in mice as assessed by subcutaneous xenograft assays. HT29 cells induced palpable tumors with a short latency period of 9 d after their injection while downregulation of cathepsin B expression in these cells severely impaired their capacity to grow as tumors (Figure 4B).
Cathepsin B Silencing in Human CRC Cells Inhibits Growth in Soft Agar and Invasion Capacity
Recombinant lentiviruses encoding anti-cathepsin B short hairpin RNA (shRNA) were developed in order to stably suppress cathepsin B expression in CRC cells. As shown in Figure 3A, intracellular cathepsin B mRNA and protein levels were decreased in HT29 and DLD1 cells in comparison to a control shRNA which had no effect. Reduction of cathepsin B expression modestly slowed the proliferation rate of HT29 and DLD1 populations in 2D cell culture (Figure 3B). Conversely, cathepsin B silencing significantly reduced the ability of HT29 and DLD1 cells to form colonies in soft agarose (Figure 3C). This indicates that intracellular cathepsin B controls anchorage-independent growth of CRC cells given the absence of Ca074 effect (Figure 2C). Moreover, cathepsin B silencing also reduced the number of invading HT29 and DLD1 cells to a similar extent as Ca074 treatment (Figure 3D vs. Figure 2B).
Cathepsin B Silencing in Human CRC Cells Inhibits Tumorigenicity and Metastasis in Immunodeficient Mice
Suppression of cathepsin B expression was found to significantly attenuate the metastatic potential of CRC cells in vivo in experimental metastasis assays. Indeed, immunodeficient mice injected with control CRC cells into the tail vein showed extensive lung metastasis within 28 d, whereas cells expressing shRNA against cathepsin B exhibited reduced lung colonization (Figure 4A). Cathepsin B silencing also altered the capacity of CRC cells to form tumors in mice as assessed by subcutaneous xenograft assays. HT29 cells induced palpable tumors with a short latency period of 9 d after their injection while downregulation of cathepsin B expression in these cells severely impaired their capacity to grow as tumors (Figure 4B).
Cathepsin B Cleaves the Cell Cycle Inhibitor p27Kip1
In order to verify whether p27Kip1 is in fact a substrate for cathepsin B, both proteins were first overexpressed in 293 T cells and cells subsequently lysed 2 d later for Western blot analysis of their respective expression. As shown in Figure 5A, forced expression of cathepsin B in 293 T cells dose-dependently reduced p27Kip1 protein levels. Next, to determine whether p27Kip1 could be degraded by cathepsin B in vitro, lysates from 293 T cells overexpressing HA-tagged p27Kip1 were incubated with purified cathepsin B and analyzed by Western blot. Figure 5B and C shows that cathepsin B degraded p27Kip1 in a time-dependent manner as visualized by the accumulation of three lower molecular mass species (26, 20, and 12 kDa) in addition to the full-length p27Kip1 protein (see arrows versus arrowhead).
Cathepsin B is capable of endopeptidase, peptidyl-dipeptidase, and carboxydipeptidase activities [18-20]. Cathepsin B also possesses a basic amino acid in the catalytic subsite in position S2 enabling the protease to preferentially split its substrates after Arg–Arg or Lys–Arg or Arg–Lys sequences. At least five of these sequences can be found within the human p27Kip1 sequence (Figure 5D). Therefore, the first amino acid of these doublets was mutated into alanine to test whether it would affect the degradation by cathepsin B. Mutation of arginine 58 (Figure 5E) and lysine 189 (Figure 5F) did not alter the cleavage profile of p27Kip1 by cathepsin B. Mutation of lysine 165 and arginine 194 also had no altering effect (not shown). On the other hand, mutation of arginine 152 into alanine markedly reduced the detection of the 20-kDa fragment (Figure 5E).
The protein stability of wild-type p27Kip1 was then compared to that of the p27Kip1 R152A/Δ189–198 mutant, which is more resistant to cathepsin B cleavage. 293T cells were transiently transfected with either wild-type p27Kip1 or p27Kip1 mutant and subsequently treated with cycloheximide to inhibit protein neosynthesis. Thereafter, cells were lysed at different time intervals in order to analyze protein expression levels of p27Kip1 forms. As shown in Figure 6A, following cycloheximide treatment, protein levels of the p27Kip1 mutant decreased much more slowly than that of wild-type protein. Specifically, 10 h after cycloheximide addition, expression of p27Kip1 protein was clearly decreased while expression of the p27Kip1 mutant remained at control (time 0) levels. Of note, forced expression of cathepsin B in 293 T cells dose-dependently reduced the wild-type form of p27Kip1 protein levels while expression of p27Kip1 R152A/Δ189–198 mutant was only very slightly affected (Figure 6B).
Colocalization of Endogenous p27Kip1 With Cathepsin B Into Lysosomes
As shown in Figure 7A, the anti-cathepsin B antibody confirmed the colocalization of cathepsin B (in green) with the lysosomal acidotropic probe LysoTracker (in red). As expected, most of p27Kip1 staining (in green) was observed in the cell nucleus (Figure 7B). However, certain areas of colocalization were observed between endogenous p27Kip1 (in green) and cathepsin B (in red) (Figure 7B, asterisks). Moreover, Western blot analyses revealed the presence of p27Kip1 protein in lysosome-enriched fractions obtained from differential centrifugation of Caco-2/15 and SW480 cell lysates (Figure 7C and D). These lysosomal fractions were enriched in lysosome-associated membrane protein 1 (LAMP1) and exhibited very low or undetectable levels of the nuclear lamin B protein.
The most extensive literature to date regarding cathepsin B highlights a key role of this protease in the invasiveness and metastasis of various carcinoma cells [3, 8, 10-12]. The present findings demonstrate that cathepsin B has not only a role in facilitating CRC invasion and metastasis, but also in mediating early premalignant processes. Results herein show that cathepsin B promotes anchorage-independent CRC cell growth, which translates in vivo to enhanced tumor growth. In addition, cathepsin B was identified as a new protease capable of proteolytic cleavage of the cell cycle inhibitor p27Kip1. This is especially relevant since the loss of p27Kip1 expression has been strongly associated with aggressive tumor behavior and poor clinical outcome in CRC [22, 23].
These data are reminiscent of the immunohistochemistry data reported by Chan et al. [13] showing that cathepsin B protein was expressed in the vast majority of colon cancers analyzed (558 tumors), which was also independent of tumor stage. The present data also revealed that increased transcription of cathepsin B was associated with the presence of mutations in APC but not in KRAS, thus emphasizing the fact that cathepsin B gene expression is already deregulated in early stages of colorectal carcinoma. Indeed, most CRCs acquire loss-of-function mutations in both copies of the APC gene, resulting in inefficient breakdown of intracellular β-catenin and enhanced nuclear signaling [27]. Given the importance of the Wnt/APC/β-catenin pathway in human tumorigenesis initiation, the present data showing an association between cathepsin B expression and APC mutations are particularly noteworthy.
Read Full Post »


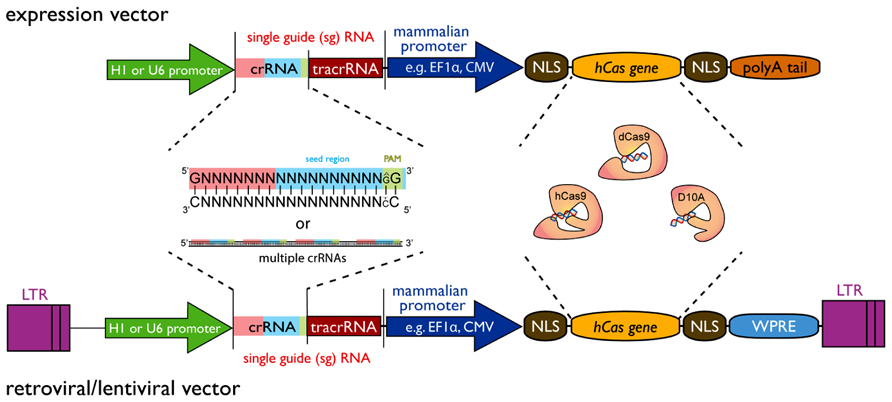
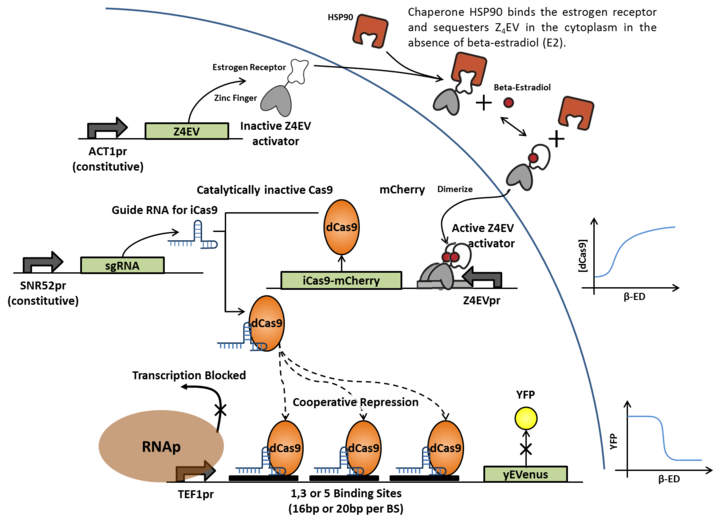
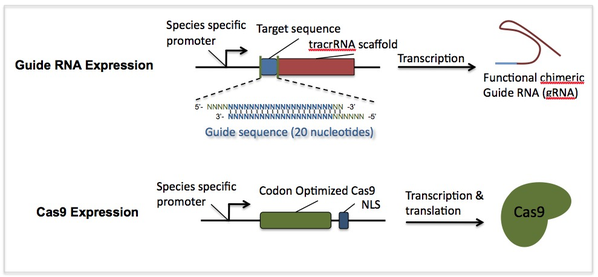
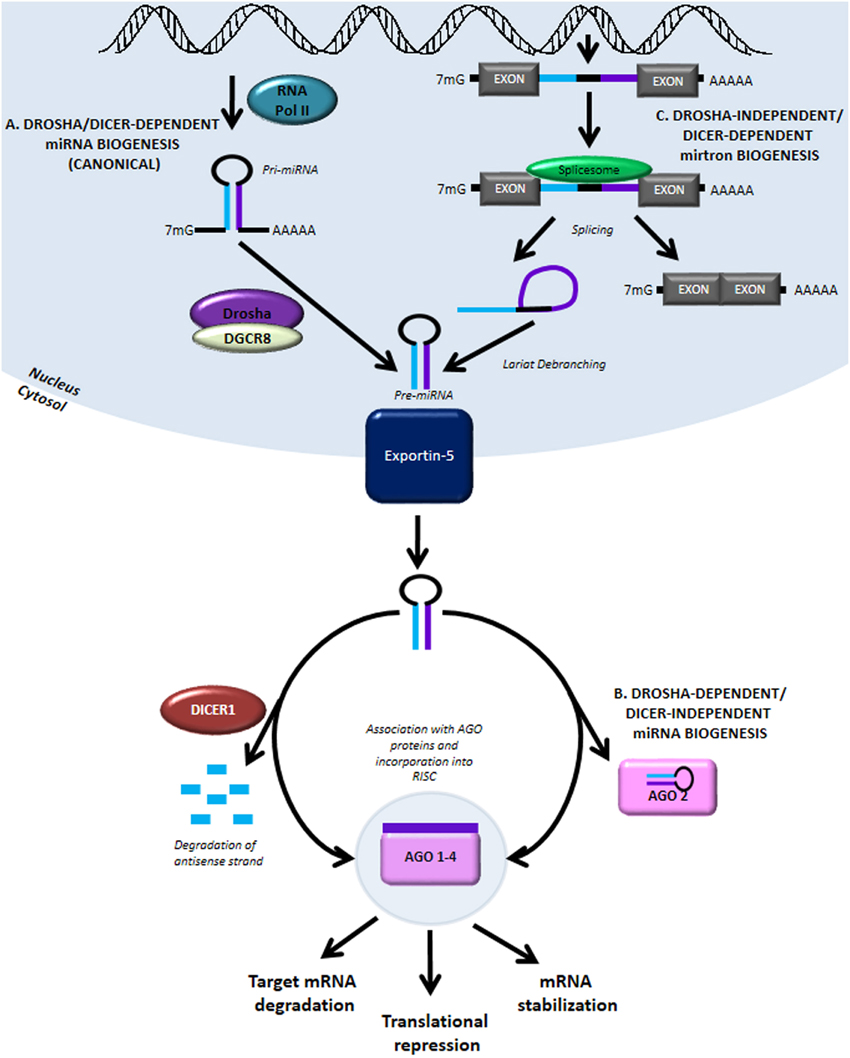
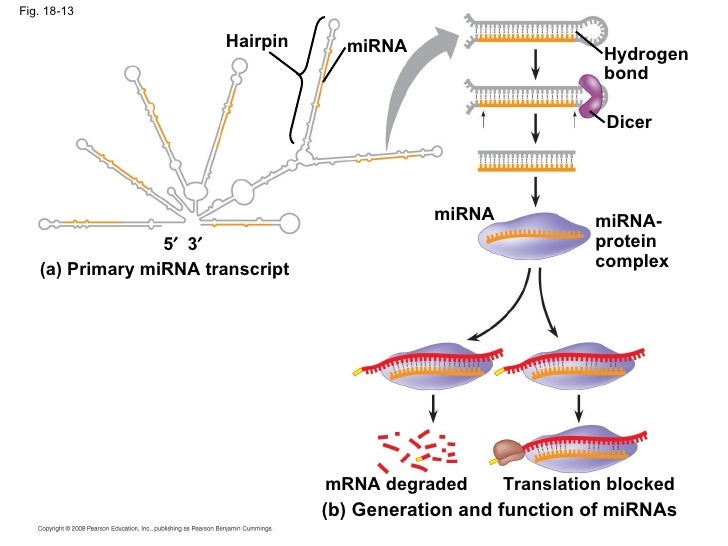
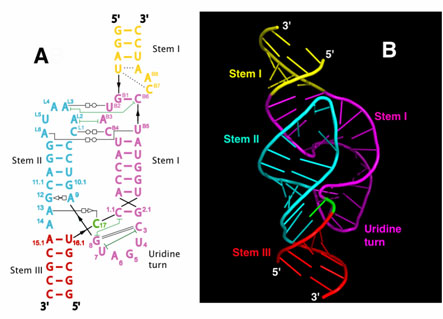