Feeds:
Posts
Comments

Archive for the ‘Medical Imaging Technology, Image Processing/Computing, MRI, CT, Nuclear Medicine, Ultra Sound’ Category

Diagnostic Value of Cardiac Biomarkers

Diagnostic Value of Cardiac Biomarkers

Author and Curator: Larry H Bernstein, MD, FCAP 

These presentations covered several views of the utilization of cardiac markers that have evolved for over 60 years.  The first stage was the introduction of enzymatic assays and isoenzyme measurements to distinguish acute hepatitis and acute myocardial infarction, which included lactate dehydrogenase (LD isoenzymes 1, 2) at a time that late presentation of the patient in the emergency rooms were not uncommon, with the creatine kinase isoenzyme MB declining or disappeared from the circulation.  The world health organization (WHO) standard definition then was the presence of two of three:

1. Typical or atypical precordial pressure in the chest, usually with radiation to the left arm

2. Electrocardiographic changes of Q-wave, not previously seen, definitive; ST- elevation of acute myocardial injury with repolarization;
T-wave inversion.

3. The release into the circulation of myocardial derived enzymes –
creatine kinase – MB (which was adapted to measure infarct size), LD-1,
both of which were replaced with troponins T and I, which are part of the actomyosin contractile apparatus.

The research on infarct size elicited a major research goal for early diagnosis and reduction of infarct size, first with fibrinolysis of a ruptured plaque, and this proceeded into the full development of a rapidly evolving interventional cardiology as well as cardiothoracic surgery, in both cases, aimed at removal of plaque or replacement of vessel.  Surgery became more imperative for multivessel disease, even if only one vessel was severely affected.

So we have clinical history, physical examination, and emerging biomarkers playing a large role for more than half a century.  However, the role of biomarkers broadened.  Patients were treated with antiplatelet agents, and a hypercoagulable state coexisted with myocardial ischemic injury.  This made the management of the patient reliant on long term followup for Warfarin with the international normalized ratio (INR) for a standardized prothrombin time (PT), and reversal of the PT required transfusion with thawed fresh frozen plasma (FFP).  The partial thromboplastin test (PPT) was necessary in hospitalization to monitor the heparin effect.

Thus, we have identified the use of traditional cardiac biomarkers for:

1. Diagnosis
2. Therapeutic monitoring

The story is only the beginning.  Many patients who were atypical in presentation, or had cardiovascular ischemia without plaque rupture were problematic.  This led to a concerted effort to redesign the troponin assays for high sensitivity with the concern that the circulation should normally be free of a leaked structural marker of myocardial damage. But of course, there can be a slow leak or a decreased rate of removal of such protein from the circulation, and the best example of this would be the patient with significant renal insufficiency, as TnT is clear only through the kidney, and TNI is clear both by the kidney and by vascular endothelium.  The introduction of the high sensitivity assay has been met with considerable confusion, and highlights the complexity of diagnosis in heart disease.  Another test that is used for the diagnosis of heart failure is in the class of natriuretic peptides (BNP, pro NT-BNP, and ANP), the last of which has been under development.

While there is an exponential increase in the improvement of cardiac devices and discovery of pharmaceutical targets, the laboratory support for clinical management is not mature.  There are miRNAs that may prove valuable, matrix metalloprotein(s), and potential endothelial and blood cell surface markers, they require

1. codevelopment with new medications
2. standardization across the IVD industry
3. proficiency testing applied to all laboratories that provide testing
4. the measurement  on multitest automated analyzers with high capability in proteomic measurement  (MS, time of flight, MS-MS)

nejmra1216063_f1   Atherosclerotic Plaques Associated with Various Presentations               nejmra1216063_f2     Inflammatory Pathways Predisposing Coronary Arteries to Rupture and Thrombosis.        atherosclerosis progression

Read Full Post »

Curation, HealthCare System in the US, and Calcium Signaling Effects on Cardiac Contraction, Heart Failure, and Atrial Fibrillation, and the Relationship of Calcium Release at the Myoneural Junction to Beta Adrenergic Release

Curation, HealthCare System in the US, and Calcium Signaling Effects on Cardiac Contraction, Heart Failure, and Atrial Fibrillation, and the Relationship of Calcium Release at the Myoneural Junction to Beta Adrenergic Release

Curator and e-book Contributor: Larry H. Bernstein, MD, FCAP
Curator and BioMedicine e-Series Editor-in-Chief: Aviva Lev Ari, PhD, RN

and 

Content Consultant to Six-Volume e-SERIES A: Cardiovascular Diseases: Justin Pearlman, MD, PhD, FACC

This portion summarises what we have covered and is now familiar to the reader.  There are three related topics, and an extension of this embraces other volumes and chapters before and after this reading.  This approach to the document has advantages over the multiple authored textbooks that are and have been pervasive as a result of the traditional publication technology.  It has been stated by the founder of ScoopIt, that amount of time involved is considerably less than required for the original publications used, but the organization and construction is a separate creative process.  In these curations we amassed on average five articles in one curation, to which, two or three curators contributed their views.  There were surprises, and there were unfulfilled answers along the way.  The greatest problem that is being envisioned is the building a vision that bridges and unmasks the hidden “dark matter” between the now declared “OMICS”, to get a more real perspective on what is conjecture and what is actionable.  This is in some respects unavoidable because the genome is an alphabet that is matched to the mino acid sequences of proteins, which themselves are three dimensional drivers of sequences of metabolic reactions that can be altered by the accumulation of substrates in critical placements, and in addition, the proteome has functional proteins whose activity is a regulatory function and not easily identified.  In the end, we have to have a practical conception, recognizing the breadth of evolutionary change, and make sense of what we have, while searching for more.

We introduced the content as follows:

1. We introduce the concept of curation in the digital context, and it’s application to medicine and related scientific discovery.

Topics were chosen were used to illustrate this process in the form of a pattern, which is mostly curation, but is significantly creative, as it emerges in the context of this e-book.

  • Alternative solutions in Treatment of Heart Failure (HF), medical devices, biomarkers and agent efficacy is handled all in one chapter.
  • PCI for valves vs Open heart Valve replacement
  • PDA and Complications of Surgery — only curation could create the picture of this unique combination of debate, as exemplified of Endarterectomy (CEA) vs Stenting the Carotid Artery (CAS), ischemic leg, renal artery stenosis.

2. The etiology, or causes, of cardiovascular diseases consist of mechanistic explanations for dysfunction relating to the heart or vascular system. Every one of a long list of abnormalities has a path that explains the deviation from normal. With the completion of the analysis of the human genome, in principle all of the genetic basis for function and dysfunction are delineated. While all genes are identified, and the genes code for all the gene products that constitute body functions, there remains more unknown than known.

3. Human genome, and in combination with improved imaging methods, genomics offers great promise in changing the course of disease and aging.

4. If we tie together Part 1 and Part 2, there is ample room for considering clinical outcomes based on individual and organizational factors for best performance. This can really only be realized with considerable improvement in information infrastructure, which has miles to go.

Curation

Curation is an active filtering of the web’s  and peer reviewed literature found by such means – immense amount of relevant and irrelevant content. As a result content may be disruptive. However, in doing good curation, one does more than simply assign value by presentation of creative work in any category. Great curators comment and share experience across content, authors and themes.
Great curators may see patterns others don’t, or may challenge or debate complex and apparently conflicting points of view.  Answers to specifically focused questions comes from the hard work of many in laboratory settings creatively establishing answers to definitive questions, each a part of the larger knowledge-base of reference. There are those rare “Einstein’s” who imagine a whole universe, unlike the three blindmen of the Sufi tale.  One held the tail, the other the trunk, the other the ear, and they all said this is an elephant!
In my reading, I learn that the optimal ratio of curation to creation may be as high as 90% curation to 10% creation. Creating content is expensive. Curation, by comparison, is much less expensive.  The same source says “Scoop.it is my content marketing testing “sandbox”. In sharing, he says that comments provide the framework for what and how content is shared.

Healthcare and Affordable Care Act

We enter year 2014 with the Affordable Care Act off to a slow start because of the implementation of the internet signup requiring a major repair, which is, unfortunately, as expected for such as complex job across the US, and with many states unwilling to participate.  But several states – California, Connecticut, and Kentucky – had very effective state designed signups, separate from the federal system.  There has been a very large rush and an extension to sign up. There are many features that we can take note of:

1. The healthcare system needed changes because we have the most costly system, are endowed with advanced technology, and we have inexcusable outcomes in several domains of care, including, infant mortality, and prenatal care – but not in cardiology.

2. These changes that are notable are:

  • The disparities in outcome are magnified by a large disparity in highest to lowest income bracket.
  • This is also reflected in educational status, and which plays out in childhood school lunches, and is also affected by larger class size and cutbacks in school programs.
  • This is not  helped by a large paralysis in the two party political system and the three legs of government unable to deal with work and distraction.
  • Unemployment is high, and the banking and home construction, home buying, and rental are in realignment, but interest rates are problematic.

3.  The  medical care system is affected by the issues above, but the complexity is not to be discounted.

  •  The medical schools are unable at this time to provide the influx of new physicians needed, so we depend on a major influx of physicians from other countries
  • The technology for laboratories, proteomic and genomic as well as applied medical research is rejuvenating the practice in cardiology more rapidly than any other field.
  • In fields that are imaging related the life cycle of instruments is shorter than the actual lifetime use of the instruments, which introduces a shortening of ROI.
  • Hospitals are consolidating into large consortia in order to maintain a more viable system for referral of specialty cases, and also is centralizing all terms of business related to billing.
  • There is reduction in independent physician practices that are being incorporated into the hospital enterprise with Part B billing under the Physician Organization – as in Partners in Greater Boston, with the exception of “concierge” medical practices.
  • There is consolidation of specialty laboratory services within state, with only the most specialized testing going out of state (Quest, LabCorp, etc.)
  • Medicaid is expanded substantially under the new ACA.
  • The federal government as provider of services is reducing the number of contractors for – medical devices, diabetes self-testing, etc.
  • The current rearrangements seeks to provide a balance between capital expenses and fixed labor costs that it can control, reduce variable costs (reagents, pharmaceutical), and to take in more patients with less delay and better performance – defined by outside agencies.

Cardiology, Genomics, and calcium ion signaling and ion-channels in cardiomyocyte function in health and disease – including heart failure, rhythm abnormalities, and the myoneural release of neurotransmitter at the vesicle junction.

This portion is outlined as follows:

2.1 Human Genome: Congenital Etiological Sources of Cardiovascular Disease

2.2 The Role of Calcium in Health and Disease

2.3 Vasculature and Myocardium: Diagnosing the Conditions of Disease

Genomics & Genetics of Cardiovascular Disease Diagnoses

actin cytoskeleton

wall stress, ventricular workload, contractile reserve

Genetic Base of Atherosclerosis and Loss of Arterial Elasticity with Aging

calcium and actin skeleton, signaling, cell motility

hypertension & vascular compliance

Genetics of Conduction Disease

Ca+ stimulated exostosis: calmodulin & PKC (neurotransmitter)

complications & MVR

disruption of Ca2+ homeostasis cardiac & vascular smooth muscle

synaptotagmin as Ca2+ sensor & vesicles

atherosclerosis & ion channels


It is increasingly clear that there are mutations that underlie many human diseases, and this is true of the cardiovascular system.  The mutations are mistakes in the insertion of a purine nucleotide, which may or may not have any consequence.  This is why the associations that are being discovered in research require careful validation, and even require demonstration in “models” before pursuing the design of pharmacological “target therapy”.  The genomics in cardiovascular disease involves very serious congenital disorders that are asserted early in life, but the effects of and development of atherosclerosis involving large and medium size arteries has a slow progression and is not dominated by genomic expression.  This is characterized by loss of arterial elasticity. In addition there is the development of heart failure, which involves the cardiomyocyte specifically.  The emergence of regenerative medical interventions, based on pleuripotent inducible stem cell therapy is developing rapidly as an intervention in this sector.

Finally, it is incumbent on me to call attention to the huge contribution that research on calcium (Ca2+) signaling has made toward the understanding of cardiac contraction and to the maintenance of the heart rhythm.  The heart is a syncytium, different than skeletal and smooth muscle, and the innervation is by the vagus nerve, which has terminal endings at vesicles which discharge at the myocyte junction.  The heart specifically has calmodulin kinase CaMK II, and it has been established that calmodulin is involved in the calcium spark that triggers contraction.  That is only part of the story.  Ion transport occurs into or out of the cell, the latter termed exostosis.  Exostosis involves CaMK II and pyruvate kinase (PKC), and they have independent roles.  This also involves K+-Na+-ATPase.  The cytoskeleton is also discussed, but the role of aquaporin in water transport appears elsewhere, as the transport of water between cells.  When we consider the Gibbs-Donnan equilibrium, which precedes the current work by a century, we recall that there is an essential balance between extracellular Na+ + Ca2+ and the intracellular K+ + Mg2+, and this has been superceded by an incompletely defined relationship between ions that are cytoplasmic and those that are mitochondrial.  The glass is half full!


Read Full Post »

The Cost to Value Conundrum in Cardiovascular Healthcare Provision

The Cost to Value Conundrum in Cardiovascular Healthcare Provision

Author: Larry H. Bernstein, MD, FCAP

Article ID #98: The Cost to Value Conundrum in Cardiovascular Healthcare Provision. Published on 1/1/2014

WordCloud Image Produced by Adam Tubman

I write this introduction to Volume 2 of the e-series on Cardiovascular Diseases, which curates the basic structure and physiology of the heart, the vasculature, and related structures, e.g., the kidney, with respect to:

1. Pathogenesis
2. Diagnosis
3. Treatment

Curation is an introductory portion to Volume Two, which is necessary to introduce the methodological design used to create the following articles. More needs not to be discussed about the methodology, which will become clear, if only that the content curated is changing based on success or failure of both diagnostic and treatment technology availability, as well as the systems needed to support the ongoing advances.  Curation requires:

  • meaningful selection,
  • enrichment, and
  • sharing combining sources and
  • creation of new synnthesis

Curators have to create a new perspective or idea on top of the existing media which supports the content in the original. The curator has to select from the myriad upon myriad options available, to re-share and critically view the work. A search can be overwhelming in size of the output, but the curator has to successfully pluck the best material straight out of that noise.

Part 1 is a highly important treatment that is not technological, but about the system now outdated to support our healthcare system, the most technolog-ically advanced in the world, with major problems in the availability of care related to economic disparities.  It is not about technology, per se, but about how we allocate healthcare resources, about individuals’ roles in a not full list of lifestyle maintenance options for self-care, and about the important advances emerging out of the Affordable Care Act (ACA), impacting enormously on Medicaid, which depends on state-level acceptance, on community hospital, ambulatory, and home-care or hospice restructuring, which includes the reduction of management overhead by the formation of regional healthcare alliances, the incorporation of physicians into hospital-based practices (with the hospital collecting and distributing the Part B reimbursement to the physician, with “performance-based” targets for privileges and payment – essential to the success of an Accountable Care Organization (AC)).  One problem that ACA has definitively address is the elimination of the exclusion of patients based on preconditions.  One problem that has been left unresolved is the continuing existence of private policies that meet financial capabilities of the contract to provide, but which provide little value to the “purchaser” of care.  This is a holdout that persists in for-profit managed care as an option.  A physician response to the new system of care, largely fostered by a refusal to accept Medicaid, is the formation of direct physician-patient contracted care without an intermediary.

In this respect, the problem is not simple, but is resolvable.  A proposal for improved economic stability has been prepared by Edward Ingram. A concern for American families and businesses is substantially addressed in a macroeconomic design concept, so that financial services like housing, government, and business finance, savings and pensions, boosting confidence at every level giving everyone a better chance of success in planning their personal savings and lifetime and business finances.

http://macro-economic-design.blogspot.com/p/book.html

Part 2 is a collection of scientific articles on the current advances in cardiac care by the best trained physicians the world has known, with mastery of the most advanced vascular instrumentation for medical or surgical interventions, the latest diagnostic ultrasound and imaging tools that are becoming outdated before the useful lifetime of the capital investment has been completed.  If we tie together Part 1 and Part 2, there is ample room for considering  clinical outcomes based on individual and organizational factors for best performance. This can really only be realized with considerable improvement in information infrastructure, which has miles to go.  Why should this be?  Because for generations of IT support systems, they are historically focused on billing and have made insignificant inroads into the front-end needs of the clinical staff.

Read Full Post »

This content is password-protected. To view it, please enter the password below.

Read Full Post »

Detecting and Treating Silent Heart Disease: NewYork-Presbyterian Hospital and Weill Cornell Medical College Launch New Institute

Reporter: Aviva Lev-Ari, PhD, RN


UPDATED on 7/15/2018

The Dalio Institute

The Dalio Institute for Cardiovascular Imaging at NewYork-Presbyterian Hospital combines research, clinical care and education to uncover new answers about preventing heart disease. A joint NewYork-Presbyterian Hospital and Weill Cornell Medicine venture, the institute employs a multidisciplinary, multimodality approach to the detection and treatment of heart disease. Directed by Dr. James K. Min, the institute’s mission is to innovate, integrate and educate, goals that will be achieved through cutting-edge research, transformations of current clinical paradigms and dissemination of knowledge.

Rooted in the central role of imaging techniques to better diagnose cardiovascular disease, the institute not only uses state-of-the-art tools such as MRI, CT and PET scanners, but also focuses on the development of novel next-generation technologies and diagnostic tests. Applying a team-based approach that draws on the expertise of physicians and scientists in radiology, cardiology, genetics, proteomics, and computational biology, the institute’s primary research initiative is to identify the specific coronary artery lesion that is responsible for heart attacks or sudden cardiac deaths.

The Dalio Institute uses imaging technologies in conjunction with other cutting-edge diagnostic tests, including blood markers of inflammation, protein expression and metabolism. The clinical program serves patients in the outpatient and inpatient setting, as well as in the emergency department. Three specific initiatives within the clinical program emphasize early identification of heart disease in women, ethnic minorities and young patients with a family history of premature heart disease.

https://hearthealth.weillcornell.org/about-us/dalio-institute

Based on your medical history, we can use calculators to estimate your risk of having a cardiovascular event over time. Risk calculators use various factors including age, sex, and race, in addition to “traditional” cardiac risk factors such as smoking, diabetes, high cholesterol and high blood pressure. Our practice uses several common risk calculators. It is important to emphasize that risk calculators may be imperfect, especially in patients with unique risk factors. These might include a family history of early heart disease or a chronic inflammatory disorder. Therefore, it may be beneficial to consider a full cardiovascular assessment to explore your personal risk and strategies to reduce it.

Risk calculators may be of interest to you, but we caution that the results should be interpreted and reviewed by a trained clinical provider.

https://hearthealth.weillcornell.org/risk-assessments

Diagnostic Tests


Your cardiovascular risk assessment at HeartHealth always begins with a detailed medical history and physical exam.  The physical exam is often not able to fully diagnose problems, nor is it ever able to diagnose coronary artery disease or calcification.  We therefore offer the most up-to-date noninvasive imaging studies to visualize the heart muscle, valves, blood flow and coronary arteries.  We have state-of-the-art equipment and world-renowned experts to interpret these studies.

All of the following will be offered at HeartHealth (Click on the test name to view more information):

  • Cardiac Computed Tomography Angiography (CTA)
  • Cardiac Magnetic Resonance Imaging (MRI)
  • Cardiac PET/CT
  • Echocardiogram/Doppler Transthoracic
  • Exercise Electrocardiogram or ETT (Exercise Treadmill Test)
  • Exercise Stress Echocardiogram & Dobutamine Stress Echocardiogram
  • Myocardial Perfusion Scan (aka Nuclear Stress Test)

HeartHealth

A Program of the Dalio Institute of Cardiovascular Imaging
at the NewYork-Presbyterian Hospital
1305 York Avenue, 8th Floor
New York, NY 10021 Map ThisP: (646) 962-4278 (HART)F: (646) 962-0188


November 12, 2013
Funded by a $20 million gift from the Dalio Foundation, the institute will combine research, clinical care, and education to uncover new answers about preventing heart disease
NEW YORK – To help reduce the burden of cardiovascular disease, the nation’s leading killer, NewYork-Presbyterian Hospital and Weill Cornell Medical College have created the Dalio Institute of Cardiovascular Imaging. Raymond T. Dalio, a life trustee of NewYork-Presbyterian Hospital, has made a gift of $20 million through his Dalio Foundation in support of the institute.

The Dalio Institute of Cardiovascular Imaging will employ a multidisciplinary, multimodality approach to the detection and treatment of heart disease, with a focus on finding new answers about prevention of heart disease in at-risk individuals and ultimately save lives. Its mission is to innovate, integrate, and educate, goals that will be achieved through cutting-edge research, transformations of current clinical paradigms, and dissemination of knowledge. Dr. James K. Min, an expert in cardiovascular imaging and a physician-scientist who has led several large-scale multicenter clinical trials, has been appointed director of the Dalio Institute of Cardiovascular Imaging. Dr. Min is an attending physician at NewYork-Presbyterian Hospital and a full-time faculty member in the Department of Radiology at Weill Cornell Medical College. He joins NewYork-Presbyterian/Weill Cornell from the Cedars-Sinai Medical Center, where he was director of cardiac imaging research and co-director of cardiac imaging. Rooted in the central role of imaging techniques to better diagnose cardiovascular disease, the institute will not only use state-of-the-art tools such as MRI, CT, and PET scanners, but will also focus on the development of novel next-generation technologies and diagnostic tests. Applying a team-based approach that draws on the expertise of physicians and scientists in radiology, cardiology, genetics, proteomics, and computational biology, the institute’s primary research initiative is to identify the “vulnerable plaque,” or the specific coronary artery lesion that is responsible for a future heart attack or sudden cardiac death.“The vulnerable plaque is the holy grail in the diagnostic work-up of individuals with suspected coronary artery disease, and its elusive nature has precluded the timely treatment of millions of high-risk individuals,” says Dr. Min. “We will apply an array of innovative hardware and software imaging technologies to improve identification of the vulnerable plaque, and then seek to apply these findings in large-scale multicenter clinical trials and registries to encourage full integration of our research findings into clinical practice.”
To develop the world-class clinical program to diagnose early cardiovascular disease, the Dalio Institute of Cardiovascular Imaging will use state-of-the-art imaging technologies in conjunction with other cutting-edge diagnostic tests, including blood markers of inflammation, protein expression, and metabolism. The clinical program will serve patients in the outpatient and inpatient setting, as well as in the emergency department. Three specific initiatives within the clinical program will emphasize
  • early identification of heart disease in women,
  • ethnic minorities, and
  • young patients with a family history of premature heart disease. 

The institute’s educational mission will focus on disseminating knowledge of the latest advances in cardiovascular imaging through the education of physicians, physician trainees, and allied health professionals through formal didactic curricula and symposia.

“More than half of people who die from sudden heart attacks never knew they were at risk because their underlying heart conditions had never been diagnosed,” says Dr. Min. “Many heart attacks can be prevented if people know of the extent and severity of their asymptomatic heart disease and are properly treated. By bringing together a multidisciplinary group of experts, the Dalio Institute of Cardiovascular Imaging will not just offer the latest imaging techniques for early detection, but will also develop disruptive technologies to fight the battle against heart disease. Ultimately, these pioneering methods aim to challenge current clinical paradigms in order to reduce the morbidity and mortality associated with cardiovascular disease.” 

“Establishing the Dalio Institute of Cardiovascular Imaging is an incredibly significant milestone in our fight against heart disease,” says Dr. Steven J. Corwin, CEO of NewYork-Presbyterian Hospital and a cardiologist by training. “While modern medicine offers highly sophisticated tools for treating heart disease, we still have a long way to go in terms of identifying high-risk individuals with early-stage disease so that we can prevent catastrophic outcomes and save lives. Dr. Min’s unique background, expertise, and clinical research experience make him ideally suited to lead the institute and its groundbreaking initiatives. We are thrilled that Dr. Min has joined us, and we are extraordinarily grateful to Ray Dalio for his vision and generous support.”

“The interdisciplinary nature of the new Dalio Institute of Cardiovascular Imaging exemplifies the best in translational research – investigations that can make lifesaving impact on our patients,” says Dr. Laurie H. Glimcher, the Stephen and Suzanne Weiss Dean of Weill Cornell Medical College. “Dr. Min has a proven track record of effectively testing novel theories, and we enthusiastically support what we know will be innovative research at the institute.”

NewYork-Presbyterian/Weill Cornell Medical Center, located in New York City, is one of the leading academic medical centers in the world, comprising the teaching hospital NewYork-Presbyterian and Weill Cornell Medical College, the medical school of Cornell University. NewYork-Presbyterian/Weill Cornell provides state-of-the-art inpatient, ambulatory and preventive care in all areas of medicine, and is committed to excellence in patient care, education, research and community service. Weill Cornell physician-scientists have been responsible for many medical advances – including the development of the Pap test for cervical cancer; the synthesis of penicillin; the first successful embryo-biopsy pregnancy and birth in the U.S.; the first clinical trial for gene therapy for Parkinson’s disease; the first indication of bone marrow’s critical role in tumor growth; and, most recently, the world’s first successful use of deep brain stimulation to treat a minimally conscious brain-injured patient. NewYork-Presbyterian Hospital also comprises NewYork-Presbyterian/Columbia University Medical Center, NewYork-Presbyterian/Morgan Stanley Children’s Hospital, NewYork-Presbyterian/Westchester Division, NewYork-Presbyterian/The Allen Hospital, and NewYork-Presbyterian/Lower Manhattan Hospital. NewYork-Presbyterian is the #1 hospital in the New York metropolitan area and is consistently ranked among the best academic medical institutions in the nation, according to U.S.News & World Report. Weill Cornell Medical College is the first U.S. medical college to offer a medical degree overseas and maintains a strong global presence in Austria, Brazil, Haiti, Tanzania, Turkey and Qatar. For more information, visit http://www.nyp.org and weill.cornell.edu.
SOURCE

Read Full Post »

Contributions to Cardiomyocyte Interactions and Signaling

Author and Curator: Larry H Bernstein, MD, FCAP

and

Curator: Aviva Lev-Ari, PhD, RN

Introduction

This is Part II of the ongoing research in the Lee Laboratory, concerned with Richard T Lee’s dissection of the underlying problems that will lead to a successful resolution of myocardiocyte regeneration unhampered by toxicity, and having a suffuciently sustained effect for an evaluation and introduction to the clinic.  This would be a milestone in the treatment of heart failure, and an alternative to transplantation surgery.  This second presentation focuses on the basic science work underpinning the therapeutic investigations.  It is work that, if it was unsupported and did not occur because of insufficient funding, the Part I story could not be told.

Cardiomyocyte hypertrophy and degradation of connexin43 through spatially restricted autocrine/paracrine heparin-binding EGF

J Yoshioka, RN Prince, H Huang, SB Perkins, FU Cruz, C MacGillivray, DA Lauffenburger, and RT Lee *
Cardiovascular Division, Department of Medicine, Brigham and Women’s Hospital, Harvard Medical School, Boston, MA; and Biological Engineering Division, MIT, Cambridge, MA
PNAS 2005; 302(30):10622-10627.  http://pnas.org/cgi/doi/10.1073/pnas.0501198102

Growth factor signaling can affect tissue remodeling through autocrine/paracrine mechanisms. Recent evidence indicates that EGF receptor transactivation by heparin-binding EGF (HB-EGF) contributes to hypertrophic signaling in cardiomyocytes. Here, we show that HB-EGF operates in a spatially restricted circuit in the extracellular space within the myocardium, revealing the critical nature of the local microenvironment in intercellular signaling. This highly localized microenvironment of HB-EGF signaling was demonstrated with 3D morphology, consistent with predictions from a computational model of EGF signaling. HB-EGF secretion by a given cardiomyocyte in mouse left ventricles led to cellular hypertrophy and reduced expression of connexin43 in the overexpressing cell and in immediately adjacent cells but not in cells farther away. Thus, HB-EGF acts as an autocrine and local paracrine cardiac growth factor that leads to loss of gap junction proteins within a spatially confined microenvironment. These findings demonstrate how cells can coordinate remodeling with their immediate neighboring cells with highly localized extracellular EGF signaling. Within 3D tissues, cells must coordinate remodeling in response to stress or growth signals, and this communication may occur by direct contact or by secreted signaling molecules. Cardiac hypertrophy is a physiological response that enables the heart to adapt to an initial stress; however, hypertrophy can ultimately lead to the deterioration in cardiac function and an increase in cardiac arrhythmias. Although considerable progress has been made in elucidating the molecular pathogenesis of cardiac hypertrophy, the precise mechanisms guiding the hypertrophic process remain unknown. Recent evidence suggests that myocardial heparin-binding (HB)-epidermal growth factor participates in the hypertrophic response. In cardiomyocytes, hypertrophic stimuli markedly increase expression of the HB-EGF gene, suggesting that HB-EGF can act as an autocrine trophic factor that contributes to cellular growth. HB-EGF is first synthesized as a membrane-anchored form (proHB-EGF), and subsequent ectodo-main shedding at the cell surface releases the soluble form of HB-EGF. Soluble HB-EGF is a diffusible factor that can be captured by the receptors to activate the intracellular EGF receptor signaling cascade. Indeed, EGF receptor (EGFR) transactivation, triggered by shedding of HB-EGF from the cell surface, plays an important role in cardiac hypertrophy resulting from pressure overload in the aortic-banding model. EGFR activation can occur through autocrine and paracrine signaling. In autocrine signaling, a cell produces and responds to the same signaling molecules. Paracrine signaling molecules can target groups of distant cells or act as localized mediators affecting only cells in the immediate environment of the signaling cell. Thus, although locally produced HB-EGF may travel through the extra-cellular space, it may also be recaptured by the EGFR close to the point where it was released from the cell surface. The impact of spatially localized microenvironments of signaling could be extensive heterogeneous tissue remodeling, which can be particularly important in an electrically coupled tissue like myocardium. Interestingly, recent data suggest that EGF can regulate protea-some-dependent degradation of connexin43 (Cx43), a major trans-membrane gap junction protein, in liver epithelial cells, along with a rapid inhibition of cell–cell communication through gap junctions. One of the critical potential myocardial effects of HB-EGF could therefore be to increase degradation of Cx43 and reduce electrical stability of the heart. Reduced content of Cx43 is commonly observed in chronic heart diseases such as hypertrophy, myocardial infarction, and failure. Thus, we hypothesized that HB-EGF signals may operate in a spatially restricted local circuit in the extracellular space. We also hypothesized that HB-EGF secretion by a given cardiomyocyte could create a local remodeling microenvironment of decreased Cx43 within the myocardium. To explore whether HB-EGF signaling is highly spatially constrained, we took advantage of the nonuniform gene transfer to cardiac myocytes in vivo, normally considered a pitfall of gene therapy. We also performed computational modeling to predict HB-EGF dynamics and developed a 3D approach to measure cardiomyocyte hypertrophy.

Results

Autocrine HB-EGF and Cardiomyocyte Growth.

To assess the effects of gene transfer of HB-EGF on cardiomyocyte hypertrophy, cells were infected with adenoviral vectors expressing GFP alone (Ad-GFP) or HB-EGF and GFP (Ad-HB-EGF). At this level of infection, 99% of cardiomyocytes were transduced. The incidence of apoptotic cell death (sub-G1 fraction) was not different between Ad-GFP cells, suggesting that expression of GFP by the adenoviral vector was not cardiotoxic in these conditions. Western analysis by using an anti-HB-EGF antibody confirmed successful gene transfer of HB-EGF in cardiomyocytes (18 ± 5-fold, n = 4, P < 0.01); HB-EGF appeared electrophoretically as several bands from 15 to 30 kDa (Fig. 1A). The strongest band corresponds to the soluble 20-kDa form of HB-EGF. To confirm that Ad-HB-EGF results in cellular hypertrophy, cell size and protein synthesis were measured. Ad-HB-EGF enlarged cardiomyocytes compared with Ad-GFP-infected cells by phase-contrast microscopy (24 ± 10% increase in cell surface area, n = 27, P < 0.05) and with flow cytometry analysis (26 ± 10% increase of Ad-GFP infected cells, P < 0.01, Fig. 1B). Overexpression of HB-EGF increased total protein synthesis in cardiomyocytes as measured by [3H]leucine uptake (34 ± 6% of Ad-GFP, n = 6, P < 0.01, Fig. 1C). Uninfected cells within the same dish (and thus sharing the same culture media) did not develop hypertrophy. Additionally, medium from cultures previously infected with Ad-HB-EGF for 48 h was collected and applied to adenovirus-free cultures. Conditioned medium from Ad-HB-EGF-infected cardiomyocytes failed to stimulate hypertrophy in naive cardiomyocytes (Fig. 1C), and there were no significant differences in cell size between noninfected cells from Ad-GFP and Ad-HB-EGF dishes. These results suggest that HB-EGF acts primarily as an autocrine growth factor in cardiomyocytes in vitro.
Because the dilution factor in culture media is important for autocrine/paracrine signaling, we determined the concentration of soluble HB-EGF in the conditioned medium and the effective concentration to stimulate cardiomyocyte growth. HB-EGF levels in the conditioned medium from Ad-HB-EGF dishes were 258 ± 73 pg/ml (n = 4), whereas HB-EGF levels from Ad-GFP dishes (n = 8) were below the limit of detection (6.7 pg/ml). The addition of 300 pg/ml of exogenous recombinant HB-EGF into fresh media failed to stimulate hypertrophy in cardiomyocytes as measured by [3H]leucine uptake (-12 ± 5.0% compared with control, n = 5,P = not significant), but 2,000 pg/ml of recombinant HB-EGF did result in a significant effect (+24 ± 5.5% compared with control, n = 6, P < 0.05). This comparison implies that the local concentration of autocrine ligand is substantially greater than that indicated by a bulk measurement of conditioned media, consistent with previous experimental and theoretical studies.

Fig. 1. Effects of gene transfer of HB-EGF on rat neonatal cardiomyocyte growth.

(A) Cells were infected with adenoviral vectors expressing GFP (Ad-GFP), or HB-EGF and GFP (Ad-HB-EGF). Western analysis showed the successful gene transfer of HB-EGF. (8) FACS analysis of 5,000 cardiomyocytes demonstrated that overexpression of HB-EGF produced a 26 ± 10% increase in cell size that was significantly greater than the overex-pression of GFP. Bar graphs with errors represent mean ± SEM from three independent experiments. **, P < 0.01 vs. Ad-HB-EGF-nonin-fected cells and Ad-GFP nonin-fected cells. , P < 0.05 vs. Ad-GFP infected cells. (C) Overexpression of HB-EGF resulted in a 34 ± 6% increase in [3H]leucine uptake compared with Ad-GFP (n = 6), whereas conditioned medium from Ad-HB-EGF cells caused an only insignificant increase. **, P < 0.05 vs. Ad-GFP control and conditioned medium Ad-GFP.

 Effects of HB-EGF on Cx43 Content in Cultured Cardiomyocytes

Because EGF can induce degradation of the gap junction protein Cx43 in other cells, we then determined whether Cx43 is regulated by HB-EGF in cardiomyocytes. Fig. 2A shows a representative immunoblot from three separate experiments in which Cx43 migrated as three major bands at 46, 43, and 41 kDa, as reported in ref. 16. Overexpression of HB-EGF decreased total Cx43 content (27 ± 11% compared with Ad-GFP, n = 4, P < 0.05) without affecting the intercellular adhesion protein, N-cadherin. The phosphorylation of ERK1/2, an intracellular signaling kinase downstream of EGFR transactivation, was augmented by HB-EGF (3.2 ± 1.0-fold compared with Ad-GFP, n = 4, P < 0.05). Northern analysis showed that HB-EGF did not reduce Cx43 gene expression, suggesting that HB-EGF decreases Cx43 by posttranslational modification (Fig. 2B). AG 1478 (10 iLM), a specific inhibitor of EGFR tyrosine kinase, abolished the effect of HB-EGF on Cx43 (Fig. 2C), indicating that the decrease in Cx43 content depends on EGFR transactivation by HB-EGF. The conditioned medium from Ad-HB-EGF-infected cells did not change expression of Cx43 in naive cells, even though ERK1/2 was slightly activated by the conditioned medium (Fig. 1D). These data are consistent with the hypertrophy data presented above, demonstrating that HB-EGF can act as a predominantly autocrine factor both in hypertrophy and in the reduction of Cx43 content in cardiomyocytes.

Computational Analysis Predicts HB-EGF Autocrine/Paracrine Signaling in Vivo.

Although these in vitro experiments showed HB-EGF as a predominantly autocrine cardiac growth factor, HB-EGF signaling in vivo takes place in a very different environment. Therefore, we sought to determine the extent that soluble HB-EGF may travel in the interstitial space of the myocardium with a simple 2D model of HB-EGF diffusion (Fig. 3A). An approximate geometric representation of myocytes in cross-section is a square (15 x 15 iLm), with each of the corners occupied by a capillary (diameter 5 iLm). The cell shape was chosen so that the extracellular matrix width (0.5 iLm), in which soluble HB-EGF is free to diffuse, was constant around all tissue features. This model geometry is based on a square array of capillaries; although a hexagonal pattern of capillary distribution is commonly accepted, the results are not expected to be substantially different with this simpler construction, because both have four capillaries surrounding each myocyte. The model represents a single central cell that is releasing HB-EGF at a constant rate, Rgen, (approximated from the HB-EGF concentration measurement in conditioned medium) into the extracellular space. HB-EGF then can diffuse throughout this space, or enter a capillary and leave the system. This system is governed by
  • the diffusion equation at steady state (DV2C = 0),
  • the boundary condition for the ligand producing cell (—DVC = Rgen),
  • the boundary condition for all other cells (—DVC = 0), and
  • the capillary boundary condition (DVC = h(C — Cblood)).

C denotes HB-EGF concentration, D is the diffusivity constant, h is the mass transfer coefficient, and Cblood is the concentration of HB-EGF in the blood, approximated to be zero.  The numerical solution in Fig. 3B illustrates that HB-EGF remained localized around the cell which produced it and did not diffuse farther because of the sink-like effect of the capillaries. The maximum concentration of soluble HB-EGF achieved is 0.27 nM, which is near the threshold level of HB-EGF measured to stimulate cardiomyocyte growth (2,000 pg/ml). Therefore, the central HB-EGF-producing cell only signals to its four adjacent neighbors where the HB-EGF concentration reaches this threshold. However, if the model geometry is altered to reflect a 50% and 150% increase in cross-sectional area in all cells because of hypertrophy, estimated from 1 and 4 weeks of transverse aortic constriction, the maximum concentration achieved increases slightly to 0.29 nM and 0.37 nM, respectively. As the cell width increases, HB-EGF must diffuse farther to reach a capillary, exposing adjacent cells to a higher concentration during hypertrophy. However, no additional cells are exposed to HB-EGF. 

Fig. 3. Computational modeling of HB-EGF diffusion in the myocardium.

Red areas represent capillaries, green represents the HB-EGF ligand producing cell, pink represents adjacent cells, and white is an extracellular matrix where HB-EGF is free to diffuse. (A) The model geometry where HB-EGF is generated by the ligand-producing cell at a constant rate, Rgen, and diffuses throughout the extracellular space or enters a capillary and leaves the system with a mass transfer coefficient, h. (B) Numerical solution of the steady-state HB-EGF concentration profile with Rgen = 10 cell-1s-1, D = 0.7 µm2/s, and h = 0.02 µm/s, where concentration is shown by the color scale and height depicted. The maximum concentration achieved with the stated parameters was 0.27 nM from a capillary. Myocyte length was assumed to be 100 µm.

The driving force that determined the extent to which HB-EGF traveled was the rate of HB-EGF transfer into the capillaries and the diffusivity of HB-EGF. The exact mechanism of macromolecule transport into capillaries is unknown; however, it is most likely through diffusion, transcytosis, or a combination of the two. In the case of diffusion, the mass transfer coefficient governing the flux of HB-EGF through the capillary wall is coupled to the diffusivity of HB-EGF, whereas the terms are uncoupled for the case of transcytosis. Therefore, this model assessed transcytosis as a conservative scenario for HB-EGF localization. Parameter perturbation with uncoupled diffusion and capillary mass transfer showed that HB-EGF remained localized around the origin of production and diffused only to immediate neighbors for mass transfer coefficients >0.002 µm/s. For values <0.002 µm/s, HB-EGF diffused distances more than two cells away from the origin. Although the actual mass transfer coefficient of ligands in the size range of HB-EGF is unknown, values for O2 (0.02 µm/s, 0.032 kDa) (19) and LDL (1.7 x 10⁻⁵ µm/s, 2,000–3,000 kDa) (20) have been reported, and we assumed HB-EGF is in the upper end of that range due to its small size. HB-EGF also binds to EGFRs, the extracellular matrix, and cell surface heparan sulfate proteoglycans. EGFR binding and internalization could serve to further localize HB-EGF. The number of extracellular binding sites does not affect the steady-state HB-EGF concentration profile if this binding is reversible. However, these binding sites could serve to localize HB-EGF as the cell begins to produce the ligand by slowing the travel of HB-EGF to the capillaries in the approach to the steady state, or as a source of HB-EGF as the cell slows or stops HB-EGF production. At a diffusivity of 0.7 µm2/s (21), HB-EGF traveled only one cell away, but traveled approximately five cells away at 51.8 µm2/s (22), with a peak concentration below the estimated threshold for stimulating.

Overexpression of HB-EGF Causes Hypertrophy on the Infected Cell and Its Immediate Neighbor in Vivo.

To explore whether HB-EGF signals operate in a spatially restricted local circuit in the in vivo myocardial extracellular space as predicted by computational modeling, adenoviral vectors were injected directly into the left ventricular free wall in 26 male mice (Ad-GFP, n = 12; Ad-HB-EGF, n = 14). Of the 26 mice, 5 (4 Ad-GFP and 1 Ad-HB-EGF) mice died after the surgery. Gene expression was confirmed as positive cellular fluorescence in the presence of GFP, allowing determination of which cells were infected at 7 days (Fig. 4A). Immunohis-tochemical staining revealed that HB-EGF was localized on the Ad-HB-EGF-infected cell membrane or in the extracellular space around the overexpressing cell (Fig. 4A). For comparison, remote cells were defined as noninfected cells far (15–20 cell dimensions) from the adenovirus-infected area and in the same field as infected cells. Conventional 2D cross-sectional analysis blinded to treatment group (Fig. 4B) showed that Ad-GFP-infected cells (n = 102) resulted in no cellular hypertrophy compared with noninfected, adjacent (n = 92), or remote (n = 97) cells (2D myocyte cross-sectional area, 250 ± 7 versus 251 ± 7 or 255 ± 6 µm2, respectively). These data suggest that expression of GFP in these conditions does not cause cellular hypertrophy. However, overexpression of HB-EGF caused hypertrophy in both Ad-HB-EGF-infected cells (a 41 ± 5% increase of Ad-GFP-infected cells, n = 119, P < 0.01) and noninfected adjacent cells (a 33 ± 5% increase of Ad-GFP-adjacent cells, n = 97, P < 0.01) compared with remote cells (n = 109). Because 2D analysis of cardiomyocyte hypertrophy can be influenced by the plane of sectioning, we then developed a 3D histology approach that allowed reconstruction of cardiomyocytes in situ (Fig. 4C). We performed an independent 3D histology analysis of cardiomyocytes to determine cell volumes, blinded to treatment group (Fig. 4B). The volumes of both HB-EGF-infected cells (n = 19, 42,700 ± 4,000 µm3) and their adjacent cells (n = 11, 33,500 ± 3,300 µm3) were significantly greater than volumes of remote cells (n = 13, 18,600 ± 1,700 µm3, P < 0.01 vs. HB-EGF-infected cells and P < 0.05 vs. HB-EGF-adjacent cells, Fig. 4D). In contrast, cells treated with Ad-GFP (n = 12) showed no hypertrophy in the Ad-GFP-adjacent (n = 10) or remote cells (n = 9). These data demonstrate that HB-EGF acts as both an autocrine and local paracrine growth factor within myocardium, as predicted by computational modeling.

Degradation of Cx43 Through Local Autocrine/Paracrine HB-EGF

To determine whether the spatially confined effect of HB-EGF reduces local myocardial Cx43 in vivo, Cx43 was assessed with immunohistochemistry and confocal fluorescence imaging. Cells infected with Ad-HB-EGF had significant decreases in Cx43 immunoreactive signal compared with Ad-GFP cells, consistent with the results of in vitro immunoblotting (Fig. 5A). Quantitative digital image analyses of Cx43 in a total of 22 fields in 6 Ad-HB-EGF hearts and 19 fields in 4 Ad-GFP hearts were analyzed (Fig. 5B). Although Ad-GFP-infected cells showed immunoreactive Cx43 at the appositional membrane, overexpression of HB-EGF increased Cx43 in intracellular vesicle-like components (Fig. 5C), with reduced gap junction plaques (percent Cx43 area per cell area, 52 ± 8% of Ad-GFP control, P < 0.01). These data suggest that reduced expression of Cx43 can be attributed to an increased rate of internalization and degradation in gap junction plaques in cardiomyocytes. Interestingly, HB-EGF secretion by a given cardiomyocyte caused a 37 ± 13% reduction of Cx43 content in its adjacent cells compared with GFP controls (P < 0.05). As degradation of Cx43 may accompany structural changes with marked rearrangement of intercellular connections.  In contrast to Cx43, there was no significant difference in total area occupied by N-cadherin immunoreactive signal in between Ad-GFP (n = 19) and Ad-HB-EGF hearts (1.8 ± 0.5-fold compared with Ad-GFP, n = 17, P = not significant), indicating that HB-EGF has a selective effect on Cx43. Taken together, these data show that HB-EGF leads to cardiomyocyte hypertrophy and degradation of Cx43 in the infected cell and its immediately adjacent neighbors because of autocrine/ paracrine signaling. It should be noted, however, that quantifying the Cx43 from immunostaining could be limited by a nonlinear relation between the amount of Cx43 present and the area of staining.

Fig. 4. Effects of gene transfer of HB-EGF on cardiomyocyte hypertrophy in vivo.

(A) Adenoviral vectors (Ad-GFP or Ad-HB-EGF) were injected into the left ventricular free wall in mice. Myocytes were grouped as infected or noninfected on the basis of GFP fluorescence. Overex-pression of HB-EGF was confirmed by im-munohistochemistry. The presented image was pseudocolored with blue from that stained with Alexa Fluor 555 for the presence of HB-EGF. (Scale bars: 20 sm.) (B) 2D cross-sectional area of cardiomyo-cytes was measured in infected and non-infected cells in the same region of the same animal. Overexpression of HB-EGF caused cellular hypertrophy in both infected and adjacent cells. **, P < 0.01 vs. Ad-GFP infected; , P < 0.01 vs. Ad-HB-EGF remote; and §, P < 0.01 vs. Ad-GFP adjacent cells. GFP (infected 102 cells, adjacent 92 cells, and remote 97 cells from 5 mice), and HB-EGF (infected 119 cells, adjacent 97 cells, and remote 109 cells from 7 mice). The 3D histology also revealed cellular hypertrophy in both Ad-HB-EGF-infected cell and its adjacent cell. **, P < 0.01 vs. Ad-GFP infected; , P < 0.01; and *, P < 0.05 vs. Ad-HB-EGF remote cells. GFP (infected 12 cells, adjacent 10 cells, and remote 9 cells), and HB-EGF (infected 19 cells, adjacent 11 cells, and remote 13 cells). Statistical analysis was performed with one-way ANOVA. (C) Sample image of extracted myocytes in three dimensions.

Discussion

We have demonstrated in this study that HB-EGF secreted by cardiomyocytes leads to cellular growth and reduced expression of the principal ventricular gap junction protein Cx43 in a local autocrine/paracrine manner. Although proHB-EGF is biologically active as a juxtacrine growth factor that can signal to immediately neighboring cells in a nondiffusible mannerseveral studies have revealed the crucial role of metalloproteases in the enzymatic conversion of proHB-EGF to soluble HB-EGF, which binds to and activates the EGFR. Hypertrophic stimuli such as mechanical strain and G protein-coupled receptors agonists mediate cardiac hypertrophy through the shedding of membrane-bound proHB-EGF. Thus, an autocrine/paracrine loop, which requires the diffusible, soluble form of HB-EGF, is necessary for subsequent transactivation of the EGFR to produce the hypertrophic response.

To our knowledge, there have been no previous reports concerning the spatial extent of autocrine/paracrine ligand distribution and signaling in myocardial tissue. A theoretical analysis by Shvartsman et al. predicted, from computational modeling in an idealized cell culture environment, that autocrine ligands may remain highly localized, even within subcellular distances; this prediction has support from experimental data in the EGFR system. In contrast, a theoretical estimate by Francis and Palsson has suggested that cytokines might effectively communicate larger distances, approximated to be 200–300 m from the point of release. However, these studies have all focused on idealized cell culture systems, so our combined experimental and computational investigation here aimed at understanding both in vitro and in vivo situations offers insight.
Our computational model of diffusion in the extracellular space predicts that HB-EGF acts as both an autocrine and spatially restricted paracrine growth factor for neighboring cells. We studied the responses of the signaling cell and its immediate neighbors compared with more distant cells. For a paracrine signal to be delivered to its proper target, the secreted signaling molecules cannot diffuse too far; in vitro experiments, in fact, indicated that HB-EGF acts as a predominantly autocrine signal in cell culture, where diffusion into the medium is relatively unconstrained.
In contrast, in the extracellular space of the myocardium, HB-EGF is localized around the source of production because of tissue geometry, thereby acting in a local paracrine or autocrine manner only. Indeed, our results from in vivo gene transfer demonstrated that both the cell releasing soluble HB-EGF and its surrounding cells undergo hypertrophy. This localized conversation between neighboring cells may allow remodeling to be fine-tuned on a highly spatially restricted level within the myocardium and in other tissues.

Common genetic variation at the IL1RL1locus regulates IL-33/ST2 signaling

JE Ho, Wei-Yu Chen, Ming-Huei Chen, MG Larson, ElL McCabe, S Cheng, A Ghorbani, E Coglianese, V Emilsson, AD Johnson,….. CARDIoGRAM Consortium, CHARGE Inflammation Working Group, A Dehghan, C Lu, D Levy, C Newton-Cheh, CHARGE Heart Failure Working Group, …. JL Januzzi, RT Lee, and TJ Wang J Clin Invest Oct 2013; 123(10):4208-4218.  http://dx.doi.org/10.1172/JCI67119

Abstract and Introduction

The suppression of tumorigenicity 2/IL-33 (ST2/IL-33) pathway has been implicated in several immune and inflammatory diseases. ST2 is produced as 2 isoforms. The membrane-bound isoform (ST2L) induces an immune response when bound to its ligand, IL-33. The other isoform is a soluble protein (sST2) that is thought to be a decoy receptor for IL-33 signaling. Elevated sST2 levels in serum are associated with an increased risk for cardiovascular disease. We investigated the determinants of sST2 plasma concentrations in 2,991 Framing­ham Offspring Cohort participants. While clinical and environmental factors explained some variation in sST2 levels, much of the variation in sST2 production was driven by genetic factors. In a genome-wide associ­ation study (GWAS), multiple SNPs within IL1RL1 (the gene encoding ST2) demonstrated associations with sST2 concentrations. Five missense variants of IL1RL1 correlated with higher sST2 levels in the GWAS and mapped to the intracellular domain of ST2, which is absent in sST2. In a cell culture model, IL1RL1 missense variants increased sST2 expression by inducing IL-33 expression and enhancing IL-33 responsiveness (via ST2L). Our data suggest that genetic variation in IL1RL1 can result in increased levels of sST2 and alter immune and inflammatory signaling through the ST2/IL-33 pathway. Suppression of tumorigenicity 2 (ST2) is a member of the IL-1 receptor (IL-1R) family that plays a major role in immune and inflammatory responses. Alternative promoter activation and splicing produces both a membrane-bound protein (ST2L) and a soluble form (sST2). The transmembrane form of ST2 is selectively expressed on Th2- but not Th1-type T cells, and bind­ing of its ligand, IL-33, induces Th2 immune responses.  In contrast, the soluble form of ST2 acts as a decoy receptor by sequestering IL-33. The IL-33/ST2 pathway has important immunomodulatory effects. Clinically, the ST2/IL-33 signaling pathway participates in the pathophysiology of a number of inflammatory and immune diseases related to Th2 activation, including asthma, ulcera­tive colitis, and inflammatory arthritis. ST2 expression is also upregulated in cardiomyocytes in response to stress and appears to have cardioprotective effects in experimental studies. As a biomarker, circulating sST2 concentrations have been linked to worse prognosis in patients with heart failure, acute dyspnea, and acute coronary syndrome, and also predict mortality and incident cardiovascular events in individuals without existing cardiovascular disease. Both sST2 and its transmembrane form are encoded by IL-1R– like 1 (IL1RL1). Genetic variation in this pathway has been linked to a number of immune and inflammatory diseases. The contribution of IL1RL1 locus variants to interindividual variation in sST2 has not been investigated. The emergence of sST2 as an important predictor of cardiovascular risk and the important role outside of the ST2/IL-33 pathway in inflammatory diseases highlight the value of understanding genetic determinants of sST2. The fam­ily-based FHS cohort provides a unique opportunity to examine the heritability of sST2 and to identify specific variants involved using a genome-wide association study (GWAS). Thus, we per­formed a population-based study to examine genetic determinants of sST2 concentrations, coupled with experimental studies to elu­cidate the underlying molecular mechanisms.

Results

Clinical characteristics of the 2,991 FHS participants are presented in Supplemental Table 1 (supplemental material available online with this article; doi:10.1172/JCI67119DS1). The mean age of participants was 59 years, and 56% of participants were women. Soluble ST2 concentrations were higher in men compared with those in women (P < 0.001). Soluble ST2 concentrations were positively associated with age, systolic blood pressure, body-mass index, antihypertensive medication use, and diabetes mellitus (P < 0.05 for all). Together, these variables accounted for 14% of the variation in sST2 concentrations. The duration of hypertension or diabetes did not materially influence variation in sST2 concentra­tions. After additionally accounting for inflammatory conditions, clinical variables accounted for 14.8% of sST2 variation.

Heritability of sS72.

The age- and sex-adjusted heritability (h2) of sST2 was 0.45 (P = 5.3 x 10⁻¹⁶), suggesting that up to 45% of the vari­ation in sST2 not explained by clinical variables was attributable to genetic factors. Multivariable adjustment for clinical variables pre­viously shown to be associated with sST2 concentrations (21) did not attenuate the heritability estimate (adjusted h2 = 0.45, P = 8.2 x 10⁻¹⁶). To investigate the influence of shared environmental fac­tors, we examined the correlation of sST2 concentrations among 603 spousal pairs and found no significant correlation (r = 0.05, P = 0.25).

Genetic correlates of sS72.

We conducted a GWAS of circulating sST2 concentrations. Quantile-quantile, Manhattan, and regional linkage disequilibrium plots are shown in Supplemental Figures 1–3.  All genome-wide significant SNPs were located in a 400-kb linkage disequilibrium block that included IL1RL1 (the gene encoding ST2), IL1R1, IL1RL2, IL18R1, IL18RAP, and SLC9A4 (Figure 1). Results for 11 genome-wide significant “indepen­dent” SNPs, defined as pairwise r2 < 0.2, are shown in Table 1. In aggregate, these 11 “independent” genome-wide significant SNPs across the IL1RL1 locus accounted for 36% of heritability of sST2. In conditional analyses, 4 out of the 11 SNPs remained genome-wide significant, independent of each other (rs950880, rs13029918, rs1420103, and rs17639215), all within the IL1RL1 locus. The most significant SNP (rs950880, P = 7.1 x 10–94) accounted for 12% of the residual interindividual variability in circulating sST2 concentrations. Estimated mean sST2 concen­trations were 43% higher in major homozygotes (CC) compared with minor homozygotes (AA). Tree loci outside of the IL1RL1 locus had suggestive associations with sST2 (P < 1 x 10⁻⁶) and are displayed in Supplemental Table 3.

In silico association with expression SNPs.

The top 10 sST2 SNPs (among 11 listed in Table 1) were explored in collected gene expression databases. There were 5 genome-wide significant sST2 SNPs associated with gene expression across a variety of tissue types (Table 2). Specifically, rs13001325 was associated with IL1RL1 gene expression (the gene encoding both soluble and transmembrane ST2) in several subtypes of brain tissue (prefrontal cortex, P = 1.95 x 10⁻¹²; cerebellum, P = 1.54 x 10⁻⁵; visual cortex, P = 1.85 x 10⁻⁷). The CC genotype of rs13001325 was associated with a higher IL1RL1 gene expression level as well as a higher circulating sST2 concentration when compared with the TT genotype (Supplemental Figure 4). Other ST2 variants were significantly associated with IL18RAP (P = 8.50 x 10–41, blood) and IL18R1 gene expression (P = 2.99 x 10⁻¹², prefrontal cortex).

In silico association with clinical phenotypes in published data

The G allele of rs1558648 was associated with lower sST2 concentra­tions in the FHS (0.88-fold change per G allele, P = 3.94 x 10⁻¹⁶) and higher all-cause mortality (hazard ratio [HR] 1.10 per G allele, 95% CI 1.03–1.16, P = 0.003) in the CHARGE consortium, which observed 8,444 deaths in 25,007 participants during an average fol­low-up of 10.6 years (22). The T allele of rs13019803 was associated with lower sST2 concentrations in the FHS (0.87-fold change per G allele, P = 5.95 x 10⁻²⁰), higher mortality in the CHARGE consor­tium (HR 1.06 per C allele, 95% CI 1.01–1.12, P = 0.03), and higher risk of coronary artery disease (odds ratio 1.06, 95% CI 1.00–1.11, P = 0.035) in the CARDIoGRAM consortium, which included 22,233 individuals with coronary artery disease and 64,762 controls (23). In relating sST2 SNPs to other clinical phenotypes (including blood pressure, body-mass index, lipids, fasting glucose, natriuretic peptides, C-reactive protein, and echocardiographic traits) in pre­viously published studies, we found nominal associations with C-reactive protein for 2 SNPs (Supplemental Table 4).

Putative functional variants.

Using GeneCruiser, we examined nonsynonymous SNPs (nSNPs) (missense variants) that had at least suggestive association with sST2 (P < 1 x 10⁻⁴), includ­ing SNPs that served as proxies (r2 = 1.0) for nSNPs within the 1000 Genomes Pilot 1 data set (ref. 24 and Table 3). There were 6 missense variants located within the IL1RL1 gene, 5 of which had genome-wide significant associations with sST2 concen­trations, including rs6749114 (proxy for rs10192036, Q501K), rs4988956 (A433T), rs10204137 (Q501R), rs10192157 (T549I), rs10206753 (L551S), and rs1041973 (A78AE). Base substitutions and corresponding amino acid changes for these coding muta­tions are listed in Table 3. In combination, these 6 missense muta­tions accounted for 5% of estimated heritability, with an effect estimate of 0.23 (standard error [s.e.] 0.02, P = 2.4 x 10⁻²⁰). When comparing major homozygotes with minor homozygotes, the esti­mated sST2 concentrations for these missense variants differed by 11% to 15% according to genotype (Supplemental Table 5). In conditional analyses, intracellular and extracellular variants appeared to be independently associated with sST2. For instance, in a model containing rs4988956 (A433T) and rs1041973 (A78E), both SNPs remained significantly associated with sST2 (P = 2.61 x 10⁻²⁴ and P = 7.67 x 10⁻¹⁵, respectively). In total, missence variants added little to the proportion of sST2 variance explained by the 11 genome-wide significant nonmissense variants listed in Table 1. In relating these 6 missense variants to other clinical phenotypes in large consortia, we found an association with asthma for 4 out of the 6 variants (lowest P = 4.8 x 10⁻¹² for rs10204137) (25).

Homology map of IL1RL1 missense variants and ST2 structure.

Of the 6 missense variants mapping to IL1RL1, 5 were within the cytoplas­mic Toll/IL-1R (TIR) domain of the transmembrane ST2 receptor (Figure 2A), and these intracellular variants are thus not part of the circulating sST2 protein. Of these cytoplasmic domain variants, A433T was located within the “box 2” region of sequence conserva­tion, described in the IL-1R1 TIR domain as important for IL-1 sig­naling . Q501R/K was within a conserved motif called “box 3,” but mutants of IL-1R1 in box 3 did not significantly affect IL-1 signaling in previous experiments (26). Both T549I and L551S were near the C terminus of the transmembrane ST2 receptor and were not predicted to alter signaling function based on previous exper­iments with the IL-1R . The A78E SNP was located within the extracellular domain of ST2 and is thus present in both the sST2 isoform and the transmembrane ST2 receptor. In models of the ST2/IL-33/IL-1RAcP complex derived from a crystal structure of the IL-1RII/IL-1β/IL-1RAcP complex (protein data bank ID 1T3G and 3O4O), A78E was predicted to be located on a surface loop within the first immunoglobulin-like domain (Figure 2B), distant from the putative IL-33 binding site or the site of interaction with IL-1RAcP. There were 2 rare extracellular variants that were not cap­tured in our GWAS due to low minor allele frequencies (A80E, MAF 0.008; A176T, MAF 0.002). Both were distant from the IL-33 bind­ing site on homology mapping and unlikely to affect IL-33 binding.

Functional effects of IL1RL1 missense variants on sST2 expression and promoter activity.

Since 5 of the IL1RL1 missense variants asso­ciated with sST2 levels mapped to the intracellular domain of ST2L and hence are not present on sST2 itself, we hypothesized that these missense variants exert effects via intracellular mecha­nisms downstream of ST2 transmembrane receptor signaling to regulate sST2 levels. To investigate the effect of IL1RL1 missense variants (identified by GWAS) on sST2 expression, stable cell lines expressing WT ST2L, IL1RL1 variants (A78E, A433T, T549I, Q501K, Q501R, and L551S), and a construct containing the 5 IL1RL1 intracellular domain variants (5-mut) were generated. Expression of ST2L mRNA and protein (detected in membrane fractions) was confirmed (Supplemental Figures 5 and 6). Eight different stable clones in each group were analyzed to reduce bias from clonal selection. Intracellular domain variants (A433T, T549I, Q501K, Q501R, L551S, and 5-mut), but not the extracellular domain variant (A78E), were associated with increased basal sST2 expression when compared with WT expression (P < 0.05 for all, Figure 3A). sST2 expression was highest in the 5-mut construct, suggesting that intracellular ST2L variants cooperatively regulate sST2 levels. This same pattern was consistent across different cell types (U937, Jurkat T, and A549 cells; Supplemental Figure 7). These findings suggest that intracellular domain variants of the transmembrane ST2 receptor may functionally regulate downstream signaling.   IL1RL1 transcription may occur via two alternative promoters (proximal vs. distal), which leads to differential expression of the soluble versus membrane-bound ST2 proteins. Similar to the sST2 protein expression results above, the intracellular domain variants, but not the extracellular domain variant, were associated with higher basal proximal promoter activity. Dis­tal promoter activity was also increased for most intracellular domain variants (Supplemental Figure 8).

IL1RL1 intracellular missense variants resulted in higher IL-33 pro­tein levels.

In addition to upregulation of sST2 protein levels, IL1RL1 intracellular missense variants caused increased basal IL-33 protein expression (Figure 3B), suggesting a possible autoregulatory loop whereby IL-33 signaling positively induces sST2 expression. IL-33 induced sST2 protein expression in cells expressing both WT and IL1RL1 missense variants. Interest­ingly, this effect was particularly pronounced in the A433T and Q501R variants (Supplemental Figure 9A).

Enhanced IL-33 responsiveness is mediated by IL-113 in A433T and Q501R variants.

Interaction among IL-33, sST2, and IL-113.

Inhibition of IL-113 by anti–IL-113 mAb reduced basal expression of sST2 (Supplemental Figure 11A). Blocking of IL-33 by sST2 did not reduce the induction of IL-113 levels by the IL1RL1 variants (Supplemental Figure 11B). Furthermore, inhibition of IL-113 by anti–IL-113 reduced the basal IL-33 levels. IL-33 itself upregulated sST2 levels, which in turn reduced IL-33 levels (Supplemental Figure 11C). Our results revealed that both IL-33 and IL-113 drive sST2 expression and that IL-113 acts as an upstream inducer of IL-33 and maintains IL-33 expression by intracellular IL1RL1 vari­ants (Supplemental Figure 11D). This suggests that IL1RL1 vari­ants upregulated sST2 mainly through IL-33 autoregulation and that the enhanced IL-33 responsiveness by A433T and Q501R was mediated by IL-113 upregulation.

IL1RL1 missense variants modulate ST2 signaling pathways

The effect of IL1RL1 missense variants on known ST2 downstream regulatory pathways, including NF-KB, AP-1/c-Jun, AKT, and STAT3 , was examined in the presence and absence of IL-33 (Figure 4 and Supplemental Figure 12). The IL1RL1 intracellular missense vari­ants (A433T, T549I, Q501K, Q501R, and L551S) were associated with higher basal phospho–NF-KB p65 and phospho–c-Jun levels (Figure 4, A and B). Consistent with enhanced IL-33 responsive­ness in A433T and Q501R cells, levels of IL-33–induced NF-KB and c-Jun phosphorylation were enhanced in these 2 variants (Figure 4, B and D). In contrast, A433T and Q501R variants showed lower basal phospho-AKT levels (Figure 4E). ……….. The majority of sST2 gene variants in our study were located within or near IL1RL1, the gene coding for both transmembrane ST2 and sST2. IL1RL1 resides within a linkage disequilibrium block of 400 kb on chromosome 2q12, a region that includes a number of other cytokines, including IL-18 receptor 1 (IL18R1) and IL-18 receptor accessory protein (IL18RAP). Polymorphisms in this gene cluster have been associated previously with a num­ber of immune and inflammatory conditions, including asthma, celiac disease, and type 1 diabetes mellitus . Many of these variants were associated with sST2 concentrations in our analysis (Supplemental Table 6). The immune effects of ST2 are corroborated by experimental evidence: membrane-bound ST2 is selectively expressed on Th2- but not Th1-type T helper cells, and activation of the ST2/IL-33 axis elaborates Th2 responses. In general, the allergic phenotypes above are thought to be Th2-mediated processes, in contrast to atherosclerosis, which appears to be a Th1-driven process.

Fig 2  Models of ST2 illustrate IL1RL1 missense variant locations.

Figure 2 Models of ST2 illustrate IL1RL1 missense variant locations.

Models of the (A) intracellular TIR domain (ST2-TIR) and the (B) extracellular domain (ST2-ECD) of ST2 (protein data bank codes 3O4O and 1T3G, respectively). Domains of ST2 are shown in yellow, with identified mis-sense SNP positions represented as red spheres and labels. Note that positions 549 and 551 are near the C terminus of ST2, which is not defined in the crystal structure (protein data bank ID 1T3G, shown as dashed black line in A). Arrows point toward the transmembrane domain, which is also not observed in crystal structures.

Fig 3 IL1RL1 intracellular missense variants resulted in higher sST2 and IL-33.

Figure 3   IL1RL1 intracellular missense variants resulted in higher sST2 and IL-33.

Media from KU812 cells expressing WT and IL1RL1 missense variants were collected for ELISA analysis of (A) sST2, (B) IL-33, and (C) IL-113 levels. Horizontal bars indicate mean values, and symbols represent indi­vidual variants. *P < 0.05, **P < 0.01 vs. WT. (D) Effect of anti–IL-113 mAb on IL-33–induced sST2 expression. Dashed line indicates PBS-treated cells as referent group. Error bars represent mean ± SEM from 2 independent experiments. *P < 0.05 vs. IL-33.

Fig 4  IL1RL1 missense variants modulated ST2 signaling pathways

Figure 4  IL1RL1 missense variants modulated ST2 signaling pathways. 

KU812 cells expressing WT or IL1RL1 variants were treated with PBS or IL-33. Levels of the following phosphorylated proteins were detected in cell lysates using ELISA: (A and B) phospho-NF-KB p65; (C and D) phospho-c-Jun activity; and (E and F) phospho-AKT. (A, C, and E) White bars represent basal levels, and (B, D, and F) gray bars represent relative fold increase (compared with PBS-treated group) after IL-33 treatment. *P < 0.05 vs. WT; **P < 0.01 vs. PBS-treated group. Dashed line in B, D, and F represents PBS-treated cells as referent group. Error bars represent mean ± SEM from 2 independent experiments. Fig 5   IL-33–induced sST2 expression is enhanced with mTOR inhibition and occurs via ST2L-dependent signaling.

Figure 5  IL-33–induced sST2 expression is enhanced with mTOR inhibition and occurs via ST2L-dependent signaling.

(A) sST2 mRNA expression in KU812 cells after treatment with DMSO, IL-33, or IL-33 plus signal inhibitors (wortmannin, LY294002, rapamycin, PD98059, SP60125, BAY11-7082, or SR11302). (B) ST2L mRNA and (C) sST2 mRNA expression in KU812 cells treated with PBS (white columns), rapamycin (rapa), anti-ST2 mAb, IL-33, IL-33 plus anti-ST2, IL-33 plus rapamycin, IL-33 plus rapamycin plus anti-ST2 mAb, or rapamycin plus anti-ST2. (D) IL33 mRNA expression in KU812 cells after treatment with DMSO, signal inhibitors, IL-33 plus signal inhibitors, and IL-1n plus signal inhibitors. *P < 0.05 vs. PBS-treated group; #P < 0.05 vs. IL-33–treated group; &P < 0.05 vs. IL-1n–treated group. Error bars represent mean ± SEM from 2 independent experiments. (E) A schematic model illustrating the regulation of sST2 expression by IL1RL1 missense variants through enhanced induction of IL-33 via enhanced NF-KB and AP-1 signaling and enhanced IL-33 responsiveness via increasing ST2L expression.

Quantitating subcellular metabolism with multi-isotope imaging mass spectrometry

ML Steinhauser, A Bailey, SE Senyo, C Guillermier, TS Perlstein, AP Gould, RT Lee, and CP Lechene
Department of Medicine, Divisions of Cardiovascular Medicine & Genetics, Brigham and Women’s Hospital, Harvard Medical School & Harvard Stem Cell Institute Division of Physiology and Metabolism, Medical Research Council National Institute for Medical Research, Mill Hill, London, UK National Resource for Imaging Mass Spectroscopy
Nature 2012;481(7382): 516–519.   http://dx. do.org/10.1038/nature10734

Mass spectrometry with stable isotope labels has been seminal in discovering the dynamic state of living matter, but is limited to bulk tissues or cells. We developed multi-isotope imaging mass spectrometry (MIMS) that allowed us to view and measure stable isotope incorporation with sub-micron resolution. Here we apply MIMS to diverse organisms, including Drosophila, mice, and humans. We test the “immortal strand hypothesis,” which predicts that during asymmetric stem cell division chromosomes containing older template DNA are segregated to the daughter destined to remain a stem cell, thus insuring lifetime genetic stability. After labeling mice with 15N-thymidine from gestation through post-natal week 8, we find no 15N label retention by dividing small intestinal crypt cells after 4wk chase. In adult mice administered 15N-thymidine pulse-chase, we find that proliferating crypt cells dilute label consistent with random strand segregation. We demonstrate the broad utility of MIMS with proof-of-principle studies of lipid turnover in Drosophila and translation to the human hematopoietic system. These studies show that MIMS provides high-resolution quantitation of stable isotope labels that cannot be obtained using other techniques and that is broadly applicable to biological and medical research. MIMS combines ion microscopy with secondary ion mass spectrometry (SIMS), stable isotope reporters, and intensive computation (Supplemental Fig 1). MIMS allows imaging and measuring stable isotope labels in cell domains smaller than one micron cubed. We tested the potential of MIMS to quantitatively track DNA labeling with 15N-thymidine in vitro. In proliferating fibroblasts, we detected label incorporation within the nucleus by an increase in the 15N/14N ratio above natural ratio (Fig 1a). The labeling pattern resembled chromatin with either stable isotope-tagged thymidine or thymidine analogs (Fig 1b). We measured dose-dependent incorporation of 15N-thymidine over three orders of magnitude (Fig 1d, Supplemental Fig 2). We also tracked fibroblast division after a 24-hour label-free chase (Fig 1d,e, Supplemental Fig 3). Cells segregated into two populations, one indistinguishable from control cells suggesting no division, the other with halving of label, consistent with one division during chase. We found similar results by tracking cell division in vivo in the small intestine (Fig 1f,g, Supplemental Figs 4–6). We measured dose-dependent 15N-thymidine incorporation within nuclei of actively dividing crypt cells (Fig 1g, Supplemental Fig 4), down to a dose of 0.1µg/ g (Supplemental Fig 2). The cytoplasm was slightly above natural ratio, likely due to low level soluble 15N-thymidine or mitochondrial incorporation (Supplemental Fig 2). We measured halving of label with each division during label-free chase (Supplemental Fig 6). We then tested the “immortal strand hypothesis,” a concept that emerged from autoradiographic studies and that predicted long-term label retaining cells in the small intestinal crypt. It proposes that asymmetrically dividing stem cells also asymmetrically segregate DNA, such that older template strands are retained by daughter cells that will remain stem cells and newer strands are passed to daughters committed to differentiation (Supplemental Fig 7)5,6. Modern studies continue to argue both for or against the hypothesis, leading to the suggestion that definitive resolution of the debate will require a new experimental approach. Although prior evidence suggests a concentration of label-retaining cells in the +4 anatomic position, we searched for DNA label retention irrespective of anatomic position or molecular identity. We labeled mice with 15N-thymidine for the first 8 wks of life when intestinal stem cells are proposed to form. After a 4-wk chase, mice received bromodeoxyuridine (BrdU) for 24h prior to sacrifice to identify proliferating cells(Fig 2a, Supplemental Fig 8: Exp 1), specifically crypt base columnar (CBC) cells and transit amplifying cells (TA) (Supplemental Fig 9), which cycle at a rate of one and two times per 24h, respectively (Supplemental Fig 10). All crypt cell nuclei were highly labeled upon completion of 15N-thymidine; after a four-week chase, however, we found no label retention by non-Paneth crypt cells (Fig 2b–f; n=3 mice, 136 crypts analysed). 15N-labeling in BrdU/15N+ Paneth and mesenchymal cells was equivalent to that measured at pulse completion (Fig2b,c) suggesting quiescence during the chase (values above 15N/14N natural ratio: Paneth pulse=107.8 +/− 5.0% s.e.m. n=51 vs Paneth pulse-chase=96.3+/−2.8% s.e.m. n=218; mesenchymal pulse=92.0+/−5.0% s.e.m. n=89 vs mesenchymal pulse-chase=90.5+/ −2.2% s.e.m. n=543). The number of randomly selected crypt sections was sufficient to detect a frequency as low as one label-retaining stem cell per crypt irrespective of anatomic location within the crypt. Because each anatomic level contains approximately 16 circumferentially arrayed cells, a 2-dimensional analysis captures approximately 1/8th of the cells at each anatomic position (one on each side of the crypt; Supplemental Fig 9a). Therefore, assuming only 1 label-retaining stem cell per crypt we should have found 17 label-retaining cells in the 136 sampled crypts (1/8th of 136); we found 0 (binomial test p<0.0001). The significance of this result held after lowering the expected frequency of label-retaining cells by 25% to account for the development of new crypts, a process thought to continue into adulthood. In three additional experiments, using shorter labeling periods and including in utero development, we also found no label-retaining cells in the crypt other than Paneth cells (Supplemental Fig 8, Exps 2–4).
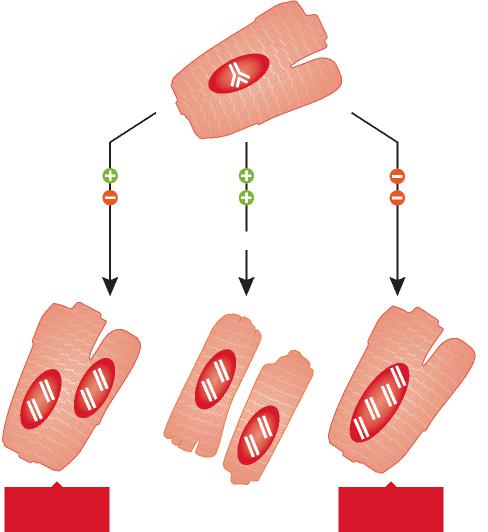
Fig 1 post-natal human DNA synthesis in the heart

In recent years, several protocols have been developed experimentally in an attempt to identify novel therapeutic interventions aiming at the reduction of infarct size and prevention of short and long term negative ventricular remodeling following ischemic myocardial injury. Three main strategies have been employed and a significant amount of work is being conducted to determine the most effective form of action for acute ischemic heart failure. The delivery of bone marrow progenitor cells (BMCs) has been highly controversial, but recent clinical data have shown improvement in ventricular performance and clinical outcome. These observations have not changed the nature of the debate concerning the efficacy of this cell category for the human disease and the mechanisms involved in the impact of BMCs on cardiac structure and function. Whether BMCs transdifferentiate and acquire the cardiomyocyte lineage has faced strong opposition and data in favor and against this possibility have been reported. However, this is the only cell class which has been introduced in the treatment of heart failure in patients and large clinical trials are in progress.
Human embryonic stem cells (ESCs) have repeatedly been utilized in animal models to restore the acutely infarcted myocardium, but limited cell engraftment, modest ability to generate vascular structures, teratoma formation and the apparent transient beneficial effects on cardiac hemodynamics have questioned the current feasibility of this approach clinically. Tremendous efforts are being performed to reduce the malignant tumorigenic potential of ESCs and promote their differentiation into cardiomyocytes with the expectation that these extremely powerful cells may be applied to human beings in the future. Additionally, the study of ESCs may provide unique understanding of the mechanisms of embryonic development that may lead to therapeutic interventions in utero and the correction of congenital malformations.
The recognition that a pool of primitive cells with the characteristics of stem cells resides in the myocardium and that these cells form myocytes, ECs and SMCs has provided a different perspective of the biology of the heart and mechanisms of cardiac homeostasis and tissue repair. Regeneration implies that dead cells are replaced by newly formed cells restoring the original structure of the organ. In adulthood, this process occurs during physiological cell turnover, in the absence of injury. However, myocardial damage interferes with recapitulation of cell turnover and restitutio ad integrum of the organ. Because of the inability of the adult heart to regenerate itself after infarction, previous studies have promoted tissue repair by injecting exogenously expanded CPCs in proximity of the necrotic myocardium or by activating resident CPCs through the delivery of growth factors known to induce cell migration and differentiation. These strategies have attenuated ventricular dilation and the impairment in cardiac function and in some cases have decreased animal mortality.

Although various subsets of CPCs have been used to reconstitute the infarcted myocardium and different degrees of muscle mass regeneration have been obtained, in all cases the newly formed cardiomyocytes possessed fetal-neonatal characteristics and failed to acquire the adult cell phenotype. In the current study, to enhance myocyte growth and differentiation, we have introduced cell therapy together with the delivery of self-assembly peptide nanofibers to provide a specific and prolonged local myocardial release of IGF-1. IGF-1 increases CPC growth and survival in vitro and in vivo and this effect resulted here in a major increase in the formation of cardiomyocytes and coronary vessels, decreasing infarct size and restoring partly cardiac performance. This therapeutic approach was superior to the administration of CPCs or NF-IGF-1 only. Combination therapy appeared to be additive; it promoted myocardial regeneration through the activation and differentiation of resident and exogenously delivered CPCs. Additionally, the strategy implemented here may be superior to the utilization of BMCs for cardiac repair. CPCs are destined to form myocytes, and vascular SMCs and ECs and, in contrast to BMCs, do not have to transdifferentiate to acquire cardiac cell lineages. Transdifferentiation involves chromatin reorganization with activation and silencing of transcription factors and epigenetic modifications.

Selected References

  1. Hsieh PC, Davis ME, Gannon J, MacGillivray C, Lee RT. Controlled delivery of PDGF-BB for myocardial protection using injectable self-assembling peptide nanofibers. J Clin Invest 2006;116:237–248. [PubMed: 16357943]
  2. Davis ME, Hsieh PC, Takahashi T, Song Q, Zhang S, Kamm RD, Grodzinsky AJ, Anversa P, Lee RT. Local myocardial insulin-like growth factor 1 (IGF-1) delivery with biotinylated peptide nanofibers improves cell therapy for myocardial infarction. Proc Natl Acad Sci USA 2006;103:8155–8160. [PubMed: 16698918]
  3. Beltrami AP, Barlucchi L, Torella D, Baker M, Limana F, Chimenti S, Kasahara H, Rota M, Musso E, Urbanek K, Leri A, Kajstura J, Nadal-Ginard B, Anversa P. Adult cardiac stem cells are multipotent and support myocardial regeneration. Cell 2003;114:763–776. [PubMed: 14505575]
  4. Rota M, Padin-Iruegas ME, Misao Y, De Angelis A, Maestroni S, Ferreira-Martins J, Fiumana E, Rastaldo R, Arcarese ML, Mitchell TS, Boni A, Bolli R, Urbanek K, Hosoda T, Anversa P, Leri A, Kajstura J. Local activation or implantation of cardiac progenitor cells rescues scarred infarcted myocardium improving cardiac function. Circ Res 2008;103:107–116. [PubMed: 18556576]

Cardiac anatomy.

Figure 2.  Cardiac anatomy.

(A and B) Cardiac weights and infarct size. R and L correspond, respectively, to the number of myocytes remaining and lost after infarction. (C–G) LV dimensions. Sham-operated: SO. *Indicates P<0.05 vs SO; **vs untreated infarcts (UN); †vs infarcts treated with CPCs; ‡vs infarcts treated with NF-IGF-1.

Ventricular function

Figure 3.  Ventricular function.

Combination therapy (CPC-NF-IGF-1) attenuated the most the negative impact of myocardial infarction on cardiac performance. See Figure 2 for symbols.

Endothelial Cells Promote Cardiac Myocyte Survival and Spatial Reorganization: Implications for Cardiac Regeneration

Daria A. Narmoneva, Rada Vukmirovic, Michael E. Davis, Roger D. Kamm,  and Richard T. Lee
Cardiovascular Division, Department of Medicine, Brigham and Women’s Hospital, Harvard Medical School, Boston, and the Division of Biological Engineering, Massachusetts Institute of Technology, Cambridge, MA
Circulation. 2004 August 24; 110(8): 962–968.        http://dx.doi.org/10.1161/01.CIR.0000140667.37070.07

Background

Endothelial-cardiac myocyte (CM) interactions play a key role in regulating cardiac function, but the role of these interactions in CM survival is unknown. This study tested the hypothesis that endothelial cells (ECs) promote CM survival and enhance spatial organization in a 3-dimensional configuration.

Methods and Results

Microvascular ECs and neonatal CMs were seeded on peptide hydrogels in 1 of 3 experimental configurations:

  1. CMs alone,
  2. CMs mixed with ECs (coculture), or
  3. CMs seeded on preformed EC networks (prevascularized).

Capillary-like networks formed by ECs promoted marked CM reorganization along the EC structures, in contrast to limited organization of CMs cultured alone. The presence of ECs markedly inhibited CM apoptosis and necrosis at all time points. In addition, CMs on preformed EC networks resulted in significantly less CM apoptosis and necrosis compared with simultaneous EC-CM seeding (P<0.01, ANOVA). Furthermore, ECs promoted synchronized contraction of CMs as well as connexin 43 expression.

Conclusions

These results provide direct evidence for a novel role of endothelium in survival and organization of nearby CMs. Successful strategies for cardiac regeneration may therefore depend on establishing functional CM-endothelium interactions.

Keywords:  endothelium; cardiomyopathy; heart failure; tissue

Introduction

Recent studies suggest that the mammalian heart possesses some ability to regenerate itself through several potential mechanisms, including generation of new cardiomyocytes (CMs) from extracardiac progenitors, CM proliferation, or fusion with stem cells with subsequent hybrid cell division. These mechanisms are insufficient to regenerate adequate heart tissue in humans, although some vertebrates can regenerate large volumes of injured myocardium.
Several approaches in cell transplantation and cardiac tissue engineering have been investigated as potential treatments to enhance cardiac function after myocardial injury. Implantation of skeletal muscle cells, bone marrow cells, embryonic stem cell-derived CMs, and myoblasts can enhance cardiac function. Cell-seeded grafts have been used instead of isolated cells for in vitro cardiac tissue growth or in vivo transplantation. These grafts can develop a high degree of myocyte spatial organization, differentiation, and spontaneous and coordinated contractions. On implantation in vivo, cardiac grafts can integrate into the host tissue and neovascularization can develop. However, the presence of scar tissue and the death of cells in the graft can limit the amount of new myocardium formed, most likely due to ischemia. Therefore, creating a favorable environment to promote survival of transplanted cells and differentiation of progenitor cells remains one of the most important steps in regeneration of heart tissue.
One of the key factors for myocardial regeneration is revascularization of damaged tissue. In the normal heart, there is a capillary next to almost every CM, and endothelial cells (ECs) outnumber cardiomyocytes by ≈3:1. Developmental biology experiments reveal that myocardial cell maturation and function depend on the presence of endocardial endothelium at an early stage. Experiments with inactivation or overexpression of vascular endothelial growth factor (VEGF) demonstrated that at later stages, either an excess or a deficit in blood vessel formation results in lethality due to cardiac dysfunction. Both endocardium and myocardial capillaries have been shown to modulate cardiac performance, rhythmicity, and growth. In addition, a recent study showed the critical importance of CM-derived VEGF in paracrine regulation of cardiac morphogenesis. These findings and others highlight the significance of interactions between CMs and endothelium for normal cardiac function. However, little is known about the specific mechanisms for these interactions, as well as the role of a complex, 3-dimensional organization of myocytes, ECs, and fibroblasts in the maintenance of healthy cardiac muscle.
The critical relation of CMs and the microvasculature suggests that successful cardiac regeneration will require a strategy that promotes survival of both ECs and CMs. The present study explored the hypothesis that ECs (both as preexisting capillary-like structures and mixed with myocytes at the time of seeding) promote myocyte survival and enhance spatial reorganization in a 3-dimensional configuration. The results demonstrate that CM interactions with ECs markedly decrease myocyte death and show that endothelium may be important not only for the delivery of blood and oxygen but also for the formation and maintenance of myocardial structure.

Methods

  • Three-Dimensional Culture
  • Immunohistochemistry and Cell Death Assays
  • Evaluation of Contractile Areas

Results

  • EC-CM Interactions Affect Myocyte Reorganization
  • ECs Improve Survival of CMs
  • Preformed Endothelial Networks Promote Coordinated, Spontaneous Contractions
  • ECs Promote Cx43 Expression

EC-CM Interactions Affect Myocyte Reorganization

To explore interactions between CMs and ECs in 3-dimensional culture, we used peptide hydrogels, a tissue engineering scaffold. Cells seeded on the surface of the hydrogel attach and then migrate into the hydrogel. When CMs alone were used, cells attached on day 1 and then formed small clusters of cells at days 3 and 7 (Figure 1). In contrast, when CMs were seeded together with ECs, cells formed interconnected linear networks, as commonly seen with ECs in 3-dimensional culture environments, with increasing spatial organization from day 1 to day 7 (Figure 1).

Figure 1.  ECs promote CM reorganization. 

When CMs were cultured alone (left column), they aggregated into sparse clusters. When CMs were cultured with ECs (center), cells organized into capillary-like networks. There was no difference in morphological appearance between coculture or prevascularized cultures (not shown) and ECs alone (right column). Bar=100 μm. Abbreviations are as defined in text.

To establish whether preformed endothelial networks enhanced the organization of myocytes, we also seeded ECs 1 day before myocytes were added. These ECs formed similar interconnected networks in the absence of myocytes; preforming the vascular network did not lead to significant differences in morphology (data not shown). Furthermore, to exclude the possibility that the increasing cell density of added ECs caused the spatial organization, we also performed control experiments with varying numbers and combinations of cells; there was no effect of doubling or halving cell numbers, indicating that the spatial organization effect was specifically due to ECs. To establish that both myocytes and ECs were forming networks together, we performed immunofluorescence studies with specific antibodies, as well as analysis of cross sections of CM-EC cocultures, whereby cells were labeled with CellTracker dyes before seeding. Immunofluorescent staining demonstrated that >95% of CMs were present within these networks, suggesting that CMs preferentially migrate to or survive better near ECs (Figure 2).

Figure 2.  CMs appear on outside of endothelial networks.

CMs appear on outside of endothelial networks. High-magnification, double-immunofluorescence image of structures formed in EC-CM coculture at day 7 demonstrating CMs (sarcomeric actinin, red) spread on top of ECs (von Willebrand factor, green) with no myocytes present outside structure. Bar=100 μm. Abbreviations are as defined in text.

The analysis of cross sections demonstrated the presence of what appeared to be EC-derived, tubelike structures (Figure 3), with myocytes spread on the outer part of the capillary wall. Along with the capillary-like structures, clusters of intermingled cells (both myocytes and ECs) not containing the lumen were also observed (not shown). However, when the lumen was present, ECs were always on the inner side and myocytes on the outer side of the structure.

Figure 3.  ECs form tubelike structures with myocytes spreading on outer wall.

Cross section of paraffin-embedded sample of 3-day coculture of myocytes (red) and ECs (green) incubated in CellTracker dye before seeding on hydrogel. Bar=50 μm. Abbreviations are as defined in text.

In CM-fibroblast cocultures, cells rapidly (within 24 hours) formed large clusters consisting of cells of both types (not shown). At later time points, fibroblast proliferation resulted in their migration outside the clusters and spreading on the hydrogel without any pattern. However, in contrast to EC-CM cocultures, CMs remained in the clusters and demonstrated only limited spreading. Immunofluorescent staining revealed that there was no orientation of myocytes relative to the fibroblasts in the clusters. In cultures with EC-conditioned medium, myocyte morphology and spatial organization remained similar to those of myocyte controls.

ECs Improve Survival of CMs

To test the hypothesis that ECs promote CM survival, we assessed apoptosis and necrosis in the 3-dimensional cultures. Quantitative analyses of CMs positive for TUNEL and necrosis staining demonstrated significantly decreased myocyte apoptosis and necrosis when cultured with ECs, compared with CM-only cultures (Figure 4, P<0.01). This effect was observed at all 3 time points, although the decreased necrosis was most pronounced at day 1. In addition, CMs seeded on the preformed EC networks had a lower rate of apoptosis at day 1 relative to same-time seeding cultures (P<0.05, post hoc test), suggesting that early EC-CM interactions provided by the presence of well-attached and prearranged ECs may further promote CM survival. In contrast to the ECs, cardiac fibroblasts did not affect myocyte survival (P>0.05, Figure 4), with ratios for myocyte apoptosis and necrosis in the myocyte-fibroblast cocultures being similar to those for myocyte-only controls. However, addition of EC-conditioned medium resulted in a significant decrease in apoptosis and necrosis ratios of myocytes (P<0.01). Interestingly, the effect of conditioned medium on myocyte necrosis was similar in magnitude to the effect of ECs, whereas myocyte apoptosis ratios in the conditioned-medium group were only partially decreased compared with those in the presence of ECs. These results suggest that the prosurvival effect of ECs on CMs may not only be merely due to the local interactions between myocytes and ECs during myocyte attachment but may also involve direct signaling between myocytes and ECs.

Figure 4.  ECs prolong survival of CMs

Top, dual immunostaining of CMs and EC-myocyte prevascularized groups at day 3 in culture, with TUNEL-positive cells in red; green indicates sarcomeric actinin; blue, DAPI. Bottom, presence of ECs decreased CM apoptosis and necrosis, both in coculture conditions and when cultures were prevascularized by seeding with ECs 1 day before CMs (mean±SD, P<0.01). EC-conditioned medium decreased myocyte apoptosis and necrosis (P<0.01), whereas fibroblasts did not have any effect (P>0.05). *Different from myocytes alone; **different from EC-myocyte coculture and pre-vascularized. Bar=100 μm. Abbreviations are as defined in text.

Preformed Endothelial Networks Promote Coordinated, Spontaneous Contractions

In the prevascularized group with preformed vascular structures, synchronized, spontaneous contractions of large areas (Figure 5, top panels) were detected as early as days 2 to 3after seeding, in contrast to the coculture group, wherein such contractions were observed on days 6 to 7. In CM-only cultures, beating of separate cells and small cell clusters was also detected at days 2 to 3, similar to that in the prevascularized group. However, the average area of synchronized beating at day 3 in the myocyte-only group (3.5±0.5×102 μm2) was nearly 3 orders of magnitude smaller than the synchronously contracting area in the prevascularized group (4.3±2.5×105 μm2, mean±SD, n=5). These data suggest that ECs promote synchronized CM contraction, particularly when vascular networks are already formed.

Figure 5.  ECs promote large-scale, synchronized contraction of CMs.

Left, phase-contrast video of beating areas in CM-only and prevascularized groups (day 3). Right, motion analysis of video showing regions of synchronized contractions (connected areas in purple are contracting synchronously) and nonmoving areas in blue. Bars=100 μm. Abbreviations are as defined in text.

ECs Promote Cx43 Expression

Staining for Cx43 showed striking differences in the distribution pattern of this gap junction protein between EC-CM cocultures and CMs cultured alone. In myocyte-only cultures, Cx43 expression was barely detectable at day 1 (not shown); at days 3 and 7, Cx43 expression was sparse throughout the cell clusters (Figure 6). In the presence of ECs (in both coculture and prevascularized groups), Cx43 staining was evident at day 1, both between ECs and distributed among CMs. As early as day 3 in culture, patches of localized junction-like Cx43, in addition to diffuse staining, were observed for myocytes in the coculture group (Figure 6). In the prevascularized group at day 3, wherein spontaneous contractions were already observed, more junction-like patches of Cx43 were observed compared with the coculture group, indicating electrical connections between myocytes (Figure 6). In addition to junctions between myocytes, there was also evidence of Cx43 localized at the interface between ECs and myocytes (Figure 6) detected in both the coculture group (at day 7) and the preculture group (as early as day 3). When myocytes and myocyte-EC coculture groups were cultured for 3 days with or without addition of 100 ng/mL of neutralizing anti-mouse VEGF antibody (R&D Systems), we observed no differences in either apoptosis or Cx43 staining between VEGF antibody-containing cultures and controls.

Figure 6. ECs promote Cx43 expression

Cultures at 3 days immunostained for Cx43 (red) and anti-sarcomeric actinin (green); nuclei are stained with DAPI (blue). For CMs alone (left), Cx43 staining is diffuse and sparse, with no evidence of gap junctions; for coculture (center), both diffuse (yellow arrow) and patchlike (thin, white arrow) Cx43 staining is observed; for prevascularized (right), increased patchlike staining indicates presence of gap junctions. Thick arrow-heads indicate junctions between myocytes and ECs. Bar=50 μm. Abbreviations are as defined in text.

nihms-134922.jpg  endothelial-myocyte figs_Image_1

nihms-134922.jpg  endothelial-myocyte figs_Image_2

nihms-134922.jpg  endothelial-myocyte figs_Image_3

nihms-134922.jpg  endothelial-myocyte figs_Image_4

nihms-134922.jpg  endothelial-myocyte figs_Image_5

nihms-134922.jpg  endothelial-myocyte figs_Image_6

Endothelial-Cardiomyocyte Interactions in Cardiac Development and Repair: Implications for Cardiac Regeneration

Patrick C.H. Hsieh, Michael E. Davis, Laura K. Lisowski, and Richard T. Lee

Cardiovascular Division, Department of Medicine, Brigham and Women’s Hospital, Harvard Medical School, Boston, MA
Annu Rev Physiol.    PMC 2009 September 30

The ongoing molecular conversation between endothelial cells and cardiomyocytes is highly relevant to the recent excitement in promoting cardiac regeneration. The ultimate goal of myocardial regeneration is to rebuild a functional tissue that closely resembles mature myocardium, not just to improve systolic function transiently. Thus, regenerating myocardium will require rebuilding the vascular network along with the cardiomyocyte architecture. Here we review evidence demonstrating crucial molecular interactions between endothelial cells and cardiomyocytes. We first discuss endothelial-cardiomyocyte interactions during embryonic cardiogenesis, followed with morphological and functional characteristics of endothelial-cardiomyocyte interactions in mature myocardium. Finally, we consider strategies exploiting endothelial-cardiomyocyte interplay for cardiac regeneration.

Signaling from Cardiomyocytes to Endothelial Cells

The examples of neuregulin-1, NF1, and PDGF-B demonstrate that signals from endothelial cells regulate the formation of primary myocardium. Similarly, signaling from myocardial cells to endothelial cells is also required for cardiac development. Two examples of myocardial-to-endothelial signaling are vascular endothelial growth factor (VEGF)-A and angiopoietin-1.

VASCULAR ENDOTHELIAL GROWTH FACTOR-A

VEGF-A is a key regulator of angiogenesis during embryogenesis. In mice, a mutation in VEGF-A causes endocardial detachment from an underdeveloped myocardium. A mutation in VEGF receptor-2 (or Flk-1) also results in failure of the endocardium and myocardium to develop (18). Furthermore, cardiomyocyte-specific deletion of VEGF-A results in defects in vasculogenesis/angiogenesis and a thinned ventricular wall, further confirming reciprocal signaling from the myocardial cell to the endothelial cell during cardiac development. Interestingly, this cardiomyocyte-selective VEGF-A-deletion mouse has underdeveloped myocardial microvasculature but preserved coronary artery structure, implying a different signaling mechanism for vasculogenesis/angiogenesis in the myocardium and in the epicardial coronary arteries.
Cardiomyocyte-derived VEGF-A also inhibits cardiac endocardial-to-mesenchymal transformation. This process is essential in the formation of the cardiac cushions and requires delicate control of VEGF-A concentration. A minimal amount of VEGF initiates endocardial-to-mesenchymal transformation, whereas higher doses of VEGF-A terminate this transformation. Interestingly, this cardiomyocyte-derived VEGF-A signaling for endocardial-to-mesenchymal transformation may be controlled by an endothelial-derived feedback mechanism through the calcineurin/NFAT pathway (24), demonstrating the importance of endothelial-cardiomyocyte interactions for cardiac morphogenesis.

ANGIOPOIETIN-1

Another mechanism of cardiomyocyte control of endothelial cells during cardiac development is the angiopoietin-Tie-2 system. Both angiopoietin-1 and angiopoietin-2 may bind to Tie-2 receptors in a competitive manner, but with opposite effects: Angiopoietin-1 activates the Tie-2 receptor and prevents vascular edema, whereas angiopoietin-2 blocks Tie-2 phosphorylation and increases vascular permeability. During angiogenesis/vasculogenesis, angiopoietin-1 is produced primarily by pericytes, and Tie-2 receptors are expressed on endothelial cells. Angiopoietin-1 regulates the stabilization and maturation of neovasculature; genetic deletion of angiopoietin-1 or Tie-2 causes a defect in early vasculogenesis/angiogenesis and is lethal.
Cardiac endocardium is one of the earliest vascular components (along with the dorsal aorta and yolk sac vessels) and the adult heart can be regarded as a fully vascularized organ, angiopoietin-Tie-2 signaling may also be required for early cardiac development. Indeed, mice with mutations in Tie-2 have underdeveloped endocardium and myocardium. These Tie-2 knockout mice display defects in the endocardium but have normal vascular morphology at E10.5, suggesting that the endocardial defect is the fundamental cause of death. In addition, a recent study showed that overexpression, and not deletion, of angiopoietin-1 from cardiomyocytes caused embryonic death between E12.5-15.5 due to cardiac hemorrhage. The mice had defects in the endocardium and myocardium and lack of coronary arteries, suggesting that, as with VEGF-A, a delicate control of angiopoietin-1 concentration is critical for early heart development.

ENDOTHELIAL-CARDIOMYOCYTE INTERACTIONS IN NORMAL CARDIAC FUNCTION

Cardiac Endothelial Cells Regulate Cardiomyocyte Contraction

The vascular endothelium senses the shear stress of flowing blood and regulates vascular smooth muscle contraction. It is therefore not surprising that cardiac endothelial cells—the endocardial endothelial cells as well as the endothelial cells of intramyocardial capillaries— regulate the contractile state of cardiomyocytes. Autocrine and paracrine signaling molecules released or activated by cardiac endothelial cells are responsible for this contractile response (Figure 2).

NITRIC OXIDE

Three different nitric oxide synthase isoenzymes synthesize nitric oxide (NO) from L-arginine. The neuronal and endothelial NO synthases (nNOS and eNOS, respectively) are expressed in normal physiological conditions, whereas the inducible NO synthase is induced by stress or cytokines. Like NO in the vessel, which causes relaxation of vascular smooth muscle, NO in the heart affects the onset of ventricular relaxation, which allows for a precise optimization of pump function beat by beat. Although NO is principally a paracrine effector secreted by cardiac endothelial cells, cardiomyocytes also express both nNOS and eNOS. Endothelial expression of eNOS exceeds that in cardiomyocytes by greater than 4:1. Cardiomyocyte autocrine eNOS signaling can regulate β-adrenergic and muscarinic control of contractile state.
Barouch et al. demonstrated that cardiomyocyte nNOS and eNOS may have opposing effects on cardiac structure and function. Using mice with nNOS or eNOS deficiency, they found that nNOS and eNOS have not only different localization in cardiomyocytes but also opposite effects on cardiomyocyte contractility; eNOS localizes to caveolae and inhibits L-type Ca2+ channels, leading to negative inotropy, whereas nNOS is targeted to the sarcoplasmic reticulum and facilitates Ca2+ release and thus positive inotropy (31). These results demonstrate that spatial confinement of different NO synthase isoforms contribute independently to the maintenance of cardiomyocyte structure and phenotype.
As indicated above, mutation of neuregulin or either of two of its cognate receptors, erbB2 and erbB4, causes embryonic death during mid-embryogenesis due to aborted development of myocardial trabeculation . Neuregulin also appears to play a role in fully developed myocardium. In adult mice, cardiomyocyte-specific deletion of erbB2 leads to dilated cardiomyopathy. Neuregulin from endothelial cells may induce a negative inotropic effect in isolated rabbit papillary muscles. This suggests that, along with NO, the neuregulin signaling pathway acts as an endothelial-derived regulator of cardiac inotropism.  In fact, the negative inotropic effect of neuregulin may require NO synthase because L-NMMA, an inhibitor of NO synthase, significantly attenuates the negative inotropy of neuregulin.

Studies to date indicate that cardiac regeneration in mammals may be feasible, but the response is inadequate to preserve myocardial function after a substantial injury. Thus, understanding how normal myocardial structure can be regenerated in adult hearts is essential. It is clear that endothelial cells play a role in cardiac morphogenesis and most likely also in survival and function of mature cardiomyocytes. Initial attempts to promote angiogenesis in myocardium were based on the premise that persistent ischemia could be alleviated. However, it is also possible that endothelial-cardiomyocyte interactions are essential in normal cardiomyocyte function and for protection from injury. Understanding the molecular and cellular mechanisms controlling these cell-cell interactions will not only enhance our understanding of the establishment of vascular network in the heart but also allow the development of new targeted therapies for cardiac regeneration by improving cardiomyocyte survival and maturation.

Endothelial-cardiomyocyte assembly

Figure 1.  Endothelial-cardiomyocyte assembly in adult mouse myocardium.
Normal adult mouse myocardium is stained with intravital perfusion techniques to demonstrate cardiomyocyte (outlined in red) and capillary (green; stained with isolectin-fluorescein) assembly. Nuclei are blue (Hoechst). Original magnification: 600X

Endothelial dysfunction

Intramyocardial Fibroblast – Myocyte Communication

Rahul Kakkar, M.D. and Richard T. Lee, M.D.
From the Cardiology Division, Massachusetts General Hospital and the Cardiovascular Division, Brigham and Women’s Hospital, Department of Medicine, Harvard Medical School, Boston, MA
Circ Res. 2010 January 8; 106(1): 47–57.    http://dx.doi.org/10.1161/CIRCRESAHA.109.207456

Cardiac fibroblasts have received relatively little attention compared to their more famous neighbors, the cardiomyocytes. Cardiac fibroblasts are often regarded as the “spotters”, nonchalantly watching the cardiomyocytes do the real weight-lifting, and waiting for a catastrophe that requires their actions. However, emerging data now reveal the fibroblast as not only a critical player in the response to injury, but also as an active participant in normal cardiac function.
Interest in cardiac fibroblasts has grown with the recognition that cardiac fibrosis is a prominent contributor to diverse forms of myocardial disease. In the early 1990’s, identification of angiotensin receptors on the surface of cardiac fibroblasts linked the renin-angiotensin-aldosterone system directly with pathologic myocardial and matrix extracellular remodeling.  Fibroblasts were also revealed as a major source of not only extracellular matrix, but the proteases that regulate and organize matrix. New research has uncovered paracrine and well as direct cell-to-cell interactions between fibroblasts and their cardiomyocyte neighbors, and cardiac fibroblasts appear to be dynamic participants in ventricular physiology and pathophysiology.
This review will focus on several aspects of fibroblast-myocyte communication, including mechanisms of paracrine communication.  Ongoing efforts at regeneration of cardiac tissue focus primarily on increasing the number of cardiomyocytes in damaged myocardium. Although getting cardiomyocytes into myocardium is an important goal, understanding intercellular paracrine communication between different cell types, including endothelial cells but also fibroblasts, may prove crucial to regenerating stable myocardium that responds to physiological conditions appropriately.

An area of active research in cardiovascular therapeutics is the attempt to engineer, ex vivo, functional myocardial tissue that may be engrafted onto areas of injured ventricle. Recent data suggests that the inclusion of cardiac fibroblasts in three-dimensional cultures greatly enhances the stability and growth of the nascent myocardium. Cardiac fibroblasts when included in polymer scaffolds seeded with myocytes and endothelial cells have the ability to promote and stabilize vascular structures. Naito and colleagues constructed three dimensional cultures of neonatal rat cell isolates on collagen type I and Matrigel (a basement membrane protein mixture), and isolates of a mixed cell population versus a myocyte-enriched population were compared. The mixed population cultures, which contained a higher fraction of cardiac fibroblasts than the myocyte-enriched cultures, displayed improved contractile force generation and greater inotropic response despite an equivalent overall cell number. Greater vascularity was also seen in the mixed-pool cultures.(160) Building on this, Nichol and colleagues demonstrated that in a self-assembling nanopeptide scaffold, embedded rat neonatal cardiomyocytes exhibit greater cellular alignment and reduced apoptosis when cardiac fibroblasts were included in the initial culture. A similar result was noted when polymer scaffolds were pre-treated with cardiac fibroblasts before myocyte seeding, suggesting a persistent paracrine effect. These data reinforce the concept that engineering functional myocardium, either in situ or ex vivo will require attention to the nature of cell-cell interactions, including fibroblasts.

To date, a broad initial sketch of cardiac fibroblast-myocyte interactions has been drawn. Future studies in this field will better describe these interactions. How do multiple paracrine factors interact to produce a cohesive and coordinated communication scheme? What are the changes in coordinated bidirectional signaling that during development promotes myocyte progenitor proliferation but have different roles in the adult? Might fibroblasts actually be required for improved cardiac repair and regeneration?
Recent studies have begun to apply genetic and cellular fate-mapping techniques to document the origins of cardiac fibroblasts, the dynamic nature of their population, and how that population may be in flux during time of injury or pressure overload. It is crucial to define on a more specific molecular basis the origins and fates of cardiac fibroblasts. Do fibroblasts that have been resident within the ventricle since development fundamentally differ from those that arise from endothelial transition or that infiltrate from the bone marrow during adulthood? Do fibroblasts with these different origins behave differently or take on different roles in the face of ventricular strain or injury?

Our understanding of the nature of the cardiac fibroblast is evolving from the concept of the fibroblast as a bystander that causes unwanted fibrosis to the picture of a more complex role of fibroblasts in the healthy as well as diseased heart. The pathways used by cardiac fibroblasts to communicate with their neighboring myocytes are only partially described, but the data to date indicate that these pathways will be important for cardiac repair and regeneration.

. Paracrine bidirectional cardiac fibroblast-myocyte crosstalk

Figure 2. Paracrine bidirectional cardiac fibroblast-myocyte crosstalk

Under biomechanical overload, cardiac fibroblasts and myocytes respond to an altered environment via multiple mechanisms including integrin-extracellular matrix interactions and renin-angiotensin-aldosterone axis activation. Cardiac fibroblasts increase synthesis of matrix proteins and secrete a variety of paracrine factors that can stimulate myocyte hypertrophy. Cardiac myocytes similarly respond by secreting a conglomerate of factors. Hormones such as TGFβ1, FGF-2, and the IL-6 family members LIF and CT-1 have all been implicated in this bidirectional fibroblast-myocyte hormonal crosstalk.

Read Full Post »

Notable Contributions to Regenerative Cardiology by Richard T. Lee – Part I


Author and Curator: Larry H Bernstein, MD, FCAP

and

Article Commissioner: Aviva Lev-Ari, PhD, RD


Introduction

This presentation is a two part discussion of selected articles of a large body of research from Dr. Richard T. Lee, at Harvard Medical School’s Lee Laboratory and Brigham & Womens Hospital.  This work is innovative in the field of stem cell research and myocardial regeneration.  It devolves the complex cellular processes that are involved in the management of a cell transforming from a progenitor to a functional cardiomyocyte.  The cell engineering involves investigating interactions between a cell placed into the layer derived from the interstitial layer between viable cardiomyocytes.  This is only possible from a through actionable knowledge of the mechanism involved in the transformation process, which has occupied the Lee Laboratory for many years.  Part II will cover the cellular mechanisms underlying the conceptual approach to cardiac myocyte regeneration.

The Lee Laboratory uses emerging biotechnologies to discover and design new approaches to cardiovascular diseases. A central theme of the laboratory is that merging bioengineering and molecular biology approaches can yield novel approaches. Thus, the Lee Laboratory works at this interface using a broad variety of techniques in genomics, imaging, nanotechnology, physiology, cell biology, and molecular biology. The approach is to understand problems and design solutions in the laboratory and then demonstrate the effectiveness of these solutions in vivo. Ongoing projects in the laboratory include studies of cardiac regeneration, diabetic vascular disease, wound healing, heart failure, and cardiac hypertrophy.

Richard T. Lee is Professor of Medicine at Harvard Medical School and lecturer in Biological Engineering at the Massachusetts Institute of Technology. He is a 1979 graduate of Harvard College in Biochemical Sciences and received his M.D. from Cornell University Medical College in 1983.  He went on to complete his residency in 1986 and cardiology fellowship in 1989, both at Brigham and Women’s Hospital in Boston, and he obtained post-doctoral training at MIT in Bioengineering.

Dr. Lee is certified by the American Board of Internal Medicine in cardiovascular disease and is a Fellow of the American College of Cardiology. He is Leader of the Cardiovascular Program of the Harvard Stem Cell Institute.  He is a member of the Editorial Boards of the journals Circulation Research, Journal of Clinical Investigation, and Circulation, and has published over 180 peer-reviewed articles based on his research, which combines approaches in biotechnology and molecular biology to discover new avenues to manage and treat heart disease.

Regeneration of the heart

Matthew L. Steinhauser, Richard T. Lee
Division of Cardiovascular Medicine, Department of Medicine, Brigham and Women’s Hospital, Harvard Medical School, and (2)             Harvard Stem Cell Institute, Cambridge, MA
EMBO Mol Med 2011; 3: 701–712   http://dx.doi.org/10.1002/emmm.201100175

The death of cardiac myocytes diminishes the heart’s pump function and is a major cause of heart failure. With the exception of heart transplantation and implantation of mechanical ventricular assist devices, current therapies do not address the central problem of decreased pumping capacity owing to a depleted pool of cardiac myocytes. The field is evolving in two important directions. First, although endogenous mammalian cardiac regeneration clearly seems to decline rapidly after birth, it may still persist in adulthood. The careful elucidation of the cellular and molecular mechanisms of endogenous heart regeneration may therefore provide an opportunity for developing therapeutic interventions that amplify this process. Second, recent breakthroughs have enabled reprogramming of cells that were apparently terminally differentiated, either by dedifferentiation into pluripotent stem cells or by trans-differentiation into cardiac myocytes.
The longstanding paradigm held that the mammalian heart is a terminally differentiated organ, incapable of replenishing any myocyte attrition. During the past decade, however, studies revealed not only that mammalian cardiac myocytes retain some capacity for division (Beltrami et al, 2001), but also identified endogenous cardiac progenitor cells in the heart (Beltrami et al, 2003) or bone marrow (Orlic et al, 2001). These cells retain some potential for differentiation into the cellular components of the heart, including endothelial cells, smooth muscle cells and cardiac myocytes.
If progenitor cells residing in the adult are capable of producing new heart cells, the therapeutic delivery of such progenitors might facilitate the generation of de novo functional myocardium. In this context, cell-based therapies for the heart have been rapidly translated into the clinic to treat heart disease, but randomized clinical trials with bone marrow progenitors have shown at best modest improvements in ventricular function (Martin-Rendon et al, 2008). In short, the promise of complete cardiac regeneration has not yet been realized.  Therefore, it is worth revisiting both the foundations of cardiac regeneration and highlight recent advances that may portend future directions in the field.
We will first define the problem, that is elucidating the scope of endogenous mammalian regeneration and, by extension, the scale of the regenerative deficit. We will then summarize current regenerative approaches, including both cell-based therapies and pharmacoregenerative strategies. In this context, we will summarize the many challenges that stand in the way of cardiac regeneration, both endogenous repair processes and exogenous regenerative therapies.
The regenerative deficit of the mammalian heart is obvious when compared with organisms such as zebrafish and newts, which demonstrate a remarkable survival capacity after removal of up to 20% of the heart by transection of the ventricular apex. Pre-existing cardiac myocytes adjacent to the site appear to undergo a process of dedifferentiation, characterized by dissolution of sarcomeric structures. This is followed by incorporation of deoxyribonucleic acid (DNA) synthesis markers (e.g. nucleotide analogues) consistent with proliferation. Ultimately, newly generated cardiac myocytes are functionally integrated with the preexisting myocardium. The heart is left with little residual evidence of the injury, thus providing a natural example of complete myocardial regeneration.

Evidence for heart regeneration in mammals

During embryonic development and the early post-natal period, mice also demonstrate a remarkable regenerative capacity. Embryos heterozygous for a cardiac myocyte-specific null mutation in the x-linked holocytochrome c synthase (Hccs) gene demonstrate cardiac myocyte replacement during foetal development (Drenckhahn et al, 2008): when one of two X-chromosomes is randomly inactivated in each female somatic cell, approximately 50% of the cardiac myocytes are rendered Hccs-null and hence dysfunctional. Proliferative functional Hccs-expressing cardiac myocytes compensate for dysfunctional Hccs-null myocytes, such that, at birth, 90% of the heart is derived from myocytes containing one functional Hccs allele. However, after the first week in post-natal mice, injured myocardium is largely replaced by fibrosis and scarring.  Distinguishing whether the adult mammalian heart is incapable of cardiac myocyte replacement or whether it retains a low-level capacity for repair is therefore fundamentally important. This is the basis for an evolving view of a more plastic mammalian heart.
Arguments against the age old view of the terminally differentiated quiescent cardiac myocyte:

  1. evidence supporting cardiac myocyte plasticity relied on mathematical modelling of the myocyte population based on cytometric indices. (the measured average volume increase of cardiac myocytes was calculated to fall short of the increase predicted by the observed volumetric changes in the whole heart
  • changes in heart volume could not be explained by hypertrophy alone, and that cardiac myocyte hyperplasia contributed to changes in heart mass, but the conclusions relied on a number of assumptions about myocyte size and DNA content.
  • detecting cell cycle markers such as Ki67 or the incorporation of nucleotide analogues (e.g. iododeoxyuridine or 3H-thymidine) into newly synthesized DNA further support the notion that the mammalian heart may generate new myocytes
  • human cardiac myocytes can reenter the cell cycle, but the described rates of this phenomenon differ by more than one order of magnitude
  • experiments, made possible by nuclear arms testing in the middle of the 20th century, provide the most convincing evidence for post-natal human cardiac myocyte turnover.
  • the period of nuclear testing serves as a historical DNA labelling pulse, and the period after the test ban treaty serves as a chase.
  • the genomic DNA of cells generated during either the pulse or the chase reflect the earth’s atmospheric 14C concentration at that point in time, which allows investigators to date the age of cardiac myocytes by measuring the concentration of 14C in their nuclei
  1. Listed are a number of problems in detecting the generation of cardiac myocytes:
  • small errors may magnify projections of absolute yearly or lifetime myocyte turnover
  • mis-identification of cellular components by light microscopy
  • autofluorescence of myocardium, which complicates any method that relies on the detection of a fluorescent signal
  • confounders could also affect the 14C dating method, because it requires the isolation of cardiac myocyte nuclei by digestion and flow cytometric sorting

The heart also presents a unique challenge compared to other organs owing to the propensity of cardiac myocytes to synthesize DNA during S-phase without completing either mitosis and/or cytokinesis (Fig 1).

Figure 1. The majority of post-natal human DNA synthesis in the heart does not lead to new myocyte formation.

Cardiac myocytes can complete S-phase, followed by mitosis and cytokinesis (centre) resulting in myocyte doubling. Cardiac myocytes can also complete mitosis without cytokinesis (left), resulting in a binucleated cell. Cardiac myocytes can also undergo chromosomal replication without completing either mitosis or cytokinesis (right), resulting in polyploidy nuclei. By the completion of post-natal development, the majority of human myocyte nuclei contain ~4n chromosomal copies.

During early post-natal development, for example, the majority of rodent cardiac myocytes and an estimated 25–57% of human cardiac myocytes become binucleated. By adulthood, most cardiac myocyte nuclei have also become polyploid with at least one or two additional rounds of chromosomal replication.

The ploidy state of cardiac myocytes may increase with myocardial hypertrophy or injury, which could be mistaken for myocyte division. Conversely, hearts that have been unloaded by implantation of a ventricular assist device may have a lower percentage of polyploid myocytes, because more 2n cardiac myocytes are being generated. These aspects of cardiac myocyte biology inevitably represent potential confounders that must be considered in any quantification of cardiac myocyte formation.

Defining the cellular source of new cardiac myocytes

The majority of reports suggest some endogenous capacity for cardiac myocyte renewal, which has generated a broad focus on finding the cellular source of newly generated cardiac myocytes.  Newly generated adult mammalian cardiac myocytes may arise from an endogenous pool of progenitor cells after injury. The Lee Laboratory developed a genetic lineage mapping approach to quantify progenitor-dependent cardiac myocyte turnover (Fig 2) (Hsieh et al, 2007). In the bitransgenic MerCreMer/ZEG inducible cardiac myocyte reporter mouse, mature cardiac myocytes undergo an irreversible genetic switch from constitutive 3-galactosidase expression to green fluorescent protein (GFP) expression upon tamoxifen pulse. During a chase period, we evaluated the effect of myocardial injury on the proportion of GFP+ or 3-gal+ cardiac myocytes. Pressure overload or myocardial infarction resulted in a significant reduction in the percentage of GFP+ cardiac myocytes and a corresponding increase in the percentage of B-gal+ cardiac myocytes, consistent with repletion of the myocyte pool by B-gal— expressing progenitors. This approach cannot directly identify the molecular identity or anatomic location of the progenitor pool.
One approach to characterizing the molecular phenotype of cardiac progenitors is to study cardiac embryologic develop-ment, guided by the assumption that developmental paradigms are recapitulated during post-natal repair. When examined through a developmental lens, an increasingly detailed picture emerges of the soluble and transcriptional signals that guide the cardiogenic programme from gastrulation (formation of distinct germ layers) through the ultimate maturation of cardiac myocytes. The induction of mesoderm posterior (MESP)-1 expression by brachyury-expressing primitive mesodermal cells is a proximal require¬ment for the ultimate production of differentiated heart cells. As the developing embryo grows beyond the germ layer phase, its developing heart receives cells from distinct anatomic progeni¬tor sources: the 1st and 2nd heart fields provide the majority of the myocardium, with some contribution from epicardial progenitors.
Also, Certain fields may be preferentially marked by specific transcription factors;

  • the first heart field by T-box transcription factor 5 (Tbx5)
  • the second heart field by
    • Lim-homeodomain protein Islet1 (Isl1)
    • and epicardial progenitors by Wilms tumour-1 (WT1) or
    • T-box transcription factor 18 (Tbx18)
    • identified by embryonic lineage tracing or analysis of gene silencing include
      • homeobox protein nkx2.5
      • myocyte enhancer factor 2C (Mef2c)
      • GATA4
      • there is no consensus yet about the molecular identity of post-natal mammalian cardiac progenitor cells or ‘adult cardiac stem cells’

Figure 2. Lineage-mapping in the adult heart.

Left: Theoretical progenitor lineage-mapping is depicted. Progenitors would be selectively marked by fluorescent protein expression. After injury, the appearance of fluorescently labelled cardiac myocytes would support the concept that these progenitors were contributing to new myocyte formation. Right: Differentiated cell (cardiac myocyte) lineage-mapping. Upon treatment of the MerCreMer-ZEG mouse with OH-tamoxifen, approximately 80% of the cardiac myocytes undergo a permanent switch from I3-galactosidase to GFP expression. The dilution of the GFPþ cardiac myocyte pool after injury is consistent with repletion by I3-galþ progenitors.

A number of laboratories have identified cell populations within the post-natal mouse, which fulfil some criteria of cardiac progenitors:

  • expression of a developmentally important gene (isl-1(Laugwitz et al, 2005))
  • specific cell surface receptor profile (c-kit (Beltrami et al, 2003)
  • or sca-1 (Oh et al, 2003))
  • capacity to actively exclude Hoechst dye (so-called side population cells (Martin et al, 2004)) or based on the outgrowth of typical spherical colonies in tissue culture 

In general, the label of ‘cardiac stem cell’ results from the observation of self-propagation and cardiac myocyte transdifferentiation when exposed to cardiogenic conditions in vitro or when delivered in vivo after injury. However, the field will benefit from careful in vivo lineage tracing studies—without ex vivo culture steps—to study if and how a given cell type contributes to cardiac myocyte replenishment during either normal homeostasis or after injury (Fig 2). The lack of such publications to date owes in part to the lack of specificity of many stem cell markers (Fig 3).

Figure 3. Possible recapitulation of developmental paradigms by endogenous post-natal cardiac stem cells.

Between mesodermal development and the emergence of cardiac myocytes, cardiovascular progenitors express a number of markers that have also been detected in the various post-natal cardiac stem cell (CSC) preparations. Expression as measured by messenger RNA (mRNA) or protein expression is denoted with (þ). Absent expression is denoted by (-). Blank1/4 untested.

Moving towards a regenerative therapy

The therapeutic challenge is considerable: a typical large myocardial infarction that leads to heart failure will kill around 1 billion cardiac myocytes,  roughly a quarter of the heart’s myocytes. A possible therapeutic approach would coax an endogenous stem cell population or an exogenously delivered cell-based therapy to replace lost cardiac myocytes in a coordinated fashion. Amongst the myriad of potential cell-based therapies, no clear winning strategy has so far emerged (Segers & Lee, 2008).

Bone marrow derived progenitors

Conflicting studies sparked excitement and also uncertainty about a possible adult cardiogenic progenitor originating outside of the heart. A post-mortem examination of male heart transplant patients who had received female donor hearts found that approximately 10% of -sarcomeric actin-positive cardiac myocytes had Y-chromosomes, and two cases in which a bone marrow cell population with a higher density of the cell surface receptor c-kit, showed repopulation of murine cardiac myocytes after experimental myocardial infarction. A number of studies that followed failed to demonstrate similar rates of chimerism in transplanted hearts or potency of bone marrow stem cell.  However, some therapeutic effect was observed even in studies with no detectable transdifferentiation.

Figure 4. The challenge of regenerating the heart.

Both exogenously delivered cell therapies and progenitors in the endogenous niche encounter a similar hostile environment after myocardial injury, often including inadequate blood supply (ischemia), inflammation and fibrosis/scarring. Regenerative pathways may be activated by as yet unknown paracrine pathways, responsible for recruiting progenitors from the niche, stimulating proliferation and coaxing differentiation.  Cell-based therapy using autologous bone marrow
progenitors was rapidly translated into the clinic to treat human ischemic heart disease. A number of randomized trials, using bone marrow mononuclear cells have been performed and most studies demonstrated modest cell therapy-mediated improvements in ventricular function.

Pluripotent stem cells

Embryonic stem (ES) cells represent the prototypical stem cells with the hallmarks of clonogenicity, self-renewal and pluripotency. The potency of these cells also represents a real safety concern, given their tendency to form teratomas. One approach to overcoming this prohibitive safety problem has been to generate pluripotent-derived progenitors that have already committed to a cardiogenic pathway. As a proof-of-principle example of such a strategy, cells with an expression profile of Oct4, stage-specific embryonic antigen 1 (SSEA-1) and MESP1 demonstrated some regenerative potency when delivered therapeutically in a primate infarct model, without detectable teratoma formation. One could envision a similar strategy using cardiogenic intermediates that express any of the previously mentioned transcription factors associated with cardiac progenitors or cell surface markers such as the receptor for vascular endothelial growth factor (Flk1/KDR). Yet, such a strategy should still demonstrate both substantial preclinical efficacy without tumorigenicity before human translation. If such criteria are met, ES-derived therapies have the potential of providing ‘off-the-shelf’ cardiac myocytes to treat acute myocardial infarctions or chronic heart failure.
A second approach, which may also obviate the risk of teratomas, is to generate a pure population of ES-derived cardiac myocytes for therapeutic delivery either as a cell suspension or after ex vivo tissue engineering. There has already been enormous progress during the past decade in defining the factors and transcription signals to differentiate cardiac myocytes from ES-cells. As discussed in greater detail, cardiac myocyte development is dictated by the time and dose-dependent exposure to a series of growth factors from the wingless-type MMTV integration site (Wnt), fibroblast growth factor (FGF), bone morphogenetic protein (BMP) and nodal families. Several laboratories have successfully generated ES-derived preparations with more than 50% of functional cardiac myocytes.  The most realistic future for such technical advances may be as an unlimited source of cardiac myocytes for engineering myocardial grafts.
The generation of induced pluripotent stem (iPS) cells may overcome two important limitations of ES cells: ethical concerns about harvesting ES cells from embryos and graft rejection

  • iPS cells can be custom-engineered from a patient’s stromal cells for autologous transplantation.
  • immunogenecity in syngeneically transplanted iPS cells, suggests that the immune system cannot yet be discounted in the development of iPS-based therapies

The initial protocols for iPS cell generation involved retro-viral-mediated expression of four stem-cell genes.
But virally reprogrammed cells may harbour an associated risk of neoplastic conversion. Alternative reprogramming strategies, such as the use of small molecules (Shi et al, 2008) or non-viral gene modifying approaches (Warren et al, 2010) will probably be a necessary component of any future therapeutic strategies. However, the most important lesson from these landmark studies may be the remarkable plasticity of even the most terminally differentiated cells when exposed to the right combination of signals.

Tissue engineering

Historically, the greatest challenge in tissue engineering has been an adequate supply of oxygen and nutrients for metabolically active tissues such as the heart. One approach has been to engineer thin cardiac sheets, which can then be stacked for in vivo delivery. Although these layered sheets demonstrate some degree of electromechanical coordination and neovascularization in vivo, it is not clear yet if such an approach can be optimized to yield full-thickness myocardium with an adequate blood supply. The addition of non-myocyte cellular components, such as fibroblasts and endothelial cells, leads to the formation of primitive vascular structures within engineered grafts, but the electro-mechanical properties are not sufficient for normal functionality.

Circumventing cell-based therapy with pharmacoregeneration?

A short-term goal may be to exploit paracrine signalling to amplify the existent endogenous regenerative response. Recent cell transplantation experiments conducted in our laboratory, using an inducible cre-based genetic lineage mapping approach, tested the hypothesis that cell-based therapies might exert proregenerative effects via a paracrine mechanism (Loffredo et al, 2011) (Fig 5).  Consistent with some prior studies, we found no evidence for transdifferentiation of exogenously delivered bone marrow cells into cardiac myocytes. However, we did find increased generation of cardiac myocytes from endogenous progenitors in mice, which were administered c-kit+ bone marrow cells but not mesenchymal stem cells. This finding suggests paracrine signalling between exogenously delivered cells and endogenous resident progenitors. It provides a rationale for therapeutic interventions aimed at activating progenitors or recruiting them from their niche to the injury site.

Figure 5. Proposed of action for cell-based therapies.

In theory, exogenously delivered cells may directly differentiate into endothelial cells, smooth muscle cells and cardiac myocytes. They may also release paracrine factors which may result in non-regenerative effects, such as immunomodulation, angiogenesis or cardioprotection. Recent work from our laboratory suggests that a dominant mechanism achieved with bone marrow progenitor therapy may be via the activation of endogenous progenitor recruitment (Loffredo et al, 2011).

Controlling the mitotic activity of mononucleated cardiac myocytes may provide an alternative approach to replenishing cardiac myocytes. A major concern with systemic growth factor therapy, however, is the potential for mitogenic effects that may impact other organs. Thus, the future of pharmacologic regeneration may lie in the local delivery of engineered proteins and small molecules that target 

Future directions

In this review, we have described the current status of research on cardiac regeneration, highlighting important recent discoveries and ongoing controversies. The initial hope that a cell progenitor would emerge with the capacity to regenerate the injured mammalian heart in the same manner that bone marrow may be reconstituted has not been realized.
Cardiac myocyte regeneration may lie in the local delivery of engineered proteins and small molecules that target specific survival, growth and differentiation pathways.

Pending issues

Dissect the mechanistic differences between adult mammals with limited regenerative capacity and organisms, such as neonatal mice, zebrafish and newts, that demonstrate unambiguous cardiac myocyte regeneration. Understanding these differences may reveal new pathways that can be therapeutically targeted to achieve more robust regeneration.

Complete molecular and functional characterization of endogenous cardiac myocyte progenitors. Multiple laboratories have isolated progenitors from the heart with different molecular characteristics. What are the in vivo functional roles of these progenitors? Do the observed molecular differences between these isolated cells represent functionally distinct cell types?

Identify paracrine signalling pathways responsible for activation and recruitment of endogenous cardiac myocyte progenitors. This may facilitate a pharmacoregenerative therapy, in which treatment with a protein or small molecule would hold the promise of amplifying endogenous regeneration.

Refine reprogramming strategies to more efficiently produce mature cardiac myocytes, both in vitro and in vivo. The ultimate bioengineering goal is to produce a pure population of mature, fully functional cardiac myocytes for ex vivo tissue engineering (or) to control the proliferation and differentiation of endogenous cell populations or exogenously delivered cell therapies such that scar tissue is replaced by myocardium. These different strategies are unified by an underlying requirement to understand the fundamental pathways involved in cardiac myocyte differentiation and maturation.

There is reason for optimism for a regenerative medicine approach to heart failure, given the intense research efforts and the capacity of higher organisms, including the neonatal mouse, to regenerate myocardium. Perhaps the most important issue in this field is identifying which findings are consistently supported by multiple experimental approaches. Ultimately, the findings that are easily reproduced by most or all laboratories will most likely benefit patients.

Selected references

Hsieh et al, 2007.  Hsieh PC, Segers VF, Davis ME, MacGillivray C, Gannon J, Molkentin JD, Robbins J, Lee RT (2007) Evidence from a genetic fate-mapping study that stem cells refresh adult mammalian cardiomyocytes after injury. Nat Med 13: 970¬974
Laugwitz et al, 2005.  Laugwitz KL, Moretti A, Lam J, Gruber P, Chen Y, Woodard S, Lin LZ, Cai CL, Lu MM, Reth M et al (2005) Postnatal isl1þ cardioblasts enter fully differentiated cardiomyocyte lineages. Nature 433: 647-653
Beltrami et al, 2003.  Beltrami AP, Barlucchi L, Torella D, Baker M, Limana F, Chimenti S, Kasahara H, Rota M, Musso E, Urbanek K et al (2003) Adult cardiac stem cells are multipotent and support myocardial regeneration. Cell 114: 763¬776
Oh et al, 2003. Oh H, Bradfute SB, Gallardo TD, Nakamura T, Gaussin V, Mishina Y, Pocius J, Michael LH, Behringer RR, Garry DJ et al (2003) Cardiac progenitor cells from adult myocardium: homing, differentiation, and fusion after infarction. Proc Natl Acad Sci USA 100: 12313-12318
Segers & Lee, 2008.  Segers VF, Lee RT (2008) Stem-cell therapy for cardiac disease. Nature 451:937-942
Loffredo et al, 2011.  Loffredo FS, Steinhauser ML, Gannon J, Lee RT (2011) Bone marrow-derived cell therapy stimulates endogenous cardiomyocyte progenitors and promotes cardiac repair. Cell Stem Cell 8: 389-398.
Shi et al, 2008.  Shi Y, Desponts C, Do JT, Hahm HS, Scholer HR, Ding S (2008) Induction of pluripotent stem cells from mouse embryonic fibroblasts by Oct4 and Klf4 with small-molecule compounds. Cell Stem Cell 3: 568-574.
Warren et al, 2010.  Warren L, Manos PD, Ahfeldt T, Loh YH, Li H, Lau F, Ebina W, Mandal PK, Smith ZD, Meissner A et al (2010) Highly efficient reprogramming to pluripotency and directed differentiation of human cells with synthetic modified mRNA. Cell Stem Cell 7: 618-630.

Mammalian Heart Renewal by Preexisting Cardiomyocytes

SE Senyo, ML Steinhauser, CL Pizzimenti, VK. Yang, Lei Cai, Mei Wang, …,and Richard T. Lee
Cardiovascular and Genetics Divisions, Brigham and Women’s Hospital and Harvard Medical School,
INSERM, Orsay (Fr), Institut Curie, Laboratoire de Microscopie Ionique, Orsay (Fr), National Resource for Imaging Mass Spectrometry, Harvard Stem Cell Institute
Nature. 2013 January 17; 493(7432): 433–436.  http://dx.doi.org/10.1038/nature11682

Although recent studies have revealed that heart cells are generated in adult mammals, the frequency and source of new heart cells is unclear. Some studies suggest a high rate of stem cell activity with differentiation of progenitors to cardiomyocytes. Other studies suggest that new cardiomyocytes are born at a very low rate, and that they may be derived from division of pre-existing cardiomyocytes. Thus, the origin of cardiomyocytes in adult mammals remains unknown. Here we combined two different pulse-chase approaches — genetic fate-mapping with stable isotope labeling and Multi-isotope Imaging Mass Spectrometry (MIMS). We show that genesis of cardiomyocytes occurs at a low rate by division of pre-existing cardiomyocytes during normal aging, a process that increases by four-fold adjacent to areas of myocardial injury. Cell cycle activity during normal aging and after injury led to polyploidy and multinucleation, but also to new diploid, mononucleated cardiomyocytes. These data reveal pre-existing cardiomyocytes as the dominant source of cardiomyocyte replacement in normal mammalian myocardial homeostasis as well as after myocardial injury.

Despite intensive research, fundamental aspects of the mammalian heart’s capacity for self-renewal are actively debated. Estimates of cardiomyocyte turnover range from less than 1% per year to more than 40% per year. Turnover has been reported to either decrease or increase with age, while the source of new cardiomyocytes has been attributed to both division of existing myocytes and to progenitors residing within the heart or in exogenous niches such as bone marrow. Controversy persists regarding the plasticity of the adult heart in part due to methodological challenges associated with studying slowly replenished tissues. Toxicity attributed to radiolabeled thymidine and halogenated nucleotide analogues limits the duration of labeling and may produce direct biological effects. The challenge of measuring cardiomyocyte turnover is further compounded by the faster rate of turnover of cardiac stromal cells relative to cardiomyocytes.

We used Multi-isotope Imaging Mass Spectrometry (MIMS) to study cardiomyocyte turnover and to determine whether new cardiomyocytes are derived from preexisting myocytes or from a progenitor pool (Fig 1a). MIMS uses ion microscopy and mass spectrometry to generate high resolution quantitative mass images and localize stable isotope reporters in domains smaller than one micron cubed15,16,17. MIMS generates 14N quantitative mass images by measuring the atomic composition of the sample surface with a lateral resolution of under 50nm and a depth resolution of a few atomic layers. Cardiomyocyte cell borders and intracellular organelles were easily resolved (Fig 1b). Regions of interest can be analyzed at higher resolution, demonstrating cardiomyocyte-specific subcellular ultrastructure, including sarcomeres (Fig 1c, Supplemental Fig 1a). In all subsequent analyses, cardiomyocyte nuclei were identified by their location within sarcomere-containing cells, distinguishing them from adjacent stromal cells.
An immense advantage of MIMS is the detection of nonradioactive stable isotope tracers. As an integral part of animate and inanimate matter, they do not alter biochemical reactions and are not harmful to the organism18. MIMS localizes stable isotope tracers by simultaneously quantifying multiple masses from each analyzed domain; this enables the generation of a quantitative ratio image of two stable isotopes of the same element15. The incorporation of a tracer tagged with the rare stable isotope of nitrogen (15N) is detectable with high precision by an increase in 15N:14N above the natural ratio (0.37%). Nuclear incorporation of 15N-thymidine is evident in cells having divided during a one-week labeling period, as observed in the small intestinal epithelium, which turns over completely in 3–5 days16 (Fig 1d); in contrast, 15N-thymidine labeled cells are rarely observed in the heart (Fig 1e) after 1 week of labeling. In subsequent studies, small intestine was used as a positive control to confirm label delivery.
To evaluate for an age-related change in cell cycle activity, we administered 15N-thymidine for 8 weeks to three age groups of C57BL6 mice starting at day-4 (neonate), at 10-weeks (young adult) and at 22-months (old adult) (Supplemental Fig 2). We then performed MIMS analysis (Fig 2a, b, Supplemental Fig 3). In the neonatal group, 56% (±3% s.e.m., n=3 mice) of cardiomyocytes demonstrated 15N nuclear labeling, consistent with the well-accepted occurrence of cardiomyocyte DNA synthesis during post-natal development19. We observed a marked decline in the frequency of 15N-labeled cardiomyocyte nuclei (15N+CM) in the young adult (neonate= 1.00%15N+CM/day ±0.05 s.e.m. vs young adult=0.015% 15N+CM/ day ±0.003 s.e.m., n=3 mice/group, p<0.001) (Fig 2a, c; Supplemental Fig 3). We found a further reduction in cardiomyocyte DNA synthesis in old mice (young adult=0.015%15N+CM/day ±0.003 s.e.m. vs. old adult=0.007 %15N+CM/day ±0.002 s.e.m., n=3/group, p<0.05) (Fig 2c). The observed pattern of nuclear 15N-labeling in cardiomyocytes is consistent with the known chromatin distribution pattern in cardiomyocytes20 (Supplemental Fig 1b) and was measured at levels that could not be explained by DNA repair (Supplemental Fig 4). Extrapolating DNA synthesis measured in cardiomyocytes over 8 weeks yields a yearly rate of 5.5% in the young adult and 2.6% in the old mice. Given that cardiomyocytes are known to undergo DNA replication without completing the cell cycle19,21,22, these calculations represent the upper limit of cardiomyocyte generation under normal homeostatic conditions, indicating a low rate of cardiogenesis.
To test whether cell cycle activity occurred in preexisting cardiomyocytes or was dependent on a progenitor pool, we performed 15N-thymidine labeling of double-transgenic MerCreMer/ZEG mice, previously developed for genetic lineage mapping (Fig 3a)23,24. MerCreMer/ZEG cardiomyocytes irreversibly express green fluorescent protein (GFP) after treatment with 4OH-tamoxifen, allowing pulse labeling of existing cardiomyocytes with a reproducible efficiency of approximately 80%. Although some have reported rare GFP expression by non-cardiomyocytes with this approach25, we did not detect GFP expression in interstitial cells isolated from MerCreMer/ZEG hearts nor did we detect GFP expression by Sca1 or ckit-expressing progenitors in histological sections (Supplemental Fig 5). Thus, during a chase period, cardiomyocytes generated from progenitors should be GFP−, whereas cardiomyocytes arising from preexisting cardiomyocytes should express GFP at a frequency similar to the background rate induced by 4OH-tamoxifen. We administered 4OH-tamoxifen for two weeks to 8 wk-old mice (n=4); during a subsequent 10-week chase, mice received 15N-thymidine via osmotic minipump.

We next used MIMS and genetic fate mapping to study myocardial injury. Cardiomyocyte GFP labeling was induced in MerCreMer/ZEG mice with 4OH-tamoxifen. Mice then underwent experimental myocardial infarction or sham surgery followed by continuous labeling with 15N-thymidine for 8wks. The frequency of 15N-labeled cardiomyocytes in sham-operated mice was similar to prior experiments in unoperated mice (yearly projected rates: sham=6.8%; unoperated=4.4%), but increased significantly adjacent to infarcted myocardium (total 15N+ cardiomyocyte nuclei: MI=23.0% vs sham=1.1%, Fig 4a–b, Supplemental Fig 8). We examined GFP expression, nucleation and ploidy status of 15N-labeled cardiomyocytes and surrounding unlabeled cardiomyocytes. We found a significant dilution of the GFP+ cardiomyocyte pool at the border region as previously shown23,24 (67% vs. 79%, p<0.05, Table 2, Supplemental Fig 9); however, 15N+ myocytes demonstrated a similar frequency of GFP expression compared to unlabeled myocytes (71% vs. 67%, Fisher’s exact=n.s.), suggesting that DNA synthesis was primarily occurring in pre-existing cardiomyocytes. Of 15N-labeled cardiomyocytes, approximately 14% were mononucleated and diploid consistent with division of pre-existing cardiomyocytes (Supplemental Fig 6, 7). We observed higher DNA content (>2N) in the remaining cardiomyocytes as expected with compensatory hypertrophy after injury. Thus, in the 8wks after myocardial infarction, approximately 3.2% of the cardiomyocytes adjacent to the infarct had unambiguously undergone division (total 15N+ × mononucleated diploid fraction = 23% × 0.14 = 3.2%). The low rate of cardiomyocyte cell cycle completion is further supported by the absence of detectable Aurora B Kinase, a transiently expressed cytokinesis marker, which was detected in rapidly proliferating small intestinal cells but not in cardiomyocytes (Supplemental Fig 10). We also considered the possibility that a subset of 15N+ myocytes that were multinucleated and/or polyploid resulted from division followed by additional rounds of DNA synthesis without division. However, quantitative analysis of the 15N+ population did not identify a subpopulation that had accumulated additional 15N-label as would be expected in such a scenario (Supplemental Fig 11). Together, these data suggest that adult cardiomyocytes retain some capacity to reenter the cell cycle, but that the majority of DNA synthesis after injury occurs in preexisting cardiomyocytes without completion of cell division.
If dilution of the GFP+ cardiomyocyte pool cannot be attributed to division and differentiation of endogenous progenitors, do these data exclude a role for progenitors in the adult mammalian heart? These data could be explained by preferential loss of GFP+ cardiomyocytes after injury, a process that we have previously considered but for which we have not found supporting evidence23. Such an explanation excludes a role for endogenous progenitors in cardiac repair and would be consistent with data emerging from lower vertebrates8,26 and the neonatal mouse27 in which preexisting cardiomyocytes are the cellular source for cardiomyocyte repletion. A second possibility to explain the dilution of the GFP+ cardiomyocyte pool is that injury stimulates progenitor differentiation without division; inevitably, this would lead to exhaustion of the progenitor pool, which if true could explain the limited regenerative potential of the adult mammalian heart.

In summary, this study demonstrates birth of cardiomyocytes from preexisting cardiomyocytes at a projected rate of approximately 0.76%/year (15N+ annual rate × mononucleated diploid fraction = 4.4% × 0.17) in the young adult mouse under normal homeostatic conditions, a rate that declines with age but increases by approximately four-fold after myocardial injury in the border region. This study shows that cardiac progenitors do not play a significant role in myocardial homeostasis in mammals and suggests that their role after injury is also limited.

Engineering insulin-like growth factor-1 for local delivery

T Tokunou, R Miller, P Patwari, ME Davis, VFM Segers, AJ Grodzinsky, and RT Lee
Cardiovascular Division, Department of Medicine, Brigham and Women’s Hospital, Harvard Medical School, Boston, MA and Biological Engineering, MIT, Cambridge, MA
FASEB J. 2008 June ; 22(6): 1886–1893.   http://dx.doi.org/10.1096/fj.07-100925

Insulin-like growth factor-1 (IGF-1) is a small protein that promotes cell survival and growth, often acting over long distances. Although for decades IGF-1 has been considered to have therapeutic potential, systemic side effects of IGF-1 are significant, and local delivery of IGF-1 for tissue repair has been a long-standing challenge. In this study, we designed and purified a novel protein, heparin-binding IGF-1 (Xp-HB-IGF-1), which is a fusion protein of native IGF-1 with the heparin-binding domain of heparin-binding epidermal growth factor-like growth factor. Xp-HB-IGF-1 bound selectively to heparin as well as the cell surfaces of 3T3 fibroblasts, neonatal cardiac myocytes and differentiating ES cells. Xp-HB-IGF-1 activated the IGF-1 receptor and Akt with identical kinetics and dose response, indicating no compromise of biological activity due to the heparin-binding domain. Because cartilage is a proteoglycan-rich environment and IGF-1 is a known stimulus for chondrocyte biosynthesis, we then studied the effectiveness of Xp-HB-IGF-1 in cartilage. Xp-HB-IGF-1 was selectively retained by cartilage explants and led to sustained chondrocyte proteoglycan biosynthesis compared to IGF-1. These data show that the strategy of engineering a “long-distance” growth factor like IGF-1 for local delivery may be useful for tissue repair and minimizing systemic effects.

INSULIN-LIKE GROWTH FACTOR-1 (IGF-1) is a growth factor well known as an important mediator of cell growth and differentiation. IGF-1 stimulates several signaling pathways through the tyrosine kinase IGF-1 receptor, including phosphatidylinositol (PI) 3-kinase and mitogen-activated protein kinases (MAPKs). PI3-kinase has many downstream targets, including the kinase Akt, and activation of Akt promotes survival, proliferation, and growth.
IGF-1 has been extensively studied for its therapeutic potential in tissue repair and regeneration. IGF-1 is a small and highly diffusible protein that can act over long distances. However, systemic administration of IGF-1 has significant side effects as well as the potential to promote diabetic retinopathy and cancer. Therefore, local delivery of IGF-1 has been a longstanding challenge. Here, we describe the design of a new protein, formed by fusion of IGF-1 with the heparin-binding (HB) domain of heparin-binding epidermal growth factor-like growth factor (HB-EGF). HB-EGF binds selectively to glycosaminoglycans through its highly positively charged heparin-binding domain.

Thus, we hypothesized that engineering IGF-1 to bind to glycosaminoglycans could provide selective delivery of IGF-1 to cell surfaces or to specific tissues. We demonstrate that this heparin-binding IGF-1 (Xp-HB-IGF-1) can bind to cell surfaces as well as the proteoglycan-rich tissue of cartilage; furthermore, Xp-HB-IGF-1 prolongs the stimulation of chondrocyte biosynthesis, demonstrating its potential for tissue specific repair.

Purification of Xp-HB-IGF-1

Figure 1A—C shows the constructs for Xp-HB-IGF-1 and the control Xp-IGF-1 fusion proteins.

IGF-1 has 3 disulfide bonds and includes 70 amino acids. The IGF-1 fusion proteins both contain polyhistidine tags for protein purification and Xpress tags for protein detection. The expected molecular masses of Xp-HB-IGF-1 and Xp-IGF-1 are 14,018 and 11,548 Da, respectively. Xp-HB-IGF-1 has the HB domain on the N terminus of IGF-1. The HB domain has 21 amino acids and includes 12 positively charged amino acids. Final purification of the new fusion proteins after refolding was performed with RP-HPLC (Fig. 1D, E). Identification of the correctly folded protein was performed as described previously and confirmed with bioactivity assays. These 3 IGF-1s (Xp-HB-IGF-1, Xp-IGF-1, and unmodified IGF-1) yielded similar intensities.

Xp-HB-IGF-1 binds to heparin and cell surfaces

1. Xp-HB-IGF-1 binds selectively to heparin compared with Xp-IGF-1 (Fig. 2A).
2. Xp-HB-IGF-1 bound to 3T3 fibroblast cells when treated with 10 and 100 nM concentrations.
3. Xp-HB-IGF-1 binds with neonatal cardiac myocytes, with clear selective binding of Xp-HB-IGF-1 (Fig 2C)
4. These results are consistent with binding of this HB domain to heparan sulfate in the submicromolar range
5. Xp-HB-IGF-1 was readily detected on the surfaces of ES cells in embryoid bodies — which contain multiple cell types.
6. There is more Xpress epitope tag in Xp-HB-IGF-1 group than the Xp-IGF-1 group, suggesting that Xp-HB-IGF-1 binds with heparan sulfate on the cell surface.

Xp-HB-IGF-1 bioactivity

Bioassays for IGF-1 receptor phosphorylation and Akt activation were performed. Control IGF-1, Xp-HB-IGF-1, and Xp-IGF-1 all activated the IGF-1 receptor of neonatal cardiac myocytes dose-dependently and induced Akt phosphorylation identically (Fig. 3A), and they  activated Akt with a similar time course (Fig. 3B), indicating — addition of the heparin-binding domain does not interfere with the bioactivity of IGF-1.

  1. Xp-HB-IGF-1 transport in cartilage
  2. Cartilage is a proteoglycan-rich tissue, and chondrocytes respond to IGF-1 with increased extracellular matrix synthesis (19). Because prolonged local stimulation of IGF-1 signaling could thus be beneficial for cartilage repair, we studied the ability of Xp-HB-IGF-1 to bind to cartilage.
  3. Xp-HB-IGF-1 is selectively retained by cartilage, while Xp-IGF-1 is rapidly lost.
  4. Xp-HB-IGF-1 can bind to cartilage after chondroitin sulfate digestion

To explore the possibility of nonspecific binding of Xp-HB-IGF-1 to glycosaminoglycans other than heparan sulfate, we studied the binding of Xp-HB-IGF-1 after chondroitinase ABC digestion.
Xp-HB-IGF-1 retention is not mediated by the pool of chondroitin sulfated proteoglycans in the cartilage matrix.

  1. Xp-HB-IGF-1 increases chondrocyte biosynthesis
  2. Xp-HB-IGF-1, which is selectively retained in the cartilage, stimulates chondrocyte biosynthesis over a more sustained period.

DISCUSSION

In this study, we describe a novel IGF-1 protein, Xp-HB-IGF-1, which binds to proteoglycan-rich tissue and cell surfaces but has the same bioactivity as IGF-1. Our data indicate that Xp-HB-IGF-1 can activate the IGF-1 receptor and Akt and thus that the heparin-binding domain does not interfere with interactions of IGF-1 and its receptor. IGF-1 has four domains: B domain (aa 1–29), C domain (aa 30 – 41), A domain (aa 42–62) and D domain (aa 63–70), with the C domain playing the most important role in binding to the IGF-1 receptor. Replacement of the entire C domain causes a 30-fold decrease in affinity for the IGF-1 receptor. Thus, the addition of the heparin-binding domain to the N terminus of IGF-1 was not anticipated to interfere with interactions with the IGF-1 C domain.
Both extracellular matrix and cell surfaces are rich in proteoglycans and can serve as reservoirs for proteoglycan-binding growth factors. A classic example is the fibroblast growth factor-2 (FGF-2) system, where a low-affinity, high-capacity pool of proteoglycan receptors serves as a reservoir of FGF-2 for its high-affinity receptor. Our experiments suggest that Xp-HB-IGF-1 could function in some circumstances in a similar manner, since Xp-HB-IGF-1 is selectively retained on cell surfaces. Many growth factors are known to interact with heparan sulfate, including HB-EGF (10-12), FGF-2 (26), vascular endothelial growth factor-A (VEGF-A), transforming growth factor beta (TGF-β) (28), platelet-derived growth factors (PDGFs), and hepatocyte growth factor (HGF). However, other proteins such as nerve growth factor (NGF), which induces differentiation and reduces apoptosis of neurons, does not have the heparin-binding domain. Thus, the strategy of engineering growth factors for selective matrix or cell surface binding could be used for other growth factors.
IGF-1 can also bind with extracellular matrix via IGF binding proteins (IGFBPs); in the circulation, at least 99% of IGF-1 is bound to IGFBPs (IGFBP-1 to −6). Further experiments are necessary to determine whether addition of a heparin-binding domain to IGF-1 changes interactions with IGFBPs and whether this changes its biological activity.
IGF-1 can promote the synthesis of cartilage extracellular matrix and inhibit cartilage degradation (19); however, a practical mode of IGF-1 delivery to cartilage has yet to be developed (33). Heparan sulfate proteoglycans are prevalent in the pericellular matrix of cartilage, particularly as chains on perlecan and syndecan-2, and are known to bind other ligands such as FGF-2 (34). Our experiments suggest that Xp-HB-IGF-1 protein can bind with matrix and increase local, long-term bioavailability to chondrocytes and thus may improve cartilage repair.

Selected References

Hameed M, Orrell RW, Cobbold M, Goldspink G, Harridge SD. Expression of IGF-I splice variants in young and old human skeletal muscle after high resistance exercise. J. Physiol 2003;547:247–254. [PubMed: 12562960]
Shavlakadze T, Winn N, Rosenthal N, Grounds MD. Reconciling data from transgenic mice that overexpress IGF-I specifically in skeletal muscle. Growth Horm. IGF Res 2005;15:4–18. [PubMed: 15701567]
Milner SJ, Francis GL, Wallace JC, Magee BA, Ballard FJ. Mutations in the B-domain of insulin-like growth factor-I influence the oxidative folding to yield products with modified biological properties. Biochem. J 1995;308(Pt 3):865–871. [PubMed: 8948444]
Milner SJ, Carver JA, Ballard FJ, Francis GL. Probing the disulfide folding pathway of insulin-like growth factor-I. Biotechnol. Bioeng 1999;62:693–703. [PubMed: 9951525]
Bonassar LJ, Grodzinsky AJ, Srinivasan A, Davila SG, Trippel SB. Mechanical and physicochemical regulation of the action of insulin-like growth factor-I on articular cartilage. Arch. Biochem. Biophys 2000;379:57–63. [PubMed: 10864441]
Denley A, Cosgrove LJ, Booker GW, Wallace JC, Forbes BE. Molecular interactions of the IGF system. Cytokine Growth Factor Rev 2005;16:421–439. [PubMed: 15936977]
Musaro A, Dobrowolny G, Rosenthal N. The neuroprotective effects of a locally acting IGF-1 isoform. Exp. Gerontol 2007;42:76–80. [PubMed: 16782294]
Farndale RW, Buttle DJ, Barrett AJ. Improved quantitation and discrimination of sulphated glycosaminoglycans by use of dimethylmethylene blue. Biochim. Biophys. Acta 1986;883:173–177. [PubMed: 3091074]
Yayon A, Klagsbrun M, Esko JD, Leder P, Ornitz DM. Cell surface, heparin-like molecules are required for binding of basic fibroblast growth factor to its high affinity receptor. Cell 1991;64:841– 848. [PubMed: 1847668]
Martin P. Wound healing—aiming for perfect skin regeneration. Science 1997;276:75–81. [PubMed: 9082989]

Figure 1.  Construction and purification of a new Xp-HB-IGF-1 fusion protein.

Figure 1.  Construction and purification of a new Xp-HB-IGF-1 fusion protein.

A) The heparin binding domain of HB-EGF was inserted N-terminal to IGF-1 to generate the fusion protein. The construct included the hexahistidine and Xpress tags from the pTrcHis vector for purification and detection. B) The resulting amino acid sequence of HB-IGF-1. C) Schematic for the structure of HB-IGF-1. Red circles: positively charged amino acids; blue circles: negatively charged amino acids; yellow circles: cysteines. The arrow shows the HB domain. In this figure the epitope tags are not shown. D, E) Representative reverse-phase high-performance liquid chromatography (RP-HPLC) elution profiles with single peaks containing correctly folded protein. Readings of optical density at 214 nm are in blue; readings at 280 nm are in red; elution is by acetonitrile (ACN) gradient. F) After RP-HPLC, Coomassie blue staining and Western blot analysis demonstrate isolation of single bands containing Xpress-tagged protein. The right panel shows that the Western blot analysis of IGF-1, and the two engineered IGF-1 proteins yield similar results using an anti-IGF-1 antibody.

Protein Therapeutics for Cardiac Regeneration after Myocardial Infarction

Vincent F.M. Segers and Richard T. Lee
Provasculon Inc, 14 Cambridge Center, and Harvard Stem Cell Institute and the Cardiovascular Division, Department of Medicine, Brigham and Women’s Hospital, Harvard Medical School, Cambridge, MA
J Cardiovasc Transl Res. 2010 October ; 3(5): 469–477.   http://dx.doi./10.1007/s12265-010-9207-5.

Although most medicines have historically been small molecules, many newly approved drugs are derived from proteins. Protein therapies have been developed for treatment of diseases in almost every organ system, including the heart. Great excitement has now arisen in the field of regenerative medicine, particularly for cardiac regeneration after myocardial infarction. Every year, millions of people suffer from acute myocardial infarction, but the adult mammalian myocardium has limited regeneration potential. Regeneration of the heart after myocardium infarction is therefore an exciting target for protein therapeutics.  

In this review, we discuss different classes of proteins that have therapeutic potential to regenerate the heart after myocardial infarction. Protein candidates have been described that induce angiogenesis, including fibroblast growth factors and vascular endothelial growth factors, although thus far clinical development has been disappointing. Chemotactic factors that attract stem cells, e.g. hepatocyte growth factor and stromal cell derived factor-1, may also be useful. Finally, neuregulins and periostin are proteins that induce cell cycle reentry of cardiomyocytes, and growth factors like IGF-1 can induce growth and differentiation of stem cells. As our knowledge of the biology of regenerative processes and the role of specific proteins in these processes increases, the use of proteins as regenerative drugs could develop as a cardiac therapy.
Keywords: protein therapeutics; myocardial infarction; regeneration; heart failure

The current standard of care for MI is early reperfusion of the occluded vessel with angioplasty or thrombolysis to reverse ischemia and increase the number of surviving myocytes. Efforts to decrease delays between onset of symptoms and reperfusion have resulted in decreased morbidity and mortality, but the maximal benefit of early reperfusion has reached a point close to practical limits. Besides early reperfusion therapy, ACE inhibitors and beta-blockers are used to prevent remodeling after MI and progression to heart failure. Both ACE inhibitors and beta-blockers improve long term survival but no therapies besides cardiac transplantation are currently available that restore cardiac function.
In the last decade, a large number of pre-clinical and clinical studies have been published on the potential use of stem cells for cardiac regeneration after MI. Different stem cell types have been shown to improve cardiac function in animal studies and can induce a small but potentially significant increase in ejection fraction in clinical studies. Stem cell therapy is a promising treatment option for heart failure, but numerous technical challenges and gaps in our understanding of stem cell behavior may limit translation to the clinic.
With the advent of biotechnology, protein and peptide drugs are becoming increasingly important in modern medicine. Drugs based on naturally-occurring proteins have the advantage of efficacy based on a mechanism of action refined by millions of years of biological evolution. Though promising as therapeutics, proteins might behave differently when used at pharmacological instead of physiological concentrations with an increase in adverse effects on other organs. Proteins used as therapeutics have been modified in different ways to limit immunogenicity and rapid degradation in plasma and tissues.
We discuss four different classes of proteins that could potentially benefit patients with MI (Figure 1); all of these proteins have been shown to improve cardiac function in animal models of MI or heart failure. They include angiogenic growth factors, proteins that increase recruitment of progenitor cells to the heart, proteins that induce mitosis of existing myocytes, and proteins that increase differentiation and growth of stem cells and myocytes. As more is learned about cardiac regeneration and why mammals lack sufficient myocardial regeneration, more proteins are likely to be added to this list of candidates.

A decade of extensive research on cardiac stem cell biology revealed 1 protein (G-CSF) that can be used to mobilize hematopoietic stem cells and just 2 proteins with chemotactic properties on stem cells: SDF-1 on endothelial progenitor cells and HGF on cardiac stem cells. Another protein that has been identified as a stem cell attractant is monocyte chemotactic protein-3 which attracts mesenchymal stem cells [42]. It is unknown if local administration of MCP-3 improves cardiac function. Identification of new stem cell chemotactic proteins is important because it could lead to the development of new and feasible therapeutics for treatment of MI and heart failure. At the same time, the true regenerative potential of most stem cells remains highly controversial; indicating that even if a chemotactic factor attracting stem cells to the heart is identified, formation of functional myocardial is still a challenging task.

Proteins like periostin and neuregulin which stimulate mitosis of surviving myocytes can partially restore the damage inflicted by MI. However, some requirements have to be met before this will result in a viable therapy. An inherent selectivity for myocytes would also allow for systemic delivery as opposed to the use of more complicated local delivery methods. An important factor to consider is the duration of the signal necessary to induce mitosis in a significant number of myocytes. A protein that induces cell cycle reentry in a significant fraction of myocytes with a single pulse has more therapeutical potential than a protein that needs sustained or repeated delivery. Ideally, pro-mitotic proteins will be not only specific for myocytes in general but might also be specific for myocytes in the border zone of the MI. This has drawbacks, among which is that formation of new myocytes, either by stem cell differentiation or by myocyte mitosis, carries an increased risk of ventricular arrhythmias.

Figure 1. Regeneration of the heart by 4 different classes of proteins

Figure 1. Regeneration of the heart by 4 different classes of proteins

See text for details. A) FGF and VEGF increase angiogenesis. B) G-CSF mobilizes bone marrow hematopoietic stem cells and SDF-1 attracts endothelial progenitor cells. HGF attracts cardiac stem cells. C) Neuregulin and periostin can induce division of adult cardiomyocytes. D) IGF-1 induces maturation and differentiation of cardiac stem cells.

Read Full Post »

Risks for Patients’ and Physician’s Health in the Cath Lab

Reporter and Curator: Aviva Lev-Ari, PhD, RN

On Thursday, June 27th, 2013, Bayer HealthCare, Nuance® Healthcare, and The Mount Sinai Hospital held a live webinar outlining how one of America’s leading Radiology Departments is pioneering the next generation of imaging informatics. If you were unable to watch it live, or would like to view it again, it is now available online here.
The Mount Sinai Hospital in New York has taken Contrast Dose Management and IT interoperability to a new level with two industry-leading forces – Bayer’s Certegra® Informatics Platform and Nuance’s PowerScribe® 360 | Reporting.
The FREE 60-minute webinar includes:
New Trends in Imaging Informatics & Dose Management
Emerging Contrast Dose Management Best Practices as a Standard of Care at The Mount Sinai Hospital
Experiences with Informatics including Point of Care Documentation, Injection Protocol Management for Patient-Based Dosing, Interfacing with IT Systems, and Analytics
Live Q&A panel: The Mount Sinai Hospital, Bayer and Nuance

Interfacing with the Future of Imaging:
THE MOUNT SINAI HOSPITAL’S EXPERIENCE
with Contrast Dose Management™
WEBINAR PLAYBACK


VIEW VIDEO

http://www.insite24.com/downstream/bayer%2Dcdm%2Dwebinar/


Risks for Physician’s Health in the Cath Lab

EuroIntervention. 2012 Jan;7(9):1081-6. doi: 10.4244/EIJV7I9A172.

Brain tumours among interventional cardiologists: a cause for alarm? Report of four new cases from two cities and a review of the literature.

Source

Interventional Cardiology, Rambam Medical Center, Bruce Rappaport Faculty of Medicine, the Technion, Israel Institute of Technology, Haifa, Israel. aroguin@technion.ac.il

Abstract

AIMS:

Interventional cardiologists who work in cardiac catheterisation laboratories are exposed to low doses of ionising radiation that could pose a health hazard. DNA damage is considered to be the main initiating event by which radiation damage to cells results in development of cancer.

METHODS AND RESULTS:

We report on four interventional cardiologists, all with brain malignancies in the left hemisphere. In a literature search, we found five additional cases and thus present data on six interventional cardiologist and three interventional radiologists who were diagnosed with brain tumours. All worked for prolonged periods with exposure to ionising radiation in the catheterisation laboratory.

CONCLUSIONS:

In interventional cardiologists and radiologists, the left side of the head is known to be more exposed to radiation than the right. A connection to occupational radiation exposure is biologically plausible, but risk assessment is difficult due to the small population of interventional cardiologists and the low incidence of these tumours. This may be a chance occurrence, but the cause may also be radiation exposure. Scientific study further delineating occupational risks is essential. Since interventional cardiologists have the highest radiation exposure among health professionals, major awareness of radiation safety and training in radiological protection are essential and imperative, and should be used in every procedure.

Risks for Patients’ Health in the Cath Lab

Contrast-Induced Nephropathy

  • Author: Renu Bansal, MD; Chief Editor: Vecihi Batuman, MD, FACP, FASN

SOURCE

http://emedicine.medscape.com/article/246751-medication#showall

Contrast-induced nephropathy (CIN) is defined as the impairment of renal function and is measured as either a 25% increase in serum creatinine (SCr) from baseline or 0.5 mg/dL (44 µmol/L) increase in absolute value, within 48-72 hours of intravenous contrast administration. (See Etiology.)

For renal insufficiency (RI) to be attributable to contrast administration, it should be acute, usually within 2-3 days, although it has been suggested that RI up to 7 days post–contrast administration be considered CIN; it should also not be attributable to any other identifiable cause of renal failure. A temporal link is thus implied.[1] Following contrast exposure, SCr levels peak between 2 and 5 days and usually return to normal in 14 days. (See Clinical and Workup.)

Complications

CIN is one of the leading causes of hospital-acquired acute renal failure. It is associated with a significantly higher risk of in-hospital and 1-year mortality, even in patients who do not need dialysis.

Nonrenal complications include procedural cardiac complications (eg, Q-wave MI, coronary artery bypass graft [CABG], hypotension, shock), vascular complications (eg, femoral bleeding, hematoma, pseudoaneurysm, stroke), and systemic complications (eg, acute respiratory distress syndrome [ARDS], pulmonary embolism).

There is a complicated relationship between CIN, comorbidity, and mortality. Most patients who develop CIN do not die from renal failure. Death, if it does occur, is more commonly from either a preexisting nonrenal complication or a procedural complication.

Concerns

Many physicians who refer patients for contrast procedures and some who perform the procedure themselves are not fully informed about the risk of CIN. A survey found that less than half of referring physicians were aware of potential risk factors, including diabetes mellitus. (See Differentials.)

CIN suffers from a lack of consensus regarding its definition and treatment. Studies differ in regard to the marker used for renal function (SCr vs eGFR), the day of initial measurement and remeasurement of the marker, and the percentage increase used to define CIN. This makes it difficult to compare studies, especially in terms of the efficacy of various treatment modalities. (See Treatment and Medication.)[2]

The reported incidence of CIN might be an underestimation. SCr levels normally rise by day 3 of contrast administration. Most patients do not remain hospitalized for so long and there is no specific protocol to order outpatient SCr levels 3-5 days after the procedure.

Other renal function markers

The use of SCr as a marker of renal function has its limitations. Indicators such as the estimated glomerular filtration rate (eGFR) and cystatin C are increasingly considered to be more reliable and accurate reflectors of existing renal function.[3, 4]

The eGFR can be calculated using the Modification of Diet in Renal Disease (MDRD) formula or the Cockroft-Gault formula. The Cockroft-Gault formula calculates eGFR using age, sex, and body weight, which are factors that, independent of GFR, influence SCr. The MDRD equation also includes blood urea nitrogen (BUN) and serum albumin.

The eGFR works best at low creatinine values. SCr and GFR share a curvilinear relationship. At lower SCr values, doubling SCr is associated with a corresponding 50% decrease in GFR. However, in elderly patients with chronic kidney disease(CKD) who have high SCr values at baseline, a 25% rise in SCr is actually indicative of a relatively modest reduction in GFR. Nonetheless, even a 25% increase in SCr in this situation has been shown to have great impact, especially in terms of inhospital and 1-year mortality.[5]

Serum cystatin C is a serum protein that is secreted by nucleated cells. It is freely filtered by the glomerulus and has been found to be an accurate marker of GFR. Compared with SCr, cystatin C changes much earlier after contrast administration and is not subject to confounding factors, such age, sex, and muscle mass, that influence SCr values independent of the underlying GFR. Cystatin C is increasingly being used as a marker of renal function in cardiac surgical patients.

Patient education

Patients with risk factors for CIN should be educated about the necessity of follow-up care with their physicians with a postprocedure SCr estimation, especially if the initial procedure was done on an outpatient basis.

Etiology

Contrast media (CM) act on distinct anatomic sites within the kidney and exert adverse effects via multiple mechanisms. They cause a direct cytotoxic effect on the renal proximal tubular cells, enhance cellular damage by reactive oxygen species, and increase resistance to renal blood flow. They also exacerbate renal vasoconstriction, particularly in the deeper portions of the outer medulla. This is especially important in patients with CKD, because their preexisting abnormal vascular pathobiology is made worse by the effects of CM.[6, 7]

Renal (particularly medullary) microcirculation depends on a complex interplay of neural, hormonal, paracrine and autocrine influences. Of note are the vasodilator nitric oxide (NO) and the vasoconstrictors vasopressin, adenosine (when it acts via the high affinity A1 receptors), angiotensin II, and endothelins. Prostaglandins cause a redistribution of blood flow to the juxtamedullary cortex and, therefore, are protective.

NO, in particular, seems to be very important, with antiplatelet, vasodilatory, insulin sensitizing, anti-inflammatory, and antioxidant properties. It has been suggested that plasma levels of asymmetrical dimethylarginine (ADMA), which is an endogenous inhibitor of all NO synthase isoforms, can be used as a marker of CIN, especially in patients with unfavorable outcomes.

CM-mediated vasoconstriction is the result of a direct action of CM on vascular smooth muscle and from metabolites such as adenosine and endothelin. Additionally, the osmotic property of CM, especially in the tubular lumen, decreases water reabsorption, leading to a buildup of interstitial pressure. This, along with the increased salt and water load to the distal tubules, reduces GFR and causes local compression of the vasa recta. All of this contributes to worsening medullary hypoxemia and renal vasoconstriction in patients who are already volume depleted.

Finally, CM also increase resistance to blood flow by increasing blood viscosity and by decreasing red cell deformability. This intravascular sludging generates local ischemia and causes activation of reactive oxygen species that result in tubular damage at a cellular level.

Comparison of contrast-agent nephropathy potential

The ability of different classes of CM to cause CIN is influenced by their osmolality, ionicity (the ability of the contrast media to dissociate in water), and molecular structure. Each of these characteristics, in turn, influences their behavior in body fluid and their potential to cause adverse effects. (See Table 1, below.)[8]

Agents are classified as high, low, or iso-osmolar, depending on their osmolality in relation to blood. Low-osmolarity contrast media (LOCM) is actually a misnomer, since these agents have osmolalities of 600-900 mOsm/kg and so are 2-3 times more hyperosmolar than blood. High-osmolarity contrast media (HOCM) are 5-7 times more hyperosmolar than blood, with osmolalities greater than 1500 mOsm/kg.

Molecular structure of CM refers to the number of benzene rings. Most CM that were developed in the 1990s are dimers with 2 benzene rings. Dimeric CM, while nonionic and with low osmolarity, have high viscosity, which may influence renal tubular blood flow.

The ratio of iodine to dissolved particles describes an important relationship between opacification and osmotoxicity of the contrast agent. The higher ratios are more desirable. High-osmolar agents have a ratio of 1.5, low-osmolar agents have a ratio of 3, and iso-osmolar agents have the highest ratio, 6.

While the safety of LOCM over HOCM in terms of CIN seems intuitive, clinical evidence of it came from a meta-analysis by Barrett and Carlisle.[9] They showed the benefit of using LOCM over HOCM mostly in high-risk patients. The Iohexol Cooperative Study was a large, prospective, randomized, double-blinded, multicenter trial that compared the risk of developing CIN in patients receiving the low-osmolarity agent iohexol versus the high-osmolarity agent diatrizoate. While the HOCM group was 3.3 times more likely to develop CIN compared with the LOCM group, this was seen only in patients with preexisting CKD (baseline SCr greater than or equal to 1.5 mg/dL). In addition to CKD; diabetes mellitus, male sex, and contrast volume were found to be independent risk factors.

Even within the LOCM category, the risk is not the same for all agents. High-risk patients receiving iohexol have a higher likelihood of developing CIN than do patients receiving another agent (ie, iopamidol) in the same class.

When LOCM were compared with iso-osmolar contrast media (IOCM), the Nephrotoxicity in High-Risk Patients Study of Iso-Osmolar and Low-Osmolar Non-Ionic Contrast Media (NEPHRIC study), arguably the most definitive study in this category to date, found that the odds of developing CIN in high-risk patients were almost 9 times greater for the study’s iohexol group than for the investigation’s iodixanol group (iso-osmolar contrast agent). The incidence of CIN was 3% in the iodixanol group versus 26% in the iohexol group.[10] These results, though promising, were not duplicated in some subsequent studies.

When iodixanol was used, the Rapid Protocol for the Prevention of Contrast-Induced Renal Dysfunction (RAPPID) trial found a 21% incidence of CIN,[11] and the Contrast Media and Nephrotoxicity Following Coronary Revascularization by Angioplasty (CONTRAST) trial found a 33% incidence of CIN.[12] Finally, the Renal Toxicity Evaluation and Comparison Between Visipaque (Iodixanol) and Hexabrix (Ioxaglate) in Patients With Renal Insufficiency Undergoing Coronary Angiography (RECOVER) trial compared the iso-osmolar contrast medium iodixanol to the low-osmolarity agent ioxaglate and found a significantly lower incidence of CIN with iodixanol than with ioxaglate (7.9% vs 17%, respectively).[13]

Thus, although the data are by no means uniform, they seem to suggest that the iso-osmolar contrast agent iodixanol may be associated with smaller increases in SCr and lower rates of CIN when compared with low-osmolar agents, especially in patients with CKD and in those with CKD and diabetes mellitus.[14]

Risk factors

Risk factors for CIN can be divided into patient-related, procedure-related, and contrast-related factors (although the risk factors for CIN are still being identified and remain poorly understood). Patient-related risk factors are as follows:

  • Age
  • CKD
  • Diabetes mellitus
  • Hypertension
  • Metabolic syndrome
  • Anemia
  • Multiple myeloma
  • Hypoalbuminemia
  • Renal transplant
  • Hypovolemia and decreased effective circulating volumes – As evidenced by congestive heart failure (CHF), an ejection fraction (EF) of less than 40%, hypotension, and intra-aortic balloon counterpulsation (IABP) use

Procedure-related risk factors are as follows:

  • Urgent versus elective
  • Arterial versus venous
  • Diagnostic versus therapeutic

Contrast-related risk factors are as follows:

  • Volume of contrast
  • Contrast characteristics, including osmolarity, ionicity, molecular structure, and viscosity

The single most important patient-related risk factor is preexisting CKD, even more so than diabetes mellitus.[15] Patients with CKD in the setting of diabetes mellitus have a 4-fold increase in the risk of CIN compared with patients without diabetes mellitus or preexisting CKD.

Table: Physiochemical Properties of Contrast Media

Although the data is by no means uniform, they seem to suggest that the iso-osmolar contrast agent iodixanol may be associated with smaller increases in SCr and lower rates of CIN when compared with low-osmolar agents, especially in patients with CKD and in those with CKD and diabetes mellitus.[14] Guidelines from the American Heart Association (AHA)/American College of Cardiology (ACC) for the management of acute coronary syndromes patients with CKD recommend the use of IOCM (Class I, level of Evidence).

Table 1. Physiochemical Properties of Contrast Media[16] (Open Table in a new window)

Class of Contrast Agent Type of Contrast Agent Iodine Dose(mg/mL) Iodine/Particle Ratio Viscosity(cPs at 37°C) Osmolality(mOsm/kg H2 O) Molecular Weight (Da)
High-osmolar monomers(ionic) Diatrizoate (Renografin)Ioxithalamate (Telebrix) 370350 1.51.5 2.32.5 18702130 636643
Low-osmolar dimers(ionic) Ioxaglate (Hexabrix) 320 3 7.5 600 1270
Low-osmolar monomers(nonionic) Iohexol (Omnipaque)Iopamidol (Isovue)Iomeprol (Iomeron)

Ioversol (Optiray)

Iopromide (Ultravist)

Iopentol (Imagopaque)

350370400

350

370

350

333

3

3

3

10.49.412.6

9

10

12

780790620

790

770

810

821777778

807

791

835

Iso-osmolar dimers(nonionic) Iodixanol (Visipaque)Iotrolan (Isovist) 320320 66 11.88.5 290290 15501620

Epidemiology

Occurrence in the United States

CIN is the third leading cause of hospital-acquired renal failure. Decreased renal perfusion and surgery (or in some studies, nephrotoxic medications) are the number one and number two causes, respectively.

An analysis of 15 prospective and retrospective studies from 1976-1996 report an incidence of CIN of 3.1-31%. The number varies depending on the definition used for CIN; the contrast agent characteristics, including the type, amount, duration, and route of administration; preexisting risk factors; and length of follow-up (including the day of measurement of postcontrast serum creatinine).

In patients without risk factors, the incidence may be as low as 2%. With the introduction of risk factors, like diabetes, the number rises to 9%, with incidences being as high as 90% in diabetics with CKD. Therefore, the number and the type of preexisting risk factors directly influence the incidence of renal insufficiency. It is also procedure dependant, with 14.5% overall in patients undergoing coronary interventions compared to 1.6-2.3% for diagnostic intervention, as reported in literature.[17]

Race- and age-related demographics

While African Americans with diabetic nephropathy have a faster acceleration of end-stage renal disease (ESRD), independent of other variables, race has not been found to be a risk factor for CIN.

The incidence of CIN in patients older than age 60 years has been variously reported as 8-16%. It has also been shown that in patients with acute MI who have undergone coronary intervention, an age of 75 years or older is an independent risk factor for CIN.

Prognosis

CIN is normally a transient process, with renal functions reverting to normal within 7-14 days of contrast administration. Less than one-third patients develop some degree of residual renal impairment.

Dialysis is required in less than 1% of patients, with a slightly higher incidence in patients with underlying renal impairment (3.1%) and in those undergoing primary PCI for myocardial infarction (MI) (3%). However, in patients with diabetes and severe renal failure, the rate of dialysis can be as high as 12%.

Of the patients who need dialysis, 18% end up on permanent dialysis therapy. However, many of these patients will have had advanced renal insufficiency and concomitant diabetic nephropathy and will have been destined for dialysis regardless of the episode of CIN.

A growing body of knowledge indicates that acute kidney injury after contrast medium can be a harbinger of CKD or ESRD. In one observational study, the population studied appeared representative of the general population undergoing angiography and the rate of acute kidney ingury was consonant with other studies. The finding that persistent kidney damage can occur after contrast-induced acute kidney injury highlights the potential for acceleration of the progression of kidney injury in individuals with pre-existing CKD.[18]

Mortality

Patients who require dialysis have a considerably worse mortality rate, with reported rates of 35.7% inhospital mortality (compared with 7.1% in the nondialysis group) and a 2-year survival rate of only 19%.

CIN by itself may be an independent mortality risk factor. Following invasive cardiology procedures, patients with normal baseline renal function who develop CIN have reduced survival compared with patients with baseline chronic CKD who do not develop CIN.

Gadolinium-based agents

Gadolinium-based CM (used for magnetic resonance imaging [MRI]), when compared with iodine-based CM, have a similar, if not worse, adverse effect profile in patients with moderate CKD and eGFR of less than 30 mL/min. Their use has been implicated in the development of nephrogenic systemic fibrosis, a chronic debilitating condition with no cure.

A review of 3 series and 4 case reports suggested that the risk of renal insufficiency with gadolinium is similar to that of iodinated radiocontrast dye. The reported incidence varies from 4% in stage 3 CKD to 20% in stage 4 CKD. It may even be worse, as suggested by some investigators. A prospective study of 57 patients found that acute renal failure was seen in 28% of patients in the gadolinium group, compared with 6.5% of patients in the iodine group, despite prophylactic saline and N-acetylcysteine (NAC).

The risk factor profile is similar to that for iodinated CM; increased incidence of acute renal failure is seen in older patients and in those with lower baseline creatinine clearance, diabetic nephropathy, anemia, and hypoalbuminemia.

Risk stratification scoring systems

CIN is the result of a complex interplay of many of the above risk factors. The presence of 2 or more risk factors is additive, and the likelihood of CIN rises sharply as the number of risk factors increases. Researchers have tried to objectively quantify and predict the contribution of each risk factor to the ultimate outcome of CIN.

Risk stratification scoring systems have been devised to calculate an individual patient’s risk of developing CIN. This has mostly been done in patients undergoing percutaneous coronary intervention (PCI), especially those with preexisting risk factors. Mehran et al developed the following scoring system based on points awarded to each of 7 multivariate predictors[19] :

  • Hypotension = 5 points
  • IABP use = 5 points
  • CHF = 5 points
  • SCr of greater than 1.5 mg/dL = 4 points
  • Age greater than 75 years = 4 points
  • Anemia = 3 points
  • Diabetes mellitus = 3 points
  • Contrast volume = 1 point for each 100 cc used

Based on the total calculated score, patients were divided into low-risk (score of less than or equal to 5), moderate-risk (score of 6-10), high-risk (score of 11-15), and very–high-risk (score of greater than or equal to 16) categories. The rate of CIN and the requirement for dialysis were 7.5 and 0.04%, 14 and 0.12%, 26.1 and 1.09%, and 57.3 and 12.6%, respectively, for each of the 4 groups.

Bartholomew et al worked to create another scoring system and took into consideration 8 variables, including creatinine clearance of less than 60 mL/min, IABP use, urgent coronary procedure, diabetes mellitus, CHF, hypertension, peripheral vascular disease (PVD), and volume of contrast used.[20]

History and Physical Examination

History

Patients usually present with a history of contrast administration 24-48 hours prior to presentation, having undergone a diagnostic or therapeutic procedure (eg, PCI). The renal failure is usually nonoliguric.

Physical examination

A physical examination is useful for ruling out other causes of acute nephropathy, such as cholesterol emboli (eg, blue toe, livedo reticularis) or drug-induced interstitial nephritis (eg, rash). Patients may have evidence of volume depletion or may be in decompensated CHF.

Diagnostic Considerations

Conditions to consider in the differential diagnosis of CIN include the following:

  • Atheroembolic renal failure – More than 1 week after contrast, blue toes, livedo reticularis, transient eosinophilia, prolonged course, and lower recovery
  • Acute renal failure (includes prerenal and postrenal azotemia) – There may also be associated dehydration from aggressive diuresis, exacerbated by preexisting fluid depletion; the acute renal failure is usually oliguric, and recovery is anticipated in 2-3 weeks
  • Acute interstitial nephritis (triad of fever, skin rash, and eosinophilia) – Also eosinophiluria; the nephritis is usually from drugs such as penicillin, cephalosporins, and nonsteroidal anti-inflammatory drugs (NSAIDs)
  • Acute tubular necrosis – Ischemia from prerenal causes; endogenous toxins, such as hemoglobin, myoglobin, and light chains; exogenous toxins, such as antibiotics, chemotherapeutic agents, organic solvents, and heavy metals

Approach Considerations

SCr concentration usually begins to increase within 24 hours after contrast agent administration, peaks between days 3 and 5, and returns to baseline in 7-10 days. Serum cystatin C (which has been suggested as a surrogate marker of renal function in lieu of SCr) is increased in patients with CIN.

Nonspecific formed elements can appear in the urine, including renal tubular epithelial cells, pigmented granular casts, urate crystals, and debris. However, these urine findings do not correlate with severity.

Urine osmolality tends to be less than 350 mOsm/kg. The fractional excretion of sodium (FENa) may vary widely. In the minority of patients with oliguric CIN, the FENa is low in the early stages, despite no clinical evidence of volume depletion.

Histology

CM cause direct toxic effects on renal tubular epithelial cells, characterized by cell vacuolization, interstitial inflammation, and cellular necrosis. In a study, these characteristic changes, called osmotic nephrosis, were observed in 22.3% of patients undergoing renal biopsy, within 10 days of contrast exposure.[21]

Approach Considerations

Hydration therapy is the cornerstone of CIN prevention. Renal perfusion is decreased for up to 20 hours following contrast administration. Intravascular volume expansion maintains renal blood flow, preserves nitric oxide production, prevents medullary hypoxemia, and enhances contrast elimination.

However, a number of other CIN therapies have been investigated, including the use of statins, bicarbonate, N-acetylcysteine (NAC), ascorbic acid, the adenosine antagonists theophylline and aminophylline, vasodilators, forced diuresis, and renal replacement therapy. Patients with CIN should be managed in consultation with a nephrologist.

Hydration Therapy

The first study revealing the benefit of hydration in CIN prevention came from Solomon et al.[22] They also found forced diuresis to be inferior to hydration with 0.45% saline. Fluids with different compositions and tonicity have since been studied, including bicarbonate and mannitol.

Normal saline has been found to be superior to half-normal saline in terms of its enhanced ability in intravascular volume expansion. It also causes increased delivery of sodium to the distal nephron, prevents rennin-angiotensin activation, and thus maintains increased renal blood flow. In terms of route of administration, oral fluids, while beneficial, are not as effective as intravenous hydration.[23, 24]

The CIN Consensus Working Panel found that adequate intravenous volume expansion with isotonic crystalloids (1-1.5 mL/kg/h), 3-12 hours before the procedure and continued for 6-24 hours afterward, decreases the incidence of CIN in patients at risk. The panel studied 6 clinical trials with different protocols for volume expansion. The studies differed in the type of fluid used for hydration (isotonic vs half-normal saline), route, duration, timing, and amount of fluid used.[25]

For hospitalized patients, volume expansion should begin 6 hours prior to the procedure and be continued for 6-24 hours postprocedure. For outpatients, administration of fluids can be initiated 3 hours before and continued for 12 hours after the procedure. Postprocedure volume expansion is more important than preprocedure hydration. It has been suggested that a urine output of 150 mL/h should guide the rate of intravenous fluid replacement, although the CIN Consensus Working Panel did not find it useful to recommend a target urine output.

CHF poses a particular challenge. Patients with compensated CHF should still be given volume, albeit at lower rates. Uncompensated CHF patients should undergo hemodynamic monitoring, if possible, and diuretics should be continued. In emergency situations, one’s clinical judgment should be used, and, in the absence of any baseline renal function, adequate postprocedure hydration should be carried out.

What is interesting, however, is that, while hydration remains the cornerstone for CIN prevention, a randomized, controlled trial comparing a strategy of volume expansion with no volume expansion has not been performed to date.

Statins

Statins are widely used in coronary artery disease (CAD) for their pleiotropic effects (favorable effects on endothelin and thrombus formation, plaque stabilization, and anti-inflammatory properties), and it was believed that, given the vascular nature of CIN, they might have similar renoprotective effects. The data for statin use, however, are retrospective and anecdotal; they are taken mostly from patients already on statins who underwent PCI.[26]

A significantly lower incidence of CIN was found in patients treated with statins preoperatively (CIN incidence of 4.37% in the statin group vs 5.93% in the nonstatin group). However, prospective trials looking at statin use in patients undergoing noncardiac procedures are needed to better qualify this initial promise.

Bicarbonate Therapy

Bicarbonate therapy alkalinizes the renal tubular fluid and, thus, prevents free radical injury. Hydrogen peroxide and an oxygen ion (from superoxide) react to form a hydroxide ion, all agents of free radical injury. This reaction, called the Harber-Weiss reaction, is activated in an acidic environment. Bicarbonate, by alkalinizing the environment, slows down the reaction. It also scavenges reactive oxygen species (ROS) from NO, such as peroxynitrite.

Bicarbonate protocols most often include infusion of sodium bicarbonate at the rate of 3 mL/kg/hour an hour before the procedure, continued at 1 mL/kg/hour for 6 hours after. Some investigators have used 1 mL/kg/hour for 24 hours, starting 12 hours before the procedure. The exact duration, however, remains a matter of debate. Hydration with sodium bicarbonate has been found by some researchers to be more protective than normal saline alone.

Treatment controversy

A 2008 retrospective cohort study at the Mayo Clinic assessed the risk of CIN associated with the use of sodium bicarbonate, NAC, and the combination of sodium bicarbonate with NAC and found that, compared with no treatment, sodium bicarbonate used alone was associated with an increased risk of CIN. NAC alone or in combination with sodium bicarbonate did not significantly affect the incidence of CIN. The results were obtained after adjusting for confounding factors, including total volume of hydration, medications, baseline creatinine, and contrast iodine load.[27] Given the above new information, it is recommended that the use of sodium bicarbonate to prevent CIN should be further evaluated.

N-acetylcysteine

NAC is acetylated L-cysteine, an amino acid. Its sulfhydryl groups make it an excellent antioxidant and scavenger of free oxygen radicals. It also enhances the vasodilatory properties of nitric oxide. Twelve meta-analyses covering 29 randomized, controlled trials have been published on the effect of NAC therapy in CIN. They all suffer from significant heterogeneity. The standard oral NAC regimen consists of 600 mg twice daily for 24 hours before and on the day of the procedure. Higher doses of 1 g, 1200 mg, and 1500 mg twice daily have also been studied, with no significant dose-related or route-related (oral vs intravenous) difference. NAC has very low oral bioavailability; substantial interpatient variability and inconsistency between the available oral products obscure the picture further.[3, 24, 28]

Treatment controversy

The latest controversy relating to NAC therapy questioned the parameter on which its effectiveness was based. It was suggested that the beneficial effect of NAC in CIN is related to its SCr-lowering ability rather than to improved GFR. It was believed that NAC directly reduces SCr by increasing SCr’s excretion (tubular secretion), decreasing its production (augments activity of creatine kinase), or interfering with its laboratory measurement, enzymatic or nonenzymatic (Jaffe method).

This was supported by a study that demonstrated a significant decrease in SCr after 4 doses of 600 mg of oral NAC in healthy volunteers with normal kidney function and no exposure to radiocontrast media.[29] This would bring doubt into the results of at least 13 randomized, controlled trials that showed NAC to be protective in CIN, with SCr used as the endpoint. However, Haase et al compared the effect of NAC on SCr by simultaneously studying its effect on cystatin C and found that NAC did not artifactually lower SCr when measured by the Jaffe method.[30]

The CIN Working Panel concluded that the existing data on NAC therapy in CIN is sufficiently varied to preclude a definite recommendation.[25] In the practice of medicine, though, it remains part of the standard of care and is routinely administered because of its low cost, lack of adverse effects, and potential beneficial effect, as demonstrated by the relative risk reduction of CIN, ranging from 0.37-0.73, as reported in several meta-analyses.

Renal Replacement Therapy

Less than 1% of patients with CIN ultimately go on to require dialysis, the number being slightly higher in patients with underlying renal impairment (3.1%) and in those undergoing primary PCI for MI (3%). However, in patients with diabetes and severe renal failure, the rate of dialysis can be as high as 12%. Patients who get dialyzed do considerably worse, with inhospital mortality rates of 35.7% (compared with 7.1% in the nondialysis group) and a 2-year survival rate of only 19%.

CM have molecular weights that range between 650 and 1600 mOsm/kg. They have low lipophilicity, low plasma protein binding, and minimal biotransformation. They quickly equilibrate across capillary membranes and have volumes of distribution equivalent to that of the extracellular fluid volume. In patients with normal renal function, CM are excreted with the first glomerular passage and the decrease in their plasma concentration follows a 2-part exponential function, a distribution phase and an elimination phase. However, in patients with renal impairment, the renal clearance values are reduced. For example, 50% of the low-osmolarity contrast agent iomeprol is eliminated within 2 hours in healthy subjects, compared with 16-84 hours in patients with severe renal impairment.

In patients already on dialysis, the commonly sited issues with contrast administration include volume load and direct toxicity of contrast to the remaining nonfunctional nephrons and nonrenal tissues. Thus, the perceived need for emergent dialysis and contrast removal.

Rodby attempted to address these concerns, calculating that the administration of 100 mL of hyperosmolar contrast would move 265 mL of water from the intracellular to the extracellular compartment, resulting in an increase in extracellular volume by 365 mL. The increase in intravascular space would therefore be only a third, or 120 mL. Fluid shifts with LOCM are even less. He also found that extrarenal toxicity of CM was cited in mostly single case reports, and no objective evidence could be identified in 3 prospective studies.[31]

The risk of acute damage from contrast is therefore greatest in patients with CKD. This can be explained by the increase in single nephron GFR and, thus, the filtered load of contrast per nephron. This is akin to a double hit to the remaining nephrons; increased contrast load and prolonged tubular exposure. While this may not seem to be a concern in patients with ESRD who are already on dialysis, residual renal function, in fact, plays a big role in their outcome, more so in patients on peritoneal dialysis. Its preservation is therefore important.[31]

CM can be effectively and efficiently removed by hemodialysis (HD). Factors that influence CM removal include blood flow, membrane surface area, molecular size, transmembrane pressure, and dialysis time. High-flux dialysis membranes with blood flows of between 120-200 mL/min can remove almost 50% of iodinated CM within an hour and 80% in 4 hours. Even in patients with CKD, in whom contrast excretion is delayed, it was found that 70-80% of contrast can be removed by a 4-hour HD treatment. In view of the limited benefit of therapies such as hydration, bicarbonate and NAC, dialysis may seem like the definitive answer.

However, an excellent meta-analysis by Cruz et al—8 trials (6 randomized and 2 nonrandomized, controlled studies) were included in the analysis, with a pooled sample size of 412 patients—indicated that periprocedural extracorporeal blood purification (ECBP) does not significantly reduce the incidence of CIN in comparison with standard medical therapy. ECBP in the study consisted of HD (6 trials), continuous venovenous hemofiltration (1 trial), and continuous venovenous hemodiafiltration (1 trial).[32]

Cruz et al found that the incidence of CIN in the standard medical therapy group was 35.2%, compared with 27.8% in the ECBP group. Renal death (combined endpoint of death or dialysis dependence) was 12.5% in the standard medical therapy group, compared with 7.9% in the ECBP group.

An important consideration is the role of ECBP therapy in patients with severe renal impairment (ie, stage 5 CKD) not yet on maintenance dialysis. A study by Lee et al indicated that in patients with chronic renal failure who are undergoing coronary angiography, prophylactic HD can improve renal outcome. The study included 82 patients with stage 5 CKD who were not on dialysis and who were referred for coronary angiography.[33] The patients were randomly assigned to either undergo prophylactic HD (initiated within 81 ± 32 min) or to receive intravenous normal saline (control group).

The baseline creatinine of the dialysis group was 13.2 mL/min/1.73 m2, comparable to that of the control group (12.6 mL/min/1.73 m2). The investigators’ primary endpoint was change in creatinine clearance in the 2 groups on day 4, which was found to be statistically significant (0.4 ± 0.9 mL/min/1.73 m2 in the dialysis group vs 2.2 ± 2.8 mL/min/1.73 m2 in the control group).

Lee et al found that 35% of the control group required temporary renal replacement therapy, compared with 2% of the dialysis group. In addition, long-term, postdischarge dialysis was required in 13% of the control patients but in none of the dialysis patients. Among those patients who did not require chronic dialysis, an increase in SCr at discharge of over 1 mg/dL from baseline was found in 13 patients in the control group and in 2 patients in the dialysis group.

The study, though hopeful, does raise some concerns. While the change in creatinine clearance on day 4 from baseline was statistically significant, the day 4 creatinine clearance itself was not significantly different between the 2 groups. Also, the results were not expressed as CIN incidence. This patient population is very fragile and is already on the verge of dialysis. How much time off dialysis a single HD session was able to buy these patients was not discussed. The duration of follow-up was also not clear.

Marenzi et al found better outcomes in patients who received venovenous hemofiltration both pre- and post-CM administration than in patients who received post-CM hemofiltration or no hemofiltration at all. These outcomes included a lower likelihood of CIN, no need for HD, and no 1-year mortality, in the pre-/post-CM group.[34]

The biggest confounder in studies of continuous renal replacement therapy (CRRT) is that the outcome measure (SCr) is affected by the treatment itself. While the advantage of CRRT is the lack of delay in its institution, contrast clearance rates would be 1 L/h (16.6 mL/min provided a maximal sieving coefficient for contrast across the hemofiltration membrane of 1), substantially less than standard HD.

Furthermore, continuous venovenous hemofiltration is expensive, highly invasive, and requires trained personnel; the procedure itself needs to be performed in the intensive care unit (ICU). In the face of equivocal benefit of a highly invasive and expensive procedure, the role of continuous venovenous hemofiltration has yet to be accepted as a prophylactic treatment for avoiding CIN.

Dialysis immediately after contrast administration has been suggested for patients already on long-term HD and for those at very high risk of CIN. Three studies looked at its necessity and found that LOCM can be given safely to patients with ESRD who are being maintained on HD without the added expense or inconvenience of emergent postprocedural HD.

The only condition in which HD might be argued to have a beneficial role is in patients on peritoneal dialysis who rely on their residual renal function. In this setting, HD performed soon after CM administration may provide enhanced removal and therefore protect residual renal function. It should be noted, however, that these patients on peritoneal dialysis would therefore need an additional HD procedure with concomitant vascular access, as the clearance with peritoneal dialysis would be far too slow to offer any protection.

In a study to determine if renal replacement therapy in concert with contrast administration helps, Frank et al found that although the overall clearance of contrast was significantly increased by dialysis, the peak plasma concentration of iomeprol 15 minutes after contrast administration was not significantly changed by simultaneous dialysis. In their report, the investigators prospectively studied 17 patients with chronic renal insufficiency (SCr >3 mg/dL), dialysis independent, who were then randomized to receive high-flux HD over 6 hours simultaneously with contrast administration, and[35]

In the study, Frank et al also found that to be clinically effective, simultaneous dialysis should reduce the risk of developing ESRD by 50%. If type 1 and type 2 errors are set at 0.01, the result could be accepted only if none of the 48 sequential patients with simultaneous dialysis required dialysis during the 8 weeks after contrast exposure. To reject the hypothesis, 239 sequential patients with simultaneous dialysis would have to be included. Therefore, most CIN studies, are seriously underpowered.

Studies of HD for CIN vary with respect to the definition of CIN used, the patient population, the type and volume of CM, how long after CM administration HD is started, and, finally, the dialysis treatment modality itself. While existing studies do not show HD to be superior to hydration alone for CIN prevention, if HD is used in conjunction with hydration and CIN protective therapy, such as NAC and bicarbonate, it might prove to be efficacious in some high-risk patients. However, most studies have had only an 8-week follow-up period. While the initiation of long-term dialysis was 5-15%, the progression to uremia over a long-term follow-up period is still unanswered.[16]

Other Therapies

Ascorbic acid, which has antioxidant properties, was studied for its ability to counter the effect of free radicals and reactive oxygen species. One study found that oral ascorbic acid administered in a 3-g dose preprocedure and two 2-g doses postprocedure was associated with a 62% risk reduction in CIN incidence.[36]

Theophylline and aminophylline are adenosine antagonists that counteract the intrarenal vasoconstrictor and tubuloglomerular feedback effects of adenosine. They have been found to have a statistically significant effect in preventing CIN in high-risk patients. However, their use is limited by their narrow therapeutic window and adverse effects profile.

Vasodilators, such as calcium channel blockers, dopamine/fenoldopam, atrial natriuretic peptide, and L-arginine, all with different mechanisms of action, have a favorable effect on renal hemodynamics. However, their use for CIN prevention has not been borne out by most controlled trials, and they are not routinely recommended at this point.

Forced diuresis with furosemide and mannitol was studied in the hope that this procedure would dilute CM within the tubular lumen and enhance their excretion. Furosemide and mannitol in fact worsen CIN by causing dehydration in patients who may already have intravascular volume depletion. Their use at this time is discouraged.

Deterrence and Prevention

The best therapy for CIN is prevention. Physicians need to be increasingly aware that CIN is a common and potentially serious complication. Patients at risk should be identified early, especially those with CKD (ie, eGFR < 60 mL/min/1.73 m2). A detailed history inquiring for risk factors, especially diabetes mellitus, should be ascertained.

In patients with risk factors for CIN, the possibility of alternative imaging studies that do not need contrast should be explored. MRI with gadolinium is no longer considered a safe alternative to contrast because of the risk of nephrogenic systemic fibrosis, an irreversible, debilitating condition seen mostly in patients with an eGFR of less than 30 mL/min/1.73 m2.

In patients with a moderate to severe risk of CIN, creatinine clearance rates or eGFR should be estimated by either the MDRD formula or the Cockroft-Gault formula and then measured again 24-48 hours after contrast administration.

In the emergency setting, where the benefit of very early imaging studies outweighs that of waiting, the imaging procedure can be carried out without an initial estimation of SCr or eGFR.

Intra-arterial administration of iodinated CM poses a greater risk for CIN than does the intravenous approach. For patients at an increased risk for CIN receiving intra-arterial contrast, nonionic iso-osmolar agents (iodixanol) are associated with the lowest risk of CIN.

The amount of contrast used during the procedure should be limited to as little as possible and kept under 100 mL. Most investigators have found this to be the cut-off value below which no patient needed dialysis. The risk of CIN increases by 12% for each 100 mL of contrast used beyond the first 100 mL. Most angiographic diagnostic studies usually require 100 mL of contrast, compared with 200-250 mL for angioplasty. The maximum amount of contrast that can be used safely should be individualized, taking into account the preexisting renal function.

Various formulas for calculating the maximal safe CM dose have been suggested. Two most often cited are those suggested by Cigarroa et al and the European Society of Urogenital Radiology (ESUR).[37, 38] Cigarroa et al, in a retrospective study of 115 patients undergoing cardiac catheterization and angiography, using the HOCM diatrizoate, suggested that the dose of CM should not exceed 5 mL/kg of body weight (maximum 300 mL divided by SCr [mg/dL]). The ESUR, in turn, has published maximal LOCM volumes for various SCr cut-off values.

While the formulas from Cigarroa and the ESUR take into account the SCr, it has been suggested that the eGFR (a more accurate predictor of renal function) and the iodine dose of CM should be reflected in any estimates or predictions of safe CM dosages. There exists, however, no unimpeachably safe CM dose algorithm for CIN prevention.

The length of time between 2 contrast procedures should be at least 48-72 hours. Rapid repetition of contrast administration has been found to be a univariate risk factor for CIN.

Potentially nephrotoxic drugs (eg, NSAIDs, aminoglycosides, amphotericin B, cyclosporin, tacrolimus) should be withdrawn at least 24 hours prior, in patients at risk (eGFR < 60 mL/min).

Metformin, though not nephrotoxic, should be used prudently, because if renal failure does occur, there is risk of concomitant lactic acidosis. Therefore, metformin should be stopped at the time of the procedure and resumed 48 hours later if renal function remains normal.

Angiotensin-converting enzyme (ACE) inhibitors and angiotensin receptor blockers (ARBs) cause a 10-15% rise in SCr by reducing intraglomerular pressure. While they should not be started at this time, whether they should be discontinued remains a matter of debate. Much of the literature in this area is unclear and controversial.

Minimizing contrast administration

The amount of contrast used during the procedure should be limited to as little as possible and kept under 100 mL. Most investigators have found this to be the cut-off value below which no patient needed dialysis. The risk of CIN increases by 12% for each 100 mL of contrast used beyond the first 100 mL. Most angiographic diagnostic studies usually require 100 mL of contrast, compared with 200-250 mL for angioplasty. The maximum amount of contrast that can be used safely should be individualized, taking into account the preexisting renal function.

Various formulas for calculating the maximal safe CM dose have been suggested. Two most often cited are those suggested by Cigarroa et al and the European Society of Urogenital Radiology (ESUR).[37, 38] Cigarroa et al, in a retrospective study of 115 patients undergoing cardiac catheterization and angiography, using the HOCM diatrizoate, suggested that the dose of CM should not exceed 5 mL/kg of body weight (maximum 300 mL divided by SCr [mg/dL]). The ESUR, in turn, has published maximal LOCM volumes for various SCr cut-off values.

While the formulas from Cigarroa and the ESUR take into account the SCr, it has been suggested that the eGFR (a more accurate predictor of renal function) and the iodine dose of CM should be reflected in any estimates or predictions of safe CM dosages. There exists, however, no unimpeachably safe CM dose algorithm for CIN prevention.

RAAS blockade

A prospective, 50-month Mayo study found renin-angiotensin-aldosterone system (RAAS) blockade, particularly in older patients with CHD, exacerbates CIN (43% incidence of dialysis and 29% progression to ESRD).[39] The marker used for renal function was eGFR, as calculated by the MDRD formula. The study recommended that RAAS blockade be withheld 48 hours prior to contrast exposure.

RAAS blockage, however, can improve renal perfusion and decrease proximal tubular reabsorption, including CM absorption by the tubular cells. This effect can be documented with the increase in the fractional excretion of urea seen with low-dose RAAS therapy in patients with CHF and moderate CKD (the majority of the CIN-susceptible population).[40] In this group, reduction in intraglomerular pressure and filtration fraction from RAAS therapy might decrease tubular CM concentration and therefore lessen its adverse effects.

Medication Summary

NAC is acetylated L-cysteine, an amino acid. As previously mentioned, its sulfhydryl groups make it an excellent antioxidant and scavenger of free oxygen radicals. It also enhances the vasodilatory properties of nitric oxide. Twelve meta-analyses covering 29 randomized, controlled trials have been published on the effect of NAC therapy in CIN. They all suffer from significant heterogeneity. The standard oral NAC regimen consists of 600 mg twice daily for 24 hours before and on the day of the procedure. Higher doses of 1 g, 1200 mg, and 1500 mg twice daily have also been studied, with no significant dose-related or route-related (oral vs intravenous) difference. NAC has very low oral bioavailability; substantial interpatient variability and inconsistency between the available oral products obscure the picture further.[24, 28]

Antidote, Acetaminophen

Class Summary

Used for prevention of contrast toxicity.

N-acetylcysteine (Acetadote)

Used for prevention of contrast toxicity in susceptible individuals such as those with diabetes mellitus. May provide substrate for conjugation with toxic metabolites.

Antilipemic Agents

Class Summary

These agents are used for their favorable effects on endothelin and thrombus formation, plaque stabilization and anti-inflammatory properties by improving lipid profile.

Simvastatin (Zocor)

Indicated for hyperlipoproteinemia (Type III). Inhibit 3-hydroxy-3-methylglutaryl coenzyme A (HMG-CoA reductase), which in turn inhibit cholesterol synthesis, and increases cholesterol metabolism. Increase HDL cholesterol and decrease LDL-C, total-C, apolipoprotein B, VLDL cholesterol, and plasma triglycerides.

Atorvastatin (Lipitor)

The most efficacious of the statins at high doses. Inhibits 3-hydroxy-3-methylglutaryl coenzyme A (HMG-CoA reductase), which in turn inhibits cholesterol synthesis and increases cholesterol metabolism. Reports have shown as much as a 60% reduction in LDL-C. The Atorvastatin versus Revascularization Treatment study (AVERT) compared 80 mg atorvastatin daily to standard therapy and angioplasty in patients with CHD. While events at 18 mo were the same between both groups, the length of time until the first CHD event occurred was longer with aggressive LDL-C lowering. The half-life of atorvastatin and its active metabolites is longer than that of all the other statins (ie, approximately 48 h compared to 3-4 h).

May modestly elevate HDL-C levels. Clinically, reduced levels of circulating total cholesterol, LDL-C, and serum TGs are observed.

Before initiating therapy, patients should be placed on a cholesterol-lowering diet for 3-6 mo; the diet should be continued indefinitely.

Lovastatin (Mevacor, Altoprev)

Adjunct to dietary therapy in reducing serum cholesterol. Immediate-release (Mevacor) and extended-release (Altocor) are available.

Fluvastatin (Lescol, Lescol XL)

Synthetically prepared HMG-CoA reductase inhibitor with some similarities to lovastatin, simvastatin, and pravastatin. However, structurally distinct and has different biopharmaceutical profile (eg, no active metabolites, extensive protein binding, minimal CSF penetration).

Used as an adjunct to dietary therapy in decreasing cholesterol levels.

Pravastatin (Pravachol)

Effective in reducing circulating lipid levels and improving the clinical and anatomic course of atherosclerosis.

Rosuvastatin (Crestor)

HMG-CoA reductase inhibitor that in turn decreases cholesterol synthesis and increases cholesterol metabolism. Reduces total-C, LDL-C, and TG levels and increases HDL-C level. Used adjunctively with diet and exercise to treat hypercholesterolemia.

SOURCE

Managing Your Risks: Patient and Physician Health in the Cath Lab

flouro image

In this post we’ll explore the issue of radiation exposure, occupational risks in the catheterization lab, and how that can impact your care.

I. Patient Risks in the Cath Lab

Fluoroscopy is a type of medical imaging used during percutaneous coronary interventions that displays a continuous x-ray image. Blood flow and artery blockages are not able to be seen using x-ray only imaging. Physicians inject a contrast solution into the arteries so that when an x-ray beam is passed through the tissue, the physician can get a real-time image of the coronary arteries. On average, angioplasty procedures will last about an hour, this means the patient is exposed to ionizing radiation from the fluoroscopy for a significant amount of time. Lengthy procedures lead to greater exposure to the radiation of fluoroscopy.

Radiation has a cumulative effect and leads to increased risk for many conditions, most notably, cancer.  In healthcare where radiation is required for treatment, there is a prevailing philosophy called ALARA, which stands for as low as (is) reasonably achievable.   Wherever possible, physicians should be looking for ways to limit exposure to radiation to limit the cumulative effects of radiation on patients. Along with the risks posed by radiation, patients in the cath lab also face potentially high doses of the contrast medium which can cause a condition known as contrast induced nephropathy. The contrast solution that is so valuable to imaging can be toxic to the kidneys, and when the body is unable to process the contrast, it leads to CIN in which the kidneys shut down.  While most patients who develop CIN typically recover within 1- 2 weeks, it can cause serious renal (kidney) complications in patients with certain risk factors including diabetes, prior kidney transplant, chronic kidney disease, and hypertensive disorders. Therefore, physicians need to keep a constant watch on the contrast volume used during procedures to minimize the risk of CIN.

II. Occupational Hazards in the Cath Lab

It is well documented that Interventional Cardiologists face serious dangers of long-term radiation exposure in the cath lab. Risks to clinicians include: skin damage to hands and exposed tissue, injury to the lens of the eye/ cataracts, and in some cases the development of brain tumors and other cancers. In a 2012 study, researchers found an increased incidence of left hemisphere brain tumors in a study group of interventional cardiologists that may be attributed to the prolonged exposure to ionizing radiation to the left side of the head during interventional procedures.

Via LifeScience PLUS

Physicians in the Cardiac Cath Lab (Via LifeScience PLUS)

Lead aprons are the standard convention used in Cath labs across the US to reduce radiation exposure to physicians and staff; however these protective barriers can weigh between 15-20 pounds and place up to 300 pounds per square inch of pressure on vertebral disks. In one study more than 400 interventionalists were surveyed and 71% of the study population reported some type of orthopedic disease. According to Dr. Tom Ports, Director of Interventional Cardiology at University of San Francisco, the leading cause of early retirement for interventional cardiologists is spinal injury!

Attention to the danger of radiation exposure and other risks in the cath lab for both patients and staff is on the rise. As more focus is being brought upon safety practices in the cath lab, improved procedural measures are being put in place to protect physicians and staff, and improve the quality of care for patients.

http://blog.corindus.com/?p=124

REFERENCES

SOURCE
  1. Murphy SW, Barrett BJ, Parfrey PS. Contrast nephropathy. J Am Soc Nephrol. Jan 2000;11(1):177-82.[Medline].
  2. Lakhal K, Ehrmann S, Chaari A, et al. Acute Kidney Injury Network definition of contrast-induced nephropathy in the critically ill: Incidence and outcome. J Crit Care. Jul 5 2011;[Medline].
  3. Droppa M, Desch S, Blase P, et al. Impact of N-acetylcysteine on contrast-induced nephropathy defined by cystatin C in patients with ST-elevation myocardial infarction undergoing primary angioplasty. Clin Res Cardiol. Jun 28 2011;[Medline].
  4. Ren L, Ji J, Fang Y, et al. Assessment of Urinary N-Acetyl-ß-glucosaminidase as an Early Marker of Contrast-induced Nephropathy. J Int Med Res. 2011;39(2):647-53. [Medline].
  5. Finn WF. The clinical and renal consequences of contrast-induced nephropathy. Nephrol Dial Transplant. Jun 2006;21(6):i2-10. [Medline].
  6. Lameier NH. Contrast-induced nephropathy–prevention and risk reduction. Nephrol Dial Transplant. Jun 2006;21(6):i11-23. [Medline].
  7. Department of Veteran Affairs, Department of Defense. VA/DoD clinical practice guideline for management of chronic kidney disease in primary care. Available at http://guideline.gov/content.aspx?id=15674. Accessed Jul 10 2011.
  8. Wong GT, Irwin MG. Contrast-induced nephropathy. Br J Anaesth. Oct 2007;99(4):474-83. [Medline].
  9. Barrett BJ, Carlisle EJ. Metaanalysis of the relative nephrotoxicity of high- and low-osmolality iodinated contrast media. Radiology. Jul 1993;188(1):171-8. [Medline].
  10. Aspelin P, Aubry P, Fransson SG, et al. Nephrotoxic effects in high-risk patients undergoing angiography.N Engl J Med. Feb 6 2003;348(6):491-9. [Medline].
  11. Baker CS, Wragg A, Kumar S, et al. A rapid protocol for the prevention of contrast-induced renal dysfunction: the RAPPID study. J Am Coll Cardiol. Jun 18 2003;41(12):2114-8. [Medline].
  12. Bartorelli AL, Marenzi G. Contrast-induced nephropathy. J Interv Cardiol. Feb 2008;21(1):74-85. [Medline].
  13. [Best Evidence] Jo SH, Youn TJ, Koo BK, et al. Renal toxicity evaluation and comparison between visipaque (iodixanol) and hexabrix (ioxaglate) in patients with renal insufficiency undergoing coronary angiography: the RECOVER study: a randomized controlled trial. J Am Coll Cardiol. Sep 5 2006;48(5):924-30. [Medline].
  14. Shin DH, Choi DJ, Youn TJ, et al. Comparison of contrast-induced nephrotoxicity of iodixanol and iopromide in patients with renal insufficiency undergoing coronary angiography. Am J Cardiol. Jul 15 2011;108(2):189-94. [Medline].
  15. Toprak O. Risk markers for contrast-induced nephropathy. Am J Med Sci. Oct 2007;334(4):283-90.[Medline].
  16. Guastoni C, De Servi S, D’Amico M. The role of dialysis in contrast-induced nephropathy: doubts and certainties. J Cardiovasc Med (Hagerstown). Aug 2007;8(8):549-57. [Medline].
  17. McCullough PA, Wolyn R, Rocher LL, et al. Acute renal failure after coronary intervention: incidence, risk factors, and relationship to mortality. Am J Med. Nov 1997;103(5):368-75. [Medline].
  18. Maioli M, Toso A, Leoncini M, Gallopin M, Musilli N, Bellandi F. Persistent renal damage after contrast-induced acute kidney injury: incidence, evolution, risk factors, and prognosis. Circulation. Jun 26 2012;125(25):3099-107. [Medline].
  19. Mehran R, Aymong ED, Nikolsky E, et al. A simple risk score for prediction of contrast-induced nephropathy after percutaneous coronary intervention: development and initial validation. J Am Coll Cardiol. Oct 6 2004;44(7):1393-9. [Medline].
  20. Bartholomew BA, Harjai KJ, Dukkipati S, et al. Impact of nephropathy after percutaneous coronary intervention and a method for risk stratification. Am J Cardiol. Jun 15 2004;93(12):1515-9. [Medline].
  21. Moreau JF, Noel LH, Droz D. Proximal renal tubular vacuolization induced by iodinated contrast media, or so-called “osmotic nephrosis”. Invest Radiol. Feb 1993;28(2):187-90. [Medline].
  22. Solomon R. Radiocontrast-induced nephropathy. Semin Nephrol. Sep 1998;18(5):551-7. [Medline].
  23. Mueller C. Prevention of contrast-induced nephropathy with volume supplementation. Kidney Int Suppl. Apr 2006;S16-9. [Medline].
  24. Pannu N, Wiebe N, Tonelli M. Prophylaxis strategies for contrast-induced nephropathy. JAMA. Jun 21 2006;295(23):2765-79. [Medline].
  25. Friedewald VE, Goldfarb S, Laskey WK, et al. The editor’s roundtable: contrast-induced nephropathy. Am J Cardiol. Aug 1 2007;100(3):544-51. [Medline].
  26. Pappy R, Stavrakis S, Hennebry TA, et al. Effect of statin therapy on contrast-induced nephropathy after coronary angiography: A meta-analysis. Int J Cardiol. May 31 2011;[Medline].
  27. From AM, Bartholmai BJ, Williams AW, et al. Sodium bicarbonate is associated with an increased incidence of contrast nephropathy: a retrospective cohort study of 7977 patients at Mayo Clinic. Clin J Am Soc Nephrol. Jan 2008;3(1):10-8. [Medline].
  28. Van Praet JT, De Vriese AS. Prevention of contrast-induced nephropathy: a critical review. Curr Opin Nephrol Hypertens. Jul 2007;16(4):336-47. [Medline].
  29. Hoffmann U, Fischereder M, Kruger B, et al. The value of N-acetylcysteine in the prevention of radiocontrast agent-induced nephropathy seems questionable. J Am Soc Nephrol. Feb 2004;15(2):407-10.[Medline].
  30. Haase M, Haase-Fielitz A, Ratnaike S, et al. N-Acetylcysteine does not artifactually lower plasma creatinine concentration. Nephrol Dial Transplant. May 2008;23(5):1581-7. [Medline].
  31. Rodby RA. Preventing complications of radiographic contrast media: is there a role for dialysis?. Semin Dial. Jan-Feb 2007;20(1):19-23. [Medline].
  32. [Best Evidence] Cruz DN, Perazella MA, Bellomo R, et al. Extracorporeal blood purification therapies for prevention of radiocontrast-induced nephropathy: a systematic review. Am J Kidney Dis. Sep 2006;48(3):361-71. [Medline].
  33. Lee PT, Chou KJ, Liu CP, et al. Renal protection for coronary angiography in advanced renal failure patients by prophylactic hemodialysis. A randomized controlled trial. J Am Coll Cardiol. Sep 11 2007;50(11):1015-20. [Medline].
  34. Marenzi G, Lauri G, Campodonico J, et al. Comparison of two hemofiltration protocols for prevention of contrast-induced nephropathy in high-risk patients. Am J Med. Feb 2006;119(2):155-62. [Medline].
  35. Frank H, Werner D, Lorusso V, et al. Simultaneous hemodialysis during coronary angiography fails to prevent radiocontrast-induced nephropathy in chronic renal failure. Clin Nephrol. Sep 2003;60(3):176-82.[Medline].
  36. Spargias K, Alexopoulos E, Kyrzopoulos S, et al. Ascorbic acid prevents contrast-mediated nephropathy in patients with renal dysfunction undergoing coronary angiography or intervention. Circulation. Nov 2 2004;110(18):2837-42. [Medline].
  37. Cigarroa RG, Lange RA, Williams RH, et al. Dosing of contrast material to prevent contrast nephropathy in patients with renal disease. Am J Med. Jun 1989;86(6 Pt 1):649-52. [Medline].
  38. Morcos SK, Thomsen HS, Webb JA. Contrast-media-induced nephrotoxicity: a consensus report. Contrast Media Safety Committee, European Society of Urogenital Radiology (ESUR). Eur Radiol. 1999;9(8):1602-13. [Medline].
  39. Onuigbo MA, Onuigbo NT. Worsening renal failure in older chronic kidney disease patients with renal artery stenosis concurrently on renin angiotensin aldosterone system blockade: a prospective 50-month Mayo-Health-System clinic analysis. QJM. Mar 28 2008;[Medline].
  40. Kaplan AA, Kohn OF. Fractional excretion of urea as a guide to renal dysfunction. Am J Nephrol. 1992;12(1-2):49-54. [Medline].

Read Full Post »

The importance of spatially-localized and quantified image interpretation in cancer management

Writer & reporter: Dror Nir, PhD

I became involved in the development of quantified imaging-based tissue characterization more than a decade ago. From the start, it was clear to me that what clinicians needs will not be answered by just identifying whether a certain organ harbors cancer. If imaging devices are to play a significant role in future medicine, as a complementary source of information to bio-markers and gene sequencing the minimum value expected of them is accurate directing of biopsy needles and treatment tools to the malignant locations in the organ.  Therefore, the design goal of the first Prostate-HistoScanning (“PHS”) version I went into the trouble of characterizing localized volume of tissue at the level of approximately 0.1cc (1x1x1 mm). Thanks to that, the imaging-interpretation overlay of PHS localizes the suspicious lesions with accuracy of 5mm within the prostate gland; Detection, localisation and characterisation of prostate cancer by prostate HistoScanning(™).

I then started a more ambitious research aiming to explore the feasibility of identifying sub-structures within the cancer lesion itself. The preliminary results of this exploration were so promising that it surprised not only the clinicians I was working with but also myself. It seems, that using quality ultrasound, one can find Imaging-Biomarkers that allows differentiation of inside structures of a cancerous lesions. Unfortunately, for everyone involved in this work, including me, this scientific effort was interrupted by financial constrains before reaching maturity.

My short introduction was made to explain why I find the publication below important enough to post and bring to your attention.

I hope for your agreement on the matter.

Quantitative Imaging in Cancer Evolution and Ecology

Robert A. Gatenby, MD, Olya Grove, PhD and Robert J. Gillies, PhD

From the Departments of Radiology and Cancer Imaging and Metabolism, Moffitt Cancer Center, 12902 Magnolia Dr, Tampa, FL 33612. Address correspondence to  R.A.G. (e-mail: Robert.Gatenby@Moffitt.org).

Abstract

Cancer therapy, even when highly targeted, typically fails because of the remarkable capacity of malignant cells to evolve effective adaptations. These evolutionary dynamics are both a cause and a consequence of cancer system heterogeneity at many scales, ranging from genetic properties of individual cells to large-scale imaging features. Tumors of the same organ and cell type can have remarkably diverse appearances in different patients. Furthermore, even within a single tumor, marked variations in imaging features, such as necrosis or contrast enhancement, are common. Similar spatial variations recently have been reported in genetic profiles. Radiologic heterogeneity within tumors is usually governed by variations in blood flow, whereas genetic heterogeneity is typically ascribed to random mutations. However, evolution within tumors, as in all living systems, is subject to Darwinian principles; thus, it is governed by predictable and reproducible interactions between environmental selection forces and cell phenotype (not genotype). This link between regional variations in environmental properties and cellular adaptive strategies may permit clinical imaging to be used to assess and monitor intratumoral evolution in individual patients. This approach is enabled by new methods that extract, report, and analyze quantitative, reproducible, and mineable clinical imaging data. However, most current quantitative metrics lack spatialness, expressing quantitative radiologic features as a single value for a region of interest encompassing the whole tumor. In contrast, spatially explicit image analysis recognizes that tumors are heterogeneous but not well mixed and defines regionally distinct habitats, some of which appear to harbor tumor populations that are more aggressive and less treatable than others. By identifying regional variations in key environmental selection forces and evidence of cellular adaptation, clinical imaging can enable us to define intratumoral Darwinian dynamics before and during therapy. Advances in image analysis will place clinical imaging in an increasingly central role in the development of evolution-based patient-specific cancer therapy.

© RSNA, 2013


Introduction

Cancers are heterogeneous across a wide range of temporal and spatial scales. Morphologic heterogeneity between and within cancers is readily apparent in clinical imaging, and subjective descriptors of these differences, such as necrotic, spiculated, and enhancing, are common in the radiology lexicon. In the past several years, radiology research has increasingly focused on quantifying these imaging variations in an effort to understand their clinical and biologic implications (1,2). In parallel, technical advances now permit extensive molecular characterization of tumor cells in individual patients. This has led to increasing emphasis on personalized cancer therapy, in which treatment is based on the presence of specific molecular targets (3). However, recent studies (4,5) have shown that multiple genetic subpopulations coexist within cancers, reflecting extensive intratumoral somatic evolution. This heterogeneity is a clear barrier to therapy based on molecular targets, since the identified targets do not always represent the entire population of tumor cells in a patient (6,7). It is ironic that cancer, a disease extensively and primarily analyzed genetically, is also the most genetically flexible of all diseases and, therefore, least amenable to such an approach.

Genetic variations in tumors are typically ascribed to a mutator phenotype that generates new clones, some of which expand into large populations (8). However, although identification of genotypes is of substantial interest, it is insufficient for complete characterization of tumor dynamics because evolution is governed by the interactions of environmental selection forces with the phenotypic, not genotypic, properties of populations as shown, for example, by evolutionary convergence to identical phenotypes among cave fish even when they are from different species (911). This connection between tissue selection forces and cellular properties has the potential to provide a strong bridge between medical imaging and the cellular and molecular properties of cancers.

We postulate that differences within tumors at different spatial scales (ie, at the radiologic, cellular, and molecular [genetic] levels) are related. Tumor characteristics observable at clinical imaging reflect molecular-, cellular-, and tissue-level dynamics; thus, they may be useful in understanding the underlying evolving biology in individual patients. A challenge is that such mapping across spatial and temporal scales requires not only objective reproducible metrics for imaging features but also a theoretical construct that bridges those scales (Fig 1).

P1a

Figure 1a: Computed tomographic (CT) scan of right upper lobe lung cancer in a 50-year-old woman.

P1b

Figure 1b: Isoattenuation map shows regional heterogeneity at the tissue scale (measured in centimeters).

 cd

Figure 1c & 1d: (c, d)Whole-slide digital images (original magnification, ×3) of a histologic slice of the same tumor at the mesoscopic scale (measured in millimeters) (c) coupled with a masked image of regional morphologic differences showing spatial heterogeneity (d). 

p1e

Figure 1e: Subsegment of the whole slide image shows the microscopic scale (measured in micrometers) (original magnification, ×50).

p1f

Figure 1f: Pattern recognition masked image shows regional heterogeneity. In a, the CT image of non–small cell lung cancer can be analyzed to display gradients of attenuation, which reveals heterogeneous and spatially distinct environments (b). Histologic images in the same patient (c, e) reveal heterogeneities in tissue structure and density on the same scale as seen in the CT images. These images can be analyzed at much higher definition to identify differences in morphologies of individual cells (3), and these analyses reveal clusters of cells with similar morphologic features (d, f). An important goal of radiomics is to bridge radiologic data with cellular and molecular characteristics observed microscopically.

To promote the development and implementation of quantitative imaging methods, protocols, and software tools, the National Cancer Institute has established the Quantitative Imaging Network. One goal of this program is to identify reproducible quantifiable imaging features of tumors that will permit data mining and explicit examination of links between the imaging findings and the underlying molecular and cellular characteristics of the tumors. In the quest for more personalized cancer treatments, these quantitative radiologic features potentially represent nondestructive temporally and spatially variable predictive and prognostic biomarkers that readily can be obtained in each patient before, during, and after therapy.

Quantitative imaging requires computational technologies that can be used to reliably extract mineable data from radiographic images. This feature information can then be correlated with molecular and cellular properties by using bioinformatics methods. Most existing methods are agnostic and focus on statistical descriptions of existing data, without presupposing the existence of specific relationships. Although this is a valid approach, a more profound understanding of quantitative imaging information may be obtained with a theoretical hypothesis-driven framework. Such models use links between observable tumor characteristics and microenvironmental selection factors to make testable predictions about emergent phenotypes. One such theoretical framework is the developing paradigm of cancer as an ecologic and evolutionary process.

For decades, landscape ecologists have studied the effects of heterogeneity in physical features on interactions between populations of organisms and their environments, often by using observation and quantification of images at various scales (1214). We propose that analytic models of this type can easily be applied to radiologic studies of cancer to uncover underlying molecular, cellular, and microenvironmental drivers of tumor behavior and specifically, tumor adaptations and responses to therapy (15).

In this article, we review recent developments in quantitative imaging metrics and discuss how they correlate with underlying genetic data and clinical outcomes. We then introduce the concept of using ecology and evolutionary models for spatially explicit image analysis as an exciting potential avenue of investigation.


Quantitative Imaging and Radiomics

In patients with cancer, quantitative measurements are commonly limited to measurement of tumor size with one-dimensional (Response Evaluation Criteria in Solid Tumors [or RECIST]) or two-dimensional (World Health Organization) long-axis measurements (16). These measures do not reflect the complexity of tumor morphology or behavior, and in many cases, changes in these measures are not predictive of therapeutic benefit (17). In contrast, radiomics (18) is a high-throughput process in which a large number of shape, edge, and texture imaging features are extracted, quantified, and stored in databases in an objective, reproducible, and mineable form (Figs 12). Once transformed into a quantitative form, radiologic tumor properties can be linked to underlying genetic alterations (the field is called radiogenomics) (1921) and to medical outcomes (2227). Researchers are currently working to develop both a standardized lexicon to describe tumor features (28,29) and a standard method to convert these descriptors into quantitative mineable data (30,31) (Fig 3).

p2

Figure 2: Contrast-enhanced CT scans show non–small cell lung cancer (left) and corresponding cluster map (right). Subregions within the tumor are identified by clustering pixels based on the attenuation of pixels and their cumulative standard deviation across the region. While the entire region of interest of the tumor, lacking the spatial information, yields a weighted mean attenuation of 859.5 HU with a large and skewed standard deviation of 243.64 HU, the identified subregions have vastly different statistics. Mean attenuation was 438.9 HU ± 45 in the blue subregion, 210.91 HU ± 79 in the yellow subregion, and 1077.6 HU ± 18 in the red subregion.


p3

Figure 3: Chart shows the five processes in radiomics.

Several recent articles underscore the potential power of feature analysis. After manually extracting more than 100 CT image features, Segal and colleagues found that a subset of 14 features predicted 80% of the gene expression pattern in patients with hepatocellular carcinoma (21). A similar extraction of features from contrast agent–enhanced magnetic resonance (MR) images of glioblastoma was used to predict immunohistochemically identified protein expression patterns (22). Other radiomic features, such as texture, can be used to predict response to therapy in patients with renal cancer (32) and prognosis in those with metastatic colon cancer (33).

These pioneering studies were relatively small because the image analysis was performed manually, and the studies were consequently underpowered. Thus, recent work in radiomics has focused on technical developments that permit automated extraction of image features with the potential for high throughput. Such methods, which rely heavily on novel machine learning algorithms, can more completely cover the range of quantitative features that can describe tumor heterogeneity, such as texture, shape, or margin gradients or, importantly, different environments, or niches, within the tumors.

Generally speaking, texture in a biomedical image is quantified by identifying repeating patterns. Texture analyses fall into two broad categories based on the concepts of first- and second-order spatial statistics. First-order statistics are computed by using individual pixel values, and no relationships between neighboring pixels are assumed or evaluated. Texture analysis methods based on first-order statistics usually involve calculating cumulative statistics of pixel values and their histograms across the region of interest. Second-order statistics, on the other hand, are used to evaluate the likelihood of observing spatially correlated pixels (34). Hence, second-order texture analyses focus on the detection and quantification of nonrandom distributions of pixels throughout the region of interest.

The technical developments that permit second-order texture analysis in tumors by using regional enhancement patterns on dynamic contrast-enhanced MR images were reviewed recently (35). One such technique that is used to measure heterogeneity of contrast enhancement uses the Factor Analysis of Medical Image Sequences (or FAMIS) algorithm, which divides tumors into regions based on their patterns of enhancement (36). Factor Analysis of Medical Image Sequences–based analyses yielded better prognostic information when compared with region of interest–based methods in numerous cancer types (1921,3739), and they were a precursor to the Food and Drug Administration–approved three-time-point method (40). A number of additional promising methods have been developed. Rose and colleagues showed that a structured fractal-based approach to texture analysis improved differentiation between low- and high-grade brain cancers by orders of magnitude (41). Ahmed and colleagues used gray level co-occurrence matrix analyses of dynamic contrast-enhanced images to distinguish benign from malignant breast masses with high diagnostic accuracy (area under the receiver operating characteristic curve, 0.92) (26). Others have shown that Minkowski functional structured methods that convolve images with differently kernelled masks can be used to distinguish subtle differences in contrast enhancement patterns and can enable significant differentiation between treatment groups (42).

It is not surprising that analyses of heterogeneity in enhancement patterns can improve diagnosis and prognosis, as this heterogeneity is fundamentally based on perfusion deficits, which generate significant microenvironmental selection pressures. However, texture analysis is not limited to enhancement patterns. For example, measures of heterogeneity in diffusion-weighted MR images can reveal differences in cellular density in tumors, which can be matched to histologic findings (43). Measures of heterogeneity in T1- and T2-weighted images can be used to distinguish benign from malignant soft-tissue masses (23). CT-based texture features have been shown to be highly significant independent predictors of survival in patients with non–small cell lung cancer (24).

Texture analyses can also be applied to positron emission tomographic (PET) data, where they can provide information about metabolic heterogeneity (25,26). In a recent study, Nair and colleagues identified 14 quantitative PET imaging features that correlated with gene expression (19). This led to an association of metagene clusters to imaging features and yielded prognostic models with hazard ratios near 6. In a study of esophageal cancer, in which 38 quantitative features describing fluorodeoxyglucose uptake were extracted, measures of metabolic heterogeneity at baseline enabled prediction of response with significantly higher sensitivity than any whole region of interest standardized uptake value measurement (22). It is also notable that these extensive texture-based features are generally more reproducible than simple measures of the standardized uptake value (27), which can be highly variable in a clinical setting (44).


Spatially Explicit Analysis of Tumor Heterogeneity

Although radiomic analyses have shown high prognostic power, they are not inherently spatially explicit. Quantitative border, shape, and texture features are typically generated over a region of interest that comprises the entire tumor (45). This approach implicitly assumes that tumors are heterogeneous but well mixed. However, spatially explicit subregions of cancers are readily apparent on contrast-enhanced MR or CT images, as perfusion can vary markedly within the tumor, even over short distances, with changes in tumor cell density and necrosis.

An example is shown in Figure 2, which shows a contrast-enhanced CT scan of non–small cell lung cancer. Note that there are many subregions within this tumor that can be identified with attenuation gradient (attenuation per centimeter) edge detection algorithms. Each subregion has a characteristic quantitative attenuation, with a narrow standard deviation, whereas the mean attenuation over the entire region of interest is a weighted average of the values across all subregions, with a correspondingly large and skewed distribution. We contend that these subregions represent distinct habitats within the tumor, each with a distinct set of environmental selection forces.

These observations, along with the recent identification of regional variations in the genetic properties of tumor cells, indicate the need to abandon the conceptual model of cancers as bounded organlike structures. Rather than a single self-organized system, cancers represent a patchwork of habitats, each with a unique set of environmental selection forces and cellular evolution strategies. For example, regions of the tumor that are poorly perfused can be populated by only those cells that are well adapted to low-oxygen, low-glucose, and high-acid environmental conditions. Such adaptive responses to regional heterogeneity result in microenvironmental selection and hence, emergence of genetic variations within tumors. The concept of adaptive response is an important departure from the traditional view that genetic heterogeneity is the product of increased random mutations, which implies that molecular heterogeneity is fundamentally unpredictable and, therefore, chaotic. The Darwinian model proposes that genetic heterogeneity is the result of a predictable and reproducible selection of successful adaptive strategies to local microenvironmental conditions.

Current cross-sectional imaging modalities can be used to identify regional variations in selection forces by using contrast-enhanced, cell density–based, or metabolic features. Clinical imaging can also be used to identify evidence of cellular adaptation. For example, if a region of low perfusion on a contrast-enhanced study is necrotic, then an adaptive population is absent or minimal. However, if the poorly perfused area is cellular, then there is presumptive evidence of an adapted proliferating population. While the specific genetic properties of this population cannot be determined, the phenotype of the adaptive strategy is predictable since the environmental conditions are more or less known. Thus, standard medical images can be used to infer specific emergent phenotypes and, with ongoing research, these phenotypes can be associated with underlying genetic changes.

This area of investigation will likely be challenging. As noted earlier, the most obvious spatially heterogeneous imaging feature in tumors is perfusion heterogeneity on contrast-enhanced CT or MR images. It generally has been assumed that the links between contrast enhancement, blood flow, perfusion, and tumor cell characteristics are straightforward. That is, tumor regions with decreased blood flow will exhibit low perfusion, low cell density, and high necrosis. In reality, however, the dynamics are actually much more complex. As shown in Figure 4, when using multiple superimposed sequences from MR imaging of malignant gliomas, regions of tumor that are poorly perfused on contrast-enhanced T1-weighted images may exhibit areas of low or high water content on T2-weighted images and low or high diffusion on diffusion-weighted images. Thus, high or low cell densities can coexist in poorly perfused volumes, creating perfusion-diffusion mismatches. Regions with poor perfusion with high cell density are of particular clinical interest because they represent a cell population that is apparently adapted to microenvironmental conditions associated with poor perfusion. The associated hypoxia, acidosis, and nutrient deprivation select for cells that are resistant to apoptosis and thus are likely to be resistant to therapy (46,47).

p4

Figure 4: Left: Contrast-enhanced T1 image from subject TCGA-02-0034 in The Cancer Genome Atlas–Glioblastoma Multiforme repository of MR volumes of glioblastoma multiforme cases. Right: Spatial distribution of MR imaging–defined habitats within the tumor. The blue region (low T1 postgadolinium, low fluid-attenuated inversion recovery) is particularly notable because it presumably represents a habitat with low blood flow but high cell density, indicating a population presumably adapted to hypoxic acidic conditions.

Furthermore, other selection forces not related to perfusion are likely to be present within tumors. For example, evolutionary models suggest that cancer cells, even in stable microenvironments, tend to speciate into “engineers” that maximize tumor cell growth by promoting angiogenesis and “pioneers” that proliferate by invading normal issue and co-opting the blood supply. These invasive tumor phenotypes can exist only at the tumor edge, where movement into a normal tissue microenvironment can be rewarded by increased proliferation. This evolutionary dynamic may contribute to distinct differences between the tumor edges and the tumor cores, which frequently can be seen at analysis of cross-sectional images (Fig 5).

p5a

Figure 5a: CT images obtained with conventional entropy filtering in two patients with non–small cell lung cancer with no apparent textural differences show similar entropy values across all sections. 

p5b

Figure 5b: Contour plots obtained after the CT scans were convolved with the entropy filter. Further subdividing each section in the tumor stack into tumor edge and core regions (dotted black contour) reveals varying textural behavior across sections. Two distinct patterns have emerged, and preliminary analysis shows that the change of mean entropy value between core and edge regions correlates negatively with survival.

Interpretation of the subsegmentation of tumors will require computational models to understand and predict the complex nonlinear dynamics that lead to heterogeneous combinations of radiographic features. We have exploited ecologic methods and models to investigate regional variations in cancer environmental and cellular properties that lead to specific imaging characteristics. Conceptually, this approach assumes that regional variations in tumors can be viewed as a coalition of distinct ecologic communities or habitats of cells in which the environment is governed, at least to first order, by variations in vascular density and blood flow. The environmental conditions that result from alterations in blood flow, such as hypoxia, acidosis, immune response, growth factors, and glucose, represent evolutionary selection forces that give rise to local-regional phenotypic adaptations. Phenotypic alterations can result from epigenetic, genetic, or chromosomal rearrangements, and these in turn will affect prognosis and response to therapy. Changes in habitats or the relative abundance of specific ecologic communities over time and in response to therapy may be a valuable metric with which to measure treatment efficacy and emergence of resistant populations.


Emerging Strategies for Tumor Habitat Characterization

A method for converting images to spatially explicit tumor habitats is shown in Figure 4. Here, three-dimensional MR imaging data sets from a glioblastoma are segmented. Each voxel in the tumor is defined by a scale that includes its image intensity in different sequences. In this case, the imaging sets are from (a) a contrast-enhanced T1 sequence, (b) a fast spin-echo T2 sequence, and (c) a fluid-attenuated inversion-recovery (or FLAIR) sequence. Voxels in each sequence can be defined as high or low based on their value compared with the mean signal value. By using just two sequences, a contrast-enhanced T1 sequence and a fluid-attenuated inversion-recovery sequence, we can define four habitats: high or low postgadolinium T1 divided into high or low fluid-attenuated inversion recovery. When these voxel habitats are projected into the tumor volume, we find they cluster into spatially distinct regions. These habitats can be evaluated both in terms of their relative contributions to the total tumor volume and in terms of their interactions with each other, based on the imaging characteristics at the interfaces between regions. Similar spatially explicit analysis can be performed with CT scans (Fig 5).

Analysis of spatial patterns in cross-sectional images will ultimately require methods that bridge spatial scales from microns to millimeters. One possible method is a general class of numeric tools that is already widely used in terrestrial and marine ecology research to link species occurrence or abundance with environmental parameters. Species distribution models (4851) are used to gain ecologic and evolutionary insights and to predict distributions of species or morphs across landscapes, sometimes extrapolating in space and time. They can easily be used to link the environmental selection forces in MR imaging-defined habitats to the evolutionary dynamics of cancer cells.

Summary

Imaging can have an enormous role in the development and implementation of patient-specific therapies in cancer. The achievement of this goal will require new methods that expand and ultimately replace the current subjective qualitative assessments of tumor characteristics. The need for quantitative imaging has been clearly recognized by the National Cancer Institute and has resulted in formation of the Quantitative Imaging Network. A critical objective of this imaging consortium is to use objective, reproducible, and quantitative feature metrics extracted from clinical images to develop patient-specific imaging-based prognostic models and personalized cancer therapies.

It is increasingly clear that tumors are not homogeneous organlike systems. Rather, they contain regional coalitions of ecologic communities that consist of evolving cancer, stroma, and immune cell populations. The clinical consequence of such niche variations is that spatial and temporal variations of tumor phenotypes will inevitably evolve and present substantial challenges to targeted therapies. Hence, future research in cancer imaging will likely focus on spatially explicit analysis of tumor regions.

Clinical imaging can readily characterize regional variations in blood flow, cell density, and necrosis. When viewed in a Darwinian evolutionary context, these features reflect regional variations in environmental selection forces and can, at least in principle, be used to predict the likely adaptive strategies of the local cancer population. Hence, analyses of radiologic data can be used to inform evolutionary models and then can be mapped to regional population dynamics. Ecologic and evolutionary principles may provide a theoretical framework to link imaging to the cellular and molecular features of cancer cells and ultimately lead to a more comprehensive understanding of specific cancer biology in individual patients.


Essentials

  • • Marked heterogeneity in genetic properties of different cells in the same tumor is typical and reflects ongoing intratumoral evolution.
  • • Evolution within tumors is governed by Darwinian dynamics, with identifiable environmental selection forces that interact with phenotypic (not genotypic) properties of tumor cells in a predictable and reproducible manner; clinical imaging is uniquely suited to measure temporal and spatial heterogeneity within tumors that is both a cause and a consequence of this evolution.
  • • Subjective radiologic descriptors of cancers are inadequate to capture this heterogeneity and must be replaced by quantitative metrics that enable statistical comparisons between features describing intratumoral heterogeneity and clinical outcomes and molecular properties.
  • • Spatially explicit mapping of tumor regions, for example by superimposing multiple imaging sequences, may permit patient-specific characterization of intratumoral evolution and ecology, leading to patient- and tumor-specific therapies.
  • • We summarize current information on quantitative analysis of radiologic images and propose future quantitative imaging must become spatially explicit to identify intratumoral habitats before and during therapy.

Disclosures of Conflicts of Interest: R.A.G. No relevant conflicts of interest to disclose. O.G. No relevant conflicts of interest to disclose.R.J.G. No relevant conflicts of interest to disclose.


Acknowledgments

The authors thank Mark Lloyd, MS; Joel Brown, PhD; Dmitry Goldgoff, PhD; and Larry Hall, PhD, for their input to image analysis and for their lively and informative discussions.

Footnotes

  • Received December 18, 2012; revision requested February 5, 2013; revision received March 11; accepted April 9; final version accepted April 29.
  • Funding: This research was supported by the National Institutes of Health (grants U54CA143970-01, U01CA143062; R01CA077575, andR01CA170595).

References

    1. Kurland BF,
    2. Gerstner ER,
    3. Mountz JM,
    4. et al

    . Promise and pitfalls of quantitative imaging in oncology clinical trials. Magn Reson Imaging2012;30(9):1301–1312.

    1. Levy MA,
    2. Freymann JB,
    3. Kirby JS,
    4. et al

    . Informatics methods to enable sharing of quantitative imaging research data. Magn Reson Imaging2012;30(9):1249–1256.

    1. Mirnezami R,
    2. Nicholson J,
    3. Darzi A

    . Preparing for precision medicine. N Engl J Med 2012;366(6):489–491.

    1. Yachida S,
    2. Jones S,
    3. Bozic I,
    4. et al

    . Distant metastasis occurs late during the genetic evolution of pancreatic cancer. Nature 2010;467(7319):1114–1117.

    1. Gerlinger M,
    2. Rowan AJ,
    3. Horswell S,
    4. et al

    . Intratumor heterogeneity and branched evolution revealed by multiregion sequencing. N Engl J Med2012;366(10):883–892.

    1. Gerlinger M,
    2. Swanton C

    . How Darwinian models inform therapeutic failure initiated by clonal heterogeneity in cancer medicine. Br J Cancer2010;103(8):1139–1143.

    1. Kern SE

    . Why your new cancer biomarker may never work: recurrent patterns and remarkable diversity in biomarker failures. Cancer Res2012;72(23):6097–6101.

    1. Nowell PC

    . The clonal evolution of tumor cell populations. Science1976;194(4260):23–28.

    1. Greaves M,
    2. Maley CC

    . Clonal evolution in cancer. Nature2012;481(7381):306–313.

    1. Vincent TL,
    2. Brown JS

    . Evolutionary game theory, natural selection and Darwinian dynamics. Cambridge, England: Cambridge University Press, 2005.

    1. Gatenby RA,
    2. Gillies RJ

    . A microenvironmental model of carcinogenesis. Nat Rev Cancer 2008;8(1):56–61.

    1. Bowers MA,
    2. Matter SF

    . Landscape ecology of mammals: relationships between density and patch size. J Mammal 1997;78(4):999–1013.

    1. Dorner BK,
    2. Lertzman KP,
    3. Fall J

    . Landscape pattern in topographically complex landscapes: issues and techniques for analysis. Landscape Ecol2002;17(8):729–743.

    1. González-García I,
    2. Solé RV,
    3. Costa J

    . Metapopulation dynamics and spatial heterogeneity in cancer. Proc Natl Acad Sci U S A2002;99(20):13085–13089.

    1. Patel LR,
    2. Nykter M,
    3. Chen K,
    4. Zhang W

    . Cancer genome sequencing: understanding malignancy as a disease of the genome, its conformation, and its evolution. Cancer Lett 2012 Oct 27. [Epub ahead of print]

    1. Jaffe CC

    . Measures of response: RECIST, WHO, and new alternatives. J Clin Oncol 2006;24(20):3245–3251.

    1. Burton A

    . RECIST: right time to renovate? Lancet Oncol2007;8(6):464–465.

    1. Lambin P,
    2. Rios-Velazquez E,
    3. Leijenaar R,
    4. et al

    . Radiomics: extracting more information from medical images using advanced feature analysis. Eur J Cancer 2012;48(4):441–446.

    1. Nair VS,
    2. Gevaert O,
    3. Davidzon G,
    4. et al

    . Prognostic PET 18F-FDG uptake imaging features are associated with major oncogenomic alterations in patients with resected non-small cell lung cancer. Cancer Res2012;72(15):3725–3734.

    1. Diehn M,
    2. Nardini C,
    3. Wang DS,
    4. et al

    . Identification of noninvasive imaging surrogates for brain tumor gene-expression modules. Proc Natl Acad Sci U S A 2008;105(13):5213–5218.

    1. Segal E,
    2. Sirlin CB,
    3. Ooi C,
    4. et al

    . Decoding global gene expression programs in liver cancer by noninvasive imaging. Nat Biotechnol 2007;25(6):675–680.

    1. Tixier F,
    2. Le Rest CC,
    3. Hatt M,
    4. et al

    . Intratumor heterogeneity characterized by textural features on baseline 18F-FDG PET images predicts response to concomitant radiochemotherapy in esophageal cancer. J Nucl Med2011;52(3):369–378.

    1. Pang KK,
    2. Hughes T

    . MR imaging of the musculoskeletal soft tissue mass: is heterogeneity a sign of malignancy? J Chin Med Assoc2003;66(11):655–661.

    1. Ganeshan B,
    2. Panayiotou E,
    3. Burnand K,
    4. Dizdarevic S,
    5. Miles K

    . Tumour heterogeneity in non-small cell lung carcinoma assessed by CT texture analysis: a potential marker of survival. Eur Radiol 2012;22(4):796–802.

    1. Asselin MC,
    2. O’Connor JP,
    3. Boellaard R,
    4. Thacker NA,
    5. Jackson A

    . Quantifying heterogeneity in human tumours using MRI and PET. Eur J Cancer2012;48(4):447–455.

    1. Ahmed A,
    2. Gibbs P,
    3. Pickles M,
    4. Turnbull L

    . Texture analysis in assessment and prediction of chemotherapy response in breast cancer. J Magn Reson Imaging doi:10.1002/jmri.23971 2012. Published online December 13, 2012.

    1. Kawata Y,
    2. Niki N,
    3. Ohmatsu H,
    4. et al

    . Quantitative classification based on CT histogram analysis of non-small cell lung cancer: correlation with histopathological characteristics and recurrence-free survival. Med Phys2012;39(2):988–1000.

    1. Rubin DL

    . Creating and curating a terminology for radiology: ontology modeling and analysis. J Digit Imaging 2008;21(4):355–362.

    1. Opulencia P,
    2. Channin DS,
    3. Raicu DS,
    4. Furst JD

    . Mapping LIDC, RadLex™, and lung nodule image features. J Digit Imaging 2011;24(2):256–270.

    1. Channin DS,
    2. Mongkolwat P,
    3. Kleper V,
    4. Rubin DL

    . The Annotation and Image Mark-up project. Radiology 2009;253(3):590–592.

    1. Rubin DL,
    2. Mongkolwat P,
    3. Kleper V,
    4. Supekar K,
    5. Channin DS

    . Medical imaging on the semantic web: annotation and image markup. Presented at the AAAI Spring Symposium Series, Semantic Scientific Knowledge Integration, Palo Alto, Calif, March 26–28, 2008.

    1. Goh V,
    2. Ganeshan B,
    3. Nathan P,
    4. Juttla JK,
    5. Vinayan A,
    6. Miles KA

    . Assessment of response to tyrosine kinase inhibitors in metastatic renal cell cancer: CT texture as a predictive biomarker. Radiology 2011;261(1):165–171.

    1. Miles KA,
    2. Ganeshan B,
    3. Griffiths MR,
    4. Young RC,
    5. Chatwin CR

    . Colorectal cancer: texture analysis of portal phase hepatic CT images as a potential marker of survival. Radiology 2009;250(2):444–452.

    1. Haralick RM,
    2. Shanmugam K,
    3. Dinstein I

    . Textural features for image classification. IEEE Trans Syst Man Cybern 1973;3(6):610–621.

    1. Yang X,
    2. Knopp MV

    . Quantifying tumor vascular heterogeneity with dynamic contrast-enhanced magnetic resonance imaging: a review. J Biomed Biotechnol 2011;2011:732848.

    1. Frouin F,
    2. Bazin JP,
    3. Di Paola M,
    4. Jolivet O,
    5. Di Paola R

    . FAMIS: a software package for functional feature extraction from biomedical multidimensional images. Comput Med Imaging Graph 1992;16(2):81–91.

    1. Frouge C,
    2. Guinebretière JM,
    3. Contesso G,
    4. Di Paola R,
    5. Bléry M

    . Correlation between contrast enhancement in dynamic magnetic resonance imaging of the breast and tumor angiogenesis. Invest Radiol 1994;29(12):1043–1049.

    1. Zagdanski AM,
    2. Sigal R,
    3. Bosq J,
    4. Bazin JP,
    5. Vanel D,
    6. Di Paola R

    . Factor analysis of medical image sequences in MR of head and neck tumors. AJNR Am J Neuroradiol 1994;15(7):1359–1368.

    1. Bonnerot V,
    2. Charpentier A,
    3. Frouin F,
    4. Kalifa C,
    5. Vanel D,
    6. Di Paola R

    . Factor analysis of dynamic magnetic resonance imaging in predicting the response of osteosarcoma to chemotherapy. Invest Radiol 1992;27(10):847–855.

    1. Furman-Haran E,
    2. Grobgeld D,
    3. Kelcz F,
    4. Degani H

    . Critical role of spatial resolution in dynamic contrast-enhanced breast MRI. J Magn Reson Imaging2001;13(6):862–867.

    1. Rose CJ,
    2. Mills SJ,
    3. O’Connor JPB,
    4. et al

    . Quantifying spatial heterogeneity in dynamic contrast-enhanced MRI parameter maps. Magn Reson Med2009;62(2):488–499.

    1. Canuto HC,
    2. McLachlan C,
    3. Kettunen MI,
    4. et al

    . Characterization of image heterogeneity using 2D Minkowski functionals increases the sensitivity of detection of a targeted MRI contrast agent. Magn Reson Med2009;61(5):1218–1224.

    1. Lloyd MC,
    2. Allam-Nandyala P,
    3. Purohit CN,
    4. Burke N,
    5. Coppola D,
    6. Bui MM

    . Using image analysis as a tool for assessment of prognostic and predictive biomarkers for breast cancer: how reliable is it? J Pathol Inform2010;1:29–36.

    1. Kumar V,
    2. Nath K,
    3. Berman CG,
    4. et al

    . Variance of SUVs for FDG-PET/CT is greater in clinical practice than under ideal study settings. Clin Nucl Med2013;38(3):175–182.

    1. Walker-Samuel S,
    2. Orton M,
    3. Boult JK,
    4. Robinson SP

    . Improving apparent diffusion coefficient estimates and elucidating tumor heterogeneity using Bayesian adaptive smoothing. Magn Reson Med 2011;65(2):438–447.

    1. Thews O,
    2. Nowak M,
    3. Sauvant C,
    4. Gekle M

    . Hypoxia-induced extracellular acidosis increases p-glycoprotein activity and chemoresistance in tumors in vivo via p38 signaling pathway. Adv Exp Med Biol 2011;701:115–122.

    1. Thews O,
    2. Dillenburg W,
    3. Rösch F,
    4. Fellner M

    . PET imaging of the impact of extracellular pH and MAP kinases on the p-glycoprotein (Pgp) activity. Adv Exp Med Biol 2013;765:279–286.

    1. Araújo MB,
    2. Peterson AT

    . Uses and misuses of bioclimatic envelope modeling. Ecology 2012;93(7):1527–1539.

    1. Larsen PE,
    2. Gibbons SM,
    3. Gilbert JA

    . Modeling microbial community structure and functional diversity across time and space. FEMS Microbiol Lett2012;332(2):91–98.

    1. Shenton W,
    2. Bond NR,
    3. Yen JD,
    4. Mac Nally R

    . Putting the “ecology” into environmental flows: ecological dynamics and demographic modelling. Environ Manage 2012;50(1):1–10.

    1. Clark MC,
    2. Hall LO,
    3. Goldgof DB,
    4. Velthuizen R,
    5. Murtagh FR,
    6. Silbiger MS

    .Automatic tumor segmentation using knowledge-based techniques. IEEE Trans Med Imaging 1998;17(2):187–201.

Read Full Post »

Echocardiogram Quantification: Quest for Reproducibility and Dependability

Reporter: Aviva Lev-Ari, PhD, RN

How can echo quantification become more reproducible and dependable?

 Senior Director, Global Cardiology at Innovations in Cardiology

Innovations in Cardiology

a subgroup of Innovations In Health on LinkedIn.com

Echocardiography encompasses an array of clinically important tasks including quantifying cardiac chamber size, ventricular mass and function.

Based on your experience, how can echo quantification become more reproducible and dependable?

Comments made by Group members:


Yoni TiroshYoni

Yoni Tirosh

CEO at M.I. Medical Incentive Ltd.

Hello Ivan,
I’ve sent you a personal message regarding an innovative development related to Echo use.


Tim ZepickTim

Tim Zepick

Office Manager; Technical Director, Ultrasound at Line Medical

It’s impossible.

There are large variations in quality of ultrasound systems. There are also large variations in skill levels of operators. And those skill levels change over time. But the most detrimental factor is that the human body is a dynamic and unique system. Some subjects are technically difficult and LV function is basically impossible to assess, even with an excellent US system. Measurement of LVPWiD is a guess on these patients. Then there are subjects on whom you can obtain excellent images at intercostal space #2, #3, and #4. And the anatomy is bisected at a different angle and might yield three different measurements at each approach. The same can be said for a lot of the 2-D length measurements. I can probably make your RA five centimeters wide, if I try.

That said, doing about 5,000 studies will get you pretty good at recognizing your limitations, realizing the need to remeasure erroneous data, common failings of ultrasound physics and other sources of error.

Thankfully, inexperienced techs get a good education on spotting and evaluating the “exciting” stuff because these nuanced stuff takes time to develop.


Wayne PetersonWayne

Wayne Peterson

Product Manager

Ivan,
As a former Philips employee, hello. My clinical skills included cardiac ultrasound. In response to your question, a software program with edge resolution enhancement and auto analysis would be amazing. It would remove user variability.


Tony GallagherTony

Tony Gallagher

Clinical Coordinator of Cardiology and Cardio-Pulmonary Rehabilitation at Floyd Medical Center

I agree with Tim that it is not possible. In deference to Wayne; edge recognition software would help. But the variety of equipment skill levels, even peoples varied vision; prevent 100% agreement.

Even at the larger conferences, when you attend the “read with the experts” courses, you see that they tend to disagree looking at the same images.

unless equipment, education, and criteria for performing studies gets standardized; not going to happen.


Alberto GomezAlberto

Alberto Gomez

Research Assistant at King’s College London

Reproducibility and reduction (I.e. not complete removal) of variability could be achieved in several ways. For example, to cite a few: multi view imaging to remove view dependency on edge definition and occlusion; angle independent flow quantification using 3D color Doppler; image fusion and compounding with tracked probes; simultaneous (or quasi-simultaneous) multi-prove systems. All these are engineering and research challenges but we will get to them. How long it will take highly depends on how willing manufacturers are to open up to research institutions and how willing research institutions are to share and exploit results.


Aviva Lev-Ari, PhD, RN

Aviva Lev-Ari, PhD, RN

Cardiovascular Original Research: Curation Methodology Designer at Leaders in Pharmaceutical Business Intelligence

Please visit us
Http://pharmaceuticalintelligence.com

On right hand side Categories, pl. Click on Medical Imaging
search box
Type
Justin Pearlman, MD, PhD, FACC

Thank you
Aviva Lev-Ari, PhD, RN


Clifford ThorntonClifford

Clifford Thornton

Echocardiography Technician at CapitalHealth

You’re a very brave man Ivan, asking the holy grail question of echocardiography! I’ve been doing echoes at prominent institutions for 10 years, been registered in echo since 2006, have performed probably more than 6,000 adult echoes, teach echo to technicians and sometimes residents, attended echo related conferences and read the latest Dr. Feigenbaum and Dr. Otto textbooks – so I can speak to this topic.

Here’s the deal. From what I understand, the best echo has to offer as far as EF quantification (which I think is usually the focus) is 3D volume quantification. The problem is, is that primarily due to reimbursement issues this technology has had very slow adoption and application and therefore low availability. A great application of this technology would be evaluating a patient for possible LVAD placement/treatment or heart transplant.

Given this, what most technicians are left with is 2 Dimensional echo. There are many ways we can measure Ejection Fraction with 2D Echo and they include direct 2D measurement (measuring the left ventricular internal dimension at end-diastole (LVIDd) and the left ventricular internal dimension at end-systole (LVIDs). Most modern echo systems have very specific packages that enable fairly easy measurements of these aspects of the heart and are clearly labeled. A technician can also make a similar measurement using M-Mode. The achilles-heel of M-Mode based measurement of EF is that the picture or the heart in the picture (from the parasternal long-axis window/view – PLAX) must be on-axis. If the picture is off-axis, your direct 2D measurements should be more accurate. Side note: this all goes out the window with a poorly trained or lazy echo tech who has little to no idea of what they’re doing – and unfortunately there’s too many of these out there (read more on this later). So, as far as 2D left ventricular dimension measurements of EF go, direct 2D (on screen) measurements are preferable.

According to a Wake Forest Cardiology conference which I attended several years ago in Orlando, “The Beat Goes On” the best or most accurate measurement of EF with 2D echo (assuming there’s a good, well-trained, knowledgeable and hard working echo tech performing the test) is with Simpson’s Bi-plane method/Quantification. This measurement is based on volume of blood in the heart at end-diastole and end-systole (see the pattern). Once this is calculated a technician can then calculate the stroke volume (which most packages calculate automatically once the proper measurements are calculated and entered) and the cardiac output (Stroke volume (SV) X heart rate (HR)). As a reference the heart wants to push around 5 liters of blood per minute to sustain life and normal body function. Of course this can greatly increase with exercise or decrease slightly with rest as can your respiratory function.

The way the Biplane Simpsons’ method is performed is that a technician calculates the following from both the apical-4-chamber view and the apical-2-chamber view (again most modern systems have these measurements built into the package and labeled and they can also be exported directly to the preliminary report through DICOM specs.):
1. Left ventricular volume at End-Diastole (LVVED) – A4C

1. Left ventricular volume at End-Systole (LVVES) – A4C

1. Left ventricular volume at End-Diastole (LVVED) – A2C

1. Left ventricular volume at End-Systole (LVVED) – A2C

Yes, you can imagine this is very time consuming. It can be done later once the scan is done however once the patient leaves, you can not go back and adjust your view if you think your picture is foreshortened or off-axis, etc.

Please see very relevant document to this topic from the American Society of Echocardiography, Committee Recommendations:
http://files.asecho.org/files/ChamberQuantification.pdf


Clifford ThorntonClifford

Clifford Thornton

Echocardiography Technician at CapitalHealth

cont’d–
The bottom line is that quantification in echo, particularly in calculating EF depends on the situation. Simpsons’ method is not performed routinely in most labs because if the EF visually looks normal (around 55% – 70%) from the long-axis, short-axis and apical 4 chamber and apical 2 chamber views then there’s usually not a huge need for it; little additional benefit. I try to do it as much as possible because I like to do as best an echo I can and also it’s good to practice and a little fun when you have very clear/great quality pictures (ironically these are the people who you know their EF is probably normal the minute they walk through your door!).

There are many tools and techniques one can employ to optimize their 2D/Simpsons’ EF measurements. Here are a few:
* the patient into the proper position (left lateral decubitus) — I use a wedge to keep them on their left side and keep their head well supported with a rolled up pillow or rolled up blankets

* the proper echo settings/frequency. Use penetration setting if you have to, but if they have good pictures, use the best resolution setting you can without sacrificing endocardial border definition — otherwise you’re defeating the purpose

* the proper breathing techniques (I find from parasternal window it’s best to have the patient inhale, exhale all the way and then hold their breath for loop acquisition and best to have them inhale and hold for apical acquisitions – but just play around with it until you get the picture you want).

* the picture on axis and avoid foreshortening — this is very key for the Simpsons’ method of discs

Now, you’ve tried all this, you’re sweating, your hand and shoulder are about to fall off, you see stars or angels or both and the patient and their family think you are completely clueless and think you’re torturing their Wife/Husband/Daughter/Friend/etc. and you’re wondering if you’ll have a job tomorrow. So what do you do?

Definity Echo contrast (Perflutren Lipid Microsphere) – http://www.definityimaging.com/ – you say? Yes, possibly. You need to A. Get the patient’s consent (although this is beginning to change) B. Establish IV access for the injection of the Definity solution C. Activate the Definity and use it within a certain period D. Utilize it correctly.

Basically Definity contrast is little gas bubbles that reflect the ultrasound beams (for which 2D pictures are generated from pulsed-wave doppler) very well or strongly and allow for a stronger, clearer/better resolution image. The heart walls/endocardial borders are one color and the contrast is the other (the contrast is usually the white-milky substance you see inside the left ventricle while it’s filling and contracting. Most people think it’s pretty “cool” when they see it and it can make a dramatic difference in how you visually estimate or calculate the EF. As I mentioned, Simpsons’ method (the preferred 2D EF calc. method) is highly dependent on operator skill and effort and hence picture quality. And Definity contrast can greatly enhance the picture quality. Last week I had a patient where you could barely see any endocardial border without Definity and visually estimating his EF would be a total shot in the dark. Well, we administered Definity, and I’m not lying it was still a tough scan, but once the Definity was injected and began to appear in the right ventricle and then left, I could see immediately that his EF was completely normal (55-60%). This was important to assess clinically because the patient was in the CCU at the time and he was s/p CABG. Judging whether the EF is normal or not can have a big play in clinical decision making for other conditions.

Ironically getting an accurate EF has to do more with having the right technician perform your test than it has to do with technology or anything else. And unfortunately there’s no lack of pitfalls there.


Reza

Reza Mehzad, MD, MPH

Mercy Heart Institute

Full automation for 3D echocardiography volume assessment AND having a safe contrast agents to be used with all echo studies.


 Clifford Thornton likes this

Read Full Post »

« Newer Posts - Older Posts »