The Metabolic View of Epigenetic Expression
Writer and Curator: Larry H Bernstein, MD, FCAP
Introduction
This is the fifth contribution to a series of articles on cancer, genomics, and metabolism. I begin this after reading an article by Stephen Williams “War on Cancer May Need to Refocus Says Cancer Expert on NPR”, and after listening to NPR “On the Media”. This is an unplanned experience, perhaps partly related to an Op-Ed in the New York Times two days before by Angelina Jolie Pittman. Taking her article prior to pre-emptive breast surgery for the BRCA1 mutation two years ago and her salpingo-oophorectomy at age 39 years with her family history, and her adoption of several children even prior to her marriage to Brad Pitt, reveals an unusual self-knowledge as well as perspective on the disease risk balanced with her maternal instincts. I sense (but don’t know) that she had a good knowledge not stated about the estrogen sensitivity of breast cancer for some years, and balanced that knowledge in her life decisions.
Tracing the history of cancer and the Lyndon Johnson initiated “War on Cancer” the initiative is presented as misguided. Moreover, the imbalance is posed aas focused overly on genomics, and there is an imbalnced in the attention to the types of cancer, bladder cancer (urothelial) receiving too little attention. However, the events that drive this are complex, and not surprising. The funding is driven partly by media attention (a film star or President’s wife) and not to be overlooked, watch where the money flows. People who have the ability to donate and also have a family experience will give, regardless of the statistics because it is 100 percent in their eyes.
Insofar as the scientific endeavor goes, young scientists are committed to a successful research career, and they also need funding, so they have to balance the risk of success and failure in the choice of problems they choose to work on. But until the 20th century, the biological sciences were largely descriptive. The emergence of a “Molecular Biology” is a unique 20th century development. The work of Pathology – pioneered by Rokitansky, Virchow, and to an extent also the anatomist/surgeon John Harvey – was observational science. The description of Hodgkin’s lymphoma was observational, and it was a breakthrough in medicine.
With the emergence of genomics from biochemistry and genetics in molecular biology (biology at the subcellular level), a part of medicine that was well founded became an afterthought. After all, after many years of the history of medicine and pathology, it is well known that cancers are not only a dysmetabolism of cellular replication and cellular regulation, but cancers have a natural history related to organ system, tissue specificity, sex, and age of occurrence. This should be well known to the experienced practitioner, but not necessarily to the basic researcher with no little clinical exposure. Consequently, it was quite remarkable to me to find that the truly amazing biochemist who gave a “Harvey Lecture” at Harvard on the pyridine nucleotide transhydrogenases, and who shared in the discovery of Coenzyme A, had made the observation that organs that are primarily involved with synthetic activity -adrenal, pituitary, and thyroid, testis, ovary, breast (most notably) – have a more benign course than those of stomach, colon, pancreas, melanoma, hematopoietic, and sarcomas. The liver is highly synthetic, but doesn’t fit so nicely because of the role in detoxification and the large role in glucose and fat catabolism. Further, this was at a time that we knew nothing about the cell death pathway and cellular repair, and how is it in concert with cell proliferation.
The first important reasoning about cancer metabolism was opened by Otto Warburg in the late 1920s. I have little reason to doubt his influence on Nathan Kaplan, who used the terms DPN(+/H) and TPN(+/H), disregarding the terms NAD(+/H) and NADP(+/H), although I was told it was because of the synthesis of the pyridine nucleotide adducts for study (APDPN, etc.).
In a recent article, I had an interesting response from Jose ES Rosalino:
In mRNA Translation and Energy Metabolism in Cancer
Topisirovic and N. Sonenberg – Cold Spring Harbor Symposia on Quantitative Biology, Volume LXXVI – http://dx.doi.org:/10.1101/sqb.2011.76.010785
“A prominent feature of cancer cells is the use of aerobic glycolysis under conditions in which oxygen levels are sufficient to support energy production in the mitochondria (Jones and Thompson 2009; Cairns et al. 2010). This phenomenon, named the “Warburg effect,” after its discoverer Otto Warburg, is thought to fuel the biosynthetic requirements of the neoplastic growth (Warburg 1956; Koppenol et al. 2011) and has recently been acknowledged as one of the hallmarks of cancer (Hanahan and Weinberg 2011). mRNA translation is the most energy-demanding process in the cell (Buttgereit and Brand 1995). Again, the use of aerobic glycolysis expression has being twisted.”
To understand my critical observation consider this: Aerobic glycolysis is the carbon flow that goes from Glucose to CO2 and water (includes Krebs cycle and respiratory chain for the restoration of NAD, FAD etc.
Anerobic glyclysis is the carbon flow that goes from glucose to lactate. It uses conversion of pyruvate to lactate to regenerate NAD.
“Pasteur effect” is an expression coined by Warburg it refers to the reduction in the carbon flow from glucose when oxygen is offered to yeasts. The major reason for that is in general terms, derived from the fact that carbon flow is regulated by several cell requirements but majorly by the ATP needs of the cell. Therefore, as ATP is generated 10 more efficiently in aerobiosis than under anaerobiosis, less carbon flow is required under aerobiosis than under anaerobiosis to maintain ATP levels. Warburg, after searching for the same regulatory mechanism in normal and cancer cells for comparison found that transformed cell continued their large flow of glucose carbons to lactate despite of the presence of oxygen.
So, it is wrong to describe that aerobic glycolysis continues in the presence of oxygen. It is what it is expected to occur. The wrong thing is that anaerobic glycolysis continues under aerobiosis.
In our discussion of transcription and cell regulatory processes, we have already encountered a substantial amount of “enzymology” that drives what is referred to as “epigenetics”. Enzymatic reactions are involved almost everywhere we look at the processes involved in RNA nontranscriptional affairs.
Enzyme catalysis
Pyruvate carboxylase is critical for non–small-cell lung cancer proliferation
K Sellers,…, TW-M Fan
J Clin Invest. Jan 2015; xx
http://dx.doi.org:/10.1172/JCI72873
Anabolic biosynthesis requires precursors supplied by the Krebs cycle, which in turn requires anaplerosis to replenish precursor intermediates. The major anaplerotic sources are pyruvate and glutamine, which require the activity of pyruvate carboxylase (PC) and glutaminase 1 (GLS1), respectively. Due to their rapid proliferation, cancer cells have increased anabolic and energy demands; however, different cancer cell types exhibit differential requirements for PC- and GLS-mediated pathways for anaplerosis and cell proliferation. Here, we infused patients with early-stage non–small-cell lung cancer (NSCLC) with uniformly 13C-labeled glucose before tissue resection and determined that the cancerous tissues in these patients had enhanced PC activity. Freshly resected paired lung tissue slices cultured in 13C6-glucose or 13C5, 15N2-glutamine tracers confirmed selective activation of PC over GLS in NSCLC. Compared with noncancerous tissues, PC expression was greatly enhanced in cancerous tissues, whereas GLS1 expression showed no trend. Moreover, immunohistochemical analysis of paired lung tissues showed PC overexpression in cancer cells rather than in stromal cells of tumor tissues. PC knockdown induced multinucleation, decreased cell proliferation and colony formation in human NSCLC cells, and reduced tumor growth in a mouse xenograft model. Growth inhibition was accompanied by perturbed Krebs cycle activity, inhibition of lipid and nucleotide biosynthesis, and altered glutathione homeostasis. These findings indicate that PC-mediated anaplerosis in early stage NSCLC is required for tumor survival and proliferation.
Accelerated glycolysis under aerobic conditions (the “Warburg effect”) has been a hallmark of cancer for many decades (1). It is now recognized that cancer cells must undergo many other metabolic reprograming changes (2) to meet the increased anabolic and energetic demands of proliferation (3, 4). It is also becoming clear that different cancer types may utilize a variety of metabolic adaptations that are context dependent, commensurate with the notion that altered metabolism is a hallmark of cancer (12). Enhanced glucose uptake and aerobic glycolysis generates both energy (i.e., ATP) and molecular precursors for the biosynthesis of complex carbohydrates, sugar nucleotides, lipids, proteins, and nucleic acids. However, increased glycolysis alone is insufficient to meet the total metabolic demands of proliferating cancer cells. The Krebs cycle is also a source of energy via the oxidation of pyruvate, fatty acids, and amino acids such as glutamine. Moreover, several Krebs cycle intermediates are essential for anabolic and glutathione metabolism, including citrate, oxaloacetate, and α-ketoglutarate (Figure 1A).
Figure 1. PC is activated in human NSCLC tumors. (A) PC and GLS1 catalyze the major anaplerotic inputs (blue) into the Krebs cycle to support the anabolic demand for biosynthesis (green). Also shown is the fate of 13C from 13C6-glucose through glycolysis and into the Krebs cycle via PC (red).
(B) Representative Western blots of PC and GLS1 protein expression levels in human NC lung (N) and NSCLC (C) tissues. (C) Pairwise PC and GLS1 expression (n = 86) was normalized to α-tubulin and plotted as the log10 ratio of CA/NC tissues. For PC, nearly all log ratios were positive (82 of 86), with a clustering in the 0.5–1 range (i.e., typically 3- to 10-fold higher expression in the tumor tissue; Wilcoxon test, P < 0.0001). In contrast, GLS1 expression was nearly evenly distributed between positive and negative log10 ratios and showed no statistically significant difference between the CA and NC tissues (Wilcoxon test, P = 0.213). Horizontal bar represents the median. (D) In vivo PC activity was enhanced in CA tissue compared with that in paired NC lung tissues (n = 34) resected from the same human patients given 13C6-glucose 2.5–3 hours before tumor resection. PC activity was inferred from the enrichment of 13C3-citrate (Cit+3), 13C5-Cit (Cit+5), 13C3-malate (Mal+3), and 13C3-aspartate (Asp+3) as determined by GC-MS. *P < 0.05 and **P < 0.01 by paired Student t test. Error bars represent the SEM.
Continued functioning of the Krebs cycle requires the replenishment of intermediates that are diverted for anabolic uses or glutathione synthesis. This replenishment process, or anaplerosis, is accomplished via 2 major pathways: glutaminolysis (deamidation of glutamine via glutaminase [GLS] plus transamination of glutamate to α-ketoglutarate) and carboxylation of pyruvate to oxaloacetate via ATP-dependent pyruvate carboxylase (PC) (EC 6.4.1.1) (refs. 3, 20, 21, and Figure 1A). The relative importance of these pathways is likely to depend on the nature of the cancer and its specific metabolic adaptations, including those to the microenvironment (20, 22). For example, glutaminolysis was shown to be activated in the glioma cell line SF188, while PC activity was absent, despite the high PC activity present in normal astrocytes. However, SF188 cells use PC to compensate for GLS1 suppression or glutamine restriction (20), and PC, rather than GLS1, was shown to be the major anaplerotic input to the Krebs cycle in primary glioma xenografts in mice. It is also unclear as to the relative importance of PC and GLS1 in other cancer cell types or, most relevantly, in human tumor tissues in situ. Our preliminary evidence from 5 non–small-cell lung cancer (NSCLC) patients indicated that PC expression and activity are upregulated in cancerous (CA) compared with paired noncancerous (NC) lung tissues (21), although it was unclear whether PC activation applies to a larger NSCLC cohort or whether PC expression was associated with the cancer and/or stromal cells
Here, we have greatly extended our previous findings (21) in a larger cohort (n = 86) by assessing glutaminase 1 (GLS1) status and analyzing in detail the biochemical and phenotypic consequences of PC suppression in NSCLC. We found PC activity and protein expression levels to be, on average, respectively, 100% and 5- to 10-fold higher in cancerous (CA) lung tissues than in paired NC lung tissues resected from NSCLC patients, whereas GLS1 expression showed no significant trend. We have also applied stable isotope–resolved metabolomic (SIRM) analysis to paired freshly resected CA and NC lung tissue slices in culture (analogous to the Warburg slices; ref. 25) using either [U-13C] glucose or [U-13C,15N] glutamine as tracers. This novel method provided information about tumor metabolic pathways and dynamics without the complication of whole-body metabolism in vivo.
PC expression and activity, but not glutaminase expression, are significantly enhanced in early stages of malignant NSCLC tumors. PC protein expression was significantly higher in primary NSCLC tumors than in paired adjacent NC lung tissues (n = 86, P < 0.0001, Wilcoxon test) (Figure 1, B and C). The median PC expression was 7-fold higher in the tumor, and the most probable (modal) overexpression in the tumor was approximately 3-fold higher (see Supple-mental Table 1; supplemental material available online with this article; http://dx.doi.org:/10.1172/JCI72873DS1). We found that PC expression was also higher in the tumor tissue compared with that detected in the NC tissue in 82 of 86 patients. In contrast, GLS1 expression was not significantly different between the tumor and NC tissues (P = 0.213, Wilcoxon test) (Figure 1C and Supplemental Table 1). The 13C3-Asp produced from 13C6-glucose (Figure 1A) infused into NSCLC patients was determined by gas chromatography–mass spectrometry (GC-MS) to estimate in vivo PC activity. A bolus injection of 10 g 13C6-glucose in 50 ml saline led to an average of 44% 13C enrichment in the plasma glucose immediately after infusion (Supplemental Table 2). Because the labeled glucose was absorbed by various tissues over the approximately 2.5 hours between infusion and tumor resection, plasma glucose enrichment dropped to 17% (Supplemental Table 2). The labeled glucose in both CA and NC lung tissues was metabolized to labeled lactate, but this occurred to a much greater extent in the CA tissues (Supplemental Figure 1A), which indicates accelerated glycolysis in these tissues.
Fresh tissue (Warburg) slices confirm enhanced PC and Krebs cycle activity in NSCLC. To further assess PC activity relative to GLS1 activity in human lung tissues, thin (<1 mm thick) slices of paired CA and NC lung tissues freshly resected from 13 human NSCLC patients were cultured in 13C6-glucose or 13C5,15N2-glutamine for 24 hours. These tissues maintain biochemical activity and histological integrity for at least 24 hours under culture conditions (Figure 2A, Supplemental Figure 2, A and B, and ref. 26). When the tissues were incubated with 13C6-glucose, CA slices showed a significantly greater percentage of enrichment in glycolytic 13C3-lactate (3 in Figure 2B) than did the NC slices, indicative of the Warburg effect. In addition, the CA tissues had significantly higher fractions of 13C4-, 13C5-, and 13C6-citrate (4, 5, and 6 of citrate, respectively, in Figure 2B) than did the NC tissues. These isotopologs require the combined action of PDH, PC, and multiple turns of the Krebs cycle (Figure 2C). Consistent with the labeled citrate data, the increase in the percentage of enrichment of 13C3-, 13C4-, and 13C5-glutamate (3, 4, and 5 of glutamate, respectively, in Figure 2B) in the CA tissues indicates enhanced Krebs cycle and PC activity.
Figure 2. Ex vivo CA lung tissue slices have enhanced oxidation of glucose through glycolysis and the Krebs cycle with and without PC input compared with that of paired NC lung slices. Thin slices of CA and NC lung tissues freshly resected from 13 human NSCLC patients were incubated with 13C6-glucose for 24 hours as described in the Methods. The percentage of enrichment of lactate, citrate, glutamate, and aspartate was determined by GC-MS. (A) 1H{13C} HSQC NMR showed an increase in labeled lactate, glutamate, and aspartate. In addition, CA tissues had elevated 13C abundance in the ribose moiety of the adenine-containing nucleotides (1′-AXP), indicating that the tissues were viable and had enhanced capacity for nucleotide synthesis. (B) CA tissue slices (n = 13) showed increased glucose metabolism through glycolysis based on the increased percentage of enrichment of 13C3-lactate (“3”), and through the Krebs cycle based on the increased percentage of enrichment of 13C4–6-citrate (“4–6”) and 13C3–5-glutamate (“3–5”) (see 13C fate tracing in C). *P < 0.05 and **P < 0.01 by paired Student’s t test. Error bars represent the SEM. (C) An atom-resolved map illustrates how PC, PDH, and 2 turns of the Krebs cycle activity produced the 13C isotopologs of citrate and glutamate in B, whose enrichment were significantly enhanced in CA tissue slices.
Figure 4. PC suppression via shRNA inhibits proliferation and tumorigenicity of human NSCLC cell lines in vitro and in vivo. Proliferation and colony-formation assays were initiated 1 week after transduction and selection with puromycin. A549 xenograft in NSG mice was performed 8 days after transduction. *P < 0.01, **P < 0.001, ***P < 0.0001, and ****P < 0.00001 by Student t test, assuming unequal variances. Error bars represent the SEM. (A) NSCLC cells lines were transduced with shPC55 or shEV. Proliferation assays (n = 6) revealed substantial growth inhibition induced by PC knockdown in all 5 cell lines after a relatively long latency period. (B) Colony-formation assays indicated that PC knockdown reduced the capacity of A549 and PC9 cells to form colonies in soft agar (n = 3). (C) Tumor xenografts from shPC55-transduced A549 cells showed a 2-fold slower growth rate than did control shEV tumors (P < 0.001 by the unpaired Welch version of the t test). Tumor size was calculated as πab/4, where a and b are the x,y diameters. Each point represents an average of 6 mice. The solid lines are the nonlinear regression fits to the equation: size = a + bt2, as described in the Methods. (D) The extent of PC knockdown in the mouse xenografts (n = 6) was lesser than that in cell cultures, leading to less attenuation of PC expression (30%–60% of control) and growth inhibition. In addition, PC expression in the excised tumors correlated with the individual growth rates, as determined by Pearson’s correlation coefficient.
Fatty acyl synthesis from 13C5-glutamine (“Even” in Figure 6B) via glutaminolysis and the Krebs cycle was greatly attenuated in PC-suppressed cells. Taken together, these results suggest that PC knockdown severely inhibits lipid production by blocking the biosynthesis of fatty acyl components but not the glucose-derived glycerol backbone. This is consistent with decreased Krebs cycle activity (Figure 5), which in turn curtails citrate export from the mitochondria to supply the fatty acid precursor acetyl CoA in the cytoplasm.
Figure 5. PC knockdown perturbs glucose and glutamine flux through the Krebs cycle. 13C Isotopolog concentrations were determined by GC-MS (n = 3). Values represent the averages of triplicates, with standard errors. *P < 0.05, **P < 0.01, ***P < 0.001, and ****P < 0.0001 by Student’s t test, assuming unequal variances. The experiments were repeated 3 times. (A) A549 cells were transduced with shPC55 for 10 days before incubation with 13C6-glucose for 24 hours. As expected, the 13C isotopologs of Krebs cycle metabolites produced via PC and Krebs cycle activity were depleted in PC-deficient cells (tracked by blue dots in the atom-resolved map and blue circles in the bar graphs; see also Figure 2C). In addition, 13C6-glucose metabolism via PDH was also perturbed (indicated by red dots and circles). (B) Treatment of PC-knockdown cells with 13C5,15N2-glutamine revealed that anaplerotic input via GLS did not compensate for the loss of PC activity, since GLS activity was attenuated, as inferred from the activity markers (indicated by red dots and circles). Decarboxylation of glutamine-derived malate by malic enzyme (ME) and reentry of glutamine-derived pyruvate into the Krebs cycle via PC or PDH (shown in blue and green, respectively) were also attenuated. Purple diamonds denote 15N; black diamonds denote 14N.
Figure 6. PC suppression hinders Krebs cycle–fueled biosynthesis. (A) 13C atom–resolved pyrimidine biosynthesis from 13C6-glucose and 13C5-glutamine is depicted with a 13C5-ribose moiety (red dots) produced via the pentose phosphate pathway (PPP) and 13C1-3 uracil ring (blue dots) derived from 13C2-4-aspartate produced via the Krebs cycle or the combined action of ME and PC (blue dots). A549 cells transduced with shPC55 or shEV were incubated with 13C6-glucose or 13C5-glutamine for 24 hours. Fractional enrichment of UTP and CTP isotopologs from FT-ICR-MS analysis of polar cell extracts showed reduced enrichment of 13C6-glucose–derived 13C5-ribose (the “5” isotopolog) and 13C6-glucose– or 13C5-glutamine–derived 13C1-3-pyrimidine rings (the “6–8” or “1–3” isotopologs, highlighted by dashed green rectangles; for the “6–8” isotopologs, 5 13Cs arose from ribose and 1–3 13Cs from the ring) (10, 45). These data suggest that PC knockdown inhibits de novo pyrimidine biosynthesis from both glucose and glutamine. (B) Glucose and glutamine carbons enter fatty acids via citrate. FT-ICR-MS analysis of labeled lipids from the nonpolar cell extracts showed that PC knockdown severely inhibited the incorporation of glucose and glutamine carbons into the fatty acyl chains (even) and fatty acyl chains plus glycerol backbone (odd >3) of phosphatidylcholine lipids. However, synthesis of the 13C3-glycerol backbone (the “3” isotopolog) or its precursor 13C3-α-glycerol-3-phosphate (αG3P, m+3) from 13C6-glucose was enhanced rather than inhibited by PC knockdown. These data suggest that PC suppression specifically hinders fatty acid synthesis in A549 cells. Values represent the averages of triplicates (n = 3), with standard errors. *P < 0.05, **P < 0.01, and ***P < 0.001 by Student’s t test, assuming unequal variances.
De novo glutathione synthesis was analyzed by 1H{13C} HSQC NMR. Glutathione synthesis from both glucose and glutamine was suppressed by PC knockdown (Supplemental Figure 9, A and B). Reduced de novo synthesis led to a large decrease in the total level of reduced glutathione (GSH; Supplemental Figure 12, A and B). At the same time, PC-knockdown cells accumulated slightly more oxidized GSH (GSSG; Supplemental Figure 12, A and B), leading to a significantly reduced GSH/GSSG ratio both in cell culture and in vivo (Supplemental Figure 12C). To determine whether this perturbation of glutathione homeostasis compromises the ability of PC-suppressed cells to handle oxidative stress, we measured ROS production by DCFDA fluorescence. PC-knockdown cells had over 70% more basal ROS than did control cells (0 mM H2O2; Supplemental Figure 12D). When cells were exposed to increasing concentrations of H2O2, the knockdown cells were less able to quench ROS, as they produced up to 300% more ROS than did control cells (Supplemental Figure 12D). However, N-acetylcysteine (NAC) at 10 mM did not rescue the growth of PC-knockdown cells, suggesting that such a growth effect is not simply related to an inability to regenerate GSH from GSSG. Altogether, these results show that PC suppression compromises anaplerotic input into the Krebs cycle, which in turn reduces the activity of the Krebs cycle, while limiting the ability of A549 cells to synthesize nucleotides, lipids, and glutathione. These downstream effects of PC knockdown were also evident when comparing the metabolism of shPC55-transduced A549 cells against that of A549 cells transduced with a scrambled vector (shScr) (Supplemental Figure 13), which suggests that they are on-target effects of PC knockdown.
- Warburg O. On the origin of cancer cells. Science. 1956;123(3191):309–314. 2. Dang CV, Semenza GL. Oncogenic alterations of metabolism. Trends Biochem Sci. 1999; 24(2):68–72.
3. Fan TW, et al. Rhabdomyosarcoma cells show an energy producing anabolic metabolic phenotype compared with primary myocytes. Mol Cancer. 2008;7:79.
4. Vander Heiden MG, Cantley LC, Thompson CB. Understanding the Warburg effect: the metabolic requirements of cell proliferation. Science. 2009;324(5930):1029–1033.
10. Le A, et al. Glucose-independent glutamine metabolism via TCA cycling for proliferation and survival in B cells. Cell Metab. 2012;15(1):110–121
20. Cheng T, et al. Pyruvate carboxylase is required for glutamine-independent growth of tumor cells. Proc Natl Acad Sci U S A. 2011;108(21):8674–8679.
21. Fan TW, et al. Altered regulation of metabolic pathways in human lung cancer discerned by (13) C stable isotope-resolved metabolomics (SIRM). Mol Cancer. 2009;8:41.
22. Marin-Valencia I, et al. Analysis of tumor metabolism reveals mitochondrial glucose oxidation in genetically diverse human glioblastomas in the mouse brain in vivo. Cell Metab. 2012;15(6):827–837.
25. Warburg O. Versuche an überlebendem Carcinomgewebe (Methoden). Biochem Zeitschr. 1923;142:317–333.
45. Lorkiewicz P, Higashi RM, Lane AN, Fan TW. High information throughput analysis of nucleotides and their isotopically enriched isotopologues by direct-infusion FTICR-MS. Metabolomics. 2012;8(5):930–939.
In vivo HIF-mediated reductive carboxylation is regulated by citrate levels and sensitizes VHL-deficient cells to glutamine deprivation.
Gameiro PA, Yang J, Metelo AM,…, Stephanopoulos G, Iliopoulos O.
Cell Metab. 2013 Mar 5; 17(3):372-85.
http://dx.doi.org:/10.1016/j.cmet.2013.02.002
Hypoxic and VHL-deficient cells use glutamine to generate citrate and lipids through reductive carboxylation (RC) of α-ketoglutarate. To gain insights into the role of HIF and the molecular mechanisms underlying RC, we took advantage of a panel of disease-associated VHL mutants and showed that HIF expression is necessary and sufficient for the induction of RC in human renal cell carcinoma (RCC) cells. HIF expression drastically reduced intracellular citrate levels. Feeding VHL-deficient RCC cells with acetate or citrate or knocking down PDK-1 and ACLY restored citrate levels and suppressed RC. These data suggest that HIF-induced low intracellular citrate levels promote the reductive flux by mass action to maintain lipogenesis. Using [(1-13)C]glutamine, we demonstrated in vivo RC activity in VHL-deficient tumors growing as xenografts in mice. Lastly, HIF rendered VHL-deficient cells sensitive to glutamine deprivation in vitro, and systemic administration of glutaminase inhibitors suppressed the growth of RCC cells as mice xenografts.
Cancer cells undergo fundamental changes in their metabolism to support rapid growth, adapt to limited nutrient resources, and compete for these supplies with surrounding normal cells. One of the metabolic hallmarks of cancer is the activation of glycolysis and lactate production even in the presence of adequate oxygen. This is termed the Warburg effect, and efforts in cancer biology have revealed some of the molecular mechanisms responsible for this phenotype (Cairns et al., 2011). More recently, 13C isotopic studies have elucidated the complementary switch of glutamine metabolism that supports efficient carbon utilization for anabolism and growth (DeBerardinis and Cheng, 2010). Acetyl-CoA is a central biosynthetic precursor for lipid synthesis, being generated from glucose-derived citrate in well-oxygenated cells (Hatzivassiliou et al., 2005). Warburg-like cells, and those exposed to hypoxia, divert glucose to lactate, raising the question of how the tricarboxylic acid (TCA) cycle is supplied with acetyl-CoA to support lipogenesis. We and others demonstrated, using 13C isotopic tracers, that cells under hypoxic conditions or defective mitochondria primarily utilize glutamine to generate citrate and lipids through reductive carboxylation (RC) of α-ketoglutarate by isocitrate dehydrogenase 1 (IDH1) or 2 (IDH2) (Filipp et al., 2012; Metallo et al., 2012; Mullen et al., 2012; Wise et al., 2011).
The transcription factors hypoxia inducible factors 1α and 2α (HIF-1α, HIF-2α) have been established as master regulators of the hypoxic program and tumor phenotype (Gordan and Simon, 2007; Semenza, 2010). In addition to tumor-associated hypoxia, HIF can be directly activated by cancer-associated mutations. The von Hippel-Lindau (VHL) tumor suppressor is inactivated in the majority of sporadic clear-cell renal carcinomas (RCC), with VHL-deficient RCC cells exhibiting constitutive HIF-1α and/or HIF-2α activity irrespective of oxygen availability (Kim and Kaelin, 2003). Previously, we showed that VHL-deficient cells also relied on RC for lipid synthesis even under normoxia. Moreover, metabolic profiling of two isogenic clones that differ in pVHL expression (WT8 and PRC3) suggested that reintroduction of wild-type VHL can restore glucose utilization for lipogenesis (Metallo et al., 2012). The VHL tumor suppressor protein (pVHL) has been reported to have several functions other than the well-studied targeting of HIF. Specifically, it has been reported that pVHL regulates the large subunit of RNA polymerase (Pol) II (Mikhaylova et al., 2008), p53 (Roe et al., 2006), and the Wnt signaling regulator Jade-1. VHL has also been implicated in regulation of NF-κB signaling, tubulin polymerization, cilia biogenesis, and proper assembly of extracellular fibronectin (Chitalia et al., 2008; Kim and Kaelin, 2003; Ohh et al., 1998; Thoma et al., 2007; Yang et al., 2007). Hypoxia inactivates the α-ketoglutarate-dependent HIF prolyl hydroxylases, leading to stabilization of HIF. In addition to this well-established function, oxygen tension regulates a larger family of α-ketoglutarate-dependent cellular oxygenases, leading to posttranslational modification of several substrates, among which are chromatin modifiers (Melvin and Rocha, 2012). It is therefore conceivable that the effect of hypoxia on RC that was reported previously may be mediated by signaling mechanisms independent of the disruption of the pVHL-HIF interaction. Here we
- demonstrate that HIF is necessary and sufficient for RC,
- provide insights into the molecular mechanisms that link HIF to RC,
- detected RC activity in vivo in human VHL-deficient RCC cells growing as tumors in nude mice,
- provide evidence that the reductive phenotype of VHL-deficient cells renders them sensitive to glutamine restriction in vitro, and
- show that inhibition of glutaminase suppresses growth of VHL-deficient cells in nude mice.
These observations lay the ground for metabolism-based therapeutic strategies for targeting HIF-driven tumors (such as RCC) and possibly the hypoxic compartment of solid tumors in general.
HIF Inactivation Is Necessary for Downregulation of Reductive Carboxylation by pVHL
(A) Expression of HIF-1 α, HIF-2α, and their target protein GLUT1 in UMRC2-derived cell lines, as indicated.
(B) Carbon atom transition map: the fate of [1-13C1] and [5-13C1]glutamine used to trace reductive carboxylation in this work (carbon atoms are represented by circles). The [1-13C1] (green circle) and [5-13C1] (red circle) glutamine-derived isotopic labels are retained during the reductive TCA cycle (bold red pathway). Metabolites containing the acetyl-CoA carbon skeleton are highlighted by dashed circles.
(C) Relative contribution of reductive carboxylation.
(D and E) Relative contribution of glucose oxidation to the carbons of indicated metabolites (D) and citrate (E). Student’s t test compared VHL-reconstituted to vector-only or to VHL mutants (Y98N/Y112N). Error bars represent SEM. Pyr, pyruvate; Lac, lactate; AcCoA, acetyl-CoA, Cit, citrate; IsoCit, isocitrate; Akg, α-ketoglutarate; Suc, succinate; Fum, fumarate; Mal, malate; OAA, oxaloacetate; Asp, aspartate; Glu, glutamate; PDH, pyruvate dehydrogenase; ME, malic enzyme; IDH, isocitrate dehydrogenase enzymes; ACO, aconitase enzymes; ACLY, ATP-citrate lyase; GLS, glutaminase.
To test the effect of HIF activation on the overall glutamine incorporation in the TCA cycle, we labeled an isogenic pair of VHL-deficient and VHL-reconstituted UMRC2 cells with [U-13C5]glutamine, which generates M4 fumarate, M4 malate, M4 aspartate, and M4 citrate isotopomers through glutamine oxidation. As seen in Figure S1B, VHL-deficient/VHL-positive UMRC2 cells exhibit similar enrichment of M4 fumarate, M4 malate, and M4 asparate (but not citrate) showing that VHL-deficient cells upregulate reductive carboxylation without compromising oxidative metabolism from glutamine. Next, we tested whether HIF inactivation by pVHL is necessary to regulate the reductive utilization of glutamine for lipogenesis. To this end, we traced the relative incorporation of [U-13C6]glucose or [5-13C1]glutamine into palmitate. Labeled carbon derived from [5-13C1]glutamine can be incorporated into fatty acids exclusively through RC, and the labeled carbon cannot be transferred to palmitate through the oxidative TCA cycle (Figure 1B, red carbons). Tracer incorporation from [5-13C1]glutamine occurs in the one carbon (C1) of acetyl-CoA, which results in labeling of palmitate at M1, M2, M3, M4, M5, M6, M7, and M8 mass isotopomers. In contrast, lipogenic acetyl-CoA molecules originating from [U-13C6]glucose are fully labeled, and the labeled palmitate is represented by M2, M4, M6, M8, M10, M12, M14, and M16 mass isotopomers. VHL-deficient control cells and cells expressing pVHL type 2B mutants exhibited high palmitate labeling from the [5-13C1]glutamine; conversely, reintroduction of wild-type or type 2C pVHL mutant (L188V) resulted in high labeling from [U-13C6]glucose (Figures 2A and 2B, box inserts highlight the heavier mass isotopomers).

hif-inactivation-is-necessary-for-downregulation-of-reductive-carboxylation-by-pvhl
Figure 2. HIF Inactivation Is Necessary for Downregulation of Reductive Lipogenesis by pVHL
Next, to determine the specific contribution from glucose oxidation or glutamine reduction to lipogenic acetyl-CoA, we performed isotopomer spectral analysis (ISA) of palmitate labeling patterns. ISA indicates that wild-type pVHL or pVHL L188V mutant-reconstituted UMRC2 cells relied mainly on glucose oxidation to produce lipogenic acetyl-CoA, while UMRC2 cells reconstituted with a pVHL mutant defective in HIF inactivation (Y112N or Y98N) primarily employed RC. Upon disruption of the pVHL-HIF interaction, glutamine becomes the preferred substrate for lipogenesis, supplying 70%–80% of the lipogenic acetyl-CoA (Figure 2C). This is not a cell-line-specific phenomenon, but it applies to VHL-deficient human RCC cells in general; the same changes are observed in 786-O cells reconstituted with wild-type pVHL or mutant pVHL or infected with vector only as control (Figure S2). Type 2A pVHL mutants (Y112H, which retain partial HIF binding) confer an intermediate reductive phenotype between wild-type VHL (which inactivates HIF) and type 2B pVHL mutants (which are totally defective in HIF regulation) as seen in Figures 1 and and 2.2. Taken together, these data demonstrate that the ability of pVHL to regulate reductive carboxylation and lipogenesis from glutamine tracks genetically with its ability to bind and degrade HIF, at least in RCC cells.
HIF Is Sufficient to Induce RC from Glutamine in RCC Cells
To test the hypothesis that HIF-2α is sufficient to promote RC from glutamine, we expressed a pVHL-insensitive HIF-2α mutant (HIF-2α P405A/P531A, marked as HIF-2α P-A) in VHL-reconstituted 786-O cells (Figure 3). HIF-2α P-A is constitutively expressed in this polyclonal cell population, despite the reintroduction of wild-type VHL, reflecting a pseudohypoxia condition (Figure 3A). We confirmed that this mutant is transcriptionally active by assaying for the expression of its targets genes GLUT1, LDHA, HK1, EGLN, HIG2, and VEGF (Figures 3B and S3A). As shown in Figure 3C, reintroduction of wild-type VHLinto 786-O cells suppressed RC, whereas the expression of the constitutively active HIF-2α mutant was sufficient to stimulate this reaction, restoring the M1 enrichment of TCA cycle metabolites observed in VHL-deficient 786-O cells. Expression of HIF-2α P-A also led to a concomitant decrease in glucose oxidation, corroborating the metabolic alterations observed in glutamine metabolism (Figures 3D and 3E). Additional evidence of the HIF2α-regulation on the reductive phenotype was obtained with [U-13C5]glutamine, which generates M5 citrate, M3 fumarate, M3 malate, and M3 aspartate through RC (Figure 3F).
Our current work showed that HIF-2α is sufficient to induce the reductive program in RCC cells that express only the HIF-2α paralog, while mouse NEK cells appeared to use HIF-1α preferentially to promote RC. Together with the evidence that HIF-1α and HIF-2α may have opposite roles in tumor growth, it is possible that the cellular context dictates which paralog activates RC. It is also possible that HIF-2α adopts the RC regulatory function of HIF-1α upon deletion of the latter in RCC cells. Further studies are warranted in understanding the relative role of HIF-α paralogs in regulating RC in different cell types.
Finally, the selective sensitivity to glutaminase inhibitors exhibited by VHL-deficient cells, together with the observed RC activity in vivo, strongly suggests that reductive glutamine metabolism may fuel tumor growth. Investigating whether the reductive flux correlates with tumor hypoxia and/or contributes to the actual cell survival under low oxygen conditions is warranted. Together, our findings underscore the biological significance of reductive carboxylation in VHL-deficient RCC cells. Targeting this metabolic signature of HIF may open viable therapeutic opportunities for the treatment of hypoxic and VHL-deficient tumors.
Elevated levels of 14-3-3 proteins, serotonin, gamma enolase and pyruvate kinase identified in clinical samples from patients diagnosed with colorectal cancer
Dowling P, Hughes DJ, Larkin AM, Meiller J, …, Clynes M
Clin Chim Acta. 2015 Feb 20;441:133-41.
http://dx.doi.org:/10.1016/j.cca.2014.12.005.
Highlights
- Identification of a number of significant proteins and metabolites in CRC patients
- 14-3-3 proteins, serotonin, gamma enolase and pyruvate kinase all significant
- Intense staining for 14-3-3 epsilon in tissue specimens from CRC patients
- Tissue 14-3-3 epsilon levels concordant with abundance in the circulation
- Biomolecules provide insight into the biology associated with tumor development
Background: Colorectal cancer (CRC), a heterogeneous disease that is common in both men and women, continues to be one of the predominant cancers worldwide. Lifestyle, diet, environmental factors and gene defects all contribute towards CRC development risk. Therefore, the identification of novel biomarkers to aid in the management of CRC is crucial. The aim of the present study was to identify candidate biomarkers for CRC, and to develop a better understanding of their role in tumorogenesis. Methods: In this study, both plasma and tissue samples from patients diagnosed with CRC, together with non-malignant and normal controls were examined using mass spectrometry based proteomics and metabolomics approaches.
Results: It was established that the level of several biomolecules, including serotonin, gamma enolase, pyruvate kinase and members of the 14-3-3 family of proteins, showed statistically significant changes when comparing malignant versus non-malignant patient samples, with a distinct pattern emerging mirroring cancer cell energy production. Conclusion: The diagnosis and management of CRC could be enhanced by the discovery and validation of new candidate biomarkers, as found in this study, aimed at facilitating early detection and/or patient stratification together with providing information on the complex behavior of cancer cells.
Table 2 – List of proteins found to show statistically significant differences between control (n=10) and CRC (n=16; 8 stage III/8 stage IV) patient plasma samples fractionated using Proteominer beads. Information provided in the table includes accession number, discovery platform used, protein description, the number of unique peptides for quantitation, a mascot score for protein identification (confidence number), ANOVA p-values(≥0.05), fold change in protein abundance (≥2-fold) and highest/lowest mean change.
Table 3 – List of metabolites found to show statistically significant differences between control (n=8) and CRC (n=16; 8 stage III/8 stage IV) patient plasma samples. Included in the table is the Human Metabolome Database (HMDB) entry, platform used to analyse the biochemicals, biochemical name, ANOVA p-values (≥0.05), fold-change and highest/lowest mean change.
Fig.1. Box and whisker plots for: (A) M2-PK, (B) gamma enolase, (C) 14-3-3 (pan) and (D) serotonin. ELISA analysisofM2-PK, gamma enolase, serotonin and 14-3-3 (pan) in plasma samples from control (n = 20), polyps (n = 10), adenoma (n = 10), stage I/II CRC (n= 20) and stage III/IV (n= 20)patients. The figures show statistically significant p-value for various comparisons between the different sample groups. This ELISA measurement for 14-3-3 detects all known isoforms of mammalian 14-3-3 proteins (β/α, γ, ε, η, ζ/δ, θ/τ and σ).
Role of lipid peroxidation derived 4-hydroxynonenal (4-HNE) in cancer- Focusing on mitochondria
Huiqin Zhonga, Huiyong Yin
Redox Biol Apr 2015; 4: 193–199
Oxidative stress-induced lipid peroxidation has been associated with human physiology and diseases including cancer. Overwhelming data suggest that reactive lipid mediators generated from this process, such as 4-hydroxynonenal (4-HNE), are biomarkers for oxidative stress and important players for mediating a number of signaling pathways. The biological effects of 4-HNE are primarily due to covalent modification of important biomolecules including proteins, DNA, and phospholipids containing amino group. In this review, we summarize recent progress on the role of 4-HNE in pathogenesis of cancer and focus on the involvement of mitochondria: generation of 4-HNE from oxidation of mitochondria-specific phospholipid cardiolipin; covalent modification of mitochondrial proteins, lipids, and DNA; potential therapeutic strategies for targeting mitochondrial ROS generation, lipid peroxidation, and 4-HNE.
Reactive oxygen species (ROS), such as superoxide anion, hydrogen peroxide, hydroxyl radicals, singlet oxygen, and lipid peroxyl radicals, are ubiquitous and considered as byproducts of aerobic life [1]. Most of these chemically reactive molecules are short-lived and react with surrounding molecules at the site of formation while some of the more stable molecules diffuse and cause damages far away from their sites of generation. Overproduction of these ROS, termed oxidative stress, may provoke oxidation of polyunsaturated fatty acids (PUFAs) in cellular membranes through free radical chain reactions and form lipid hydroperoxides as primary products [2]; some of these primary oxidation products may decompose and lead to the formation of reactive lipid electrophiles. Among these lipid peroxidation (LPO) products, 4-hydroxy-2-nonenals (4-HNE) represents one of the most bioactive and well-studied lipid alkenals [3]. 4-HNE can modulate a number of signaling processes mainly through forming covalent adducts with nucleophilic functional groups in proteins, nucleic acids, and membrane lipids. These properties have been extensively summarized in some excellent reviews [4], [5], [6], [7], [8], [9] and [10].
Conclusions
Lipid peroxidation-derived 4-HNE is a prototypical reactive lipid electrophile that readily forms covalent adducts with nucleophilic functional groups in macromolecule such as proteins, DNA, and lipids (Fig. 3). A body of work have shown that generation of 4-HNE macromolecule adducts plays important pathological roles in cancer through interactions with mitochondria. First of all, mitochondria are one of the most important cellular sites of 4-HNE production, presumably from oxidation of abundant PUFA-containing lipids, such as L4CL. Emerging evidence suggest that this process play a critical role in apoptosis. Secondly, in response to the toxicity of 4-HNE, mitochondria have developed a number of defense mechanisms to convert 4-HNE to less reactive chemical species and minimize its toxic effects. Thirdly, 4-HNE macromolecule adducts in mitochondria are involved in the cancer initiation and progression by modulating mitochondrial function and metabolic reprogramming. 4-HNE protein adducts have been widely studied but the mtDNA modification by lipid electrophiles has yet to emerge. The biological consequence of PE modification remains to be defined, especially in the context of cancer. Last but not the least, manipulation of mitochondrial ROS generation, lipid peroxidation, and production of lipid electrophiles may be a viable approach for cancer prevention and treatment.
K.J. Davies. Oxidative stress, antioxidant defenses, and damage removal, repair, and replacement systems. IUBMB Life, 50 (4–5) (2000): 279–289. http://dx.doi.org/10.1080/713803728.1132732
Shoeb, N.H. Ansari, S.K. Srivastava, K.V. Ramana. 4-hydroxynonenal in the pathogenesis and progression of human diseases. Current Medicinal Chemistry, 21 (2) (2014):230–237 http://dx.doi.org/10.2174/09298673113209990181 23848536
J.D. West, L.J. Marnett. Endogenous reactive intermediates as modulators of cell signaling and cell death. Chemical Research in Toxicology, 19 (2)(2006): 173–194 http://dx.doi.org/10.1021/tx050321u.16485894
Barrera, S. Pizzimenti,…, A. Lepore, et al. Role of 4-hydroxynonenal-protein adducts in human diseases. Antioxidants & Redox Signaling (2014) http://dx.doi.org/10.1089/ars.2014.6166 25365742
J.R. Roede, D.P. Jones. Reactive species and mitochondrial dysfunction: mechanistic significance of 4-hydroxynonenal. Environmental and Molecular Mutagenesis, 51 (5) (2010):380–390 http://dx.doi.org/10.1002/em.20553 20544880
Guéraud, M. Atalay, N. Bresgen, …, I. Jouanin, W. Siems, K. Uchida. Chemistry and biochemistry of lipid peroxidation products. Free Radical Research, 44 (10) (2010): 1098–1124 http://dx.doi.org/10.3109/10715762.2010.498477.20836659
Z.H. Chen, E. Niki. 4-hydroxynonenal (4-HNE) has been widely accepted as an inducer of oxidative stress. Is this the whole truth about it or can 4-HNE also exert protective effects? IUBMB Life, 58 (5–6) (2006): 372–373. http://dx.doi.org/10.1080/15216540600686896 16754333
Aldini, M. Carini, K.-J. Yeum, G. Vistoli. Novel molecular approaches for improving enzymatic and nonenzymatic detoxification of 4-hydroxynonenal: toward the discovery of a novel class of bioactive compounds. Free Radical Biology and Medicine, 69 (0) (2014): 145–156 http://dx.doi.org/10.1016/j.freeradbiomed.2014.01.017 24456906
Fig. 2. Catabolism of 4-HNE in mitochondria. ROS induced lipid peroxidation in IMM and OMM (outer membrane of mitochondria) leads to 4-HNE formation. In matrix, 4-HNE conjugation with GSH produces glutathionyl-HNE (GS-HNE); this process occurs spontaneously or can be catalyzed by GSTs. 4-HNE is reduced to 1,4-dihydroxy-2-nonene (DHN) catalyzed ADH or AKRs. ALDH2 catalyzes the oxidation of 4-HNE to form 4-hydroxy-2-nonenoic acid (HNA).

Role of 4-hydroxynonenal in cancer focusing on mitochondria
http://ars.els-cdn.com/content/image/1-s2.0-S2213231714001359-gr2.jpg

http://ars.els-cdn.com/content/image/1-s2.0-S2213231714001359-gr3.jpg
Fig. 3. A schematic view of 4-HNE macromolecule adducts in cancer cell. 4-HNE macromolecule adducts are involved in cancer initiation, progression, metabolic reprogramming, and cell death. 4-HNE (depicted as a zigzag line) is produced through ROS-induced lipid peroxidation of mitochondrial and plasma membranes. Biological consequences of 4-HNE adduction:
- reducing membrane integrity;
- affecting protein function in cytosol;
- causing nuclear and mitochondrial DNA damage;
- inhibiting ETC activity;
- activating UCPs activity;
- reducing TCA activity;
- inhibiting ALDH2 activity.
DNA methylation paradigm shift: 15-lipoxygenase-1 upregulation in prostatic intraepithelial neoplasia and prostate cancer by atypical promoter hypermethylation.
Kelavkar UP1, Harya NS, … , Chandran U, Dhir R, O’Keefe DS.
Prostaglandins Other Lipid Mediat. 2007 Jan; 82(1-4):185-97
Fifteen (15)-lipoxygenase type 1 (15-LO-1, ALOX15), a highly regulated, tissue- and cell-type-specific lipid-peroxidating enzyme has several functions ranging from physiological membrane remodeling, pathogenesis of atherosclerosis, inflammation and carcinogenesis. Several of our findings support a possible role for 15-LO-1 in prostate cancer (PCa) tumorigenesis. In the present study, we identified a CpG island in the 15-LO-1 promoter and demonstrate that the methylation status of a specific CpG within this island region is associated with transcriptional activation or repression of the 15-LO-1 gene. High levels of 15-LO-1 expression was exclusively correlated with one of the CpG dinucleotides within the 15-LO-1 promoter in all examined PCa cell-lines expressing 15-LO-1 mRNA. We examined the methylation status of this specific CpG in microdissected high grade prostatic intraepithelial neoplasia (HGPIN), PCa, metastatic human prostate tissues, normal prostate cell lines and human donor (normal) prostates. Methylation of this CpG correlated with HGPIN, PCa and metastatic human prostate tissues, while this CpG was unmethylated in all of the normal prostate cell lines and human donor (normal) prostates that either did not display or had minimal basal 15-LO-1 expression. Immunohistochemistry for 15-LO-1 was performed in prostates from PCa patients with Gleason scores 6, 7 [(4+3) and (3+4)], >7 with metastasis, (8-10) and 5 normal (donor) individual males. Quantitative reverse transcription-polymerase chain reaction (qRT-PCR) was used to detect 15-LO-1 in PrEC, RWPE-1, BPH-1, DU-145, LAPC-4, LNCaP, MDAPCa2b and PC-3 cell lines. The specific methylated CpG dinucleotide within the CpG island of the 15-LO-1 promoter was identified by bisulfite sequencing from these cell lines. The methylation status was determined by COBRA analyses of one specific CpG dinucleotide within the 15-LO-1 promoter in these cell lines and in prostates from patients and normal individuals. Fifteen-LO-1, GSTPi and beta-actin mRNA expression in BPH-1, LNCaP and MDAPCa2b cell lines with or without 5-aza-2′-deoxycytidine (5-aza-dC) and trichostatin-A (TSA) treatment were investigated by qRT-PCR. Complete or partial methylation of 15-LO-1 promoter was observed in all PCa patients but the normal donor prostates showed significantly less or no methylation. Exposure of LNCAP and MDAPCa2b cell lines to 5-aza-dC and TSA resulted in the downregulation of 15-LO-1 gene expression. Our results demonstrate that 15-LO-1 promoter methylation is frequently present in PCa patients and identify a new role for epigenetic phenomenon in PCa wherein hypermethylation of the 15-LO-1 promoter leads to the upregulation of 15-LO-1 expression and enzyme activity contributes to PCa initiation and progression.
Transcriptional regulation of 15-lipoxygenase expression by promoter methylation.
Liu C1, Xu D, Sjöberg J, Forsell P, Björkholm M, Claesson H
Exp Cell Res. 2004 Jul 1; 297(1):61-7.
15-Lipoxygenase type 1 (15-LO), a lipid-peroxidating enzyme implicated in physiological membrane remodeling and the pathogenesis of atherosclerosis, inflammation, and carcinogenesis, is highly regulated and expressed in a tissue- and cell-type-specific fashion. It is known that interleukins (IL) 4 and 13 play important roles in transactivating the 15-LO gene. However, the fact that they only exert such effects on a few types of cells suggests additional mechanism(s) for the profile control of 15-LO expression. In the present study, we demonstrate that hyper- and hypomethylation of CpG islands in the 15-LO promoter region is intimately associated with the transcriptional repression and activation of the 15-LO gene, respectively. The 15-LO promoter was exclusively methylated in all examined cells incapable of expressing 15-LO (certain solid tumor and human lymphoma cell lines and human T lymphocytes) while unmethylated in 15-LO-competent cells (the human airway epithelial cell line A549 and human monocytes) where 15-LO expression is IL4-inducible. Inhibition of DNA methylation in L428 lymphoma cells restores IL4 inducibility to 15-LO expression. Consistent with this, the unmethylated 15-LO promoter reporter construct exhibited threefold higher activity in A549 cells compared to its methylated counterpart. Taken together, demethylation of the 15-LO promoter is a prerequisite for the gene transactivation, which contributes to tissue- and cell-type-specific regulation of 15-LO expression.
mechanism of the lipoxygenase reaction

Radical mechanism of the lipoxygenase reaction pattabhiraman
http://edoc.hu-berlin.de/dissertationen/pattabhiraman-shankaranarayanan-2003-11-03/HTML/pattabhiraman_html_705b7fbd.png

Position determinants of lipoxygenase reaction pattabhiraman
http://edoc.hu-berlin.de/dissertationen/pattabhiraman-shankaranarayanan-2003-11-03/HTML/pattabhiraman_html_m3642741b.jpg
Position determinants of lipoxygenase reaction
This suggests that the space inside the active site cavity plays an important role in the positional specificity (Borngräber et al., 1999). The reverse process on 12-LOX works equally well (Suzuki et al., 1994; Watanabe and Haeggstrom, 1993). However, conversion to 5-LOX by mutagenesis has not been successful. The positional determinant residues on 15-LOX were mutated to those of 5-LOX but the enzyme was inactive (Sloane et al., 1990). 15-LOX possess the ability to oxygenate 15-HpETE to form 5, 15-diHpETE. Methylation of carboxy end of the substrate increased the activity significantly. This phenomenon was hypothesised to be due to an inverse orientation of the substrate at the active site. In this case the caroboxy end may slide into the cavity as suggested by experiments with modified [page 6↓]substrates and site directed mutagenesis (Schwarz et al., 1998; Walther et al., 2001). Thus, the determinant of positional specificity is not only the volume but also the orientation of the substrate in the active site.
The N-terminal domain of the enzyme does not play a major role in the dioxygenation reaction of 12/15 lipoxygenase. N-terminal domain truncations did not impair the lipoxygenase activity. The ability of the enzyme to bind to membranes, however, is impaired in the mutants (point and truncations) of the N-ternimal domain without significant alterations to the catalytic activity (Walther et al., 2002). Mutation to Trp 181, which is localised in the catalytic domain, also impaired membrane binding function. This suggests that the C-terminal domain is responsible for the catalytic activity and a concerted action of N-terminal and C-terminal domain was necessary for effective membrane binding.
Metabolomic studies
New paradigms for metabolic modeling of human cells
Mardinoglu A, Nielsen J
Curr Opin Biotechnol. 2015 Jan 2; 34C:91-97.
http://dx.doi.org:/10.1016/j.copbio.2014

integration of genetic and biochemical knowledge
http://ars.els-cdn.com/content/image/1-s2.0-S0958166914002286-fx1.jpg
Highlights
- We presented the timeline of generation and evaluation of global reconstructions of human metabolism.
- We reviewed the generation of the context specific GEMs through the use of human generic GEMs.
- We discussed the generation of multi-tissue GEMs in the context of whole-body metabolism.
- We finally discussed the integration of GEMs with other biological networks.
Abnormalities in cellular functions are associated with the progression of human diseases, often resulting in metabolic reprogramming. GEnome-scale metabolic Models (GEMs) have enabled studying global metabolic reprogramming in connection with disease development in a systematic manner. Here we review recent work on reconstruction of GEMs for human cell/tissue types and cancer, and the use of GEMs for identification of metabolic changes occurring in response to disease development. We further discuss how GEMs can be used for the development of efficient therapeutic strategies. Finally, challenges in integration of cell/tissue models for simulation of whole body functions as well as integration of GEMs with other biological networks for generating complete cell/tissue models are presented.
http://ars.els-cdn.com/content/image/1-s2.0-S0958166914002286-gr2.sml
Inter- and intra-tumor profiling of multi-regional colon cancer and metastasis
Kogita A, Yoshioka Y, …, Nakai T, Okuno K, Nishio K
Biochem Biophys Res Commun. 2015 Feb 27; 458(1):52-6.
http://dx.doi.org:/10.1016/j.bbrc.2015.01.064
Highlights
- Mutation profiling of tumors of multi-regional colon cancers using targeted sequencing.
- Formalin-fixed paraffin embedded samples were available for next-generation sequencing.
- Different clones existed in primary tumors and metastatic tumors.
- Muti-clonalities between intra- and inter-tumors.
Intra- and inter-tumor heterogeneity may hinder personalized molecular-target treatment that depends on the somatic mutation profiles. We performed mutation profiling of formalin-fixed paraffin embedded tumors of multi-regional colon cancer and characterized the consequences of intra- and inter-tumor heterogeneity and metastasis using targeted re-sequencing. We performed targeted re-sequencing on multiple spatially separated samples obtained from multi-regional primary colon carcinoma and associated metastatic sites in two patients using next-generation sequencing. In Patient 1 with four primary tumors (P1-1, P1-2, P1-3, and P1-4) and one liver metastasis (H1), mutually exclusive pattern of mutations was observed in four primary tumors. Mutations in primary tumors were identified in three regions; KARS (G13D) and APC (R876*) in P1-2, TP53 (A161S) in P1-3, and KRAS (G12D), PIK3CA (Q546R), and ERBB4 (T272A) in P1-4. Similar combinatorial mutations were observed between P1-4 and H1. The ERBB4 (T272A) mutation observed in P1-4, however, disappeared in H1. In Patient 2 with two primary tumors (P2-1 and P2-2) and one liver metastasis (H2), mutually exclusive pattern of mutations were observed in two primary tumors. We identified mutations; KRAS (G12V), SMAD4 (N129K, R445*, and G508D), TP53 (R175H), and FGFR3 (R805W) in P2-1, and NRAS (Q61K) and FBXW7 (R425C) in P2-2. Similar combinatorial mutations were observed between P2-1 and H2. The SMAD4 (N129K and G508D) mutations observed in P2-1, however, were nor detected in H2. These results suggested that different clones existed in primary tumors and metastatic tumor in Patient 1 and 2 likely originated from P1-4 and P2-1, respectively. In conclusion, we detected the muti-clonalities between intra- and inter-tumors based on mutational profiling in multi-regional colon cancer using next-generation sequencing. Primary region from which metastasis originated could be speculated by mutation profile. Characterization of inter- and inter-tumor heterogeneity can lead to underestimation of the tumor genomics landscape and treatment strategy of personal medicine.
Fig.1. Treatment timelines for the two patients. A) Patient 1 (a 55-year-old man) had multifocal sigmoid colon cancers, and all of which were surgically resected in their entirety (P1-1, P1-2, P1-3, and P1-4). The patient received adjuvant chemotherapy (8 courses of XELOX). Eight months later, a single liver metastasis (H1) was detected, and the patients received neoadjuvant treatment of XELOX plus bevacizumab. Thereafter, he received a partial hepatectomy. B) Patient 2 (an 84-year-old woman) had cecal and sigmoid colon cancers (P2-1 and P2-2, respectively) with a single liver metastasis (H2). She received a subtotal colectomy and subsegmental hepatectomy.
Fig. 2. Schematic representation of intra-tumor heterogeneity in two patients. A) In patient 1, primary tumor (P1-4) contains two or more subclones. The clone without the ERBB4 (T272A) mutation created the liver metastasis. B) In patient 2, primary tumor (P2-1) contains two or more subclones. The clone without the SMAD4 (N129K and G508D) mutation created the liver metastasis.
Loss of Raf-1 Kinase Inhibitor Protein Expression Is Associated With Tumor Progression and Metastasis in Colorectal Cancer
Parham Minoo, Inti Zlobec, Kristi Baker, Luigi Tornillo, Luigi Terracciano, Jeremy R. Jass, and Alessandro Lugli
American Journal of Clinical Pathology, 127, 820-827
http://dx.doi.org:/10.1309/5D7MM22DAVGDT1R8(2007)
Raf-1 kinase inhibitor protein (RKIP) is known as a critical down-regulator of the mitogen-activated protein kinase signaling pathway and a potential molecular determinant of malignant metastasis. The aim of this study was to determine the prognostic significance of RKIP expression in colorectal cancer (CRC). Immunohistochemical staining for RKIP was performed on a tissue microarray comprising 1,197 mismatch repair (MMR)-proficient and 141 MMR-deficient CRCs. The association of RKIP with clinicopathologic features was analyzed. Loss of cytoplasmic RKIP was associated with distant metastasis (P = .038), higher N stage (P = .032), vascular invasion (P = .01), and worse survival (P = .001) in the MMR-proficient group. In MMR-deficient CRCs, loss of cytoplasmic RKIP was associated with distant metastasis (P = .043) and independently predicted worse survival (P = .004). Methylation analysis of 28 cases showed that loss of RKIP expression is unlikely to be due to promoter methylation.
Raf-1 kinase inhibitor protein (RKIP) is a ubiquitously expressed and highly conserved protein that belongs to the phosphatidylethanolamine-binding protein family.1,2 RKIP is present in the cytoplasm and at the cell membrane3 and appears to have multiple biologic functions that implicate spermatogenesis, neural development, cardiac function, and membrane biogenesis.4-6 RKIP has also been shown to have a role in the regulation of multiple signaling pathways. Originally, RKIP was identified as a phospholipid-binding protein and, subsequently, as an interacting partner of Raf-1 kinase that blocks mitogen-activated protein kinase (MAPK) initiated by Raf-1.7 Initial studies showed that RKIP achieves this role by competitive interference with the binding of MEK to Raf-1.8 Recently, RKIP was shown to inhibit activation of Raf-1 by blocking phosphorylation of Raf-1 by p21-activated kinase and Src family kinases.9 It has also been suggested that RKIP could be involved in regulation of apoptosis by modulating the NF-κB pathway10 and in regulation of the spindle checkpoint via Aurora B.11 RKIP has also been implicated in tumor biology. In breast and prostate cancers, ectopic expression of RKIP sensitized cells to chemotherapeutic-induced apoptosis, and reduced expression of RKIP led to resistance to chemotherapy.12 A link between RKIP and cancer was first established in prostate cancer, with RKIP showing reduced expression in prostate cancer cells and the lowest expression levels in metastatic cells, suggesting that RKIP expression is inversely associated with the invasiveness of prostate cancer.13 Restoration of RKIP expression in metastatic prostate cancer cells inhibited invasiveness of the cells in vitro and in vivo in spontaneous lung metastasis but not the growth of the primary tumor in a murine model.13
Clinicopathologic Parameters The clinicopathologic data for 1,420 patients included T stage (T1, T2, T3, and T4), N stage (N0, N1, and N2), tumor grade (G1, G2, and G3), vascular invasion (presence or absence), and survival. The distribution of these features has been described previously.18-20 For 478 patients, information on local recurrence and distant metastasis was also available.
Methylation of RKIP Methylation of RKIP promoter was examined by methylation-specific polymerase chain reaction (PCR) using an AmpliTaq Gold kit (Roche, Branchburg, NJ) as described previously.25 The primers for amplification of the unmethylated sequence were 5′-TTTAGTGATATTTTTTGAGATATGA-3′ and 3′-CACTCCCTAACCTCTAATTAACCAA-5′ and for the methylated reaction were 5′-TTTAGCGATATTTTTTGAGATACGA-3′ and 3′-GCTCCCTAACCTCTAATTAACCG- 5′. The conditions for amplification were 10 minutes at 95°C followed by 39 cycles of denaturing at 95°C for 30 seconds, annealing at 52°C for 30 seconds, and 30 seconds of extension at 72°C. The PCR products were subjected to electrophoresis on 8% acrylamide gels and visualized by SYBR gold nucleic acid gel stain (Molecular Probes, Eugene, OR). CpGenome Universal Methylated DNA (Chemicon, Temecula, CA) was used as a positive control sample for methylation. Randomization of MMR-Proficient CRCs The 1,197 MMR-proficient CRCs were randomly assigned into 2 groups consisting of 599 (group 1) and 598 (group 2) cases and matched for sex, tumor location, T stage, N stage, tumor grade, vascular invasion, and survival ❚Table 1❚. Immunohistochemical cutoff scores for RKIP expression were determined for group 1, and the association of RKIP expression and T stage, N stage, tumor grade, vascular invasion, local recurrence, distant metastasis, and 10-year survival were studied in group 2.
❚Table 1❚ Characteristics of the Randomized Mismatch Repair–Proficient Subgroups of Colorectal Cancer Cases*
| Variable |
|
|
|
|
|
|
p |
| Group |
|
Gp 1 (n=599) |
|
|
Gp 2 (n=598) |
|
0.235 |
| Sex |
|
M |
F |
|
M |
F |
|
|
|
288 (48.3) |
308
(51.7) |
|
287
(48.2) |
308
(51.8) |
0.82 |
| Tumor location |
Right-sided |
417 (70.6) |
417 (71.2) |
Left-sided |
174 (29.4) |
169 (28.8) |
|
|
T1 |
T2 |
T3 |
T4 |
|
|
|
| T stage |
25 (4.3) 35 (6.0) |
92(15.8) 97(16.7) |
375(64.2)
365(62.8) |
92(15.8)
84(14.5) |
|
|
0.514 |
| N stage |
N0 |
N1 |
|
|
N2 |
|
|
|
289(50.7) |
154(27.0) |
154(26.9) |
|
127(22.3) |
120(21.0) |
0.847 |
| Tumor grade |
G1 |
G2 |
|
|
G3 |
|
|
|
14 (2.4) 13 (2.2) |
503(86.7) |
507(86.7) |
|
63 (10.9) |
65 (11.1) |
0.969 |
| Vascular invasion |
Presence |
412 (70.9) |
422 (72.1) |
Absence |
169 (29.1) |
163 (27.9) |
0.643 |
| Median survival, mo |
|
68.0 (57.0-91.0) |
|
|
76.0 (62.0-88.0) |
|
0.59 |
(95% confidence interval) * Data are given as number (percentage) unless otherwise indicated.
Data were not available for all cases; percentages are based on the number of cases available for the variable, not the total number of cases in the group. Cases were assigned into groups matched for all variables listed. †
The χ2 test was used for sex, tumor location, T stage, N stage, tumor grade, and vascular invasion and log-rank test for survival analysis. P > .05 indicates that there is no difference between groups 1 and 2.
Breast and prostate cancer: more similar than different
Gail P. Risbridger1, Ian D. Davis2, Stephen N. Birrell3 & Wayne D. Tilley3
Nature Reviews Cancer 10, 205-212 (March 2010)
http://dx.doi.org:/10.1038/nrc2795
Breast cancer and prostate cancer are the two most common invasive cancers in women and men, respectively. Although these cancers arise in organs that are different in terms of anatomy and physiological function both organs require gonadal steroids for their development, and tumours that arise from them are typically hormone-dependent and have remarkable underlying biological similarities. Many of the recent advances in understanding the pathophysiology of breast and prostate cancers have paved the way for new treatment strategies. In this Opinion article we discuss some key issues common to breast and prostate cancer and how new insights into these cancers could improve patient outcomes.
Emerging field of metabolomics. Big promise for cancer biomarker identification and drug discovery
Patel S, Ahmed S.
J Pharm Biomed Anal. 2015 Mar 25; 107C:63-74.
http://DX.doi.ORG:/10.1016/j.jpba.2014.12.020
Highlights
- Mass spectrometry, nuclear magnetic resonance and chemometrics have enabled cancer biomarker discovery.
- Metabolomics can non-invasively identify biomarkers for diagnosis, prognosis and treatment of cancer.
- All major types of cancers and their biomarkers discovered by metabolomics have been discussed.
- This review sheds light on the pitfalls and potentials of metabolomics with respect to oncology.
Most cancers are lethal and metabolic alterations are considered a hallmark of this deadly disease. Genomics and proteomics have contributed vastly to understand cancer biology. Still there are missing links as downstream to them molecular divergence occurs. Metabolomics, the omic science that furnishes a dynamic portrait of metabolic profile is expected to bridge these gaps and boost cancer research. Metabolites being the end products are more stable than mRNAs or proteins. Previous studies have shown the efficacy of metabolomics in identifying biomarkers associated with diagnosis, prognosis and treatment of cancer. Metabolites are highly informative about the functional status of the biological system, owing to their proximity to organismal phenotypes. Scores of publications have reported about high-throughput data generation by cutting-edge analytic platforms (mass spectrometry and nuclear magnetic resonance). Further sophisticated statistical softwares (chemometrics) have enabled meaningful information extraction from the metabolomic data. Metabolomics studies have demonstrated the perturbation in glycolysis, tricarboxylic acid cycle, choline and fatty acid metabolism as traits of cancer cells. This review discusses the latest progress in this field, the future trends and the deficiencies to be surmounted for optimally implementation in oncology. The authors scoured through the most recent, high-impact papers archived in Pubmed, ScienceDirect, Wiley and Springer databases to compile this review to pique the interest of researchers towards cancer metabolomics.
Table. Novel Cancer Markers Identified by Metabolomics
Quantitative analysis of acetyl-CoA production in hypoxic cancer cells reveals substantial contribution from acetate
Jurre J Kamphorst, Michelle K Chung, Jing Fan and Joshua D Rabinowitz
Cancer & Metabolism 2014, 2:23
http://dx.doi.org:/10.1186/2049-3002-2-23
Background: Cell growth requires fatty acids for membrane synthesis. Fatty acids are assembled from 2-carbon units in the form of acetyl-CoA (AcCoA). In nutrient and oxygen replete conditions, acetyl-CoA is predominantly derived from glucose. In hypoxia, however, flux from glucose to acetyl-CoA decreases, and the fractional contribution of glutamine to acetyl-CoA increases. The significance of other acetyl-CoA sources, however, has not been rigorously evaluated. Here we investigate quantitatively, using 13C-tracers and mass spectrometry, the sources of acetyl-CoA in hypoxia. Results: In normoxic conditions, cultured cells produced more than 90% of acetyl-CoA from glucose and glutamine-derived carbon. In hypoxic cells, this contribution dropped, ranging across cell lines from 50% to 80%. Thus, under hypoxia, one or more additional substrates significantly contribute to acetyl-CoA production. 13C-tracer experiments revealed that neither amino acids nor fatty acids are the primary source of this acetyl-CoA. Instead, the main additional source is acetate. A large contribution from acetate occurs despite it being present in the medium at a low concentration (50–500 μM). Conclusions: Acetate is an important source of acetyl-CoA in hypoxia. Inhibition of acetate metabolism may impair tumor growth.
Cancer cells have genetic mutations that drive proliferation. Such proliferation creates a continuous demand for structural components to produce daughter cells [1–3]. This includes demand for fatty acids for lipid membranes. Cancer cells can obtain fatty acids both through uptake from extracellular sources and through de novo synthesis, with the latter as a major route by which non-essential fatty acids are acquired in many cancer types [4,5].
The first fatty acid to be produced by de novo fatty acid synthesis is palmitate. The enzyme fatty acid synthase (FAS) makes palmitate by catalyzing the ligation and reduction of 8-acetyl (2-carbon) units donated by cytosolic acetyl-CoA. This 16-carbon fatty acid palmitate is then incorporated into structural lipids or subjected to additional elongation (again using acetyl-CoA) and desaturation reactions to produce the diversity of fatty acids required by the cell.
Acetyl-CoA sits at the interface between central carbon and fatty acid metabolism. In well-oxygenated conditions with abundant nutrients, its 2-carbon acetyl unit is largely produced from glucose. First, pyruvate dehydrogenase produces acetyl-CoA from glucose-derived pyruvate in the mitochondrion, followed by ligation of the acetyl group to oxaloacetate to produce citrate. Citrate is then transported into the cytosol and cytosolic acetyl-CoA produced by ATP citrate lyase.
In hypoxia, flux from glucose to acetyl-CoA is impaired. Low oxygen leads to the stabilization of the HIF1 complex, blocking pyruvate dehydrogenase (PDH) activity via activation of HIF1-responsive pyruvate dehydrogenase kinase 1 (PDK1) [6,7]. As a result, the glucose-derived carbon is shunted towards lactate rather than being used for generating acetyl-CoA, affecting carbon availability for fatty acid synthesis.
To understand how proliferating cells rearrange metabolism to maintain fatty acid synthesis under hypoxia, multiple studies focused on the role of glutamine as an alternative carbon donor[8–10]. The observation that citrate M+5 labeling from U-13C-glutamine increased in hypoxia led to the hypothesis that reductive carboxylation of glutamine-derived α-ketoglutarate enables hypoxic cells to maintain citrate and acetyl-CoA production. As was noted later, though, dropping citrate levels in hypoxic cells make the α-ketoglutarate to citrate conversion more reversible and an alternative explanation of the extensive citrate and fatty acid labeling from glutamine in hypoxia is isotope exchange without a net reductive flux [11]. Instead, we and others found that hypoxic cells can at least in part bypass the need for acetyl-CoA for fatty acid synthesis by scavenging serum fatty acids [12,13].
In addition to increased serum fatty acid scavenging, we observed a large fraction of fatty acid carbon (20%–50% depending on the cell line) in hypoxic cells not coming from either glucose or glutamine. Here, we used 13C-tracers and mass spectrometry to quantify the contribution from various carbon sources to acetyl-CoA and hence identify this unknown source. We found only a minor contribution of non-glutamine amino acids and of fatty acids to acetyl-CoA in hypoxia. Instead, acetate is the major previously unaccounted for carbon donor. Thus, acetate assimilation is a route by which hypoxic cells can maintain lipogenesis and thus proliferation.
Figure 1. Percentage 13C-labeling of cytosolic acetyl-CoA can be quantified from palmitate labeling. (A) Increasing 13C2-acetyl-CoA labeling shifts palmitate labeling pattern to the right. 13C2-acetyl-CoA labeling can be quantified by determining a best fit between observed palmitate labeling and computed binomial distributions (shown on right-hand side) from varying fractions of acetyl-CoA (AcCoA) labeling. (B) Steady-state palmitate labeling from U-13C-glucose and U-13C-glutamine in MDA-MB-468 cells. (C) Percentage acetyl-CoA production from glucose and glutamine. For (B) and (C), data are means ± SD of n = 3.
Fraction palmitate M + x = (16/x)(p)x (1−p)(16−x)
We applied this approach to MDA-MB-468 cells grown in medium containing U-13C-glucose and U-13C-glutamine. The resulting steady-state palmitate labeling patterns showed multiple heavily 13C-labeled forms as well as a remaining unlabeled M0 peak (Figure 1B). The M0-labeled form results from scavenging of unlabeled serum fatty acids and can be disregarded for the purpose of determining AcCoA labeling. From the remaining labeling distribution, we calculated 87% AcCoA labeling from glucose and 6% from glutamine, with 93% collectively accounted for by these two major carbon sources (Additional file 1: Figure S1). Similar results were also obtained for HeLa and A549 cells (Figure 1C)
Figure 2. Acetyl-CoA labeling from 13C-glucose and 13C-glutamine decreases in hypoxia. (A) Steady-state palmitate labeling from U-13C-glucose and U-13C-glutamine in normoxic and hypoxic (1% O2) conditions. (B) Percentage acetyl-CoA production from glucose and glutamine in hypoxia. (C) One or more additional carbon donors contribute substantially to acetyl-CoA production in hypoxia. Abbreviations: Gluc, glucose; Gln, glutamine. Data are means ± SD of n = 3.
Figure 3. Amino acids (other than glutamine) and fatty acids are not major sources of cytosolic acetyl-CoA in hypoxia. (A) Palmitate labeling in hypoxic (1% O2) MDA-MB-468 cells, grown for 48 h in medium where branched chain amino acids plus lysine and threonine were substituted with their respective U-13C-labeled forms. (B) Same conditions, except that glucose and glutamine only or glucose and all amino acids, were substituted with the U-13C-labeled forms. (C) Palmitate labeling in hypoxic (1% O2) MDA-MB-468 cells, grown in medium supplemented with 20 μM U-13C-palmitate for 48 h. Data are means ± SD of n = 3.
Acetate is the main additional AcCoA carbon source in hypoxia
We next investigated if hypoxic cells could activate acetate to AcCoA. Although we used dialyzed serum in our experiments and acetate is not a component of DMEM, we contemplated the possibility that trace levels could still be present or that acetate is produced as a catabolic intermediate from other sources (for example from protein de-acetylation). We cultured MDA-MB-468 cells in 1% O2 in DMEM containing U-13C-glucose and U-13C-glutamine and added increasing amounts of U-13C-acetate (Figure 4A). AcCoA labeling rose considerably with increasing U-13C-acetate concentrations, from approximately 50% to 86% with 500 μM U-13C-acetate. No significant increase in labeling of AcCoA was observed in normoxic cells following incubation with U-13C-acetate. Thus, acetate selectively contributes to AcCoA in hypoxia.
Figure 4. The main additional AcCoA source in hypoxia is acetate. (A) Percentage 13C2-acetyl-CoA labeling quantified from palmitate labeling in hypoxic (1% O2) and normoxic MDA-MB-468 cells grown in medium with U-13C-glucose and U-13C-glutamine and additionally supplemented with indicated concentrations of U-13C-acetate. (B) Acetate concentrations in fresh 10% DFBS, DMEM, and DMEM with 10% DFBS. (C) Percentage 13C2-acetyl-CoA labeling for hypoxic (1% O2) HeLa and A549 cells. For (A) and (C), data are means ± SD of n ≥ 2. For (B), data are means ± SEM of n = 3.
Tumors require a constant supply of fatty acids to sustain cellular replication. It is thought that most cancers derive a considerable fraction of the non-essential fatty acids through de novo synthesis. This requires AcCoA with its 2-carbon acetyl group acting as the carbon donor. In nutrient replete and well-oxygenated conditions, AcCoA is predominantly made from glucose. However, tumor cells often experience hypoxia, causing limited entry of glucose-carbon into the TCA cycle. This in turn affects AcCoA production, and it has been proposed that hypoxic cells can compensate by increasing AcCoA production from glutamine-derived carbon in a pathway involving reductive carboxylation of α-ketoglutarate [8–10].
Irrespective of the precise net contribution of acetate in hypoxia, a remarkable aspect is that a significant contribution occurs based only on contaminating acetate (~300 μM) in the culturing medium. This is considerably less than glucose (25 mM) or glutamine (4 mM). Acetate concentrations in the plasma of human subjects have been reported in the range of 50 to 650 μM [22–25], and therefore, significant acetate conversion to AcCoA may occur in human tumors. This is supported by clinical observations that 11C-acetate PET can be used to image tumors, in particular those where conventional FDG-PET typically fails [26]. Our results indicate that 11C-acetate PET could be particularly important in notoriously hypoxic tumors, such as pancreatic cancer. Preliminary results provide evidence in this direction [27].
Finally, as our measurements of fatty acid labeling reflect specifically cytosolic AcCoA, it is likely that the cytosolic acetyl-CoA synthetase ACSS2 plays an important role in the observed acetate assimilation. Accordingly, inhibition of ACSS2 merits investigation as a potential therapeutic approach.
In hypoxic cultured cancer cells, one-quarter to one-half of cytosolic acetyl-CoA is not derived from glucose, glutamine, or other amino acids. A major additional acetyl-CoA source is acetate. Low concentrations of acetate (e.g., 50–650 μM) are found in the human plasma and also occur as contaminants in typical tissue culture media. These amounts are avidly incorporated into cellular acetyl-CoA selectively in hypoxia. Thus, 11C-acetate PET imaging may be useful for probing hypoxic tumors or tumor regions. Moreover, inhibiting acetate assimilation by targeting acetyl-CoA synthetases (e.g., ACSS2) may impair tumor growth.
Differential metabolomic analysis of the potential antiproliferative mechanism of olive leaf extract on the JIMT-1 breast cancer cell line
Barrajón-Catalán E, Taamalli A, Quirantes-Piné R, …, Micol V, Zarrouk M
J Pharm Biomed Anal. 2015 Feb; 105:156-62.
http://dx.doi.org:/10.1016/j.jpba.2014.11.048
A new differential metabolomic approach has been developed to identify the phenolic cellular metabolites derived from breast cancer cells treated with a supercritical fluid extracted (SFE) olive leaf extract. The SFE extract was previously shown to have significant antiproliferative activity relative to several other olive leaf extracts examined in the same model. Upon SFE extract incubation of JIMT-1 human breast cancer cells, major metabolites were identified by using HPLC coupled to electrospray ionization quadrupole-time-of-flight mass spectrometry (ESI-Q-TOF-MS). After treatment, diosmetin was the most abundant intracellular metabolite, and it was accompanied by minor quantities of apigenin and luteolin. To identify the putative antiproliferative mechanism, the major metabolites and the complete extract were assayed for cell cycle, MAPK and PI3K proliferation pathways modulation. Incubation with only luteolin showed a significant effect in cell survival. Luteolin induced apoptosis, whereas the whole olive leaf extract incubation led to a significant cell cycle arrest at the G1 phase. The antiproliferative activity of both pure luteolin and olive leaf extract was mediated by the inactivation of the MAPK-proliferation pathway at the extracellular signal-related kinase (ERK1/2). However, the flavone concentration of the olive leaf extract did not fully explain the strong antiproliferative activity of the extract. Therefore, the effects of other compounds in the extract, probably at the membrane level, must be considered. The potential synergistic effects of the extract also deserve further attention. Our differential metabolomics approach identified the putative intracellular metabolites from a botanical extract that have antiproliferative effects, and this metabolomics approach can be expanded to other herbal extracts or pharmacological complex mixtures.
Pancreatic cancer early detection. Expanding higher-risk group with clinical and metabolomics parameters
Shiro Urayama
World J Gastroenterol. 2015 Feb 14; 21(6): 1707–1717.
http://dx.doi.org:/10.3748/wjg.v21.i6.1707
Pancreatic ductal adenocarcinoma (PDAC) is the fourth and fifth leading cause of cancer death for each gender in developed countries. With lack of effective treatment and screening scheme available for the general population, the mortality rate is expected to increase over the next several decades in contrast to the other major malignancies such as lung, breast, prostate and colorectal cancers. Endoscopic ultrasound, with its highest level of detection capacity of smaller pancreatic lesions, is the commonly employed and preferred clinical imaging-based PDAC detection method. Various molecular biomarkers have been investigated for characterization of the disease, but none are shown to be useful or validated for clinical utilization for early detection. As seen from studies of a small subset of familial or genetically high-risk PDAC groups, the higher yield and utility of imaging-based screening methods are demonstrated for these groups. Multiple recent studies on the unique cancer metabolism including PDAC, demonstrate the potential for utility of the metabolites as the discriminant markers for this disease. In order to generate an early PDAC detection screening strategy available for a wider population, we propose to expand the population of higher risk PDAC group with combination clinical and metabolomics parameters.
Core tip: This is a summary of current pancreatic cancer cohort early detection studies and a potential approach being considered for future application. This is an area that requires heightened efforts as lack of effective treatment and screening scheme for wider population is leading this particular disease to be the second lethal cancer by 2030.
Currently, pancreatic ductal adenocarcinoma (PDAC) is the fourth major cause of cancer mortality in the United States[1]. It is predicted that 46420 new cases and 39590 deaths would result from pancreatic cancer in the United States in 2014[2]. Worldwide, there were 277668 new cases and 266029 deaths from this cancer in 2008[3]. In comparison to other major malignancies such as breast, colon, lung and prostate cancers with their respective 89%, 64%, 16%, 99% 5-year survival rate, PDAC at 6% is conspicuously low[2]. For PDAC, the only curative option is surgical resection, which is applicable in only 10%-15% of patients due to the common discovery of late stage at diagnosis[4]. In fact, PDAC is notorious for late stage discovery as evidenced by the low percentage of localized disease at diagnosis, compared to other malignancies: breast (61%), colon (40%), lung (16%), ovarian (19%), prostate (91%), and pancreatic cancer (7%) [5]. With the existing effective screening methods, the decreasing trends of cancer death rate are seen in major malignancies such as breast, prostate and colorectal cancer. In contrast, it is estimated that PDAC is expected to be surfacing as the second leading cause of cancer death by 2030[6].
With the distinct contribution of late-stage discovery and general lack of effective medical therapy, a critical approach in reversing the poor outcome of pancreatic cancer is to develop an early detection scheme for the tumor. In support of this, we see the trend that despite the poor prognosis of the disease, for those who have undergone curative resection with negative margins, the 5-year survival rate is 22% in contrast to 2% for the advanced-stage with distant metastasis[7,8]. An earlier diagnosis with tumor less than 2 cm (T1) is associated with a better 5-year survival of 58% compared to 17% for stage IIB PDAC[9]. Ariyama et al. [10] reported complete survival of 79 patients with less than 1 cm tumors after surgical resection. Furthermore, as a recent report indicates, the estimated time from the transformation to pre-metastatic growths of pancreatic cancer is approximately 15 years[11]; there is a wide potential window of opportunity to apply developing technologies in early detection of this cancer.
Current screening programs have demonstrated that the EUS evaluation can detect premalignant lesions and early cancers in certain small subset of high-risk groups. However, as the overwhelming majority of PDAC cases involve patients who develop the disease sporadically without a recognized genetic abnormality, the application of this modality for PDAC detection screening is very limited for the general adult population.
Select population based approach
Identification of a higher-PDAC-risk group: As the prevalence of PDAC in the general United States population over the age 55 is approximately 68 per 100000, a candidate discriminant test with a specificity of 98% and a sensitivity of 100% would generate 1999 false-positive test results and 68 true-positives[74]. Thus, relying on a single determinant for distinguishing the PDAC early-stage cases from the general population would necessitate a highly accurate test with a specificity of greater than 99%. More practical approach, then, would be to begin with a subset of population with a higher prevalence, and in conjunction with novel surrogate markers to curtail the at-risk subset, we could begin to identify the group with significantly increased PDAC risk for whom the endoscopic/imaging-based screening strategy could be applied.
An initial approach in selection of the screening population is to utilize selective clinical parameters that could be used to curtail the subset of the general population at increased PDAC risk. For instance, based on the epidemiological evidence, such clinical parameters include hyperglycemia or diabetes, which are noted in 50%-80% of pancreatic cancer patients [75–79]. Though not encompassing all PDAC patients, this subset includes a much larger proportion of PDAC patients for whom we may select further for screening. Similarly, patients with a history of chronic pancreatitis or obesity are reported to have increased PDAC risk during their lifetime[80–85].
With the recent advancement in the technology and resumed interest in the cancer-associated metabolic abnormality [89,90], application of metabolomics in the cancer field has attracted more attention [91]. Cancer-related metabolic reprogramming, Warburg effect, has been known since nearly a century ago in association with various solid tumors including PDAC [92], as cancer cells undergo energetically inefficient glycolysis even in the presence of oxygen in the environment (aerobic glycolysis)[93]. A number of common cancer mutations including Akt1, HIF (hypoxia-inducible factor), and p53 have been shown to support the Warburg effect through glycolysis and down-regulation of metabolite flux through the Krebs cycle [94–101]. In PDAC, increased phosphorylation or activation of Akt1 has also been reported (illuminating on the importance of enzyme functionality)[102] as well as involvement of HIF1 in the tumor growth via effects on glycolytic process [103,104] and membrane-bound glycoprotein (MUC17) regulation [105] – reflective of activation of metabolic pathways. Further evidences of loss-of-function genetic mutations in key mitochondrial metabolic enzymes such as succinate dehydrogenase and fumarate hydratase, isocitrate dehydrogenase, phosphoglycerate dehydrogenase support carcinogenesis and the Warburg effect [106–110]. Other important alternative pathways in cancer metabolism such as glutaminolysis and pyruvate kinase isoform suppression have been shown to accumulate respective upstream intermediates and reduction of associated end products such as NADPH, ribose-5-phosphate and nucleic acids [111-116]. As such, various groups have reported metabolomics biomarker applications for different cancers [117,118].
As a major organ involved in metabolic regulation in a healthy individual, pancreatic disorder such as malignancy is anticipated to influence the normal metabolism, presenting further rationale and interest in elucidating the implication of malignant transformation and PDAC development. Proteomic analysis of the pancreatic cancer cells demonstrated alteration in proteins involved in metabolic pathways including increased expression of glycolytic and reduced Krebs cycle enzymes, and accumulation of key proteins involved in glutamine metabolism, in support of Warburg effect. These in turn play significant role in nucleotide and amino acid biosynthesis required for sustaining the proliferating cancer cells[119]. Applications of sensitive mass spectrometric techniques in metabolomics study of PDAC detection biomarkers have led to identification of a set of small molecules or metabolites (or biochemical intermediates) that are potent discriminants of developing PDAC and the controls (See Figure 1 as an example of metabolomics based analysis, allowing segregation of PDAC from benign cases). Recent reports from our group as well as others have demonstrated that specific candidate metabolites consisting of amino acids, bile acids, and a number of lipids and fatty acids – suspected to be reflective of tumor proliferation as well as many systemic response yet to be determined – were identified as potential discriminant for blood-based PDAC biomarkers[120-123]. As a further supporting data, elucidation of lipids and fatty acids as discriminant factors from PDAC and benign lesions from the cancer tissue and adjacent normal tissue has been reported recently[124].

metabolomics based analysis for PDC WJG-21-1707-g001
http://www.ncbi.nlm.nih.gov/pmc/articles/PMC4323446/bin/WJG-21-1707-g001.gif
Figure 1 Example of metabolomics based analysis, allowing segregation of pancreatic ductal adenocarcinoma from benign cases. Heat map illustration of discriminant capability of a metabolite set derived from gas chromatography and liquid chromatography/mass spectrometry …
By virtue of simultaneously depicting the multiple metabolite levels, metabolomics approach reveals various biochemical pathways that are uniquely involved in malignant conditions and has led to findings such as abnormalities of glycine and its mitochondrial biosynthetic pathway, as a potential therapeutic target in certain cancers[125]. Moreover, in combination with other systems biology approaches such as transcriptomics and proteomics, further refinement in characterization of cancer development and therapeutic targets as well as identification of potential biomarkers could be realized for PDAC. Since many enzymes in a metabolic network determine metabolites’ level and nonlinear quantitative relationship from the genes to the proteome and metabolome levels exist, a metabolome cannot be easily decomposed to a specific single marker, which will designate the cancer state[126]. Thus, in order to delineate a pathological state such as PDAC, multiple metabolomic features might be required for accurate depiction of a developing cancer. Future studies are anticipated to incorporate cancer systems’ biological knowledge, including metabolomics, for optimal designation of PDAC biomarkers, which would be utilized in conjunction with a clinical-parameter-derived population subset for establishing the PDAC screening population. Subsequently, further validation studies for the PDAC biomarkers need to be performed.
Current imaging-based detection and diagnostic methods for PDAC is effectively providing answers to clinical questions raised for patients with signs or symptoms of suspected pancreatic lesions. However, the endoscopic/imaging-based screening schemes are currently limited in applications to early PDAC detection in asymptomatic patients, aside from a small group of known genetically high-risk groups. There is a high demand for developing a method of selecting distinct subsets among the general population for implementing the endoscopic/imaging screening test effectively. Application of combinations of clinical risk parameters/factors with the developing molecular biomarkers from translational science such as metabolomics analysis brings hopes of providing us with early PDAC detection markers, and developing effective early detection screening scheme for the patients in the near future.
Serum metabolomic profiles evaluated after surgery may identify patients with estrogen receptor negative early breast cancer at increased risk of disease recurrence
Tenori L, Oakman C, Morris PG, …, Luchinat C, Di Leo A.
Mol Oncol. 2015 Jan; 9(1):128-39.
http://dx.doi.org:/10.1016/j.molonc.2014.07.012
Purpose: Metabolomics is a global study of metabolites in biological samples. In this study we explored whether serum metabolomic spectra could distinguish between early and metastatic breast cancer patients and predict disease relapse. Methods: Serum samples were analysed from women with metastatic (n = 95) and predominantly oestrogen receptor (ER) negative early stage (n = 80) breast cancer using high resolution nuclear magnetic resonance spectroscopy. Multivariate statistics and a Random Forest classifier were used to create a prognostic model for disease relapse in early patients.
Results: In the early breast cancer training set (n = 40), metabolomics correctly distinguished between early and metastatic disease in 83.7% of cases. A prognostic risk model predicted relapse with 90% sensitivity (95% CI 74.9-94.8%), 67% specificity (95% CI 63.0-73.4%) and 73% predictive accuracy (95% CI 70.6-74.8%). These results were reproduced in an independent early breast cancer set (n = 40), with 82% sensitivity, 72% specificity and 75% predictive accuracy. Disease relapse was associated with significantly lower levels of histidine (p = 0.0003) and higher levels of glucose (p = 0.01), and lipids (p = 0.0003), compared with patients with no relapse.
Conclusions: The performance of a serum metabolomic prognostic model for disease relapse in individuals with ER-negative early stage breast cancer is promising. A confirmation study is ongoing to better define the potential of metabolomics as a host and tumour-derived prognostic tool.
Figure 1 e Clusterization of serum metabolomic profiles. Discrimination between metastatic (green, n [ 95) and early (red, n [ 40) breast cancer patients using the random forest classifier. (a) CPMG; (b) NOESY1D; (c) Diffusion.
Figure 2 e Training set. Comparison between metabolomic classification and actual relapse. The receiver operator curves (ROC) and the area under the curve (AUC) scores are presented for CPMG, NOESY1D and Diffusion.
Figure 3 e Validation set. Comparison between CPMG random forest risk score metabolomic classification and actual relapse The receiver operator curve (ROC) and the area under the curve (AUC) score are presented for the CPMG analysis.
Figure 4 e Discriminant metabolites. Discriminant metabolites (p < 0.05) between profiles from early (green, n [ 80) and metastatic (red, n [ 95) breast cancer patients. Box and whisker plots: horizontal line within the box [ mean; bottom and top lines of the box [ 25th and 75th percentiles, respectively; bottom and top whiskers [ 5th and 95th percentiles, respectively. Median values (arbitrary units) are provided in the associated table, along with raw p values and p values adjusted for multiple testing. pts: patients.
Transparency in metabolic network reconstruction enables scalable biological discovery
Benjamin D Heavner, Nathan D Price
Current Opinion in Biotechnology, Aug 2015; 34: 105–109
Highlights
- Assembling a network reconstruction can reveal knowledge gaps.
- Building a functional metabolic model enables testable prediction.
- Recent work has found that most models contain the same reactions.
- Reconstruction and functional model building should be explicitly separated.
Reconstructing metabolic pathways has long been a focus of active research. Now, draft models can be generated from genomic annotation and used to simulate metabolic fluxes of mass and energy at the whole-cell scale. This approach has led to an explosion in the number of functional metabolic network models. However, more models have not led to expanded coverage of metabolic reactions known to occur in the biosphere. Thus, there exists opportunity to reconsider the process of reconstruction and model derivation to better support the less-scalable investigative processes of biocuration and experimentation. Realizing this opportunity to improve our knowledge of metabolism requires developing new tools that make reconstructions more useful by highlighting metabolic network knowledge limitations to guide future research.

metabolic network reconstruction
http://ars.els-cdn.com/content/image/1-s2.0-S0958166914002250-fx1.jpg
Mapping metabolic pathways has been a focus of significant scientific efforts dating from the emergence of biochemistry as a distinct scientific field in the late 19th century [1]. This endeavor remains an important effort for at least two compelling reasons. First, cataloguing and characterizing the full range of metabolic processes across species (which because of genomics are being discovered at an incredible pace) is a fundamentally important step towards a complete understanding of our ecological environment. Second, mapping metabolic pathways in organisms — many of which can be found with specialized properties shaped by their environment — facilitates metabolic engineering to advance nascent industrial biotechnology efforts ranging from augmenting/replacing petroleum-derived chemical precursors or fuels to biopharmaceutical production [2]. However, despite laudable efforts to enable high-throughput ‘genomic enzymology’ [3•], the traditional biochemical approaches of enzyme expression, purification, and characterization remain time-intensive, capital-intensive, and labor-intensive, and have not expanded in scale like our ability to identify and characterize life genomically. Characterizing new metabolic function is further hampered by the challenge of cultivating environmental isolates in laboratory conditions [4]. Fortunately, recent efforts to leverage genome functional annotation and established knowledge of biochemistry have enabled the computational assembly of ‘draft metabolic reconstructions’ [5], which are parts lists of metabolic network components. In this context, a reconstruction is not just the information embodied in the stoichiometric matrix describing metabolic network structure, but also the associated metadata and annotation that entails an organism-specific knowledge base. Such a reconstruction can serve as the basis for making functional models amenable to mathematical simulation. Thus, a reconstruction is a bottom-up assembly of biochemical information, and a model can serve as a framework for integrating top-down information (for example, model constraints can be generated from statistically inferred gene regulatory networks [6]). Such computational approaches are significantly faster and less expensive than biochemical characterization [7]. They are also providing new resources facilitate cultivation of novel environmental isolates [8], and the scope of draft metabolic network coverage across the biome has increased much faster than wet lab characterization. If the distinction between reconstruction and model formulation can be strengthened and supported through software implementation, there is great opportunity for using both tasks to further advance rapid discovery of biological function.
The iterative process of manual curation of a draft metabolic network reconstruction to assemble a higher confidence compendium of organism-specific metabolism (a process termed ‘biocuration’ [9 and 10]) remains time-intensive and labor-intensive. Biocuration of metabolic reconstructions currently advances on a decadal time scale [11 and 12]. Thus, much research effort has focused instead on developing techniques for rapid development of models that are amenable to simulation [13 and 14]. Thousands of models have been derived from automatically assembled draft reconstructions [15], but most of these models consist of highly conserved portions of metabolism since they are propagated primarily via orthology. Though the number of models is large, they do not reflect the true diversity of cellular metabolic capabilities across different organisms [16•]. Applying the rapid and scalable process of draft network reconstruction to support and accelerate the less-scalable processes of biocuration and in vitro or in vivo experimentation remains an unrealized opportunity. The path forward should focus on increased emphasis on transparently documenting the reconstruction process and developing tools to highlight, rather than obscure, knowledge limitations that ultimately cause limitations to model predictive accuracy.
More explicit annotation of metabolic network reconstruction and model derivation steps can help direct research efforts
Testing implicit hypotheses arising from reconstruction assembly provides one opportunity for guiding experimental efforts. However, the very act of identifying ambiguous information in the literature should also be exploited to contribute to experimental efforts, independent of the choices a researcher makes in assembling a reconstruction. Preliminary steps to facilitate large-scale computational identification of biological uncertainty have been made, such as the development of the Evidence Ontology [18]. However, realizing the potential for using reconstruction assembly to highlight experimental opportunities will require a broader shift to emphasize the limits of our knowledge, rather than only the predictive power of a model that can be derived from a reconstruction. Computational reconstruction of metabolic networks provides two distinct opportunities for guiding experimental efforts even before a mathematically computable model is derived from the assembled knowledge: highlighting areas of uncertainty in the current knowledge of an organism, and introducing hypotheses of metabolic function as choices are made throughout biocuration efforts.
The subsequent process of deriving a mathematically computable model from a reconstruction provides additional opportunities for scalable hypothesis generation that could be exploited to inform experimental efforts. While stoichiometrically constrained models derived from reconstructions are ‘parameter-light’ when compared to dynamic enzyme kinetic models, they are not really ‘parameter free’ [19]. As modelers derive a model from an assembled reconstruction, they must make choices. And, like the ambiguities and choices that are made and should be highlighted in assembling a reconstruction, highlighting the choices made in deriving a model provides further opportunity for scalable hypothesis generation. Examples of choices that often arise in deriving a functional model include adding intracellular transport reactions, filling network gaps, or trimming network dead ends to improve network connectivity [20]. Researchers seeking to conduct Flux Balance Analysis (FBA) [21] or similar approaches must formulate an objective function, can include testable parameters such as ATP maintenance requirements, and can compare model predictions to designated reference phenotype observations. Each of these model-building and tuning activities presents opportunities to rapidly develop and prioritize new hypotheses of metabolic function.
The effort to computationally reconstruct biochemical knowledge to compile organism-specific reconstructions, and to derive computable models from these reconstructions, is a relatively young field of research with abundant opportunity for facilitating biological discovery of metabolic function. Judgment is required in assembling a reconstruction, and there should be careful consideration of the fact that judgment calls represent an implicit hypothesis. Making these hypotheses more explicit would help guide subsequent investigation. Bernhard Palsson and colleagues call for ‘an open discussion to define the minimal quality criteria for a genome scale reconstruction’ [16•] — an effort we fully support. We believe that such a beneficial ‘minimal quality criteria’ should be guided by the goals of reproducibility and transparency, including those aspects that can help to guide discovery of novel gene functions.
Like this:
Like Loading...
Read Full Post »


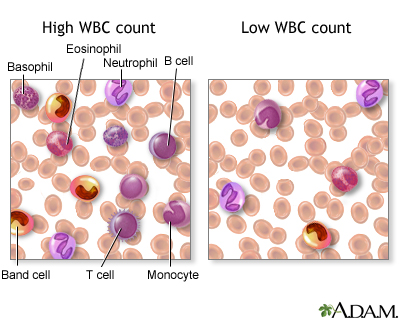