Feeds:
Posts
Comments

Archive for the ‘RNA Biology’ Category

Introduction to Impairments in Pathological States: Endocrine Disorders, Stress Hypermetabolism and Cancer

Author and Curator: Larry H. Bernstein, MD, FCAP 


This leads into a series of presentations and the metabolic imbalance central to findings of endocrine, metabolic, inflammatory, immune diseases and cancer.  All of this has been a result of discoveries based on the methods of study of genomiocs, proteomics, transcriptomics, and metabolomics that have preceded this.  In some cases there has been the use of knockout methods. The completion of the human genomic and other catalogues have been instrumental in the past few years.  In all cases there has been a thorough guidance by a biological concept of mechanism based on gene expression, metabolic disturbance, signaling pathways, and up- or down- regulation of metabolic circuits.  It is interesting to recall that a concept of metabolic circuits was not yet formulated at the time of the mid 20th century physiology, except perhaps with respect to the coagulation pathways, and to some extent, glycolysis, gluconeogenesis, the hexose monophosphate shunt, and mitochondrial respiration, which were linear strings of enzyme substrate reactions that intersected and that had flow restraints not then understood as to the complexity we now appreciate.  We did know the importance of cytochrome c, the adenine and pyridine nucleotides, and the energy balance.  Electron microscopy had opened the door to understanding the mechanism of contraction of skeletal muscle and myocardium, but it also opened the door to understanding kidney structure and function, explaining the “mesangium”.  The first cardiac maker was discovered by Arthur Karmen in the serum alanine and aspartate aminotransferases, with a consequent differentiation between hepatic and myocardial damage.  This was followed by lactic dehydrogenase and the H- and M-type isoenzymes in the 1960s, and in the next decade, by the MB-isoenzyme of creatine kinase.  Troponins T and then I would not be introduced until the mid 1980s, and they have become a gold standard for the diagnosis of myocardial infarction.

In the 1980s we also saw the development of antiplatelet therapy that rapidly advanced interventional cardiology.  But advances in surgical as well as medical intervention also proceeded as the understanding of the lipid metabolism was opened by the work of Brown and Goldstein, and UTSW Medical Campus, and major advances in treatment came at Baylor and UT Medical Center in Houston, and at the Cleveland Clinic.  The next important advance came with the discovery of nitric oxide synthase role in endothelium and oxidative stress.  The field of endocrinology saw advances as well for a solid period of 30 years in a comparable period for the adrenals, thyroid, and pituitary glands, and for the understanding of the male and female sex hormones, and discoveries in breast, ovarian, and prostate cancer.  There were cancer markers, such as, CA125 and CA15-3, and PSA.  This had more of an impact on timely surgical intervention, and if not that, post surgical followup.  Despite a long time into the war on cancer, introduced by President Lynden Johnson, the fundamental knowledge needed was not sufficient.  In the meantime, there were advances in the treatment of diabetes, with eventual introduction of the insulin pump for type I diabetes.  The problem of Type 2 DM increased in prevalence, reaching into the childhood age group, with ascendent obesity.  An epidemiological pattern of disease comorbidities was emergent.  Our population has aged out, and with it we are seeing an increase in dementias, especially Alzheimer’s disease.  But the knowledge of the brain has lagged far behind.

What follows is a series of chapters that address what has currently been advanced with repect to the alignment of our knowledge of the last decade and pharmacetical discovery.  Pharmaceuticals were suitable for bacterial infections until the 1990s, when we saw the rise of resistance to penicillins and Vancomycin, and we had issues with gram negative enterobacter, salmonella, and E. coli strains.  That has been and is a significant challenge.  The elucidation of the gut microbiome in recent years will help to relieve this problem.  The problem of the variety and different aggressive types of cancer has been another challenge.  The door has been opened to better diagnostic tools with respsct to imaging and targeted biomarkers for localization.  I am not dealing with imaging, which is not the subject here.

HLA targeting efficiency correlates with human T-cell response magnitude and with mortality from influenza A infection

From http://www.pnas.org –      Sep 3, 2013 4:24 PM

Experimental and computational evidence suggests that HLAs preferentially bind

  • conserved regions of viral proteins, a concept we term “targeting efficiency,” and
  • that this preference may provide improved clearance of infection in several viral systems.

To test this hypothesis, T-cell responses to A/H1N1 (2009)

  • were measured from peripheral blood mononuclear cells
  • obtained from a household cohort study performed during the 2009–2010 influenza season.

We found that HLA targeting efficiency scores

  • significantly correlated with IFN-γ
    enzyme-linked immunosorbent spot responses (P = 0.042, multiple regression).

A further population-based analysis found that

  • the carriage frequencies of the alleles with the lowest targeting efficiencies, A*24,
  • were associated with pH1N1 mortality (r = 0.37, P = 0.031) and
  • are common in certain indigenous populations in which
  • increased pH1N1 morbidity has been reported.

HLA efficiency scores and HLA use are associated with

  • CD8 T-cell magnitude in humans after influenza infection.

The computational tools used in this study may be useful predictors of

  • potential morbidity and identify immunologic differences of new variant influenza strains
  • more accurately than evolutionary sequence comparisons.

Population-based studies of the relative frequency of these alleles

  • in severe vs. mild influenza cases might advance clinical practices
  • for severe H1N1 infections among genetically susceptible populations.

A deeper look into cholesterol synthesis

By Swathi Parasuraman

The human body needs cholesterol to maintain membrane fluidity, and

  • it acts as a precursor molecule for several important biochemical pathways.

Its regulation requires strict control, as it can cause problems if it’s produced in excess. In 1964, Konrad Bloch received a Nobel Prize for his work elucidating the mechanisms of cholesterol synthesis. His work

  • eventually contributed to the discovery of statins, drugs used today to lower blood cholesterol levels.

The biosynthesis of cholesterol is a complex process with more than 20 steps. One of the first enzymes is

  • 3-hydroxy-3-methylglutaryl-CoA reductase, also known as HMGCR, the main target of statins.

As links between intermediates in cholesterol synthesis and various diseases are being discovered continually, more information about the regulatory role of the post-HMGCR pathway is needed.

In a recent minireview in The Journal of Biological Chemistry, Laura Sharpe and Andrew Brown of the University of New South Wales describe

  • multiple ways various enzymes other than HMGCR
  • are implicated in the modulation of cholesterol synthesis.

One such enzyme is squalene monooxygenase, which, like HMGCR, can be destroyed

  • by the proteasome when cholesterol levels are high.

The minireview also explains how pathway intermediates

  • can have functions distinct from those of cholesterol.

For example, intermediate 7-dehydrocholesterol usually is converted to cholesterol by the enzyme DHCR7

  • but is also a vitamin D precursor.

To synthesize the enzymes necessary to make cholesterol,

  • SREBPs, short for sterol regulatory element binding proteins, have special functions.

Along with transcriptional cofactors, they activate gene expression

  1. in response to low sterol levels and, conversely,
  2. are suppressed when there is enough cholesterol around.

Additionally, SREBPs control production of

  • nicotinamide adenine dinucleotide phosphate, or NADPH,
  • which is the reducing agent required to carry out the different steps in the pathway.

Lipid carrier proteins also can facilitate cholesterol synthesis. One example is SPF, or supernatant protein factor,

  1. which transfers substrate from an inactive to an active pool or
  2. from one enzyme site to another.

Furthermore, translocation of several cholesterogenic enzymes

  • from the endoplasmic reticulum to other cell compartments can occur under various conditions,
  • thereby regulating levels and sites of intracellular cholesterol accumulation.

Immunology in the gut mucosa:

20 Feb 2013 by Kausik Datta, posted in Immunology, Science (Nature)

The human gut can be the scene for devastating conditions such as inflammatory bowel disease,

  • which arises through an improperly controlled immune response.

The gut is often the body’s first point of contact with microbes; every mouthful of food is accompanied by a cargo of micro-organisms that go on to encounter the mucosa, the innermost layer of the gut. Most microbes are destroyed by the harsh acidic environment in the stomach, but a hardy few make it through to the intestines.

The intestinal surface is covered with finger-like protrusions called villi,

whose primary function is the absorption of nutrients.

These structures and the underlying tissues

  • host the body’s largest population of immune cells.

Scattered along the intestinal mucosa are

  • dome-like structures called Peyer’s Patches.

These are enriched in lymphoid tissue, making them key sites for

  • coordinating immune responses to pathogens,
  • whilst promoting tolerance to harmless microbes and food.

The villi contain a network of blood vessels to transport nutrients from food to the rest of the body. Lymphatics

  • from both the Peyer’s Patches and the villi
  • drain into the mesenteric lymph nodes.

Within the villi is a network of loose connective tissue called the lamina propria, and

  • at the base of the villi are the crypts which host the stem cells that replenish the epithelium.

The epithelium together with its overlying mucus forms

  • a barrier against microbial invasion.

A mix of immune cells including T- and B-lymphocytes, macrophages, and dendritic cells are

  • embedded within the matrix of the Peyer’s Patches, .

A key function of the Peyer’s Patch is the sampling of antigens present in the gut. The Peyer’s Patch has a thin mucous layer and specialized phagocytic cells, called M-cells, which

  • transport material across the epithelial barrier via a process called transcytosis.

Dendritic cells extend dendrites between epithelial cells to sample antigens that are then

  • broken down and used for presenting to lymphocytes.

Sampling antigens in this way typically results in so-called tolerogenic activation, where

  • the immune system initiates an anti-inflammatory response.

With their cargo of antigens, these Dendritic Cells then

  • traffic to the T-cell zones of the Peyer’s Patch.

Upon encounter with specific T-cells, the Dendritic Cells

  • convert them into an immunomodulatory cell called regulatory T-cell or T-reg.

Defects in the function of these cells are associated with

  • inflammatory bowel disease in both animals and humans.

These T-regs migrate to lamina propria of the villi via the lymphatics. Here, the T-regs

  • secrete a molecule called Interleukin (IL)-10,
  • which exerts a suppressive action on immune cells within the lamina propria
  • and upon the epithelial layer itself.

IL10 is, therefore, critical in maintaining immune quiescence

  • and preventing unnecessary inflammation.

However, a breakdown in this process of immune homeostasis results in gut pathology and

  • when this occurs over a prolonged period and in an uncontrolled manner,
  • it can lead to inflammatory bowel disease.

Chemical, mechanical or pathogen-triggered barrier disruption

  • coupled with particular genetic susceptibilities may all combine to set off inflammation.

Epithelium coming into contact with bacteria

  • is activated, leading to bacterial influx.

Alarm molecules released by the epithelium

  • activates immune cells, and T-regs in the vicinity
  • scale down their IL10 secretion to enable an immune response to proceed.

Dendritic cells are also activated by this environment, and

  • start to release key inflammatory molecules,
  • such as IL6, IL12, and IL23.

Effector T-cells also appear on the scene and

  • these coordinate an escalation of the immune response
  • by secreting their own inflammatory molecules,
  • Tumor Necrosis Factor (TNF)-α, Interferon (IFN)-γ and IL17.

Soon after the effector T-cells are arrived, a voracious phagocyte called a neutrophil is recruited. Neutrophils are critical for the clearance of the bacteria. One weapon in the neutrophil armory is

  • the ability to undergo self-destruction.

This leaves behind a jumble of DNA saturated with enzymes, called the Neutrophil Extracellular Trap.

Although this can effectively destroy the bacterial invaders

  • and plug any breaches in the epithelial wall,
  • it also causes collateral damage to tissues.

Slowly the tide begins to turn and the bacterial invasion is repulsed. Any remaining neutrophils die off,

  • and are cleared by macrophages.

Epithelial integrity is restored by replacement of damaged cells with new ones from the intestinal crypts. Finally T-regs are recruited once again to calm the immune response.

Targeting the molecules involved in gut pathology is leading to

  • effective therapies for inflammatory bowel disease.

Notes:

T- and B-lymphocytes, Macrophages, and Dendritic Cells: These are all important immune effector cells. Macrophages and Dendritic cells are primary defence cells that can eat up (‘phagocytosis’) microbes and destroy them; they also can present parts of these microbes to lymphocytes. T-lymphocytes or T-cells help B-lymphocytes or B-cells recognize the antigen and form antibodies against it. Other types of T-cells can themselves kill microbes. All these cells also secrete various chemical substances, called cytokines and chemokines, which act as molecular messengers in recruiting various immune cells, coordinating and fine-tuning the immune response. Some of these cytokines are called Interleukins, shortened to IL.

Anti-inflammatory response: A type of immune response in which molecular messengers are used to scale down heavy-handed immune cell activity and switch off processes that recruit immune cells. This helps the body recognize and selectively tolerate beneficial substances such as commensalic microbes that live in the gut.

Neutrophils: These are highly versatile immune effector cells. Usually, they are one of the first cells recruited to the site of infection or tissue damage via message spread by molecular messengers. Neutrophils can themselves elaborate cytokines and chemokines, and have the ability to directly kill microbes.

Oxazoloisoindolinones with in vitro antitumor activity selectively activate a p53-pathway through potential inhibition of the p53-MDM2 interaction.

J Soares, et al. Eur J Pharm Sci 10/2014; http://dx.doi.org:/10.1016/j.ejps.2014.10.006

An appealing target for anticancer treatment is

  • the p53 tumor suppressor protein.

This protein is inactivated in half of human tumors

  • due to endogenous negative regulators such as MDM2.

Therefore, restoring the p53 activity through

  • the inhibition of its interaction with MDM2
  • is considered a valuable therapeutic strategy
  • against cancers with a wild-type p53 status.

We report the synthesis of nine enantiopure phenylalaninol-derived oxazolopyrrolidone lactams

  • and the evaluation of their biological effects as p53-MDM2 interaction inhibitors.

Using a yeast-based screening assay, two oxazoloisoindolinones,

  • were identified as potential p53-MDM2 inhibitors.

The molecular mechanism of oxazoloisoindolinone 3a validated

  • in human colon adenocarcinoma HCT116 cells with wild-type p53 (HCT116 p53(+/+)) and
  • in its isogenic derivative without p53 (HCT116 p53(-/-)).

we demonstrated that oxazoloisoindolinone 3a exhibited

  • a p53-dependent in vitro antitumor activity through
  • induction of G0/G1-phase cell cycle arrest and apoptosis.

The selective activation of a p53-apoptotic pathway by oxazoloisoindolinone 3a was further supported

  • by the occurrence of PARP cleavage only in p53-expressing HCT116 cells.

Oxazoloisoindolinone 3a led

  • to p53 protein stabilization
  • to the up-regulation of p53 transcriptional activity &
  • increased expression levels of several p53 target genes,
  • as p21, MDM2, BAX and PUMA,
  • in p53(+/+) but not in p53(-/-) HCT116 cells.

the ability of oxazoloisoindolinone 3a to block the p53-MDM2 interaction in HCT116 p53(+/+) cells was confirmed by co-immunoprecipitation.

molecular docking analysis of the interactions

  • between the compounds and MDM2 revealed that
  • oxazoloisoindolinone 3a binds to MDM2.

this work adds the oxazoloisoindolinone scaffold to the activators of a wild-type p53-pathway with promising antitumor activity.

it may open the way to the development of

  • a new class of p53-MDM2 interaction inhibitors.

TrypanoCyc: a community-led biochemical pathways database for Trypanosoma brucei.

Sanu Shameer, et al. Nucleic Acids Research10/2014;
http://dx.doi.org/10.1093/nar/gku944

The metabolic network of a cell represents the catabolic and anabolic reactions that interconvert small molecules (metabolites) through the activity of enzymes, transporters and non-catalyzed chemical reactions. Our understanding of individual metabolic networks is increasing as we learn more about the enzymes that are active in particular cells under particular conditions and as technologies advance to allow detailed measurements of the cellular metabolome.

Metabolic network databases are important in allowing us to

  • contextualise data sets emerging from transcriptomic, proteomic and metabolomic experiments.

Here we present a dynamic database, TrypanoCyc (http://www.metexplore.fr/trypanocyc/), which describes

  • the generic and condition-specific metabolic network of Trypanosoma brucei, a parasitic protozoan
  • responsible for human and animal African trypanosomiasis.

In addition to enabling navigation through the BioCyc-based TrypanoCyc interface, we have implemented a network

  • representation of the information through MetExplore,

yielding a novel environment in which to visualise the metabolism of this important parasite.

Read Full Post »

Summary of Metabolomics

Author and Curator: Larry H. Bernstein, MD, FCAP 

This concludes the series on metabolomics, a rapidly developing science that is interconnected with a group termed – OMICS: proteomics, transcriptomics, genomics, and metabolomics.  This chapter is most representative of the many important studies being done in the field, which ranges most widely because it has opened doors into nutrition and nutritional supplements, plant biochemistry, agricultural crops and breeding, animal breeding, worldwide malnutrition, diabetes, cancer, neurosciences, circulatory, respiratory, and musculosletal disorders, infectious diseases and immune system disorders.  Obviously, it is not possible to cover the full range of activity, but metabolomics is most comprehensive in exploring the full range of metabolic changes that occur in health during the full age range from development to the geriatric years.  It can be integrated well with gene expression, proteomics studies, and epidemiological investigations.

The subchapters are given here:

7.1   Extracellular evaluation of intracellular flux in yeast cells  

 http://pharmaceuticalintelligence.com/2014/08/25/extracellular-evaluation-of-intracellular-flux-in-yeast-cells/

 7.2    Metabolomic analysis of two leukemia cell lines. I.  

         http://pharmaceuticalintelligence.com/2014/08/23/metabolomic-analysis-of-two-leukemia-cell-lines-_i/

  7.3   Metabolomic analysis of two leukemia cell lines. II.

           http://pharmaceuticalintelligence.com/2014/08/24/metabolomic-analysis-of-two-leukemia-cell-lines-ii/

  7.4   Buffering of genetic modules involved in tricarboxylic acid cycle metabolism provides homeostatic
regulation
  

           http://pharmaceuticalintelligence.com/2014/08/27/buffering-of-genetic-modules-involved-in-tricarboxylic-acid-cycle-metabolism-provides-homeomeostatic-regulation/

  7.5   Metabolomics, Metabonomics and Functional Nutrition: the next step in nutritional metabolism and
biotherapeutics

 http://pharmaceuticalintelligence.com/2014/08/22/metabolomics-metabonomics-and-functional-nutrition-the-next-step-in-nutritional-metabolism-and-biotherapeutics/

    7.6    Isoenzymes in cell metabolic pathways

 http://pharmaceuticalintelligence.com/2014/10/06/isoenzymes-in-cell-metabolic-pathways/

7.7   A Brief Curation of Proteomics, Metabolomics, and Metabolism

http://pharmaceuticalintelligence.com/2014/10/03/a-brief-curation-of-proteomics-metabolomics-and-metabolism/

   7.8   Metabolomics is about Metabolic Systems Integration

     http://pharmaceuticalintelligence.com/2014/10/13/metabolomics-is-about-metabolic-systems-integration/

 7.9  Mechanisms of Drug Resistance

   http://pharmaceuticalintelligence.com/2014/10/09/mechanisms-of-drug-resistance/

7.10  Development Of Super-Resolved Fluorescence Microscopy

    http://pharmaceuticalintelligence.com/2014/10/12/development-of-super-resolved-fluorescence-microscopy  

7.11  Metabolic Reactions Need Just Enough

 http://pharmaceuticalintelligence.com/2014/10/14/metabolic-reactions-need-just-enough/

7.12  Metabolomics Summary and Perspective

   This chapter will be followed by an exploration of disease and pharmaceutical directed studies using these methods  8. Impairments in pathological states: endocrine disorders; stress
hypermetabolism; cancer.

Networking metabolites and diseases

P Braun, E Rietman, and M Vidal
Center for Cancer Systems Biology and Department of Cancer Biology, Dana-Farber Cancer Institute, and Department of Genetics, Harvard Medical School,  Boston, MA; and Physical Sciences Inc., Andover, MA 01810
PNAS July 22, 2008; 105(29): 9849–9850.    http://pnas.org/cgi/doi/10.1073/pnas.0805644105

Biological systems are increasingly viewed and analyzed as

  • highly complex networks of interlinked macromolecules and metabolites.

Network analysis has been applied to

  • interactome maps of protein–protein, protein–DNA, and protein–RNA interactions
  • as well as transcriptional, metabolic, and genetic data.

Such network views of biological systems should facilitate the detection of

  • nonlinear long-range effects of perturbations, for example, by mutations, and
  • help identification of unanticipated indirect causal connections.

Diseasome and Drug-Target Network

Recently, Goh et al. (1) constructed a ‘‘diseasome’’ network in which

  • two diseases are linked to each other if
  • they share at least one gene, in which mutations are associated with both diseases.

In the resulting network, related disease families cluster tightly together, thus

  • phenotypically defining functional modules.

Importantly, for the first time this study applied concepts from network biology to human diseases,

  • thus opening the door for discovering causal relationships between
  • disregulated networks and resulting ailments.

Subsequently Yilderim et al. (2) linked drugs to protein targets in a drug–target network,

  • which could then be overlaid with the diseasome network.

One notable finding was the recent trend toward the development of

  • new compounds directly targeted at disease gene products, whereas previous drugs,
  • often found by trial and error, appear to target proteins only indirectly related to
  • the actual disease molecular mechanisms.

An important question that remains in this emerging field of network analysis consists of

  • investigating the extent to which directly targeting the product of mutated genes is an efficient approach or
  • whether targeting network properties instead, and
  • thereby accounting for indirect nonlinear effects of system perturbations by drugs, may prove more fruitful.

However, to answer such questions it is important to have a good understanding of the various influences that can lead to diseases.

Metabolic Connections

One group of diseases that was very poorly connected in the original diseasome network was the family of metabolic diseases.

In this issue of PNAS, Lee et al. (3) hypothesize that metabolic diseases may instead be connected

  • via metabolites and common reactions.

To investigate this hypothesis Lee et al. first constructed a metabolic network from data available in

  • two manually curated databases detailing well known
  1. metabolic reactions,
  2. the involved metabolites, and
  3. catalyzing enzymes.

In addition, gene–disease associations were identified by using the Online Mendelian Inheritance in Man (OMIM) database (http://ncbi.nlm.nih.gov/sites/
entrez?dbomim&itooltoolbar). In a last step,

  • a metabolic disease network (MDN) was constructed by connecting
  • two diseases if their associated genes are linked in the metabolic network
  • by a common metabolite or metabolites used in a common reaction.

Metabolites are not only linked by common reactions, but

  • on a larger scale by coupled fluxes within a metabolic network,
  • which may also influence disease phenotypes.

An increase in the concentration of one metabolite may increase several fluxes

  • across reaction pathways that use this compound, which
  • may lead to diverse phenotypes and distinct diseases.

The fluxes within the metabolic network are calculated by using

  • the Flux Coupling Finder method described by Nikolaev et al. (4) and Burgard et al. (5),
  • which is based on the assumption that pools of metabolites are conserved.

To functionally validate the network, coexpression correlations are measured for genes

  • linked by adjacent reactions and those linked by fluxes.

Interestingly, the average coexpression correlation for flux-coupled genes (0.31)

  • is higher than that for genes simply catalyzing adjacent reactions (0.24)
    (compared with 0.10 for all gene pairs in the network).

If the links between diseases identified in the MDN are functionally and causally relevant

  • it should be expected that linked diseases occur more frequently in the same individual.

To test this hypothesis, Lee et al. (3) measured the co-occurrence of diseases in patients by using detailed Medicare information

  • of 13 million patients and 32 million hospital visits within a 3-year period.

A comorbidity index was computed to measure the degree to which one disease

  • will increase the likelihood of a second disease in the same patient.

The average comorbidity for all genes is 0.0008 (Pearson correlation coefficient),

  • which increases 3-fold to 0.0027 when disease pairs that are metabolically linked are analyzed,
  • which is highly statistically significant (P 108).

When diseases are analyzed that are directionally coupled by a flux (see ref. 3 for details),

  • the correlation increases to 0.0062.

Thus, whereas 17% of all diseases in the network show significant comorbidity, this fraction

  • nearly doubles to 31% for metabolically linked diseases.

Further analysis reveals that comorbidity effects can be detected up to three links (metabolites, reactions)

  • apart from each other with statistical significance, but not farther away.

In the MDN, several highly connected hubs, e.g., hypertension and hemolytic anemia, are

  • linked to many different co-occurring diseases not unexpected for such complex diseases
  • that can result from many different genetic alterations or variants.

Importantly, though, most of the connections to the different linked diseases

  • are mediated by diverse connections in the metabolic network.

Thus, in the future such insights may be helpful for finer classification of the complex hub disease.

Furthermore, depending on the onset of the complex (hub) disease in relation to the associated diseases,

  • such relationships may potentially be used to systematically
  • stratify patients and develop targeted treatments acting on
  • the underlying metabolic links.

Returning to the starting point of their study, Lee et al. (3) next investigated

  • whether metabolic diseases are better linked through the metabolic network
  • than they are in the previously described gene–disease network.

When purely metabolic diseases are considered, the comorbidity is, in fact,

  • best predicted by metabolic links.

Interestingly, when all diseases linked to metabolic enzymes are considered,

  • which involves many diseases that are merely related to metabolic diseases through multifunctional enzymes,
  • the gene and metabolic networks are nearly equally predictive of comorbidity,
  • indicating that as a general approach information from
  • many different biological dimensions should be integrated to identify the most relevant connections.

Together, all these findings support the initial hypothesis that metabolic diseases are linked by metabolic networks.

Practically, alteration of one metabolite or one reaction can have numerous repercussions in the network,

  • each of which can manifest as different diseases that frequently occur together in affected patients.

Radoslav Bozov

  1. Glycine, as the only amino acid having no isomer driven central carbon allowing for hing occupancy of ‘free’
    motifs, where quark (proton) ‘fluxes’ play at, is a one – step away observable (1) from synthesis of pyrimidines
    to glyoxylate mitochondrial ‘shunt’ entangling at least two differential compartments longly objected by
    Japanese metabolomics study groups.
  2. One carbon systems emerge out of a glycoprotein ‘complex’, pyrimidine synthase pathway, that possesses
    significant similarity to  BRCA2 and most other transcription factors suggesting that protein allocation is
    coorchestrated by modifications and spatially transforming construes as an outcome of energy processing.
    Directly deduced by TCS, life cannot exist without mutations, as mutations and chromatin states appear to
    be a sort of energy hold and release ‘gates’.
  3. Phosphorylations and small molecules as such as cGMP, cAMP play a role of decompression machinery
    for amplifying bio signal processing C-S, C-N, C-O, interference open systems.  By decompression
    of one relative discrete space, another one becomes compressed, which gets uncertainty of absolute energy
    processing within space scalar wise into vector objected space represented by chromatin remodeling processes,
    possibly seen as network identities information.
  4. Unifying network and quantum theory possess implications to relativity concepts and energy relevant computational methodology.
 translational medicine

translational medicine

Shifts in steady-state profiles caused by kinetic perturbations

Shifts in steady-state profiles caused by kinetic perturbations

mapping metabolomic data using three different approaches

mapping metabolomic data using three different approaches

network genetics metabotypes -  integrated metabolome and interactome mapping (iMIM)

network genetics metabotypes – integrated metabolome and interactome mapping (iMIM)

metabol leukem cell lines

metabol leukem cell lines

Metabolome Informatics Research

Metabolome Informatics Research

Read Full Post »

Summary to Metabolomics

Summary to Metabolomics

Author and Curator: Larry H. Bernstein, MD, FCAP 

This concludes a long step-by-step journey into rediscovering biological processes from the genome as a framework to the remodeled and reconstituted cell through a number of posttranscription and posttranslation processes that modify the proteome and determine the metabolome.  The remodeling process continues over a lifetime. The process requires a balance between nutrient intake, energy utilization for work in the lean body mass, energy reserves, endocrine, paracrine and autocrine mechanisms, and autophagy.  It is true when we look at this in its full scope – What a creature is man?

http://masspec.scripps.edu/metabo_science/recommended_readings.php
 Recommended Readings and Historical Perspectives

Metabolomics is the scientific study of chemical processes involving metabolites. Specifically, metabolomics is the “systematic study of the unique chemical fingerprints that specific cellular processes leave behind”, the study of their small-molecule metabolite profiles.[1] The metabolome represents the collection of all metabolites in a biological cell, tissue, organ or organism, which are the end products of cellular processes.[2] mRNA gene expression data and proteomic analyses reveal the set of gene products being produced in the cell, data that represents one aspect of cellular function. Conversely, metabolic profiling can give an instantaneous snapshot of the physiology of that cell. One of the challenges of systems biology and functional genomics is to integrate proteomic, transcriptomic, and metabolomic information to provide a better understanding of cellular biology.

The term “metabolic profile” was introduced by Horning, et al. in 1971 after they demonstrated that gas chromatography-mass spectrometry (GC-MS) could be used to measure compounds present in human urine and tissue extracts. The Horning group, along with that of Linus Pauling and Arthur B. Robinson led the development of GC-MS methods to monitor the metabolites present in urine through the 1970s.

Concurrently, NMR spectroscopy, which was discovered in the 1940s, was also undergoing rapid advances. In 1974, Seeley et al. demonstrated the utility of using NMR to detect metabolites in unmodified biological samples.This first study on muscle highlighted the value of NMR in that it was determined that 90% of cellular ATP is complexed with magnesium. As sensitivity has improved with the evolution of higher magnetic field strengths and magic angle spinning, NMR continues to be a leading analytical tool to investigate metabolism. Efforts to utilize NMR for metabolomics have been influenced by the laboratory of Dr. Jeremy Nicholson at Birkbeck College, University of London and later at Imperial College London. In 1984, Nicholson showed 1H NMR spectroscopy could potentially be used to diagnose diabetes mellitus, and later pioneered the application of pattern recognition methods to NMR spectroscopic data.

In 2005, the first metabolomics web database, METLIN, for characterizing human metabolites was developed in the Siuzdak laboratory at The Scripps Research Institute and contained over 10,000 metabolites and tandem mass spectral data. As of September 2012, METLIN contains over 60,000 metabolites as well as the largest repository of tandem mass spectrometry data in metabolomics.

On 23 January 2007, the Human Metabolome Project, led by Dr. David Wishart of the University of Alberta, Canada, completed the first draft of the human metabolome, consisting of a database of approximately 2500 metabolites, 1200 drugs and 3500 food components. Similar projects have been underway in several plant species, most notably Medicago truncatula and Arabidopsis thaliana for several years.

As late as mid-2010, metabolomics was still considered an “emerging field”. Further, it was noted that further progress in the field depended in large part, through addressing otherwise “irresolvable technical challenges”, by technical evolution of mass spectrometry instrumentation.

Metabolome refers to the complete set of small-molecule metabolites (such as metabolic intermediates, hormones and other signaling molecules, and secondary metabolites) to be found within a biological sample, such as a single organism. The word was coined in analogy with transcriptomics and proteomics; like the transcriptome and the proteome, the metabolome is dynamic, changing from second to second. Although the metabolome can be defined readily enough, it is not currently possible to analyse the entire range of metabolites by a single analytical method. The first metabolite database(called METLIN) for searching m/z values from mass spectrometry data was developed by scientists at The Scripps Research Institute in 2005. In January 2007, scientists at the University of Alberta and the University of Calgary completed the first draft of the human metabolome. They catalogued approximately 2500 metabolites, 1200 drugs and 3500 food components that can be found in the human body, as reported in the literature. This information, available at the Human Metabolome Database (www.hmdb.ca) and based on analysis of information available in the current scientific literature, is far from complete.

Each type of cell and tissue has a unique metabolic ‘fingerprint’ that can elucidate organ or tissue-specific information, while the study of biofluids can give more generalized though less specialized information. Commonly used biofluids are urine and plasma, as they can be obtained non-invasively or relatively non-invasively, respectively. The ease of collection facilitates high temporal resolution, and because they are always at dynamic equilibrium with the body, they can describe the host as a whole.

Metabolites are the intermediates and products of metabolism. Within the context of metabolomics, a metabolite is usually defined as any molecule less than 1 kDa in size.
A primary metabolite is directly involved in the normal growth, development, and reproduction. A secondary metabolite is not directly involved in those processes.  By contrast, in human-based metabolomics, it is more common to describe metabolites as being either endogenous (produced by the host organism) or exogenous. Metabolites of foreign substances such as drugs are termed xenometabolites. The metabolome forms a large network of metabolic reactions, where outputs from one enzymatic chemical reaction are inputs to other chemical reactions.

Metabonomics is defined as “the quantitative measurement of the dynamic multiparametric metabolic response of living systems to pathophysiological stimuli or genetic modification”. The word origin is from the Greek μεταβολή meaning change and nomos meaning a rule set or set of laws. This approach was pioneered by Jeremy Nicholson at Imperial College London and has been used in toxicology, disease diagnosis and a number of other fields. Historically, the metabonomics approach was one of the first methods to apply the scope of systems biology to studies of metabolism.

There is a growing consensus that ‘metabolomics’ places a greater emphasis on metabolic profiling at a cellular or organ level and is primarily concerned with normal endogenous metabolism. ‘Metabonomics’ extends metabolic profiling to include information about perturbations of metabolism caused by environmental factors (including diet and toxins), disease processes, and the involvement of extragenomic influences, such as gut microflora. This is not a trivial difference; metabolomic studies should, by definition, exclude metabolic contributions from extragenomic sources, because these are external to the system being studied.

Toxicity assessment/toxicology. Metabolic profiling (especially of urine or blood plasma samples) detects the physiological changes caused by toxic insult of a chemical (or mixture of chemicals).

Functional genomics. Metabolomics can be an excellent tool for determining the phenotype caused by a genetic manipulation, such as gene deletion or insertion. Sometimes this can be a sufficient goal in itself—for instance, to detect any phenotypic changes in a genetically-modified plant intended for human or animal consumption. More exciting is the prospect of predicting the function of unknown genes by comparison with the metabolic perturbations caused by deletion/insertion of known genes.

Nutrigenomics is a generalised term which links genomics, transcriptomics, proteomics and metabolomics to human nutrition. In general a metabolome in a given body fluid is influenced by endogenous factors such as age, sex, body composition and genetics as well as underlying pathologies. The large bowel microflora are also a very significant potential confounder of metabolic profiles and could be classified as either an endogenous or exogenous factor. The main exogenous factors are diet and drugs. Diet can then be broken down to nutrients and non- nutrients.

http://en.wikipedia.org/wiki/Metabolomics

Jose Eduardo des Salles Roselino

The problem with genomics was it was set as explanation for everything. In fact, when something is genetic in nature the genomic reasoning works fine. However, this means whenever an inborn error is found and only in this case the genomic knowledge afterwards may indicate what is wrong and not the completely way to put biology upside down by reading everything in the DNA genetic as well as non-genetic problems.

Coordination of the transcriptome and metabolome by the circadian clock PNAS 2012

Coordination of the transcriptome and metabolome by the circadian clock PNAS 2012

analysis of metabolomic data and differential metabolic regulation for fetal lungs, and maternal blood plasma

conformational changes leading to substrate efflux.img

conformational changes leading to substrate efflux.img

The cellular response is defined by a network of chemogenomic response signatures.

The cellular response is defined by a network of chemogenomic response signatures.

Dynamic Construct of the –Omics

Dynamic Construct of the –Omics

 genome cartoon

genome cartoon

central dogma phenotype

central dogma phenotype

Read Full Post »

Summary of Proteomics

Author and Curator: Larry H. Bernstein, MD, FCAP 


We have completed a series of discussions on proteomics, a scientific endeavor that is essentially 15 years old.   It is quite remarkable what has been accomplished in that time.  The interest is abetted by the understanding of the limitations of the genomic venture that has preceded it.  The thorough, yet incomplete knowledge of the genome, has led to the clarification of its limits.  It is the coding for all that lives, but all that lives has evolved to meet a demanding and changing environment with respect to

  1. availability of nutrients
  2. salinity
  3. temperature
  4. radiation exposure
  5. toxicities in the air, water, and food
  6. stresses – both internal and external

We have seen how both transcription and translation of the code results in a protein, lipoprotein, or other complex than the initial transcript that was modeled from tRNA. What you see in the DNA is not what you get in the functioning cell, organ, or organism.  There are comparabilities as well as significant differences between plants, prokaryotes, and eukaryotes.  There is extensive variation.  The variation goes beyond genomic expression, and includes the functioning cell, organ type, and species.

Here, I return to the introductory discussion.  Proteomics is a goal directed, sophisticated science that uses a combination of methods to find the answers to biological questions. Graves PR and Haystead TAJ.  Molecular Biologist’s Guide to Proteomics.
Microbiol Mol Biol Rev. Mar 2002; 66(1): 39–63.  http://www.ncbi.nlm.nih.gov/pmc/articles/PMC120780/

Peptide mass tag searching

Peptide mass tag searching

Peptide mass tag searching. Shown is a schematic of how information from an unknown peptide (top) is matched to a peptide sequence in a database (bottom) for protein identification. The partial amino acid sequence or “tag” obtained by MS/MS is combined with the peptide mass (parent mass), the mass of the peptide at the start of the sequence (mass tag 1), and the mass of the peptide at the end of the sequence (mass tag 2). The specificity of the protease used (trypsin is shown) can also be included in the search.

ICAT method for measuring differential protein expression

ICAT method for measuring differential protein expression

The ICAT method for measuring differential protein expression. (A) Structure of the ICAT reagent. ICAT consists of a biotin affinity group, a linker region that can incorporate heavy (deuterium) or light (hydrogen) atoms, and a thiol-reactive end group for linkage to cysteines. (B) ICAT strategy. Proteins are harvested from two different cell states and labeled on cysteine residues with either the light or heavy form of the ICAT reagent. Following labeling, the two protein samples are mixed and digested with a protease such as trypsin. Peptides labeled with the ICAT reagent can be purified by virtue of the biotin tag by using avidin chromatography. Following purification, ICAT-labeled peptides can be analyzed by MS to quantitate the peak ratios and proteins can be identified by sequencing the peptides with MS/MS.

Strategies for determination of phosphorylation sites in proteins

Strategies for determination of phosphorylation sites in proteins

Strategies for determination of phosphorylation sites in proteins. Proteins phosphorylated in vitro or in vivo can be isolated by protein electrophoresis and analyzed by MS. (A) Identification of phosphopeptides by peptide mass fingerprinting. In this method, phosphopeptides are identified by comparing the mass spectrum of an untreated sample to that of a sample treated with phosphatase. In the phosphatase-treated sample, potential phosphopeptides are identified by a decrease in mass due to loss of a phosphate group (80 Da). (B) Phosphorylation sites can be identified by peptide sequencing using MS/MS. (C) Edman degradation can be used to monitor the release of inorganic 32P to provide information about phosphorylation sites in peptides.

protein mining strategy

protein mining strategy

Proteome-mining strategy. Proteins are isolated on affinity column arrays from a cell line, organ, or animal source and purified to remove nonspecific adherents. Then, compound libraries are passed over the array and the proteins eluted are analyzed by protein electrophoresis. Protein information obtained by MS or Edman degradation is then used to search DNA and protein databases. If a relevant target is identified, a sublibrary of compounds can be evaluated to refine the lead. From this method a protein target and a drug lead can be simultaneously identified.

Although the technology for the analysis of proteins is rapidly progressing, it is still not feasible to study proteins on a scale equivalent to that of the nucleic acids. Most of proteomics relies on methods, such as protein purification or PAGE, that are not high-throughput methods. Even performing MS can require considerable time in either data acquisition or analysis. Although hundreds of proteins can be analyzed quickly and in an automated fashion by a MALDI-TOF mass spectrometer, the quality of data is sacrificed and many proteins cannot be identified. Much higher quality data can be obtained for protein identification by MS/MS, but this method requires considerable time in data interpretation. In our opinion, new computer algorithms are needed to allow more accurate interpretation of mass spectra without operator intervention. In addition, to access unannotated DNA databases across species, these algorithms should be error tolerant to allow for sequencing errors, polymorphisms, and conservative substitutions. New technologies will have to emerge before protein analysis on a large-scale (such as mapping the human proteome) becomes a reality.

Another major challenge for proteomics is the study of low-abundance proteins. In some eukaryotic cells, the amounts of the most abundant proteins can be 106-fold greater than those of the low-abundance proteins. Many important classes of proteins (that may be important drug targets) such as transcription factors, protein kinases, and regulatory proteins are low-copy proteins. These low-copy proteins will not be observed in the analysis of crude cell lysates without some purification. Therefore, new methods must be devised for subproteome isolation.

Tissue Proteomics for the Next Decade?  Towards a Molecular Dimension in Histology

R Longuespe´e, M Fle´ron, C Pottier, F Quesada-Calvo, Marie-Alice Meuwis, et al.
OMICS A Journal of Integrative Biology 2014; 18: 9.    http://dx.doi.org:/10.1089/omi.2014.0033

The concept of tissues appeared more than 200 years ago, since textures and attendant differences were described within the whole organism components. Instrumental developments in optics and biochemistry subsequently paved the way to transition from classical to molecular histology in order to decipher the molecular contexts associated with physiological or pathological development or function of a tissue. In 1941, Coons and colleagues performed the first systematic integrated examination of classical histology and biochemistry when his team localized pneumonia antigens in infected tissue sections. Most recently, in the early 21st century, mass spectrometry (MS) has progressively become one of the most valuable tools to analyze biomolecular compounds. Currently, sampling methods, biochemical procedures, and MS instrumentations
allow scientists to perform ‘‘in depth’’ analysis of the protein content of any type of tissue of interest. This article reviews the salient issues in proteomics analysis of tissues. We first outline technical and analytical considerations for sampling and biochemical processing of tissues and subsequently the instrumental possibilities for proteomics analysis such as shotgun proteomics in an anatomical context. Specific attention concerns formalin fixed and paraffin embedded (FFPE) tissues that are potential ‘‘gold mines’’ for histopathological investigations. In all, the matrix assisted laser desorption/ionization (MALDI) MS imaging, which allows for differential mapping of hundreds of compounds on a tissue section, is currently the most striking evidence of linkage and transition between ‘‘classical’’ and ‘‘molecular’’ histology. Tissue proteomics represents a veritable field of research and investment activity for modern biomarker discovery and development for the next decade.

Progressively, tissue analyses evolved towards the description of the whole molecular content of a given sample. Currently, mass spectrometry (MS) is the most versatile
analytical tool for protein identification and has proven its great potential for biological and clinical applications. ‘‘Omics’’ fields, and especially proteomics, are of particular
interest since they allow the analysis of a biomolecular picture associated with a given physiological or pathological state. Biochemical techniques were then adapted for an optimal extraction of several biocompounds classes from tissues of different natures.

Laser capture microdissection (LCM) is used to select and isolate tissue areas of interest for further analysis. The developments of MS instrumentations have then definitively transformed the scientific scene, pushing back more and more detection and identification limits. Since a few decades, new approaches of analyses appeared, involving the use of tissue sections dropped on glass slides as starting material. Two types of analyses can then be applied on tissue sections: shotgun proteomics and the very promising MS imaging (MSI) using Matrix Assisted Laser Desorption/Ionization (MALDI) sources. Also known as ‘‘molecular histology,’’ MSI is the most striking hyphen between histology and molecular analysis. In practice, this method allows visualization of the spatial distribution of proteins, peptides, drugs, or others analytes directly on tissue sections. This technique paved new ways of research, especially in the field of histopathology, since this approach appeared to be complementary to conventional histology.

Tissue processing workflows for molecular analyses

Tissue processing workflows for molecular analyses

Tissue processing workflows for molecular analyses. Tissues can either be processed in solution or directly on tissue sections. In solution, processing involves protein
extraction from tissue pieces in order to perform 2D gel separation and identification of proteins, shotgun proteomics, or MALDI analyses. Extracts can also be obtained from
tissues area selection and protein extraction after laser micro dissection or on-tissue processing. Imaging techniques are dedicated to the morphological characterization or molecular mapping of tissue sections. Histology can either be conducted by hematoxylin/eosin staining or by molecular mapping using antibodies with IHC. Finally, mass spectrometry imaging allows the cartography of numerous compounds in a single analysis. This approach is a modern form of ‘‘molecular histology’’ as it grafts, with the use of mathematical calculations, a molecular dimension to classical histology. (AR, antigen retrieval; FFPE, formalin fixed and paraffin embedded; fr/fr, fresh frozen; IHC, immunohistochemistry; LCM, laser capture microdissection; MALDI, matrix assisted laser desorption/ionization; MSI, mass spectrometry imaging; PTM, post translational modification.)

Analysis of tissue proteomes has greatly evolved with separation methods and mass spectrometry instrumentation. The choice of the workflow strongly depends on whether a bottom-up or a top-down analysis has to be performed downstream. In-gel or off-gel proteomics principally differentiates proteomic workflows. The almost simultaneous discoveries of the MS ionization sources (Nobel Prize awarded) MALDI (Hillenkamp and Karas, 1990; Tanaka et al., 1988) and electrospray ionization (ESI) (Fenn et al., 1989) have paved the way for analysis of intact proteins and peptides. Separation methods such as two-dimension electrophoresis (2DE) (Fey and Larsen, 2001) and nanoscale reverse phase liquid chromatography (nanoRP-LC) (Deterding et al., 1991) lead to efficient preparation of proteins for respectively topdown and bottom-up strategies. A huge panel of developments was then achieved mostly for LC-MS based proteomics in order to improve ion fragmentation approaches and peptide
identification throughput relying on database interrogation. Moreover, approaches were developed to analyze post translational modifications (PTM) such as phosphorylations (Ficarro et al., 2002; Oda et al., 2001; Zhou et al., 2001) or glycosylations (Zhang et al., 2003), proposing as well different quantification procedures. Regarding instrumentation, the most cutting edge improvements are the gain of mass accuracy for an optimal detection of the eluted peptides during LC-MS runs (Mann and Kelleher, 2008; Michalski et al., 2011) and the increase in scanning speed, for example with the use of Orbitrap analyzers (Hardman and Makarov, 2003; Makarov et al., 2006; Makarov et al., 2009; Olsen et al., 2009). Ion transfer efficiency was also drastically improved with the conception of ion funnels that homogenize the ion transmission
capacities through m/z ranges (Kelly et al., 2010; Kim et al., 2000; Page et al., 2006; Shaffer et al., 1998) or by performing electrospray ionization within low vacuum (Marginean et al., 2010; Page et al., 2008; Tang et al., 2011). Beside collision induced dissociation (CID) that is proposed for many applications (Li et al., 2009; Wells and McLuckey, 2005), new fragmentation methods were investigated, such as higher-energy collisional dissociation (HCD) especially for phosphoproteomic
applications (Nagaraj et al., 2010), and electron transfer dissociation (ETD) and electron capture dissociation (ECD) that are suited for phospho- and glycoproteomics (An
et al., 2009; Boersema et al., 2009; Wiesner et al., 2008). Methods for data-independent MS2 analysis based on peptide fragmentation in given m/z windows without precursor selection neither information knowledge, also improves identification throughput (Panchaud et al., 2009; Venable et al., 2004), especially with the use of MS instruments with high resolution and high mass accuracy specifications (Panchaud et al., 2011). Gas fractionation methods such as ion mobility (IM) can also be used as a supplementary separation dimension which enable more efficient peptide identifications (Masselon et al., 2000; Shvartsburg et al., 2013; Shvartsburg et al., 2011).

Microdissection relies on a laser ablation principle. The tissue section is dropped on a plastic membrane covering a glass slide. The preparation is then placed into a microscope
equipped with a laser. A highly focused beam will then be guided by the user at the external limit of the area of interest. This area composed by the plastic membrane, and the tissue section will then be ejected from the glass slide and collected into a tube cap for further processing. This mode of microdissection is the most widely used due to its ease of handling and the large panels of devices proposed by constructors. Indeed, Leica microsystem proposed the Leica LMD system (Kolble, 2000), Molecular Machine and Industries, the MMI laser microdissection system Microcut, which was used in combination with IHC (Buckanovich et al., 2006), Applied Biosystems developed the Arcturus
microdissection System, and Carl Zeiss patented P.A.L.M. MicroBeam technology (Braakman et al., 2011; Espina et al., 2006a; Espina et al., 2006b; Liu et al., 2012; Micke
et al., 2005). LCM represents a very adequate link between classical histology and sampling methods for molecular analyses as it is a simple customized microscope. Indeed,
optical lenses of different magnification can be used and the method is compatible with classical IHC (Buckanovich et al., 2006). Only the laser and the tube holder need to be
added to the instrumentation.

After microdissection, the tissue pieces can be processed for analyses using different available MS devices and strategies. The simplest one consists in the direct analysis of the
protein profiles by MALDI-TOF-MS (MALDI-time of flight-MS). The microdissected tissues are dropped on a MALDI target and directly covered by the MALDI matrix (Palmer-Toy et al., 2000; Xu et al., 2002). This approach was already used in order to classify breast cancer tumor types (Sanders et al., 2008), identify intestinal neoplasia protein biomarkers (Xu et al., 2009), and to determine differential profiles in glomerulosclerosis (Xu et al., 2005).

Currently the most common proteomic approach for LCM tissue analysis is LC-MS/MS. Label free LC-MS approaches have been used to study several cancers like head and neck squamous cell carcinomas (Baker et al., 2005), esophageal cancer (Hatakeyama et al., 2006), dysplasic cervical cells (Gu et al., 2007), breast carcinoma tumors (Hill et al., 2011; Johann et al., 2009), tamoxifen-resistant breast cancer cells (Umar et al., 2009), ER + / – breast cancer cells (Rezaul et al., 2010), Barretts esophagus (Stingl et al., 2011), and ovarian endometrioid cancer (Alkhas et al., 2011). Different isotope labeling methods have been used in order to compare proteins expression. ICAT was first used to investigate proteomes of hepatocellular carcinoma (Li et al., 2004; 2008). The O16/O18 isotopic labeling was then used for proteomic analysis of ductal carcinoma of the breast (Zang et al., 2004).

Currently, the lowest amount of collected cells for a relevant single analysis using fr/fr breast cancer tissues was 3000–4000 (Braakman et al., 2012; Liu et al., 2012; Umar et al., 2007). With a Q-Exactive (Thermo, Waltham) mass spectrometer coupled to LC, Braakman was able to identify up to 1800 proteins from 4000 cells. Processing
of FFPE microdissected tissues of limited sizes still remains an issue which is being addressed by our team.

Among direct tissue analyses modes, two categories of investigations can be done. MALDI profiling consists in the study of molecular localization of compounds and can be
combined with parallel shotgun proteomic methods. Imaging methods give less detailed molecular information, but is more focused on the accurate mapping of the detected compounds through tissue area. In 2007, a concept of direct tissue proteomics (DTP) was proposed for high-throughput examination of tissue microarray samples. However, contrary to the classical workflow, tissue section chemical treatment involved a first step of scrapping each FFPE tissue spot with a razor blade from the glass slide. The tissues were then transferred into a tube and processed with RIPA buffer and finally submitted to boiling as an AR step (Hwang et al., 2007). Afterward, several teams proved that it was possible to perform the AR directly on tissue sections. These applications were mainly dedicated to MALDI imaging analyses (Bonnel et al., 2011; Casadonte and Caprioli, 2011; Gustafsson et al., 2010). However, more recently, Longuespe´e used citric acid antigen retrieval (CAAR) before shotgun proteomics associated to global profiling proteomics (Longuespee et al., 2013).

MALDI imaging workflow

MALDI imaging workflow

MALDI imaging workflow. For MALDI imaging experiments, tissue sections are dropped on conductive glass slides. Sample preparations are then adapted depending on the nature of the tissue sample (FFPE or fr/fr). Then, matrix is uniformly deposited on the tissue section using dedicated devices. A laser beam subsequently irradiates the preparation following a given step length and a MALDI spectrum is acquired for each position. Using adapted software, the different detected ions are then mapped through the tissue section, in function of their differential intensities. The ‘‘molecular maps’’ are called images. (FFPE, formalin fixed and paraffin embedded; fr/fr, fresh frozen; MALDI, matrix assisted laser desorption ionization.)

Proteomics instrumentations, specific biochemical preparations, and sampling methods such as LCM altogether allow for the deep exploration and comparison of different proteomes between regions of interest in tissues with up to 104 detected proteins. MALDI MS imaging that allows for differential mapping of hundreds of compounds on a tissue section is currently the most striking illustration of association between ‘‘classical’’ and ‘‘molecular’’ histology.

Novel serum protein biomarker panel revealed by mass spectrometry and its prognostic value in breast cancer

L Chung, K Moore, L Phillips, FM Boyle, DJ Marsh and RC Baxter*  Breast Cancer Research 2014, 16:R63
http://breast-cancer-research.com/content/16/3/R63

Introduction: Serum profiling using proteomic techniques has great potential to detect biomarkers that might improve diagnosis and predict outcome for breast cancer patients (BC). This study used surface-enhanced laser desorption/ionization time-of-flight (SELDI-TOF) mass spectrometry (MS) to identify differentially expressed proteins in sera from BC and healthy volunteers (HV), with the goal of developing a new prognostic biomarker panel.
Methods: Training set serum samples from 99 BC and 51 HV subjects were applied to four adsorptive chip surfaces (anion-exchange, cation-exchange, hydrophobic, and metal affinity) and analyzed by time-of-flight MS. For validation, 100 independent BC serum samples and 70 HV samples were analyzed similarly. Cluster analysis of protein spectra was performed to identify protein patterns related to BC and HV groups. Univariate and multivariate statistical analyses were used to develop a protein panel to distinguish breast cancer sera from healthy sera, and its prognostic potential was evaluated.
Results: From 51 protein peaks that were significantly up- or downregulated in BC patients by univariate analysis, binary logistic regression yielded five protein peaks that together classified BC and HV with a receiver operating characteristic (ROC) area-under-the-curve value of 0.961. Validation on an independent patient cohort confirmed
the five-protein parameter (ROC value 0.939). The five-protein parameter showed positive association with large tumor size (P = 0.018) and lymph node involvement (P = 0.016). By matrix-assisted laser desorption/ionization time-of-flight (MALDI-TOF) MS, immunoprecipitation and western blotting the proteins were identified as a fragment
of apolipoprotein H (ApoH), ApoCI, complement C3a, transthyretin, and ApoAI. Kaplan-Meier analysis on 181 subjects after median follow-up of >5 years demonstrated that the panel significantly predicted disease-free survival (P = 0.005), its efficacy apparently greater in women with estrogen receptor (ER)-negative tumors (n = 50, P = 0.003) compared to ER-positive (n = 131, P = 0.161), although the influence of ER status needs to be confirmed after longer follow-up.
Conclusions: Protein mass profiling by MS has revealed five serum proteins which, in combination, can distinguish between serum from women with breast cancer and healthy control subjects with high sensitivity and specificity. The five-protein panel significantly predicts recurrence-free survival in women with ER-negative tumors and may have value in the management of these patients.

Cellular prion protein is required for neuritogenesis: fine-tuning of multiple signaling pathways involved in focal adhesions and actin cytoskeleton dynamics

Aurélie Alleaume-Butaux, et al.   Cell Health and Cytoskeleton 2013:5 1–12

Neuritogenesis is a dynamic phenomenon associated with neuronal differentiation that allows a rather spherical neuronal stem cell to develop dendrites and axon, a prerequisite for the integration and transmission of signals. The acquisition of neuronal polarity occurs in three steps:

(1) neurite sprouting, which consists of the formation of buds emerging from the postmitotic neuronal soma;

(2) neurite outgrowth, which represents the conversion of buds into neurites, their elongation and evolution into axon or dendrites; and

(3) the stability and plasticity of neuronal polarity.

In neuronal stem cells, remodeling and activation of focal adhesions (FAs)

  • associated with deep modifications of the actin cytoskeleton is
  • a prerequisite for neurite sprouting and subsequent neurite outgrowth.

A multiple set of growth factors and interactors located in

  • the extracellular matrix and the plasma membrane orchestrate neuritogenesis
  • by acting on intracellular signaling effectors, notably small G proteins such as RhoA, Rac, and Cdc42,
  • which are involved in actin turnover and the dynamics of FAs.

The cellular prion protein (PrPC), a glycosylphosphatidylinositol (GPI)-anchored membrane protein

  • mainly known for its role in a group of fatal neurodegenerative diseases,
  • has emerged as a central player in neuritogenesis.

Here, we review the contribution of PrPC to neuronal polarization and

  • detail the current knowledge on the signaling pathways fine-tuned
  • by PrPC to promote neurite sprouting, outgrowth, and maintenance.

We emphasize that PrPC-dependent neurite sprouting is a process in which

  • PrPC governs the dynamics of FAs and the actin cytoskeleton via β1 integrin signaling.

The presence of PrPC is necessary to render neuronal stem cells

  • competent to respond to neuronal inducers and to develop neurites.

In differentiating neurons, PrPC exerts a facilitator role towards neurite elongation.

This function relies on the interaction of PrPC with a set of diverse partners such as

  1. elements of the extracellular matrix,
  2. plasma membrane receptors,
  3. adhesion molecules, and
  4. soluble factors that control actin cytoskeleton turnover
  • through Rho-GTPase signaling.

Once neurons have reached their terminal stage of differentiation and

  • acquired their polarized morphology,
  • PrPC also takes part in the maintenance of neurites.

By acting on tissue nonspecific alkaline phosphatase, or matrix metalloproteinase type 9,

  • PrPC stabilizes interactions between neurites and the extracellular matrix.

Fusion-pore expansion during syncytium formation is restricted by an actin network

Andrew Chen et al., Journal of Cell Science 121, 3619-3628. http://dx.doi.org:/10.1242/jcs.032169

Cell-cell fusion in animal development and in pathophysiology

  • involves expansion of nascent fusion pores formed by protein fusogens
  • to yield an open lumen of cell-size diameter.

Here we explored the enlargement of micron-scale pores in syncytium formation,

  • which was initiated by a well-characterized fusogen baculovirus gp64.

Radial expansion of a single or, more often, of multiple fusion pores

  • proceeds without loss of membrane material in the tight contact zone.

Pore growth requires cell metabolism and is

  • accompanied by a local disassembly of the actin cortex under the pores.

Effects of actin-modifying agents indicate that

  • the actin cortex slows down pore expansion.

We propose that the growth of the strongly bent fusion-pore rim

  1. is restricted by a dynamic resistance of the actin network and
  2. driven by membrane-bending proteins that are involved in
  3. the generation of highly curved intracellular membrane compartments.

Pak1 Is Required to Maintain Ventricular Ca2+ Homeostasis and Electrophysiological Stability Through SERCA2a Regulation in Mice

Yanwen Wang, et al.  Circ Arrhythm Electrophysiol. 2014;7:00-00.

Impaired sarcoplasmic reticular Ca2+ uptake resulting from

  • decreased sarcoplasmic reticulum Ca2+-ATPase type 2a (SERCA2a) expression or activity
  • is a characteristic of heart failure with its associated ventricular arrhythmias.

Recent attempts at gene therapy of these conditions explored strategies

  • enhancing SERCA2a expression and the activity as novel approaches to heart failure management.

We here explore the role of Pak1 in maintaining ventricular Ca2+ homeostasis and electrophysiological stability

  • under both normal physiological and acute and chronic β-adrenergic stress conditions.

Methods and Results—Mice with a cardiomyocyte-specific Pak1 deletion (Pak1cko), but not controls (Pak1f/f), showed

  • high incidences of ventricular arrhythmias and electrophysiological instability
  • during either acute β-adrenergic or chronic β-adrenergic stress leading to hypertrophy,
  • induced by isoproterenol.

Isolated Pak1cko ventricular myocytes correspondingly showed

  • aberrant cellular Ca2+ homeostasis.

Pak1cko hearts showed an associated impairment of SERCA2a function and

  • downregulation of SERCA2a mRNA and protein expression.

Further explorations of the mechanisms underlying the altered transcriptional regulation

  • demonstrated that exposure to control Ad-shC2 virus infection
  • increased SERCA2a protein and mRNA levels after
  • phenylephrine stress in cultured neonatal rat cardiomyocytes.

This was abolished by the

  • Pak1-knockdown in Ad-shPak1–infected neonatal rat cardiomyocytes and
  • increased by constitutive overexpression of active Pak1 (Ad-CAPak1).

We then implicated activation of serum response factor, a transcriptional factor well known for

  • its vital role in the regulation of cardiogenesis genes in the Pak1-dependent regulation of SERCA2a.

Conclusions—These findings indicate that

Pak1 is required to maintain ventricular Ca2+ homeostasis and electrophysiological stability

  • and implicate Pak1 as a novel regulator of cardiac SERCA2a through
  • a transcriptional mechanism

fusion in animal development and in pathophysiology involves expansion of nascent fusion pores

  • formed by protein fusogens to yield an open lumen of cell-size diameter.

Here we explored the enlargement of micron-scale pores in syncytium formation,

  • which was initiated by a well-characterized fusogen baculovirus gp64.

Radial expansion of a single or, more often, of multiple fusion pores proceeds

  • without loss of membrane material in the tight contact zone.

Pore growth requires cell metabolism and is accompanied by

  • a local disassembly of the actin cortex under the pores.

Effects of actin-modifying agents indicate that the actin cortex slows down pore expansion.

We propose that the growth of the strongly bent fusion-pore rim is restricted

  • by a dynamic resistance of the actin network and driven by
  • membrane-bending proteins that are involved in the generation of
  • highly curved intracellular membrane compartments.

Role of forkhead box protein A3 in age-associated metabolic decline

Xinran Maa,1, Lingyan Xua,1, Oksana Gavrilovab, and Elisabetta Muellera,2
PNAS Sep 30, 2014 | 111 | 39 | 14289–14294  http://pnas.org/cgi/doi/10.1073/pnas.1407640111

Significance
This paper reports that the transcription factor forkhead box protein A3 (Foxa3) is

  • directly involved in the development of age-associated obesity and insulin resistance.

Mice that lack the Foxa3 gene

  1. remodel their fat tissues,
  2. store less fat, and
  3. burn more energy as they age.

These mice also live significantly longer.

We show that Foxa3 suppresses a key metabolic cofactor, PGC1α,

  • which is involved in the gene programs that turn on energy expenditure in adipose tissues.

Overall, these findings suggest that Foxa3 contributes to the increased adiposity observed during aging,

  • and that it can be a possible target for the treatment of metabolic disorders.

Aging is associated with increased adiposity and diminished thermogenesis, but

  • the critical transcription factors influencing these metabolic changes late in life are poorly understood.

We recently demonstrated that the winged helix factor forkhead box protein A3 (Foxa3)

  • regulates the expansion of visceral adipose tissue in high-fat diet regimens; however,
  • whether Foxa3 also contributes to the increase in adiposity and the decrease in brown fat activity
  • observed during the normal aging process is currently unknown.

Here we report that during aging, levels of Foxa3 are significantly and selectively

  • up-regulated in brown and inguinal white fat depots, and that
  • midage Foxa3-null mice have increased white fat browning and thermogenic capacity,
  1. decreased adipose tissue expansion,
  2. improved insulin sensitivity, and
  3. increased longevity.

Foxa3 gain-of-function and loss-of-function studies in inguinal adipose depots demonstrated

  • a cell-autonomous function for Foxa3 in white fat tissue browning.

The mechanisms of Foxa3 modulation of brown fat gene programs involve

  • the suppression of peroxisome proliferator activated receptor γ coactivtor 1 α (PGC1α) levels
  • through interference with cAMP responsive element binding protein 1-mediated
  • transcriptional regulation of the PGC1α promoter.

Our data demonstrate a role for Foxa3 in energy expenditure and in age-associated metabolic disorders.

Control of Mitochondrial pH by Uncoupling Protein 4 in Astrocytes Promotes Neuronal Survival

HP Lambert, M Zenger, G Azarias, Jean-Yves Chatton, PJ. Magistretti,§, S Lengacher
JBC (in press) M114.570879  http://www.jbc.org/cgi/doi/10.1074/jbc.M114.570879

Background: Role of uncoupling proteins (UCP) in the brain is unclear.
Results: UCP, present in astrocytes, mediate the intra-mitochondrial acidification leading to a decrease in mitochondrial ATP production.
Conclusion: Astrocyte pH regulation promotes ATP synthesis by glycolysis whose final product, lactate, increases neuronal survival.
Significance: We describe a new role for a brain uncoupling protein.

Brain activity is energetically costly and requires a steady and

  • highly regulated flow of energy equivalents between neural cells.

It is believed that a substantial share of cerebral glucose, the major source of energy of the brain,

  • will preferentially be metabolized in astrocytes via aerobic glycolysis.

The aim of this study was to evaluate whether uncoupling proteins (UCPs),

  • located in the inner membrane of mitochondria,
  • play a role in setting up the metabolic response pattern of astrocytes.

UCPs are believed to mediate the transmembrane transfer of protons

  • resulting in the uncoupling of oxidative phosphorylation from ATP production.

UCPs are therefore potentially important regulators of energy fluxes. The main UCP isoforms

  • expressed in the brain are UCP2, UCP4, and UCP5.

We examined in particular the role of UCP4 in neuron-astrocyte metabolic coupling

  • and measured a range of functional metabolic parameters
  • including mitochondrial electrical potential and pH,
  1. reactive oxygen species production,
  2. NAD/NADH ratio,
  3. ATP/ADP ratio,
  4. CO2 and lactate production, and
  5. oxygen consumption rate (OCR).

In brief, we found that UCP4 regulates the intra-mitochondrial pH of astrocytes

  • which acidifies as a consequence of glutamate uptake,
  • with the main consequence of reducing efficiency of mitochondrial ATP production.
  • the diminished ATP production is effectively compensated by enhancement of glycolysis.
  • this non-oxidative production of energy is not associated with deleterious H2O2 production.

We show that astrocytes expressing more UCP4 produced more lactate,

  • used as energy source by neurons, and had the ability to enhance neuronal survival.

Jose Eduardo des Salles Roselino

The problem with genomics was it was set as explanation for everything. In fact, when something is genetic in nature the genomic reasoning works fine. However, this means whenever an inborn error is found and only in this case the genomic knowledge afterwards may indicate what is wrong and not the completely way to put biology upside down by reading everything in the DNA genetic as well as non-genetic problems.

Read Full Post »

Summary of Cell Structure, Anatomic Correlates of Metabolic Function

Author and Curator: Larry H. Bernstein, MD, FCAP  


This chapter has been concerned with the subcellular ultrastructure of organelles, and importantly, their function.  There is no waste in the cell structure. The nucleus has the instructions necessary to carry out the cell’s functions.  In the Eukaryotic cell there is significant differentiation so that the cells are regulated for the needs that they uniquely carry out.  When there is disregulation, it leads to remodeling or to cell death.

Here I shall note some highlights of this chapter.

  1. In every aspect of cell function, proteins are involved embedded in the structure, for most efficient functioning.
  2. Metabolic regulation is dependent on pathways that are also linkages of proteins.
  3. Energy utilization is dependent on enzymatic reactions, often involving essential metal ions of high valence numbers, which facilitates covalent and anion binding, and has an essential role in allostericity.

Mitochondria

Mitochondria,_mammalian_lung

Mitochondria,_mammalian_lung

http://en.wikipedia.org/wiki/File:Mitochondria,_mammalian_lung_-_TEM.jpg

Mitochondria range from 0.5 to 1.0 micrometer (μm) in diameter. These structures are sometimes described as “cellular power plants” because they generate most of the cell’s supply of adenosine triphosphate (ATP), used as a source of chemical energy. In addition to supplying cellular energy, mitochondria are involved in other tasks such as signaling, cellular differentiation, cell death, as well as the control of the cell cycle and cell growth. Mitochondria have been implicated in several human diseases, including mitochondrial disorders and cardiac dysfunction.

The number of mitochondria in a cell can vary widely by organism, tissue, and cell type. For instance, red blood cells have no mitochondria, whereas liver cells can have more than 2000. The organelle is composed of compartments that carry out specialized functions. These compartments or regions include the outer membrane, the intermembrane space, the inner membrane, and the cristae and matrix. Mitochondrial proteins vary depending on the tissue and the species. The mitochondrial proteome is thought to be dynamically regulated. Although most of a cell’s DNA is contained in the cell nucleus, the mitochondrion has its own independent genome. Further, its DNA shows substantial similarity to bacterial genomes.

In 1913 particles from extracts of guinea-pig liver were linked to respiration by Otto Heinrich Warburg, which he called “grana”. Warburg and Heinrich Otto Wieland, who had also postulated a similar particle mechanism, disagreed on the chemical nature of the respiration. It was not until 1925 when David Keilin discovered cytochromes that the respiratory chain was described.  In 1939, experiments using minced muscle cells demonstrated that one oxygen atom can form two adenosine triphosphate molecules, and, in 1941, the concept of phosphate bonds being a form of energy in cellular metabolism was developed by Fritz Albert Lipmann. In the following years, the mechanism behind cellular respiration was further elaborated, although its link to the mitochondria was not known. The introduction of tissue fractionation by Albert Claude allowed mitochondria to be isolated from other cell fractions and biochemical analysis to be conducted on them alone. In 1946, he concluded that cytochrome oxidase and other enzymes responsible for the respiratory chain were isolated to the mitchondria.

The first high-resolution micrographs appeared in 1952, replacing the Janus Green stains as the preferred way of visualising the mitochondria. This led to a more detailed analysis of the structure of the mitochondria, including confirmation that they were surrounded by a membrane. It also showed a second membrane inside the mitochondria that folded up in ridges dividing up the inner chamber and that the size and shape of the mitochondria varied from cell to cell.  In 1967, it was discovered that mitochondria contained ribosomes. In 1968, methods were developed for mapping the mitochondrial genes, with the genetic and physical map of yeast mitochondria being completed in 1976.

A mitochondrion contains outer and inner membranes composed of phospholipid bilayers and proteins. The two membranes have different properties. Because of this double-membraned organization, there are five distinct parts to a mitochondrion. They are:

  1. the outer mitochondrial membrane,
  2. the intermembrane space (the space between the outer and inner membranes),
  3. the inner mitochondrial membrane,
  4. the cristae space (formed by infoldings of the inner membrane), and
  5. the matrix (space within the inner membrane).

Mitochondria stripped of their outer membrane are called mitoplasts.

Mitochondrion_structure_drawing

Mitochondrion_structure_drawing

http://upload.wikimedia.org/wikipedia/commons/thumb/9/9e/Mitochondrion_structure_drawing.svg/500px-Mitochondrion_structure_drawing.svg.png

Mitochondrion ultrastructure (interactive diagram) A mitochondrion has a double membrane; the inner one contains its chemiosmotic apparatus and has deep grooves which increase its surface area. While commonly depicted as an “orange sausage with a blob inside of it” (like it is here), mitochondria can take many shapes and their intermembrane space is quite thin.

The intermembrane space is the space between the outer membrane and the inner membrane. It is also known as perimitochondrial space. Because the outer membrane is freely permeable to small molecules, the concentrations of small molecules such as ions and sugars in the intermembrane space is the same as the cytosol. However, large proteins must have a specific signaling sequence to be transported across the outer membrane, so the protein composition of this space is different from the protein composition of the cytosol. One protein that is localized to the intermembrane space in this way is cytochrome c.

The inner mitochondrial membrane contains proteins with five types of functions:

  1. Those that perform the redox reactions of oxidative phosphorylation
  2. ATP synthase, which generates ATP in the matrix
  3. Specific transport proteins that regulate metabolite passage into and out of the matrix
  4. Protein import machinery.
  5. Mitochondria fusion and fission protein.

It contains more than 151 different polypeptides, and has a very high protein-to-phospholipid ratio (more than 3:1 by weight, which is about 1 protein for 15 phospholipids). The inner membrane is home to around 1/5 of the total protein in a mitochondrion. In addition, the inner membrane is rich in an unusual phospholipid, cardiolipin. This phospholipid was originally discovered in cow hearts in 1942, and is usually characteristic of mitochondrial and bacterial plasma membranes. Cardiolipin contains four fatty acids rather than two, and may help to make the inner membrane impermeable. Unlike the outer membrane, the inner membrane doesn’t contain porins, and is highly impermeable to all molecules. Almost all ions and molecules require special membrane transporters to enter or exit the matrix. Proteins are ferried into the matrix via the translocase of the inner membrane (TIM) complex or via Oxa1. In addition, there is a membrane potential across the inner membrane, formed by the action of the enzymes of the electron transport chain.

The inner mitochondrial membrane is compartmentalized into numerous cristae, which expand the surface area of the inner mitochondrial membrane, enhancing its ability to produce ATP. For typical liver mitochondria, the area of the inner membrane is about five times as large as the outer membrane. This ratio is variable and mitochondria from cells that have a greater demand for ATP, such as muscle cells, contain even more cristae. These folds are studded with small round bodies known as F1 particles or oxysomes. These are not simple random folds but rather invaginations of the inner membrane, which can affect overall chemiosmotic function. One recent mathematical modeling study has suggested that the optical properties of the cristae in filamentous mitochondria may affect the generation and propagation of light within the tissue.

Mitochondrion

Mitochondrion

http://upload.wikimedia.org/wikipedia/commons/thumb/d/d8/MitochondrionCAM.jpg/250px-MitochondrionCAM.jpg

The matrix is the space enclosed by the inner membrane. It contains about 2/3 of the total protein in a mitochondrion. The matrix is important in thThe MAM is enriched in enzymes involved in lipid biosynthesis, such as phosphatidylserine synthase on the ER face and phosphatidylserine decarboxylase on the mitochondrial face.[28][29] Because mitochondria are dynamic organelles constantly undergoing fission and fusion events, they require a constant and well-regulated supply of phospholipids for membrane integrity.[30][31] But mitochondria are not only a destination for the phospholipids they finish synthesis of; rather, this organelle also plays a role in inter-organelle trafficking of the intermediates and products of phospholipid biosynthetic pathways, ceramide and cholesterol metabolism, and glycosphingolipid anabolisme production of ATP with the aid of the ATP synthase contained in the inner membrane. The matrix contains a highly concentrated mixture of hundreds of enzymes, special mitochondrial ribosomes, tRNA, and several copies of the mitochondrial DNA genome. Of the enzymes, the major functions include oxidation of pyruvate and fatty acids, and the citric acid cycle.

Purified MAM from subcellular fractionation has shown to be enriched in enzymes involved in phospholipid exchange, in addition to channels associated with Ca2+ signaling. The mitochondria-associated ER membrane (MAM) is another structural element that is increasingly recognized for its critical role in cellular physiology and homeostasis. Once considered a technical snag in cell fractionation techniques, the alleged ER vesicle contaminants that invariably appeared in the mitochondrial fraction have been re-identified as membranous structures derived from the MAM—the interface between mitochondria and the ER. Physical coupling between these two organelles had previously been observed in electron micrographs and has more recently been probed with fluorescence microscopy. Such studies estimate that at the MAM, which may comprise up to 20% of the mitochondrial outer membrane, the ER and mitochondria are separated by a mere 10–25 nm and held together by protein tethering complexes.

Such trafficking capacity depends on the MAM, which has been shown to facilitate transfer of lipid intermediates between organelles. In contrast to the standard vesicular mechanism of lipid transfer, evidence indicates that the physical proximity of the ER and mitochondrial membranes at the MAM allows for lipid flipping between opposed bilayers. Despite this unusual and seemingly energetically unfavorable mechanism, such transport does not require ATP. Instead, in yeast, it has been shown to be dependent on a multiprotein tethering structure termed the ER-mitochondria encounter structure, or ERMES, although it remains unclear whether this structure directly mediates lipid transfer or is required to keep the membranes in sufficiently close proximity to lower the energy barrier for lipid flipping.

A critical role for the ER in calcium signaling was acknowledged before such a role for the mitochondria was widely accepted, in part because the low affinity of Ca2+ channels localized to the outer mitochondrial membrane seemed to fly in the face of this organelle’s purported responsiveness to changes in intracellular Ca2+ flux. But the presence of the MAM resolves this apparent contradiction: the close physical association between the two organelles results in Ca2+ microdomains at contact points that facilitate efficient Ca2+ transmission from the ER to the mitochondria. Transmission occurs in response to so-called “Ca2+ puffs” generated by spontaneous clustering and activation of IP3R, a canonical ER membrane Ca2+ channel.

The properties of the Ca2+ pump SERCA and the channel IP3R present on the ER membrane facilitate feedback regulation coordinated by MAM function. In particular, clearance of Ca2+ by the MAM allows for spatio-temporal patterning of Ca2+ signaling because Ca2+ alters IP3R activity in a biphasic manner. SERCA is likewise affected by mitochondrial feedback: uptake of Ca2+ by the MAM stimulates ATP production, thus providing energy that enables SERCA to reload the ER with Ca2+ for continued Ca2+ efflux at the MAM. Thus, the MAM is not a passive buffer for Ca2+ puffs; rather it helps modulate further Ca2+ signaling through feedback loops that affect ER dynamics.

Regulating ER release of Ca2+ at the MAM is especially critical because only a certain window of Ca2+ uptake sustains the mitochondria, and consequently the cell, at homeostasis. Sufficient intraorganelle Ca2+ signaling is required to stimulate metabolism by activating dehydrogenase enzymes critical to flux through the citric acid cycle. However, once Ca2+ signaling in the mitochondria passes a certain threshold, it stimulates the intrinsic pathway of apoptosis in part by collapsing the mitochondrial membrane potential required for metabolism.  Studies examining the role of pro- and anti-apoptotic factors support this model; for example, the anti-apoptotic factor Bcl-2 has been shown to interact with IP3Rs to reduce Ca2+ filling of the ER, leading to reduced efflux at the MAM and preventing collapse of the mitochondrial membrane potential post-apoptotic stimuli. Given the need for such fine regulation of Ca2+ signaling, it is perhaps unsurprising that dysregulated mitochondrial Ca2+ has been implicated in several neurodegenerative diseases, while the catalogue of tumor suppressors includes a few that are enriched at the MAM.

…more

http://en.wikipedia.org/wiki/Mitochondrion

Lysosome and Apoptosis

Role of autophagy in cancer

R Mathew, V Karantza-Wadsworth & E White

Nature Reviews Cancer 7, 961-967 (Dec 2007) |  http://dx.doi.org:/10.1038/nrc2254

Autophagy is a cellular degradation pathway for the clearance of damaged or superfluous proteins and organelles. The recycling of these intracellular constituents also serves as an alternative energy source during periods of metabolic stress to maintain homeostasis and viability. In tumour cells with defects in apoptosis, autophagy allows prolonged survival. Paradoxically, autophagy defects are associated with increased tumorigenesis, but the mechanism behind this has not been determined. Recent evidence suggests that autophagy provides a protective function to limit tumour necrosis and inflammation, and to mitigate genome damage in tumour cells in response to metabolic stress.

Sustained Activation of mTORC1 in Skeletal Muscle Inhibits Constitutive and Starvation-Induced Autophagy and Causes a Severe, Late-Onset Myopathy

P Castets, S Lin, N Rion, S Di Fulvio, et al.
cell-metabolism 7 May, 2013; 17(5): p731–744   http://dx.doi.org/10.1016/j.cmet.2013.03.015

  • mTORC1 inhibition is required for constitutive and starvation-induced autophagy
  • Sustained activation of mTORC1 causes a severe myopathy due to autophagy impairment
  • TSC1 depletion is sufficient to activate mTORC1 irrespective of other stimuli
  • mTORC1 inactivation is sufficient to trigger LC3 lipidation

Autophagy is a catabolic process that ensures homeostatic cell clearance and is deregulated in a growing number of myopathological conditions. Although FoxO3 was shown to promote the expression of autophagy-related genes in skeletal muscle, the mechanisms triggering autophagy are unclear. We show that TSC1-deficient mice (TSCmKO), characterized by sustained activation of mTORC1, develop a late-onset myopathy related to impaired autophagy. In young TSCmKO mice,

  • constitutive and starvation-induced autophagy is blocked at the induction steps via
  • mTORC1-mediated inhibition of Ulk1, despite FoxO3 activation.

Rapamycin is sufficient to restore autophagy in TSCmKO mice and

  • improves the muscle phenotype of old mutant mice.

Inversely, abrogation of mTORC1 signaling by

  • depletion of raptor induces autophagy regardless of FoxO inhibition.

Thus, mTORC1 is the dominant regulator of autophagy induction in skeletal muscle and

  • ensures a tight coordination of metabolic pathways.

These findings may open interesting avenues for therapeutic strategies directed toward autophagy-related muscle diseases.

Histone deacetylases 1 and 2 regulate autophagy flux and skeletal muscle homeostasis in mice

Viviana Moresi, et al.   PNAS Jan 31, 2012; 109(5): 1649-1654
http://dx.doi.org:/10.1073/pnas.1121159109
http://www.pnas.org/content/109/5/1649/F6.medium.gif

HDAC1 activates FoxO and is both sufficient and required for skeletal muscle atrophy

Beharry, PB. Sandesara, BM. Roberts, et al.
J. Cell Sci. Apr 2014 127 (7) 1441-1453   http://dx.doi.org:/10.1242/​jcs.136390

The Forkhead box O (FoxO) transcription factors are activated, and necessary for the muscle atrophy, in several pathophysiological conditions, including muscle disuse and cancer cachexia. However, the mechanisms that lead to FoxO activation are not well defined. Recent data from our laboratory and others indicate that

  • the activity of FoxO is repressed under basal conditions via reversible lysine acetylation,
  • which becomes compromised during catabolic conditions.

Therefore, we aimed to determine how histone deacetylase (HDAC) proteins contribute to

  • activation of FoxO and induction of the muscle atrophy program.

Through the use of various pharmacological inhibitors to block HDAC activity, we demonstrate that

  • class I HDACs are key regulators of FoxO and the muscle-atrophy program
  • during both nutrient deprivation and skeletal muscle disuse.

Furthermore, we demonstrate, through the use of wild-type and dominant-negative HDAC1 expression plasmids,

  • that HDAC1 is sufficient to activate FoxO and induce muscle fiber atrophy in vivo and
  • is necessary for the atrophy of muscle fibers that is associated with muscle disuse.

The ability of HDAC1 to cause muscle atrophy required its deacetylase activity and

  • was linked to the induction of several atrophy genes by HDAC1,
  • including atrogin-1, which required deacetylation of FoxO3a.

Moreover, pharmacological inhibition of class I HDACs during muscle disuse, using MS-275,

  • significantly attenuated both disuse muscle fiber atrophy and contractile dysfunction.

Together, these data solidify the importance of class I HDACs in the muscle atrophy program and

  • indicate that class I HDAC inhibitors are feasible countermeasures to impede muscle atrophy and weakness.

Autophagy and thyroid carcinogenesis: genetic and epigenetic links
F Morani, R Titone, L Pagano, et al.  Endocr Relat Cancer Feb 1, 2014 21 R13-R29
http://dx.doi.org:/10.1530/ERC-13-0271

Autophagy is a vesicular process for the lysosomal degradation of protein aggregates and

  • of damaged or redundant organelles.

Autophagy plays an important role in cell homeostasis, and there is evidence that

  • this process is dysregulated in cancer cells.

Recent in vitro preclinical studies have indicated that autophagy is

  • involved in the cytotoxic response to chemotherapeutics in thyroid cancer cells.

Indeed, several oncogenes and oncosuppressor genes implicated in thyroid carcinogenesis

  • also play a role in the regulation of autophagy.

In addition, some epigenetic modulators involved in thyroid carcinogenesis also influence autophagy. In this review, we highlight the genetic and epigenetic factors that

  • mechanistically link thyroid carcinogenesis and autophagy, thus substantiating the rationale for
  • an autophagy-targeted therapy of aggressive and radio-chemo-resistant thyroid cancers.

Read Full Post »

Introduction to Subcellular Structure

Author and Curator: Larry H. Bernstein, MD, FCAP  


The following chapter of the metabolism/transcriptomics/proteomics/metabolomics series deals with the subcellular structure of the cell.  This would have to include the cytoskeleton, which has a key role in substrate and ion efflux and influx, and in cell movement mediated by tubulins.  It has been extensively covered already.  Much of the contributions here are concerned with the mitochondrion, which is also covered in metabolic pathways.  The ribosome is the organelle that we have discussed with respect to the transcription and translation of the genetic code through mRNA and tRNA, and the therapeutic implications of SiRNA as well as the chromatin regulation of lncRNA.

We have also encountered the mitochondrion and the lysosome in the discussion of apoptosis and autophagy, maintaining the balance between cell regeneration and cell death.

I here list the organelles:

  1. Nucleus
  2. Centrosome
  3. Nuclear Membrane
  4. Ribososome
  5. Endoplasmic Reticulum
  6. Mitochondria
  7. Lysosome
  8. Cytoskeleton
  9. Golgi apparatus
  10. Cytoplasm
cell_organelle_quiz

cell_organelle_quiz

http://www.youtube.com/watch?feature=player_embedded&v=JufLDxmCwB0

http://www.youtube.com/watch?feature=player_embedded&v=FFrKN7hJm64

Golgi Apparatus

Found within the cytoplasm of both plant and animal cells, the Golgi is composed of stacks of membrane-bound structures known as cisternae (singular: cisterna). An individual stack is sometimes called a dictyosome (from Greek dictyon: net + soma: body), especially in plant cells. A mammalian cell typically contains 40 to 100 stacks. Between four and eight cisternae are usually present in a stack; however, in some protists as many as sixty have been observed. Each cisterna comprises a flat, membrane-enclosed disc that includes special Golgi enzymes which modify or help to modify cargo proteins that travel through it.

The cisternae stack has four functional regions: the cis-Golgi network, medial-Golgi, endo-Golgi, and trans-Golgi network. Vesicles from the endoplasmic reticulum (via the vesicular-tubular clusters) fuse with the network and subsequently progress through the stack to the trans-Golgi network, where they are packaged and sent to their destination.

The Golgi apparatus is integral in modifying, sorting, and packaging these macromolecules for cell secretion (exocytosis) or use within the cell. It primarily modifies proteins delivered from the rough endoplasmic reticulum, but is also involved in the transport of lipids around the cell, and the creation of lysosomes.  Enzymes within the cisternae are able to modify the proteins by addition of carbohydrates (glycosylation) and phosphates (phosphorylation). In order to do so, the Golgi imports substances such as nucleotide sugars from the cytosol. These modifications may also form a signal sequence which determines the final destination of the protein. For example, the Golgi apparatus adds a mannose-6-phosphate label to proteins destined for lysosomes.

The Golgi plays an important role in the synthesis of proteoglycans, which are molecules present in the extracellular matrix of animals. It is also a major site of carbohydrate synthesis. This includes the production of glycosaminoglycans (GAGs), long unbranched polysaccharides which the Golgi then attaches to a protein synthesised in the endoplasmic reticulum to form proteoglycans. Enzymes in the Golgi polymerize several of these GAGs via a xylose link onto the core protein. Another task of the Golgi involves the sulfation of certain molecules passing through its lumen via sulfotranferases that gain their sulfur molecule from a donor called PAPS. This process occurs on the GAGs of proteoglycans as well as on the core protein. Sulfation is generally performed in the trans-Golgi network. The level of sulfation is very important to the proteoglycans’ signalling abilities, as well as giving the proteoglycan its overall negative charge.

The phosphorylation of molecules requires that ATP is imported into the lumen of the Golgi and utilised by resident kinases such as casein kinase 1 and casein kinase 2. One molecule that is phosphorylated in the Golgi is apolipoprotein, which forms a molecule known as VLDL that is found in plasma. It is thought that the phosphorylation of these molecules labels them for secretion into the blood.

The Golgi has a putative role in apoptosis, with several Bcl-2 family members localised there, as well as to the mitochondria. A newly characterized protein, GAAP (Golgi anti-apoptotic protein), almost exclusively resides in the Golgi and protects cells from apoptosis by an as-yet undefined mechanism.

The vesicles that leave the rough endoplasmic reticulum are transported to the cis face of the Golgi apparatus, where they fuse with the Golgi membrane and empty their contents into the lumen. Once inside the lumen, the molecules are modified, then sorted for transport to their next destinations. The Golgi apparatus tends to be larger and more numerous in cells that synthesize and secrete large amounts of substances; for example, the plasma B cells and the antibody-secreting cells of the immune system have prominent Golgi complexes.

Those proteins destined for areas of the cell other than either the endoplasmic reticulum or Golgi apparatus are moved towards the trans face, to a complex network of membranes and associated vesicles known as the trans-Golgi network (TGN). This area of the Golgi is the point at which proteins are sorted and shipped to their intended destinations by their placement into one of at least three different types of vesicles, depending upon the molecular marker they carry.

Nucleus_ER_golgi

Nucleus_ER_golgi

Diagram of secretory process from endoplasmic reticulum (orange) to Golgi apparatus (pink). 1. Nuclear membrane; 2. Nuclear pore; 3. Rough endoplasmic reticulum (RER); 4. Smooth endoplasmic reticulum (SER); 5. Ribosome attached to RER; 6. Macromolecules; 7. Transport vesicles; 8. Golgi apparatus; 9. Cis face of Golgi apparatus; 10. Trans face of Golgi apparatus; 11. Cisternae of the Golgi Apparatus

Exocytotic vesicles

After packaging, the vesicles bud off and immediately move towards the plasma membrane, where they fuse and release the contents into the extracellular space in a process known as constitutive secretion. (Antibody release by activated plasma B cells)

Secretory vesicles

After packaging, the vesicles bud off and are stored in the cell until a signal is given for their release. When the appropriate signal is received they move towards the membrane and fuse to release their contents. This process is known as regulated secretion. (Neurotransmitter release from neurons)

Lysosomal vesicles

Vesicle contains proteins and ribosomes destined for the lysosome, an organelle of degradation containing many acid hydrolases, or to lysosome-like storage organelles. These proteins include both digestive enzymes and membrane proteins. The vesicle first fuses with the late endosome, and the contents are then transferred to the lysosome via unknown mechanisms.

http://en.wikipedia.org/wiki/Golgi_apparatus

Lysosome (derived from the Greek words lysis, meaning “to loosen”, and soma, “body”) is a membrane-bound cell organelle found in animal cells (they are absent in red blood cells). They are structurally and chemically spherical vesicles containing hydrolytic enzymes, which are capable of breaking down virtually all kinds of biomolecules, including proteins, nucleic acids, carbohydrates, lipids, and cellular debris.  Lysosomes are responsible for cellular homeostasis for their involvements in secretion, plasma membrane repair, cell signalling and energy metabolism, which are related to health and diseases. Depending on their functional activity their sizes can be very different, as the biggest ones can be more than 10 times bigger than the smallest ones. They were discovered and named by Belgian biologist Christian de Duve, who eventually received the Nobel Prize in Physiology or Medicine in 1974.

Enzymes of the lysosomes are synthesised in the rough endoplasmic reticulum. The enzymes are released from Golgi apparatus in small vesicles which ultimately fuse with acidic vesicles called endosomes, thus becoming full lysosomes. In the process the enzymes are specifically tagged with mannose 6-phosphate to differentiate them from other enzymes. Lysosomes are interlinked with three intracellular processes namely phagocytosis, endocytosis and autophagy. Extracellular materials such as microorganisms taken up by phagocytosis, macromolecules by endocytosis, and unwanted cell organelles are fused with lysosomes in which they are broken down to their basic molecules. Thus lysosomes are the recycling units of a cell.

http://en.wikipedia.org/wiki/Lysosome

The endoplasmic reticulum (ER) is a type of organelle in the cells of eukaryotic organisms that forms an interconnected network of flattened, membrane-enclosed sacs or tubes known as cisternae. The membranes of the ER are continuous with the outer membrane of the nuclear envelope. Endoplasmic reticulum occurs in most types of eukaryotic cells, including the most primitive Giardia, but is absent from red blood cells and spermatozoa. There are two types of endoplasmic reticulum, rough endoplasmic reticulum (RER) and smooth endoplasmic reticulum (SER). The outer (cytosolic) face of the rough endoplasmic reticulum is studded with ribosomes that are the sites of protein synthesis. The rough endoplasmic reticulum is especially prominent in cells such as hepatocytes where active smooth endoplasmic reticulum lacks ribosomes and functions in lipid metabolism, carbohydrate metabolism, and detoxification and is especially abundant in mammalian liver and gonad cells. The lacey membranes of the endoplasmic reticulum were first seen in 1945 by Keith R. Porter, Albert Claude, Brody Meskers and Ernest F. Fullam, using electron microscopy.

http://en.wikipedia.org/wiki/Endoplasmic_reticulum

endoplasmic_reticulum

endoplasmic_reticulum

https://2cslacardano.wikispaces.com/file/view/Cell7.png/338811858/408×313/Cell7.png

Cytoskeleton

The Effects of Actomyosin Tension on Nuclear Pore Transport
Rachel Sammons
Undergraduate Honors Thesis
Spring 2011

The cytoskeleton maintains cellular structure and tension through a force balance with the nucleus, where actomyosin is anchored to the nuclear envelope by nesprin integral proteins. It is hypothesized that the presence or absence of this tension alters the transport of molecules through the nuclear pore complex. We tested the effects of cytoskeletal tension on nuclear transport in human umbilical vein endothelial cells (HUVECs) by performing fluorescence recovery after photo-bleaching (FRAP) experiments on the nuclei to monitor the passive transport of the molecules through nuclear pores.

Using myosin inhibitors, as well as siRNA transfections to reduce the expression of nesprin-1, we altered the nucleo-cytoskeletal force balance and monitored the effect of each on the nuclear pore. FRAP data was fit to a diffusion model by assuming pseudo-steady state inside the nuclear pore, perfect mixing within both the cytoplasm and the nucleus, and no intracellular binding of the fluorescent probes. From these results and a model from the current literature relating diffusion rate constants to nuclear pore radii, we were able to determine that changing cytoskeletal tension alters nuclear pore size and passive transport.

nuclear pores in nuclear envelope

nuclear pores in nuclear envelope

image of nuclear pores on the external surface of the nuclear envelope

nuclear envelope and FG filaments

nuclear envelope and FG filaments

nuclear envelope and FG filaments

Figure 1: The structure and location of the nuclear pore, shown by (a) AFM image of nuclear pores on the external surface of the nuclear envelope[5] and (b) computer model cross-section. The nuclear envelope is shown in cyan, and FG filaments in blue can be seen throughout the channel. The nuclear basket extends into the nucleoplasm.

Fusion-pore expansion during syncytium formation is restricted by an actin network

A Chen, E Leikina, K Melikov, B Podbilewicz, MM. Kozlov and LV. Chernomordik,*
J Cell Sci 1 Nov 2008;121: 3619-3628. http://dx.doi.org:/10.1242/​jcs.032169

Effects of actin-modifying agents indicate that the actin cortex slows down pore expansion. We propose that the growth of the strongly bent fusion-pore rim is restricted by a dynamic resistance of the actin network and driven by membrane-bending proteins that are involved in the generation of highly curved intracellular membrane compartments.

Read Full Post »

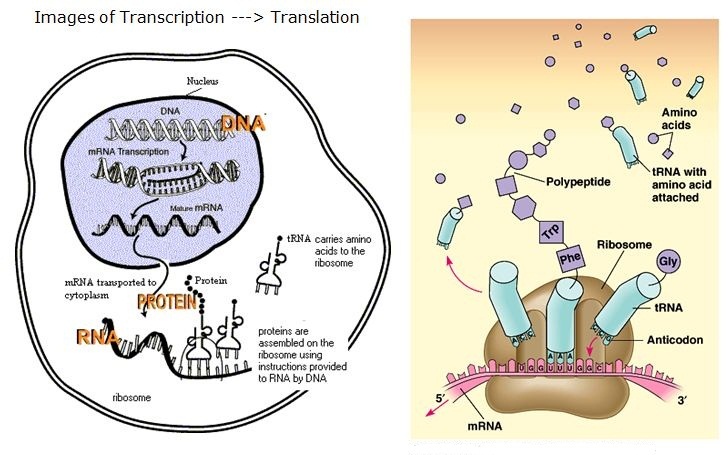
Transcription Modulation

Author and Curator: Larry H. Bernstein, MD, FCAP 


This portion of the transcription series deals with transcription factors and the effects of their binding on metabolism. This also has implications for pharmaceutical target identification.

The Functional Consequences of Variation in Transcription Factor Binding
DA. Cusanovich, B Pavlovic, JK. Pritchard*, Y Gilad*
1 Department of Human Genetics, 2 Howard Hughes Medical Institute, University of Chicago, Chicago, IL 3 Departments of Genetics and Biology and Howard Hughes Medical Institute, Stanford University, Stanford, CA.
PLoS Genet 2014;10(3):e1004226.  http://dx.doi.org:/10.1371/journal.pgen.1004226

One goal of human genetics is to understand how the information for precise and dynamic gene expression programs is encoded in the genome. The interactions of transcription factors (TFs) with DNA regulatory elements clearly

  • play an important role in determining gene expression outputs, yet
  • the regulatory logic underlying functional transcription factor binding is poorly understood.

An important question in genomics is to understand how a class of proteins called ‘‘transcription factors’’ controls the expression level of other genes in the genome in a cell type-specific manner – a process that is essential to human development. One major approach to this problem is to study where these transcription factors bind in the genome, but this does not tell us about the effect of that binding on gene expression levels and

  • it is generally accepted that much of the binding does not strongly influence gene expression.

To address this issue, we artificially reduced the concentration of 59 different transcription factors in the cell and then

  • examined which genes were impacted by the reduced transcription factor level.

Our results implicate some attributes

  • that might influence what binding is functional, but they also suggest that
  • a simple model of functional vs. non-functional binding may not suffice.

Many studies have focused on characterizing the genomic locations of TF binding, but

  • it is unclear whether TF binding at any specific locus has
  • functional consequences with respect to gene expression output.

We knocked down 59 TFs and chromatin modifiers in one HapMap lymphoblastoid cell line

  • to evaluate the context of functional TF binding.

We then identified genes whose expression was affected by the knockdowns

  • by intersecting the gene expression data with transcription factor binding data
    (based on ChIP-seq and DNase-seq)
  • within 10 kb of the transcription start sites of expressed genes.

This combination of data allowed us to infer functional TF binding.
Only a small subset of genes bound by a factor were

  • differentially expressed following the knockdown of that factor,
  • suggesting that most interactions between TF and chromatin
  • do not result in measurable changes in gene expression levels
  • of putative target genes.

We found that functional TF binding is enriched

  • in regulatory elements that harbor a large number of TF binding sites,
  • at sites with predicted higher binding affinity, and
  • at sites that are enriched in genomic regions annotated as ‘‘active enhancers.’’

We aim to be able to predict the expression pattern of a gene based on its regulatory
sequence alone. However, the regulatory code of the human genome is much more complicated than

  • the triplet code of protein coding sequences, and is highly context-specific,
  • depending on cell-type and other factors.

Moreover, regulatory regions are not necessarily organized into

  • discrete, easily identifiable regions of the genome and
  • may exert their influence on genes over large genomic distances

Genomic studies addressing questions of the regulatory logic of the human genome have largely taken one of two approaches.

  1. collecting transcription factor binding maps using techniques such as ChIPseq
    and DNase-seq
  2. mapping various quantitative trait loci (QTL), such as gene expression levels
    (eQTLs) [7], DNA methylation (meQTLs) [8] and chromatin accessibility (dsQTLs)

Cumulatively, binding map studies and QTL map studies have

  • led to many insights into the principles and mechanisms of gene regulation.

However, there are questions that neither mapping approach on its own is well equipped to address. One outstanding issue is

  • the fraction of factor binding in the genome that is ‘‘functional’’,
    which we define here to mean that
  • disturbing the protein-DNA interaction leads to a measurable
  • downstream effect on gene regulation.

Transcription factor knockdown could be used to address this problem, whereby

  • the RNA interference pathway is employed to greatly reduce
  • the expression level of a specific target gene by using small interfering RNAs (siRNAs).

The response to the knockdown can then be measured by collecting RNA after the knockdown and

  • measuring global changes in gene expression patterns
  • after specifically attenuating the expression level of a given factor.

Combining a TF knockdown approach with TF binding data can help us to

  • distinguish functional binding from non-functional binding

This approach has previously been applied to the study of human TFs, although for the most part studies have only focused on

  • the regulatory relationship of a single factor with its downstream targets.

The FANTOM consortium knocked down 52 different transcription factors in

  • the THP-1 cell line, an acute monocytic leukemia-derived cell line, and
  • used a subset of these to validate certain regulatory predictions based on binding motif enrichments.

We and others previously studied the regulatory architecture of gene expression in

  • the model system of HapMap lymphoblastoid cell lines (LCLs) using both
  • binding map strategies and QTL mapping strategies.

We now sought to use knockdown experiments targeting transcription factors in a HapMap LCL

  • to refine our understanding of the gene regulatory circuitry of the human genome.

Therefore, We integrated the results of the knockdown experiments with previous data on TF binding to

  • better characterize the regulatory targets of 59 different factors and
  • to learn when a disruption in transcription factor binding
  • is most likely to be associated with variation in the expression level of a nearby gene.

Gene expression levels following the knockdown were compared to

  • expression data collected from six samples that were transfected with negative control siRNA.

The expression data from all samples were normalized together using

  • quantile  normalization followed by batch correction using the RUV-2 method.

We then performed several quality control analyses to confirm

  1. that the quality of the data was high,
  2. that there were no outlier samples, and
  3. that the normalization methods reduced the influence of confounders

In order to identify genes that were expressed at a significantly different level

  • in the knockdown samples compared to the negative controls,
  • we used likelihood-ratio tests within the framework of a fixed effect linear model.

Following normalization and quality control of the arrays,

  • we identified genes that were differentially expressed between
  • the three knockdown replicates of each factor and the six controls.

Depending on the factor targeted, the knockdowns resulted in

  • between 39 and 3,892 differentially expressed genes at an FDR of 5%
    (Figure 1B; see Table S3 for a summary of the results).

The knockdown efficiency for the 59 factors ranged

  • from 50% to 90% (based on qPCR; Table S1).

The qPCR measurements of the knockdown level were significantly

  • correlated with estimates of the TF expression levels
  • based on the microarray data (P =0.001; Figure 1C).

Reassuringly, we did not observe a significant correlation between

  • the knockdown efficiency of a given factor and
  • the number of genes classified as differentially expressed foci.

Because we knocked down 59 different factors in this experiment

  • we were able to assess general patterns associated with the perturbation of transcription factors
  • beyond merely the number of affected target genes.

Globally, despite the range in the number of genes we identified as

  • differentially expressed in each knockdown,
  • the effect sizes of the differences in expression were relatively modest and
  • consistent in magnitude across all knockdowns.

The median effect size following the knockdown experiment for genes classified as

  • differentially expressed at an FDR of 5% in any knockdown was
  • a 9.2% difference in expression level between the controls and the knockdown (Figure 2),
  • while the median effect size for any individual knockdown experiment ranged between 8.1% and 11.0%.
    (this was true whether we estimated the knockdown effect based on qPCR (P = 0.10; Figure 1D) or microarray (P = 0.99; not shown) data.

Nor did we observe a correlation between

  • variance in qPCR-estimated knockdown efficiency (between replicates) and
  • the number of genes differentially expressed (P = 0.94; Figure 1E).

We noticed that the large variation in the number of differentially expressed genes

  • extended even to knockdowns of factors from the same gene family.

Figure 1. Differential expression analysis.
(a) Examples of differential expression analysis results for the genes HCST and IRF4. The top two panels are ‘MA plots’ of the mean Log2(expression level) between the knockdown arrays and the controls for each gene (x-axis) to the Log2(Fold-Change) between the knockdowns and controls (y-axis). Differentially expressed genes at an FDR of 5% are plotted in yellow (points 50% larger). The gene targeted by the siRNA is highlighted in red. The bottom two panels are ‘volcano plots’ of the Log2(Fold-Change) between the knockdowns and controls (x-axis) to the P-value for differential expression (y-axis). The dashed line marks the 5% FDR threshold. Differentially expressed genes at an FDR of 5% are plotted in yellow (points 50% larger). The red dot marks the gene targeted by the siRNA.
(b) Barplot of number of differentially expressed genes in each knockdown experiment.
(c) Comparison of the knockdown level measured by qPCR (RNA sample collected 48 hours posttransfection) and the knockdown level measured by microarray.
(d) Comparison of the level of knockdown of the transcription factor at 48 hrs (evaluated by qPCR; x-axis) and the number of genes differentially expressed in the knockdown experiment (y-axis).
(e) Comparison of the variance in knockdown efficiency between replicates for each transcription factor (evaluated by qPCR; x-axis) and the number of differentially expressed genes in the knockdown experiment (y-axis).

Differential expression analysis

Differential expression analysis

http://dx.doi.org:/10.1371/journal.pgen.1004226.g001

Figure 2. Effect sizes for differentially expressed genes.
Boxplots of absolute Log2(fold-change) between knockdown arrays and control arrays for all genes identified as differentially expressed in each experiment. Outliers are not plotted. The gray bar indicates the interquartile range across all genes differentially expressed in all knockdowns. Boxplots are ordered by the number of genes differentially expressed in each experiment. Outliers were not plotted.

Effect sizes for differentially expressed genes

Effect sizes for differentially expressed genes

http://dx.doi.org:/10.1371/journal.pgen.1004226.g002

Knocking down SREBF2 (1,286 genes differentially expressed), a key regulator of cholesterol homeostasis,

  • results in changes in the expression of genes that are
  • significantly enriched for cholesterol and sterol biosynthesis annotations.

While not all factors exhibited striking enrichments for relevant functional categories and pathways,

  • the overall picture is that perturbations of many of the factors
  • primarily affected pathways consistent with their known biology.

In order to assess functional TF binding, we next incorporated

  • binding maps together with the knockdown expression data.

We combined binding data based on DNase-seq footprints in 70 HapMap LCLs, reported by Degner et al. (Table S5)

  • and from ChIP-seq experiments in LCL GM12878, published by ENCODE.

We were thus able to obtain genome wide binding maps for a total of 131 factors that were either

  • directly targeted by an siRNA in our experiment (29 factors) or were
  • differentially expressed in one of the knockdown experiments.

We classified a gene as a bound target of a particular factor when

  • binding of that factor was inferred within 10kb of the transcription start site (TSS) of the target gene.

Using this approach, we found that the 131 TFs were bound

  • in proximity to a median of 1,922 genes per factor (range 11 to 7,053 target genes).

We considered binding of a factor to be functional if the target gene

  • was differentially expressed after perturbing the expression level the bound transcription factor.

We then asked about the concordance between

  • the transcription factor binding data and the knockdown expression data.
  •  the extent to which differences in gene expression levels following the knockdowns
  • might be predicted by binding of the transcription factors
  • within the putative regulatory regions of the responsive genes. and also
  • what proportion of putative target (bound) genes of a given TF were
  • differentially expressed following the knockdown of the factor.

Focusing only on the binding sites classified using the DNase-seq data
(which were assigned to a specific instance of the binding motif, unlike the ChIP data),

  • we examined sequence features that might distinguish functional binding.

In particular, whether binding at conserved sites was more likely to be functional  and

  • whether binding sites that better matched the known PWM for the factor were more likely to be functional.

We did not observe a significant shift in the conservation of functional binding sites (Wilcoxon rank sum P = 0.34),

  • but we did observe that binding around differentially expressed genes occurred at sites
  • that were significantly better matches to the canonical binding motif.

Figure 3. Intersecting binding data and expression data for each knockdown.
(a) Example Venn diagrams showing the overlap of binding and differential expression for the knockdowns of HCST and IRF4 (the same genes as in Figure 1).
(b) Boxplot summarizing the distribution of the fraction of all expressed genes that are bound by the targeted gene or downstream factors.
(c) Boxplot summarizing the distribution of the fraction of bound genes that are classified as differentially expressed, using an FDR of either 5% or 20%.

Intersecting binding data and expression data for each knockdown

Intersecting binding data and expression data for each knockdown

http://dx.doi.org:/10.1371/journal.pgen.1004226.g003

Considering bound targets determined from either the ChIP-seq or DNase-seq data, we observed that

  • differentially expressed genes were associated with both
  • a higher number of binding events for the relevant factors within 10 kb of the TSS (P,10216; Figure 4A)
  • as well as with a larger number of different binding factors
    (considering the siRNA-targeted factor and any TFs that were DE in the knockdown; P,10216; Figure 4B).

Figure 4. Degree of binding correlated with function. Boxplots comparing
(a) the number of sites bound, and
(b) the number of differentially expressed transcription factors binding events near functionally or non-functionally bound genes. We considered binding for siRNA-targeted factor and any factor differentially expressed in the knockdown.
(c) Focusing only on genes differentially expressed in common between each pairwise set of knockdowns we tested for enrichments of functional binding (y-axis). Pairwise comparisons between knockdown experiments were binned by the fraction of differentially expressed transcription factors in common between the two experiments. For these boxplots, outliers were not plotted.

Degree of binding correlated with function

Degree of binding correlated with function

http://dx.doi.org:/10.1371/journal.pgen.1004226.g004

We examined the distribution of binding about the TSS. Most factor binding was concentrated

  • near the TSS whether or not the genes were classified as differentially expressed (Figure 5A).
  • the distance from the TSS to the binding sites was significantly longer for differentially expressed genes (P,10216; Fig. 5B).

Figure 5. Distribution of functional binding about the TSS.
(a) A density plot of the distribution of bound sites within 10 kb of the TSS for both functional and non-functional genes. Inset is a zoom-in of the region +/21 kb from the TSS (b) Boxplots comparing the distances from the TSS to the binding sites for functionally bound genes and non-functionally bound genes. For the boxplots, 0.001 was added before log10 transforming the distances and outliers were not plotted.

Distribution of functional binding about the TSS

Distribution of functional binding about the TSS

http://dx.doi.doi:/10.1371/journal.pgen.1004226.g005

We investigated the distribution of factor binding across various chromatin states, as defined by Ernst et al. This dataset lists

  • regions of the genome that have been assigned to different activity states
  • based on ChIP-seq data for various histone modifications and CTCF binding.

For each knockdown, we separated binding events

  • by the genomic state in which they occurred and then
  • tested whether binding in that state was enriched around differentially expressed genes.

After correcting for multiple testing of genes that were differentially expressed.

  • 19 knockdowns showed significant enrichment for binding in ‘‘strong enhancers’’
  • four knockdowns had significant enrichments for ‘‘weak enhancers’’,
  • eight knockdowns showed significant depletion of binding in ‘‘active promoters’’ ,
  • six knockdowns had significant depletions for ‘‘transcription elongation’’,

Did the factors tended to have a consistent effect (either up- or down-regulation)

  • on the expression levels of genes they purportedly regulated?

All factors we tested are associated with both up- and down-regulation of downstream targets (Figure 6).

A slight majority of downstream target genes were expressed at higher levels

  • following the knockdown for 15 of the 29 factors for which we had binding information (Figure 6B).

The factor that is associated with the largest fraction (68.8%) of up-regulated target genes following the knockdown is EZH2,

  • the enzymatic component of the Polycomb group complex.

On the other end of the spectrum was JUND, a member of the AP-1 complex, for which

  • 66.7% of differentially expressed targets were down-regulated following the knockdown.

Figure 6. Magnitude and direction of differential expression after knockdown.
(a) Density plot of all Log2(fold-changes) between the knockdown arrays and controls for genes that are differentially expressed at 5% FDR in one of the knockdown experiments as well as bound by the targeted transcription factor.
(b) Plot of the fraction of differentially expressed putative direct targets that were up-regulated in each of the knockdown experiments.

Magnitude and direction of differential expression after knockdown

Magnitude and direction of differential expression after knockdown

http://dx.doi.org:/10.1371/journal.pgen.1004226.g006

We found no correlation between the number of paralogs and the fraction of bound targets that were differentially expressed. We also did not observe a significant correlation when we considered whether

  • the percent identity of the closest paralog might be predicative of
  • the fraction of bound genes that were differentially expressed following the knockdown (Figure S8).

While there is compelling evidence for our inferences, the current chromatin functional annotations

  • do not fully explain the regulatory effects of the knockdown experiments.

For example, the enrichments for binding in ‘‘strong enhancer’’ regions of the genome range from 7.2% to 50.1% (median = 19.2%),

  • much beyond what is expected by chance alone, but far from accounting for all functional binding.

In addition to considering

  • the distinguishing characteristics of functional binding, we also examined
  • the direction of effect that perturbing a transcription factor had on the expression level of its direct targets.

We specifically addressed whether

  • knocking down a particular factor tended to drive expression of its putatively direct (namely, bound) targets up or down,
  • which can be used to infer that the factor represses or activates the target, respectively.

Transcription factors have traditionally been thought of primarily as activators, and previous work from our group is consistent with that notion. Surprisingly, the most straightforward inference from the present study is that

  • many of the factors function as repressors at least as often as they function as activators.
  1. EZH2 had a negative regulatory relationship with the largest fraction of direct targets (68.8%),
    consistent with – the known role of EZH2 as the active member of the Polycomb group complex PC2
  2. while JUND seemed to have a positive regulatory relationship with the largest fraction of direct targets (66.7%),
    and with – the biochemical characterization of the AP-1 complex (of which JUND is a component) as a transactivator.

More generally, however, our results, combined with the previous work from our group and others make for a complicated view

  • of the role of transcription factors in gene regulation as
  • it seems difficult to reconcile the inference from previous work that
  • many transcription factors should primarily act as activators with the results presented here.

One somewhat complicated hypothesis, which nevertheless can resolve the apparent discrepancy, is that

  • the ‘‘repressive’’ effects we observe for known activators may be
  • at sites in which the activator is acting as a weak enhancer of transcription and
  • that reducing the cellular concentration of the factor
  • releases the regulatory region to binding by an alternative, stronger activator.

To more explicitly address the effect that our proximity-based definition of target genes might have on our analyses, we reanalyzed

  • the overlap between factor binding and differential expression following the knockdowns
  • using an independent, empirically determined set of target genes.

Thurman et al. used correlations in DNase hypersensitivity between

  • intergenic hypersensitive sites and promoter hypersensitive sites across diverse tissues
  • to assign intergenic regulatory regions to specific genes,
  • independently of proximity to a particular promoter.

We performed this alternative analysis in which we

  • assigned binding events to genes based on the classification of Thurman et al.

We then considered the overlap between binding and differential expression in this new data set. The results were largely

  • consistent with our proximity-based observations.

A median of 9.5% of genes that were bound by a factor were

  • also differentially expressed following the knockdown of that factor
    (compared to 11.1% when the assignment of binding sites to genes is based on proximity).

From the opposite perspective, a median of 28.0% of differentially expressed genes were bound by that factor
(compared to 32.3% for the proximity based definition). The results of this analysis are summarized in Table S7.

Our results should not be considered a comprehensive census of regulatory events in the human genome. Instead, we adopted a gene-centric approach,

  • focusing only on binding events near the genes for which we could measure expression
  • to learn some of the principles of functional transcription factor binding.

In light of our observations a reassessment of our estimates of binding may be warranted. In particular, because functional binding is skewed away from promoters (our system is apparently not well-suited to observe functional promoter binding, perhaps because of protection by large protein complexes),

  • a more conservative estimate of the fraction of binding that is indeed functional would not consider data within the promoter.

Importantly, excluding the putative promoter region from our analysis (i.e. only considering a window .1 kb from the TSS and ,10 kb from the TSS)

  • does not change our conclusions.

Considering this smaller window,

  • a median of 67.0% of expressed genes are still classified as bound by
  1. either the knocked down transcription factor or
  2. a downstream factors that is differentially expressed in each experiment,

yet a median of only 8.1% of the bound genes are

  • also differentially expressed after the knockdowns.

Much of what distinguishes functional binding (as we define it) has yet to be explained. We are unable to explain much of the differential expression observed in our experiments by the presence of least one relevant binding event. This may not be altogether surprising, as

  • we are only considering binding in a limited window around the transcription start site.

To address these issues, more factors should be perturbed to further evaluate the robustness of our results and to add insight. Together, such studies will help us develop a more sophisticated understanding of functional transcription factor binding in particular, the gene regulatory logic more generally.

Assessing quality and completeness of human transcriptional regulatory pathways on a genome-wide scale

E Shmelkov, Z Tang, I Aifantis, A Statnikov*
Biology Direct 2011; 6(15).  http://www.biology-direct.com/content/6/1/15

Recently the biological pathways have become a common and probably the most popular form of representing biochemical information for hypothesis generation and validation. These maps store wide knowledge of complex molecular interactions and regulations occurring in the living organism in a simple and obvious way, often using intuitive graphical notation. Two major types of biological pathways could be distinguished.

  1. Metabolic pathways incorporate complex networks of protein-based interactions and modifications, while
  2. signal transduction and transcriptional regulatory pathways are usually considered to provide information on mechanisms of transcription

While there are a lot of data collected on human metabolic processes,

  • the content of signal transduction and transcriptional regulatory pathways varies greatly in quality and completeness.

An indicative comparison of MYC transcriptional targets reported in ten different pathway databases reveals that these databases differ greatly from each other (Figure 1). Given that MYC is involved

  • in the transcriptional regulation of approximately 15% of all genes,

one cannot argue that the majority of pathway databases that contain

  • less than thirty putative transcriptional targets of MYC are even close to complete.

More importantly, to date there have been no prior genome-wide evaluation studies (that are based on genome-wide binding and gene expression assays) assessing pathway databases

Background: While pathway databases are becoming increasingly important in most types of biological and translational research, little is known about the quality and completeness of pathways stored in these databases. The present study conducts a comprehensive assessment of transcriptional regulatory pathways in humans for seven well-studied transcription factors:

  1. MYC,
  2. NOTCH1,
  3. BCL6,
  4. TP53,
  5. AR,
  6. STAT1,
  7. RELA.

The employed benchmarking methodology first involves integrating

  • genome-wide binding with functional gene expression data
  • to derive direct targets of transcription factors.

Then the lists of experimentally obtained direct targets

  • are compared with relevant lists of transcriptional targets from 10 commonly used pathway databases.

Results: The results of this study show that for the majority of pathway databases,

  • the overlap between experimentally obtained target genes and
  • targets reported in transcriptional regulatory pathway databases is
  • surprisingly small and often is not statistically significant.

The only exception is MetaCore pathway database which

  • yields statistically significant intersection with experimental results in 84% cases.

The lists of experimentally derived direct targets obtained in this study can be used

  • to reveal new biological insight in transcriptional regulation,  and we
  • suggest novel putative therapeutic targets in cancer.

Conclusions: Our study opens a debate on validity of using many popular pathway databases to obtain transcriptional regulatory targets. We conclude that the choice of pathway databases should be informed by

  • solid scientific evidence and rigorous empirical evaluation.

In the current study we perform

(1) an evaluation of ten commonly used pathway databases,

  • assessing the transcriptional regulatory pathways, considered in the current study as
  • the interactions of the type ‘transcription factor-transcriptional targets’.

This involves integration of human genome wide functional microarray or RNA-seq gene expression data with

  • protein-DNA binding data from ChIP-chip, ChIP-seq, or ChIP-PET platforms
  • to find direct transcriptional targets of the seven well known transcription factors:
  • MYC, NOTCH1, BCL6, TP53, AR, STAT1, and RELA.

The choice of transcription factors is based on their important role in oncogenesis and availability of binding and expression data in the public domain.

(2) the lists of experimentally derived direct targets are used to assess the quality and completeness of 84 transcriptional regulatory pathways from four publicly available (BioCarta, KEGG, WikiPathways and Cell Signaling Technology) and six commercial (MetaCore, Ingenuity Pathway Analysis, BKL TRANSPATH, BKL TRANSFAC, Pathway Studio and GeneSpring Pathways) pathway databases.

(3) We measure the overlap between pathways and experimentally obtained target genes and assess statistical significance of this overlap, and we demonstrate that experimentally derived lists of direct transcriptional targets

  • can be used to reveal new biological insight on transcriptional regulation.

We show this by analyzing common direct transcriptional targets of

  • MYC, NOTCH1 and RELA
  • that act in interconnected molecular pathways.

Detection of such genes is important as it could reveal novel targets of cancer therapy.

Figure 1 Number of genes in common between MYC transcriptional targets derived from ten different pathway databases. Cells are colored according to their values from white (low values) to red (high values). (not shown)

statistical methodology for comparison

statistical methodology for comparison

Figure 2 Illustration of statistical methodology for comparison between a gold-standard and a pathway database

Since we are seeking to compare gene sets from different studies/databases, it is essential to transform genes to standard identifiers. That is why we transformed all
gene sets to the HUGO Gene Nomenclature Committee approved gene symbols and names. In order to assess statistical significance of the overlap between the resulting gene sets, we used the hypergeometric test at 5% a-level with false discovery rate correction for multiple comparisons by the method of Benjamini and Yekutieli. The alternative hypothesis of this test is that two sets of genes (set A from pathway
database and set B from experiments) have greater number of genes in common than two randomly selected gene sets with the same number of genes as in sets A and B. For example, consider that for some transcription factor there are 300 direct targets in the pathway database #1 and 700 in the experimentally derived list (gold-standard), and their intersection is 16 genes (Figure 2a). If we select on random from a total of
20,000 genes two sets with 300 and 700 genes each, their overlap would be greater or equal to 16 genes in 6.34% times. Thus, this overlap will not be statistically significant at 5% a-level (p = 0.0634). On the other hand, consider that for the pathway database #2, there are 30 direct targets of that transcription factor, and their intersection with the 700-gene gold-standard is only 6 genes. Even though the size of this intersection is rather small, it is unlikely to randomly select 30 genes (out of 20,000) with an overlap greater or equal to 6 genes with a 700-gene gold-standard (p = 0.0005, see Figure 2a). This overlap is statistically significant at 5% a-level.

We also calculate an enrichment fold change ratio (EFC) for every intersection between a gold-standard and a pathway database. For a given pair of a gold-standard and a pathway database, EFC is equal to the observed number of genes in their intersection, divided by the expected size of intersection under the null hypothesis (plus machine epsilon, to avoid division by zero). Notice however that larger values of EFC may correspond to databases that are highly incomplete and contain only a few relations. For example, consider that for some transcription factor there are 300 direct targets in the pathway database #1 and 50 in the experimentally derived list (gold-standard), and their intersection is 30 genes (Figure 2b). If we select on random from a total of 20,000 genes two sets with 300 and 50 genes each, their expected overlap under the null hypothesis will be equal to 0.75. Thus, the EFC ratio will be equal to 40 (= 30/0.75). On the other hand, consider that for the pathway database #2, there are 2 direct
targets of that transcription factor, and their intersection with the 50-gene gold-standard is only 1 gene. Even though the expected overlap under the null hypothesis will be equal to 0.005 and EFC equal to 200 (5 times bigger than for the database #1), the size of this intersection with the gold-standard is 30 times less than for database #1 (Figure 2b).

Figure 3 Comparison between different pathway databases and experimentally derived gold-standards for all considered transcription factors. Value in a given cell is a number of overlapping genes between a gold-standard and a pathway-derived gene set. Cells
are colored according to their values from white (low values) to red (high values). Underlined values in red represent statistically significant intersections. (not shown)

Figure 4 Summary of the pathway databases assessment. Green cells represent statistically significant intersections between experimentally derived gold-standards and transcriptional regulatory pathways. White cells denote results that are not statistically significant. Numbers are the enrichment fold change ratios (EFC) calculated for each intersection. (not shown)

At the core of this study was creation of gold-standards of transcriptional regulation in humans that can be compared with target genes reported in transcriptional regulatory pathways. We focused on seven well known transcription factors and obtained gold-standards

  • by integrating genome-wide transcription factor-DNA binding data (from ChIP-chip, ChIP-seq, or ChIP-PET platforms)
  • with functional gene expression microarray and RNA-seq data.

The latter data allows to survey changes in the transcriptomes on a genome-wide scale

  • after the inhibition or over-expression of the transcription factor in question.

However, change in the expression of a particular gene could be caused either by the direct effect of the removal or introduction of a given transcription factor, as well as by an indirect effect, through the change in expression level of some other gene(s). It is essential

  • to integrate data from these two sources to
  • obtain an accurate list of gene targets that are directly regulated by a transcription factor.

It is worth noting that tested pathway databases typically do not give distinction between cell-lines, experimental conditions, and other details relevant to experimental systems in which data were obtained. These databases in a sense propose a ‘universal’ list of transcriptional targets. However, it is known that

  • transcriptional regulation in a cell is dynamic and works differently for different systems and stimuli.

This accentuates the major limitation of pathway databases and emphasizes

  • importance of deriving a specific list of transcriptional targets for the current experimental system.

In this study we followed the latter approach by developing gold-standards for specific cell characterized biological systems and experimental conditions.

The approach used here  for building gold-standards of direct mechanistic knowledge has several limitations. (see article).  Nevertheless, our results suggest that multiple transcription factors can co-operate and control both physiological differentiation and malignant transformation, as demonstrated utilizing combinatorial gene-profiling for

  • NOTCH1, MYC and RELA targets.

These studies might lead us to multi-pathway gene expression “signatures”

  • essential for the prediction of genes that could be targeted in cancer treatments.

In agreement with this hypothesis, several of the genes identified in our analysis have been suggested to be putative therapeutic targets in leukemia, with either preclinical or clinical trials underway (CDK4, CDK6, GSK3b, MYC, LCK, NFkB2, BCL2L1, NOTCH1).

Single-molecule tracking in live cells reveals distinct target-search strategies of transcription factors in the nucleus

I Izeddin†, V Récamier†‡, L Bosanac, II Cissé, L Boudarene, et al.
1Functional Imaging of Transcription, Institut de Biologie de l’Ecole Normale Supérieure (IBENS), Inserm, and CNRS UMR; 2Laboratoire Kastler Brossel, CNRS UMR, Departement de Physique et Institut de Biologie
de l’Ecole Normale Supérieure (IBENS), Paris, Fr; 3Transcription Imaging Consortium, Janelia Farm Research Campus, Howard Hughes Medical Institute, Ashburn, US; + more.
Biophysics and structural biology | Cell biology eLife 2014;3:e02230. http://dx.doi.org:/10.7554/eLife.02230

Transcription factors are

  • proteins that control the expression of genes in the nucleus, and
  • they do this by binding to other proteins or DNA.

First, however, these regulatory proteins need to overcome the challenge of

  • finding their targets in the nucleus, which is crowded with other proteins and DNA.

Much research to date has focused on measuring how fast proteins can diffuse and spread out throughout the nucleus. However these measurements only make sense if these proteins have access to the same space within the nucleus.

Now, Izeddin, Récamier et al. have developed a new technique to track

  • single protein molecules in the nucleus of mammalian cells.

A transcription factor called c-Myc and another protein called P-TEFb

  • were tracked and while they diffused at similar rates,
  • they ‘explored’ the space inside the nucleus in very different ways.

Izeddin, Récamier et al. found that c-Myc explores the nucleus in a so-called ‘non-compact’ manner: this means that it

  • can move almost everywhere inside the nucleus, and has an equal chance
  • of reaching any target regardless of its position in this space.

P-TEFb, on the other hand, searches

  • the nucleus in a ‘compact’ way.

This means that it is constrained to follow a specific path

  • through the nucleus and is therefore guided to its potential targets.

Izeddin, Récamier et al. explain that

  • the different ‘search strategies’ used by these two proteins
  • influence how long it takes them to find their targets and
  • how far they can travel in a given time.

These findings, together with information about

  • where and when different proteins interact in the nucleus,

will be essential to understand how the organization of the genome within the nucleus

  • can control the expression of genes.

The next challenge will now be to

  • uncover what determines a
  • protein’s search strategy in the nucleus, as well as
  • the potential ways that this strategy might be regulated.

Mueller et al., 2010; Normanno et al., 2012). These transient interactions are essential to ensure a fine regulation of binding site occupancy—by competition or by altering the TF concentration—but must also be persistent enough to enable the assembly of multicomponent complexes (Dundr, 2002; Darzacq and Singer, 2008; Gorski et al., 2008; Cisse et al., 2013).
In parallel to the experimental evidence of the fast diffusive motion of nuclear factors, our understanding of the intranuclear space has evolved from a homogeneous environment to an organelle where spatial arrangement among genes and regulatory sequences play an important role in transcriptional control (Heard and Bickmore, 2007). The nucleus of eukaryotes displays a hierarchy of organized structures (Gibcus and Dekker, 2013) and is often referred to as a
crowded environment.
How crowding influences transport properties of macromolecules and organelles in the cell is a fundamental question in quantitative molecular biology. While a restriction of the available space for diffusion can slow down transport processes, it can also channel molecules towards their targets increasing their chance to meet interacting partners. A widespread observation in quantitative cell biology is that the diffusion of molecules is anomalous, often attributed to crowding in the nucleoplasm, cytoplasm, or in the membranes of the cell (Höfling and Franosch, 2013). An open debate remains on how to determine whether diffusion is anomalous or normal (Malchus and Weiss, 2009; Saxton, 2012), and the mechanisms behind anomalous diffusion (Saxton, 2007). The answer to these questions bears important consequences for the understanding of the biochemical reactions of the cell.
The problem of diffusing molecules in non-homogenous media has been investigated in different fields. Following the seminal work of de Gennes (1982a), (1982b) in polymer physics, the study of diffusivity of particles and their reactivity has been generalized to random or disordered media (Kopelman, 1986; Lindenberg et al., 1991). These works have set a framework to interpret the mobility of macromolecular complexes in the cell, and recently in terms of kinetics of biochemical reactions (Condamin et al., 2007). Experimental evidence has also been found, showing the influence
of the glass-like properties of the bacterial cytoplasm in the molecular dynamics of intracellular processes (Parry et al., 2014). These studies demonstrate that the geometry of the medium in which diffusion takes place has important repercussions for the search kinetics of molecules. The notion of compact and non-compact exploration was introduced by de Gennes (1982a) in the context of dense polymers and describes two fundamental types of diffusive behavior. While a non-compact explorer leaves a significant number of available sites unvisited, a compact explorer performs a redundant
exploration of the space. In chemistry, the influence of compactness is well established to describe dimensional effects on reaction rates (Kopelman, 1986).
In this study, we aim to elucidate the existence of different types of mobility of TFs in the eukaryotic nucleus, as well as the principles governing nuclear exploration of factors relevant to transcriptional control. To this end, we used single-molecule (SM) imaging to address the relationship between the nuclear geometry and the search dynamics of two nuclear factors having distinct functional roles: the proto-oncogene c-Myc and the positive transcription elongation factor (P-TEFb). c-Myc is a basic helix-loop-helix DNA-binding transcription factor that binds to E-Boxes; 18,000 E-boxes are found in the genome, and c-Myc affects the transcription of numerous genes (Gallant and Steiger, 2009).
Recently, c-Myc has been demonstrated to be a general transcriptional activator upregulating transcription of nearly all genes (Lin et al., 2012; Nie et al., 2012). P-TEFb is an essential actor in the transcription regulation driven by RNA Polymerase II. P-TEFb is a cyclin-dependent kinase, comprising a CDK9 and a Cyclin T subunit. It phosphorylates the elongation control factors SPT5 and NELF to allow productive elongation of class II gene transcription (Wada et al., 1998). The carboxy-terminal domain (CTD) of the catalytic subunit RPB1 of polymerase II is also a major target of P-TEFb (Zhou et al., 2012). c-Myc and P-TEFb are therefore two good examples of transcriptional regulators binding to numerous sites in the nucleus; the latter binds to the transcription machinery itself and the former directly to DNA.

Single particle tracking (SPT) constitutes a powerful method to probe the mobility of molecules in living cells (Lord et al., 2010). In the nucleus, SPT has been first employed to investigate the dynamics of mRNAs (Fusco et al., 2003; Shav-Tal et al., 2004) or for rheological measurements of the nucleoplasm using inert probes (Bancaud et al., 2009). Recently, the tracking of single nuclear factors has been facilitated by the advent of efficient in situ tagging methods such as Halo
tags (Mazza et al., 2012). An alternative approach takes advantage of photoconvertible tags (Lippincott-Schwartz and Patterson, 2009) and photoactivated localization microscopy (PALM) (Betzig et al., 2006; Hess et al., 2006). Single particle tracking PALM (sptPALM) was first used to achieve high-density diffusion maps of membrane proteins (Manley et al., 2008). However, spt-PALM experiments have typically been limited to proteins with slow mobility (Manley et al., 2008) or those that undergo restricted motions (Frost et al., 2010; English et al., 2011).

Recently, by inclusion of light-sheet illumination, it has been used to determine the binding characteristics of TFs to DNA (Gebhardt et al., 2013). In this study, we developed a new sptPALM procedure adapted for the recording of individual proteins rapidly diffusing in the nucleus of mammalian cells. We used the photoconvertible fluorophore Dendra2 (Gurskaya et al., 2006) and took advantage of tilted illumination (Tokunaga et al., 2008). A careful control of the photoconversion rate minimized the background signal due to out-of-focus activated molecules, and we could thus follow the motion of individual proteins freely diffusing within the nuclear volume. With this sptPALM technique, we recorded large data sets (on the order of 104 single translocations in a single imaging session), which were essential for a proper statistical analysis of the search dynamics.
We applied our technique to several nuclear proteins and found that diffusing factors do not sense a unique nucleoplasmic architecture: c-Myc and P-TEFb adopt different nuclear space-exploration strategies, which drastically change the way they reach their specific targets. The differences observed between the two factors were not due to their diffusive kinetic parameters but to the geometry of their exploration path. c-Myc and our control protein, ‘free’ Dendra2, showed free diffusion in a three-dimensional nuclear space. In contrast, P-TEFb explored the nuclear volume by sampling a space of reduced dimensionality, displaying characteristics of exploration constrained in fractal structures.
The role of the space-sampling mode in the search strategy has long been discussed from a theoretical point of view (de Gennes, 1982a; Kopelman, 1986; Lindenberg et al., 1991). Our experimental results support the notion that it could indeed be a key parameter for diffusion-limited chemical reactions in the closed environment of the nucleus (Bénichou et al., 2010). We discuss the implications of our observations in terms of gene expression control, and its relation to the spatial organization of genes within the nucleus.

Read Full Post »

Introduction to Protein Synthesis and Degradation

Curator: Larry H. Bernstein, MD, FCAP

Updated 8/31/2019


Introduction to Protein Synthesis and Degradation

This chapter I made to follow signaling, rather than to precede it. I had already written much of the content before reorganizing the contents. The previous chapters on carbohydrate and on lipid metabolism have already provided much material on proteins and protein function, which was persuasive of the need to introduce signaling, which entails a substantial introduction to conformational changes in proteins that direct the trafficking of metabolic pathways, but more subtly uncovers an important role for microRNAs, not divorced from transcription, but involved in a non-transcriptional role.  This is where the classic model of molecular biology lacked any integration with emerging metabolic concepts concerning regulation. Consequently, the science was bereft of understanding the ties between the multiple convergence of transcripts, the selective inhibition of transcriptions, and the relative balance of aerobic and anaerobic metabolism, the weight of the pentose phosphate shunt, and the utilization of available energy source for synthetic and catabolic adaptive responses.

The first subchapter serves to introduce the importance of transcription in translational science.  The several subtitles that follow are intended to lay out the scope of the transcriptional activity, and also to direct attention toward the huge role of proteomics in the cell construct.  As we have already seen, proteins engage with carbohydrates and with lipids in important structural and signaling processes.  They are integrasl to the composition of the cytoskeleton, and also to the extracellular matrix.  Many proteins are actually enzymes, carrying out the transformation of some substrate, a derivative of the food we ingest.  They have a catalytic site, and they function with a cofactor – either a multivalent metal or a nucleotide.

The amino acids that go into protein synthesis include “indispensable” nutrients that are not made for use, but must be derived from animal protein, although the need is partially satisfied by plant sources. The essential amino acids are classified into well established groups. There are 20 amino acids commonly found in proteins.  They are classified into the following groups based on the chemical and/or structural properties of their side chains :

  1. Aliphatic Amino Acids
  2. Cyclic Amino Acid
  3. AAs with Hydroxyl or Sulfur-containing side chains
  4. Aromatic Amino Acids
  5. Basic Amino Acids
  6. Acidic Amino Acids and their Amides

Examples include:

Alanine                  aliphatic hydrophobic neutral
Arginine                 polar hydrophilic charged (+)
Cysteine                polar hydrophobic neutral
Glutamine             polar hydrophilic neutral
Histidine                aromatic polar hydrophilic charged (+)
Lysine                   polar hydrophilic charged (+)
Methionine            hydrophobic neutral
Serine                   polar hydrophilic neutral
Tyrosine                aromatic polar hydrophobic

Transcribe and Translate a Gene

  1. For each RNA base there is a corresponding DNA base
  2. Cells use the two-step process of transcription and translation to read each gene and produce the string of amino acids that makes up a protein.
  3. mRNA is produced in the nucleus, and is transferred to the ribosome
  4. mRNA uses uracil instead of thymine
  5. the ribosome reads the RNA sequence and makes protein
  6. There is a sequence combination to fit each amino acid to a three letter RNA code
  7. The ribosome starts at AUG (start), and it reads each codon three letters at a time
  8. Stop codons are UAA, UAG and UGA


protein synthesis

protein synthesis

http://learn.genetics.utah.edu/content/molecules/transcribe/images/TandT.png

mcell-transcription-translation

mcell-transcription-translation

http://www.vcbio.science.ru.nl/images/cellcycle/mcell-transcription-translation_eng_zoom.gif

transcription_translation

transcription_translation


http://www.biologycorner.com/resources/transcription_translation.JPG


What about the purine inosine?

Inosine triphosphate pyrophosphatase – Pyrophosphatase that hydrolyzes the non-canonical purine nucleotides inosine triphosphate (ITP), deoxyinosine triphosphate (dITP) as well as 2′-deoxy-N-6-hydroxylaminopurine triposphate (dHAPTP) and xanthosine 5′-triphosphate (XTP) to their respective monophosphate derivatives. The enzyme does not distinguish between the deoxy- and ribose forms. Probably excludes non-canonical purines from RNA and DNA precursor pools, thus preventing their incorporation into RNA and DNA and avoiding chromosomal lesions.

Gastroenterology. 2011 Apr;140(4):1314-21.  http://dx.doi.org:/10.1053/j.gastro.2010.12.038. Epub 2011 Jan 1.

Inosine triphosphate protects against ribavirin-induced adenosine triphosphate loss by adenylosuccinate synthase function.

Hitomi Y1, Cirulli ET, Fellay J, McHutchison JG, Thompson AJ, Gumbs CE, Shianna KV, Urban TJ, Goldstein DB.

Genetic variation of inosine triphosphatase (ITPA) causing an accumulation of inosine triphosphate (ITP) has been shown to protect patients against ribavirin (RBV)-induced anemia during treatment for chronic hepatitis C infection by genome-wide association study (GWAS). However, the biologic mechanism by which this occurs is unknown.

Although ITP is not used directly by human erythrocyte ATPase, it can be used for ATP biosynthesis via ADSS in place of guanosine triphosphate (GTP). With RBV challenge, erythrocyte ATP reduction was more severe in the wild-type ITPA genotype than in the hemolysis protective ITPA genotype. This difference also remains after inhibiting adenosine uptake using nitrobenzylmercaptopurine riboside (NBMPR).

ITP confers protection against RBV-induced ATP reduction by substituting for erythrocyte GTP, which is depleted by RBV, in the biosynthesis of ATP. Because patients with excess ITP appear largely protected against anemia, these results confirm that RBV-induced anemia is due primarily to the effect of the drug on GTP and consequently ATP levels in erythrocytes.

Ther Drug Monit. 2012 Aug;34(4):477-80.  http://dx.doi.org:/10.1097/FTD.0b013e31825c2703.

Determination of inosine triphosphate pyrophosphatase phenotype in human red blood cells using HPLC.

Citterio-Quentin A1, Salvi JP, Boulieu R.

Thiopurine drugs, widely used in cancer chemotherapy, inflammatory bowel disease, and autoimmune hepatitis, are responsible for common adverse events. Only some of these may be explained by genetic polymorphism of thiopurine S-methyltransferase. Recent articles have reported that inosine triphosphate pyrophosphatase (ITPase) deficiency was associated with adverse drug reactions toward thiopurine drug therapy. Here, we report a weak anion exchange high-performance liquid chromatography method to determine ITPase activity in red blood cells and to investigate the relationship with the occurrence of adverse events during azathioprine therapy.

The chromatographic method reported allows the analysis of IMP, inosine diphosphate, and ITP in a single run in <12.5 minutes. The method was linear in the range 5-1500 μmole/L of IMP. Intraassay and interassay precisions were <5% for red blood cell lysates supplemented with 50, 500, and 1000 μmole/L IMP. Km and Vmax evaluated by Lineweaver-Burk plot were 677.4 μmole/L and 19.6 μmole·L·min, respectively. The frequency distribution of ITPase from 73 patients was investigated.

The method described is useful to determine the ITPase phenotype from patients on thiopurine therapy and to investigate the potential relation between ITPase deficiency and the occurrence of adverse events.


System wide analyses have underestimated protein abundances and the importance of transcription in mammals

Jingyi Jessica Li1, 2, Peter J Bickel1 and Mark D Biggin3

PeerJ 2:e270; http://dx.doi.org:/10.7717/peerj.270

Using individual measurements for 61 housekeeping proteins to rescale whole proteome data from Schwanhausser et al. (2011), we find that the median protein detected is expressed at 170,000 molecules per cell and that our corrected protein abundance estimates show a higher correlation with mRNA abundances than do the uncorrected protein data. In addition, we estimated the impact of further errors in mRNA and protein abundances using direct experimental measurements of these errors. The resulting analysis suggests that mRNA levels explain at least 56% of the differences in protein abundance for the 4,212 genes detected by Schwanhausser et al. (2011), though because one major source of error could not be estimated the true percent contribution should be higher.We also employed a second, independent strategy to determine the contribution of mRNA levels to protein expression.We show that the variance in translation rates directly measured by ribosome profiling is only 12% of that inferred by Schwanhausser et al. (2011), and that the measured and inferred translation rates correlate poorly (R2 D 0.13). Based on this, our second strategy suggests that mRNA levels explain 81% of the variance in protein levels. We also determined the percent contributions of transcription, RNA degradation, translation and protein degradation to the variance in protein abundances using both of our strategies. While the magnitudes of the two estimates vary, they both suggest that transcription plays a more important role than the earlier studies implied and translation a much smaller role. Finally, the above estimates only apply to those genes whose mRNA and protein expression was detected. Based on a detailed analysis by Hebenstreit et al. (2012), we estimat that approximately 40% of genes in a given cell within a population express no mRNA. Since there can be no translation in the ab-sence of mRNA, we argue that differences in translation rates can play no role in determining the expression levels for the 40% of genes that are non-expressed.


Related studies that reveal issues that are not part of this chapter:

  1. Ubiquitylation in relationship to tissue remodeling
  2. Post-translational modification of proteins
    1. Glycosylation
    2. Phosphorylation
    3. Methylation
    4. Nitrosylation
    5. Sulfation – sulfotransferases
      cell-matrix communication
    6. Acetylation and histone deacetylation (HDAC)
      Connecting Protein Phosphatase to 1α (PP1α)
      Acetylation complexes (such as CBP/p300 and PCAF)
      Sirtuins
      Rel/NF-kB Signal Transduction
      Homologous Recombination Pathway of Double-Strand DNA Repair
    7. Glycination
    8. cyclin dependent kinases (CDKs)
    9. lyase
    10. transferase


This year, the Lasker award for basic medical research went to Kazutoshi Mori (Kyoto University) and Peter Walter (University of California, San Francisco) for their “discoveries concerning the unfolded protein response (UPR) — an intracellular quality control system that

detects harmful misfolded proteins in the endoplasmic reticulum and signals the nucleus to carry out corrective measures.”

About UPR: Approximately a third of cellular proteins pass through the Endoplasmic Reticulum (ER) which performs stringent quality control of these proteins. All proteins need to assume the proper 3-dimensional shape in order to function properly in the harsh cellular environment. Related to this is the fact that cells are under constant stress and have to make rapid, real time decisions about survival or death.

A major indicator of stress is the accumulation of unfolded proteins within the Endoplasmic Reticulum (ER), which triggers a transcriptional cascade in order to increase the folding capacity of the ER. If the metabolic burden is too great and homeostasis cannot be achieved, the response shifts from

damage control to the induction of pro-apoptotic pathways that would ultimately cause cell death.

This response to unfolded proteins or the UPR is conserved among all eukaryotes, and dysfunction in this pathway underlies many human diseases, including Alzheimer’s, Parkinson’s, Diabetes and Cancer.


The discovery of a new class of human proteins with previously unidentified activities

In a landmark study conducted by scientists at the Scripps Research Institute, The Hong Kong University of Science and Technology, aTyr Pharma and their collaborators, a new class of human proteins has been discovered. These proteins [nearly 250], called Physiocrines belong to the aminoacyl tRNA synthetase gene family and carry out novel, diverse and distinct biological functions.

The aminoacyl tRNA synthetase gene family codes for a group of 20 ubiquitous enzymes almost all of which are part of the protein synthesis machinery. Using recombinant protein purification, deep sequencing technique, mass spectroscopy and cell based assays, the team made this discovery. The finding is significant, also because it highlights the alternate use of a gene family whose protein product normally performs catalytic activities for non-catalytic regulation of basic and complex physiological processes spanning metabolism, vascularization, stem cell biology and immunology


Muscle maintenance and regeneration – key player identified

Muscle tissue suffers from atrophy with age and its regenerative capacity also declines over time. Most molecules discovered thus far to boost tissue regeneration are also implicated in cancers.  During a quest to find safer alternatives that can regenerate tissue, scientists reported that the hormone Oxytocin is required for proper muscle tissue regeneration and homeostasis and that its levels decline with age.

Oxytocin could be an alternative to hormone replacement therapy as a way to combat aging and other organ related degeneration.

Oxytocin is an age-specific circulating hormone that is necessary for muscle maintenance and regeneration (June 2014)


Proc Natl Acad Sci U S A. 2014 Sep 30;111(39):14289-94.   http://dx.doi.org:/10.1073/pnas.1407640111. Epub 2014 Sep 15.

Role of forkhead box protein A3 in age-associated metabolic decline.

Ma X1, Xu L1, Gavrilova O2, Mueller E3.

Aging is associated with increased adiposity and diminished thermogenesis, but the critical transcription factors influencing these metabolic changes late in life are poorly understood. We recently demonstrated that the winged helix factor forkhead box protein A3 (Foxa3) regulates the expansion of visceral adipose tissue in high-fat diet regimens; however, whether Foxa3 also contributes to the increase in adiposity and the decrease in brown fat activity observed during the normal aging process is currently unknown. Here we report that during aging, levels of Foxa3 are significantly and selectively up-regulated in brown and inguinal white fat depots, and that midage Foxa3-null mice have increased white fat browning and thermogenic capacity, decreased adipose tissue expansion, improved insulin sensitivity, and increased longevity. Foxa3 gain-of-function and loss-of-function studies in inguinal adipose depots demonstrated a cell-autonomous function for Foxa3 in white fat tissue browning. Furthermore, our analysis revealed that the mechanisms of Foxa3 modulation of brown fat gene programs involve the suppression of peroxisome proliferator activated receptor γ coactivtor 1 α (PGC1α) levels through interference with cAMP responsive element binding protein 1-mediated transcriptional regulation of the PGC1α promoter.


Asymmetric mRNA localization contributes to fidelity and sensitivity of spatially localized systems

RJ Weatheritt, TJ Gibson & MM Babu
Nature Structural & Molecular Biology 24 Aug, 2014; 21: 833–839 http://dx.do.orgi:/10.1038/nsmb.2876

Although many proteins are localized after translation, asymmetric protein distribution is also achieved by translation after mRNA localization. Why are certain mRNA transported to a distal location and translated on-site? Here we undertake a systematic, genome-scale study of asymmetrically distributed protein and mRNA in mammalian cells. Our findings suggest that asymmetric protein distribution by mRNA localization enhances interaction fidelity and signaling sensitivity. Proteins synthesized at distal locations frequently contain intrinsically disordered segments. These regions are generally rich in assembly-promoting modules and are often regulated by post-translational modifications. Such proteins are tightly regulated but display distinct temporal dynamics upon stimulation with growth factors. Thus, proteins synthesized on-site may rapidly alter proteome composition and act as dynamically regulated scaffolds to promote the formation of reversible cellular assemblies. Our observations are consistent across multiple mammalian species, cell types and developmental stages, suggesting that localized translation is a recurring feature of cell signaling and regulation.


An overview of the potential advantages conferred by distal-site protein synthesis, inferred from our analysis.


An overview of the potential advantages conferred by distal-site protein synthesis

An overview of the potential advantages conferred by distal-site protein synthesis


Turquoise and red filled circle represents off-target and correct interaction partners, respectively. Wavy lines represent a disordered region within a distal site synthesis protein. Grey and red line in graphs represents profiles of t…

http://www.nature.com/nsmb/journal/v21/n9/carousel/nsmb.2876-F5.jpg


Tweaking transcriptional programming for high quality recombinant protein production

Since overexpression of recombinant proteins in E. coli often leads to the formation of inclusion bodies, producing properly folded, soluble proteins is undoubtedly the most important end goal in a protein expression campaign. Various approaches have been devised to bypass the insolubility issues during E. coli expression and in a recent report a group of researchers discuss reprogramming the E. coli proteostasis [protein homeostasis] network to achieve high yields of soluble, functional protein. The premise of their studies is that the basal E. coli proteostasis network is insufficient, and often unable, to fold overexpressed proteins, thus clogging the folding machinery.

By overexpressing a mutant, negative-feedback deficient heat shock transcription factor [σ32 I54N] before and during overexpression of the protein of interest, reprogramming can be achieved, resulting in high yields of soluble and functional recombinant target protein. The authors explain that this method is better than simply co-expressing/over-expressing chaperones, co-chaperones, foldases or other components of the proteostasis network because reprogramming readies the folding machinery and up regulates the essential folding components beforehand thus  maintaining system capability of the folding machinery.

The Heat-Shock Response Transcriptional Program Enables High-Yield and High-Quality Recombinant Protein Production in Escherichia coli (July 2014)


 Unfolded proteins collapse when exposed to heat and crowded environments

Proteins are important molecules in our body and they fulfil a broad range of functions. For instance as enzymes they help to release energy from food and as muscle proteins they assist with motion. As antibodies they are involved in immune defence and as hormone receptors in signal transduction in cells. Until only recently it was assumed that all proteins take on a clearly defined three-dimensional structure – i.e. they fold in order to be able to assume these functions. Surprisingly, it has been shown that many important proteins occur as unfolded coils. Researchers seek to establish how these disordered proteins are capable at all of assuming highly complex functions.

Ben Schuler’s research group from the Institute of Biochemistry of the University of Zurich has now established that an increase in temperature leads to folded proteins collapsing and becoming smaller. Other environmental factors can trigger the same effect.

Measurements using the “molecular ruler”

“The fact that unfolded proteins shrink at higher temperatures is an indication that cell water does indeed play an important role as to the spatial organisation eventually adopted by the molecules”, comments Schuler with regard to the impact of temperature on protein structure. For their studies the biophysicists use what is known as single-molecule spectroscopy. Small colour probes in the protein enable the observation of changes with an accuracy of more than one millionth of a millimetre. With this “molecular yardstick” it is possible to measure how molecular forces impact protein structure.

With computer simulations the researchers have mimicked the behaviour of disordered proteins.
(Courtesy of Jose EDS Roselino, PhD.


MLKL compromises plasma membrane integrity

Necroptosis is implicated in many diseases and understanding this process is essential in the search for new therapies. While mixed lineage kinase domain-like (MLKL) protein has been known to be a critical component of necroptosis induction, how MLKL transduces the death signal was not clear. In a recent finding, scientists demonstrated that the full four-helical bundle domain (4HBD) in the N-terminal region of MLKL is required and sufficient to induce its oligomerization and trigger cell death.

They also found a patch of positively charged amino acids on the surface of the 4HBD that bound to phosphatidylinositol phosphates (PIPs) and allowed the recruitment of MLKL to the plasma membrane that resulted in the formation of pores consisting of MLKL proteins, due to which cells absorbed excess water causing them to explode. Detailed knowledge about how MLKL proteins create pores offers possibilities for the development of new therapeutic interventions for tolerating or preventing cell death.

MLKL compromises plasma membrane integrity by binding to phosphatidylinositol phosphates (May 2014)


Mitochondrial and ER proteins implicated in dementia

Mitochondria and the endoplasmic reticulum (ER) form tight structural associations that facilitate a number of cellular functions. However, the molecular mechanisms of these interactions aren’t properly understood.

A group of researchers showed that the ER protein VAPB interacted with mitochondrial protein PTPIP51 to regulate ER-mitochondria associations and that TDP-43, a protein implicated in dementia, disturbs this interaction to regulate cellular Ca2+ homeostasis. These studies point to a new pathogenic mechanism for TDP-43 and may also provide a potential new target for the development of new treatments for devastating neurological conditions like dementia.

ER-mitochondria associations are regulated by the VAPB-PTPIP51 interaction and are disrupted by ALS/FTD-associated TDP-43. Nature (June 2014)


A novel strategy to improve membrane protein expression in Yeast

Membrane proteins play indispensable roles in the physiology of an organism. However, recombinant production of membrane proteins is one of the biggest hurdles facing protein biochemists today. A group of scientists in Belgium showed that,

by increasing the intracellular membrane production by interfering with a key enzymatic step of lipid synthesis,

enhanced expression of recombinant membrane proteins in yeast is achieved.

Specifically, they engineered the oleotrophic yeast, Yarrowia lipolytica, by

deleting the phosphatidic acid phosphatase, PAH1 gene,

which led to massive proliferation of endoplasmic reticulum (ER) membranes.

For all 8 tested representatives of different integral membrane protein families, they obtained enhanced protein accumulation.


An unconventional method to boost recombinant protein levels

MazF is an mRNA interferase enzyme in E.coli that functions as and degrades cellular mRNA in a targeted fashion, at the “ACA” sequence. This degradation of cellular mRNA causes a precipitous drop in cellular protein synthesis. A group of scientists at the Robert Wood Johnson Medical School in New Jersey, exploited the degeneracy of the genetic code to modify all “ACA” triplets within their gene of interest in a way that the corresponding amino acid (Threonine) remained unchanged. Consequently, induction of MazF toxin caused degradation of E.coli cellular mRNA but the recombinant gene transcription and protein synthesis continued, causing significant accumulation of high quality target protein. This expression system enables unparalleled signal to noise ratios that could dramatically simplify structural and functional studies of difficult-to-purify, biologically important proteins.


Tandem fusions and bacterial strain evolution for enhanced functional membrane protein production

Membrane protein production remains a significant challenge in its characterization and structure determination. Despite the fact that there are a variety of host cell types, E.coli remains the popular choice for producing recombinant membrane proteins. A group of scientists in Netherlands devised a robust strategy to increase the probability of functional membrane protein overexpression in E.coli.

By fusing Green Fluorescent Protein (GFP) and the Erythromycin Resistance protein (ErmC) to the C-terminus of a target membrane protein they wer e able to track the folding state of their target protein while using Erythromycin to select for increased expression. By increasing erythromycin concentration in the growth media and testing different membrane targets, they were able to identify four evolved E.coli strains, all of which carried a mutation in the hns gene, whose product is implicated in genome organization and transcriptional silencing. Through their experiments the group showed that partial removal of the transcriptional silencing mechanism was related to production of proteins that were essential for functional overexpression of membrane proteins.


The role of an anti-apoptotic factor in recombinant protein production

In a recent study, scientists at the Johns Hopkins University and Frederick National Laboratory for Cancer Research examined an alternative method of utilizing the benefits of anti-apoptotic gene expression to enhance the transient expression of biotherapeutics, specifically, through the co-transfection of Bcl-xL along with the product-coding target gene.

Chinese Hamster Ovary(CHO) cells were co-transfected with the product-coding gene and a vector containing Bcl-xL, using Polyethylenimine (PEI) reagent. They found that the cells co-transfected with Bcl-xL demonstrated reduced apoptosis, increased specific productivity, and an overall increase in product yield.

B-cell lymphoma-extra-large (Bcl-xL) is a mitochondrial transmembrane protein and a member of the Bcl-2 family of proteins which are known to act as either pro- or anti-apoptotic proteins. Bcl-xL itself acts as an anti-apoptotic molecule by preventing the release of mitochondrial contents such as cytochrome c, which would lead to caspase activation. Higher levels of Bcl-xL push a cell toward survival mode by making the membranes pores less permeable and leaky.

Introduction to Protein Synthesis and Degradation Updated 8/31/2019

N-Terminal Degradation of Proteins: The N-End Rule and N-degrons

In both prokaryotes and eukaryotes mitochondria and chloroplasts, the ribosomal synthesis of proteins is initiated with the addition of the N-formyl methionine residue.  However in eukaryotic cytosolic ribosomes, the N terminal was assumed to be devoid of the N-formyl group.  The unformylated N-terminal methionine residues of eukaryotes is then  often N-acetylated (Ac) and creates specific degradation signals, the Ac N-end rule.  These N-end rule pathways are proteolytic systems which recognize these N-degrons resulting in proteosomal degradation or autophagy.  In prokaryotes this system is stimulated by certain amino acid deficiencies and in eukaryotes is dependent on the Psh1 E3 ligase.

Two papers in the journal Science describe this N-degron in more detail.

Structured Abstract
INTRODUCTION

In both bacteria and eukaryotic mitochondria and chloroplasts, the ribosomal synthesis of proteins is initiated with the N-terminal (Nt) formyl-methionine (fMet) residue. Nt-fMet is produced pretranslationally by formyltransferases, which use 10-formyltetrahydrofolate as a cosubstrate. By contrast, proteins synthesized by cytosolic ribosomes of eukaryotes were always presumed to bear unformylated N-terminal Met (Nt-Met). The unformylated Nt-Met residue of eukaryotic proteins is often cotranslationally Nt-acetylated, a modification that creates specific degradation signals, Ac/N-degrons, which are targeted by the Ac/N-end rule pathway. The N-end rule pathways are a set of proteolytic systems whose unifying feature is their ability to recognize proteins containing N-degrons, thereby causing the degradation of these proteins by the proteasome or autophagy in eukaryotes and by the proteasome-like ClpAP protease in bacteria. The main determinant of an N‑degron is a destabilizing Nt-residue of a protein. Studies over the past three decades have shown that all 20 amino acids of the genetic code can act, in cognate sequence contexts, as destabilizing Nt‑residues. The previously known eukaryotic N-end rule pathways are the Arg/N-end rule pathway, the Ac/N-end rule pathway, and the Pro/N-end rule pathway. Regulated degradation of proteins and their natural fragments by the N-end rule pathways has been shown to mediate a broad range of biological processes.

RATIONALE

The chemical similarity of the formyl and acetyl groups and their identical locations in, respectively, Nt‑formylated and Nt-acetylated proteins led us to suggest, and later to show, that the Nt-fMet residues of nascent bacterial proteins can act as bacterial N-degrons, termed fMet/N-degrons. Here we wished to determine whether Nt-formylated proteins might also form in the cytosol of a eukaryote such as the yeast Saccharomyces cerevisiae and to determine the metabolic fates of Nt-formylated proteins if they could be produced outside mitochondria. Our approaches included molecular genetic techniques, mass spectrometric analyses of proteins’ N termini, and affinity-purified antibodies that selectively recognized Nt-formylated reporter proteins.

RESULTS

We discovered that the yeast formyltransferase Fmt1, which is imported from the cytosol into the mitochondria inner matrix, can generate Nt-formylated proteins in the cytosol, because the translocation of Fmt1 into mitochondria is not as efficacious, even under unstressful conditions, as had previously been assumed. We also found that Nt‑formylated proteins are greatly up-regulated in stationary phase or upon starvation for specific amino acids. The massive increase of Nt-formylated proteins strictly requires the Gcn2 kinase, which phosphorylates Fmt1 and mediates its retention in the cytosol. Notably, the ability of Gcn2 to retain a large fraction of Fmt1 in the cytosol of nutritionally stressed cells is confined to Fmt1, inasmuch as the Gcn2 kinase does not have such an effect, under the same conditions, on other examined nuclear DNA–encoded mitochondrial matrix proteins. The Gcn2-Fmt1 protein localization circuit is a previously unknown signal transduction pathway. A down-regulation of cytosolic Nt‑formylation was found to increase the sensitivity of cells to undernutrition stresses, to a prolonged cold stress, and to a toxic compound. We also discovered that the Nt-fMet residues of Nt‑formylated cytosolic proteins act as eukaryotic fMet/N-degrons and identified the Psh1 E3 ubiquitin ligase as the recognition component (fMet/N-recognin) of the previously unknown eukaryotic fMet/N-end rule pathway, which destroys Nt‑formylated proteins.

CONCLUSION

The Nt-formylation of proteins, a long-known pretranslational protein modification, is mediated by formyltransferases. Nt-formylation was thought to be confined to bacteria and bacteria-descended eukaryotic organelles but was found here to also occur at the start of translation by the cytosolic ribosomes of a eukaryote. The levels of Nt‑formylated eukaryotic proteins are greatly increased upon specific stresses, including undernutrition, and appear to be important for adaptation to these stresses. We also discovered that Nt-formylated cytosolic proteins are selectively destroyed by the eukaryotic fMet/N-end rule pathway, mediated by the Psh1 E3 ubiquitin ligase. This previously unknown proteolytic system is likely to be universal among eukaryotes, given strongly conserved mechanisms that mediate Nt‑formylation and degron recognition.

The eukaryotic fMet/N-end rule pathway.

(Top) Under undernutrition conditions, the Gcn2 kinase augments the cytosolic localization of the Fmt1 formyltransferase, and possibly also its enzymatic activity. Consequently, Fmt1 up-regulates the cytosolic fMet–tRNAi (initiator transfer RNA), and thereby increases the levels of cytosolic Nt-formylated proteins, which are required for the adaptation of cells to specific stressors. (Bottom) The Psh1 E3 ubiquitin ligase targets the N-terminal fMet-residues of eukaryotic cytosolic proteins, such as Cse4, Pgd1, and Rps22a, for the polyubiquitylation-mediated, proteasome-dependent degradation.

” data-icon-position=”” data-hide-link-title=”0″>

The eukaryotic fMet/N-end rule pathway.

(Top) Under undernutrition conditions, the Gcn2 kinase augments the cytosolic localization of the Fmt1 formyltransferase, and possibly also its enzymatic activity. Consequently, Fmt1 up-regulates the cytosolic fMet–tRNAi (initiator transfer RNA), and thereby increases the levels of cytosolic Nt-formylated proteins, which are required for the adaptation of cells to specific stressors. (Bottom) The Psh1 E3 ubiquitin ligase targets the N-terminal fMet-residues of eukaryotic cytosolic proteins, such as Cse4, Pgd1, and Rps22a, for the polyubiquitylation-mediated, proteasome-dependent degradation.


A glycine-specific N-degron pathway mediates the quality control of protein N-myristoylation. Richard T. Timms1,2Zhiqian Zhang1,2David Y. Rhee3J. Wade Harper3Itay Koren1,2,*,Stephen J. Elledge1,2

Science  05 Jul 2019: Vol. 365, Issue 6448

The second paper describes a glycine specific N-degron pathway in humans.  Specifically the authors set up a screen to identify specific N-terminal degron motifs in the human.  Findings included an expanded repertoire for the UBR E3 ligases to include substrates with arginine and lysine following an intact initiator methionine and a glycine at the extreme N-terminus, which is a potent degron.

Glycine N-degron regulation revealed

For more than 30 years, N-terminal sequences have been known to influence protein stability, but additional features of these N-end rule, or N-degron, pathways continue to be uncovered. Timms et al. used a global protein stability (GPS) technology to take a broader look at these pathways in human cells. Unexpectedly, glycine exposed at the N terminus could act as a potent degron; proteins bearing N-terminal glycine were targeted for proteasomal degradation by two Cullin-RING E3 ubiquitin ligases through the substrate adaptors ZYG11B and ZER1. This pathway may be important, for example, to degrade proteins that fail to localize properly to cellular membranes and to destroy protein fragments generated during cell death.

Science, this issue p. eaaw4912

Structured Abstract

INTRODUCTION

The ubiquitin-proteasome system is the major route through which the cell achieves selective protein degradation. The E3 ubiquitin ligases are the major determinants of specificity in this system, which is thought to be achieved through their selective recognition of specific degron motifs in substrate proteins. However, our ability to identify these degrons and match them to their cognate E3 ligase remains a major challenge.

RATIONALE

It has long been known that the stability of proteins is influenced by their N-terminal residue, and a large body of work over the past three decades has characterized a collection of N-end rule pathways that target proteins for degradation through N-terminal degron motifs. Recently, we developed Global Protein Stability (GPS)–peptidome technology and used it to delineate a suite of degrons that lie at the extreme C terminus of proteins. We adapted this approach to examine the stability of the human N terminome, allowing us to reevaluate our understanding of N-degron pathways in an unbiased manner.

RESULTS

Stability profiling of the human N terminome identified two major findings: an expanded repertoire for UBR family E3 ligases to include substrates that begin with arginine and lysine following an intact initiator methionine and, more notably, that glycine positioned at the extreme N terminus can act as a potent degron. We established human embryonic kidney 293T reporter cell lines in which unstable peptides that bear N-terminal glycine degrons were fused to green fluorescent protein, and we performed CRISPR screens to identify the degradative machinery involved. These screens identified two Cul2 Cullin-RING E3 ligase complexes, defined by the related substrate adaptors ZYG11B and ZER1, that act redundantly to target substrates bearing N-terminal glycine degrons for proteasomal degradation. Moreover, through the saturation mutagenesis of example substrates, we defined the composition of preferred N-terminal glycine degrons specifically recognized by ZYG11B and ZER1.

We found that preferred glycine degrons are depleted from the native N termini of metazoan proteomes, suggesting that proteins have evolved to avoid degradation through this pathway, but are strongly enriched at annotated caspase cleavage sites. Stability profiling of N-terminal peptides lying downstream of all known caspase cleavages sites confirmed that Cul2ZYG11Band Cul2ZER1 could make a substantial contribution to the removal of proteolytic cleavage products during apoptosis. Last, we identified a role for ZYG11B and ZER1 in the quality control of N-myristoylated proteins. N-myristoylation is an important posttranslational modification that occurs exclusively on N-terminal glycine. By profiling the stability of the human N-terminome in the absence of the N-myristoyltransferases NMT1 and NMT2, we found that a failure to undergo N-myristoylation exposes N-terminal glycine degrons that are otherwise obscured. Thus, conditional exposure of glycine degrons to ZYG11B and ZER1 permits the selective proteasomal degradation of aberrant proteins that have escaped N-terminal myristoylation.

CONCLUSION

These data demonstrate that an additional N-degron pathway centered on N-terminal glycine regulates the stability of metazoan proteomes. Cul2ZYG11B– and Cul2ZER1-mediated protein degradation through N-terminal glycine degrons may be particularly important in the clearance of proteolytic fragments generated by caspase cleavage during apoptosis and in the quality control of protein N-myristoylation.

The glycine N-degron pathway.

Stability profiling of the human N-terminome revealed that N-terminal glycine acts as a potent degron. CRISPR screening revealed two Cul2 complexes, defined by the related substrate adaptors ZYG11B and ZER1, that recognize N-terminal glycine degrons. This pathway may be particularly important for the degradation of caspase cleavage products during apoptosis and the removal of proteins that fail to undergo N-myristoylation.

” data-icon-position=”” data-hide-link-title=”0″>

The glycine N-degron pathway.

Stability profiling of the human N-terminome revealed that N-terminal glycine acts as a potent degron. CRISPR screening revealed two Cul2 complexes, defined by the related substrate adaptors ZYG11B and ZER1, that recognize N-terminal glycine degrons. This pathway may be particularly important for the degradation of caspase cleavage products during apoptosis and the removal of proteins that fail to undergo N-myristoylation.


Read Full Post »

Summary of Signaling and Signaling Pathways

Summary of Signaling and Signaling Pathways

Author and Curator: Larry H Bernstein, MD, FCAP

In the imtroduction to this series of discussions I pointed out JEDS Rosalino’s observation about the construction of a complex molecule of acetyl coenzyme A, and the amount of genetic coding that had to go into it.  Furthermore, he observes –  Millions of years later, or as soon as, the information of interaction leading to activity and regulation could be found in RNA, proteins like reverse transcriptase move this information to a more stable form (DNA). In this way it is easier to understand the use of CoA to make two carbon molecules more reactive.

acetylCoA

acetylCoA

In the tutorial that follows we find support for the view that mechanisms and examples from the current literature, which give insight into the developments in cell metabolism, are achieving a separation from inconsistent views introduced by the classical model of molecular biology and genomics, toward a more functional cellular dynamics that is not dependent on the classic view.  The classical view fits a rigid framework that is to genomics and metabolomics as Mendelian genetics if to multidimentional, multifactorial genetics.  The inherent difficulty lies in two places:

  1. Interactions between differently weighted determinants
  2. A large part of the genome is concerned with regulatory function, not expression of the code

The goal of the tutorial was to achieve an understanding of how cell signaling occurs in a cell.  Completion of the tutorial would provide

  1. a basic understanding signal transduction and
  2. the role of phosphorylation in signal transduction.
Regulation of the integrity of endothelial cell–cell contacts by phosphorylation of VE-cadherin

Regulation of the integrity of endothelial cell–cell contacts by phosphorylation of VE-cadherin

In addition – detailed knowledge of –

  1. the role of Tyrosine kinases and
  2. G protein-coupled receptors in cell signaling.
serine

serine

threonine

threonine

protein kinase

protein kinase

We are constantly receiving and interpreting signals from our environment, which can come

  • in the form of light, heat, odors, touch or sound.

The cells of our bodies are also

  • constantly receiving signals from other cells.

These signals are important to

  • keep cells alive and functioning as well as
  • to stimulate important events such as
  • cell division and differentiation.

Signals are most often chemicals that can be found

  • in the extracellular fluid around cells.

These chemicals can come

  • from distant locations in the body (endocrine signaling by hormones), from
  • nearby cells (paracrine signaling) or can even
  • be secreted by the same cell (autocrine signaling).

Notch-mediated juxtacrine signal between adjacent cells. 220px-Notchccr

Signaling molecules may trigger any number of cellular responses, including

  • changing the metabolism of the cell receiving the signal or
  • result in a change in gene expression (transcription) within the nucleus of the cell or both.
controlling the output of ribosomes.

controlling the output of ribosomes.

To which I would now add..

  • result in either an inhibitory or a stimulatory effect

The three stages of cell signaling are:

Cell signaling can be divided into 3 stages:

Reception: A cell detects a signaling molecule from the outside of the cell.

Transduction: When the signaling molecule binds the receptor it changes the receptor protein in some way. This change initiates the process of transduction. Signal transduction is usually a pathway of several steps. Each relay molecule in the signal transduction pathway changes the next molecule in the pathway.

Response: Finally, the signal triggers a specific cellular response.

signal transduction

signal transduction

http://www.hartnell.edu/tutorials/biology/images/signaltransduction_simple.jpg

The initiation is depicted as follows:

Signal Transduction – ligand binds to surface receptor

Membrane receptors function by binding the signal molecule (ligand) and causing the production of a second signal (also known as a second messenger) that then causes a cellular response. These types of receptors transmit information from the extracellular environment to the inside of the cell.

  • by changing shape or
  • by joining with another protein
  • once a specific ligand binds to it.

Examples of membrane receptors include

  • G Protein-Coupled Receptors and
Understanding these receptors and identifying their ligands and the resulting signal transduction pathways represent a major conceptual advance.

Understanding these receptors and identifying their ligands and the resulting signal transduction pathways represent a major conceptual advance.

  • Receptor Tyrosine Kinases.
intracellular signaling

intracellular signaling

http://www.hartnell.edu/tutorials/biology/images/membrane_receptor_tk.jpg

Intracellular receptors are found inside the cell, either in the cytopolasm or in the nucleus of the target cell (the cell receiving the signal).

Note that though change in gene expression is stated, the change in gene expression does not here imply a change in the genetic information – such as – mutation.  That does not have to be the case in the normal homeostatic case.

This point is the differentiating case between what JEDS Roselino has referred as

  1. a fast, adaptive reaction, that is the feature of protein molecules, and distinguishes this interaction from
  2. a one-to-one transcription of the genetic code.

The rate of transcription can be controlled, or it can be blocked.  This is in large part in response to the metabolites in the immediate interstitium.

This might only be

  • a change in the rate of a transcription or a suppression of expression through RNA.
  • Or through a conformational change in an enzyme
 Swinging domains in HECT E3 enzymes

Swinging domains in HECT E3 enzymes

Since signaling systems need to be

  • responsive to small concentrations of chemical signals and act quickly,
  • cells often use a multi-step pathway that transmits the signal quickly,
  • while amplifying the signal to numerous molecules at each step.

Signal transduction pathways are shown (simplified):

Signal Transduction

Signal Transduction

Signal transduction occurs when an

  1. extracellular signaling molecule activates a specific receptor located on the cell surface or inside the cell.
  2. In turn, this receptor triggers a biochemical chain of events inside the cell, creating a response.
  3. Depending on the cell, the response alters the cell’s metabolism, shape, gene expression, or ability to divide.
  4. The signal can be amplified at any step. Thus, one signaling molecule can cause many responses.

In 1970, Martin Rodbell examined the effects of glucagon on a rat’s liver cell membrane receptor. He noted that guanosine triphosphate disassociated glucagon from this receptor and stimulated the G-protein, which strongly influenced the cell’s metabolism. Thus, he deduced that the G-protein is a transducer that accepts glucagon molecules and affects the cell. For this, he shared the 1994 Nobel Prize in Physiology or Medicine with Alfred G. Gilman.

Guanosine monophosphate structure

Guanosine monophosphate structure

In 2007, a total of 48,377 scientific papers—including 11,211 e-review papers—were published on the subject. The term first appeared in a paper’s title in 1979. Widespread use of the term has been traced to a 1980 review article by Rodbell: Research papers focusing on signal transduction first appeared in large numbers in the late 1980s and early 1990s.

Signal transduction involves the binding of extracellular signaling molecules and ligands to cell-surface receptors that trigger events inside the cell. The combination of messenger with receptor causes a change in the conformation of the receptor, known as receptor activation.

This activation is always the initial step (the cause) leading to the cell’s ultimate responses (effect) to the messenger. Despite the myriad of these ultimate responses, they are all directly due to changes in particular cell proteins. Intracellular signaling cascades can be started through cell-substratum interactions; examples are the integrin that binds ligands in the extracellular matrix and steroids.

Integrin

Integrin

Most steroid hormones have receptors within the cytoplasm and act by stimulating the binding of their receptors to the promoter region of steroid-responsive genes.

steroid hormone receptor

steroid hormone receptor

Various environmental stimuli exist that initiate signal transmission processes in multicellular organisms; examples include photons hitting cells in the retina of the eye, and odorants binding to odorant receptors in the nasal epithelium. Certain microbial molecules, such as viral nucleotides and protein antigens, can elicit an immune system response against invading pathogens mediated by signal transduction processes. This may occur independent of signal transduction stimulation by other molecules, as is the case for the toll-like receptor. It may occur with help from stimulatory molecules located at the cell surface of other cells, as with T-cell receptor signaling. Receptors can be roughly divided into two major classes: intracellular receptors and extracellular receptors.

Signal transduction cascades amplify the signal output

Signal transduction cascades amplify the signal output

Signal transduction cascades amplify the signal output

G protein-coupled receptors (GPCRs) are a family of integral transmembrane proteins that possess seven transmembrane domains and are linked to a heterotrimeric G protein. Many receptors are in this family, including adrenergic receptors and chemokine receptors.

Arrestin binding to active GPCR kinase (GRK)-phosphorylated GPCRs blocks G protein coupling

signal transduction pathways

signal transduction pathways

Arrestin binding to active GPCR kinase (GRK)-phosphorylated GPCRs blocks G protein coupling

Arrestin binding to active GPCR kinase (GRK)-phosphorylated GPCRs blocks G protein coupling

Signal transduction by a GPCR begins with an inactive G protein coupled to the receptor; it exists as a heterotrimer consisting of Gα, Gβ, and Gγ. Once the GPCR recognizes a ligand, the conformation of the receptor changes to activate the G protein, causing Gα to bind a molecule of GTP and dissociate from the other two G-protein subunits.

The dissociation exposes sites on the subunits that can interact with other molecules. The activated G protein subunits detach from the receptor and initiate signaling from many downstream effector proteins such as phospholipases and ion channels, the latter permitting the release of second messenger molecules.

Receptor tyrosine kinases (RTKs) are transmembrane proteins with an intracellular kinase domain and an extracellular domain that binds ligands; examples include growth factor receptors such as the insulin receptor.

 insulin receptor and and insulin receptor signaling pathway (IRS)

insulin receptor and and insulin receptor signaling pathway (IRS)

To perform signal transduction, RTKs need to form dimers in the plasma membrane; the dimer is stabilized by ligands binding to the receptor.

RTKs

RTKs

The interaction between the cytoplasmic domains stimulates the autophosphorylation of tyrosines within the domains of the RTKs, causing conformational changes.

Allosteric_Regulation.svg

Subsequent to this, the receptors’ kinase domains are activated, initiating phosphorylation signaling cascades of downstream cytoplasmic molecules that facilitate various cellular processes such as cell differentiation and metabolism.

Signal-Transduction-Pathway

Signal-Transduction-Pathway

As is the case with GPCRs, proteins that bind GTP play a major role in signal transduction from the activated RTK into the cell. In this case, the G proteins are

  • members of the Ras, Rho, and Raf families, referred to collectively as small G proteins.

They act as molecular switches usually

  • tethered to membranes by isoprenyl groups linked to their carboxyl ends.

Upon activation, they assign proteins to specific membrane subdomains where they participate in signaling. Activated RTKs in turn activate

  • small G proteins that activate guanine nucleotide exchange factors such as SOS1.

Once activated, these exchange factors can activate more small G proteins, thus

  • amplifying the receptor’s initial signal.

The mutation of certain RTK genes, as with that of GPCRs, can result in the expression of receptors that exist in a constitutively activate state; such mutated genes may act as oncogenes.

Integrin


Integrin

Integrin

Integrin-mediated signal transduction

An overview of integrin-mediated signal transduction, adapted from Hehlgens et al. (2007).

Integrins are produced by a wide variety of cells; they play a role in

  • cell attachment to other cells and the extracellular matrix and
  • in the transduction of signals from extracellular matrix components such as fibronectin and collagen.

Ligand binding to the extracellular domain of integrins

  • changes the protein’s conformation,
  • clustering it at the cell membrane to
  • initiate signal transduction.

Integrins lack kinase activity; hence, integrin-mediated signal transduction is achieved through a variety of intracellular protein kinases and adaptor molecules, the main coordinator being integrin-linked kinase.

As shown in the picture, cooperative integrin-RTK signaling determines the

  1. timing of cellular survival,
  2. apoptosis,
  3. proliferation, and
  4. differentiation.
integrin-mediated signal transduction

integrin-mediated signal transduction

Integrin signaling

Integrin signaling

ion channel

A ligand-gated ion channel, upon binding with a ligand, changes conformation

  • to open a channel in the cell membrane
  • through which ions relaying signals can pass.

An example of this mechanism is found in the receiving cell of a neural synapse. The influx of ions that occurs in response to the opening of these channels

  1. induces action potentials, such as those that travel along nerves,
  2. by depolarizing the membrane of post-synaptic cells,
  3. resulting in the opening of voltage-gated ion channels.
RyR and Ca+ release from SR

RyR and Ca+ release from SR

An example of an ion allowed into the cell during a ligand-gated ion channel opening is Ca2+;

  • it acts as a second messenger
  • initiating signal transduction cascades and
  • altering the physiology of the responding cell.

This results in amplification of the synapse response between synaptic cells

  • by remodelling the dendritic spines involved in the synapse.

In eukaryotic cells, most intracellular proteins activated by a ligand/receptor interaction possess an enzymatic activity; examples include tyrosine kinase and phosphatases. Some of them create second messengers such as cyclic AMP and IP3,

cAMP

cAMP

Inositol_1,4,5-trisphosphate.svg

Inositol_1,4,5-trisphosphate.svg

  • the latter controlling the release of intracellular calcium stores into the cytoplasm.

Many adaptor proteins and enzymes activated as part of signal transduction possess specialized protein domains that bind to specific secondary messenger molecules. For example,

  • calcium ions bind to the EF hand domains of calmodulin,
  • allowing it to bind and activate calmodulin-dependent kinase.
calcium movement and RyR2 receptor

calcium movement and RyR2 receptor

PIP3 and other phosphoinositides do the same thing to the Pleckstrin homology domains of proteins such as the kinase protein AKT.

Signals can be generated within organelles, such as chloroplasts and mitochondria, modulating the nuclear
gene expression in a process called retrograde signaling.

Recently, integrative genomics approaches, in which correlation analysis has been applied on transcript and metabolite profiling data of Arabidopsis thaliana, revealed the identification of metabolites which are putatively acting as mediators of nuclear gene expression.

http://fpls.com/unraveling_retrograde_signaling_pathways:_finding_candidate_signaling_molecules_via_metabolomics_and_systems_biology_driven_approaches

Related articles

  1. Systems Biology Approach Reveals Genome to Phenome Correlation in Type 2 Diabetes (plosone.org)
  2. Gene Expression and Thiopurine Metabolite Profiling in Inflammatory Bowel Disease – Novel Clues to Drug Targets and Disease Mechanisms? (plosone.org)
  3. Activation of the Jasmonic Acid Plant Defence Pathway Alters the Composition of Rhizosphere

Nutrients 2014, 6, 3245-3258; http://dx.doi.org:/10.3390/nu6083245

Omega-3 (ω-3) fatty acids are one of the two main families of long chain polyunsaturated fatty acids (PUFA). The main omega-3 fatty acids in the mammalian body are

  • α-linolenic acid (ALA), docosahexaenoic acid (DHA) and eicosapentaenoic acid (EPA).

Central nervous tissues of vertebrates are characterized by a high concentration of omega-3 fatty acids. Moreover, in the human brain,

  • DHA is considered as the main structural omega-3 fatty acid, which comprises about 40% of the PUFAs in total.

DHA deficiency may be the cause of many disorders such as depression, inability to concentrate, excessive mood swings, anxiety, cardiovascular disease, type 2 diabetes, dry skin and so on.

On the other hand,

  • zinc is the most abundant trace metal in the human brain.

There are many scientific studies linking zinc, especially

  • excess amounts of free zinc, to cellular death.

Neurodegenerative diseases, such as Alzheimer’s disease, are characterized by altered zinc metabolism. Both animal model studies and human cell culture studies have shown a possible link between

  • omega-3 fatty acids, zinc transporter levels and
  • free zinc availability at cellular levels.

Many other studies have also suggested a possible

  • omega-3 and zinc effect on neurodegeneration and cellular death.

Therefore, in this review, we will examine

  • the effect of omega-3 fatty acids on zinc transporters and
  • the importance of free zinc for human neuronal cells.

Moreover, we will evaluate the collective understanding of

  • mechanism(s) for the interaction of these elements in neuronal research and their
  • significance for the diagnosis and treatment of neurodegeneration.

Epidemiological studies have linked high intake of fish and shellfish as part of the daily diet to

  • reduction of the incidence and/or severity of Alzheimer’s disease (AD) and senile mental decline in

Omega-3 fatty acids are one of the two main families of a broader group of fatty acids referred to as polyunsaturated fatty acids (PUFAs). The other main family of PUFAs encompasses the omega-6 fatty acids. In general, PUFAs are essential in many biochemical events, especially in early post-natal development processes such as

  • cellular differentiation,
  • photoreceptor membrane biogenesis and
  • active synaptogenesis.

Despite the significance of these

two families, mammals cannot synthesize PUFA de novo, so they must be ingested from dietary sources. Though belonging to the same family, both

  • omega-3 and omega-6 fatty acids are metabolically and functionally distinct and have
  • opposing physiological effects. In the human body,
  • high concentrations of omega-6 fatty acids are known to increase the formation of prostaglandins and
  • thereby increase inflammatory processes [10].

the reverse process can be seen with increased omega-3 fatty acids in the body.

Many other factors, such as

  1. thromboxane A2 (TXA2),
  2. leukotriene
  3. B4 (LTB4),
  4. IL-1,
  5. IL-6,
  6. tumor necrosis factor (TNF) and
  7. C-reactive protein,

which are implicated in various health conditions, have been shown to be increased with high omega-6 fatty acids but decreased with omega-3 fatty acids in the human body.

Dietary fatty acids have been identified as protective factors in coronary heart disease, and PUFA levels are known to play a critical role in

  • immune responses,
  • gene expression and
  • intercellular communications.

omega-3 fatty acids are known to be vital in

  • the prevention of fatal ventricular arrhythmias, and
  • are also known to reduce thrombus formation propensity by decreasing platelet aggregation, blood viscosity and fibrinogen levels

.Since omega-3 fatty acids are prevalent in the nervous system, it seems logical that a deficiency may result in neuronal problems, and this is indeed what has been identified and reported.

The main

In another study conducted with individuals of 65 years of age or older (n = 6158), it was found that

  • only high fish consumption, but
  • not dietary omega-3 acid intake,
  • had a protective effect on cognitive decline

In 2005, based on a meta-analysis of the available epidemiology and preclinical studies, clinical trials were conducted to assess the effects of omega-3 fatty acids on cognitive protection. Four of the trials completed have shown

a protective effect of omega-3 fatty acids only among those with mild cognitive impairment conditions.

A  trial of subjects with mild memory complaints demonstrated

  • an improvement with 900 mg of DHA.

We review key findings on

  • the effect of the omega-3 fatty acid DHA on zinc transporters and the
  • importance of free zinc to human neuronal cells.

DHA is the most abundant fatty acid in neural membranes, imparting appropriate

  • fluidity and other properties,

and is thus considered as the most important fatty acid in neuronal studies. DHA is well conserved throughout the mammalian species despite their dietary differences. It is mainly concentrated

  • in membrane phospholipids at synapses and
  • in retinal photoreceptors and
  • also in the testis and sperm.

In adult rats’ brain, DHA comprises approximately

  • 17% of the total fatty acid weight, and
  • in the retina it is as high as 33%.

DHA is believed to have played a major role in the evolution of the modern human –

  • in particular the well-developed brain.

Premature babies fed on DHA-rich formula show improvements in vocabulary and motor performance.

Analysis of human cadaver brains have shown that

  • people with AD have less DHA in their frontal lobe
  • and hippocampus compared with unaffected individuals

Furthermore, studies in mice have increased support for the

  • protective role of omega-3 fatty acids.

Mice administrated with a dietary intake of DHA showed

  • an increase in DHA levels in the hippocampus.

Errors in memory were decreased in these mice and they demonstrated

  • reduced peroxide and free radical levels,
  • suggesting a role in antioxidant defense.

Another study conducted with a Tg2576 mouse model of AD demonstrated that dietary

  • DHA supplementation had a protective effect against reduction in
  • drebrin (actin associated protein), elevated oxidation, and to some extent, apoptosis via
  • decreased caspase activity.


Zinc

Zinc is a trace element, which is indispensable for life, and it is the second most abundant trace element in the body. It is known to be related to

  • growth,
  • development,
  • differentiation,
  • immune response,
  • receptor activity,
  • DNA synthesis,
  • gene expression,
  • neuro-transmission,
  • enzymatic catalysis,
  • hormonal storage and release,
  • tissue repair,
  • memory,
  • the visual process

and many other cellular functions. Moreover, the indispensability of zinc to the body can be discussed in many other aspects,  as

  • a component of over 300 different enzymes
  • an integral component of a metallothioneins
  • a gene regulatory protein.

Approximately 3% of all proteins contain

  • zinc binding motifs .

The broad biological functionality of zinc is thought to be due to its stable chemical and physical properties. Zinc is considered to have three different functions in enzymes;

  1. catalytic,
  2. coactive and

Indeed, it is the only metal found in all six different subclasses

of enzymes. The essential nature of zinc to the human body can be clearly displayed by studying the wide range of pathological effects of zinc deficiency. Anorexia, embryonic and post-natal growth retardation, alopecia, skin lesions, difficulties in wound healing, increased hemorrhage tendency and severe reproductive abnormalities, emotional instability, irritability and depression are just some of the detrimental effects of zinc deficiency.

Proper development and function of the central nervous system (CNS) is highly dependent on zinc levels. In the mammalian organs, zinc is mainly concentrated in the brain at around 150 μm. However, free zinc in the mammalian brain is calculated to be around 10 to 20 nm and the rest exists in either protein-, enzyme- or nucleotide bound form. The brain and zinc relationship is thought to be mediated

  • through glutamate receptors, and
  • it inhibits excitatory and inhibitory receptors.

Vesicular localization of zinc in pre-synaptic terminals is a characteristic feature of brain-localized zinc, and

  • its release is dependent on neural activity.

Retardation of the growth and development of CNS tissues have been linked to low zinc levels. Peripheral neuropathy, spina bifida, hydrocephalus, anencephalus, epilepsy and Pick’s disease have been linked to zinc deficiency. However, the body cannot tolerate excessive amounts of zinc.

The relationship between zinc and neurodegeneration, specifically AD, has been interpreted in several ways. One study has proposed that β-amyloid has a greater propensity to

  • form insoluble amyloid in the presence of
  • high physiological levels of zinc.

Insoluble amyloid is thought to

  • aggregate to form plaques,

which is a main pathological feature of AD. Further studies have shown that

  • chelation of zinc ions can deform and disaggregate plaques.

In AD, the most prominent injuries are found in

  • hippocampal pyramidal neurons, acetylcholine-containing neurons in the basal forebrain, and in
  • somatostatin-containing neurons in the forebrain.

All of these neurons are known to favor

  • rapid and direct entry of zinc in high concentration
  • leaving neurons frequently exposed to high dosages of zinc.

This is thought to promote neuronal cell damage through oxidative stress and mitochondrial dysfunction. Excessive levels of zinc are also capable of

  • inhibiting Ca2+ and Na+ voltage gated channels
  • and up-regulating the cellular levels of reactive oxygen species (ROS).

High levels of zinc are found in Alzheimer’s brains indicating a possible zinc related neurodegeneration. A study conducted with mouse neuronal cells has shown that even a 24-h exposure to high levels of zinc (40 μm) is sufficient to degenerate cells.

If the human diet is deficient in zinc, the body

  • efficiently conserves zinc at the tissue level by compensating other cellular mechanisms

to delay the dietary deficiency effects of zinc. These include reduction of cellular growth rate and zinc excretion levels, and

  • redistribution of available zinc to more zinc dependent cells or organs.

A novel method of measuring metallothionein (MT) levels was introduced as a biomarker for the

  • assessment of the zinc status of individuals and populations.

In humans, erythrocyte metallothionein (E-MT) levels may be considered as an indicator of zinc depletion and repletion, as E-MT levels are sensitive to dietary zinc intake. It should be noted here that MT plays an important role in zinc homeostasis by acting

  • as a target for zinc ion binding and thus
  • assisting in the trafficking of zinc ions through the cell,
  • which may be similar to that of zinc transporters

Zinc Transporters

Deficient or excess amounts of zinc in the body can be catastrophic to the integrity of cellular biochemical and biological systems. The gastrointestinal system controls the absorption, excretion and the distribution of zinc, although the hydrophilic and high-charge molecular characteristics of zinc are not favorable for passive diffusion across the cell membranes. Zinc movement is known to occur

  • via intermembrane proteins and zinc transporter (ZnT) proteins

These transporters are mainly categorized under two metal transporter families; Zip (ZRT, IRT like proteins) and CDF/ZnT (Cation Diffusion Facilitator), also known as SLC (Solute Linked Carrier) gene families: Zip (SLC-39) and ZnT (SLC-30). More than 20 zinc transporters have been identified and characterized over the last two decades (14 Zips and 8 ZnTs).

Members of the SLC39 family have been identified as the putative facilitators of zinc influx into the cytosol, either from the extracellular environment or from intracellular compartments (Figure 1).

The identification of this transporter family was a result of gene sequencing of known Zip1 protein transporters in plants, yeast and human cells. In contrast to the SLC39 family, the SLC30 family facilitates the opposite process, namely zinc efflux from the cytosol to the extracellular environment or into luminal compartments such as secretory granules, endosomes and synaptic vesicles; thus decreasing intracellular zinc availability (Figure 1). ZnT3 is the most important in the brain where

  • it is responsible for the transport of zinc into the synaptic vesicles of
  • glutamatergic neurons in the hippocampus and neocortex,

Figure 1: Subcellular localization and direction of transport of the zinc transporter families, ZnT and ZIP. Arrows show the direction of zinc mobilization for the ZnT (green) and ZIP (red) proteins. A net gain in cytosolic zinc is achieved by the transportation of zinc from the extracellular region and organelles such as the endoplasmic reticulum (ER) and Golgi apparatus by the ZIP transporters. Cytosolic zinc is mobilized into early secretory compartments such as the ER and Golgi apparatus by the ZnT transporters. Figures were produced using Servier Medical Art, http://www.servier.com/.   http://www.hindawi.com/journals/jnme/2012/173712.fig.001.jpg

Figure 2: Early zinc signaling (EZS) and late zinc signaling (LZS). EZS involves transcription-independent mechanisms where an extracellular stimulus directly induces an increase in zinc levels within several minutes by releasing zinc from intracellular stores (e.g., endoplasmic reticulum). LSZ is induced several hours after an external stimulus and is dependent on transcriptional changes in zinc transporter expression. Components of this figure were produced using Servier Medical Art, http://www.servier.com/ and adapted from Fukada et al. [30].

omega-3 fatty acids in the mammalian body are

  1. α-linolenic acid (ALA),
  2. docosahexenoic acid (DHA) and
  3. eicosapentaenoic acid (EPA).

In general, seafood is rich in omega-3 fatty acids, more specifically DHA and EPA (Table 1). Thus far, there are nine separate epidemiological studies that suggest a possible link between

  • increased fish consumption and reduced risk of AD
  • and eight out of ten studies have reported a link between higher blood omega-3 levels

DHA and Zinc Homeostasis

Many studies have identified possible associations between DHA levels, zinc homeostasis, neuroprotection and neurodegeneration. Dietary DHA deficiency resulted in

  • increased zinc levels in the hippocampus and
  • elevated expression of the putative zinc transporter, ZnT3, in the rat brain.

Altered zinc metabolism in neuronal cells has been linked to neurodegenerative conditions such as AD. A study conducted with transgenic mice has shown a significant link between ZnT3 transporter levels and cerebral amyloid plaque pathology. When the ZnT3 transporter was silenced in transgenic mice expressing cerebral amyloid plaque pathology,

  • a significant reduction in plaque load
  • and the presence of insoluble amyloid were observed.

In addition to the decrease in plaque load, ZnT3 silenced mice also exhibited a significant

  • reduction in free zinc availability in the hippocampus
  • and cerebral cortex.

Collectively, the findings from this study are very interesting and indicate a clear connection between

  • zinc availability and amyloid plaque formation,

thus indicating a possible link to AD.

DHA supplementation has also been reported to limit the following:

  1. amyloid presence,
  2. synaptic marker loss,
  3. hyper-phosphorylation of Tau,
  4. oxidative damage and
  5. cognitive deficits in transgenic mouse model of AD.

In addition, studies by Stoltenberg, Flinn and colleagues report on the modulation of zinc and the effect in transgenic mouse models of AD. Given that all of these are classic pathological features of AD, and considering the limiting nature of DHA in these processes, it can be argued that DHA is a key candidate in preventing or even curing this debilitating disease.

In order to better understand the possible links and pathways of zinc and DHA with neurodegeneration, we designed a study that incorporates all three of these aspects, to study their effects at the cellular level. In this study, we were able to demonstrate a possible link between omega-3 fatty acid (DHA) concentration, zinc availability and zinc transporter expression levels in cultured human neuronal cells.

When treated with DHA over 48 h, ZnT3 levels were markedly reduced in the human neuroblastoma M17 cell line. Moreover, in the same study, we were able to propose a possible

  • neuroprotective mechanism of DHA,

which we believe is exerted through

  • a reduction in cellular zinc levels (through altering zinc transporter expression levels)
  • that in turn inhibits apoptosis.

DHA supplemented M17 cells also showed a marked depletion of zinc uptake (up to 30%), and

  • free zinc levels in the cytosol were significantly low compared to the control

This reduction in free zinc availability was specific to DHA; cells treated with EPA had no significant change in free zinc levels (unpublished data). Moreover, DHA-repleted cells had

  • low levels of active caspase-3 and
  • high Bcl-2 levels compared to the control treatment.

These findings are consistent with previous published data and further strengthen the possible

  • correlation between zinc, DHA and neurodegeneration.

On the other hand, recent studies using ZnT3 knockout (ZnT3KO) mice have shown the importance of

  • ZnT3 in memory and AD pathology.

For example, Sindreu and colleagues have used ZnT3KO mice to establish the important role of

  • ZnT3 in zinc homeostasis that modulates presynaptic MAPK signaling
  • required for hippocampus-dependent memory

Results from these studies indicate a possible zinc-transporter-expression-level-dependent mechanism for DHA neuroprotection.

Read Full Post »

“Gene Editing at CRISPR Speed”: Services and Tools

Reporter: Aviva Lev-Ari, PhD, RN


SOURCE

 http://www.appliedstemcell.com/services/cell-line-models/cell-line-modification/

CRISPR Cell Line Knock-Out, Knock-in, Point Mutation

  • Overview
  • Technical Details
  • Literature
  • Ordering

CRISPR Service / Cas9

The CRISPR/Cas9 system uses the Cas9 nuclease to facilitate RNA-guided site-specific DNA cleavage. The system consists of two components:

(1) Mammalian codon-optimized version of the Cas9 protein carrying a nuclear localization signal to ensure nuclear compartmentalization in mammalian cells

(2) Guide RNAs (gRNAs) to direct Cas9 protein to sequence-specifically cleave the targeted DNA

The advantage of CRISPR/Cas9 over ZFNs or TALENs is its scalability and multiplexibility in that multiple sites within the mammalian genome can be simultaneously modified, providing a robust, high-throughput approach for gene editing in mammalian cells.

CRISPR Service (Point mutation, Deletion, Small DNA insertion)

crispr

We are experts in CRISPR Service! Applied StemCell is in Nature Biotechnology as one of the select companies for CRISPR-Cas9 tools! Monya Baker, “Gene Editing at CRISPR Speed,” Nature Biotechnology, 32: 309-312, April 2014.

Since Applied Stem Cell started out as a company focused on induced pluripotent stem cells (iPSCs), we have excellent capabilities of correcting mutations in disease-model iPSCs using CRISPR/ Cas9.

Other Related articles published in this Open Access Online Scientific Journal, include the following:

Licensing CRISPR-Cas9 Technology from Broad Institute: Clontech, Horizon Discovery, Sage Labs

http://pharmaceuticalintelligence.com/2014/10/28/licenses-crispr-cas9-technology-from-broad-institute-clontech-horizon-discovery-sage-labs/

CRISPR-Cas9 Foundational Technology originated at UC, Berkeley & UCSF, Broad Institute is developing Biotech Applications — Intellectual Property emerging as Legal Potential Dispute


http://pharmaceuticalintelligence.com/2014/06/18/crispr-cas9-foundational-technology-originated-at-uc-berkeley-ucsf-broad-institute-is-developing-biotech-applications-intellectual-property-emerging-as-legal-potential-dispute/

Read Full Post »

« Newer Posts - Older Posts »