Healthcare analytics, AI solutions for biological big data, providing an AI platform for the biotech, life sciences, medical and pharmaceutical industries, as well as for related technological approaches, i.e., curation and text analysis with machine learning and other activities related to AI applications to these industries.
Nicole Kidman’s new role shines a light on genetics
Nicole Kidman has taken to the London stage to play Rosalind Franklin, one of the most important yet overshadowed scientists of the 20th century. The impact of her work is still revolutionizing genetics work in modern pathology.
Photograph 51 relates Franklin’s contribution to the discovery of the double helix structure of DNA in the 1950s. The play depicts the sometimes confrontational working relationship between the talented Franklin and her laboratory partner, Maurice Wilkins.
The play’s name comes from the X-ray image of DNA that Franklin created. It was this image that led scientists James Watson and Francis Crick to determine the chemical structure of DNA, ushering in the age of modern genetics.
In 1962, the Nobel Prize in Physiology or Medicine was awarded to Watson, Crick and Wilkins, with Franklin notably overlooked. In 1958, Franklin died of cancer, never having been recognised for her work. Photograph 51 attempts to bring Franklin’s role to light.
Dr Melody Caramins is a genetic pathologist working in Sydney. She says modern medicine would look very different without the discovery.
“Genetic testing is widely used, particularly for screening; for example prenatal testing for Down Syndrome and newborn bloodspot testing for life-threatening conditions like Cystic Fibrosis.
Genetic testing can also suggest if a particular cancer drug is likely to be effective for an individual patient. Testing can also indicate an elevated risk of developing a hereditary cancer.”
Dr Caramins says that genetics is an exciting and rapidly developing area to work in as there are so many questions to be answered.
“I encourage anyone willing to work hard to consider pathology and genetics in particular. There is great variety in the work on offer, including lab work and consulting directly with patients.”
This burgeoning profession owes much to genetic pioneers like Rosalind Franklin.
Researchers have used computational modelling to shed light on precisely how charged gold nanoparticles influence the structure of DNA and RNA.
The work holds promise for developing applications that can store and transport genetic information, create custom scaffolds for bioelectronics and create new drug delivery technologies.
“In nature, meters of DNA are packed tightly into every living cell,” says Jessica Nash, a Ph.D. student at NC State and lead author of a paper on the work. “This is possible because the DNA is wrapped tightly around a positively charged protein called a histone. We’d like to be able to shape DNA using a similar approach that replaces the histone with a charged gold nanoparticle. So we used computational techniques to determine exactly how different charges influence the curvature of nucleic acids – DNA and RNA.”
In their model, the researchers manipulated the charge of the gold nanoparticles by adding or removing positively charged ligands – organic molecules attached to the surface of the nanoparticle. This allowed them to determine how the nucleic acid responded to each level of charge. An animation of a nanoparticle and ligands shaping a strand of DNA is available on the further information link below.
“This will let researchers know what to expect – how much charge they need in order to get the desired curvature in the nucleic acid,” says Yaroslava Yingling, an associate professor of materials science and engineering at NC State and corresponding author of the paper.
“We used ligands in the model, but there are other ways to manipulate the charge of the nanoparticles,” says Abhishek Singh, a postdoctoral researcher at NC State and co-author of the paper. “For example, if the nanoparticles and nucleic acid are in solution, you can change the charge by changing the pH of the solution.”
The work is also significant because it highlights how far computational research has come in materials science.
“Our large-scale models account for every atom involved in the process,” says Nan Li, a Ph.D. student at NC State and co-author of the paper. “This is an example of how we can use advanced computational hardware, such as the GPUs – or graphics processing units – developed for use in videogames, to conduct state-of-the-art scientific simulations.”
The research team is now building on these findings to design new nanoparticles with different shapes and surface chemistries to get even more control over the shape and structure of nucleic acids.
“No one has come close to matching nature’s efficiency when it comes to wrapping and unwrapping nucleic acids,” Yingling says. “We’re trying to advance our understanding of precisely how that works.”
Researchers Detail How to Control Shape, Structure of DNA and RNA
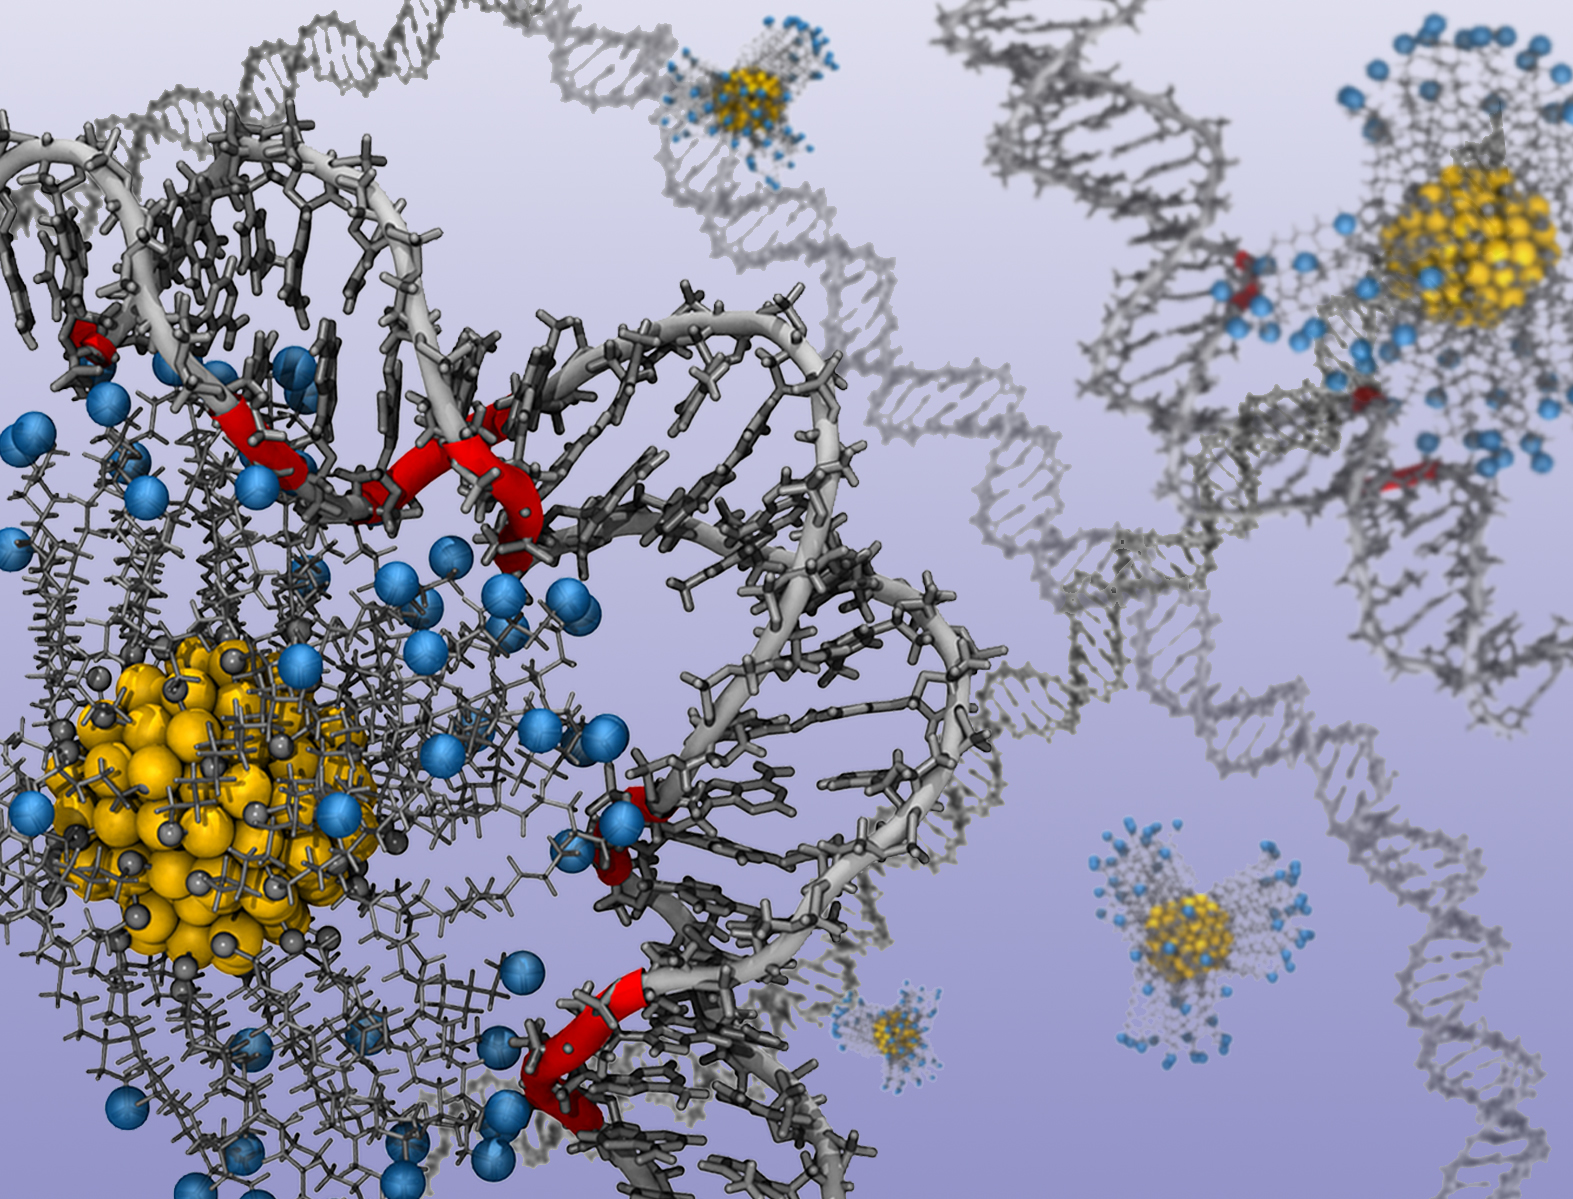
Researchers used a computer model of gold nanoparticles and ligands to determine how nucleic acids respond to various charges. In technical language, the image shows the binding of alkyl ligand functionalized gold nanoparticles with protonated amine end groups (the blue spheres) to double stranded DNA. Image credit: Jessica Nash. Click to enlarge.
Researchers at North Carolina State University have used computational modelling to shed light on precisely how charged gold nanoparticles influence the structure of DNA and RNA – which may lead to new techniques for manipulating these genetic materials.
The work holds promise for developing applications that can store and transport genetic information, create custom scaffolds for bioelectronics and create new drug delivery technologies.
“In nature, meters of DNA are packed tightly into every living cell,” says Jessica Nash, a Ph.D. student at NC State and lead author of a paper on the work. “This is possible because the DNA is wrapped tightly around a positively charged protein called a histone. We’d like to be able to shape DNA using a similar approach that replaces the histone with a charged gold nanoparticle. So we used computational techniques to determine exactly how different charges influence the curvature of nucleic acids – DNA and RNA.”
In their model, the researchers manipulated the charge of the gold nanoparticles by adding or removing positively charged ligands – organic molecules attached to the surface of the nanoparticle. This allowed them to determine how the nucleic acid responded to each level of charge. An animation of a nanoparticle and ligands shaping a strand of DNA is available at https://www.youtube.com/watch?v=kNpvPyc2bmc&feature=youtu.be.
Explains what is meant by specific and non-specific binding and how they are measured in a radioligand binding assay.
“This will let researchers know what to expect – how much charge they need in order to get the desired curvature in the nucleic acid,” says Yaroslava Yingling, an associate professor of materials science and engineering at NC State and corresponding author of the paper.
“We used ligands in the model, but there are other ways to manipulate the charge of the nanoparticles,” says Abhishek Singh, a postdoctoral researcher at NC State and co-author of the paper. “For example, if the nanoparticles and nucleic acid are in solution, you can change the charge by changing the pH of the solution.”
The work is also significant because it highlights how far computational research has come in materials science.
“Our large-scale models account for every atom involved in the process,” says Nan Li, a Ph.D. student at NC State and co-author of the paper. “This is an example of how we can use advanced computational hardware, such as the GPUs – or graphics processing units – developed for use in videogames, to conduct state-of-the-art scientific simulations.”
Cells package their DNA not only to protect it, but also to regulate which genes are accessed and when. Cellular genes are therefore similar to valuable files stored in a file cabinet — but in this case, the cabinet’s drawers are constantly opening and closing; various files are continually being located, pulled, and copied; and the original files are always returned to the correct location.
Of course, just as file drawers help conserve space in an office, DNA packaging helps conserve space in cells. Packaging is the reason why the approximately two meters of human DNA can fit into a cell that is only a few micrometers wide. But how, exactly, is DNA compacted to fit within eukaryotic and prokaryotic cells? And what mechanisms do cells use to access this highly compacted genetic material?
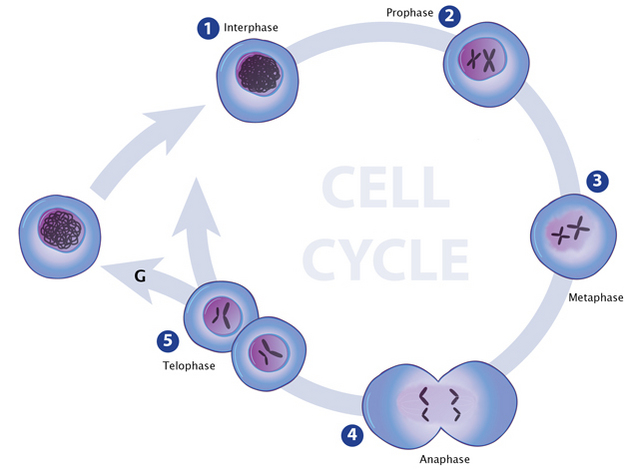
In the first stage of mitosis, an illustration of chromatin looks like a loosely packed clump of thread contained inside a cell’s nucleus (early interphase). In late interphase, the chromatin appears tightly packed into two chromosome-like structures within the nucleus. The structures look like two hockey sticks. In the 2ndstage of mitosis (prophase), true chromosomes have formed inside the nucleus: each chromosome pair looks like two hockey sticks connected to one another where they bend to form an “X” shape. There are two pairs of chromosomes, so the nucleus contains two “X” shaped structures. In stage 3 (metaphase), each chromosome has separated from its partner in each pair, so that four individual chromosomes are visible inside the nucleus. In stage 4 (anaphase), two separate cells are forming, and each contains its own developing nucleus. Inside each nucleus are two chromosomes. In stage 5 (telophase), two individual cells are shown. Inside each cell’s nucleus are two chromosomes. An arrow connects each stage to the one succeeding it. Between telophase and interphase an arrow completes the cycle.
Eukaryotes typically possess multiple pairs of linear chromosomes, all of which are contained in the cellular nucleus, and these chromosomes have characteristic and changeable forms. During cell division, for example, they become more tightly packed, and their condensed form can be visualized with a light microscope. This condensed form is approximately 10,000 times shorter than the linear DNA strand would be if it was devoid of proteins and pulled taut. However, when eukaryotic cells are not dividing — a stage called interphase — the chromatin within their chromosomes is less tightly packed. This looser configuration is important because it permits transcription to take place (Figure 1, Figure 2).
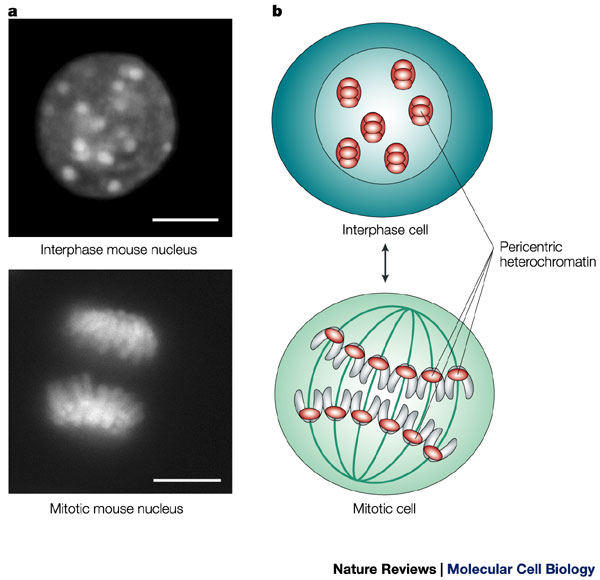
During interphase, the cell’s DNA is not condensed and is loosely distributed. A stain for heterochromatin (which indicates the position of chromosomes) shows this broad distribution of chromatin in a mouse cell (upper left). The same stain also shows the organized, aligned structure of the chromosomes during mitosis. Scale bars = 10 microns.
Two photomicrographs, which are labeled “a,” show fluorescently labeled heterochromatin in a mouse nucleus during interphase (top) and in a mouse cell during mitosis (bottom). In the interphase photomicrograph, the nucleus appears as a circle filled with dark grey, light grey, and white spots of different sizes. These spots are found scattered throughout the nucleus, because the chromosomes are not condensed. The brighter spots are regions where pericentric heterochromatin has clustered. Everything outside the nucleus appears black. In the photomicrograph of the mitotic cell, the heterochromatin staining is not spotty, and the chromosomes are condensed and distinct. The chromosomes are being pulled to opposite sides of the cell, so the cell is in anaphase. The chromosomes resemble fingers reaching towards the cell’s center from either end. In the mitotic cell, the staining is more even than the interphase cell, but the portions of the chromosomes that are being pulled to the sides of the cell (the pericentric regions) stain brighter than the ends of the chromosomes, which lie toward the center of the cell. The background is black. In the illustrations, which are labeled “b,” an interphase cell is shown at the top, and a mitotic cell is shown at the bottom. The interphase cell is depicted as a blue circle containing a large nucleus, which is shown as a light blue circle. There are six heterochromatin aggregates distributed throughout the nucleus. Each aggregate is made up of a vertical, orange, oval structure that contains three horizontal, smaller, orange oval structures. An arrow indicates that these aggregates are pericentric heterochromatin. The illustration of the mitotic cell has a mitotic spindle, which is depicted as dark green lines radiating from two poles. Twelve chromosomes are being segregated into two groups; six chromosomes are being pulled to each pole of the spindle. Each chromosome looks like two light grey ovals oriented in a V-shaped pattern and attached to an orange oval in the middle. The orange oval is the pericentric heterochromatin, and this is the part of the chromosome that is being pulled toward the spindle poles first.
Eukaryotic chromosomes consist of repeated units of chromatin called nucleosomes, which were discovered by chemically digesting cellular nuclei and stripping away as much of the outer protein packaging from the DNA as possible. The chromatin that resisted digestion had the appearance of “beads on a string” in electron micrographs — with the “beads” being nucleosomes positioned at intervals along the length of the DNA molecule (Figure 3).Nucleosomes are made up of double-stranded DNA that has complexed with small proteins called histones. The core particle of each nucleosome consists of eight histone molecules, two each of four different histone types: H2A, H2B, H3, and H4. The structure of histones has been strongly conserved across evolution, suggesting that their DNA packaging function is crucially important to all eukaryotic cells (Figure 4).
Histones carry positive charges and bind negatively charged DNA in a specific conformation. In particular, a segment of the DNA double helix wraps around each histone core particle a little less than twice. The exact length of the DNA segment associated with each histone core varies from species to species, but most such segments are approximately 150 base pairs in length. Furthermore, each histone molecule within the core particle has one end that sticks out from the particle. These ends are called N-terminal tails, and they play an important role in higher-order chromatin structure and gene expression.
P. J. Horn and C. L. Peterson, Science297, 1824-1827 (2002)
Learn how the cell packs six feet of DNA into a nucleus 5 micrometers in length, through the amazing structure known as chromatin.
Begin to decipher the “histone code” and the mechanisms, beyond transcription, by which the expression of genes is regulated.
Explore how the modENCODE project has expanded our understanding of how chromatin states affect gene expression, in a Vignette.
Compared to prokaryotes, eukaryotes have enormous genomes. For example, inside each of your cells is a genome containing more than 3 billion base pairs. Lined up, that’s more thansix feet (~2 meters) of DNA.
Fitting that much DNA in a cell nucleus (average width: 5 micrometers) is like fitting a string the length of the Empire State building underneath your fingernail! How do our cells store these extremely long, information-packed molecules?
Chromatin — found only in the cells of eukaryotic organisms — is the complex of DNA and a specialized suite of of proteins that are organized in beads, wrapped with DNA, and the string folded, at multiple scales, to allow the DNA to be packaged into the neat nuclear structures called chromosomes that we see through the microscope. But chromatin is about more than just solving a storage problem. In the past few decades, scientists have come to increasingly appreciate the role of chromatin, and of modifications to the histone proteins central to chromatin structure, in regulating gene expression. The packaging is even as a mechanism for heritable changes in phenotype that don’t involve actual changes to the genome sequence. The study of such mechanisms makes up an exciting, and rapidly growing, branch of biology called epigenetics.
In this section of the site, we’ll take a brief look at chromatin as a regulator of gene expression in some ways complementary to transcription factors. And we’ll see how the techniques used in the modENCODE project have helped to broaden our understanding of the system.
Strings, Beads, and Nucleosomes
Image Source: Reprinted by perimisson from Macmillan Publishers Ltd:Nature421, 448-453 (23 January 2003), copyright 2003.
To fit our genomes into a tiny cell, the DNA of each chromosome is coiled, compacted, and coiled up some more. At the primary level of compaction, the DNA is wrapped around a group of special proteins called histones. When DNA wraps around a group of histones, it forms a nucleosome. You can think of the system as DNA “thread” wound around a protein “spool”. The first scientists who saw nucleosomes with an electron microscope remarked that they looked like “beads on a string,” though we now know that nucleosomes are more like “string wrapped around beads.”
Each nucleosome is made of four different histones — H2A, H2B, H3, and H4. Two molecules of each histone come together to form an octamer. (Note the prefix “octa” — an octamer is just a complex made of eight proteins.) The DNA string wraps around the histone octamer bead to create the nucleosome.
So the process of fitting all of that DNA into a tiny cell nucleus begins with wrapping the DNA around histones into a nucleosome. But it doesn’t end there — the chain of nucleosomes coils around a central axis to get even more compact. As depicted in the diagram at the right, the packaging actually takes place at a number of scales:
The DNA wraps around histone octamers to form a “beads on string” fiber approximately 10nanometers (nm) in width.
The beads-on-string structure in turn coils into a 30-nm-diameter fiber that packs the nucleosomes more closely together.
During cellular interphase — the period in which the cell is not actively dividing — “scaffold” proteins fold the 30-nm fibers into a somewhat more compact structure to fit within the nucleus.
During cell division, the chromatin, through the action of additional scaffold proteins, is radically packed and condensed to form the metaphase chromosome that divides and passes the DNA carrying the genetic code to the two daughter cells.
You might be starting to see a problem here. You already know that the genome contains important information — the instructions for making all of the proteins of your cells. If the DNA is all twisted up on itself, how can the cell access that information so it can make proteins?
At the end of the holiday season, you may store your holiday decorations away in a closet or garage. You don’t need them immediately at hand in the house, since you don’t use them regularly — but you know where they are in storage, and can find them when you need them.
Something very similar is happening in your cells. Cells have ways of opening up the DNA to be read — or of hiding it so that it isn’t read by mistake. And different types of cells have different sets of genes that are accessible for transcription, and other sets of genes that they have closed up and stored away. That’s why your nerve cells are so different from your muscle cells, even though both types of cells contain exactly the same genome with exactly the same DNA code. And, just as you can push or slide boxes out of the way in your garage or closet to get at the holiday decorations when you need them, the cell can remove or slide nucleosomes so that RNA polymerase can get to a gene it needs to transcribe.
One way that cells can open or close a certain gene is by modifying the histones around which the DNA is wrapped. The ends of histone proteins form so-called “tails”, and certain chemical groups can attach to those tails, changing their chemical properties and affecting how the tails interact with the DNA. Sometimes, chemical modification of histones makes a whole region of the genome easier to access –- sort of like putting the boxes you use most often on a lower shelf, or at the front of the closet. Other times, these chemical markers are labels that can be read by other proteins, as you might label a box with a marker to make it easier to find what you need.
Image Source: Reprinted by perimisson from Macmillan Publishers Ltd: Nature Reviews Neuroscience8, 355-367 (May 2007), copyright 2007.
Examples of chemical modifications to histones are methylation, acetylation, orphosphorylation (the names just refer to the types of chemical group that is attached – methyl, acetyl, phosphate, etc.). These modifications can be added and removed by special enzymes, so that each type of cell can organize its genome to make it easier to synthesize the proteins that cell type uses most often. These enzymes can also change the modifications as the organism develops, or in response to the environment — for example, in response to a hormone signal or temperature change.
These histone modifications can directly affect how tightly DNA binds to histones. In unmodified histones, the positively charged (basic) histone tails bind very tightly to the negatively charged (acidic) DNA. Some modifications, like the acetylation of a lysine, help neutralize the positive charge of the histone tails. This means the tails bind the DNA less tightly, and the chromatin is more open. Acetylation is thus a histone modification that is associated with genes that are very active, and expressed at high levels. (Check out an animation that illustrates how acetylation weakens the binding between DNA and the histone octamer, making it easier to disassemble the nucleosome.)
As already noted, other histone modifications work differently — instead of directly affecting how tightly the tails bind to DNA, they are instead interpreted by other proteins. These modifications are believed to be part of a histone code, which is “read” by proteins that respond by making the chromatin either more open or more compact, depending on the specific histone modification.
Vignette: modENCODE, the Fly, and Chromatin States
The modENCODE scientists worked hard to understand how chromatin functions in model organisms like flies and worms. This has uncovered a lot of important and useful information about how chromatin is structured in general, which can be applied to other organisms, including humans. It’s time to drill down into some of this work. Click on the image to the right to explore what detailed work in the fly has taught us about chromatin.
Why would modifications like acetylation, that make histones bind to DNA less tightly, affect how active a gene is?
Imagine a gene that encodes a protein important for developing the axons of neurons. There are histones binding your DNA coding for this gene in every cell. Do you think these histones are more likely to be acetylated in your skin cells, brain cells, or the cells of your immune system?
What effect do you think histone deacetylases have on gene expression, in general?
Why would we study chromatin in flies and worms? Can you think of living organisms that might not be helpful for studying chromatin structure?
The ability to sequence a person’s entire genome has led many researchers to hunt for the genetic causes of certain diseases. But without a larger set of genomes to compare mutations against, putting these variations into context is difficult. An international group of researchers has banked the full exomes of 60,706 individuals in a database called the Exome Aggregation Consortium (ExAC). The team’s analaysis, posted last month (October 30) on the preprint server bioRxiv, was presented at the Genome Science 2015 conference in Birmingham, U.K. (September 7).
Led by Daniel MacArthur from the Broad Institute of MIT and Harvard, the research team collected exomes from labs around the world for its dataset. “The resulting catalogue of human genetic diversity has unprecedented resolution,” the authors wrote in their preprint. Many of the variants observed in the dataset occurred only once.
“This is one of the most useful resources ever created for medical testing for genetic disorders,” Heidi Rehm, a clinical lab director at Harvard Medical School, told Science News.
Among other things, the team found 3,230 genes that are highly conserved across exomes, indicating likely involvement in critical cellular functions. Of these, 2,557 are not associated with diseases. The authors hypothesized that these genes, if mutated, either lead to embryonic death—before a problem can be diagnosed—or cause rare diseases that have not yet been genetically characterized.
“We should soon be able to say, with high precision: If you have a mutation at this site, it will kill you. And we’ll be able to say that without ever seeing a person with that mutation,” MacArthur said during his Genome Science talk, according to The Atlantic.
This is not the complete set of essential genes in the human body, David Goldstein, a geneticist at Columbia University in New York City, pointed out to Nature. Only by studying more exomes will researchers be able to refine that number, he noted.
Analysis of protein-coding genetic variation in 60,706 humans
Exome Aggregation Consortium, MonkolLek, KonradKarczewski, EricMinikel, KaitlinSamocha, et al.
Large-scale reference data sets of human genetic variation are critical for the medical and functional interpretation of DNA sequence changes. Here we describe the aggregation and analysis of high-quality exome (protein-coding region) sequence data for 60,706 individuals of diverse ethnicities. The resulting catalogue of human genetic diversity has unprecedented resolution, with an average of one variant every eight bases of coding sequence and the presence of widespread mutational recurrence. The deep catalogue of variation provided by the Exome Aggregation Consortium (ExAC) can be used to calculate objective metrics of pathogenicity for sequence variants, and to identify genes subject to strong selection against various classes of mutation; we identify 3,230 genes with near-complete depletion of truncating variants, 79% of which have no currently established human disease phenotype. Finally, we show that these data can be used for the efficient filtering of candidate disease-causing variants, and for the discovery of human knockout variants in protein-coding genes.
Over the last five years, the widespread availability of high-throughput DNA sequencing technologies has permitted the sequencing of the whole genomes or exomes (the 18 protein-coding regions of genomes) of over half a million humans. In theory, these data represent a powerful source of information about the global patterns of human genetic variation, but in practice, are difficult to access for practical, logistical, and ethical reasons; in addition, the inconsistent processing complicates variant-calling pipelines used by different groups. Current publicly available datasets of human DNA sequence variation contain only a small fraction of all sequenced samples: the Exome Variant Server, created as part of the NHLBI Exome Sequencing Project (ESP)1, contains frequency information spanning 6,503 exomes; and the 1000 Genomes (1000G) Project, which includes individual-level genotype data from whole-genome and exome sequence data for 2,504 individuals2.
Databases of genetic variation are important for our understanding of human population history and biology1–5, but also provide critical resources for the clinical interpretation of variants observed in patients suffering from rare Mendelian diseases6,7. The filtering of candidate variants by frequency in unselected individuals is a key step in any pipeline for the discovery of causal variants in Mendelian disease patients, and the efficacy of such filtering depends on both the size and the ancestral diversity of the available reference data.
Here, we describe the joint variant calling and analysis of high-quality variant calls across 60,706 human exomes, assembled by the Exome Aggregation Consortium (ExAC; exac.broadinstitute.org). This call set exceeds previously available exome-wide variant databases by nearly an order of magnitude, providing unprecedented resolution for the analysis of very low-frequency genetic variants. We demonstrate the application of this data set to the analysis of patterns of genetic variation including the discovery of widespread mutational recurrence, the inference of gene-level constraint against 10 truncating variation, the clinical interpretation of variation in Mendelian disease genes, and the discovery of human “knockout” variants in protein-coding genes.
…..
Deleterious variants are expected to have lower allele frequencies than neutral ones, due to negative selection. This theoretical property has been demonstrated previously in human population sequencing data18,19 and here (Figure 1d, Figure 1e). This allows inference of the degree of natural selection against specific functional classes of variation: however, mutational recurrence as described above indicates that allele frequencies observed in ExAC-scale samples are also skewed by mutation rate, with 10 more mutable sites less likely to be singletons (Figure 2c and Extended Data Figure 4d). Mutation rate is in turn non-uniformly distributed across functional classes – for instance, stop lost mutations can never occur at CpG dinucleotides (Extended Data Figure 4e). We corrected for mutation rates (Supplementary Information) by creating a mutability-adjusted proportion singleton (MAPS) metric. This metric reflects (as expected) strong selection against predicted PTVs, as well as missense variants predicted by conservation-based methods to be deleterious (Figure 2e).
The deep ascertainment of rare variation in ExAC also allows us to infer the extent of 19 selection against variant categories on a per-gene basis by examining the proportion of 20 variation that is missing compared to expectations under random mutation. Conceptually similar approaches have been applied to smaller exome datasets13,20 but have been underpowered, particularly for the analysis of depletion of PTVs. We compared the observed number of rare (MAF <0.1%) variants per gene to an expected number derived from a selection neutral, sequence-context based mutational model13. The model performs extremely well in predicting the number of synonymous variants, which should be under minimal purifying selection, per gene (r = 0.98; Extended Data Figure 5).
……
Critically, we note that LoF-intolerant genes include virtually all known severe haploinsufficient human disease genes (Figure 3b), but that 79% of LoF-intolerant genes have not yet been assigned a human disease phenotype despite the clear evidence for extreme selective constraint (Supplementary Information 4.11). These likely represent either undiscovered severe dominant disease genes, or genes in which loss of a single copy results in embryonic lethality.
The most highly constrained missense (top 25% missense Z scores) and PTV (pLI ≥0.9) genes show higher expression levels and broader tissue expression than the least constrained genes24 (Figure 3c). These most highly constrained genes are also depleted for eQTLs (p < 10-9 for missense and PTV; Figure 3d), yet are enriched within genome-wide significant trait-associated loci (χ2 p < 10-14, Figure 3e). Intuitively, genes intolerant of PTV variation are dosage sensitive: natural selection does not tolerate a 50% deficit in expression due to the loss of single allele. It is therefore unsurprising that these genes are also depleted of common genetic variants that have a large enough effect on expression to be detected as eQTLs with current limited sample sizes. However, smaller changes in the expression of these genes, through weaker eQTLs or functional variants, are more likely to contribute to medically relevant phenotypes. Therefore, highly constrained genes are dosage-sensitive, expressed more broadly across tissues (as expected for core cellular processes), and are enriched for medically relevant variation.
Finally, we investigated how these constraint metrics would stratify mutational classes according to their frequency spectrum, corrected for mutability as in the previous section (Figure 3f). The effect was most dramatic when considering stop-gained variants in the LoF-intolerant set of genes. For missense variants, the missense Z score offers information additional to Polyphen2 and CADD classifications, indicating that gene-level measures of constraint offer additional information to variant-level metrics in assessing potential pathogenicity.
We assessed the value of ExAC as a reference dataset for clinical sequencing approaches, which typically prioritize or filter potentially deleterious variants based on functional consequence and allele frequency6. To simulate a Mendelian variant analysis, we filtered variants in 100 ExAC exomes per continental population against ESP (the previous default reference data set for clinical analysis) or the remainder of ExAC, removing variants present at ≥0.1% allele frequency, a filter recommended for dominant 16 disease variant discovery6. Filtering on ExAC reduced the number of candidate protein-altering variants by 7-fold compared to ESP, and was most powerful when the highest 18 allele frequency in any one population (“popmax”) was used rather than average (“global”) allele frequency (Figure 4a). ESP is not well-powered to filter at 0.1% AF without removing many genuinely rare variants, as AF estimates based on low allele counts are both upward-biased and imprecise (Figure 4b). We thus expect that ExAC will provide a very substantial boost in the power and accuracy of variant filtering in Mendelian disease projects.
…….
The above curation efforts confirm the importance of allele frequency filtering in analysis of candidate disease variants. However, literature and database errors are prevalent even at lower allele frequencies: the average ExAC exome contains 0.89 reportedly Mendelian variants in well-characterized dominant disease genes at <1% popmax AF and 0.20 at <0.1% popmax AF. This inflation likely results from a combination of false reports of pathogenicity and incomplete penetrance, as we show for PRNP in the accompanying work [Minikel et al, submitted]. The abundance of rare functional variation in many disease genes in ExAC is a reminder that such variants should not be assumed to be causal or highly penetrant without careful segregation or case-control analysis28,7.
We investigated the distribution of PTVs, variants predicted to disrupt protein-coding genes through the introduction of a stop codon or frameshift or the disruption of an essential splice site; such variants are expected to be enriched for complete loss-of-function of the impacted genes. Naturally-occurring PTVs in humans provide a model for the functional impact of gene inactivation, and have been used to identify many genes in 6 which LoF causes severe disease31, as well as rare cases where LoF is protective against disease32.
Among the 7,404,909 HQ variants in ExAC, we found 179,774 high-confidence PTVs (as 10 defined in Supplementary Information Section 6), 121,309 of which are singletons. This 11 corresponds to an average of 85 heterozygous and 35 homozygous PTVs per individual (Figure 5a). The diverse nature of the cohort enables the discovery of substantial numbers of novel PTVs: out of 58,435 PTVs with an allele count greater than one, 33,625 occur in only one population. However, while PTVs as a category are extremely rare, the majority of the PTVs found in any one person are common, and each individual 16 has only ~2 singleton PTVs, of which 0.14 are found in PTV-constrained genes (pLI 17 >0.9). The site frequency spectrum of these variants across the populations represented in ExAC recapitulates known aspects of demographic models, including an increase in intermediate-frequency (1%-5%) PTVs in Finland33 and relatively common (>0.1%) PTVs in Africans (Figure 5b).
……
Discussion Here we describe the generation and analysis of the most comprehensive catalogue of 29 human protein-coding genetic variation to date, incorporating high-quality exome sequencing data from 60,706 individuals of diverse geographic ancestry. The resulting call set provides unprecedented resolution for the analysis of very low-frequency protein-coding variants in human populations, as well as a powerful resource for the clinical interpretation of genetic variants observed in disease patients. The complete frequency CC-BY-ND 4.0 International license for this preprint is the author/funder. It is made available under a bioRxiv preprint first posted online October 30, 2015; http://dx.doi.org/10.1101/030338 ; The copyright holder and annotation data from this call-set has been made freely available through a public website [exac.broadinstitute.org]
The ExAC resource provides the largest database to date for the estimation of allele frequency for protein-coding genetic variants, providing a powerful filter for analysis of candidate pathogenic variants in severe Mendelian diseases. Frequency data from ESP1 have been widely used for this purpose, but those data are limited by population diversity and by resolution at allele frequencies ≤0.1%. ExAC therefore provides 21 substantially improved power for Mendelian analyses, although it is still limited in power at lower allele frequencies, emphasizing the need for more sophisticated pathogenic variant filtering strategies alongside on-going data aggregation efforts. ExAC also highlights an unexpected tolerance of many disease genes to functional variation, and reveals that the literature and public databases contain an inflated number of reportedly pathogenic variants across the frequency spectrum, indicating a need for stringent criteria for assertions of pathogenicity.
Finally, we show that different populations confer different advantages in the discovery of gene-disrupting PTVs, providing guidance for projects seeking to identify human “knockouts” to understand gene function. Individuals of African ancestry have more PTVs (140 on average), with this enrichment most pronounced at allele frequencies above 1% (Figure 5b). Finnish individuals, as a result of a population bottleneck, are depleted at the lowest (<0.1%) allele frequencies but have a peak in frequency at 1-5% (Figure 5b). However, these differences are diminished when considering only LoF-constrained (pLI > 0.9) genes (Extended Data Figure 10). Sampling multiple populations would likely be a fruitful strategy for a researcher investigating common PTV variation. However, discovery of homozygous PTVs is markedly enhanced in the South Asia samples, which come primarily from a Pakistani cohort with 38.3% of individuals self- reporting as having closely related parents, emphasizing the extreme value of consanguineous cohorts for “human knockout” discovery (Figure 5d) [Saleheen et al., to 8 be co-submitted].
…..
While the ExAC dataset dramatically exceeds the scale of previously available frequency reference datasets, much remains to be gained by further increases in sample size. Indeed, the fact that even the rarest transversions have mutational rates13 on the order of 1 x 10⁻⁹ implies that almost all possible non-lethal SNVs likely exist in some person on Earth. ExAC already includes >70% of all possible protein-coding CpG transitions at well-covered sites; order of magnitude increases in sample size will eventually lead to saturation of other classes of variation.
Genetically Engineered Algae, Volume 2 (Volume Two: Latest in Genomics Methodologies for Therapeutics: Gene Editing, NGS and BioInformatics, Simulations and the Genome Ontology), Part 1: Next Generation Sequencing (NGS)
A research group in Australia has developed algae nanoparticles. The algae have been found to kill 90 percent of cancer cells in cultured human cells. Based on this success, the modified algae have been shown to destroy cancerous tumors in mice.
Algae is a general term for a range of single-celled microscopic photosynthetic organisms such as diatoms, and larger, multi-cellular plants, like kelp. The use of algae in cancer treatment relates to drug delivery. Some success has been achieved with the use of nanoparticles (such as nanoporous silica) to deliver anti-cancer medicines. One downside with this relates to the cost of production and the fact that some nanoparticles can be toxic. To overcome this, researchers based at the University of South Australia have used algae to model an alternative drug delivery system.
Success has been achieved with microalgae-derived nanoporous biosilica. The bio-material was derived from Thalassiosira pseudonana, which is a species of marine diatom. Diatoms are are among the most common types of phytoplankton, and they are found in the oceans, in freshwater, in soils and on damp surfaces. In studies, modified diatoms have been used as types of backpacks for the targeted delivery of anticancer drugs to tumor sites.
Lead researcher Nico Voelcker, speaking with International Business Times, explained why genetic modification was key in adapting the diatoms: “By genetically engineering diatom algae – tiny, unicellular, photosynthesising algae with a skeleton made of nanoporous silica, we are able to produce an antibody-binding protein on the surface of their shells. Anti-cancer chemotherapeutic drugs are often toxic to normal tissues.”
Although the results are interesting, experiments in cell culture and even on mice do not necessarily translate into success in humans. A series of clinical trials will be required to verify the results and to streamline any potential treatment options.
The research is published in the journal Nature Communications, in a paper headed “Targeted drug delivery using genetically engineered diatom biosilica.”
Targeted drug delivery using genetically engineered diatom biosilica
The ability to selectively kill cancerous cell populations while leaving healthy cells unaffected is a key goal in anticancer therapeutics. The use of nanoporous silica-based materials as drug-delivery vehicles has recently proven successful, yet production of these materials requires costly and toxic chemicals. Here we use diatom microalgae-derived nanoporous biosilica to deliver chemotherapeutic drugs to cancer cells. The diatom Thalassiosira pseudonana is genetically engineered to display an IgG-binding domain of protein G on the biosilica surface, enabling attachment of cell-targeting antibodies. Neuroblastoma and B-lymphoma cells are selectively targeted and killed by biosilica displaying specific antibodies sorbed with drug-loaded nanoparticles. Treatment with the same biosilica leads to tumour growth regression in a subcutaneous mouse xenograft model of neuroblastoma. These data indicate that genetically engineered biosilica frustules may be used as versatile ‘backpacks’ for the targeted delivery of poorly water-soluble anticancer drugs to tumour sites.
Figure 1: The principle of action of the genetically engineered biosilica therapeutic nanoparticles
Genetically engineered diatom biosilica (green) containing liposome-encapsulated drug molecules (yellow) can be targeted to both adherent neuroblastoma cells (red) and lymphocyte cells in suspension (purple) by functionalizing the biosilica
Figure 2: SEM images of T. pseudonana biosilica and analysis of IgG–HRP binding to T. pseudonana biosilica
(a) Side view and (b) top view of cylinder-shaped biosilica from a single diatom cell. (c,d) Details of the biosilica structure showing the highly porous surface. (e) Schematic structure of the S–T8–GFP–GB1 fusion protein. S, N-terminal…
Figure 4: Interaction of anti-CD20 antibody-labelled GB1–biosilica with B and T cells captured on an anti-CD45 antibody microarray.
The left panels show epifluorescence microscopy images of cells captured on microarray spots after incubation with anti-CD20 antibody-labelled biosilica (n=3). The right panels show higher magnification images within the spots. Green: b…
Figure 6: Interaction of anti-p75NTR–GB1–biosilica frustules with adherent cells
Utah Valley University physicists are literally applying rocket science to the field of medical diagnostics. With a few key changes, the researchers used a noninvasive ultrasonic technique originally developed to detect microscopic flaws in solid fuel rockets, such as space shuttle boosters, to successfully detect cell stiffness changes associated with certain cancers and other diseases.
Brian Patchett, a research assistant and instructor within the Department of Physics at Utah Valley University, will describe the group’s method, which uses sound waves to manipulate and probe cells, during the Acoustical Society of America’s Fall 2015 Meeting, held Nov. 2-6, in Jacksonville, Fla.
The method combines a low-frequency ultrasonic wave to levitate the cells and confine them to a single layer within a fluid and a high-frequency ultrasonic wave to measure the cell’s stiffness.
University Basic setup of the group’s acoustic levitation device during normal use with an ultrahigh-frequency pulser taking readings of the monolayer. (Credit: Brian Patchett/Utah Valley)
“An acoustic wave is a pressure wave so it travels as a wave of high and low pressure. By trapping a sound wave between a transducer — such as a speaker — and a reflective surface, we can create a ‘standing wave’ in the space between,” explained Patchett. “This standing wave has stationary layers of high and low pressure, a.k.a. ‘anti-nodes,’ and areas, ‘the nodes’ where the pressure remains the same.”
This standing wave allowed the group to acoustically levitate the cells and isolate them in manner similar to their natural state — as they would be within human tissue or the bloodstream. Previous work in this realm relied on “growing the cell cultures in a Petri dish, which tends to deform the structure, as well as create all sorts of interference,” Patchett said.
The significance of the group’s work is that it focuses on an unexplored method of measuring the properties of cells and how they change during the process of cancer and disease development. “The stiffness of the cell is the primary change detected with our high-frequency ultrasound; it reveals detailed information about the internal structure of the cell and how it changes in certain diseases,” Patchett said.
The group’s method can also help distinguish between different types of cancer — such as aggressive breast cancer vs. less aggressive forms. “By isolating the cells in a monolayer of fluid via acoustic levitation, we’re providing a better method for the detection of cell stiffness,” Patchett said. “This method can be used to explore the aspect of cells that changes during Alzheimer’s disease, the metastasis of cancer, or during the onset of autoimmune responses to better understand these conditions and provide insight into possible treatment methods.”
UHFSine photo of the layers created by Sine waves. (Credit: Brian Patchett/Utah Valley University)
One of the group’s key findings is that “by manipulating the shape of the wave that we use for levitation in specific ways, we’re able to create more precise, sharply defined layers,” Patchett said. “And, borrowing from previous cell culture work done by our group, our high-frequency ultrasound method detects changes within the stiffness of cells with high accuracy. By isolating the cells in a levitated monolayer, we hope to see these changes more clearly so that we can gain a better understanding of what’s happening within the cell and why.”
What kinds of applications might this method find? “It’s a really fantastic research method for exploring autoimmune disorders,” pointed out Timothy Doyle, lead scientist on the project and an assistant professor of physics at Utah Valley University.
As far as other applications, the group’s method may find use in clinics, hospitals, and surgical centers as a way to immediately detect and characterize cancer or other diseases.
“Our method identifies aggressive types of breast cancer, for example, while in the operating room,” Patchett noted. “Faster than current pathology methods, it will enable doctors to ensure speedier assessments and more effective treatment plans for patients — personalized to their specific needs, which, in turn, will end up being more cost effective in the long term.”
In the near future, the group plans to apply their method to a wide range of biological materials, including white blood cells undergoing activation, which is part of the immune response to an illness.
“We’re collaborating with the Huntsman Cancer Institute — part of the University of Utah healthcare system — to explore various types of breast tissues under levitation to refine our pathology detection methods,” Patchett said. “Our goal is to provide potentially life-saving, personalized medical treatments based on our ability to quickly and effectively detect cancers and diseases in patients.”
New answers may have just emerged in a long-standing debate in the field of oncology and molecular evolution. The neutral theory of molecular evolution states that changes occurring at the molecular level are not caused by natural selection, but rather by the random genetic drift of mutant alleles. In contrast, Darwinian selection adheres to the idea that a molecular mutation holds some selective advantage over the wild-type, allowing it to thrive.
When viewing these two theories through the lens of carcinogenesis, it is not difficult to envision the applicability of either theory. However now, new evidence from scientists at the University of Chicago and the Beijing Institute of Genomics may tip the scales in favor of neutral theory. This collaborative scientific effort assembled data from one of the most rigorous genetic sequencing ever carried out on a single tumor—revealing a much greater level of genetic diversity than expected.
The investigators excised a tumor roughly 3.5 centimeters in diameter (slightly smaller than a ping-pong ball), from a hepatocellular carcinoma tumor of the liver. The research team estimated that the tumor contained more than 100 million distinct mutations within genetic coding regions, which is thousands of times more than they anticipated. The impact of this finding is that even microscopic tumors are likely to contain extremely high genetic diversity and with so much variation there are likely many cells contained within able to resist standard post-surgical cancer treatment such as chemotherapy and radiation.
“With 100 million mutations, each capable of altering a protein in some way, there is a high probability that a significant minority of tumor cells will survive, even after aggressive treatment,” explained study director Chung-I Wu, Ph.D., professor of ecology and evolution at the University of Chicago. “In a setting with so much diversity, those cells could multiply to form new tumors, which would be resistant to standard treatments.”
The findings from this study were published recently in PNAS through an article entitled “Extremely high genetic diversity in a single tumor points to prevalence of non-Darwinian cell evolution.”
Extremely high genetic diversity in a single tumor points to prevalence of non-Darwinian cell evolution
A tumor comprising many cells can be compared to a natural population with many individuals. The amount of genetic diversity reflects how it has evolved and can influence its future evolution. We evaluated a single tumor by sequencing or genotyping nearly 300 regions from the tumor. When the data were analyzed by modern population genetic theory, we estimated more than 100 million coding region mutations in this unexceptional tumor. The extreme genetic diversity implies evolution under the non-Darwinian mode. In contrast, under the prevailing view of Darwinian selection, the genetic diversity would be orders of magnitude lower. Because genetic diversity accrues rapidly, a high probability of drug resistance should be heeded, even in the treatment of microscopic tumors.
The prevailing view that the evolution of cells in a tumor is driven by Darwinian selection has never been rigorously tested. Because selection greatly affects the level of intratumor genetic diversity, it is important to assess whether intratumor evolution follows the Darwinian or the non-Darwinian mode of evolution. To provide the statistical power, many regions in a single tumor need to be sampled and analyzed much more extensively than has been attempted in previous intratumor studies. Here, from a hepatocellular carcinoma (HCC) tumor, we evaluated multiregional samples from the tumor, using either whole-exome sequencing (WES) (n = 23 samples) or genotyping (n = 286) under both the infinite-site and infinite-allele models of population genetics. In addition to the many single-nucleotide variations (SNVs) present in all samples, there were 35 “polymorphic” SNVs among samples. High genetic diversity was evident as the 23 WES samples defined 20 unique cell clones. With all 286 samples genotyped, clonal diversity agreed well with the non-Darwinian model with no evidence of positive Darwinian selection. Under the non-Darwinian model,MALL (the number of coding region mutations in the entire tumor) was estimated to be greater than 100 million in this tumor. DNA sequences reveal local diversities in small patches of cells and validate the estimation. In contrast, the genetic diversity under a Darwinian model would generally be orders of magnitude smaller. Because the level of genetic diversity will have implications on therapeutic resistance, non-Darwinian evolution should be heeded in cancer treatments even for microscopic tumors.
Scientists at the Beijing Institute of Genomics sampled nearly 300 regions from one slice of the hepatocellular tumor and sequenced or genotyped each one searching for genetic changes. Once they analyzed their data and applied a modern population genetic theory, their results lead them to the 100 million coding-region mutation estimate for the whole tumor.
This extensive level of heterogeneity within a single tumor, which is way beyond what a Darwinian process would permit, makes the selectionism vs. neutralism debate of the 1980s “suddenly medically relevant,” Dr. Wu remarked. Since previous to the current study, no one had ever genetically dissected a tumor as thoroughly, the commonly held theory was that tumors had from a few hundred up to 20,000 genetic alterations that were not present in the patient’s healthy cells.
“Our study is the non-Darwinian process writ small, down to the cellular level,” Dr. Wu noted. “In the Darwinian struggle, there are—from the tumor’s point of view—few beneficial mutations, meaning changes that give tumor cells a growth advantage. When there are no such limits on genetic variation, however, mutations can emerge and apparently thrive.”
“This could potentially change how we think about tumor growth and spread, but the direct clinical implications of this study may not be obvious on the surface,” added co-author Daniel Catenacci, M.D., assistant professor and medical oncologist at the University of Chicago.
While the bulk of the mutations were at very low frequencies, drug intervention could provide some of the genetic mutations with a progression path forward.
“The presence of so many random mutations could present a problem to specifically targeted therapies,” Dr. Catenacci stated. “It almost guarantees that some cells will be resistant. But it also suggests that aggressive treatment could push tumor cells into a more Darwinian mode.”
Since the current study only focused on a single tumor type, it remains to be seen how comparable this data will be for other types of cancerous tumors. However, regardless of narrow focus, the results from this analysis raises important question about tumor evolution and heterogeneity.
An international team led by investigators in Sweden team used a series of array-based expression and methylomic profiling experiments to put together a so-called gene regulatory network for T cells differentiating into four T helper cell groups.
NEW YORK (GenomeWeb) – The regulatory network controlling differentiation of the immune system’s T cells may contain markers of disease that differ in individuals’ blood samples even before symptoms appear, according to a new study in Science Translational Medicine.
A validated gene regulatory network and GWAS identifies early regulators of T cell–associated diseases
Mika Gustafsson1,2,*,†, Danuta R. Gawel1,†, Lars Alfredsson3, Sergio Baranzini4, Janne Björkander5, Robert Blomgran6, Sandra Hellberg7, Daniel Eklund8, et al.
Diseases may be easier to treat if caught early. However, means of identifying early disease—especially before symptoms appear—are in short supply. Now, Gustafsson et al.identify early regulators of T cell–mediated disease by finding transcription factors involved in T cell differentiation that are enriched in disease-associated polymorphisms. Three such experimentally validated transcription factors—GATA3, MAF, and MYB—and their targets were found to be differentially expressed in asymptomatic stages of two different T cell–mediated diseases—multiple sclerosis and seasonal allergic rhinitis. These data not only provide potential markers of disease development but also shed light on the mechanistic underpinning of T cell–mediated disease.
By cross-referencing transcription factors from this analysis with information from past genome-wide association studies on common human diseases, the group narrowed in on three transcription factors showing disease-related differences in their expression, SNP profiles, and splice variant patterns.
To test their hypothesis that the transcription factors might offer a window on symptom development, the researchers then tracked their expression in the blood of individuals with two relapsing diseases: multiple sclerosis and seasonal allergic rhinitis. Indeed, their results pointed to distinct expression profiles in those with or without symptoms, suggesting similar T-cell regulators could help in finding, treating, or perhaps preventing other common diseases down the road.
“[We think] that different functional variants of these three transcription factors or their expression levels … can be used to predict many T cell-associated diseases with high accuracy,” senior author Mikael Benson, a physician researcher with Linköping University’s Centre for Individualized Medicine in Sweden, told GenomeWeb.
“But,” he cautioned, “to really make it clinically relevant, I think you have to perform more studies of at-risk populations for certain diseases and study many different types of molecules, like methylation and proteins, and pick the most discriminating molecules for discriminating purposes.”
For the most part, diseases aren’t successfully diagnosed until symptoms are obvious, creating problems for those tasked with trying to treat conditions that may already have caused irreparable damage, Benson noted. Along with suffering for patients, this treatment failure leads to health care costs associated with both ineffective drugs and new drug development.
“Ideally, you should actually start treatment for preventing disease before symptoms occur, early in the disease process,” he explained.
In their search for early blood markers of disease, Benson and his colleagues drew from their ongoing work on T cells — a group of white blood cells tasked with patrolling the body to find and stave off forms of disease ranging from metabolic conditions and heart disease to inflammatory conditions and cancer.
“If you can tap into that information — what’s happening in those T cells — ideally you could diagnose disease processes early before symptoms occur,” Benson said.
With that in mind, the researchers did array-based gene expression and methylation profiling on T cells over time as they differentiated into four subsets of T helper cells, hoping to find regulators relevant to early-stage disease.
After assessing such in vitro T-cell differentiation events at six time points in four replicate experiments, the researchers plugged their data into a mathematical model designed by first author Mika Gustafsson, also at Linköping University, to tease apart factors involved in T-cell differentiation regulation.
And from the set of transcription factors pinned to T cell differentiation, the team narrowed in further by folding in information on the genes and variants implicated in common human diseases through past GWAS.
The search led to three transcription factors — GATA3, MYB, and MAF — that were confirmed as T-cell regulators through the researchers’ subsequent chromatin immunoprecipitation sequencing, gene expression profiling, and gene knockdown experiments in differentiated T helper 1 and T helper 3 cells.
From publicly available gene expression data, the researchers found that these three transcription factors and/or their target genes were differentially expressed in T cell-associated diseases such as rheumatoid arthritis, acute myeloid leukemia, or systemic lupus erythematosus.
Meanwhile, their own experiments in T cell samples from individuals with seasonal allergic rhinitis, individuals with MS, and unaffected control individuals suggested splicing patterns and gene expression of the three transcription factor markers shifted as symptoms appear in each of the relapsing diseases.
While there may not be a clear clinical need to test for allergic seasonal rhinitis, Benson explained, he and his colleagues believe a similar approach could be used for finding informative markers in individuals at risk of certain diseases such as hereditary breast cancer, for example, to diagnose, treat, or attempt to prevent disease.
“A likely continuation would be to study various forms of common cancer in at-risk populations to show clinical feasibility,” he said. “We believe that it’s probably easier to find drugs that can stop earlier disease processes than established ones.”
More generally, Benson said, it would be ideal to start testing markers identified through these sorts of studies over decades in prospective studies of thousands or hundreds of thousands of individuals who start out healthy, using longitudinal blood samples such as those planned for President Obama’s Precision Medicine Initiative.
sjwilliamspa
Seems odd to me that they had done microarray as T cell differentiate. I would have felt this has been done with other methodology such as differential display. The finding of GATA3 does not seem unique though as this factor is commonly differenctially expressed as cells differentiate and is involved in the differentiation of many cell types. It only seems to me coincidental that a cross search in expression databases revealed GATA involved in disease states, which it is however does not seem a fair comparison. They would need to constitutively express GATA3 in an autologous transfer to see if mice develop symtomology of these diseases, which does not seem totally plausible.
Irreconciliable Dissonance in Physical Space and Cellular Metabolic Conception
Curator: Larry H. Bernstein, MD, FCAP
Pasteur Effect – Warburg Effect – What its history can teach us today.
José Eduardo de Salles Roselino
The Warburg effect, in reality the “Pasteur-effect” was the first example of metabolic regulation described. A decrease in the carbon flux originated at the sugar molecule towards the end of the catabolic pathway, with ethanol and carbon dioxide observed when yeast cells were transferred from an anaerobic environmental condition to an aerobic one. In Pasteur´s studies, sugar metabolism was measured mainly by the decrease of sugar concentration in the yeast growth media observed after a measured period of time. The decrease of the sugar concentration in the media occurs at great speed in yeast grown in anaerobiosis (oxygen deficient) and its speed was greatly reduced by the transfer of the yeast culture to an aerobic condition. This finding was very important for the wine industry of France in Pasteur’s time, since most of the undesirable outcomes in the industrial use of yeast were perceived when yeasts cells took a very long time to create, a rather selective anaerobic condition. This selective culture media was characterized by the higher carbon dioxide levels produced by fast growing yeast cells and by a higher alcohol content in the yeast culture media.
However, in biochemical terms, this finding was required to understand Lavoisier’s results indicating that chemical and biological oxidation of sugars produced the same calorimetric (heat generation) results. This observation requires a control mechanism (metabolic regulation) to avoid burning living cells by fast heat released by the sugar biological oxidative processes (metabolism). In addition, Lavoisier´s results were the first indications that both processes happened inside similar thermodynamics limits. In much resumed form, these observations indicate the major reasons that led Warburg to test failure in control mechanisms in cancer cells in comparison with the ones observed in normal cells.
[It might be added that the availability of O2 and CO2 and climatic conditions over 750 million years that included volcanic activity, tectonic movements of the earth crust, and glaciation, and more recently the use of carbon fuels and the extensive deforestation of our land masses have had a large role in determining the biological speciation over time, in sea and on land. O2 is generated by plants utilizing energy from the sun and conversion of CO2. Remove the plants and we tip the balance. A large source of CO2 is from beneath the earth’s surface.]
Biology inside classical thermodynamics places some challenges to scientists. For instance, all classical thermodynamics must be measured in reversible thermodynamic conditions. In an isolated system, increase in P (pressure) leads to increase in V (volume), all this occurring in a condition in which infinitesimal changes in one affects in the same way the other, a continuum response. Not even a quantic amount of energy will stand beyond those parameters.
In a reversible system, a decrease in V, under same condition, will led to an increase in P. In biochemistry, reversible usually indicates a reaction that easily goes either from A to B or B to A. For instance, when it was required to search for an anti-ischemic effect of Chlorpromazine in an extra hepatic obstructed liver, it was necessary to use an adequate system of increased biliary system pressure in a reversible manner to exclude a direct effect of this drug over the biological system pressure inducer (bile secretion) in Braz. J. Med. Biol. Res 1989; 22: 889-893. Frequently, these details are jumped over by those who read biology in ATGC letters.
Very important observations can be made in this regard, when neutral mutations are taken into consideration since, after several mutations (not affecting previous activity and function), a last mutant may provide a new transcript RNA for a protein and elicit a new function. For an example, consider a Prion C from lamb getting similar to bovine Prion C while preserving its normal role in the lamb when its ability to change Human Prion C is considered (Stanley Prusiner).
This observation is good enough, to confirm one of the most important contributions of Erwin Schrodinger in his What is Life:
“This little book arose from a course of public lectures, delivered by a theoretical physicist to an audience of about four hundred which did not substantially dwindle, though warned at the outset that the subject matter was a difficult one and that the lectures could not be termed popular, even though the physicist’s most dreaded weapon, mathematical deduction, would hardly be utilized. The reason for this was not that the subject was simple enough to be explained without mathematics, but rather that it was much too involved to be fully accessible to mathematics.”
After Hans Krebs, description of the cyclic nature of the citrate metabolism and after its followers described its requirement for aerobic catabolism two major lines of research started the search for the understanding of the mechanism of energy transfer that explains how ADP is converted into ATP. One followed the organic chemistry line of reasoning and therefore, searched for a mechanism that could explain how the breakdown of carbon-carbon link could have its energy transferred to ATP synthesis. One of the major leaders of this research line was Britton Chance. He took into account that relatively earlier in the series of Krebs cycle reactions, two carbon atoms of acetyl were released as carbon dioxide ( In fact, not the real acetyl carbons but those on the opposite side of citrate molecule). In stoichiometric terms, it was not important whether the released carbons were or were not exactly those originated from glucose carbons. His research aimed at to find out an intermediate proteinaceous intermediary that could act as an energy reservoir. The intermediary could store in a phosphorylated amino acid the energy of carbon-carbon bond breakdown. This activated amino acid could transfer its phosphate group to ADP producing ATP. A key intermediate involved in the transfer was identified by Kaplan and Lipmann at John Hopkins as acetyl coenzyme A, for which Fritz Lipmann received a Nobel Prize.
Alternatively, under possible influence of the excellent results of Hodgkin and Huxley a second line of research appears. The work of Hodgkin & Huxley indicated that the storage of electrical potential energy in transmembrane ionic asymmetries and presented the explanation for the change from resting to action potential in excitable cells. This second line of research, under the leadership of Peter Mitchell postulated a mechanism for the transfer of oxide/reductive power of organic molecules oxidation through electron transfer as the key for the energetic transfer mechanism required for ATP synthesis.
This diverted the attention from high energy (~P) phosphate bond to the transfer of electrons. During most of the time the harsh period of the two confronting points of view, Paul Boyer and followers attempted to act as a conciliatory third party, without getting good results, according to personal accounts (in L. A. or Latin America) heard from those few of our scientists who were able to follow the major scientific events held in USA, and who could present to us later. Paul Boyer could present how the energy was transduced by a molecular machine that changes in conformation in a series of 3 steps while rotating in one direction in order to produce ATP and in opposite direction in order to produce ADP plus Pi from ATP (reversibility).
However, earlier, a victorious Peter Mitchell obtained the result in the conceptual dispute, over the Britton Chance point of view, after he used E. Coli mutants to show H+ gradients in the cell membrane and its use as energy source, for which he received a Nobel Prize. Somehow, this outcome represents such a blow to Chance’s previous work that somehow it seems to have cast a shadow over very important findings obtained during his earlier career that should not be affected by one or another form of energy transfer mechanism. For instance, Britton Chance got the simple and rapid polarographic assay method of oxidative phosphorylation and the idea of control of energy metabolism that brings us back to Pasteur.
This metabolic alternative result seems to have been neglected in the recent years of obesity epidemics, which led to a search for a single molecular mechanism required for the understanding of the accumulation of chemical (adipose tissue) reserve in our body. It does not mean that here the role of central nervous system is neglected. In short, in respiring mitochondria the rate of electron transport linked to the rate of ATP production is determined primarily by the relative concentrations of ADP, ATP and phosphate in the external media (cytosol) and not by the concentration of respiratory substrate as pyruvate. Therefore, when the yield of ATP is high as it is in aerobiosis and the cellular use of ATP is not changed, the oxidation of pyruvate and therefore of glycolysis is quickly (without change in gene expression), throttled down to the resting state. The dependence of respiratory rate on ADP concentration is also seen in intact cells. A muscle at rest and using no ATP has a very low respiratory rate. [When skeletal muscle is stressed by high exertion, lactic acid produced is released into the circulation and is metabolized aerobically by the heart at the end of the activity].
This respiratory control of metabolism will lead to preservation of body carbon reserves and in case of high caloric intake in a diet, also shows increase in fat reserves essential for our biological ancestors survival (Today for our obesity epidemics). No matter how important this observation is, it is only one focal point of metabolic control. We cannot reduce the problem of obesity to the existence of metabolic control. There are numerous other factors but on the other hand, we cannot neglect or remove this vital process in order to correct obesity. However, we cannot explain obesity ignoring this metabolic control. This topic is so neglected in modern times that we cannot follow major research lines of the past that were interrupted by the emerging molecular biology techniques and the vain belief that a dogmatic vision of biology could replace all previous knowledge by a new one based upon ATGC readings. For instance, in order to display bad consequences derived from the ignorance of these old scientific facts, we can take into account, for instance, how ion movements across membranes affects membrane protein conformation and therefore contradicts the wrong central dogma of molecular biology. This change in protein conformation (with unchanged amino acid sequence) and/or the lack of change in protein conformation is linked to the factors that affect vital processes as the heart beats. This modern ignorance could also explain some major pitfalls seen in new drugs clinical trials and in a small scale on bad medical practices.
The work of Britton Chance and of Peter Mitchell have deep and sound scientific roots that were made with excellent scientific techniques, supported by excellent scientific reasoning and that were produced in a large series of very important intermediary scientific results. Their sole difference was to aim at very different scientific explanations as their goals (They have different Teleology in their minds made by their previous experiences). When, with the use of mutants obtained in microorganisms P Mitchell´s goal was found to survive and B Chance to succumb to the experimental evidence, all those excellent findings of B Chance and followers were directed to the dustbin of scientific history as an example of lack of scientific consideration. [On the one hand, the Mitchell model used a unicellular organism; on the other, Chance’s work was with eukaryotic cells, quite relevant to the discussion.]
We can resume the challenge faced by these two great scientists in the following form: The first conceptual unification in bioenergetics, achieved in the 1940s, is inextricably bound up with the name of Fritz Lipmann. Its central feature was the recognition that adenosine triphosphate, ATP, serves as a universal energy “currency” much as money serves as economic currency. In a nutshell, the purpose of metabolism is to support the synthesis of ATP. In microorganisms, this is perfect! In humans or mammals, or vertebrates, by the same reason that we cannot consider that gene expression is equivalent to protein function (an acceptable error in the case of microorganisms) this oversimplifies the metabolic requirement with a huge error. However, in case our concern is ATP chemistry only, the metabolism produces ATP and the hydrolysis of ATP pays for the performance of almost, all kinds of works. It is possible to presume that to find out how the flow of metabolism (carbon flow) led to ATP production must be considered a major focal point of research of the two contenders. Consequently, what could be a minor fall of one of the contenders, in case we take into account all that was found during their entire life of research, the real failure in B Chance’s final goal was amplified far beyond what may be considered by reason!
Another aspect that must be taken into account: Both contenders have in the scientific past a very sound root. Metabolism may produce two forms of energy currency (I personally don´t like this expression*) and I use it here because it was used by both groups in order to express their findings. Together with simplistic thermodynamics, this expression conveys wrong ideas): The second kind of energy currency is the current of ions passing from one side of a membrane to the other. The P. Mitchell scientific root undoubtedly have the work of Hodgkin & Huxley, Huxley & Huxley, Huxley & Simmons
*ATP is produced under the guidance of cell needs and not by its yield. When glucose yields only 2 ATPs per molecule it is oxidized at very high speed (anaerobiosis) as is required to match cellular needs. On the other hand, when it may yield (thermodynamic terms) 38 ATP the same molecule is oxidized at low speed. It would be similar to an investor choice its least money yield form for its investment (1940s to 1972) as a solid support. B. Chance had the enzymologists involved in clarifying how ATP could be produced directly from NADH + H+ oxidative reductive metabolic reactions or from the hydrolysis of an enolpyruvate intermediary. Both competitors had their work supported by different but, sound scientific roots and have produced very important scientific results while trying to present their hypothetical point of view.
Before the winning results of P. Mitchell were displayed, one line of defense used by B. Chance followers was to create a conflict between what would be expected by a restrictive role of proteins through its specificity ionic interactions and the general ability of ionic asymmetries that could be associated with mitochondrial ATP production. Chemical catalyzed protein activities do not have perfect specificity but an outstanding degree of selective interaction was presented by the lock and key model of enzyme interaction. A large group of outstanding “mitochondriologists” were able to show ATP synthesis associated with Na+, K+, Ca2+… asymmetries on mitochondrial membranes and any time they did this, P. Mitchell have to display the existence of antiporters that exchange X for hydrogen as the final common source of chemiosmotic energy used by mitochondria for ATP synthesis.
This conceptual battle has generated an enormous knowledge that was laid to rest, somehow discontinued in the form of scientific research, when the final E. Coli mutant studies presented the convincing final evidence in favor of P. Mitchell point of view.
Not surprisingly, a “wise anonymous” later, pointed out: “No matter what you are doing, you will always be better off in case you have a mutant”
(Principles of Medical Genetics T D Gelehrter & F.S. Collins chapter 7, 1990).
However, let’s take the example of a mechanical wristwatch. It clearly indicates when the watch is working in an acceptable way, that its normal functioning condition is not the result of one of its isolated components – or something that can be shown by a reductionist molecular view. Usually it will be considered that it is working in an acceptable way, in case it is found that its accuracy falls inside a normal functional range, for instance, one or two standard deviations bellow or above the mean value for normal function, what depends upon the rigor wisely adopted. While, only when it has a faulty component (a genetic inborn error) we can indicate a single isolated piece as the cause of its failure (a reductionist molecular view).
We need to teach in medicine, first the major reasons why the watch works fine (not saying it is “automatic”). The functions may cross the reversible to irreversible regulatory limit change, faster than what we can imagine. Latter, when these ideas about normal are held very clear in the mind set of medical doctors (not medical technicians) we may address the inborn errors and what we may have learn from it. A modern medical technician may cause admiration when he uses an “innocent” virus to correct for a faulty gene (a rather impressive technological advance). However, in case the virus, later shows signals that indicate that it was not so innocent, a real medical doctor will be called upon to put things in correct place again.
Among the missing parts of normal evolution in biochemistry a lot about ion fluxes can be found. Even those oscillatory changes in Ca2+ that were shown to affect gene expression (C. De Duve) were laid to rest since, they clearly indicate a source of biological information that despite the fact that it does not change nucleotides order in the DNA, it shows an opposing flux of biological information against the dogma (DNA to RNA to proteins). Another, line has shown a hierarchy, on the use of mitochondrial membrane potential: First the potential is used for Ca2+ uptake and only afterwards, the potential is used for ADP conversion into ATP (A. L. Lehninger). In fact, the real idea of A. L. Lehninger was by far, more complex since according to him, mitochondria works like a buffer for intracellular calcium releasing it to outside in case of a deep decrease in cytosol levels or capturing it from cytosol when facing transient increase in Ca2+ load. As some of Krebs cycle dehydrogenases were activated by Ca2+, this finding was used to propose a new control factor in addition to the one of ADP (B. Chance). All this was discontinued with the wrong use of calculus (today we could indicate bioinformatics in a similar role) in biochemistry that has established less importance to a mitochondrial role after comparative kinetics that today are seen as faulty.
It is important to combat dogmatic reasoning and restore sound scientific foundations in basic medical courses that must urgently reverse the faulty trend that tries to impose a view that goes from the detail towards generalization instead of the correct form that goes from the general finding well understood towards its molecular details. The view that led to curious subjects as bioinformatics in medical courses as training in sequence finding activities can only be explained by its commercial value. The usual form of scientific thinking respects the limits of our ability to grasp new knowledge and relies on reproducibility of scientific results as a form to surpass lack of mathematical equation that defines relationship of variables and the determination of its functional domains. It also uses old scientific roots, as its sound support never replaces existing knowledge by dogmatic and/or wishful thinking. When the sequence of DNA was found as a technical advance to find amino acid sequence in proteins it was just a technical advance. This technical advance by no means could be considered a scientific result presented as an indication that DNA sequences alone have replaced the need to study protein chemistry, its responses to microenvironmental changes in order to understand its multiple conformations, changes in activities and function. As E. Schrodinger correctly describes the chemical structure responsible for the coded form stored of genetic information must have minimal interaction with its microenvironment in order to endure hundreds and hundreds years as seen in Hapsburg’s lips. Only magical reasoning assumes that it is possible to find out in non-reactive chemical structures the properties of the reactive ones.
For instance, knowledge of the reactions of the Krebs cycle clearly indicate a role for solvent that no longer could be considered to be an inert bath for catalytic activity of the enzymes when the transfer of energy include a role for hydrogen transport. The great increase in understanding this change on chemical reaction arrived from conformational energy.
Again, even a rather simplistic view of this atomic property (Conformational energy) is enough to confirm once more, one of the most important contribution of E. Schrodinger in his What is Life:
“This little book arose from a course of public lectures, delivered by a theoretical physicist to an audience of about four hundred which did not substantially dwindle, though warned at the outset that the subject matter was a difficult one and that the lectures could not be termed popular, even though the physicist’s most dreaded weapon, mathematical deduction, would hardly be utilized. The reason for this was not that the subject was simple enough to be explained without mathematics, but rather that it was much too involved to be fully accessible to mathematics.”
In a very simplistic view, while energy manifests itself by the ability to perform work conformational energy as a property derived from our atomic structure can be neutral, positive or negative (no effect, increased or decreased reactivity upon any chemistry reactivity measured as work)
Also:
“I mean the fact that we, whose total being is entirely based on a marvelous interplay of this very kind, yet if all possess the power of acquiring considerable knowledge about it. I think it possible that this knowledge may advance to little just a short of a complete understanding -of the first marvel. The second may well be beyond human understanding.”
In fact, scientific knowledge allows us to understand how biological evolution may have occurred or have not occurred and yet does not present a proof about how it would have being occurred. It will be always be an indication of possible against highly unlike and never a scientific proven fact about the real form of its occurrence.
As was the case of B. Chance in its bioenergetics findings, we may get very important findings that indicates wrong directions in the future as was his case, or directed toward our past.
The Skeleton of Physical Time – Quantum Energies in Relative Space of S-labs
By Radoslav S. Bozov Independent Researcher
WSEAS, Biology and BioSystems of Biomedicine
Space does not equate to distance, displacement of an object by classically defined forces – electromagnetic, gravity or inertia. In perceiving quantum open systems, a quanta, a package of energy, displaces properties of wave interference and statistical outcomes of sums of paths of particles detected by a design of S-labs.
The notion of S-labs, space labs, deals with inherent problems of operational module, R(i+1), where an imagination number ‘struggles’ to work under roots of a negative sign, a reflection of an observable set of sums reaching out of the limits of the human being organ, an eye or other foundational signal processing system.
While heavenly bodies, planets, star systems, and other exotic forms of light reflecting and/or emitting objects, observable via naked eye have been deduced to operate under numerical systems that calculate a periodic displacement of one relative to another, atomic clocks of nanospace open our eyes to ever expanding energy spaces, where matrices of interactive variables point to the problem of infinity of variations in scalar spaces, however, defining properties of minute universes as a mirror image of an astronomical system. The first and furthermost problem is essentially the same as those mathematical methodologies deduced by Isaac Newton and Albert Einstein for processing a surface. I will introduce you to a surface interference method by describing undetermined objective space in terms of determined subjective time.
Therefore, the moment will be an outcome of statistical sums of a numerical system extending from near zero to near one. Three strings hold down a dual system entangled via interference of two waves, where a single wave is a product of three particles (today named accordingly to either weak or strong interactions) momentum.
The above described system emerges from duality into trinity the objective space value of physical realities. The triangle of physical observables – charge, gravity and electromagnetism, is an outcome of interference of particles, strings and waves, where particles are not particles, or are strings strings, or are waves waves of an infinite character in an open system which we attempt to define to predict outcomes of tomorrow’s parameters, either dependent or independent as well as both subjective to time simulations.
We now know that aging of a biological organism cannot be defined within singularity. Thereafter, clocks are subjective to apparatuses measuring oscillation of defined parameters which enable us to calculate both amplitude and a period, which we know to be dependent on phase transitions.
The problem of phase was solved by the applicability of carbon relative systems. A piece of diamond does not get wet, yet it holds water’s light entangled property. Water is the dark force of light. To formulate such statement, we have been searching truth by examining cooling objects where the Maxwell demon is translated into information, a data complex system.
Modern perspectives in computing quantum based matrices, 0+1 =1 and/or 0+0=1, and/or 1+1 =0, will be reduced by applying a conceptual frame of Aladdin’s flying anti-gravity carpet, unwrapping both past and future by sending a photon to both, placing present always near zero. Thus, each parallel quantum computation of a natural system approaching the limit of a vibration of a string defining 0 does not equal 0, and 1 does not equal 1. In any case, if our method 1+1 = 1, yet, 1 is not 1 at time i+1. This will set the fundamentals of an operational module, called labris operator or in simplicity S-labs. Note, that 1 as a result is an event predictable to future, while interacting parameters of addition 1+1 may be both, 1 as an observable past, and 1 as an imaginary system, or 1+1 displaced interactive parameters of past observable events. This is the foundation of Future Quantum Relative Systems Interference (QRSI), taking analytical technologies of future as a result of data matrices compressing principle relative to carbon as a reference matter rational to water based properties.
Goedel’s concept of loops exist therefore only upon discrete relative space uniting to parallel absolute continuity of time ‘lags’. ( Goedel, Escher and Bach: An Eternal Golden Braid. A Metaphorical Fugue on Minds and Machines in the Spirit of Lewis Carroll. D Hofstadter. Chapter XX: Strange Loops, Or Tangled Hierarchies. A grand windup of many of the ideas about hierarchical systems and self-reference. It is concerned with the snarls which arise when systems turn back on themselves-for example, science probing science, government investigating governmental wrongdoing, art violating the rules of art, and finally, humans thinking about their own brains and minds. Does Gödel’s Theorem have anything to say about this last “snarl”? Are free will and the sensation of consciousness connected to Gödel’s Theorem? The Chapter ends by tying Gödel, Escher, and Bach together once again.) The fight struggle in-between time creates dark spaces within which strings manage to obey light properties – entangled bozons of information carrying future outcomes of a systems processing consciousness. Therefore, Albert Einstein was correct in his quantum time realities by rejecting a resolving cube of sugar within a cup of tea (Henri Bergson 19th century philosopher. Bergson’s concept of multiplicity attempts to unify in a consistent way two contradictory features: heterogeneity and continuity. Many philosophers today think that this concept of multiplicity, despite its difficulty, is revolutionary.) However, the unity of time and space could not be achieved by deducing time to charge, gravity and electromagnetic properties of energy and mass.
Charge is further deduced to interference of particles/strings/waves, contrary to the Hawking idea of irreducibility of chemical energy carrying ‘units’, and gravity is accounted for by intrinsic properties of anti-gravity carbon systems processing light, an electromagnetic force, that I have deduced towards ever expanding discrete energy space-energies rational to compressing mass/time. The role of loops seems to operate to control formalities where boundaries of space fluctuate as a result of what we called above – dark time-spaces.
Indeed, the concept of horizon is a constant due to ever expanding observables. Thus, it fails to acquire a rational approach towards space-time issues.
Richard Feynman has touched on issues of touching of space, sums of paths of particle traveling through time. In a way he has resolved an important paradigm, storing information and possibly studying it by opening a black box. Schroedinger’s cat is alive again, but incapable of climbing a tree when chased by a dog. Every time a cat climbs a garden tree, a fruit falls on hedgehogs carried away parallel to living wormholes whose purpose of generating information lies upon carbon units resolving light.
In order to deal with such a paradigm, we will introduce i+1 under square root in relativity, therefore taking negative one ( -1 = sqrt (i+1), an operational module R dealing with Wheelers foam squeezed by light, releasing water – dark spaces. Thousand words down!
What is a number? Is that a name or some kind of language or both? Is the issue of number theory possibly accountable to the value of the concept of entropic timing? Light penetrating a pyramid holding bean seeds on a piece of paper and a piece of slice of bread, a triple set, where a church mouse has taken a drop of tear, but a blood drop. What an amazing physics! The magic of biology lies above egoism, above pride, and below Saints.
We will set up the twelve parameters seen through 3+1 in classic realities:
– discrete absolute energies/forces – no contradiction for now between Newtonian and Albert Einstein mechanics
– mass absolute continuity – conservational law of physics in accordance to weak and strong forces
– quantum relative spaces – issuing a paradox of Albert Einstein’s space-time resolved by the uncertainty principle
– parallel continuity of multiple time/universes – resolving uncertainty of united space and energy through evolving statistical concepts of scalar relative space expansion and vector quantum energies by compressing relative continuity of matter in it, ever compressing flat surfaces – finding the inverse link between deterministic mechanics of displacement and imaginary space, where spheres fit within surface of triangles as time unwraps past by pulling strings from future.
To us, common human beings, with an extra curiosity overloaded by real dreams, value happens to play in the intricate foundation of life – the garden of love, its carbon management in mind, collecting pieces of squeezed cooling time.
The infinite interference of each operational module to another composing ever emerging time constrains unified by the Solar system, objective to humanity, perhaps answers that a drop of blood and a drop of tear is united by a droplet of a substance separating negative entropy to time courses of a physical realities as defined by an open algorithm where chasing power subdue to space becomes an issue of time.
Jose Eduardo de Salles Roselino
Some small errors: For intance an increase i P leads to a decrease in V ( not an increase in V)..
Radoslav S. Bozov Independent Researcher
If we were to use a preventative measures of medical science, instruments of medical science must predict future outcomes based on observable parameters of history….. There are several key issues arising: 1. Despite pinning a difference on genomic scale , say pieces of information, we do not know how to have changed that – that is shift methylome occupying genome surfaces , in a precise manner.. 2. Living systems operational quo DO NOT work as by vector gravity physics of ‘building blocks. That is projecting a delusional concept of a masonry trick, who has not worked by corner stones and ever shifting momenta … Assuming genomic assembling worked, that is dealing with inferences through data mining and annotation, we are not in a position to read future in real time, and we will never be, because of the rtPCR technology self restriction into data -time processing .. We know of existing post translational modalities… 3. We don’t know what we don’t know, and that foundational to future medicine – that is dealing with biological clocks, behavior, and various daily life inputs ranging from radiation to water systems, food quality, drugs…
Advinus Therapeutics announced that it has successfully completed a 14-day POC study in 60 Type II diabetic patients on its lead molecule, GKM-001, a glucokinase activator. The results of the trial show effective glucose lowering across all doses tested without any incidence of hypoglycemia or any other clinically relevant adverse events.
GKM-001 is differentiated from most other GK molecules that are in development, or have been discontinued, due to its novel liver selective mechanism of action.
GKM-001 belongs to a novel class of molecules for treatment of type II diabetes. It is an activator of Glucokinase (GK), a glucose-sensing enzyme found mainly in the liver and pancreas. Being liver selective, GKM-001 mostly activates GK in the liver and not in pancreas, which is its key differentiation from most competitor molecules that activate GK in pancreas as well.
A glucokinase activator for treatment of type II diabetes, currently in PI. Advinus is actively exploring partnership options to expedite further development and WW marketing of GKM-001.
Examples C2 and C3 were prepared in analogues manner of example (Cl) from the appropriate chiral intermediate:
Example Dl : (+)-{5-Chloro-2-[2-(4-cyclopropanesulfonylphenyl)-2-(2,4- difluorophenoxy)acetylamino]thiazol-4-yl}acetic acid, ethyl ester
Advinus’ GK-activator Achieves Early POC for Diabetes
November 29 2011
Partnership Dialog Actively Underway
Advinus Therapeutics, a research-based pharmaceutical company founded by globally experienced industry executives and promoted by the TATA Group, announced that it has successfully completed a 14-day POC study in 60 Type II diabetic patients on its lead molecule, GKM-001, a glucokinase activator. The results of the trial show effective glucose lowering across all doses tested without any incidence of hypoglycemia or any other clinically relevant adverse events.
The clinical trials on GKM-001 validate the company’s pre-clinical hypothesis that a liver selective Glucokinase activator would not cause hypoglycemia (very low blood sugar), while showing robust efficacy.
“GKM-001 is differentiated from most other GK molecules that are in development, or have been discontinued, due to its novel liver selective mechanism of action. GKM-001 has a prolonged pharmacological effect and a half-life that should support a once a day dosing as both mono and combination therapy.” said Dr. Rashmi Barbhaiya, MD & CEO, Advinus Therapeutics. He added that Advinus is actively exploring partnership options to expedite further development and global marketing of GKM-001.
GKM-001 belongs to a novel class of molecules for treatment of type II diabetes. It is an activator of Glucokinase (GK), a glucose-sensing enzyme found mainly in the liver and pancreas. Being liver selective, GKM-001 mostly activates GK in the liver and not in pancreas, which is its key differentiation from most competitor molecules that activate GK in pancreas as well. The resulting increase in insulin secretion creates a potential for hypoglycemia-a risk GKM-001 is designed to avoid. Advinus has the composition of matter patent on GKM-001 for all major markets globally. Both the Single Ascending Dose data, in healthy and type II diabetics, and the Multiple Ascending Dose Study in Type II diabetics has shown that the molecule shows effective glucose lowering in a dose dependent manner and has excellent safety and tolerability profile over a 40-fold dose range. The pharmacokinetic properties of the molecule support once a day dosing. GKM-001 has the potential to be “First-in-Class” drug to address this large, growing and yet poorly addressed market.
Advinus also has identified a clinical candidate as a back-up to GKM-001, which is structurally different. In its portfolio, the company has a growing pipeline for COPD, sickle cell disease, inflammatory bowel disease, type 2 diabetes, acute and chronic pain and rheumatoid arthritis in various stages of late discovery and pre-clinical development.
The first glucokinase modulator discovered and developed in India
A new concept for the management of diabetes for patients, globally
100 per cent ‘made in India’ molecule for the treatment of diabetes
IND approved by DGCI, Phase I clinical trial shows excellent safety and tolerance profiles with efficacy
Bangalore: Advinus Therapeutics (Advinus), the research-based pharmaceutical company founded by leading global pharmaceutical executives and promoted by the Tata group, today, announced the discovery of a novel molecule for the treatment of type II diabetes — GKM-001.The molecule is an activator of glucokinase; an enzyme that regulates glucose balance and insulin secretion in the body.
GKM-001 is a completely indigenously developed molecule and the initial clinical trials have shown excellent results for both safety and efficacy.
“Considering past failures of other companies on this target, our discovery programme primarily focused on identifying a molecule that would be efficacious without causing hypoglycaemia; a side effect associated with most compounds developed for this target.
“Recently completed Phase I data indicate that Advinus’ GKM–001 is a liver selective molecule that has overcome the biggest clinical challenge of hypoglycaemia. GKM-001 is differentiated from most other GK molecules in development due to this novel mechanism of action,” said Dr Rashmi Barbhaiya, MD and CEO, Advinus Therapeutics.
He further added, “We are very proud that GKM-001 is 100 per cent Indian. Advinus’s discovery team in Pune discovered the molecule and entire preclinical development was carried out at our centre in Bangalore. The Investigational New Drug (IND) application was filed with the DGCI for approval to initiate clinical trials in India within 34 months of initiation of the discovery programme. Subsequent to the approval of the IND, we have completed the Phase I Single Ascending Dose study in India within two months.”
GKM-001 is a novel molecule for the treatment of type II diabetes. It is the first glucokinase modulator discovered and developed in India and has potential to be both first or best in class. The success in discovering GKM-001 is attributed to the science-driven efforts in Advinus laboratories and ‘breaking the conventional mold’ for selection of a drug candidate. Advinus has ‘composition of matter’ patent on the molecule for all major markets globally. Glucokinase as a class of target is considered to be novel as currently there is no product in the market or in late clinical trials. The strategy for early clinical development revolved around assessing safety (particularly hypoglycaemia) and early assessment of therapeutic activity (glucose lowering and other biomarkers) in type II diabetics. The Phase I data, in both healthy and type II diabetics, shows excellent safety and tolerability over a 40-fold dose range and desirable pharmacokinetic properties consistent with ‘once a day’ dosing. The next wave of clinical studies planned continues on this strategy of early testing in type II diabetics.
Right behind the lead candidate GKM-001, Advinus has a rich pipeline of back up compounds on the same target. These include several structurally different compounds with diverse potency, unique pharmacology and tissue selectivity. Having discovered the molecule with early indication of wide safety margins, desired efficacy and pharmacokinetic profiles, the company now seeks to out-licence GKM-001 and its discovery portfolio.
Cell Death Pathway Insights, Volume 2 (Volume Two: Latest in Genomics Methodologies for Therapeutics: Gene Editing, NGS and BioInformatics, Simulations and the Genome Ontology), Part 2: CRISPR for Gene Editing and DNA Repair
Cell Death Pathway Insights
Larry H. Bernstein, MD, FCAP, Curator
LPBI
Phosphorylation and activation of ubiquitin-specific protease-14 by Akt regulates the 1 ubiquitin-proteasome system
Daichao Xu1,2, Bing Shan1,4, Byung-Hoon Lee3,4, Kezhou Zhu1,4, Tao Zhang1,4, Huawang Sun1, 4 Min Liu1, Linyu Shi1, Wei Liang1, et al.
eLife 2015;10.7554/eLife.10510 DOI: http://dx.doi.org/10.7554/eLife.10510
In this study, we report that USP14 is an Akt substrate and that this phosphorylation activates the DUB activity of USP14 both in vitro and in cells. We also demonstrate that phosphorylation of USP14 is critical for Akt to control UPS and consequentially global protein degradation via the UPS.
Regulation of ubiquitin-proteasome system (UPS), which controls the turnover of short-lived proteins in eukaryotic cells, is critical in maintaining cellular proteostasis. Here we show that 40 USP14, a major deubiquitinating enzyme that regulates the UPS, is a substrate of Akt, a serine/threonine-specific protein kinase critical in mediating intracellular signaling transducer for growth factors. We report that Akt-mediated phosphorylation of USP14 at Ser432, which normally blocks its catalytic site in the inactive conformation, activates its deubiquitinating activity in vitro and in cells. We also demonstrate that phosphorylation of USP14 is critical for Akt to regulate proteasome activity and consequently global protein degradation. Since Akt can be activated by a wide range of growth factors and is under negative control by phosphoinosotide phosphatase PTEN, we suggest that regulation of UPS by Akt-mediated phosphorylation of USP14 may provide a common mechanism for growth factors to control global proteostasis and for promoting tumorigenesis in PTEN-negative cancer cells.
The ubiquitin-proteasome system (UPS), a major degradative mechanism in eukaryotic cells, is involved in the degradation of short-lived proteins as well as misfolded and damaged proteins 69 (Komander and Rape, 2012). The 26S proteasome specifically targets and degrades proteins conjugated to ubiquitin. Regulation of protein deubiquitination by deubiquitinating enzymes (DUBs) is recognized as an important regulatory step in the ubiquitin-proteasome system. USP14, a deubiquitinating enzyme reversibly associated with the proteasome, negatively regulates the activity of proteasomes by trimming ubiquitin chains on proteasome-bound substrates (Borodovsky et al., 2001; Koulich et al., 2008; Lee et al., 2010). Purified recombinant USP14 is largely inactive and can be highly activated when in association with proteasome (Hu 76 et al., 2005; Koulich et al., 2008; Lee et al., 2010). However, a significant fraction of USP14 is present intracellularly in a proteasome-free state (Koulich et al., 2008) and it is not clear if and how proteasome-free USP14 might serve a significant physiological function. Akt, a serine/threonine-specific protein kinase and an important intracellular signaling transducer for growth factors such as insulin, is involved in regulating cell proliferation, metabolism, transcription, migration and apoptosis (Manning and Cantley, 2007). The activity of Akt is regulated by PI(3,4,5)P3, a lipid product of the phosphoinositide 3-kinases (PI3Ks). The intracellular levels of PI(3,4,5)P3 are negatively regulated by phosphatases such as SHIP1/2 and PTEN. The latter, a phosphoinoside phosphatase, is encoded by a tumor suppressor gene that is mutated in human cancers at high frequency (Cantley and Neel, 1999). Akt has been reported to mediate the phosphorylation of many substrates that in turn regulate cell proliferation, metabolism, transcription, migration and apoptosis. However, very little is known about its role in the UPS, and furthermore no mechanistic link between Akt and UPS has been elucidated.
Two forms of USP14 have been determined crystallographically: the inactive free form and an adduct between Ub-aldehyde (Ubal) and USP14, which provides insight into the catalytically active state (Hu et al., 2005). The key difference between these two structures is in the position of the blocking loops, BL1 and BL2, which project over the catalytic cleft of USP14 and block the access of the C-terminal residues of ubiquitin in the inactive form (Figure 1A). In Ubal-modified USP14, BL1 and BL2 are rearranged, thus exposing the cleft. In particular, Ser432, located within BL2, shifts its position over a distance of 3-5Å between the two states (Hu et al., 2005) (Figure 1B). Since Ser432 residue is located very close to a highly negatively charged patch (Figure 107 1C), we reasoned that when Ser432 residue was phosphorylated, the negatively charged phosphate group might induce a repulsive force, thereby inducing rearrangement of the BL2 loop and removing the inhibitory effect of this loop on the activity of USP14. The amino acid 110 sequences around Ser432 are highly evolutionarily conserved among USP14 orthologues 111 (Figure 1D) and Ser432 is predicted to be an Akt substrate by Scansite (http://scansite3.mit.edu/#home). We therefore tested the possibility that USP14 might be a substrate of activated Akt. We first examined the interaction between USP14 and Akt using a co-immunoprecipitation assay. As shown in Figure1-figure supplement 1A, when USP14 and Akt were overexpressed in HEK293T cells, their interaction was readily detectable. To test whether Akt could phosphorylate USP14, we overexpressed USP14 and an activated Akt (Myr-Akt) in HEK293T cells, and performed a quantitative phosphoproteomic analysis (Figure 118 1-figure supplement 1B). We identified four phosphorylation sites on USP14 when it was 119 expressed alone: Ser143, Ser230, Thr235, and Ser432 (Figure 1-figure supplement 1C-D). Notably, the phosphorylation levels of two of the four sites, Ser143 and Ser432, were increased considerably in cells expressing activated Akt (Figure 1E).
Figure 1. Structural basis of USP14 activation by phosphorylation of Ser432. (A) Detailed view of blocking loop 2 (BL2), which occludes the active site of USP14 (PDB access code 2AYN). The BL2 loop, which contains Ser432, is shown in stick model, in the apo form. (B) Combined ribbon representation and stick model showing a comparison of the conformations of the BL2 loop containing in the apo form (blue, PDB access code 2AYN) and in the USP14-Ubal adduct (orange, PDB access code 2AYO). In this drawing, the Ser432 and Cys114 residues are 504 shown in stick model, and the bound Ubal (a ubiquitin derivative in which the C-terminal 505 carboxylate is replaced by an aldehyde) in the complex is drawn in green. (C) A surface charge potential representation (contoured at ±7 kT/eV; blue/red) of USP14 (PDB accession 2AYN) showing that the S432 residue is very close to a highly negatively charged patch mainly formed by the acidic E188, D199 and E202 residues. When S432 is phosphorylated, the negatively charged phosphate group may induce a repulsive force, thereby relieving inhibition of the catalytic activity of USP14. (D) USP14 domain organization and sequence alignment of the Akt 511 phosphorylation site within USP14 orthologues from different species. Two blocking loops (BL1 512 and BL2) covering the USP14 active site are shown. The Akt phosphorylation site in USP14 from different species as predicted by Scansite. (E) S432 is the major phosphorylation site in USP14. HEK293T cells were treated as in Figure 1-figure supplement 1B, followed by ESI-MS analysis. Spectral counts were determined by ESI-MS. (F) Akt phosphorylates USP14 in vitro. Bacterially expressed and purified USP14 was incubated with active Akt in the presence of ATP. Reaction products were resolved by SDS-PAGE, and phosphorylated species were detected by a phospho-Ser antibody.
Since Ser432 residue is located very close to a highly negatively charged patch (Figure 107 1C), we reasoned that when Ser432 residue was phosphorylated, the negatively charged phosphate group might induce a repulsive force, thereby inducing rearrangement of the BL2 loop and removing the inhibitory effect of this loop on the activity of USP14. The amino acid sequences around Ser432 are highly evolutionarily conserved among USP14 orthologues (Figure 1D) and Ser432 is predicted to be an Akt substrate by Scansite (http://scansite3.mit.edu/#home). We therefore tested the possibility that USP14 might be a substrate of activated Akt. We first examined the interaction between USP14 and Akt using a co-immunoprecipitation assay. As shown in Figure1-figure supplement 1A, when USP14 and Akt were overexpressed in HEK293T cells, their interaction was readily detectable. To test whether Akt could phosphorylate USP14, we overexpressed USP14 and an activated Akt (Myr-Akt) in HEK293T cells, and performed a quantitative phosphoproteomic analysis (Figure 1-figure supplement 1B). We identified four phosphorylation sites on USP14 when it was expressed alone: Ser143, Ser230, Thr235, and Ser432 (Figure 1-figure supplement 1C-D). Notably, the phosphorylation levels of two of the four sites, Ser143 and Ser432, were increased considerably in cells expressing activated Akt (Figure 1E).
To examine whether USP14 is a direct substrate for Akt, we conducted an in vitro kinase 123 assay using activated recombinant Akt and purified recombinant USP14 expressed in E. coli. We 124 found that co-incubation of USP14 and Akt led to modification of USP14 as detected by a pan phospho-Ser antibody (Figure 1F), suggesting that USP14 is a substrate for Akt.
Figure 1-figure supplement 1. Akt phosphorylates USP14. (A) Akt interacts with USP14. HEK293T cells were transfected with indicated plasmids for 24 h. The cell lysates were collected for co-immunoprecipitation and western blotting analysis. (B) Schematic representation of mass spectrometry assay to determine USP14 phosphorylation sites by Akt. (C) Four phosphorylation sites of USP14 were determined by mass spectrometry. (D) The representative MS/MS spectrum of phosphorylated tryptic peptide ‘SSSphosSGHYVSWVK’ of human USP14 protein. The peptide sequence ‘SSSphosSGHYVSWVK’ containing phosphorylated S432 was identified by shotgun analysis using mass spectrometry when USP14 was co-expressed with Myr-Akt in HEK293T cells. Fragmentation ion of the amide bond of the peptide result in formation of ‘b’ ion and ‘y’ ion series corresponding to the N-terminal and C-terminal fragments respectively. Representative ions with phosphorylation and H2O loss were manually labeled in red on the spectrum.
To determine if Ser143 and Ser432 were indeed phosphorylated by Akt, we used this pan phospho-Ser antibody as above and found phosphorylation of WT USP14, but not of S143A/S432A mutant USP14, after incubating with activated Akt in a kinase assay (Figure 2A). To differentiate the relative importance of Ser143 and Ser432 as phosphorylation sites by Akt, we overexpressed activated Akt (Myr-Akt) in HEK293T cells with WT, S143A, S432A or double S143A/S432A (AA) mutants. We found that S143A mutant showed partially reduced phosphorylation as compared to that of WT, whereas phosphorylation of the USP14 S432A mutant was significantly decreased and that of AA double mutant was completely eliminated (Figure 2B). These results suggested S432 as a major and S143 as a minor phosphorylation site of Akt.
The phosphorylation of USP14 by Akt was further confirmed using an Akt phosphorylation-consensus motif (R××S/T) antibody (Figure 2-figure supplement 1A). The reactivity of USP14 with pan phospho-Ser antibody was eliminated after incubation with lambda phosphatase (Figure 2C). Notably, the phosphorylation levels of USP14 were decreased in cells when treated with MK2206, an inhibitor of Akt (Figure 2D), or when serum deprived, a condition known to inactivate endogenous Akt (Zhang et al., 2015) (Figure 2D).
To further verify the phosphorylation of USP14 S432 by Akt, we developed a phospho-Ser432 specific antibody. Phosphorylation of S432 can be detected after incubation of WT, but not S432A mutant USP14, with recombinant activated Akt in a kinase reaction (Figure 145 2E). This was further confirmed by using phos-tag electrophoresis which can specifically retard the migration of phosphorylated protein species (Kinoshita et al., 2009) (Figure 2E). Expression of Myr-Akt also led to S342 phosphorylation of endogenous USP14 (Figure 2F). Treatment with either MK2206 or AZD5363, two structurally unrelated Akt inhibitors, led to decrease of USP14 S432 phosphorylation levels (Figure 2-figure supplement 1B-C). Moreover, treatment with PI3K inhibitors, either Wortmannin or GDC0941, but not ERK1/2 inhibitor U0126, also significantly decreased the phosphorylation levels of USP14 S432 (Figure 2-figure supplement 152 1D-E). In addition, we tested growth factors such as IGF-1 or EGF, both of which are known to promote activation of Akt. We found that the treatment of IGF-1 or EGF resulted in phosphorylation of USP14 S432, which was blocked in cells pre-treated with MK2206 (Figure 155 2G-H). Finally, USP14 S432 is dramatically more phosphorylated in PTEN knockout mouse embryonic fibroblasts (MEFs), which carry high levels of Akt activity, than that of WT MEFs as determined by western blotting using the phospho-USP14(S432) antibody and phos-tag electrophoresis (Figure 2I), and the phosphorylation of USP14 S432 was blocked by Akt inhibitors (Figure 2-figure supplement 1F). From these results, we conclude that Ser432 of USP14 is a major phosphorylation site by Akt.
Figure 2. USP14 is phosphorylated at Ser432 by activated Akt. (A) In vitro phosphorylation 521 of USP14 at S432 by Akt. Bacterially expressed and purified wide type USP14 or AA mutant incubated with active Akt in the presence of ATP. Reaction products were resolved by SDS-PAGE, and phosphorylation was detected by the phospho-Ser antibody. (B) Akt phosphorylates USP14 at S432 in vivo. Western blot analysis of whole cell lysate and immunoprecipitates derived from HEK293T cells transfected with wild type USP14, USP14 S143A, USP14 S432A and USP14 S143A/S432A (AA) constructs using the phospho-Ser antibody. L.E., long exposure. (C) Immunoprecipitation (IP) and IB analysis of HEK293T cells transfected with HA-USP14 and Myr-Akt and preincubated with or without λ-phosphatase as indicated. (D) Inhibition of Akt decreased exogenous USP14 phosphorylation. HEK293T cells were transfected with Myc-USP14 for 20 h then treated with 1 μM MK2206 or deprived of serum for another 4 h before harvest. (E) In vitro kinase assay to detect Akt phosphorylation of USP14 by phospho-Ser432 specific antibody and phos-tag-containing gels. Bacterially expressed and purified wide type USP14 or S432A mutant was incubated with active Akt in the presence of ATP. The reaction products were resolved by SDS-PAGE, and USP14 phosphorylation was detected using an antibody that specifically recognizes Ser432 phosphorylation of USP14 or determined by differential migration on phos-tag gels. (F) In vivo detection of endogenous USP14 Ser432 phosphorylation by anti-p-Ser432 specific antibody. Western blot analysis of immunoprecipitates derived from H4 cells transfected with or without Myr-Akt plasmids using the anti-p-Ser432 specific antibody. (G, H) Phosphorylation of endogenous USP14 S432 upon 540 stimulation with IGF-1 or EGF. HEK293T cells were serum-starved and pre-treated with Akt inhibitor MK2206 (1 μM) for 30 min before stimulation with IGF-1 (100 ng/mL) for 30 min (G) or EGF (100 ng/mL) for 1 h (H). The cell lysates were immunoprecipitated with USP14 antibody and western-blotted with anti-p-S432 antibody. (I) Phosphorylation of endogenous USP14 S432 in Pten knockout cells with high activity of Akt. Lysates from MEFs with indicated genotypes 545 were immunoprecipitated with USP14 antibody and then western-blotted with p-S432 antibody. The differential migration of phospho-USP14 on phos-tag-containing gels was determined as shown in the bottom panel.
Activation of USP14 by Akt mediated phosphorylation Because bacterially expressed and purified USP14 protein exhibits very low catalytic activity (Lee et al., 2010), we tested whether Akt-mediated phosphorylation might activate the DUB activity of USP14. We compared the activity of recombinant USP14 in a Ub-AMC (ubiquitin-7-amido-4-methylcoumarin, a fluorogenic substrate) hydrolysis assay in the presence or absence of Akt. Bacterially expressed and purified USP14 (Figure 3-figure supplement 1) showed trace hydrolyzing activity towards Ub-AMC as reported (Lee et al., 2010), while USP14 incubated with Akt showed high activity (Figure 3A). To validate Akt-mediated activation of USP14 in cells, we co-expressed USP14 and Myr-Akt in HEK293T cells. USP14 immunoprecipitated from cells co-expressing activated Akt showed higher activity in Ub-AMC assay than that expressed alone (Figure 3B). On the other hand, USP14 isolated from HEK293T cells incubated with Akt inhibitor MK2206 showed reduced activity in Ub-AMC assay (Figure 3C). Moreover, USP14 isolated from HEK293T cells stimulated with IGF-1 showed higher
activity, which was suppressed when cells were pre-treated with MK2206 (Figure 3D). To determine the specific contribution of Ser432, we compared the activity of USP14 S432A mutant protein in Ub-AMC assay with that of WT in the presence of Akt, and found that the stimulating effect of Akt on the hydrolyzing activity of USP14 was largely blocked by S432A mutation (Figure 3E), but not by S143A mutation (Figure 3-figure supplement 2B).
To further characterize the effect of Ser432 phosphorylation, we expressed and purified recombinant S432E USP14 protein, which mimics the phosphorylation state of USP14, from E. coli (Figure 3-figure supplement 1) and analyzed its activity by Ub-AMC assay. Interestingly, we found that USP14 S432E mutant protein alone showed high levels of Ub-AMC hydrolyzing activity (Figure 3F). Consistent with S432 as the major phosphorylation site by Akt, double E mutant (S143E/S432E) showed almost the same levels of hydrolyzing activity as that of S432E single mutant and S143E mutation had no significant impact on the activity of USP14 (Figure 3-figure supplement 2C-D). To determine its enzyme kinetics, we incubated USP14 S432E mutant protein with increasing amounts of Ub-AMC (Figure 3-figure supplement 2E) and determined the Km value (Km = 26 μM) from the slope of a Lineweaver-Burk plot (Figure 3G).
We characterized the distributions of p-S432 USP14 and total USP14 with that of proteasome in Pten-/- MEFs using glycerol gradient centrifugation (Koulich et al., 2008). We found that majority of p-S432 USP14 was distributed in the fractions with lower molecular weight proteins and distinguishable from the fractions where larger protein complexes, such as proteasomes, were localized. On the other hand, unphosphorylated USP14 was found in the fractions where larger molecular weight complexes, such as proteasome, are known to be localized (Figure 3-figure supplement 2F). Thus, S432 phosphorylated and unphosphorylated USP14 might be distributed differently in the cells. We next determined whether phospho-mimetic mutant of USP14 could be further activated by interacting with proteasome. Interestingly, we found that the Ub-AMC hydrolytic activity of S432E mutant could be further 200 activated when incubated with proteasome in vitro (Figure 3H). Taken together, these results suggest that S432 phosphorylation and intraction with proteasome may be two different
regulatory mechanisms for USP14.
Figure 3. Phosphorylation of USP14 by Akt activates USP14 DUB activity. (A) Akt activates USP14 DUB activity in vitro. USP14 protein (1μg) was incubated with or without active Akt (1 μg) in kinase assay buffer in a total volume of 50 μL for 1 h at 30oC, then the reaction mixtures were subjected to Ub-AMC assay. RFU, relative fluorescence units. (B, C) Akt activates USP14 in cells. USP14 was immunoprecipitated from HEK293T cells co-expressed with activated Akt (B) or treated with 10 μM MK2206 for 4h (C) and then eluted with HA-peptide following Ub-AMC hydrolysis assay. (D) Activation of USP14 by stimulating cells with IGF-1. HEK293T cells were serum-starved and pre-treated with or without Akt inhibitor MK2206 (1 μM) for 30 min before stimulation with IGF-1 (100ng/mL) for 30 min. USP14 was then immunoprecipitated and eluted with HA-peptide. The activity of USP14 was determined using Ub-AMC hydrolysis assay. (E) USP14 activation by Akt is blocked by S432A mutation. Ub-AMC hydrolysis assay of wide type USP14 or S432A mutant in the presence or absence of active Akt. (F) Ub-AMC hydrolysis assay of bacterially expressed and purified wide type USP14 or S432E mutant. (G) Lineweaver-Burk analysis of USP14 S432E, obtained by measuring the initial rates at varying Ub-AMC concentrations (see Figure 3-figure supplement 2E for reference). (H) The activity of phospho-mimetic USP14 mutant can be further stimulated by the presence of proteasome. Ub-AMC hydrolysis assay of wild type USP14 or S432E mutant in the presence or absence of Ub-VS-treated human proteasome [VS-proteasome (see Lee et al., 2010); 1 nM]. Ptsm, 26S proteasome.
Phosphorylation of USP14 promotes both K48 and K63 deubiquitination activity To assess the impact of USP14 phosphorylation on its selectivity towards different types of 206 ubiquitin linkages, we incubated USP14 WT and S432E mutant protein with diubiquitin species of K48, K63 and linear linkages. Conversion to monomeric Ub was monitored via SDS-PAGE followed by western blotting. We observed significantly increased hydrolytic activity of S432E mutant, as compared to that of WT, towards both Lys48 and Lys63 diubiquitin, while linear diubiquitin was not readily cleaved by WT or mutant USP14 (Figure 4A-B and Figure 4-figure supplement 1A). Similarly, immunoprecipitated USP14 from cells showed significant activity toward both Lys48 and Lys63 diubiquitin, but not linear diubiquitin (Figure 4-figure supplement 1B-C). In contrast, S432A mutant immunoprecipitated from cells showed lower activity towards both Lys48 and Lys63 diubiquitin than that of WT (Figure 4C). Regulation of ubiquitin-proteasome system by Akt depends on phosphorylation of USP14. Since USP14 is a negative regulator of the UPS (Koulich et al., 2008; Lee et al., 2010; Lee et al., 2011) and we found USP14 can be phosphorylated and activated by Akt, we reasoned that 219 Akt-mediated activation of USP14 might lead to inhibition of the ubiquitin-proteasome system (UPS) and generally enhance the stability of many proteins. To this end, we generated a stable 221 cell line expressing GFP-CL1 (also known as GFPu), an engineered ubiquitin-dependent proteasome substrate widely used as a reporter for UPS activity (Bence et al., 2001; Kelly et al., 2007; Li et al., 2013; Liu et al., 2014) (Figure 5-figure supplement 1A-C). Treatment of cells with Akt inhibitors or serum deprivation or PI3K inhibitor, all of which can block Akt activity (Zhang et al., 2015), led to reduced level of GFP-CL1 as detected by both western blotting and fluorescence microscopy (Figure 5A-C and Figure 5-figure supplement 1D). Conversely, the expression of activated Akt (Myr-Akt) led to increased levels of GFP-CL1 protein. Treatment of WT H4 cells with IGF-1 or EGF also led to increased levels of GFP-CL1 protein (Figure 5D-G and Figure 5-figure supplement 1E). In contrast, in USP14 knockout H4 cells (generated using CRISPR/Cas9 technology, Figure 5-figure supplement 2A-D), the expression of Myr-Akt did not affect the levels of GFP-CL1 (Figure 5H). From these results, we conclude that Akt 232 negatively regulates the UPS in an USP14-dependent manner.
We next tested the importance of USP14 phosphorylation for Akt to regulate UPS. We found that in contrast to USP14 WT reconstituted H4 cells, USP14 AA mutant reconstituted H4 cells showed no increase in the accumulation of GFP-CL1 in response to the expression of activated Akt (Figure 5-figure supplement 2E and Figure 5I). As a control, we found that the expression of Akt had no effect on a ubiquitin-independent substrate of the proteasome, C-terminal ornithine decarboxylase-GFP (GFP-cODC) (Hoyt et al., 2005; Kelly et al., 2007; Lee et al., 2010) (Figure 5-figure supplement 2F-G), suggesting that Akt does not inhibit the UPS through a general inhibition of the proteasome itself. Taken together, these data show that 241 phosphorylation of USP14 by Akt is important for this kinase to negatively regulate the UPS in a ubiquitin-dependent manner.
Phosphorylation of USP14 regulates global protein degradation To further understand the physiological roles of Akt-mediated USP14 phosphorylation and subsequently activation, we sought to study the impact of USP14 phosphorylation on global protein degradation. Since the loss of USP14 accelerates cellular proteolysis (Koulich et al., 2008; Lee et al., 2010), we performed a quantitative proteomic analysis to determine the levels of proteins in WT H4 cells, H4 USP14-KO cells, and H4 USP14-KO cells complemented with WT USP14, S143A/S432A (AA) or S143D/S432D (DD) mutants. Using an isobaric TMT labeling approach, our mass spectrometry analysis identified 18,400 peptides with high confidence (q<0.01), corresponding to 3,648 proteins with a minimum of two peptides from each protein. 2,763 proteins, which were quantified in at least 2 replicates, were subjected to further analysis. We found the global protein patterns of H4 USP14-KO cells were similar to those of H4 USP14 KO-AA cells, but distinct from those of WT H4 cells. We identified a common set of 87 proteins that were reduced in H4 KO cells as compared to H4 WT cells or to H4 KO cells complemented with WT USP14 (KO-WT) (Figure 6, Lane1-2). The levels of these proteins were also significantly reduced in H4 KO-AA cells (Figure 6, Lane 3). Importantly, the levels of this set of 87 proteins in H4 KO-DD cells were significantly higher than that of H4 KO-AA cells (Figure 6, Lane 4).
Figure 6. Phosphorylation of USP14 regulates global protein degradation. The quantitative 605 analysis of proteome change in USP14 knockout or USP14 mutant cells were performed by 606 TMT-isobaric labeling followed by shotgun analysis. The heat map was plotted based on the set of 87 proteins that are down-regulated greater than or equal to 1.2 fold in H4 KO cells compared to H4 WT cells or to H4 KO cells complemented with WT USP14 (KO-WT). The log base 2 of average ratios was plotted as indicated.
To verify that the identified changes in protein abundance were due to proteasomal degradation, we treated H4 KO-AA cells with proteasome inhibitor MG132 and analyzed the protein level change of these 87 proteins. We found that the levels of these proteins increased significantly in MG132-treated KO-AA cells compared to that of control KO-AA cells (Figure 6, Lane 5), suggesting that these proteins were indeed subject to an increased rate of proteasome degradation with expression of non-phosphorylatable USP14. Interestingly, the top hit on this list of 87 proteins that were differentially regulated upon the loss of USP14 is mTOR, a central established regulator of cellular metabolism and tumorigenesis. We confirmed the role of USP14 on the levels of mTOR by western blotting. We found that the levels of mTOR were reduced inH4 KO and H4 KO cells complemented with USP14 AA mutant, but restored upon the expression of USP14 DD mutant (Figure 6-figure supplement 1). Taken together, our results suggest that phosphorylation of USP14 may provide a mechanism for Akt to regulate global protein degradation through the proteasome, which in turn may control key cellular pathways involved in regulating metabolism and tumorigenesis.
NF-kB-Independent Role of IKKa/IKKb in Preventing RIPK1 Kinase-Dependent Apoptotic and Necroptotic Cell Death during TNF Signaling
IKKa/IKKb prevent RIPK1 kinase-dependent death independently of NF-kB activation
IKKa/IKKb directly phosphorylate RIPK1 in TNFR1 complex I
Impaired phosphorylation of RIPK1 correlates with enhanced binding to FADD/caspase-8
IKK kinase inhibition induces TNF-mediated RIPK1 kinasedependent cell death in vivo
In Brief Dondelinger et al. describe an unexpected NF-kB-independent function of the IKK complex in protecting against TNF-induced RIPK1 kinase-dependent cell death. In TNFR1 complex I, IKKa/ IKKb directly phosphorylates RIPK1, leading to a reduction in RIPK1’s ability to bind FADD/caspase-8 and to induce apoptosis.
TNF is a master pro-inflammatory cytokine. Activation of TNFR1 by TNF can result in both RIPK1-independent apoptosis and RIPK1 kinase-dependent apoptosisornecroptosis.Thesecelldeathoutcomes are regulated by two distinct checkpoints during TNFR1 signaling. TNF-mediated NF-kB-dependent induction of pro-survival or anti-apoptotic molecules is a well-known late checkpoint in the pathway, protecting cells from RIPK1-independent death. On the other hand, the molecular mechanism regulating the contribution of RIPK1 to cell death is far less understood. We demonstrate here that the IKK complex phosphorylates RIPK1 at TNFR1 complex I and protects cells from RIPK1 kinase-dependent death, independent of its function in NF-kB activation. We provide in vitro and in vivo evidence that inhibition of IKKa/IKKb or its upstream activators sensitizes cells to death by inducing RIPK1 kinase-dependent apoptosis or necroptosis. We therefore report on an unexpected, NF-kB-independent role for the IKK complex in protecting cells from RIPK1-dependent death downstream of TNFR1.
The IkB kinase (IKK) complex, composed of the regulatory subunit NEMO (also known as IKKg) and the two catalytic subunits IKKa and IKKb, plays a central role in the induction of immune and inflammatory responses as well as in promoting cell survival and tumorigenesis (Baldwin, 2012; Baud and Karin, 2009; Hayden and Ghosh, 2012; Liu et al., 2012). Its activation constitutes the ignition phase of the canonical NF-kB pathway, which
ultimately results in the translocation of NF-kB dimers to the nucleus, where they promote transcription of a myriad of genes involved in inflammation, survival, and tumorigenesis.
TNF is a master pro-inflammatory cytokine, and inappropriate TNF signaling has been demonstrated to drive many inflammatory diseases. Activation of TNFR1 by TNF promotes inflammation either directly by activating the canonical NF-kB pathway or indirectly by promoting cell death, which exacerbates inflammation by releasing damage-associated molecular patterns (DAMPs) as well as by affecting the permeability of the bodily barriers to microbes (Pasparakis and Vandenabeele, 2015). In most cell types, activation of TNFR1 does not induce death but triggers canonical NF-kB-dependent transcriptional upregulation of genes encoding pro-survival and pro-inflammatory molecules. Ligation of TNF to trimeric TNFR1 induces the rapid assembly of a plasma membrane-bound signaling complex, known as complex I, that contains TRADD, RIPK1, and the E3 ubiquitin ligases TRAF2, cIAP1, cIAP2, and LUBAC (Walczak, 2011). The conjugation of ubiquitin chains to RIPK1 by cIAP1/ cIAP2 generates binding sites for TAB2/TAB3 and NEMO and allows further recruitment and activation of TAK1 and IKKa/ IKKb (Bertrand et al., 2008; Ea et al., 2006; Gerlach et al., 2011; Kanayama et al., 2004; Mahoney et al., 2008; Wu et al., 2006). TAK1 activates the IKK complex by phosphorylation, resulting in the rapid and selective IKK-mediated phosphorylation of IkBa and in its subsequent ubiquitylation-dependent proteasomal degradation. IkBa degradation then permits translocation of the NF-kB heterodimer p50/p65 to the nucleus, where it induces transcription of multiple responsive genes, including pro-survival genes such as cFLIP (Hayden and Ghosh, 2014). The anti-apoptotic potential of cFLIP resides in its ability to counteract activation of caspase-8 from a cytosolic TRADD-FADD-caspase-8 cytosolic complex, named complex IIa, which is believed to originate from complex I internalization (Irmler et al., 1997; Micheau and Tschopp, 2003; Wang et al., 2008; Wilson et al., 2009). Accordingly, TNFR1-mediated RIPK1-independent apoptosis requires inhibition of the NF-kB response (Van Antwerp et al., 1996), commonly obtained in vitro by the use of pharmacological inhibitors of transcription or translation, respectively, Actinomycin D (ActD) and cycloheximide (CHX).
The NF-kB-mediated induction of pro-survival/anti-apoptotic molecules is, however, not the only cell death checkpoint in the TNFR1 pathway (O’Donnell and Ting, 2011). Indeed, altering activation of the canonical NF-kB pathway by inhibiting components located upstream of IkBa, namely, cIAP1/cIAP2, TAK1, and NEMO, was reported to further sensitize cells to death by additionally inducing RIPK1-dependent death (Dondelinger et al., 2013; Legarda-Addison et al., 2009; O’Donnell et al., 2012). Depending on the cellular context, activated RIPK1 accelerates cell death either by promoting assembly of a RIPK1FADD-caspase-8 cytosolic apoptotic complex, referred to as complex IIb (Wilson et al., 2009), or by promoting necroptosis via activation of the RIPK3-MLKL pathway (Pasparakis and Vandenabeele, 2015). Although initiated by cIAP1/cIAP2-mediated ubiquitylation of RIPK1 in complex I, the last molecular step in the regulation of this early RIPK1 kinase-dependent cell death checkpoint is currently unknown. In this study, we demonstrate that RIPK1 is a bona fide substrate of IKKa and IKKb and that IKKa/IKKb-mediated phosphorylation of RIPK1 in complex I protects cells from RIPK1 kinase-dependent death.
NEMO Deficiency and IKKa/IKKb Double Deficiencies Induce TNFR1-Mediated RIPK1 Kinase-Dependent Apoptosis We previously reported that the ubiquitin chains conjugated to RIPK1 by cIAP1/cIAP2 do not constitute the ultimate step regulating the contribution of RIPK1 to TNF-induced cell death. Indeed, genetic or pharmacological inhibition of TAK1 also drivesRIPK1-dependentdeathwithoutaffectingRIPK1ubiquitylation in complex I (Dondelinger et al., 2013). In this study, we investigated the role of the IKK complex in the regulation of this cell death checkpoint. Indeed, the IKK complex lies between TAK1andIkBainthepathway,andalthoughexpressionofaproteasome-resistant form of IkBa (IkBaSR) induces RIPK1-independent apoptosis (Dondelinger et al., 2013), NEMO deficiency was reported to sensitize cells to TNF-induced death by additionally promoting RIPK1-dependent apoptosis (Legarda-Addison et al., 2009). In absence of cIAP1/cIAP2 or TAK1, TNF-mediated RIPK1-dependent apoptosis was shown to rely on RIPK1 kinase activity (Dondelinger et al., 2013; Wang et al., 2008). To test whether this is also true in absence of NEMO, we first stimulated NEMO-deficient mouse embryonic fibroblasts (MEFs) with TNF in the absence or presence of Nec-1, a RIPK1 kinase inhibitor. Interestingly, we found that Nec-1 greatly, but not entirely,protectedNemo/MEFsfromTNF-induced apoptosis, as monitored by cell permeability, caspase-3 activity, and caspase-3 and caspase-8 processing (Figures 1A–1D, 1K, and 1L). These results indicated that, similarly as cIAP1/cIAP2 and TAK1, NEMO also regulates both RIPK1 kinase-dependent and RIPK1-independent cell death checkpoints downstream of TNFR1. To test whether this protective function of NEMO
reflects its role as adaptor protein recruiting IKKa and IKKb to TNFR1 complex I, we next stimulated Ikka/, Ikkb/, and Ikka//Ikkb/ MEFs with TNF. Interestingly, while IKKa or IKKb single deficiency had little effect on apoptosis induction (Figures 1E–1H), their combined depletion mimicked the phenotype observed in the Nemo/ MEFs (Figures 1I–1L), suggesting redundant roles of IKKa and IKKb downstream of NEMO in preventing RIPK1-dependent apoptosis. To exclude the possibility that the phenotypes observed in the various MEF genotypes were originating from intrinsic defects due to clonal expansion, we confirmed our findings in Ripk1+/+ and Ripk1/ MEFs depleted of IKK proteins by siRNA (Figure S1). Of note, NEMO siRNA had little effect on cell death induction in these experiments, probably due to the poor efficiency in repressing NEMO.
Figure 1. NEMO Deficiency and IKKa/IKKb Double Deficiencies Induce TNFR1-Mediated RIPK1 Kinase-Dependent Apoptosis (A–L)MEFsoftheindicatedgenotypesweretreatedwith20ng/mlhTNFinthepresenceorabsenceofNec-1,andcelldeath(A,C,E,G,andI)andcaspaseactivity (B, D, F, H, and J) were measured in function of time, respectively, by SytoxGreen positivity and DEVD-AMC fluorescence. Protein levels were determined by immunoblotting in unstimulated cells (K) or 15 hr poststimulation with the indicated compounds (L). Forthe celldeath results, error bars represent theSEM ofthreeindependent experiments. Forthe caspase-3activity results, error bars represent SDof triplicates of one representative experiment. See also Figure S1.
IKKa and IKKb Mediate Their Protective Effect on RIPK1 via Their Enzymatic Activities Because IKKa and IKKb are serine/threonine kinases, we next evaluated the requirement of their enzymatic activities for their ability to repress RIPK1-dependent apoptosis. To do so, we tested the effect of five different IKK inhibitors on TNF-induced death and found that all of them led to a combination of RIPK1 kinase-dependent and RIPK1-independent death, as observed in the Ikka//Ikkb/ MEFs (Figures S2A and S2B). We further confirmed RIPK1 kinase-dependent apoptosis induction using TPCA-1 (Figures 2A–2C), as this inhibitor had no effect on TNF-induced death in Ikka//Ikkb/ MEFs (Figure S2B). TPCA-1 was used at 5 mM, a concentration reported to inhibit both IKKa and IKKb kinase activities (IC50 = 400 nM and 17.9 nM for IKKa and IKKb, respectively) (Podolin et al., 2005). We demonstrated that the apoptotic cell death was mostly depending on RIPK1 kinase activity by either co-incubating cells with Nec-1 (Figures 2A–2C) or by stimulating RIPK1 kinase-dead-expressing MEFs (Ripk1 K45A)(Figures 2D and 2E) (Berger et al., 2014). Importantly, Nec-1 had no effect in Ripk1 K45A MEFs, excluding any off-target effect (Figures S2E andS2F). Of note, similar results were obtained upon pharmacological inhibition of cIAP1/cIAP2 or TAK1 (Figures 2F, 2G, S2C, and S2D). In line with a role of IKKa and IKKb downstream of cIAP1/cIAP2, TAK1, and NEMO in the pathway, we tested the effect of TPCA-1 on TNF-induced death in ciap1/2/, Tak1/, and Nemo/ MEFs and found no additional effect (Figures 2H–2K). Together, these results indicate that the kinase activities of IKKa/IKKb regulate, downstream of cIAP1/cIAP2, TAK1, and NEMO, both RIPK1 kinasedependent and RIPK1-independent cell death checkpoints.
Figure 2. IKKa and IKKb Mediate Their Protective Effect on RIPK1 via Their Enzymatic Activities (A, B,and D–K)Ripk1+/+ or MEFsof theindicated genotypes weretreated with20ng/ml hTNF inthepresenceof theindicated compounds, and celldeath (A,D,F, H, I, J, K) and caspase-3 activity (B, E, G) were measured in function of time, respectively, by SytoxGreen positivity and DEVD-AMC fluorescence. (C) Protein levels in wild-type MEFs determined by immunoblotting 4 hr poststimulation. Forthecell death results,error bars represent the SEMof three independent experiments. Forthe caspase-3 activity results, error bars represent SDoftriplicates of one representative experiment. See also Figure S2.
IKKa/IKKb Protect Cells from RIPK1-Dependent Apoptosis Independently of NF-kB We previously demonstrated that, in absence of cIAP1/cIAP2 or TAK1, RIPK1 contribution to TNF-induced death is regulated independently of a defect in the canonical NF-kB-dependent upregulation of pro-survival genes (Dondelinger et al., 2013). Moreover, NEMO was also reported to inhibit RIPK1 activation in an NF-kB-independent manner (Legarda-Addison et al., 2009; O’Donnell et al., 2012). IKKa and IKKb are best known for their roles in NF-kB activation, but NF-kB-independent functions have also been reported (Hinz and Scheidereit, 2014). To confirm that IKKa and IKKb regulate RIPK1 activation independently of the canonical NF-kB response, we took two different approaches. In the first one, we tested the effect of inhibiting IKKa/IKKb in conditions where the NF-kB response is prevented by incubating the cells with the translational inhibitor CHX. In the second, we used p65/ MEFs, which are defective for canonical NF-kB activation (Beg et al., 1995). As previously reported (Wang et al., 2008), apoptosis induced by TNF+CHX occurred with a slow kinetic and independently of RIPK1 kinase activity (Figures 3A–3C). Remarkably, a pretreatment with TPCA-1 greatly sensitized cells to apoptosis, and this sensitization was prevented by Nec-1 (Figures 3A– 3C, S3A, and S3B). Similar results were obtained when stimu
lating NF-kB-deficient p65/ MEFs with TNF and TPCA-1 (Figures 3D–3F) or in combination with TAK1 and cIAP1/ cIAP2 inhibitors (Figures S3C and S3D). Together, these results demonstrate that RIPK1-independent and -dependent apoptotic pathways are regulated by two different cell death checkpoints downstream of TNFR1 and that IKKa/IKKb regulate both of them in NF-kB-dependent and -independent manners, respectively.
Figure 3. IKKa/IKKb Protect Cells from RIPK1-Dependent Apoptosis Independently of NF-kB (A,B,D,andE)Ripk1+/+ (AandB)orp65/(DandE)MEFswerestimulatedwith20ng/mlhTNFinthepresenceoftheindicatedcompounds,andcelldeath(Aand D) and caspase activity (B and E) were measured in function of time, respectively, by SytoxGreen positivity and DEVD-AMC fluorescence. (C and F) Ripk1+/+ (C) or p65/ (F) MEFs were stimulated for, respectively, 15 hr and 8 hr with the indicated compounds, and protein levels were determined by immunoblotting. Forthe celldeath results, error bars represent theSEM ofthreeindependent experiments. Forthe caspase-3activity results, error bars represent SDof triplicates of one representative experiment. See also Figure S3.
Defective RIPK1 Phosphorylation in Complex I Correlates with RIPK1 Kinase-Dependent Contribution to TNF-Induced Apoptosis Knowing that the IKK complex physically interacts with RIPK1 in complex I, we hypothesized that the kinase-dependent role of IKKa/IKKb in preventing RIPK1 kinase-dependent apoptosis results from its ability to phosphorylate RIPK1. To test this hypothesis, we analyzed whether RIPK1 is phosphorylated in complex I and whether its phosphorylation state is altered in conditions affecting activation of IKKa/IKKb, but not when the pathway is inhibited downstream of IKKa/IKKb. Because RIPK1 is highly ubiquitylated in complex I (which prevents the detection by immunoblot of potential mobility shifts resulting from its phosphorylation), we removed the ubiquitin chains conjugated to RIPK1 by incubating complex I, pulled-down using FLAG-TNF, with the deubiquitylase USP2 (Figure 4A). By doing so, we observed that the pool of deubiquitylated RIPK1 was running at a higher molecular weight than normal and confirmed, by l-phosphatase treatment, that this mobility shift was resulting from phosphorylation, but not auto-phosphorylation since it was not inhibited by Nec-1 or in Ripk1 K45A MEFs (Figures 4A–4C). Remarkably, and in line with the model of cIAP1/ cIAP2-mediated ubiquitylation-dependent recruitment of TAK1 and NEMO/IKKa/IKKb to complex I and with our cell death results, we found that RIPK1 phosphorylation in complex I is affected in ciap1/2/, Tak1/, Nemo/, and Ikka//Ikkb/, but not in Ikka/, Ikkb/, and p65/ MEFs or in MEFs preincubated with CHX (Figures 4D, 4E, 4G, and 4H). Importantly, IKK activity is greatly affected (as observed by IkBa phosphorylation) in all conditions in which we observed impaired RIPK1 phosphorylation, thereby further demonstrating the link between RIPK1 phosphorylation and IKK enzymatic activities (Figure 4E). Defective RIPK1 phosphorylation in complex I was also observed following pharmacological inhibition of cIAP1/ cIAP2, TAK1, or IKKa/IKKb (Figure 4F).
Figure 4. Defective RIPK1 Phosphorylation in Complex I Correlates with RIPK1 Kinase-Dependent Contribution to TNF-Induced Apoptosis (A–H) Ripk1+/+ MEFs (A, B, F, and H) or MEFs with the indicated genotype (C, D, E, and G) were stimulated for 5 min with 2 mg/ml FLAG-hTNF in the presence or absence of the indicated compounds. TNFR1 complex I was then FLAG immunoprecipitated, incubated with the deubiquitylating enzyme USP2 or lambda phosphatase (l PPase) when indicated, and RIPK1 ubiquitylation and phosphorylation finally analyzed by immunoblotting. * indicates an aspecific band. See also Figure S7
Direct Phosphorylation of RIPK1 by IKKa/IKKb Prevents RIPK1 from Integrating Complex IIb To test the direct contribution of IKKa/IKKb to RIPK1 phosphorylation, we next performed in vitro kinase assays using recombinant proteins and included Nec-1 in the reactions to prevent RIPK1 autophosphorylation. We found that both IKKa and IKKb directly phosphorylated full-length RIPK1 or a mutated version lacking the death and RHIM domain (RIPK11–479)(Figures 5A, 5B, and S4A). Of note, RIPK1 phosphorylation by IKKb induced a mobility shift of RIPK1 not detected when using IKKa (Figures 5A and 5B), suggesting some specificity in the residues phosphorylated by both kinases. In line with our cellular data, TPCA-1 repressed, although with different efficiencies, the direct phosphorylation of RIPK1 by IKKa and IKKb. In contrast, recombinant TAB1/TAK1 did notlead to detectable RIPK1 phosphorylation by autoradiography (Figure 5C).
We next tested the consequence of genetic or pharmacological inhibition of IKKa/IKKb, and of the resulting defective phosphorylation of RIPK1 in complex I, on the ability of RIPK1 to integrate the cytosolic caspase-8-activating complex IIb. We found, by performing FADD and caspase-8 immunoprecipitations, that inhibition of IKKa/IKKb enzymatic activities resulted in the binding of RIPK1 to FADD and caspase-8, a process relying on RIPK1 kinase activity (Figures 5D–5G). In contrast, CHX pre-treatment, which does not affect phosphorylation of RIPK1 in complex I (Figure 4H), led to much less recruitment of RIPK1 to FADD/caspase-8, and this recruitment was not inhibited by Nec-1 (Figures 5F, 5G, and S4B). Of note, association of TRADD with FADD/caspase-8 was not observed under these conditions. Together, these results suggest that IKKa/IKKb-mediated phosphorylation of RIPK1 either represses RIPK1 kinase activity or interferes with RIPK1’s ability to bind complex IIb components.
Figure 5. Direct Phosphorylation of RIPK1 by IKKa/IKKb Prevents RIPK1 from Integrating Complex IIb (A–C) Recombinant GST-IKKa, GST-IKKb, or GST-TAB1-TAK1 fusion protein was incubated with a recombinant truncated (GST-RIPK11–479) or full-length (GST-RIPK1FL) form of RIPK1 in a radioactive in vitro kinase assay in the presence of the indicated inhibitors. Phosphorylation was revealed by SDS-PAGE followed by autoradiography. (D–G) MEFs with the indicated genotype (D and E) or Ripk1+/+ MEFs (F and G) were pre-incubated with zVAD-fmk and with the indicated compounds for 30 min and then stimulated with 20 ng/ml hTNF. After 4 hr, complex II was isolated by FADD or caspase-8 immunoprecipitation and RIPK1 binding revealed by immunoblotting. See also Figure S4.
IKKa/IKKb Mediate In Vivo Protection to RIPK1 KinaseDependent Death To test the in vivo relevance of our in vitro findings, we evaluated the contribution of RIPK1 kinase activity to two different mouse models of TNF-induced death. In the first one, we injected Ripk1K45A/K45A and Ripk1+/+ littermates with TNF in association with D-galactosamine. In this well-known model of acute hepatitis, TNF-mediated hepatocyte apoptosis is reported to result from transcriptional inhibition (Decker and Keppler, 1974), thereby affecting the NF-kB pathway downstream of IKKa/ IKKb. In accordance with our in vitro results, we found that Ripk1K45A/K45A mice were not protected from TNF-induced lethality and apoptotic liver damage, as monitored by survival curves, blood levels of aspartate transaminase/alanine transaminase (AST/ALT), caspase-3 activation in the liver by DEVDase assays, and active caspase-3 staining (Figures 6A–6E). Blood levels of lactate dehydrogenase (LDH), a marker of necrosis, were not upregulated by TNF+GalN injection (Figure 6F).
In the next model, we injected Ripk1K45A/K45A and Ripk1+/+ littermates with a sub-lethal dose of TNF (5 mg) in presence or absence of TPCA-1 (10 mg/kg) to inhibit the canonical NF-kB pathway at the level of IKKa/IKKb. Remarkably, while TPCA-1 hadnotoxicity onitsown(FiguresS5AandS5B),itscombination with TNF resulted in the rapid death of all Ripk1+/+, but no Ripk1K45A/K45A, mice (Figure 6G). Accordingly, Ripk1K45A/K45A mice were protected from TNF-induced hypothermia and had no increase in serum levels of ASL/ALT or caspase-3 activation in the liver (Figures 6H–6L). In contrast to TNF+GalN injection, TNF+TPCA-1 led to a substantial increase of LDH levels in the serum that was also absent in Ripk1K45A/K45A mice, suggesting additional necroptosis induction (Figure 6M). Importantly, RIPK1 kinase inhibition by co-administration of Nec-1s (Degterev et al., 2013), a modified and more stable version of Nec-1, in C57BL/6J mice also significantly delayed the death and injury induced by TNF+TPCA-1 injection (Figures S5C–S5I).
Together, these in vivo results demonstrate TNF-mediated RIPK1-independent and RIPK1 kinase-dependent hepatocyte apoptosis in condition of NF-kB inhibition downstream or at the level of IKKa/IKKb, respectively.
Figure 6. IKKa/IKKb Mediate In Vivo Protection to RIPK1 Kinase-Dependent Death (A) Cumulative survival rates of littermate Ripk1+/+ and Ripk1K45A/K45A C57BL/6J females injected with GalN 15 min prior to injection with mTNF (n = 5). (B, C, and F) Blood AST (B), ALT (C), and LDH (F) levels determined 3 hr post-TNF injection (Ripk1+/+ n = 3, and Ripk1K45A/K45A n = 4). (D and E) Caspase-3 activity in liver samples (Ripk1+/+ n = 3, and Ripk1K45A/K45A n = 4) isolated 3 hr post-TNF injection and determined by Ac-DEVD-AMC fluorescence assay (D) or anti-cleaved caspase-3 staining (E). (G) Cumulative survival rates of littermate Ripk1+/+ and Ripk1K45A/K45A C57BL/6J females injected with TPCA-1 20 min prior to injection with mTNF (n = 5). (H) Body temperature as a function of time. (I, J, and M) Blood AST (I), ALT (J), and LDH (M) levels determined 3 hr post-TNF injection (n = 4). (K and L) Caspase-3 activity in liver samples (n = 4) isolated 3 hr post-TNF injection and determined by Ac-DEVD-AMC fluorescence assay (K) or anti-cleaved caspase-3 staining (L). Scale bar, 25 mm. Error bars represent the SEM of the indicated n values. See also Figure S5.
IKKa/IKKb Protect Cells from RIPK1 Kinase-Dependent Necroptosis Independently of NF-kB Our in vivo results suggested that TNF+TPCA-1 additionally induced necroptosis in the injected mice. To test the possibility that IKKa/IKKb also regulates RIPK1 kinase-dependent necroptosis independently of NF-kB, we in vitro stimulated MEFs with TNF+CHX in the presence of the pan caspase inhibitor zVAD-fmk and of TPCA-1. As shown in Figure 7A,TNF-mediated
necroptosis induced by TNF+CHX+zVAD is fully repressed by Nec-1 but still greatly enhanced by additionally inhibiting IKKa/ IKKb with TPCA-1 (Figures 7A and S6A). The mouse fibrosarcoma cell line L929sAhFAS is a prototypic model for necroptosis since these cells succumb by necroptosis upon single TNF stimulation. While inhibiting NF-kB by CHX sensitized these cells to necroptosis, the sensitization was again enhanced when IKKa/ IKKb was additionally inhibited by TPCA-1 (Figures 7B and S6B). Our results therefore demonstrate that IKKa/IKKb prevent RIPK1 kinase-dependent apoptosis and necroptosis downstream of TNFR1 independently of their known function in protecting the cells from death by mediating NF-kB-dependent upregulation of pro-survival/anti-death genes.
RIPK1 kinase-dependent necroptosis relies on the downstream activation of the RIPK3-MLKL pathway (Cho et al., 2009; He et al., 2009; Pasparakis and Vandenabeele, 2015;Sun et al., 2012; Zhang et al., 2009; Zhao et al., 2012). To further characterize the contribution of RIPK3 to the lethality resulting from the in vivo injection of TNF+TPCA-1, we challenged Ripk3+/+ and Ripk3/ littermates with this trigger. Contrary to Ripk1K45A/K45A mice, Ripk3/ mice were greatly, but not entirely, protected from death and hypothermia induced by TNF+TPCA-1 (Figures 7C and 7D). Interestingly, the protection was not originating from the liver, as RIPK3 deficiency did not prevent liver damage (Figures 7E–7H). Instead, RIPK3 deficiency prevented the increased of LDH levels in the blood, resulting from necrosis of undefined organ(s) (Figure 7I). These in vivo results therefore suggest that the lethality induced by TNF+TPCA-1 results from both RIPK1 kinase-dependent apoptosis and necroptosis.
Figure 7. IKKa/IKKb Protect Cells from RIPK1 Kinase-Dependent Necroptosis Independently of NF-kB (A and B) Ripk1+/+ MEFs (A) and L929sAhFas cells (B) were stimulated with hTNF (20 ng/ml in A and 33 pg/ml in B) in the presence of the indicated compounds, and cell death was measured as a function of time by SytoxGreen positivity. (C) Cumulative survival rates of littermate Ripk3+/+ and Ripk3/ C57BL/6J females injected with TPCA-1 20 min prior to injection with mTNF (Ripk3+/+ n = 4, and Ripk3/ n = 7). (D) Body temperature as a function of time. (E, F, and I) Blood AST (E), ALT (F), and LDH (I) levels determined 3 hr post-TNF injection (Ripk3+/+ n = 4, and Ripk3/ n = 3). (G and H) Caspase-3 activity in liver samples (Ripk3+/+ n = 4, and Ripk3/n = 3) isolated 3 hr post-TNF injection and determined by Ac-DEVD-AMC fluorescence assay (G) or anti-cleaved caspase-3 staining (H). Scale bar,25mm.Fortheinvitrocell death results,error bars represent the SEM of three independent experiments. For the in vivo results,error bars represent the SEM of the indicated n values
Sensing of TNF by TNFR1 at the cell surface can paradoxically result in the activation of signaling pathways with opposite consequences: cell survival or cell death. The fact that survival is the dominant outcome in most cell types indicates the existence of molecular mechanisms actively repressing TNFR1-mediated cell death.Two major mechanisms have been reported to control cell death downstream of TNFR1 (O’Donnell and Ting, 2011).The first identified one is well characterized and consists in a relatively slow process involving the NF-kB-dependent induction of pro-survival/anti-death molecules, such as cFLIP (Karin and Lin, 2002; Kreuz et al., 2001; Liu et al., 1996; Micheau et al., 2001; Panayotova-Dimitrova et al., 2013; Van Antwerp et al., 1996; Wang et al., 1998). The second one, which is less understood and more recently reported, is believed to take place at an earlier stage following TNFR1 activation and is shown to be independent of the NF-kB response (Dondelinger et al., 2013; Legarda-Addison et al., 2009; O’Donnell et al., 2007, 2012; Wang et al., 2008). Interestingly, while the first checkpoint regulates slow apoptosis by inhibiting activation of complex IIa (TRADD-FADD-caspase-8), the second one regulates the contribution of RIPK1 to cell death by either preventing RIPK1 from integrating the apoptotic complex IIb (RIPK1-FADD-casapase-8) or by limiting its contribution to the necrosome (RIPK1RIPK3-MLKL) (Cho et al., 2009; He et al., 2009; Sun et al., 2012; Vanlangenakker et al., 2011; Wang et al., 2008; Wilson et al., 2009; Zhang et al., 2009; Zhao et al., 2012). It has long been thought that IKKa/IKKb inhibits TNF-induced cell death through activation of the NF-kB pathway. In this study, we provide evidences that IKKa and IKKb also regulate cell death by direct phosphorylation of RIPK1 at the level of TNFR1 complex I.
TNF-induced RIPK1-dependent apoptosis was first described in conditions affecting cIAP1/cIAP2-mediated RIPK1 ubiquitylation (Bertrand et al., 2008; O’Donnell et al., 2007; Petersen et al., 2007; Wang et al., 2008), which led to the hypothesis that the ubiquitin chains on RIPK1 were directly preventing its binding to FADD, keeping RIPK1 in a survival modus. This‘‘direct’’effect, however, has later been challenged. Binding of the adaptor proteins TABs and NEMO to RIPK1 ubiquitin chains allows recruitment of TAK1 and of IKKa/IKKb to TNFR1 complex I (Ea et al., 2006; Li et al., 2006; Wu et al., 2006), and TAK1 inhibition was shown to result in TNF-mediated RIPK1-dependent apoptosis without affecting RIPK1 ubiquitylation status (Dondelinger et al., 2013). We show here that RIPK1 is phosphorylated in complex I and that affecting RIPK1 ubiquitylation by cIAP1/ cIAP2depletion directlyimpactsitsphosphorylation.Incontrast, TAK1, NEMO, or IKKa/IKKb depletion affects RIPK1 phosphorylation and induces RIPK1-dependent cell death but does not alter its ubiquitylation state in complex I. Together, these results indicate that ubiquitylation and phosphorylation of RIPK1 occur sequentially and that RIPK1 phosphorylation regulates its killing potential. Because activation of the IKK complex lies downstream of TAK1 but upstream of IkBa and p65, our results suggest a model in which IKKa/IKKb constitute the last step in the regulation of the RIPK1 cell death checkpoint (graphical abstract). Indeed, p65 deletion, expression of IkBaSR, or CHX pre-treatment induces TNF-mediated RIPK1-independent apoptosis and does not alter RIPK1 ubiquitylation or phosphorylation in complex I.
RIPK1 enzymatic activity is needed for the integration of RIPK1 to complex IIb and to the necrosome, which respectively drives apoptosis or necroptosis under TNF-stimulated conditions (Cho et al., 2009; Dondelinger et al., 2013; He et al., 2009; Wang et al., 2008). The precise role of RIPK1 kinase activity in these processes remains unclear but may involve autophosphorylation-driven conformational changes allowing increased binding of RIPK1 to the death complex components. The kinase activity of RIPK1 therefore requires active repression to avoid unnecessary cell death. A recent report suggests that RIPK1 phosphorylation on Ser89 suppresses its kinase activity (McQuade et al., 2013). It is therefore tempting to speculate that IKK-mediated phosphorylation of RIPK1 in complex I affects RIPK1 kinase activity. Alternatively, the phosphorylation of RIPK1 by IKKs may directly affect binding of RIPK1 to the death complex components or facilitate its dissociation from complex I. We performed mass spectrometry analysis to identify the residues of RIPK1 phosphorylated by IKKa and IKKb and found several sites, but not Ser89 (Figures S4C and S4D). Unfortunately, we were unable to demonstrate the direct physiological relevance of the identified phosphorylation sites due to the fact that all Ripk1/ reconstituted MEFs, even those with WT RIPK1 (irrespective of RIPK1 expression levels), started to succumb upon single TNF stimulation (data not shown), a problem previously reported (Gentleetal., 2011). The fact that the combined repression of IKKa and IKKb is needed to induce RIPK1 kinase-dependent death, and that the phosphorylation by each kinase results in different RIPK1 mobility shifts when run on gels, may indicate that phosphorylation on several residues is required to negatively regulate RIPK1.
IKKa and IKKb are best known for their roles in NF-kB activation, but NF-kB-independent functions have also been reported, some of which are even implicated in cell fate decisions (Hinz and Scheidereit, 2014). Using pharmacological inhibition of IKKa/IKKb in a p65-deficient background, or together with CHX, we demonstrated an NF-kB-independent function of IKKa/IKKb in protecting cells from TNF-induced RIPK1 kinasedependent apoptosis and necroptosis. In vivo, we demonstrate that TNF induces apoptosis of hepatocytes independently of RIPK1 when the NF-kB pathway is affected downstream of IKKa/IKKb (TNF+GalN). In contrast, pharmacological inhibition of the NF-kB pathway at the level of IKKa/IKKb (TNF+TPCA-1) sensitizesmicetoTNF-inducedshock,whichisaccompaniedby RIPK1 kinase-dependent, but RIPK3-independent, apoptosis of hepatocytes and RIPK1/RIPK3-dependent cellular death, presumably necroptosis, in undefined organs. We can indeed not formally rule out the possibility that the increase in serum LDH levels originates from secondary necrosis of apoptotic cells. Importantly, genetic and chemical inhibition of RIPK1 enzymatic activity protected the mice from TNF-induced cellular damage and death. These results therefore demonstrate the in vivo roles of IKKa/IKKb in protecting cells from RIPK1 kinase-dependent death.
The LUBAC complex, which includes its component Sharpin, is recruited to complex I during TNF signaling, and the inactivating mouse Sharpin cpdm mutation was reported to cause multi-organinflammationresultingfromTNF-mediated RIPK1kinase-dependent death (Berger et al., 2014; Kumari et al., 2014; Rickard et al., 2014). In line with our results, we found that TNF-mediated RIPK1 kinase-dependent death of mouse dermal fibroblasts (MDFs) isolated from Sharpincpdm mice is associated with defective RIPK1 phosphorylation in complex I (Figures S7A and S7B), probably resulting from the altered recruitment of IKK proteins to complex I, as previously reported for other LUBAC components (Haas et al., 2009). The genetic disruption of Nemo, Ikka, Ikkb, orIkka/Ikkb in mice results in early lethality with massive cellular death in several organs, such as the liver, the skin, and, in the case of Ikka//b/ mice, the nervous system (Hu et al., 1999; Li et al., 1999, 2000; Rudolph et al., 2000; Takeda et al., 1999). So far, these phenotypes have exclusively been explained by defects in NF-kB activation, but our study indicates that RIPK1 activation probably contributes to these pathological conditions. In the same line, RIPK1 kinase-dependent apoptosis may drive the spontaneous development of hepatocellular carcinoma observed in mice ablated of Nemo in the liver parenchymal cells (Luedde et al., 2007). Testing the contribution of RIPK1 to those phenotypes is an exciting future challenge, which may open doors for the use of chemical inhibitors of RIPK1 in the treatment of human diseases associated with IKK malfunctions, such as incontinentia pigmenti (Conte et al., 2014).
Translocation of interleukin-1β into a vesicle intermediate in autophagy-mediated secretion
Min Zhang1, Sam Kenny2, Liang Ge1, Ke Xu2 and Randy Schekman1*
eLife 2015;10.7554/eLife.11205 http://dx.doi.org/10.7554/eLife.11205
In this study, we probed the organelle association and molecular requirements for the secretion of one such unconventional cargo protein, IL-1β. Using surrogate cell lines rather than macrophages to reconstitute autophagy-mediated secretion of IL-1β (Figure 1), we find mature IL-1β localized to the lumen of the membrane in early intermediates and mature autophagosomes (Figures 2-4, 6). This surprising location may help to explain how mature IL-1β is secreted in a soluble form to the cell surface (Figure 9C). However, localization to the lumen between the two membranes of the autophagosome would require that IL-1β is translocated from the cytoplasm across the membrane precursor of a phagophore, rather than being engulfed as the phagophore membrane matures by closure into an autophagosome.
The exact route by which the autophagosome delivers mature IL-1β to the cell surface as well as how it avoids fusion with degradative lysosome remains obscure, possibly involving interaction with the multi-vesicular body or some form of lysosome as a prelude to fusion at the cell surface (Figure 9C), and this process may require selective recruitment of membrane sorting and targeting factors such as Rabs and SNAREs.
Recent evidence suggests that autophagy facilitates the unconventional secretion of the pro-inflammatory cytokine interleukin 1β (IL-1β). Here, we reconstituted an autophagy-regulated secretion of mature IL-1β (m-IL-1β) in non-macrophage cells. We found that cytoplasmic IL-1β associates with the autophagosome and m-IL-1β enters into the lumen of a vesicle intermediate but not into the cytoplasmic interior formed by engulfment of the autophagic membrane. In advance of secretion, m-IL-1β appears to be translocated across a membrane in an event that may require m-IL-1β to be unfolded or remain conformationally flexible and is dependent on two KFERQ-like motifs essential for the association of IL-1β with HSP90. A vesicle, possibly a precursor of the phagophore, contains translocated m-IL-1β and later turns into an autophagosome in which m-IL-1β resides within the intermembrane space of the double-membrane structure. Completion of IL-1β secretion requires Golgi reassembly and stacking proteins (GRASPs) and multi-vesicular body (MVB) formation.
Most eukaryotic secretory proteins with an N-terminal signal peptide are delivered through the classical secretion pathway involving an endoplasmic reticulum (ER)-to-Golgi apparatus itinerary (Lee et al., 2004; Schatz and Dobberstein, 1996). However, a substantial number of secretory proteins lack a classical signal peptide, called leaderless cargoes, and are released by unconventional means of secretion (Nickel and Rabouille, 2009; Nickel and Seedorf, 2008). The range of unconventional secretory cargoes encompasses angiogenic growth factors, inflammatory cytokines and extracellular matrix components etc. most of which play essential roles for development, immune surveillance and tissue organization (Nickel, 2003; Rabouille et al., 2012). Unlike a unified route for classical protein secretion, leaderless cargoes undergoing unconventional secretion employ multiple means of protein delivery, the details of which are largely unknown (Ding et al., 2012; Nickel, 2010; Rabouille et al., 2012; Zhang and Schekman, 2013).
IL-1β is one of the most intensely investigated cargoes of unconventional secretion. A biologically inactive 31 kDa precursor, pro-IL-1β, is made following initiation of the NF-κB signaling cascade. Pro-IL-1β is subsequently converted into the active form, the 17 kDa mature IL-1β, by the pro-inflammatory protease caspase-1 which is activated, in response to extracellular stimuli, after its recruitment to a multi-protein complex called the inflammasome (Burns et al., 2003; Cerretti et al., 1992; Rathinam et al., 2012; Thornberry et al., 1992). Interpretation of the mechanism of unconventional secretion of IL-1β is complicated by the fact that one of the physiologic reservoirs of this cytokine, macrophages, undergoes pyroptotic death and cell lysis under conditions of inflammasome activation of caspase-1. Indeed, many reports including two recent publications make the case for cell lysis as a means of release of mature IL-1β (Liu et al., 2014; Shirasaki et al., 2014). In contrast, other reports demonstrate proper secretion of mature IL-1β without cell lysis in, for example, neutrophils, which are nonetheless dependent on the inflammasome response to activate caspase-1 and secrete mature IL-1β (Chen et al., 2014).
Macroautophagy (hereafter autophagy) is a fundamental mechanism for bulk turnover of intracellular components in response to stresses such as starvation, oxidative stress and pathogen invasion (Mizushima and Levine, 2010; Yang and Klionsky, 2010). The process is characterized by the formation of a double-membrane vesicle, called the autophagosome, through the elongation and closure of a cup-shaped membrane precursor, termed the phagophore, to engulf cytoplasmic cargoes (Hamasaki et al., 2013; Lamb et al., 2013). Completion of autophagosome formation requires a sophisticated protein-vesicle network organized by autophagic factors, such as autophagy-related (ATG) proteins, and target membranes (Feng et al., 2014; Mizushima et al., 2011). Besides the degradative function, autophagy or ATG proteins have recently been implicated in multiple secretory pathways including the delivery of leaderless cargoes undergoing unconventional secretion, such as the mammalian pro-inflammatory cytokines IL-1β and IL-18, the nuclear factor HMGB1, and the yeast acyl coenzyme A-binding protein Acb1, to the extracellular space (Bruns et al., 2011; Dupont et al., 2011; Duran et al., 2010; Manjithaya and Subramani, 2011; Pfeffer, 2010; Subramani and Malhotra, 2013). The Golgi reassembly and stacking protein(s) GRASP(s) (GRASP55 and GRASP65 in mammals, dGRASP in Drosophila, GrpA in Dictyostelium and Grh1 in yeast) are required for autophagy-regulated unconventional secretion (Giuliani et al., 2011; Kinseth et al., 2007; Levi and Glick, 2007; Manjithaya et al., 2010).
Dupont et al. (2011) documented a role for autophagy in the secretion of mature IL-1β (Dupont et al., 2011), but how a protein sequestered within an autophagosome could be exported as a soluble protein was unexplained. Here, we sought to understand how conditions of starvation-induced autophagy could localize IL-1β into an autophagosomal membrane. We reconstituted the autophagy-regulated secretion of IL-1β in cultured cell lines and detected a vesicle intermediate, possibly an autophagosome precursor, containing mature IL-1β. Three-dimensional (3D) Stochastic Optical Reconstruction Microscopy (STORM) demonstrated that, after entering into the autophagosome, IL-1β colocalizes with LC3 on the autophagosomal membrane, which, together with an antibody accessibility assay and observations from biochemical assays, implies a topological distribution in the intermembrane space of the autophagosome. This distribution of IL-1β explains the mechanism accounting for its secretion as a soluble protein through either a direct fusion of autophagosome with the plasma membrane or via the MVB pathway. Quite aside from the possible complication of cell lysis, another body of work has suggested an unconventional pathway for the proper secretion of IL-1β. Pro-IL-1β lacks a typical signal peptide and the propeptide is processed in the cytosol rather than the ER (Rubartelli et al., 1990; Singer et al., 1988). Although mature IL-1β appears to be incorporated into a vesicular transport system, secretion is not blocked by Brefeldin A, a drug that blocks the traffic of standard secretory proteins form the Golgi apparatus (Rubartelli et al., 1990). Multiple mechanisms have been implicated in the unconventional secretion of IL-1β, including autophagy, secretory lysosomes, multi-vesicular body (MVB) formation and micro-vesicle shedding (Andrei et al., 1999; Andrei et al., 2004; Brough et al., 2003; Lopez-Castejon and Brough, 2011; MacKenzie et al., 2001; Qu et al., 2007; Verhoef et al., 2003). However, a clear demonstration of the mechanism for the entry of IL-1β into a vesicular carrier, e.g. the autophagosome, is lacking.
Reconstitution of autophagy-regulated IL-1β secretion
A dual effect of autophagy has been proposed on the secretion of IL-1β in macrophages (Deretic et al., 2012; Jiang et al., 2013). On one hand, induction of autophagy directly promotes IL-1β secretion after inflammasome activation by incorporating it into the autophagosomal carrier (Dupont et al., 2011). On the other hand, autophagy indirectly dampens IL-1β secretion by degrading components of the inflammasome as well as reducing endogenous triggers for inflammasome assembly, including reactive oxygen species (ROS) and damaged components, which are required for the activation of caspase-1 and the production of active IL-1β (Harris et al., 2011; Nakahira et al., 2011; Shi et al., 2012; Zhou et al., 2011).
To focus our study specifically on the role of autophagy in IL-1β secretion, we reconstituted a stage of IL-1β secretion downstream of inflammasome activation by co-expressing pro-IL-1β (p-IL-1β) and pro-caspase-1 (p-caspase-1) in non-macrophage cells. As shown in Figure 1A, the generation and secretion (~5%) of mature IL-1β (m-IL-1β) was achieved by co-expression of p-IL-1β and p-caspase-1 in HEK293T cells. Mature IL-1β was not produced or secreted without p-caspase-1, whereas a low level of secreted p-IL-1β (~0.2%) was detected with or without the expression of p-caspase-1. Furthermore, little cell lysis occurred during the treatment we used to induce IL-1β secretion: Much less precursor than mature IL-1β and little cytoplasmic tubulin was detected released into the cell supernatant during the 2 h incubation in starvation medium (Figure 1A). Starvation, a condition that stimulates autophagy, enhanced IL-1β secretion (~3 fold) and reduced the level of IL-1β in the cell lysates (Figure 1A, B). Inhibition of autophagy by the phosphatidylinositol 3-kinase (PI3K) inhibitors 3-methyladenine (3-MA) or wortmannin (Wtm) blocked IL-1β secretion activated by starvation and caused the accumulation of mature IL-1β in the cell (Figure 1B). Likewise, in an autophagy-deficient cell line, Atg5 knockout (KO) mouse embryo fibroblasts (MEFs) (Mizushima et al., 2001), IL-1β secretion was reduced and failed to respond to starvation (Figure 1C). Moreover, IL-1β secretion was also inhibited in a dose-dependent manner in the presence of an ATG4B mutant (C74A) (Fujita et al., 2008), or after the depletion of ATG2A and B (Velikkakath et al., 2012), or FIP200 (Hara et al., 2008), which block autophagosome biogenesis at different stages (Figure 1D-F). Therefore, the reconstituted system recapitulates the autophagy-regulated secretion of IL-1β.
In macrophages, MVB formation and GRASP proteins are required for IL-1β secretion (Dupont et al., 2011; Qu et al., 2007). Inhibiting MVB formation by depletion of the ESCRT components, hepatocyte growth factor receptor substrate (Hrs) or TSG101, compromised secretion of IL-1β and CD63, an exosome marker (Figure 1-figure supplement 1A). Knockdown of the GRASP55 or GRASP65 also led to the reduction of IL-1β secretion (Figure 1- figure supplement 1B). Therefore, in addition to functions required for autophagy, the secretion of IL-1β in HEK293T cells depends on GRASP proteins and at least two proteins implicated in MVB formation, as reported previously (Dupont et al., 2011; Qu et al., 2007).
Figure 1 Reconstitution of autophagy-regulated IL-1β secretion in cultured cells (A) Reconstitution of starvation-induced IL-1β secretion in HEK293T cells. HEK293T cells were transfected with a single plasmid encoding p-IL-1β or together with the p-caspase-1 plasmid. After transfection (24 h), the cells were either treated in regular (DMEM) or starvation (EBSS) medium for 2 h. The medium and cells were collected separately and immunoblot was performed to determine the level of indicated proteins. (B) PI3K inhibitors 3-methyladenine (3-MA) or wortmannin (Wtm) inhibit IL-1β secretion. HEK293T cells transfected with p-IL-1β and p-caspase-1 plasmids were cultured in DMEM, EBSS, or EBSS containing 10 mM 3-MA or 20 nM wortmannin for 2 h. The medium and cells were collected separately and immunoblot was performed as shown in (A). (C) IL-1β secretion is blocked in Atg5 KO MEFs. Control WT or Atg5 KO MEFs were transfected with p-IL-1β and p-caspase-1 plasmids. After transfection (24 h), the cells were either cultured in DMEM or EBSS for 2 h followed by immunoblot as shown in (A). (D) IL-1β secretion is inhibited by the ATG4B mutant (C74A). HEK293T cells were transfected with plasmids encoding p-IL-1β, p-caspase-1 and different amounts of ATG4B (C74A) plasmid DNA as indicated. After transfection (24 h), cells were starved in EBSS for 2 h followed by immunoblot as shown in (A). (E) Knockdown of Atg2 reduces IL-1β secretion. HEK293T cells were transfected with control siRNA or siRNAs against Atg2A, Atg2B alone or both. After transfection (48 h), the cells were transfected with p-IL-1β and p-caspase-1 plasmids. After another 24 h, the cells were starved in EBSS for 2 h followed by immunoblot as shown in (A). (F) Knockdown of FIP200 reduces IL-1β secretion. HEK293T cells were transfected with control siRNA or FIP200 siRNA. IL-1β secretion under starvation conditions was determined as shown in (E). Quantification of IL-1β secretion was calculated as the ratio between the amount of IL-1β in the medium and the total amount (the sum of IL-1β in both medium and lysate).
Figure 1- figure supplement 1 Depletion of ESCRT or GRASPs affects IL-1β secretion HEK293T cells were transfected with indicated siRNAs (Hrs (ESCRT-0) (A), Tsg101 (ESCRT-I) (A), GRASP55 (B) or GRASP65 (B)). After transfection (48 h), the cells were transfected with p-IL-1β and p-caspase-1 plasmids. After another 24 h, the cells were starved in EBSS for 2 h followed by immunoblot as shown in Figure 1A. Quantification of IL-1β secretion was calculated as the ratio between the amount of IL-1β in the medium and the total amount (the sum of IL-1β in both medium and lysate).
IL-1β transits through an autophagosomal carrier during secretion.
To study if autophagy directly regulates IL-1β secretion, we employed a three-step membrane fractionation procedure as described previously (Figure 2A)(Ge et al., 2013). We first performed a differential centrifugation to obtain 3k, 25k and 100k membrane pellet fractions. Both IL-1β and the lipidated form of LC3 (LC3-II), a protein marker of autophagosome, were mainly enriched in the 25k membrane fraction (Figure 2B). We then separated the 25k membrane through a sucrose step gradient ultracentrifugation where both IL-1β and LC3-II co-distributed in the L fraction at the boundary between 0.25 M and 1.1 M layer of sucrose (Figure 2B). Further fractionation of the L fraction using an OptiPrep gradient showed co-fractionation of IL-1β with LC3-II (Figure 2C). To confirm the presence of IL-1β in the autophagosome, we performed immunoisolation of LC3-positive autophagosomes from the 25k fraction and found that IL-1β, especially the mature form, co-sedimented with autophagosomes (Figure 2D). Consistent with our observations, a recent study also showed a colocalization of IL-1β and LC3 in the form of puncta in macrophages (Dupont et al., 2011). These data demonstrate that at least a fraction of intracellular mature IL-1β associates with the autophagosome, possibly related to its role in IL-1β secretion.
Figure 2 IL-1β vesicles co-fractionate with LC3 vesicles (A) Membrane fractionation scheme. Briefly, HEK293T cells transfected with p-IL-1β and p-caspase-1 plasmids were starved in EBSS for 2 h, collected and homogenized. Cell lysates were subjected to differential centrifugations at 3,000×g (3k), 25,000×g (25k) and 100,000×g (100k). The level of IL-1β in each membrane fraction was determined by immunoblot. The 25k pellet, in which IL-1β was mainly enriched, was selected and a sucrose gradient ultracentrifugation was performed to separate membranes in the 25k pellet to the L (light) and P (pellet) fractions. The L fraction, which contained the majority of IL-1β, was further resolved on an OptiPrep gradient after which ten fractions from the top were collected. (B, C) Immunoblot was performed to examine the distribution of IL-1β, LC3 as well as the indicated membrane markers in the indicated membrane fractions. T, top; B, bottom (D) HEK293T cells transfected with p-IL-1β, p-caspase-1 and FLAG-tagged LC3-I plasmids were starved in EBSS for 2 h. LC3 positive membranes were immunoisolated with anti-FLAG agarose from the 25k pellet and the presence of IL-1β was determined by immunoblot analysis. FT, flowthrough.
To determine if IL-1β is localized to the phagophore in the absence of autophagosome completion, we fractionated membranes from ATG2-depleted cells, which are deficient in phagophore elongation and therefore fail to form mature autophagosomes (Velikkakath et al., 2012), and examined the distribution of LC3-II, which remains attached to immature phagophore membranes, and mature and precursor IL-1β. We performed the three-step fractionation described above. In control cells, IL-1β co-distributed with LC3-II in all three steps (Figure 3). Depletion of ATG2 did not affect the co-fractionation of IL-1β and LC3-II (Figure 3), indicating that IL-1β enters into the phagophore membrane before the completion of the autophagosome.
Figure 3 IL-1β co-distributes with LC3 in Atg2-depleted cells (A) HEK293T cells were transfected with siRNAs against Atg2A and Atg2B followed with p-IL-1β and 739 p-caspase-1 plasmids as shown in Figure 1E. The cells were starved in EBSS for 2 h. Membrane fractions (3k, 25k, 100k (×g), L and P) were separated from the post-nuclear supernatant as depicted in Figure 2B. (B) Ten membrane fractions were collected from the OptiPrep gradient ultracentrifugation as depicted in Figure 2C. Immunoblot was performed to examine the distribution of IL-1β, LC3 as well as the indicated membrane markers. T, top; B, bottom.
Autophagosome formation is not required for entry of IL-1β into vesicles
We asked how IL-1β enters into the autophagosome. One possibility is engulfment through the closure of the phagophore membrane during autophagosome maturation as in the capture of autophagic cargo. In this scenario, closure of the phagophore to complete autophagosome formation would be required to sequester IL-1β away from the cytoplasm. Alternatively, we considered the possibility that IL-1β may be translocated through a membrane into the lumen of the phagophore envelope and be sequestered from the cytoplasm even before the mature autophagosome is sealed. To test this possibility, we performed proteinase K protection experiments with the membranes from ATG2-depleted cells (Figure 4A). In control cells, p62 (an autophagic cargo) and a fraction of LC3-II (which was encapsulated after autophagosome completion), as well as mature IL-1β, were largely resistant to proteinase K digestion similar to the ER luminal protein, protein disulfide isomerase (PDI). In contrast, SEC22B, a membrane anchored SNARE protein exposed to the cytoplasm, was sensitive to proteinase K digestion (Figure 4A). Triton X-100 treatment permeabilized the membrane and rendered all proteins tested sensitive to proteinase K digestion (Figure 4A). This demonstrated that the majority of membrane localized IL-1β was sequestered within an organelle, likely the autophagosome, as demonstrated by the fractionation results of Figures 2 and 3. However, the result did not pinpoint where within the autophagosome IL-1β was housed. In ATG2-depleted cells, p62 and LC3-II remained sensitive to proteinase K digestion, consistent with the hypothesis that ATG2 is essential for maturation and closure of the autophagosome (Figure 4A). However, in the same samples the majority of IL-1β resisted degradation by proteinase K treatment (Figure 4A), except on addition of Triton X-100 to permeabilize membranes. Although the precursor form of IL-1β remained associated with isolated autophagosome and phagophore membranes (Figure 3), the protein was degraded when membranes from normal and ATG2-depleted cells were treated with protease in the presence or absence of Triton X-100 (data not shown). Thus, the mature but not the precursor IL-1β appears to be transported into the phagophore.
A most recent study showed that small, closed double-membrane structures could be observed in ATG2-depleted cells (Kishi-Itakura et al., 2014). To rule out the possibility that IL-1β was engulfed by the small closed autophagosomes, we employed Atg5 KO MEFs in which the phagophore could not be closed (Kishi-Itakura et al., 2014; Mizushima et al., 2001). Similar to what we observed in ATG2-depleted cells, IL-1β was protected from proteinase K digestion in membranes from Atg5 KO MEFs (Figure 4B). In addition, IL-1β was sequestered within vesicles in FIP200 (another early factor in phagophore development (Hara et al., 2008)) knockdown cells (Figure 4C). These data indicate that the entry of IL-1β into the vesicle carrier is not dependent on the formation of the autophagosome. These results are inconsistent with a role for engulfment of IL-1β by the maturing phagophore and suggest instead that IL-1β may be translocated across a membrane into a vesicle precursor of the phagophore, possibly at a very early stage in the development of the organelle.
Figure 4 Closure of the autophagosome is not required for the entry of IL-1β into vesicles (A) HEK293T cells were transfected with siRNAs against Atg2A and Atg2B followed by transfection with p-IL-1β and p-caspase-1 plasmids as shown in Figure 1E. The cells were starved in EBSS for 2 h and proteinase K digestion was performed with the 25k membrane fractions. (B) Atg5 WT, KO MEFs were transfected with p-IL-1β and p-caspase-1 plasmids as shown in Figure 1B. The cells were starved in EBSS for 2 h followed by proteinase K digestion as shown in (A). 752 (C) HEK293T cells were transfected with siRNA against FIP200 followed by analysis of membrane entry of 753 IL-1β as shown in (A). The level of proteinase K protection was calculated as the percentage of the total protein. Error bars represent standard deviations of at least three experiments.
Entry of IL-1β into the vesicle carrier requires protein conformational flexibility
We then sought to test if IL-1β could directly translocate across the membrane of a vesicle carrier. As protein unfolding is usually required for protein translocation, we adopted an approach used in many other circumstances wherein a targeted protein is fused to dihydrofolate reductase (DHFR), an enzyme whose three-dimensional structure is stabilized by the folate derivative aminopterin, hence providing a chemical ligand to impede the unfolding process (Backhaus et al., 2004; Eilers and Schatz, 1986; Wienhues et al., 1991). We first determined the secretion of the DHFR-fused IL-1β. As shown in Figure 5A, secretion of a mature IL-1β-DHFR fusion protein was enhanced by starvation similar to the untagged counterpart. Importantly, IL-1β-DHFR secretion was reduced in a dose-dependent manner in the presence of aminopterin (Figure 5B). Of notice, treatment of aminopterin did not completely abolish IL-1β secretion perhaps due to a cell death-induced release of IL-1β at high concentrations of aminopterin, as indicated by the release of a low level of tubulin into the medium fraction (Figure 5B). As a control, aminopterin did not reduce the secretion of untagged IL-1β, confirming its specific effect on DHFR (Figure 5- figure supplement 1). Fractionation of cells 185 incubated with aminopterin showed a reduced level of IL-1β in the membrane fraction with a corresponding 186 increase in the cytosol fraction (Figure 5C). The residual DHFR-tagged IL-1β associated with membranes from aminopterin-treated cells was sensitive to proteinase K digestion (Figure 5D), indicating that this pool of membrane-associated IL-1β did not translocate into the lumen of the vesicle. The data suggest that entry of IL-1β into a vesicle carrier involves a process of protein unfolding and translocation.
Figure 5 Protein unfolding is required for the entry of IL-1β into vesicles (A) Secretion of DHFR-tagged IL-1β. HEK293T cells were transfected with p-IL-1β-DHFR and p-caspase-1 plasmids. After transfection (24 h), the cells were treated with DMEM or EBSS for 2 h. Release of IL-1β was determined as shown in Figure 1. (B) Secretion of IL-1β-DHFR was inhibited by aminopterin. HEK293T cells were transfected with p-IL-1β-DHFR and p-caspase-1 plasmids. After transfection (24 h), the cells were treated with EBSS, or EBSS containing different concentrations of aminopterin as indicated for 15 min followed by determination of IL-1β secretion as shown in (A). Quantification of IL-1β secretion was calculated as the ratio between the amount of IL-1β in the medium and the total amount (the sum of IL-1β in both medium and lysate). (C) Less IL-1β enters into membrane in the presence of aminopterin. HEK293T cells were transfected with p-IL-1β-DHFR and p-caspase-1 plasmids. After transfection (24 h), the cells were either untreated or treated with 5 μM aminopterin in EBSS for 2 h. The membrane fraction was collected from the top fractions of a Nycodenz density gradient resolved from membranes in a 25k pellet as described in Material and Methods. The cytosolic fraction was collected as the supernatant after 100k×g centrifugation. All fractions were analyzed by immunoblotting using indicated antibodies. (D) IL-1β-DHFR is not protected from proteinase K in the presence of aminopterin. Nycodenz -floated membrane fraction collected as shown in (C) was subjected to proteinase K digestion and then analyzed by immunoblotting using indicated antibodies.
Figure 5- figure supplement 1 Secretion of IL-1β is not affected by aminopterin HEK293T cells were transfected with p-IL-1β and p-caspase-1 plasmids. After transfection (24 h), the cells were treated with EBSS, or EBSS containing different concentrations of aminopterin as indicated for 15 min followed by determination of IL-1β secretion as shown in Figure 1 (A).
IL-1β colocalizes with LC3 on the autophagosome envelope
If IL-1β is directly translocated across the membrane of a vesicle intermediate, fusion of these vesicles to form a double-membrane autophagosome would deposit IL-1β in the lumen between the two membranes of the autophagosome. To visualize the subcellular localization of IL-1β, we employed U2OS cells, which formed 194 large and distinct autophagosomes after starvation. U2OS cells co-expressing p-IL-1β and p-caspase-1 secreted IL-1β in a starvation-enhanced and PI3K-dependent manner similar to HEK293T cells (Figure 6- figure supplement 1). To prepare for the subsequent fluorescence imaging, we also employed a FLAG-tagged m-IL-1β, which allowed us to directly determine the topological localization of the m-IL-1β. Secretion of m-IL-1β-FLAG from U2OS cells was stimulated by starvation and dependent on PI3K (Figure 6- figure supplement 1).
To determine the topological distribution of IL-1β, we first performed confocal immunofluorescence labeling experiments. After starvation, cells were exposed to 40 μg/ml of digitonin to permeabilize the plasma membrane, harvested and washed with cold PBS to remove the excess cytosolic m-IL-1β-FLAG. In cells expressing either p-IL-1β and p-caspase-1, or m-IL-1β alone, LC3 and IL-1β were observed by confocal microscopy to localize together or adjacent to one another on the edge of ring-shaped autophagosomes (Figure 6- figure supplement 2). To further resolve these ring structures, we employed 3D STORM (Huang et al., 2008; Rust et al., 2006) super-resolution microscopy (Hell, 2007; Huang et al., 2010) (Figure 6 and Figure 6- figure supplements 3, 4 and Videos 1 and 2). Ring-shaped autophagosomes positive for LC3 (cyan) formed after starvation. Some IL-1β (magenta) also organized in ring-shaped structures that co-localized with LC3 (Figure 6 and Figure 6- figure supplement 3). Around 18 ring structures of IL-1β accounting for ~5% of the total IL-1β signal were observed in each cell. A 3D virtual Z-stack analysis confirmed the spatial co-distribution of LC3 and IL-1β on a ball-shaped vesicle (Video 1 and 2). The diameter of the structures double-labeled with LC3 and IL-1β are ~700 nm (larger structures up to 2 μm in diameter were also found) which is comparable to the size of the autophagosome. Occasionally, we also found IL-1β localized in the center of the ring structure, where cytoplasmic autophagic cargoes fill, surrounded by LC3 (Figure 6-figure supplement 4). This portion of IL-1β was possibly being engulfed by the autophagosome.
The visual detection of IL-1β localized to ring-shaped autophagosomes is consistent with our biochemical assays that place IL-1β in the intermembrane space between the outer and inner membrane of the autophagosome. We devised a further visual test of this conclusion using selective permeabilization of cell surface and intracellular membranes with digitonin and saponin, respectively (Figure 6-figure supplement 5). We compared antibody accessibility to IL-1β and DFCP1, a marker located on the cytosolic surface of the omegasome (a harbor for the phagophore) in both WT and Atg5 KO cells. Consistent with a cytosolic surface localization, DFCP1 was readily labeled in cells treated with digitonin alone (selectively permeabilizes the plasma membrane) in both WT and Atg5 KO cells (Figure 6-figure supplement 5A-E). In contrast, IL-1β was accessible to the antibody only after treatment with digitonin and saponin (gently permeabilizes the endomembrane) (Figure 6-figure supplement 5A, B and F) in WT cells. This by itself would not distinguish localization of IL-1β to the intermembrane space vs the cytoplasmic enclosed space of a mature autophagosome. However, in Atg5 KO cells where the phagophore precursor envelope remains open and exposed to the cytosol, saponin treatment was necessary to expose IL-1β to antibody and roughly half of the labeled structures coincided with the phagophore marker DFCP1 (Figure 6-figure supplement 5C, D and F). This visual assay further confirms the intermembrane localization of IL-1β in the phagophore and 231 autophagosome.
Figure 6 Topological localization of IL-1β in the autophagosomal carrier determined by STORM U2OS cells were transfected with a plasmid containing the expression cassette of FLAG-tagged mature IL-1β (m-IL-1β-FLAG). After transfection (24 h), the cells were starved in EBSS for 1 h followed by immunofluorescence labeling with mouse monoclonal anti-LC3 and rabbit polyclonal anti-FLAG antibodies. STORM analysis imaging and data analysis were performed as described in Materials and Methods. Cyan, LC3; Magenta, IL-1β; Bars: 2 μm (original image) and 500 nm (magnified inset)
Figure 6- figure supplement 1 Secretion of IL-1β in U2OS cells 795 U2OS cells were transfected with plasmids encoding the p-IL-1β and p-caspase-1 (first 4 lanes) or m-IL-1β-FLAG (last 4 lanes). After transfection (24 h), the cells were untreated or starved in the absence or presence of indicated PI3K inhibitors (3-MA or wortmannin (Wtm)) followed by measurement of secretion as indicated in Figure 1 (A) and (B). α-m-IL-1β, IL-1b antibody; α-FLAG, FLAG antibody
Figure 6- figure supplement 2 Localization of IL-1β determined by confocal microscopy U2OS cells were transfected with plasmids encoding the p-IL-1β and p-caspase-1 (A) or m-IL-1β-FLAG (B). After transfection (24 h), the cells were starved for 1 h followed by immunofluorescence labeling and confocal 804 microscopy analysis. Bar: 10 μm
Figure 6- figure supplement 3 Extra images for Figure 6 Bars: 2 μm (original image) and 500 nm (magnified inset)
Figure 6- figure supplement 4 A minority of IL-1β engulfed by autophagosome U2OS cells were transfected and treated followed by STORM analysis as shown in Figure 6. Arrow head points to the autophagosome with engulfed IL-1β. Bar: 2 μm
Figure 6- figure supplement 5 Determination of the topological localization of IL-1β in the autophagosome and phagophore (A, C) Diagrams of autophagosome (A)/phagophore (B) and omegasome, antibody accessibility for each possible situation of IL-1β localization, and summaries of the antibody accessibility of m-IL-1β-FLAG (red) and EGFP-DFCP1 (green) are illustrated. (B, D) U2OS cells (B) and Atg5 KO MEFs (D) were transfected with plasmids encoding the m-IL-1β-FLAG and EGFP-DFCP1. After transfection (24 h), the cells were starved in EBSS for 1 h followed by digitonin treatment and fixation (see Materials and Methods). The cells were either labeled with anti-FLAG (to label IL-1β) and anti-EGFP (to label EGFP-DFCP1) antibodies (Digitonin) or further treated with Saponin followed by antibody labeling (Digitonin+Saponin). Images were acquired by confocal microscopy. Bar: 10 μm 825 (E) Quantification of the percentage of EGFP-DFCP1 labeled by EGFP antibody. Percentage was counted by 826 the ratio of puncta numbers of antibody labeled EGFP-DFCP1 and EGFP-DFCP1 according to the EGFP signal. Error bars are standard deviations of more than 50 cells in two independent experiments. (F) Quantification of the puncta number for m-IL-1β-FLAG puncta (red) and those colocalized with DFCP1 (yellow). Error bars are standard deviations of more than 50 cells in two independent experiments.
Video 1 832 3D section of the magnified structure in Figure 6 (upper one) 833 The virtual Z-section thickness is 150 nm, and the step size is 50 nm. Cyan, LC3; Magenta, IL-1β; Bar 500 nm 834 835 Video 2 836 3D section of the magnified structure in Figure 6 (lower one) 837 The virtual Z-section thickness is 150 nm, and the step size is 50 nm. Cyan, LC3; Magenta, IL-1β; Bar 500 nm
Two KFERQ-like motifs are required for the entry of IL-1β into the vesicle carrier
In chaperone-mediated autophagy (CMA), cargoes are recognized by a KFERQ sequence motif for transport into the lysosome (Dice et al., 1986; Kaushik and Cuervo, 2012). We analyzed the primary sequence of IL-1β and found three KFERQ-like motifs on IL-1β including 127LRDEQ131, 132QKSLV136 and 198QLESV202 (Figure 7A). We mutated the glutamine, which has been shown to be essential for the function of the motif, as well as an adjacent amino acid in each motif (E130Q131, Q132K133 and Q198L199) to alanines and examined the secretion efficiency of these mutants. The 130-131AA mutant did not affect secretion of IL-1β (Figure 7B). However, the Q132K133 and Q198L199 mutations were both defective in secretion of mature IL-1β which instead accumulated in the cytoplasmic fraction (Figure 7B). A low level of release of the pro-forms persisted as seen with WT and mutant protein (Figure 7B). The cytoplasmic mature forms of the mutant proteins were less abundant in the membrane fraction compared with the WT mature IL-1β (Figure 7C, compare the lanes without proteinase K treatment). In addition, the membrane associated mutant IL-1β remained proteinase K accessible (less than 10% of protection compared with ~45% of WT IL-1β), demonstrating that these two KFERQ-like motifs are required for the membrane translocation of IL-1β (Figure 7C). Equal amounts of WT and mutant p-IL-1β associated with the membrane but both remained largely proteinase K accessible (Figure 7C).
Figure 7 Mutation of the KFERQ-like motif affects IL-1β secretion and entry into vesicles (A) Protein sequence of IL-1β. The yellow region indicates mature IL-1β. Three KFERQ-like motifs (aa127-131, aa132-136 and aa198-202) are highlighted in red underlined bold. (B) Secretion of IL-1β mutants. HEK293T cells were transfected with p-IL-1β-DHFR and p-caspase-1 plasmids. After transfection (24 h), the cells were either treated with DMEM or EBSS for 2 h. Secretion of 845 IL-1β mutant proteins was detected by immunoblot. (C) IL-1β mutant 132-133AA or 198-199AA is accessible to proteinase K digestion. HEK293T cells were transfected with plasmids encoding p-caspase-1 and IL-1β mutant 132-133AA or 198-199AA. After transfection (24 h), the cells were treated with EBSS for 2 h. The 25k membrane fraction was collected and subjected to proteinase K digestion assay and then analyzed by immunoblot using indicated antibodies. The level of proteinase K protection was calculated as the percentage of the total protein. Error bars represent standard deviations of at least three experiments.
HSP90 is required for the entry of IL-1β into the vesicle intermediate
The chaperone protein HSC70 and HSP90 have been reported to function in chaperone-mediated autophagy (CMA) (Kaushik and Cuervo, 2012; Majeski and Dice, 2004). HSP70 has also been implicated in autophagy and stress responses (Murphy, 2013). We performed shRNA-mediated knockdown of the three chaperone proteins to assess their potential role in the membrane translocation of IL-1β. Knockdown of Hsp90, but not of Hsp70 or Hsc70 substantially reduced IL-1β secretion (Figure 8A). As a control, knockdown of Hsc70 compromised CMA as indicated by the stabilization of a CMA cargo, GAPDH (Figure 8-figure supplement 1A). Moreover, secretion of mature IL-1β was inhibited in a dose-dependent manner by an HSP90 inhibitor geldanamycin (Figure 8B). In both experiments, mature IL-1β accumulated in the cytosol fraction at the expense of secretion. Knockdown of Hsp90 also rendered IL-1β accessible to proteinase K digestion (Figure 8C), consistent with a role for HSP90 in the translocation of IL-1β as opposed to some later secretion event. Furthermore, in a co-immunoprecipitation assay, HSP90 associated with m-IL-1β but not the translocation-deficient mutants Q132K133 and Q198L199 (Figure 8D). Although p-IL-1β also formed a complex with HSP90, the efficiency appeared lower than for m-IL-1β. These results suggest that HSP90 binds to a region of the mature IL-1β, including the essential residues Q132K133 and Q198L199, to promote the translocation event. Cleavage of p-IL-1β by caspase-1 may potentiate the recruitment of HSP90 to the mature form of IL-1β however chaperone binding is not required for this proteolytic event (Figures 8D and 7B).
In the CMA pathway, HSC70 and HSP90 play different roles. HSC70 binds to cargoes and delivers them into 266 the lysosome as well as disassembling LAMP2A oligomers, whereas HSP90 is required for the oligomerization and stability of LAMP2A (Bandyopadhyay et al., 2008; Chiang et al., 1989). Co-immunoprecipitation indicated that IL-1β associates with HSP90 but not HSC70 (Figure 8-figure supplement 1B). In addition, knockdown of Lamp2A compromised CMA but did not affect the secretion of IL-1β, and disruption of the lysosome did not result in the release of IL-1β from the membrane carrier (Figure 8-figure supplement 1C-E). These data suggest that the translocation of IL-1β into the vesicle carrier is mechanistically distinct from CMA.
Figure 8 HSP90 is involved in the entry of IL-1β into vesicles (A) Knockdown of Hsp90 inhibits IL-1β secretion. HEK293T cells were transduced with lentivirus carrying control (Ctrl) shRNA or shRNA against Hsc70, Hsp90 or Hsp70. Then the cells were transfected with p-IL-1β and p-caspase-1 plasmids. After transfection (24 h), the cells were cultured in EBSS for 2 h followed by determination of IL-1β secretion by immunoblot. (B) IL-1β secretion is reduced in the presence of HSP90 inhibitor geldanamycin. HEK293T cells were transfected with p-IL-1β and p-caspase-1 plasmids. After transfection (24 h), the cells were treated with EBSS containing different concentrations of geldanamycin as indicated. Immunoblot was performed as shown in Figure 1. Quantification of IL-1β secretion was calculated as the ratio between the amount of IL-1β in the medium and the total amount (the sum of IL-1β in both medium and lysate). (C) IL-1β remains accessible to proteinase K in Hsp90 knockdown cells. HEK293T cells were transduced with lentivirus carrying control (Ctrl) shRNA or shRNA against Hsp90. Then the cells were transfected with p-IL-1β and p-caspase-1 plasmids. After transfection (24 h), the cells were cultured in EBSS for 2 h. The 25k membrane fraction was collected and digested with proteinase K and then analyzed by immunoblotting using indicated antibodies. (D) Association of HSP90 with IL-1β WT and mutants. HEK293T cells transfected with p-caspase-1 and IL-1β mutant 132-133AA or 198-199AA were starved in EBSS for 2 h. Immunoprecipitation (IP) with anti-HSP90 antibody coupled to protein G-agarose was performed, followed by an immunoblot with anti-IL-1β and anti-HSP90 antibodies.
Figure 8- figure supplement 1 Translocation of IL-1β is mechanistically different from CMA (A) Knockdown of Hsc70 reduces CMA. HEK293T cells transduced with lentivirus carrying control (Ctrl) shRNA or shRNA against Hsc70 were incubated with regular medium (-CMA) or DMEM (+CMA) in the presence of 20 μg/ml cycloheximide for 24 h. The cells were lysed and analyzed by immunoblotting using indicated antibodies. For quantification, the ratio of GAPDH and tubulin was calculated and normalized by that in control (-CMA) treatment which was set as one. (B) Co-immunoprecipitation of HSC70 or HSP90 with IL-1β. HEK293T cells transfected with m-IL-1β-FLAG were starved in EBSS for 2 h. Immunoprecipitation (IP) with anti-HSC70 or anti-HSP90 antibody coupled to protein A/G-agarose was performed, followed by an immunoblot with indicated antibodies. (C) Knockdown of Lamp2 blocks CMA. HEK293T cells were transfected with control or LAMP2 siRNA. After transfection (48 h), the cells were trypsinized and plated. After 24 h, siRNA transfection was repeated. After another 48 h, the cells were trypsinized and plated. After 24 h, the cells were incubated with regular medium (-CMA) or DMEM (+CMA) in the presence of 20 μg/ml cycloheximide for 24 h. The cells were lysed and analyzed by immunoblotting using indicated antibodies. For quantification, the ratio of GAPDH and Tubulin was calculated and normalized by that in control (-CMA) treatment which was set as one. (D) Knockdown of LAMP2 does not affect IL-1β secretion. HEK293T cells were transfected with control or LAMP2 siRNA as show in (C). After the second siRNA transfection (24h), the cells were transfected with m-IL-1β-FLAG plasmid. After transfection (24 h), the cells were either cultured in DMEM or EBSS for 2 h followed by determination of IL-1β secretion by immunoblot as shown in Figure 1A. Quantification of IL-1β secretion was calculated as the ratio between the amount of IL-1β in the medium and the total amount (the sum of IL-1β in both medium and lysate). (E) Level of IL-1β in the membrane fraction was not affected by lysosome disruption. HEK293T cells 897 transfected with m-IL-1β were cultured in EBSS for 2 h and then treated with DMSO or 0.5 mM glycyl-L-phenylalanine-2-naphthylamide (GPN) for 10 min. The membrane fraction was collected from the top fractions of a Nycodenz density gradient resolved from membranes in a 25k pellet as described in Material and Methods. Both membrane fraction and cell lysis were analyzed by immunoblotting using indicated antibodies.
We next asked if starvation regulated the association between HSP90 and IL-1β. We performed an HSP90 co-immunoprecipitation experiment with cytosol prepared from cells grown in nutrient-rich or starvation conditions (Figure 9A). Starvation led to a ~2.5 fold increase of the association of HSP90 and IL-1β (Figure 9A). This increase was likely not due to starvation-stimulated processing of p-IL-1β because starvation had no effect on the cleavage of mutant forms of IL-1β unable to bind HSP90 (Figure 7B). Starvation led to a ~ 2 fold increase in the membrane localization and cytosolic depletion of mature IL-1β (Figure 9B). Starvation may stimulate the recruitment of a complex of m-IL-1β/HSP90 to the membrane responsible for IL-1β translocation (Figure 9B).
Figure 9 Induction of autophagy enhances the membrane incorporation of IL-1β (A) Starvation enhances the association of IL-1β with HSP90. HEK293T cells transfected with p-IL-1β and p-caspase-1 were cultured in DMEM or EBSS for 2 h. Immunoprecipitation with anti-HSP90 antibody was performed followed by an immunoblot with anti-IL-1β and anti-HSP90 antibodies. (B) Starvation promotes the entry of IL-1β into the membrane fraction. HEK293T cells transfected with p-IL-1β and p-caspase-1 were cultured in DMEM or EBSS for 2 h. The membrane fraction was collected from the top fractions of a Nycodenz density gradient resolved from membranes in a 25k pellet as described in Material and Methods. The cytosolic fraction was collected as the supernatant after 100k×g centrifugation. Immunoblot was performed to determine the levels of IL-1β in both fractions. (C) A proposed model for autophagy-mediated IL-1β secretion. Cytosolic IL-1β associates with HSP90 which facilitates the translocation of IL-1β into the lumen of a vesicle carrier which later either turns into a phagophore and an autophagosome or fuses with them. IL-1β localizes between the outer and inner membrane after the double membrane autophagosome forms. The topological distribution ensures the secretion of IL-1β in a soluble form. The IL-1β-containing autophagosome may directly fuse with the plasma membrane or further fuse with a MVB followed by fusion with the plasma membrane.
Genetic and cell biological studies have implicated autophagy in the transport of several leaderless cargoes to the extracellular space (Bruns et al., 2011; Dupont et al., 2011; Duran et al., 2010; Manjithaya et al., 2010). Unconventional secretory cargoes, such as IL-1β and Acb1, have been shown to have overlapping requirements with formation of the autophagosome or its precursor suggesting that the autophagosome may physically convey these cargo proteins to the cell surface. A key question is if and how these cargoes engage the autophagosome and how this structure exports soluble cargo molecules. In this study, we probed the organelle association and molecular requirements for the secretion of one such unconventional cargo protein, IL-1β. Using surrogate cell lines rather than macrophages to reconstitute autophagy-mediated secretion of IL-1β (Figure 1), we find mature IL-1β localized to the lumen of the membrane in early intermediates and mature autophagosomes (Figures 2-4, 6). This surprising location may help to explain how mature IL-1β is secreted in a soluble form to the cell surface (Figure 9C). However, localization to the lumen between the two membranes of the autophagosome would require that IL-1β is translocated from the cytoplasm across the membrane precursor of a phagophore, rather than being engulfed as the phagophore membrane matures by closure into an autophagosome. Our evidence suggests that IL-1β must unfold or be held in an unfolded state to promote membrane translocation (Figure 5) and that a complex sorting signal in the mature portion of IL-1β interacts with HSP90 to deliver the chaperone and its cargo to a site on a phagophore precursor membrane where the mature species is translocated (Figures 7-9).
The unconventional secretory cargo fibroblast growth factor 2 (FGF2) has been shown to directly translocate across the plasma membrane as a folded protein without the apparent aid of chaperones (Backhaus et al., 2004; Steringer et al., 2015). Unlike FGF2, the entry of IL-1β into the autophagosomal carrier appears to be dependent on protein unfolding in a conformational state that may be fostered by the association of HSP90 with two KFERQ-like sequences within the mature portion of IL-1β (Figure 5 and 8). This translocation mechanism appears superficially similar to another delivery process termed HSC70-dependent CMA in which autophagic cargoes bearing KFERQ targeting motifs are directed into the lysosome for degradation. Indeed, using a cell-free approach to study the import of CMA cargo into isolated lysosomes, Salvador et al. (2000) reported that DHFR fused to a CMA cargo is blocked in translocation by addition of methotrexate, a drug that stabilizes DHFR to unfolding, just as we have shown that IL-1β fused to DHFR is blocked in cells treated with a cell permeable folate analog, aminopterin (Wei et al., 2013). In our fractionation study, IL-1β distributed in LC3-positive autophagosomal carriers that were separated from the lysosome marker LAMP2, the proposed receptor or channel for uptake of CMA cargo (Kaushik and Cuervo, 2012)(Figure 2B). This observation, together with the involvement of a different chaperone i.e. HSP90, suggests distinct routes for IL-1β and cargoes of the CMA pathway.
The target membrane for IL-1β translocation may be a vesicle that could fuse with or form the autophagosome. We find that mature IL-1β can be detected within protease inaccessible membranes in cells blocked early in the autophagic pathway (e.g. ATG5 null cells and cells depleted of FIP200, both of which block at a stage prior to the lipidation of LC3). The identity of the vesicle carrier is unknown and could be any one of those reported to supply membrane to the formation of the autophagosome (Ge et al., 2014a; Lamb et al., 2013). Although we have ruled out the involvement of LAMP2A IL-1β translocation, it is likely that a membrane receptor locating on the membrane of the vesicle carrier, perhaps a functional equivalent of LAMP2A, recruits the protein complex of HSP90 and IL-1β, therefore designating the correct membrane targeting of IL-1β. In addition, a protein conducting channel may be involved in the translocation of IL-1β into the membrane. It seems unlikely that a standard translocation channel, such as SEC61, is involved in this import process, but no current evidence bears on this point.
The exact route by which the autophagosome delivers mature IL-1β to the cell surface as well as how it avoids fusion with degradative lysosome remains obscure, possibly involving interaction with the multi-vesicular body or some form of lysosome as a prelude to fusion at the cell surface (Figure 9C), and this process may require selective recruitment of membrane sorting and targeting factors such as Rabs and SNAREs. Fusion of the autophagosome directly with the plasma membrane would lead to the release of soluble IL-1β available to trigger an inflammatory response in the surrounding tissue. If mature IL-1β were engulfed within the cytoplasmic interior of the autophagosome, fusion of this organelle at the cell surface might release an intact vesicle corresponding to the inner membrane-enclosed cytoplasmic compartment of the autophagosome. We found mature IL-1β secreted by macrophages or in our surrogate cell system to be completely soluble, thus inconsistent with the engulfment model (data not shown). An alternative possibility may be that the autophagosome fuses with another intracellular organelle such as the MVB or the lysosome under conditions where the inner membrane of the autophagosome is degraded. If so, mature IL-1β would be available for secretion if the combined organelle (amphisome, Figure 9C) fused with the plasma membrane. However, for this model to be viable, the mature IL-1β released on dissolution of the autophagosome inner membrane would have to withstand proteolytic attack such as may be encountered in an amphisome or lysosome. Because mature IL-1β is clearly sensitive to proteolysis (Figure 4), thus any compartment engaged in presenting autophagosomal content to the cell surface must be depleted of proteases. The nature of the organelle that delivers autophagosome content to the plasma membrane may be probed by selective ablation of different Rab proteins, e.g. Rab11, Rab27 and Rab35, which appear to be required for fusion of the MVB with the cell surface (Hsu et al., 2010; Ostrowski et al., 2010; Savina et al., 2002), or Rab27a and Rab38, implicated in the fusion of lysosomes at the cell surface (Blott and Griffiths, 2002; Hume et al., 2001; Jager et al., 2000.




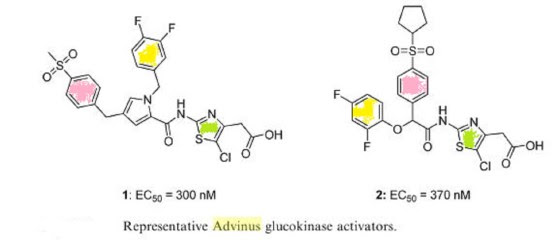


 2012pharmaceutical
 sjwilliamspa