Feeds:
Posts
Comments

Archive for the ‘Cell Biology’ Category

Mindful Discoveries

Larry H. Bernstein, MD, FCAP, Curator

LPBI

Schizophrenia and the Synapse

Genetic evidence suggests that overactive synaptic pruning drives development of schizophrenia.

By Ruth Williams | January 27, 2016 … more follows)

http://www.the-scientist.com/?articles.view/articleNo/45189/title/Schizophrenia-and-the-Synapse/

3.2.4

3.2.4   Mindful Discoveries, Volume 2 (Volume Two: Latest in Genomics Methodologies for Therapeutics: Gene Editing, NGS and BioInformatics, Simulations and the Genome Ontology), Part 2: CRISPR for Gene Editing and DNA Repair

http://www.the-scientist.com/images/News/January2016/Schizophrenia.jpg

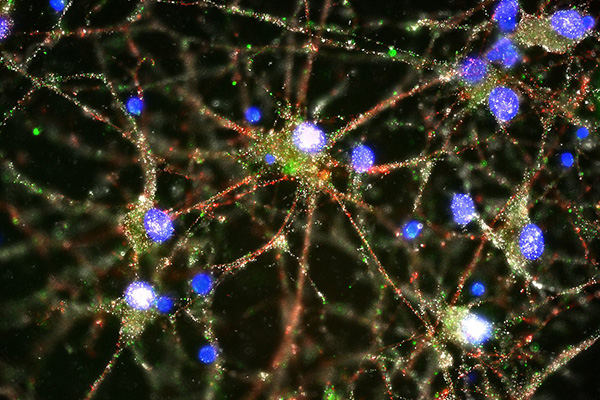
C4 (green) at synapses of human neurons

Compared to the brains of healthy individuals, those of people with schizophrenia have higher expression of a gene called C4, according to a paper published inNature today (January 27). The gene encodes an immune protein that moonlights in the brain as an eradicator of unwanted neural connections (synapses). The findings, which suggest increased synaptic pruning is a feature of the disease, are a direct extension of genome-wide association studies (GWASs) that pointed to the major histocompatibility (MHC) locus as a key region associated with schizophrenia risk.

“The MHC [locus] is the first and the strongest genetic association for schizophrenia, but many people have said this finding is not useful,” said psychiatric geneticist Patrick Sullivan of the University of North Carolina School of Medicine who was not involved in the study. “The value of [the present study is] to show that not only is it useful, but it opens up new and extremely interesting ideas about the biology and therapeutics of schizophrenia.”

Schizophrenia has a strong genetic component—it runs in families—yet, because of the complex nature of the condition, no specific genes or mutations have been identified. The pathological processes driving the disease remain a mystery.

Researchers have turned to GWASs in the hope of finding specific genetic variations associated with schizophrenia, but even these have not provided clear candidates.

“There are some instances where genome-wide association will literally hit one base [in the DNA],” explained Sullivan. While a 2014 schizophrenia GWAS highlighted the MHC locus on chromosome 6 as a strong risk area, the association spanned hundreds of possible genes and did not reveal specific nucleotide changes. In short, any hope of pinpointing the MHC association was going to be “really challenging,” said geneticist Steve McCarroll of Harvard who led the new study.

Nevertheless, McCarroll and colleagues zeroed in on the particular region of the MHC with the highest GWAS score—the C4 gene—and set about examining how the area’s structural architecture varied in patients and healthy people.

The C4gene can exist in multiple copies (from one to four) on each copy of chromosome 6, and has four different forms: C4A-short, C4B-short, C4A-long, and C4B-long. The researchers first examined the “structural alleles” of the C4 locus—that is, the combinations and copy numbers of the different C4 forms—in healthy individuals. They then examined how these structural alleles related to expression of both C4Aand C4B messenger RNAs (mRNAs) in postmortem brain tissues.From this the researchers had a clear picture of how the architecture of the C4 locus affected expression ofC4A and C4B. Next, they compared DNA from roughly 30,000 schizophrenia patients with that from 35,000 healthy controls, and a correlation emerged: the alleles most strongly associated with schizophrenia were also those that were associated with the highest C4A expression. Measuring C4A mRNA levels in the brains of 35 schizophrenia patients and 70 controls then revealed that, on average, C4A levels in the patients’ brains were 1.4-fold higher.C4 is an immune system “complement” factor—a small secreted protein that assists immune cells in the targeting and removal of pathogens. The discovery of C4’s association to schizophrenia, said McCarroll, “would have seemed random and puzzling if it wasn’t for work . . . showing that other complement components regulate brain wiring.” Indeed, complement protein C3 locates at synapses that are going to be eliminated in the brain, explained McCarroll, “and C4 was known to interact with C3 . . . so we thought well, actually, this might make sense.”McCarroll’s team went on to perform studies in mice that revealed C4 is necessary for C3 to be deposited at synapses. They also showed that the more copies of the C4 gene present in a mouse, the more the animal’s neurons were pruned.Synaptic pruning is a normal part of development and is thought to reflect the process of learning, where the brain strengthens some connections and eradicates others. Interestingly, the brains of deceased schizophrenia patients exhibit reduced neuron density. The new results, therefore, “make a lot of sense,” said Cardiff University’s Andrew Pocklington who did not participate in the work. They also make sense “in terms of the time period when synaptic pruning is occurring, which sort of overlaps with the period of onset for schizophrenia: around adolescence and early adulthood,” he added.

“[C4] has not been on anybody’s radar for having anything to do with schizophrenia, and now it is and there’s a whole bunch of really neat stuff that could happen,” said Sullivan. For one, he suggested, “this molecule could be something that is amenable to therapeutics.”

A. Sekar et al., “Schizophrenia risk from complexvariation of complement component 4,”Nature,   http://dx.doi.com:/10.1038/nature16549, 2016.     

Tags schizophrenia, neuroscience, gwas, genetics & genomics, disease/medicine and cell & molecular biology

Schizophrenia: From genetics to physiology at last

Ryan S. Dhindsa, & David B. Goldstein

Nature (2016)  http://dx.doi.org://10.1038/nature16874

The identification of a set of genetic variations that are strongly associated with the risk of developing schizophrenia provides insights into the neurobiology of this destructive disease.

http://www.nytimes.com/2016/01/28/health/schizophrenia-cause-synaptic-pruning-brain-psychiatry.html

Genetic study provides first-ever insight into biological origin of schizophrenia

Suspect gene may trigger runaway synaptic pruning during adolescence — NIH-funded study

NIH/NATIONAL INSTITUTE OF MENTAL HEALTH

IMAGE

http://media.eurekalert.org/multimedia_prod/pub/web/107629_web.jpg

The site in Chromosome 6 harboring the gene C4 towers far above other risk-associated areas on schizophrenia’s genomic “skyline,” marking its strongest known genetic influence. The new study is the first to explain how specific gene versions work biologically to confer schizophrenia risk.  CREDIT  Psychiatric Genomics Consortium

Versions of a gene linked to schizophrenia may trigger runaway pruning of the teenage brain’s still-maturing communications infrastructure, NIH-funded researchers have discovered. People with the illness show fewer such connections between neurons, or synapses. The gene switched on more in people with the suspect versions, who faced a higher risk of developing the disorder, characterized by hallucinations, delusions and impaired thinking and emotions.

“Normally, pruning gets rid of excess connections we no longer need, streamlining our brain for optimal performance, but too much pruning can impair mental function,” explained Thomas Lehner, Ph.D., director of the Office of Genomics Research Coordination of the NIH’s National Institute of Mental Health (NIMH), which co-funded the study along with the Stanley Center for Psychiatric Research at the Broad Institute and other NIH components. “It could help explain schizophrenia’s delayed age-of-onset of symptoms in late adolescence/early adulthood and shrinkage of the brain’s working tissue. Interventions that put the brakes on this pruning process-gone-awry could prove transformative.”

The gene, called C4 (complement component 4), sits in by far the tallest tower on schizophrenia’s genomic “skyline” (see graph below) of more than 100 chromosomal sites harboring known genetic risk for the disorder. Affecting about 1 percent of the population, schizophrenia is known to be as much as 90 percent heritable, yet discovering how specific genes work to confer risk has proven elusive, until now.

A team of scientists led by Steve McCarroll, Ph.D., of the Broad Institute and Harvard Medical School, Boston, leveraged the statistical power conferred by analyzing the genomes of 65,000 people, 700 postmortem brains, and the precision of mouse genetic engineering to discover the secrets of schizophrenia’s strongest known genetic risk. C4’s role represents the most compelling evidence, to date, linking specific gene versions to a biological process that could cause at least some cases of the illness.

“Since schizophrenia was first described over a century ago, its underlying biology has been a black box, in part because it has been virtually impossible to model the disorder in cells or animals,” said McCarroll. “The human genome is providing a powerful new way in to this disease. Understanding these genetic effects on risk is a way of prying open that block box, peering inside and starting to see actual biological mechanisms.”

McCarroll’s team, including Harvard colleagues Beth Stevens, Ph.D., Michael Carroll, Ph.D., and Aswin Sekar, report on their findings online Jan. 27, 2016 in the journal Nature.

A swath of chromosome 6 encompassing several genes known to be involved in immune function emerged as the strongest signal associated with schizophrenia risk in genome-wide analyses by the NIMH-funded Psychiatric Genomics Consortium over the past several years. Yet conventional genetics failed to turn up any specific gene versions there linked to schizophrenia.

To discover how the immune-related site confers risk for the mental disorder, McCarroll’s team mounted a search for “cryptic genetic influences” that might generate “unconventional signals.” C4, a gene with known roles in immunity, emerged as a prime suspect because it is unusually variable across individuals. It is not unusual for people to have different numbers of copies of the gene and distinct DNA sequences that result in the gene working differently.

The researchers dug deeply into the complexities of how such structural variation relates to the gene’s level of expression and how that, in turn, might relate to schizophrenia. They discovered structurally distinct versions that affect expression of two main forms of the gene in the brain. The more a version resulted in expression of one of the forms, called C4A, the more it was associated with schizophrenia. The more a person had the suspect versions, the more C4 switched on and the higher their risk of developing schizophrenia. Moreover, in the human brain, the C4 protein turned out to be most prevalent in the cellular machinery that supports connections between neurons.

Adapting mouse molecular genetics techniques for studying synaptic pruning and C4’s role in immune function, the researchers also discovered a previously unknown role for C4 in brain development. During critical periods of postnatal brain maturation, C4 tags a synapse for pruning by depositing a sister protein in it called C3. Again, the more C4 got switched on, the more synapses got eliminated.

In humans, such streamlining/pruning occurs as the brain develops to full maturity in the late teens/early adulthood – conspicuously corresponding to the age-of-onset of schizophrenia symptoms.

Future treatments designed to suppress excessive levels of pruning by counteracting runaway C4 in at risk individuals might nip in the bud a process that could otherwise develop into psychotic illness, suggest the researchers. And thanks to the head start gained in understanding the role of such complement proteins in immune function, such agents are already in development, they note.

“This study marks a crucial turning point in the fight against mental illness. It changes the game,” added acting NIMH director Bruce Cuthbert, Ph.D. “Thanks to this genetic breakthrough, we can finally see the potential for clinical tests, early detection, new treatments and even prevention.”

###

VIDEO: Opening Schizophrenia’s Black Box https://youtu.be/s0y4equOTLg

Reference: Sekar A, Biala AR, de Rivera H, Davis A, Hammond TR, Kamitaki N, Tooley K Presumey J Baum M, Van Doren V, Genovese G, Rose SA, Handsaker RE, Schizophrenia Working Group of the Psychiatric Genomics Consortium, Daly MJ, Carroll MC, Stevens B, McCarroll SA. Schizophrenia risk from complex variation of complement component 4.Nature. Jan 27, 2016. DOI: 10.1038/nature16549.

Schizophrenia risk from complex variation of complement component 4

Aswin Sekar, Allison R. Bialas, Heather de Rivera, Avery Davis, Timothy R. Hammond, …., Michael C. Carroll, Beth Stevens & Steven A. McCarroll

Nature(2016)   http://dx.doi.org:/10.1038/nature16549

Schizophrenia is a heritable brain illness with unknown pathogenic mechanisms. Schizophrenia’s strongest genetic association at a population level involves variation in the major histocompatibility complex (MHC) locus, but the genes and molecular mechanisms accounting for this have been challenging to identify. Here we show that this association arises in part from many structurally diverse alleles of the complement component 4 (C4) genes. We found that these alleles generated widely varying levels of C4A and C4B expression in the brain, with each common C4 allele associating with schizophrenia in proportion to its tendency to generate greater expression of C4A. Human C4 protein localized to neuronal synapses, dendrites, axons, and cell bodies. In mice, C4 mediated synapse elimination during postnatal development. These results implicate excessive complement activity in the development of schizophrenia and may help explain the reduced numbers of synapses in the brains of individuals with schizophrenia.

Figure 1: Structural variation of the complement component 4 (C4) gene.

http://www.nature.com/nature/journal/vaop/ncurrent/carousel/nature16549-f1.jpg

a, Location of the C4 genes within the major histocompatibility complex (MHC) locus on human chromosome 6. b, Human C4 exists as two paralogous genes (isotypes), C4A and C4B; the encoded proteins are distinguished at a key site

http://www.nature.com/nature/journal/vaop/ncurrent/carousel/nature16549-f3.jpg

http://www.nature.com/nature/journal/vaop/ncurrent/carousel/nature16549-sf8.jpg

Gene Study Points Toward Therapies for Common Brain Disorders

University of Edinburgh    http://www.dddmag.com/news/2016/01/gene-study-points-toward-therapies-common-brain-disorders

Scientists have pinpointed the cells that are likely to trigger common brain disorders, including Alzheimer’s disease, Multiple Sclerosis and intellectual disabilities.

It is the first time researchers have been able to identify the particular cell types that malfunction in a wide range of brain diseases.

Scientists say the findings offer a roadmap for the development of new therapies to target the conditions.

The researchers from the University of Edinburgh’s Centre for Clinical Brain Sciences used advanced gene analysis techniques to investigate which genes were switched on in specific types of brain cells.

They then compared this information with genes that are known to be linked to each of the most common brain conditions — Alzheimer’s disease, anxiety disorders, autism, intellectual disability, multiple sclerosis, schizophrenia and epilepsy.

Their findings reveal that for some conditions, the support cells rather than the neurons that transmit messages in the brain are most likely to be the first affected.

Alzheimer’s disease, for example, is characterised by damage to the neurons. Previous efforts to treat the condition have focused on trying to repair this damage.

The study found that a different cell type — called microglial cells — are responsible for triggering Alzheimer’s and that damage to the neurons is a secondary symptom of disease progression.

Researchers say that developing medicines that target microglial cells could offer hope for treating the illness.

The approach could also be used to find new treatment targets for other diseases that have a genetic basis, the researchers say.

Dr Nathan Skene, who carried out the study with Professor Seth Grant, said: “The brain is the most complex organ made up from a tangle of many cell types and sorting out which of these cells go wrong in disease is of critical importance to developing new medicines.”

Professor Seth Grant said: “We are in the midst of scientific revolution where advanced molecular methods are disentangling the Gordian Knot of the brain and completely unexpected new pathways to solving diseases are emerging. There is a pressing need to exploit the remarkable insights from the study.”

Quantitative multimodal multiparametric imaging in Alzheimer’s disease

Qian Zhao, Xueqi Chen, Yun Zhou      Brain Informatics  http://link.springer.com/article/10.1007/s40708-015-0028-9

Alzheimer’s disease (AD) is a progressive neurodegenerative disorder, causing changes in memory, thinking, and other dysfunction of brain functions. More and more people are suffering from the disease. Early neuroimaging techniques of AD are needed to develop. This review provides a preliminary summary of the various neuroimaging techniques that have been explored for in vivo imaging of AD. Recent advances in magnetic resonance (MR) techniques, such as functional MR imaging (fMRI) and diffusion MRI, give opportunities to display not only anatomy and atrophy of the medial temporal lobe, but also at microstructural alterations or perfusion disturbance within the AD lesions. Positron emission tomography (PET) imaging has become the subject of intense research for the diagnosis and facilitation of drug development of AD in both animal models and human trials due to its non-invasive and translational characteristic. Fluorodeoxyglucose (FDG) PET and amyloid PET are applied in clinics and research departments. Amyloid beta (Aβ) imaging using PET has been recognized as one of the most important methods for the early diagnosis of AD, and numerous candidate compounds have been tested for Aβ imaging. Besides in vivo imaging method, a lot of ex vivo modalities are being used in the AD researches. Multiphoton laser scanning microscopy, neuroimaging of metals, and several metal bioimaging methods are also mentioned here. More and more multimodality and multiparametric neuroimaging techniques should improve our understanding of brain function and open new insights into the pathophysiology of AD. We expect exciting results will emerge from new neuroimaging applications that will provide scientific and medical benefits.

Keywords –   Alzheimer’s disease Neuroimaging PET MRI Amyloid beta Multimodal

Alzheimer’s disease (AD) is a progressive neurodegenerative disorder that gradually destroys brain cells, causing changes in memory, thinking, and other dysfunction of brain functions [1]. AD is considered to a prolonged preclinical stage where neuropathological changes precede the clinical symptoms [2]. An estimation of 35 million people worldwide is living with this disease. If effective treatments are not discovered in a timely fashion, the number of AD cases is anticipated to rise to 113 million by 2050 [3].

Amyloid beta (Aβ) and tau are two of the major biomarkers of AD, and have important and different roles in association with the progression of AD pathophysiology. Jack et al. established hypothetical models of the major biomarkers of AD. By renewing and modifying the models, they found that the two major proteinopathies underlying AD biomarker changes, Aβ and tau, may be initiated independently in late onset AD where they hypothesize that an incident Aβ pathophysiology can accelerate an antecedent limbic and brainstem tauopathy [4]. MRI technique was used in the article, which revealed that the level of Aβ load was associated with a shorter time-to-progression of AD [5]. This warrants an urgent need to develop early neuroimaging techniques of AD neuropathology that can detect and predict the disease before the onset of dementia, monitor therapeutic efficacy in halting and slowing down progression in the earlier stage of the disease.

There have been various reports on the imaging assessments of AD. Some measurements reflect the pathology of AD directly, including positron emission tomography (PET) amyloid imaging and cerebrospinal fluid (CSF) beta-amyloid 42 (Aβ42), while others reflect neuronal injury associated with AD indirectly, including CSF tau (total and phosphorylated tau), fluorodeoxy-d-glucose (FDG)-PET, and MRI. AD Neuroimaging Initiative (ADNI) has been to establish the optimal panel of clinical assessments, MRI and PET imaging measures, as well as other biomarkers from blood and CSF, to inform clinical trial design for AD therapeutic development. At the same time, it has been highly productive in generating a wealth of data for elucidating disease mechanisms occurring during early stages of preclinical and prodromal AD [6].

Single neuroimaging often reflects limit information of AD. As a result, multimodal neuroimaging is widely used in neuroscience researches, as it overcomes the limitations of individual modalities. Multimodal multiparametric imaging mean the combination of different imaging techniques, such as PET, MRI, simultaneously or separately. The multimodal multiparametric imaging enables the visualization and quantitative analysis of the alterations in brain structure and function, such as PET/CT, and PET/MRI. [7]. In this review article, we summarize and discuss the main applications, findings, perspectives as well as advantages and challenges of different neuroimaging in AD, especially MRI and PET imaging.

2 Magnetic resonance imaging

MRI demonstrates specific volume loss or cortical atrophy patterns with disease progression in AD patients [8–10]. There are several MRI techniques and analysis methods used in clinical and scientific research of AD. Recent advances in MR techniques, such as functional MRI (fMRI) and diffusion MRI, depict not only anatomy and atrophy of the medial temporal lobe (MTL), but also microstructural alterations or perfusion disturbance within this region.

2.1 Functional MRI

Because of the cognitive reserve (CR), the relationship between severity of AD patients’ brain damage and corresponding clinical symptoms is not always paralleled [11, 12]. Recently, resting-state fMRI (RS-fMRI) is popular for its ability to map brain functional connectivity non-invasively [13]. By using RS-fMRI, Bozzali et al. reported that the CR played a role in modulating the effect of AD pathology on default mode network functional connectivity, which account for the variable clinical symptoms of AD [14]. Moreover, AD patients with higher educated experience were able to recruit compensatory neural mechanisms, which can be measured using RS-fMRI. Arterial spin-labeled (ASL) MRI is another functional brain imaging modality, which measures cerebral blood flow (CBF) by magnetically labeled arterial blood water following through the carotid and vertebral arteries as an endogenous contrast medium. Several studies have concluded the characteristics of CBF changes in AD patients using ASL-MRI [15–17].

At some point in time, sufficient brain damage accumulates to result in cognitive symptoms and impairment. Mild cognitive impairment (MCI) is a condition in which subjects are usually only mildly impaired in memory with relative preservation of other cognitive domains and functional activities and do not meet the criteria for dementia [18], or as the prodromal state AD [19]. MCI patients are at a higher risk of developing AD and up to 15 % convert to AD per year [18]. Binnewijzend et al. have reported the pseudocontinuous ASL could distinguish both MCI and AD from healthy controls, and be used in the early diagnosis of AD [20]. In their continuous study, they used quantitative whole brain pseudocontinuous ASL to compare regional CBF (rCBF) distribution patterns in different types of dementia, and concluded that ASL-MRI could be a non-invasive and easily accessible alternative to FDG-PET imaging in the assessment of CBF of AD patients [21].

2.2 Structure MRI

Structural MRI (sMRI) has already been a reliable imaging method in the clinical diagnosis of AD, characterized as gray matter reduction and ventricular enlargement in standard T1-weighted sequences [9]. Locus coeruleus (LC) and substantia nigra (SN) degeneration was seen in AD. By using new quantitative calculating method, Chen et al. presented a new quantitative neuromelanin MRI approach for simultaneous measurement of locus LC and SN of brainstem in living human subjects [22]. The approach they used demonstrated advantages in image acquisition, pre-processing, and quantitative analysis. Numerous transgenic animal models of amyloidosis are available, which can manipulate a lot of neuropathological features of AD progression from the deposition of β-amyloid [23]. Braakman et al. demonstrated the dynamics of amyloid plaque formation and development in a serial MRI study in a transgenic mouse model [24]. Increased iron accumulation in gray matter is frequently observed in AD. Because of the paramagnetic nature of iron, MRI shows nice potential in the investigating iron levels in AD [25]. Quantitative MRI was shown high sensitivity and specificity in mapping cerebral iron deposition, and helped in the research on AD diagnosis [26].

The imaging patterns are always associated with the pathologic changes, such as specific protein markers. Spencer et al. manifested the relationship between quantitative T1 and T2 relaxation time changes and three immunohistochemical markers: β-amyloid, neuron-specific nuclear protein (a marker of neuronal cell load), and myelin basic protein (a marker of myelin load) in AD transgenic mice [27].

High-field MRI has been successfully applied to imaging plaques in transgenic mice for over a decade without contrast agents [24, 28–30]. Sillerud et al. devised a method using blood–brain barrier penetrating, amyloid-targeted, superparamagnetic iron oxide nanoparticles (SPIONs) for better imaging of amyloid plaque [31]. Then, they successfully used this SPION-MRI to assess the drug efficacy on the 3D distribution of Aβ plaques in transgenic AD mouse [32].

2.3 Diffusion MRI

Diffusion-weighted imaging (DWI) is a sensitive tool that allows quantifying of physiologic alterations in water diffusion, which result from microscopic structural changes.

Diffusion tensor imaging (DTI) is a well-established and commonly employed diffusion MRI technique in clinical and research on neuroimaging studies, which is based on a Gaussian model of diffusion processes [33]. In general, AD is associated with widespread reduced fractional anisotropy (FA) and increased mean diffusivity (MD) in several regions, most prominently in the frontal and temporal lobes, and along the cingulum, corpus callosum, uncinate fasciculus, superior longitudinal fasciculus, and MTL-associated tracts than healthy controls [34–37]. Acosta-Cabronero et al. reported increased axial diffusivity and MD in the splenium, which were the earliest abnormalities in AD [38]. FA and radial diffusivity (DR) differences in the corpus callosum, cingulum, and fornix were found to separate individuals with MCI who converted to AD from non-converters [39]. DTI was also found to be a better predictor of AD-specific MTL atrophy when compared to CSF biomarkers [40]. These findings suggested the potential clinical utility of DTI as early biomarkers of AD and its progression. However, an increase in MD and DR and a decrease in FA with advancing age in selective brain regions have been previously reported [41, 42]. Diffusion MRI can be also used in the classifying of various stages of AD. Multimodal classification method, which combined fMRI and DTI, separated more MCI from healthy controls than single approaches [43].

In recent years, tau has emerged as a potential target for therapeutic intervention. Tau plays a critical role in the neurodegenerative process forming neurofibrillary tangles, which is a major hallmark of AD and correlates with clinical disease progression. Wells et al. applied multiparametric MRI, containing high-resolution structure MRI (sMRI), a novel chemical exchange saturation transfer (CEST) MRI, DTI, and ASL, and glucose CEST to measure changes of tau pathology in AD transgenic mouse [44].

Besides DWI MRI, perfusion-weighted imaging (PWI) is another advanced MR technique, which could measure the cerebral hemodynamics at the capillary level. Zimny et al. evaluated the correlation of MTL with both DWI and PWI in AD and MCI patients [45].

3 Positron emission tomography

PET is a specific imaging technique applying in researches of brain function and neurochemistry of small animals, medium-sized animals, and human subjects [46–48]. As a particular brain imaging technique, PET imaging has become the subject of intense research for the diagnosis and facilitation of drug development of AD in both animal models and human trials due to its non-invasive and translational characteristic. PET with various radiotracers is considered as a standard non-invasive quantitative imaging technique to measure CBF, glucose metabolism, and β-amyloid and tau deposition.

3.1 FDG-PET

To date, 18F-FDG is one of the best and widely used neuroimaging tracers of PET, which employed for research and clinical assessment of AD [49]. Typical lower FDG metabolism was shown in the precuneus, posterior cingulate, and temporal and parietal cortex with progression to whole brain reductions with increasing disease progress in AD brains [50, 51]. FDG-PET imaging reflects the cerebral glucose metabolism, neuronal injury, which provides indirect evidence on cognitive function and progression that cannot be provided by amyloid PET imaging.

Schraml et al. [52] identified a significant association between hypometabolic convergence index and phenotypes using ADNI data. Some researchers also used 18F-FDG-PET to analyze genetic information with multiple biomarkers to classify AD status, predicting cognitive decline or MCI to AD conversion [53–55]. Trzepacz et al. [56] reported multimodal AD neuroimaging study, using MRI, 11C-PiB PET, and 18F-FDG-PET imaging to predict MCI conversion to AD along with APOE genotype. Zhang et al. [57] compared the genetic modality single-nucleotide polymorphism (SNP) with sMRI, 18F-FDG-PET, and CSF biomarkers, which were used to differentiate healthy control, MCI, and AD. They found FDG-PET is the best modality in terms of accuracy.

3.2 Amyloid beta PET

Aβ, the primary constituent of senile plaques, and tau tangles are hypothesized to play a primary role in the pathogenesis of AD, but it is still hard to identify the fundamental mechanisms [58–60]. Aβ plaque in brain is one of the pathological hallmarks of AD [61,62]. Accumulation of Aβ peptide in the cerebral cortex is considered one cause of dementia in AD [63]. Numerous studies have involved in vivo PET imaging assessing cortical β-amyloid burden [64–66].

Aβ imaging using PET has been recognized as one of the most important methods for the early diagnosis of AD [67]. Numerous candidate compounds have been tested for Aβ imaging, such as 11C-PiB [68], 18F-FDDNP [69], 11C-SB-13 [70], 18F-BAY94-9172 [71], 18F-AV-45 [72], 18F-flutemetamol [73, 74], 11C-AZD2184 [75], and 18F-ADZ4694 [76], 11C-BF227 and 18F-FACT [77].

Several amyloid PET studies examined genotypes, phenotypes, or gene–gene interactions. Ramanan et al. [78] reported the GWAS results with 18F-AV-45 reflecting the cerebral amyloid metabolism in AD for the first time. Swaminathan et al. [79] revealed the association between plasma Aβ from peripheral blood and cortical amyloid deposition on 11C-PiB. Hohman et al. [80] reported the relationship between SNPs involved in amyloid and tau pathophysiology with 18F-AV-45 PET.

Among the PET tracers, 11C-PiB, which has a high affinity for fibrillar Aβ, is a reliable biomarker of underlying AD pathology [68, 81]. It shows cortical uptake well paralleled with AD pathology [82, 83], has recently been approved for use by the Food and Drug Administration (FDA, April 2012) and the European Medicines Agency (January 2013). 18F-GE-067 (flutemetamol) and 18F-BAY94-9172 (florbetaben) have also been approved by the US FDA in the last 2 years [84, 85].

18F-Florbetapir (also known as 18F-AV-45) exhibits high affinity specific binding to amyloid plaques. 18F-AV-45 labels Aβ plaques in sections from patients with pathologically confirmed AD [72].

It was reported in several research groups that 18F-AV-45 PET imaging showed a reliability of both qualitative and quantitative assessments in AD patients, and Aβ+ increased with diagnostic category (healthy control < MCI < AD) [82, 86, 87]. Johnson et al. used 18F-AV-45 PET imaging to evaluate the amyloid deposition in both MCI and AD patients qualitatively and quantitatively, and found that amyloid burden increased with diagnostic category (MCI < AD), age, and APOEε4 carrier status [88]. Payoux et al. reported the equivocal amyloid PET scans using 18F-AV-45 associated with a specific pattern of clinical signs in a large population of non-demented older adults more than 70 years old [89].

More and more researchers consider combination and comparison of multiple PET tracers targeting amyloid plaque imaging together. Bruck et al. compared the prognostic ability of 11C-PiB PET, 18F-FDG-PET, and quantitative hippocampal volumes measured with MR imaging in predicting MCI to AD conversion. They found that the FDG-PET and 11C-PiB PET imaging are better in predicting MCI to AD conversion [90]. Hatashita et al. used 11C-PiB and FDG-PET imaging to identify MCI due to AD, 11C-PiB showed a higher sensitivity of 96.6 %, and FDG-PET added diagnostic value in predicting AD over a short period [91].

Besides, new Aβ imaging agents were radiosynthesized. Yousefi et al. radiosynthesized a new Aβ imaging agent 18F-FIBT, and compared the three different Aβ-targeted radiopharmaceuticals for PET imaging, including 18F-FIBT, 18F-florbetaben, and 11C-PiB [92]. 11C-AZD2184 is another new PET tracer developed for amyloid senile plaque imaging, and the kinetic behavior of 11C-AZD2184 is suitable for quantitative analysis and can be used in clinical examination without input function [75,93, 94].

4 Multimodality imaging: PET/MRI

Several diagnostic techniques, including MRI and PET, are employed for the diagnosis and monitoring of AD [95]. Multimodal imaging could provide more information in the formation and key molecular event of AD than single method. It drives the progression of neuroimaging research due to the recognition of the clinical benefits of multimodal data [96], and the better access to hybrid devices, such as PET/MRI [97].

Maier et al. evaluated the dynamics of 11C-PiB PET, 15O-H2O-PET, and ASL-MRI in transgenic AD mice and concluded that the AD-related decline of rCBF was caused by the cerebral Aβ angiopathy [98]. Edison et al. systematically compared 11C-PiB PET and MRI in AD, MCI patients, and controls. They thought that 11C-PiB PET was adequate for clinical diagnostic purpose, while MRI remained more appropriate for clinical research [99]. Zhou et al. investigated the interactions between multimodal PET/MRI in elder patients with MCI, AD, and healthy controls, and confirmed the invaluable application of amyloid PET and MRI in early diagnosis of AD [100]. Kim et al. reported that Aβ-weighted cortical thickness, which incorporates data from both MRI and amyloid PET imaging, is a consistent and objective imaging biomarker in AD [101].

5 Other imaging modalities

Multiphoton non-linear optical microscope imaging systems using ultrafast lasers have powerful advantages such as label-free detection, deep penetration of thick samples, high sensitivity, subcellular spatial resolution, 3D optical sectioning, chemical specificity, and minimum sample destruction [102, 103]. Coherent anti-Stokes–Raman scattering (CARS), two-photon excited fluorescence (TPEF), and second-harmonic generation (SHG) microscopy are the most widely used biomedical imaging techniques [104–106].

Quantitative electroencephalographic and neuropsychological investigation of an alternative measure of frontal lobe executive functions: the Figure Trail Making Test

 Paul S. Foster, Valeria Drago, Brad J. Ferguson, Patti Kelly Harrison,David W. Harrison 

Brain Informatis    http://dx.doi.org:/10.1007/s40708-015-0025-z    http://link.springer.com/article/10.1007/s40708-015-0025-z/fulltext.html

The most frequently used measures of executive functioning are either sensitive to left frontal lobe functioning or bilateral frontal functioning. Relatively little is known about right frontal lobe contributions to executive functioning given the paucity of measures sensitive to right frontal functioning. The present investigation reports the development and initial validation of a new measure designed to be sensitive to right frontal lobe functioning, the Figure Trail Making Test (FTMT). The FTMT, the classic Trial Making Test, and the Ruff Figural Fluency Test (RFFT) were administered to 42 right-handed men. The results indicated a significant relationship between the FTMT and both the TMT and the RFFT. Performance on the FTMT was also related to high beta EEG over the right frontal lobe. Thus, the FTMT appears to be an equivalent measure of executive functioning that may be sensitive to right frontal lobe functioning. Applications for use in frontotemporal dementia, Alzheimer’s disease, and other patient populations are discussed.

Keywords – Frontal lobes, Executive functioning, Trail making test, Sequencing, Behavioral speed, Designs, Nonverbal, Neuropsychological assessment, Regulatory control, Effortful control

A recent survey indicated that the vast majority of neuropsychologists frequently assess executive functioning as part of their neuropsychological evaluations [1]. Surveys of neuropsychologists have indicated that the Trail Making Test (TMT), Controlled Oral Word Association Test (COWAT), Wisconsin Card Sorting Test (WCST), and the Stroop Color-Word Test (SCWT) are among the most commonly used instruments [1,2]. Further, the Rabin et al. [1] survey indicated that these same tests are among the most frequently used by neuropsychologists when specifically assessing executive or frontal lobe functioning. The frequent use of the TMT, WCST, and the SCWT, as well as the assumption that they are measures of executive functioning, led Demakis (2003–2004) to conduct a series of meta-analyses to determine the sensitivity of these test to detect frontal lobe dysfunction, particularly lateralized frontal lobe dysfunction. The findings indicated that the SCWT and Part A of the TMT [3], as well as the WCST [4], were all sensitive to frontal lobe dysfunction. However, only the SCWT differentiated between left and right frontal lobe dysfunction, with the worst performance among those with left frontal lobe dysfunction [3].

The finding of the Demakis [4] meta-analysis, that the WCST was not sensitive to lateralized frontal lobe dysfunction, is not surprising given the equivocal findings that have been reported. Whereas performance on the WCST is sensitive to frontal lobe dysfunction [5, 6], demonstration of lateralized frontal dysfunction has been quite problematic. Unilateral left or right dorsolateral frontal dysfunction has been associated with impaired performance on the WCST [6]. Fallgatter and Strik [7] found bilateral frontal lobe activation during performance of the WCST. However, other imaging studies have found right lateralized frontal lobe activation [8] and left lateralized frontal activation [9] in response to performance on the WCST. Further, left frontal lobe alpha power is negatively correlated with performance on the WCST [10]. Finally, patients with left frontal lobe tumors exhibit more impaired performance on the WCST than those with right frontal tumors [11].

Unlike the data for the WCST, more consistent findings have been reported regarding lateralized frontal lobe functioning for the other commonly used measures of executive functioning. For instance, as with the Demakis [3] study, many investigations have found the SCWT to be sensitive to left frontal lobe functioning, although the precise localization within the left frontal lobe has varied. Impaired performance on the SCWT results from left frontal lesions [12] and specifically from lesions localized to the left dorsolateral frontal lobe [13, 14], though bilateral frontal lesions have also yielded impaired performance [13, 14]. Further, studies using neuroimaging to investigate the neural basis of performance on the SCWT have indicated involvement of the left anterior cingulated cortex [15], left lateral prefrontal cortex [16], left inferior precentral sulcus [17], and the left dorsolateral frontal lobe [18].

Wide agreement exists among investigations of the frontal lateralization of verbal or lexical fluency to confrontation. Specifically, patients with left frontal lobe lesions are known to exhibit impaired performance on lexical fluency to confrontation tasks, relative to either patients with right frontal lesions [12, 19, 20] or controls [21]. A recent meta-analysis also indicated that the largest deficits in performance on measures of lexical fluency are associated with left frontal lobe lesions [22]. Troster et al. [23] found that, relative to patients with right pallidotomy, patients with left pallidotomy exhibited more impaired lexical fluency. Several neuroimaging investigations have further supported the role of the left frontal lobe in lexical fluency tasks [15, 24–27]. Performance on lexical fluency tasks also varies as a function of lateral frontal lobe asymmetry, as assessed by electroencephalography [28].

The Trail Making Test is certainly among the most widely used tests [1] and perhaps the most widely researched. Various norms exist for the TMT (see [29]), with Tombaugh [30] providing the most recent comprehensive set of normative data. Different methods of analyzing and interpreting the data have also been proposed and used, including error analysis [13, 14, 31–33], subtraction scores [13, 14, 34], and ratio scores [13, 14, 35].

Several different language versions of the test have been developed and reported, including Arabic [36], Chinese [37, 38], Greek [39], and Hebrew [40]. Numerous alternative versions of the TMT have been developed to address perceived shortcomings of the original TMT. For instance, the Symbol Trail Making Test [41] was developed to reduce the cultural confounds associated with the use of the Arabic numeral system and English alphabet in the original TMT. The Color Trails Test (CTT; [42]) was also developed to control for cultural confounds, although mixed results have been reported regarding whether the CTT is indeed analogous to the TMT [43–45]. A version of the TMT for preschool children, the TRAILS-P, has also been reported [46].

Additionally, the Comprehensive Trail Making Test [47] was developed to control for perceived psychometric shortcomings of the original TMT (for a review see [48] and the Oral Trail Making Test (OTMT; [49]) was developed to reduce confounds associated with motor speed and visual search abilities, with research supporting the OTMT as an equivalent measure [50, 51]. Alternate forms of the TMT have also been developed to permit successive administrations [32, 52] and to assess the relative contributions of the requisite cognitive skills [53].

Delis et al. [54] stated that the continued development of new instrumentation for improving diagnosis and treatment is a critical undertaking in all health-related fields. Further, in their view, the field of neuropsychology has recognized the importance of continually striving to develop new clinical measures. Delis and colleagues developed the extensive Delis-Kaplan Executive Functioning System (D-KEFS; [55]) in the spirit of advancing the instrumentation of neuropsychology. The D-KEFS includes a Trail Making Test consisting of five separate conditions. The Number-Letter Switching condition involves a sequencing procedure similar to that of the classic TMT. The other four conditions are designed to assess the component processes involved in completing the Number-Letter Switching condition so that a precise analysis of the nature of any underlying dysfunction may be accomplished. Specifically, these additional components include Visual Scanning, Number Sequencing, Letter Sequencing, and Motor Speed.

Given that the TMT comprises numbers and letters and is a measure of executive functioning, it may preferentially involve the left frontal lobe. Although the literature is somewhat controversial, neuropsychological and neuroimaging studies seem to provide support for the sensitivity of the TMT to detect left frontal dysfunction [56]. Recent clinically oriented studies investigating frontal lobe involvement of the TMT using transcranial magnetic stimulation (TMS) and near-infrared spectroscopy (NIRS) also support this localization [57]. Performance on Part B of the TMT improved following repetitive TMS applied to the left dorsolateral frontal lobe [57].

With 9–13-year-old boys performing TMT Part B, Weber et al. [58] found a left lateralized increase in the prefrontal cortex in deoxygenated hemoglobin, an indicator of increased oxygen consumption. Moll et al. [59] demonstrated increased activation specific to the prefrontal cortex, especially the left prefrontal region, in healthy controls performing Part B of the TMT. Foster et al. [60] found a significant positive correlation between performance on Part A of the TMT and low beta (13–21 Hz) magnitude (μV) at the left lateral frontal lobe, but not at the right lateral frontal lobe. Finally, Stuss et al. [13, 14] found that patients with left dorsolateral frontal dysfunction evidenced more errors than patients with lesions in other areas of the frontal lobes and those patients with left frontal lesions were the slowest to complete the test.

Taken together, the possibility exists that the aforementioned tests are largely associated with left frontal lobe activity and the TMT, in particular, provides information concerning mental processing speed as well as cognitive flexibility and set-shifting. While some studies have found that deficits in visuomotor set-shifting are specific to the frontal lobe damage [61], others investigators have reported such impairment in patients with posterior brain lesions and widespread cerebral dysfunctions, including cerebellar damage [62] and Alzheimer disease [63]. Thus, it remains unclear whether impairments in visuomotor set-shifting are specific to frontal lobe dysfunction or whether they are non-specific and can result from more posterior or widespread brain dysfunction.

Compared to the collective knowledge we have regarding the cognitive roles of the left frontal lobe, relatively little is known about right frontal lobe contributions to executive functioning. This is likely a result of the dearth of tests that are associated with right frontal activity. The Ruff Figural Fluency Test (RFFT; [64]) is among the few standardized tests of right frontal lobe functioning and was listed as the 14th most commonly used instrument to assess executive functioning in the Rabin et al. [1] survey. The RFFT is known to be sensitive to right frontal lobe functioning [65, 66]; see also [67] pp. 297–298), as is a measure based on the RFFT [19].

The present investigation, with the same intent and spirit as that reported by Delis et al. [54], sought to develop and initially validate a measure of right frontal lobe functioning in an effort to attain a greater understanding of right frontal contributions to executive functioning and to advance the instrumentation of neuropsychology. To meet this objective, a version of the Trail Making Test comprising figures, as opposed to numbers and letters, was developed. The TMT was used as a model for the new test, referred to as the Figure Trail Making Test (FTMT), due to the high frequency of use, the volume of research conducted, and the ease of administration of the TMT. Given that the TMT and the FTMT are both measuring executive functioning, we felt that a moderate correlation would exist between these two measures. Specifically, we hypothesized that performance on the FTMT would be positively correlated with performance on the TMT, in terms of the total time required to complete each part of the tests, an additive and subtractive score, and a ratio score. The total time required to complete each part of the FTMT was also hypothesized to be negatively correlated with the total number of unique designs produced on the RFFT and positively correlated with the number of perseverative errors committed on the RFFT and the perseverative error ratio. We also sought to determine whether the TMT and the FTMT were measuring different constructs by conducting a factor analysis, anticipating that the two tests would load on separate factors.

Additionally, we sought to obtain neurophysiological evidence that the FTMT is sensitive to right frontal lobe functioning. Specifically, we used quantitative electroencephalography (QEEG) to measure electrical activity over the left and right frontal lobes. A previous investigation we conducted found that performance on Part A of the TMT was related to left frontal lobe (F7) low beta magnitude [60]. For the present investigation, we predicted that significant negative correlations would exist between performance on Parts A and B of the TMT and both low and high beta magnitude at the F7 electrode site. We further predicted that significant negative correlations would exist between performance on Parts C and D of the FTMT and both low and high beta magnitude at the F8 electrode site.

3 Discussion

The need for additional measures of executive functions and especially instruments which may provide implications relevant to cerebral laterality is clear. There remains especially a void for neuropsychological instruments using a TMT format, which may provide information pertaining to the functional integrity of the right frontal region. Consistent with the hypotheses forwarded, significant correlations were found between performance on the TMT and the FTMT, in terms of the raw time required to complete each respective part of the tests as well as the additive and subtraction scores. The fact that the ratio scores were not significantly correlated is not surprising given that research has generally indicated a lack of clinical utility for this score [13, 14, 35]. Given the present findings, the TMT and the FTMT appear to be equivalent measures of executive functioning. Further, the present findings not only suggest that the FTMT may be a measure of executive functioning but also extend the realm of executive functioning to the sequencing and set-shifting of nonverbal stimuli.

However, the finding of significant correlations between the TMT and the FTMT represents somewhat of a caveat in that the TMT has been found to be sensitive to left frontal lobe functioning [13, 14, 57, 59]. This would seem to suggest the possibility that the FTMT is also sensitive to left frontal lobe functioning. The possibility that FTMT is related to left frontal lobe functioning is tempered, though, by the fact that the many of the hypothesized correlations between performance on the RFFT and the FTMT were also significant. Performance on the RFFT is related to right frontal lobe functioning [65,66]. Thus, the significant correlations between the RFFT and the FTMT suggest that the FTMT may also be sensitive to right frontal lobe functioning. Additionally, it should also be noted that the TMT was not significantly correlated with performance on the RFFT, with the exception of the significant correlation between performance on the TMT Part A and the total number of unique designs produced on the RFFT. Taken together, the results suggest that the FTMT may be a measure of right frontal executive functioning.

Additional support for the sensitivity of the FTMT to right frontal lobe functioning is provided by the finding of a significant negative correlation between performance on Part D of the FTMT and high beta magnitude. We have previously used QEEG to provide neurophysiological validation of the RFFT [65] and the Rey Auditory Verbal Learning Test [70] and the present findings provide further support for the use of QEEG in validating neuropsychological tests. The lack of significant correlations between the TMT and either low or high beta magnitude may be related to a restricted range of scores on the TMT. As a whole, performance on the FTMT was more variable than performance on the TMT and this relatively restricted range for the TMT may have impacted the obtained correlations. Given the present findings, together with those of the Foster et al. [65, 70] investigations, further support is also provided for the use of EEG in establishing neurophysiological validation for neuropsychological tests.

The results from the factor analysis provide support for the contention that the FMT may be a measure of right frontal lobe activity and also provide initial discriminant validity for the FTMT. Specifically, Parts C and D of the FTMT were found to load on the same factor as the number of designs generated on the RFFT, although the time required to complete Part A of the TMT is also included. Additionally, the number of errors committed on Parts C and D of the FTMT comprises a single factor, separate from either the TMT or the RFFT. Although these results support the FTMT as a measure of nonverbal executive functioning, it would be helpful to conduct an additional factor analysis including additional measures of right frontal functioning, and perhaps other measures of right hemisphere functioning as marker variables.

We sought to develop a measure sensitive to right frontal lobe functioning due to the paucity of such tests and the potentially important uses that right frontal lobe tests may have clinically. Tests of right frontal lobe functioning may, for instance, be useful in identifying and distinguishing left versus right frontotemporal dementia (FTD). Research has indicated that FTD is associated with cerebral atrophy at the right dorsolateral frontal and left premotor cortices [71]. Fukui and Kertesz [72] found right frontal lobe volume reduction in FTD relative to Alzheimer’s disease and progressive nonfluent aphasia. Some have suggested that FTD should not be considered as a unitary disorder and that neuropsychological testing may aid in differentially diagnosing left versus right FTD [73].

Whereas right FTD has been associated with more errors and perseverative responses on the Wisconsin Card Sorting Test (WCST), left FTD has been associated with significantly worse performance on the Boston Naming Test (BNT) and the Stroop Color-Word test [73]. Razani et al. [74] also distinguished between left and right FTD in finding that left FTD performed worse on the BNT and the right FTD patients performed worse on the WCST. However, as noted earlier, the WCST has been associated with left frontal activity [9], right frontal activation [8], and bilateral frontal activation [7]. Further, patients with left frontal tumors perform worse than those with right frontal tumors [11].

Patients with FTD that predominantly involves the right frontotemporal region have behavioral and emotional abnormalities and those with predominantly left frontotemporal region damage have a loss of lexical semantic knowledge. Patients, in whom neural degeneration begins on the left side, often present to the clinicians at an early stage of the disease due to the presence of language abnormalities, but maintain their emotion processing abilities, being preserved the right anterior temporal lobe. However, as this disease advances, the disease may progress to the right frontotemporal regions. Tests sensitive to right frontal lobe functioning may be useful tools to identify in advance the course of the disease, providing immediate and specific treatments and informing the caregivers on the possible prospective frame of the disease.

A potentially more important use of tests sensitive to right frontal lobe functioning, though, may be in predicting dementia patients that will develop significant and disruptive behavioral deficits. Research has found that approximately 92 % of right-sided FTD patients exhibit socially undesirable behaviors as their initial symptom, as compared to only 11 % of left-sided FTD patients [75]. Behavioral deficits in FTD are associated with gray matter loss at the dorsomedial frontal region, particularly on the right [76].

Alzheimer’s disease (AD) is also often associated with significant behavioral disturbances. Even AD patients with mild dementia are noted to exhibit behavioral deficits such as delusions, hallucinations, agitation, dysphoria, anxiety, apathy, and irritability [77]. Indeed, Shimabukuro et al. [77] found that regardless of dementia severity, over half of all AD patients exhibited apathy, delusions, irritability, dysphoria, and anxiety. Delusions in AD patients are associated with relative right frontal hypoperfusion as indicated by SPECT imaging [78, 79]. Further, positron emission tomography (PET) has indicated that AD patients exhibiting delusions exhibit hypometabolism at the right superior dorsolateral frontal and right inferior frontal pole [80].

Although research clearly implicates right frontal lobe dysfunction in the expression of behavioral deficits, data from neuropsychological testing are not as clear. Negative symptoms in patients with AD and FTD have been related to measures of nonverbal and verbal executive functioning as well as verbal memory [81]. Positive symptoms, in contrast, were related to constructional skills and attention. However, Staff et al. [78] failed to dissociate patients with delusions from those without delusions based on neuropsychological test performance, despite significant differences existing in right frontal and limbic functioning as revealed by functional imaging. The inclusion of other measures of right frontal lobe functioning may result in improved neuropsychological differentiation of dementia patients with and without significant behavioral disturbances. Further, it may be possible to predict early in the disease process those patients that will ultimately develop behavioral disturbances with improved measures of right frontal functioning. Predicting those that may develop behavioral problems will permit earlier treatment and will provide the family with more time to prepare for the potential emergence of such difficulties. Certainly, future research needs to be conducted that incorporates measures of right and left frontal lobe functioning in regression analyses to determine the plausibility of such prediction.

Tests sensitive to right frontal lobe functioning may also be useful in identifying more subtle right frontal lobe dysfunction and the cognitive and behavioral changes that follow. The right frontal lobe mediates language melody or prosody and forms a cohesive discourse, interprets abstract communication in spoken and written languages, and interprets the inferred relationships involved in communications. Subtle difficulties in interpreting abstract meaning in communication, comprehending metaphors, and even understanding jokes that are often seen in right frontal lobe stroke patients may not be detected by the family and may also be under diagnosed by clinicians [82]. Further, patients with right frontal lobe lesions are generally more euphoric and unconcerned, often minimizing their symptoms [82] or denying the illness, which may delay referral to a clinician and diagnosis.

Attention deficit hyperactivity disorder (ADHD) is a neurological disease characterized by motor inhibition deficit, problems with cognitive flexibility, social disruption, and emotional disinhibition [83, 84]. Functional MRI studies reveal reduced right prefrontal activation during “frontal tasks,” such as go/no go [85], Stroop [86], and attention task performance [87]. The right frontal lobe deficit hypothesis is further supported by structural studies [88, 89]. Tests of right frontal lobe functioning may be useful in further characterizing the nature of this deficit and in specifying the likely hemispheric locus of dysfunction.

To summarize, we feel that right frontal lobe functioning has been relatively neglected in neuropsychological assessment and that many uses for such tests exist. Our intent was to develop a test purportedly sensitive to right frontal functioning that would be easy and quick to administer in a clinical setting. However, we are certainly not meaning to assert that our FTMT would be applicable in all the aforementioned conditions. Additional research should be conducted to determine the precise clinical utility of the FTMT.

Further validation of the FTMT should also be undertaken. Establishing convergent validation may involve correlating tests measuring the same domain, such as executive functioning. This was initially accomplished in the present investigation through the significant correlations between the TMT and the FTMT. Additionally, convergent validation may also involve correlating tests that purportedly measure the same region of the brain. This was also initially accomplished in the present investigation through the significant correlations between the FTMT and the RFFT. However, additional convergent validation certainly needs to be obtained, as well as validation using patient populations and neurophysiological validation.

We are currently collecting data that hopefully will provide neurophysiological validation of the FTMT. Certainly, though, it is hoped that the present investigation will not only stimulate further research seeking to validate the FTMT and provide more comprehensive normative data, but also stimulate research investigating whether the FTMT or other measures of right frontal lobe functioning may be used to predict patients that will develop behavioral disturbances.

World’s Greatest Literature Reveals Multifractals, Cascades of Consciousness

http://www.scientificcomputing.com/news/2016/01/worlds-greatest-literature-reveals-multifractals-cascades-consciousness

http://www.scientificcomputing.com/sites/scientificcomputing.com/files/Worlds_Greatest_Literature_Reveals_Multifractals_Cascades_of_Consciousness_440.jpg

Multifractal analysis of Finnegan’s Wake by James Joyce. The ideal shape of the graph is virtually indistinguishable from the results for purely mathematical multifractals. The horizontal axis represents the degree of singularity, and the vertical axis shows the spectrum of singularity. Courtesy of IFJ PAN

Arthur Conan Doyle, Charles Dickens, James Joyce, William Shakespeare and JRR Tolkien. Regardless of the language they were working in, some of the world’s greatest writers appear to be, in some respects, constructing fractals. Statistical analysis, however, revealed something even more intriguing. The composition of works from within a particular genre was characterized by the exceptional dynamics of a cascading (avalanche) narrative structure. This type of narrative turns out to be multifractal. That is, fractals of fractals are created.

As far as many bookworms are concerned, advanced equations and graphs are the last things which would hold their interest, but there’s no escape from the math. Physicists from the Institute of Nuclear Physics of the Polish Academy of Sciences (IFJ) in Cracow, Poland, performed a detailed statistical analysis of more than one hundred famous works of world literature, written in several languages and representing various literary genres. The books, tested for revealing correlations in variations of sentence length, proved to be governed by the dynamics of a cascade. This means that the construction of these books is, in fact, a fractal. In the case of several works, their mathematical complexity proved to be exceptional, comparable to the structure of complex mathematical objects considered to be multifractal. Interestingly, in the analyzed pool of all the works, one genre turned out to be exceptionally multifractal in nature.

Fractals are self-similar mathematical objects: when we begin to expand one fragment or another, what eventually emerges is a structure that resembles the original object. Typical fractals, especially those widely known as the Sierpinski triangle and the Mandelbrot set, are monofractals, meaning that the pace of enlargement in any place of a fractal is the same, linear: if they at some point were rescaled x number of times to reveal a structure similar to the original, the same increase in another place would also reveal a similar structure.

Multifractals are more highly advanced mathematical structures: fractals of fractals. They arise from fractals ‘interwoven’ with each other in an appropriate manner and in appropriate proportions. Multifractals are not simply the sum of fractals and cannot be divided to return back to their original components, because the way they weave is fractal in nature. The result is that, in order to see a structure similar to the original, different portions of a multifractal need to expand at different rates. A multifractal is, therefore, non-linear in nature.

“Analyses on multiple scales, carried out using fractals, allow us to neatly grasp information on correlations among data at various levels of complexity of tested systems. As a result, they point to the hierarchical organization of phenomena and structures found in nature. So, we can expect natural language, which represents a major evolutionary leap of the natural world, to show such correlations as well. Their existence in literary works, however, had not yet been convincingly documented. Meanwhile, it turned out that, when you look at these works from the proper perspective, these correlations appear to be not only common, but in some works they take on a particularly sophisticated mathematical complexity,” says Professor Stanislaw Drozdz, IFJ PAN, Cracow University of Technology.

The study involved 113 literary works written in English, French, German, Italian, Polish, Russian and Spanish by such famous figures as Honore de Balzac, Arthur Conan Doyle, Julio Cortazar, Charles Dickens, Fyodor Dostoevsky, Alexandre Dumas, Umberto Eco, George Elliot, Victor Hugo, James Joyce, Thomas Mann, Marcel Proust, Wladyslaw Reymont, William Shakespeare, Henryk Sienkiewicz, JRR Tolkien, Leo Tolstoy and Virginia Woolf, among others. The selected works were no less than 5,000 sentences long, in order to ensure statistical reliability.

To convert the texts to numerical sequences, sentence length was measured by the number of words (an alternative method of counting characters in the sentence turned out to have no major impact on the conclusions). The dependences were then searched for in the data — beginning with the simplest, i.e. linear. This is the posited question: if a sentence of a given length is x times longer than the sentences of different lengths, is the same aspect ratio preserved when looking at sentences respectively longer or shorter?

“All of the examined works showed self-similarity in terms of organization of the lengths of sentences. Some were more expressive — here The Ambassadors by Henry James stood out — while others to far less of an extreme, as in the case of the French seventeenth-century romance Artamene ou le Grand Cyrus. However, correlations were evident and, therefore, these texts were the construction of a fractal,” comments Dr. Pawel Oswiecimka (IFJ PAN), who also noted that fractality of a literary text will, in practice, never be as perfect as in the world of mathematics. It is possible to magnify mathematical fractals up to infinity, while the number of sentences in each book is finite and, at a certain stage of scaling, there will always be a cut-off in the form of the end of the dataset.

Things took a particularly interesting turn when physicists from IFJ PAN began tracking non-linear dependence, which in most of the studied works was present to a slight or moderate degree. However, more than a dozen works revealed a very clear multifractal structure, and almost all of these proved to be representative of one genre, that of stream of consciousness. The only exception was the Bible, specifically the Old Testament, which has, so far, never been associated with this literary genre.

“The absolute record in terms of multifractality turned out to be Finnegan’s Wakeby James Joyce. The results of our analysis of this text are virtually indistinguishable from ideal, purely mathematical multifractals,” says Drozdz.

The most multifractal works also included A Heartbreaking Work of Staggering Genius by Dave Eggers, Rayuela by Julio Cortazar, The US Trilogy by John Dos Passos, The Waves by Virginia Woolf, 2666 by Roberto Bolano, and Joyce’sUlysses. At the same time, a lot of works usually regarded as stream of consciousness turned out to show little correlation to multifractality, as it was hardly noticeable in books such as Atlas Shrugged by Ayn Rand and A la recherche du temps perdu by Marcel Proust.

“It is not entirely clear whether stream of consciousness writing actually reveals the deeper qualities of our consciousness, or rather the imagination of the writers. It is hardly surprising that ascribing a work to a particular genre is, for whatever reason, sometimes subjective. We see, moreover, the possibility of an interesting application of our methodology: it may someday help in a more objective assignment of books to one genre or another,” notes Drozdz.

Multifractal analyses of literary texts carried out by the IFJ PAN have been published in Information Sciences, the journal of computer science. The publication has undergone rigorous verification: given the interdisciplinary nature of the subject, editors immediately appointed up to six reviewers.

Citation: “Quantifying origin and character of long-range correlations in narrative texts” S. Drożdż, P. Oświęcimka, A. Kulig, J. Kwapień, K. Bazarnik, I. Grabska-Gradzińska, J. Rybicki, M. Stanuszek; Information Sciences, vol. 331, 32–44, 20 February 2016; DOI: 10.1016/j.ins.2015.10.023

New Quantum Approach to Big Data could make Impossibly Complex Problems Solvable

David L. Chandler, MIT

http://www.scientificcomputing.com/news/2016/01/new-quantum-approach-big-data-could-make-impossibly-complex-problems-solvable

http://www.scientificcomputing.com/sites/scientificcomputing.com/files/New_Quantum_Approach_to_Big_Data_could_make_Impossibly_Complex_Problems_Solvable_440.jpg

This diagram demonstrates the simplified results that can be obtained by using quantum analysis on enormous, complex sets of data. Shown here are the connections between different regions of the brain in a control subject (left) and a subject under the influence of the psychedelic compound psilocybin (right). This demonstrates a dramatic increase in connectivity, which explains some of the drug’s effects (such as “hearing” colors or “seeing” smells). Such an analysis, involving billions of brain cells, would be too complex for conventional techniques, but could be handled easily by the new quantum approach, the researchers say. Courtesy of the researchers

From gene mapping to space exploration, humanity continues to generate ever-larger sets of data — far more information than people can actually process, manage or understand.

Machine learning systems can help researchers deal with this ever-growing flood of information. Some of the most powerful of these analytical tools are based on a strange branch of geometry called topology, which deals with properties that stay the same even when something is bent and stretched every which way.

Such topological systems are especially useful for analyzing the connections in complex networks, such as the internal wiring of the brain, the U.S. power grid, or the global interconnections of the Internet. But even with the most powerful modern supercomputers, such problems remain daunting and impractical to solve. Now, a new approach that would use quantum computers to streamline these problems has been developed by researchers at MIT, the University of Waterloo, and the University of Southern California.

The team describes their theoretical proposal this week in the journal Nature Communications. Seth Lloyd, the paper’s lead author and the Nam P. Suh Professor of Mechanical Engineering, explains that algebraic topology is key to the new method. This approach, he says, helps to reduce the impact of the inevitable distortions that arise every time someone collects data about the real world.

In a topological description, basic features of the data (How many holes does it have? How are the different parts connected?) are considered the same no matter how much they are stretched, compressed, or distorted. Lloyd explains that it is often these fundamental topological attributes “that are important in trying to reconstruct the underlying patterns in the real world that the data are supposed to represent.”

It doesn’t matter what kind of dataset is being analyzed, he says. The topological approach to looking for connections and holes “works whether it’s an actual physical hole, or the data represents a logical argument and there’s a hole in the argument. This will find both kinds of holes.”

Using conventional computers, that approach is too demanding for all but the simplest situations. Topological analysis “represents a crucial way of getting at the significant features of the data, but it’s computationally very expensive,” Lloyd says. “This is where quantum mechanics kicks in.” The new quantum-based approach, he says, could exponentially speed up such calculations.

Lloyd offers an example to illustrate that potential speedup: If you have a dataset with 300 points, a conventional approach to analyzing all the topological features in that system would require “a computer the size of the universe,” he says. That is, it would take 2300 (two to the 300th power) processing units — approximately the number of all the particles in the universe. In other words, the problem is simply not solvable in that way.

“That’s where our algorithm kicks in,” he says. Solving the same problem with the new system, using a quantum computer, would require just 300 quantum bits — and a device this size may be achieved in the next few years, according to Lloyd.

“Our algorithm shows that you don’t need a big quantum computer to kick some serious topological butt,” he says.

There are many important kinds of huge datasets where the quantum-topological approach could be useful, Lloyd says, for example understanding interconnections in the brain. “By applying topological analysis to datasets gleaned by electroencephalography or functional MRI, you can reveal the complex connectivity and topology of the sequences of firing neurons that underlie our thought processes,” he says.

The same approach could be used for analyzing many other kinds of information. “You could apply it to the world’s economy, or to social networks, or almost any system that involves long-range transport of goods or information,” Lloyd says. But the limits of classical computation have prevented such approaches from being applied before.

While this work is theoretical, “experimentalists have already contacted us about trying prototypes,” he says. “You could find the topology of simple structures on a very simple quantum computer. People are trying proof-of-concept experiments.”

Ignacio Cirac, a professor at the Max Planck Institute of Quantum Optics in Munich, Germany, who was not involved in this research, calls it “a very original idea, and I think that it has a great potential.” He adds “I guess that it has to be further developed and adapted to particular problems. In any case, I think that this is top-quality research.”

The team also included Silvano Garnerone of the University of Waterloo in Ontario, Canada, and Paolo Zanardi of the Center for Quantum Information Science and Technology at the University of Southern California. The work was supported by the Army Research Office, Air Force Office of Scientific Research, Defense Advanced Research Projects Agency, Multidisciplinary University Research Initiative of the Office of Naval Research, and the National Science Foundation.

Beyond Chess: Computer Beats Human in Ancient Chinese Game

http://www.rdmag.com/news/2016/01/beyond-chess-computer-beats-human-ancient-chinese-game

http://www.rdmag.com/sites/rdmag.com/files/rd1601_chess.jpg

A player places a black stone while his opponent waits to place a white one as they play Go, a game of strategy, in the Seattle Go Center, Tuesday, April 30, 2002. The game, which originated in China more than 2,500 years ago, involves two players who take turns putting markers on a grid. The object is to surround more area on the board with the markers than one’s opponent, as well as capturing the opponent’s pieces by surrounding them. A paper released Wednesday, Jan. 27, 2016 describes how a computer program has beaten a human master at the complex board game, marking significant advance for development of artificial intelligence. (AP Photo/Cheryl Hatch)

A computer program has beaten a human champion at the ancient Chinese board game Go, marking a significant advance for development of artificial intelligence.

The program had taught itself how to win, and its developers say its learning strategy may someday let computers help solve real-world problems like making medical diagnoses and pursuing scientific research.

The program and its victory are described in a paper released Wednesday by the journal Nature.

Computers previously have surpassed humans for other games, including chess, checkers and backgammon. But among classic games, Go has long been viewed as the most challenging for artificial intelligence to master.

Go, which originated in China more than 2,500 years ago, involves two players who take turns putting markers on a checkerboard-like grid. The object is to surround more area on the board with the markers than one’s opponent, as well as capturing the opponent’s pieces by surrounding them.

While the rules are simple, playing it well is not. It’s “probably the most complex game ever devised by humans,” Dennis Hassabis of Google DeepMind in London, one of the study authors, told reporters Tuesday.

The new program, AlphaGo, defeated the European champion in all five games of a match in October, the Nature paper reports.

In March, AlphaGo will face legendary player Lee Sedol in Seoul, South Korea, for a $1 million prize, Hassabis said.

Martin Mueller, a computing science professor at the University of Alberta in Canada who has worked on Go programs for 30 years but didn’t participate in AlphaGo, said the new program “is really a big step up from everything else we’ve seen…. It’s a very, very impressive piece of work.”

Biological Origin of Schizophrenia

Excessive ‘pruning’ of connections between neurons in brain predisposes to disease

http://hms.harvard.edu/sites/default/files/uploads/news/McCarroll_C4_600x400.jpg

Imaging studies showed C4 (in green) located at the synapses of primary human neurons. Image: Heather de Rivera, McCarroll lab

 PAUL GOLDSMITH    http://hms.harvard.edu/news/biological-origin-schizophrenia

The risk of schizophrenia increases if a person inherits specific variants in a gene related to “synaptic pruning”—the elimination of connections between neurons—according to a study from Harvard Medical School, the Broad Institute and Boston Children’s Hospital. The findings were based on genetic analysis of nearly 65,000 people.

The study represents the first time that the origin of this psychiatric disease has been causally linked to specific gene variants and a biological process.

Get more HMS news here

It also helps explain two decades-old observations: synaptic pruning is particularly active during adolescence, which is the typical period of onset for symptoms of schizophrenia, and the brains of schizophrenic patients tend to show fewer connections between neurons.

The gene, complement component 4 (C4), plays a well-known role in the immune system. It has now been shown to also play a key role in brain development and schizophrenia risk. The insight may allow future therapeutic strategies to be directed at the disorder’s roots, rather than just its symptoms.

The study, which appears online Jan. 27 in Nature, was led by HMS researchers at the Broad Institute’s Stanley Center for Psychiatric Research and Boston Children’s. They include senior author Steven McCarroll, HMS associate professor of genetics and director of genetics for the Stanley Center; Beth Stevens, HMS assistant professor of neurology at Boston Children’s and institute member at the Broad; Michael Carroll, HMS professor of pediatrics at Boston Children’s; and first author Aswin Sekar, an MD-PhD student at HMS.

The study has the potential to reinvigorate translational research on a debilitating disease. Schizophrenia afflicts approximately 1 percent people worldwide and is characterized by hallucinations, emotional withdrawal and a decline in cognitive function. These symptoms most frequently begin in patients when they are teenagers or young adults.

“These results show that it is possible to go from genetic data to a new way of thinking about how a disease develops—something that has been greatly needed.”

First described more than 130 years ago, schizophrenia lacks highly effective treatments and has seen few biological or medical breakthroughs over the past half-century.

In the summer of 2014, an international consortium led by researchers at the Stanley Center identified more than 100 regions in the human genome that carry risk factors for schizophrenia.

The newly published study now reports the discovery of the specific gene underlying the strongest of these risk factors and links it to a specific biological process in the brain.

“Since schizophrenia was first described over a century ago, its underlying biology has been a black box, in part because it has been virtually impossible to model the disorder in cells or animals,” said McCarroll. “The human genome is providing a powerful new way in to this disease. Understanding these genetic effects on risk is a way of prying open that black box, peering inside and starting to see actual biological mechanisms.”

“This study marks a crucial turning point in the fight against mental illness,” said Bruce Cuthbert, acting director of the National Institute of Mental Health. “Because the molecular origins of psychiatric diseases are little-understood, efforts by pharmaceutical companies to pursue new therapeutics are few and far between. This study changes the game. Thanks to this genetic breakthrough we can finally see the potential for clinical tests, early detection, new treatments and even prevention.”

The path to discovery

The discovery involved the collection of DNA from more than 100,000 people, detailed analysis of complex genetic variation in more than 65,000 human genomes, development of an innovative analytical strategy, examination of postmortem brain samples from hundreds of people and the use of animal models to show that a protein from the immune system also plays a previously unsuspected role in the brain.

Over the past five years, Stanley Center geneticists and collaborators around the world collected more than 100,000 human DNA samples from 30 different countries to locate regions of the human genome harboring genetic variants that increase the risk of schizophrenia. The strongest signal by far was on chromosome 6, in a region of DNA long associated with infectious disease. This caused some observers to suggest that schizophrenia might be triggered by an infectious agent. But researchers had no idea which of the hundreds of genes in the region was actually responsible or how it acted.

Based on analyses of the genetic data, McCarroll and Sekar focused on a region containing the C4 gene. Unlike most genes, C4 has a high degree of structural variability. Different people have different numbers of copies and different types of the gene.

McCarroll and Sekar developed a new molecular technique to characterize the C4 gene structure in human DNA samples. They also measured C4 gene activity in nearly 700 post-mortem brain samples.

They found that the C4 gene structure (DNA) could predict the C4 gene activity (RNA) in each person’s brain. They then used this information to infer C4 gene activity from genome data from 65,000 people with and without schizophrenia.

These data revealed a striking correlation. People who had particular structural forms of the C4 gene showed higher expression of that gene and, in turn, had a higher risk of developing schizophrenia.

Connecting cause and effect through neuroscience

But how exactly does C4—a protein known to mark infectious microbes for destruction by immune cells—affect the risk of schizophrenia?

Answering this question required synthesizing genetics and neurobiology.

Stevens, a recent recipient of a MacArthur Foundation “genius grant,” had found that other complement proteins in the immune system also played a role in brain development. These results came from studying an experimental model of synaptic pruning in the mouse visual system.

“This discovery enriches our understanding of the complement system in brain development and in disease, and we could not have made that leap without the genetics.”

Carroll had long studied C4 for its role in immune disease, and developed mice with different numbers of copies of C4.

The three labs set out to study the role of C4 in the brain.

They found that C4 played a key role in pruning synapses during maturation of the brain. In particular, they found that C4 was necessary for another protein—a complement component called C3—to be deposited onto synapses as a signal that the synapses should be pruned. The data also suggested that the more C4 activity an animal had, the more synapses were eliminated in its brain at a key time in development.

The findings may help explain the longstanding mystery of why the brains of people with schizophrenia tend to have a thinner cerebral cortex (the brain’s outer layer, responsible for many aspects of cognition) with fewer synapses than do brains of unaffected individuals. The work may also help explain why the onset of schizophrenia symptoms tends to occur in late adolescence.

The human brain normally undergoes widespread synapse pruning during adolescence, especially in the cerebral cortex. Excessive synaptic pruning during adolescence and early adulthood, due to increased complement (C4) activity, could lead to the cognitive symptoms seen in schizophrenia.

“Once we had the genetic findings in front of us we started thinking about the possibility that complement molecules are excessively tagging synapses in the developing brain,” Stevens said.

“This discovery enriches our understanding of the complement system in brain development and in disease, and we could not have made that leap without the genetics,” she said. “We’re far from having a treatment based on this, but it’s exciting to think that one day we might be able to turn down the pruning process in some individuals and decrease their risk.”

Opening a path toward early detection and potential therapies

Beyond providing the first insights into the biological origins of schizophrenia, the work raises the possibility that therapies might someday be developed that could turn down the level of synaptic pruning in people who show early symptoms of schizophrenia.

This would be a dramatically different approach from current medical therapies, which address only a specific symptom of schizophrenia—psychosis—rather than the disorder’s root causes, and which do not stop cognitive decline or other symptoms of the illness.

The researchers emphasize that therapies based on these findings are still years down the road. Still, the fact that much is already known about the role of complement proteins in the immune system means that researchers can tap into a wealth of existing knowledge to identify possible therapeutic approaches. For example, anticomplement drugs are already under development for treating other diseases.

“In this area of science, our dream has been to find disease mechanisms that lead to new kinds of treatments,” said McCarroll. “These results show that it is possible to go from genetic data to a new way of thinking about how a disease develops—something that has been greatly needed.”

This work was supported by the Broad Institute’s Stanley Center for Psychiatric Research and by the National Institutes of Health (grants U01MH105641, R01MH077139 and T32GM007753).

Adapted from a Broad Institute news release.


Scientists open the ‘black box’ of schizophrenia with dramatic genetic discovery

Amy Ellis Nutt    https://www.washingtonpost.com/news/speaking-of-science/wp/2016/01/27/scientists-open-the-black-box-of-schizophrenia-with-dramatic-genetic-finding/

Scientists Prune Away Schizophrenia’s Hidden Genetic Mechanisms

http://www.genengnews.com/gen-news-highlights/scientists-prune-away-schizophrenia-s-hidden-genetic-mechanisms/81252297/

https://youtu.be/s0y4equOTLg

A landmark study has revealed that a person’s risk of schizophrenia is increased if they inherit specific variants in a gene related to “synaptic pruning”—the elimination of connections between neurons. The findings represent the first time that the origin of this devastating psychiatric disease has been causally linked to specific gene variants and a biological process.

http://www.genengnews.com/Media/images/GENHighlight/thumb_107629_web2209513618.jpg

The site in Chromosome 6 harboring the gene C4 towers far above other risk-associated areas on schizophrenia’s genomic “skyline,” marking its strongest known genetic influence. The new study is the first to explain how specific gene versions work biologically to confer schizophrenia risk. [Psychiatric Genomics Consortium]

  • A new study by researchers at the Broad Institute’s Stanley Center for Psychiatric Research, Harvard Medical School, and Boston Children’s Hospital genetically analyzed nearly 65,000 people and revealed that an individual’s risk of schizophrenia is increased if they inherited distinct variants in a gene related to “synaptic pruning”—the elimination of connections between neurons. This new data represents the first time that the origin of this psychiatric disease has been causally linked to particular gene variants and a biological process.

The investigators discovered that versions of a gene commonly thought to be involved in immune function might trigger a runaway pruning of an adolescent brain’s still-maturing communications infrastructure. The researchers described a scenario where patients with schizophrenia show fewer such connections between neurons or synapses.

“Normally, pruning gets rid of excess connections we no longer need, streamlining our brain for optimal performance, but too much pruning can impair mental function,” explained Thomas Lehner, Ph.D., director of the Office of Genomics Research Coordination at the NIH’s National Institute of Mental Health (NIMH), which co-funded the study along with the Stanley Center for Psychiatric Research at the Broad Institute and other NIH components. “It could help explain schizophrenia’s delayed age-of-onset of symptoms in late adolescence and early adulthood and shrinkage of the brain’s working tissue. Interventions that put the brakes on this pruning process-gone-awry could prove transformative.”

The gene the research team called into question, dubbed C4 (complement component 4), was associated with the largest risk for the disorder. C4’s role represents some of the most compelling evidence, to date, linking specific gene versions to a biological process that could cause at least some cases of the illness.

The findings from this study were published recently in Nature through an article entitled “Schizophrenia risk from complex variation of complement component 4.”

“Since schizophrenia was first described over a century ago, its underlying biology has been a black box, in part because it has been virtually impossible to model the disorder in cells or animals,” noted senior study author Steven McCarroll, Ph.D., director of genetics for the Stanley Center and an associate professor of genetics at Harvard Medical School. “The human genome is providing a powerful new way into this disease. Understanding these genetic effects on risk is a way of prying open that block box, peering inside and starting to see actual biological mechanisms.”

Dr. McCarroll and his colleagues found that a stretch of chromosome 6 encompassing several genes known to be involved in immune function emerged as the strongest signal associated with schizophrenia risk in genome-wide analyses. Yet conventional genetics failed to turn up any specific gene versions there that were linked to schizophrenia.

In order to uncover how the immune-related site confers risk for the mental disorder, the scientists mounted a search for cryptic genetic influences that might generate unconventional signals. C4, a gene with known roles in immunity, emerged as a prime suspect because it is unusually variable across individuals.

Upon further investigation into the complexities of how such structural variation relates to the gene’s level of expression and how that, in turn, might link to schizophrenia, the team discovered structurally distinct versions that affect expression of two main forms of the gene within the brain. The more a version resulted in expression of one of the forms, called C4A, the more it was associated with schizophrenia. The greater number of copies an individual had of the suspect versions, the more C4 switched on and the higher their risk of developing schizophrenia. Furthermore, the C4 protein turned out to be most prevalent within the cellular machinery that supports connections between neurons.

“Once we had the genetic findings in front of us we started thinking about the possibility that complement molecules are excessively tagging synapses in the developing brain,” remarked co-author Beth Stevens, Ph.D. a neuroscientist and assistant professor of neurology at Boston Children’s Hospital and institute member at the Broad. “This discovery enriches our understanding of the complement system in brain development and disease, and we could not have made that leap without the genetics. We’re far from having a treatment based on this, but it’s exciting to think that one day we might be able to turn down the pruning process in some individuals and decrease their risk.”

“This study marks a crucial turning point in the fight against mental illness. It changes the game,” added acting NIMH director Bruce Cuthbert, Ph.D. “Because the molecular origins of psychiatric diseases are little-understood, efforts by pharmaceutical companies to pursue new therapeutics are few and far between. This study changes the game. Thanks to this genetic breakthrough, we can finally see the potential for clinical tests, early detection, new treatments, and even prevention.”

Connecting cause and effect through neuroscience

But how exactly does C4—a protein known to mark infectious microbes for destruction by immune cells—affect the risk of schizophrenia?

Answering this question required synthesizing genetics and neurobiology.

Stevens, a recent recipient of a MacArthur Foundation “genius grant,” had found that other complement proteins in the immune system also played a role in brain development. These results came from studying an experimental model of synaptic pruning in the mouse visual system.

“This discovery enriches our understanding of the complement system in brain development and in disease, and we could not have made that leap without the genetics.”

Carroll had long studied C4 for its role in immune disease, and developed mice with different numbers of copies of C4.

The three labs set out to study the role of C4 in the brain.

They found that C4 played a key role in pruning synapses during maturation of the brain. In particular, they found that C4 was necessary for another protein—a complement component called C3—to be deposited onto synapses as a signal that the synapses should be pruned. The data also suggested that the more C4 activity an animal had, the more synapses were eliminated in its brain at a key time in development.

The findings may help explain the longstanding mystery of why the brains of people with schizophrenia tend to have a thinner cerebral cortex (the brain’s outer layer, responsible for many aspects of cognition) with fewer synapses than do brains of unaffected individuals. The work may also help explain why the onset of schizophrenia symptoms tends to occur in late adolescence.

The human brain normally undergoes widespread synapse pruning during adolescence, especially in the cerebral cortex. Excessive synaptic pruning during adolescence and early adulthood, due to increased complement (C4) activity, could lead to the cognitive symptoms seen in schizophrenia.

“Once we had the genetic findings in front of us we started thinking about the possibility that complement molecules are excessively tagging synapses in the developing brain,” Stevens said.

“This discovery enriches our understanding of the complement system in brain development and in disease, and we could not have made that leap without the genetics,” she said. “We’re far from having a treatment based on this, but it’s exciting to think that one day we might be able to turn down the pruning process in some individuals and decrease their risk.”

Opening a path toward early detection and potential therapies

Beyond providing the first insights into the biological origins of schizophrenia, the work raises the possibility that therapies might someday be developed that could turn down the level of synaptic pruning in people who show early symptoms of schizophrenia.

This would be a dramatically different approach from current medical therapies, which address only a specific symptom of schizophrenia—psychosis—rather than the disorder’s root causes, and which do not stop cognitive decline or other symptoms of the illness.

The researchers emphasize that therapies based on these findings are still years down the road. Still, the fact that much is already known about the role of complement proteins in the immune system means that researchers can tap into a wealth of existing knowledge to identify possible therapeutic approaches. For example, anticomplement drugs are already under development for treating other diseases.

“In this area of science, our dream has been to find disease mechanisms that lead to new kinds of treatments,” said McCarroll. “These results show that it is possible to go from genetic data to a new way of thinking about how a disease develops—something that has been greatly needed.”

This work was supported by the Broad Institute’s Stanley Center for Psychiatric Research and by the National Institutes of Health (grants U01MH105641, R01MH077139 and T32GM007753).

Adapted from a Broad Institute news release.


https://img.washingtonpost.com/wp-apps/imrs.php?src=https://img.washingtonpost.com/rf/image_908w/2010-2019/WashingtonPost/2011/09/27/Production/Sunday/SunBiz/Images/mental2b.jpg&w=1484

This post has been updated.

For the first time, scientists have pinned down a molecular process in the brain that helps to trigger schizophrenia. The researchers involved in the landmark study, which was published Wednesday in the journal Nature, say the discovery of this new genetic pathway probably reveals what goes wrong neurologically in a young person diagnosed with the devastating disorder.

The study marks a watershed moment, with the potential for early detection and new treatments that were unthinkable just a year ago, according to Steven Hyman, director of the Stanley Center for Psychiatric Research at the Broad Institute at MIT. Hyman, a former director of the National Institute of Mental Health, calls it “the most significant mechanistic study about schizophrenia ever.”

“I’m a crusty, old, curmudgeonly skeptic,” he said. “But I’m almost giddy about these findings.”

The researchers, chiefly from the Broad Institute, Harvard Medical School and Boston Children’s Hospital, found that a person’s risk of schizophrenia is dramatically increased if they inherit variants of a gene important to “synaptic pruning” — the healthy reduction during adolescence of brain cell connections that are no longer needed.

[Schizophrenic patients have different oral bacteria than non-mentally ill individuals]

In patients with schizophrenia, a variation in a single position in the DNA sequence marks too many synapses for removal and that pruning goes out of control. The result is an abnormal loss of gray matter.

The genes involved coat the neurons with “eat-me signals,” said study co-author Beth Stevens, a neuroscientist at Children’s Hospital and Broad. “They are tagging too many synapses. And they’re gobbled up.

The Institute’s founding director, Eric Lander, believes the research represents an astonishing breakthrough. “It’s taking what has been a black box…and letting us peek inside for the first time. And that is amazingly consequential,” he said.

The timeline for this discovery has been relatively fast. In July 2014, Broad researchers published the results of the largest genomic study on the disorder and found more than 100 genetic locations linked to schizophrenia. Based on that research, Harvard and Broad geneticist Steven McCarroll analyzed data from about 29,000 schizophrenia cases, 36,000 controls and 700 post mortem brains. The information was drawn from dozens of studies performed in 22 countries, all of which contribute to the worldwide database called the Psychiatric Genomics Consortium.

[Influential government-appointed panel recommends depression screening for everyone]

One area in particular, when graphed, showed the strongest association. It was dubbed the “Manhattan plot” for its resemblance to New York City’s towering buildings. The highest peak was on chromosome 6, where McCarroll’s team discovered the gene variant. C4 was “a dark corner of the human genome,” he said, an area difficult to decipher because of its “astonishing level” of diversity.

C4 and numerous other genes reside in a region of chromosome 6 involved in the immune system, which clears out pathogens and similar cellular debris from the brain. The study’s researchers found that one of C4’s variants, C4A, was most associated with a risk for schizophrenia.

More than 25 million people around the globe are affected by schizophrenia, according to the World Health Organization, including 2 million to 3 million Americans. Highly hereditable, it is one of the most severe mental illnesses, with an annual economic burden in this country of tens of billions of dollars.

“This paper is really exciting,” said Jacqueline Feldman, associate medical director of the National Alliance on Mental Illness. “We as scientists and physicians have to temper our enthusiasm because we’ve gone down this path before. But this is profoundly interesting.”

There have been hundreds of theories about schizophrenia over the years, but one of the enduring mysteries has been how three prominent findings related to each other: the apparent involvement of immune molecules, the disorder’s typical onset in late adolescence and early adulthood, and the thinning of gray matter seen in autopsies of patients.

[A low-tech way to help treat young schizophrenic patients]

“The thing about this result,” said McCarroll, the lead author, ” it makes a lot of other things understandable. To have a result to connect to these observations and to have a molecule and strong level of genetic evidence from tens of thousands of research participants, I think that combination sets [this study] apart.”

The authors stressed that their findings, which combine basic science with large-scale analysis of genetic studies, depended on an unusual level of cooperation among experts in genetics, molecular biology, developmental neurobiology and immunology.

“This could not have been done five years ago,” said Hyman. “This required the ability to reference a very large dataset . …When I was [NIMH] director, people really resisted collaborating. They were still in the Pharaoh era. They wanted to be buried with their data.”

The study offers a new approach to schizophrenia research, which has been largely stagnant for decades.  Most psychiatric drugs seek to interrupt psychotic thinking, but experts agree that psychosis is just a single symptom — and a late-occurring one at that. One of the chief difficulties for psychiatric researchers, setting them apart from most other medical investigators, is that they can’t cut schizophrenia out of the brain and look at it under a microscope. Nor are there any good animal models.

All that now has changed, according to Stevens. “We now have a strong molecular handle, a pathway and a gene, to develop better models,” he said.

Which isn’t to say a cure is right around the corner.

“This is the first exciting  clue, maybe even the most important we’ll ever have, but it will be decades” before a true cure is found,” Hyman said. “Hope is a wonderful thing. False promise is not.”

Insight Pharma Report

Three neurodegenerative disorders that are heavily focused on in this report include: Alzheimer’s Disease/Mild Cognitive Impairment, Parkinson’s Disease, and Amyotrophic Lateral Sclerosis. Part II of the report will include all three of these disorders, highlighting specifics including background, history, and development of the disease. Deeper into the chapters, the report will unfold biomarkers under investigation, genetic targets, and an analysis of multiple studies investigating these elements.

Experts interviewed in these chapters include:

  • Dr. Jens Wendland, Head of Neuroscience Genetics, Precision Medicine, Clinical Research, Pfizer Worldwide R&D
  • Dr. Howard J. Federoff, Executive Vice President for Health Sciences, Georgetown University
  • Dr. Andrew West, Associate Professor of Neurology and Neurobiology and Co-Director, Center for Neurodegeneration and Experimental Therapeutics
  • Dr. Merit Ester Cudkowicz, Chief of Neurology at Massachusetts General Hospital

Part III of the report makes a shift from neurobiomarkers to neurodiagnostics. This section highlights several diagnostics in play and in the making from a number of companies, identifying company strategies, research underway, hypotheses, and institution goals. Elite researchers and companies highlighted in this part include:

  • Dr. Xuemei Huang, Professor and Vice Chair, Department of Neurology; Professor of Neurosurgery, Radiology,  Pharmacology, and Kinesiology Director; Hershey Brain Analysis Research Laboratory for Neurodegenerative Disorders, Penn State University-Milton, S. Hershey Medical Center Department of Neurology
  • Dr. Andreas Jeromin, CSO and President of Atlantic Biomarkers
  • Julien Bradley, Senior Director, Sales & Marketing, Quanterix
  • Dr. Scott Marshall, Head of Bioanalytics, and Dr. Jared Kohler, Head of Biomarker Statistics, BioStat Solutions, Inc.

Further analysis appears in Part IV. This section includes a survey exclusively conducted for this report. With over 30 figures and graphics and an in depth analysis, this part features insight into targets under investigation, challenges, advantages, and desired features of future diagnostic applications. Furthermore, the survey covers more than just the featured neurodegenerative disorders in this report, expanding to Multiple Sclerosis and Huntington’s Disease.

Finally, Insight Pharma Reports concludes this report with clinical trial and pipeline data featuring targets and products from over 300 companies working in Alzheimer’s Disease, Parkinson’s Disease and Amyotrophic Lateral Sclerosis.

Epigenome Tapped to Understand Rise of Subtype of Brain Medulloblastoma

http://www.genengnews.com/gen-news-highlights/epigenome-tapped-to-understand-rise-of-subtype-of-brain-medulloblastoma/81252294/

Scientists have identified the cells that likely give rise to the brain tumor subtype Group 4 medulloblastoma. [V. Yakobchuk/ Fotolia]

http://www.genengnews.com/Media/images/GENHighlight/thumb_Jan_28_2016_Fotolia_6761569_ColorfulBrain_4412824411.jpg

An international team of scientists say they have identified the cells that likely give rise to the brain tumor subtype Group 4 medulloblastoma. The believe their study (“Active medulloblastoma enhancers reveal subgroup-specific cellular origins”), published in Nature, removes a barrier to developing more effective targeted therapies against the brain tumor’s most common subtype.

Medulloblastoma occurs in infants, children, and adults, but it is the most common malignant pediatric brain tumor. The disease includes four biologically and clinically distinct subtypes, of which Group 4 is the most common. In children, about half of medulloblastoma patients are of the Group 4 subtype. Efforts to improve patient outcomes, particularly for those with high-risk Group 4 medulloblastoma, have been hampered by the lack of accurate animal models.

Evidence from this study suggests Group 4 tumors begin in neural stem cells that are born in a region of the developing cerebellum called the upper rhomic lip (uRL), according to the researchers.

“Pinpointing the cell(s) of origin for Group 4 medulloblastoma will help us to better understand normal cerebellar development and dramatically improve our chances of developing genetically faithful preclinical mouse models. These models are desperately needed for learning more about Group 4 medulloblastoma biology and evaluating rational, molecularly targeted therapies to improve patient outcomes,” said Paul Northcott, Ph.D., an assistant member of the St. Jude department of developmental neurobiology. Dr. Northcott, Stefan Pfister, M.D., of the German Cancer Research Center (DKFZ), and James Bradner, M.D., of Dana-Farber Cancer Institute, are the corresponding authors.

The discovery and other findings about the missteps fueling tumor growth came from studying the epigenome. Researchers used the analytic tool ChiP-seq to identify and track medulloblastoma subtype differences based on the activity of epigenetic regulators, which included proteins known as master regulator transcription factors. They bind to DNA enhancers and super-enhancers. The master regulator transcription factors and super-enhancers work together to regulate the expression of critical genes, such as those responsible for cell identity.

Those and other tools helped investigators identify more than 3,000 super-enhancers in 28 medulloblastoma tumors as well as evidence that the activity of super-enhancers varied by subtype. The super-enhancers switched on known cancer genes, including genes like ALK, MYC, SMO, and OTX2 that are associated with medulloblastoma, the researchers reported.

Knowledge of the subtype super-enhancers led to identification of the transcription factors that regulate their activity. Using computational methods, researchers applied that information to reconstruct the transcription factor networks responsible for medulloblastoma subtype diversity and identity, providing previously unknown insights into the regulatory landscape and transcriptional output of the different medulloblastoma subtypes.

The approach helped to discover and nominate Lmx1A as a master regulator transcription factor of Group 4 tumors, which led to the identification of the likely Group 4 tumor cells of origin. Lmx1A was known to play an important role in normal development of cells in the uRL and cerebellum. Additional studies performed in mice with and without Lmx1A in this study supported uRL cells as the likely source of Group 4 tumors.

“By studying the epigenome, we also identified new pathways and molecular dependencies not apparent in previous gene expression and mutational studies,” explained Dr. Northcott. “The findings open new therapeutic avenues, particularly for the Group 3 and 4 subtypes where patient outcomes are inferior for the majority of affected children.”

For example, researchers identified increased enhancer activity targeting the TGFbeta pathway. The finding adds to evidence that the pathway may drive Group 3 medulloblastoma, currently the subtype with the worst prognosis. The pathway regulates cell growth, cell death, and other functions that are often disrupted in cancer, but it’s role in medulloblastoma is poorly understood.

The analysis included samples from 28 medulloblastoma tumors representing the four subtypes. Researchers believe it is the largest epigenetic study yet for any single cancer type and, importantly, the first to use a large cohort of primary patient tumor tissues instead of cell lines grown in the laboratory. Previous studies have suggested that cell lines may be of limited use for studying the tumor epigenome. The three Group 3 medulloblastoma cell lines used in this study reinforced the observation, highlighting significant differences in epigenetic regulators at work in medulloblastoma cell lines versus tumor samples.

Read Full Post »

Adipocyte Differentiation: The Effects of Hormones and Differentiation Factors

Reporters: Irina Robu, PhD and Aviva Lev-Ari, PhD, RN


Hormones and Differentiation Factors influencing Adipocyte Differentiation


Agent

Effect

Comment

References

Insulin

+

Accelerates lipid accumulation 43, 57, 106, 154, 160
IGF-1

+

Stimulates adipocyte differentiation 132, 154, 170
Glucocorticoids

+

Stimulates adipocyte differentiation 49, 57, 106, 160, 179
Growth hormone

+/-

Induces adipogenesis in preadipose cell lines 46, 60, 170, 171
Inhibits adipogenesis in primary cultures
Retinoic acid

+/-

Concentration dependent 143, 144
Thyroid hormone

+/no effect

Inducing effect on adipogenesis restricted to a

Preadipose cell line

57, 146, 148, 160

175

Prostaglandins

+/-

Varied effects depending on model system 103, 110, 136, 167
EGF, TGF-alpha

–

Inhibit adipocyte differentiation 58, 98, 146, 167
TGF-beta

–

Potent inhibitor of adipogenesis 127, 149, 155, 167
aFGF, bFGF

+/-

Conflicting results 58, 79, 146, 148, 167
IL-1, interferon-gamma, TNF-alpha

–

Inhibit adipocyte differentiation 50, 119, 126
PDGF

+/-

Conflicting results 58, 61, 146
cAMP

+

Induces adipocyte diffferentiation 137, 175, 180
Vatimin D

+/-

Conflicting results 10, 80, 88, 169
Oestrogen, progesterone

+/no effect

56, 139

Abbreviations: IGF-1, insulin-like growth factor 1; EGF, epidermal growth factor; TGF, transforming growth factor; FGF, fibroblast growth factor; IL-1, interleukin-1; TNF-α, tumor necrosis factor-α; PDGF, platelet- derived growth factor; cAMP, cyclic adenosine monophosphate.

TABLE SOURCE

Table 1. on Page 9 in Adipose Tissue and Adipocyte Differentiation: Molecular and Cellular Aspects and Tissue Engineering Applications

  1. Niemelä*, S. Miettinen, J.R. Sarkanen and N. Ashammakhi

http://www.oulu.fi/spareparts/ebook_topics_in_t_e_vol4/abstracts/niemela.pdf

Topics in Tissue Engineering, Vol. 4. Eds. N Ashammakhi, R Reis, & F Chiellini © 2008.

Niemelä et al. Adipose tissue factor 1- and sterol regulatory element-binding protein-responsive gene. J Biol Chem

1997; 272: 7298-7305.


Wosnitza et al. (2007) have shown that both preadipocytes and endothelial cells share a common progenitor cell type demonstrating endothelial and adipogenic maturation potential. Furthermore their result reveals that even some mature cells of mesenchymal origin have a remarkable potency to perform transdifferentiation between endothelium and adipose tissue.177 Boquest et al. (2006), have, however, shown that despite limited upregulation of endothelium related marker surface proteins CD31 and CD144 expression after endothelial differentiation stimulation, adipose tissue derived stem cells have a limited commitment to the endothelial lineage in vitro.14

Conclusions

Resent advances in bioengineering and cell biology of fat tissue have led to innovative and new therapeutic potentials for regenerative medicine. Autologous human adipose tissue- derived stem cells could have clinical applicability for cell-based therapies and tissue engineering purposes. Promising results suggest that adipose tissue will be a useful tool in biotechnology.


REFERENCES

  1. Adams M, Montague CT, Prins JB, Holder JC, Smith SA, Sanders L, Digby JE, Sewter CP, Lazar MA, Chatterjee VK & O’Rahilly S. Activators of peroxisome proliferator- activated receptor gamma have depot-specific effects on human preadipocyte differentiation. J Clin Invest 1997; 100: 3149-3153.
  2. Antras J, Hilliou F, Redziniak G & Pairault J. Decreased biosynthesis of actin and cellular fibronectin during adipose conversion of 3T3-F442A cells. Reorganization of the cytoarchitecture and extracellular matrix fibronectin. Biol Cell 1989; 66: 247-254.
  3. Anwar A, McTernan PG, Anderson LA, Askaa J, Moody CG, Barnett AH, Eggo MC & Kumar S. Site-specific regulation of oestrogen receptor-alpha and –beta by oestradiol in human adipose tissue. Diabetes Obes Metab 2001; 3: 338-349.
  4. Aratani Y & Kitagawa Y. Enhanced synthesis and secretion of type IV collagen and entactin during adipose conversion of 3T3-L1 cells and production of unorthodox laminin complex. J Biol Chem 1988; 263: 16163-16169.
  5. Ashammakhi N, Ndreu A, Piras A, Nikkola L, Sindelar T, Ylikauppila H, Harlin A, Chiellini E, Hasirci V & Redl H. Biodegradable nanomats produced by electrospinning: expanding multifunctionality and potential for tissue engineering. J Nanosci Nanotechnol. 2006; 6(9-10):2693-711.
  6. Ashammakhi N, Ndreu A, Yang Y, Ylikauppila H, Nikkola L & Hasirci V. Tissue engineering: a new take-off using nanofiber-based scaffolds. J Craniofac Surg 2007; 18(1):3-17.
  7. Ashjian PH, Elbarbary AS, Edmonds B, DeUgarte D, Zhu M, Zuk PA, Lorenz HP, Benhaim P & Hedrick MH. In vitro differentiation of human processed lipoaspirate cells into early neural progenitors. Plast Reconstr Surg 2003; 111: 1922-31.
  8. Awad HA, Wickham MQ, Leddy HA, Gimble JM & Guilak F. Chondrogenic differentiation of adipose-derived adult stem cells in agarose, alginate, and gelatin scaffolds. Biomaterials. 2004; 25(16):3211-22.
  9. Bartness TJ & Bamshad M. Innervation of mammalian white adipose tissue: implications for the regulation of total body fat. Am J Physiol 1998; 275(5 Pt 2): R1399-411.
  10. Bellows CG, Wang YH, Heersche JN & Aubin JE. 1,25-dihydroxyvitamin D3 stimulates adipocyte differentiation in cultures of fetal rat calvaria cells: comparison with the effects of dexamethasone. Endocrinology 1994; 134: 2221-2229.
  11. Bernlohr DA, Angus CW, Lane MD, Bolanowski MA & Kelly TJ Jr. Expression of specific mRNAs during adipose differentiation: identification of an mRNA encoding a homologue of myelin P2 protein. Proc Natl Acad Sci U S A 1984; 81(17): 5468-72.
  12. Bianco P, Riminucci M, Kuznetsov S & Robey PG. Multipotential cells in the bone marrow stroma: regulation in the context of organ physiology. Crit Rev Eukaryot Gene Expr 1999; 9(2): 159-73.
  13. Bjorge T, Tretli S & Engeland A. Relation of height and body mass index to renal cell carcinoma in two million Norwegian men and women. Am J Epidemiol 2004; 160(12): 1168-76.
  14. Boquest AC, Noer A, Sørensen AL, Vekterud K & Collas P. CpG methylation profiles of endothelial cell-specific gene promoter regions in adipose tissue stem cells suggest limited differentiation potential toward the endothelial cell lineage. Stem Cells. 2007; 25(4):852-61. Epub 2006 Dec 14.
  15. Butterwith SC. Molecular events in adipocyte development. Pharmacol Ther 1994; 61(3): 399-411.
  1. Cao Z, Umek RM & McKnight SL. Regulated expression of three C/EBP isoforms during adipose conversion of 3T3-L1 cells. Genes Dev 1991; 5(9): 1538-52.
  2. Charriere G, Cousin B, Arnaud E, Andre M, Bacou F, Penicaud L & Casteilla L. Preadipocyte conversion to macrophage. Evidence of plasticity. J Biol Chem 2003; 278(11): 9850-5.
  3. Cho SW, Kim SS, Rhie JW, Cho HM, Choi CY & Kim BS. Engineering of volume- stable adipose tissues. Biomaterials. 2005; 26(17):3577-85.
  4. Cho SW, Kim I, Kim SH, Rhie JW, Choi CY & Kim BS. Enhancement of adipose tissue formation by implantation of adipogenic-differentiated preadipocytes. Biochem Biophys Res Commun. 2006; 345(2):588-94.
  5. Choi YS, Park SN & Suh H. Adipose tissue engineering using mesenchymal stem cells attached to injectable PLGA spheres. Biomaterials. 2005; 26(29):5855-63.
  6. Clavijo-Alvarez JA, Rubin JP, Bennett J, Nguyen VT, Dudas J, Underwood C & Marra KG. A novel perfluoroelastomer seeded with adipose-derived stem cells for soft-tissue repair. Plast Reconstr Surg. 2006; 118(5):1132-42.
  7. Coe NR & Bernlohr DA. Physiological properties and functions of intracellular fatty acid-binding proteins. Biochim Biophys Acta 1998; 1391(3): 287-306.
  8. Cooper SC & Roncari DA. 17-beta-estradiol increases mitogenic activity of medium from cultured preadipocytes of massively obese persons. J Clin Invest 1989; 83(6): 1925-9.
  9. Cousin B, Andre M, Arnaud E, Penicaud L & Casteilla L. Reconstitution of lethally irradiated mice by cells isolated from adipose tissue. Biochem Biophys Res Commun 2003; 301(4): 1016-22.
  10. Crandall DL, Hausman GJ & Kral JG. A review of the microcirculation of adipose tissue: anatomic, metabolic, and angiogenic perspectives. Microcirculation 1997; 4(2): 211-32.
  11. Dani C, Doglio A, Amri EZ, Bardon S, Fort P, Bertrand B, Grimaldi P & Ailhaud G. Cloning and regulation of a mRNA specifically expressed in the preadipose state. J Biol Chem 1989; 264(17): 10119-25.
  12. Deslex S, Negrel R, Vannier C, Etienne J & Ailhaud G. Differentiation of human adipocyte precursors in a chemically defined serum-free medium. Int J Obes 1987; 11(1): 19-27.
  13. Deslypere J P, Verdonck L & Vermeulen A. Fat tissue: a steroid reservoir and site of steroid metabolism. J Clin Endocrinol Metab 1985; 61(3): 564-70.
  14. DeUgarte DA, Morizono K, Elbarbary A, Alfonso Z, Zuk PA Zhu M, Dragoo JL, Ashjian P, Thomas B, Benhaim P, Chen I, Fraser J & Hedrick MH. Comparison of multi-lineage cells from human adipose tissue and bone marrow. Cells Tissues Organs 2003;174(3):101-9.
  15. Dolderer JH, Abberton KM, Thompson EW, Slavin JL, Stevens GW, Penington AJ & Morrison WA. Spontaneous large volume adipose tissue generation from a vascularized pedicled fat flap inside a chamber space. Tissue Eng. 2007; 13(4):673-81.
  16. Engeland A, Tretli S & Bjorge T. Height, body mass index, and ovarian cancer: a follow-up of 1.1 million Norwegian women. J Natl Cancer Inst 2003; 95(16): 1244-8.
  17. Entenmann G & Hauner H. Relationship between replication and differentiation in cultured human adipocyte precursor cells. Am J Physiol 1996; 270(4 Pt 1): C1011-6.
  18. Erickson GR, Gimble JM, Franklin DM, Rice HE, Awad H & Guilak F. Chondrogenic potential of adipose tissue-derived stromal cells in vitro and in vivo. Biochem Biophys Res Commun 2002; 290: 763-769.
  19. Ericsson J, Jackson SM, Kim JB, Spiegelman BM & Edwards PA. Identification of glycerol-3-phosphate acyl-transferase as an adipocyte determination and differentiation
  1. Fajas L. Adipogenesis: a cross-talk between cell proliferation and cell differentiation. 
Ann Med 2003; 35(2): 79-85.
  2. Fajas L, Fruchart JC & Auwerx J. Transcriptional control of adipogenesis. Curr Opin 
Cell Biol 1998; 10(2): 165-173.
  3. Fischbach C, Seufert J, Staiger H, Hacker M, Neubauer M, Göpferich A & Blunk T. 
Three-dimensional in vitro model of adipogenesis: comparison of culture conditions. 1: 
Tissue Eng. 2004; 10(1-2):215-29.
  4. Fischbach C, Spruss T, Weiser B, Neubauer M, Becker C, Hacker M, Göpferich A & 
Blunk T. Generation of mature fat pads in vitro and in vivo utilizing 3-D long-term 
culture of 3T3-L1 preadipocytes. Exp Cell Res. 2004; 300(1):54-64
  5. Flier JS. Clinical review 94: What’s in a name? In search of leptin’s physiologic role. J 
Clin Endocrinol Metab 1998; 83(5): 1407-13.
  6. Fliers E, Kreier F, Voshol PJ, Havekes LM, Sauerwein HP, Kalsbeek A, Buijs RM & 
Romijn JA. White adipose tissue: getting nervous. J Neuroendocrinol 2003; 15(11): 
1005-10.
  7. Flynn L, Semple JL & Woodhouse KA. Decellularized placental matrices for adipose 
tissue engineering. J Biomed Mater Res A. 2006; 79(2):359-69.
  8. Fukai F, Iso T, Sekiguchi K, Miyatake N, Tsugita A & Katayama T. An amino-terminal 
fibronectin fragment stimulates the differentiation of ST-13 preadipocytes. 
Biochemistry 1993; 32(22): 5746-51.
  9. Girard J, Perdereau D, Foufelle F, Prip-Buus C & Ferre P. Regulation of lipogenic 
enzyme gene expression by nutrients and hormones. Faseb J 1994; 8(1): 36-42.
  10. Goldberg IJ. Lipoprotein lipase and lipolysis: central roles in lipoprotein metabolism 
and atherogenesis. J Lipid Res 1996; 37(4): 693-707.
  11. Green H & Meuth M. An established pre-adipose cell line and its differentiation in 
culture. Cell 1974; 3(2): 127-33.
  12. Green H, Morikawa M & Nixon T. A dual effector theory of growth-hormone action. 
Differentiation 1985; 29: 195-198.
  13. Gregoire FM. Adipocyte differentiation: from fibroblast to endocrine cell. Exp Biol 
Med 2001; 226: 997-1002.
  14. Gregoire F, Todoroff G, Hauser N & Remacle C. The stroma-vascular fraction of rat 
inguinal and epididymal adipose tissue and the adipoconversion of fat cell precursors in 
primary culture. Biol Cell 1990; 69(3): 215-22.
  15. Gregoire F, Genart C, Hauser N & Remacle C. Glucocorticoids induce a drastic 
inhibition of proliferation and stimulate differentiation of adult rat fat cell precursors. 
Exp Cell Res 1991; 196: 270-278.
  16. Gregoire F, De Broux N, Hauser N, Heremans H, Van Damme J & Remacle C. 
Interferon-gamma and interleukin-1 beta inhibit adipoconversion in cultured rodent 
preadipocytes. J Cell Physiol 1992; 151: 300-309.
  17. Gregoire FM, Smas CM & Sul HS. Understanding adipocyte differentiation. Physiol 
Rev 1998; 78(3): 783-809.
  18. Halberstadt C, Austin C, Rowley J, Culberson C, Loebsack A, Wyatt S, Coleman S, 
Blacksten L, Burg K, Mooney D & Holder W. A hydrogel material for plastic and reconstructive applications injected into the subcutaneous space of a sheep. Tissue Eng. 2002; 8(2):309-19.
  19. Halbleib M, Skurk T, de Luca C, von Heimburg D & Hauner H. Tissue engineering of white adipose tissue using hyaluronic acid-based scaffolds. I: in vitro differentiation of human adipocyte precursor cells on scaffolds. Biomaterials. 2003; 24(18):3125-32.
  1. Halvorsen YD, Franklin D, Bond AL, Hitt DC, Auchter C, Boskey AL, Paschalis EP, W. Wilkison WO & Gimble JM. Extracellular matrix mineralization and osteoblast gene expression by human adipose tissue-derived stromal cells. Tissue Eng 2001; 7(6): 729-41.
  2. Hansen HO, Andreasen PH, Mandrup S, Kristiansen K & Knudsen J. Induction of acyl- CoA-binding protein and its mRNA in 3T3-L1 cells by insulin during preadipocyte-to- adipocyte differentiation. Biochem J 1991; 277 ( Pt 2): 341-4.
  3. Hauner H & Loffler G. Adipose tissue development: the role of precursor cells and adipogenic factors. Part I: Adipose tissue development and the role of precursor cells. Klin Wochenschr 1987; 65(17): 803-11.
  4. Hauner H, Entenmann G, Wabitsch M, Gaillard D, Ailhaud G, Negrel R & Pfeiffer EF. Promoting effect of glucocorticoids on the differentiation of human adipocyte precursor cells cultured in a chemically defined medium. J Clin Invest 1989; 84(5): 1663-70.
  5. Hauner H, Rohrig K & Petruschke T. Effects of epidermal growth factor (EGF), platelet-derived growth factor (PDGF) and fibroblast growth factor (FGF) on human adipocyte development and function. Eur J Clin Invest 1995; 25: 90-96.
  6. Hausman GJ. Responsiveness to adipogenic agents in stromal-vascular cultures derived from lean and preobese pig fetuses: an ontogeny study. J Anim Sci 1992; 70(1): 106-14.
  7. Hausman GJ & Martin RJ. The influence of human growth hormone on preadipocyte 
development in serum-supplemented and serum-free cultures of stromal-vascular cells 
from pig adipose tissue. Domest Anim Endocrinol 1989; 6: 331-337.
  8. Hayashi I, Nixon T, Morikawa M & Green H. Adipogenic and anti-adipogenic factors 
in the pituitary and other organs. Proc Natl Acad Sci USA 1981; 78: 3969-3972.
  9. von Heimburg D, G. Serov, T. Oepen and N. Pallua. Chapter 8: Fat Tissue Engineering. In: Topics in Tissue Engineering, vol. 2. Eds. N Ashammakhi and R Reis. 
http://www.oulu.fi/spareparts/ebook_topics_in_t_e/abstracts/heimburg_01.pdf 
Accessed on 25 June 2007.
  10. Hemmrich K, von Heimburg D, Rendchen R, Di Bartolo C, Milella E & Pallua N. 
Implantation of preadipocyte-loaded hyaluronic acid-based scaffolds into nude mice to evaluate potential for soft tissue engineering. Biomaterials 2005; 26(34):7025- 37.
  11. Hemmrich K, Meersch M, Wiesemann U, Salber J, Klee D, Gries T & Pallua N. Polyesteramide-derived nonwovens as innovative degradable matrices support preadipocyte adhesion, proliferation, and differentiation. Tissue Eng. 2006; 12(12):3557-65
  12. Hemmrich K, Van de Sijpe K, Rhodes NP, Hunt JA, Di Bartolo C, Pallua N, Blondeel P & von Heimburg D. Autologous In Vivo Adipose Tissue Engineering in Hyaluronan- Based Gels-a Pilot Study. J Surg Res. 2007 (In press).
  13. Hiraoka Y, Yamashiro H, Yasuda K, Kimura Y, Inamoto T & Tabata Y. In situ regeneration of adipose tissue in rat fat pad by combining a collagen scaffold with gelatin microspheres containing basic fibroblast growth factor. Tissue Eng. 2006; 12(6):1475-87.
  14. Hollenberg AN, Susulic VS, Madura JP, Zhang B, Moller DE, Tontonoz P, Sarraf P, Spiegelman BM & Lowell BB. Functional antagonism between CCAAT/Enhancer binding protein-alpha and peroxisome proliferator-activated receptor-gamma on the leptin promoter. J Biol Chem 1997; 272(8): 5283-90.
  15. Hong L, Peptan I, Clark P & Mao JJ. Ex vivo adipose tissue engineering by human marrow stromal cell seeded gelatin sponge. Ann Biomed Eng. 2005; 33(4):511-7.
  16. Hong L, Peptan IA, Colpan A & Daw JL. Adipose tissue engineering by human adipose-derived stromal cells. Cells Tissues Organs. 2006; 183(3):133-40.
  1. Huang JI, Zuk PA, Jones NF, Zhu M, Lorenz HP, Hedrick MH & Benhaim P. Chondrogenic potential of multipotential cells from human adipose tissue. Plast Reconstr Surg 2004; 113(2): 585-94.
  2. Ibrahimi A, Bonino F, Bardon S, Ailhaud G & Dani C. Essential role of collagens for terminal differentiation of preadipocytes. Biochem Biophys Res Commun 1992; 187(3): 1314-22.
  3. Iwasaki M, Nakata K, Nakahara H, Nakase T, Kimura T, Kimata K, Caplan AI & Ono K. Transforming growth factor-beta 1 stimulates chondrogenesis and inhibits osteogenesis in high density culture of periosteum-derived cells. Endocrinology 1993; 132(4): 1603-8.
  4. Jones BH, Standridge MK & Moustaid N. Angiotensin II increases lipogenesis in 3T3- L1 and human adipose cells. Endocrinology 1997; 138(4): 1512-9.
  5. Jonsson F, Wolk A, Pedersen NL, Lichtenstein P, Terry P, Ahlbom A & Feychting M. Obesity and hormone-dependent tumors: cohort and co-twin control studies based on the Swedish Twin Registry. Int J Cancer 2003; 106(4): 594-9.
  6. Kang X, Xie Y & Kniss DA. Adipose tissue model using three-dimensional cultivation of preadipocytes seeded onto fibrous polymer scaffolds. Tissue Eng. 2005;11(3-4):458- 68.
  7. Katz AJ. Mesenchymal cell culture: adipose tissue. Atala A & Lanza R, editors. Methods of Tissue Engineering. Academic Press 2002; 277-286.
  8. Katz AJ, Llull R, Hedrick MH & Futrell JW. Emerging approaches to the tissue engineering of fat. Clin Plast Surg 1999; 26(4): 587-603, viii.
  9. Katz AJ, Tholpady A, Tholpady SS, Shang H & Ogle RC. Cell surface and transcriptional characterization of human adipose-derived adherent stromal (hADAS) cells. Stem cells 2005; 23(3): 412-423.
  10. Kawaguchi N, Toriyama K, Nicodemou-Lena E, Inou K, Torii S & Kitagawa Y. De novo adipogenesis in mice at the site of injection of basement membrane and basic fibroblast growth factor. Proc Natl Acad Sci USA 1998; 95(3): 1062-1066.
  11. Kelly KA & Gimble JM. 1,25-Dihydroxy vitamin D3 inhibits adipocyte differentiation and gene expression in murine bone marrow stromal cell clones and primary cultures. Endocrinology 1998; 139: 2622-2628.
  12. Kelly JL, Findlay MW, Knight KR, Penington A, Thompson EW, Messina A & Morrison WA. Contact with existing adipose tissue is inductive for adipogenesis in matrigel. Tissue Eng. 2006; 12(7):2041-7.
  13. Kim JB & Spiegelman BM. ADD1/SREBP1 promotes adipocyte differentiation and gene expression linked to fatty acid metabolism. Genes Dev 1996; 10: 1096-1107.
  14. Kim S & Moustaid-Moussa N. Secretory, endocrine and autocrine/paracrine function of 
the adipocyte. J Nutr 2000; 130(12): 3110S-3115S.
  15. Kimura Y, Ozeki M, Inamoto T & Tabata Y. Time course of de novo adipogenesis in 
matrigel by gelatin microspheres incorporating basic fibroblast growth factor. 
Tissue Eng. 2002; 8(4):603-13.
  16. Kimura Y, Ozeki M, Inamoto T & Tabata Y. Adipose tissue engineering based on 
human preadipocytes combined with gelatin microspheres containing basic fibroblast 
growth factor. Biomaterials. 2003; 24(14):2513-21.
  17. Kirkland JL, Hollenberg CH & Gillon WS. Age, anatomic site, and the replication and 
differentiation of adipocyte precursors. Am J Physiol 1990; 258(2 Pt 1): C206-10.
  18. Kley HK, Deselaers T, Peerenboom H & Kruskemper HL. Enhanced conversion of androstenedione to estrogens in obese males. J Clin Endocrinol Metab 1980; 51(5): 
1128-32.
  1. Kong J & Li YC. Molecular mechanism of 1,25-dihydroxyvitamin D3 inhibition of adipogenesis in 3T3-L1 cells. Am J Physiol Endocrinol Metab 2006; 290: E916-E924.
  2. Konieczny SF & Emerson CP, Jr. 5-Azacytidine induction of stable mesodermal stem cell lineages from 10T1/2 cells: evidence for regulatory genes controlling determination. Cell 1984; 38(3): 791-800.
  3. Kuri-Harcuch W, Arguello C & Marsch-Moreno M. Extracellular matrix production by mouse 3T3-F442A cells during adipose differentiation in culture. Differentiation 1984; 28(2): 173-8.
  4. Lacasa D, Garcia E, Agli B & Giudicelli Y. Control of rat preadipocyte adipose conversion by ovarian status: regional specificity and possible involvement of the mitogen-activated protein kinase-dependent and c-fos signaling pathways. Endocrinology 1997; 138(7): 2729-34.
  5. Laharrague P, Larrouy D, Fontanilles AM, Truel N, Campfield A, Tenenbaum R, Galitzky J, Corberand JX, Penicaud L & Casteilla L. High expression of leptin by human bone marrow adipocytes in primary culture. Faseb J 1998; 12(9): 747-52.
  6. Lee JA, Parrett BM, Conejero JA, Laser J, Chen J, Kogon AJ, Nanda D, Grant RT & Breitbart AS. Biological alchemy: engineering bone and fat from fat-derived stem cells. Ann Plast Surg 2003; 50(6):610-7.
  7. Lefebvre AM, Laville M, Vega N, Riou JP, van Gaal L, Auwerx J & Vidal H. Depot- specific differences in adipose tissue gene expression in lean and obese subjects. Diabetes 1998; 47(1): 98-103.
  8. Levy MM, Joyner CJ, Virdi AS, Reed A, Triffitt JT, Simpson AH, Kenwright J, Stein H & M. Francis J. Osteoprogenitor cells of mature human skeletal muscle tissue: an in vitro study. Bone 2001; 29(4): 317-22.
  9. Lin FT & Lane MD. Antisense CCAAT/enhancer-binding protein RNA suppresses coordinate gene expression and triglyceride accumulation during differentiation of 3T3- L1 preadipocytes. Genes Dev 1992; 6(4): 533-44.
  10. Louet JF, Coste A, Amazit L, Tannour-Louet M, Wu RC, Tsai SY, Tsai MJ, Auwerx J & O’Malley BW. Oncogenic steroid receptor coactivator-3 is a key regulator of the white adipogenic program. Proc Natl Acad Sci U.S.A. 2006; Nov 21;103(47):17868-73. Epub 2006 Nov 10.
  11. Luetteke NC, Lee DC, Palmiter RD, Brinster RL & Sandgren EP. Regulation of fat and muscle development by transforming growth factor alpha in transgenic mice and in cultured cells. Cell Growth Differ 1993; 4: 203-213.
  12. MacDougald OA & Lane MD. Transcriptional regulation of gene expression during adipocyte differentiation. Annu Rev Biochem 1995; 64: 345-73.
  13. Mandrup S & Lane MD. Regulating adipogenesis. J Biol Chem 1997; 272(9): 5367-70.
  14. Mandrup S, Sorensen RV, Helledie T, Nohr J, Baldursson T, Gram C, Knudsen J & Kristiansen K. Inhibition of 3T3-L1 adipocyte differentiation by expression of acyl- 
CoA-binding protein antisense RNA. J Biol Chem 1998; 273(37): 23897-903.
  15. Miller WH Jr., Faust IM & Hirsch J. Demonstration of de novo production of adipocytes in adult rats by biochemical and radioautographic techniques. J Lipid Res 
1984; 25(4): 336-47.
  16. Miller CW, Casimir DA & Ntambi JM. The mechanism of inhibition of 3T3-L1 
preadipocyte differentiation by prostaglandin F2alpha. Endocrinology 1996; 137: 5641- 
5650.
  17. Mizuno H, Zuk PA, Zhu M, Lorenz HP, Benhaim P & Hedrick MH. Myogenic 
differentiation by human processed lipoaspirate cells. Plast Reconstr Surg 2002; 109(1): 199-209; discussion 210-1.
  1. Moller DE & Flier JS. Insulin resistance–mechanisms, syndromes, and implications. N Engl J Med 1991; 325(13): 938-48.
  2. Moustaid N, Lasnier F, Hainque B, Quignard-Boulange A & Pairault J. Analysis of gene expression during adipogenesis in 3T3-F442A preadipocytes: insulin and dexamethasone control. J Cell Biochem 1990; 42: 243-254.
  3. Nakajima I, Muroya S, Tanabe R & Chikuni K. Extracellular matrix development during differentiation into adipocytes with a unique increase in type V and VI collagen. Biol Cell 2002; 94(3): 197-203.
  4. Nakase T, Nakahara H, Iwasaki M, Kimura T, Kimata K, Watanabe K, Caplan AI & Ono K. Clonal analysis for developmental potential of chick periosteum-derived cells: agar gel culture system. Biochem Biophys Res Commun 1993; 195(3): 1422-8.
  5. Napolitano LM. Observations on the fine structure of adipose cells. Ann N Y Acad Sci 1965; 131(1): 34-42.
  6. Negrel R, Gaillard D & Ailhaud G. Prostacyclin as a potent effector of adipose-cell differentiation. Biochem J 1989; 257: 399-405.
  7. Nguyen A, Pasyk KA, Bouvier TN, Hassett CA & Argenta LC. Comparative study of survival of autologous adipose tissue taken and transplanted by different techniques. Plast Reconstr Surg 1990; 85(3): 378-86; discussion 387-9.
  8. Niehof M, Manns MP & Trautwein C. CREB controls LAP/C/EBP beta transcription. Mol Cell Biol 1997; 17(7):3600-13.
  9. Niemelä S, Miettinen S, Konttinen Y, Waris T, Kellomäki M, Ashammakhi N & Ylikomi T. Fat Tissue: Views on reconstruction and exploitation. J Craniofac Surg 2007; 18(2): 325.335.
  10. Nimrod A & Ryan KJ. Aromatization of androgens by human abdominal and breast fat tissue. J Clin Endocrinol Metab 1975; 40(3): 367-72.
  11. Nishimura K, Solchaga LA, Caplan AI, Yoo JU, Goldberg VM & Johnstone B. Chondroprogenitor cells of synovial tissue. Arthritis Rheum 1999; 42(12): 2631-7.
  12. Nougues J, Reyne Y & Dulor JP. Differentiation of rabbit adipocyte precursors in 
primary culture. Int J Obes 1988; 12(4): 321-33.
  13. Ntambi JM & Young-Cheul K. Adipocyte differentiation and gene expression. J Nutr 
2000; 130(12): 3122S-3126S.
  14. Ogawa R, Mizuno H, Watanabe A, Migita M, Shimada T & Hyakusoku H. Osteogenic 
and chondrogenic differentiation by adipose-derived stem cells harvested from GFP 
transgenic mice. Biochem Biophys Res Commun. 2004; 313(4):871-7.
  15. Ohsumi J, Miyadai K, Kawashima I, Ishikawa-Ohsumi H, Sakakibara S, Mita-Honjo K & Takiguchi Y. Adipogenesis inhibitory factor. A novel inhibitory regulator of adipose 
conversion in bone marrow. Proc Natl Acad Sci USA 1991; 88: 3912-3916.
  16. Ono M, Aratani Y, Kitagawa I & Kitagawa Y. Ascorbic acid phosphate stimulates type IV collagen synthesis and accelerates adipose conversion of 3T3-L1 cells. Exp Cell Res 
1990; 187(2): 309-14.
  17. Patrick CW Jr. Tissue engineering strategies for adipose tissue repair. Anat Rec 2001; 
263(4): 361-6.
  18. Patrick CW Jr., Chauvin PB, Hobley J & Reece GP. Preadipocyte seeded PLGA 
scaffolds for adipose tissue engineering. Tissue Eng 1999; 5(2): 139-51.
  19. Patrick CW, Zheng B, Johnston C & Reece GP. Long-term implantation of 
preadipocyte-seeded PLGA scaffolds. Tissue Eng. 2002; 8(2):283-93.
  20. Paulauskis JD & Sul HS. Cloning and expression of mouse fatty acid synthase and other specific mRNAs. Developmental and hormonal regulation in 3T3-L1 cells. J Biol Chem 
1988; 263(15): 7049-54.
  1. Pedersen SB, Bruun JM, Hube F, Kristensen K, Hauner H & Richelsen B. Demonstration of estrogen receptor subtypes alpha and beta in human adipose tissue: influences of adipose cell differentiation and fat depot localization. Mol Cell Endocrinol 2001; 182(1): 27-37.
  2. Petruschke T & Hauner H. Tumor necrosis factor-alpha prevents the differentiation of human adipocyte precursor cells and causes delipidation of newly developed fat cells. J Clin Endocrinol Metab 1993; 76: 742-747.
  3. Petruschke T, Rohrig K & Hauner H. Transforming growth factor beta (TGF-beta) inhibits the differentiation of human adipocyte precursor cells in primary culture. Int J Obesity Related Metab Disorders 1994; 18: 532-536.
  4. Planat-Benard V, Silvestre JS, Cousin B, Andre M, Nibbelink M, Tamarat R, Clergue M, Manneville C, Saillan-Barreau C, Duriez M, Tedgui A, Levy B, Penicaud L & Casteilla L. Plasticity of human adipose lineage cells toward endothelial cells: physiological and therapeutic perspectives. Circulation 2004; 109(5): 656-63.
  5. Poznanski WJ, Waheed I & Van R. Human fat cell precursors. Morphologic and metabolic differentiation in culture. Lab Invest 1973; 29(5): 570-6.
  6. Prins JB, Niesler CU, Winterford CM, Bright NA, Siddle K, O’Rahilly S, Walker NI & Cameron DP. Tumor necrosis factor-alpha induces apoptosis of human adipose cells. Diabetes 1997; 46(12): 1939-44.
  7. Prins JB & O’Rahilly S. Regulation of adipose cell number in man. Clin Sci (Lond) 1997; 92(1): 3-11.
  8. Ramsay TG, White ME & Wolverton CK. Insulin-like growth factor 1 induction of differentiation of porcine preadipocytes. J Anim Sci 1989; 67: 2452-2459.
  9. Rangappa S, Fen C, Lee EH, Bongso A & Sim EK. Transformation of adult mesenchymal stem cells isolated from the fatty tissue into cardiomyocytes. Ann Thorac Surg 2003; 75(3): 775-9.
  10. Rayner DV. The sympathetic nervous system in white adipose tissue regulation. Proc Nutr Soc 2001; 60(3): 357-64.
  11. Reese-Wagoner A, Thompson J & Banaszak L. Structural properties of the adipocyte lipid binding protein. Biochim Biophys Acta 1999; 1441(2-3): 106-16.
  12. Reginato MJ, Krakow SL, Bailey ST & Lazar MA. Prostaglandins promote and block adipogenesis through opposing effects on peroxisome proliferator-activated receptor γ. J Biol Chem 1998; 273: 1855-1858.
  13. Reusch JE, Colton LA & Klemm DJ. CREB activation induces adipogenesis in 3T3-L1 cells. Mol Cell Biol 2000; 20(3): 1008-20.
  14. Romijn JA & Fliers E. Sympathetic and parasympathetic innervation of adipose tissue: metabolic implications. Curr Opin Clin Nutr Metab Care 2005; 8(4): 440-4.
  15. Rondinone CM, Baker ME & Rodbard D. Progestins stimulate the differentiation of 3T3-L1 preadipocytes. J Steroid Biochem Mol Biol 1992; 42(8): 795-802.
  16. Rosen ED & Spiegelman BM. Molecular regulation of adipogenesis. Annu Rev Cell Dev Biol 2000; 16: 145-71.
  17. Ross M, Kaye G & Pawlina W. Histology, a text and atlas, Lippincott Williams & Wilkins, 2003.
  18. Safford KM, Hicok KC, Safford SD, Halvorsen YD, Wilkison WO, Gimble JM & Rice HE. Neurogenic differentiation of murine and human adipose-derived stromal cells. Biochem Biophys Res Commun 2002; 294(2): 371-9.
  19. Safonova I, Darimont C, Amri EZ, Grimaldi P, Ailhaud G, Reichert U & Shroot B. Retinoids are positive effectors of adipose cell differentiation. Mol Cell Endocrinol 1994; 104: 201-211.
  1. Safonova I, Reichert U, Shroot B, Ailhaud G & Grimaldi P. Fatty acids and retinoids act synergistically on adipose cell differentiation. Biochem Biophys Res Commun 1994; 204: 498-504.
  2. Saladin R, Fajas L, Dana S, Halvorsen YD, Auwerx J & Briggs M. Differential regulation of peroxisome proliferator activated receptor g1 (PPARg1) and PPARg2 mRNA expression in early stages of adipogenesis. Cell Growth Differ 1999; 10: 43-48.
  3. Schmidt W, Poll-Jordan G & Loffler G. Adipose conversion of 3T3-L1 cells in a serum-free culture systme depends on epidermal growth factor, insulin-like growth factor 1, corticosterone, and cyclic AMP. J Biol Chem 1990; 265: 15489-15495.
  4. Sen A, Lea-Currie YR, Sujkowska D, Franklin DM, Wilkison WO, Halvorsen YD & Gimble JM. Adipogenic potential of human adipose derived stromal cells from multiple donors is heterogenous. J Cell Biochem 2001; 81(2): 312-319.
  5. Serrero G & Mills D. Differentiation of newborn rat adipocyte precursors in defined serum-free medium. In Vitro Cell Dev Biol 1987; 23: 63-66.
  6. Serrero G & Mills D. Decrease in transforming growth factor beta 1 binding during differentiation of rat adipocyte precursors in primary culture. Cell Growth Differ 1991; 2: 173-178.
  7. Shi H, Norman AW, Okamura WH, Sen A & Zemel MB. 1alpha,25-Dihydroxyvitamin D3 modulates human adipocyte metabolism via nongenomic action. Faseb J 2001; 15(14): 2751-3.
  8. Sierra-Honigmann MR, Nath AK, Murakami C, Garcia-Cardena G, Papapetropoulos A, Sessa WC, Madge LA, Schechner JS, Schwabb MB, Polverini PJ & Flores-Riveros JR. Biological action of leptin as an angiogenic factor. Science 1998; 281(5383): 1683-6.
  9. Smas CM & Sul HS. Pref-1, a protein containing EGF-like repeats, inhibits adipocyte differentiation. Cell 1993; 73(4): 725-34.
  10. Smas CM, Chen L, Zhao L, Latasa MJ & Sul HS. Transcriptional repression of pref-1 by glucocorticoids promotes 3T3-L1 adipocyte differentiation. J Biol Chem 1999; 274(18): 12632-41.
  11. Smith PJ, Wise LS, Berkowitz R, Wan C & Rubin CS. Insulin-like growth factor-I is an essential regulator of the differentiation of 3T3-L1 adipocytes. J Biol Chem 1988; 263(19): 9402-8.
  12. Sparks RL, Allen BJ & Strauss EE. TGF-beta blocks early but not late differentiation- specific gene expression and morphologic differentiation of 3T3 T proadipocytes. J Cell Physiol 1992; 150: 568-577.
  13. Spiegelman BM & Ginty CA. Fibronectin modulation of cell shape and lipogenic gene expression in 3T3-adipocytes. Cell 1983; 35(3 Pt 2): 657-66.
  14. Spiegelman BM, Choy L, Hotamisligil GS, Graves RA & Tontonoz P. Regulation of adipocyte gene expression in differentiation and syndromes of obesity/diabetes. J Biol Chem 1993; 268(10): 6823-6.
  15. Stillaert F, P. Blondeel, M. Hamdi, K. Abberton, R. Thompson and W. Morrison. Chapter 3: Adipose Tissue Induction in a Well-Defined In Vivo Microenvironment. In: Topics in Tissue Engineering, vol. 2. Eds. N Ashammakhi and R Reis. http://www.oulu.fi/spareparts/ebook_topics_in_t_e_vol2/abstracts/stillaert_0102.pdf Accessed on 25 June 2007.
  16. Stosich MS & Mao JJ. Adipose tissue engineering from human adult stem cells: clinical implications in plastic and reconstructive surgery. Plast Reconstr Surg. 2007; 119(1):71-83.
  17. Suryawan A, Swanson LV & Hu CY. Insulin and hydrocortisone, but not triiodothyronine, are required for the differentiation of pig preadipocytes in primary culture. J Anim Sci 1997; 75: 105-111.
  1. Tabata Y, Miyao M, Inamoto T, Ishii T, Hirano Y, Yamaoki Y & Ikada Y. De novo formation of adipose tissue by controlled release of basic fibroblast growth factor. Tissue Eng 2000; 6(3): 279-89.
  2. Tamakoshi K, Wakai K, Kojima M, Watanabe Y, Hayakawa N, Toyoshima H, Yatsuya H, Kondo T, Tokudome S, Hashimoto S, Suzuki K, Ito Y & Tamakoshi A. A prospective study of body size and colon cancer mortality in Japan: The JACC Study. Int J Obes Relat Metab Disord 2004; 28(4): 551-8.
  3. Torio-Padron N, Baerlecken N, Momeni A, Stark GB & Borges J. Engineering of Adipose Tissue by Injection of Human Preadipocytes in Fibrin. Aesthetic Plast Surg. 2007; 31(3):285-293.
  4. Van RL & Roncari DA. Complete differentiation of adipocyte precursors. A culture system for studying the cellular nature of adipose tissue. Cell Tissue Res 1978; 195(2): 317-29.
  5. Van RL & Roncari DA. Complete differentiation in vivo of implanted cultured adipocyte precursors from adult rats. Cell Tissue Res 1982; 225(3): 557-66.
  6. Vashi AV, Abberton KM, Thomas GP, Morrison WA, O’Connor AJ, Cooper-White JJ & Thompson EW. Adipose tissue engineering based on the controlled release of fibroblast growth factor-2 in a collagen matrix. Tissue Eng. 2006; 12(11):3035-43.
  7. Vassaux G, Negrel R, Ailhaud G & Gaillard D. Proliferation and differentiation of rat adipose precursor cells in chemically defined medium: differential action of anti- adipogenic agents. J Cell Physiol 1994; 161: 249-256.
  8. Vermette M, Trottier V, Ménard V, Saint-Pierre L, Roy A & Fradette J. Production of a new tissue-engineered adipose substitute from human adipose-derived stromal cells. Biomaterials 2007; 28(18):2850-60.
  9. Vu D, Ong JM, Clemens TL & Kern PA. 1,25-dihydroxyvitamin D induces lipoprotein lipase expression in 3T3-L1 cells in association with adipocyte differentiation. Endocrinology 1996; 137: 1540-1544.
  10. Wabitsch M, Hauner H, Heinze E & Teller WM. The role of growth hormone/insulin- like growth factors in adipocyte differentiation. Metabolism 1995; 44: 45-49.
  11. Wabitsch M, Heinze E, Hauner H, Shymko RM, Teller WM, De Meyts P & Ilondo MM. Biological effects of human growth hormone in rat adipocyte precursor cells and newly differentiated adipocytes in primary culture. Metabolism 1996; 45: 34-42.
  12. Walton RL, Beahm EK & Wu L. De novo adipose formation in a vascularized engineered construct. Microsurgery. 2004; 24(5):378-84.
  13. Wang Y, Kim KA, Kim JH & Sul HS. Pref-1, a preadipocyte secreted factor that inhibits adipogenesis. J Nutr 2006;136(12):2953-6.
  14. Weiner FR, Shah A, Smith PJ, Rubin CS & Zern MA. Regulation of collagen gene expression in 3T3-L1 cells. Effects of adipocyte differentiation and tumor necrosis factor alpha. Biochemistry 1989; 28(9): 4094-9.
  15. Wiederer O & Loffler G. Hormonal regulation of the differentiation of rat adipocyte precursor cells in primary culture. J Lipid Res 1987; 28: 649-658.
  16. Winter A, Breit S, Parsch D, Benz K, Steck E, Hauner H, Weber RM, Ewerbeck V & Richter W. Cartilage-like gene expression in differentiated human stem cell spheroids: a comparison of bone marrow-derived and adipose tissue-derived stromal cells. Arthritis Rheum. 2003; 48(2):418-29.
  17. Wosnitza M, Hemmrich K, Groger A, Gräber S & Pallua N. Plasticity of human adipose stem cells to perform adipogenic and endothelial differentiation. Differentiation 2007; 75(1):12-23.
  1. Wu X, Black L, Santacana-Laffitte G & Patrick CW. Preparation and assessment of glutaraldehyde-crosslinked collagen-chitosan hydrogels for adipose tissue engineering. J Biomed Mater Res A. 2007; 81(1):59-65.
  2. Wu Z, Bucher NL & Farmer SR. Induction of peroxisome proliferator-activated receptor gamma during the conversion of 3T3 fibroblasts into adipocytes is mediated by C/EBPbeta, C/EBPdelta, and glucocorticoids. Mol Cell Biol 1996; 16(8): 4128-36.
  3. Yarwood SJ, Anderson NG & Kilgour E. Cyclic AMP modulates adipogenesis in 3T3- F442A cells. Biochem Soc Trans 1995; 23, Suppl: 175S.
  4. Zhu Y, Qi C, Korenberg JR, Chen XN, Noya D, Rao MS & Reddy JK. Structural organization of mouse peroxisome proliferator-activated receptor gamma (mPPAR gamma) gene: alternative promoter use and different splicing yield two mPPAR gamma isoforms. Proc Natl Acad Sci U S A 1995; 92(17): 7921-5.
  5. Zuk PA, Zhu M, Mizuno H, Huang J, Futrell JW, Katz AJ, Benhaim P, Lorenz HP & Hedrick MH. Multilineage cells from human adipose tissue: implications for cell-based therapies. Tissue Eng 2001; 7(2): 211-228.
  6. Zuk PA, Zhu M, Ashjian P, De Ugarte DA, Huang JI, Mizuno H, Alfonso ZC, Fraser JK, Benhaim P & Hedrick MH. Human adipose tissue is a source of multipotent stem cells. Mol Biol Cell 2002; 13(12): 4279-95.


SOURCE

Adipose Tissue and Adipocyte Differentiation: Molecular and Cellular Aspects and Tissue Engineering Applications

  1. Niemelä*, S. Miettinen, J.R. Sarkanen and N. Ashammakhi

http://www.oulu.fi/spareparts/ebook_topics_in_t_e_vol4/abstracts/niemela.pdf


Read Full Post »

Novel Mechanisms of Resistance to Novel Agents


Curators: Larry H. Berstein, M.D. FACP & Stephen J. Williams, Ph.D.

For most of the history of chemotherapy drug development, predicting the possible mechanisms of drug resistance that ensued could be surmised from the drug’s pharmacologic mechanism of action. In other words, a tumor would develop resistance merely by altering the pathways/systems which the drug relied on for mechanism of action. For example, as elucidated in later chapters in this book, most cytotoxic chemotherapies like cisplatin and cyclophosphamide were developed to bind DNA and disrupt the cycling cell, thereby resulting in cell cycle arrest and eventually cell death or resulting in such a degree of genotoxicity which would result in great amount of DNA fragmentation. These DNA-damaging agents efficacy was shown to be reliant on their ability to form DNA adducts and lesions. Therefore increasing DNA repair could result in a tumor cell becoming resistant to these drugs. In addition, if drug concentration was merely decreased in these cells, by an enhanced drug efflux as seen with the ABC transporters, then there would be less drug available for these DNA adducts to be generated. A plethora of literature has been generated on this particular topic.

However in the era of chemotherapies developed against targets only expressed in tumor cells (such as Gleevec against the Bcr-Abl fusion protein in chronic myeloid leukemia), this paradigm had changed as clinical cases of resistance had rapidly developed soon after the advent of these compounds and new paradigms of resistance mechanisms were discovered.

speed of imitinib resistance

Imatinib resistance can be seen quickly after initiation of therapy

mellobcrablresistamplification

Speed of imatinib resistance a result of rapid gene amplification of BCR/ABL target, thereby decreasing imatinib efficacy


Although there are many other new mechanisms of resistance to personalized medicine agents (which are discussed later in the chapter) this post is a curation of cellular changes which are not commonly discussed in reviews of chemoresistance and separated in three main categories:

Cellular Diversity and Adaptation

Identifying Cancers and Resistance

Cancer Drug-Resistance Mechanism

p53 tumor drug resistance gene target

Variability of Gene Expression and Drug Resistance


Expression of microRNAs and alterations in RNA resulting in chemo-resistance

Drug-resistance Mechanism in Tumor Cells

Overexpression of miR-200c induces chemoresistance in esophageal cancers mediated through activation of the Akt signaling pathway


The miRNA–drug resistance connection: a new era of personalized medicine using noncoding RNA begins


Gene Duplication of Therapeutic Target


The advent of Gleevec (imatinib) had issued in a new era of chemotherapy, a personalized medicine approach by determining the and a lifesaver to chronic myeloid leukemia (CML) patients whose tumors displayed expression of the Bcr-Abl fusion gene. However it was not long before clinical resistance was seen to this therapy and, it was shown amplification of the drug target can lead to tumor outgrowth despite adequate drug exposure. le Coutre, Weisberg and Mahon23, 24, 25 all independently generated imatinib-resistant clones through serial passage of the cells in imatinib-containing media and demonstrated elevated Abl kinase activity due to a genetic amplification of the Bcr–Abl sequence. However, all of these samples were derived in vitro and may not represent a true mode of clinical resistance. Nevertheless, Gorre et al.26 obtained specimens, directly patients demonstrating imatinib resistance, and using fluorescence in situ hybridization analysis, genetic duplication of the Bcr–Abl gene was identified as one possible source of the resistance. Additional sporadic examples of amplification of the Bcr–Abl sequence have been clinically described, but the majority of patients presenting with either primary or secondary imatinib resistance fail to clinically demonstrate Abl amplification as a primary mode of treatment failure.

This is seen in the following papers:

Clinical resistance to STI-571 cancer therapy caused by BCR-ABL gene mutation or amplification.Gorre ME, Mohammed M, Ellwood K, Hsu N, Paquette R, Rao PN, Sawyers CL. Science. 2001 Aug 3;293(5531):876-80. Epub 2001 Jun 21.

and in another original paper by le Coutre et. al.

Induction of resistance to the Abelson inhibitor STI571 in human leukemic cells through gene amplification. le Coutre P1, Tassi E, Varella-Garcia M, Barni R, Mologni L, Cabrita G, Marchesi E, Supino R, Gambacorti-Passerini C. Blood. 2000 Mar 1;95(5):1758-66

The 2-phenylaminopyrimidine derivative STI571 has been shown to selectively inhibit the tyrosine kinase domain of the oncogenic bcr/abl fusion protein. The activity of this inhibitor has been demonstrated so far both in vitro with bcr/abl expressing cells derived from leukemic patients, and in vivo on nude mice inoculated with bcr/abl positive cells. Yet, no information is available on whether leukemic cells can develop resistance to bcr/abl inhibition. The human bcr/abl expressing cell line LAMA84 was cultured with increasing concentrations of STI571. After approximately 6 months of culture, a new cell line was obtained and named LAMA84R. This newly selected cell line showed an IC50 for the STI571 (1.0 microM) 10-fold higher than the IC50 (0.1 microM) of the parental sensitive cell line. Treatment with STI571 was shown to increase both the early and late apoptotic fraction in LAMA84 but not in LAMA84R. The induction of apoptosis in LAMA84 was associated with the activation of caspase 3-like activity, which did not develop in the resistant LAMA84R cell line. LAMA84R cells showed increased levels of bcr/abl protein and mRNA when compared to LAMA84 cells. FISH analysis with BCR- and ABL-specific probes in LAMA84R cells revealed the presence of a marker chromosome containing approximately 13 to 14 copies of the BCR/ABL gene. Thus, overexpression of the Bcr/Abl protein mediated through gene amplification is associated with and probably determines resistance of human leukemic cells to STI571 in vitro. (Blood. 2000;95:1758-1766)

This is actually the opposite case with other personalized therapies like the EGFR inhibitor gefinitib where actually the AMPLIFICATION of the therapeutic target EGFR is correlated with better response to drug in

Molecular mechanisms of epidermal growth factor receptor (EGFR) activation and response to gefitinib and other EGFR-targeting drugs.Ono M, Kuwano M. Clin Cancer Res. 2006 Dec 15;12(24):7242-51. Review.

Abstract

The epidermal growth factor receptor (EGFR) family of receptor tyrosine kinases, including EGFR, HER2/erbB2, and HER3/erbB3, is an attractive target for antitumor strategies. Aberrant EGFR signaling is correlated with progression of various malignancies, and somatic tyrosine kinase domain mutations in the EGFR gene have been discovered in patients with non-small cell lung cancer responding to EGFR-targeting small molecular agents, such as gefitinib and erlotinib. EGFR overexpression is thought to be the principal mechanism of activation in various malignant tumors. Moreover, an increased EGFR copy number is associated with improved survival in non-small cell lung cancer patients, suggesting that increased expression of mutant and/or wild-type EGFR molecules could be molecular determinants of responses to gefitinib. However, as EGFR mutations and/or gene gains are not observed in all patients who respond partially to treatment, alternative mechanisms might confer sensitivity to EGFR-targeting agents. Preclinical studies showed that sensitivity to EGFR tyrosine kinase inhibitors depends on how closely cell survival and growth signalings are coupled with EGFR, and also with HER2 and HER3, in each cancer. This review also describes a possible association between EGFR phosphorylation and drug sensitivity in cancer cells, as well as discussing the antiangiogenic effect of gefitinib in association with EGFR activation and phosphatidylinositol 3-kinase/Akt activation in vascular endothelial cells.


Mutant Variants of Therapeutic Target


resistant subclones in tissue samples and Tyrosine Kinase tumor activity


Mitochondrial Isocitrate Dehydrogenase and Variants

Mutational Landscape of Rare Childhood Brain Cancer: Analysis of 60 Intercranial Germ Cell Tumor Cases using NGS, SNP and Expression Array Analysis – Signaling Pathways KIT/RAS are affected by mutations in IGCTs


AND seen with the ALK inhibitors as well (as seen in the following papers

Acquisition of cancer stem cell-like properties in non-small cell lung cancer with acquired resistance to afatinib.

Hashida S, Yamamoto H, Shien K, Miyoshi Y, Ohtsuka T, Suzawa K, Watanabe M, Maki Y, Soh J, Asano H, Tsukuda K, Miyoshi S, Toyooka S. Cancer Sci. 2015 Oct;106(10):1377-84. doi: 10.1111/cas.12749. Epub 2015 Sep 30.

In vivo imaging models of bone and brain metastases and pleural carcinomatosis with a novel human EML4-ALK lung cancer cell line.

Nanjo S, Nakagawa T, Takeuchi S, Kita K, Fukuda K, Nakada M, Uehara H, Nishihara H, Hara E, Uramoto H, Tanaka F, Yano S. Cancer Sci. 2015 Mar;106(3):244-52. doi: 10.1111/cas.12600. Epub 2015 Feb 17.

Identification of a novel HIP1-ALK fusion variant in Non-Small-Cell Lung Cancer (NSCLC) and discovery of ALK I1171 (I1171N/S) mutations in two ALK-rearranged NSCLC patients with resistance to Alectinib. Ou SH, Klempner SJ, Greenbowe JR, Azada M, Schrock AB, Ali SM, Ross JS, Stephens PJ, Miller VA.J Thorac Oncol. 2014 Dec;9(12):1821-5

Reports of chemoresistance due to variants have also been seen with the BRAF inhibitors like vemurafenib and dabrafenib:

The RAC1 P29S hotspot mutation in melanoma confers resistance to pharmacological inhibition of RAF.

Watson IR, Li L, Cabeceiras PK, Mahdavi M, Gutschner T, Genovese G, Wang G, Fang Z, Tepper JM, Stemke-Hale K, Tsai KY, Davies MA, Mills GB, Chin L.Cancer Res. 2014 Sep 1;74(17):4845-52. doi: 10.1158/0008-5472.CAN-14-1232-T. Epub 2014 Jul 23


Read Full Post »

Serpins: A Review

Reporter: Stephen J. Williams, Ph.D.

Update of the human and mouse SERPIN gene superfamily

Abstract

The serpin family comprises a structurally similar, yet functionally diverse, set of proteins. Named originally for their function as serine proteinase inhibitors, many of its members are not inhibitors but rather chaperones, involved in storage, transport, and other roles. Serpins are found in genomes of all kingdoms, with 36 human protein-coding genes and five pseudogenes. The mouse has 60 Serpin functional genes, many of which are orthologous to human SERPIN genes and some of which have expanded into multiple paralogous genes. Serpins are found in tissues throughout the body; whereas most are extracellular, there is a class of intracellular serpins. Serpins appear to have roles in inflammation, immune function, tumorigenesis, blood clotting, dementia, and cancer metastasis. Further characterization of these proteins will likely reveal potential biomarkers and therapeutic targets for disease.

Keywords: Serpins, Serine protease inhibitor, Chaperone, Blood clotting, Thrombolysis, Complement, Cell death, Metastatic cancer

Introduction

Serpins represent the largest and most functionally diverse family of protease inhibitors. The name serpin originates from the first described function of this family, viz., serine proteinase inhibitors. In their native state, serpins exist as monomeric proteins. Most serpin family members inhibit serine proteinases of the chymotrypsin family [1], thereby inhibiting proteolytic cascades. However, some serpins exhibit functions unrelated to inhibition of catalytic activity, such as hormone transport and other mechanisms.

Approximately 1,500 serpin sequences have been identified; they are found in the genomes of all five kingdoms [2]. There are 36 identified human putatively functional protein-coding genes [3]. The serpin superfamily is divided into groups called clades according to their sequence similarity. Clades are classified as A–P, with clades A–I representing human serpins [4].

Serpins have well-conserved secondary structures with an exposed reactive center loop (RCL) (Figure 1), which interacts with the protease active site to inhibit protease activity [5]. The ability for serpins to undergo conformational change is crucial for their function, in which serpins act via a suicide substrate inhibitory mechanism [2,4]. Although most serpins selectively inhibit serine proteases, some inhibit cysteine proteases, such as caspases and cathespins; others perform hormone transport and blood pressure regulation [4]. Serpins play important physiological roles in hormone transport, corticosteroid binding, coagulation, and blood pressure regulation.

Figure 1

Native SERPINA1. Native SERPINA1 with labeled structural elements: β sheet a and reactive center loop (RCL); α helices in red, β sheets in turquoise, turns in green. (Adapted from PDB 1HP7).

Serpin nomenclature

Initially named for tissue location or function (Table 1), a nomenclature committee convened in 1999 with the goal of standardizing serpin gene nomenclature [4]. ‘SERPIN’ was designated as the gene symbol for humans and other species because it is well known and used in the literature and as a keyword [4]. Serpins were not named for activity or function due to the diversity of member structure and tissue distribution. In 2005, proteinase in human gene names was replaced with the term peptidase; however, ‘serpin’ remains the stem because the name was designated prior to this change. The current classification of serpins involves division into clades that are based on phylogenetic relationships (Figure 2). There are 16 clades labeled A–P. Human serpins are represented in the first nine clades (i.e., A–I), with a variety of members being in each clade. Clades are phylogenetically unique and it is important to recognize that no relationships between the clade letters are implied by their order [4]. Some serpins are classified as orphans because they do not group with any other clade. It is likely that they will form clades as new serpins are identified. An example to help illustrate the nomenclature would be α-1-antitrypsin. This was assigned to the first clade, giving it the symbol SERPINA1 with the ‘A’ referencing the clade and the ‘1’ referencing the gene number within the clade [4].

Table 1

SERPIN aliases and function

Figure 2

SERPIN phylogenetic tree. Phylogenetic tree of human and mouse serpin proteins. Protein sequences were aligned using TCOFFEE and analysed using neighbour-joining methods with 10,000 bootstrap replicates in the Phylip package.

Structure function

Serpins have a metastable structure that is required for their function. It consists of a highly conserved secondary structure with three β-sheets (A, B, and C), nine α-helices and a RCL (Figure 1), which serve as bait for target proteases [4,6]. Well-conserved throughout the serpin family, the tertiary structure of scaffold allows for a conformational change critical to protease inhibitor activity [4]. In their native state, serpins exist as monomeric proteins. A serpin molecule consists of a single 330- to 500-amino acid polypeptide chain that has conserved secondary helices and sheets. To inhibit proteolytic activity, the serpin acts as a suicide substrate for the protease [4]. This is accomplished by the RCL of the serpin interacting with the protease’s active site [6].

Serpins can exist in several forms, viz., active, latent, cleaved, delta, and polymeric. Each form is defined by the RCL, which is the moiety required for inhibitory activity. The active form (or the native state) has an exposed RCL that allows it to interact with the protease. The RCL forms an exposed extension located above the molecule. Following proteolysis, the amino acid terminus of the RCL inserts into the A β sheet forming a fourth strand. This process is called the ‘stressed (S) to relaxed (R) transition’ [3] used to inhibit proteases, resulting in the cleaved form. The cleaved form is necessary for inhibition of proteases resulting in an irreversible covalent complex with the target protease thus inactivating both the serpin and the target. Some serpins bind cofactors and/or glycosaminoglycans to maximize protease inhibition, which can vastly increase inhibitory potential [7].

The native form of serpins has low thermal stability indicating that it is not the most stable conformation; rather, native serpins are metastable. However, not all serpins undergo this transition. Serpins can transition to the latent form from the active form and back to the active form from the latent form. The latent form does not possess inhibitory activity but it can convert to the active form through denaturation and refolding [4]. Consequently, it can be considered a control mechanism in regulating homeostasis for certain serpins [3]. Alternatively, the latent state caused by a mutation can be pathological [3].

The delta form is an intermediate conformation between latent and native state where the RCL inserts into the A β sheet and one of the helices unwinds and completes hydrogen bonding of the β sheet [3]. Little is known about the function of this conformation; however, it is likely that this favors polymeric or latent conformation transition rather than native. The polymeric form has a loop sheet mechanism whereby the RCL that would be inserted into the same serpin is instead inserted into the A β sheet of another serpin forming a long chain of these molecules [3]. However, this mechanism of polymerization has recently been challenged in favor of that of a domain-swapping model [8]. Serpins are unique in that their native state (active form) is not the most kinetically stable; rather, it is ‘metastable’. By incorporating the RCL into their A β sheet, either by cleavage for inhibition of target protease or spontaneous latency, they become more stable [9]. For an excellent minireview on kinetics of serpins, see Silverman et al. [4].

Evolution

Whereas serpins have highly conserved secondary and tertiary structures upon which they are grouped, they often share little amino acid sequence similarity. They do, however, share a highly conserved core, especially in the shutter domain including Ser56 and Ser53 [10], which is thought to be critical in determining tertiary structure and conformational flexibility.

Due to the numerous, yet distinct, processes regulated by serpins and their widespread functions, serpins offer a unique perspective for protein evolution. Members of the serpin family tend to group phylogenetically by species rather than by function. Therefore, evolution of the serpin family was likely driven by speciation to fill their physiological roles rather than by coevolution with the serine proteases (which group by function) [10]. Numerous serpin genes are also found in clusters on the same chromosomes, reflecting earlier gene-duplication events and potentially indicating a common precursor [11,12]. Interestingly, these genes are functionally divergent, despite their chromosomal proximity [7]. In addition, serpins have distinct patterns of introns and exons. These patterns may contain information regarding phylogenetic signals and be evolutionarily related based on relative intron positioning [13,14].

The distribution of serpins in eukaryotes suggests that they arose early in eukaryotic evolution [1]. Extensive gene clustering indicates that numerous serpins in close proximity on the same chromosome may have arisen as a result of duplications from a common precursor [12]; however, the evolution of these proximal genes gave way to vastly divergent functions.

Intracellular serpins of clade B are ancestral to most extracellular serpins [15,16] and each inhibitory serpin contains a highly conserved hinge region [16] within the RCL. Clade F serpins specifically share ancestry with a sea lamprey serpin. Clade P is specific to plant serpins which form a discrete clade. At the time of divergence between Viridiplantae and fungi/Metazoa groups, there was likely only one serpin gene [16]; however, the ancestral homolog from prokaryote or fungi has not yet been identified [16].

There are eight human serpin pseudogenes listed in Table 2. SERPINA15P has been named in succession for the A clade with the parent gene SERPINA6 according to Ensembl and SERPINE2 is the parent gene for SERPINE4P, again named in sequence of the E clade. There are ten mouse pseudogenes listed (Table 3) which remain uncharacterized.

Table 2

Human SERPIN genes

Table 3

Mouse Serpin genes

Methods

Protein sequences for human serpins were accessed from Uniprot through the HUGO Gene Nomenclature Committee website (http://www.genenames.org). Sequences were retrieved from the National Center for Biotechnology Information (NCBI) gene database (http://www.ncbi.nlm.nih.gov/gene) referenced through the HUGO Gene Nomenclature Committee website (http://www.genenames.org) for humans and MGI website (http://www.informatics.jax.org) for mouse. All sequences were aligned using the most accurate settings of T-Coffee (http://tcoffee.crg.cat/) and phylogenetic trees were constructed using neighbor-joining methods with 1000 replicate bootstrap in PHYLIP 3.69 (http://evolution.genetics.washington.edu/phylip.html) (Figure 2). Expression data were determined using Genecards (http://www.genecards.org) and alternative name information was determined using HGNC (http://www.genenames.org) or MGI (http://www.informatics.jax.org).

Human and mouse serpin isoforms

Clade A

Clade A serpins are classified as antitrypsin-like, extracellular proteins. They are the largest of the eight clades of extracellular serpins. The SERPINA clade has eleven human genes (1, 3–12) and two pseudogenes.

SERPINA1 is an inhibitory serpin formerly known as antitrypsin. It plays a role in the inhibition of neutrophil elastase [3,17].

SERPINA2 was initially classified as a pseudogene; however, recent evidence indicates that it produces an active transcript that encodes a protein located in the endoplasmic reticulum [18]. A study that sequenced SERPINA2 genes across multiple ethnic groups indicated that in addition to active SERPINA2 protein, there is a haplotype characterized by a partial deletion which has patterns suggestive of positive selection for loss-of-function of SERPINA2 protein. They suggest that the partial pseudogenization in humans may indicate an ongoing process of pseudogenization [19].

SERPINA3 is an inhibitory protein formerly known as antichymotrypsin. It inhibits chymotrypsin and cathepsin G [3,16]. This serpin is normally found in blood, liver, kidney, and lung.

SERPINA4 is an inhibitory protein formerly known as kallistatin (PI4), which inhibits kallikrein [20]. It is expressed in blood, liver, kidney, and heart.

SERPINA5, formerly a protein C inhibitor, inhibits active protein C. It is present in blood, kidney and liver.

SERPINA6 was formerly known as corticosteroid-binding globulin. It is a non-inhibitory protein that binds hormones, i.e., cortisol [16].

SERPINA7, formerly thyroxine-binding globulin, is involved in non-inhibitory thyroid hormone transport. It is expressed in blood, kidney, and heart.

SERPINA8 is now referred to as angiotensinogen (AGT), which is a hormone precursor. It has a distinct serpin domain (phylogenetically unrelated to other clade A members in the current analysis) and a distinct, smaller, agt domain. This particular serpin domain appears to be more closely associated with SERPINF and SERPING [21].

SERPINA9 appears to have a role in naïve B cell maintenance. Formerly called centerin, it is expressed in the plasma and liver.

SERPINA10 is an inhibitory protein responsible for inhibition of activated coagulation factors Z and XI [3]. Formerly known as protein Z-dependent proteinase inhibitor, it is expressed in blood and liver.

SERPINA11 is likely a pseudogene and is uncharacterized.

SERPINA12, formerly vaspin, inhibits kallikrein [22] and plays a role in insulin sensitivity [23]. It appears to be expressed in plasma, platelets, liver and heart.

In the mouse (Table 3), Serpina1 has been expanded to include six members, a–f. Serpina3 has been expanded to include nine members, a–c and f–n. The other clade a members are orthologous to human genes. Serpina8, now known as Agt in the mouse, is vital for the development and function of the renin-angiotensin system [24]. It is orthologous to AGT in humans.

Clade B

Clade B consists of intracellular serpins, including ov-serpins, which are ancestral to the extracellular serpins [16]. Members of this subfamily have shorter C and N termini than typical A members and also lack the secretory signal peptide sequence [4]. There are 13 human genes in clade B and one pseudogene. Serpins in clade B are important in inflammation and immune system function as well as mucous production [25]. SERPINB1, B6, B7, and B9 are involved in immune system function with roles in neutrophil and megakaryocyte development [26,27], as well as in the inhibition of the cytotoxic granule protease granzyme B [28]. SERPINB3 and its close homolog B4 are inhibitors that have roles in mucous production [29] and are expressed in epithelial tissues, such as tongue, tonsils, uterus, cervix, and vagina as well as in the upper respiratory tract and thymus [30].

Despite elusive function, SERPINB3 appears to have a role in apoptotic regulation and immunity, which implicates B3 in tumor metastasis and autoimmunity [30]. SERPINB5 has been shown to inhibit metastasis as a tumor suppressor in breast and prostate cancer [30,31]. In addition, multiple serpins in the B clade have been associated with oral squamous cell carcinoma, specifically SERPINB12, SERPINB13, SERPINB4, SERPINB3, SERPINB11, SERPINB7, and SERPINB2 [32]. Less is known about SERPINB10–B13. However, recent evidence points to a role for SERPINB13 in autoimmune diabetes progression and in inflammation [33].

SERPINB1 is an inhibitor of neutrophil elastase. It was formerly called monocyte neutrophil elastase inhibitor and is expressed ubiquitously.

SERPINB2 inhibits PLAU (uPA). It was formerly called plasminogen activator inhibitor 2 (PAI2) and is expressed in blood, kidney, and liver.

SERPINB3 is a cross-class inhibitor of cathepsin L and V [34]. Formerly referred to as squamous cell carcinoma antigen 1, it is expressed in blood, immune cells, kidney, lung, heart, and brain as well as numerous mucosal cells.

SERPINB4 was formerly known as squamous cell carcinoma antigen 2; it was discovered with SERPINB3 [25]. It is a cross-class inhibitor of cathepsin G and chymase [35] and is found in plasma, platelets, kidney, and heart, as well as saliva.

SERPINB5 is a non-inhibitory protein formerly called maspin. It is likely expressed in blood, kidney, liver, lung, as well as saliva.

SERPINB6, formerly called proteinase inhibitor 6 (PI6), is an inhibitor of granule protease, cathepsin G [36]. It is expressed ubiquitously.

SERPINB7 is involved in mesangial cell proliferation [37]. Formerly called megsin, it is expressed in blood and liver.

SERPINB8 is an inhibitory protein. Formerly called proteinase inhibitor 8 (PI8), it is expressed in blood and heart.

SERPINB9 is an inhibitory protein. Formerly called proteinase inhibitor 9 (PI9), it is expressed in blood, liver, lung, and heart.

SERPINB10 is an inhibitory protein involved in hematopoietic and myeloid development [37]. Formerly called bomapin, it expressed in blood and possibly in the brain.

SERPINB11 is a non-inhibitory serpin in human but retains trypsin inhibitory activity in mice [38]. It appears not to exhibit tissue-specific expression; however, it is expressed in HEK cells.

SERPINB12 is a trypsin inhibitor formerly known as yukopin [39]. It is expressed in blood, kidney, liver, heart, and brain.

SERPINB13, formerly known as hurpin, is expressed in blood, kidney, and saliva.

In clade b, mouse Serpinb1 has been expanded to include three members a–c; Serpinb3 as well as Serpinb6 have each expanded to include four members, a–d. In mice, Serpinb4 is not listed; however, it appears that SERPINB3 and SERPINB4 are equally related to Serpinb3a, Serpinb3b, Serpinb3c, and Serpinb3d, despite the initial theory that Serpinb3d is the mouse homolog of human SERPINB3 and Serpinb3c is the mouse homolog of SERPINB4. Serpinb9 has been expanded to seven members and one pseudogene. Interestingly, Serpinb11 is an active proteinase inhibitor, whereas the human ortholog is inactive.

Clade C

Serpin clade C consists of only one serpin member, SERPINC1, more commonly known as antithrombin. SERPINC1 inhibits coagulation factors IX and X [40]. It is expressed in blood, kidney, liver, lung, heart, brain, as well as saliva.

Serpinc1 gene encodes antithrombin and is orthologous to human SERPINC1.

Clade D

Clade D has one serpin member, SERPIND1, which is an extracellular protein also known as heparin cofactor II [41]. It is an inhibitor of thrombin [42] and is expressed in blood, kidney, liver, and heart.

Serpind1 encodes heparin cofactor II and is orthologous to SERPIND1.

Clade E

Clade E has three members, E1, E2, and E3, all of which are extracellular.

SERPINE1, also known as plasminogen activator inhibitor-1 (PAI1), inhibits thrombin. It is expressed in blood, liver, and heart.

SERPINE2 is a glial-derived nexin that is important in recovery of nerve structure and function [43]. It is expressed in blood, liver, kidney, and brain.

Little is known about the function of SERPINE3.

The mouse genes in clade e (Serpine1–3) are orthologous to human SERPINE1–3.

Clade F

There are two members in SERPIN clade F.

SERPINF1 (or pigment epithelium-derived factor (PEDF)) regulates angiogenesis and is an example of a non-inhibitory serpin. It is also thought to be a neurotrophic factor [16], and appears to be expressed in blood, liver, kidney, heart, and possibly lung.

SERPINF2, also known as α-2-antiplasmin, is an inhibitor of fibrinolysis. It is found in blood, kidney, liver, and heart.

Mouse Serpinf1 and f2 genes are orthologous to the human SERPINF1 and SERPINF2 genes, respectively.

Clade G

Clade G consists of one inhibitory serpin.

SERPING1 is a complement I esterase inhibitor [44] formerly called C1 inhibitor. It is expressed in blood, liver, kidney, lung, heart, and brain.

Mouse Serping1 encodes C1 inhibitor and is orthologous to SERPING1.

Clade H

Clade H consists of one member.

SERPINH1, also known as 47-kDa heat shock protein (HSP47), does not act as a proteinase inhibitor, but rather as a chaperone for collagen [45]. It is expressed in blood, liver and heart.

Mouse Serpinh1 encodes HSP47 and is orthologous to SERPINH1. Knockouts of Serpinh1 in mice are lethal [46] and missense mutations are associated with osteogenesis imperfecta [47].

Clade I

Clade I consists of two extracellular proteins. Serpins in clade I include the following.

SERPINI1 is a neuroserpin inhibitor of PLAT (tPA), PLAU (uPA), and plasmin [48]. It is expressed in liver and possibly plasma.

SERPINI2, previously known as pancipin, has an unknown protein target but may be involved in pancreatic dysfunction [49]. It is found in platelets and plasma as well as the heart.

The genes Serpini1 and Serpini2 encode mouse neuroserpin and pancipin, respectively. These are orthologous to SERPINI1 and SERPINI2 in the human.

Clades J–P

Clades j–p represent viral, nematode, horseshoe crab, blood fluke, and plant serpins [16] and will not be described further in this update.

Serpins associated with disease

Serpin polymorphisms have been associated with in many disease states, including blood clotting disorders, emphysema, cirrhosis, and dementia [15,16,50] as well as tumorigenesis and metastasis.

Mutations in SERPINA1 result in a decrease in circulating α-1-antitrypsin which is associated with emphysema and hepatocellular carcinoma [51]. Serpins are implicated in regulation of the cardiovascular system. For example, SERPINA4 depletion is related to renal and cardiovascular injury [52], SERPINA8 variations are integral to the normal function of the renin-angiotensin system and have been found to regulate blood pressure [53], and a SERPINA10 polymorphism was found to increase the risk of venous thromboembolism [54,55]. SERPINA3 deficiency is associated with emphysema [56].

Many SERPINBs are implicated in immune function and dysfunction. In many of these cases, intracellular serpins cause autoimmune antibody production, inflammation, neutropenia, and cancer metastasis [25]. SERPINC1 deficiency has been correlated with autoimmune disease, especially in patients producing antinuclear antibodies, such as those with systemic lupus erythematosus [30]. Interestingly, a SERPINA6 polymorphism has been associated with chronic fatigue syndrome [57], which is thought to be an immune disorder. SERPINA7 deficiency is associated with hyperthyroidism, and high SERPINA12 levels have been associated with insulin resistance [23].

Mutations in SERPINH1, as well as in SERPINF1, are associated with osteogenesis imperfecta [47,58].

Serpins appear to influence protein aggregation. In this respect, SERPINI1 expression has been correlated with dementia [4]. In addition, SERPINA5 accumulation has been identified in plaques in multiple sclerosis [59] and SERPINA3 polymerization may accelerate onset and severity of Alzheimer’s disease [30].

Many serpins have been implicated in cancer progression including SERPINBs (on the 18q21 locus) in oral squamous cell carcinoma [25]. Breast and prostate cancer metastases are also closely associated with SERPINB5 [60,61]. In addition, SERPINE1 appears to have a role in tumor progression [62] and metastasis [63]. Further, SERPINI2 may play a possible role in breast and pancreatic cancer metastasis [49]. Adult gliomas have significant associations with SERPINI1 [64], although its role is unknown. In addition, SERPINI1 has also been proposed as one of five biomarkers in hepatocellular carcinoma [65]. Another potential biomarker includes SERPINA9, which has been found to be strongly expressed in B cell lymphomas [66].

Mouse models of human disease

There are numerous mouse models used to study the role of SERPINs in disease. Some examples include knockout of Serpinag3 used in studying T cells in immunology [67], hepatic specific knockout of Serpinc1, which exhibits coagulopathy [68], and Agt knockout to study blood pressure regulation and the renin-angiotensin system where adipocyte-specific knockout of agt caused decreased systolic blood pressure [69]. Serpinb1 knockout mice show neutropenia [70].

Gene variants in SERPINS

A large number of human variants of serpin genes have been found. For example, NCBI’s dbSNP database (http://www.ncbi.nlm.nih.gov/snp) has 621 entries for SNPs of SERPINA1 alone (accessed October 2013). In addition, several groups have developed specific databases for individual SERPIN genes. These include databases for SERPINA1[71], SERPINC3[72], and SERPING1[73]. A number of pathologies in humans have been attributed to SERPIN gene variants, and often multiple deleterious mutations are known for each gene. Although a full listing of disease-causing SERPIN mutations is beyond the scope of this review, a sample of their scope is provided here. Mutations in the SERPINA1 gene have been linked with early-onset pulmonary emphysema, neonatal hepatitis, liver cirrhosis, and sometimes panniculitis and vasculitis [74,75]. SERPINA5 mutations have been linked with increased papillary thyroid cancer risk [76], and mutations in SERPINA10 have been linked to pregnancy complications [77]. Predisposition to familial venous thromboembolic disease has been linked to mutations in SERPINC1[78,79]. Finally, SNP variants for the SERPING1 gene have been shown to be associated with hereditary angioedema [80].

Conclusions

Serpins are a large class of diverse proteins, which contribute to numerous physiological and pathological conditions. Identification of serpins in immunological functions, pathology due to polymerization, and cancer metastasis underscores their diverse functions and physiological and pathological importance, and gene mutations often lead to loss-of-function and pathology in affected individuals. However, there is still much to learn about the functions and evolutionary development of serpins. Because of numerous biological functions and pathological states associated with serpins, further characterization of these proteins and mechanistic information will provide insight into potential biomarker identification and therapeutic targets.

Competing interests

The authors declare that they have no competing interests.

Authors’ contributions

CH carried out the sequence alignments and drafted the manuscript. BJ participated in the sequence alignment and analysis. MM reviewed mouse gene/protein data and the nomenclature for accuracy and completeness. MW reviewed human gene/protein data and nomenclature for accuracy and completeness. DT, GS and DWN reviewed and edited the manuscript. VV designed the study and reviewed data and manuscript. All authors read and approved the final manuscript.

Acknowledgements

This work was supported, in part, by the following NIH grants: R24 AA022057, NIEHS P30 ES06096, HG000330, U41HG003345 and also by a Welcome Trust grant no. 099129/Z/12/Z. Fellowship assistance for BCJ (F31 AA020728) is acknowledged. We would like to thank Konstandinos Vasiliou for his assistance.

References

  • Wright HT. Introns and higher-order structure in the evolution of serpins. J Mol Evol. 1993;7:136–143. doi: 10.1007/BF00166249. [Cross Ref]
  • Potempa J, Korzus E, Travis J. The serpin superfamily of proteinase inhibitors: structure, function, and regulation. J Biol Chem. 1994;7:15957–15960. [PubMed]
  • Law RH, Zhang Q, McGowan S, Buckle AM, Silverman GA, Wong W, Rosado CJ, Langendorf CG, Pike RN, Bird PI, Whisstock JC. An overview of the serpin superfamily. Genome Biol. 2006;7:216. doi: 10.1186/gb-2006-7-5-216. [PMC free article] [PubMed] [Cross Ref]
  • Silverman GA, Bird PI, Carrell RW, Church FC, Coughlin PB, Gettins PG, Irving JA, Lomas DA, Luke CJ, Moyer RW, Pemberton PA, Remold-O’Donnell E, Salvesen GS, Travis J, Whisstock JC. The serpins are an expanding superfamily of structurally similar but functionally diverse proteins: evolution, mechanism of inhibition, novel functions, and a revised nomenclature. J Biol Chem. 2001;7:33293–33296. doi: 10.1074/jbc.R100016200. [PubMed] [Cross Ref]
  • Schechter I, Berger A. On the size of the active site in proteases: I. Papain. Biochem Biophys Res Commun. 1967;7:157–162. doi: 10.1016/S0006-291X(67)80055-X. [PubMed] [Cross Ref]
  • Huber R, Carrell RW. Implications of the three-dimensional structure of alpha 1-antitrypsin for structure and function of serpins. Biochemistry-US. 1989;7:8951–8966. doi: 10.1021/bi00449a001. [PubMed] [Cross Ref]
  • Rein CM, Desai UR, Church FC. Serpin-glycosaminoglycan interactions. Methods Enzymol. 2011;7:105–137. [PubMed]
  • Yamasaki M, Sendall TJ, Pearce MC, Whisstock JC, Huntington JA. Molecular basis of alpha1-antitrypsin deficiency revealed by the structure of a domain-swapped trimer. EMBO Rep. 2011;7:1011–1017. doi: 10.1038/embor.2011.171. [PMC free article] [PubMed] [Cross Ref]
  • Huntington JA. Serpin structure, function and dysfunction. J Thromb Haemost. 2011;7(1):26–34. [PubMed]
  • Krem MM, Di Cera E. Conserved ser residues, the shutter region, and speciation in serpin evolution. J Biol Chem. 2003;7:37810–37814. doi: 10.1074/jbc.M305088200. [PubMed] [Cross Ref]
  • Billingsley GD, Walter MA, Hammond GL, Cox DW. Physical mapping of four serpin genes: alpha 1-antitrypsin, alpha 1-antichymotrypsin, corticosteroid-binding globulin, and protein C inhibitor, within a 280-kb region on chromosome I4q32.1. Am J Hum Genet. 1993;7:343–353. [PMC free article] [PubMed]
  • Rollini P, Fournier RE. A 370-kb cosmid contig of the serpin gene cluster on human chromosome 14q32.1: molecular linkage of the genes encoding alpha 1-antichymotrypsin, protein C inhibitor, kallistatin, alpha 1-antitrypsin, and corticosteroid-binding globulin. Genomics. 1997;7:409–415. doi: 10.1006/geno.1997.5077. [PubMed] [Cross Ref]
  • Long M, de Souza SJ, Gilbert W. Evolution of the intron-exon structure of eukaryotic genes. Curr Opin Genet Dev. 1995;7:774–778. doi: 10.1016/0959-437X(95)80010-3. [PubMed] [Cross Ref]
  • Logsdon JM Jr, Stoltzfus A, Doolittle WF. Molecular evolution: recent cases of spliceosomal intron gain? Curr Biol. 1998;7:R560–R563. doi: 10.1016/S0960-9822(07)00361-2. [PubMed] [Cross Ref]
  • Clarke EP, Cates GA, Ball EH, Sanwal BD. A collagen-binding protein in the endoplasmic reticulum of myoblasts exhibits relationship with serine protease inhibitors. J Biol Chem. 1991;7:17230–17235. [PubMed]
  • Irving JA, Pike RN, Lesk AM, Whisstock JC. Phylogeny of the serpin superfamily: implications of patterns of amino acid conservation for structure and function. Genome Res. 2000;7:1845–1864. doi: 10.1101/gr.GR-1478R. [PubMed] [Cross Ref]
  • Clemmensen SN, Jacobsen LC, Rorvig S, Askaa B, Christenson K, Iversen M, Jorgensen MH, Larsen MT, van Deurs B, Ostergaard O, Heegaard NH, Cowland JB, Borregaard N. Alpha-1-antitrypsin is produced by human neutrophil granulocytes and their precursors and liberated during granule exocytosis. Eur J Haematol. 2011;7:517–530. doi: 10.1111/j.1600-0609.2011.01601.x. [PubMed] [Cross Ref]
  • Marques PI, Ferreira Z, Martins M, Figueiredo J, Silva DI, Castro P, Morales-Hojas R, Simoes-Correia J, Seixas S. SERPINA2 is a novel gene with a divergent function from SERPINA1. PLoS One. 2013;7:e66889. doi: 10.1371/journal.pone.0066889. [PMC free article] [PubMed] [Cross Ref]
  • Seixas S, Suriano G, Carvalho F, Seruca R, Rocha J, Di Rienzo A. Sequence diversity at the proximal 14q32.1 SERPIN subcluster: evidence for natural selection favoring the pseudogenization of SERPINA2. Mol Biol Evol. 2007;7:587–598. [PubMed]
  • Chao J, Schmaier A, Chen LM, Yang Z, Chao L. Kallistatin, a novel human tissue kallikrein inhibitor: levels in body fluids, blood cells, and tissues in health and disease. J Lab Clin Med. 1996;7:612–620. doi: 10.1016/S0022-2143(96)90152-3. [PubMed] [Cross Ref]
  • Paterson MA, Horvath AJ, Pike RN, Coughlin PB. Molecular characterization of centerin, a germinal centre cell serpin. Biochem J. 2007;7:489–494. doi: 10.1042/BJ20070174. [PMC free article] [PubMed] [Cross Ref]
  • Heiker JT, Kloting N, Kovacs P, Kuettner EB, Strater N, Schultz S, Kern M, Stumvoll M, Bluher M, Beck-Sickinger AG. Vaspin inhibits kallikrein 7 by serpin mechanism. Cell Mol Life Sci. 2013;7:2569–2583. doi: 10.1007/s00018-013-1258-8. [PMC free article] [PubMed] [Cross Ref]
  • Teshigawara S, Wada J, Hida K, Nakatsuka A, Eguchi J, Murakami K, Kanzaki M, Inoue K, Terami T, Katayama A, Iseda I, Matsushita Y, Miyatake N, McDonald JF, Hotta K, Makino H. Serum vaspin concentrations are closely related to insulin resistance, and rs77060950 at SERPINA12 genetically defines distinct group with higher serum levels in Japanese population. J Clin Endocrinol Metab. 2012;7:E1202–E1207. doi: 10.1210/jc.2011-3297. [PubMed] [Cross Ref]
  • Hilgers KF, Norwood VF, Gomez RA. Angiotensin’s role in renal development. Semin Nephrol. 1997;7:492–501. [PubMed]
  • Vidalino L, Doria A, Quarta S, Zen M, Gatta A, Pontisso P. SERPINB3, apoptosis and autoimmunity. Autoimmun Rev. 2009;7:108–112. doi: 10.1016/j.autrev.2009.03.011. [PubMed] [Cross Ref]
  • Tsujimoto M, Tsuruoka N, Ishida N, Kurihara T, Iwasa F, Yamashiro K, Rogi T, Kodama S, Katsuragi N, Adachi M, Katayama T, Nakao M, Yamaichi K, Hashino J, Haruyama M, Miura K, Nakanishi T, Nakazato H, Teramura M, Mizoguchi H, Yamaguchi N. Purification, cDNA cloning, and characterization of a new serpin with megakaryocyte maturation activity. J Biol Chem. 1997;7:15373–15380. doi: 10.1074/jbc.272.24.15373. [PubMed] [Cross Ref]
  • Miyata T, Inagi R, Nangaku M, Imasawa T, Sato M, Izuhara Y, Suzuki D, Yoshino A, Onogi H, Kimura M, Sugiyama S, Kurokawa K. Overexpression of the serpin megsin induces progressive mesangial cell proliferation and expansion. J Clin Invest. 2002;7:585–593. [PMC free article] [PubMed]
  • Sun J, Bird CH, Sutton V, McDonald L, Coughlin PB, De Jong TA, Trapani JA, Bird PI. A cytosolic granzyme B inhibitor related to the viral apoptotic regulator cytokine response modifier A is present in cytotoxic lymphocytes. J Biol Chem. 1996;7:27802–27809. doi: 10.1074/jbc.271.44.27802. [PubMed] [Cross Ref]
  • Sivaprasad U, Askew DJ, Ericksen MB, Gibson AM, Stier MT, Brandt EB, Bass SA, Daines MO, Chakir J, Stringer KF, Wert SE, Whitsett JA, Le Cras TD, Wills-Karp M, Silverman GA, Khurana Hershey GK. A nonredundant role for mouse serpinb3a in the induction of mucus production in asthma. J Allergy Clin Immunol. 2011;7:254–261. doi: 10.1016/j.jaci.2010.10.009. 261 e251-256. [PMC free article] [PubMed] [Cross Ref]
  • Gatto M, Iaccarino L, Ghirardello A, Bassi N, Pontisso P, Punzi L, Shoenfeld Y, Doria A. Serpins, immunity and autoimmunity: old molecules, new functions. Clin Rev Allergy Immunol. 2013;7(2):267–280. doi: 10.1007/s12016-013-8353-3. [PubMed] [Cross Ref]
  • Zou Z, Anisowicz A, Hendrix MJ, Thor A, Neveu M, Sheng S, Rafidi K, Seftor E, Sager R. Maspin, a serpin with tumor-suppressing activity in human mammary epithelial cells. Science. 1994;7:526–529. doi: 10.1126/science.8290962. [PubMed] [Cross Ref]
  • Shiiba M, Nomura H, Shinozuka K, Saito K, Kouzu Y, Kasamatsu A, Sakamoto Y, Murano A, Ono K, Ogawara K, Uzawa K, Tanzawa H. Down-regulated expression of SERPIN genes located on chromosome 18q21 in oral squamous cell carcinomas. Oncol Rep. 2010;7:241–249. [PubMed]
  • Baldzizhar R, Fedorchuk C, Jha M, Rathinam C, Henegariu O, Czyzyk J. Anti-serpin antibody-mediated regulation of proteases in autoimmune diabetes. J Biol Chem. 2013;7:1612–1619. doi: 10.1074/jbc.M112.409664. [PMC free article] [PubMed] [Cross Ref]
  • Schick C, Pemberton PA, Shi GP, Kamachi Y, Cataltepe S, Bartuski AJ, Gornstein ER, Bromme D, Chapman HA, Silverman GA. Cross-class inhibition of the cysteine proteinases cathepsins K, L, and S by the serpin squamous cell carcinoma antigen 1: a kinetic analysis. Biochemistry-US. 1998;7:5258–5266. doi: 10.1021/bi972521d. [PubMed] [Cross Ref]
  • Schick C, Kamachi Y, Bartuski AJ, Cataltepe S, Schechter NM, Pemberton PA, Silverman GA. Squamous cell carcinoma antigen 2 is a novel serpin that inhibits the chymotrypsin-like proteinases cathepsin G and mast cell chymase. J Biol Chem. 1997;7:1849–1855. doi: 10.1074/jbc.272.3.1849. [PubMed] [Cross Ref]
  • Scott FL, Hirst CE, Sun J, Bird CH, Bottomley SP, Bird PI. The intracellular serpin proteinase inhibitor 6 is expressed in monocytes and granulocytes and is a potent inhibitor of the azurophilic granule protease, cathepsin G. Blood. 1999;7:2089–2097. [PubMed]
  • Xia Y, Zhang Y, Shi W, Liu S, Chen Y, Liang X, Ye Z. Overexpression of megsin induces mesangial cell proliferation and excretion of type IV collagen in vitro. Cell Immunol. 2011;7:413–417. doi: 10.1016/j.cellimm.2011.08.009. [PubMed] [Cross Ref]
  • Askew DJ, Cataltepe S, Kumar V, Edwards C, Pace SM, Howarth RN, Pak SC, Askew YS, Bromme D, Luke CJ, Whisstock JC, Silverman GA. SERPINB11 Is a new noninhibitory intracellular serpin: common single nucleotide polymorphisms in the scaffold impair conformational change. J Biol Chem. 2007;7:24948–24960. doi: 10.1074/jbc.M703182200. [PubMed] [Cross Ref]
  • Askew YS, Pak SC, Luke CJ, Askew DJ, Cataltepe S, Mills DR, Kato H, Lehoczky J, Dewar K, Birren B, Silverman GA. SERPINB12 is a novel member of the human ov-serpin family that is widely expressed and inhibits trypsin-like serine proteinases. J Biol Chem. 2001;7:49320–49330. doi: 10.1074/jbc.M108879200. [PubMed] [Cross Ref]
  • Huntington JA. Shape-shifting serpins–advantages of a mobile mechanism. Trends Biochem Sci. 2006;7:427–435. doi: 10.1016/j.tibs.2006.06.005. [PubMed] [Cross Ref]
  • Vicente CP, He L, Pavao MS, Tollefsen DM. Antithrombotic activity of dermatan sulfate in heparin cofactor II-deficient mice. Blood. 2004;7:3965–3970. doi: 10.1182/blood-2004-02-0598. [PubMed] [Cross Ref]
  • Rau JC, Deans C, Hoffman MR, Thomas DB, Malcom GT, Zieske AW, Strong JP, Koch GG, Church FC. Heparin cofactor II in atherosclerotic lesions from the pathobiological determinants of atherosclerosis in youth (PDAY) study. Exp Mol Pathol. 2009;7:178–183. doi: 10.1016/j.yexmp.2009.09.003. [PMC free article] [PubMed] [Cross Ref]
  • Lino MM, Atanasoski S, Kvajo M, Fayard B, Moreno E, Brenner HR, Suter U, Monard D. Mice lacking protease nexin-1 show delayed structural and functional recovery after sciatic nerve crush. J Neurosci. 2007;7:3677–3685. doi: 10.1523/JNEUROSCI.0277-07.2007. [PubMed] [Cross Ref]
  • Beinrohr L, Harmat V, Dobo J, Lorincz Z, Gal P, Zavodszky P. C1 inhibitor serpin domain structure reveals the likely mechanism of heparin potentiation and conformational disease. J Biol Chem. 2007;7:21100–21109. doi: 10.1074/jbc.M700841200. [PubMed] [Cross Ref]
  • Widmer C, Gebauer JM, Brunstein E, Rosenbaum S, Zaucke F, Drogemuller C, Leeb T, Baumann U. Molecular basis for the action of the collagen-specific chaperone Hsp47/SERPINH1 and its structure-specific client recognition. Proc Natl Acad Sci U S A. 2012;7:13243–13247. doi: 10.1073/pnas.1208072109. [PMC free article] [PubMed] [Cross Ref]
  • Nagai N, Hosokawa M, Itohara S, Adachi E, Matsushita T, Hosokawa N, Nagata K. Embryonic lethality of molecular chaperone hsp47 knockout mice is associated with defects in collagen biosynthesis. J Cell Biol. 2000;7:1499–1506. doi: 10.1083/jcb.150.6.1499. [PMC free article] [PubMed] [Cross Ref]
  • Christiansen HE, Schwarze U, Pyott SM, Al Swaid A, Al Balwi M, Alrasheed S, Pepin MG, Weis MA, Eyre DR, Byers PH. Homozygosity for a missense mutation in SERPINH1, which encodes the collagen chaperone protein HSP47, results in severe recessive osteogenesis imperfecta. Am J Hum Genet. 2010;7:389–398. doi: 10.1016/j.ajhg.2010.01.034. [PMC free article] [PubMed] [Cross Ref]
  • Osterwalder T, Cinelli P, Baici A, Pennella A, Krueger SR, Schrimpf SP, Meins M, Sonderegger P. The axonally secreted serine proteinase inhibitor, neuroserpin, inhibits plasminogen activators and plasmin but not thrombin. J Biol Chem. 1998;7:2312–2321. doi: 10.1074/jbc.273.4.2312. [PubMed] [Cross Ref]
  • Ozaki K, Nagata M, Suzuki M, Fujiwara T, Miyoshi Y, Ishikawa O, Ohigashi H, Imaoka S, Takahashi E, Nakamura Y. Isolation and characterization of a novel human pancreas-specific gene, pancpin, that is down-regulated in pancreatic cancer cells. Genes Chromosomes Cancer. 1998;7:179–185. doi: 10.1002/(SICI)1098-2264(199807)22:3<179::AID-GCC3>3.0.CO;2-T. [PubMed] [Cross Ref]
  • Carrell RW, Lomas DA. Conformational disease. Lancet. 1997;7:134–138. doi: 10.1016/S0140-6736(97)02073-4. [PubMed] [Cross Ref]
  • Saunders DN, Tindall EA, Shearer RF, Roberson J, Decker A, Wilson JA, Hayes VM. A novel SERPINA1 mutation causing serum alpha(1)-antitrypsin deficiency. PLoS One. 2012;7:e51762. doi: 10.1371/journal.pone.0051762. [PMC free article] [PubMed] [Cross Ref]
  • Liu Y, Bledsoe G, Hagiwara M, Shen B, Chao L, Chao J. Depletion of endogenous kallistatin exacerbates renal and cardiovascular oxidative stress, inflammation, and organ remodeling. Am J Physiol Renal Physiol. 2012;7:F1230–F1238. doi: 10.1152/ajprenal.00257.2012. [PMC free article] [PubMed] [Cross Ref]
  • Jeunemaitre X, Gimenez-Roqueplo AP, Celerier J, Corvol P. Angiotensinogen variants and human hypertension. Curr Hypertens Rep. 1999;7:31–41. doi: 10.1007/s11906-999-0071-0. [PubMed] [Cross Ref]
  • Van de Water N, Tan T, Ashton F, O’Grady A, Day T, Browett P, Ockelford P, Harper P. Mutations within the protein Z-dependent protease inhibitor gene are associated with venous thromboembolic disease: a new form of thrombophilia. Br J Haematol. 2004;7:190–194. doi: 10.1111/j.1365-2141.2004.05189.x. [PubMed] [Cross Ref]
  • Corral J, Gonzalez-Conejero R, Soria JM, Gonzalez-Porras JR, Perez-Ceballos E, Lecumberri R, Roldan V, Souto JC, Minano A, Hernandez-Espinosa D, Alberca I, Fontcuberta J, Vicente V. A nonsense polymorphism in the protein Z-dependent protease inhibitor increases the risk for venous thrombosis. Blood. 2006;7:177–183. doi: 10.1182/blood-2005-08-3249. [PMC free article] [PubMed] [Cross Ref]
  • Gooptu B, Hazes B, Chang WS, Dafforn TR, Carrell RW, Read RJ, Lomas DA. Inactive conformation of the serpin alpha(1)-antichymotrypsin indicates two-stage insertion of the reactive loop: implications for inhibitory function and conformational disease. Proc Natl Acad Sci U S A. 2000;7:67–72. doi: 10.1073/pnas.97.1.67. [PMC free article] [PubMed] [Cross Ref]
  • Torpy DJ, Bachmann AW, Gartside M, Grice JE, Harris JM, Clifton P, Easteal S, Jackson RV, Whitworth JA. Association between chronic fatigue syndrome and the corticosteroid-binding globulin gene ALA SER224 polymorphism. Endocr Res. 2004;7:417–429. doi: 10.1081/ERC-200035599. [PubMed] [Cross Ref]
  • Homan EP, Rauch F, Grafe I, Lietman C, Doll JA, Dawson B, Bertin T, Napierala D, Morello R, Gibbs R, White L, Miki R, Cohn DH, Crawford S, Travers R, Glorieux FH, Lee B. Mutations in SERPINF1 cause osteogenesis imperfecta type VI. J Bone Miner Res. 2011;7:2798–2803. doi: 10.1002/jbmr.487. [PMC free article] [PubMed] [Cross Ref]
  • Han MH, Hwang SI, Roy DB, Lundgren DH, Price JV, Ousman SS, Fernald GH, Gerlitz B, Robinson WH, Baranzini SE, Grinnell BW, Raine CS, Sobel RA, Han DK, Steinman L. Proteomic analysis of active multiple sclerosis lesions reveals therapeutic targets. Nature. 2008;7:1076–1081. doi: 10.1038/nature06559. [PubMed] [Cross Ref]
  • Cao D, Zhang Q, Wu LS, Salaria SN, Winter JW, Hruban RH, Goggins MS, Abbruzzese JL, Maitra A, Ho L. Prognostic significance of maspin in pancreatic ductal adenocarcinoma: tissue microarray analysis of 223 surgically resected cases. Mod Pathol. 2007;7:570–578. doi: 10.1038/modpathol.3800772. [PubMed] [Cross Ref]
  • Vecchi M, Confalonieri S, Nuciforo P, Vigano MA, Capra M, Bianchi M, Nicosia D, Bianchi F, Galimberti V, Viale G, Palermo G, Riccardi A, Campanini R, Daidone MG, Pierotti MA, Pece S, Di Fiore PP. Breast cancer metastases are molecularly distinct from their primary tumors. Oncogene. 2008;7:2148–2158. doi: 10.1038/sj.onc.1210858. [PubMed] [Cross Ref]
  • Jing Y, Kovacs K, Kurisetty V, Jiang Z, Tsinoremas N, Merchan JR. Role of plasminogen activator inhibitor-1 in urokinase’s paradoxical in vivo tumor suppressing or promoting effects. Mol Cancer Res. 2012;7:1271–1281. doi: 10.1158/1541-7786.MCR-12-0145. [PMC free article] [PubMed] [Cross Ref]
  • Klein RM, Bernstein D, Higgins SP, Higgins CE, Higgins PJ. SERPINE1 expression discriminates site-specific metastasis in human melanoma. Exp Dermatol. 2012;7:551–554. doi: 10.1111/j.1600-0625.2012.01523.x. [PMC free article] [PubMed] [Cross Ref]
  • Rajaraman P, Brenner AV, Butler MA, Wang SS, Pfeiffer RM, Ruder AM, Linet MS, Yeager M, Wang Z, Orr N, Fine HA, Kwon D, Thomas G, Rothman N, Inskip PD, Chanock SJ. Common variation in genes related to innate immunity and risk of adult glioma. Cancer Epidemiol Biomarkers Prev. 2009;7:1651–1658. doi: 10.1158/1055-9965.EPI-08-1041. [PMC free article] [PubMed] [Cross Ref]
  • Jia HL, Ye QH, Qin LX, Budhu A, Forgues M, Chen Y, Liu YK, Sun HC, Wang L, Lu HZ, Shen F, Tang ZY, Wang XW. Gene expression profiling reveals potential biomarkers of human hepatocellular carcinoma. Clin Cancer Res. 2007;7:1133–1139. doi: 10.1158/1078-0432.CCR-06-1025. [PubMed] [Cross Ref]
  • Paterson MA, Hosking PS, Coughlin PB. Expression of the serpin centerin defines a germinal center phenotype in B-cell lymphomas. Am J Clin Pathol. 2008;7:117–126. doi: 10.1309/9QKE68QU7B825A3U. [PubMed] [Cross Ref]
  • Byrne SM, Aucher A, Alyahya S, Elder M, Olson ST, Davis DM, Ashton-Rickardt PG. Cathepsin B controls the persistence of memory CD8+ T lymphocytes. J Immunol. 2012;7:1133–1143. doi: 10.4049/jimmunol.1003406. [PMC free article] [PubMed] [Cross Ref]
  • Safdar H, Cheung KL, Salvatori D, Versteeg HH, Laghmani el H, Wagenaar GT, Reitsma PH, van Vlijmen BJ. Acute and severe coagulopathy in adult mice following silencing of hepatic antithrombin and protein C production. Blood. 2013;7:4413–4416. doi: 10.1182/blood-2012-11-465674. [PubMed] [Cross Ref]
  • Yiannikouris F, Karounos M, Charnigo R, English VL, Rateri DL, Daugherty A, Cassis LA. Adipocyte-specific deficiency of angiotensinogen decreases plasma angiotensinogen concentration and systolic blood pressure in mice. Am J Physiol Regul Integr Comp Physiol. 2012;7:R244–R251. doi: 10.1152/ajpregu.00323.2011. [PMC free article] [PubMed] [Cross Ref]
  • Baumann M, Pham CT, Benarafa C. SerpinB1 is critical for neutrophil survival through cell-autonomous inhibition of cathepsin G . Blood. 2013;7:3900–3907. doi: 10.1182/blood-2012-09-455022. S3901-3906. [PMC free article] [PubMed] [Cross Ref]
  • Zaimidou S, van Baal S, Smith TD, Mitropoulos K, Ljujic M, Radojkovic D, Cotton RG, Patrinos GP. A1ATVar: a relational database of human SERPINA1 gene variants leading to alpha1-antitrypsin deficiency and application of the VariVis software. Hum Mutat. 2009;7:308–313. doi: 10.1002/humu.20857. [PubMed] [Cross Ref]
  • Lane DA, Olds RJ, Thein SL. Antithrombin III: summary of first database update. Nucleic Acids Res. 1994;7:3556–3559. [PMC free article] [PubMed]
  • Kalmar L, Hegedus T, Farkas H, Nagy M, Tordai A. HAEdb: a novel interactive, locus-specific mutation database for the C1 inhibitor gene. Hum Mutat. 2005;7:1–5. doi: 10.1002/humu.20112. [PubMed] [Cross Ref]
  • Sabina J, Tobias W. Augmentation therapy with alpha1-antitrypsin: novel perspectives. Cardiovasc Hematol Disord Drug Targets. 2013;7:90–98. [PubMed]
  • Bornhorst JA, Greene DN, Ashwood ER, Grenache DG. α1-Antitrypsin phenotypes and associated serum protein concentrations in a large clinical population. Chest. 2013;7:1000–1008. doi: 10.1378/chest.12-0564. [PubMed] [Cross Ref]
  • Brenner AV, Neta G, Sturgis EM, Pfeiffer RM, Hutchinson A, Yeager M, Xu L, Zhou C, Wheeler W, Tucker MA, Chanock SJ, Sigurdson AJ. Common single nucleotide polymorphisms in genes related to immune function and risk of papillary thyroid cancer. PLoS One. 2013;7:e57243. doi: 10.1371/journal.pone.0057243. [PMC free article] [PubMed] [Cross Ref]
  • Almawi WY, Al-Shaikh FS, Melemedjian OK, Almawi AW. Protein Z, an anticoagulant protein with expanding role in reproductive biology. Reproduction. 2013;7:R73–R80. doi: 10.1530/REP-13-0072. [PubMed] [Cross Ref]
  • Maruyama K, Morishita E, Karato M, Kadono T, Sekiya A, Goto Y, Sato T, Nomoto H, Omi W, Tsuzura S, Imai H, Asakura H, Ohtake S, Nakao S. Antithrombin deficiency in three Japanese families: one novel and two reported point mutations in the antithrombin gene. Thromb Res. 2013;7:e118–e123. doi: 10.1016/j.thromres.2013.06.001. [PubMed] [Cross Ref]
  • Hepner M, Karlaftis V. Antithrombin. Methods Mol Biol. 2013;7:355–364. doi: 10.1007/978-1-62703-339-8_28. [PubMed] [Cross Ref]
  • Bork K, Davis-Lorton M. Overview of hereditary angioedema caused by C1-inhibitor deficiency: assessment and clinical management. Eur Ann Allergy Clin Immunol. 2013;7:7–16. [PubMed]

Read Full Post »

Shortened Time for Cell Renewal, Volume 2 (Volume Two: Latest in Genomics Methodologies for Therapeutics: Gene Editing, NGS and BioInformatics, Simulations and the Genome Ontology), Part 2: CRISPR for Gene Editing and DNA Repair

Shortened time for cell renewal

Larry H. Bernstein, MD, FCAP, Curator

LPBI


Accelerated Reprogramming and Gene Editing Protocol Can Make Fixed Cells Much Faster


Simultaneous Reprogramming and Gene Correction of Patient Fibroblasts

Sara E. Howden, John P. Maufort, Bret M. Duffin, Andrew G. Elefanty, Edouard G. Stanley, James A. Thomson
Stem Cell Reports Dec 2015;  5, (6):1109–1118   http://dx.doi.org/10.1016/j.stemcr.2015.10.009
Highlights
  • •Episomal reprogramming system is enhanced by expression of miR302/367
  • •Gene targeting and reprogramming can be combined in a simple one-step procedure
  • •Clonal gene-corrected iPS cell lines can be obtained in as little as 2 weeks


Summary

The derivation of genetically modified induced pluripotent stem (iPS) cells typically involves multiple steps, requiring lengthy cell culture periods, drug selection, and several clonal events. We report the generation of gene-targeted iPS cell lines following a single electroporation of patient-specific fibroblasts using episomal-based reprogramming vectors and the Cas9/CRISPR system. Simultaneous reprogramming and gene targeting was tested and achieved in two independent fibroblast lines with targeting efficiencies of up to 8% of the total iPS cell population. We have successfully targeted the DNMT3B and OCT4 genes with a fluorescent reporter and corrected the disease-causing mutation in both patient fibroblast lines: one derived from an adult with retinitis pigmentosa, the other from an infant with severe combined immunodeficiency. This procedure allows the generation of gene-targeted iPS cell lines with only a single clonal event in as little as 2 weeks and without the need for drug selection, thereby facilitating “seamless” single base-pair changes.

Induced pluripotent stem (iPS) cells, generated by introducing defined factors to reprogram terminally differentiated somatic cells, offer enormous potential for the development of autologous or customized cellular therapies to treat or correct many inherited and acquired diseases (Takahashi et al., 2007, Yu et al., 2007). Complications associated with immunorejection can be avoided through the generation and subsequent disease correction of patient-specific iPS cells, which can be differentiated into relevant cell types for the repopulation and regeneration of a defective tissue or organ. Gene targeting by homologous recombination is the ideal approach for the correction of genetic defects as it enables replacement of the defective allele with a normal functional one without disturbing the remaining genome. The generation of a genetically modified iPS cell line typically involved multiple procedures that required the cells to be in culture for an extensive period, drug selection, and several clonal events (Hockemeyer et al., 2009, Howden et al., 2011, Liu et al., 2011, Zou et al., 2011). In the first step, somatic cells are reprogrammed, and several clones are expanded and characterized. Gene targeting constructs are then introduced, and cells are usually subjected to drug selection to isolate and identify correctly modified iPS cell colonies. Once successfully targeted clones are identified, it is preferable to excise the drug selectable marker, commonly flanked by loxP or FRT sites. Taken together, the multiple steps required for the generation of genetically modified iPS cell lines typically require cells to be in culture for several months, which is not compatible for patients for whom urgent medical intervention is imperative. Furthermore, there is evidence to suggest that increased culture times are associated with undesirable changes in genomic integrity, such as duplications of oncogenic genes (Laurent et al., 2011) and other karyotypic abnormalities (Chen et al., 2008). Here we report that reprogramming and gene targeting can be performed together in a one-step procedure that requires only a single electroporation. Multiple gene-targeted iPS cell clones can be generated from patient cells in as little as 2 weeks, requiring only a single clonal event. The procedure also does not require the use of drug selection and permits the generation of clones that contain “seamless” single base-pair changes, without leaving residual loxP or FRT sites in the host genome.


Large image of Figure 1.

Figure 1

Episomal Reprogramming System Is Enhanced with Inclusion of Plasmid Encoding the miR302/367 Cluster

Reprogramming experiments were performed with and without inclusion of the miR302/367 expression plasmid using a normal male fibroblast line. Data represent an average of three independent experiments ± SD.


We used an enhanced episomal-based reprogramming system to generate iPS cell lines that would eventually be free of vector sequences. In addition to the seven factors (OCT4, SOX2, NANOG, c-MYC, KLF4, LIN28, and the SV40 Large T-Antigen) encoded by the three oriP-based vectors previously reported to induce pluripotency (Yu et al., 2009), we also forced expression of the micro RNA (miR) 302/367 cluster, which is known to facilitate reprogramming and maintenance of pluripotency (Lin et al., 2008, Miyoshi et al., 2011). The inclusion of an additional episomal vector encoding miR 302/367 resulted in a substantial increase (more than 100-fold) in the total number of iPS cell colonies in human fibroblasts (Figure 1). This plasmid was included in all subsequent reprogramming experiments and was necessary to obtain sufficient iPS cell colony numbers when combining gene targeting and reprogramming in a single step.

…….

We have also successfully used our one-step protocol to simultaneously reprogram and genetically correct the disease-causing mutation in the patient fibroblasts, an autosomal dominant C > T transition in exon 42 of the PRPF8gene. This was achieved using a plasmid encoding the Cas9 protein fromS. pyogenes (Mali et al., 2013b), a plasmid encoding a PRPF8-specific sgRNA that binds 33 bp upstream of the disease-causing mutation, and a 184-bp single-stranded oligodeoxynucleotide (ssODN) (Figure 3A). The ssODN was engineered to contain four synonymous mutations to minimize the possibility of Cas9 protein re-cutting following homologous recombination and to aid in the identification of clones that had undergone a gene-targeting event (Figure 3A). Approximately 3 weeks post-transfection, we randomly isolated and expanded a total of 72 iPS cell colonies for further analysis. A PCR product encoding the region of interest was amplified from the genomic DNA of all 72 clones using primers flanking the target site, which was subsequently analyzed by Sanger sequencing. Cas9-induced modification of one or both PRPF8 alleles was observed in 22 (31%) of the clones analyzed, most commonly detected as a nonhomologous end joining (NHEJ) event within the intended cut site. Homologous recombination at the target site could be detected in 6 (8%) clones, as evidenced by the loss of the disease-causing mutation or the presence of one or more synonymous mutations carried by the corrective ssODN (Table 1). Genetic correction of the autosomal dominant patient-specific mutation was observed in 2 clones, while targeting of the wild-type allele was observed in 4 clones. We were unable to determine which allele had undergone gene targeting in 1 clone (P.57) due to a 151-bp deletion spanning the site of the mutation. Surprisingly, 1 clone (P.50) appeared to have undergone bi-allelic homologous recombination, as evidenced by correction of the patient-specific mutation and the presence of ssODN-specific synonymous mutations on both alleles (Figures 3B and 3C). However, this clone also contained a 1-bp deletion approximately 50 bp upstream of the intended site of the Cas9-induced double-stranded break. We hypothesize that this is most likely due to homologous recombination with an incorrectly synthesized ssODN rather than an additional mutation caused by NHEJ, which normally occurs at the site of the double-stranded break.


Table 1Analysis of Gene-Targeted iPS Cell Clones Derived from Patient with Retinitis Pigmentosa
Clone Modification Observed at PRPF8 Target Site (Exon 42)
P.16 no correction of mutation but presence of SM1 and SM2 on mutant allele; wild-type allele unmodified
P.50 one allele contains SMs 1–3; other allele contains SMs 1–4 and 1-bp deletion ≈30 bp upstream of Cas9 target site
P.57 one allele contains SMs 1–3; other allele contains 151-bp deletion (spanning 124 bp downstream and 7 bp upstream of Cas9 target site) and 105-bp insertion
P.71 correction of mutant allele, but no SMs present; wild-type allele has a 2-bp insertion within Cas9 target site
P.72 wild-type allele contains SMs 1–4; mutant allele has 1-bp deletion
P.73 wild-type allele contains SMs 1–3; mutant allele has 2-bp deletion within Cas9 target site

SM, synonymous mutation.


Thumbnail image of Figure 3. Opens large image

http://www.cell.com/cms/attachment/2040890164/2054788036/gr3.jpg

Figure 3

Simultaneous Reprogramming and Genetic Correction of thePRPF8 Gene in Fibroblasts from a Patient with Retinitis Pigmentosa

(A) Schematic diagram of the PRPF8 gene, with mutation in exon 42. The Cas9 target site (red), the patient-specific mutation (blue), and antisense single-stranded DNA template used for gene repair are shown.

(B) Sequencing analysis of exon 42 of the PRPF8 gene in the genomic DNA from uncorrected patient-specific iPS cells. Both wild-type and mutant alleles are shown.

(C) Sequencing analysis of genomic DNA from a single iPS cell clone following successful simultaneous reprogramming and genetic correction of patient-specific fibroblasts. Both alleles appear to have undergone homologous recombination with the corrective ssODN as evidenced by the presence of the ssODN-specific synonymous mutations (SM 1-4) on both alleles. One allele also has a single base-pair deletion, which is most likely caused by an ssODN that was incorrectly synthesized. The location of the patient-specific mutation and synonymous mutations introduced by the repair ssODN are marked by black boxes.


Next we attempted to correct the disease-causing mutation in a fibroblast line isolated from an infant with severe combined immunodeficiency (SCID), caused by mutations in the gene encoding adenosine deaminase (ADA). SCID patients could particularly benefit from a one-step protocol that facilitates the expedited generation of gene-corrected iPS cells because without early intervention, such as a bone marrow transplant, patients typically die within the first 1 to 2 years of life. We first attempted to simultaneously reprogram and target DNMT3B in ADA-SCID fibroblasts and identified one EGFP-expressing colony (0.9%) out of a total of 108 iPS cell colonies (Figure S2). PCR analysis confirmed targeting of theDNMT3B locus (see Figure 2E). We next attempted to simultaneously reprogram and correct one of the disease-causing mutations in the ADA-SCID fibroblasts using our one-step protocol. The fibroblasts were derived from a patient who is a compound heterozygote: one allele has a C > T transition in exon 11 of the ADAgene (1,081C > T), and the second allele has an A > G transition in the 3-prime splice site of intron 3, resulting in a deletion of exon 4 from mature mRNA. We chose to correct the C > T transition in exon 11 using an sgRNA specific to the mutant, but not wild-type, exon 11 sequence of the ADA gene (Figure 4A). We hypothesized that this would minimize Cas9 cutting in both alleles, as seen in the majority of the PRPF8 gene-targeted iPS cell lines, where only 1 out of the 6 clones did not have a second allele modified, either by NHEJ or a second homologous recombination event. To facilitate gene correction we used a 175-bp single-stranded corrective ssODN, which was engineered to contain a single synonymous mutation within the Cas9 target site (Figure 4A). A total of 55 colonies were expanded and screened, with Cas9-induced modification of ADAexon 11 observed in 20 (36%) clones, as determined by Sanger sequencing of a 1.4-kb PCR product amplified from genomic DNA using primers flanking the target site. Gene targeting was detected in 3 (5%) clones, as evidenced by the loss of the disease-causing mutation and the presence of the synonymous mutation carried by the corrective ssODN. Genetic correction of the patient-specific mutation in exon 11 was observed in all three clones, without modification of the second allele, indicating that Cas9 preferentially favored the mutant exon 11 sequence (over wild-type). ……


Thumbnail image of Figure 4. Opens large image

http://www.cell.com/cms/attachment/2040890164/2054788039/gr4.jpg

Figure 4

Simultaneous Reprogramming and Genetic Correction of ADA-SCID Fibroblasts

(A) Schematic diagram of the ADA gene, with mutation in exon 11. The Cas9 target site (red), the patient-specific mutation (blue), and antisense single-stranded DNA template used for gene repair are shown.

(B) Sequencing analysis of exon 11 of the ADA gene in the genomic DNA of an uncorrected and two gene-corrected iPS cell lines derived from ADA-SCID fibroblasts. One of the gene-corrected lines (clone Bb) was also found to carry a G > A transition approximately 35 bp downstream of the intended DNA double-stranded break, and most likely introduced by an incorrectly synthesized ssODN.

(C) Sequencing analysis of the ADA transcript amplified from the cDNA of an uncorrected and two gene-corrected iPS cell lines. The location of the patient-specific mutation, synonymous mutation, and G > A transition introduced by the repair ssODN are marked by black boxes.

……….


We have demonstrated the feasibility of performing reprogramming and gene correction together in a simple one-step procedure that enables the generation of multiple gene-corrected and uncorrected iPS cell lines in as little as 2 weeks, requiring considerably less time and resources compared to conventional multi-step protocols that can take several months to complete. In a therapeutic context this should facilitate transplantation medicine by making gene-corrected cells available to patients in a more timely manner, while potentially minimizing the risks associated with extended cell culture, drug selection, and multiple clonal events. In addition, we anticipate that comparisons between corrected and matched uncorrected control iPS cell lines generated from a single experiment will also be extremely useful for disease modeling and understanding the underlying molecular mechanisms governing disease, because any observed differences between corrected and uncorrected cells can be attributed to the patient-specific mutation rather than differences in genetic background.

However, it is important to note that a number of studies have demonstrated that iPS cell lines derived from skin biopsies typically harbor a unique subset of de novo genetic abnormalities, either in the form of copy-number variation or single base-pair changes (Abyzov et al., 2012, Gore et al., 2011) and that iPS cell lines generated from the same parental line can vary significantly with respect to whole-genome gene expression in the differentiated state (Reinhardt et al., 2013). Nonetheless, it is reasonable to expect that the confounding effects arising from the variations that exist across different iPS cell clones may be minimized by comparing multiple gene-corrected or gene-targeted clones with multiple uncorrected clones. In this regard a consistent difference that is observed exclusively in the corrected versus uncorrected lines can most likely be attributed to the patient-specific mutation rather than variations that may exist from one clone to the next. In the current study we routinely observed targeting efficiencies of > 5%, enabling the generation of multiple gene-targeted and “matched” uncorrected clones from a single experiment.


Read Full Post »

von Willebrand Factor

Larry H. Bernstein, MD, FCAP, Curator

LPBI


FDA approves first recombinant von Willebrand factor to treat bleeding episodes

Dr. Anthony Melvin Castro


12/08/2015 02:44
The U.S. Food and Drug Administration today approved Vonvendi, von Willebrand factor (Recombinant), for use in adults 18 years of age and older who have von Willebrand disease (VWD). Vonvendi is the first FDA-approved recombinant von Willebrand factor, and is approved for the on-demand (as needed) treatment and control of bleeding episodes in adults diagnosed with VWD.
Company Baxalta Inc.
Description Recombinant human von Willebrand factor (vWF)
Molecular Target von Willebrand factor (vWF)
Mechanism of Action
Therapeutic Modality Biologic: Protein
Latest Stage of Development Registration
Standard Indication Bleeding
Indication Details Treat and prevent bleeding episodes in von Willebrand disease (vWD) patients; Treat von Willebrand disease (vWD)
Regulatory Designation U.S. – Orphan Drug (Treat and prevent bleeding episodes in von Willebrand disease (vWD) patients);
EU – Orphan Drug (Treat and prevent bleeding episodes in von Willebrand disease (vWD) patients);
Japan – Orphan Drug (Treat and prevent bleeding episodes in von Willebrand disease (vWD) patients)


The U.S. Food and Drug Administration today approved Vonvendi, von Willebrand factor (Recombinant), for use in adults 18 years of age and older who have von Willebrand disease (VWD). Vonvendi is the first FDA-approved recombinant von Willebrand factor, and is approved for the on-demand (as needed) treatment and control of bleeding episodes in adults diagnosed with VWD.

VWD is the most common inherited bleeding disorder, affecting approximately 1 percent of the U.S. population. Men and women are equally affected by VWD, which is caused by a deficiency or defect in von Willebrand factor, a protein that is critical for normal blood clotting. Patients with VWD can develop severe bleeding from the nose, gums, and intestines, as well as into muscles and joints. Women with VWD may have heavy menstrual periods lasting longer than average and may experience excessive bleeding after childbirth.

“Patients with heritable bleeding disorders should meet with their health care provider to discuss appropriate measures to reduce blood loss,” said Karen Midthun, M.D., director of the FDA’s Center for Biologics Evaluation and Research. “The approval of Vonvendi provides an additional therapeutic option for the treatment of bleeding episodes in patients with von Willebrand disease.”

The safety and efficacy of Vonvendi were evaluated in two clinical trials of 69 adult participants with VWD. These trials demonstrated that Vonvendi was safe and effective for the on-demand treatment and control of bleeding episodes from a variety of different sites in the body. No safety concerns were identified in the trials. The most common adverse reaction observed was generalized pruritus (itching).

The FDA granted Vonvendi orphan product designation for these uses.Orphan product designation is given to drugs intended to treat rare diseases in order to promote their development.

Vonvendi is manufactured by Baxalta U.S., Inc., based in Westlake Village, California.


von Willebrand Disease

Author: Eleanor S Pollak; Chief Editor: Srikanth Nagalla

Von Willebrand disease (vWD) is a common, inherited, genetically and clinically heterogeneous hemorrhagic disorder caused by a deficiency or dysfunction of the protein termed von Willebrand factor (vWF). Consequently, defective vWF interaction between platelets and the vessel wall impairs primary hemostasis.

vWF, a large, multimeric glycoprotein, circulates in blood plasma at concentrations of approximately 10 mg/mL. In response to numerous stimuli, vWF is released from storage granules in platelets and endothelial cells. It performs two major roles in hemostasis. First, it mediates the adhesion of platelets to sites of vascular injury. Second, it binds and stabilizes the procoagulant protein factor VIII (FVIII). (See Etiology.)

vWD is divided into three major categories: (1) partial quantitative deficiency (type I), (2) qualitative deficiency (type II), and (3) total deficiency (type III). vWD type II is further divided into four variants (IIA, IIB, IIN, IIM), based on characteristics of dysfunctional vWF. These categories correspond to distinct molecular mechanisms, with corresponding clinical features and therapeutic recommendations.

For discussion of vWD in children, see Pediatric Von Willebrand Disease.

http://emedicine.medscape.com/article/206996-overview


Read Full Post »

Rhodopsin role in ciliary trafficking

Jillian N Pearring
Department of Ophthalmology, Duke University School of Medicine, Durham, United States
No competing interests declared

” data-author-inst=”DukeUniversitySchoolofMedicineUnitedStates”>Jillian N Pearring, 

William J Spencer
Department of Ophthalmology, Duke University School of Medicine, Durham, United States
No competing interests declared

” data-author-inst=”DukeUniversitySchoolofMedicineUnitedStates”>William J Spencer, 

Eric C Lieu
Department of Ophthalmology, Duke University School of Medicine, Durham, United States
No competing interests declared

” data-author-inst=”DukeUniversitySchoolofMedicineUnitedStates”>Eric C Lieu, 

Vadim Y Arshavsky
Department of Ophthalmology, Duke University School of Medicine, Durham, United States
For correspondence: vadim.arshavsky@duke.edu
No competing interests declared

” data-author-inst=”DukeUniversitySchoolofMedicineUnitedStates”>Vadim Y Arshavsky
eLife 2015;10.7554/eLife.12058   http://dx.doi.org/10.7554/eLife.12058

Sensory cilia are populated by a select group of signaling proteins that detect environmental stimuli. How these molecules are delivered to the sensory cilium and whether they rely on one another for specific transport remains poorly understood. Here, we investigated whether the visual pigment, rhodopsin, is critical for delivering other signaling proteins to the sensory cilium of photoreceptor cells, the outer segment. Rhodopsin is the most abundant outer segment protein and its proper transport is essential for formation of this organelle, suggesting that such a dependency might exist. Indeed, we demonstrated that guanylate cyclase-1, producing the cGMP second messenger in photoreceptors, requires rhodopsin for intracellular stability and outer segment delivery. We elucidated this dependency by showing that guanylate cyclase-1 is a novel rhodopsin-binding protein. These findings expand rhodopsin’s role in vision from being a visual pigment and major outer segment building block to directing trafficking of another key signaling protein.


Photoreceptor cells transform information entering the eye as photons into patterns of neuronal electrical activity. This transformation takes place in the sensory cilium organelle, the outer segment. Outer segments are built from a relatively small set of structural and signaling proteins, including components of the classical GPCR phototransduction cascade. Such a distinct functional and morphological specialization allow outer segments to serve as a nearly unmatched model system for studying general principles of GPCR signaling (Arshavsky et al., 2002) and, in more recent years, a model for ciliary trafficking (Garcia-Gonzalo and Reiter, 2012; Nemet et al., 2015; Pearring et al., 2013; Schou et al., 2015; Wang and Deretic, 2014). Despite our deep understanding of visual signal transduction, little is known how the outer segment is populated by proteins performing this function. Indeed, nearly all mechanistic studies of outer segment protein trafficking were devoted to rhodopsin (Nemet et al., 2015; Wang and Deretic, 2014), which is a GPCR visual pigment comprising the majority of the outer segment membrane protein mass (Palczewski, 2006). The mechanisms responsible for outer segment delivery of other transmembrane proteins remain essentially unknown. Some of them contain short outer segment targeting signals, which can be identified through site-specific mutagenesis (Deretic et al., 1998; Li et al., 1996; Pearring et al., 2014; Salinas et al., 2013; Sung et al., 1994; Tam et al., 2000; Tam et al., 2004). A documented exception is retinal guanylate cyclase 1 (GC-1), whose exhaustive mutagenesis did not yield a distinct outer segment targeting motif (Karan et al., 2011).

GC-1 is a critical component of the phototransduction machinery responsible for synthesizing the second messenger, cGMP (Wen et al., 2014). GC-1 is the only guanylate cyclase isoform expressed in the outer segments of cones and the predominant isoform in rods (Baehr et al., 2007; Yang et al., 1999). GC-1 knockout in mice is characterized by severe degeneration of cones and abnormal light-response recovery kinetics in rods (Yang et al., 1999). Furthermore, a very large number of GC-1 mutations found in human patients cause one of the most severe forms of early onset retinal dystrophy, called Leber’s congenital amaurosis (Boye, 2014; Kitiratschky et al., 2008). Many of these mutations are located outside the catalytic site of GC-1, which raises great interest to understanding the mechanisms of its intracellular processing and trafficking.

In this study, we demonstrate that, rather than relying on its own targeting motif, GC-1 is transported to the outer segment in a complex with rhodopsin. We conducted a comprehensive screen of outer segment protein localization in rod photoreceptors of rhodopsin knockout (Rho-/- ) mice and found that GC-1 was the only protein severely affected by this knockout. We next showed that this unique property of GC-1 is explained by its interaction with rhodopsin, which likely initiates in the biosynthetic membranes and supports both intracellular stability and outer segment delivery of this enzyme. These findings explain how GC-1 reaches its specific intracellular destination and also expand the role of rhodopsin in supporting normal vision by showing that it guides trafficking of another key phototransduction protein.


GC-1 is the outer segment-resident protein severely down-regulated in rhodopsin knockout rods

GC-1 stability and trafficking require the transmembrane core of rhodopsin but not its outer 119 segment targeting domain

GC-1 is a rhodopsin-interacting protein


The findings reported in this study expand our understanding of how the photoreceptor’s sensory cilium is populated by its specific membrane proteins. We have found that rhodopsin serves as an interacting partner and a vehicle for ciliary delivery of a key phototransduction protein, GC-1. This previously unknown function adds to the well-established roles of rhodopsin as a GPCR visual pigment and a major building block of photoreceptor membranes. We further showed that GC-1 is unique in its reliance on rhodopsin, as the other nine proteins tested in this study were expressed in significant amounts and faithfully localized to rod outer segments in the absence of rhodopsin.

Our data consolidate a number of previously published observations, including a major puzzle related to GC-1: the lack of a distinct ciliary targeting motif encoded in its sequence. The shortest recombinant fragment of GC-1 which localized specifically to the outer segment was found to be very large and contain both transmembrane and cytoplasmic domains (Karan et al., 2011). Our study shows that GC-1 delivery requires rhodopsin and, therefore, can rely on specific targeting information encoded in the rhodopsin molecule. Interestingly, we also found that this information can be replaced by an alternative ciliary targeting sequence from a GPCR not endogenous to photoreceptors. This suggests that the functions of binding/stabilization of GC-1 and ciliary targeting are performed by different parts of the rhodopsin molecule. Our findings also shed new light on the report that both rhodopsin and GC-1 utilize intraflagellar transport (IFT) for their ciliary trafficking and co-precipitate with IFT proteins (Bhowmick et al., 2009). The authors hypothesized that GC-1 plays a primary role in assembling cargo for the IFT particle bound for ciliary delivery. Our data suggest that it is rhodopsin that drives this complex, at least in photoreceptor cells where these proteins are specifically expressed. Unlike GC-1’s reliance on rhodopsin for its intracellular stability or outer segment trafficking, rhodopsin does not require GC-1 as its expression level and localization remain normal in rods of GC-1 knockout mice ((Baehr et al., 2007) and this study). The outer segment trafficking of cone opsins is not affected by the lack of GC-1 either (Baehr et al., 2007; Karan et al., 2008), although GC-1 knockout cones undergo rapid degeneration, likely because they do not express GC-2 – an enzyme with redundant function. The primary role of rhodopsin in guiding GC-1 to the outer segment is further consistent with rhodopsin directly interacting with IFT20, a mobile component of the IFT complex responsible for recruiting IFT cargo at the Golgi network (Crouse et al., 2014; Keady et al., 2011).

It was also reported that GC-1 trafficking requires participation of chaperone proteins, most importantly DnaJB6 (Bhowmick et al., 2009). Our data suggest that GC-1 interaction with DnaJB6 is transient, most likely in route to the outer segment, since we were not able to co-precipitate DnaJB6 with GC-1 from whole retina lysates (Figure 5). In contrast, the majority of GC-1 co-precipitates with rhodopsin from these same lysates, suggesting that these proteins remain in a complex after being delivered to the outer segment. Although our data do not exclude that the mature GC-1-rhodopsin complex may contain additional protein component(s), our attempts to identify such components by mass spectrometry have not yielded potential candidates.

Interestingly, GC-1 was previously shown to stably express in cell culture where it localizes to either ciliary or intracellular membranes (Bhowmick et al., 2009; Peshenko et al., 2015). This strikes at the difference between the composition of cellular components supporting membrane protein stabilization and transport in cell culture models versus functional photoreceptors. The goal of future experiments is to determine whether these protein localization patterns would be affected by co-expressing GC-1 with rhodopsin, thereby gaining further insight into the underlying intracellular trafficking mechanisms.

Finally, GC-1 trafficking was reported to depend on the small protein, RD3, thought to stabilize both guanylate cyclase isoforms, GC-1 and GC-2, in biosynthetic membranes (Azadi et al., 2010; Zulliger et al., 2015). In the case of GC-1, this stabilization would be complementary to that by rhodopsin and potentially could take place at different stages of GC-1 maturation and trafficking in photoreceptors. Another proposed function of RD3 is to inhibit the activity of guanylate cyclase isoforms outside the outer segment in order to prevent undesirable cGMP synthesis in other cellular compartments (Peshenko et al., 2011a).

In summary, this study explains how GC-1 reaches its intracellular destination without containing a dedicated targeting motif, expands our understanding of the role of rhodopsin in photoreceptor biology and extends the diversity of signaling proteins found in GPCR complexes to a member of the guanylate cyclase family. Provided that the cilium is a critical site of GPCR signaling in numerous cell types (Schou et al., 2015), it would be interesting to learn whether other ciliary GPCRs share rhodopsin’s ability to stabilize and deliver fellow members of their signaling pathways


Like this:

Read Full Post »

Targeting Neuronal Cell Growth

Targeting Neuronal Cell Growth

Larry H. Bernstein, MD, FCAP, Curator

LPBI


Remote Mind Control

Using chemogenetic tools to spur the brain into action

By Kelly Rae Chi | November 1, 2015     http://www.the-scientist.com//?articles.view/articleNo/44321/title/Remote-Mind-Control/

http://www.the-scientist.com/November2015/LT_2_opener.jpg

A MATTER OF TIME: Optogenetics methods, which work on the millisecond timescale, allow for the finest level of temporal control over neuron excitation and inhibition. The chemogenetic tools, DREADDs and PSAMs-PSEMs, are ideal for the study of longer-lasting behaviors such as appetite, thirst, or anxiety because they work over a scale of the minutes-to-hours. The receptors are incorporated into specific neurons or cells using viruses. Ligands—CNO or salvinorin B (for DREADD receptors) or PSEMs—are administered via injection or drinking water. Both receptors and ligands are orthogonal, meaning they do not bind to anything else in the body.
REDRAWN WITH PERMISSION OF SCOTT STERNSON FROM SCIENCE, 333:1292, 2011; NEUROENDOCRINOLOGY, 100:98, 2014

In a pharmacology lab at the University of North Carolina at Chapel Hill, doctoral student Reid Olsen, working with brain tissue harvested from a mouse just a few hours earlier, readies half a dozen dime-size slices for live calcium imaging. This mouse’s brain contains a genetically engineered receptor that Olsen has targeted to cells thought to control the making of new neurons in adult mice. He is about to use a synthetic drug to activate this receptor in the tissue. When it indeed works—just as he has predicted—he turns his attention to attempting to stimulate neurogenesis in a freely moving mouse that has the same engineered receptors in its brain.

Less than a decade ago, such precise control over neuronal activity in a dish, let alone in a living brain, was impossible. The drugs available to repress neurons or encourage them to fire would produce off-target effects or eliminate cell populations indiscriminately.

Working in the lab of Juan Song, Olsen is using a “designer receptor exclusively activated by a designer drug,” or DREADD. These modified G protein–coupled receptors (GPCRs) are usually either virally administered or bred into animals, then activated by a specific ligand that’s either injected or taken orally. Both the receptor and the ligand are designed to be orthogonal, effectively meaning they bind to each other but to nothing else.

Along with DREADDs, recently developed orthogonal ligand-gated ion channels called “pharmacologically selective actuator molecules” and “pharmacologically selective effector molecules” (PSAMs-PSEMs), are allowing researchers to dial up or dial down neuronal activity in living animals, with the goal of clarifying the brain wiring that controls appetite, thirst, anxiety, and many other behaviors.

Along with DREADDs, recently developed orthogonal ligand-gated ion channels called “pharmacologically selective actuator molecules” and “pharmacologically selective effector molecules” (PSAMs-PSEMs), are allowing researchers to dial up or dial down neuronal activity in living animals, with the goal of clarifying the brain wiring that controls appetite, thirst, anxiety, and many other behaviors.

“[DREADDs and PSAMs–PSEMs] are completely complementary methods, and they can in principle be used together in the same animal.—Scott Sternson, HHMI Janelia Research Campus”

These are not the only so-called chemical genetic, or “chemogenetic,” tools for controlling cells. Orthogonal kinases have been used in the brain to deduce the mechanisms underlying epilepsy, memory, and neuronal development. And inducible genetic systems, now in wide use for two decades—for example, tetracycline-dependent transcriptional promoters—are incredibly powerful for expressing specific genes at a particular point in an animal’s development, says Bruce Conklin, senior investigator at the University of California, San Francisco–affiliated Gladstone Institute of

Cardiovascular Disease, whose group pioneered the development of engineered GPCRs. At the other extreme of temporal control from inducible genetic systems, optogenetics—a set of methods that use light to activate genetically encoded opsins—is widely used for controlling brain cells on the millisecond time scale in vivo.

As tools, DREADDs and PSAMs-PSEMs allow control of neuronal activity over a middle ground—from minutes to hours. “These are the time scales that are most useful, in my opinion, for neurobiology experiments,” says Scott Sternson of the Howard Hughes Medical Institute’s Janelia Research Campus in Ashburn, Virginia, who has developed PSAMs-PSEMs but who also regularly uses DREADDs and optogenetics. (For a review, see Ann Rev Neurosci, 37:387-407, 2014.)

The Scientist talked to developers about the basics behind DREADDs and PSAMs-PSEMs. Here’s what they said.

DREADDs and PSAMs-PSEMs: A history

In 1991, scientists showed that engineering orthogonal GPCRs was possible, and first iterations of such tools, dubbed “receptor activated solely by a synthetic ligand”  or RASSLs, came onto the scene in 1998.

Bryan Roth, of the UNC School of Medicine, made the second generation of RASSLs, which he called DREADDs, using an engineered muscarinic GPCR and, importantly, a ligand that was chemically inert (PNAS, 104:5163-68, 2007). Since the publication of that first paper on DREADDs, hundreds of labs have administered them in vivo, Roth says. This chemical genetic technique has the advantage of being easier to implement and less invasive than optogenetics, he adds.

Ligand-gated ion channel–based chemical genetic tools have their own history, but were not used in vivo in animals until 2011, when Sternson developed PSAMs-PSEMs. The researchers mutated ligand-binding domains and mixed and matched them to different ion-pore domains. But they altered the receptors and their ligands further so that they don’t interact with anything in the body. “As I was thinking about that system, I imagined I would want it to have easily optimizable, nontoxic ligands and the ability to tune the ion[-pore] or ligand-binding domain easily,” Sternson says.

DREADDs and PSAM-PSEM combinations in action

There are five different classes of DREADDs available, each designed for a different purpose:

The synthetic ligand for each of the first four DREADDs is clozapine-N-oxide (CNO), whereas KORDs are activated by salvinorin B. That means combining DREADDs is now possible: Roth’s group showed recently that they could insert the hM3Dq and KORD to be able to activate and silence the same neurons (Neuron, 86:936-46, 2015).

Roth’s lab has also made light-activated (photocaged) CNO, which allows for more-precise control over the timing of DREADD receptor activation. He has not published any papers using this yet, but will provide the caged ligand to interested researchers upon request. To make use of photocaged CNO, however, you will need to surgically implant an optic cable to provide light to the brain region of interest. If you’re going to go to the trouble, you might consider optogenetics, Roth adds.

Scientists have paired different PSAMs with various ion channels and PSEMs in order to control neurons. Among the most popular:

When to opt for optogenetics

The single biggest consideration in your choice of, and among, these technologies is the temporal control needed for your experiment. Optogenetics, for example, offers the finest level of control, on the order of milliseconds to seconds. If you’re examining decision-making behaviors, for example, then optogenetics (or electrical stimulation) is for you.

If you’re studying behaviors—such as eating or drinking—or physiological changes that occur over minutes to hours, then either optogenetics, chemogenetics, or both might work.

For long-lasting behaviors being measured over the course of hours to days, a chemogenetic approach such as DREADDs or PSAMs-PSEMs is the clear winner. The ligands linger longer than short light pulses and can even be dissolved into the animals’ drinking water. The chemogenetic approach is also superior for investigating larger swaths of brain, which are challenging to illuminate using optogenetics methods, Roth says.

Researchers have also successfully combined the approaches, typically using an optogenetic approach to turn on neurons and chemogenetic approaches to switch them off in the same animal. The inhibitory DREADD hM4Di targets presynaptic terminals, which could be especially helpful if you’re investigating a region of the brain where long-range projection neurons terminate.

Use DREADDs or PSAMs-PSEMs first?

TWOFERS: In 2015, researchers announced a new DREADD: KORD. Because it is activated by a different ligand than the one for previously developed DREADDs, the engineered receptors can now be combined in the same animal. BRYAN ROTH

Researchers tend to start with DREADDs simply because they have been around longer, Sternson says. But some will turn to PSAMs if DREADDs have been ineffective. “Most cell types will respond to [DREADDs] as they’re supposed to, but not all,” Sternson says. That’s because DREADDs tap into a complex signaling pathway that eventually results in neuronal activation or silencing. In contrast, PSAMs work by controlling the gating of an ion channel. On the other hand, ligand-gated ion channels may affect some types of cells, such as developing neurons, differently than they do adult cells, says Olsen, who coauthored the Neuronpaper describing KORD, the newest DREADD. But in general, Sternson says, “they’re completely complementary methods, and they can in principle be used together in the same animal.”

Another consideration is that PSEMs tend to take slightly longer to work—15 minutes, compared with the DREADD ligand CNO, which takes 5–10 minutes. On the other hand, PSEMs tend to take less time to clear from the body, 1–2 hours (vs. about 2 hours for CNO). Salvinorin B, the ligand of the new KOR-based DREADD, works almost instantaneously, and the effects last less than an hour. Although these differences are minor, they may factor into your experiment.

Experimental procedure

The operational steps are similar for both tools. Most people inject viruses carrying the engineered receptors into the brain area of interest and wait two to three weeks for expression. They then administer the ligand and make their measurements.
If you’ve already performed stereotactically guided brain surgery, there’s nothing new to learn. For newcomers, a Journal of Visualized Experiments protocol describes the surgery and injection of the virally ferried chemogenetic tools (100:e52859, 2015), though it’s best to learn by shadowing someone with experience, Roth says.

Viral constructs for both DREADDs and PSAMs are available from Addgene. For DREADDs, the UNC Vector Core sells high-titer virus stocks. CNO is available for free or at a reduced price for NIH-funded investigators through the National Institute of Drug Abuse’s Drug Supply Program. For PSAMs, you make your own receptor-carrying virus. Sternson provides PSEMs to researchers for their pilot experiments, and they are available for purchase through Apex Scientific for about $15 for 10 mg, he says.

You don’t necessarily need to do surgery if you can afford mutant mice whose DREADDs are under the control of an inducible promoter, such as Cre. Such mice are available through Jackson Labs. In general, just be sure to use validated Cre driver lines, Roth says.

You should make sure the receptor is expressed and working in vitro before you move to whole animals. Expression of both DREADDs and PSAMs is linked to the translation of a fluorescent protein. On his blog, chemogenetic.blogspot.com, Roth gives more specific advice on immunofluorescent staining for visualization of DREADDs.

To make sure that the receptors are actually working involves more-detailed studies, such as the calcium imaging Olsen used to ascertain whether his activating DREADD responded to the ligand, or electrophysiological studies in slices, but the particulars depend on what mechanism your receptor-ligand uses.

“One thing that’s important to know when using these receptors is that they’re not completely off when expressed at high levels,” Conklin says, referring to DREADDs. “[Simply] by expressing them, one cannot be sure.” To get around potential abnormal background activity, you have to include a control without the receptor. Also, having a good label on the receptor is helpful. Using DREADDs in combination with an inducible transcription system, such as Cre, allows you to measure receptor expression before and after inducing it.

Future uses

Although DREADDs and PSAMs-PSEMs are proving to be useful research tools for cell biologists and neurobiologists, both Roth and Sternson are actively developing orthogonal systems for potential clinical use, either as gene-based therapies that would go directly into humans or to be used in stem cell–based therapies.


Chemogenetic tools to interrogate brain functions.

Annu Rev Neurosci. 2014;37:387-407. doi: 10.1146/annurev-neuro-071013-014048. Epub 2014 Jun 16.

Elucidating the roles of neuronal cell types for physiology and behavior is essential for understanding brain functions. Perturbation of neuron electrical activity can be used to probe the causal relationship between neuronal cell types and behavior. New genetically encoded neuron perturbation tools have been developed for remotely controlling neuron function using small molecules that activate engineered receptors that can be targeted to cell types using genetic methods. Here we describe recent progress for approaches using genetically engineered receptors that selectively interact with small molecules. Called “chemogenetics,” receptors with diverse cellular functions have been developed that facilitate the selective pharmacological control over a diverse range of cell-signaling processes, including electrical activity, for molecularly defined cell types. These tools have revealed remarkably specific behavioral physiological influences for molecularly defined cell types that are often intermingled with populations having different or even opposite functions.


A Method for Remotely Silencing Neural Activity in Rodents During Discrete Phases of Learning.

J Vis Exp. 2015 Jun 22;(100):e52859. doi: 10.3791/52859.

This protocol describes how to temporarily and remotely silence neuronal activity in discrete brain regions while animals are engaged in learning and memory tasks. The approach combines pharmacogenetics (Designer-Receptors-Exclusively-Activated-by-Designer-Drugs) with a behavioral paradigm (sensory preconditioning) that is designed to distinguish between different forms of learning. Specifically, viral-mediated delivery is used to express a genetically modified inhibitory G-protein coupled receptor (the Designer Receptor) into a discrete brain region in the rodent. Three weeks later, when designer receptor expression levels are high, a pharmacological agent (the Designer Drug) is administered systemically 30 min prior to a specific behavioral session. The drug has affinity for the designer receptor and thus results in inhibition of neurons that express the designer receptor, but is otherwise biologically inert. The brain region remains silenced for 2-5 hr (depending on the dose and route of administration). Upon completion of the behavioral paradigm, brain tissue is assessed for correct placement and receptor expression. This approach is particularly useful for determining the contribution of individual brain regions to specific components of behavior and can be used across any number of behavioral paradigms.
It is important to indicate that after the protein has being made it acts in fast form (milliseconds etc,) as protein do…

Read Full Post »

Telomere length

Telomere length

Larry H. Bernstein, MD, FCAP, Curator

LPBI


New Enzyme Discovered for Sustaining Telomere Length

http://www.genengnews.com/gen-news-highlights/new-enzyme-discovered-for-sustaining-telomere-length/81251981/


http://www.genengnews.com/Media/images/GENHighlight/Picture18124516425.jpg

Researchers developed a novel assay to identify telomere length regulators and showed that ATM inhibition shortens telomeres, whereas ATM activation elongates telomeres. [Lee et al., 2015, Cell Reports 13, 1–10]


In the early years of molecular biology research, scientists studying chromosomal structure and composition noticed that the terminal ends of chromosomes, called telomeres, would gradually become shorter with each successive round of cellular replication. This process would continue until the chromosome reached a certain length, ultimately becoming unstable and causing the cell to die. Conversely, the scientists noticed that for certain genetic disorders, such as cancer, an abnormally long telomere length led to genome anomalies that were closely associated with the cancer phenotype.

In 1984, researchers Elizabeth Blackburn, Ph.D., and Carol Greider, Ph.D., who was at the time a graduate student in Dr. Blackburn’s laboratory, discovered the telomerase enzyme, which was responsible for maintaining the appropriate length of telomerase after chromosomal replication. Drs. Blackburn and Greider would go on to be awarded the 2009 Nobel Prize in Physiology and Medicine, along with Jack Szostak, Ph.D. for their work on molecular mechanisms of the telomerase enzyme.

Yet, even during their seminal work, the investigators quickly realized that other molecules besides telomerase must be involved in maintaining the protective caps at the end of chromosomes. Now, researchers at Johns Hopkins report uncovering the role of an additional enzyme crucial to telomere length and say the novel method they could be used to speed discovery of other proteins and processes that are involved in telomere stability.

“We’ve known for a long time that telomerase doesn’t tell the whole story of why chromosomes’ telomeres are a given length, but with the tools we had, it was difficult to figure out which proteins were responsible for getting telomerase to do its work,” explained Dr. Greider, professor, and director of molecular biology and genetics in the Johns Hopkins Institute for Basic Biomedical Sciences.

The findings from this study were published recently in Cell Reports through an article entitled “ATM Kinase Is Required for Telomere Elongation in Mouse and Human Cells.”

Understanding the mechanisms that are needed to lengthen telomeres has broad health implications, since shortened telomeres have been implicated in aging and diseases as diverse as lung and bone marrow disorders, while overly long telomeres are linked to cancer. Cells need a well-tuned process to keep adding the right number of building blocks back onto telomeres over an organism’s lifetime.

Unfortunately, until recently, the methods researchers used to study telomere length were extremely time-consuming, often taking months of work to study cells grown in vitro, searching for detectable differences in telomere length. However, Dr. Greider’s team developed a new tool for measuring telomere length in yeast. The idea was to artificially cut mammalian cells’ telomeres and then detect elongation by telomerase—a test that would take less than a day, and could be performed even if the blocked proteins were needed for cells to divide.

The new test, dubbed addition of de novo initiated telomeres (ADDIT) was used to observe an enzyme long suspected to be involved in telomere maintenance, ATM kinase. “ATM kinase was known to be involved in DNA repair, but there were conflicting reports about whether it had a role in telomere lengthening,” noted Dr. Greider.

The Hopkins researchers blocked the enzyme in lab-grown mouse cells and used ADDIT to find that it was indeed needed to lengthen telomeres. They confirmed their result by using the old, three-month-long telomere test, which lead to the same outcome.

Additionally, the team also found that in normal mouse cells, a drug that blocks an enzyme called PARP1 would activate ATM kinase and spur telomere lengthening. This finding has the potential to impact drug-based telomere elongation for treating short-telomere diseases, such as bone marrow failure.

Dr. Greider and her team were excited by their findings and plan to use ADDIT to find out more about the telomere-lengthening biochemical pathway that ATM kinase participates.

“The potential applications are very exciting,” stated lead author Stella Lee, Ph.D., postdoctoral fellow in Dr. Greider’s laboratory. “Ultimately ADDIT can help us understand how cells strike a balance between aging and the uncontrolled cell growth of cancer, which is very intriguing.”


Nobel Laureate Blackburn Named Salk Institute’s New President


Elizabeth H. Blackburn, Ph.D., a 2009 Nobel laureate who has specialized in telomere and telomerase research, was named the new president of the Salk Institute for Biological Studies today, effective January 1, 2016.

“The Salk is full of absolutely terrific people and brimming with great science. Building on its distinguished history and current success, I am delighted to be playing a role in continuing and growing its major contributions to science and health research,” Dr. Blackburn said in a statement. “I am truly honored to be asked to be the next president of the Salk Institute.”

Dr. Blackburn has been a non-resident fellow at the institute since 2001, where she has been one of a group of investigators that advise the institute’s leadership and play key decision-making roles in appointing and promoting Salk professors. In addition, she has been the Morris Herzstein Professor of Biology and Physiology in the department of biochemistry and biophysics at the University of California San Francisco (UCSF).

In 2009, she was named one of three co-winners of the Nobel Prize in Physiology or Medicine “for the discovery of how chromosomes are protected by telomeres and the enzyme telomerase.” Dr. Blackburn discovered the molecular nature of telomeres—the ends of eukaryotic chromosomes that serve as protective caps essential for preserving the genetic information—and co-discovered the ribonucleoprotein enzyme telomerase.

Those discoveries helped launch new research around telomeres and telomerase, both believed to play central roles in aging and diseases that include cancer.

In addition to the Nobel Prize, Dr. Blackburn has received nearly every major award in science, including the Lasker, Gruber, and Gairdner prizes. In 2007, she was named to the TIME 100 yearly list of the world’s most influential people. Dr. Blackburn is also a member of the National Academy of Sciences, the National Academy of Medicine, and the Royal Society of London.

Dr. Blackburn was born in Hobart, Tasmania, Australia, to a family of doctors and scientists. Her parents were both family physicians, while her grandfather and great-grandfather were geologists.

Inspired by her fascination with animals and a biography of Marie Curie, Dr. Blackburn chose to also pursue a career in science. She earned her B.Sc. degree in 1970 and her M.Sc. degree in biochemistry, both from the University of Melbourne. She earned her Ph.D. in molecular biology from the University of Cambridge in 1975, then conducted postdoctoral research in molecular and cellular biology at Yale University from 1975 to 1977.


ATM Kinase Is Required for Telomere Elongation in Mouse and Human Cells

Stella Suyong Lee, Craig Bohrson, Alexandra Mims Pike, Sarah Jo Wheelan, Carol Widney Greider
  • •ADDIT assay measures telomerase-mediated addition at a single telomere
  • •De novo telomere addition in mouse cells requires ATM kinase
  • •ATM inhibition blocks bulk telomere elongation in both mouse and human cells
  • •Excess activation of ATM by inhibition of PARP1 increases telomere addition

Short telomeres induce a DNA damage response, senescence, and apoptosis, thus maintaining telomere length equilibrium is essential for cell viability. Telomerase addition of telomere repeats is tightly regulated in cells. To probe pathways that regulate telomere addition, we developed the ADDIT assay to measure new telomere addition at a single telomere in vivo. Sequence analysis showed telomerase-specific addition of repeats onto a new telomere occurred in just 48 hr. Using the ADDIT assay, we found that ATM is required for addition of new repeats onto telomeres in mouse cells. Evaluation of bulk telomeres, in both human and mouse cells, showed that blocking ATM inhibited telomere elongation. Finally, the activation of ATM through the inhibition of PARP1 resulted in increased telomere elongation, supporting the central role of the ATM pathway in regulating telomere addition. Understanding this role of ATM may yield new areas for possible therapeutic intervention in telomere-mediated disease.


Vertebrate telomeres are repetitive TTAGGG DNA sequences located at the ends of chromosomes, which protect the coding regions of DNA. In mammalian germline cells and ∼85% of cancers, telomere length is maintained by the dimeric ribonucleoprotein telomerase, which catalyzes the addition of TTAGGG repeats to counteract telomere shortening and cellular senescence (Shay and Bacchetti, 1997, Kim et al., 1994, Wenz et al., 2001). The minimal catalytic core of human telomerase consists of the telomerase reverse transcriptase protein (hTERT), telomerase RNA (hTR), and the protein dyskerin (Cohen et al., 2007).

The differentiation of telomeres from broken chromosome ends is conferred by a family of six telomere-specific binding proteins collectively termed “shelterin” (de Lange, 2005). This complex consists of the double-stranded binding proteins TRF1 and TRF2, the single-stranded binding proteins POT1 and TPP1, the bridging protein TIN2 that links these two groups of proteins, and Rap1 (reviewed in Palm and de Lange, 2008). TRF1 protects the telomere and negatively regulates telomerase-mediated telomere lengthening (van Steensel and de Lange, 1997, Smogorzewska et al., 2000, Ancelin et al., 2002, Karlseder et al., 2002). TRF1 also facilitates the progression of the replication machinery; deletion of TRF1 increases replication fork stalling, leading to ATR kinase activation and a “fragile telomere” phenotype (Sfeir et al., 2009, Martínez et al., 2009). The TRF1-mediated repression of the ATR response requires recruitment of the shelterin components TIN2 and the TPP1/POT1 heterodimer (Zimmermann et al., 2014).

TPP1 and POT1 also have roles in mediating telomere-length regulation. A surface on the N-terminal oligonucleotide/oligosaccharide-binding (OB) domain of TPP1 termed the TEL patch activates telomerase by stimulating telomerase processivity and providing a direct binding site for telomerase recruitment to telomeres; mutation of the TEL patch can lead to telomere shortening syndromes characterized by bone marrow failure (Abreu et al., 2010, Nandakumar et al., 2012, Zhong et al., 2012, Kocak et al., 2014, Guo et al., 2014, Dalby et al., 2015). Additionally, mutation analyses at sites independent of the TEL patch have implicated TPP1 as part of a telomere-length-dependent feedback loop that regulates telomere-length homeostasis (Sexton et al., 2014). A mutant form of POT1 that abrogates binding to single-stranded DNA (POT1ΔOB) deregulated telomere-length control (Loayza and De Lange, 2003), indicating that the DNA-binding capability of POT1 is vital as a negative regulator of telomere length. The impact of human POT1 on telomere length is complex, since both depletion and overexpression of POT1 lead to telomere lengthening (Ye et al., 2004, Veldman et al., 2004, Colgin et al., 2003, Armbruster et al., 2004). POT1 function as a positive or negative regulator of telomerase activity at the telomere depends on its position of binding relative to the DNA 3′ end and is also modulated by its binding partner, TPP1 (Zaug et al., 2005, Wang et al., 2007, Lei et al., 2005, Kelleher et al., 2005).

Telomerase action at the telomere is highly regulated; it preferentially elongates the shortest telomeres, and recruitment of the enzyme complex to the telomere occurs in mid-S phase of the cell cycle (Bianchi and Shore, 2007, Britt-Compton et al., 2009,Teixeira et al., 2004, Hemann et al., 2001, Tomlinson et al., 2006, Jády et al., 2006). In both budding and fission yeasts, the preference of telomerase to extend the shortest telomeres requires the activity of Tel1, the yeast homolog of human ATM (Sabourin et al., 2007, Hector et al., 2007, Arnerić and Lingner, 2007). ATM and ATR are kinases within the phosphatidylinositol-3 kinase-related kinase (PIKK) family, which regulates cellular responses to DNA damage, mRNA decay, and nutrient-dependent signaling (Lovejoy and Cortez, 2009). Activation of these DNA damage pathways is dampened at telomeres; in mammalian cells, TRF2 represses activation of ATM while POT1 represses ATR (Karlseder et al., 2004, Celli and de Lange, 2005, Denchi and de Lange, 2007, Guo et al., 2007, Okamoto et al., 2013). Nevertheless, there is a large amount of evidence that their yeast homologs play a positive role in facilitating telomere extension by telomerase (Moser et al., 2009, Moser et al., 2011, Yamazaki et al., 2012, Churikov et al., 2013).

It is not known whether the role of the ATM and ATR pathways in recruiting telomerase is conserved in mammals. Although ATM deficiency or ATR mutations can induce telomere shortening or instability in human and mouse cells (Metcalfe et al., 1996, Smilenov et al., 1997, Wong et al., 2003, Wu et al., 2007, Pennarun et al., 2010), these kinases were reported to be dispensable for elongation of the shortest telomeres in mouse models (Feldser et al., 2006, McNees et al., 2010). Also, immortalized cell lines from human patients with ATM mutations are able to maintain their telomeres with telomerase, albeit at short lengths (Sprung et al., 1997). Nonetheless, there is evidence that TRF1-mediated telomere-length regulation in human cells involves ATM. Inhibition of human ATM resulted in increased TRF1 at the telomere, and phosphorylation of TRF1 on serine 367, an ATM/ATR target site, reduced the interaction of TRF1 with telomeres and abrogated its ability to inhibit telomere lengthening (McKerlie et al., 2012, Wu et al., 2007).

In this study, we report that both ATM and ATR are required for the recruitment of human telomerase to telomeres.

ATM and ATR Are Both Required for the Presence of Human Telomerase at Telomeres

Figure 1

ATM and ATR Are Both Required for the Presence of Human Telomerase at Telomeres

(A) Representative images of hTR/telomere FISH in 293T cells treated with the indicated siRNAs or kinase inhibitors. Cells were synchronized to mid-S phase of the cell cycle and probed with hTR probes (green) or a telomere probe (red). Co-localizations are indicated by white arrows in the merge row. Scale bar, 10 μm.

(B) Immunoblot of 293T cells with either ATM (left panel) or ATR (right panel) siRNA-mediated knockdown, using the respective antibodies, with vinculin as a control.

(C) Average co-localizations between telomerase and telomeres in unsynchronized 293T cells treated with control siRNA (gray), ATM siRNA (red) (∗p = 0.012), or ATR siRNA (purple) (∗∗p = 0.0095).

(D) Quantitation of decrease in telomerase recruitment in S phase synchronized 293T cells following treatment with two independent ATM and ATR siRNAs; ∗∗p < 0.01. Cells were synchronized with a thymidine/aphidicolin block (ATM) or sorted into cell-cycle phases by FACS based on DNA content (ATR).

(E) Average telomerase co-localization with telomeres in S phase synchronized 293T cells after treatment with DMSO vehicle (gray), 1.5 μM KU-55933 (light yellow), or 500 nM VE-822 (dark yellow); ∗p < 0.05.

(F) Telomerase co-localization with telomeres in 293T cells at the indicated number of hours after release from a thymidine/aphidicolin block, treated with control (gray) or ATM (red) siRNA.

(G) Telomerase co-localization with telomeres in 293T cells treated with control (gray) or ATM (red) siRNA. Cells were stained with the DNA dye VyBrant DyeCycle Violet and isolated into cell-cycle phases with FACS. Enrichment of cells in the indicated phases was confirmed by flow cytometry of sorted cells (Figure S1A).

(H) Telomerase co-localization with telomeres in 293T cells treated with control (gray) or ATR (purple) siRNA and sorted by FACS as in Figure 1G.

In all panels, data are presented as the mean of three independent experiments ± SD.

See also Figure S1.

ATM Effect on Telomerase Recruitment Is Partially Mediated by TRF1

Figure 2

ATM Effect on Telomerase Recruitment Is Partially Mediated by TRF1

(A) Immunoblot of 293T cells treated with control or two different TRF1 siRNAs. All lanes are from the same immunoblot, which was cropped to remove intervening irrelevant lanes. Actin was probed as a control.

(B) Average recruitment of telomerase to telomeres in asynchronous 293T cells treated with control (gray) or TRF1 (blue) siRNA;∗∗p = 0.0011.

(C) Average co-localization of telomerase with telomeres in 293T cells synchronized to G2/M of the cell cycle by release from a thymidine/aphidicolin block; cells were treated with control (gray) or two different TRF1 siRNAs (blue); ∗p < 0.05.

(D) Telomerase co-localization with telomeres in thymidine/aphidicolin synchronized 293T cells, treated with control (gray) or TRF1 (blue) siRNA. The values along the x axis represent the number of hours since release of cells from G1/S boundary. The control data are the same as those in Figure 1F, since these experiments were performed simultaneously.

(E) Telomerase co-localization with telomeres in 293T cells, treated with control (gray) or TRF1 (blue) siRNA; cells were stained with the DNA dye VyBrant DyeCycle Violet and isolated into the cell-cycle phases with FACS. The control data are the same as those in Figure 1G, since these experiments were performed simultaneously.

(F) FISH for hTR (green) and telomeres (red) in 293T cells treated with control or combined ATM and TRF1 siRNAs. Cells were either asynchronous or synchronized with thymidine and aphidicolin and harvested 3–4 hr (S phase) or 7 hr (G2/M) after release from the G1/S boundary. Co-localizations are indicated by the white arrows in the merge row. Scale bar, 10 μm.

(G) Quantitation of (F); average telomerase-telomere co-localizations after control (gray), ATM only (red), TRF1 only (blue), and ATM/TRF1 (green) siRNAs, in asynchronous, S phase, or G2/M phase cell populations; n = 4; ∗∗p < 0.01.

Data are presented as the mean of three independent experiments except where indicated otherwise, ± SD.

See also Figure S2.

Large image of Figure 7.

http://www.cell.com/cms/attachment/2040375994/2053862726/gr7.jpg

Figure 7

Model for ATM and ATR Involvement in Human Telomerase Recruitment to Telomeres

(A) During S phase, ATM and/or other PIKKs phosphorylates TRF1 at S367, which leads to partial dissociation of TRF1 from telomeres (McKerlie et al., 2012, Wu et al., 2007). Depletion of TRF1, together with its protein partners Tin2, TPP1, and Pot1, causes telomeric replication forks to stall, leading to recruitment of RPA and ATR (Sfeir et al., 2009, Martínez et al., 2009, Zimmermann et al., 2014). ATR phosphorylates an unknown substrate to mediate telomerase recruitment. Replication fork stalling caused by aphidicolin treatment also leads to telomerase recruitment (this study) and telomere elongation (Sfeir et al., 2009).

(B) An independent role of ATM and ATR involves stimulation of telomerase assembly, which is a prerequisite for telomerase localization to telomeres. This model does not preclude involvement of other unidentified substrates of ATM, ATR, and other PIKKs.

……..

We demonstrated that one TRF1-independent function of ATM is its impact upon the ability of hTR and hTERT to assemble into a functional enzyme complex (Figure 6), which is a prerequisite for localization of hTR to telomeres (Tomlinson et al., 2008). ATR also plays a role in assembly of human telomerase; we do not know if the substrates of these two kinases in this process are the same. This role is reflected in a substantial decrease in the amount of hTR recovered after hTERT immunoprecipitation and in the total immunoprecipitated telomerase activity following ATM and ATR knockdown. The specific activity of telomerase remains unchanged, demonstrating that both ATM and ATR have no effect on telomerase catalytic activity, consistent with results in yeast (Chan et al., 2001). No consensus PIKK phosphorylation motifs exist in the RNA-binding domain of hTERT, implying either that ATM or ATR can mediate telomerase assembly by targeting regions not in the RNA-binding domain or that they can regulate telomerase assembly by phosphorylating unknown substrates (Figure 7B).

Our data support a model incorporating multiple roles for ATM and ATR in the presence of human telomerase at telomeres (Figure 7). One pathway involving both ATM and ATR is mediated by phosphorylation of TRF1 and its removal from the telomere, leading to replication fork stalling in telomeric DNA, which acts as a trigger for telomerase recruitment. A second pathway involves the role of ATM and ATR in facilitating telomerase assembly; additional phosphorylation targets of ATM, ATR, and other PIKKs in the telomerase recruitment process may remain to be identified. These data reveal that although it is important for telomeres to repressDNA damage signaling in order to avoid deleterious fusions, telomeres have also evolved the ability to carefully exploit aspects of DNA damage signaling pathways to regulate telomerase presence at the telomere. Increased understanding of regulation of telomerase assembly and access to the telomere may provide valuable insight in the process of developing highly specific cancer therapeutics.

Read Full Post »

Antibiotic Resistance

Antibiotic Resistance

Larry H. Bernstein, MD, FCAP, Curator

LPBI


Resistance Gene to Last Line of Antibiotic Defense Has Emerged

http://www.genengnews.com/gen-news-highlights/resistance-gene-to-last-line-of-antibiotic-defense-has-emerged/81252000/

Drug resistance can often emerge due to the selective pressure of antibiotic use on a microbial population. [NIAID]


Until recently, resistance to the polymyxin class of antibiotics—the last line of microbial defense—was thought to be highly improbable. However now, Chinese scientists have discovered a new gene, called mcr-1 that is widespread among Enterobacteriaceae, a large family of Gram-negative bacteria that include a variety of human pathogens, after taking samples from pigs and patients in South China.

“These are extremely worrying results. The polymyxins (colistin and polymyxin B) were the last class of antibiotics in which resistance was incapable of spreading from cell to cell. Until now, colistin resistance resulted from chromosomal mutations, making the resistance mechanism unstable and incapable of spreading to other bacteria,” explained co-author Jian-Hua Liu, Ph.D., a professor at the South China Agricultural University in Guangzhou, China. “Our results reveal the emergence of the first polymyxin resistance gene that is readily passed between common bacteria such as Escherichia coli and Klebsiella pneumoniae, suggesting that the progression from extensive drug resistance to pandrug resistance is inevitable.”

The investigators found the mcr-1 gene on plasmids within various bacterial strains, suggesting an alarming potential to spread and differentiate between diverse microbial populations.

The findings from this study were published recently in The Lancet Infectious Diseases through an article entitled “Emergence of plasmid-mediated colistin resistance mechanism MCR-1 in animals and human beings in China: a microbiological and molecular biological study.”

The researchers stumbled across the mcr-1 gene while performing routine testing of livestock for antimicrobial resistance on a pig farm in Shanghai. This prompted the researchers to collect bacteria samples from pigs at slaughter across four provinces, and from pork and chicken sold in 30 open markets and 27 supermarkets across Guangzhou between 2011 and 2014. Additionally, the scientists analyzed bacteria samples from patients presenting with infections at two hospitals in Guangdong and Zhejiang provinces.

What they found was troubling to say the least, as a high prevalence of the mcr-1 gene in E. coli was observed in isolates from animal (166 of 804) and raw meat samples (78 of 523). Moreover, the proportion of positive samples has been observed to be increasing from year to year.

The scientists also found that the transfer rate of the mcr-1 gene was very high between E. coli strains and that it has a strong potential to spread into other epidemic pathogenic bacterial species such asK. pneumoniae and Pseudomonas aeruginosa—making the rapid dissemination into humans very likely.

“Because of the relatively low proportion of positive samples taken from humans compared with animals, it is likely that mcr-1 mediated colistin resistance originated in animals and subsequently spread to humans,” noted senior author Jianzhong Shen, Ph.D., professor at the China Agricultural University in Beijing, China. “The selective pressure imposed by increasingly heavy use of colistin in agriculture in China could have led to the acquisition of mcr-1 by E. coli.”

The importance of selective pressure on this resistance gene becomes even more evident when considering the fact that China is one of the world’s largest users and producers of colistin for agriculture and veterinary use. Worldwide, the demand for colistin in agriculture is expected to reach almost 12,000 tons per year by the end of 2015, rising to 16,500 tons by 2021.

“The emergence of mcr-1 heralds the breach of the last group of antibiotics,” the authors stated. “Although currently confined to China, mcr-1 is likely to emulate other resistance genes such as blaNDM-1 and spread worldwide. There is a critical need to re-evaluate the use of polymyxins in animals and for very close international monitoring and surveillance of mcr-1 in human and veterinary medicine.”


Emergence of plasmid-mediated colistin resistance mechanism MCR-1 in animals and human beings in China: a microbiological and molecular biological study  

Yi-Yun Liu, Yang Wang, Timothy R Walsh, Ling-Xian Yi, Rong Zhang, James Spencer, et al.

DOI: http://dx.doi.org/10.1016/S1473-3099(15)00424-7      http://www.thelancet.com/journals/laninf/article/PIIS1473-3099(15)00424-7/abstract

Background

Until now, polymyxin resistance has involved chromosomal mutations but has never been reported via horizontal gene transfer. During a routine surveillance project on antimicrobial resistance in commensal Escherichia coli from food animals in China, a major increase of colistin resistance was observed. When an E coli strain, SHP45, possessing colistin resistance that could be transferred to another strain, was isolated from a pig, we conducted further analysis of possible plasmid-mediated polymyxin resistance. Herein, we report the emergence of the first plasmid-mediated polymyxin resistance mechanism, MCR-1, in Enterobacteriaceae.

Methods

The mcr-1 gene in E coli strain SHP45 was identified by whole plasmid sequencing and subcloning. MCR-1 mechanistic studies were done with sequence comparisons, homology modelling, and electrospray ionisation mass spectrometry. The prevalence of mcr-1 was investigated in E coli andKlebsiella pneumoniae strains collected from five provinces between April, 2011, and November, 2014. The ability of MCR-1 to confer polymyxin resistance in vivo was examined in a murine thigh model.

Findings

Polymyxin resistance was shown to be singularly due to the plasmid-mediated mcr-1 gene. The plasmid carrying mcr-1 was mobilised to an E coli recipient at a frequency of 10−1 to 10−3 cells per recipient cell by conjugation, and maintained in K pneumoniae and Pseudomonas aeruginosa. In an in-vivo model, production of MCR-1 negated the efficacy of colistin. MCR-1 is a member of the phosphoethanolamine transferase enzyme family, with expression in E coli resulting in the addition of phosphoethanolamine to lipid A. We observed mcr-1 carriage in E coli isolates collected from 78 (15%) of 523 samples of raw meat and 166 (21%) of 804 animals during 2011–14, and 16 (1%) of 1322 samples from inpatients with infection.

Interpretation

The emergence of MCR-1 heralds the breach of the last group of antibiotics, polymyxins, by plasmid-mediated resistance. Although currently confined to China, MCR-1 is likely to emulate other global resistance mechanisms such as
NDM-1. Our findings emphasise the urgent need for coordinated global action in the fight against pan-drug-resistant Gram-negative bacteria.


Colistin resistance: a major breach in our last line of defence

In hospital practice, clinicians have been buoyed by the recent development of new antibiotics active against multidrug resistant Gram-negative bacilli. However, recently approved antibiotics like ceftazidime-avibactam or ceftolozane-tazobactam do not provide activity against all Gram-negative bacilli, with notable gaps in their coverage, including the notorious New Delhi metallo-β-lactamase 1-producing organisms and many strains of carbapenem resistant Acinetobacter baumannii. For this reason, the polymyxins (colistin and polymyxin B) remain the last line of defence against many Gram-negative bacilli.
References
  1. The White House Office of the Press Secretary. FACT SHEET: Obama Administration Releases National Action Plan to Combat Antibiotic-Resistant Bacteria. https://www.whitehouse.gov/the-press-office/2015/03/27/fact-sheet-obama-administration-releases-national-action-plan-combat-ant. ((accessed Oct 20, 2015).)
  2. Walsh, F. Antibiotic resistance: Cameron warns of medical ‘dark ages’.http://www.bbc.co.uk/news/health-28098838. ((accessed Oct 20, 2015).)
  3. WHO. Antimicrobial resistance: global report on surveillance 2014. Wolrd Health Organization,Geneva; 2014http://www.who.int/drugresistance/documents/surveillancereport/en/. ((accessed Oct 20, 2015).)
  4. McKenna, M. CDC Threat Report: We will soon be in a post-antibiotic era. Wired. Sept 16, 2013;http://www.wired.com/2013/09/cdc-amr-rpt1/. ((accessed Oct 20, 2015).)
  5. Kumarasamy, KK, Toleman, MA, Walsh, TR et al. Emergence of a new antibiotic resistance mechanism in India, Pakistan, and the UK: a molecular, biological, and epidemiological study.Lancet Infect Dis. 2010; 10: 597–602
  6. Munoz-Price, LS, Poirel, L, Bonomo, RA et al. Clinical epidemiology of the global expansion ofKlebsiella pneumoniae carbapenemases. Lancet Infect Dis. 2013; 13: 785–796
  7. Falagas, ME, Karageorgopoulos, DE, and Nordmann, P. Therapeutic options for infections with Enterobacteriaceae producing carbapenem-hydrolyzing enzymes. Future Microbiol. 2011; 6: 653–666
  8. Halaby, T, Al Naiemi, N, Kluytmans, J, van der Palen, J, and Vandenbroucke-Grauls, CM.Emergence of colistin resistance in Enterobacteriaceae after the introduction of selective digestive tract decontamination in an intensive care unit. Antimicrob Agents Chemother. 2013; 57: 3224–3229


https://www.reddit.com/r/science/comments/3tdyaz/emergence_of_plasmidmediated_colistin_resistance/

This is my second attempt at my first time contributing a link so hopefully this is the correct subreddit. This really highlights why research focused on discovery of novel antibiotics and resistance modifying agents is so important.  The article is summarized in the BBC: http://www.bbc.com/news/health-34857015


What a shame this isn’t getting any more attention in the news, antibiotic resistance is becoming more and more of a problem, and nobody is giving a fuck it seems. Colistin is used as a last defense against extensive resistant Gram-negative bacteria, and if resistance against it now also comes in a plasmid flavor, implications could be big.


Yes, the gene has been known for a fair amount of time but the fact it is now in plasmids that can easily transfect other bacteria is a bit disconcerting. Hopefully some of the new soil cultured classes of antibiotics make it into clinical settings soon.

Read Full Post »

« Newer Posts - Older Posts »