Feeds:
Posts
Comments

Archive for the ‘Cell Biology’ Category

Investigating Functional Compensation by Human Paralogous Proteins

Larry H. Bernstein, MD, FCAP, Curator

LPBI


Using Disease-Associated Coding Sequence Variation to Investigate Functional Compensation by Human Paralogous Proteins

Evolutionary Bioinformatics 2015:11 245-251    http://dx.doi.org:/10.4137/EBO.S30594


In this article, we examined the functional compensation among paralogs as a general phenomenon through an analysis of disease-associated genetic variation in humans.23–26 In contrast to expectations under the functional compensation hypothesis, we found that multigene families have a greater tendency to harbor dSNVs than singleton proteins. We proposed that differences in functional constraints (evolutionary constraint hypothesis) explain the observed pattern to a large degree.


Gene duplication enables the functional diversification in species. It is thought that duplicated genes may be able to compensate if the function of one of the gene copies is disrupted. This possibility is extensively debated with some studies reporting proteome-wide compensation, whereas others suggest functional compensation among only recent gene duplicates or no compensation at all. We report results from a systematic molecular evolutionary analysis to test the predictions of the functional compensation hypothesis. We contrasted the density of Mendelian disease-associated single nucleotide variants (dSNVs) in proteins with no discernable paralogs (singletons) with the dSNV density in proteins found in multigene families. Under the functional compensation hypothesis, we expected to find greater numbers of dSNVs in singletons due to the lack of any compensating partners. Our analyses produced an opposite pattern; paralogs have over 35% higher dSNV density than singletons. We found that these patterns are concordant with similar differences in the rates of amino acid evolution (ie, functional constraints), as the proteins with paralogs have evolved 33% slower than singletons. Our evolutionary constraint explanation is robust to differences in family sizes, ages (young vs. old duplicates), and degrees of amino acid sequence similarities among paralogs. Therefore, disease-associated human variation does not exhibit significant signals of functional compensation among paralogous proteins, but rather an evolutionary constraint hypothesis provides a better explanation for the observed patterns of disease-associated and neutral polymorphisms in the human genome.


Gene duplication is an important mechanism for the origin of novelty in evolution.1–3 When a gene is duplicated, one of the duplicate copies usually decays within a few million years due to an accumulation of deleterious mutations.4 However, duplicates may be retained if they become functionally important to the organism.5–7 It has been suggested that duplicate genes may be able to carry out the original gene function, which means that paralogs may compensate for each other.8,9 Gene knockout/knockdown experiments have been conducted in multiple species to examine the degree of functional redundancy in gene families. The results suggest that the loss of function in genes with paralogs is associated with higher organismal survival than the loss of function in genes without any known paralogs (singletons), supporting the functional compensation hypothesis.10–16 However, Liao and Zhang17 reported that duplicates rarely compensate for each other in mice, which has been debated.18–22 Overall, experimental data have not yet provided definitive evidence about whether paralogous genes do compensate for each other in most instances.

The predictions of functional compensation can be tested computationally by analyzing the disease-associated genetic variation in humans. These variants are currently experiencing negative selection in the human populations, which means that they constitute data of functional impact in nature. If functional compensation among gene family members is substantial, it is expected that fewer significant statistical associations between variants and disease phenotypes will be detected for proteins in multigene families than for singletons. Using this idea, Dickerson and Robertson23 tested the predictions of functional compensation and found no difference between the proportion of singletons and para logs implicated in diseases (2% difference), supporting the conclusions of Liao and Zhang.17 However, they and others have suggested that recently diverged paralogs are less likely to be disease-associated than singletons and proteins with distantly related paralogs.23–26 These results suggest functional redundancy among young gene duplicates.

However, the abovementioned computational studies have not accounted for many potentially confounding factors. First, disease-associated single nucleotide variants (dSNVs) are found preferentially at slowly evolving amino acid positions27; thus, we expect to observe a higher frequency of dSNVs in more conserved proteins. This could distort comparisons between singletons and multigene family proteins if the distributions of amino acid evolutionary rates are not the same for these two classes. Second, the numbers of dSNVs found in different proteins are not expected to be the same because the numbers of amino acids in proteins vary by an order of magnitude. This means that commonly used metrics, such as the relative fractions of disease and nondisease proteins in different protein classes, are too coarse. Metrics that take into account the number of amino acids in proteins (sequence length) are necessary for more robust hypothesis testing.

In the following section, we tested the hypothesis of functional compensation by considering the abovementioned factors to better understand the genome-wide pattern of functional evolution in gene families, which is vital for understanding genome evolution and predicting disruptive effects of the mutations of proteins that have paralogs.

We obtained a set of 15,485 human proteins and their homologs from 46 diverse species from the UCSC genome browser (see Material and Methods). For each protein, we also obtained a list of paralogs from the HOVERGEN database.28 Our set of proteins is representative of the whole human gene set because about half (52%) of these proteins have at least one paralog, a fraction that is similar to the overall fraction of proteins with paralogs in the human genome (49% in HOVERGEN database28). For each human protein, we computed the average rate of amino acid substitution (number of substitutions per site per billion years) using the interspecific amino acid sequence alignments (see Material and Methods). Figure 1 shows the distributions of evolutionary rates in singleton and multigene family proteins. Overall, singletons are less conserved than multigene family proteins, with a ∼20% mean and ∼30% median difference (P < 0.01 by two-sample Kolmogorov–Smirnov test; Fig. 1A). Similar patterns are observed when considering paralogs belonging to small (2–5) and large (.5) multigene families (P < 0.01; Fig. 1B).


Figure 1. Distributions of evolutionary rates of singleton (broken line) and multigene family proteins (solid or dotted line). (A) Evolutionary rates are in the units of the number of amino acid substitutions per amino acid site per billion years. the mean and median of these distributions are 1.05 and 0.89, respectively, for singletons, and 0.80 and 0.61, respectively, for proteins in multigene families. these distributions are significantly different (two-sample Kolmogorov– smirnov test; P < 0.01). (b) multigene family proteins were separated into those with two to five paralogs (small family; solid line) and greater than five paralogs (large family; dotted line). The mean and median of these distributions are 0.75 and 0.60, respectively, for the proteins from the small multigene families (two to five paralogs) and 0.87 and 0.63, respectively, for the proteins from the large multigene families (greater than five paralogs). These distributions are significantly different from the distribution for singletons (P < 0.01).


dsNVs in singletons and multigene families. We analyzed all available SNVs associated with Mendelian diseases in singleton and multigene family proteins. There were a total of 47,382 dSNVs in 2,589 proteins. In these data, the proportion of proteins with at least one dSNV was slightly lower (2.2%) for singletons than that of proteins with paralogs, which is consistent with the recent reports.23,29 However, the number of dSNVs in proteins varied extensively and was found to be positively correlated with the protein length (P < 0.05 for multigene family and singletons; Fig. 2). This is reasonable because longer proteins should have a greater chance of accumulating random mutations and are, therefore, more likely to be classified as disease genes. Thus, we normalized the number of dSNVs by protein length to avoid any bias due to length differences in subsequent analyses.


Figure 2. Distributions of the number of dsnvs. (A) a frequency diagram showing the number of proteins with at least one dsnv. (b) the average number of dsnvs per protein for proteins at different length thresholds at 100 amino acids intervals. the average number of dsnvs per protein is positively correlated with the average protein length for both multigene family (correlation = 0.005; P < 0.01) and singleton proteins (correlation = 0.002; P = 0.04).


We compared the number of dSNVs per 100 amino acid positions (dSNV density) between multigene family and singleton proteins. Multigene family proteins have 1.6 times higher density of dSNVs than detected in singleton proteins (0.66 and 0.42, respectively). We can statistically reject the null hypothesis of equal dSNV densities in singletons and multigene family proteins (P < 0.01). However, the direction of effect is opposite to the predictions of functional compensation from paralogous genes in multigene families, as the multigene family proteins contained significantly more dSNVs than singletons. We tested the influence of outliers on this result by excluding all proteins with .0.5 dSNVs per amino acid. This reduced the number of proteins slightly (131 proteins were excluded), but the ratio of multigene family and singleton protein dSNV densities remained unchanged (1.6; P < 0.01). We, nevertheless, excluded all proteins in which the number of dSNVs per position was .0.5 in all subsequent analyses to remove the influence of proteins with unusually high dSNV density when comparing the patterns between different classes of proteins. We also tested if the observed patterns reflect the mutations of specific amino acids (eg, arginine) that comprise a major fraction of the dataset of dSNVs (16%). Arginine codons contain a CpG dinucleotide in the first two positions and are, thus, more prone to transitional mutations, leading to amino acid variation.30 We computed the dSNV densities using only the arginine positions in proteins and found the dSNV density in multigene family proteins to be 1.5 times greater than observed in singletons (0.09 and 0.06, respectively; P < 0.01). A similar pattern was observed for glycine (replacement of glycine residues occurs for 12% of dSNVs in this dataset). The dSNV density in multigene family proteins was twice than observed in singletons (0.08 and 0.04, respectively; P < 0.01).

Finally, we looked for the signatures of functional compensation using dSNVs that are expected to be the most severe, with the rationale that functional compensation may be easier to detect, as ameliorating severe phenotypic effects will have greater relative effect on individual fitness. We designated a dSNV to be severe if the predicted functional impact score for the variant was in the top 5% of all dSNVs (see Material and Methods). For these data, the multigene family proteins have a dSNV density 2.3 times higher than that observed for singletons (0.034 and 0.015, respectively; P < 0.01), which does not support the functional compensation hypothesis. Therefore, the patterns of greater abundance of dSNVs in multigene families are robust to the predicted effect sizes of dSNVs analyzed and the amino acid composition bias of the variation dataset.

Relationship of evolutionary conservation and dsNVs.

We examined if protein conservation difference between singletons and multigene family proteins can explain the above mentioned pattern because it is now well established that highly conserved proteins are significantly more likely to contain dSNVs.27,31 Because the protein evolutionary rate distributions are neither normal nor symmetrical (Fig. 1), we compared medians (0.61 and 0.89, respectively) and found a ratio of 0.69 between the multigene family and singleton proteins. The inverse of this ratio (1.5) is only slightly different from the ratio of dSNV densities (1.6). This similarity suggests that the higher rate of dSNVs in multigene family proteins is mostly explained by the degree of functional constraint on proteins in multigene families versus singleton proteins. Based on this observation, we propose the evolutionary constraints hypothesis, which posits that the differences in dSNV densities among different classes of proteins (eg, singleton vs. multigene) are primarily a result of the differences in the degree of natural selection acting upon them. If true, this would be consistent with the neutral theory of molecular evolution.32 Evolutionary constraint hypothesis does not preclude the existence of functional compensation (among other factors) in some proteins or positions, but it does claim that differences in the intensity of purifying selection will be the primary cause of observed differences in the preponderance of SNVs in different groups of proteins.

We tested the prediction of the evolutionary constraint hypothesis in an analysis of 12,952 common neutral SNVs (nSNVs) obtained from the 1000 Genomes Project.33 These common nSNVs are complementary in nature to dSNVs, as common nSNVs persist in the human population and have risen to moderate frequencies (.5%) because their impact on fitness is effectively neutral (opposite of dSNVs that cause disease). Therefore, if functional constraints and, thus, the conservation level of human protein sequence explain the observed differences in dSNV density, we should also observe fewer nSNVs in multigene family proteins, as these proteins evolve more slowly and are expected to be subject to more severe purifying selection.34 Indeed, the nSNV density (number of nSNVs per 100 amino acids) in multigene family proteins was lower than that of singletons (ratio = 0.82; 0.13 and 0.16, respectively; P < 0.01). This ratio (0.82) is again similar to the ratio of the evolutionary rates (0.69) for these two classes of proteins. These results suggest that the occurrence of dSNVs and nSNVs in proteins is largely concordant with the degree of functional constraint on proteins, which is captured in their evolutionary rates.

Disease sNV prevalence in proteins with young and old paralogs.

Next, we tested the hypothesis that functional compensation is more common in proteins with younger paralogs.23,24 If functional compensation generally occurs only for a brief period after the gene duplication event, then the most recently diverged paralogs will provide the most powerful signal to detect functional compensation. We first identified the closest paralog for each protein within a given gene family by selecting the paralog with the smallest nucleotide divergence in their codons (third positions only). To estimate the relative antiquity of the duplicate event, we used the protein-specific human–mouse third positions in codons to normalize each closest paralog divergence across gene families (see Materials and Methods). This normalized value yields an approximate gene duplication time when it is scaled using the human–mouse divergence time (92.3 million years ago35). This approximation is reasonable, as third positions in codons evolve relatively neutrally and because we use divergence times primarily for identifying and sorting young paralogs for hypothesis testing.

Density of dSNV for duplicates that have diverged from their paralogs in the last 200 million years shows a tendency to increase with estimated duplicate age (Fig. 3A). The same pattern is observed for the positions of arginine and glycine and those with predicted severe functional impacts (Fig. 3B–D). Also, the dSNV densities for the youngest duplicates are lower than those for singletons (triangle in Fig. 3). We found that the evolutionary rate of proteins is negatively correlated with time since duplication, and the youngest duplicates have higher evolutionary rates than singletons (Fig. 4A). These patterns do not support the functional compensation hypothesis23 and are consistent with our evolutionary constraint hypothesis. These trends are confirmed in the analysis of nSNV densities that showed expected complementary patterns (Fig. 4B).


Figure 3. the dsnv density in duplicates over time. Each point shows the dsnv density of all proteins with duplication age less than or equal to a threshold time (x-axis; 10 million year intervals). the dsnv density of singletons is shown with a triangle. Panels show patterns obtained for all dsnvs (A), arginine dsnvs (b), and glycine dsnvs (C). Panel D shows patterns for dsnvs with severe impact predicted by EvoD.46


Figure 4. the average evolutionary rates (A) and nsnv densities (b) of all proteins with duplication age less than or equal to a threshold time (x-axis; 10 million year intervals). the decreasing trend for evolutionary rate (A) is opposite to that observed for dsnvs, but it is similar to that observed for nsnvs (b). in each panel, triangle shows the value from singletons.


Disease sNV prevalence in proteins with very similar paralogs.

We also tested the functional compensation hypothesis in proteins that show high amino acid sequence similarities with their paralogs, as studied by Hsiao and Vitkup.24 We found that paralogs with the highest amino acid sequence similarities (.95%) actually have higher dSNV densities than other paralogs (0.98 vs. 0.57; P < 0.01). This is inconsistent with the functional compensation hypothesis but agrees with our evolutionary constraint hypothesis because the evolutionary rates were lower in paralogs with .95% similarity (0.59 and 0.78 substitutions/site/billion years; P < 0.01). Therefore, differences in the degree of functional constraint (measured using evolutionary rates) account for the observed patterns of dSNV densities.

Next, we compared nSNV densities in paralogs with .95% sequence similarity to those with #95% similarity. For this comparison, we needed to be cognizant of the fact that variant calls are difficult when the paralogs have very similar DNA sequences.36–39 This is the case for paralogs with .95% amino acid sequence similarity because most of these proteins also showed small divergences at the third positions in codons between paralogs (#0.2 substitutions per site). To accommodate the variant call errors, we used proteins with #0.2 distance (third positions) for comparison between paralogs for two groups of proteins (225 and 69 proteins). The nSNV density was 0.30 and 0.52 for proteins that have paralogs with .95% and #95% sequence similarity, respectively (P < 0.01). The former proteins are more conserved (rate = 0.89) than the latter (rate = 1.97; P < 0.01), and so the result is consistent with the evolutionary constraint hypothesis.


In this article, we examined the functional compensation among paralogs as a general phenomenon through an analysis of disease-associated genetic variation in humans.23–26 In contrast to expectations under the functional compensation hypothesis, we found that multigene families have a greater tendency to harbor dSNVs than singleton proteins. We proposed that differences in functional constraints (evolutionary constraint hypothesis) explain the observed pattern to a large degree. We confirmed that singleton proteins show lower functional constraint than proteins with identifiable duplicates in the genome, which explains the increased detection of disease-associated variation observed in multigene families.

Some recent theoretical and empirical studies suggest that functional compensation can lead to enhanced purifying selection and, therefore, may actually be associated with slower evolutionary rates.14,40 Other studies indicate that the youngest duplicates are evolving under relaxed selection pressures, which would cause an increase in evolutionary rates for a few million years.4 Such short-term and localized rate changes (faster or slower) will not have significant impact on the estimates of very long-term evolutionary rates that we have used to quantify the functional constraint. We have calculated the evolutionary rates using sequence differences in proteins that have accumulated changes for hundreds of millions of years across major groups of vertebrates. There is no evidence that pervasive functional compensation exists across the phylogenetic breadth and genomic scale reflected in our analyses. We expect our major conclusions to hold true in general, while acknowledging that functional compensation may occur in some multigene families and some amino acid positions. In summary, we suggest that there is a need to fully consider differences in the evolutionary conservation of proteins when studying the patterns of sequence variation and variant–phenotype associations.


Related


Read Full Post »

developments in medical spectroscopy

Larry H. Bernstein, MD, FCAP, Curator

LPBI


Using QCLs for MIR-Based Spectral Imaging — Applications in Tissue Pathology
A quantum cascade laser (QCL) microscope allows for fast data acquisition, real-time chemical imaging and the ability to collect only spectral frequencies of interest. Due to their high-quality, highly tunable illumination characteristics and excellent signal-to-noise performance, QCLs are paving the way for the next generation of mid-infrared (MIR) imaging methodologies.

Using QCLs for MIR-Based Spectral Imaging — Applications in Tissue Pathology

http://www.photonics.com/images/Web/Articles/2015/9/8/Imaging_Prostate.png


Efficient Spectroscopic Imaging Demonstrated In Vivo
Although optical spectroscopy is routinely used study molecules in cell samples, it is currently not practical to perform in vivo. Now, a converted Raman spectroscopy system has been used to reveal the chemical composition of living tissues in seconds.

Efficient Spectroscopic Imaging Demonstrated In Vivo

http://www.photonics.com/images2/EmailBlasts%5CSpectroscopy/2015/11/Efficient_Spectroscopic_Imaging_Demonstrated_In_Vivo.jpg


Broadband Laser Aimed at Cancer Detection
Covering a wide swath of the mid-infrared region, a new laser system offers greater spectral sensitivity.

Broadband Laser Aimed at Cancer Detection

http://www.photonics.com/images/Web/Articles/2015/9/25/REAS_molecular_1.jpg


Using QCLs for MIR-Based Spectral Imaging — Applications in Tissue Pathology

A quantum cascade laser (QCL) microscope allows for fast data acquisition, real-time chemical imaging and the ability to collect only spectral frequencies of interest. Due to their high-quality, highly tunable illumination characteristics and excellent signal-to-noise performance, QCLs are paving the way for the next generation of mid-infrared (MIR) imaging methodologies.

MICHAEL WALSH, UNIVERSITY OF ILLINOIS AT CHICAGO; MATTHEW BARRE & BENJAMIN BIRD, DAYLIGHT SOLUTIONS

H. Sreedhar*1, V. Varma*2, A. Graham3, Z. Richards1, F. Gambacorata4, A. Bhatt1,
P. Nguyen1, K. Meinke1, L. Nonn1, G. Guzman1, E. Fotheringham5, M. Weida5,
D. Arnone5, B. Mohar5, J. Rowlette5
1 Department of Bioengineering, University of Illinois at Chicago
2 Department of Pathology, University of Illinois at Chicago
3 Department of Bioengineering, University of Illinois at Urbana-Champaign
4 Department of Chemical Engineering, University of Illinois at Chicago
5 Daylight Solutions, San Diego
*Contributed Equally

Real-time, MIR chemical imaging microscopes could soon become powerful frontline screening tools for practicing pathologists. The ability to see differences in the biochemical makeup across a tissue sample greatly enhances a practioner’s ability to detect early stages of disease or disease variants. Today, this is accomplished much as it was 100 years ago — through the use of specially formulated stains and dyes in combination with white light microscopy. A new MIR, QCL-based microscope from Daylight Solutions enables real-time, nondestructive biochemical imaging of tissues without the need to perturb the sample with chemical or heat treatments, thus preserving the sample for follow-on fluorescence tagging, histochemical staining or other “omics” testing within the workflow.
MIR chemical imaging is a well-established absorbance spectroscopy technique; it senses the relative amount of light that molecules absorb due to their unique vibrational resonances falling within the MIR portion of the electromagnetic spectrum (i.e., wavelengths from approximately 2 to 15 µm). This absorption can be detected with a variety of MIR detector types and can provide detailed information about the sample’s chemical composition.

The most common instrument for this type of measurement is known as a Fourier transform infrared (FTIR) spectrometer. FTIR systems use a broadband MIR light source, known as a globar, to illuminate a sample; the absorption spectrum is generated by the use of interferometry. Throughout the past decade, FTIR systems have incorporated linear arrays and 2D focal plane arrays (FPAs) in a microscope configuration to enable a technique known as chemical imaging.

With this approach, the illumination beam is expanded across a sample area, and the data produced is transformed into a hyperspectral data cube — a 2D image of the sample with an absorption profile associated with every pixel. This is a very versatile technique that allows the detailed spatial distribution of chemical content to be analyzed across a sample. Recently, this technique has proved to be very useful within the biomedical imaging sector for label-free, biochemical analyses of cells, tissue and biofluids.

While FTIR microscopy now is established as a powerful technique for a wide variety of applications, the instruments used for this methodology are fundamentally limited by the brightness of the globar source. Users looking to maximize the signal-to-noise ratios, and the associated resolutions of the images produced are forced to use synchrotron facilities, which replace the globar light source with a MIR beam generated by a particle accelerator. This approach can yield excellent results but clearly is not practical for benchtop applications; it is particularly unfit for biomedical imaging applications within clinical settings.

The recent advent of QCLs has provided an ideal light source for next-generation MIR microscopy. They are compact, semiconductor-based lasers that produce high-brightness light in the MIR region. The devices can be manufactured in an external cavity configuration to provide broadly tunable output with a narrow spectral bandwidth at each frequency. In this configuration, a QCL can be tuned across the MIR spectrum to sequentially capture an absorption profile for chemical identification.

Daylight Solutions’ IR microscope incorporates a broadly tunable and high-brightness QCL light source (it is an order of magnitude brighter than a synchrotron), a set of high numerical aperture (NA) diffraction-limited objectives, and an uncooled microbolometer FPA into a compact, benchtop instrument, as shown in Figure 1. The instrument provides rapid, high-resolution chemical images across very large fields of view and also provides a real-time chemical imaging mode. By overcoming the physical size, camera cooling and data collection time requirements of FTIR-based instruments, the microscope is positioned to bring MIR microscopy beyond research settings and into clinical use.

Schematic of a quantum cascade laser (QCL) microscope.


Figure 1. Schematic of a quantum cascade laser (QCL) microscope. Courtesy of Daylight Solutions.


Dr. Michael Walsh of the University of Illinois at Chicago (UIC) conducts research within the pathology department’s Spectral Pathology Lab, which has been using the IR microscope for the past several months. Walsh has been focused on developing chemical imaging techniques, with the ultimate goal of improving diagnoses within the field of tissue pathology.

Currently, the state-of-the-art method-ology used for the diagnosis of most solid-organ diseases is to extract a tissue sample via a biopsy. Tissue inherently has very little contrast and needs to be stained with dyes or probes to visualize and identify cell types and tissue structures. The field of pathology is based on examining the stained tissues, typically using white light, to determine if the tissue morphology deviates from a normal pattern. If the tissue looks abnormal, the disease state may be further subclassified by grade or by predicted outcome. However, the field of pathology is limited by the information that can be derived from the stained tissues and the subjective interpretation of the tissue by a highly trained pathologist.

Spero microscope.


Spero microscope. Courtesy of Daylight Solutions.


UIC’s Spectral Pathology Lab is focused on identifying areas in pathology where current techniques fail, or where there is a need for additional diagnostic or prognostic information that can help improve patient care. Potentially, MIR imaging is a very valuable adjunct to the current practice of pathology. Rather than using only stains, MIR imaging can interrogate the entire biochemistry of the tissue and render a diagnosis in an objective fashion. Traditionally, MIR imaging with an FTIR system has been limited by slow data acquisition speeds and the need to collect the entire spectral data cube. QCL imaging with the Spero microscope has the potential to speed up the data acquisition of images obtained from a tissue sample and to collect only the spectral frequencies of interest. The device also provides real-time imaging of samples at 30 fps, which could allow pathologists to very rapidly identify areas of interest on a tissue biopsy in a manner that is similar to their current clinical workflows. Some examples of the comparison of FTIR-derived and QCL-derived images from multiple organ tissues of interest are presented.

H&E-stained image of a mouse brain section on IR reflective slide, with selected regions labeled: hypothalamus, thalamus, and dentate gyrus.
Figure 2.
(a) H&E-stained image of a mouse brain section on IR reflective slide, with selected regions labeled: hypothalamus, thalamus, and dentate gyrus. (b) Transflectance QCL IR image of same region, prior to staining, at 1652 cm−1, in which the thalamus is clearly distinguished from surrounding regions. (c) Same region at 1548 cm−1. (d) Same region at 1500 cm−1. Courtesy of University of Illinois at Chicago (UIC)/Spectral Pathology Lab.


A tissue section from a mouse brain was scanned using the Spero microscope’s high-magnification objective (12.5×; 0.7 NA; 1.4 × 1.4-µm pixels) at various MIR frequencies in transflection mode, as shown in Figure 2. The tissue then was stained using hematoxylin and eosin (H&E), the most common stain in histopathology, and is displayed in Figure 2a. Using the H&E stain, regions were identified in the brain (thalamus, dentate gyrus and hypothalamus) that correlated with structures in the IR image. By illuminating the tissue at various wavelengths, discrete tissue features exhibit contrast due to the difference in absorption, as highlighted in the IR images taken at 1652, 1548 and 1500 cm−1 in Figure 2b-d, respectively. The microscope also makes it possible to visualize tissue at these individual wavelengths in real time. The identification of cell types and their biochemical changes is of particular interest in neuropathology.

Transmission FTIR image of a 4-µm thick section from a human liver tissue microarray on barium fluoride at 1650 cm-1.
Figure 3.
(a) Transmission FTIR image of a 4-µm thick section from a human liver tissue microarray on barium fluoride at 1650 cm-1. The image was taken with 64 coadditions of successive scans. (b) Transmission image from the Spero microscope of the same tissue at 1652 cm-1, both baseline corrected between 1796 cm-1 and 904 cm-1. In both images, the bright white stripe dividing the tissue core roughly in half is a region of fibrosis (red arrow), while the rest of the tissue on either side is composed primarily of hepatocytes (blue arrow). Courtesy of UIC/Spectral Pathology Lab.


A single biopsy core obtained from human liver tissue was scanned in transmission mode on a barium fluoride substrate by an Agilent Cary 600 Series FTIR microscope (Figure 3a). The FTIR image was acquired using a 36× Cassegrain collecting objective and a 15× Cassegrain condenser for a pixel size of 2.2 × 2.2 µm. Figure 3b shows the same liver core acquired using the Spero microscope with the high-magnification collecting objective (12.5×, 0.7 NA) and condenser objective for a pixel size of 1.4 × 1.4 µm. High-definition IR imaging enables clear contrast and identification of the band of fibrosis in the center of the core and the surrounding regions of liver cells, known as hepatocytes, and is indicated within Figure 3a-b. Acquisition of IR imaging data at the diffraction limit enables chemical information to be recorded from tissue structures at the single-cell level, allowing accurate characterization of individual tissue components, different cell types, varied disease states or other aspects of a tissue section.

Averaged spectra for regions of interest corresponding to the hepatocytes and the fibrotic area on the FTIR image in Figure 3a.
Figure 4.
(a) Averaged spectra for regions of interest corresponding to the hepatocytes and the fibrotic area on the FTIR image in Figure 3a. Spectra have been truncated from 1800 to 900 cm-1, normalized to 1650 cm-1, and baseline corrected between 1796 and 904 cm-1. (b) Averaged spectra for regions of interest corresponding to the hepatocytes and the fibrotic area on the Spero microscope image in Figure 3b. Spectra have been normalized to 1652 cm-1 and baseline corrected between 1796 and 904 cm-1.


Figure 4 displays average spectra calculated from homogenous tissue regions that describe hepatocytes and fibrosis within the liver tissue core shown in Figure 3. The spectra acquired from both FTIR and QCL systems are very similar. Walsh is focused on developing spectral classifiers that can aid pathologists in making very difficult diagnoses in the precancerous stages of liver cancer.

H&E-stained section of human colon tissue, and FTIR (with 16 coadditions) and Spero microscope transmission images of a 4-µm thick serial section of the same sample on barium fluoride. FTIR image shown at 1650 cm-1, Spero microscope image shown at 1652 cm-1.
Figure 5.
H&E-stained section of human colon tissue, and FTIR (with 16 coadditions) and Spero microscope transmission images of a 4-µm thick serial section of the same sample on barium fluoride. FTIR image shown at 1650 cm-1, Spero microscope image shown at 1652 cm-1. The red circle indicates mucin, the green circle indicates malignant colon carcinoma epithelium, and the blue circle indicates fibroblastic stroma. The raw spectra (taken from single pixels in approximately the same location for each of the three tissue features) are shown below their respective IR images. The FTIR spectra were truncated to match the Spero microscope’s spectral range of 1800 to 900 cm-1. Courtesy of UIC/Spectral Pathology Lab.


Point spectra from individual pixels were obtained and compared from a human colon sample on barium fluoride scanned in transmission on the same FTIR and QCL systems, which is shown in Figure 5. A serial section was obtained and stained with H&E to identify the different tissue structures. Using the H&E image as a reference, spectra from mucin (red), malignant colon carcinoma epithelium (green) and fibroblastic stroma (blue) were collected from a single pixel at approximately the same location. The unprocessed QCL and FTIR spectra are shown directly beneath their respective images. The FTIR system has an FPA size of 128 × 128 detector elements, while the Spero system has a microbolometer of 480 × 480 detector elements. Therefore, the FTIR image was collected as a mosaic and then stitched together.

FTIR and Spero microscope spectra from a single pixel of mucin, from the tissue shown in Figure 5.
Figure 6.
(a) FTIR and Spero microscope spectra from a single pixel of mucin, from the tissue shown in Figure 5. (b) FTIR and Spero microscope spectra from a single pixel of malignant colon carcinoma epithelium, from the same tissue. (c) FTIR and Spero microscope spectra from a single pixel of fibroblastic stroma. All spectra have been normalized (FTIR to 1650 cm-1, Spero to 1652 cm-1) and baseline corrected between 1796 and 904 cm-1, with the FTIR spectra truncated to match the Spero microscope’s spectral range of 1800 to 900 cm-1. Note that pixels for each tissue feature were located in approximately the same region, and that the two images have different pixel sizes (2.2 × 2.2 µm for FTIR, 1.4 × 1.4 µm for Spero microscope). Courtesy of UIC/Spectral Pathology Lab.


The spectra obtained from the regions of interest depicted in Figure 5 were preprocessed, as shown in Figure 6. The data was peak height normalized to the Amide I band. The FTIR data and QCL data were processed using a simple, two-point linear baseline correction between 1796 and 904 cm−1. Figure 6a-c shows the processed data from single pixels looking at the biochemistry of mucin, malignant colon carcinoma epithelium and fibroblastic stroma, respectively. The spectra from the QCL and FTIR systems are very similar on an individual-pixel level.

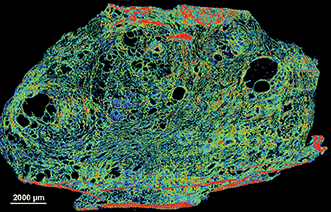
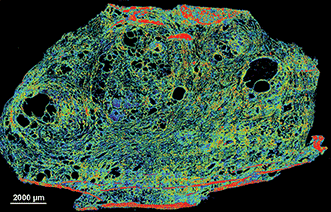
Finally, Figure 7 shows the scan of a frozen prostate tissue section captured with the microscope. Once thawed, the system can quickly image these sections at a single frequency of interest. The real-time capabilities of the system combined with the capacity for scanning frozen samples could someday allow for the analysis of samples in a time-critical intraoperative setting.

Transflectance scan of a 5-µm frozen human prostate tissue section on Kevley low-emissivity substrate captured with the Spero microscope.


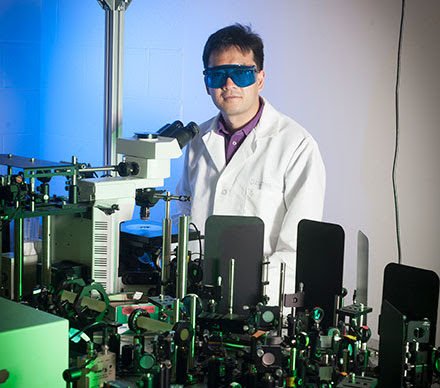
Figure 7. Transflectance scan of a 5-µm frozen human prostate tissue section on Kevley low-emissivity substrate captured with the Spero microscope. Visualized with a false color map at 1640 cm-1. Data was baseline corrected between 1796 and 904 cm-1. Courtesy of UIC/Spectral Pathology Lab. University of Illinois at Chicago — Spectral Pathology Lab members, from left to right: David Martinez, Francesca Gambacorta, Vishal Varma, Andrew Graham and Michael Walsh. Courtesy of Daylight Solutions.


While there has been significant interest in MIR imaging for pathology applications for a number of years1-5, the technology has lacked the maturity to be ready for clinical implementation due to slow scanning speeds, low spatial resolutions and by a lack of computational power to fully handle large multispectral datasets. The Spero microscope, coupled with modern computing power, overcomes these limitations. The information detailed above demonstrates that the quality of the images and spectra obtained from the instrument are similar to those offered by FTIR imaging methods but with the additional benefits associated with the use of a QCL-based system. Recent advances in large multielement FPAs6-8) and high-resolution imaging approaches9-11 for tissue pathology have made this a much more attractive approach for fast and detailed image acquisition. QCLs represent the next step toward clinical implementation — they have demonstrated fast data acquisition, live-imaging capabilities and the ability to collect only spectral frequencies of diagnostic value.

Meet the authors

Michael Walsh holds a PhD in biological sciences and is an assistant professor at the University of Illinois at Chicago in Chicago; email: walshm@uic.edu. Matthew Barre is the business development manager at Daylight Solutions in San Diego; email: mbarre@daylightsolutions.com. Benjamin Bird is an applications scientist at Daylight Solutions in San Diego; email: bbird@daylightsolutions.com.

References

1. D.C. Fernandez et al. (2005). Infrared spectroscopic imaging for histopathologic recognition. Nat Biotechnol, Vol. 23, Issue 4, pp. 469-474.

2. C. Matthaus et al. (2008). Chapter 10: Infrared and Raman microscopy in cell biology. Methods Cell Biol, Vol. 89, pp. 275-308.

3. C. Kendall et al. (2009). Vibrational spectroscopy: a clinical tool for cancer diagnostics. Analyst, Vol. 134, Issue 6, pp. 1029-1045.

4. C. Krafft et al. (2009). Disease recognition by infrared and Raman spectroscopy. J Biophotonics, Vol. 2, Issue 1-2, pp. 13-28.

5. F.L. Martin et al. (2010). Distinguishing cell types or populations based on the computational analysis of their infrared spectra. Nat Protoc, Vol. 5, Issue 11, pp. 1748-1760.


Broadband Laser Aimed at Cancer Detection

Covering a wide swath of the mid-infrared, a new system offers greater spectral sensitivity

BY JAMES F. LOWE, WEB MANAGING EDITOR, JAMES.LOWE@PHOTONICS.COM

MUNICH, Sept. 25, 2015 — Mid-infrared (MIR) light is rich with molecular “fingerprint” information that can be used to detect substances from atmospheric pollutants to cancer cells.

While some lasers already operate in this region, enabling a variety of spectroscopy applications, their linewidth is relatively narrow, which limits the types of substances they can detect at any given moment.

Now a team of researchers from Germany and Spain has developed a laser system with phase-coherent emission from 6.8 to 16.4 μm and output power of 0.1 W. That is broad and powerful enough, they said, to detect subtle signs of cancer early in its development.

Molecules absorb portions of the MIR spectrum in ways that are unique to their atomic structures, and their absorption patterns provide a means of identifying the molecules with great specificity, even in low concentrations.


Emission spectrum


The emission spectrum of the laser and corresponding molecular fingerprint regions. Courtesy of the Institute of Photonic Sciences (ICFO).


“Cancer causes subtle modification in protein structure and content within a cell,” said professor Dr. Jens Biegert, a group leader at the Institute of Photonic Sciences (ICFO) in Barcelona. “Looking at only a few nanometer range, the probability of detection is extremely low. But comparing many of such intervals, one can have an extremely high confidence level.”

The new laser system generates MIR pulses via difference-frequency generation driven by the nonlinearly compressed pulses of a Kerr-lens mode-locked Yb:YAG thin-disc oscillator. It features a repetition rate of 100 MHz and pulse durations of 66 fs — so short that the electric field oscillates only twice per pulse.

Lab


Staff scientist Dr. Ioachim Pupeza (left) and postdoctoral researcher Oleg Pronin helped develop a laser system that emits ultrashort pulses of mid-infrared light. These pulses can be used to detect trace molecules in gaseous and liquid media. Courtesy of Thorsten Naeser/Ludwig Maximilian University.


“Since we now possess a compact source of high-intensity and coherent infrared light, we have a tool that can serve as an extremely sensitive sensor for the detection of molecules, and is suitable for serial production,” said project leader Dr. Ioachim Pupeza, a staff scientist at Ludwig Maximilian University of Munich (LMU).

The LMU and ICFO researchers aim to use their MIR laser to identify and quantify disease markers in exhaled air. Many diseases, including some types of cancer, are thought to produce specific molecules that end up in the air expelled from the lungs.

“We assume that exhaled breath contains well over 1000 different molecular species,” said Dr. Alexander Apolonskiy, an LMU group leader.

However, the amount of molecular biomarkers present in exhaled breath is extraordinarily low, meaning a diagnostic tool would need to be capable of detecting concentrations of at least one part per billion. The next step will be to couple the new laser system with a novel amplifier that would increase its brightness and boost sensitivity one part per trillion.

Detecting MIR signatures

The laser’s output spans more than one octave. Until now, the researchers said, such broadband emission has only been available from large-scale synchrotron sources.

Other more compact MIR sources, such as quantum cascade lasers (QCLs), have narrower linewidths. Tuning them to different sensing bands is time consuming, and combining multiple QCLs emitting in different parts of the MIR would be cost-prohibitive, Biegert said.

Meanwhile, the laser system’s 100-MHz pulse train is hundreds to thousands of times more powerful than state-of-the-art frequency combs that emit in the same range, the researchers said.

Detecting broadband MIR signals presents its own problems, however. Detectors for this region have poor signal-to-noise ratios unless cooled with liquid nitrogen, the researchers said.

In this case, electro-optical sampling proved to be a better option. Well-established for the terahertz range, the technique is less common in the fingerprint region.

“In the MIR range, there are not many groups who have implemented this already, because you need a broadband, phase-stable MIR pulse and an ultrashort sample pulse at the same time, which is quite challenging,” Pupeza said.

Having solved that problem with their broadband laser, the team now could use electro-optical sampling to extract the data they wanted.

In a nutshell, the process works like this: The electric field of an MIR pulse alters the birefringence of a crystal. This change can be measured by observing how the polarization of slightly shorter near-infrared (NIR) pulse is changed while propagating through the same crystal at the same time. In the end, only the NIR pulse is measured directly.

“Therefore, one big advantage is low-noise detection in the NIR, even though one obtains information on spectral components in the MIR,” said Ioachim Pupeza. “You only need to perform a Fourier transform numerically to get the spectrum of the pulse once you have its electric field.”

http://www.photonics.com/Article.aspx?AID=57757
The research was published in Nature Photonics (doi: 10.1038/nphoton.2015.179).


Read Full Post »

Renal Cell Carcinoma Classified

Larry H. Bernstein, MD, FCAP, Curator

LPBI


TCGA Analysis Points to Kidney Cancer Subtypes With Prognosis, Treatment Clues

NEW YORK (GenomeWeb) – Members of the Cancer Genome Atlas Research Network have described two molecularly distinct types within the kidney cancer papillary renal cell carcinoma, including one group containing three prognostically informative subtypes.

As they reported in the New England Journal of Medicine last night, the researchers used whole-exome sequencing, transcriptome sequencing, microRNA sequencing, proteomic analyses, and array-based methylation and copy number profiling to characterize 161 primary papillary renal cell carcinomas.

Bringing these data together, the researchers defined two main papillary renal cell carcinoma groups: type 1 tumors, which were frequently marked by glitches in the MET gene pathway, and type 2 tumors, which fell into three further subtypes with variable molecular features and patient outcomes.

The findings “really help us understand the phenotypes of sporadic papillary kidney cancer,” corresponding author Marston Linehan, a urologic oncology researcher with the National Cancer Institute, told GenomeWeb. “It also confirms that type 1 and type 2 [papillary renal cell carcinoma] really are two very separate diseases.”

It’s expected that molecular patterns within these groups could help predict disease aggressiveness in papillary renal cell carcinoma patients and, in some cases, highlight possible treatment targets.


Comprehensive Molecular Characterization of Papillary Renal-Cell Carcinoma

The Cancer Genome Atlas Research Network Group

NEJM   Nov 4, 2015     DOI: http://dx.doi.org:/10.1056/NEJMoa1505917

Papillary renal-cell carcinoma, which accounts for 15 to 20% of renal-cell carcinomas, is a heterogeneous disease that consists of various types of renal cancer, including tumors with indolent, multifocal presentation and solitary tumors with an aggressive, highly lethal phenotype. Little is known about the genetic basis of sporadic papillary renal-cell carcinoma, and no effective forms of therapy for advanced disease exist.

Type 1 and type 2 papillary renal-cell carcinomas were shown to be different types of renal cancer characterized by specific genetic alterations, with type 2 further classified into three individual subgroups on the basis of molecular differences associated with patient survival. Type 1 tumors were associated with METalterations, whereas type 2 tumors were characterized by CDKN2Asilencing, SETD2 mutations, TFE3 fusions, and increased expression of the NRF2–antioxidant response element (ARE) pathway. A CpG island methylator phenotype (CIMP) was observed in a distinct subgroup of type 2 papillary renal-cell carcinomas that was characterized by poor survival and mutation of the gene encoding fumarate hydratase (FH).

Type 1 and type 2 papillary renal-cell carcinomas were shown to be clinically and biologically distinct. Alterations in the MET pathway were associated with type 1, and activation of the NRF2-ARE pathway was associated with type 2; CDKN2A loss and CIMP in type 2 conveyed a poor prognosis. Furthermore, type 2 papillary renal-cell carcinoma consisted of at least three subtypes based on molecular and phenotypic features. (Funded by the National Institutes of Health.)

Figure 1. Somatic Alterations in Papillary Renal-Cell Carcinoma and Molecular Differences between Type 1 and Type 2 Cancers.

http://www.nejm.org/na101/home/literatum/publisher/mms/journals/content/nejm/0/nejm.ahead-of-print/nejmoa1505917/20151104-02/images/small/nejmoa1505917_f1.gif

Unsupervised clustering of DNA copy profiles of 161 papillary renal-cell carcinomas (PRCCs) (Panel A) revealed three molecular subtypes, one of which was highly enriched for type 1 tumors and the other two for type 2 tumors. SCNA denotes somatic copy-number alterations. Significantly mutated genes (SMGs) in PRCC (Panel B) were determined by considering all genes (q<0.1 [range, 0.0 to 1.0]) or focusing on the set of 260 genes previously implicated in cancer by large-scale, pan-cancer exome analyses15 (q<0.1). P values were calculated with the MutSigCV algorithm, version 2.0. A pathway-centric view of gene mutations in PRCC (Panel C) shows key pathways and genes implicated in cancer, either in the current study or elsewhere.15 The tumors were classified according to histologic type (from left to right) and according to gene or pathway altered (from top to bottom). Pathways and genes represented include MET, the Hippo pathway (NF2, SAV1, and WWC1), the NRF2 pathway (NFE2L2, KEAP1, CUL3, SIRT1, and FH), chromatin modification (CREBBP, DOTL1, EHMT1/2, EP300, EZH1/2, KAT2A/B, KDM1A/B, KDM4A/B, KDM5A/B/C, KDM6A/B, MLL1/2/3/4/5, NSD1, SETD2, SMYD4, and SRCAP), the SWI/SNF complex (ACTB, ACTL6A/B, ARID1A/B, ARID2, BCL6A/B/C, BCL11A/B, BRD7/9, DPF1/2/3, PHF10, PBRM1, SMARCA2/4

Figure 2. Alterations in Papillary Renal-Cell Carcinoma Involving the MET Oncogene.

http://www.nejm.org/na101/home/literatum/publisher/mms/journals/content/nejm/0/nejm.ahead-of-print/nejmoa1505917/20151104-02/images/small/nejmoa1505917_f2.gif

Panel A is a schematic representation of somatic mutations in MET, along with germline variant H1112R, which was previously implicated in hereditary papillary renal-cell carcinoma,17 and the novel RNA transcript variant of MET lacking the canonical exons 1 and 2 but containing a novel exon 1 that splices to the canonical exon 3. IPT denotes immunoglobulin-like, plexins, and transcription factors, and PSI plexins, semaphorins, and integrins. Panel B shows the crystal structure for the MET tyrosine kinase catalytic domain (RCSB-PDB 3I5 N18), on which are mapped the residues that are altered in papillary renal-cell carcinoma. All numbering of amino acids is based on the MET protein sequences.

We used a comprehensive genomics approach to characterize the biologic foundation of papillary renal-cell carcinoma and found that type 1 and type 2 papillary renal-cell carcinoma are distinctly different diseases and that type 2 papillary renal-cell carcinoma is a heterogeneous disease with multiple distinct subgroups. Common driver mutations among the different subtypes were relatively rare, as had been observed in two recent studies.7,30 Molecular and phenotypic differences between type 1 and type 2 papillary renal-cell carcinoma were reflected in individual and combined analyses of various data platforms. The usefulness of CDKN2A alterations as an independent prognostic marker associated with type 2 tumors requires validation. This study suggests that gene fusions involving TFE3 or TFEB are underappreciated in type 2 tumors in adults and should be considered in any patient with type 2 disease. Although papillary renal-cell carcinomas with fusions involving TFE3 or TFEB are generally considered to be diseases of children and young adults,16the mean age in our study was 52 years, and we found tumors with TFEB fusions in patients 64 and 71 years of age.

The most distinct of the three type 2 subgroups was the subgroup defined by the CIMP, which was associated with the worst overall survival. CIMP hypermethylation patterns have been observed in a number of other cancer subtypes, including glioblastoma,31 lung adenocarcinoma,32 and gastric adenocarcinoma.33 The CIMP-associated tumors showed low levels of FH mRNA expression, and five had germline or somatic mutation of FH. Germline mutation of FH has been observed in the aggressive type 2 tumor associated with the hereditary leiomyomatosis and renal-cell cancer syndrome.9,34 In this syndrome, the high levels of fumarate accumulating from loss of fumarate hydratase enzyme activity result in impaired function of enzymes such as the TET family of enzymes, which play a role in maintaining appropriate DNA methylation within the genome.35 The subgrouping of type 2 tumors according to molecular features and the presence of specific subsets of type 2 tumors, such as those with TFE3 fusions or CIMP, suggest that substratification of type 2 papillary renal-cell carcinoma according to specific molecular markers may allow more accurate diagnosis that could lead to the development of mechanistic, disease-specific targeted therapies.

This classification of papillary renal-cell carcinoma could potentially have a substantial effect on clinical and therapeutic management and on the design of clinical trials. Alteration of MET or gain of chromosome 7 was observed in a large percentage (81%) of type 1 tumors. Antitumor activity of an agent targeting the MET and VEGFR2 pathways has been shown in a phase 2 trial involving patients with papillary renal-cell carcinoma, with a particularly high response rate among patients who had tumors with MET mutations.36 Mutation of the Hippo pathway tumor suppressor, NF2, was observed in a number of papillary renal-cell carcinomas. This pathway has been targeted in other cancers with agents such as dasatinib, an inhibitor of the YES1 kinase that interacts with the YAP transcription factor that is up-regulated with Hippo pathway dysregulation.37 The CIMP-associated tumors showed a Warburg-like metabolic shift, similar to that observed in fumarate hydratase–deficient tumors in patients with the hereditary leiomyomatosis and renal-cell cancer syndrome.11,25,26 A clinical trial targeting this metabolic shift in papillary renal-cell carcinoma is currently under way (ClinicalTrials.gov number, NCT01130519). Increased expression of the NRF2-ARE pathway has been observed in both hereditary and sporadic type 2 papillary renal-cell carcinomas.12 Immunohistochemical analysis for NQO1 could provide a valuable marker of activation of the NRF2-ARE pathway. Currently, there is intense interest in the NRF2-ARE pathway in cancer,38 and novel strategies have recently been developed to target this pathway.39

The identification of altered genes and pathways provides a comprehensive foundation for an understanding of the molecular basis of papillary renal-cell carcinoma. This refined classification more accurately reflects the genotypic and phenotypic differences among the various types of these tumors and may lead to more appropriate clinical management and development of more effective forms of therapy.

Read Full Post »

Neural Networks in Alzheimer’s

Larry H. Bernstein, MD, FCAP, Curator

LPBI

SfN 2015 Recap: The Role of Synapses, Neural Networks in Alzheimer’s

Stephanie Guzowski, Editor

http://www.dddmag.com/articles/2015/11/sfn-2015-recap-role-synapses-neural-networks-alzheimers

http://www.dddmag.com/sites/dddmag.com/files/perineuronal%20nets_SfN.jpg

Perineuronal nets, shown in green, in three regions of the mouse brain. Credit: S.F. Palida et al.

Cognition and behavior rely on communication between individual neurons and extensive interactions between neural networks. But when synaptic dysfunction occurs, the results can be dire, leading to neurodegenerative symptoms in Alzheimer’s disease.

“The brain is the seed of our personal identity,” said Valina Dawson, Ph.D., director of neurogeneration and stem cell programs at Johns Hopkins University in Baltimore, Maryland. “It allows us to interact with our world but when things go wrong in the brain, it’s disastrous for the individual as well as the family.

“Our ability to treat these diseases is limited at the moment. We need new insight into what goes wrong.”

A lesser-known protein

Researchers, for years, have targeted amyloid beta (Aβ) in attempts to halt the progression of Alzheimer’s disease, and have recently, shown increased interest in the protein, tau.

But Paula Pousinha, Ph.D., at the French National Centre for Scientific Research, has focused her research on a lesser-known protein fragment: amyloid precursor protein intracellular domain (AICD). AICD is a fragment of amyloid precursor protein (APP), which is formed at the same time as Aβ in the brain. New evidence suggests that in addition to Aβ, AICD also disrupts communication between neurons during the progression of Alzheimer’s disease. Pousinha presented thesepublished findings at this year’s Society for Neuroscience (SfN) conference, which took place from October 17 to 21 in Chicago.

“Although AICD has been known for more than 10 years, it has been poorly studied,” said Pousinha.

Pousinha’s research team demonstrated that overexpressing AICD levels with AAV vector in rats’ brains “perturbs neuronal communication in the hippocampus,” a key structure necessary in forming memories and an area earliest affected in Alzheimer’s disease.

“In normal animals, if we apply to these neurons a high-frequency stimulation, afterward the neurons are stronger,” said Pousinha. “Neurons where we overexpressed AICD failed to have this potentization.”

Pousinha doesn’t negate the importance of Aβ in the development of neurodegenerative diseases. “Our study doesn’t exclude the pathological effects of Aβ,” she said. “We believe that Alzheimer’s disease is much more complex and has more than one candidate that has implications.

“It’s very important for the scientific community to understand the role of all these APP fragments of neuroinflammation — different pieces of the puzzle of how we can stop the disease progression.”

How do memories persist in the brain long term?

New research, also presented at this year’s SfN, has implications for understanding memory to develop treatments for Alzheimer’s disease and dementias. Sakina Palida, a graduate student at the University of California, San Diego found that localized modifications in the perineuronal net (PNN) at synapses could be a mechanism by which information is stably encoded and preserved in the brain over time.

“We still don’t understand how we stably encode and store memories in our brains for up to our entire lifetimes,” said Palida. The prevailing idea on how memories are maintained over time generally focus on postsynaptic proteins, said Palida. “But the problem with looking at intracellular synaptic proteins is that the majority turn over rapidly, of hours to at most a few days. So they’re very unstable.”

So, Palida and her team identified PNN as an ideal substrate for long-term memory. “Kind of like how you carve into stone — stone is a stable substrate — you retain the information regardless of what comes and goes over it.” They demonstrated that individual PNN proteins are highly stable, and that the PNN is locally degraded when synapses are strengthened.

And the team also demonstrated that mice lacking enzymes that degrade the PNN have deficient long-term, but not short-term, memory. “Which is a really exciting new result,” said Palida.

To track the PNN in live animals, Palida and her team fused a fluorescent protein to a small link protein in the PNN to allow tracking of PNN dynamics in real time. They also monitored PNN degradation in live cells after stimulating neurons with brain-derived neurotrophic factor (BDNF), a chemical secreted in the nervous system to enhance signaling — and observed localized degradation of the PNN at some newly formed synapses.

Crtl 1-Venus. Fusion of a fluorescent protein to small link proteins in the PNN allows tracking of PNN dynamics over time. Credit: S.F. Palida et al. Crtl1-Venus Neurons. Tracking PNN dynamics in live cells, in mouse brain tissue. Credit: S.F. Palida et al.

What’s next? “We’re currently making transgenic animals to express this protein, which would allow us to monitor PNN dynamics simultaneously with synaptic dynamics in a live animal brain, and really investigate this hypothesis further,” said Palida.

Increased APP intracellular domain (AICD) production perturbs synaptic signal integration via increased NMDAR function

*Paula A Pousinha1PubmedElisabeth Raymond1PubmedXavier Mouska1PubmedMichael Willem2PubmedHélène Marie1Pubmed

1660 Route de Lucioles, CNRS IPMC UMR 7275, Valbonne, France; 2Ludwig-Maximilians-University Munich, Munich, Germany

Alzheimer’s disease (AD) is a neurodegenerative disease that begins as mild short-term memory deficits and culminates in total loss of cognition and executive functions. The main culprit of the disease, resulting from Amyloid-Precursor Protein (APP) processing, has been thought to be amyloid-b peptide (Ab). However, despite the genetic and cell biological evidence that supports the amyloid cascade hypothesis, it is becoming clear that AD etiology is complex and that Ab alone is unable to account for all aspects of AD [Pimplikar et al. J Neurosci.30: 14946. 2010]. Gamma-secretase not only liberates Ab, but also its C-terminal intracellular counterpart called APP intracellular domain (AICD) [Passer. et al. JAlzheimers Dis.2: 289-301. 2000], which is known to also accumulate in AD patient’s brain [Ghosal et al. PNAS.106:18367. 2009], but surprisingly little is known about its functions in the hippocampus. To address this crucial issue, we increased AICD production in vivo in adult CA1 pyramidal neurons, mimicking the human pathological condition. Different ex-vivo electrophysiological and pharmacological approaches, including double- patch of neighbor neurons were used. We clearly demonstrate that in vivo AICD production increases synaptic NMDA receptor currents. This causes a frequency-dependent disruption of synaptic signal integration, leading to impaired long-term potentiation, which we were able to rescue by different pharmacological approaches. Our results provide convincing and entirely novel evidence that increased in vivo production of AICD is enough, per se, to cause synaptic dysfunction in CA1 hippocampal neurons.

131.21P2X2R-FE65 interaction induces synaptic failure and neuronal dyshomeostasis after treatments with soluble oligomers of amyloid beta peptide

300.15Early synaptic deficits in Alzheimer’s disease involve neuronal adenosine A2A receptors

215.08Homeostatic coupling between surface trafficking and cleavage of amyloid precursor protein

280.11A novel mechanism for lowering Abeta

383.22Impact of intracellular soluble oligomers of amyloid-β peptide on glutamatergic synaptic transmission

Society for Neuroscience Annual Meeting Showcases Strides in Brain Research

10/23/2015 – Stephanie Guzowski, Editor

CHICAGO – Nearly 30,000 researchers from more than 80 countries gathered this week at the annual Society for Neuroscience (SfN) meeting, the world’s largest conference focused on scientific discovery related to the brain and nervous system.

The 45th annual SfN meeting at McCormick Place convention center showcased more than 15,000 scientific presentations on advances in technologies and new research about brain structure, disease and treatments, and 517 exhibitors, according to event organizers.

Presentations covered a wide variety of topics including new technologies to study the brain, the science behind addiction, potential treatments for spinal cord injuries, and the role of synapses in neurological conditions.

Of particular focus was the Brain Research through Advancing Innovative Neurotechnologies (BRAIN) Initiative, the large collaborative quest to develop technologies for a dynamic view of the brain. In early October, the National Institutes of Health announced its second round of funding to support goals, bringing the NIH investment to $85 million in fiscal year 2015.

Toxic Tau Could be Key to Alzheimer’s Treatment

01/06/2015 – Stephanie Guzowski, Editor

http://www.dddmag.com/articles/2015/01/toxic-tau-could-be-key-alzheimers-treatment

http://www.dddmag.com/sites/dddmag.com/files/tangles_Alz2.jpg

“But now, we know that tau is not simply a bystander but also a player,” Li said. “Both proteins work together to damage cell functions as the disease unfolds.”

Targeting tau

In the healthy brain, tau protein helps with the building and functioning of neurons. But when tau malfunctions, it creates abnormal clumps of protein fibers—neurofibrillary tangles—which spread rapidly throughout the brain. This highly toxic and altered form of the brain protein tau is called “tau oligomer.”

“There’s growing evidence that tau oligomers, not tau protein in general, are responsible for the development of neurodegenerative diseases, like Alzheimer’s,” said Julia Gerson, a graduate student in neuroscience at the University of Texas Medical Branch.

In Gerson’s research, which she presented at this year’s Society for Neuroscience meeting in Washington, D.C., Gerson and her team injected tau oligomers from people with Alzheimer’s into the brains of healthy mice. Subsequent testing revealed that the mice had developed memory loss.

“When we inject mice with tau oligomers, we see that they spend the same amount of time exploring a familiar object as an unfamiliar object,” said Gerson. “So they’re incapable of remembering that they’ve already seen this familiar object.”

What’s more, the molecules had multiplied throughout the animals’ brains. “This suggests that tau oligomers may spread from the injection site to other unaffected regions,” said Gerson.

Future treatments

Understanding tau’s connection to Alzheimer’s could have implications for potential therapies. “If we can stop the spread of these toxic tau oligomers, we may be capable of either preventing, or reversing, symptoms,” said Gerson. Gerson’s lab is currently investigating antibodies, which specifically fight tau oligomers.

Click to Enlarge. Normal brain vs. Alzheimer’s brain (Credit: Garrondo)

Erik Roberson, M.D., Ph.D., at the University of Alabama at Birmingham, and colleagues looked at how boosting the function of a specific type of neurotransmitter receptor, the NMDA receptor, provided benefit to people with the second most common type of dementia: frontotemporal dementia (FTD), a disease in which people experience rapid and dramatic changes in behavior, personality and social skills. People often quickly deteriorate and usually die about three years after diagnosis; there is also no effective treatment for FTD.

Since mutated tau impairs synapses—the connections between neurons—by reducing the size of NMDA receptors, “boosting the function of remaining NMDA receptors may help restore synaptic firing, and reverse behavioral abnormalities,” said Roberson.

Roberson’s, along with others’ work presented at the Society of Neuroscience meeting, focused on using animal models that mimic developing tau pathology. “These new mouse models, which contain both tau tangles and amyloid plaques” said Dr. Li, “offer the possibility of more accurately testing therapies directed at delaying the onset of amyloid beta plaques, tau accumulation and neuronal loss, all characteristic features of Alzheimer’s.”

Are clinical trials next?

Potentially, yes. “This arena of academic research has been ongoing for several years—it’s a younger area in terms of involvement of drug discovery,” said Sangram Sisodia, Ph.D., director of the Center for Molecular Neurobiology at the University of Chicago. “But I believe there is growing interest in pharma companies about targeting tau.

“The tau protein plays an incredibly complex role in the development of Alzheimer’s and other neurodegenerative diseases,” said Sisodia. “We are in the early stages of understanding that role, which will be crucial for developing effective preventions or treatments.”

Read Full Post »

MYBPC3 gene and the heart

Larry H. Bernstein, MD, FCAP, Curator

LPBI


MYBPC3 myosin binding protein C, cardiac [ Homo sapiens (human) ]

http://www.ncbi.nlm.nih.gov/gene/4607

MYBPC3 provided by HGNC
Official Full Name – myosin binding protein C, cardiac provided by HGNC
Primary source – HGNC:HGNC:7551 ;
See related Ensembl:ENSG00000134571; HPRD:02980; MIM:600958; Vega:OTTHUMG00000166986
Gene type protein coding RefSeq status
REVIEWED Organism Homo sapiens
LineageEukaryota; Metazoa; Chordata; Craniata; Vertebrata; Euteleostomi; Mammalia; Eutheria; Euarchontoglires; Primates; Haplorrhini; Catarrhini; Hominidae; Homo
Also known asFHC; CMH4; CMD1MM; LVNC10; MYBP-C

SummaryMYBPC3 encodes the cardiac isoform of myosin-binding protein C. Myosin-binding protein C is a myosin-associated protein found in the cross-bridge-bearing zone (C region) of A bands in striated muscle. MYBPC3, the cardiac isoform, is expressed exclussively in heart muscle. Regulatory phosphorylation of the cardiac isoform in vivo by cAMP-dependent protein kinase (PKA) upon adrenergic stimulation may be linked to modulation of cardiac contraction. Mutations in MYBPC3 are one cause of familial hypertrophic cardiomyopathy. [provided by RefSeq, Jul 2008]


What is the official name of the MYBPC3 gene?

The official name of this gene is “myosin binding protein C, cardiac.”

MYBPC3 is the gene’s official symbol. The MYBPC3 gene is also known by other names, listed below.

Read more about gene names and symbols on the About page.


What is the normal function of the MYBPC3 gene?

The MYBPC3 gene provides instructions for making the cardiac myosin binding protein C (cardiac MyBP-C), which is found in heart (cardiac) muscle cells. In these cells, cardiac MyBP-C is associated with a structure called the sarcomere, which is the basic unit of muscle contraction. Sarcomeres are made up of thick and thin filaments. The overlapping thick and thin filaments attach to each other and release, which allows the filaments to move relative to one another so that muscles can contract. Regular contractions of cardiac muscle pump blood to the rest of the body.

In cardiac muscle sarcomeres, cardiac MyBP-C attaches to thick filaments and keeps them from being broken down. Cardiac MyBP-C has chemical groups called phosphate groups attached to it; when the phosphate groups are removed, cardiac MyBP-C is broken down, followed by the breakdown of the proteins of the thick filament. Cardiac MyBP-C also regulates the rate of muscle contraction, although the mechanism is not fully understood.


Does the MYBPC3 gene share characteristics with other genes?

The MYBPC3 gene belongs to a family of genes called fibronectin type III domain containing(fibronectin type III domain containing). It also belongs to a family of genes called immunoglobulin superfamily, I-set domain containing (immunoglobulin superfamily, I-set domain containing). It also belongs to a family of genes called MYBP (myosin binding proteins).

A gene family is a group of genes that share important characteristics. Classifying individual genes into families helps researchers describe how genes are related to each other. For more information, see What are gene families? in the Handbook.

http://ghr.nlm.nih.gov/gene/MYBPC3


Aliases for MYBPC3 Gene

http://www.genecards.org/cgi-bin/carddisp.pl

  • Myosin Binding Protein C, Cardiac 2 3
  • C-Protein, Cardiac Muscle Isoform 3 4
  • CMD1MM 3 6
  • LVNC10 3 6
  • CMH4 3 6
  • Myosin-Binding Protein C, Cardiac-Type 3
  • Myosin-Binding Protein C, Cardiac 2
  • Cardiac MyBP-C 4
  • MYBP-C 3
  • FHC 3


GO – Molecular functioni

http://www.uniprot.org/uniprot/Q14896

GO – Biological processi

Keywords – Molecular functioni

Muscle protein

Keywords – Biological processi

Cell adhesion

Keywords – Ligandi

Actin-binding, Metal-binding, Zinc

Enzyme and pathway databases


Organization and Sequence of Human Cardiac Myosin Binding Protein C Gene (MYBPC3) and Identification of Mutations Predicted to Produce Truncated Proteins in Familial Hypertrophic Cardiomyopathy

Lucie Carrier, Gisele Bonne, Ellen Bahrend, Bing Yu, Pascale Richard, Florence Niel, Bernard Hainque, et al.

Circulation Research.1997; 80: 427-434   http://dx.doi.org:/10.1161/01.res.0000435859.24609.b3

Cardiac myosin binding protein C (MyBP-C) is a sarcomeric protein belonging to the intracellular immunoglobulin superfamily. Its function is uncertain, but for a decade evidence has existed for both structural and regulatory roles. The gene encoding cardiac MyBP-C (MYBPC3) in humans is located on chromosome 11p11.2, and mutations have been identified in this gene in unrelated families with familial hypertrophic cardiomyopathy (FHC). Detailed characterization of the MYBPC3 gene is essential for studies on gene regulation, analysis of the role of MyBP-C in cardiac contraction through the use of recombinant DNA technology, and mutational analyses of FHC. The organization of human MYBPC3 and screening for mutations in a panel of French families with FHC were established using polymerase chain reaction, single-strand conformation polymorphism, and sequencing. The MYBPC3 gene comprises >21 000 base pairs and contains 35 exons. Two exons are unusually small in size, 3 bp each. We found six new mutations associated with FHC in seven unrelated French families. Four of these mutations are predicted to produce truncated cardiac MyBP-C polypeptides. The two others should each produce two aberrant proteins, one truncated and one mutated. The present study provides the first organization and sequence for an MyBP-C gene. The mutations reported here and previously in MYBPC3 result in aberrant transcripts that are predicted to encode significantly truncated cardiac MyBP-C polypeptides. This spectrum of mutations differs from the ones previously observed in other disease genes causing FHC. Our data strengthen the functional importance of MyBP-C in the regulation of cardiac work and provide the basis for further studies.

Cardiac MyBP-C is a member of a family comprising isoforms specific for slow-skeletal, fast-skeletal, and cardiac muscles. The skeletal isoforms were initially described in 1971 [1] and later came to be recognized as proteins with specific myosin- and titin-binding properties located in the A bands of the thick filaments of all vertebrate cross-striated muscle and forming a series of seven to nine transverse stripes, 43 nm apart, in the crossbridgebearing region. [2-5] Subsequent cloning of the three isoforms showed them to belong to the intracellular immunoglobulin superfamily and to share a conserved domain pattern consisting of IgI set domains and fn-3 domains. [6-11]

Comparison of the cardiac and the skeletal MyBP-C isoform sequences reveals three distinct regions that are specific to the cardiac isoform: the N-terminal domain C0 IgI containing 101 residues, the MyBP-C motif (a 105-residue stretch linking the C1 and C2 IgI domains), and a 28-residue loop inserted in the C5 IgI domain. [7,12,13] The MyBP-C motif is not specific to the cardiac isoform, but the alignment of skeletal and cardiac sequences revealed the addition of a nine-residue loop in the cardiac variant, which is the key substrate site for phosphorylation by both protein kinase A and a calmodulin-dependent protein kinase associated with the native protein. [7] As for the 28-residue loop, it is strictly cardiac specific. [14,15] The major myosin-binding site of MyBP-C resides in the C-terminal C10 IgI domain and is mainly restricted to the last 102 amino acids. [16-18] The titin-binding site is also located in the C-terminal region, spanning the C8 to C10 IgI domains of the molecule. [6,13]

The function of MyBP-C is uncertain, but for a decade evidence has existed to indicate both structural and regulatory roles. It should be stressed, however, that most studies were performed on skeletal muscles and that very little functional data exist for cardiac muscle. Several investigators have shown that MyBP-C modulates in vitro the shape and the length of sarcomeric thick filaments [19-21] and that depending on ionic strength and the molar ratio of actin and myosin in solution, the addition of MyBP-C can modulate the actin-activated ATPase activity of skeletal and cardiac myosins. [3,22,23] Partial extraction of the MyBP-C from rat skinned cardiac myocytes and rabbit skeletal muscle fibers alters Ca2+-sensitive tension, supporting the view that contractile function is affected by MyBP-C. [24] This view was very recently strengthened by the elegant studies of Weisberg and Winegrad. [25] These authors showed that phosphorylation of cardiac MyBP-C alters myosin crossbridges in native thick filaments isolated from rat ventricles and suggested that MyBP-C can modify force production in activated cardiac muscles.

The gene encoding the cardiac isoform in humans (MYBPC3) was assigned to the chromosomal location 11p11.2 [7] in a region where we had identified the CMH4 disease locus in FHC. [26] Recently, three mutations in MYBPC3 have been identified in unrelated families with FHC by our group [27] and others. [28] FHC is a genetically and phenotypically heterogeneous disease, transmitted as an autosomal-dominant trait. None of the previous hypotheses of the pathophysiological mechanisms would have predicted that defects in sarcomeric protein genes could be a possible molecular basis for the disease. The results of molecular genetic studies have nevertheless shown that many forms of the disease involve mutations in genes encoding sarcomeric proteins (for reviews, see [29-31]), and the findings that MYBPC3 is one of these disease genes are consistent with the view that cardiac MyBP-C may play a more important role in the regulation of cardiac contraction than was previously thought.

Detailed characterization of the MYBPC3 gene is essential for studies of gene regulation, analysis of the role of cardiac MyBP-C in the sarcomere structure and function through the use of recombinant DNA technology, and, finally, mutational analyses and further studies in FHC. In the present work, we have determined the organization and sequence of the human MYBPC3 gene and shown it to exceed 21 000 bp in size and to contain 35 exons, out of which 34 are coding. We also report that six new mutations in the MYBPC3 gene are associated with FHC in seven unrelated French families. Four of these mutations are predicted to produce truncated cardiac MyBP-C polypeptides in these families. The two others should each produce two aberrant proteins, one truncated and the other mutated or deleted.


Screening the Human MYBPC3 Gene for Mutations

The primers were constructed on the basis of flanking intron sequences and were used to amplify each exon (see Table 1). The touchdown PCR was performed (as described above according to the conditions reported in Table 1) on genomic DNA from unrelated FHC patients. For SSCP, PCR products were denatured for 5 minutes at 96 degrees C in a standard denaturing buffer, kept on ice for 5 minutes, loaded onto 6% to 10% polyacrylamide gels, and then run at 6 mA and at 7 degrees C or 20 degrees C in a Hoeffer apparatus. The bands were visualized after silver staining of the gels (Bio-Rad). Sequencing was performed as described above.

Table 1.

Oligonucleotide Primers and PCR Conditions for Detection of Mutations in Human MYBPC3 Gene

RNA Isolation, cDNA Synthesis, and MYBPC3 cDNA Amplifications

Total cellular RNA was isolated from human lymphoblastoid cell lines using RNA Plus (Bioprobe Systems), and the cDNA synthesis was performed as previously described. [27] The cDNA products were amplified in a 50-micro L PCR reaction using two outer primers (see Table 2). A second round of PCR was performed with a final dilution of 1:100 of the first round products, using nested primers (see Table 2). The primers were determined according to the cDNA sequence (EMBL accession number X84075), and cDNA fragments were amplified using a touchdown PCR protocol between 70 degrees C and 60 degrees C. Sizes of normal and mutated cDNA-PCR fragments were assessed, followed by size-fractionation on agarose gels. After extraction and purification of the normal and the putative mutated cDNAs, they were cloned using pGEM-T System II (Promega) and then sequenced as described above.

Table 2.

Oligonucleotide Primers for MYBPC3 cDNA Amplifications

Genomic Organization and Sequence of Human MYBPC3

The size of introns was first estimated by PCR amplification of DNA segments between exons from control genomic DNA, followed by size-fractionation of the PCR products on agarose gels. The exon/intron boundaries and the entire intronic sequences were then determined by sequencing. The sequences have been deposited with EMBL (accession number Y10129). The schematic organization of the human MYBPC3 gene and the alignment of exons with structural domains in the protein are shown in Figure 1. The gene comprises >21 000 bp and contains 35 exons, out of which 34 are coding. A (GT) repeat was found in intron 20 (data not shown). The 101-residue N-terminal extra IgI domain is encoded by exons 1 to 3; the proline-rich domain (51 residues), by exons 3 and 4; the C1 IgI domain (104 residues), by exons 4 to 6; the MyBP-C motif (105 residues), by exons 6 to 12; the C2 IgI domain (91 residues), by exons 12 to 16; the C3 IgI domain (91 residues), by exons 16 to 18; the C4 IgI domain (90 residues), by exons 18 to 20; the linker (11 residues), by exons 20 and 21; the C5 IgI domain (127 residues), by exons 21 to 24; the C6 fn-3 domain (98 residues), by exons 24 to 26; the C7 fn-3 domain (101 residues), by exons 26 to 28; the C8 IgI domain (95 residues), by exons 28 to 30; the C9 fn-3 domain (115 residues), by exons 30 to 32; and the C-terminal C10 IgI domain (94 residues), by exons 32 to 34.

Figure 1.

Schematic organization of the human MYBPC3 gene and alignment of exons with structural domains of the protein. Top, The structural domains of cardiac MyBP-C. The high-affinity myosin heavy chain domain (confined to the C10 IgI repeat), the titin binding site (C8 to C10), and the phosphorylation sites are indicated. Middle, The mRNA with the limits of exons. Bottom, the schematic organization of the gene with locations of exons shown by boxes and introns shown by horizontal lines. The exons are numbered from the 5 prime end of the gene, with exon 1 containing the first codon ATG. The exons coding for structural domains are indicated by interrupted lines.

The sizes of exons and introns are summarized in Table 3. The exon sizes, excluding the 5 prime and 3 prime untranslated regions, vary between 3 and 267 bp. Two of the exons, ie, exons 10 and 14, are unusually small and contain three nucleotides each. The remaining 32 exons vary in size between 18 and 267 bp. Twenty-seven exons finish with a split codon (see Table 3). The intron sizes vary between 85 and [nearly =]2000 bp. The major consensus donor splice site is GTGAG in 53% of the cases, and the major consensus acceptor splice site is CAG in 91% of the cases. Twenty-seven of the 34 introns contain putative branch point sequences located -14 to -51 upstream from each splice acceptor site. Introns 1, 4, 11, 14, 16, 24, and 31 do not contain any known consensus branch point sequence.

Table 3.

Exon-Intron Boundaries in the Human MYBPC3 Gene Identification of Mutations in MYBPC3 Gene Associated With FHC

Because the families were not large enough to assess linkage on the basis of a statistically significant Lod score, we used haplotype analysis to define the disease locus responsible for FHC in each family. Linkage was established on the basis of the transmission of a common haplotype in affected individuals and exclusion on the basis of affected recombinant individuals. Families 717 and 740 presented linkage only to CMH4, and the other five families (families 702, 716, 731, 750, and 754) were less informative but at least potentially linked to CMH4 (data not shown).

All the exon-intron boundaries were analyzed by PCRSSCP according to the conditions described in Table 2. A total of six new mutations were identified in MYBPC3 associated with FHC in seven unrelated French families (Figure 2 andFigure 3, Table 4).

Table 4.

Consequences at mRNA Level of MYBPC3 Mutations

Figure 2.

Pedigrees of families with MYBPC3 gene mutations. Clinical affection status is indicated: darkened, affected; clear, unaffected; and clear with a cross, indeterminate. Genetically affected status is indicated by an asterisk. The mutations (M) are as follows: M1, GTGAG[arrow right]GTGAA splice donor site mutation in intron 7; M2, GAA[arrow right]CAA mutation in exon 17; M3, GT[arrow right]AT splice donor site mutation in intron 23; M4, TGAT[arrow right]TGGT transversion in the branch point consensus sequence of intron 23; M5, [-GCGTC] deletion in exon 25; and M6, duplication [+TTCAAGAATGGC]/deletion [-ACCT] in exon 33.

Figure 3.

Normal and mutated cardiac MyBP-C polypeptides. N indicates the normal structure of human cardiac MyBP-C; M1 to M6 correspond to the predicted products of the aberrant MyBP-C cDNAs resulting from the different mutations.

M1 is a GTGAG[arrow right]GTGAA transition in the 3 prime splice donor site of intron 7 in family 717. The G residue at position +5 in the intron is a highly conserved nucleotide in the splice donor consensus sequence. [33] The G[arrow right]A mutation inactivates this donor site. Amplification of MYBPC3 cDNA from patients’ lymphocytes identified the skipping of the 49-bp exon 7 that produces a frameshift. No alternative splice donor site was found in intron 7. The aberrant cDNA encodes 258 normal cardiac MyBP-C residues, followed by 25 new amino acids, and a premature termination of translation. This should produce a large truncated protein (-80%) lacking the MyBP-C motif containing the phosphorylation sites and the titin and myosin binding sites.

M2 is a G[arrow right]C transversion at position 1656 in exon 17 in families 702 and 750 that produces a mutated polypeptide in the C3 domain at the position 542 (Glu[arrow right]Gln). Otherwise, this mutation affects the last nucleotide of the exon, which is part of the consensus splicing site. [34] A common feature in human exon-intron boundaries is that 80% of exons finish with a guanine (85% in MYBPC3). This mutation also results in an aberrant transcript in lymphocytes (with the skipping of exon 17) that directly introduces a stop codon. The aberrant cDNA encodes 486 normal cardiac MyBP-C residues, leading to a truncated protein (-62%) that lacks the titin and myosin binding sites.

M3 is a GT[arrow right]AT transition in the 3 prime splice donor site of intron 23 in family 716 that inactivates this splicing site. This mutation produces the skipping of the 160-bp exon 23. No alternative splice donor site was found in lymphocytes. The mutated cDNA identified in lymphocytes encodes 717 normal residues and then 51 novel amino acids, followed by premature termination of the translation in the C5 domain, leading to a potential truncated protein (-44%) that loses the titin and myosin binding domains.

M4 is a TGAT[arrow right]TGGT transition in intron 23 in family 740. This A[arrow right]G mutation inactivates a potential branch point consensus sequence (URAY). Although three potential branch points exist upstream from the mutation, they do not seem to be used, since analysis of the transcripts in lymphocytes indicates the existence of two aberrant cDNAs. One corresponds to the skipping of the 105-bp exon 24 without frameshift and encodes a polypeptide depleted of 35 amino acids in the C6 domain (-50% of C6). The other still contains the 724-bp intron 23. This mutant cDNA is associated with a frameshift: it encodes 770 normal cardiac MyBP-C residues and then 100 novel amino acids, followed by a stop codon, and the corresponding truncated protein (-40%) should not interact with either titin or myosin.

M5 is a 5-bp deletion (-GCGTC) in exon 25 in family 731. This deletion also produces a frameshift: the aberrant cDNA identified in the lymphocytes encodes 845 normal MyBP-C residues and then 35 novel amino acids, followed by a premature stop codon in the C6 domain that should produce a truncated protein (-34%), losing the C-terminal region containing both the titin- and myosin-binding sites.

M6 is a 12-bp duplication (+TTCAAGAATGGC)/4-bp deletion (-ACCT) in exon 33 in family 754. This modification introduces a frameshift at position 3691 that leads to 1220 normal MyBP-C residues and then 19 novel amino acids, followed by a premature stop codon in the last third part of the C10 domain. The predicted truncated protein (-4%) should also lose part of its myosin binding site.

All these six mutations were absent in 200 samples from control unrelated subjects without FHC and also in 42 unrelated probands with FHC (out of which 8 have mutations in MYBPC3, 8 have mutations in the beta-myosin heavy chain gene [MYH7], 1 has a mutation in the cardiac troponin T gene, and 25 have presently undefined mutations).

Discussion

The present work describes the first genomic organization for an MyBP-C. The gene is over 21 000 bp and contains 35 exons. An interesting feature of the organization of this gene is that there is a striking correspondence between the limits of the exons and those of structural domains (Figure 1). The IgI and fn-3 domains are encoded by two or three exons. The linker region between the IgI C4 and IgI C5 domains corresponds to exon 20. Twenty-six of the 28 cardiac-specific amino acids of the IgI C5 domain correspond to exon 22. Finally, the MyBP-C motif is encoded by the most complex exon structure: the nine cardiac-specific amino acids correspond to exon 8, and the four phosphorylation sites described by Gautel et al [7] are encoded by six exons and are located at the end or at the junction of two exons (phosphorylation sites: A, junction of exons 7 and 8; B, end of exon 8; C, end of exon 9, exon 10, and beginning of exon 11; and D, end of exon 12). The correlation between exonic organization and protein structure has also recently been described concerning the titin, [35] suggesting a common feature for the intracellular immunoglobulin superfamily.

We suggest that the new mutations described here cause FHC because they segregate with the disease, are not present in controls, and result in aberrant transcripts that are predicted to encode significantly altered cardiac MyBP-C polypeptide structure and/or function. They are all transcribed into mRNAs in lymphocytes. However, because most, if not all, genes in humans are thought to be transcribed at very low levels in lymphocytes (“illegitimate transcription”), [36] these results do not address the hypothesis that these mutations are expressed in the diseased myocardium. Since cardiac MyBP-C is specifically expressed in heart, ventricular tissue is needed to address this issue, and we had no access to any myocardial specimens. One study documented the expression of a missense mutation in the mRNA for the beta-myosin heavy chain in myocardial tissue from an affected patient with FHC. [37] Because the beta-myosin heavy chain is normally expressed in slow-twitch skeletal fibers, skeletal muscle biopsies can also be used to show that the mutated myosin is produced in the muscle and that the mutation alters the function of the beta-myosin and the contractile properties of the muscle fibers. [38,39] One might thus reasonably assume that the MYBPC3 gene mutations are expressed in the myocardium and that they exert their effect by altering the multimeric complex assembly of the cardiac sarcomere via at least one of these mechanisms: (1) They can act as “poison polypeptides” through a dominant-negative effect. The altered proteins would be incorporated in the sarcomere and would alter the assembly of the sarcomeric filaments, since most truncated MyBP-Cs are unable to cross-link the titin and/or myosin molecules. (2) They can act as “null alleles,” potentially leading to haplo insufficiency; the production of insufficient quantities of normal cardiac MyBP-C would produce an imbalance in stoichiometry of the thick-filament components that would be sufficient to alter the sarcomeric structure and function. (3) Since myosin, titin, and MyBP-C might be translated and assembled cotranslationally, one can also assume that the misfolded, mutated MYBPC3 mRNAs may disturb the translation of the other sarcomeric components that would interfere with the proper assembly of sarcomeric structures.

The full spectrum of mutations of the FHC disease genes is far from known, but it is intriguing to note that most mutations found so far in MYH7 are missense ones, whereas most of those in MYBPC3 disrupt the reading frame and produce premature stop codons. Both genes are large ones, composed of [nearly =]40 exons, and there are no reasons for different types of mutations in the two genes. Thus, one might hypothesize that mutations leading to truncated proteins exist also for MYH7 in humans but have no deleterious effect. In support of this are the reports of two deletions in the C-terminal part of the beta-myosin heavy chain molecule with almost no phenotype. One is a 2.4-kbp deletion including part of intron 39 and exon 40 containing the 3 prime untranslated region and the polyadenylation signal, which was reported in a small pedigree. [40] Only the proband had developed clinically diagnosed hypertrophic cardiomyopathy at a very late onset (age, 59 years), and the other genotypically affected family members had not developed the disease at 10, 32, and 33 years. The other one is a large deletion leaving only a short variant of the beta-myosin heavy chain constituting only the first 53 residues of the molecule (out of 1935). This deletion was found by chance in an unaffected individual. [41] For MYBPC3, in contrast, the majority of the mutations described so far produce the C-terminal truncation of the cardiac MyBP-C polypeptides and are associated with an FHC phenotype. However, no definitive conclusion can be drawn at this stage concerning the pathogenic mechanisms of mutations in these two genes. The present work provides the molecular basis for the production of transgenic animals for cardiac MyBP-C that will help to resolve some of these issues.

Footnotes
  • Received December 2, 1996; accepted January 10, 1997.

  • This manuscript was sent to Laurence Kedes, Consulting Editor, for review by expert referees, editorial decision, and final disposition.

  • Selected Abbreviations and Acronyms
    EMBL
    European Molecular Biology Laboratory
    FHC
    familial hypertrophic cardiomyopathy
    fn-3
    fibronectin III
    MyBP-C
    myosin binding protein C
    PCR
    polymerase chain reaction
    SSCP
    single-strand conformation polymorphism analysis
  1. 1.↵
  2. 2.↵
  3. 3.↵
  4. 4.↵
  5. 5.↵
  6. 6.↵
  7. 7.↵
  8. 8.↵
  9. 9.↵
  10. 10.↵
  11. 11.↵
  12. 12.↵
  13. 13.↵
  14. 14.↵
  15. 15.↵
  16. 16.↵
  17. 17.↵
  18. 18.↵
  19. 19.↵
  20. 20.↵


MYBPC3 – Hypertrophic Cardiomyopathy Testing

http://www.cincinnatichildrens.org/workarea/downloadasset.aspx?id=90111
Hypertrophic Cardiomyopathy (HCM) is relatively common, with a prevalence of 1 in 500 adults (1). HCM is a primary disorder of heart muscle characterized by left ventricular hypertrophy. The most classic finding in HCM is asymmetric septal hypertrophy, with or without left ventricular outflow tract obstruction. The disease demonstrates extensive clinical variability with regard to age of onset, severity and progression of disease. HCM can affect infants and children although it is more typically identified in adolescence or adulthood (2,3).

The MYBPC3 gene codes for cardiac myosin binding protein C. Phosphorylation of this protein modulates contraction and is an important component of the sarcomere (4). The MYBPC3 gene contains 35 exons and is located at chromosome 11p11.2. Up to 40% of individuals with a clinical diagnosis of HCM have MYBPC3 mutations (2). MYBPC3 mutations are inherited in an autosomal dominant manner. The majority of individuals inherit the MYBPC3 from a parent, although de novo mutations do occur. Mutations in MYBPC3 and MYH7 genes are the most common causes of HCM. However, the disease is genetically heterogeneous and sequencing additional genes should be considered if familial HCM is suspected or the underlying etiology remains unknown. Approximately 50-65% of individuals with a known or suspected diagnosis of familial HCM have a mutation in one of a number of genes encoding components of the sarcomere and cytoskeleton (3). Compound heterozygous mutations have been reported in MYBPC3 and other genes associated with HCM (5). Mutations in the MYBPC3 gene have been primarily associated with HCM, but can also be associated with other types of heart muscle disease including dilated cardiomyopathy, restrictive cardiomyopathy and left-ventricular non-compaction (6).
Indication MYBPC3 testing is utilized to confirm a diagnosis of HCM in patients with clinically evident disease. Genetic testing also allows for early identification and diagnosis of individuals at greatest risk prior to the expression of typical clinical manifestations. If a mutation is identified in an asymptomatic individual, regular and routine outpatient follow up is indicated. If clinically unaffected members of a family with an identified mutation for HCM are found not to carry that mutation, they can be definitely diagnosed as unaffected and reassured that neither they nor their children will be at higher risk compared to the general population to develop symptoms related to HCM. A negative test result in an individual with a known familial mutation also eliminates the need for routine follow up.
Methodology:
All 35 exons of the MYBPC3 gene, as well as the exon/intron boundaries and a portion of untranslated regions of the gene are amplified by PCR. Genomic DNA sequences from both forward and reverse directions are obtained by automatic fluorescent detection using an ABI PRISM® 3730 DNA Analyzer. Sequence variants different from National Center for Biotechnology Information GenBank references are further evaluated for genetic significance. If a mutation is identified, a known familial mutation analysis will be available for additional family members.
Sensitivity & Accuracy:
Greater than 98.5% of the mutations in exon 1-35 of MYBPC3 are detectable by sequence based methods. Sequencing does not detect deletions or duplications. Mutations in MYBPC3 account for up to 40% of cases of idiopathic hypertrophic cardiomyopathy.
References:
1. Maron BJ, Gardin JM, Flack JM, Gidding SS, Kurosaki TT, Bild DE. Prevalence of hypertrophic cardiomyopathy in a general population of young adults. Echocardiographic analysis of 4111 subjects in the cardia study. Coronary artery risk development in (young) adults. Circulation. 1995;92:785-789.
2. Kaski JP, Syrris P, Esteban MT, Jenkins S, Pantazis A, Deanfield JE, McKenna WJ, Elliott PM. Prevalence of sarcomere protein gene mutations in preadolescent children with hypertrophic cardiomyopathy. Circulation Cardiovascular Genetics. 2009;2:436441.
3. Morita H, Rehm HL, Menesses A, McDonough B, Roberts AE, Kucherlapati R, Towbin JA, Seidman JG, Seidman CE. Shared genetic causes of cardiac hypertrophy in children and adults. The New England Journal of Medicine. 2008;358:1899-1908.
4. van Dijk SJ, Dooijes D, dos Remedios C, Michels M, Lamers JM, Winegrad S, Schlossarek S, Carrier L, ten Cate FJ, Stienen GJ, van der Velden J. Cardiac myosin-binding protein c mutations and hypertrophic cardiomyopathy: Haploinsufficiency, deranged phosphorylation, and cardiomyocyte dysfunction. Circulation. 2009;119:1473-1483.
5. Van Driest SL, Vasile VC, Ommen SR, Will ML, Tajik AJ, Gersh BJ, Ackerman MJ. Myosin binding protein c mutations and compound heterozygosity in hypertrophic cardiomyopathy. Journal of the American College of Cardiology. 2004;44:1903-1910.
6. Hershberger RE, Norton N, Morales A, Li DX, Siegfried JD, Gonzalez-Quintana J. Coding sequence rare variants identified in MYBPC3, MYH6, TPM1, TNNC1, and TNNI3 from 312 patients with familial or idiopathic dilated cardiomyopathy. CirculationCardiovascular Genetics. 2010;3:155-161.

Read Full Post »

Keeping Stem Cells in Check

Larry H. Bernstein, MD, FCAP, Curator

LPBI

Researchers track gene that keeps stem cells in check      

“Prkci” influences whether stem cells self-renew or differentiate into more specialized cell types

http://news.usc.edu/88168/researchers-probe-a-gene-that-keeps-stem-cells-in-check/

Prkci gene

http://news.usc.edu/files/2015/10/nestin_tuj_ratreated_escells_WEB-824×549.jpg

When it comes to stem cells, too much of a good thing isn’t wonderful: Producing too many new stem cells may lead to cancer; producing too few inhibits the repair and maintenance of the body.

In a paper published in Stem Cell Reports, USC researcher In Kyoung Mah, who works in the lab of Francesca Mariani, and colleagues at the University of California, San Diego, describe a key gene that maintains this critical balance. Called Prkci, the gene influences whether stem cells self-renew to produce more stem cells or differentiate into more specialized cell types, such as blood or nerves.

In their experiments, the team grew mouse embryonic stem cells, which lacked Prkci, into embryo-like structures in the lab. Without Prkci, the stem cells favored self-renewal, generating large numbers of stem cells and, subsequently, an abundance of secondary structures.

Upon closer inspection, the stem cells lacking Prkci had many activated genes typical of stem cells, and some activated genes typical of neural, cardiac and blood-forming cells. Therefore, the loss of Prkci can also encourage stem cells to differentiate into the progenitor cells that form neurons, heart muscle and blood.

Follow the pathway

Prkci achieves these effects by activating or deactivating a well-known group of interacting genes that are part of the “Notch signaling pathway.” In the absence of Prkci, the Notch pathway produces a protein that signals to stem cells to make more stem cells. In the presence of Prkci, the Notch pathway remains silent, and stem cells differentiate into specific cell types.

These findings have implications for developing patient therapies. Even though Prkci can be active in certain skin cancers, inhibiting it might lead to unintended consequences, such as tumor overgrowth. However, for patients with certain injuries or diseases, it could be therapeutic to use small molecule inhibitors to block the activity of Prkci, thus boosting stem cell production.

“We expect that our findings will be applicable in diverse contexts and make it possible to easily generate stem cells that have typically been difficult to generate,” said Mariani, principal investigator at the Eli and Edythe Broad Center for Regenerative Medicine and Stem Cell Research at USC.

Additional co-authors on the study include Rachel Soloff and Stephen Hedrick from UCSD. The research was supported by USC and the Robert E. and May R. Wright Foundation.

PRKCI protein kinase C, iota [ Homo sapiens (human) ]

http://www.ncbi.nlm.nih.gov/gene/5584

Official Symbol PRKCIprovided by HGNCOfficial
Full Name protein kinase C, iota , provided by HGNC

Primary source HGNC:HGNC:9404
See relatedEnsembl:ENSG00000163558; HPRD:02105; MIM:600539; Vega:OTTHUMG00000150214
Gene type protein coding RefSeq status

REVIEWED

Organism Homo sapiens
Lineage – Eukaryota; Metazoa; Chordata; Craniata; Vertebrata; Euteleostomi; Mammalia; Eutheria; Euarchontoglires; Primates; Haplorrhini; Catarrhini; Hominidae; Homo
Also known asPKCI; DXS1179E; nPKC-iota
Summary: This gene encodes a member of the protein kinase C (PKC) family of serine/threonine protein kinases. The PKC family comprises at least eight members, which are differentially expressed and are involved in a wide variety of cellular processes. This protein kinase is calcium-independent and phospholipid-dependent. It is not activated by phorbolesters or diacylglycerol. This kinase can be recruited to vesicle tubular clusters (VTCs) by direct interaction with the small GTPase RAB2, where this kinase phosphorylates glyceraldehyde-3-phosphate dehydrogenase (GAPD/GAPDH) and plays a role in microtubule dynamics in the early secretory pathway. This kinase is found to be necessary for BCL-ABL-mediated resistance to drug-induced apoptosis and therefore protects leukemia cells against drug-induced apoptosis. There is a single exon pseudogene mapped on chromosome X. [provided by RefSeq, Jul 2008]

A Prkci gene keeps stem cells in check

Date:
October 30, 2015
Source:
University of Southern California – Health Sciences
Summary:
When it comes to stem cells, too much of a good thing isn’t wonderful: producing too many new stem cells may lead to cancer; producing too few inhibits the repair and maintenance of the body. Medical researchers now describe a key gene in maintaining this critical balance between producing too many and too few stem cells.

Newly-discovered gene controls stem cell production

|

A scientific team from the University of Southern California (USC) and the University of California, San Diego have described an important gene that maintains a critical balance between producing too many and too few stem cells. Called Prkci, the gene influences whether stem cells self-renew to produce more stem cells, or differentiate into more specialized cell types, such as blood or nerves.

When it comes to stem cells, too much of a good thing isn’t necessarily a benefit: producing too many new stem cells may lead to cancer; making too few inhibits the repair and maintenance of the body.

In their experiments, the researchers grew mouse embryonic stem cells, which lacked Prkci, into embryo-like structures in the laboratory. Without Prkci, the stem cells favored self-renewal, generating large numbers of stem cells and, subsequently, an abundance of secondary structures.

Upon closer inspection, the stem cells lacking Prkci had many activated genes typical of stem cells, and some activated genes typical of neural, cardiac, and blood-forming cells. Therefore, the loss of Prkci can also encourage stem cells to differentiate into the progenitor cells that form neurons, heart muscle, and blood.

Prkci achieves these effects by activating or deactivating a well-known group of interacting genes that are part of the Notch signaling pathway. In the absence of Prkci, the Notch pathway produces a protein that signals to stem cells to make more stem cells. In the presence of Prkci, the Notch pathway remains silent, and stem cells differentiate into specific cell types.

These findings have implications for developing patient therapies. Even though Prkci can be active in certain skin cancers, inhibiting it might lead to unintended consequences, such as tumor overgrowth. However, for patients with certain injuries or diseases, it could be therapeutic to use small molecule inhibitors to block the activity of Prkci, thus boosting stem cell production.

“We expect that our findings will be applicable in diverse contexts and make it possible to easily generate stem cells that have typically been difficult to generate,” said Francesca Mariani, Ph.D., principal investigator at the Eli and Edythe Broad Center for Regenerative Medicine and Stem Cell Research at USC.

Their study (“Atypical PKC-iota Controls Stem Cell Expansion via Regulation of the Notch Pathway”) was published in a Stem Cell Reports.

Atypical PKC-iota Controls Stem Cell Expansion via Regulation of the Notch Pathway
In Kyoung Mah,1 Rachel Soloff,2,3 Stephen M. Hedrick,2 and Francesca V. Mariani1, *
*Correspondence: fmariani@usc.edu    http://dx.doi.org/10.1016/j.stemcr.2015.09.021

Mah et al., Atypical PKC-iota Controls Stem Cell Expansion via Regulation of the Notch Pathway, Stem Cell Reports (2015), http://dx.doi.org/10.1016/j.stemcr.2015.09.021

The number of stem/progenitor cells available can profoundly impact tissue homeostasis and the response to injury or disease. Here, we propose that an atypical PKC, Prkci, is a key player in regulating the switch from an expansion to a differentiation/maintenance phase via regulation of Notch, thus linking the polarity pathway with the control of stem cell self-renewal. Prkci is known to influence symmetric cell division in invertebrates; however a definitive role in mammals has not yet emerged. Using a genetic approach, we find that loss of Prkci results in a marked increase in the number of various stem/progenitor cells. The mechanism used likely involves inactivation and symmetric localization of NUMB, leading to the activation of NOTCH1 and its downstream effectors. Inhibition of atypical PKCs may be useful for boosting the production of pluripotent stem cells, multipotent stem cells, or possibly even primordial germ cells by promoting the stem cell/progenitor fate.

The control of asymmetric versus symmetric cell division in stem and progenitor cells balances self-renewal and differentiation to mediate tissue homeostasis and repair and involves key proteins that control cell polarity. In the case of excess symmetric division, too many stem-cell-like daughter cells are generated that can lead to tumor initiation and growth. Conversely, excess asymmetric cell division can severely limit the number of cells available for homeostasis and repair (Go´mez-Lo´pez et al., 2014; Inaba and Yamashita, 2012). The Notch pathway has been implicated in controlling stem cell self-renewal in a number of different contexts (Hori et al., 2013). However, how cell polarity, asymmetric cell division, and the activation of determinants ultimately impinges upon the control of stem cell expansion and maintenance is not fully understood. In this study, we examine the role of an atypical protein kinase C (aPKC), PRKCi, in stem cell self-renewal and, in particular, determine whether PRKCi acts via the Notch pathway.

PKCs are serine-threonine kinases that control many basic cellular processes and are typically classified into three subgroups—conventional, novel, and the aPKCs iota and zeta, which, in contrast to the others, are not activated by diacylglyceride or calcium. The aPKC proteins are best known for being central components of an evolutionarily conserved Par3-Par6-aPKC trimeric complex that controls cell polarity in C. elegans, Drosophila, Xenopus, zebrafish, and mammalian cells (Suzuki and Ohno, 2006).

Before Notch influences stem cell self-renewal, the regulation of cell polarity, asymmetric versus symmetric cell division, and the segregation of cell fate determinants such as NUMB may first be required (Knoblich, 2008). For example, mutational analysis in Drosophila has demonstrated that the aPKC-containing trimeric complex is required for maintaining polarity and for mediating asymmetric cell division during neurogenesis via activation and segregation of NUMB (Wirtz-Peitz et al., 2008). NUMB then functions as a cell fate determinant by inhibiting Notch signaling and preventing self-renewal (Wang et al., 2006). In mammals, the PAR3-PAR6-aPKC complex also can bind and phosphorylate NUMB in epithelial cells and can regulate the unequal distribution of Numb during asymmetric cell division (Smith et al., 2007). During mammalian neurogenesis, asymmetric division is also thought to involve the PAR3-PAR6-aPKC complex, NUMB segregation, and NOTCH activation (Bultje et al., 2009).

Mice deficient in Prkcz are grossly normal, with mild defects in secondary lymphoid organs (Leitges et al., 2001). In contrast, deficiency of the Prkci isozyme results in early embryonic lethality at embryonic day (E)9.5 (Seidl et al., 2013; Soloff et al., 2004). A few studies have investigated the conditional inactivation of Prkci; however, no dramatic changes in progenitor generation were detected in hematopoietic stem cells (HSCs) or the brain (Imai et al., 2006; Sengupta et al., 2011), although one study found evidence of a role for Prkci in controlling asymmetric cell division in the skin (Niessen et al., 2013). Analysis may be complicated by functional redundancy between the iota and zeta isoforms and/or because further studies perturbing aPKCs in specific cell lineages and/or at specific developmental stages are needed. Therefore, a complete picture for the requirement of aPKCs at different stages of mammalian development has not yet emerged.

Here, we investigate the requirement of Prkci in mouse cells using an in vitro system that bypasses early embryonic lethality. Embryonic stem (ES) cells are used to make embryoid bodies (EBs) that develop like the early post-implantation embryo in terms of lineage specification and morphology and can also be maintained in culture long enough to observe advanced stages of cellular differentiation (Desbaillets et al., 2000). Using this approach, we provide genetic evidence that inactivation of Prkci signaling leads to enhanced generation of pluripotent cells and some types of multipotent stem cells, including cells with primordial germ cell (PGC) characteristics. In addition, we provide evidence that aPKCs ultimately regulate stem cell fate via the Notch pathway

Figure 1. Prkci/ EBs Contain Cells with Pluripotency Characteristics (A and A0 ) Day (d) 12 heterozygous EBs have few OCT4/E-CAD+ cells, while null EBs contain many in clusters at the EB periphery. Inset: OCT4 (nucleus)/E-CAD (cytoplasm) double-positive cells. (B and B0 ) Adjacent sections in a null EB show that OCT4+ cells are likely also SSEA1+. (C) Dissociated day-12 Prkci/ EBs contain five to six times more OCT4+ and approximately three times more SSEA1+ cells than heterozygous EBs (three independent experiments). (D and D0 ) After 2 days in ES cell culture, no colonies are visible in null SSEA1 cultures while present in null SSEA1+ cultures (red arrows). (E–E00) SSEA1+ sorted cells can be maintained for many passages, 27+. (E) Prkci+/ sorted cells make colonies with differentiated cells at the outer edges (n = 27/35). (E0 ) Null cells form colonies with distinct edges (n = 39/45). (E00) The percentage of undifferentiated colonies is shown. ***p < 0.001.
(F) Sorted null cells express stem cell and differentiation markers at similar levels to normal ES cells (versus heterozygous EBs) (three independent experiments). (G) EBs made from null SSEA1+ sorted cells express germ layer marker genes at the indicated days. Error bars indicate mean ± SEM, three independent experiments. Scale bars, 100 mm in (A, D, and E); 25 mm in (B). See also Figure S1.

Prkci/ Cultures Have More Pluripotent Cells Even under Differentiation Conditions First, we compared Prkci null EB development to that of Prkci/ embryos. Consistent with another null allele (Seidl et al., 2013), both null embryos and EBs fail to properly cavitate (Figures S1A and S1B). The failure to cavitate is unlikely to be due to the inability to form one of the three germ layers, as null EBs express germ-layer-specific genes (Figure S1E). A failure of cavitation could alternatively be caused by an accumulation of pluripotent cells. For example, EBs generated from Timeless knockdown cells do not cavitate and contain large numbers of OCT4-expressing cells (O’Reilly et al., 2011). In addition, EBs generated with Prkcz isoform knockdown cells contain OCT4+ cells under differentiation conditions (Dutta et al., 2011; Rajendran et al., 2013). Thus, we first evaluated ES colony differentiation by alkaline phosphatase (AP) staining. After 4 days without leukemia inhibitory factor (LIF), Prkci/ ES cell colonies retained crisp boundaries and strong AP staining. In contrast, Prkci+/ colonies had uneven colony boundaries with diffuse AP staining (Figures S1F–S1F00). To definitively detect pluripotent cells, day-12 EBs were assayed for OCT4 and E-CADHERIN (E-CAD) protein expression. Prkci+/ EBs had very few OCT4/E-CAD double-positive cells (Figure 1A); however, null EBs contained large clusters of OCT4/E-CAD double-positive cells, concentrated in a peripheral zone (Figure 1A0 ). By examining adjacent sections, we found that OCT4+ cells could also be positive for stage-specific embryonic antigen 1 (SSEA1) (Figures 1B and 1B0 ). Quantification by fluorescence-activated cell sorting (FACS) analysis showed that day-12 Prkci/ EBs had more OCT4+ and SSEA1+ cells than Prkci+/ EBs (Figure 1C). We did not find any difference between heterozygous and wild-type cells with respect to the number of OCT4+ or SSEA1+ cells or in their levels of expression for Oct4, Nanog, and Sox2 (Figures S1I, S1I0 and S1J). However, we did find that Oct4, Nanog, and Sox2 were highly upregulated in OCT4+ null cells (Figure S1G). Thus, together, these data indicate that Prkci/ EBs contain large numbers of pluripotent stem cells, despite being cultured under differentiation conditions.

Functional Pluripotency Tests If primary EBs have a pluripotent population with the capacity to undergo self-renewal, they can easily form secondary EBs (O’Reilly et al., 2011). Using this assay, we found that more secondary EBs could be generated from Prkci/ versus Prkci+/ EBs, especially at days 6, 10, and 16; even when plated at a low density to control for aggregation (Figure S1H). To test whether SSEA1+ cells could maintain pluripotency long term, FACS-sorted Prkci/ SSEA1+ and SSEA1 cells were plated at a low density and maintained under ES cell culture conditions. SSEA1 cells were never able to form identifiable colonies and could not be maintained in culture (Figure 1D). SSEA1+ cells, however, formed many distinct colonies after 2 days of culture, and these cells could be maintained for over 27 passages (Figures 1D0 , 1E0 , and 1E00). Prkci+/ SSEA1+ cells formed colonies that easily differentiated at the outer edge, even in the presence of LIF (Figure 1E). In contrast Prkci/ SSEA1+ cells maintained distinct round colonies (Figure 1E0 ). Next, we determined whether null SSEA1+ cells expressed pluripotency and differentiation markers similarly to normal ES cells. Indeed, we found that Oct4, Nanog, and Sox2 were upregulated in both null SSEA1+ EB cells and heterozygous ES cells. In addition, differentiated markers (Fgf5, T, Wnt3, and Afp) and tissue stem/progenitor cell markers (neural: Nestin, Sox1, and NeuroD; cardiac: Nkx2-5 and Isl1; and hematopoietic: Gata1 and Hba-x) were downregulated in both SSEA1+ cells and heterozygous ES cells (Figure 1F). SSEA1+ cells likely have a wide range of potential, since EBs generated from these cells expressed markers for all three germ layers (Figure 1G). In addition, as expected, EBs made from null SSEA1+ cells were (F) Sorted null cells morphologically abnormal, similar to the EBs made from unsorted Prkci/ ES cells (Figure S1G0 ). Thus, taken together, several assays indicate that the OCT4 and SSEA1+ populations enriched in null EBs represent pluripotent stem cells that can self-renew and have broad differentiation capacity.

ERK1/2 Signaling during EB Development Stem cell self-renewal has been shown to require the activation of the JAK/STAT3 and PI3K/AKT pathways and the inhibition of ERK1/2 and GSK3 pathways (Kunath et al., 2007; Niwa et al., 1998; Sato et al., 2004; Watanabe et al., 2006). We found that both STAT3 and phosphorylated STAT3 levels were not grossly altered and that the p-STAT3/STAT3 ratio was similar between heterozygous and null ES cells and EBs (Figures S2A and S2B). In addition we did not see any difference in AKT, pAKT, or b-CATENIN levels when comparing heterozygous to null ES cells or EBs (Figures S2A and S2C). Thus, the effects observed by the loss of Prkci are unlikely to be due to a significant alteration in the JAK/STAT3, PI3K/AKT, or GSK3 pathways.

Next, we investigated ERK1/2 expression and activation. Consistent with other studies showing ERK1/2 activation to be downstream of Prkci in some mammalian cell types (Boeckeler et al., 2010; Litherland et al., 2010), pERK1/2 was markedly inactivated in Prkci null versus heterozygous ES cells. In addition, during differentiation, null EBs displayed strong pERK1/2 inhibition early (until day 6). Later, pERK1/2 was activated strongly, as the EB began differentiating (Figures 2A and 2B). By immunofluorescence, pERK1/2 was strongly enriched in the columnar epithelium of control EBs, while overall levels were much lower in Prkci/ EBs (Figure 2C). In addition, high OCT4 expression correlated with a marked inactivation of pERK1/2 (Figure 2C). Next, we examined Prkci/ SSEA1+ cells by western blot. We found that SSEA1+ cells isolated from day-12 null EBs had pSTAT3 expression levels similar to whole EBs, while pERK1/2 levels were low (Figure 2D). Thus, these experiments indicate that the higher numbers of pluripotent cells in null EBs correlate with a strong inactivation of ERK1/2.

Figure 2. Prkci and Pluripotency Pathways (A) ERK1/2 phosphorylation (Y202/Y204) is reduced in null ES cells and early day (d)-6 null EBs compared to heterozygous EBs and strongly increased at later stages. The first lane shows ES cells activated (A) by serum treatment 1 day after serum depletion. (B) Quantification of pERK1/2 normalized to non-phosphorylated ERK1/2 (three independent experiments; mean ± SEM; **p < 0.01). (C) pERK1/2 Y202/Y204 is strongly expressed in the columnar epithelium of heterozygous EBs that have just cavitated. Null EBs have lower expression. OCT4 and pERK1/2 expression do not co-localize. Scale bar, 100 mm. (D) pERK1/2Y202/Y204 levels are lower in null SSEA1+ sorted cells than in heterozygous or in null day-12 EBs that have undergone further differentiation. pSTAT3 and STAT levels are unchanged. See also Figure S2.

Neural Stem Cell Fate Is Favored in Prkci/ EBs It is well known that ERK/MEK inhibition is not sufficient for pluripotent stem cell maintenance (Ying et al., 2008); thus, other pathways are likely involved. Therefore, we used a TaqMan Mouse Stem Cell Pluripotency Panel (#4385363) on an OpenArray platform to investigate the mechanism of Prkci action. Day 13 and day 20 Prkci/ EBs expressed high levels of pluripotency and stemness markers versus heterozygous EBs, including Oct4, Utf1, Nodal, Xist, Fgf4, Gal, Lefty1, and Lefty2. However, interestingly, EBs also expressed markers for differentiated cell types and tissue stem cells, including Sst, Syp, and Sycp3 (neural-related genes), Isl1 (cardiac progenitor marker), Hba-x, and Cd34 (hematopoietic markers). Based on this first-pass test, we sought to determine whether loss of Prkci might favor the generation of neural, cardiac, and hematopoietic cell types and/or their progenitors.

First, we found that null EBs contained many more NESTIN- and PAX6-positive cells than heterozygous EBs (Figures 3A and 3B; Figures S3A and S3B) (neural stem A and progenitor markers) (Sansom et al., 2009; Tohyama et al., 1992). In addition, quantification of PAX6 immuno- fluorescence (easier to quantify because of its nuclear localization) using a pixel count method (Fogel et al., 2012) revealed more abundant PAX6+ cells in null EBs versus heterozygous EBs. This difference was no longer evident at day 16, presumably because most of the new neural progenitors had differentiated (Figure 3D). Indeed, differentiated neuronal markers MAP2 and TUJ1 could be expressed in null cell cultures (Figures 3C and 3C0 ). Retinoic acid (RA) treatment both in EBs and ES cells promotes neurogenesis (Xu et al., 2012). We found that, even under RA induction, null cultures contained a larger population of NESTIN+ and a smaller population of TUJ1+ cells when compared to heterozygous cultures (Figures 3E and 3F). Again, null neural progenitors were capable of undergoing some differentiation, since we could find cells expressing NEUROD, NEUN, and MAP2 (Figures 3F0 –3F000). We also assessed neurogenesis in monolayer culture, using media that promotes neural stem cell generation supplemented with a low concentration of RA (Xu et al., 2012). Similar to the EB assay, we found that null ES cells generated a larger NESTIN+ and smaller TUJ1+ population compared to heterozygous ES cells (Figures S3C and S3D). Like in EBs, MAP2- and TUJ1-positive cells could still be found in the null cultures (Figure S3D0 ). Thus, using several different neural-induction assays, we found that the absence of Prkci correlates with the production of more neural progenitors and that, although these cells may favor self-renewal, they are still capable of progressing toward differentiation.

Figure 3. Neural Stem Cell Populations Are Increased in Null EBs (A–C0 ) Prkci/ EBs (B) have more NESTINpositive cells than Prkci+/ EBs (A). (C and C0 ) MAP2 and TUJ1 are expressed in null EBs, similarly to heterozygous EBs (data not shown). (D) EBs were assessed for PAX6 expression, and the images were used for quantification (Figures S3A and S3B). The pixel count ratio of PAX6+ cells in null EBs (green) is substantially higher than that found in heterozygous EBs (black) (three independent experiments; mean ± SEM; *p < 0.05). (E–F000) Day 4 after RA treatment, Prkci/ EBs have more NESTIN- than TUJ1-positive neurons (E and F). However, null cells can still terminally differentiate into NEUROD-, NEUN-, and MAP2-positive cells (F0 –F000). Scale bars, 25 mm in (A and C) and 50 mm in (E). See also Figure S3.

The Generation of Cardiomyocyte and Erythrocyte Progenitors Is Also Favored Next, we examined ISL1 expression (a cardiac stem cell marker) by immunofluorescence and found that Prkci/ EBs contained larger ISL1 clusters compared with Prkci+/ EBs; this was confirmed using an image quantification assay (Figures 4A, 4A0 , and 4C). Differentiated cardiac cells and ventral spinal neurons can also express ISL1 (Ericson et al., 1992); therefore, we also examined Nkx2-5 expression, a better stem cell marker and regulator of cardiac progenitor determination (Brown et al., 2004), by RT-PCR and immunofluorescence. In null EBs, Nkx2-5 was upregulated (Figure 4D). In addition, in response to RA, which can promote cardiac fates in vitro (Niebruegge et al., 2008), cells expressing NKX2-5 were more prevalent in null versus heterozygous EBs (Figures 4B and 4B0 ).The abundant cardiac progenitors found in null EBs were still capable of undergoing differentiation (Figures 4E–4F0 ). Indeed, more cells exhibited the striated pattern characteristic of a-ACTININ in null versus heterozygous EBs with RA induction (Figures 4F and 4F0 ). In addition, many more Prkci/ EBs were beating after days 6 and 12 of culture (Figure 4G).

Figure 4. Cardiomyocyte and Erythrocyte Progenitors Are Increased in Prkci/ EBs (A–F0 ) In (A, A0 , E, and E0 ), Prkci/ EBs cultured without LIF have more ISL1 (cardiac progenitor marker) and a-ACTININ-positive cells compared to heterozygous EBs. (C) At day (d) 9, the pixel count ratio for ISL1 expression indicates that null EBs (green) have larger ISL1 populations than heterozygous EBs (black) (three independent experiments, n = 20 heterozygous EBs, 21 null EBs total; mean ± SEM; *p < 0.05). In (B, B0 , D, F, and F0 ), RA treatment induces more NKX2-5 (both nuclear and cytoplasmic) and a-ACTININ expression in null EBs. Arrows point to fibers in (F0 ). (G) Null EBs (green) generate more beating EBs with RA treatment compared to heterozygous EBs (black) (four independent experiments; mean ± SEM; *p < 0.05, ***p < 0.001). (H) Dissociated null EBs of different stages (green) generate more erythrocytes in a colony-forming assay (CFU-E) (four independent experiments; mean ± SEM; **p < 0.01). (I) Examples of red colonies. (J) Gene expression for primitive HSC markers is upregulated in null EBs (relative to heterozygous EBs) (three independent experiments; mean ± SEM). Scale bars, 50 mm in (A, B, and E); 100 mm in (F), and 25 mm in (I). See also Figure S4.

Hba-x expression is restricted to yolk sac blood islands and primitive erythrocyte populations (Lux et al., 2008; Trimborn et al., 1999). Cd34 is also a primitive HSC marker (Sutherland et al., 1992). Next, we determined whether the elevated expression of these markers observed with OpenArray might represent higher numbers of primitive hematopoietic progenitors. Using a colony-forming assay (Baum et al., 1992), we found that red colonies (indicative of erythrocyte differentiation; examples in Figure 4I) were produced significantly earlier and more readily from cells isolated from null versus heterozygous EBs (Figure 4H). By quantitative real-time PCR, upregulation of Hba-x and Cd34 genes confirmed the OpenArray results (Figure 4J). In addition, we found Gata1, an erythropoiesis-specific factor, and Epor, an erythropoietin receptor that mediates erythroid cell proliferation and differentiation (Chiba et al., 1991), to be highly upregulated in null versus heterozygous EBs (Figure 4J). These data suggest that the loss of Prkci promotes the generation of primitive erythroid progenitors that can differentiate into erythrocytes.

To determine whether the aforementioned tissue stem cells identified were represented in the OCT4+ population that we described earlier, we examined the expression of PAX6, ISL1, and OCT4 in adjacent EB sections. We found that cells expressing OCT4 appeared to represent a distinct population from those expressing PAX6 and ISL1 (although some cells were PAX6 and ISL1 double-positive) (Figures S4A–S4C).

Prkci/ Cells Are More Likely to Inherit NUMB/aNOTCH1 Symmetrically The enhanced production of both pluripotent and tissue stem cells suggests that the mechanism underlying the action of Prkci in these different contexts is fundamentally similar. Because the Notch pathway controls stem cell self-renewal in many contexts (Hori et al., 2013), and because previous studies implicated a connection between PRKCi function and the Notch pathway (Bultje et al., 2009; Smith et al., 2007), we examined the localization and activation of a key player in the Notch pathway, NUMB, (Inaba and Yamashita, 2012). Differences in NUMB expression were first evident in whole EBs, where polarized expression was evident in the ectodermal and endodermal epithelia of heterozygous EBs, while Prkci/ EBs exhibited a more even distribution (Figures 5A–5B0 ). To more definitively determine the inheritance of NUMB during cell division, doublets undergoing telophase or cytokinesis were scored for symmetric (evenly distributed in both cells) or asymmetric (unequally distributed) NUMB localization (examples: Figures 5C and 5C0 ). In dissociated day-10 EBs, Prkci+/ doublets displayed somewhat less symmetric versus asymmetric inheritance, while Prkci/ doublets exhibited nearly four times more symmetric versus asymmetric inheritance (Figure 5D). Although individual cells from null EBs that were OCT4+ or PAX6+ more likely to exhibit non-polarized NUMB distribution (Figures S5A and S5B), we decided to use an assay that allowed for FACS purifi- cation, followed by the more stringent doublet assay. Therefore, we chose CD24 (heat-stable antigen; BA-1), a cell-surface marker that is highly expressed in pre-differentiated neurons and neuroblasts (Pruszak et al., 2009), and tested this marker as a method to enrich for cells destined to differentiate into neurons (see Supplemental Experimental Procedures). To assess NUMB localization, FACSsorted CD24 cells isolated from the RA-treated EBs were then put in culture for 24 hr, and doublets were scored. Both Prkci/ CD24high and CD24low doublets exhibited more symmetric versus asymmetric NUMB localization when compared to Prkci+/ doublets (Figure 5E) (>23 more was observed for CD24low doublets; 1.5 ± 0.25 [null] versus 0.67 ± 0.2 [heterozygous]). Thus, in summary, loss of Prkci favors the generation of cells with symmetric NUMB distribution, even during EB differentiation. In addition, in situations where neurogenesis is stimulated (RA treatment), loss of Prkci favors symmetric NUMB distribution in both the CD24high/low subpopulations.

Because NUMB can be directly phosphorylated by aPKCs (both PRKCi and PRKCz) (Smith et al., 2007; Zhou et al., 2011), loss of Prkci might be expected to lead to decreased NUMB phosphorylation. Three NUMB phosphorylation sites—Ser7, Ser276, and Ser295—could be aPKC mediated (Smith et al., 2007). By immunofluorescence, we found that one of the most well-characterized sites (Ser276), was strongly inactivated in null versus heterozygous EBs, especially in the core (Figures 5F and 5G). Western analysis also confirmed that the levels of pNUMB (Ser276) were decreased in null versus heterozygous EBs (Figure S5F). Thus, genetic inactivation of Prkci leads to a marked decrease in the phosphorylation status of NUMB. Notch pathway inhibition by NUMB has been observed in flies and mammals (Berdnik et al., 2002; French et al., 2002). Therefore, we investigated whether reduced Numb activity in Prkci/ EBs might lead to enhanced NOTCH1 activity and the upregulation of the downstream transcriptional readouts (Meier-Stiegen et al., 2010). An overall increase in NOTCH1 activation was supported by western blot analysis showing that the level of activated NOTCH1 (aNOTCH1) was strongly increased in day 6 and day 10 null versus heterozygous EBs (Figure S5G). This was supported by immunofluorescence in EBs, where widespread strong expression of aNOTCH1 was seen in most null cells (Figures 5I and 5I0 ), while in heterozygous EBs, this pattern was observed only in the OCT4+ cells (Figures 5H and 5H0 ).

Figure 5. Prkci/ Cells Preferentially Inherit Symmetric Localization of NUMB and aNOTCH1 and Notch Signaling Is Required for Stem Cell Self-Renewal in Null Cells (A–B0 ) In (A and B), day (d)-7 heterozygous EBs have polarized NUMB localization within epithelia and strong expression in the endoderm, while null EBs have a more even distribution. (A0 and B0 ) Enlarged views. (C and C0 ) Asymmetric and symmetric NUMB expression examples. (D) Doublets from day-10 null EBs have more symmetric inheritance when compared to day-10 heterozygous doublets (three independent experiments; mean ± SEM; **p < 0.01). A red line indicates a ratio of 1 (equal percent symmetric and asymmetric). (E) CD24 high null doublets exhibited more symmetric NUMB inheritance than CD24 high heterozygous doublets (three independent experiments; mean ± SEM; *p < 0.05). A red line indicates where the ratio is 1. (F and G) Decreased pNUMB (Ser276) is evident in the core of null versus heterozygous EBs (n = 10 of each genotype). (H–I0 ) In (H and I), aNOTCH1 is strongly expressed in heterozygous EBs, including both OCT4+ and OCT4 cells, while strong aNOTCH1 expression is predominant in OCT4+ cells of null EBs (n = 10 of each genotype)). (H0 and I0 ) Enlarged views of boxed regions. OCT4+ cells are demarcated with dotted lines. (J and J0 ) OCT4+ cells express HES5 strongly in the nucleus (three independent experiments). (K) Null doublets from dissociated EBs have more symmetric aNOTCH1 inheritance compared to heterozygous doublets (three independent experiments; mean ± SEM; **p < 0.01). A red line indicates where the ratio is 1. (L) CD24high Prkci/ doublets exhibit more symmetric aNOTCH1 than CD24high heterozygous doublets (three independent experiments; mean ± SEM; *p < 0.05). A red line indicates where the ratio is 1. (M and M0 ) Examples of asymmetric and symmetric aNOTCH1 localization. (N and O) Day-3 DMSO-treated null ES colonies show strong AP staining all the way to the colony edge in (N). Treatment with 3 mM DAPT led to more differentiation in (O). (P–R) OCT4 is strongly expressed in day-4 DMSO-treated null ES cultures (P). With DAPT (Q,R), OCT4 expression is decreased. (S) Working model: In daughter cells that undergo differentiation, PRKCi can associate with PAR3 and PAR6. NUMB is recruited and directly phosphorylated. The activation of NUMB then leads to an inhibition in NOTCH1 activation and stimulation of a differentiation/maintenance program. In the absence of Prkci, the PAR3/PAR6 complex cannot assemble (although it may do so minimally with Prkcz). NUMB asymmetric localization and phosphorylation is reduced. Low levels of pNUMB are not sufficient to block NOTCH1 activation, and activated NOTCH1 preserves the stem cell self-renewal program. We suggest that PRKCi functions to drive differentiation by pushing the switch from an expansion phase that is symmetric to a differentiation and/or maintenance phase that is predominantly asymmetric. In situations of low or absent PRKCi, we propose that the expansion phase is prolonged. Scale bars, 50 mm in (A, B, F, G, H, I, J, J0 , P–R); 200 mm in (A0 and B0 ); 25 mm in (C, C0 , M, and M0 ); and 100 mm in (H0 , I0 , N, and O). See also Figure S5.

To examine the localization of aNOTCH1 and to better quantify the results seen in Figures 5H and 5I, doublets from dissociated EBs were scored. As seen with NUMB localization, null doublets were more likely to have symmetric localization of aNOTCH1 in comparison to heterozygous doublets (Figure 5K; examples in Figures 5M and 5M0 ). In addition, both CD24high and CD24low doublets from RA-treated null EBs were more likely to exhibit symmetric aNOTCH1 distribution versus doublets from RA-treated heterozygous EBs (Figure 5L; 3.46 ± 0.8 [null] versus 0.59 ± 0.06 [heterozygous] in CD24low doublets). In addition, by RT-PCR, the expression of Notch downstream genes Hes1, Hes5, Hey1, and Hey2 was increased in null versus heterozygous EBs (Figure S5I). Furthermore, HES5 by immunofluorescence was broadly expressed at similar levels in both null and heterozygous cells (Figures 5J and 5J0 ; Figures S5H and S5H0 ) but more strongly expressed in null OCT4+ cells (Figures 5J and 5J0 ). Thus, loss of Prkci is associated with NOTCH1 activation, aNOTCH1 symmetric localization, and the upregulation of Hes/Hey downstream genes in several assays.

To determine whether Notch pathway activation is required in the absence of Prkci, we examined AP activity and OCT4 expression while blocking the Notch pathway using DAPT to inhibit g-secretase (Sastre et al., 2001). DMSO-treated null ES cells stayed undifferentiated (sharp-edged colonies, strong AP staining); however, treatment of null ES cells with 3 mM DAPT led to more differentiation (AP-negative cells with cellular extensions) (Figures 5N, 5O, and S5J). In addition, OCT4 is strongly expressed in day-4 control ES cell cultures; however, in the presence of DAPT, OCT4 expression is much decreased both in monolayer culture (Figures 5P–5R) and in null EBs (48% lower OCT4+ signal versus DMSO controls, pixel counting on EB sections; data not shown). These results support the idea that activated Notch signaling is required in the absence of Prkci to see enhanced pluripotency.

Taken together, the combined effects of decreased NUMB activation, favored symmetric distribution of NUMB and aNOTCH1 and increased NOTCH1 activity support a model whereby loss of Prkci leads to sustained generation of pluripotent and some tissue stem cell populations (Figure 5S; and see Discussion).

Additional Loss of PRKCz Activity Boosts the Number of OCT4-, SSEA1-, and STELLA-Positive Cells The generation and maintenance of pluripotent stem cells from new sources or tissue stem cells for basic or translational research can be challenging, and there is need for new in vitro strategies. A PKC inhibitor (Go¨6983) that inhibits PKCa, -b, -g, -d, and -z has been used to help maintain mouse and rat ES cells in the absence of LIF (Dutta et al., 2011; Rajendran et al., 2013). Thus, we hypothesized that treating null cells with Go¨6983 might lead to better stem cell expansion compared to loss of just Prkci. In our hands, we found that, under differentiation conditions (no LIF), heterozygous ES cells treated with the inhibitor for 4 days still underwent differentiation (Figure 6A), while treated null ES cells largely stayed undifferentiated (Figure 6A0 ; Figure S6A). Drug treatment of heterozygous EBs boosted the generation of OCT4-expressing cells (Figure 6B), while treatment of null EBs resulted in an even larger OCT4+ population (Figure 6B0 ). NUMB localization was also moderately affected (Figure S6B). By cell sorting, we found that drug treatment significantly increased the percentage of OCT4+ cells in both Prkci+/ and Prkci/ EBs (Figures 6C and 6C0 ; Figures S6C and S6C0 ). Interestingly, Go¨6983 treatment also boosted the generation of SSEA1+ cells in both null and heterozygous EBs (Figures 6D and 6D0 ; Figures S6D and S6D0 ).

SSEA1 is expressed in BLIMP1-positive PGCs derived from mouse epiblast stem cells (Hayashi and Surani, 2009). Also, PGC-like cells can be derived from isolated SSEA1+/OCT4+ EB cells (Geijsen et al., 2004). Therefore, we speculated that the increase in SSEA1 and OCT4 due to Go¨6983 treatment could represent an increase in the generation of PGC-like cells instead of undifferentiated ES cells. Therefore, we examined the expression of STELLA (a PGC marker). As expected, heterozygous EBs contain small clusters of STELLA+ cells similar to EBs made of wild-type cells (Figure 6E) (Payer et al., 2006). The addition of Go¨6983 to Prkci+/ EBs induced a modest increase in the number of STELLA+ cells present in the clusters (Figure 6F). Without drug treatment, null EBs contained more clusters, and the clusters contained more STELLA+ cells when compared to heterozygous EBs (Figures 6E and 6G). Interestingly, when Prkci/ EBs were treated with Go¨6983, the generation of STELLA+ cells was strongly enhanced (Figure 6G versus Figure 6H). Because undifferentiated ES cells can still express STELLA (Payer et al., 2006), we co-stained Prkc EBs for VASA (a more differentiated PGC marker). We found many cells that were double positive (a little less than half) (Figure 6K) but also cells that expressed VASA only and STELLA only (23 more than VASA only) (Figures 6I–6K, red/green arrows). Therefore, the combined effect of loss of Prkci and PKC inhibition via Go¨6983 treatment leads to the production of STELLA and VASA+ PGC-like cells.

Figure 6. Additional Inhibition of PRKCz Results in an Even Higher Percentage of OCT4-, SSEA1-, and STELLA-Positive Cells (A and A0 ) After day 4 without LIF, heterozygous ES cells undergo differentiation in the presence of Go¨6983, while null ES cells stay as distinct colonies in (A0 ). (B and B0 ) Go¨6983 stimulates an increase in OCT4+ populations in heterozygous EBs and an even larger OCT4+ population in null EBs in (B0 , insets: green and red channels separately). (C–D0 ) An even higher percentage of cells are OCT4+ (C and C0 ) and SSEA1+ (D and D0 ) with Go¨6983 treatment (day 12, three independent experiments). (E and F) More STELLA+ clusters containing a larger number of cells are present in drugtreated heterozygous EBs. (G and H) Null EBs also have more STELLA+ clusters and cells. Drug-treated null EBs exhibit a dramatic increase in the number of STELLA+ cells. (I–K) Some cells are double positive for STELLA and VASA in drug-treated null EBs (yellow arrows). There are also VASAonly (green arrows) and STELLA-only cells (red arrows) (three independent experiments). (L–P) Treatment with ZIP results in an increase in OCT4+ and STELLA+ cells. ZIP treatment also results in more cells that are VASA+ (three independent experiments); n = 11 for Prkci+/, and n = 13 for Prkci+/ + ZIP; n = 14 for Prkci/, and n = 20 for Prkci/ + ZIP; eight EBs assayed for both STELLA and VASA expression). Scale bars, 100 mm in (A and A0 ); 50 mm in (B and B0 ); and 25 mm in (E, I, and L). See also Figure S6. 10 S.

Next, we examined whether the more specific aPKC inhibitor, ZIP, a myristolated aPKC pseudosubstrate with competitive binding to p62, had similar effects (Price and Ghosh, 2013; Tsai et al., 2015; Yao et al., 2013). We found that both heterozygous and null EBs treated with ZIP contained more OCT4+ cells compared to un-treated EBs (Figures 6L–6O). In addition, like Go¨6983, ZIP treatment resulted in a modest increase in the percentage of SSEA1+ cells found in heterozygous EBs and a strong increase in the percentage of SSEA1+ cells in null EBs (Figures S6E– S6F0 ). Furthermore, like Go¨6983, both STELLA+ and VASA+ populations were increased with ZIP treatment (Figure 6P). Thus, both pluripotent and PGC-like cells can be abundantly generated with Go¨6983 or ZIP treatment, suggesting that strategies that inhibit both PRKCi and/or PRKCz may be useful to maintain stem cell self-renewal and/or generate abundant PGC-like cells.

DISCUSSION In this report, we suggest that Prkci controls the balance between stem cell expansion and differentiation/maintenance by regulating the activation of NUMB, NOTCH1, and Hes /Hey downstream effector genes. In the absence of Prkci, the pluripotent cell fate is favored, even without LIF, yet cells still retain a broad capacity to differentiate. In addition, loss of Prkci results in enhanced generation of tissue progenitors such as neural stem cells and cardiomyocyte and erythrocyte progenitors. In contrast to recent findings on Prkcz (Dutta et al., 2011), loss of Prkci does not appear to influence STAT3, AKT, or GSK3 signaling but results in decreased ERK1/2 activation. We hypothesize that, in the absence of Prkci, although ERK1/2 inhibition may be involved, it is the decreased NUMB phosphorylation and increased NOTCH1 activation that promotes stem and progenitor cell fate. Thus, we conclude that PRKCi, a protein known to be required for cell polarity, also plays an essential role in controlling stem cell fate and generation via regulating NOTCH1 activation.

Notch Activation Drives the Decision to Self-Renew versus Differentiate Notch plays an important role in balancing stem cell selfrenewal and differentiation in a variety of stem cell types and may be one of the key downstream effectors of Prkci signaling. Sustained Notch1 activity in embryonic neural progenitors has been shown to maintain their undifferentiated state (Jadhav et al., 2006). Similarly, sustained constitutive activation of NOTCH1 stimulates the proliferation of immature cardiomyocytes in the rat myocardium (Collesi et al., 2008). In HSCs, overexpression of constitutively active NOTCH1 in hematopoietic progenitors and stem cells supports both primitive and definitive HSC selfrenewal (Stier et al., 2002). Together, these studies suggest that activation and/or sustained Notch signaling can lead to an increase in certain tissue stem cell populations. Thus, a working model for how tissue stem cell populations are favored in the absence of Prkci involves a sequence of events that ultimately leads to Notch activation. Recent studies have shown that aPKCs can be found in a complex with NUMB in both Drosophila and mammalian cells (Smith et al., 2007; Zhou et al., 2011); hence, in our working model (Figure 5S), we propose that the localization and phosphorylation of NUMB is highly dependent on the activity of PRKCi. When Prkci is downregulated or absent (as shown here), cell polarity is not promoted, leading to diffuse distribution and decreased phosphorylation of NUMB. Without active NUMB, NOTCH1 activation is enhanced, Hes/Hey genes are upregulated, and stem/progenitor fate generation is favored. To initiate differentiation, polarization could be stochastically determined but could also be dependent on external cues such as the presentation of certain ligands or extracellular matrix (ECM) proteins (Habib et al., 2013). When PRKCi is active and the cell becomes polarized, a trimeric complex is formed with PRKCi, PAR3, and PAR6. Numb is then recruited and phosphorylated, leading to Notch inactivation, the repression of downstream Hes/Hey genes, and differentiation is favored (see Figure 5S). Support for this working model comes from studies in Drosophila showing that the aPKC complex is essential for Numb activation and asymmetric localization (Knoblich, 2008; Smith et al., 2007; Wang et al., 2006). Additional studies on mouse neural progenitors show that regulating Numb localization and Notch activation is critical for maintaining the proper number of stem/progenitor cells in balance with differentiation (Bultje et al., 2009). Thus, an important function for PRKCi may be to regulate the switch between symmetric expansion of stem/progenitor cells to an asymmetric differentiation/maintenance phase. In situations of low or absent PRKCi, we propose that the expansion phase is favored. Thus, temporarily blocking either, or both, of the aPKC isozymes may be a powerful approach for expanding specific stem/progenitor populations for use in basic research or for therapeutic applications.

These studies, together with data presented here, provide genetic evidence that evolutionarily conserved polarity pathways may play a central role in NOTCH1 activation. and stem cell self-renewal in mammals. Further genetic studies using Cre transgenes that are specific for progenitors in the neural plate, primitive erythrocytes, cardiomyocytes, and other progenitors to ablate aPKC function will be needed to determine how generally this mechanism is used in diverse tissues.

Although we do not see changes in the activation status of the STAT3, AKT, or GSK3 pathway, loss of Prkci results in an inhibition of ERK1/2 (Figures 2A and 2B). This result is consistent with the findings that ERK1/2 inhibition is both correlated with and directly increases ES cell selfrenewal (Burdon et al., 1999). Modulation of ERK1/2 activity by Prkci has been observed in cancer cells and chondrocytes (Litherland et al., 2010; Murray et al., 2011). Although it is not clear whether a direct interaction exists between Prkci and ERK1/2, Prkcz directly interacts with ERK1/2 in the mouse liver and in hypoxia-exposed cells (Das et al., 2008; Peng et al., 2008). The Prkcz isozyme is still expressed in Prkci null cells but evidently cannot suf- ficiently compensate and activate the pathway normally. Furthermore, knocking down Prkcz function in ES cells does not result in ERK1/2 inhibition, suggesting that this isozyme does not impact ERK1/2 signaling in ES cells (Dutta et al., 2011). Therefore, although PRKCi may interact with ERK1/2 and be directly required for its activation, ERK1/2 inhibition could also be a readout for cells that are more stem-like. Further studies will be needed to address this question.

Utility of Inhibiting aPKC Function Loss of Prkci resulted in EBs that contained slightly more STELLA+ cells than EBs made from +/ cells. Furthermore, inhibition of both aPKC isozymes by treating Prkci null cells with the PKC inhibitor Go¨6983 or the more specific inhibitor, ZIP, strongly promoted the generation of large clusters of STELLA+ and VASA+ cells, suggesting that inhibition of both isozymes is important for PGC progenitor expansion (Figure 6). It is unclear what the mechanism for this might be; however, one possibility is that blocking both aPKCs is necessary to promote NOTCH1 activation in PGCs or in PGC progenitor cells that may ordinarily have strong inhibitions to expansion (Feng et al., 2014). Regardless of mechanism, the ability to generate PGC-like cells in culture is notoriously challenging, and our results provide a method for future studies on PGC specification and differentiation.

Expansion of stem/progenitor pools may not be desirable in the context of cancer. Prkci has been characterized as a human oncogene, a useful prognostic cancer marker, and a therapeutic target for cancer treatment. Overexpression of Prkci is found in epithelial cancers (Fields and Regala, 2007), and Prkci inhibitors are being evaluated as candidate cancer therapies (Atwood et al., 2013; Mansfield et al., 2013). However, because our results show that Prkci inhibition leads to enhanced stem cell production in vitro, Prkci inhibitor treatment as a cancer therapy might lead to unintended consequences (tumor overgrowth), depending on the context and treatment regimen. Thus, extending our findings to human stem and cancer stem cells is needed. In summary, here, we demonstrate that loss of Prkci leads to the generation of abundant pluripotent cells, even under differentiation conditions. In addition, we show that tissue stem cells such as neural stem cells, primitive erythrocytes, and cardiomyocyte progenitors can also be abundantly produced in the absence of Prkci. These increases in stem cell production correlate with decreased NUMB activation and symmetric NUMB localization and require Notch signaling. Further inhibition of Prkcz may have an additive effect and can enhance the production of PGC-like cells. Thus, Prkci (along with Prkcz) may play key roles in stem cell self-renewal and differentiation by regulating the Notch pathway. Furthermore, inhibition of Prkci and or Prkcz activity with specific small-molecule inhibitors might be a powerful method to boost stem cell production in the context of injury or disease.

SUPPLEMENTAL INFORMATION

Supplemental Information includes Supplemental Experimental Procedures, six figures, and two tables and can be found with this article online at http://dx.doi.org/10.1016/j.stemcr. 2015.09.021.

REFERENCES

Atwood, S.X., Li, M., Lee, A., Tang, J.Y., and Oro, A.E. (2013). GLI activation by atypical protein kinase C i/l regulates the growth of basal cell carcinomas. Nature 494, 484–488.

Baum, C.M., Weissman, I.L., Tsukamoto, A.S., Buckle, A.M., and Peault, B. (1992). Isolation of a candidate human hematopoietic stem-cell population. Proc. Natl. Acad. Sci. USA 89, 2804–2808.

Berdnik, D., To¨ro¨k, T., Gonza´lez-Gaita´n, M., and Knoblich, J.A. (2002). The endocytic protein alpha-Adaptin is required for numb-mediated asymmetric cell division in Drosophila.

Dev. Cell 3, 221–231. Boeckeler, K., Rosse, C., Howell, M., and Parker, P.J. (2010). Manipulating signal delivery – plasma-membrane ERK activation in aPKC-dependent migration. J. Cell Sci. 123, 2725–2732.

more….

USC offers a summer of stem cells for local high school students

The teens boost their scientific IQ by conducting research in USC labs

The goal of these unique programs is to educate bright young minds at the stage where they’re still formulating ideas and still open and receptive to new discoveries.

Andrew McMahon

Twenty-three local high school students spent their summer vacations in a very unusual place: the Eli and Edythe Broad CIRM Center for Regenerative Medicine and Stem Cell Research at USC.

The students celebrated their graduations this month from the USC Early Investigator High School (EiHS) and the USC CIRM Science, Technology and Research (STAR) programs. These are the only programs that offer comprehensive training in stem cell research to high school students.

“The goal of these unique programs is to educate bright young minds at the stage where they’re still formulating ideas and still open and receptive to new discoveries, and introduce them to the wonder and inspirational power of stem cell biology,” said Andrew McMahon, director of USC’s stem cell research center and the Department of Stem Cell Biology and Regenerative Medicine, and head of the university-wide USC Stem Cell initiative uniting more than 100 researchers from all disciplines.

Stem cells, ethics and public policy

Over the course of the summer, the high school students participated in either a 10-day training course or eight-week research internship, working with human stem cells in USC’s world-class laboratories. 

Under the mentorship of USC faculty and graduate students, the students learned about the latest advances in regenerative medicine and explored stem cells, ethics and public policy.

Roberta Diaz Brinton, director of the CIRM STAR program, paid tribute to the accomplishments of the students.

“We’re very impressed by the caliber of science and more impressed by the caliber of young minds. These young scientists are generating the new knowledge from which stem cell biology and stem cell therapies will progress in the future,” said Brinton, professor at the USC School of Pharmacy, the USC Viterbi School of Engineering and the Keck School of Medicine of USC, and an executive committee member of USC Stem Cell.

True teamwork

Victoria Fox, director of the EiHS program, extended her thanks to everyone who contributed to the experience.

“The EiHS program was made possible by a team of very incredible people that starts with my laboratory staff and includes donors, the students, the administrators of the stem cell research center and the mentors who take the students in their laboratories,” she said. “I’m very grateful to all of these people.”

This year’s participants were selected from Harvard-Westlake School, Lifeline Education Charter School, Chadwick School and Bravo Medical Magnet High School, and many received scholarships.

“The program has motivated our students to be college-ready by giving them the opportunity to work in a university setting,” said Obed Nartey, principal of Lifeline Education Charter School. “Many of these students are the first generation to graduate from high school. For these students, college was seen as being out of reach until they met and worked with Dr. Fox and her team.”

On graduation day, the students shared their transformative summer experiences with their mentors, friends, parents and teachers by presenting scientific posters and by contributing articles to the program’s new EiHS Journal, which will publish its first issue in October.

“Being able to contribute to a scientific project that can play an important role in someone’s life is an amazing opportunity, and I would not trade it for the world,” said Marialuisa Flores, a student from Lifeline Education Charter School. “It was a very enjoyable learning experience, which has made a great impact on my life and future career.”

“Being able to contribute to a scientific project that can play an important role in someone’s life is an amazing opportunity, and I would not trade it for the world,” said Marialuisa Flores, a student from Lifeline Education Charter School. “It was a very enjoyable learning experience, which has made a great impact on my life and future career.”

A retreat from everything but stem cells

BY Cristy Lytal

It wasn’t the pristine 27-hole course that drew more than 120 stem cell researchers from USC and beyond to the Desert Princess Golf Resort near Palm Springs, Calif. It was the sixth annual retreat for the Eli and Edy the Broad Center for Regenerative Medicine and Stem Cell Research at USC, which took place on Oct. 20-­21.

The two-day, overnight retreat featured a plenary lecture by Clive Svendsen, director of the Regenerative Medicine Institute at Cedars-Sinai Medical Center, about the contribution of induced pluripotent stem (iPS) cells to regenerative medicine, particularly to studying and developing treatments for neurological disorders.

The retreat also included presentations by winners of the first Regenerative Medicine Initiative (RMI) Awards, which provide up to two years of seed funding for multi-investigator research collaborations that harness the full potential of USC-affiliated faculty members. The three winning teams are using various stem/progenitor cells that might lead to future therapies for certain forms of deafness, bone defects and pediatric leukemia.

Many other principal investigators, postdoctoral and graduate students shared innovative research advancing several key areas of regenerative medicine.

Rong Lu, who will leave Stanford University to join USC’s stem cell research center as a principal investigator in January, talked about her new cellular “tracking system” for hematopoietic, or blood-forming stem cells. The system allows for the more effective study of blood and other types of cancers.

Min Yu, who will leave Massachusetts General Hospital at Harvard Medical School to accept a joint appointment as a principal investigator at USC’s stem cell research center and the USC Norris Comprehensive Cancer Center in January, discussed how to filter out circulating cancer stem cells from billions of other blood cells to understand and stop cancer’s spread.

USC research associate Hu Zhao and research assistants Yichen Li and Yingxiao Shi gave presentations.

Postdoctoral students who presented research included Mohamed Hammad, Lori O’Brien, Sandeep Paul and Saaket Varma.

PhD student presenters included Wen-Hsuan Chang, Guanyi Huang, Sapna Jain, Erin Moran, Marie Rippen and Yuki Yamaguchi.

The retreat also showcased the USC stem cell research center’s core facilities for stem cell sorting, derivation, culture, iPS programming, imaging and therapeutic screening.

During the cocktail hour, guests exchanged new ideas while voting on their favorite posters, which introduced research opportunities related to the Development, Stem Cells, and Regenerative Medicine PhD program.

Retreat sponsors included the California Institute for Regenerative Medicine Amgen, Sanofi, Zeiss, Leica Microsystems, Fluidigm, Lonza and Novogenix Laboratories LLC.

“This year’s retreat was a great success,” said Andrew McMahon, who spearheads the USC Stem Cell initiative and directs the Broad Center. “It helped solidify USC Stem Cell as an interactive scientific community and build relationships with our colleagues at the university and beyond.”

$1.5M Goes to Stem Cell Research

$6.4M for Stem Cell Labs to USC, CHLA

$25 million Broad Foundation gift creates stem cell institute at USC

McMahon discusses central role of stem cell biology in medicine of the future

Andrew McMahon is a Provost Professor and inaugural holder of the W.M. Keck Professorship of Stem Cell Biology and Regenerative Medicine at USC. (Photo/Philip Channing)

McMahon installed as chair of stem cell biology

Army Research Laboratory selects USC institute as base for breakthroughs in science and technology

Brainpower applied to understanding of neural stem cells

Cristy Lytal
BY Cristy Lytal   OCTOBER 24, 2013

How do humans and other mammals get so brainy? USC researcher Wange Lu and his colleagues shed new light on this question in a paper published in the journal Cell Reports on Oct. 24.

The researchers donned their thinking caps to explain how neural stem and progenitor cells differentiate into neurons and related cells called glia. Neurons transmit information through electrical and chemical signals; glia surround, support and protect neurons in the brain and throughout the nervous system. Glia do everything from holding neurons in place to supplying them with nutrients and oxygen to protect them from pathogens.

By studying the embryo neural stem cells of mice in a petri dish, Lu and his colleagues discovered that a protein called SMEK1 promotes the differentiation of neural stem and progenitor cells. At the same time, SMEK1 keeps these cells in check by suppressing their uncontrolled proliferation.

The researchers also determined that SMEK1 doesn’t act alone: It works in concert with Protein Phosphatase 4 to suppress the activity of PAR3, a third protein that discourages neurogenesis — the birth of new neurons. With PAR3 out of the picture, neural stem cells and progenitors are free to differentiate into new neurons and glia.

“These studies reveal the mechanisms of how the brain keeps the balance of stem cells and neurons when the brain is formed,” said Wange Lu, associate professor of biochemistry and molecular biology at the Eli and Edythe Broad Center for Regenerative Medicine and Stem Cell Research at USC. “If this process goes wrong, it leads to cancer or mental retardation or other neurological diseases.”

neural stem cells

Neural stem and progenitor cells offer tremendous promise as a future treatment for neurodegenerative disorders, and understanding their differentiation is the first step toward harnessing the cells’ therapeutic potential. This could offer new hope for patients with Alzheimer’s, Parkinson’s and many other currently incurable diseases.

Co-authors from the Broad Center included Vicky Yamamoto, Si Ho Choi and Zhong Wei. Co-authors Hee-Ryang Kim and Choun-Ki Joo work at the Catholic University of Korea in Seoul, and first author Jungmook Lyu is affiliated with both institutions.

Funding for the study came from the National Institutes of Health (grant number 5R01NS067213).

Protein phosphatase 4 and Smek complex negatively regulate Par3 and promote neuronal differentiation of neural stem/progenitor cells.
Cell Rep. 2013 Nov 14;5(3):593-600. http://d.doi.org:/10.1016/j.celrep.2013.09.034. Epub 2013 Oct 24.
Neural progenitor cells (NPCs) are multipotent cells that can self-renew and differentiate into neurons and glial cells. However, mechanisms that control their fate decisions are poorly understood. Here, we show that Smek1, a regulatory subunit of the serine/threonine protein phosphatase PP4, promotes neuronal differentiation and suppresses the proliferative capacity of NPCs. We identify the cell polarity protein Par3, a negative regulator of neuronal differentiation, as a Smek1 substrate and demonstrate that Smek1 suppresses its activity. We also show that Smek1, which is predominantly nuclear in NPCs, is excluded from the nucleus during mitosis, allowing it to interact with cortical/cytoplasmic Par3 and mediate its dephosphorylation by the catalytic subunit PP4c. These results identify the PP4/Smek1 complex as a key regulator of neurogenesis.

Neural stem and progenitor cells located in the ventricular zone (VZ) of the embryonic neocortex are mitotically active, self-renewing cells with the potential to produce differentiated cell types (Temple, 2001). During cortical development, postmitotic neurons generated from NPCs migrate radially out of the VZ and form the cortical plate (CP) in an “inside-out pattern,” eventually establishing a six-layered cortex (Kriegstein et al., 2006). The timing of neuronal differentiation determines the size of the progenitor pool, the final number of neurons, and cortical thickness. However, the molecular mechanisms that control the switch from proliferation to neuronal differentiation of NPCs remain incompletely understood.

Studies of Drosophila neuroblasts show that the serine/threonine protein phosphatase 2A (PP2A) inhibits self-renewal and promotes neuronal differentiation by regulating the phosphorylation status of cell fate determinants, including Numb (Wang et al., 2009). Bazooka, a key component of the Par protein complex, is a well-characterized PP2A substrate in Drosophila neuroblasts (Krahn et al., 2009; Ogawa et al., 2009). PP2A antagonizes phosphorylation of Bazooka by Par1 kinase to control its subcellular localization. In mammals, a protein called Partitioning-defective 3 (Par3), the ortholog of Bazooka, accumulates at the tip of a growing axon in neurons and controls axon specification (Shi et al., 2003). Recently, it has been shown that Par3, which is enriched in the apical domain of NPCs of the VZ (Imai et al., 2006), critically regulates proliferation versus differentiation during cortical development (Bultje et al., 2009; Costa et al., 2008).

PP4, which belongs to the PP2A family, is a protein complex comprised of a catalytic subunit PP4c plus regulatory subunits (Gingras et al., 2005). Smek (also termed PP4R3) has been identified as a PP4 regulatory subunit and implicated in activities as diverse as regulation of MEK (Mendoza et al., 2005), insulin/IGF-1 signaling (Wolff et al., 2006), H2AX phosphorylation (Chowdhury et al., 2008), and histone H3 and H4 acetylation (Lyu et al., 2011). A recent study reported that Falafel (Flfl), the Drosophila homolog of Smek, mediates localization of the adaptor protein Miranda and the cell fate determinant Prospero in neuroblasts (Sousa-Nunes et al., 2009). However, the direct substrate of Smek remains unclear. Here we identify Par3 as a direct substrate of the PP4/Smek1 complex in NPCs and report a novel role for Smek1 in regulating neuronal differentiation.

Smek1 is required for neuronal differentiation of NPCs

During mouse cortical development, Smek1 is expressed in a distinct temporal and spatial pattern. At E11.5, we observed that Smek1 protein is expressed in most NPCs at the apical side of the forebrain VZ (Figure 1Aand S1A). At E14.5, Smek1 protein was detectable primarily in CP neurons (Figure 1B and S1B), while weak Smek1 expression was seen in some NPCs undergoing mitosis at the ventricle surface (Figure 1B, boxes). Interestingly, VZ neurons that migrate to the CP also expressed Smek1 protein (Figure 1B, arrows). In postnatal forebrain, Smek1 protein expression remained detectable in cortical layers I-IV (Figure S1C). Moreover, E14 cortices of Smek1-depleted mice (Smek1gt/gt) exhibited an increase in the number of Pax6-positive cells (an NPC marker) and a decrease in the number of Tbr1-positive cells (a marker of cortical neurons) as compared to E14 cortices of wild-type (Smek1+/+) mice (Figure 1C and S1D).

Figure 1

Smek1 regulates neuronal differentiation in the early phase of NPC differentiation

To assess Smek1’ function in neurogenesis, we employed an in vitro culture system using NPCs isolated from the E11.5 mouse forebrain neocortex. NPCs transduced with lentivirus expressing shRNA againstSmek1 or control shRNA under control of a doxycycline-inducible promoter (Figure S1E) were cultured in medium containing doxycycline for 6 days under differentiating conditions and then assessed for neurogenesis using TUJ1 (a marker of immature neurons) or MAP2 (a marker of mature neurons). The number of TUJ1- or MAP2-positive cells significantly decreased in Smek1 knockdown cultures compared to cultures expressing control shRNA (Figure 1D), indicating a neuronal differentiation defect. A decrease in number of neurons can be caused by a defect in NPC proliferation or neuronal apoptotic cell death. While no significant difference in the number of apoptotic cell death (as determined by TUNEL staining) was observed between control and Smek1 knockdown cells cultured under differentiation condition (data not shown),Smek1 knockdown NPCs grown under proliferation conditions underwent hyperproliferation (Figure S1F and G). We then asked whether Smek1 regulated the transition of NPCs from proliferative to differentiation states by knocking down Smek1 in NPCs prior to placing them in differentiating culture conditions. Western blotting of cells expressing Smek1 shRNA showed decreased levels of TUJ1 protein relative to controls by day 1 of culture (Figure S1H). At this time point, we found that the percentage of undifferentiated NPCs expressing both Nestin (an NPC marker) and Ki67 (a marker of proliferation) or Pax6 increased in cultures expressing Smek1 shRNA compared to control cultures, while the percentage of TUJ1-positive cells significantly decreased (Figure 1E and F). These findings suggest that Smek1 is required for neuronal differentiation and suppression of NPC proliferative capacity at an early phase of differentiation.

Smek1 recruits PP4c to promote neuronal differentiation

To determine Smek1 as a regulatory subunit of PP4 in neurogenesis, we asked whether Smek1 binds to the catalytic subunit PP4c in NPCs using co-immunoprecipitation. Western blot analysis revealed PP4c in Smek1 but not control immunoprecipitates, indicating that Smek1 physically interacts with PP4c. Such interactions did not change during differentiation (Figure 2A). To examine whether PP4c functions in neurogenesis, NPCs were exposed to lentivirus expressing PP4c or control shRNA and cultured as described in Figure 1D. PP4c knockdown led to changes similar to those accompanying Smek1 knockdown: relative to control cultures TUJ1 expression and the number of TUJ1-positive neurons decreased while Pax6-positive NPCs increased (Figure 2B and S2A and B). We next mapped Smek1 domains required for PP4c interaction. Smek contains four conserved domains: an N-terminal Ran-binding domain (RanBD), a domain of unknown function 625 (DUF625), an armadillo (Arm) repeat region, and a C-terminal nuclear localization sequence (NLS). We constructed a series of Flag-tagged deletion mutants, including Smek1ΔRanBD (lacking amino acid (aa) 2–100), ΔDUF625 (lacking aa 162-355), ΔArm (lacking 350-653), and ΔNLS (lacking aa 809-820) (Figure 2C, top) and introduced them or a wild-type construct into NPCs. PP4c was not be detected in anti-Flag immunoprecipitates from NPCs expressing Flag-Smek1ΔArm (Figure 2C, bottom) but was detected in cells expressing wild-type or other deletion mutants, suggesting that PP4c/Smek1 complex formation requires the Arm repeats. We also found that, while expression of wild-type Smek1 or corresponding ΔNLS mutant in cultures lacking endogenous Smek1 rescued the neuronal differentiation defect, the other mutants did not (Figure 2D and S2C and D). These results indicate that Smek1 regulates neuronal differentiation via its Arm repeats region through PP4c and suggest that both RanBD and DUF625 domains also participate in neurogenesis.

Figure 2

PP4c is required for neuronal differentiation   
Smek1 binds to and mediates Par3 dephosphorylation

To identify PP4 substrates regulated by Smek1 in NPCs, we employed affinity purification to purify proteins interacting with Smek1. Mass spectrometry analysis identified potential Smek1-binding proteins, including Par3, Kinesin-like protein, coiled-coil domain-containing protein 30 (CCDC 30), heat shock protein 90 (HSP90), PKC lambda, and HDAC1 Figure S3A. Among these, Par3, an intrinsic regulator of neurogenesis, is a particularly attractive candidate (Bultje et al., 2009; Costa et al., 2008). Using an antibody that detects the major isoforms (180, 150, and 100 kDa) of Par3, Western blot analysis revealed the predominant expression of two isoforms, 180 and 100 kDa forms, in NPCs, and that only the 180 kDa Par3 was detectable in Smek1 immunoprecipitates (Figure 3A). To determine whether Smek1/Par3 binding was direct, we performed an in vitro pull-down assay using purified Flag-Smek1 and His-fused Par3 fragments, the latter containing the CR1 domain (aa 1-338), the PDZ domain (aa 343-733), the aPKC-BR domain (aa 711-1054), or the C-terminal coiled-coil region (aa 1055-1334) (Figure S3B). Western blot analysis revealed that Flag-Smek1 pulled down only the Par3 coiled-coil region (Figure 3B), indicating direct binding through that region. Moreover, Par3 was detected in Flag immunoprecipitates derived from NPCs transduced with lentivirus expressing Myc-Par3 plus lentivirus expressing Flag-Smek1 wild-type or Smek1ΔRanBD, Smek1ΔArm, or Smek1ΔNLS constructs but not from NPCs expressing Smek1ΔDUF625 (Figure 3C). This result indicates that Smek1 DUF625 domain is required for Smek1/Par3 interaction.

Figure 3

Smek1 interacts with Par3 and inhibits its function in neuronal differentiation

To assess potential dephosphorylation of Par3 by Smek1, we phosphorylayed Myc-Par3 protein in vitro by incubating it with an NPC lysate and 32P-ATP and then treated it with a complex containing Flag-Smek1 proteins (Figure 3D). 32P-labeling of Par3 was significantly decreased when Par3 protein was incubated with a complex containing wild-type Flag-Smek1 protein and PP4c (Figure 3D). By contrast, treatment with a Flag-Smek1ΔArm protein complex lacking PP4c binding significantly reduced Par3 dephosphorylation. Moreover, Western blot analysis of Par3 immunoprecipitates with an anti-phospho-serine/threonine antibody confirmed that Smek1 and PP4c regulate Par3 phosphorylation through serine/threonine residues (Figure S3C). Since the DUF625 and Arm repeats regions of Smek1 are required for binding to Par3 and PP4c respectively, we examined the Par3 phosphorylation state in NPCs expressing Flag-tagged wild-type or mutant Smek1 together with Myc-tagged Par3. Western blot analysis of Myc-Par3 immunoprecipitates using anti-phospho-serine/threonine antibody showed that overexpression of wild-type Smek1 or Smek1ΔNLS significantly decreased Par3 phosphorylation levels compared to controls, whereas overexpression of Smek1ΔRanBD, ΔDUF625, or ΔArm did not (Figure 3E). These results suggest that, in addition to the DUF625 and Arm, the RanBD domain of Smek1 participates in regulation of Par3 phosphorylation at serine/threonine residues.

Smek1 negatively regulates Par3 in neurogenesis

Next we asked whether Par3 is required for Smek1-mediated neurogenesis. To this end, we assessed the effect of Smek1 loss-or gain-of function on neuronal differentiation in the presence or absence of Par3. NPCs expressing either Smek1 shRNA or wild-type Smek1 were transduced with lentivirus expressing Par3 or control shRNA (Figure S3D). At day 1 after differentiation, in the presence of Par3, knockdown of Smek1 led to a decrease in the number of TUJ1-positive neurons and an increase in the number of Nestin/Ki67 double-positive NPCs, while overexpression of Smek1 had the opposite effect (Figure 3F and S3E). In the absence of Par3 by using shRNA, the number of TUJ1-positve cell was increased and the number of Nestin/Ki67 double positive NPCs was decreased. However, in these cultures knockdown or overexpression of Smek1 did not significantly alter the number of neurons or undifferentiated NPCs. In addition, we also observed increased expression of mRNAs encoding the Notch targets Hes1 and Hes5 in cells expressing Smek1 shRNA compared to control cells (Figure S3F). Moreover, analysis of Notch reporter gene activity revealed that wild-type Smek1 inhibited Notch signaling activity induced by Par3 overexpression, while Smek1ΔDUF625 did not (Figure S3G). Given that Par3 activates Notch signaling (Bultje et al., 2009), these results suggest that Smek1 acts upstream of Par3 to negatively regulate its activity in neurogenesis.

Par3 loss of function promotes neuronal differentiation (Costa et al., 2008), consistent with the effect seen following Smek1 overexpression (Figure 3F). To confirm that Smek1 promotes neurogenesis by suppressing Par3 function, we transduced NPCs with lentiviruses expressing Par3 alone or Par3 together with wild-type Smek1 or Smek1ΔDUF625, cultured them under differentiation conditions, and then neuronal differentiation was quantified by determining the percentage of TUJ1-positive and Nestin/Ki67 double-positive cells one day later. Par3 overexpression decreased the number of TUJ1-positive neurons and increased the number of Nestin/Ki67-positive undifferentiated NPCs compared with control cells (Figure 3G and S3H). As expected, wild-type Smek1 negated the effect of Par3 overexpression, as determined by comparing the percentage of TUJ1-positive and Nestin/Ki67 double-positive cells in cultures expressing both Smek1 and Par3 to cultures expressing Par3 alone. In comparison with wild-type Smek1, no significant change was seen in cultures transduced with Smek1ΔDUF625, which cannot bind Par3. These experiments further confirm that Smek1 negatively regulates Par3 in NPC differentiation.

Dynamic changes in Smek1 subcellular localization facilitate targeting of PP4 to Par3

Par3 localizes to the apical cortex of NPCs (Bultje et al., 2009), while Smek1 is predominantly nuclear (Figure 1A and C). To determine if changes in Smek1 subcellular localization occur in NPCs during neurogenesis, coronal sections from E11.5 forebrain were immunostained with anti-Smek1 and -α-tubulin (a cytoplasmic marker) antibodies. Smek1 co-localized with α-tubulin in cells on the ventricular surface (Figure 4A, arrows), indicating a cytoplasmic/cortical localization in mitotic NPCs. In mitotic cells, Par3 showed a similar localization (Figure S4A and B). Moreover, immunostaining of NPC cultures with anti-Smek1 and -α-tubulin antibodies showed that Smek1 undergoes dynamic changes in subcellular localization during mitosis. While Smek1 was nuclear in interphase and prophase cells, it showed a cytoplasmic/cortical localization from prometaphase to anaphase (Figure 4B and S4C). Metaphase and anaphase cells also showed Smek1 enrichment at spindle microtubules.

Figure 4

Smek1 regulates subcellular localization of PP4c but not Par3

The RanBD motif of the Dictyostelium discoideum Smek homolog is reportedly critical for its cytoplasmic/cortical localization (Mendoza et al., 2005). To test whether this was the case for mammalian Smek1, Smek1-depleted NPCs were transduced with constructs encoding Flag-tagged wild-type Smek1 or its deletion mutants and immunostained with anti-Flag and anti-phospho-histone H3 (a marker of mitosis and chromatin condensation). Consistent with results reported in Dictyostelium discoideum, the Smek1ΔRanBD mutant failed to localize to the cytoplasm/spindle during mitosis but rather localized in the nucleus and remained there in interphase (Figure 4C). The subcellular localization of other mutants tested resembled that of wild-type Smek1, with the exception of Smek1ΔNLS, which was expressed in both the nucleus and cytoplasm of interphase cells. Smek1ΔRanBD contains domains that can bind Par3 and PP4c, as shown by immunoprecipitation (Figure 2C and ​and3C).3C). We thus asked whether ectopic expression of Smek1ΔRanBD promoted mislocalization of Par3 and PP4c during mitosis. When we expressed Smek1ΔRanBD ectopically in Smek1-depleted NPCs, cytoplasmic/cortical Par3 remained unchanged while Smek1ΔRanBD was nuclear (Figure S4D). In addition, no difference in localization of Par3 between Smek1-depleted and wild-type Smek1 re-expressing cells was observed, suggesting that Smek1 does not alter Par3 localization. To evaluate PP4c subcellular localization, chromosome-associated and cytosolic protein fractions were isolated from M phase-synchronized NPCs and compared by Western analysis using indicated antibodies (Figure 4D). Interestingly, PP4c protein levels increased in the chromosomal fraction from cells expressing Flag-Smek1ΔRanBD compared to control cells or wild-type Flag-Smek1, while in the cytosolic fraction the level of PP4c protein decreased, indicating altered localization of cytoplasmic PP4c to the nucleus. Taken together, these results demonstrate that PP4c subcellular localization depends on Smek1 localization during mitosis and suggest that cytoplasmic/cortical localization of Smek1 targets PP4 to Par3.

DISCUSSION

Neural stem and progenitor cells have been suggested as potential therapeutics for neurodegenerative disorders. However, understanding molecular and cellular mechanisms underlying their differentiation is a prerequisite to manipulating stem cell behavior. We show that Smek1, an evolutionarily conserved regulatory subunit of PP4, regulates neuronal differentiation and reveal an unreported function of PP4 in mammalian neurogenesis. Moreover, identification of Par3 as a novel Smek1-interacting protein and characterization of its conserved domains reveals a molecular mechanism by which Smek1 targets PP4 to Par3 during mitosis and negatively regulates Par3 function in neurogenesis.

In this study we identify Par3 as a PP4 substrate. We propose that Smek1, through its DUF625 domain, binds directly to the Par3 C-terminus. In NPCs Par3 is primarily cytoplasmic in interphase and mitosis. Thus, nuclear export of Smek1 to the cytoplasm is required for its interaction with Par3. We show dynamic changes in Smek1 subcellular localization in NPCs. While Smek1 localizes exclusively to the nucleus in interphase, during mitosis it becomes cytoplasmic. The RanBD of several proteins reportedly recognizes GTP-bound Ran (RanGTP), which directs assembly of spindle microtubules allowing chromosomal segregation and cytokinesis in mitosis (Carazo-Salas et al., 2001). Smek1 enrichment at spindle microtubules in metaphase and anaphase cells suggests that its RanBD may function in a RanGTP-dependent pathway during mitosis. Notably, nuclear export of Smek1 to the cytoplasm was observed from prometaphase cells when microtubules invade the nuclear space, and deletion of the Smek1 RanBD abolished this effect, as seen by nuclear localization. Thus our data suggest that Smek1 subcellular localization is regulated through the RanBD and that this activity may depend on microtubule dynamics functioning in a Ran-dependent pathway.

Most Smek homologs physically interact with the catalytic subunit PP4c (Gingras et al., 2005; Chowdhury et al., 2008), suggesting that the PP4 complex is evolutionarily conserved. We show that PP4c recognizes the Arm repeats region of Smek1 and its subcellular localization depends on Smek1 localization. Thus, nuclear export of Smek1 during mitosis facilitates dephosphorylation of Par3. This idea is supported by our observation that, while expression of Smek1 induced Par3 dephosphorylation in NPCs, expression of Smek1 mutants lacking RanBD and Arm repeats region did not. Interestingly, studies of Drosophila neuroblasts previously revealed that cell fate specification is tightly linked with phosphorylation status of bazooka protein (Betschinger et al., 2003; Krahn et al., 2009). However, it is now yet clear whether Par3 dephosphorylation directly regulates NPC neurogenesis. Although we could not identify specific phosphorylation sites targeted by PP4, our data defines three conserved domains of Smek1, namely RanBD, DUF625, and Arm repeats, necessary to target PP4 to its substrate Par3 and provides insight into the molecular mechanism by Smek1 to regulate PP4 function in NPCs.

We here show that Smek1 suppresses Par3, a negative regulator of neuronal differentiation. Par3 acts upstream of Notch signaling (Bultje et al., 2009), which critically regulates cell fate decision of NPCs in cortical development (Gaiano and Fishell, 2002). Notch gain-of-function activity inhibits neuronal differentiation (Nye et al., 1994), an effect similar to Smek1 loss-of-function. Moreover, Smek1 inhibits Par3-induced Notch reporter gene activity. Although it remains unclear whether Smek1 inhibits Par3’s ability to activate Notch signaling during mitosis, ensuring a neuronal fate, our data demonstrate Smek1 as a negative regulator of Par3 in regulating neuronal differentiation and suggest a novel role for PP4 in mammalian neurogenesis.

Supplementary Material   Click here to view.(13M, pdf)

http://www.ncbi.nlm.nih.gov/pmc/articles/PMC3855259/bin/NIHMS530096-supplement-01.pdf

Acknowledgments   We thank the USC Transgenic Core Facility for generating mutant mice. This research is funded by a NIH grant to W.L (5R01NS067213) and an NRF grant (NRF-2011-35B-E00015) to J.L.

References

  • Betschinger J, Mechtler K, Knoblich JA. The Par complex directs asymmetric cell division by phosphorylating the cytoskeletal protein Lgl. Nature. 2003;422:326–330. [PubMed]
  • Bultje RS, Castaneda-Castellanos DR, Jan LY, Jan YN, Kriegstein AR, Shi SH. Mammalian Par3 regulates progenitor cell asymmetric division via notch signaling in the developing neocortex. Neuron.2009;63:189–202. [PMC free article] [PubMed]
  • Carazo-Salas RE, Gruss OJ, Mattaj IW, Karsenti E. Ran-GTP coordinates regulation of microtubule nucleation and dynamics during mitotic-spindle assembly. Nat Cell Biol. 2001;3:228–234. [PubMed]
  • Chowdhury D, Xu X, Zhong X, Ahmed F, Zhong J, Liao J, Dykxhoorn DM, Weinstock DM, Pfeifer GP, Lieberman J. A PP4-phosphatase complex dephosphorylates gamma-H2AX generated during DNA replication. Mol Cell. 2008;31:33–46. [PMC free article] [PubMed]
  • Costa MR, Wen G, Lepier A, Schroeder T, Gotz M. Par-complex proteins promote proliferative progenitor divisions in the developing mouse cerebral cortex. Development. 2008;135:11–22.[PubMed]
  • more …

Read Full Post »

Hand Held DNA Sequencer

Larry H. Bernstein, MD, FCAP, Curator

LPBI


Point-of-Care DNA Sequencer Inching Closer to Widespread Use as Beta-Testers Praise Oxford Technologies’ Pocketsize, Portable Nanopore Device

November 4, 2015

MinION could help achieve NIH’s goal of $1,000 human genome sequencing and in remote clinics and outbreak zones shift testing away from medical laboratories

Point-of-care DNA sequencing  technology is edging ever closer to widespread commercial use as the Oxford Nanopore MinION sequencer  draws praise and registers successes in pre-release testing.

A pocketsize gene-sequencing machine such as the MinION could transform the marketplace by shifting DNA testing to remote clinics and outbreak zones while eliminating the need to return samples to clinical laboratories for analysis. Such devices also are expected to increase the need for trained genetic pathologists andmedical technologists.

After Much Anticipation, MinION Delivers on Promises

The MinION, produced by United Kingdom-based Oxford Nanopore Technologies, is a miniaturized instrument about the size of a USB memory stick that plugs directly into a PC or laptop computer’s USB port. Unlike bench-top sequencers, the MinION uses nanopore “strand sequencing” technology to deliver ultra-long-read-length single-molecule sequence data.

“The USB-powered sequencer contains thousands of wells, each containing nanopores—narrow protein channels that are only wide enough for a single strand of DNA. When DNA enters the channels, each base gives off a unique electronic signature that can be detected by the system, providing a readout of the DNA sequence,” reported

After several years of unfulfilled promises, Oxford began delivering the MinION in the spring of 2014 to researchers participating in its early access program called MAP . For a $1,000 access fee, participants receive a starter kit and may purchase consumable supplies. The current price for additional flow cells ranges from $900 for one to $500 per piece when purchased in 48-unit quantities.


Nick Loman, an Independent Research Fellow in the Institute for Microbiology and Infection at the University of Birmingham, UK, had questioned if MinION’s promise would ever be realized. But the USB-size sequencer won him over after he used it to detect Salmonella within 15 minutes in samples sent from a local hospital.


Loman received the MinION in May 2014 as part of the MAP program and quickly tested its usefulness. After using the device to sequence a strain of Pseudomonas aeruginosa, a common hospital-acquired infection (HAI), he next helped solve the riddle of an outbreak of Salmonella infection in a Birmingham hospital that had affected 30 patients and staff.

“The hospital wanted to understand quickly what was happening,” Loman stated. “But routine genome sequencing is quite slow. It usually takes weeks or even months to get information back.”

Using MinION, Loman detected Salmonella in some of the samples sent from the hospital in less than 15 minutes. Ultimately, the main source of the outbreak was traced to a German egg supplier.

“The MinION just blew me away,” Loman stated in Wired. “The idea that you could do sequencing on a sort of USB stick that you can chuck around does stretch credulity.”

Portable Sequencing Opens Up Intriguing Possibilities for Pathologists

In May 2015, Oxford released a second version of the device, the MinION MkI. According to the company website, the updated MinION is a “full production device featuring improvements of performance and ease of use,” such as improved temperature control and updated mechanism to engage the device with the consumable flow cells.

“The bench-top sequencers opened up the market to a certain degree,” Loman says. “You started seeing [them] in intensive research groups and in the clinic. But what if anyone could have this hanging off their key ring and go do sequencing? That’s an insane idea, and we don’t really know what it’s going to mean in terms of the potential applications. We’re very much at the start of thinking about what we might be able to do, if anyone can just sequence anything, anywhere they are.”


Joshua Quick, a PhD candidate at the University of Birmingham, UK believes Oxford Nanopore Technologies’ portable and inexpensive device will change the gene sequencing landscape.


Accuracy One Trade-off for Portability

Beta-testers have shown that the miniature device can read out relatively long stretches of genetic sequence with increasing accuracy, but according to the report in the journal Nature , the MinION MkI will need to correct several shortcomings found in the original sequencer:

• It is not practical to sequence large genomes with the device, with some experts estimating it would take a year for the original version to sequence the equivalent of a human genome.

• The machine has a high error rate compared with those of existing full-sized sequencers, misidentifying DNA sequence 5%–30% of the time.

• It also has difficulties reading sections of genome that contain long stretches of a single DNA base.

Yet researchers who have used the device remain enthusiastic about the future of this fourth-generation sequencing technique, which may have the potential to achieve the $1,000-per-human-genome goal set by the National Institutes of Health  (NIH).

“This is the democratization of sequencing,” Joshua Quick, a PhD candidate at the University of Birmingham, told Nature. “You don’t have to rely on expensive infrastructure and costly equipment.”

News accounts did not provide information about Oxford Nanopore’s plans to obtain an EU mark for its MinION device. That will be the next step to demonstrating that the device is ready for widespread clinical use. At the same time, clinical laboratory managers and pathologist should take note of the capabilities of the MinION MkI as described above. Researchers are already finding it useful to identify infectious diseases in clinical setting where other diagnostic methods have not yet identified the agent causing the infection.

Read Full Post »

DNA Replication

Larry H. Bernstein, MD, FCAP, Curator

LPBI


Decades Old DNA Replication Models Called into Question

http://www.genengnews.com/gen-news-highlights/decades-old-dna-replication-models-called-into-question/81251929/


Decades Old DNA Replication Models Called into Question

http://www.genengnews.com/media/images/GENHighlight/102252_web8123122217.jpg

A series of electron micrographs show the barrel-shaped helicase, which is the enzyme that separates the two DNA strands, along with other components of the replisome, including polymerase-epsilon (green).[Brookhaven National Laboratory]

  • It may be time to update biology texts to reflect newly published data from a collaborative team of scientists at Rockefeller University, Stony Brook University, and the U.S. Department of Energy’s Brookhaven National Laboratory. Using cutting-edge electron microscopy (EM) techniques, the investigators gathered the first ever images of the fully assembled replisome, providing new insight into the molecular mechanisms of replication.

    “Our finding goes against decades of textbook drawings of what people thought the replisome should look like,” remarked co-senior author Michael O’Donnell, Ph.D., professor and head of Rockefeller’s Laboratory of DNA Replication. “However, it’s a recurring theme in science that nature does not always turn out to work the way you thought it did.”

    “Our finding goes against decades of textbook drawings of what people thought the replisome should look like,” remarked co-senior author Michael O’Donnell, Ph.D., professor and head of Rockefeller’s Laboratory of DNA Replication. “However, it’s a recurring theme in science that nature does not always turn out to work the way you thought it did.”

http://www.genengnews.com/Media/images/GENHighlight/102254_web2322915422.jpg

Previously (left), the replisome’s two polymerases (green) were assumed to be below the helicase (tan), the enzyme that splits the DNA strands. The new images reveal one polymerase is located at the front of the helicase, causing one strand to loop backward as it is copied (right). [Brookhaven National Laboratory]

The researcher’s findings focused on the replisome found in eukaryotic organisms, a category that includes a broad swath of living things, including humans and other multicellular organisms. Over the past several decades, there has been an array of data describing the individual components comprising the complex nature of replisome. Yet, until now no pictures existed to show just how everything fit together.

“This work is a continuation of our long-standing research using electron microscopy to understand the mechanism of DNA replication, an essential function for every living cell,” explained co-senior author Huilin Li, Ph.D., biologist with joint appointments at Brookhaven Lab and Stony Brook University. “These new images show the fully assembled and fully activated ‘helicase’ protein complex—which encircles and separates the two strands of the DNA double helix as it passes through a central pore in the structure—and how the helicase coordinates with the two ‘polymerase’ enzymes that duplicate each strand to copy the genome.”

The image and implications from this study were described in a paper entitled “The architecture of a eukaryotic replisome,” published recently through Nature Structural & Molecular Biology.

Traditional models of DNA replication show the helicase enzyme moving along the DNA, separating the two strands of the double helix, with two polymerases located at the back where the DNA strand is split. In this configuration, the polymerases would add nucleotides to the side-by-side split ends as they move out of the helicase to form two new complete double helix DNA strands. However, the images that the researchers collected of intact replisomes revealed that only one of the polymerases is located at the back of the helicase. The other is on the front side of the helicase, where the helicase first encounters the double-stranded helix. This means that while one of the two split DNA strands is acted on by the polymerase at the back end, the other has to thread itself back through or around the helicase to reach the front-side polymerase before having its new complementary strand assembled.

“DNA replication is one of the most fundamental processes of life, so it is every biochemist’s dream to see what a replisome looks like,” stated lead author Jingchuan Sun, EM biologist in Dr. Li’s laboratory. “Our lab has expertise and a decade of experience using electron microscopy to study DNA replication, which has prepared us well to tackle the highly mobile therefore very challenging replisome structure. Working together with the O’Donnell lab, which has done beautiful, functional studies on the yeast replisome, our two groups brought perfectly complementary expertise to this project.”

The positioning of one polymerase at the front of the helicase suggests that it may have an unforeseen function—the possibilities of which the collaborative group of scientists is continuing to study. Whatever the function the offset polymerase ends up having, Drs. Li and O’Donnell hope that it will not only provide them better insight into the replication machinery but that they may uncover useful information that can be exploited for disease intervention.

“Clearly, further studies will be required to understand the functional implications of the unexpected replisome architecture reported here,” the scientists concluded.


RELATED CONTENT


Fifth Histone Found to Recruit Proteins for DNA Repair   

http://www.genengnews.com/gen-news-highlights/fifth-histone-found-to-recruit-proteins-for-dna-repair/81251895/

Scientists at the University of Copenhagen say they have located a previously unknown function for histones, which allows for an improved understanding of how cells protect and repair DNA damages. This new discovery may be of great importance to the treatment of diseases caused by cellular changes such as cancer and immune deficiency syndrome.

The study (“Histone H1 couples initiation and amplification of ubiquitin signaling after DNA damage”) is published in Nature.

“I believe that there’s a lot of work ahead. It’s like opening a door onto a previously undiscovered territory filled with lots of exciting knowledge. The histones are incredibly important to many of the cells’ processes as well as their overall wellbeing,” said Niels Mailand, Ph.D., from the Novo Nordisk Foundation Center for Protein Research at the Faculty of Health and Medical Science.

Histones enable the tight packaging of DNA strands within cells. The strands are two meters in length and the cells usually about 100,000 times smaller. Generally speaking, there are five types of histones. Four of them are core histones and they are placed like beads on the DNA strands, which are curled up like a ball of wool within the cells. The role of the histones is already well described in research, and in addition to enabling the packaging of the DNA strands they also play a central part in practically every process related to the DNA-code, including repairing possibly damaged DNA.

The four core histones have tails and, among other things, they signal damage to the DNA and thus attract the proteins that help repair the damage. Between the histone “yarn balls” we find the fifth histone, Histone H1, but up until now its function has not been thoroughly examined.

Using a mass spectrometer, Dr. Mailand and his team have discovered that, surprisingly, the H1 histone also helps summon repair proteins.

“In international research, the primary focus has been on the core histones and their functionality, whereas little attention has been paid to the H1 histone, simply because we weren’t aware that it too influenced the repair process. Having discovered this function in the H1 constitutes an important piece of the puzzle of how cells protect their DNA, and it opens a door onto hitherto unknown and highly interesting territory,” noted Dr. Mailand.

He expects the discovery to lead to increased research into Histone H1 worldwide, which will lead to increased knowledge of cells’ abilities to repair possible damage to their DNA and thus increase our knowledge of the basis for diseases caused by cellular changes. It will also generate more knowledge about the treatment of these diseases.

“By mapping the function of the H1 histone, we will also learn more about the repair of DNA damages on a molecular level. In order to provide the most efficient treatment, we need to know how the cells prevent and repair these damages,” point out Dr. Mailand.


Cover All the Bases for Oligonucleotide Analysis

Stephen Luke

Synthetic oligonucleotides have emerged as promising therapeutic agents for the treatment of a variety of diseases, including viral infections and cancer. Researchers are looking at several classes of nucleic acids, such as antisense oligonucleotides, small interfering RNAs (siRNAs), and aptamers, for therapeutic applications.

However, various impurities – product-related, in the starting materials, and arising from incomplete capping of coupling reactions – must be identified and removed and postsynthesis processing must be monitored. Thus, a key challenge in the development and manufacture of oligonucleotide therapeutics is to establish analytical methods that are capable of separating and identifying impurities.

Exploring Better Options for Oligonucleotide LC Separations


Table 1. Options for oligonucleotide LC separations

Ion-pair, reversed-phase separation of the trityl-on oligos and is relatively simple to perform. This method separates the full-length target oligo, which still has the dMT group attached, from the deprotected failure sequences. The analytical information obtained is limited, so this is generally considered a purification method.

An alternate method, ion-exchange separations of the trityl-off, deprotected oligos uses the negative charge on the backbone of the oligo to facilitate the separation. Resolution is good for the shorter oligos but decreases with increasing chain length. Aqueous eluents are used but oligos are highly charged, and high concentrations of salt are needed to achieve elution from the column, making the technique unsuitable for use with LC/MS.

Finally, ion-pair, reversed-phase separation of the trityl-off, deprotected oligos makes use of organic solvents and mobile phase additives such as TEAA (triethylammonium acetate) or TEA-HFIP (triethylamine and hexafluoroisopropanol) to ion-pair with the negatively charged phosphodiester backbone of the oligonucleotide. High-performance columns deliver excellent resolution. What’s more, methods with volatile mobile phase constituents such as TEA-HFIP are suitable for use with LC/MS, providing useful information to help characterize oligonucleotide structures and sequences.

In Table 1 we summarize some of the options for oligonucleotide analysis by liquid chromatography.

Designed for ion-pair, reversed-phase separation of the trityl-off, deprotected oligos using either TEAA or TEA-HFIP mobile phases –Agilent AdvanceBio Oligonucleotide columns meet these challenges.

more….   http://www.genengnews.com/gen-articles/cover-all-the-bases-for-oligonucleotide-analysis/5594/

Read Full Post »

Diagnostic Revelations

Larry H. Bernstein, MD, FCAP, Curator

LPBI

New Liquid Biopsy Test Uses Platelet RNA as Cancer Diagnostic

  • Click Image To Enlarge +
    Using platelet RNA, scientists have been able to detect the presence of cancer and pinpoint its primary location. [Best et al., 2015, Cancer Cell 28, 1–11]

    The age of fast, accurate, and noninvasive cancer screening is rapidly becoming reality. The power of next-generation sequencing has allowed molecular diagnostic techniques to sample small amounts of blood for the genetic hallmarks of tumorigenesis. These liquid biopsy procedures, as they have been dubbed, typically search for circulating tumor DNA (ctDNA) that has made its way into the systemic circulation from tumor cells that have died or enrich for circulating tumor cells (CTCs) that have broken off from the primary cancer site.

    Now, a team of researchers lead by scientists at Massachusetts General Hospital (MGH), have developed a new diagnostic test that analyzes the tumor RNA picked up in circulating platelets. The investigators believe this new method could become even more useful than other molecular technologies for diagnosing cancer since it can also determine the primary location of the tumor and provide insight to potential therapeutic approaches.

    “By combining next-generation-sequencing gene expression profiles of platelet RNA with computational algorithms we developed, we were able to detect the presence of cancer with 96 percent accuracy,” explains co-senior author Bakhos Tannous, Ph.D., associate professor Harvard Medical School and associate neuroscientist at MGH. “Platelet RNA signatures also provide valuable information on the type of tumor present in the body and can guide the selection of the most optimal treatment for individual patients.

    The findings from this study were published recently in Cancer Cell through an article entitled “RNA-Seq of Tumor-Educated Platelets Enables Blood-Based Pan-Cancer, Multiclass, and Molecular Pathway Cancer Diagnostics.”

    In the current study the research team describes finding that the RNA profiles of tumor-educated platelets (TEPs)—those that have taken up molecules shed by tumors—can distinguish among blood samples of healthy individuals and those of patients with six types of cancer, determine the location of the primary tumor, and identify tumors carrying mutations that can guide therapeutic decision-making.

    Over the past several years, the scientific literature has shown that in addition to their role in promoting blood clotting, platelets take up protein and RNA molecules from tumors, possibly playing a role in tumor growth and metastasis. Dr. Tannous and his colleagues set out to determine whether tumor RNA carried in platelets could be used to diagnose and classify common types of cancer.

    The investigators isolated platelets from blood samples taken from 55 healthy donors, 39 individual with early-stage cancer and 189 patients with advanced, metastatic cancer. Among those patients with cancer, they were diagnosed with non-small-cell lung cancer, colorectal cancer, glioblastoma, pancreatic cancer, hepatobiliary cancer, or breast cancer.

    The comparison of RNA profiles from the healthy donors to those of the cancer patients identified increased levels of approximately 1,500 RNA molecules—many involved in cancer-associated processes—and a reduction of almost 800 in samples from cancer patients. Using their novel algorithm, the MGH group was able to examine close to 1,000 RNAs from almost 300 individuals with 96% accuracy for the presence of cancer.

    Additionally, the platelet mRNA profiles were able to identify the particular type of cancer within each patient participant, including distinguishing among three types of gastrointestinal adenocarcinoma: colorectal cancer, pancreatic cancer, and hepatobiliary cancer. Platelets from patients with tumors driven by mutations in KRAS or EGFR proteins—biomarkers that can guide the use of drugs targeting those mutations—proved to have unique RNA profiles as well.

    The researchers were excited by their findings and emphasize the uniqueness of their approach as currently utilized liquid biopsy approaches have been unable to diagnose cancer while simultaneously pinpointing the location of the primary tumor.

    “We observed that the mRNA profiles of tumor-educated platelets have the sensitivity and specificity to detect cancer, even in early, non-metastasized tumors,” noted Dr. Tannous. “We are further assessing the potential of TEP-based screening for therapeutic decision making and also investigating how non-cancerous diseases may further influence the RNA repertoire of TEPs.”

  • RNA-Seq of Tumor-Educated Platelets Enables Blood-Based Pan-Cancer, Multiclass, and Molecular Pathway Cancer Diagnostics

Myron G. Best Nik Sol, Jihane Tannous, Bart A. Westerman, François Rustenburg, Pepijn Schellen, Heleen Verschueren, Edward Post, Jan Koster, Bauke Ylstra, Irsan Kooi, et al.
Highlights

•Tumors “educate” platelets (TEPs) by altering the platelet RNA profile

•TEPs provide a RNA biosource for pan-cancer, multiclass, and companion diagnostics

•TEP-based liquid biopsies may guide clinical diagnostics and therapy selection

•A total of 100–500 pg of total platelet RNA is sufficient for TEP-based diagnostics

mRNA Profiles of Tumor-Educated Platelets Are Distinct from Platelets of Healthy Individuals

Summary

Tumor-educated blood platelets (TEPs) are implicated as central players in the systemic and local responses to tumor growth, thereby altering their RNA profile. We determined the diagnostic potential of TEPs by mRNA sequencing of 283 platelet samples. We distinguished 228 patients with localized and metastasized tumors from 55 healthy individuals with 96% accuracy. Across six different tumor types, the location of the primary tumor was correctly identified with 71% accuracy. Also, MET or HER2-positive, and mutant KRAS, EGFR, orPIK3CA tumors were accurately distinguished using surrogate TEP mRNA profiles. Our results indicate that blood platelets provide a valuable platform for pan-cancer, multiclass cancer, and companion diagnostics, possibly enabling clinical advances in blood-based “liquid biopsies”.

Figure thumbnail fx1

http://www.cell.com/cms/attachment/2039645414/2053235278/fx1.jpg

Significance

Blood-based “liquid biopsies” provide a means for minimally invasive molecular diagnostics, overcoming limitations of tissue acquisition. Early detection of cancer, clinical cancer diagnostics, and companion diagnostics are regarded as important applications of liquid biopsies. Here, we report that mRNA profiles of tumor-educated blood platelets (TEPs) enable for pan-cancer, multiclass cancer, and companion diagnostics in both localized and metastasized cancer patients. The ability of TEPs to pinpoint the location of the primary tumor advances the use of liquid biopsies for cancer diagnostics. The results of this proof-of-principle study indicate that blood platelets are a potential all-in-one platform for blood-based cancer diagnostics, using the equivalent of one drop of blood.

Introduction

Cancer is primarily diagnosed by clinical presentation, radiology, biochemical tests, and pathological analysis of tumor tissue, increasingly supported by molecular diagnostic tests. Molecular profiling of tumor tissue samples has emerged as a potential cancer classifying method (Akbani et al., 2014, Golub et al., 1999, Han et al., 2014, Hoadley et al., 2014, Kandoth et al., 2013,Ramaswamy et al., 2001, Su et al., 2001). In order to overcome limitations of tissue acquisition, the use of blood-based liquid biopsies has been suggested (Alix-Panabières et al., 2012, Crowley et al., 2013, Haber and Velculescu, 2014). Several blood-based biosources are currently being evaluated as liquid biopsies, including plasma DNA (Bettegowda et al., 2014, Chan et al., 2013, Diehl et al., 2008, Murtaza et al., 2013, Newman et al., 2014, Thierry et al., 2014) and circulating tumor cells (Bidard et al., 2014, Dawson et al., 2013, Maheswaran et al., 2008, Rack et al., 2014). So far, implementation of liquid biopsies for early detection of cancer has been hampered by non-specificity of these biosources to pinpoint the nature of the primary tumor (Alix-Panabières and Pantel, 2014,Bettegowda et al., 2014).

It has been reported that tumor-educated platelets (TEPs) may enable blood-based cancer diagnostics (Calverley et al., 2010, McAllister and Weinberg, 2014,Nilsson et al., 2011). Blood platelets—the second most-abundant cell type in peripheral blood—are circulating anucleated cell fragments that originate from megakaryocytes in bone marrow and are traditionally known for their role in hemostasis and initiation of wound healing (George, 2000, Leslie, 2010). More recently, platelets have emerged as central players in the systemic and local responses to tumor growth. Confrontation of platelets with tumor cells via transfer of tumor-associated biomolecules (“education”) is an emerging concept and results in the sequestration of such biomolecules (Klement et al., 2009,Kuznetsov et al., 2012, McAllister and Weinberg, 2014, Nilsson et al., 2011,Quail and Joyce, 2013). Moreover, external stimuli, such as activation of platelet surface receptors and lipopolysaccharide-mediated platelet activation (Denis et al., 2005, Rondina et al., 2011), induce specific splicing of pre-mRNAs in circulating platelets (Power et al., 2009, Rowley et al., 2011, Schubert et al., 2014). Platelets may also undergo queue-specific splice events in response to signals released by cancer cells and the tumor microenvironment—such as stromal and immune cells. The combination of specific splice events in response to external signals and the capacity of platelets to directly ingest (spliced) circulating mRNA can provide TEPs with a highly dynamic mRNA repertoire, with potential applicability to cancer diagnostics (Calverley et al., 2010, Nilsson et al., 2011) (Figure 1A). In this study, we characterize the platelet mRNA profiles of various cancer patients and healthy donors and investigate their potential for TEP-based pan-cancer, multiclass cancer, and companion diagnostics.

  
Results

We prospectively collected and isolated blood platelets from healthy donors (n = 55) and both treated and untreated patients with early, localized (n = 39) or advanced, metastatic cancer (n = 189) diagnosed by clinical presentation and pathological analysis of tumor tissue supported by molecular diagnostics tests. The patient cohort included six tumor types, i.e., non-small cell lung carcinoma (NSCLC, n = 60), colorectal cancer (CRC, n = 41), glioblastoma (GBM, n = 39), pancreatic cancer (PAAD, n = 35), hepatobiliary cancer (HBC, n = 14), and breast cancer (BrCa, n = 39) (Figure 1B; Table 1; Table S1). The cohort of healthy donors covered a wide range of ages (21–64 years old, Table 1).

Table 1Summary of Patient Characteristics
PATIENT GROUP TOTAL (N) GENDER M (%)A AGE (SD)B METASTASIS (%) MUTATION PRESENCE (%)
TRAINING VALIDATION TRAINING VALIDATION TRAINING VALIDATION TRAINING VALIDATION TRAINING VALIDATION
HD 39 16 21 (54) 6 (38) 41 (13) 38 (16) – – – – –
GBM 23 16 18 (78) 10 (63) 59 (16) 62 (14) 0 (0) 0 (0) – – –
NSCLC 36 24 14 (39) 14 (58) 60 (11) 59 (12) 33 (92) 23 (96) KRAS 15 (42) 11 (46)
EGFR 14 (39) 7 (29)
MET-overexpression 5 (14) 3 (13)
CRC 25 16 13 (52) 9 (56) 59 (13) 63 (16) 20 (80) 15 (94) KRAS 7 (28) 8 (50)
PAAD 21 14 12 (57) 7 (50) 66 (9) 66 (10) 15 (71) 9 (64) KRAS 13 (62) 9 (64)
BrCa 23 16 0 (0) 0 (0) 59 (11) 59 (11) 16 (70) 9 (56) HER2+ 7 (30) 5 (31)
PIK3CA 6 (26) 2 (13)
triple negative 5 (22) 3 (19)
HBC 8 6 6 (75) 2 (33) 68 (13) 62 (16) 6 (75) 4 (67) KRAS 3 (38) 1 (17)

HD, healthy donors; GBM, glioblastoma; NSCLC, non-small cell lung cancer; CRC, colorectal cancer; PAAD, pancreatic cancer; BrCa, breast cancer; HBC, hepatobiliary cancer. See also Table S1.

aIndicated are number of male individuals.
bIndicated is mean age in years.

Platelet purity was confirmed by morphological analysis of randomly selected and freshly isolated platelet samples (contamination is 1 to 5 nucleated cells per 10 million platelets, see Supplemental Experimental Procedures), and platelet RNA was isolated and evaluated for quality and quantity (Figure S1A). A total of 100–500 pg of platelet total RNA (the equivalent of purified platelets in less than one drop of blood) was used for SMARTer mRNA amplification and sequencing (Ramsköld et al., 2012) (Figures 1C and S1A). Platelet RNA sequencing yielded a mean read count of ∼22 million reads per sample. After selection of intron-spanning (spliced) RNA reads and exclusion of genes with low coverage (seeSupplemental Experimental Procedures), we detected in platelets of healthy donors (n = 55) and localized and metastasized cancer patients (n = 228) 5,003 different protein coding and non-coding RNAs that were used for subsequent analyses. The obtained platelet RNA profiles correlated with previously reported mRNA profiles of platelets (Bray et al., 2013, Kissopoulou et al., 2013, Rowley et al., 2011, Simon et al., 2014) and megakaryocytes (Chen et al., 2014) and not with various non-related blood cell mRNA profiles (Hrdlickova et al., 2014) (Figure S1B). Furthermore, DAVID Gene Ontology (GO) analysis revealed that the detected RNAs are strongly enriched for transcripts associated with blood platelets (false discovery rate [FDR] < 10−126).

Among the 5,003 RNAs, we identified known platelet markers, such as B2M, PPBP, TMSB4X, PF4, and several long non-coding RNAs (e.g., MALAT1). A total of 1,453 out of 5,003 mRNAs were increased and 793 out of 5,003 mRNAs were decreased in TEPs as compared to platelet samples of healthy donors (FDR < 0.001), while presenting a strong correlation between these platelet mRNA profiles (r = 0.90, Pearson correlation) (Figure 1D). Unsupervised hierarchical clustering based on the differentially detected platelet mRNAs distinguished two sample groups with minor overlap (Figure 1E; Table S2). DAVID GO analysis revealed that the increased TEP mRNAs were enriched for biological processes such as vesicle-mediated transport and the cytoskeletal protein binding while decreased mRNAs were strongly involved in RNA processing and splicing (Table S3). A correlative analysis of gene set enrichment (CAGE) GO methodology, in which 3,875 curated gene sets of the GSEA database were correlated to TEP profiles (see Experimental Procedures), demonstrated significant correlation of TEP mRNA profiles with cancer tissue signatures, histone deacetylases regulation, and platelets (Table 2). The levels of 20 non-protein coding RNAs were altered in TEPs as compared to platelets from healthy individuals and these show a tumor type-associated RNA profile (Figure S1C).

Thumbnail image of Figure 1. Opens large image

http://www.cell.com/cms/attachment/2039645414/2053235279/gr1.jpg

Tumor-Educated Platelet mRNA Profiling for Pan-Cancer Diagnostics

(A) Schematic overview of tumor-educated platelets (TEPs) as biosource for liquid biopsies.

(B) Number of platelet samples of healthy donors and patients with different types of cancer.

(C) TEP mRNA sequencing (mRNA-seq) workflow, as starting from 6 ml EDTA-coated tubes, to platelet isolation, mRNA amplification, and sequencing.

(D) Correlation plot of mRNAs detected in healthy donor (HD) platelets and cancer patients’ TEPs, including highlighted increased (red) and decreased (blue) TEP mRNAs.

(E) Heatmap of unsupervised clustering of platelet mRNA profiles of healthy donors (red) and patients with cancer (gray).

(F) Cross-table of pan-cancer SVM/LOOCV diagnostics of healthy donor subjects and patients with cancer in training cohort (n = 175). Indicated are sample numbers and detection rates in percentages.

(G) Performance of pan-cancer SVM algorithm in validation cohort (n = 108). Indicated are sample numbers and detection rates in percentages.

(H) ROC-curve of SVM diagnostics of training (red), validation (blue) cohort, and random classifiers, indicating the classification accuracies obtained by chance of the training and validation cohort (gray).

(I) Total accuracy ratios of SVM classification in five subgroups, including corresponding predictive strengths. Genes, number of mRNAs included in training of the SVM algorithm.

See also Figure S1 and Tables S1, S2, S3, and S4.

Table 2Pan-Cancer CAGE Gene Ontology
TOP 25 GO CORRELATIONS
# LOWESTA HIGHESTA
DOWN
Translation 10 −0.865 −0.890
Immune, T cell 5 −0.853 −0.883
Cancer-associated 2 −0.875 −0.887
Viral replication 2 −0.875 −0.878
IL-signaling 2 −0.869 −0.874
RNA processing 1 −0.886
Ago2-Dicer-silencing 1 −0.882
Protein metabolism 1 −0.879
Receptor processing 1 −0.869
UP
Cancer-associated 6 −0.783 −0.906
Infection 3 −0.798 −0.853
HDAC 3 −0.795 −0.852
Platelet 3 −0.837 −0.906
Cytoskeleton 2 −0.801 −0.886
Hypoxia 2 −0.763 −0.937
Protease 1 −0.854
Immunodeficiency 1 −0.812
Differentiation 1 −0.810
Immune differentiation 1 −0.801
Methylation 1 −0.778
Metabolism 1 −0.768

Top-ranking correlations of platelet-mRNA profiles with 3,875 Broad Institute curated gene sets. CAGE, Correlative Analysis of Gene Set Enrichment; GO, gene ontology; #, number of hits per annotation; IL, interleukin; HDAC, histone deacetylase.

aIndicated are lowest and highest correlations per annotation.

Next, we determined the diagnostic accuracy of TEP-based pan-cancer classification in the training cohort (n = 175), employing a leave-one-out cross-validation support vector machine algorithm (SVM/LOOCV, see Experimental Procedures; Figures S1D and S1E), previously used to classify primary and metastatic tumor tissues (Ramaswamy et al., 2001, Su et al., 2001, Vapnik, 1998, Yeang et al., 2001). Briefly, the SVM algorithm (blindly) classifies each individual sample as cancer or healthy by comparison to all other samples (175 − 1) and was performed 175 times to classify and cross validate all individuals samples. The algorithms we developed use a limited number of different spliced RNAs for sample classification. To determine the specific input gene lists for the classifying algorithms we performed ANOVA testing for differences (as implemented in the R-package edgeR), yielding classifier-specific gene lists (Table S4). For the specific algorithm of the pan-cancer TEP-based classifier test we selected 1,072 RNAs (Table S4) for the n = 175 training cohort, yielding a sensitivity of 96%, a specificity of 92%, and an accuracy of 95% (Figure 1F). Subsequent validation using a separate validation cohort (n = 108), not involved in input gene list selection and training of the algorithm, yielded a sensitivity of 97%, a specificity of 94%, and an accuracy of 96% (Figure 1G), with an area under the curve (AUC) of 0.986 to detect cancer (Figure 1H) and high predictive strength (Figure 1I). In contrast, random classifiers, as determined by multiple rounds of randomly shuffling class labels (permutation) during the SVM training process (see Experimental Procedures), had no predictive power (mean overall accuracy: 78%, SD ± 0.3%, p < 0.01), thereby showing, albeit an unbalanced representation of both groups in the study cohort, specificity of our procedure. A total of 100 times random class-proportional subsampling of the entire dataset in a training and validation set (ratio 60:40) yielded similar accuracy rates (mean overall accuracy: 96%, SD: ± 2%), confirming reproducible classification accuracy in this dataset. Of note, all 39 patients with localized tumors and 33 of the 39 patients with primary tumors in the CNS were correctly classified as cancer patients (Figure 1I). Visualization of 22 genes previously identified at differential RNA levels in platelets of patients with various non-cancerous diseases (Gnatenko et al., 2010, Healy et al., 2006, Lood et al., 2010,Raghavachari et al., 2007), revealed mixed levels in our TEP dataset (Figure S1F), suggesting that the platelet RNA repertoire in patients with non-cancerous disease is distinct from patients with cancer.

Tumor-Specific Educational Program of Blood Platelets Allows for Multiclass Cancer Diagnostics

In addition to the pan-cancer diagnosis, the TEP mRNA profiles also distinguished healthy donors and patients with specific types of cancer, as demonstrated by the unsupervised hierarchical clustering of differential platelet mRNA levels of healthy donors and all six individual tumor types, i.e., NSCLC, CRC, GBM, PAAD, BrCa, and HBC (Figures 2A, all p < 0.0001, Fisher’s exact test, and S2A; Table S5), and this resulted in tumor-specific gene lists that were used as input for training and validation of the tumor-specific algorithms (Table S4). For the unsupervised clustering of the all-female group of BrCa patients, male healthy donors were excluded to avoid sample bias due to gender-specific platelet mRNA profiles (Figure S2B). SVM-based classification of all individual tumor classes with healthy donors resulted in clear distinction of both groups in both the training and validation cohort, with high sensitivity and specificity, and 38/39 (97%) cancer patients with localized disease were classified correctly (Figures 2B and S2C). CAGE GO analysis showed that biological processes differed between TEPs of individual tumor types, suggestive of tumor-specific “educational” programs (Table S6). We did not detect sufficient differences in mRNA levels to discriminate patients with non-metastasized from patients with metastasized tumors, suggesting that the altered platelet profile is predominantly influenced by the molecular tumor type and, to a lesser extent, by tumor progression and metastases.

 We next determined whether we could discriminate three different types of adenocarcinomas in the gastro-intestinal tract by analysis of the TEP-profiles, i.e., CRC, PAAD, and HBC. We developed a CRC/PAAD/HBC algorithm that correctly classified the mixed TEP samples (n = 90) with an overall accuracy of 76% (mean overall accuracy random classifiers: 42%, SD: ± 5%, p < 0.01,Figure 2C). In order to determine whether the TEP mRNA profiles allowed for multiclass cancer diagnosis across all tumor types and healthy donors, we extended the SVM/LOOCV classification test using a combination of algorithms that classified each individual sample of the training cohort (n = 175) as healthy donor or one of six tumor types (Figures S2D and S2E). The results of the multiclass cancer diagnostics test resulted in an average accuracy of 71% (mean overall accuracy random classifiers: 19%, SD: ± 2%, p < 0.01,Figure 2D), demonstrating significant multiclass cancer discriminative power in the platelet mRNA profiles. The classification capacity of the multiclass SVM-based classifier was confirmed in the validation cohort of 108 samples, with an overall accuracy of 71% (Figure 2E). An overall accuracy of 71% might not be sufficient for introduction into cancer diagnostics. However, of the initially misclassified samples according to the SVM algorithms choice with strongest classification strength the second ranked classification was correct in 60% of the cases. This yields an overall accuracy using the combined first and second ranked classifications of 89%. The low validation score of HBC samples can be attributed to the relative low number of samples and possibly to the heterogenic nature of this group of cancers (hepatocellular cancers and cholangiocarcinomas).
large Image

Tumor-Educated Platelet mRNA Profiles for Multiclass Cancer Diagnostics

(A) Heatmaps of unsupervised clustering of platelet mRNA profiles of healthy donors (HD; n = 55) (red) and patients with non-small cell lung cancer (NSCLC; n = 60), colorectal cancer (CRC; n = 41), glioblastoma (GBM; n = 39), pancreatic cancer (PAAD, n = 35), breast cancer (BrCa; n = 39; female HD; n = 29), and hepatobiliary cancer (HBC; n = 14).

(B) ROC-curve of SVM diagnostics of healthy donors and individual tumor classes in both training (left) and validation (right) cohort. Random classifiers, indicating the classification accuracies obtained by chance, are shown in gray.

(C) Confusion matrix of multiclass SVM/LOOCV diagnostics of patients with CRC, PAAD, and HBC. Indicated are detection rates as compared to the actual classes in percentages.

(D) Confusion matrix of multiclass SVM/LOOCV diagnostics of the training cohort consisting of healthy donors (healthy) and patients with GBM, NSCLC, PAAD, CRC, BrCa, and HBC. Indicated are detection rates as compared to the actual classes in percentages.

(E) Confusion matrix of multiclass SVM algorithm in a validation cohort (n = 108). Indicated are sample numbers and detection rates in percentages. Genes, number of mRNAs included in training of the SVM algorithm.

See also Figure S2 and Tables S4, S5, and S6.

Companion Diagnostics Tumor Tissue Biomarkers Are Reflected by Surrogate TEP mRNA Onco-signatures

Blood provides a promising biosource for the detection of companion diagnostics biomarkers for therapy selection (Bettegowda et al., 2014, Crowley et al., 2013,Papadopoulos et al., 2006). We selected platelet samples of patients with distinct therapy-guiding markers confirmed in matching tumor tissue. Although the platelet mRNA profiles contained undetectable or low levels of these mutant biomarkers, the TEP mRNA profiles did allow to distinguish patients with KRASmutant tumors from KRAS wild-type tumors in PAAD, CRC, NSCLC, and HBC patients, and EGFR mutant tumors in NSCLC patients, using algorithms specifically trained on biomarker-specific input gene lists (all p < 0.01 versus random classifiers, Figures 3A–3E ; Table S4). Even though the number of samples analyzed is relatively low and the risk of algorithm overfitting needs to be taken into account, the TEP profiles distinguished patients with HER2-amplified, PIK3CA mutant or triple-negative BrCa, and NSCLC patients with MET overexpression (all p < 0.01 versus random classifiers, Figures 3F–3I).

 We subsequently compared the diagnostic accuracy of the TEP mRNA classification method with a targeted KRAS (exon 12 and 13) and EGFR (exon 20 and 21) amplicon deep sequencing strategy (∼5,000× coverage) on the Illumina Miseq platform using prospectively collected blood samples of patients with localized or metastasized cancer. This method did allow for the detection of individual mutant KRAS and EGFR sequences in both plasma DNA and platelet RNA (Table S7), indicating sequestration and potential education capacity of mutant, tumor-derived RNA biomarkers in TEPs. Mutant KRAS was detected in 62% and 39%, respectively, of plasma DNA (n = 103, kappa statistics = 0.370, p < 0.05) and platelet RNA (n = 144, kappa statistics = 0.213, p < 0.05) of patients with a KRAS mutation in primary tumor tissue. The sensitivity of the plasma DNA tests was relatively poor as reported by others (Bettegowda et al., 2014, Thierry et al., 2014), which may partly be attributed to the loss of plasma DNA quality due to relatively long blood sample storage (EDTA blood samples were stored up to 48 hr at room temperature before plasma isolation). To discriminate KRAS mutant from wild-type tumors in blood, the TEP mRNA profiles provided superior concordance with tissue molecular status (kappa statistics = 0.795–0.895, p < 0.05) compared to KRAS amplicon sequencing analysis of both plasma DNA and platelet RNA (Table S7). Thus, TEP mRNA profiles can harness potential blood-based surrogate onco-signatures for tumor tissue biomarkers that enable cancer patient stratification and therapy selection.
large Image

Tumor-Educated Platelet mRNA Profiles for Molecular Pathway Diagnostics

Cross tables of SVM/LOOCV diagnostics with the molecular markers KRAS in (A) CRC, (B) PAAD, and (C) NSCLC patients, (D) KRAS in the combined cohort of patients with either CRC, PAAD, NSCLC, or HBC, (E) EGFR and (F) MET in NSCLC patients, (G) PIK3CA mutations, (H) HER2-amplification, and (I) triple negative status in BrCa patients. Genes, number of mRNAs included in training of the SVM algorithm. See alsoTables S4 and S7.

TEP-Profiles Provide an All-in-One Biosource for Blood-Based Liquid Biopsies in Patients with Cancer

Unequivocal discrimination of primary versus metastatic nature of a tumor may be difficult and hamper adequate therapy selection. Since the TEP profiles closely resemble the different tumor types as determined by their organ of origin—regardless of systemic dissemination—this potentially allows for organ-specific cancer diagnostics. Hence we selected all healthy donors and all patients with primary or metastatic tumor burden in the lung (n = 154), brain (n = 114), or liver (n = 127). We performed “organ exams” and instructed the SVM/LOOCV algorithm to determine for lung, brain, and liver the presence or absence of cancer (96%, 91%, and 96% accuracy, respectively), with cancer subclassified as primary or metastatic tumor (84%, 93%, and 90% accuracy, respectively) and in case of metastases to identify the potential organ of origin (64%, 70%, and 64% accuracy, respectively). The platelet mRNA profiles enabled assignment of the cancer to the different organs with high accuracy (Figure 4). In addition, using the same TEP mRNA profiles we were able to again indicate the biomarker status of the tumor tissues (90%, 82%, and 93% accuracy, respectively) (Figure 4).

large Image

Organ-Focused TEP-Based Cancer Diagnostics

SVM/LOOCV diagnostics of healthy donors (n = 55) and patients with primary or metastatic tumor burden in the lung (n = 99; totaling 154 tests), brain (n = 62; totaling 114 tests), or liver (n = 72; totaling 127 tests), to determine the presence or absence of cancer, with cancer subclassified as primary or metastatic tumor, in case of metastases the identified organ of origin, and the correctly identified molecular markers. Of note, at the exam level of mutational subtypes some samples were included in multiple classifiers (i.e., KRAS, EGFR, PIK3CA,HER2-amplification, MET-overexpression, or triple negative status), explaining the higher number in mutational tests than the total number of included samples. TP, true positive; FP, false positive; FN, false negative; TN, true negative. Indicated are sample numbers and detection rates in percentages.

Discussion

The use of blood-based liquid biopsies to detect, diagnose, and monitor cancer may enable earlier diagnosis of cancer, lower costs by tailoring molecular targeted treatments, improve convenience for cancer patients, and ultimately supplements clinical oncological decision-making. Current blood-based biosources under evaluation demonstrate suboptimal sensitivity for cancer diagnostics, in particular in patients with localized disease. So far, none of the current blood-based biosources, including plasma DNA, exosomes, and CTCs, have been employed for multiclass cancer diagnostics (Alix-Panabières and Pantel, 2014, Bettegowda et al., 2014, Skog et al., 2008), hampering its implementation for early cancer detection. Here, we report that molecular interrogation of blood platelet mRNA can offer valuable diagnostics information for all cancer patients analyzed—spanning six different tumor types. Our results suggest that platelets may be employable as an all-in-one biosource to broadly scan for molecular traces of cancer in general and provide a strong indication on tumor type and molecular subclass. This includes patients with localized disease possibly allowing for targeted diagnostic confirmation using routine clinical diagnostics for each particular tumor type.

Since the discovery of circulating tumor material in blood of patients with cancer (Leon et al., 1977) and the recognition of the clinical utility of blood-based liquid biopsies, a wealth of studies has assessed the use of blood for cancer diagnostics, prognostication and treatment monitoring (Alix-Panabières et al., 2012, Bidard et al., 2014, Crowley et al., 2013, Haber and Velculescu, 2014). By development of highly sensitive targeted detection methods, such as targeted deep sequencing (Newman et al., 2014), droplet digital PCR (Bettegowda et al., 2014), and allele-specific PCR (Maheswaran et al., 2008, Thierry et al., 2014), the utility and applicability of liquid biopsies for clinical implementation has accelerated. These advances previously allowed for a pan-cancer comparison of various biosources and revealed that in >75% of cancers, including advanced stage pancreas, colorectal, breast, and ovarian cancer, cell-free DNA is detectable although detection rates are dependent on the grade of the tumor and depth of analysis (Bettegowda et al., 2014). Here, we show that the platelet RNA profiles are affected in nearly all cancer patients, regardless of the type of tumor, although the abundance of tumor-associated RNAs seems variable among cancer patients. In addition, surrogate RNA onco-signatures of tissue biomarkers, also in 88% of localized KRAS mutant cancer patients as measured by the tumor-specific and pan-cancer SVM/LOOCV procedures, are readily available from a minute amount (100–500 pg) of platelet RNA. As whole blood can be stored up to 48 hr on room temperature prior to isolation of the platelet pellet, while maintaining high-quality RNA and the dominant cancer RNA signatures, TEPs can be more readily implemented in daily clinical laboratory practice and could potentially be shipped prior to further blood sample processing.

Blood platelets are widely involved in tumor growth and cancer progression (Gay and Felding-Habermann, 2011). Platelets sequester solubilized tumor-associated proteins (Klement et al., 2009) and spliced and unspliced mRNAs (Calverley et al., 2010, Nilsson et al., 2011), whereas platelets do also directly interact with tumor cells (Labelle et al., 2011), neutrophils (Sreeramkumar et al., 2014), circulating NK-cells (Palumbo et al., 2005, Placke et al., 2012), and circulating tumor cells (Ting et al., 2014, Yu et al., 2013). Interestingly, in vivo experiments have revealed breast cancer-mediated systemic instigation by supplying circulating platelets with pro-inflammatory and pro-angiogenic proteins, supporting outgrowth of dormant metastatic foci (Kuznetsov et al., 2012). Using a gene ontology methodology, CAGE, we correlated TEP-cancer signatures with publicly available curated datasets. Indeed, we identified widespread correlations with cancer tissues, hypoxia, platelet-signatures, and cytoskeleton, possibly reflecting the “alert” and pro-tumorigenic state of TEPs. We observed strong negative correlations with RNAs implicated in RNA translation, T cell immunity, and interleukin-signaling, implying diminished needs of TEPs for RNAs involved in these biological processes or orchestrated translation of these RNAs to proteins (Denis et al., 2005). We observed that the tumor-specific educational programs in TEPs are predominantly influenced by tumor type and, to a lesser extent, by tumor progression and metastases. Although we were not able to measure significant differences between non-metastasized and metastasized tumors, we do not exclude that the use of larger sample sets could allow for the generation of SVM algorithms that do have the power to discriminate between certain stages of cancer, including those with in situ carcinomas and even pre-malignant lesions. In addition, different molecular tumor subtypes (e.g., HER2-amplified versus wild-type BrCa) result in different effects on the platelet profiles, possibly caused by different “educational” stimuli generated by the different molecular tumor subtypes (Koboldt et al., 2012). Altogether, the RNA content of platelets in patients with cancer is dependent on the transcriptional state of the bone-marrow megakaryocyte (Calverley et al., 2010, McAllister and Weinberg, 2014), complemented by sequestration of spliced RNA (Nilsson et al., 2011), release of RNA (Clancy and Freedman, 2014, Kirschbaum et al., 2015, Rak and Guha, 2012, Risitano et al., 2012), and possibly queue-specific pre-mRNA splicing during platelet circulation. Partial or complete normalization of the platelet profiles following successful treatment of the tumor would enable TEP-based disease recurrence monitoring, requiring the analysis of follow-up platelet samples. Future studies will be required to address the tumor-specific “educated” profiles on both an (small non-coding) RNA (Laffont et al., 2013, Landry et al., 2009, Leidinger et al., 2014, Lu et al., 2005) and protein (Burkhart et al., 2014,Geiger et al., 2013, Klement et al., 2009) level and determine the ability of gene ontology, blood-based cancer classification.

In conclusion, we provide robust evidence for the clinical relevance of blood platelets for liquid biopsy-based molecular diagnostics in patients with several types of cancer. Further validation is warranted to determine the potential of surrogate TEP profiles for blood-based companion diagnostics, therapy selection, longitudinal monitoring, and disease recurrence monitoring. In addition, we expect the self-learning algorithms to further improve by including significantly more samples. For this approach, isolation of the platelet fraction from whole blood should be performed within 48 hr after blood withdrawal, the platelet fraction can subsequently be frozen for cancer diagnosis. Also, future studies should address causes and anticipated risks of outlier samples identified in this study, such as healthy donors classified as cancer patients. Systemic factors such as chronic or transient inflammatory diseases, or cardiovascular events and other non-cancerous diseases may also influence the platelet mRNA profile and require evaluation in follow-up studies, possibly also including individuals predisposed for cancer.

References   

Authors  Title
Source

Akbani, R., Ng, P.K.S., Werner, H.M.J., Shahmoradgoli, M., Zhang, F., Ju, Z., Liu, W., Yang, J.-Y., Yoshihara, K., Li, J. et al. A pan-cancer proteomic perspective on The Cancer Genome Atlas.

Nat. Commun. 2014; 5: 3887

Alix-Panabières, C. and Pantel, K. Challenges in circulating tumour cell research.

Nat. Rev. Cancer. 2014; 14:623–631

Alix-Panabières, C., Schwarzenbach, H., and Pantel, K. Circulating tumor cells and circulating tumor DNA.

Annu. Rev. Med. 2012; 63:199–215

Bettegowda, C., Sausen, M., Leary, R.J., Kinde, I., Wang, Y., Agrawal, N., Bartlett, B.R., Wang, H., Luber, B., Alani, R.M. et al. Detection of circulating tumor DNA in early- and late-stage human malignancies.

Sci. Transl. Med. 2014; 6:224ra24

Bidard, F.-C., Peeters, D.J., Fehm, T., Nolé, F., Gisbert-Criado, R., Mavroudis, D., Grisanti, S., Generali, D., Garcia-Saenz, J.A., Stebbing, J. et al. Clinical validity of circulating tumour cells in patients with metastatic breast cancer: a pooled analysis of individual patient data.

Lancet Oncol. 2014; 15: 406–414

Bray, P.F., McKenzie, S.E., Edelstein, L.C., Nagalla, S., Delgrosso, K., Ertel, A., Kupper, J., Jing, Y., Londin, E., Loher, P. et al. The complex transcriptional landscape of the anucleate human platelet.

BMC Genomics. 2013; 14: 1

Burkhart, J.M., Gambaryan, S., Watson, S.P., Jurk, K., Walter, U., Sickmann, A., Heemskerk, J.W.M., and Zahedi, R.P.  What can proteomics tell us about platelets?.

Circ. Res. 2014; 114: 1204–1219

Calverley, D.C., Phang, T.L., Choudhury, Q.G., Gao, B., Oton, A.B., Weyant, M.J., and Geraci, M.W. Significant downregulation of platelet gene expression in metastatic lung cancer.

Clin. Transl. Sci. 2010; 3:227–232

Chan, K.C.A., Jiang, P., Chan, C.W.M., Sun, K., Wong, J., Hui, E.P., Chan, S.L., Chan, W.C., Hui, D.S.C., Ng, S.S.M. et al. Noninvasive detection of cancer-associated genome-wide hypomethylation and copy number aberrations by plasma DNA bisulfite sequencing.

Proc. Natl. Acad. Sci. USA.2013; 110: 18761–18768

Abstract Image
Chi-Ping Day, Glenn Merlino, Terry Van Dyke
Cell, Vol. 163, Issue 1, p39–53
Published in issue: September 24, 2015
Abstract Image
Katherine A. Hoadley, Christina Yau, Denise M. Wolf, Andrew D. Cherniack, David Tamborero, Sam Ng, Max D.M. Leiserson, Beifang Niu, Michael D. McLellan, Vladislav Uzunangelov, Jiashan Zhang, Cyriac Kandoth, Rehan Akbani, Hui Shen, Larsson Omberg, Andy Chu, Adam A. Margolin, Laura J. van’t Veer, Nuria Lopez-Bigas, Peter W. Laird, Benjamin J. Raphael, Li Ding, A. Gordon Robertson, Lauren A. Byers, Gordon B. Mills, John N. Weinstein, Carter Van Waes, Zhong Chen, Eric A. Collisson, The Cancer Genome Atlas Research Network, Christopher C. Benz, Charles M. Perou, Joshua M. Stuart
Cell, Vol. 158, Issue 4, p929–944
Published online: August 7, 2014

Open Archive

Abstract Image
Pau Creixell, Erwin M. Schoof, Craig D. Simpson, James Longden, Chad J. Miller, Hua Jane Lou, Lara Perryman, Thomas R. Cox, Nevena Zivanovic, Antonio Palmeri, Agata Wesolowska-Andersen, Manuela Helmer-Citterich, Jesper Ferkinghoff-Borg, Hiroaki Itamochi, Bernd Bodenmiller, Janine T. Erler, Benjamin E. Turk, Rune Linding
Cell, Vol. 163, Issue 1, p202–217
Published online: September 17, 2015
Abstract Image
Cell, Vol. 155, Issue 1, p9–10
Published in issue: September 26, 2013

Open Archive

Abstract Image
Corina E. Antal, Andrew M. Hudson, Emily Kang, Ciro Zanca, Christopher Wirth, Natalie L. Stephenson, Eleanor W. Trotter, Lisa L. Gallegos, Crispin J. Miller, Frank B. Furnari, Tony Hunter, John Brognard, Alexandra C. Newton
Cell, Vol. 160, Issue 3, p489–502
Published online: January 22, 2015
Abstract Image
Cell, Vol. 160, Issues 1-2, p7
Published in issue: January 15, 2015
Abstract Image
Amelia J. Johnston, Kate T. Murphy, Laura Jenkinson, David Laine, Kerstin Emmrich, Pierre Faou, Ross Weston, Krishnath M. Jayatilleke, Jessie Schloegel, Gert Talbo, Joanne L. Casey, Vita Levina, W. Wei-Lynn Wong, Helen Dillon, Tushar Sahay, Joan Hoogenraad, Holly Anderton, Cathrine Hall, Pascal Schneider, Maria Tanzer, Michael Foley, Andrew M. Scott, Paul Gregorevic, Spring Yingchun Liu, Linda C. Burkly, Gordon S. Lynch, John Silke, Nicholas J. Hoogenraad
Cell, Vol. 162, Issue 6, p1365–1378
Published in issue: September 10, 2015
Abstract Image
Levi A. Garraway, Eric S. Lander
Cell, Vol. 153, Issue 1, p17–37
Published in issue: March 28, 2013

Open Archive

Abstract Image
Hector L. Franco, W. Lee Kraus
Cell, Vol. 163, Issue 1, p28–30
Published in issue: September 24, 2015

Read Full Post »

Liposomes, Lipidomics and Metabolism

Larry H. Bernstein, MD, FCAP, Curator

LPBI


Building a Better Liposome

Computational models suggest new design for nanoparticles used in targeted drug delivery.

http://www.technologynetworks.com/Metabolomics/news.aspx?ID=184147

Using computational modeling, researchers at Carnegie Mellon University, the Colorado School of Mines and the University of California, Davis have come up with a design for a better liposome. Their findings, while theoretical, could provide the basis for efficiently constructing new vehicles for nanodrug delivery.

Liposomes are small containers with shells made of lipids, the same material that makes up the cell membrane. In recent years, liposomes have been used for targeted drug delivery. In this process, the membrane of a drug-containing liposome is engineered to contain proteins that will recognize and interact with complementary proteins on the membrane of a diseased or dysfunctional cell. After the drug-containing liposomes are administered, they travel through the body, ideally connecting with targeted cells where they release the drug.

liposome_853x480-min.jpg

This packaging technique is often used with highly toxic nanodrugs, like chemotherapy drugs, in an attempt to prevent the free drug from damaging non-cancerous cells. However, studies of this model of delivery have shown that in many cases less than 10 percent of the drugs transported by liposomes end up in tumor cells. Often, the liposome breaks open before it reaches a tumor cell and the drug is absorbed into the body’s organs, including the liver and spleen, resulting in toxic side effects.

“Even with current forms of targeted drug delivery, treatments like chemotherapy are still very brutal. We wanted to see how we could make targeted drug delivery better,” said Markus Deserno, professor of physics at Carnegie Mellon and a member of the university’s Center for Membrane Biology and Biophysics.

Deserno and colleagues propose that targeted drug delivery can be improved by making more stable liposomes. Using three different types of computer modeling, they have shown that liposomes can be made sturdier by incorporating a nanoparticle core made of a material like gold or iron and connecting that core to the liposome’s membrane using polymer tethers. The core and tethers act as a hub-and-spoke-like scaffold and shock-absorber system that help the liposome to weather the stresses and strains it encounters as it travels through the body to its target.

Francesca Stanzione and Amadeu K. Sum of the Colorado School of Mines conducted a fine-grained simulation that looked at how the polymer tethers anchor the liposome’s membrane at an atomistic level. Roland Faller of UC Davis did a meso-scale simulation that looked how a number of tethers held on to a small patch of membrane. Each of these simulations allowed researchers to look at smaller components of the liposome, nanoparticle core and tethers, but not the entire structure.

To see the entire structure, Carnegie Mellon’s Deserno and Mingyang Hu developed a coarse-grained model that represents groupings of components rather than individual atoms. For example, one lipid in the cell membrane might have 100 atoms. In a fine-grain simulation, each atom would be represented. In Deserno’s coarse grain simulation, those atoms might be represented by only three pieces instead of 100.

“Its unfeasible to look at the complete construct at an atomistic level. There are too many atoms to consider, and the timescale is too long. Even with the most advanced supercomputer, we wouldn’t have the power to run an atom-level simulation,” Deserno said. “But the physics that matters isn’t locally specific. It’s more like soft matter physics, which can be described at a much coarser resolution.”

Deserno’s simulation allowed the researchers to see how the entire reinforced liposome construct responded to stress and strain. They proposed that if a liposome was given the right-sized hub and tethers, its membrane would be much more resilient, bending to absorb impact and pressure.

Additionally, they were able to simulate how to best assemble the liposome, hub and tether system. They found that if the hub and tether are attached and placed in a solution of lipids, and solvent conditions are suitably chosen, a correctly sized liposome would self-assemble around the hub and tethers.

The researchers hope that chemists and drug developers will one day be able to use their simulations to determine what size core and polymer tethers they would need to effectively secure a liposome designed to deliver a specific drug or other nanoparticle. Using such simulations could narrow down the design parameters, speed up the development process and reduce costs.


Lipotype GmbH and NIHS Collaborate

http://www.technologynetworks.com/Metabolomics/news.aspx?ID=184363

NIHS to use the Lipotype Shotgun Lipidomics Technology for lipid analysis.

Lipotype GmbH and the Nestlé Institute of Health Sciences (NIHS) have collaborated to employ the innovative Lipotype Shotgun Lipidomics Technology to analyze lipids in blood for nutritional research. Recently, Lipotype and NIHS have jointly published results of the robustness of the Lipotype Technology. Lipotype envisions a future use of its technology in clinical diagnostics screens for establishing reliable lipid diagnostic biomarkers.

Innovative Lipotype Technology for lipid analysis
The purpose of this collaboration is to enable NIHS to use the Lipotype Shotgun Lipidomics Technology for lipid analysis. The mass spectrometry-based Lipotype technology covers a broad spectrum of lipid molecules and delivers quantitative results in high-throughput. The Nestlé Institute of Health Sciences uses this technology platform for nutritional research. NIHS is a specialized biomedical research institute and is part of Nestlé’s global Research & Development network.

Joint research project reveals robustness of Lipotype Technology
During the collaboration, Lipotype and NIHS conducted a joint research project and demonstrated that the Lipotype technology was robust enough to deliver data with high precision and negligible technical variation between different sites. In addition, important features are the high coverage and throughput, which were confirmed when applying the Lipotype technology.

Lipotype envisions these as important features, required for future use in clinical diagnostics screens, in order to establish and validate reliable lipid diagnostic biomarkers. The results have been published in October 2015, in the European Journal of Lipid Science and Technology (Surma et al. “An Automated Shotgun Lipidomics Platform for High Throughput, Comprehensive, and Quantitative Analysis of Blood Plasma Intact Lipids.”).

Lipids play an important role for health and disease
Lipotype is a spin-off company of the Max-Planck-Institute of Molecular Cell Biology and Genetics in Dresden, Germany. Prof. Kai Simons, CEO of Lipotype explains: “We developed a novel Shotgun-Lipidomics technology to analyze lipids in blood and other biological samples. Our analysis is quick and covers hundreds of lipid molecules at the same time. Our technology can be used to identify disease related lipid signatures.”


New Treatment for Obesity Developed

http://www.technologynetworks.com/Metabolomics/news.aspx?ID=183998

Researchers at the University of Liverpool, working with a global healthcare company, have helped develop a new treatment for obesity.
The treatment, which is a once-daily injectable derivative of a metabolic hormone called GLP-1 conventionally used in the treatment of type 2 diabetes, has proved successful in helping non-diabetic obese patients lose weight.

Professor John Wilding, who leads Obesity and Endocrinology research in the Institute of Ageing and Chronic Disease, investigates the pathophysiology and treatment of both obesity and type 2 diabetes and is applying his expertise in this area to work with, and often act as a consultant for, a number of large pharmaceutical companies looking to develop new treatments for obesity and diabetes.

Exciting development

Professor Wilding, said: “The biology of GLP-1 has been a focus of my research for 20 years; in particular when I was working at Hammersmith Hospital in London, I was part of the team that demonstrated that it was involved in appetite regulation; work on GLP-1 has continued during my time in Liverpool. Being involved in the development of a treatment, from the basic research right through to clinical trials in patients is very exciting”.

“It is likely that the treatment will be used initially in very specific situations, such as helping patients who are severely obese. It differs from current treatments used for diabetes, as it has stronger appetite regulating effects but no greater effect on glucose control.”

In 2014 more than 1.9 billion adults worldwide were classed as obese by the World Health Organisation; in the UK numbers have more than tripled since 1980. This Obesity can lead to other serious health-related illnesses including type 2 diabetes, hypertension and obstructive sleep apnoea as well as increasing the risk for many common cancers.

The drug has been approved in the European Union, but has not yet launched in the UK.

Professor Wilding added: “Consultancy like this can help relationship and reputation building and informs my research keeping it at the forefront of developments. It also brings many other benefits such as publications and income generation, which can help support other research, for example by such as funding for pilot projects that can lead to grant applications and investigator-initiated trials funded by the company”.


Evidence of How Incurable Cancer Develops

http://www.technologynetworks.com/Metabolomics/news.aspx?ID=184346

Researchers in the West Midlands have made a breakthrough in explaining how an incurable type of blood cancer develops from an often symptomless prior blood disorder.

The findings could lead to more effective treatments and ways to identify those most at risk of developing the cancer.

All patients diagnosed with myeloma, a cancer of the blood-producing bone marrow, first develop a relatively benign condition called ‘monoclonal gammopathy of undetermined significance’ or ‘MGUS’.

MGUS is fairly common in the older population and only progresses to cancer in approximately one in 100 cases. However, currently there is no way of accurately predicting which patients with MGUS are likely to go on to get myeloma.

Myeloma is diagnosed in around 4,000 people each year in the UK. It specifically affects antibody-producing white blood cells found in the bone marrow, called plasma cells. The researcher team from the University of Birmingham, New Cross and Heartlands Hospitals compared the cellular chemistry of bone marrow and blood samples taken from patients with myeloma, patients with MGUS and healthy volunteers.

Surprisingly, the researchers found that the metabolic activity of the bone marrow of patients with MGUS was significantly different to plasma from healthy volunteers, but there were very few differences at all between the MGUS and myeloma samples. The research was funded by the blood cancer charity Bloodwise, which changed its name from Leukaemia & Lymphoma in September.

The findings suggest that the biggest metabolic changes occur with the development of the symptomless condition MGUS and not with the later progression to myeloma.

Dr Daniel Tennant, who led the research at the University of Birmingham, said, “Our findings show that very few changes are required for a MGUS patient to progress to myeloma as we now know virtually all patients with myeloma evolve from MGUS. A drug that interferes with these specific initial metabolic changes could make a very effective treatment for myeloma, so this is a very exciting discovery.”

The research team found over 200 products of metabolism differed between the healthy volunteers and patients with MGUS or myeloma, compared to just 26 differences between MGUS patients and myeloma patients. The researchers believe that these small changes could drive the key shifts in the bone marrow required to support myeloma growth.

Read Full Post »

« Newer Posts - Older Posts »