Feeds:
Posts
Comments

Archive for the ‘Anticancer Resistance’ Category

Metabolic Response Heterogeneity

Larry H Bernstein, MD, FCAP, Curator

LFBI


The Prognostic Significance of Metabolic Response Heterogeneity in Metastatic Colorectal Cancer

PLoS One. 2015; 10(9): e0138341.

Published online 2015 Sep 30. doi:  10.1371/journal.pone.0138341

PMCID: PMC4589397

Alain Hendlisz,1,* Amelie Deleporte,1 Thierry Delaunoit,2 Raphaël Maréchal,3 Marc Peeters,4 Stéphane Holbrechts,6Marc Van den Eynde,7 Ghislain Houbiers,9 Bertrand Filleul,2 Jean-Luc Van Laethem,3 Sarah Ceyssens,5 Anna-Maria Barbuto,6 Renaud Lhommel,8 Gauthier Demolin,9 Camilo Garcia,10 Hazem El Mansy,1,2,3,4,5,6,7,8,9,10 Lieveke Ameye,11 Michel Moreau,11 Thomas Guiot,10 Marianne Paesmans,11 Martine Piccart,1 and Patrick Flamen10

Daniele Santini, Editor

Author information ► Article notes ► Copyright and License information ►

Go to:

Abstract

Background Tumoral heterogeneity is a major determinant of resistance in solid tumors. FDG-PET/CT can identify early during chemotherapy non-responsive lesions within the whole body tumor load. This prospective multicentric proof-of-concept study explores intra-individual metabolic response (mR) heterogeneity as a treatment efficacy biomarker in chemorefractory metastatic colorectal cancer (mCRC).

Methods Standardized FDG-PET/CT was performed at baseline and after the first cycle of combined sorafenib (600mg/day for 21 days, then 800mg/day) and capecitabine (1700 mg/m²/day administered D1-14 every 21 days). MR assessment was categorized according to the proportion of metabolically non-responding (non-mR) lesions (stable FDG uptake with SUV-max decrease <15%) among all measurable lesions.

Results Ninety-two patients were included. The median overall survival(OS) and progression-free survival (PFS) were 8.2months (95%CI:6.8–10.5) and 4.2months (95%CI:3.4–4.8) respectively. In the 79 assessable patients, early PET-CT showed no metabolically refractory lesion in 47%, a heterogeneous mR with at least one non-mR lesion in 32%, and a consistent non-mR or early disease progression in 21%. On exploratory analysis, patients without any non-mR lesion showed a significantly longer PFS (HR 0.34; 95% CI: 0.21–0.56, P-value 0.02) compared to the other patients. The proportion of non-mR lesions within the tumor load did not impact PFS/OS.

Conclusion The presence of at least one metabolically refractory lesion is associated with a poorer outcome in advanced mCRC patients treated with combined sorafenib-capecitabine. Early detection of treatment-induced mR heterogeneity may represent an important predictive efficacy biomarker in mCRC.

Trial Registration ClinicalTrials.gov NCT01290926


Background

Tumoral heterogeneity is a major determinant of resistance in solid tumors. FDG-PET/CT can identify early during chemotherapy non-responsive lesions within the whole body tumor load. This prospective multicentric proof-of-concept study explores intra-individual metabolic response (mR) heterogeneity as a treatment efficacy biomarker in chemorefractory metastatic colorectal cancer (mCRC).

Methods

Standardized FDG-PET/CT was performed at baseline and after the first cycle of combined sorafenib (600mg/day for 21 days, then 800mg/day) and capecitabine (1700 mg/m²/day administered D1-14 every 21 days). MR assessment was categorized according to the proportion of metabolically non-responding (non-mR) lesions (stable FDG uptake with SUVmax decrease <15%) among all measurable lesions.

Results

Ninety-two patients were included. The median overall survival (OS) and progression-free survival (PFS) were 8.2 months (95% CI: 6.8–10.5) and 4.2 months (95% CI: 3.4–4.8) respectively. In the 79 assessable patients, early PET-CT showed no metabolically refractory lesion in 47%, a heterogeneous mR with at least one non-mR lesion in 32%, and a consistent non-mR or early disease progression in 21%. On exploratory analysis, patients without any non-mR lesion showed a significantly longer PFS (HR 0.34; 95% CI: 0.21–0.56, P-value <0.001) and OS (HR 0.58; 95% CI: 0.36–0.92, P-value 0.02) compared to the other patients. The proportion of non-mR lesions within the tumor load did not impact PFS/OS.

Conclusion

The presence of at least one metabolically refractory lesion is associated with a poorer outcome in advanced mCRC patients treated with combined sorafenib-capecitabine. Early detection of treatment-induced mR heterogeneity may represent an important predictive efficacy biomarker in mCRC.

Trial Registration

ClinicalTrials.gov NCT01290926

Introduction

The development of new therapeutics for solid tumors is currently strained by increasing regulatory demands to better define subpopulations bearing resistant diseases in order to spare patients from useless toxicities and the society from unaffordable costs in case of ineffective treatments.

Tumor heterogeneity through the existence of resistant subclones (genetic drift) or local environmental factors is nowadays accepted as a major determinant of treatment resistance. However, sensitive biomarkers of tumoral heterogeneity are lacking.[13] Current response assessment methods using morphology (RECIST using MRI/CT) or metabolism (PERCIST using FGD-PET/CT) do not allow the description of tumor heterogeneity because dichotomization of response (versus non-response) requires summing of measurements or the selection of the one single most representative lesion.[4] Moreover most of the new biological therapies render response evaluation even more challenging by the infrequency of tumor shrinkage.[58]

Imaging tumour metabolism using 18F-Fluorodeoxyglucose positron emission tomography coupled with computed tomography (FDG-PET/CT) allows rapid identification of treatment-refractory lesions with a high negative predictive value (NPV).[914] FDG-PET is currently central in the international recommendations for response assessment for Hodgkin’s disease and aggressive non-Hodgkin’s lymphoma, in which medical conditions it is used commonly as a basis for therapeutic decisions. [1417] In contrast, solid tumors are frequently more refractory to treatment and reveal smaller and slower changes in FDG uptake under therapy leading to the existence of different criteria for metabolic response assessment at the lesion as well as at the patient level.[18,19] This ongoing discussion explain why metabolic imaging has still not acquired a biomarker status in solid tumors.

Metabolic imaging provides a whole-body quantitative assessment of treatment-induced changes in tumoral glycolysis early after treatment initiation, before any morphological changes are observed. It has therefore the potential to detect tumoral heterogeneity by revealing how distinct tumor sites behave in response to treatment.

Several trials suggest meaningful clinical activity of combined sorafenib-capecitabine in metastatic breast and colorectal cancer. However the significant toxicity of the combination renders its use practically incompatible with a palliative setting, further underscoring the need to identify a sensitive biomarker for patient selection.[20,21] Preliminary reports in lung and renal cancer suggest that FDG-PET-based metabolic response assessment could be used as a predictive biomarker of sorafenib.[22,23]

The trial is a proof-of-concept study designed to explore intra-individual mR heterogeneity as a prognostic biomarker for this combination of a biological and a cytotoxic agent in mCRC.


Material and Methods

Belgian competent authorities and ethical committees of the 6 participating centres approved the study (EudraCT 2010-023695-91, clinicaltrials.gov NCT01290926), designed as a prospective multicentric single-arm phase II, with one-stage accrual.

Patients with histologically proven unresectable metastatic CRC failing all standard treatments but not necessarily bevacizumab were eligible. Exclusion criteria were contraindications for capecitabine and sorafenib, ECOG performance status (PS) > 1, age < 18 years, and cerebral metastasis. Normal organ and bone marrow function, a life expectancy >12 weeks, and a signed informed consent were required.

Both drugs were given orally on an outpatient basis: sorafenib 200mg in the morning and 400 mg in the evening every day for the first cycle, then 400 mg twice a day every day; capecitabine 850 mg/m2 twice a day on days 1 to 14, every 21 days. One cycle was defined as a 21-day period. Adverse events were reported according to the National Cancer Institute Criteria, version 3.0 (http://ctep.cancer.gov/protocolDevelopment/electronic_applications/docs/ctcaev3.pdf). Study medications were to be stopped at disease progression or when unacceptable toxicity occurred. RECIST 1.1-radiological response was assessed locally every two cycles (6weeks). Patients were followed until objective disease progression and every 3 months thereafter for survival assessment.

FDG-PET/CT Imaging

For the FDG-PET/CT, patients were referred to one of the 5 participating PET/CT centres, previously approved for participation based on FDG-PET phantom imaging study for quality’s central assessment [24]. An independent academic molecular imaging core laboratory (OriLab) centralized all FDG-PET/CT images through anonymized CD-Rom transfers, checked image’s quality, DICOM headers, compliance to the Standard Procedures Imaging Manual and imaging case report forms.

Baseline FDG-PET/CT was performed within 7 days preceding chemotherapy initiation and repeated under the same technical and patient conditions on day (D)21 (range D19-D23), with D1 as the first day of chemotherapy administration. Prior to FDG injection, fasting ≥ 6 hours and glycemia levels <120 mg/dL for non-diabetic patients, and <180 mg/dL for diabetic patients were required. Short-acting insulin use on the day of FDG-PET/CT was not allowed.

The PET/CT was initiated 60 to 90 minutes after intravenous injection of 3.7 to 7.4 MBq/kg FDG, optimized for body weight. Similar FDG activity (+/-15%) and time window (+/- 15 min) were used for the second PET/CT.

Whole body scanning with a low dose CT (without intravenous or oral contrast, from proximal femur to skull) was performed, immediately followed by the PET acquisition. Imaging acquisition and reconstruction remained stable over the whole study period. The second FDG-PET/CT was strictly blinded to the investigators, and was not added to the patient’s (electronic) medical records.

The standard uptake value (SUV) of FDG used was the lean body mass-based maximal SUV value within the lesion (SUVmax, g/ml).

All FDG-PET/CT images were analysed in batches using the same software (PETVcar version 4.6, General Electric, USA) and display techniques. Two senior nuclear medicine physicians (PF, CG) performed independent mR analyses using a predefined 3-step methodology.[13] First, on the baseline PET/CT, target lesions were identified according to the following criteria: transaxial diameter (measured on the CT of the PET/CT) > 15 mm, intense FDG uptake (> 2 x normal liver parenchym uptake) and with an unequivocally neoplastic basis. Each target lesion was then classified as non-responding (decrease of SUVmax on second PET-CT<15%) or responding. Second, the patients were classified according to the lesional distribution of mR; class I: absence of any metabolically non-responding lesion, class II: a minor part of whole body tumour load shows a non-response, class III: major part of whole body target tumour load does not respond, and, class IV: all target lesions are non-responding, or presence of a progressive lesion (progression defined as >25% increase of SUVMax, or appearance of a new lesion). (Fig 1) Finally, different methods of patient response dichotomization (metabolic responders versus non-responders) were explored.

Fig 1

Classes of metabolic responses. Class1: no metabolic unresponsive lesion; Class2: minority of unresponsive lesions among whole body target tumour load; Class3: majority of whole body target tumour load does not respond; Class4: all target lesions are non-responding,or, presence of progressive lesions [progression defined as > 25% increase of FDG up take on second PET or appearance of a new lesion]  http://dx.doi.org:/10.1371/journal.pone.0138341.g001


Classes of metabolic responses.

Statistical considerations

A first co-primary objective defined the minimal clinical activity necessary to explore the negative predictive value of metabolic response imaging on OS as a survival rate at 6 months > 30% according to the existing literature on chemorefractory CRC. To reject the null hypothesis that the 6 month-OS rate would be <30% using a binomial distribution, a 1-sided test with α = 0.025 and a power of 90% in case of a true 6 months-OS ≥ 50% was used, requiring a sample size of 66 eligible patients followed for at least 6 months. An intent-to-treat (ITT) approach was used.

The second co-primary objective was the prognostic value of mR classification. Based on a previous study,[13] and anticipating a 95% eligibility rate, a 50% early PET/CT non-responders rate, and a hazard ratio (HR) around 0.385 for comparison between the survival distributions, 54 events were needed for a 90% power and a two-sided logrank test at the 2.5% level.

Because the mR rate monitored during the study was higher than expected, the number of events to be observed was increased to 62. This decision was taken without changing the HR to be detected and without estimating this HR during study conduct.

Secondary objectives were to describe PFS, objective response rate and toxicity and to determine the predictive value of early MR on PFS.

For the first co-primary objective, the 6 month-OS, median (m)OS and mPFS were calculated from the patient’s inclusion. For the second co-primary objective, the predictive value assessment of mR on OS and PFS was done from the time of the second FDG-PET/CT on patients having undergone the second FDG-PET/CT in order to control for guarantee-time bias.[25] PFS was calculated up to the time of disease progression or death, whichever occurred first. Kaplan-Meier estimates were used to characterise PFS and OS, and the log-rank test to investigate comparisons between survival curves. Cox’s proportional hazards model was used to calculate HR and their 95% CI

The multivariate analysis was performed using Cox’s proportional hazard model. Variables with a univariate P-value < 0.20 were considered as possible predictors in the multivariate model. We performed stepwise forward selection of variables, i.e. forward selection but at each step variables already in the model could be dropped if their associated p-value became >0.05. To verify the final model, also backward selection of variables was performed on all variables with univariate p-value<0.20, resulting in the same set of variables.[26]

All statistical analyses were performed using SAS 9.4 (SAS Institute Inc., Cary, NC, USA) and GraphPad Prism 6 software.

Patients found with an early metabolic progressive disease (class IV) were not excluded from the statistical analyses as the objectives of the paper were to show the predictive value of early metabolic response on OS and PFS, which implies the necessity of an intent-to-treat analysis. The event “progression” in the definition of PFS is moreover a radiological progression. Patients belonging to class IV do not meet this definition of radiological progression, which remains an event to be predicted.

Results

Between February and October 2011, 97 consecutive patients were enrolled in 6 clinical centres. The CONSORT diagram details the reasons for considering 5 patients as ineligible, excluding them from all analysis (Fig 2). The eligible patients (N = 92), median age 63 (range 28–83), male/female ratio of 54/46, PS 0 (55%) or 1(45%) received a median of 5 (range 0–44+) cycles of sorafenib-capecitabine after an history of a median of 3 (range 1–6) prior therapeutic lines including bevacizumab in 55% of patients. Codons 12–13 KRAS mutations were present in 52%.

Fig 2

Consort Diagram.  http://dx.doi.org:/10.1371/journal.pone.0138341.g002

Toxicity (Table 1)

Table 1

Most important (>10%) side effects in the 88 patients who received treatment according to Common Toxicity Criteria CTC3.0.  http://dx.doi.org:/10.1371/journal.pone.0138341.t001

Patients presented a median of 7 (Q1 = 4, Q3 = 9) different adverse reactions during therapy. All but one patient experienced at least one toxicity of any grade, of whom 61.4% with at least one grade III-IV. Grade III-IV side effects were mainly fatigue (21.6%), hand-foot skin reactions (HFSR) (15.9%), and diarrhoea (12.5%). No toxic death was observed. Toxicity led to dose modifications in 63.6% and therapy discontinuation in 5.7% of cases.

Survival data and radiological response

The mOS and mPFS were 8.2 months (95% CI: 6.8–10.5) and 4.2 months (95% CI: 3.4–4.8) respectively. The OS rate at 6 months was 71% (65/92) (95% CI: 61%-79%), significantly higher than the 30% minimal efficiency level predefined in the statistical plan (p-value <0.001), meeting the clinical co-primary endpoint.

According to RECIST, partial response was observed in 7/92 patients (7.6%, 95%CI 2.2–13.0). In the 79 assessable patients, disease control at first evaluation (partial responses and stable diseases according to RECIST) was noted in 32/37 (80%) of the patients with consistent mR versus 24/42 (57%) in other patients (p-value 0.006) (Table 2).

Table 2

RECIST1.1 versus Metabolic Response classes in patients for whom both mR and RECIST assessment of response are available.  http://dx.doi.org:/10.1371/journal.pone.0138341.t002

Metabolic response analysis

MR data were available for 79 patients: 37 (46.8%) were classified as class I; 14 (17.7%) as class II; 11 (13.9%) as class III; and 17 (21.5%) as class IV. Within Class IV, 8 patients (10%) showed early metabolic disease progression.

Patients without any metabolically non-responding lesions (Class I) performed better than patients with heterogeneous responses (Class II and III) or with a consistent non-response or progressive disease (Class IV). The difference between the four classes is statistically significant for mPFS (p-value <0.001) but not for mOS (p-value = 0.13). (Fig 3A and 3B)

Fig 3

PFS* (A) and OS* (B) distribution according to the 4 classes of metabolic response.  Class1: no metabolic unresponsive lesion; Class2: minority of unresponsive lesions among whole body target tumour load; Class3: majority of whole body target tumour load does not respond; Class 4: all target lesions are nonresponding, or, presence of progressive lesions [progression defined as >25% increase of FDG uptake on second PET, or appearance of a new lesion].*from date of the second FDG PET-CT.

Two classifications were considered for reporting response in a dichotomized way according to mR heterogeneity among lesions: classes (I and II) versus classes (III and IV),[13] and classes (I) versus classes (II+III+IV). The first compares outcome according to the dominance of non-mR lesions within the tumor load, the second according to the consistence of mR (Table 3Fig 4). “Using the “dominance” classification to define early metabolic non response, the second co-primary objective, which was to identify a prognostic value on survival for early metabolic assessment, was not met while it was successful to discriminate patients according to their outcome using the exploratory “consistence” classification.“Five of the 42 patients (12%) with at least one non-responding lesion remained free of disease progression at 6 months, versus 15 of the 37 class I patients (41%) (p-value 0.005).

http://dx.doi.org;/10.1371/journal.pone.0138341.g003


Table 3 Correlation of mPFS and mOS with Dominance and Consistency of metabolic response.  http://dx.doi.org:/10.1371/journal.pone.0138341.t003


Fig 4   PFS and OS distribution according to the dichotomized mR classifications.  http://dx.doi.org:/10.1371/journal.pone.0138341.g004

Multivariate analysis after stepwise variable selection of age, PS, number of previous chemotherapy lines, bevacizumab pretreatment, sex, Body Mass Index (BMI), HFSR occurrence and mR retained the absence of metabolically resistant lesion (class I) as the only variable significantly correlated with both mOS and mPFS (Table 4).

Table 4  Univariate and multivariate analysis for OS and PFS.   http://dx.doi.org:/10.1371/journal.pone.0138341.t004

Discussion

Tumoral heterogeneity, described as the coexistence of genomically different subclones within a patient tumor load or to local environmental aspects, is recognized as a major determinant of resistance to treatment in solid tumors.[13] However, interlesional tumor heterogeneity in metastatic setting is not covered by current response assessment methods because of the analysis’ methodology performing averaging of responses among lesions. This prospective multicentric proof-of-concept study explored interlesional mR heterogeneity as a biomarker of treatment resistance in advanced solid tumors.

As previously reported in several solid tumors, FDG-PET/CT response assessment after one therapy cycle allows a rapid identification of non-responding lesions/patients, fulfilling the necessary conditions to become potentially a good predictive biomarker, which is crucial to avoid useless toxicity.[4,912,22,27] Moreover, significant progresses and implementation of standardized methodology for FDG-PET/CT imaging, including homogenization of imaging procedures and patient’s preparation, quality control and independent central analysis, now allows its use in multicentric trials.[24,27,28]

Studying tumoral heterogeneity requires assessing the response of the whole baseline metastatic tumor load without restriction in number nor site. However, existing morphological (WHO, RECIST) and metabolic (EORTC, PERCIST) response assessment methods do not take into account this response heterogeneity because they only consider a limited number of operator-selected target lesions and/or perform summing or averaging of response variables.[4,19,29,30] Moreover, being classically performed late during treatment, these assessment criteria measure response, while from a clinical point of view, it is the presence of non-response that triggers the need for treatment adaptation. For this, based on prior research, in order to optimize the negative predictive value (NPV) of mR assessment, a 15% cut-off value of SUVmax decrease instead of the standard 25–30% response cut-off value was chosen.[18,31] Such low cut-off value maximally avoids unjustified denial to a potentially active treatment regimen.

With regard to the characterization of response heterogeneity among lesions, this study adopted a multistep descriptive procedure. First, a lesion-by-lesion response analysis of all measurable lesions on baseline FDG-PET/CT without restriction of their number was performed applying the 15% cut-off for non-response. Then, a patient-based 4-class classification was applied, describing the presence and proportion of metabolically non-responding lesions among the whole-body tumor load.[13]

Using such methodology, 22% of the patients showed overall treatment resistance of whom 10% showed early metabolic disease progression at 3 weeks. This observation indicates the importance of performing the baseline FDG-PET/CT as close as possible before the start of the tested drug administration, because rapid disease progression during this timeframe could lead to false negative mR assessment.

On the other hand, after one treatment cycle, 32% of the patients showed heterogeneous metabolic responses combining resistant with potentially responding lesions (Class II and III). Of these, 18% showed non-mR in the minor, while 14% showed a non-mR in the major part of the tumor load. The proportion of heterogeneous response observed in this study is considerable, confirming earlier observation in an independent mCRC patient group treated with chemotherapy, where heterogeneity of mR was described in 67% of patients.[13] Other comparisons are impossible because information about heterogeneity is lacking in most available literature, which apply dichotomization to response assessment.[3234]

Indeed, for clinical decision-making, the response assessment is generally reported dichotomously, because clinicians have to decide whether to continue or adapt the initiated treatment. Such information-reducing response reporting may only be adequate in case of homogeneous mR, but blurs useful information in case of response heterogeneity.

Outcome analysis in this study indicated that mPFS and mOS are comparable in patients bearing one or more metabolically resistant lesion. Only patients without any resistant lesion (class I) seemed to have a better outcome (mPFS and mOS) compared to all others. Therefore it seems that the presence but not the number/proportion of non-responding lesions is the most important prognostic determinant. Moreover, its value is reinforced by a multivariate analysis showing absence of any metabolically treatment resistant lesion as an independent prognostic factor for both PFS and OS.

A valid assessment of a predictive biomarker requires a significant level of activity of the regimen under study. This was achieved, as 71% of the included patients were still alive at 6 months, which was significantly higher than the minimal activity predefined in the study design. ITT analysis of the 92 eligible patients showed a mPFS of 4.2 months and a mOS of 8.2 months respectively, suggesting an overall beneficial effect for this drug combination compared to recent historical data with 2 months mPFS and 4–6 months mOS in the same clinical setting.[6,31,3537]

Moreover, this study confirms the need for an effective predictive response biomarker for a sorafenib-containing regimen, because of the high toxicity profile together with the poor sensitivity of morphology-based imaging (CT/MRI) for detecting responses (only 8% of partial response according to RECIST) during treatment.[7,8,38]

A major application of standardized metabolic imaging is expected in early drug development (phase I-II) for two reasons: (i) as FDG-PET response analysis seems to be correlated with prognosis, it provides a rapid appraisal of the new drug activity even in small patient populations, and (ii) image-guided biopsies of resistant lesions could identify the molecular basis of treatment resistance by demonstrating genomic or epigenomic heterogeneity.

In this study for instance, half (47%) of the patients didn’t demonstrate any resistant lesion, indicating a remarkable activity level for such a heavily pre-treated patients population, unsuspected by classical morphological imaging.

Furthermore, in the metastatic setting, FDG-PET/CT may provide a tool for the identification of patients with one or very few metastatic sites resisting to treatment for whom the continuation of unchanged therapy carries a grim prognosis. This raises the potential of adding locoregional ablative treatments guided by the imaging of metabolic response, in order to achieve homogeneity of disease control and restore prognosis. If the current observation is confirmed by an ongoing multicentric trial, (clinicaltrials.gov NCT01929616), randomized prospective trials using early FDG-PET/CT response assessment as an interventional tool for targeting locoregional therapy (eg. surgery, radioembolization, radiofrequency ablation) will be justified.

Finally, in the absence of randomized data based on PET response, it remains to be proven whether the presence of metabolically non-responding lesions is a biomarker identifying more heterogeneous diseases with intrinsically a worse prognosis, or a genuine therapeutic predictive tool for a given treatment.


Conclusions

Metabolic response assessment allows the early identification of treatment-resistant tumor sites. The presence of metabolically refractory lesions seems to negatively impact overall treatment outcome whatever their number, adding to the mounting evidence that tumour heterogeneity is a key element in cancer management.

Early assessment of mR heterogeneity is a potentially powerful predictive biomarker enabling the personalization of anticancer treatments by increasing their cost-effectiveness and sparing useless toxicities.

Go to:

Supporting Information

S1 Protocol

Study protocol.

(PDF)

Click here for additional data file.(1.1M, pdf)

S1 TREND Checklist

TREND Checklist.

(PDF)

Click here for additional data file.(1.3M, pdf)

References

  1. McDermott U, Downing JR, Stratton MR (2011) Genomics and the continuum of cancer care. N Engl J Med 364: 340–350. doi: 10.1056/NEJMra0907178[PubMed]
  2. Greaves M, Maley CC (2012) Clonal evolution in cancer. Nature 481: 306–313. doi:10.1038/nature10762[PMC free article] [PubMed]
  3. Aparicio S, Caldas C (2013) The implications of clonal genome evolution for cancer medicine. N Engl J Med 368: 842–851. doi: 10.1056/NEJMra1204892[PubMed]
  4. Eisenhauer EA, Therasse P, Bogaerts J, Schwartz LH, Sargent D, Ford R, et al. (2009) NSew response evaluation criteria in solid tumours: revised RECIST guideline (version 1.1). Eur J Cancer 45: 228–247.[PubMed]
  5. Grothey A, Hedrick EE, Mass RD, Sarkar S, Suzuki S, Ramanathan RK, et al. (2008) Response-independent survival benefit in metastatic colorectal cancer: a comparative analysis of N9741 and AVF2107.J Clin Oncol 26: 183–189. doi: 10.1200/JCO.2007.13.8099[PubMed]
  6. Grothey A, Van Cutsem E, Sobrero A, Siena S, Falcone A, Ychou M, et al. (2012) Regorafenib monotherapy for previously treated metastatic colorectal cancer (CORRECT): an international, multicentre, randomised, placebo-controlled, phase 3 trial. Lancet 381: 303–312. doi: 10.1016/S0140-6736(12)61900-X[PubMed]
  7. Llovet JM, Ricci S, Mazzaferro V, Hilgard P, Gane E, Blanc JF, et al. (2008) Sorafenib in advanced hepatocellular carcinoma. N Engl J Med 359: 378–390. doi: 10.1056/NEJMoa0708857[PubMed]
  8. Awada A, Gil T, Whenham N, Van Hamme J, Besse-Hammer T, Brendel E, et al. (2011) Safety and pharmacokinetics of sorafenib combined with capecitabine in patients with advanced solid tumors: results of a phase 1 trial. J Clin Pharmacol 51: 1674–1684. doi: 10.1177/0091270010386226[PubMed]
  9. Ott K, Weber WA, Lordick F, Becker K, Busch R, Herrmann K, et al. (2006) Metabolic imaging predicts response, survival, and recurrence in adenocarcinomas of the esophagogastric junction. J Clin Oncol 24: 4692–4698. [PubMed]
  10. Hoekstra CJ, Stroobants SG, Smit EF, Vansteenkiste J, van Tinteren H, Postmus PE, et al. (2005)Prognostic relevance of response evaluation using [18F]-2-fluoro-2-deoxy-D-glucose positron emission tomography in patients with locally advanced non-small-cell lung cancer. J Clin Oncol 23: 8362–8370. [PubMed]
  11. Rousseau C, Devillers A, Sagan C, Ferrer L, Bridji B, Campion L, et al. (2006) Monitoring of early response to neoadjuvant chemotherapy in stage II and III breast cancer by [18F]fluorodeoxyglucose positron emission tomography. J Clin Oncol 24: 5366–5372. [PubMed]
  12. de Geus-Oei LF, van Laarhoven HW, Visser EP, Hermsen R, van Hoorn BA, Kamm YJ, et al. (2008)Chemotherapy response evaluation with FDG-PET in patients with colorectal cancer. Ann Oncol 19: 348–352. [PubMed]
  13. Hendlisz A, Golfinopoulos V, Garcia C, Covas A, Emonts P, Ameye L, et al. (2012) Serial FDG-PET/CT for early outcome prediction in patients with metastatic colorectal cancer undergoing chemotherapy.Ann Oncol 23: 1687–1693. doi: 10.1093/annonc/mdr554[PubMed]
  14. Barrington SF, Mikhaeel NG, Kostakoglu L, Meignan M, Hutchings M, Mueller SP, et al. (2014) Role of Imaging in the Staging and Response Assessment of Lymphoma: Consensus of the International Conference on Malignant Lymphomas Imaging Working Group. J Clin Oncol. [PubMed]
  15. Cheson BD, Pfistner B, Juweid ME, Gascoyne RD, Specht L, Horning SJ, et al. (2007) Revised response criteria for malignant lymphoma. J Clin Oncol 25: 579–586. [PubMed]

….

Read Full Post »

Treatment of Acute Leukemias

Author and Curator: Larry H. Bernstein, MD, FCAP

2.4.4 Treatment of Acute Leukemias

Treatment of Acute Lymphoblastic Leukemia

Ching-Hon Pu, and William E. Evans
N Engl J Med Jan 12, 2006; 354:166-178
http://dx.doi.org:/10.1056/NEJMra052603

Although the overall cure rate of acute lymphoblastic leukemia (ALL) in children is about 80 percent, affected adults fare less well. This review considers recent advances in the treatment of ALL, emphasizing issues that need to be addressed if treatment outcome is to improve further.

Acute Lymphoblastic Leukemia

Ching-Hon Pui, Mary V. Relling, and James R. Downing
N Engl J Med Apr 8, 2004; 350:1535-1548
http://dx.doi.org:/10.1056/NEJMra023001

This comprehensive survey emphasizes how recent advances in the knowledge of molecular mechanisms involved in acute lymphoblastic leukemia have influenced diagnosis, prognosis, and treatment.

Gene-Expression Patterns in Drug-Resistant Acute Lymphoblastic Leukemia Cells and Response to Treatment

Amy Holleman, Meyling H. Cheok, Monique L. den Boer, et al.
N Engl J Med 2004; 351:533-42

Childhood acute lymphoblastic leukemia (ALL) is curable with chemotherapy in approximately 80 percent of patients. However, the cause of treatment failure in the remaining 20 percent of patients is largely unknown.

Methods We tested leukemia cells from 173 children for sensitivity in vitro to prednisolone, vincristine, asparaginase, and daunorubicin. The cells were then subjected to an assessment of gene expression with the use of 14,500 probe sets to identify differentially expressed genes in drug-sensitive and drug-resistant ALL. Gene-expression patterns that differed according to sensitivity or resistance to the four drugs were compared with treatment outcome in the original 173 patients and an independent cohort of 98 children treated with the same drugs at another institution.

Results We identified sets of differentially expressed genes in B-lineage ALL that were sensitive or resistant to prednisolone (33 genes), vincristine (40 genes), asparaginase (35 genes), or daunorubicin (20 genes). A combined gene-expression score of resistance to the four drugs, as compared with sensitivity to the four, was significantly and independently related to treatment outcome in a multivariate analysis (hazard ratio for relapse, 3.0; P=0.027). Results were confirmed in an independent population of patients treated with the same medications (hazard ratio for relapse, 11.85; P=0.019). Of the 124 genes identified, 121 have not previously been associated with resistance to the four drugs we tested.

Conclusions  Differential expression of a relatively small number of genes is associated with drug resistance and treatment outcome in childhood ALL.

Leukemias Treatment & Management

Author: Lihteh Wu, MD; Chief Editor: Hampton Roy Sr
http://emedicine.medscape.com/article/1201870-treatment

The treatment of leukemia is in constant flux, evolving and changing rapidly over the past few years. Most treatment protocols use systemic chemotherapy with or without radiotherapy. The basic strategy is to eliminate all detectable disease by using cytotoxic agents. To attain this goal, 3 phases are typically used, as follows: remission induction phase, consolidation phase, and maintenance therapy phase.

Chemotherapeutic agents are chosen that interfere with cell division. Tumor cells usually divide more rapidly than host cells, making them more vulnerable to the effects of chemotherapy. Primary treatment will be under the direction of a medical oncologist, radiation oncologist, and primary care physician. Although a general treatment plan will be outlined, the ophthalmologist does not prescribe or manage such treatment.

  • The initial treatment of ALL uses various combinations of vincristine, prednisone, and L-asparaginase until a complete remission is obtained.
  • Maintenance therapy with mercaptopurine is continued for 2-3 years following remission.
  • Use of intrathecal methotrexate with or without cranial irradiation to cover the CNS varies from facility to facility.
  • Daunorubicin, cytarabine, and thioguanine currently are used to obtain induction and remission of AML.
  • Maintenance therapy for 8 months may lengthen remission. Once relapse has occurred, AML generally is curable only by bone marrow transplantation.
  • Presently, treatment of CLL is palliative.
  • CML is characterized by a leukocytosis greater than 100,000 cells. Emergent treatment with leukopheresis sometimes is necessary when leukostastic complications are present. Otherwise, busulfan or hydroxyurea may control WBC counts. During the chronic phase, treatment is palliative.
  • When CML converts to the blastic phase, approximately one third of cases behave as ALL and respond to treatment with vincristine and prednisone. The remaining two thirds resemble AML but respond poorly to AML therapy.
  • Allogeneic bone marrow transplant is the only curative therapy for CML. However, it carries a high early mortality rate.
  • Leukemic retinopathy usually is not treated directly. As the hematological parameters normalize with systemic treatment, many of the ophthalmic signs resolve. There are reports that leukopheresis for hyperviscosity also may alleviate intraocular manifestations.
  • When definite intraocular leukemic infiltrates fail to respond to systemic chemotherapy, direct radiation therapy is recommended.
  • Relapse, manifested by anterior segment involvement, should be treated by radiation. In certain cases, subconjunctival chemotherapeutic agents have been injected.
  • Optic nerve head infiltration in patients with ALL is an emergency and requires prompt radiation therapy to try to salvage some vision.

Treatments and drugs

http://www.mayoclinic.org/diseases-conditions/leukemia/basics/
treatment/con-20024914

Common treatments used to fight leukemia include:

  • Chemotherapy. Chemotherapy is the major form of treatment for leukemia. This drug treatment uses chemicals to kill leukemia cells.

Depending on the type of leukemia you have, you may receive a single drug or a combination of drugs. These drugs may come in a pill form, or they may be injected directly into a vein.

  • Biological therapy. Biological therapy works by using treatments that help your immune system recognize and attack leukemia cells.
  • Targeted therapy. Targeted therapy uses drugs that attack specific vulnerabilities within your cancer cells.

For example, the drug imatinib (Gleevec) stops the action of a protein within the leukemia cells of people with chronic myelogenous leukemia. This can help control the disease.

  • Radiation therapy. Radiation therapy uses X-rays or other high-energy beams to damage leukemia cells and stop their growth. During radiation therapy, you lie on a table while a large machine moves around you, directing the radiation to precise points on your body.

You may receive radiation in one specific area of your body where there is a collection of leukemia cells, or you may receive radiation over your whole body. Radiation therapy may be used to prepare for a stem cell transplant.

  • Stem cell transplant. A stem cell transplant is a procedure to replace your diseased bone marrow with healthy bone marrow.

Before a stem cell transplant, you receive high doses of chemotherapy or radiation therapy to destroy your diseased bone marrow. Then you receive an infusion of blood-forming stem cells that help to rebuild your bone marrow.

You may receive stem cells from a donor, or in some cases you may be able to use your own stem cells. A stem cell transplant is very similar to a bone marrow transplant.

2.4.4.2 Acute Myeloid Leukemia

New treatment approaches in acute myeloid leukemia: review of recent clinical studies.

Norsworthy K1Luznik LGojo I.
Rev Recent Clin Trials. 2012 Aug; 7(3):224-37.
http://www.ncbi.nlm.nih.gov/pubmed/22540908

Standard chemotherapy can cure only a fraction (30-40%) of younger and very few older patients with acute myeloid leukemia (AML). While conventional allografting can extend the cure rates, its application remains limited mostly to younger patients and those in remission. Limited efficacy of current therapies and improved understanding of the disease biology provided a spur for clinical trials examining novel agents and therapeutic strategies in AML. Clinical studies with novel chemotherapeutics, antibodies, different signal transduction inhibitors, and epigenetic modulators demonstrated their clinical activity; however, it remains unclear how to successfully integrate novel agents either alone or in combination with chemotherapy into the overall therapeutic schema for AML. Further studies are needed to examine their role in relation to standard chemotherapy and their applicability to select patient populations based on recognition of unique disease and patient characteristics, including the development of predictive biomarkers of response. With increasing use of nonmyeloablative or reduced intensity conditioning and alternative graft sources such as haploidentical donors and cord blood transplants, the benefits of allografting may extend to a broader patient population, including older AML patients and those lacking a HLA-matched donor. We will review here recent clinical studies that examined novel pharmacologic and immunologic approaches to AML therapy.

Novel approaches to the treatment of acute myeloid leukemia.

Roboz GJ1
Hematology Am Soc Hematol Educ Program. 2011:43-50.
http://dx.doi.org:/10.1182/asheducation-2011.1.43.

Approximately 12 000 adults are diagnosed with acute myeloid leukemia (AML) in the United States annually, the majority of whom die from their disease. The mainstay of initial treatment, cytosine arabinoside (ara-C) combined with an anthracycline, was developed nearly 40 years ago and remains the worldwide standard of care. Advances in genomics technologies have identified AML as a genetically heterogeneous disease, and many patients can now be categorized into clinicopathologic subgroups on the basis of their underlying molecular genetic defects. It is hoped that enhanced specificity of diagnostic classification will result in more effective application of targeted agents and the ability to create individualized treatment strategies. This review describes the current treatment standards for induction, consolidation, and stem cell transplantation; special considerations in the management of older AML patients; novel agents; emerging data on the detection and management of minimal residual disease (MRD); and strategies to improve the design and implementation of AML clinical trials.

Age ≥ 60 years has consistently been identified as an independent adverse prognostic factor in AML, and there are very few long-term survivors in this age group.5 Poor outcomes in elderly AML patients have been attributed to both host- and disease-related factors, including medical comorbidities, physical frailty, increased incidence of antecedent myelodysplastic syndrome and myeloproliferative disorders, and higher frequency of adverse cytogenetics.28 Older patients with multiple poor-risk factors have a high probability of early death and little chance of long-term disease-free survival with standard chemotherapy. In a retrospective analysis of 998 older patients treated with intensive induction at the M.D. Anderson Cancer Center, multivariate analysis identified age ≥ 75 years, unfavorable karyotype, poor performance status, creatinine > 1.3 mg/dL, duration of antecedent hematologic disorder > 6 months, and treatment outside a laminar airflow room as adverse prognostic indicators.29 Patients with 3 or more of these factors had expected complete remission rates of < 20%, 8-week mortality > 50%, and 1-year survival < 10%. The Medical Research Council (MRC) identified cytogenetics, WBC count at diagnosis, age, and de novo versus secondary disease as critical factors influencing survival in > 2000 older patients with AML, but cautioned in their conclusions that less objective factors, such as clinical assessment of “fitness” for chemotherapy, may be equally important in making treatment decisions in this patient population.30 It is hoped that data from comprehensive geriatric assessments of functional status, cognition, mood, quality of life, and other measures obtained during ongoing cooperative group trials will improve our ability to predict how older patients will tolerate treatment.

Current treatment of acute myeloid leukemia.

Roboz GJ1.
Curr Opin Oncol. 2012 Nov; 24(6):711-9.
http://dx.doi.org:/10.1097/CCO.0b013e328358f62d.

The objectives of this review are to discuss standard and investigational nontransplant treatment strategies for acute myeloid leukemia (AML), excluding acute promyelocytic leukemia.

RECENT FINDINGS: Most adults with AML die from their disease. The standard treatment paradigm for AML is remission induction chemotherapy with an anthracycline/cytarabine combination, followed by either consolidation chemotherapy or allogeneic stem cell transplantation, depending on the patient’s ability to tolerate intensive treatment and the likelihood of cure with chemotherapy alone. Although this approach has changed little in the last three decades, increased understanding of the pathogenesis of AML and improvements in molecular genomic technologies are leading to novel drug targets and the development of personalized, risk-adapted treatment strategies. Recent findings related to prognostically relevant and potentially ‘druggable’ molecular targets are reviewed.

SUMMARY: At the present time, AML remains a devastating and mostly incurable disease, but the combination of optimized chemotherapeutics and molecularly targeted agents holds significant promise for the future.

Adult Acute Myeloid Leukemia Treatment (PDQ®)
http://www.cancer.gov/cancertopics/pdq/treatment/adultAML/healthprofessional/page9

About This PDQ Summary

This summary is reviewed regularly and updated as necessary by the PDQ Adult Treatment Editorial Board, which is editorially independent of the National Cancer Institute (NCI). The summary reflects an independent review of the literature and does not represent a policy statement of NCI or the National Institutes of Health (NIH).

Board members review recently published articles each month to determine whether an article should:

  • be discussed at a meeting,
  • be cited with text, or
  • replace or update an existing article that is already cited.

Treatment Option Overview for AML

Successful treatment of acute myeloid leukemia (AML) requires the control of bone marrow and systemic disease and specific treatment of central nervous system (CNS) disease, if present. The cornerstone of this strategy includes systemically administered combination chemotherapy. Because only 5% of patients with AML develop CNS disease, prophylactic treatment is not indicated.[13]

Treatment is divided into two phases: remission induction (to attain remission) and postremission (to maintain remission). Maintenance therapy for AML was previously administered for several years but is not included in most current treatment clinical trials in the United States, other than for acute promyelocytic leukemia. (Refer to the Adult Acute Myeloid Leukemia in Remission section of this summary for more information.) Other studies have used more intensive postremission therapy administered for a shorter duration of time after which treatment is discontinued.[4] Postremission therapy appears to be effective when given immediately after remission is achieved.[4]

Since myelosuppression is an anticipated consequence of both the leukemia and its treatment with chemotherapy, patients must be closely monitored during therapy. Facilities must be available for hematologic support with multiple blood fractions including platelet transfusions and for the treatment of related infectious complications.[5] Randomized trials have shown similar outcomes for patients who received prophylactic platelet transfusions at a level of 10,000/mm3 rather than 20,000/mm3.[6] The incidence of platelet alloimmunization was similar among groups randomly assigned to receive pooled platelet concentrates from random donors; filtered, pooled platelet concentrates from random donors; ultraviolet B-irradiated, pooled platelet concentrates from random donors; or filtered platelets obtained by apheresis from single random donors.[7] Colony-stimulating factors, for example, granulocyte colony–stimulating factor (G-CSF) and granulocyte-macrophage colony–stimulating factor (GM-CSF), have been studied in an effort to shorten the period of granulocytopenia associated with leukemia treatment.[8] If used, these agents are administered after completion of induction therapy. GM-CSF was shown to improve survival in a randomized trial of AML in patients aged 55 to 70 years (median survival was 10.6 months vs. 4.8 months). In this Eastern Cooperative Oncology Group (ECOG) (EST-1490) trial, patients were randomly assigned to receive GM-CSF or placebo following demonstration of leukemic clearance of the bone marrow;[9] however, GM-CSF did not show benefit in a separate similar randomized trial in patients older than 60 years.[10] In the latter study, clearance of the marrow was not required before initiating cytokine therapy. In a Southwest Oncology Group (NCT00023777) randomized trial of G-CSF given following induction therapy to patients older than 65 years, complete response was higher in patients who received G-CSF because of a decreased incidence of primary leukemic resistance. Growth factor administration did not impact on mortality or on survival.[11,12] Because the majority of randomized clinical trials have not shown an impact of growth factors on survival, their use is not routinely recommended in the remission induction setting.

The administration of GM-CSF or other myeloid growth factors before and during induction therapy, to augment the effects of cytotoxic therapy through the recruitment of leukemic blasts into cell cycle (growth factor priming), has been an area of active clinical research. Evidence from randomized studies of GM-CSF priming have come to opposite conclusions. A randomized study of GM-CSF priming during conventional induction and postremission therapy showed no difference in outcomes between patients who received GM-CSF and those who did not receive growth factor priming.[13,14][Level of evidence: 1iiA] In contrast, a similar randomized placebo-controlled study of GM-CSF priming in patients with AML aged 55 to 75 years showed improved disease-free survival (DFS) in the group receiving GM-CSF (median DFS for patients who achieved complete remission was 23 months vs. 11 months; 2-year DFS was 48% vs. 21%), with a trend towards improvement in overall survival (2-year survival was 39% vs. 27%, = .082) for patients aged 55 to 64 years.[15][Level of evidence: 1iiDii]

References

  1. Kebriaei P, Champlin R, deLima M, et al.: Management of acute leukemias. In: DeVita VT Jr, Lawrence TS, Rosenberg SA: Cancer: Principles and Practice of Oncology. 9th ed. Philadelphia, Pa: Lippincott Williams & Wilkins, 2011, pp 1928-54.
  2. Wiernik PH: Diagnosis and treatment of acute nonlymphocytic leukemia. In: Wiernik PH, Canellos GP, Dutcher JP, et al., eds.: Neoplastic Diseases of the Blood. 3rd ed. New York, NY: Churchill Livingstone, 1996, pp 283-302.
  3. Morrison FS, Kopecky KJ, Head DR, et al.: Late intensification with POMP chemotherapy prolongs survival in acute myelogenous leukemia–results of a Southwest Oncology Group study of rubidazone versus adriamycin for remission induction, prophylactic intrathecal therapy, late intensification, and levamisole maintenance. Leukemia 6 (7): 708-14, 1992. [PUBMED Abstract]
  4. Cassileth PA, Lynch E, Hines JD, et al.: Varying intensity of postremission therapy in acute myeloid leukemia. Blood 79 (8): 1924-30, 1992. [PUBMED Abstract]
  5. Supportive Care. In: Wiernik PH, Canellos GP, Dutcher JP, et al., eds.: Neoplastic Diseases of the Blood. 3rd ed. New York, NY: Churchill Livingstone, 1996, pp 779-967.
  6. Rebulla P, Finazzi G, Marangoni F, et al.: The threshold for prophylactic platelet transfusions in adults with acute myeloid leukemia. Gruppo Italiano Malattie Ematologiche Maligne dell’Adulto. N Engl J Med 337 (26): 1870-5, 1997. [PUBMED Abstract]
  7. Leukocyte reduction and ultraviolet B irradiation of platelets to prevent alloimmunization and refractoriness to platelet transfusions. The Trial to Reduce Alloimmunization to Platelets Study Group. N Engl J Med 337 (26): 1861-9, 1997. [PUBMED Abstract]
  8. Geller RB: Use of cytokines in the treatment of acute myelocytic leukemia: a critical review. J Clin Oncol 14 (4): 1371-82, 1996. [PUBMED Abstract]
  9. Rowe JM, Andersen JW, Mazza JJ, et al.: A randomized placebo-controlled phase III study of granulocyte-macrophage colony-stimulating factor in adult patients (> 55 to 70 years of age) with acute myelogenous leukemia: a study of the Eastern Cooperative Oncology Group (E1490). Blood 86 (2): 457-62, 1995. [PUBMED Abstract]
  10. Stone RM, Berg DT, George SL, et al.: Granulocyte-macrophage colony-stimulating factor after initial chemotherapy for elderly patients with primary acute myelogenous leukemia. Cancer and Leukemia Group B. N Engl J Med 332 (25): 1671-7, 1995. [PUBMED Abstract]
  11. Dombret H, Chastang C, Fenaux P, et al.: A controlled study of recombinant human granulocyte colony-stimulating factor in elderly patients after treatment for acute myelogenous leukemia. AML Cooperative Study Group. N Engl J Med 332 (25): 1678-83, 1995. [PUBMED Abstract]
  12. Godwin JE, Kopecky KJ, Head DR, et al.: A double-blind placebo-controlled trial of granulocyte colony-stimulating factor in elderly patients with previously untreated acute myeloid leukemia: a Southwest oncology group study (9031). Blood 91 (10): 3607-15, 1998. [PUBMED Abstract]
  13. Buchner T, Hiddemann W, Wormann B, et al.: GM-CSF multiple course priming and long-term administration in newly diagnosed AML: hematologic and therapeutic effects. [Abstract] Blood 84 (10 Suppl 1): A-95, 27a, 1994.
  14. Löwenberg B, Boogaerts MA, Daenen SM, et al.: Value of different modalities of granulocyte-macrophage colony-stimulating factor applied during or after induction therapy of acute myeloid leukemia. J Clin Oncol 15 (12): 3496-506, 1997. [PUBMED Abstract]
  15. Witz F, Sadoun A, Perrin MC, et al.: A placebo-controlled study of recombinant human granulocyte-macrophage colony-stimulating factor administered during and after induction treatment for de novo acute myelogenous leukemia in elderly patients. Groupe Ouest Est Leucémies Aiguës Myéloblastiques (GOELAM). Blood 91 (8): 2722-30, 1998. [PUBMED Abstract]

Read Full Post »

Stem Cells and Cancer

Larry H. Bernstein, MD, FCAP, Curator

Leaders in Pharmaceutical Intelligence

Series E. 2; 8.09

Cancer cells programmed back to normal by US scientists

By Sarah Knapton, Science Editor

Scientists have turned cancerous cells back to normal by switching back on the process which stops normal cells from replicating too quickly. Cancer cells could be stopped from replicating after scientists found how to switch on the brakes.

http://www.telegraph.co.uk/news/science/science-news/11821334/Cancer-cells-programmed-back-to-normal-by-US-scientists.html

Cancer cells have been programmed back to normal by scientists in a breakthrough which could lead to new treatments and even reverse tumour growth.

For the first time aggressive breast, lung and bladder cancer cells have been turned back into harmless benign cells by restoring the function which prevents them from multiplying excessively and forming dangerous growths.

Scientists at the Mayo Clinic in Florida, US, said it was like applying the brakes to a speeding car.

So far it has only been tested on human cells in the lab, but the researchers are hopeful that the technique could one day be used to target tumours so that cancer could be ‘switched off’ without the need for harsh chemotherapy or surgery.

“We should be able to re-establish the brakes and restore normal cell function,” said Profesor Panos Anastasiadis, of the Department for Cancer Biology.

“Initial experiments in some aggressive types of cancer are indeed very promising.

“It represents an unexpected new biology that provides the code, the software for turning off cancer.”

Cells need to divide constantly to replace themselves. But in cancer the cells do not stop dividing leading to huge cell reproduction and tumour growth.

The scientists discovered that the glue which holds cells together is regulated by biological microprocessors called microRNAs. When everything is working normally the microRNAs instruct the cells to stop dividing when they have replicated sufficiently. They do this by triggering production of a protein called PLEKHA7 which breaks the cell bonds. But in cancer that process does not work.

Scientists discovered they could switch on cancer in cells by removing the microRNAs from cells and preventing them from producing the protein.

And, crucially they found that they could reverse the process switching the brakes back on and stopping cancer. MicroRNAs are small molecules which can be delivered directly to cells or tumours so an injection to increase levels could switch off disease.

“We have now done this in very aggressive human cell lines from breast and bladder cancer,” added Dr Anastasiadis.

“These cells are already missing PLEKHA7. Restoring either PLEKHA7 levels, or the levels of microRNAs in these cells turns them back to a benign state. We are now working on better delivery options.”

Cancer experts in Britain said the research solved a riddle that biologists had puzzled over for decades, why cells did not naturally prevent the proliferation of cancer.

“This is an unexpected finding,” said Dr Chris Bakal, a specialist in how cells change shape to become cancerous, at the Institute for Cancer Research in London.

“We have been trying to work out how normal cells might be suppressing cancer, and stopping dividing when they form contacts with each other, which has been a big mystery.

“Normal cells touch each other and form junctions then they shut down proliferation. If there is a way to turn that back on then that would be a way to stop tumours from growing.

“I think in reality it is unlikely that you could reverse tumours by reversing just one mechanism, but it’s a very interesting finding.”

Henry Scowcroft, Cancer Research UK’s senior science information manager, said: “This important study solves a long-standing biological mystery, but we mustn’t get ahead of ourselves.

“There’s a long way to go before we know whether these findings, in cells grown in a laboratory, will help treat people with cancer. But it’s a significant step forward in understanding how certain cells in our body know when to grow, and when to stop. Understanding these key concepts is crucial to help continue the encouraging progress against cancer we’ve seen in recent years.”

The research was published in the journal Nature Cell Biology.

Biomaterial Sponge-Like Impant Traps Spreading Cancer Cells

September 9, 2015 by mburatov http://wp.me/ptV19-1vG

Prof Lonnie Shea, from the Department of Biomedical Engineering at the University of Michigan and his team have designed a small sponge-like implant that has the ability to mop up cancer cells as they move through the body. This device has been tested in mice, but there is hope that the device could act as an early warning system in patients, alerting doctors to cancer spread. The sponge-like implant also seemed to stop rogue cancer cells from reaching other areas where they could establish the growth of new tumors. Shea and others published their findings in the journal Nature Communications.

According to Cancer Research UK, nine in 10 cancer deaths are caused by the disease-spreading to other areas of the body. Stopping the spread of cancer cells, or metastasis, is one of the ways to prevent cancers from becoming worse. Complicating this venture is the fact that cancer cells that circulate in the bloodstream are rare and difficult to detect.

Shea’s device is about 5mm or 0.2 inches in diameter and made of a “biomaterial” already approved for use in medical devices. So far, this implant has so far been tested in mice with breast cancer. Implantation experiments showed that it can be placed either in the abdominal fat or under the skin and that it tended to suck up cancer cells that had started to circulate in the body.

The implant mimicked a process known as chemoattraction in which cells that have broken free from a tumor are attracted to other areas in the body by immune cells. Shea and others found that these immune cells are drawn to the implant where they “set up shop.” This is actually a natural reaction to any foreign body, and the presence of the immune cells also attracts the cancer cells to the implant.

Initially, Shea and others labeled cancer cells with fluorescent proteins that caused them to glow under certain lights, which allowed them to be easily spotted. However, they eventually went on to use a special imaging technique that can distinguish between cancerous and normal cells. They discovered that they could definitively detect cancer cells that had been caught within the implant.

Unexpectedly, when they measured cancer cells that had spread in mice with and without the implant, they showed that the implant not only captured circulating cancer cells, but it also reduced the numbers of cancer cells present at other sites in the body.

Shea, said that he and his team were planning the first clinical trials in humans fairly soon: “We need to see if metastatic cells will show up in the implant in humans like they did in the mice, and if it’s a safe procedure and that we can use the same imaging to detect cancer cells.”

Shea and his coworkers are continuing their work in animals to determine what the outcomes if the spread of the cancer spread was detected at a very early stage, which is something that is presently not yet fully understood.

Lucy Holmes, Cancer Research UK’s science information manager, said: “We urgently need new ways to stop cancer in its tracks. So far this implant approach has only been tested in mice, but it’s encouraging to see these results, which could one day play a role in stopping cancer spread in patients.”


U of Penn Group Releases Hopeful Results of CAR T-Cells Trial

Sept 8, 2015 by mburatov

https://beyondthedish.wordpress.com/2015/09/08/u-of-penn-group-releases-hopeful-results-of-car-t-cells-trial/

Chimeric Antigen Receptor T-Cells (CART-cells) are a type of genetically engineered type of immune cell that represents one of the most promising avenues of cancer therapy. Such treatments can induce sustained remissions in patients with stubborn disease.

Studies with CART-cells have been tested in patients with relapsed and stubborn chronic lymphocytic leukemia (CLL). Now a new publication by Porter and others reports the results of a clinical trial that examined CART-cells as a treatment for blood-based cancers. This study reports that infused CART-cells were functional up to 4 years after treatment. Patients also achieved completely remission, and no patient who achieved complete remission relapsed, and no minimal residual disease was detected, suggesting that in a subset of patients, CAR T cells may drive disease eradication.

Patients enrolled in this study suffered from CLL and had a poor prognosis. The CART-cells employed in this study targeted the molecule CD19. Porter and others report the mature results of the treatment of 14 patients with relapsed and refractory CLL.

The patient’s own T-Cells were extracted from circulating blood, and genetically engineered to express a CD19-directed receptor. Patients received doses of 0.14 × 10[8] to 11 × 10[8] CTL019 cells. Patients were monitored for toxicity, response, expansion, and persistence of circulating CTL019 T cells.

The overall response rate in these heavily pretreated CLL patients was 8 of 14 (57%), and there were 4 complete remissions (CR) and 4 partial remissions (PR). The expansion of the CAR T-cells in culture correlated with clinical responses; the better the engineered T-cells grew in culture the better they performed in the Patient’s bodies. Furthermore, the CAR T-cells persisted and remained functional beyond 4 years in the first two patients achieving Complete Remission. None of the patients who experienced Complete Remission have relapsed.

All the patients who responded to the treatment developed “B cell aplastic” (abnormally low B-cell levels) and experienced cytokine release syndrome, which was part and partial of T cell proliferation.

Minimal residual disease was not detectable in patients who achieved Complete Remission, suggesting that disease eradication may be possible in some patients with advanced CLL.


New Method to Regulate Stem Cell Differentiation

GEN News Highlights Sep 2, 2015
http://www.genengnews.com/gen-news-highlights/new-method-developed-to-regulate-stem-cell-differentiation/81251707/

Researchers have developed a method that enables the regulation of a single gene’s behavior without changing the genome itself. [Professor Otonkoski Lab, University of Helsinki]

http://www.genengnews.com/Media/images/GENHighlight/thumb_Sep0915_UnivHelsinki_StemCellDifferentiationGraph3620321462.jpg

Scientists at the University of Helsinki in Finland say they have developed a new method that enables the activation of genes in a cell without changing the genome. Applications of the method include directing the differentiation of stem cells.

The method was developed by researchers Diego Balboa and Jere Weltner, who are working on their doctoral dissertations in the lab of  Timo Otonkoski, Ph.D., at the Meilahti medical campus of the University of Helsinki. The research study (“Conditionally Stabilized dCas9 Activator for Controlling Gene Expression in Human Cell Reprogramming and Differentiation”) was published in Stem Cell Reports.

The hottest topics in stem cell research at the moment are methods that can regulate the differentiation of cells. The differentiation process is based on how genes in a cell are activated and deactivated, so researchers are looking for ways to control the activation of the genes. The researchers dream of being able to activate and deactivate genes precisely at specific moments.

“We can produce undifferentiated stem cells from specialized cells, also known as iPS, or induced pluripotent stem cells, and we can regulate the differentiation of these cells by providing them with the right kinds of growth environments. However, we cannot control the differentiation process sufficiently. The process may go smoothly, but then at the very end, a single gene won’t activate at the necessary time, and the cell remains immature,” Dr. Otonkoski explains.

Researchers in Dr. Otonkoski’s laboratory have now developed a method that enables the regulation of a single gene’s behavior without changing the genome itself. The method employs CRISPR technology, but the regulation itself is controlled by the addition of chemicals. The desired gene is made receptive to the drug by introducing bits of RNA into the cell that will bind to the activator protein and the gene’s regulatory area. The gene will then activate in the desired way when the chemicals that regulates the activator protein are provided to the cell.

“In our research, we used two common antibiotics, doxycycline and trimethoprim, and these chemicals enabled us to regulate the expression of many genes precisely and effectively. The method worked on all cells we tested, including stem cells. We used human cells in our development,” continued Dr. Otonkoski, who emphasized that the method is currently being used in experimental models. It is far too early to discuss therapeutic applications.

“The basic idea has now been developed, and the method has been demonstrated to be viable, and I believe that it can become a very important research tool. In my laboratory we use the method to regulate the differentiation of stem cells, but it has many potential applications in other research fields, for example, in cancer biology.”


Single Cell Analysis (SCA): Expanding in Importance in Life Science Research — circa 2015

Technologies Impacting SCA and Driving Translation Towards Single Cell-based Diagnostics

GEN Sep 2, 2015  http://www.genengnews.com/insight-and-intelligence/single-cell-analysis-sca-expanding-in-importance-in-life-science-research-circa-2015/77900516/

The focus of this GEN Market & Tech Analysis report is Single Cell Analysis (SCA) Trends.

  • Select Biosciences performed a study of the en bloc Single Cell Analysis (SCA) space in August 2015 to reveal trends in this evolving field—the results from these analyses are presented in this GENReport
  • The field is evolving as it is permeating into life sciences research as well as diagnostics development — this represents the translation of SCA and is evidenced for instance by the increasing penetrance of circulating tumor cell (CTC) research in the SCA space
  • The field of SCA is intersecting with nucleic acid and protein characterizing approaches/technologies which suggests that the “cargo” of single cells is a current area of study
  • The utilization of microfluidics approaches in SCA is a key and growing theme and suggests that the use of microfluidics for single cell capture and interrogation is gaining momentum

Shedding Light On Century-Old Biochemical Mystery

Aug 20, 2015  http://www.technologynetworks.com/Metabolomics/news.aspx?ID=182141

Yale scientists have used magnetic resonance measurements to show how glucose is metabolized in yeast to answer the puzzle of the “Warburg Effect.”

Given plenty of glucose and oxygen, yeast and cancer cells do not burn it all to produce energy but convert much of it to the byproducts ethanol and lactate, respectively.

In the 1920s Nobel laureate Otto Heinrich Warburg asked why these cells were so wasteful of energy. He suggested that this seemingly inefficient cellular use of resources was a root cause of cancer, a hypothesis that has been the subject of research ever since.

Almost a century later, two Yale scientists have used magnetic resonance measurements showing how glucose is metabolized in yeast to answer the puzzle of the “Warburg Effect.” The production of these byproducts is a result of the cell’s need to keep its internal state constant during glucose consumption, they report.

This biochemical response is an example of homeostasis, a fundamental need of all life forms.

“It’s the cell’s way of saying it has enough to eat,” said Robert Shulman, professor emeritus of molecular biophysics and biochemistry.

In the 1980s, Shulman conducted pioneering studies of metabolism in yeast using magnetic resonance spectroscopy, a method then confined to the study of cells but now used routinely in patients.

More recently, Shulman and co-author Douglas Rothman, professor of diagnostic radiology and of biomedical engineering, reviewed the data applying new methods of analyzing metabolic control. They found key intermediate molecular steps involved in the conversion of glucose to ethanol as well as to ATP, the chief energy source of cells. When these molecular switches that maintained homeostasis were disabled by mutations, the cells died from accumulated excesses of both byproducts and ATP.

This chemical balancing act explains why yeast and likely cancer cells do not convert all available fuel to energy that they could use to divide and flourish.

“Cancer cells have to survive first,” Rothman said.

Shulman and Rothman point out that their results open a new direction for cancer researchers — identifying metabolic homeostasis mechanisms and targeting them for treatment.

“By taking another look at the in vivo data available from magnetic resonance experiments, I think we can revitalize research efforts in a host of areas,” Shulman said.

Orchestrating Organoids

A guide to crafting tissues in a dish that reprise in vivo organs

By Kelly Rae Chi | Sep 1, 2015 http://www.the-scientist.com//?articles.view/articleNo/43842/title/Orchestrating-Organoids/

In 2009, at the Hubrecht Institute in Utrecht, Netherlands, Hans Clevers and postdoc Toshiro Sato took adult stem cells from the mouse intestine and created the first mini-guts they called organoids—three-dimensional organized clusters of cells that would allow the researchers to glean new insights into the biology of gut health and disease, including colorectal cancer.

This method inspired many other scientists, working with both mouse and human tissues, to create a rapidly expanding palette of organoids that now includes kidney, brain, liver, prostate, and pancreas. These cultured clumps are tiny enough to be sustained without a blood supply, but large and diverse enough in their cell compositions to tell us something about tissue development and whole-organ physiology.

A typical organoid protocol starts with isolated embryonic or pluripotent stem cells. Scientists culture the cells in a proteinaceous matrix (such as Matrigel) that supports three-dimensional growth. After a set period of time the organoids grow mature enough for study, or for engrafting into a mouse to allow them to further develop. Researchers then harvest the organoids and slice them for immunohistochemistry, funnel them through a flow cytometer to study their cell surface markers, or blend them for PCR.

Of course, the devil’s in the details. Although the field of organoid research is maturing rapidly (see “2013’s Big Advances in Science,” The Scientist, December 24, 2013), with some organoids already moving into clinical studies to test drug efficacy, culture methods are still in their infancy, says Michael Shen, professor of medicine and of genetics and development at Columbia University in New York City. “Certainly there are different ways to pursue organoid culture, and some of these are just beginning to be explored. I don’t think we’re at the point yet where this is all entirely cookbook.”

The Scientist talked with researchers about how they’re producing organoids, and what beginners should know. Here’s what we learned.

BRAIN BEADS
Researcher: Madeline Lancaster, group leader, MRC Laboratory of Molecular Biology, Cambridge, U.K.

Project: Understanding early brain development and disease using organoids cultured from human stem cells

Background: In 2013, as a postdoctoral researcher in the lab of Jürgen Knoblich at the Institute of Molecular Biotechnology in Vienna, Austria, Lancaster developed organoids from neural stem cells that she had been studying in 2-D culture conditions. She used the method to coax human induced pluripotent stem cells into brain organoids in order to understand the biology of microcephaly, a disorder that is difficult to re-create in animal models (Nature, 501:373-79, 2013).

Researchers have adopted Lancaster’s methods to create models of embryonic brain development, analogous to what happens in the first trimester of pregnancy, and to probe the molecular mechanisms of brain disorders, including autism, schizophrenia, and neurodegenerative diseases such as Parkinson’s and Alzheimer’s.

Getting started: The group’s protocol addresses some of the common questions asked by new users and provides photos showing the appearance of healthy organoids (Nat Protoc, 9:2329-40, 2014).

For those well versed in cell and tissue culture, the time and financial investment required to delve into organoids is minimal, Lancaster says. You need two main things: Matrigel (the supportive structure that allows the organoids to develop into more complex tissue) and equipment that will allow you to agitate the organoids to enhance nutrient and oxygen exchange in the media, making bigger organoids possible. If you don’t have a spinning bioreactor, you can use an orbital shaker set inside a standard tissue culture incubator.

Considerations: You should closely characterize the first few batches using RT-PCR or immunofluorescence to check for the expression of certain genes that indicate the organoids are indeed brain cells, Lancaster says.

Researchers studying neurodegeneration might consider examining their organoids starting at about four months. Although the organoids survive for up to 15 months, by that time they don’t look healthy. They start to decline at around six or seven months, as the neurons begin to disappear and are replaced by glia.

Tip: It takes some time and practice to develop an eye for healthy organoids. A good way to learn is to take pictures of your organoids as they develop. “You can always look back and say, ‘Oh, at that point I think it started going bad,’” Lancaster says.

Cost: Roughly $150 per organoid (not including equipment), according to Lancaster’s calculations

Looking ahead: Lancaster has already tweaked the method to improve the reproducibility, using a combination of timing and media formulations, and some new additives. She expects to publish a revised protocol by the end of the year.

GUTSY GLOBS
INTIMATING INTESTINE: Mini-gut methods are the most established of organoid protocols. Proliferating epithelial cells in small intestinal aggregations from mouse (green, left) and human (pink, right) will pave the way for patient-specific organoids.COURTESY OF HELMRATH LABResearcher: Maxime Mahé, postdoctoral research fellow inMichael Helmrath’s lab at Cincinnati Children’s Hospital Medical Center, Ohio

Project: Understanding gastrointestinal development and homeostasis and generating patient-specific organoids for study

Background: The intestinal epithelial layer is made up of tiny, slender projections, called villi, resembling the strands of a shag carpet. The nooks formed at the bases of the villi, known as crypts, are home to intestinal stem cells responsible for constant renewal of the intestinal lining. Building on Sato’s protocol, Mahé added two new twists: he used manual dissection to extract the crypts, rather than shaking the tissue to dissociate the cells; and he added a small-molecule activator of the Wnt3A pathway to boost expansion of the cells (Curr Protoc Mouse Biol, 3:217-40, 2013).

Helmrath’s group grew such “enteroids” from intestinal stem cells isolated from the crypts of surgically removed human intestine. In principle, such organoids could be developed from the tissue of specific patients for diagnostic and clinical uses. A video protocol is available in the Journal of  Visualized Experiments (doi: 10.3791/52483, 2015).

Getting started: It takes five or six attempts to get comfortable with the procedure, especially mastering the hardest part: the initial dissection. “The tissue is not always the same; it’s not something you can standardize,” Mahé says. “Sometimes you get a high number of crypts, sometimes you have a few.”

Tip: Many questions about cell proliferation, migration, and differentiation can be answered using in vitro organoids, Mahé says. “You save time, you save money, you save animals as well.” After that, you might consider moving into an animal model, depending on your goals: for example, to see muscle development, you should work in vivo, Mahé adds.

Looking ahead: The group is still working to be able to efficiently engraft human adult intestinal stem cell–derived organoids into mice. Although their first attempts were unsuccessful, they have since generated organoids for research from human embryonic stem cells (ESCs) and human induced pluripotent stem cells (iPSCs) derived by reprogramming fibroblasts. When organoids created from the either type of pluripotent stem cells are engrafted into immunodeficient mice to allow the cells to mature further, they develop into a human intestine (Nat Med, 20:1310-14, 2014), which may eventually lead to bioengineering a custom human intestine.

Cost: The Helmrath group spends roughly $150/sample in reagents to culture their organoids for a month. The medical center’s Pluripotent Stem Cell Facility provides training for a fee, and sells human intestinal organoids for roughly $400/plate (which contains 20–30 organoids).

B-CELL BALLS
PROSTRATE PROGRESS: Researchers have grown prostate organoids that consist of basal cells (green/blue) and luminal cells (red/blue).MAHO SHIBATAResearcher: Ankur Singh, assistant professor of mechanical and aerospace engineering, Cornell University

Project: In vitro modeling of immune reactions in mice

Background: When naive B cells in the body are exposed to antigens, they form clumps of cells called germinal centers in a lymph node or the spleen, where they proliferate, mutate to generate high-affinity antibodies, and undergo clonal expansion. Until now, this process has been difficult to recapitulate in vitro. Adding the necessary (stromal) support cells to primary naive B cells and culturing them in 2-D does not enable them to differentiate into cells resembling those from germinal centers, Singh says. Unlike stem cells, naive B cells do not tend to grow in clusters, so they need a little extra help.

Rather than using the conventional Matrigel for 3-D culture, Singh and his collaborators developed a gelatin and silicate-nanoparticle mix that mimics the softness of the body’s lymphoid organs. Within four to six days, the B cells in these organoids mature—100 times faster than B cells in 2-D culture—and produce two classes of antibodies important for fighting infections. The scientists use collagenase to dissolve the gel and harvest the organoid’s cells for analysis using flow cytometry. These new germinal center organoids were described this year in Biomaterials (63:24-34).

Getting started: Making the gelatin-nanoparticle mix is as easy as making Jell-O at home, Singh says, and the ingredients are commercially available. You’ll need experience with animal dissection (the necessary starting point is isolation of naive B cells from the spleen) and with cell culture. Once these techniques have been mastered, it takes roughly one week to get your first batch of organoids with mature antibody-producing cells.

Considerations: Singh’s group has already determined an optimal gelatin-nanoparticle ratio (2% gelatin/1.5% nanoparticle), but if you you’re using genetically mutated B cells, you may need to tweak the ratios. “It can be easily tuned,” Singh says.

Tip: After four days of incubating the cells with gel, you will see dark spots—a sign that the cells are proliferating and that you’re on the right track.

Cost: Not including the cost of generating immortalized stromal cell lines, it costs roughly $1 to produce one germinal center.

Looking ahead: Eventually, Singh’s group hopes to adapt the technique for use with patient-specific stem cells, though it has proven challenging to produce immune cells from stem cells. “It’s a very complicated process,” says Singh, “[but] it will happen one day in the context of this system.”

PROSTATE PELLETS
Researcher: Michael Shen, professor of medicine and of genetics and development, Columbia University Medical Center, New York

Project: Understanding basic prostate regeneration and prostate cancer

Background: In 2009, Shen’s group discovered a rare population of stem cells from which prostate cancer can originate (Nature, 461:495-500, 2009). Calling them CARNS, for castration-resistant Nkx3.1-expressing cells, the group knew they would face challenges culturing the cells because they are a type of luminal epithelial cell, which had historically proven difficult to expand using 2-D methods. “We thought if any type of approach would succeed it would be 3-D,” Shen recalls.

Through a trial-and-error approach, postdoctoral researcher Chee Wai Chua eventually converted mouse CARNS into organoids (Nat Cell Biol, 16:951-61, 2014). The resulting cell types and tissue architecture resembled those characteristic of normal prostate epithelium. The researchers then engrafted the organoids into mice to generate prostatic tissues.

Getting started: Shen’s group has made their method available via the Nature Protocol Exchange. The most difficult part for beginners is the initial tissue-dissociation step, which is typical of any organoid protocol. “To work out the details of how to do this is not straightforward,” Shen says. “In our case, we’re still working on this. We’re continually seeking to improve dissociation conditions.”

Considerations: When applied to the prostate, Clevers’s conditions seem to favor the growth of a different type of prostate cell known as a basal cell, though his group also grew luminal cells. Shen’s conditions are less defined than those of Clevers, using serum instead of specific growth factors. Shen’s group doesn’t know exactly which growth factors in the serum drive organoid growth and development.

Tip: If you are making the organoids from normal prostate for the first time, you might consider assessing their response to androgen deprivation. They should lose expression of Nkx3.1 in response to this condition.

Cost: It costs $1 or less for one mouse prostate organoid (not counting animal, equipment or labor costs).

Looking ahead: The group has been able to create organoids derived from human prostate cells, but determining the ideal conditions for these cells is still a work in progress, Shen says.

Tags

techniquesorganoidsdisease/medicine and 3-D cell culture

Aurelian Udristioiu commented on your update

“The human body emits low levels light, heat, and acoustical energy, these wavelengths of radiations having the electrical and magnetic properties and may also to be transformed in kinds of energy that cannot be easily defined by classical physical sciences and chemistry. In last time most researches has focused on electromagnetic aspects of the bio-magnetic field Bio-energetic fluids can be used in technology of preparation of drugs, from homeopath medicine and in laboratory medicine by the changes of pH in liquid medium with cultivated stem cells for to prolong the span life of cells, in view of cell-stem transplantation in chronic diseases. ”

Umbilical Cord Blood Contains c-kit+ Cells that Can Differentiate into Heart-like Cells

https://beyondthedish.wordpress.com/2015/09/10/umbilical-cord-blood-contains-c-kit-cells-that-can-differentiate-into-heart-like-cells/

Directed Neural Differentiation of Induced Pluripotent Stem Cells in the Marmoset

Peter J. Hornsby Ph.D. | 10th-Sep-2015

http://medical.wesrch.com/paper-details/pdf-ME1XXFT06ILUR-directed-neural-differentiation-of-induced-pluripotent-stem-cells-in-the-marmoset#page1

Description: Personalized cell therapy: The marmoset as a model- Before personalized cell therapy is used in humans, need to move beyond rodent models, Beyond rodents, nonhuman primates play key roles, Within nonhuman primates, the marmoset is a suitable size and life span for stem cell studies, Has been used in drug studies and in disease models, e.g. Parkinson’s disease, The marmoset was the first nonhuman primate to have transgenics with germline transmission, The second nonhuman primate (after the rhesus macaque) for which induced pluripotent stem cells were derived (our work, 2010).

DMSO treatment/differentiation: Conclusions- Despite some differences in growth characteristics of 3 marmoset iPS cell lines, all can be directed to a uniform pattern of neural differentiation by prior exposure to 24 h DMSO, The optimal DMSO concentration should be determined for each cell line, Therefore we should be able to differentiate any given (newly created) iPS cell population “on demand” by a protocol similar to the one used here.

Progress so far; next step- Marmoset iPS cells generated by a reproducible reprogramming method, Many marmoset iPS cell lines continuously grown for >1 year – immortal; maintain pluripotency, Rapid differentiation into the neural lineage using combinations of drugs with iterative testing, Rapid reprogramming of samples from living individuals, Rapid differentiation of living individual iPS cells. .

Read Full Post »

McEwen Award for Innovation: Irving Weissman, M.D., Stanford School of Medicine, and Hans Clevers, M.D., Ph.D., Hubrecht Institute

Larry H. Bernstein, MD, FCAP, Curator
Leaders in Pharmaceutical Innovation

Series E. 2; 7.3

Past winners include Azim Surani, James Thomson, Rudolf Jaenisch and Kazutoshi Takahashi with Shinya Yamanaka

The International Society for Stem Cell Research (ISSCR) has presented EuroStemCell partner Hans Clevers with the McEwen Award for Innovation at the opening of its annual meeting, today (24 June) in Stockholm, Sweden.

The prizes awarded by ISSCR in 2015 are:

McEwen Award for Innovation: Irving Weissman, M.D., Stanford School of Medicine, and Hans Clevers, M.D., Ph.D., Hubrecht Institute

ISSCR-BD Biosciences Outstanding Young Investigator Award: Paul Tesar, Ph.D., Case Western Reserve University School of Medicine

ISSCR Public Service Award: Alan Trounson, Ph.D., MIMR-PHI Institute of Medical Research


In 2015, the ISSCR recognizes long-standing contributors to the field, Weissman and Clevers, for the identification, prospective purification and characterization of somatic (adult) tissue-associated stem cells and advancement of their research findings toward clinical applications.

Award recipient Weissman’s many discoveries have helped map the direction of the stem cell field and have served as the basis for important research and work by scientists all over the world.  He was the first to isolate and characterize hematopoietic (blood) stem cells from mice and humans. He developed the approaches and technologies, now widely used within the field, for isolating blood stem and progenitor cells and defining their properties. Weissman pioneered the extension of his approaches to isolation of other stem cell types, including human nervous system cells and skeletal muscle myogenic stem/progenitor cells. Further, he discovered several independent leukemia stem cells and, more recently, bladder cancer stem cells, head and neck cancer stem cells and malignant melanoma stem cells. Weissman has pursued these discoveries to develop several promising means of cancer therapy.

Award recipient Clevers has been a leader in biomedical sciences and the area of Wnt signaling in colon cancer for more than three decades. He and his lab developed tools to identify and track an adult stem cell population able to give rise to the entire lining of the gut and later to demonstrate that these cells can be isolated and grown in culture as “miniguts,” recapitulating the normal structure and function of the gut. These discoveries are a move toward promising therapies for colon conditions, like ulcers, in which the lining of the intestine has been destroyed in patches, and provide a powerful resource for modeling disease pathology and for drug screening.

“Irv Weissman and Hans Clevers have made enormous contributions to stem cell science. Working in the blood and gut systems, respectively, and extending their findings in different tissues, they have defined the concepts and technologies that underpin many avenues of research,” Hans Schöler, chair of the ISSCR’s McEwen Awards selection committee, said. “Each has made pioneering conceptual advances in disease modeling and regenerative medicine.”


The ISSCR-BD Biosciences Outstanding Young Investigator Award recognizes exceptional achievements by an ISSCR member and investigator in the early part of their independent career in stem cell research.  The winner receives a $7,500 USD personal award and is invited to present at the ISSCR’s annual meeting. Past winners include Valentina Greco, Marius Wernig, Cédric Blanpain, Robert Blelloch, Joanna Wysocka and Konrad Hochedlinger.

Award recipient Tesar established his independent laboratory five years ago and has rapidly risen to his current position as the Dr. Donald and Ruth Weber Goodman Professor of Innovative Therapeutics and tenured Associate Professor in the Department of Genetics and Genome Sciences at Case Western Reserve University School of Medicine. Tesar’s studies have shaped the global understanding of both pluripotent stem cell and oligodendrocyte biology. His seminal and highly cited report on epiblast stem cells, published in Nature in 2007, along with similar findings by Pedersen, Vallier and colleagues, led to a complete shift in the understanding of how pluripotency is regulated in the mammalian embryo.  He has continued to provide high impact contributions to the field, pioneering new methods to generate and mature oligodendrocyte progenitor cells, and to use these to enhance repair in animal models of multiple sclerosis.

Stanford stem cell pioneer Irving Weissman wins international honors

by Krista Conger on Feb 10, 2015
http://news.stanford.edu/thedish/2015/02/10/stanford-stem-cell-pioneer-irving-weissman-wins-international-honors/

IRVING WEISSMAN, a professor of pathology and of developmental biology at Stanford Medical School, was recently awarded the Charles Rodolphe Brupbacher Prize for Cancer Research in Zurich.

Weissman, who directs the Stanford Institute for Stem Cell Biology and Regenerative Medicine, was honored for his role in identifying and isolating the first hematopoetic, or blood-forming, stem cell in mice in 1988, and then in humans in 1992. In 2000, he also isolated leukemia cancer stem cells from humans. Recently, he and his colleagues have devoted themselves to understanding how cancer cells escape destruction by the immune system by expressing a “don’t eat me” signal on their cell membranes.

“His discoveries on aging processes in stem-cell systems and ultimately his contribution toward understanding cancer stem cells and the way in which the immune system can control these cells are pioneering achievements with far-reaching clinical implications,” Markus Manz, director of the Department of Hematology at the University Hospital Zurich, said of Weissman at a symposium titled “Breakthroughs in Cancer Research and Therapy” where the prize was announced.

Weissman also is the director of Stanford’s Ludwig Center for Cancer Stem Cell Research and Medicine and holds the Virginia and Daniel K. Ludwig Professorship in Clinical Investigation in Cancer Research.

The prize, presented by the Charles Rodolphe Brupbacher Foundation, included 100,000 Swiss francs, or about $108,000.

The Charles Rodolphe Brupbacher Foundation was founded in 1991 by Brupbacher’s wife, Frederique, in honor of her late husband. This is the 12th time the prize, which is meant to recognize internationally acknowledged achievements in fundamental cancer research, has been awarded. Brupbacher was a Swiss banker, economist and international currency expert.

In addition to the Brupbacher Prize, it was recently announced that Weissman will receive theMcEwen Award for Innovation, supported by the McEwen Centre for Regenerative Medicine in Toronto. The award will be presented in June at the annual meeting of the International Society for Stem Cell Research in Stockholm. It recognizes the work of Weissman and Hans Clevers, of the Hubrecht Institute in the Netherlands, in the identification, purification and characterization of adult stem cells from a variety of human tissues and cancers. Weissman and Clevers will share a $100,000 award.

Anti-CD47 antibody may offer new route to successful cancer vaccination

Scientists at the School of Medicine have shown that their previously identified therapeutic approach to fight cancer via immune cells called macrophages also prompts the disease-fighting killer T cells to attack the cancer.

The research, published online May 20 in the Proceedings of the National Academy of Sciences, demonstrates that the approach may be a promising strategy for creating custom cancer vaccines.

Various researchers have been working over the years to create vaccines against cancer, but the resulting vaccines have not been highly effective. Current approaches to developing the vaccines rely on using immune cells called dendritic cells to introduce cancer protein fragments to T cells — a process known as antigen presentation. The hope has been that the process would stimulate the body’s T cells to identify cancer cells as diseased or damaged and target them for elimination. However, this process often only modestly activates the most potent cancer-fighting kind of T cell, called killer T cells or CD8+ T cells.

The Stanford team discovered that there was another viable vaccine approach, using the macrophage pathway to program killer T cells against cancer. Irving Weissman, MD, professor of pathology and of developmental biology, and his team previously showed that nearly all cancers use the molecule CD47 as a “don’t-eat-me” signal to escape from being eaten and eliminated by macrophages. The researchers found that anti-CD47 antibodies, which can block the “don’t-eat-me” signal and enable macrophages to engulf cancer cells, eliminated or inhibited the growth of various blood cancers and solid tumors.

In the new study, the Stanford team showed that after engulfing the cancer cells, the macrophages presented pieces of the cancer to CD8+ T cells, which, in addition to attacking cancer, are also potent attackers of virally infected or damaged cells. As a result, the CD8+ T cells were activated to attack the cancer cells on their own. “It was completely unexpected that CD8+ T cells would be mobilized when macrophages engulfed the cancer cells in the presence of CD47-blocking antibodies,” said MD/PhD student Diane Tseng, the lead author of the study. Following engulfment of cancer cells, macrophages activate T cells to mobilize their own immune attack against cancer, she said.

The Stanford group plans to start human clinical trials of the anti-CD47 cancer therapy in 2014. The new research provides hope that the therapy will cause the immune system to wage a two-pronged attack on cancer — through both macrophages and T cells. The approach may also give physicians early indicators of how the treatment is working in patients. “Monitoring T-cell parameters in patients receiving anti-CD47 antibody may help us identify the immunological signatures that tell us whether patients are responding to therapy,” said co-author Jens Volkmer, MD, an instructor at the Stanford Institute for Stem Cell Biology and Regenerative Medicine.

The research revives interest in an aspect of macrophages that has been neglected for decades: their role in presenting antigens to T cells. For many years, researchers have focused on the dendritic cell as the main antigen-presenting cell, and have generally believed that macrophages specialize in degrading antigens rather presenting them. This research shows that macrophages can be effective at antigen presentation and are powerful initiators of the CD8+T cell response.

The fact that T cells become involved in fighting cancer as a result of CD47-blocking antibody therapy could have important clinical implications. The antibody might be used as a personalized cancer vaccine allowing T cells to recognize the unique molecular markers on an individual patient’s cancer. “Because T cells are sensitized to attack a patient’s particular cancer, the administration of CD47-blocking antibodies in a sense could act as a personalized vaccination against that cancer,” Tseng added.

Weissman, who is senior author of the new study, is the director of the Stanford Institute for Stem Cell Biology and Regenerative Medicine and the director of the Stanford Ludwig Center for Cancer Stem Cell Research and Medicine.

Other Stanford investigators involved in the research were senior scientist Stephen Willingham, PhD; postdoctoral scholars John Fathman, PhD, Nathaniel Fernhoff, PhD, Matthew Inlay, PhD, and Masanori Miyanishi, MD, PhD; instructor Jun Seita, MD, PhD; graduate student Kipp Weisskopf, MPhil; and life sciences research associate Humberto Contreras-Trujillo.

The research was supported by the Virginia and D.K. Ludwig Fund for Cancer Research, the Joseph and Laurie Lacob Gynecologic/Ovarian Cancer Fund, the National Institutes of Health (grants R01CA86017, P01CA139490, P30CA124435 and F30CA168059), and the Student Training and Research in Tumor Immunology Program of the Cancer Research Institute.

Christopher Vaughan is communications manager at the Stanford Institute for Stem Cell Biology and Regenerative Medicine.


Clinical Investigation of a Humanized Anti-CD47 Antibody in Targeting Cancer Stem Cells in Hematologic Malignancies and Solid Tumors

Funding Type:

Disease Team Therapy Development III

Grant Number: DR3-06965

Investigator(s): Irving Weissman – PI

Institution: Stanford University

Disease Focus:
Cancer
Solid Tumor
Blood Cancer

Most normal tissues are maintained by a small number of stem cells that can both self-renew to maintain stem cell numbers, and also give rise to progenitors that make mature cells. We have shown that normal stem cells can accumulate mutations that cause progenitors to self-renew out of control, forming cancer stem cells (CSC). CSC make tumors composed of cancer cells, which are more sensitive to cancer drugs and radiation than the CSC. As a result, some CSC survive therapy, and grow and spread. We sought to find therapies that include all CSC as targets. We found that all cancers and their CSC protect themselves by expressing a ‘don’t eat me’ signal, called CD47, that prevents the innate immune system macrophages from eating and killing them. We have developed a novel therapy (anti-CD47 blocking antibody) that enables macrophages to eliminate both the CSC and the tumors they produce. This anti-CD47 antibody eliminates human cancer stem cells when patient cancers are grown in mice. At the time of funding of this proposal, we will have fulfilled FDA requirements to take this antibody into clinical trials, showing in animal models that the antibody is safe and well-tolerated, and that we can manufacture it to FDA specifications for administration to humans.

Here, we propose the initial clinical investigation of the anti-CD47 antibody with parallel first-in-human Phase 1 clinical trials in patients with either Acute Myelogenous Leukemia (AML) or separately a diversity of solid tumors, who are no longer candidates for conventional therapies or for whom there are no further standard therapies. The primary objectives of our Phase I clinical trials are to assess the safety and tolerability of anti-CD47 antibody. The trials are designed to determine the maximum tolerated dose and optimal dosing regimen of anti-CD47 antibody given to up to 42 patients with AML and up to 70 patients with solid tumors. While patients will be clinically evaluated for halting of disease progression, such clinical responses are rare in Phase I trials due to the advanced illness and small numbers of patients, and because it is not known how to optimally administer the antibody. Subsequent progression to Phase II clinical trials will involve administration of an optimal dosing regimen to larger numbers of patients. These Phase II trials will be critical for evaluating the ability of anti-CD47 antibody to either delay disease progression or cause clinical responses, including complete remission. In addition to its use as a stand-alone therapy, anti-CD47 antibody has shown promise in preclinical cancer models in combination with approved anti-cancer therapeutics to dramatically eradicate disease. Thus, our future clinical plans include testing anti-CD47 antibody in Phase IB studies with currently approved cancer therapeutics that produce partial responses. Ultimately, we hope anti-CD47 antibody therapy will provide durable clinical responses in the absence of significant toxicity.

New insights into the biology of cancer have provided a potential explanation for the challenge of treating cancer. An increasing number of scientific studies suggest that cancer is initiated and maintained by a small number of cancer stem cells that are relatively resistant to current treatment approaches. Cancer stem cells have the unique properties of continuous propagation, and the ability to give rise to all cell types found in that particular cancer. Such cells are proposed to persist in tumors as a distinct population, and because of their increased ability to survive existing anti-cancer therapies, they regenerate the tumor and cause relapse and metastasis. Cancer stem cells and their progeny produce a cell surface ‘invisibility cloak’ called CD47, a ‘don’t eat me signal’ for cells of the native immune system to counterbalance ‘eat me’ signals which appear during cancer development. Our anti-CD47 antibody counters the ‘cloak’, enabling the patient’s natural immune system to eliminate the cancer stem cells and cancer cells. Our preclinical data provide compelling support that anti-CD47 antibody might be a treatment strategy for many different cancer types, including breast, bladder, colon, ovarian, glioblastoma, leiomyosarcoma, squamous cell carcinoma, multiple myeloma, lymphoma, and acute myelogenous leukemia.

Development of specific therapies that target all cancer stem cells is necessary to achieve improved outcomes, especially for sufferers of metastatic disease. We hope our clinical trials proposed in this grant will indicate that anti-CD47 antibody is a safe and highly effective anti-ancer therapy that offers patients in California and throughout the world the possibility of increased survival and even complete cure.

We have previously developed a new therapeutic candidate, the anti-CD47 humanized antibody, Hu5F9-G4, which demonstrates potent anti-cancer activity in animal models of malignancy. The goal of CIRM DTIII Grant DR3-06965 is to conduct initial phase I clinical trials of this antibody in advanced cancer patients. We originally proposed to conduct two separate Phase I clinical trials: one in solid tumor patients with advanced malignancy (commenced in August 2014), the other in relapsed, refractory AML patients (anticipated to start in September 2015). The primary endpoints for these trials will be to assess safety and tolerability, and additional endpoints include obtaining information about the dosing regimen for subsequent clinical investigations, and initial efficacy assessments.

CD47 is a dominant anti-phagocytosis signal that is expressed on all types of human cancers assessed thus far. It binds to SIRPα, an inhibitory receptor on macrophages, and in so doing, blocks the ability of macrophages to engulf and eliminate cancer cells. Hu5F9-G4 blocks binding of CD47 to SIRPα, and restores the ability of macrophages to engulf or phagocytose cancer cells. In pre-clinical cancer models, treatment with Hu5F9-G4 shrunk tumors, eliminated metastases, and in some cases resulted in long-term protection from cancer recurrence. These results suggest that Hu5F9-G4 leads to elimination of cancer stem cells in addition to differentiated cancer cells.

We have developed Hu5F9-G4 for human clinical trials by demonstrating safety and tolerability in pre-clinical toxicology studies. These studies also indicated that we can achieve serum levels associated with potent efficacy in pre-clinical models. The regulatory agencies (FDA in the U.S., and MHRA in the U.K.) reviewed the large package of pre-clinical data describing Hu5F9-G4, and approved our requests to commence separate Phase I clinical trials in solid tumor and AML patients. The solid tumor trial commenced at Stanford in August 2014 and has been designed to assess patients in separate groups, or cohorts, treated with increasing doses of Hu5F9-G4. The trial is ongoing as primary endpoints have not been met. The acute myeloid leukemia trial has been given regulatory approval in the U.K., and will start enrolling patients in September 2015. In summary, during the last year, the Hu5F9-G4 clinical trials have made substantial progress and all milestones have been met.

Stem Cell Research: Promise and Progress

Hans Clevers: “Every day new research is showing us that many types of cancers are fed by tumour stem cells”

http://www.irbbarcelona.org/en/news/hans-clevers-every-day-new-research-is-showing-us-that-many-types-of-cancers-are-fed-by-tumour

The biggest challenge in designing new cancer therapies lies in successfully identifying and targeting tumour stem cells, which are responsible for the regrowth of the tumour.

The Barcelona BioMed Conference on “Normal and Tumour Stem Cells”, aims to analyze the function of stem cells in cancer. The conference, which begins today and runs until November 14 at the Institut d’Estudis Catalans, is co-organized by colon cancer research experts Eduard Batlle (IRB Barcelona) andHans Clevers (Hubrecht Institute, the Netherlands), with the support of the BBVA Foundation. During the three-day event, 21 world experts in the field will meet with a further 130 participants to share their latest research findings on tumour stem cells.

“In 2007 we held the first Barcelona BioMed Conference on this topic. At the time there was only very preliminary data on the relationship between stem cells and cancer. Five years on, many convincing data have emerged to indicate that the majority of tumours are indeed fed by tumour stem cells,” explains Hans Clevers, the scientist who first identified stem cells in the intestine and who today is one of the world leaders in research on normal stem cells and their potential for regenerative therapy.

A number of important studies have demonstrated that at the heart of cancers of the breast, colon, skin, brain, lung and leukemias lie a small group of malignant cells that have retained the properties of the stem cell that gave rise to the cancers in the first place. It is these cells that allow the tumour to grow and can regenerate it. The efforts of many research groups worldwide now focusses on unraveling this process, identifying the specific genes that allow it to occur, and finding ways to detect and eliminate these malignant stem cells.

Stem cells and the origin of tumours

One of the principal characteristics of stem cells is that they are able to copy themselves indefinitely, giving rise to one stem cell and one specialized cell. This capacity for unlimited replication ensures the constant renewal of healthy tissues, which is fundamental for survival and is the basis of regenerative medicine. When the stem cells undergo cancerous mutations or when normal tumour cells acquire stem cell properties, however, this can lead to the formation of tumours.

“This conference gives us a valuable opportunity to learn about the latest work on the two types of stem cells, normal and tumour, in different tissues. What we have been observing over recent years is that the tumour mimcs the hierarchies that exist in normal tissues. In order to understand the tumour, we need to understand the healthy tissue. Most of the scientists invited to the conference are working on both aspects,” explains Batlle. The list of speakers includes pioneers in the field, such as Irving L. Weissman, director of the Institute for Stem Cell Biology & Regenerative Medicine in Stanford, California. Weissman, known as the “father of haematopoiesis”, first identified stem cells in the blood and determined how they give rise to the different types of blood cells, making major contributions to our understanding of leukemias and other ‘liquid’ tumours.

Stem cells and metastasis

In addition to being at the root of the tumour and allowing it to grow, stem cells may also cause metastasis. In order for metastasis to occur, cells from the original tumour must escape into the blood stream and invade new organs to seed new tumours there. “Only cells with stem cell properties are able to make this happen, since they are the only type of cell that can generate all the cell types of the tumor,” explains Batlle. But in order to cause metastasis, these cells also need to be able to do other things. “We have discovered that in the case of colon cancer, stem cells must be able to trick the healthy tissue of the organ they have invaded into helping them survive in this hostile environment.” Batlle’s study, to be published tomorrow inCancer Cell, will be presented during the conference. This is the first piece of work to reveal a key role for the tumour microenvironment in fostering the process of metastasis, a discovery which will open doors to similar findings in other types of tumours.

Normal stem cells vs. tumour stem cells

One of the keys in the fight against cancer is the ability to identify tumour stem cells and differentiate them from healthy stem cells. The conference co-organizers maintain that “this is still a central question. We don’t yet know enough about normal stem cells, and technical issues make things difficult. We are making rapid progress, however, and in the next few years we expect to be able to make great strides both in figuring out the similarities and differences in the two types of cells, and in coming up with new strategies to fight the growth and spread of tumours.”

PROFILES OF CONFERENCE CO-ORGANIZERS

EDUARD BATLLE – Group Leader of the Colorectal Cancer Laboratory and Coordinator of the Oncology Programme at IRB Barcelona. ICREA Research Professor (Instituto Catalán para la Investigación y Estudios Avanzados).

Dr. Batlle’s research over the past decade has focused on the characterization of the mechanisms that cause the initiation, progression and metastasis of colon cancer. He has published studies in several high-impact journals such as Cell, Nature, Nature Genetics and Cancer Cell. His achievements include the discovery of the transcription factor Snail in tumour cells and the elucidation of the function of EphB membrane receptors in colorrectal cancer. During the Barcelona BioMed Conference, Dr. Batlle will present the results of a study to be published in Cancer Cell on a process indispensable for colon cancer metastasis.

Among his recognitions, Batlle has received the Banc Sabadell Prize for Biomedical Research (2010) and the “Debiopharm Life Sciences Award for Outstanding Research in Oncology” given by the Ecole Polytechnique Fédérale de Lausanne in Switzerland (2006). He is the recipient of an ERC Starting Grant awarded by the European Research Council in 2007.


HANS CLEVERS – Group leader at the Hubrecht Institute (director 2002-2012 ) and President of the Royal Netherlands Academy of Arts and Sciences. Dr. Clevers was the first scientist to identify intestinal stem cells and remains one of the leading researchers in this field. His discoveries have had significant impact in cancer as well as in regenerative therapy with stem cells and in vitro organ culture. Clevers’ work in developmental biology and cancer led him to discover the beta-catenin/Tcf4 transcriptional complex, which causes the majority of colorrectal cancer.

http://apoorvamandavilli.com/wp-content/uploads/2010/10/2010stem-cells-and-cancer.pdf


In 1991 Clevers became a professor of immunology at the University Medical Center in Utrecht. Since 2002 he has been a professor of molecular genetics at UMC Utrecht. Also in 2002 he became director of the Hubrecht Institute for Developmental Biology and Stem-Cell Research at the Royal Dutch Academy of Sciences, where until May 2012 he led the WNT Signaling and Cancer research group and was project leader of the Netherlands Proteomics Centre and Cancer Genomics Centre. Clevers discovered similarities between the normal renewal of intestinal tissue and the onset of colon cancer. In 2007 he received a grant of two million euros from the KWF Cancer Society to study the function of stem cells in the normal intestines and in colon cancer, and in 2008 he received an ERC Advanced Investigator Grant. In March 2012, Clevers, who since 2000 had been a member of the Royal Netherlands Academy of Arts and Sciences, was elected its president, a position he assumed on June 1 of that year, succeeding Robbert Dijkgraaf. In connection with his election to this position, he resigned from the Hubrecht Institute and began to carry out research two days a week at the UMC-U.[4][5][6][7][9]

Asked in a 2008 interview what had been the highlights of his research up to that point, Clevers said “there would probably be three. There was a first one, when I just started my lab, within the first few months we cloned the gene that they call TCF1, t-cell factor 1, I used to be a t-cell embryologist when we first started out. And that paper was published in EMBO in ’91, first author. So in that paper we described cloning of this vector, which at that time maybe on the world scale was not great but for my own lab to clone this gene was my first thing I ever did alone. This gene then in ’96 we found to be the crucial missing component of what’s called the Wnt signaling pathway, and this [was] generally seen as a major breakthrough we had. There were papers in ’96 and ’97 in Cell, and we had two papers in Science in the same two years.”

Clevers and his team thus showed that “there is that this TCF transcription factor, there is a small family of them, they occur in every animal on the planet, they are the end point of the signal transcription cascade, and they control virtually every decision in a developing animal. When we realized this we started changing our model systems, we used to work on lymphocytes, and we changed it, first to frogs and flies, drosophila, where the Wnt pathway had been studied by many other people that way we could use assays of those people. We then realized that in mammals Wnt signaling…was not only important in embryos but also crucial in adults, which is novel. And we switched to the gut, we found that one of our knockouts, the TCF4 knockout, one of the four members of that family had no stem cells in the gut. And this is the first link in the literature, this was also a ’97 paper in Nature Genetics, between Wnt signaling and stem cells in adults. And in that same year we found that colon cancer comes about by the disregulation of TCF4, and those two phenomena are really linked. So stem cells need TCF4, cancers disregulate TCF4 by mutating a gene upstream in that pathway called APC.”

After this Clevers’s team “continued to work on the intestine and on the physiology of the intestine, which was essentially an unstudied field, much to my surprise. May I emphasize, there are thousands of very competent embryologists, and they work on tiny details, and they fight over the smallest details, are extremely competent. In this intestinal field there are thousands of gastroentromologists that study cancer or colitis or Crohn’s Disease, but there are very few, if any, labs studying normal tissue, which is amazing because that is a tissue that we use every five days. It’s the most rapidly proliferating tissue in a normal body. So my lab actually build up a lot of mouse models and we learn a lot about how that’s being done, and then finally…last year we finally identified the stem cells in the gut. And we now can purify them in large numbers and study their characteristics.”[4]

A recent posting at the website of the Royal Netherlands Academy of Arts and Sciences provides a capsule summary of Clevers’s research to date: “His research deals with the intestine, in both its healthy and diseased state. He has discovered that there are numerous similarities between the normal process whereby intestinal tissue is renewed and the development of intestinal cancer. Improved understanding of these processes is crucial to developing new ways of treating cancer. Hans Clevers has described the molecular signalling pathways that are disrupted by cancer and has identified a protein that is specific to stem cells in the intestine. He has then been able to grow ‘mini-intestines’ from individual stem cells. These are the first steps on the road to regenerative medicine, in this case the regeneration of intestinal tissue.”[7]

Q&A: Hans Clevers

Eric Bender

Nature 521, S15 (14 May 2015) http://dx.doi.org://10.1038/521S15a

n 2009, Hans Clevers and Toshiro Sato (then a postdoc in Clevers’ lab) demonstrated a powerful new model to study development and disease: a three-dimensional ‘organoid’ derived from adult stem cells that replicates the structure of cells lining the intestine. More than 100 labs worldwide are now working with different types of organoid to study cancer and other diseases. Clevers, at the Hubrecht Institute in Utrecht, the Netherlands, discusses the potential of this approach.

Why might it be better to screen drugs in organoids rather than in cell lines?

We don’t currently understand why certain tumours are sensitive or resistant to particular drugs. With targeted therapies, you can make a prediction, but for classical chemotherapy drugs, such as cisplatin or 5-fluorouracil, it is totally unpredictable which tumours will respond. Tumours can be sequenced in great detail, but drugs against them cannot be tested effectively other than in clinical trials. Organoids are a very good genetic representation of the tumour, so they let us bridge the gap between deep-sequencing efforts and patient outcomes.

How do you see organoids contributing to the study of colorectal cancer?

We are collaborating with groups at the Broad Institute in Cambridge, Massachusetts, and the Sanger Institute in Hinxton, UK, to build a biobank of organoids from 20 or so people with colon cancer. We have organoids of the cancer and of normal cells from individual patients, as well as sequences of their protein-coding genes. We have established the non-profit Hubrecht Organoid Technology (HUB) to expand our organoid biobanks. The HUB shares these biobanks with academic groups around the world, and now works with about 15 companies on drug-development programmes. We can culture tumours from almost every person with colon cancer, sequence them and test them against drugs. Additionally, we can use research techniques that have been developed for cell lines, such as genetic tools, fluorescence-activated cell sorting and microarrays.

Is this research moving towards clinical trials?

Yes, my group and the HUB are collaborating with Emile Voest at the Netherlands Cancer Institute in Amsterdam on an observational trial. We already have some organoid models from people with colon cancer who receive chemotherapy. The organoids are screened against a panel of common colon-cancer drugs. The patients will be treated the same way the oncologists would normally treat them, but we’ll see if we could have predicted the response from our organoids. We’re also starting another trial in which we will enrol advanced-colon-cancer patients, for whom there is no standard treatment. We will make organoids, test drug sensitivity and resistance, and then advise the oncologists as to what drug to use for that particular patient. We will be looking at multiple drugs, so we need large numbers of patients — that’s the only way we will be able to produce enough data to help us match drugs to tumour types.

To benefit individual patients, won’t you need to test the drugs very quickly?

Yes — and that’s really where we want to take this technology. When you have pneumonia, your bacterial cultures are tested and you get answers in three days. With this technology, we can tell the oncologist the best odds for a combination of therapeutics, maybe not in three days, but in several weeks. We have an organoid-based test in cystic fibrosis that gives us a result in about two weeks.

How does the organoid approach differ from patient-derived xenografts, in which patients’ tumours are transplanted into immune-suppressed mice for testing drugs?

It’s the same principle — you get a functional readout of the patient’s tumour. But organoids can be tested against an unlimited amount of compounds and combinations. Furthermore, in contrast to xenografts, organoids can be established from almost all patients.

What are some of the next steps in your cancer research?

Organoids model the key component of the tumour but they lack some important elements. We want to combine organoids with other elements to make more-complete tools. For instance, we would like to introduce the immune system so that we can study the effects of the fantastic new immunotherapy drugs. We think that we can build it up in a reductionist way — take lymphocytes isolated from a tumour, bring these together with cancer organoids derived from the same tumour and watch what happens. And maybe we can also put microorganisms in these organoids. For example, we could add Helicobacter, a major cause of stomach cancer, to stomach organoids.

Can organoids also help to test drug combinations?

Yes, tumours are genetically heterogeneous, and there can be vast differences in drug sensitivity between clones for the same tumour. We can possibly advance sequence-based therapy by testing millions of drug combinations in organoids.

Single Lgr5 stem cells build crypt–villus structures in vitro without a mesenchymal niche

Toshiro Sato1, Robert G. Vries1, Hugo J. Snippert1, Marc van de Wetering1, Nick Barker1, Daniel E. Stange1, Johan H. van Es1, Arie Abo2, Pekka Kujala3, Peter J. Peters3 & Hans Clevers1
Nature 459, 262-265 (14 May 2009) |   http://dx.doi.org:/10.1038/nature07935    Received 16 July 2008; Accepted 24 February 2009

The intestinal epithelium is the most rapidly self-renewing tissue in adult mammals. We have recently demonstrated the presence of about six cycling Lgr5+ stem cells at the bottoms of small-intestinal crypts1. Here we describe the establishment of long-term culture conditions under which single crypts undergo multiple crypt fission events, while simultanously generating villus-like epithelial domains in which all differentiated cell types are present. Single sorted Lgr5+ stem cells can also initiate these crypt–villus organoids. Tracing experiments indicate that the Lgr5+ stem-cell hierarchy is maintained in organoids. We conclude that intestinal crypt–villus units are self-organizing structures, which can be built from a single stem cell in the absence of a non-epithelial cellular niche.

  • A Model for Life
Dis. Model. Mech. September 2013, doi: 10.1242/dmm.013367 vol. 6 no. 5 1053-1056

A gutsy approach to stem cells and signalling: an interview with Hans Clevers

Hans Clevers, Professor of Molecular Genetics at Utrecht University, began his career in immunology and developmental biology, but a shift towards intestinal research in the late 1990s led to his group’s pioneering discovery that Lgr5 is a marker of tissue stem cells – a finding that paved the way for a cascade of key insights into the molecular signalling pathways that are dysregulated in cancer. Interviewed here by Ross Cagan, Editor-in-Chief of Disease Models & Mechanisms, Hans recalls the mentors and discoveries that motivated his transition from basic to applied science, discusses his style of lab management and mentorship, and highlights the potential of organoid-based therapy for personalised medicine.

Johannes (Hans) Clevers was born in 1957 in Eindhoven, home to Philips Electronics, in the south of The Netherlands. From a young age he showed enthusiasm and a natural talent for science, and as an undergraduate became fascinated with molecular biology. He obtained his PhD in immunology from Utrecht University during the mid-1980s, and simultaneously studied medicine. Making the pivotal decision to move back into the lab after completing his clinical training, he undertook postdoctoral research in Cox Terhorst’s lab at the Dana-Farber Cancer Institute at Harvard University. He then returned to Utrecht to set up his own lab, and was a Professor of Immunology at the university between 1991 and 2002. From 2002 to 2012 he was Director of the nearby Hubrecht Institute for Stem Cell Research. During this time, Hans moved gradually into the gastroenterology field, and made groundbreaking discoveries regarding the role of Wnt signalling in stem cells and colon cancer. His unique contributions to cancer, stem cell research and regenerative medicine have been recognised in the form of numerous awards, and in 2013 he was one of the eleven winners of a $3 million award from the Breakthrough Prize in Life Sciences Foundation. Currently, he is Professor of Molecular Genetics at Utrecht University, and is also President of the Royal Netherlands Academy of Arts and Sciences (KNAW). Hans has also been involved in setting up several biotechnology companies.

Before we get to your background, I want to congratulate you on being, unsurprisingly, one of the Breakthrough Prize award winners. You have a long list of prizes now – is it something you’ve gotten used to?

This last one was unusual for me – prior to the Breakthrough award I had only ever received one American prize and that was in gastroenterology. To be the only researcher in Europe awarded, and to see my name on the list together with people like Robert Weinberg and Bert Vogelstein, who were the big shots when I was a postdoc, was a truly great honour. I went to the ceremony for the physics prize in Geneva, and it was like being at the Oscars – very surreal, as a scientist.

The first thing I did when I found out about my award was to invite the current and previous members of my lab to a huge party in Amsterdam, which will take place in September [2013]. There will be around 100 attendees – most of which are still in science. There will be good food and drink, stand-up comedy, and a small symposium.

Taking a step back into your past, why did you choose a career in science and medicine?

My high school system was very geared towards languages. I started learning biology at university in 1975 at the age of 18, and I was disappointed. Molecular biology was being developed in England, Switzerland and the US, but in Dutch universities there was no legal framework to do this, and so the courses – where available – focused only on technical details. Biology in general lacked charisma. At the time, my friends and brothers were junior medics, and as I had an interest in medicine I decided to take it on in addition to biology. I ended up spending a year in Nairobi and half a year at NIH for my biology rotations, and essentially I never went to any lectures (although this is something I never tell my students!). Anyway, I really started getting sucked into the clinical training, and found that working in a clinical environment is much more sociable than being in a lab. You’re part of a big organisation and there are lots of people to talk to, whereas in the lab there are only a few people, and small issues – such as somebody not cleaning up – can really cause friction. After medical school, I was picked, mainly because of my research background, for a training position in paediatrics. They suggested that I should start work for a PhD, so I went back into the lab. That’s when I realised that, despite the social attractiveness of working in a hospital, I was much more of a scientist than a doctor. I got my PhD – together with four published papers – in just 1 year. However, it was during my first postdoc position in Boston that I think I was really exposed to science for the first time. It was tough, but I knew I’d made the right decision.

Are there particular mentors who influenced your decision to choose the lab over clinics, and shaped your career moves?

When I received the Heineken Prize from the Royal Netherlands Academy of Arts and Sciences in 2012, I had to think deeply about my mentors and realised that there were two that I had almost forgotten. The first was my high school chemistry teacher, who sold laboratory chemicals to students from his home, during the evenings (in a well-regulated way). I had built a small lab in the attic of my parents’ house and I really had fun mixing things together and doing all the experiments that are possible to do at home. Because of this chemistry teacher, I learned the joy of being in a lab.

The second crucial mentor was my thesis advisor, who didn’t supervise me very much but did give me key advice that has stayed with me until now. He taught me that it’s important to trust everybody you work with, at least until they show you that they can’t be trusted. I emphasize this in my own lab – I encourage my students and postdocs to be open and transparent and to discuss their work. Some scientists are intuitively secretive and paranoid – cultural differences perhaps play a part in this. In my view, only when someone damages your trust can you justify being paranoid, and until then it is important to share information.

“…it’s important to trust everybody you work with, at least until they show you that they can’t be trusted”

There are many ways to run a lab; for example, you can micro-manage it or you can focus on the big picture and step back from the day-to-day issues. What is your style of running a lab?

When I first became a PI, I really liked doing experimental work. Even after 5 years as a postdoc, I enjoyed doing minipreps! As a consequence, I really micro-managed the few lab members I had, and I’m sure they were ultimately happy to get away from me. But when the lab grew a little bigger and I became Head of Department, it took me away from the lab much of the time. Nowadays, I informally talk with my lab colleagues as much as I can, preferably at the bench. As we speak, I know that there is someone in my group who will find out the results of a 3-month effort, today. I always insist on looking at the raw data, never the digested, analysed data. It could be 5 minutes or 2 hours, but when I’m needed in the lab I will always try to make time for it and be part of the troubleshooting process. When you can no longer troubleshoot in your own lab, you’re lost.

Well clearly success builds on success – some impressive scientists have come out of your lab. Do you encourage all of your group members to pursue academic positions?

I’ve had many ‘super postdocs’ in my lab but some of these individuals would not be happy as PIs. It’s not about capability, but about wanting to deal with the paperwork, the responsibility and the decision-making that come with being a PI. Such individuals can make a valuable contribution to a lab, given their years of experience, as well as acting as great mentors and role models for the newer group members. When, having gained experience in the pharmaceutical industry, Nick Barker re-joined my group in 2006 as Senior Staff Scientist, we spent 6–7 years looking for stem cell markers, and then broke open the field by identifying Lgr5 as a marker of cancer stem cell populations. Nick has now set up his own group in Singapore, but I have had several other very talented experimentalists in my lab for many years. Overall, I think that intermediate positions are fantastic for successful postdocs who might end up unhappy as PIs.

How did you get involved with intestinal stem cell research? You didn’t start in this field but somehow ended up there.

As an undergraduate student, I did a brief rotation project on T cells. This led to a PhD and postdoc focused on T cells. I learned molecular biology, which inspired me to clone a T-lymphocyte transcription factor, TCF-1, when I subsequently set up my own lab in Holland. We (Marc van der Wetering and I) cloned TCF-1 within a few months and showed that it binds DNA; but, despite trying all kinds of functional assays, we couldn’t show that it regulates transcription. It took 6 or 7 years to figure out that β-catenin, a signal transducer in the Wnt signalling pathway, was needed. We heard that Walter Birchmeier had made a complementary discovery in Berlin, and our papers came out at the same time.

Around that time, I was Clinical Professor in Immunology at Utrecht, and I started studying TCFs in mice, frogs, flies and worms. We soon established that TCFs are always the endpoint of the Wnt pathway. In 1996–1997, we knocked out TCF-4 in mice and, remarkably, observed a gut phenotype – the mice had no crypts. Simultaneously, we realised that the pathway is overactivated in colon cancer. That’s when I decided to move into studying the gut. It wasn’t easy as an immunologist, but I gradually got to know the gastroenterology field. At the time, this field was dominated by clinical research, and in fact our work didn’t really become known to gastroenterologists until around 3–4 years ago. They were totally unaware that mice could give clues about human disease, which surprised me, as in haematology and immunology, there is a good balance between basic and clinical science. There are other clinically well-developed fields, such as prostate and lung cancer research, that could really benefit from a stronger basic approach.

A key discovery for you was that Lgr5 is a marker of stem cells. When did you realise the implications of this discovery?

There were two ‘eureka’ moments with the stem cell story. The dogma at the time was the ‘+4’ stem cell model, which was pioneered by Chris Potten, who recently passed away. I tried to provide experimental support for this model, together with Nick Barker, but it never really went anywhere. Having realised that β-catenin and TCFs controlled crypts in the gut and cancer, we set out to determine the genetic programme controlled by this pathway. At the time (1997), there was no technology to do this properly, but in 2000 we performed one of the first microarrays with Pat Brown. Our array looked at expression in a colon cancer cell line. The array contained only two samples – plus or minus the Wnt pathway – but it opened the field for us by providing a list of markers to investigate further. This was the first, key step. From the list of markers, we picked a few that we thought were marking +4 cells, but these led us nowhere. Eventually, based on its unique expression pattern, we came up with Lgr5. We made numerous mouse strains, including Lgr5-GFP tagged mice. The moment we saw tiny cells lighting up under the microscope, I started writing our next ten big papers in my head. It was a remarkable moment – the cells exist, and we could visualise them using these mice.

And why exactly is Lgr5 so important, both from a basic and an applied standpoint?

Lgr5 is an exquisite protein. We and several other labs have shown that it is a marker for stem cells in many tissues. Originally, we saw it only in spontaneously dividing tissues, but we’ve recently found that it also appears in organs that have undergone damage. Lgr5 is unique in that it – on its own – it specifically marks homogenous populations of stem cells but not their progenitors, unlike most other markers. We now know that this is because it is a cell surface receptor protein in the Wnt pathway, and only stem cells require Wnts. In the gut, the stem cells are particularly active – in mice, they divide every day for 2.5 years, so they go through a thousand cell divisions.

Discovering Lgr5 led to another eureka moment: the generation of long-term culture systems that maintain crypt physiology. A Japanese gastroenterologist who I invited to my lab, Toshiro Sato, was the first to set up the right culture conditions, and now multiple labs are creating these systems, which are called organoids or ‘mini-guts’. Once the system was up and running, Toshiro showed that Paneth cells provide the niche for stem cells at crypt bottoms, and that stem cells produce their own daughters which then produce growth factors. With his former Japanese lab, we showed that normal tissue can be generated from a single stem cell, and it can survive in a mouse for as long as you want. Based on this finding, our lab evolved and now we’re culturing prostate, liver, pancreas, kidney, lung and breast tissue, all for prolonged periods of time, all from humans. There are no changes in chromosomal structure in the cultured cells, and deep sequencing reveals very few mutations. The next step will be to take single cells, genetically modify them like we do with embryonic stem cells, pick a safe clone, expand it and use it for therapy, particularly transplantation.

Do you think we will be able to take organoid-based therapy to the personalised level? Colorectal cancer, for example, only has a 3% success rate in clinical trials. Are organoids going to provide the answer?

We’re finalising a pilot sequencing study now involving 20 patients with normal crypts and colon cancer. With the wild-type and colon cancer organoids, we can potentially predict patient outcome and response to drugs. In the future, we hope to rapidly build large, living biobanks for other cancers, too. In line with this, we’re building up a ‘Stand Up 2 Cancer’ dream team involving several American labs and the Sanger Institute, with the aim of taking the organoid approach to the next level in cancer therapy. Sanger has robotised screening set-ups that allow thousands of compounds to be screened across hundreds of cell lines. We can now do this with patient-derived organoids. From these tests we could establish new effective drug combinations, and we could link genetics to function to help design smarter trials. The great thing about organoids is that they contain only epithelium – there is no immune system, no blood system, only the diseased tissue, making it a very clean system.

We’ve also recently collaborated with clinicians on a cystic fibrosis project. We can predict using cystic fibrosis ‘mini-guts’ that certain drugs that are currently in trials will work for one patient and not for another, and that certain drug combinations work better than others. From biopsy to drug response, it takes only 10 days. Industry is now very interested in using this assay to pre-screen and design trials.

“The great thing about organoids is that they contain only epithelium – there is no immune system, no blood system, only the diseased tissue, making it a very clean system”

In the past, you’ve suggested that classic hypothesis-driven science isn’t the right way to do science. Could you say a little bit more about this?

Now that I’m a bit older I’m more interested in how the process of science works. I always ask my colleagues: how do you run the lab and how do you make discoveries? In my lab, I try to establish a reproducible, quantitative system, like GFP mice and arrays. Then, I throw something at the system and look, without formulating a hypothesis. This is difficult because our brains like to produce causal relationships, even though these are often wrong. I’m constantly telling my group members that they should keep their minds open and make observations without assuming that they know what’s going on. In molecular biology, we can go anywhere we want and there are billions of effects to discover. You cannot do this in a hypothesis-driven way because you’re essentially retracing evolution. There are many solutions to a particular problem but evolution picked one – it’s very arrogant to think we can reconstruct this in our minds.

Some of my most elegant hypotheses have fallen by the wayside. The importance of establishing formal rules for innovation is a discussion worth having in biology. I understand that you have embraced movies to explain scientific concepts. What’s the story behind this?

I was inspired by Leonard Zon – I came across one of his movies about 8 years ago. I realised it’s much easier to convey messages visually than in words so I started working with a small company in Holland to produce science movies. The lab provides the idea and the images, and the company writes the script. We end up going back and forth a few times to make the message as accurate as possible, and it really shows us as scientists how ambiguous language can be. Often, feedback from the company sends us back into the lab to find out something we hadn’t looked into, for example how fast do the cells move, how many cells are there? Gradually, the movie comes together. Nowadays, I typically use the movies in my talks to explain a problem, and I’ve found that it’s much more effective to show the movie before explaining the experiments. People understand the experiments much better that way, and listen effortlessly. Now, whenever we have a story to write up I try to turn it into a 30-second movie before putting pen to paper. This really forces us to think about the core of the paper.

“In molecular biology, we can go anywhere we want and there are billions of effects to discover…There are many solutions to a particular problem but evolution picked one – it’s very arrogant to think we can reconstruct this in our minds”

In your view, is being a scientist a good career choice? What advice would you give to a young scientist thinking about this career?

Science is frustrating because things don’t work 90% of the time: ideas are wrong, experiments fail. You have to have the personality that thrives by those few fantastic moments of success that you have once a year or even once a career. Moving from being a clinician to being a scientist was one of the hardest decisions I ever made. A clinician gets rewards multiple times a day, so if you’re a person who needs that kind of reward and social interaction, then you shouldn’t be a scientist. Luckily there are now many alternative careers, such as pharma, government and teaching, that didn’t exist when I was a young scientist. However, there needs to be a radical change in the way we view these alternative routes. Maybe in the US it’s different, but here, if you step out of the system you are treated like a failure. I tell young scientists that failure comes with ending up as a miserable PI, with no funding and no papers.

PhD students and junior postdocs have to be aware that the people they see at meetings who give the great talks are in the minority – as scientists we have to be ready to do something else at any point during our career. I think the whole system has to realise that every other job can be as interesting as a job in science. That’s not what we always convey to young people – we describe academia as where it’s happening and everything else as dull or uncreative.

If you hadn’t chosen science as a career, what would you have done instead?

I would probably be a novelist. It’s even more competitive than being a scientist, but it’s also creative, so the perfect blend for me.

Read Full Post »

Therapeutic Implications for Targeted Therapy from the Resurgence of Warburg ‘Hypothesis’

Writer and Curator: Larry H. Bernstein, MD, FCAP 

(Note that each portion of the discussion is followed by a reference)

It is now a time to pause after almost a century of a biological scientific discoveries that have transformed the practice of medicine and impacted the lives of several generations of young minds determined to probe the limits of our knowledge.  In the century that we have entered into the scientific framework of medicine has brought together a difficult to grasp evolution of the emergence of human existence from wars, famine, droughts, storms, infectious diseases, and insect born pestilence with betterment of human lives, only unevenly divided among societal classes that have existed since time immemorial. In this short time span there have emerged several generations of physicians who have benefited from a far better medical education that their forebears could have known. In this expansive volume on cancer, we follow an incomplete and continuing challenge to understand cancer, a disease that has become associated with longer life spans in developed nations.

While there are significant improvements in the diagnosis and treatment of cancers, there is still a personal as well as locality factor in the occurrence of this group of diseases, which has been viewed incorrectly as a “dedifferentiation” of mature tissue types and the emergence of a cell phenotype that is dependent on glucose, reverts to a cancer “stem cell type” (loss of stemness), loses cell to cell adhesion, loses orderly maturation, and metastasizes to distant sites. At the same time, physician and nurses are stressed in the care of patients by balancing their daily lives and maintaining a perspective.

The conceptual challenge of cancer diagnosis and management has seemed insurmountable, but owes much to the post World War I activities of Otto Heinrich Warburg. It was Warburg who made the observation that cancer cells metabolize glucose by fermentation in much the way Pasteur 60 years earlier observed fermentation of yeast cells. This metabolic phenomenon occurs even in the presence of an oxygen supply, which would provide a huge deficit in ATP production compared with respiration. The cancer cell is “addicted to glucose” and produced lactic acid. Warburg was awarded the Nobel Prize in Medicine for this work in 1931.

In the last 15 years there has been a resurgence of work on the Warburg effect that sheds much new light on the process that was not previously possible, with significant therapeutic implications.  In the first place, the metabolic mechanism for the Warburg effect was incomplete even at the beginning of the 21st century.  This has been partly rectified with the enlightening elucidation of genome modifications, cellular metabolic regulation, and signaling pathways.

The following developments have become central to furthering our understanding of malignant transformation.

  1. There is usually an identifiable risk factor, such as, H. pylori, or of a chronic inflammatory state, as in the case of Barrett’s esophagus.
  2. There are certain changes in glucose metabolism that have been unquestionably been found in the evolution of this disease. The changes are associated with major changes in metabolic pathways, miRN signaling, and the metabolism geared to synthesis of cells with an impairment of the cell death cycle. In these changes, mitochondrial function is central to both the impaired respiration and the autophagy geared to the synthesis of cancer cells.

The emergence of this cell prototype is characterized by the following, again related to the Warburg effect:

  1. Cancer cells oxidize a decreased fraction of the pyruvate generated from glycolysis
  2. The mitochondrial pyruvate carrier (MPC), composed of the products of the MPC1 and MPC2 genes, modulates fractional pyruvate oxidation. MPC1 is deleted or underexpressed in multiple cancers and correlates with poor prognosis.
  3. Cancer cells tend to express a partially inhibited splice variant of pyruvate kinase (PK-M2), leading to decreased pyruvate production.
  4. The two proteins that mediate pyruvate conversion to lactate and its export, M-type lactate dehydrogenase and the monocarboxylate transporter MCT-4, are commonly upregulated in cancer cells leading to decreased pyruvate oxidation.
  5. The enzymatic step following mitochondrial entry is the conversion of pyruvate to acetyl-CoA by the pyruvate dehydrogenase (PDH) complex. Cancer cells frequently exhibit increased expression of the PDH kinase PDK1, which phosphorylates and inactivates PDH. This PDH regulatory mechanism is required for oncogene induced transformation and reversed in oncogene-induced senescence.
  6. The PDK inhibitor dichloroacetate has shown some clinical efficacy, which correlates with increased pyruvate oxidation. One of the simplest mechanisms to explain decreased mitochondrial pyruvate oxidation in cancer cells, a loss of mitochondrial pyruvate import, has been observed repeatedly over the past 40 years. This process has been impossible to study at a molecular level until recently, however, as the identities of the protein(s) that mediate mitochondrial pyruvate uptake were unknown.
  7. The mitochondrial pyruvate carrier (MPC) as a multimeric complex that is necessary for efficient mitochondrial pyruvate uptake. The MPC contains two distinct proteins, MPC1 and MPC2; the absence of either leads to a loss of mitochondrial pyruvate uptake and utilization in yeast, flies, and mammalian cells.

A Role for the Mitochondrial Pyruvate Carrier as a Repressor of the Warburg Effect and Colon Cancer Cell Growth

John C. Schell, Kristofor A. Olson, Lei Jiang, Amy J. Hawkins, et al.
Molecular Cell Nov 6, 2014; 56: 400–413.
http://dx.doi.org/10.1016/j.molcel.2014.09.026

In addition to the above, the following study has therapeutic importance:

Glycolysis has become a target of anticancer strategies. Glucose deprivation is sufficient to induce growth inhibition and cell death in cancer cells. The increased glucose transport in cancer cells has been attributed primarily to the upregulation of glucose transporter 1 (Glut1),  1 of the more than 10 glucose transporters that are responsible for basal glucose transport in almost all cell types. Glut1 has not been targeted until very recently due to the lack of potent and selective inhibitors.

First, Glut1 antibodies were shown to inhibit cancer cell growth. Other Glut1 inhibitors and glucose transport inhibitors, such as fasentin and phloretin, were also shown to be effective in reducing cancer cell growth. A group of inhibitors of glucose transporters has been recently identified with IC50 values lower than 20mmol/L for inhibiting cancer cell growth. However, no animal or detailed mechanism studies have been reported with these inhibitors.

Recently, a small molecule named STF-31 was identified that selectively targets the von Hippel-Lindau (VHL) deficient kidney cancer cells. STF-31 inhibits VHL deficient cancer cells by inhibiting Glut1. It was further shown that daily intraperitoneal injection of a soluble analogue of STF-31 effectively reduced the growth of tumors of VHL-deficient cancer cells grafted on nude mice. On the other hand, STF-31 appears to be an inhibitor with a narrow cell target spectrum.

These investigators recently reported the identification of a group of novel small compounds that inhibit basal glucose transport and reduce cancer cell growth by a glucose deprivation–like mechanism. These compounds target Glut1 and are efficacious in vivo as anticancer agents. A novel representative compound WZB117 not only inhibited cell growth in cancer cell lines but also inhibited cancer growth in a nude mouse model. Daily intraperitoneal injection of WZB117 resulted in a more than 70% reduction in the size of human lung cancer of A549 cell origin. Mechanism studies showed that WZB117 inhibited glucose transport in human red blood cells (RBC), which express Glut1 as their sole glucose transporter. Cancer cell treatment with WZB117 led to decreases in levels of Glut1 protein, intracellular ATP, and glycolytic enzymes. All these changes were followed by increase in ATP sensing enzyme AMP-activated protein kinase (AMPK) and declines in cyclin E2 as well as phosphorylated retinoblastoma, resulting in cell-cycle arrest, senescence, and necrosis. Addition of extracellular ATP rescued compound-treated cancer cells, suggesting that the reduction of intracellular ATP plays an important role in the anticancer mechanism of the molecule.

A Small-Molecule Inhibitor of Glucose Transporter 1 Downregulates Glycolysis, Induces Cell-Cycle Arrest, and Inhibits Cancer Cell Growth In Vitro and In Vivo

Yi Liu, Yanyan Cao, Weihe Zhang, Stephen Bergmeier, et al.
Mol Cancer Ther Aug 2012; 11(8): 1672–82
http://dx.doi.org://10.1158/1535-7163.MCT-12-0131

Alterations in cellular metabolism are among the most consistent hallmarks of cancer. These investigators have studied the relationship between increased aerobic lactate production and mitochondrial physiology in tumor cells. To diminish the ability of malignant cells to metabolize pyruvate to lactate, M-type lactate dehydrogenase levels were knocked down by means of LDH-A short hairpin RNAs. Reduction in LDH-A activity resulted in stimulation of mitochondrial respiration and decrease of mitochondrial membrane potential. It also compromised the ability of these tumor cells to proliferate under hypoxia. The tumorigenicity of the LDH-A-deficient cells was severely diminished, and this phenotype was reversed by complementation with the human ortholog LDH-A protein. These results demonstrate that LDH-A plays a key role in tumor maintenance.

The results are consistent with a functional connection between alterations in glucose metabolism and mitochondrial physiology in cancer. The data also reflect that the dependency of tumor cells on glucose metabolism is a liability for these cells under limited-oxygen conditions. Interfering with LDH-A activity as a means of blocking pyruvate to lactate conversion could be exploited therapeutically. Because individuals with complete deficiency of LDH-A do not show any symptoms under ordinary circumstances, the genetic data suggest that inhibition of LDH-A activity may represent a relatively nontoxic approach to interfere with tumor growth.

Attenuation of LDH-A expression uncovers a link between glycolysis, mitochondrial physiology, and tumor maintenance

Valeria R. Fantin Julie St-Pierre and Philip Leder
Cancer Cell Jun 2006; 9: 425–434.
http://dx.doi.org:/10.1016/j.ccr.2006.04.02

The widespread clinical use of positron-emission tomography (PET) for the detection of aerobic glycolysis in tumors and recent findings have rekindled interest in Warburg’s theory. Studies on the physiological changes in malignant conversion provided a metabolic signature for the different stages of tumorigenesis; during tumorigenesis, an increase in glucose uptake and lactate production have been detected. The fully transformed state is most dependent on aerobic glycolysis and least dependent on the mitochondrial machinery for ATP synthesis.

Tumors ferment glucose to lactate even in the presence of oxygen (aerobic glycolysis; Warburg effect). The pentose phosphate pathway (PPP) allows glucose conversion to ribose for nucleic acid synthesis and glucose degradation to lactate. The nonoxidative part of the PPP is controlled by transketolase enzyme reactions. We have detected upregulation of a mutated transketolase transcript (TKTL1) in human malignancies, whereas transketolase (TKT) and transketolase-like-2 (TKTL2) transcripts were not upregulated. Strong TKTL1 protein expression was correlated to invasive colon and urothelial tumors and to poor patients outcome. TKTL1 encodes a transketolase with unusual enzymatic properties, which are likely to be caused by the internal deletion of conserved residues. We propose that TKTL1 upregulation in tumors leads to enhanced, oxygen-independent glucose usage and a lactate based matrix degradation. As inhibition of transketolase enzyme reactions suppresses tumor growth and metastasis, TKTL1 could be the relevant target for novel anti-transketolase cancer therapies. We suggest an individualized cancer therapy based on the determination of metabolic changes in tumors that might enable the targeted inhibition of invasion and metastasis.

Other important links between cancer-causing genes and glucose metabolism have been already identified. Activation of the oncogenic kinase Akt has been shown to stimulate glucose uptake and metabolism in cancer cells and renders these cells susceptible to death in response to glucose withdrawal. Such tumor cells have been shown to be dependent on glucose because the ability to induce fatty acid oxidation in response to glucose deprivation is impaired by activated Akt. In addition, AMP-activated protein kinase (AMPK) has been identified as a link between glucose metabolism and the cell cycle, thereby implicating p53 as an essential component of metabolic cell-cycle control.

Expression of transketolase TKTL1 predicts colon and urothelial cancer patient survival: Warburg effect reinterpreted

S Langbein, M Zerilli, A zur Hausen, W Staiger, et al.
British Journal of Cancer (2006) 94, 578–585.
http://dx.doi.org:/10.1038/sj.bjc.6602962

The unique metabolic profile of cancer (aerobic glycolysis) might confer apoptosis resistance and be therapeutically targeted. Compared to normal cells, several human cancers have high mitochondrial membrane potential (DJm) and low expression of the K+ channel Kv1.5, both contributing toapoptosis resistance. Dichloroacetate (DCA) inhibits mitochondrial pyruvate dehydrogenase kinase (PDK), shifts metabolism from glycolysis to glucose oxidation, decreases DJm, increases mitochondrial H2O2, and activates Kv channels in all cancer, but not normal, cells; DCA upregulates Kv1.5 by an NFAT1-dependent mechanism. DCA induces apoptosis, decreases proliferation, and inhibits tumor growth, without apparent toxicity. Molecular inhibition of PDK2 by siRNA mimics DCA. The mitochondria-NFAT-Kv axis and PDK are important therapeutic targets in cancer; the orally available DCA is a promising selective anticancer agent.

Cancer progression and its resistance to treatment depend, at least in part, on suppression of apoptosis. Although mitochondria are recognized as regulators of apoptosis, their importance as targets for cancer therapy has not been adequately explored or clinically exploited. In 1930, Warburg suggested that mitochondrial dysfunction in cancer results in a characteristic metabolic phenotype, that is, aerobic glycolysis (Warburg, 1930). Positron emission tomography (PET) imaging has now confirmed that most malignant tumors have increased glucose uptake and metabolism. This bioenergetic feature is a good marker of cancer but has not been therapeutically pursued..

The small molecule DCA is a metabolic modulator that has been used in humans for decades in the treatment of lactic acidosis and inherited mitochondrial diseases. Without affecting normal cells, DCA reverses the metabolic electrical remodeling that we describe in several cancer lines (hyperpolarized mitochondria, activated NFAT1, downregulated Kv1.5), inducing apoptosis and decreasing tumor growth. DCA in the drinking water at clinically relevant doses for up to 3 months prevents and reverses tumor growth in vivo, without apparent toxicity and without affecting hemoglobin, transaminases, or creatinine levels. The ease of delivery, selectivity, and effectiveness  make DCA an attractive candidate for proapoptotic cancer therapy which can be rapidly translated into phase II–III clinical trials.

A Mitochondria-K+ Channel Axis Is Suppressed in Cancer and Its Normalization Promotes Apoptosis and Inhibits Cancer Growth

Sebastien Bonnet, Stephen L. Archer, Joan Allalunis-Turner, et al.

Cancer Cell Jan 2007; 11: 37–51.
http://dx.doi.org:/10.1016/j.ccr.2006.10.020

Tumor cells, just as other living cells, possess the potential for proliferation, differentiation, cell cycle arrest, and apoptosis. There is a specific metabolic phenotype associated with each of these conditions, characterized by the production of both energy and special substrates necessary for the cells to function in that particular state. Unlike that of normal living cells, the metabolic phenotype of tumor cells supports the proliferative state. Aim: To present the metabolic hypothesis that (1) cell transformation and tumor growth are associated with the activation of metabolic enzymes that increase glucose carbon utilization for nucleic acid synthesis, while enzymes of the lipid and amino acid synthesis pathways are activated in tumor growth inhibition, and (2) phosphorylation and allosteric and transcriptional regulation of intermediary metabolic enzymes and their substrate availability together mediate and sustain cell transformation from one condition to another. Conclusion: Evidence is presented that demonstrates opposite changes in metabolic phenotypes induced by TGF-β, a cell transforming agent, and tumor growth-inhibiting phytochemicals such as genistein and Avemar, or novel synthetic antileukemic drugs such as STI571 (Gleevec).  Intermediary metabolic enzymes that mediate the growth signaling pathways and promote malignant cell transformation may serve as high efficacy nongenetic novel targets for cancer therapies.

A Metabolic Hypothesis of Cell Growth and Death in Pancreatic Cancer

Laszlo G. Boros, Wai-Nang Paul Lee, and Vay Liang W. Go
Pancreas 2002; 24(1):26–33

Clear cell renal cell carcinoma (ccRCC) is the most common pathological subtype of kidney cancer. Here, we integrated an unbiased genome-wide RNA interference screen for ccRCC survival regulators with an analysis of recurrently overexpressed genes in ccRCC to identify new therapeutic targets in this disease. One of the most potent survival regulators, the monocarboxylate transporter MCT4 (SLC16A3), impaired ccRCC viability in all eight ccRCC lines tested and was the seventh most overexpressed gene in a meta-analysis of five ccRCC expression datasets.

MCT4 silencing impaired secretion of lactate generated through glycolysis and induced cell cycle arrest and apoptosis. Silencing MCT4 resulted in intracellular acidosis, and reduction in intracellular ATP production together with partial reversion of the Warburg effect in ccRCC cell lines. Intra-tumoral heterogeneity in the intensity of MCT4 protein expression was observed in primary ccRCCs.

MCT4 protein expression analysis based on the highest intensity of expression in primary ccRCCs was associated with poorer relapse-free survival, whereas modal intensity correlated with Fuhrman nuclear grade. Consistent with the potential selection of subclones enriched for MCT4 expression during disease progression, MCT4 expression was greater at sites of metastatic disease. These data suggest that MCT4 may serve as a novel metabolic target to reverse the Warburg effect and limit disease progression in ccRCC.

Clear cell carcinoma (ccRCC) is the commonest subtype of renal cell carcinoma, accounting for 80% of cases. These tumors are highly resistant to cytotoxic chemotherapy and until recently, systemic treatment options for advanced ccRCC were limited to cytokine based therapies, such as interleukin-2 and interferon-α. Recently, anti-angiogenic drugs and mTOR inhibitors, all targeting the HIF–VEGF axis which is activated in up to 91% of ccRCCs through loss of the VHL tumor suppressor gene [1], have been shown to be effective in metastatic ccRCC [2–5]. Although these drugs increase overall survival to more than 2 years [6], resistance invariably occurs, making the identification of new molecular targets a major clinical need to improve outcomes in patients with metastatic ccRCC.

Genome-wide RNA interference analysis of renal carcinoma survival regulators identifies MCT4 as a Warburg effect metabolic target

Marco Gerlinger, Claudio R Santos, Bradley Spencer-Dene, et al.
J Pathol 2012; 227: 146–156
http://dx.doi.org:/10.1002/path.4006

Hypoxia-inducible factor 1 (HIF-1) plays a key role in the reprogramming of cancer metabolism by activating transcription of genes encoding glucose transporters and glycolytic enzymes, which take up glucose and convert it to lactate; pyruvate dehydrogenase kinase 1, which shunts pyruvate away from the mitochondria; and BNIP3, which triggers selective mitochondrial autophagy. The shift from oxidative to glycolytic metabolism allows maintenance of redox homeostasis and cell survival under conditions of prolonged hypoxia. Many metabolic abnormalities in cancer cells increase HIF-1 activity. As a result, a feed-forward mechanism can be activated that drives HIF-1 activation and may promote tumor progression.

Metastatic cancer is characterized by reprogramming of cellular metabolism leading to increased uptake of glucose for use as both an anabolic and a catabolic substrate. Increased glucose uptake is such a reliable feature that it is utilized clinically to detect metastases by positron emission tomography using 18F-fluorodeoxyglucose (FDG-PET) with a sensitivity of >90% [1]. As with all aspects of cancer biology, the details of metabolic reprogramming differ widely among individual tumors. However, the role of specific signaling pathways and transcription factors in this process is now understood in considerable detail. This review will focus on the involvement of hypoxia-inducible factor 1 (HIF-1) in both mediating metabolic reprogramming and responding to metabolic alterations. The placement of HIF-1 both upstream and downstream of cancer metabolism results in a feed-forward mechanism that may play a major role in the development of the invasive, metastatic, and lethal cancer phenotype.

O2 concentrations are significantly reduced in many human cancers compared with the surrounding normal tissue. The median PO2 in breast cancers is 10 mmHg, as compared with65 mmHg in normal breast tissue. Reduced O2 availability induces HIF-1, which regulates the transcription of hundreds of genes that encode proteins involved in every aspect of cancer biology, including: cell immortalization and stem cell maintenance; genetic instability; glucose and energy metabolism; vascularization; autocrine growth factor signaling; invasion and metastasis; immune evasion; and resistance to chemotherapy and radiation therapy.

HIF-1 is a transcription factor that consists of an O2 regulated HIF-1a and a constitutively expressed HIF-1b subunit. In well-oxygenated cells, HIF-1a is hydroxylated on proline residue 402 (Pro-402) and/or Pro-564 by prolyl hydroxylase domain protein 2 (PHD2), which uses O2 and a-ketoglutarate as substrates in a reaction that generates CO2 and succinate as byproducts. Prolylhydroxylated HIF-1a is bound by the von Hippel–Lindau tumor suppressor protein (VHL), which recruits an E3-ubiquitin ligase that targets HIF-1a for proteasomal degradation (Figure 1a). Asparagine 803 in the transactivation domain is hydroxylated in well-oxygenated cells by factor inhibiting HIF-1 (FIH-1), which blocks the binding of the coactivators p300 and CBP. Under hypoxic conditions, the prolyl and asparaginyl hydroxylation reactions are inhibited by substrate (O2) deprivation and/or the mitochondrial generation of reactive oxygen species (ROS), which may oxidize Fe(II) present in the catalytic center of the hydroxylases.

The finding that acute changes in PO2 increase mitochondrial ROS production suggests that cellular respiration is optimized at physiological PO2 to limit ROS generation and that any deviation in PO2 – up or down – results in increased ROS generation. If hypoxia persists, induction of HIF-1 leads to adaptive mechanisms to reduce ROS and re-establish homeostasis, as described below. Prolyl and asparaginyl hydroxylation provide a molecular mechanism by which changes in cellular oxygenation can be transduced to the nucleus as changes in HIF-1 activity.

HIF-1: upstream and downstream of cancer metabolism

Gregg L Semenza
Current Opinion in Genetics & Development 2010, 20:51–56

This review comes from a themed issue on Genetic and cellular mechanisms of oncogenesis Edited by Tony Hunter and Richard Marais

http://dx.doi.org:/10.1016/j.gde.2009.10.009

Hypoxia-inducible factor 1 (HIF-1) regulates the transcription of many genes involved in key aspects of cancer biology, including immortalization, maintenance of stem cell pools, cellular dedifferentiation, genetic instability, vascularization, metabolic reprogramming, autocrine growth factor signaling, invasion/metastasis, and treatment failure. In animal models, HIF-1 overexpression is associated with increased tumor growth, vascularization, and metastasis, whereas HIF-1 loss-of-function has the opposite effect, thus validating HIF-1 as a target. In further support of this conclusion, immunohistochemical detection of HIF-1a overexpression in biopsy sections is a prognostic factor in many cancers. A growing number of novel anticancer agents have been shown to inhibit HIF-1 through a  variety of molecular mechanisms. Determining which combination of drugs to administer to any given patient remains a major obstacle to improving cancer treatment outcomes.

Intratumoral hypoxia The majority of locally advanced solid tumors contain regions of reduced oxygen availability. Intratumoral hypoxia results when cells are located too far from a functional blood vessel for diffusion of adequate amounts of O2 as a result of rapid cancer cell proliferation and the formation of blood vessels that are structurally and functionally abnormal. In the most extreme case, O2 concentrations are below those required for survival, resulting in cell death and establishing a selection for cancer cells in which apoptotic pathways are inactivated, anti-apoptotic pathways are activated, or invasion/metastasis pathways that promote escape from the hypoxic microenvironment are activated. This hypoxic adaptation may arise by alterations in gene expression or by mutations in the genome or both and is associated with reduced patient survival.

Hypoxia-inducible factor 1 (HIF-1) The expression of hundreds of genes is altered in each cell exposed to hypoxia. Many of these genes are regulated by HIF-1. HIF-1 is a heterodimer formed by the association of an O2-regulated HIF1a subunit with a constitutively expressed HIF-1b subunit. The structurally and functionally related HIF-2a protein also dimerizes with HIF-1b and regulates an overlapping battery of target genes. Under nonhypoxic conditions, HIF-1a (as well as HIF-2a) is subject to O2-dependent prolyl hydroxylation and this modification is required for binding of the von Hippel–Lindau tumor suppressor protein (VHL), which also binds to Elongin C and thereby recruits a ubiquitin ligase complex that targets HIF-1a for ubiquitination and proteasomal degradation. Under hypoxic conditions, the rate of hydroxylation and ubiquitination declines, resulting in accumulation of HIF-1a. Immunohistochemical analysis of tumor biopsies has revealed high levels of HIF-1a in hypoxic but viable tumor cells surrounding areas of necrosis.

Genetic alterations in cancer cells increase HIF-1 activity In the majority of clear-cell renal carcinomas, VHL function is lost, resulting in constitutive activation of HIF-1. After re-introduction of functional VHL, renal carcinoma cell lines are no longer tumorigenic, but can be made tumorigenic by expression of HIF2a in which the prolyl residues that are subject to hydroxylation have been mutated. In addition to VHL loss-of-function, many other genetic alterations that inactivate tumor suppressors

Evaluation of HIF-1 inhibitors as anticancer agents

Gregg L. Semenza
Drug Discovery Today Oct 2007; 12(19/20).
http://dx.doi.org:/10.1016/j.drudis.2007.08.006

Hypoxia-inducible factor-1 (HIF-1), which is present at high levels in human tumors, plays crucial roles in tumor promotion by upregulating its target genes, which are involved in anaerobic energy metabolism, angiogenesis, cell survival, cell invasion, and drug resistance. Therefore, it is apparent that the inhibition of HIF-1 activity may be a strategy for treating cancer. Recently, many efforts to develop new HIF-1-targeting agents have been made by both academic and pharmaceutical industry laboratories. The future success of these efforts will be a new class of HIF-1-targeting anticancer agents, which would improve the prognoses of many cancer patients. This review focuses on the potential of HIF-1 as a target molecule for anticancer therapy, and on possible strategies to inhibit HIF-1 activity. In addition, we introduce YC-1 as a new anti-HIF-1, anticancer agent. Although YC-1 was originally developed as a potential therapeutic agent for thrombosis and hypertension, recent studies demonstrated that YC-1 suppressed HIF-1 activity and vascular endothelial growth factor expression in cancer cells. Moreover, it halted tumor growth in immunodeficient mice without serious toxicity during the treatment period. Thus, we propose that YC-1 is a good lead compound for the development of new anti-HIF-1, anticancer agents.

Although many anticancer regimens have been introduced to date, their survival benefits are negligible, which is the reason that a more innovative treatment is required. Basically, the identification of the specific molecular features of tumor promotion has allowed for rational drug discovery in cancer treatment, and drugs have been screened based upon the modulation of specific molecular targets in tumor cells. Target-based drugs should satisfy the following two conditions.

First, they must act by a described mechanism.

Second, they must reduce tumor growth in vivo, associated with this mechanism.

Many key factors have been found to be involved in the multiple steps of cell growth signal-transduction pathways. Targeting these factors offers a strategy for preventing tumor growth; for example, competitors or antibodies blocking ligand–receptor interaction, and receptor tyrosine kinase inhibitors, downstream pathway inhibitors (i.e., RAS farnesyl transferase inhibitors, mitogen-activated protein kinase and mTOR inhibitors), and cell-cycle arresters (i.e., cyclin-dependent kinase inhibitors) could all be used to inhibit tumor growth.

In addition to the intracellular events, tumor environmental factors should be considered to treat solid tumors. Of these, hypoxia is an important cancer-aggravating factor because it contributes to the progression of a more malignant phenotype, and to the acquisition of resistance to radiotherapy and chemotherapy. Thus, transcription factors that regulate these hypoxic events are good targets for anticancer therapy and in particular HIF-1 is one of most compelling targets. In this paper, we introduce the roles of HIF-1 in tumor promotion and provide a summary of new anticancer strategies designed to inhibit HIF-1 activity.

New anticancer strategies targeting HIF-1

Eun-Jin Yeo, Yang-Sook Chun, Jong-Wan Park
Biochemical Pharmacology 68 (2004) 1061–1069
http://dx.doi.org:/10.1016/j.bcp.2004.02.040

Classical work in tumor cell metabolism focused on bioenergetics, particularly enhanced glycolysis and suppressed oxidative phosphorylation (the ‘Warburg effect’). But the biosynthetic activities required to create daughter cells are equally important for tumor growth, and recent studies are now bringing these pathways into focus. In this review, we discuss how tumor cells achieve high rates of nucleotide and fatty acid synthesis, how oncogenes and tumor suppressors influence these activities, and how glutamine metabolism enables macromolecular synthesis in proliferating cells.

Otto Warburg’s demonstration that tumor cells rapidly use glucose and convert the majority of it to lactate is still the most fundamental and enduring observation in tumor metabolism. His work, which ushered in an era of study on tumor metabolism focused on the relationship between glycolysis and cellular bioenergetics, has been revisited and expanded by generations of tumor biologists. It is now accepted that a high rate of glucose metabolism, exploited clinically by 18FDGPET scanning, is a metabolic hallmark of rapidly dividing cells, correlates closely with transformation, and accounts for a significant percentage of ATP generated during cell proliferation. A ‘metabolic transformation’ is required for tumorigenesis. Research over the past few years has reinforced this idea, revealing the conservation of metabolic activities among diverse tumor types, and proving that oncogenic mutations can promote metabolic autonomy by driving nutrient uptake to levels that often exceed those required for cell growth and proliferation.

In order to engage in replicative division, a cell must duplicate its genome, proteins, and lipids and assemble the components into daughter cells; in short, it must become a factory for macromolecular biosynthesis. These activities require that cells take up extracellular nutrients like glucose and glutamine and allocate them into metabolic pathways that convert them into biosynthetic precursors (Figure 1). Tumor cells can achieve this phenotype through changes in the expression of enzymes that determine metabolic flux rates, including nutrient transporters and enzymes [8– 10]. Current studies in tumor metabolism are revealing novel mechanisms for metabolic control, establishing which enzyme isoforms facilitate the tumor metabolic phenotype, and suggesting new targets for cancer therapy.

The ongoing challenge in tumor cell metabolism is to understand how individual pathways fit together into the global metabolic phenotype of cell growth. Here we discuss two biosynthetic activities required by proliferating tumor cells: production of ribose-5 phosphate for nucleotide biosynthesis and production of fatty acids for lipid biosynthesis. Nucleotide and lipid biosynthesis share three important characteristics.

  • First, both use glucose as a carbon source.
  • Second, both consume TCA cycle intermediates, imposing the need for a mechanism to replenish the cycle.
  • Third, both require reductive power in the form of NADPH.

In this Essay, we discuss the possible drivers, advantages, and potential liabilities of the altered metabolism of cancer cells (Figure 1, not shown). Although our emphasis on the Warburg effect reflects the focus of the field, we would also like to encourage a broader approach to the study of cancer metabolism that takes into account the contributions of all interconnected small molecule pathways of the cell.

The Tumor Microenvironment Selects for Altered Metabolism One compelling idea to explain the Warburg effect is that the altered metabolism of cancer cells confers a selective advantage for survival and proliferation in the unique tumor microenvironment. As the early tumor expands, it outgrows the diffusion limits of its local blood supply, leading to hypoxia and stabilization of the hypoxia-inducible transcription factor, HIF. HIF initiates a transcriptional program that provides multiple solutions to hypoxic stress (reviewed in Kaelin and Ratcliffe, 2008). Because a decreased dependence on aerobic respiration becomes advantageous, cell metabolism is shifted toward glycolysis by the increased expression of glycolytic enzymes, glucose transporters, and inhibitors of mitochondrial metabolism. In addition, HIF stimulates angiogenesis (the formation of new blood vessels) by upregulating several factors, including most prominently vascular endothelial growth factor (VEGF).

Blood vessels recruited to the tumor microenvironment, however, are disorganized, may not deliver blood effectively, and therefore do not completely alleviate hypoxia (reviewed in Gatenby and Gillies, 2004). The oxygen levels within a tumor vary both spatially and temporally, and the resulting rounds of fluctuating oxygen levels potentially select for tumors that constitutively upregulate glycolysis. Interestingly, with the possible exception of tumors that have lost the von Hippel-Lindau protein (VHL), which normally mediates degradation of HIF, HIF is still coupled to oxygen levels, as evident from the heterogeneity of HIF expression within the tumor microenvironment. Therefore, the Warburg effect—that is, an uncoupling of glycolysis from oxygen levels—cannot be explained solely by upregulation of HIF. Other molecular mechanisms are likely to be important, such as the metabolic changes induced by oncogene activation and tumor suppressor loss.

Oncogene Activation Drives Changes in Metabolism Not only may the tumor microenvironment select for a deranged metabolism, but oncogene status can also drive metabolic changes. Since Warburg’s time, the biochemical study of cancer metabolism has been overshadowed by efforts to identify the mutations that contribute to cancer initiation and progression. Recent work, however, has demonstrated that the key components of the Warburg effect—

  • increased glucose consumption,
  • decreased oxidative phosphorylation, and
  • accompanying lactate production—
  • are also distinguishing features of oncogene activation.

The signaling molecule Ras, a powerful oncogene when mutated, promotes glycolysis (reviewed in Dang and Semenza, 1999; Ramanathan et al., 2005). Akt kinase, a well-characterized downstream effector of insulin signaling, reprises its role in glucose uptake and utilization in the cancer setting (reviewed in Manning and Cantley, 2007), whereas the Myc transcription factor upregulates the expression of various metabolic genes (reviewed in Gordan et al., 2007). The most parsimonious route to tumorigenesis may be activation of key oncogenic nodes that execute a proliferative program, of which metabolism may be one important arm. Moreover, regulation of metabolism is not exclusive to oncogenes.

Cancer Cell Metabolism: Warburg & Beyond

Hsu PP & Sabatini DM
Cell  Sep 5, 2008; 134, 703-705
http://dx.doi.org:/10.1016/j.cell.2008.08.021

Tumor cells respond to growth signals by the activation of protein kinases, altered gene expression and significant modifications in substrate flow and redistribution among biosynthetic pathways. This results in a proliferating phenotype with altered cellular function. These transformed cells exhibit unique anabolic characteristics, which includes increased and preferential utilization of glucose through the non-oxidative steps of the pentose cycle for nucleic acid synthesis but limited de novo fatty  acid   synthesis   and   TCA   cycle   glucose   oxidation. This  primarily nonoxidative anabolic profile reflects an undifferentiated highly proliferative aneuploid cell phenotype and serves as a reliable metabolic biomarker to determine cell proliferation rate and the level of cell transformation/differentiation in response to drug treatment.

Novel drugs effective in particular cancers exert their anti-proliferative effects by inducing significant reversions of a few specific non-oxidative anabolic pathways. Here we present evidence that cell transformation of various mechanisms is sustained by a unique disproportional substrate distribution between the two branches of the pentose cycle for nucleic acid synthesis, glycolysis and the TCA cycle for fatty acid synthesis and glucose oxidation. This can be demonstrated by the broad labeling and unique specificity of [1,2-13C2]glucose to trace a large number of metabolites in the metabolome. Stable isotope-based dynamic metabolic profiles (SIDMAP) serve the drug discovery process by providing a powerful new tool that integrates the metabolome into a functional genomics approach to developing new drugs. It can be used in screening kinases and their metabolic targets, which can therefore be more efficiently characterized, speeding up and improving drug testing, approval and labeling processes by saving trial and error type study costs in drug testing.

Metabolic Biomarker and Kinase Drug Target Discovery in Cancer Using Stable Isotope-Based Dynamic Metabolic Profiling (SIDMAP)

László G. Boros, Daniel J. Brackett and George G. Harrigan
Current Cancer Drug Targets, 2003, 3, 447-455 447

Pyruvate constitutes a critical branch point in cellular carbon metabolism. We have identified two proteins, Mpc1 and Mpc2, as essential for mitochondrial pyruvate transport in yeast, Drosophila, and humans. Mpc1 and Mpc2 associate to form an ~150 kilodalton complex in the inner mitochondrial membrane. Yeast and Drosophila mutants lacking MPC1 display impaired pyruvate metabolism, with an accumulation of upstream metabolites and a depletion of tricarboxylic acid cycle intermediates. Loss of yeast Mpc1 results in defective mitochondrial pyruvate uptake, while silencing of MPC1 or MPC2 in mammalian cells impairs pyruvate oxidation. A point mutation in MPC1 provides resistance to a known inhibitor of the mitochondrial pyruvate carrier. Human genetic studies of three families with children suffering from lactic acidosis and hyperpyruvatemia revealed a causal locus that mapped to MPC1, changing single amino acids that are conserved throughout eukaryotes. These data demonstrate that Mpc1 and Mpc2 form an essential part of the mitochondrial pyruvate carrier.

A Mitochondrial Pyruvate Carrier Required for Pyruvate Uptake in Yeast, Drosophila , and Humans

Daniel K. Bricker, Eric B. Taylor, John C. Schell, Thomas Orsak, et al.
Science Express 24 May 2012
http://dx.doi.org:/10.1126/science.1218099

Adenosine deaminase acting on RNA (ADAR) enzymes convert adenosine (A) to inosine (I) in double-stranded (ds) RNAs. Since Inosine is read as Guanosine, the biological consequence of ADAR enzyme activity is an A/G conversion within RNA molecules. A-to-I editing events can occur on both coding and non-coding RNAs, including microRNAs (miRNAs), which are small regulatory RNAs of ~20–23 nucleotides that regulate several cell processes by annealing to target mRNAs and inhibiting their translation. Both miRNA precursors and mature miRNAs undergo A-to-I RNA editing, affecting the miRNA maturation process and activity. ADARs can also edit 3′ UTR of mRNAs, further increasing the interplay between mRNA targets and miRNAs. In this review, we provide a general overview of the ADAR enzymes and their mechanisms of action as well as miRNA processing and function. We then review the more recent findings about the impact of ADAR-mediated activity on the miRNA pathway in terms of biogenesis, target recognition, and gene expression regulation.

Review ADAR Enzyme and miRNA Story: A Nucleotide that Can Make the Difference 

Sara Tomaselli, Barbara Bonamassa, Anna Alisi, Valerio Nobili, Franco Locatelli and Angela Gallo
Int. J. Mol. Sci. 19 Nov 2013; 14, 22796-22816 http://dx.doi.org:/10.3390/ijms141122796

The fermented wheat germ extract (FWGE) nutraceutical (Avemar™), manufactured under “good manufacturing practice” conditions and, fulfilling the self-affirmed “generally recognized as safe” status in the United States, has been approved as a “dietary food for special medical purposes for cancer patients” in Europe. In this paper, we report the adjuvant use of this nutraceutical in the treatment of high-risk skin melanoma patients. Methods: In a randomized, pilot, phase II clinical trial, the efficacy of dacarbazine (DTIC)-based adjuvant chemotherapy on survival parameters of melanoma patients was compared to that of the same treatment supplemented with a 1-year long administration of FWGE. Results: At the end of an additional 7-year-long follow-up period, log-rank analyses (Kaplan-Meier estimates) showed significant differences in both progression-free (PFS) and overall survival (OS) in favor of the FWGE group. Mean PFS: 55.8 months (FWGE group) versus 29.9 months (control group), p  0.0137. Mean OS: 66.2 months (FWGE group) versus 44.7 months (control group), p < 0.0298. Conclusions: The inclusion of Avemar into the adjuvant protocols of high-risk skin melanoma patients is highly recommended.

Adjuvant Fermented Wheat Germ Extract (Avemar™) Nutraceutical Improves Survival of High-Risk Skin Melanoma Patients: A Randomized, Pilot, Phase II Clinical Study with a 7-Year Follow-Up

LV Demidov, LV Manziuk, GY Kharkevitch, NA Pirogova, and EV Artamonova
Cancer Biotherapy & Radiopharmaceuticals 2008; 23(4)
http://dx.doi.org:/10.1089/cbr.2008.0486

Cancer cells possess unique metabolic signatures compared to normal cells, including shifts in aerobic glycolysis, glutaminolysis, and de novo biosynthesis of macromolecules. Targeting these changes with agents (drugs and dietary components) has been employed as strategies to reduce the complications associated with tumorigenesis. This paper highlights the ability of several food components to suppress tumor-specific metabolic pathways, including increased expression of glucose transporters, oncogenic tyrosine kinase, tumor-specific M2-type pyruvate kinase, and fatty acid synthase, and the detection of such effects using various metabonomic technologies, including liquid chromatography/mass spectrometry (LC/MS) and stable isotope-labeled MS. Stable isotope-mediated tracing technologies offer exciting opportunities for defining specific target(s) for food components. Exposures, especially during the early transition phase from normal to cancer, are critical for the translation of knowledge about food components into effective prevention strategies. Although appropriate dietary exposures needed to alter cellular metabolism remain inconsistent and/or ill-defined, validated metabonomic biomarkers for dietary components hold promise for establishing effective strategies for cancer prevention.

Bioactive Food Components and Cancer-Specific Metabonomic Profiles

Young S. Kim and John A. Milner
Journal of Biomedicine and Biotechnology 2011, Art ID 721213, 9 pages
http://dx.doi.org:/10.1155/2011/721213

This reviewer poses the following observation.  The importance of the pyridine nucleotide reduced/oxidized ratio has not been alluded to here, but the importance cannot be understated. It has relevance to the metabolic functions of anabolism and catabolism of the visceral organs.  The importance of this has ties to the pentose monophosphate pathway. The importance of the pyridine nucleotide transhydrogenase reaction remains largely unexplored.  In reference to the NAD-redox state, the observation was made by Nathan O. Kaplan that the organs may be viewed with respect to their primary functions in anabolic or high energy catabolic activities. Thus we find that the endocrine organs are largely tied to anabolic functioning, and to NADP, whereas cardiac and skeletal muscle are highly dependent on NAD. The consequence of this observed phenomenon appears to be related to a difference in the susceptibility to malignant transformation.  In the case of the gastrointestinal tract, the rate of turnover of the epithelium is very high. However, with the exception of the liver, there is no major activity other than cell turnover. In the case of the liver, there is a major commitment to synthesis of lipids, storage of fuel, and synthesis of proteins, which is largely anabolic, but there is also a major activity in detoxification, which is not.  In addition, the liver has a double circulation. As a result, a Zahn infarct is uncommon.  Now we might also consider the heart.  The heart is a muscle syncytium with a high need for oxygen.  Cutting of the oxygen supply makes the myocytes vulnerable to ischemic insult and abberant rhythm abnormalities.  In addition, the cardiomyocyte can take up lactic acid from the circulation for fuel, which is tied to the utilization of lactate from vigorous skeletal muscle activity.  The skeletal muscle is tied to glycolysis in normal function, which has a poor generation of ATP, so that the recycling of excess lactic acid is required by cardiac muscle and hepatocytes.  This has not been a part of the discussion, but this reviewer considers it important to remember in considering the organ-specific tendencies to malignant transformation.

Comment (Aurelian Udristioiu):

Otto Warburg observed that many cancers lose their capacity for mitochondrial respiration, limiting ATP production to anaerobic glycolytic pathways. The phenomenon is particularly prevalent in aggressive malignancies, most of which are also hypoxic [1].
Hypoxia induces a stochastic imbalance between the numbers of reduced mitochondrial species vs. available oxygen, resulting in increased reactive oxygen species (ROS) whose toxicity can lead to apoptotic cell death.
Mechanism involves inhibition of glycolytic ATP production via a Randle-like cycle while increased uncoupling renders cancers unable to produce compensatory ATP from respiration-.generation in the presence of intact tricarboxylic acid (TCA) enzyme.
One mitochondrial adaptation to increased ROS is over-expression of the uncoupling protein 2 (UCP2) that has been reported in multiple human cancer cell lines [2-3]. Increased UCP2 expression was also associated with reduced ATP production in malignant oxyphilic mouse leukemia and human lymphoma cell lines [4].
Hypoxia reduces the ability of cells to maintain their energy levels, because less ATP is obtained from glycolysis than from oxidative phosphorylation. Cells adapt to hypoxia by activating the expression of mutant genes in glycolysis.
-Severe hypoxia causes a high mutation rate, resulting in point mutations that may be explained by reduced DNA mismatch repairing activity.
The most direct induction of apoptosis caused by hypoxia is determined by the inhibition of the electron carrier chain from the inner membrane of the mitochondria. The lack of oxygen inhibits the transport of protons and thereby causes a decrease in membrane potential. Cell survival under conditions of mild hypoxia is mediated by phosphoinositide-3 kinase (PIK3) using severe hypoxia or anoxia, and then cells initiate a cascade of events that lead to apoptosis [5].
After DNA damage, a very important regulator of apoptosis is the p53 protein. This tumor suppressor gene has mutations in over 60% of human tumors and acts as a suppressor of cell division. The growth-suppressive effects of p53 are considered to be mediated through the transcriptional trans-activation activity of the protein. In addition to the maturational state of the clonal tumor, the prognosis of patients with CLL is dependent of genetic changes within the neoplastic cell population.

1.Warburg O. On the origin of cancer cells. Science 1956; 123 (3191):309-314
PubMed Abstract ; Publisher Full Text

2.Giardina TM, Steer JH, Lo SZ, Joyce DA. Uncoupling protein-2 accumulates rapidly in the inner mitochondrial membrane during mitochondrial reactive oxygen stress in macrophages. Biochim Biophys Acta 2008, 1777(2):118-129. PubMed Abstract | Publisher Full Text

3. Horimoto M, Resnick MB, Konkin TA, Routhier J, Wands JR, Baffy G. Expression of uncoupling protein-2 in human colon cancer. Clin Cancer Res 2004; 10 (18 Pt1):6203-6207. PubMed Abstract | Publisher Full Text

4. Randle PJ, England PJ, Denton RM. Control of the tricarboxylate cycle and it interactions with glycolysis during acetate utilization in rat heart. Biochem J 1970; 117(4):677-695. PubMed Abstract | PubMed Central Full Text

5. Gillies RJ, Robey I, Gatenby RA. Causes and consequences of increased glucose metabolism of cancers. J Nucl Med 2008; 49(Suppl 2):24S-42S. PubMed Abstract | Publisher Full Text

Shortened version of Comment –

Hypoxia induces a stochastic imbalance between the numbers of reduced mitochondrial species vs. available oxygen, resulting in increased reactive oxygen species (ROS) whose toxicity can lead to apoptotic cell death.
Mechanism involves inhibition of glycolytic ATP production via a Randle-like cycle while increased uncoupling renders cancers unable to produce compensatory ATP from respiration-.generation in the presence of intact tricarboxylic acid (TCA) enzyme.
One mitochondrial adaptation to increased ROS is over-expression of the uncoupling protein 2 (UCP2) that has been reported in multiple human cancer cell lines. Increased UCP2 expression was also associated with reduced ATP production in malignant oxyphilic mouse leukemia and human lymphoma cell lines.
Severe hypoxia causes a high mutation rate, resulting in point mutations that may be explained by reduced DNA mismatch repairing activity.

Read Full Post »

Nonhematologic Cancer Stem Cells [11.2.3]

Writer and Curator: Larry H. Bernstein, MD, FCAP 

Nonhematologic Stem Cells

11.2.3.1 C8orf4 negatively regulates self-renewal of liver cancer stem cells via suppression of NOTCH2 signalling

Pingping Zhu, Yanying Wang, Ying Du, Lei He, Guanling Huang, et al.
Nature Communications May 2015; 6(7122). http://dx.doi.org:/10.1038/ncomms8122

Liver cancer stem cells (CSCs) harbor self-renewal and differentiation properties, accounting for chemotherapy resistance and recurrence. However, the molecular mechanisms to sustain liver CSCs remain largely unknown. In this study, based on analysis of several hepatocellular carcinoma (HCC) transcriptome datasets and our experimental data, we find that C8orf4 is weakly expressed in HCC tumors and liver CSCs. C8orf4 attenuates the self-renewal capacity of liver CSCs and tumor propagation. We show that NOTCH2 is activated in liver CSCs. C8orf4 is located in the cytoplasm of HCC tumor cells and associates with the NOTCH2 intracellular domain, which impedes the nuclear translocation of N2ICD. C8orf4 deletion causes the nuclear translocation of N2ICD that triggers the NOTCH2 signaling, which sustains the stemness of liver CSCs. Finally, NOTCH2 activation levels are consistent with clinical severity and prognosis of HCC patients. Altogether, C8orf4 negatively regulates the self-renewal of liver CSCs via suppression of NOTCH2 signaling.

Like stem cells, CSCs are characterized by self-renewal and differentiation simultaneously9. Not surprisingly, CSCs share core regulatory genes and developmental pathways with normal tissue stem cells. Accumulating evidence shows that NOTCH, Hedgehog and Wnt signaling pathways are implicated in the regulation of CSC self-renewal4. NOTCH signaling modulates many aspects of metazoan development and tissue stemness1011. NOTCH receptors contain four members (NOTCH1–4) in mammals, which are activated by engagement with various ligands. The aberrant NOTCH signaling was first reported to be involved in the tumorigenesis of human T-cell leukaemia1213. Recently, a number of studies have reported that the NOTCH signaling pathway is implicated in regulating self-renewal of breast stem cells and mammary CSCs1415. However, how the NOTCH signaling regulates the liver CSC self-renewal remains largely unknown.

C8orf4, also called thyroid cancer 1 (TC1), was originally cloned from a papillary thyroid carcinoma and its surrounding normal thyroid tissue16. C8orf4 is ubiquitously expressed across a wide range of vertebrates with the sequence conservation across species. A number of studies have reported that C8orf4 is highly expressed in several tumors and implicated in tumorigenesis171819. In addition, C8orf4 augments Wnt/β-catenin signaling in some cancer cells2021, suggesting it may be involved in the regulation of self-renewal of CSCs. However, the biological function of C8orf4 in the modulation of liver CSC self-renewal is still unknown. Here we show that C8orf4 is weakly expressed in HCC and liver CSCs. NOTCH2 signaling is highly activated in HCC tumors and liver CSCs. C8orf4 negatively regulates the self-renewal of liver CSCs via suppression of NOTCH2 signaling.

C8orf4 is weakly expressed in HCC tissues and liver CSCs

To search for driver genes in the oncogenesis of HCC, we performed genome-wide analyses using several online-available HCC transcriptome datasets by R language and Bioconductor approaches. After analysing gene expression profiles of HCC tumor and peri-tumor tissues, we identified >360 differentially expressed genes from both Park’s cohort (GSE36376; ref. 22) and Wang’s cohort (GSE14520; refs 2324). Of these changed genes, we focused on C8orf4, which was weakly expressed in HCC tumors derived from both Park’s cohort (GSE36376) and Wang’s cohort (GSE14520) (Fig. 1a). Lower expression of C8orf4 was further confirmed in HCC samples by quantitative reverse transcription–PCR (qRT–PCR) and immunoblotting (Fig. 1b,c). In this study, HCC patient samples we used included all subtypes of HCC. In addition, these observations were further validated by immunohistochemical (IHC) staining (Fig. 1d). These data indicate that C8orf4 is weakly expressed in HCC tumor tissues.

C8orf4 is weakly expressed in HCC tumours and liver CSCs

C8orf4 is weakly expressed in HCC tumours and liver CSCs

Figure 1. C8orf4 is weakly expressed in HCC tumours and liver CSCs

http://www.nature.com/ncomms/2015/150519/ncomms8122/images_article/ncomms8122-f1.jpg

(a)C8orf4 is weakly expressed in HCC patients. Using R language and Bioconductor methods, we analyzed C8orf4 expression in HCC tumor and peri-tumor tissues provided by Park’s cohort (GSE36376) and Wang’s cohort (GSE14520) datasets. (b,c) C8orf4 expression levels were verified in HCC patient samples by quantitative RT–PCR (qRT–PCR) (b) and immunoblotting (c). β-actin served as a loading control. 18S: 18S rRNA. (d) HCC samples were assayed by immunohistochemical staining. Scale bar—left: 50 μm; right: 20 μm. (eC8orf4 is weakly expressed in CD13+CD133+ cells sorted from Huh7 cells and primary HCC samples. C8orf4 messenger RNA (mRNA) was measured by qRT–PCR. Six HCC samples got similar results. (fC8orf4 is much more weakly expressed in oncospheres than non-sphere tumor cells. Non-sphere: Huh7 or HCC primary cells that failed to form spheres. (g) HCC sample tissues were co-stained with anti-C8orf4 and anti-CD13 or anti-CD133 antibodies, then counterstained with DAPI for confocal microscopy. White arrows indicate CD13+ or CD133+ cells. Scale bars: 20 μm. For a,b, data are shown as box and whisker plot. Boxes represent interquartile range (IQR); upper and lower edge corresponds to the 75th and 25th percentiles, respectively. Horizontal lines within boxes represent median levels of gene intensity. Whiskers below and above boxes extend to the 5th and 95th percentiles, respectively. For e and f, Student’s t-test was used for statistical analysis, *P<0.05;**P<0.01, data are shown as mean ± standard deviation. Data are representative of at least three independent experiments. P, peri-tumor; T, tumor.


Notably, C8orf4 was also weakly expressed in embryonic stem cells (ESCs) and induced pluripotent stem cells (iPSCs) by analysis of its expression profiles derived from online datasets (GSE14897; ref. 25 and GSE25417; ref. 26) (Supplementary Fig. 1a,b). C8orf4 was also lowly expressed in normal liver stem cells (Supplementary Fig. 1c,d), suggesting that C8orf4 may be involved in the regulation of self-renewal of liver stem cells. Thus, we propose that C8orf4 might play a role in the maintenance of liver CSCs. Since CD13 and CD133 were widely used as liver CSC surface markers, we sorted CD13+CD133+ cells from Huh7 and Hep3B HCC cell lines as well as HCC samples, serving as liver CSCs. We observed that C8orf4 was weakly expressed in liver CSCs enriched from both HCC cell lines and patient samples (Fig. 1e). Six HCC samples were analyzed for these experiments. Similar results were obtained in CD13+CD133+ cells from Hep3B cells. Furthermore, we performed sphere formation experiments using Huh7 cells and HCC primary sample cells, and detected expression levels of C8orf4. We observed that C8orf4 was dramatically reduced in the oncospheres generated by both HCC cell lines and patient samples (Fig. 1f). In addition, we noticed that C8orf4 expression was negatively correlated with liver CSC markers such as CD13 and CD133 in HCC samples (Fig. 1g), suggesting lower expression of C8orf4 in liver CSCs. Moreover, C8orf4 was mainly located in the cytoplasm of tumour cells. Altogether, C8orf4 is weakly expressed in HCC tumor tissues and liver CSCs.

C8orf4 negatively regulates self-renewal of liver CSCs

We then wanted to look at whether C8orf4 plays a critical role in the self-renewal maintenance of liver CSCs. C8orf4 was knocked out in Huh7 cells through a CRISPR/Cas9 system (Fig. 2a). TwoC8orf4-knockout (KO) cell strains were established and C8orf4 was completely deleted in these two strains. C8orf4 deletion dramatically enhanced oncosphere formation (Fig. 2b). We co-stained SOX9, a widely used progenitor marker, and Ki67, a well-known proliferation marker, in C8orf4 KO sphere cells. We found that SOX9 was strongly stained in C8orf4 KO sphere cells (Supplementary Fig. 2a). In contrast, Ki67 staining was not significantly altered in C8orf4 KO sphere cells versus WT sphere cells. We also digested sphere cells and examined the SOX9 and Ki67 expression by flow cytometry. Similar results were achieved (Supplementary Fig. 2b). Importantly, through serial passage of CSC sphere cells, similar observations were obtained in the fourth generation oncosphere assay (Supplementary Fig. 2c,d). These data suggest that C8orf4 is involved in the regulation of liver CSC self-renewal.

(not shown)

Figure 2: C8orf4 knockout enhances self-renewal of liver CSCs.

http://www.nature.com/ncomms/2015/150519/ncomms8122/images_article/ncomms8122-f2.jpg

  • C8orf4-deficient Huh7 cells were established using a CRISPR/Cas9 system. T7 endonuclease I cleavage confirmed the efficiency of sgRNA (left panel, white arrowheads), and C8orf4-knockout efficiency was confirmed by western blot (right panel). Two knockout cell lines were used.  C8KO#1:C8orf4KO#1;  C8KO#2C8orf4KO#2. (bC8orf4-deficient cells enhanced sphere formation activity. Calculated ratios are shown in the right panel. (cC8orf4-deficient or WT Huh7 cells (1 × 10⁶) were injected into BALB/c nude mice. Tumor sizes were observed every 5 days. (dC8orf4 deficiency enhances tumor-initiating capacity. Diluted cell numbers of Huh7 cells were implanted into BALB/c nude mice for tumor initiation. Percentages of tumor-formation mice were calculated (left panel), and frequency of tumor-initiating cells was calculated using extreme limiting dilution analysis (right panel). Error bars represent the 95% confidence intervals of the estimation. (e) Expression levels of CD13 andCD133 were analyzed in C8orf4-knockout Huh7 cells. (f) C8orf4 was silenced in HCC primary cells and C8orf4 depletion enhanced sphere formation activity. Calculated ratios are shown at the right panel. Three HCC specimens obtained similar results. (g) C8orf4-overexpressing Huh7 cells were established (left panel). C8orf4-overexpressing Huh7 cells and control Huh7 cells were cultured for sphere formation. (h,i) Xenograft tumor growth (h) and frequency of tumor-initiating cells (i) for C8orf4-overexpressing Huh7 cells were analyzed as c,d. (j) C8orf4 overexpression reduces expression of CD133 and CD13 in Huh7 cells. (k) C8orf4 was transfected in HCC primary cells and cultured for sphere formation. Three HCC patient samples obtained similar results. Scale bars: b,f,g,k, 500 μm. Student’s t-test was used for statistical analysis,    *P<0.05; **P<0.01; ***P<0.001, data are shown as mean ± standard deviation. Data represent at least three independent experiments. oeC8orf4, overexpression of C8orf4; oeVec, overexpression vector.

In addition, C8orf4-deficient Huh7 cells overtly increased xenograft tumour growth (Fig. 2c). We then performed sphere formation and digested oncospheres formed by C8orf4-deficient or WT cells into single-cell suspension, then subcutaneously implanted 1 × 10⁴, 1 × 10³, 1 × 10² and 10 cells into BALB/c nude mice. Tumour formation was examined for tumour-initiating capacity at the third month. C8orf4 deficiency remarkably enhanced tumour-initiating capacity and liver CSC ratios (Fig. 2d). In addition, C8orf4 deletion significantly enhanced expression levels of the liver CSC markers such as CD13 and CD133 (Fig. 2e). We also silenced C8orf4 in HCC primary cells using a lentivirus infection system and established C8orf4-silenced cells. Two pairs of short hairpin RNA (shRNA) sequences obtained similar knockdown efficiency. C8orf4 knockdown remarkably promoted sphere formation and xenograft tumour growth (Fig. 2f and Supplementary Fig. 2e). These data indicate that C8orf4 deletion potentiates the self-renewal of liver CSCs.
We next overexpressed C8orf4 in Huh7 cells and HCC primary cells using lentivirus infection. We observed that C8orf4 overexpression in Huh7 cells remarkably reduced sphere formation and xenograft tumour growth (Fig. 2g,h). In addition, C8orf4 overexpression remarkably reduced tumour-initiating capacity and expression of liver CSC markers (Fig. 2i,j). Similar results were observed by C8orf4 overexpression in HCC primary cells (Fig. 2k). We tested three HCC samples with similar results. Overall, C8orf4 negatively regulates the maintenance of liver CSC self-renewal and tumour propagation.

C8orf4 suppresses NOTCH2 signaling in liver CSCs

To further determine the underlying mechanism of C8orf4 in the regulation of liver CSCs, we analyzed three major self-renewal signaling pathways, including Wnt/β-catenin, Hedgehog and NOTCH pathways, in C8orf4-deleted Huh7 cells and HCC primary cells. We found that only NOTCH target genes were remarkably upregulated in C8orf4-deficient cells (Fig. 3a), whereasC8orf4 deficiency did not significantly affect the Wnt/β-catenin or the Hedgehog pathway. Given that the NOTCH family receptors have four members, we wanted to determine which NOTCH member was involved in the C8orf4-mediated suppression of liver CSC stemness. We noticed that only NOTCH2 was highly expressed in both Huh7 cells and HCC samples (Fig. 3b). In addition, this result was also confirmed by analysis of NOTCH expression levels derived from Wang’s cohort (GSE14520) and Petel’s cohort (E-TABM-36; ref. 27) (Fig. 3c). Moreover, we analysed expression profiles of C8orf4 and NOTCH target genes using Park’s cohort (GSE36376) and Wurmbach’s cohort (GSE6764; ref. 28). These cohort datasets provided several Notch signaling and its target genes. HEY1NRARP and HES6 genes were highly expressed in HCC tumour tissues (GSE6764; ref. 28), which were further confirmed in HCC samples by real-time PCR (Supplementary Fig. 3a,b). Furthermore, HEY1NRARP and HES6 genes have been reported to be relatively specific NOTCH target genes. We then examined these three genes as the NOTCH2 target genes throughout this study. We found that the C8orf4 expression level was negatively correlated with the expression levels of HEY1 and HES6, suggesting that C8orf4 inhibited NOTCH signaling in HCC patients (Fig. 3d). Finally these results were further confirmed in HCC samples by qRT-PCR (Fig. 3e). To further explore the activation status of NOTCH2 signaling in liver CSCs, we examined the expression levels of NOTCH downstream target genes in oncospheres and CD13+CD133+ cells derived from both Huh7 cells and HCC cells. We observed that NOTCH target genes were highly expressed in liver CSCs (Fig. 3f,g). These observations were verified by immunoblotting (Fig. 3h). In addition, the expression levels of NRARPHES6 and HEY1 were positively related to the expression levels of EpCAM and CD133 derived from Zhang’s cohort (GSE25097; ref. 29) and Wang’s cohort (GSE14520; Supplementary Fig. 3c,d). These data suggest that the NOTCH2 signaling plays a critical role in the maintenance of self-renewal of liver CSCs.

(not shown)

Figure 3: C8orf4 suppresses NOTCH2 signaling in liver CSCs.

http://www.nature.com/ncomms/2015/150519/ncomms8122/images_article/ncomms8122-f3.jpg

(aC8orf4 deficiency or depletion activates NOTCH signaling. The indicated major stemness signalling pathways were analysed in C8orf4-knockout Huh7 cells (left panel) and C8orf4-silenced primary cells of HCC samples (right panel). (b) Four receptor members of NOTCH family were examined in both Huh7 cells (left panel) and 29 pairs of HCC samples (right panel). (cNOTCH receptors were analyzed from Wang’s cohort (left panel) and Petel’s cohort (right panel) datasets. (dHEY1 and HES6 were highly expressed in C8orf4low samples by analysis of Park’s cohort (upper panel) and Wurmbach’s cohort (lower panel). (e) Expression levels of HEY1 and HES6 along with C8orf4 were analysed in HCC samples by qRT–PCR. (f,g) Expression levels of NRARPHEY1 and HES6 in spheres generated by Huh7 cells and HCC primary cells (f) and in CD13+CD133+ cells sorted from Huh7 cells and HCC primary cells (g). Non-sphere: Huh7 cells or HCC cells that failed to form spheres. (h) HEY1, HES6 and NRARP expression in sphere and non-sphere cells was detected by immunoblotting. β-actin was used as a loading control. For c,d, data are shown as box and whisker plot. Box: interquartile range (IQR); horizontal line within box: median; whiskers: 5–95 percentile. For a,b,f,g, Student’s t-test was used for statistical analysis, *P<0.05;**P<0.01; ***P<0.001, data are shown as mean ± standard deviation. Data are representative of at least three independent experiments.

C8orf4 interacts with NOTCH2 that is critical for liver CSCs

On ligand–receptor binding, the NOTCH receptor experiences a proteolytic cleavage by metalloprotease and γ-secretase, releasing a NOTCH extracellular domain (NECD) and a NOTCH intracellular domain (NICD), respectively30. Then the active NICD undergoes nuclear translocation and activates the expression of NOTCH downstream target genes31.Then we constructed the NOTCH2 extracellular domain (N2ECD) and intracellular domain (N2ICD) and examined the interaction with C8orf4 via a yeast two-hybrid approach. Interestingly, we found that C8orf4 interacted with N2ICD, but not N2ECD (Fig. 4a). The interaction was validated by co-immunoprecipitation (Fig. 4b). Through domain mapping, the ankyrin repeat domain of NOTCH2 was essential and sufficient for its association with C8orf4 (Fig. 4c). Taken together, C8orf4 interacts with the N2ICD domain of NOTCH2.

Figure 4: C8orf4 interacts with NOTCH2 that is required for the self-renewal maintenance of liver CSCs.

C8orf4 interacts with NOTCH2 that is required for the self-renewal maintenance of liver CSCs

C8orf4 interacts with NOTCH2 that is required for the self-renewal maintenance of liver CSCs

http://www.nature.com/ncomms/2015/150519/ncomms8122/images_article/ncomms8122-f4.jpg

(a) C8orf4 interacts with N2ICD. Yeast strain AH109 was co-transfected with Gal4 DNA-binding domain (BD) fused C8orf4 and Gal4-activating domain (AD) fused N2ICD. p53 and large T antigen were used as a positive control. (b) Recombinant Flag-N2ICD and GFP–C8orf4 were incubated for co-immunoprecipitation. (c) The ankyrin repeat AR domain is essential and sufficient for the interaction of C8orf4 with N2ICD. Various N2ICD truncation constructs were co-transfected with GFP–C8orf4 for domain mapping. NLS: nuclear location signal. (d) NOTCH2 was knocked down in Huh7 cells and detected by qRT–PCR and immunoblotting. (e) NOTCH2-silenced Huh7 cells were cultured for sphere formation assays. Two pairs of shRNAs against NOTCH2 obtained similar results. (f,g) Xenograft tumor growth (f) and frequency of tumor-initiating cells (g) for NOTCH2-silenced Huh7 cells were analyzed. (h) NOTCH2 was silenced in HCC primary cells and NOTCH2 depletion declined sphere formation activity. Three HCC specimens obtained similar results. (i) Sphere formation capacity was examined in differently treated HCC primary cells. (j) HCC primary cells were treated with indicated lentivirus and implanted into BALB/c nude mice for xenograft tumor growth assays. Scale bars: e,h,i, 500 μm, Student’s t-test was used for statistical analysis, *P<0.05; **P<0.01; ***P<0.001, data are shown as mean ± standard deviation. Data are representative of at least three independent experiments. IB, immunoblotting; IP, immunoprecipitation; NS, not significant.

To further verify the role of NOTCH2 in the maintenance of liver CSC self-renewal, we knocked down NOTCH2 in Huh7 cells and established stably depleted cell lines by two pairs of NOTCH2 shRNAs (Fig. 4d). NOTCH2 knockdown dramatically reduced sphere formation (Fig. 4e), as well as attenuated xenograft tumor growth and tumor-initiating capacity (Fig. 4f,g). Similar observations were achieved in NOTCH2-depleted HCC primary cells (Fig. 4h). In addition, we found that simultaneous knockdown of NOTCH2 and overexpression of C8orf4 failed to reduce sphere formation capacity compared with individual knockdown of NOTCH2 (Fig. 4i), suggesting that NOTCH2 and C8orf4 affected sphere formation through the same pathway. Meanwhile, C8orf4 knockdown failed to rescue the sphere formation ability of NOTCH2-depleted HCC primary cells (Fig. 4i). Similar observations were obtained in Huh7 cells (Supplementary Fig. 4). Finally, NOTCH2 depletion in C8orf4-silenced Huh7 cells or HCC primary cells also abrogated the C8orf4 depletion-mediated enhancement of xenograft tumor growth (Fig. 4j), suggesting that C8orf4 acted as upstream of NOTCH2 signaling. These data suggest that C8orf4 suppresses the liver CSC stemness through inhibiting the NOTCH2 signaling pathway.

C8orf4 blocks nuclear translocation of N2ICD

As shown in Fig. 1g, C8orf4 was mainly localized in the cytoplasm in tumor cells of HCC samples. To confirm these observations, we stained C8orf4 in several HCC cell lines and noticed that C8orf4 also resided in the cytoplasm of Huh7 cells and Hep3B cells (Fig. 5a and Supplementary Fig. 5a). These results were further validated by cellular fractionation (Fig. 5b). Importantly, C8orf4 KO led to nuclear translocation of N2ICD (Fig. 5c). In addition, we also examined the intracellular location of N2ICD in Huh7 spheres. We found that C8orf4 deletion caused complete nuclear translocation of N2ICD in oncosphere cells (Fig. 5d,e), while N2ICD was mainly located in the cytoplasm of WT oncosphere cells. However, we found that C8orf4 KO did not affect subcellular localization of β-catenin (Supplementary Fig. 5b,c). Through luciferase assays, C8orf4 transfection did not significantly influence promoter transcription activity of Wnt target genes such as TCF1, LEF and SOX4 (Supplementary Fig. 5d). These data indicate that C8orf4 resides in the cytoplasm of HCC cells and inhibits nuclear translocation of N2ICD.

C8orf4 deletion causes the nuclear translocation of N2ICD

C8orf4 deletion causes the nuclear translocation of N2ICD

Figure 5: C8orf4 deletion causes the nuclear translocation of N2ICD.

http://www.nature.com/ncomms/2015/150519/ncomms8122/images_article/ncomms8122-f5.jpg

(a) C8orf4 resides in the cytoplasm of Huh7 cells. Huh7 cells were permeabilized and stained with anti-C8orf4 antibody, then counterstained with PI for confocal microscopy. (b) Cellular fractionation was performed and detected by immunoblotting. (c,d) C8orf4 knockout causes the nuclear translocation of N2ICD. C8orf4-deficient Huh7 cells (c) and sphere cells (d) were permeabilized and stained with anti-C8orf4 and anti-N2ICD antibodies, then counterstained with DAPI followed by confocal microscopy. (e) Cellular fractionation was performed in C8orf4-deficient sphere and WT sphere cells followed by immunoblotting. (f) C8orf4-deficient Huh7 cells were implanted into BALB/c nude mice. Xenograft tumors were analyzed by immunohistochemical staining. Red arrowheads denote nuclear translocation of N2ICD. (g) C8orf4-overexpressing Huh7 cells were permeabilized for immunofluorescence staining. (h) Cellular fractionation was performed in C8orf4-overexpressing Huh7 cells for immunoblotting. (i,j) C8orf4 was overexpressed in N2ICD-overexpressing Huh7 cells followed by immunofluorescence staining (i) and immunoblotting (j). (k) NOTCH target genes were measured in cells treated as in i by real-time PCR. Scale bars: a,c,d,g,i, 10 μm; f, 40 μm. Student’s t-test was used for statistical analysis, **P<0.01;***P<0.001, data are shown as mean±s.d.. Data represent at least three independent experiments.

To further determine whether C8orf4 inhibits the NOTCH2 signaling in the propagation of xenograft tumors, we examined the distribution of N2ICD and NOTCH2 target gene activation inC8orf4-deficient xenograft tumor tissues. We found that C8orf4-deficient tumors displayed much more nuclear translocation of N2ICD compared with WT tumors (Fig. 5f). Expectedly, C8orf4-deficient tumors showed elevated expression levels of NOTCH2 target genes such as HEY1, HES6 and NRARP (Supplementary Fig. 5e). Furthermore, C8orf4 overexpression blocked the nuclear translocation of N2ICD (Fig. 5g,h). Consequently, C8orf4-overexpressing tumors showed much less N2ICD nuclear translocation and reduced expression levels of NOTCH2 target genes compared with control tumors (Supplementary Fig. 5f,g). Of note, C8orf4 overexpression in N2ICD-overexpressing Huh7 cells still blocked nuclear translocation of N2ICD (Fig. 5i,j). Consequently, C8orf4 overexpression abolished the activation of Notch2 signaling (Fig. 5k). These results suggest that C8orf4 deletion causes the nuclear translocation of N2ICD leading to activation of NOTCH2 signaling.

NOTCH2 signalling is required for the stemness of liver CSCs

To further verify the role of NRARP and HEY1 in the maintenance of liver CSC self-renewal, we knocked down these two genes in Huh7 cells and established stably depleted cell lines by two pairs of shRNAs. As expected, NRARP knockdown dramatically reduced sphere formation (Fig. 6a,b). NRARP knockdown also attenuated tumor-initiating capacity and liver CSC ratios (Fig. 6c). Similar results were achieved in NRARP-silenced HCC primary cells (Fig. 6d,e). Similarly, HEY1 silencing remarkably reduced sphere formation derived from Huh7 and HCC primary cells (Fig. 6f–i), as well as declined xenograft tumor growth and tumor-initiating capacity (Supplementary Fig. 6a,b). In sum, NOTCH2 signaling is required for the maintenance of liver CSC self-renewal.

(not shown)

Figure 6: Depletion of NRARP and HEY1 impairs stemness of liver CSCs.

http://www.nature.com/ncomms/2015/150519/ncomms8122/images_article/ncomms8122-f6.jpg

(a,b) NRARP-silenced Huh7 cells were established (a) and showed reduced sphere formation capacity (b). Two pairs of shRNAs against NRARP obtained similar results. (c) NRARP-silenced Huh7 cells decline tumour-initiating capacity (left panel) and reduce liver CSC frequency (right panel). Error bars represent the 95% confidence intervals of the estimation. (d,e) NRARP was knocked down in HCC primary cells (d) and sphere formation was detected (e). Three HCC samples were tested with similar results. (f,g) HEY1-silenced Huh7 cells were established (f) and sphere formation was assayed (g). Two pairs of shRNAs against HEY1 obtained similar results. (h,i) HEY1 was knocked down in HCC primary cells (h) and HEY1 depletion impaired sphere formation capacity (i). Three HCC samples were tested with similar results. Scale bars: b,e,g,i, 500 μm. For a,b,di, Student’s t-test was used for statistical analysis, *P<0.05; **P<0.01;  ***P<0.001, data are shown as mean ± standard deviation. Data are representative of at least three independent experiments.

NOTCH2 signaling is correlated with HCC severity

As shown above, the NOTCH2 signaling was highly activated in liver CSCs and involved in the regulation of liver CSC stemness. We further examined the relationship of NOTCH2 signaling with the progression of HCC. First, we analyzed NOTCH2 activation levels in HCC tumor tissues and peri-tumor tissues derived from Park’s cohort (GSE36376). We observed that HEY1HES6 and NRARP were highly expressed in the tumor tissues of HCC patients (Fig. 7a). Consistently, high expression levels of HEY1HES6 and NRARP in HCC tumors were validated by Zhang’s cohort (GSE25097) (Fig. 7b). Importantly, high expression of these three genes was confirmed in HCC samples through quantitative RT–PCR (Fig. 7c), as well as immunoblotting (Fig. 7d). To confirm a causative link between low C8orf4 expression level and nuclear N2ICD, we examined 93 HCC samples (31 peri-tumor, 37 early stage of HCC patients and 25 advanced stage of HCC patients) with immunohistochemistry staining. We observed that nuclear staining of N2ICD appeared in ~10% tumor cells in the majority of early HCC patients we tested (Fig. 7e,f). In advanced HCC patients, nuclear staining of N2ICD in tumor cells increased to ~30% in almost all the advanced HCC patients we examined. Consequently, HEY1 staining existed in ~10% tumor cells with scattered distribution and increased to 30% tumor cells in the advanced HCC patients (Fig. 7e). Consistently, low expression of C8orf4 was well correlated with activation of NOTCH2 signaling (Fig. 7e,f).

NOTCH2 activation levels are consistent with clinical severity and prognosis of HCC patients

NOTCH2 activation levels are consistent with clinical severity and prognosis of HCC patients

Figure 7: NOTCH2 activation levels are consistent with clinical severity and prognosis of HCC patients.

http://www.nature.com/ncomms/2015/150519/ncomms8122/images_article/ncomms8122-f7.jpg

(a,b) NOTCH target genes were highly expressed in HCC tumour tissues derived from Park’s cohort (a) and Zhang’s cohort (b). (c) High expression levels of NOTCH target genes in HCC tumor tissues were verified by qRT–PCR. (d) HEY1 expression in HCC tumor tissues was detected by western blot. (e) IHC staining for N2ICD, C8orf4 and HEY1. These images represent 93 HCC samples. Scale bars, 50 μm. (f) IHC images were calculated using Image-Pro Plus 6. (g) Expression levels of NOTCH target genes were elevated in HCC tumors and advanced HCC patients derived from Wang’s cohort. (hHEY1 expression level was positively correlated with prognosis prediction of HCC patients analyzed by Petel’s cohort and Wang’s cohort. HCC samples were divided into two groups according to HEY1 expression levels followed by Kaplan–Meier survival analysis. For ac, data are shown as box and whisker plot, Box: interquartile range (IQR); horizontal line within box: median; whiskers: 5–95 percentile. For f,g, Student’s t-test was used for statistical analysis, *P<0.05; **P<0.01; ***P<0.001; data are shown as mean ± standard deviation. Experiments were repeated at least three times. aHCC, advanced HCC; CL, cirrhosis liver; eHCC, early HCC; IL, inflammatory liver; NL, normal liver; NS, not significant.

Serial passages of colonies or sphere formation in vitro, as well as transplantation of tumor cells, are frequently used to assess the long-term self-renewal capacities of CSCs32. We used HCC primary cells for serial passage growth in vitro and tested the expression levels of C8orf4HEY1 and SOX9. We found that C8orf4 expression was gradually reduced over serial passages in oncosphere cells (Supplementary Fig. 7a). Consequently, the expression of NOTCH2 targets such as HEY1 and SOX9 was gradually increased in oncosphere cells during serial passages (Supplementary Fig. 7b). In addition, N2ICD nuclear translocation appeared in oncosphere cells with high expression of HEY1 plus low expression of C8orf4 (termed as C8orf4/N2ICDnuc/HEY1+cells) (Supplementary Fig. 7c). These data suggest that the C8orf4/N2ICDnuc/HEY1+ fraction cells represent a subset of liver CSCs.

Through analyzing Wang’s cohort (GSE54238), we noticed that the NOTCH2 activation levels were positively correlated with the development and progression of HCC (Fig. 7g). By contrast, the NOTCH2 pathway was not activated in inflammation liver, cirrhosis liver and normal liver (Fig. 7f). Consistently, similar observations were achieved by analysis of Zhang’s cohort (GSE25097) (Supplementary Fig. 7d). In addition, the NOTCH2 activation levels were consistent with clinicopathological stages of HCC patients derived from Wang’s cohort (GSE14520) (Supplementary Fig. 7e). Finally, HCC patients with higher expression of HEY1 displayed worse prognosis derived from Petel’s cohort (E-TABM-36) and Wang’s cohort (GSE14520) (Fig. 7h). These two cohorts (E-TABM-36 and GSE14520) have survival information of HCC patients. Taken together, the NOTCH2 activation levels in tumor tissues are consistent with clinical severity and prognosis of HCC patients.

Discussion

CSC have been identified in many solid tumors, including breast, lung, brain, liver, colon, prostate and bladder cancers4633. CSCs have similar characteristics associated with normal tissue stem cells, including self-renewal, differentiation and the ability to form new tumors. CSCs may be responsible for cancer relapse and metastasis due to their invasive and drug-resistant capacities34. Thus, targeting CSCs may become a promising therapeutic strategy to deadly malignancies3536. However, it remains largely unknown about hepatic CSC biology. In this study, we used CD13 and CD133 to enrich CD13+CD133+
subpopulation cells as liver CSCs. Based on analysis of several online-available HCC transcriptome datasets, we found that C8orf4 is weakly expressed in HCC tumors as well as in CD13+CD133+ liver CSCs. NOTCH2 signaling is required for the maintenance of liver CSC self-renewal. C8orf4 resides in the cytoplasm of tumor cells and interacts with N2ICD, blocking the nuclear translocation of N2ICD. Lower expression of C8orf4 causes nuclear translocation of N2ICD that activates NOTCH2 signaling in liver CSCs. NOTCH2 activation levels are consistent with clinical severity and prognosis of HCC patients. Therefore, C8orf4 negatively regulates self-renewal of liver CSCs via suppression of NOTCH2 signaling.

Elucidating signaling pathways that maintains self-renewal of liver CSCs is pivotal for the understanding of hepatic CSC biology and the development of novel therapies against HCC. Several signaling pathways, such as Wnt/β-catenin, transforming growth factor-beta, AKT and STAT3 pathways, have been defined to be implicated in the regulation of liver CSCs37. Not surprisingly, some liver CSC subsets and normal tissue stem cells may share core regulatory genes and common signaling pathways. The NOTCH signaling pathway plays an important role in development via cell-fate determination, proliferation and cell survival3839. The NOTCH family receptors contain four members in mammals (NOTCH1–4), which are activated by binding to their corresponding ligands. A large body of evidence provides that NOTCH signaling is implicated in carcinogenesis40. However, the role of NOTCH signaling in liver cancer is controversial. A previous study reported that NOTCH1 signaling suppresses tumor growth of HCC41. Recently, several reports showed that NOTCH signaling enhances liver tumor initiation424344. Importantly, a recent study showed that various NOTCH receptors have differential functions in the development of liver cancer45. Here we demonstrate that NOTCH2 signaling is activated in HCC tumor tissues and liver CSCs, which is required for the maintenance of liver CSC self-renewal.

C8orf4, also known as TC1, was originally cloned from a papillary thyroid cancer16, 46. The copy number variations of C8orf4 are associated with acute myeloid leukemia and other hematological malignancies19, 47. C8orf4 has been reported to be implicated in various cancers. C8orf4 was highly expressed in thyroid cancer, gastric cancer and breast cancer16, 20, 46. C8orf4 has been reported to enhance Wnt/β-catenin signaling in cancer cells that is associated with poor prognosis20, 21. However, C8orf4 is downregulated in colon cancer48. In this study, we show that C8orf4 is weakly expressed in HCC tumor tissues and liver CSCs. Our observations were confirmed by two HCC cohort datasets. Importantly, C8orf4 negatively regulates the NOTCH2 signaling to suppress the self-renewal of liver CSCs. Therefore, C8orf4 may exert distinct functions in the regulation of various malignancies.

NOTCH receptors consist of noncovalently bound extracellular and transmembrane domains. Once binding with membrane-bound Delta or Jagged ligands, the NOTCH receptors undergoes a proteolytic step by metalloprotease and γ-secretase, generating NECD and NICD fragments11, 31. The NICD, a soluble fragment, is released in the cytoplasm on proteolysis. Then the NICD translocates to the nucleus and binds to the transcription initiation complex, leading to activation of NOTCH-associated target genes49. However, it is largely unclear how the NICD is regulated during NOTCH signaling activation. Here we show that N2ICD binds to C8orf4 in the cytoplasm of liver non-CSC tumor cells, which impedes the nuclear translocation of N2ICD. By contrast, in liver CSCs, lower expression of C8orf4 causes the nuclear translocation of N2ICD, leading to activation of NOTCH signaling.

CSCs or tumour-initiating cells, behave like tissue stem cells in that they are capable of self-renewal and of giving rise to hierarchical organization of heterogeneous cancer cells4. Thus, CSCs harbour the stem cell properties of self-renewal and differentiation. Actually, the CSC model cannot account for tumorigenesis in all tumours. CSCs could undergo genetic evolution, and the non-CSCs might switch to CSC-like cells4. These results highlight the dynamic nature of CSCs, suggesting that the clonal evolution and CSC models can act in concert for tumorigenesis. Furthermore, low C8orf4 expression in tumor cells results in overall Notch2 activation, which then may have more of a progenitor signature and be more aggressive. These cells would likely have a growth advantage in non-adherent conditions and express many of the stemness markers. The dynamic nature of CSCs or persistent NOTCH2 activation may contribute to the high number of C8orf4/N2ICDnuc/HEY1+ cells in advanced HCC tumors and correlation in the patient cohort.

A recent study showed that NOTCH2 and its ligand Jag1 are highly expressed in human HCC tumors, suggesting activation of NOTCH2 signaling in HCC45. In addition, inhibiting NOTCH2 or Jag1 dramatically reduces tumor burden and growth. However, suppression of NOTCH3 has no effect on tumor growth. Dill et al.43 reported that Notch2 is an oncogene in HCC. Notch2-driven HCC are poorly differentiated with a high expression level of the progenitor marker Sox9, indicating a critical role of Notch2 signaling in liver CSCs. Here we found that NOTCH2 and its target genes such as NRARP, HEY1 and HES6 are highly expressed in HCC samples. In addition, depletion of NRARP and HEY1 impairs the stemness maintenance of liver CSCs and tumor propagation. Moreover, the expression levels of NRARP, HEY1 and HES6 in tumors are positively correlated with clinical severity and prognosis of HCC patients. Finally, the NOTCH2 activation status is positively related to the clinicopathological stages of HCC patients. Altogether, C8orf4 and NOTCH2 signaling can be detected for the diagnosis and prognosis prediction of HCC patients, as well as used as targets for eradicating liver CSCs for future therapy.

11.2.3.2 Quantifying the Landscape for Development and Cancer from a Core Cancer Stem Cell Circuit

The authors developed a landscape and path theoretical framework to investigate the global natures and dynamics for a core cancer stem cell gene network. The landscape exhibits four basins of attraction, representing cancer stem cell, stem cell, cancer and normal cell states. They also uncovered certain key genes and regulations responsible for determining the switching between different states. [Cancer Res]

Chunhe Li and Jin Wang
Cancer Res May 13, 2015; 75(10).
http://dx.doi.org:/10.1158/0008-5472.CAN-15-0079

Cancer presents a serious threat to human health. The understanding of the cell fate determination during development and tumor genesis remains challenging in current cancer biology. It was suggested that cancer stem cell (CSC) may arise from normal stem cells, or be transformed from normal differentiated cells. This gives hints on the connection between cancer and development. However, the molecular mechanisms of these cell type transitions and the CSC formation remain elusive. We quantified landscape, dominant paths and switching rates between cell types from a core gene regulatory network for cancer and development. Stem cell, CSC, cancer, and normal cell types emerge as basins of attraction on associated landscape. The dominant paths quantify the transition processes among CSC, stem cell, normal cell and cancer cell attractors. Transition actions of the dominant paths are shown to be closely related to switching rates between cell types, but not always to the barriers in between, due to the presence of the curl flux. During the process of P53 gene activation, landscape topography changes gradually from a CSC attractor to a normal cell attractor. This confirms the roles of P53 of preventing the formation of CSC, through suppressing self-renewal and inducing differentiation. By global sensitivity analysis according to landscape topography and action, we identified key regulations determining cell type switchings and suggested testable predictions. From landscape view, the emergence of the CSCs and the associated switching to other cell types are the results of underlying interactions among cancer and developmental marker genes. This indicates that the cancer and development are intimately connected. This landscape and flux theoretical framework provides a quantitative way to understand the underlying mechanisms of CSC formation and interplay between cancer and development. Major Findings: We developed a landscape and path theoretical framework to investigate the global natures and dynamics for a core cancer stem cell gene network. Landscape exhibits four basins of attraction, representing CSC, stem cell, cancer and normal cell states. We quantified the kinetic rate and paths between different attractor states. We uncovered certain key genes and regulations responsible for determining the switching between different states.

11.2.3.3 IMP3 Promotes Stem-Like Properties in Triple-Negative Breast Cancer by Regulating SLUG

Scientists observed that insulin-like growth factor-2 mRNA binding protein 3 (IMP3) expression is significantly higher in tumor initiating than in non-tumor initiating breast cancer cells and demonstrated that IMP3 contributes to self-renewal and tumor initiation, properties associated with cancer stem cells. [Oncogene]

S Samanta, H Sun, H L Goel, B Pursell, C Chang, A Khan, et al.
Oncogene
 , (18 May 2015) |
http://dx.doi.org:/10.1038/onc.2015.164

IMP3 (insulin-like growth factor-2 mRNA binding protein 3) is an oncofetal protein whose expression is prognostic for poor outcome in several cancers. Although IMP3 is expressed preferentially in triple-negative breast cancer (TNBC), its function is poorly understood. We observed that IMP3 expression is significantly higher in tumor initiating than in non-tumor initiating breast cancer cells and we demonstrate that IMP3 contributes to self-renewal and tumor initiation, properties associated with cancer stem cells (CSCs). The mechanism by which IMP3 contributes to this phenotype involves its ability to induce the stem cell factor SOX2. IMP3 does not interact with SOX2 mRNA significantly or regulate SOX2 expression directly. We discovered that IMP3 binds avidly to SNAI2 (SLUG) mRNA and regulates its expression by binding to the 5′ UTR. This finding is significant because SLUG has been implicated in breast CSCs and TNBC. Moreover, we show that SOX2 is a transcriptional target of SLUG. These data establish a novel mechanism of breast tumor initiation involving IMP3 and they provide a rationale for its association with aggressive disease and poor outcome.

11.2.3.4 Type II Transglutaminase Stimulates Epidermal Cancer Stem Cell Epithelial-Mesenchymal Transition

Researchers investigated the role of type II transglutaminase (TG2) in regulating epithelial mesenchymal transition (EMT) in epidermal cancer stem cells. They showed that TG2 knockdown or treatment with TG2 inhibitor, resulted in a reduced EMT marker expression, and reduced cell migration and invasion. [Oncotarget]

ML Fisher, G Adhikary, W Xu, C Kerr, JW Keillor, RL Ecker
Oncotarget May 08, 2015;

Type II transglutaminase (TG2) is a multifunctional protein that has recently been implicated as having a role in ECS cell survival. In the present study we investigate the role of TG2 in regulating epithelial mesenchymal transition (EMT) in ECS cells. Our studies show that TG2 knockdown or treatment with TG2 inhibitor, results in a reduced EMT marker expression, and reduced cell migration and invasion. TG2 has several activities, but the most prominent are its transamidase and GTP binding activity. Analysis of a series of TG2 mutants reveals that TG2 GTP binding activity, but not the transamidase activity, is required for expression of EMT markers (Twist, Snail, Slug, vimentin, fibronectin, N-cadherin and HIF-1α), and increased ECS cell invasion and migration. This coupled with reduced expression of E-cadherin. Additional studies indicate that NFϰB signaling, which has been implicated as mediating TG2 impact on EMT in breast cancer cells, is not involved in TG2 regulation of EMT in skin cancer. These studies suggest that TG2 is required for maintenance of ECS cell EMT, invasion and migration, and suggests that inhibiting TG2 GTP binding/G-protein related activity may reduce skin cancer tumor survival.

Epidermal squamous cell carcinoma (SCC) is among the most common cancers and the frequency is increasing at a rapid rate [1,2]. SCC is treated by surgical excision, but the rate of recurrence approaches 10% and the recurrent tumors are aggressive and difficult to treat [2]. We propose that human epidermal cancer stem (ECS) cells survive at the site of tumor excision, that these cells give rise to tumor regrowth, and that therapies targeted to kill ECS cells constitute a viable anti-cancer strategy. An important goal in this context is identifying and inhibiting activity of key proteins that are essential for ECS cell survival. Working towards this goal, we have developed systems for propagation of human ECS cells [3]. These cells display properties of cancer stem cells including self-renew and high level expression of stem cell marker proteins [3].

In the present study we demonstrate that ECS cells express proteins characteristic of cells undergoing EMT (epithelial-mesenchymal transition). EMT is a morphogenetic process whereby epithelial cells lose epithelial properties and assume mesenchymal characteristics [4]. The epithelial cells lose cell-cell contact and polarity, and assume a mesenchymal migratory phenotype. There are three types of EMT. This first is an embryonic process, during gastrulation, when the epithelial sheet gives rise to the mesoderm [5]. The second is a growth factor and cytokine-stimulated EMT that occurs at sites of tissue injury to facilitate wound repair [6]. The third is associated with epithelial cancer cell acquisition of a mesenchymal migratory/invasive phenotype. This process mimics normal EMT, but is not as well controlled and coordinated [478]. A number of transcription factors (ZEB1, ZEB2, snail, slug, and twist) that are expressed during EMT suppress expression of epithelial makers, including E-cadherin, desmoplakin and claudins [4]. Snail proteins also activate expression of vimentin, fibronectin and metalloproteinases [4]. Snail factors are not present in normal epithelial cells, but are present in the tumor cells and are prognostic factors for poor survival [4].

An important goal is identifying factors that provide overarching control of EMT in cancer stem cells. In this context, several recent papers implicate type II transglutaminase (TG2) as a regulator of EMT [912]. TG2, the best studied transglutaminase, was isolated in 1957 from guinea pig liver extract as an enzyme involved in the covalent crosslinks proteins via formation of isopeptide bonds [13]. However, subsequent studies reveal that TG2 also serves as a scaffolding protein, regulates cell adhesion, and modulates signal transduction as a GTP binding protein that participates in G protein signaling [14]. TG2 is markedly overexpressed in cancer cells, is involved in cancer development [1518], and has been implicated in maintaining and enhancing EMT in breast and ovarian cancer [10121920]. The G protein function may have an important role in these processes [102123].

In the present manuscript we study the role of TG2 in regulating EMT in human ECS cells. Our studies show that TG2 is highly enriched in ECS cells. We further show that these cells express EMT markers and that TG2 is required to maintain EMT protein expression. TG2 knockdown, or treatment with TG2 inhibitor, reduces EMT marker expression and ECS cell survival, invasion and migration. TG2 GTP binding activity is absolutely required for maintenance of EMT protein expression and EMT-related responses. However, in contrast to breast cancer [910], we show that TG2 regulation of EMT is not mediated via NFκB signaling.

TG2 is required for expression of EMT markers

EMT is a property of tumor stem cells that confers an ability to migrate and invade surrounding tissue [2426]. We first examined whether ECS cells express EMT markers. Non-stem cancer cells and ECS cells, derived from the SCC-13 cancer cell line, were analyzed for expression of EMT markers. Fig. 1A shows that a host of EMT transcriptional regulators, including Twist, Snail and Slug, are increased in ECS cells (spheroid) as compared to non-stem cancer cells (monolayer). This is associated with increased levels of vimentin, fibronectin and N-cadherin, which are mesenchymal proteins, and reduced expression of E-cadherin, an epithelial marker. HIF-1α, an additional marker frequently associated with EMT, is also elevated. We next examined whether TG2 is required to maintain EMT marker expression. SCC-13 cell-derived ECS cells were grown in the presence of control- or TG2-siRNA, to reduce TG2, and the impact on EMT marker level was measured. Fig. 1B shows that loss of TG2 is associated with reduced expression of Twist, Snail, vimentin and HIF-1α. To further assess the role of TG2, we utilized SCC13-Control-shRNA and SCC13-TG2-shRNA2 cell lines. These lines were produced by infection of SCC-13 cells with lentiviruses encoding control- or TG2-specific shRNA. Fig. 1C shows that SCC13-TG2-shRNA2 cells express markedly reduced levels of TG2 and that this is associated with reduced expression of EMT associated transcription factors and target proteins, and increased expression of E-cadherin. To confirm this, we grew SCC13-Control-shRNA and SCC13-TG2-shRNA2 cells as monolayer cultures for immunostain detection of EMT markers. As shown in Fig. 2A, TG2 levels are reduced in TG2-shRNA expressing cells, and this is associated with the anticipated changes in epithelial and mesenchymal marker expression.

Tumor cells that express EMT markers display enhanced migration and invasion ability [2426]. We therefore examined the impact of TG2 reduction on these responses. To measure invasion, control-shRNA and TG2-shRNA cells were monitored for ability to move through matrigel. Fig. 2B shows that loss of TG2 reduces movement through matrigel by 50%. We further show that this is associated with a reduction in cell migration using a monolayer culture wound closure assay. The control cells close the wound completely within 14 h, while TG2 knockdown reduces closure rate (Fig. 2C).

TG2 inhibitor reduces EMT marker expression and EMT functional responses

NC9 is a recently developed TG2-specific inhibitor [2728]. We therefore asked whether pharmacologic inhibition of TG2 suppresses EMT. SCC-13 cells were treated with 0 or 20 μM NC9. Fig. 3A shows that NC9 treatment reduces EMT transcription factor (Twist, Snail, Slug) and EMT marker (vimentin, fibronectin, N-cadherin, HIF-1α) levels. Consistent with these changes, the level of the epithelial marker, E-cadherin, is elevated. Fig. 3B and 3C show that pharmacologic inhibition of TG2 activity also reduces EMT biological response. Invasion (Fig. 3B) and cell migration (Fig. 3C) are also reduced.

Identification of TG2 functional domain required for EMT

We next performed studies to identify the functional domains and activities required for TG2 regulation of EMT. TG2 is a multifunctional enzyme that serves as a scaffolding protein, as a transamidase, as a kinase, and as a GTP binding protein [21]. The two best studied functions are the transamidase and GTP binding/G-protein related activities [21]. Transamidase activity is observed in the presence of elevated intracellular calcium, while GTP binding-related signaling is favored by low calcium conditions (reviewed in [21]). To identify the TG2 activity required for EMT, we measured the ability of wild-type and mutant TG2 to restore EMT in SCC13-TG2-shRNA2 cells, which have reduced TG2 expression (Fig. 4A). SCC13-TG2-shRNA2 cells display reduced expression of EMT markers including Twist, Snail, Slug, vimentin, fibronectin, N-cadherin and HIF-1α, and increased expression of the epithelial maker, E-cadherin, as compared to SCC13-Control-shRNA cells. Expression of wild-type TG2, or the TG2-C277S or TG2-W241A mutants, restores marker expression in SCC13-TG2-shRNA2 cells (Fig. 4A). TG2-C277S and TG2-W241A lack transamidase activity [10,2931]. In contrast, TG2-R580A, which lacks G-protein activity [2931], and TG2-Y516F, which retains only partial G-protein activity [30], do not efficiently restore marker expression. These findings suggest that the TG2 GTP binding function is required for EMT.

We next assayed the ability of the TG2 mutants to restore EMT functional responses-invasion and migration. Fig. 4B4C shows that wild-type TG2, TG2-C277S and TG2-W241A restore the ability of SCC13-TG2-shRNA2 cells to invade matrigel, but TG2-R580A and Y516F are less active. Fig. 4D shows a similar finding for cell migration, in that the TG2-R580A and Y517F mutant are only partially able to restore SCC13-TG2-shRNA2 cell migration. These findings suggest that TG2 GTP binding/G-protein related activity is required for EMT-related migration and invasion by skin cancer cells.

Role of TG2 in regulating EMT in A431 cells

The number of available epidermis-derived squamous cell carcinoma cell lines is limited, and so we compared our findings with A431 cells. A431 cells are squamous cell carcinoma cells established from human vulvar skin. A431 cells were grown as monolayer (non-stem cancer cells) and spheroids (ECS cells) and after 10 d the cells were harvested and assayed for expression of TG2 and EMT makers. Fig. 5A shows that TG2 levels are elevated in ECS cells and that this is associated with increased levels of mesenchymal markers, including Twist, Snail, Slug, vimentin, fibronectin, N-cadherin and HIF-1α. In contrast, E-cadherin levels are reduced. We next examined the impact of TG2 knockdown on EMT marker expression. Fig. 5B shows that mesenchymal markers are globally reduced and E-cadherin level is increased. As a biological endpoint of EMT, we examine the impact of TG2 knockdown on spheroid formation and found that TG2 loss leads to reduced spheroid formation (Fig. 5C). We next examined the impact of NC9 treatment on EMT and found a reduction in EMT markers expression associated with an increase in epithelial (E-cadherin) marker level (Fig. 5D). This loss of EMT marker expression is associated with reduced matrigel invasion (Fig. 5E), reduced spheroid formation (Fig. 5F) and reduced cell migration (Fig. 5G).

Role of NFκB

Previous studies in breast [183236], ovarian cancer [123738], and epidermoid carcinoma [11] indicate that NFκB signaling mediates TG2 impact on EMT. We therefore assessed the role of NFκB in skin cancer cells. As shown in Fig. 6A, the increase in TG2 level observed in ECS cells (spheroids) is associated with reduced NFκB level. In addition, NFκB level is increased in TG2 knockdown cells (Fig. 6B). Thus, increased NFκB is not associated with increased TG2. We next assessed the impact of NFκB knockdown on TG2 control of EMT marker expression. Fig. 6C shows that TG2 is required for increased expression of EMT markers (HIF-1α, snail, twist, N-cadherin, vimentin and fibronectin) and reduced expression of the E-cadherin epithelial marker; however, knockdown of NFκB expression does not interfere with TG2 regulation of these endpoints. We next examined the effect of TG2 knockdown on NFκB and IκBα localization. The fluorescence images in Fig. 6D suggest that TG2 knockdown with TG2-siRNA does not alter the intracellular localization of NFκB or IκBα. This is confirmed by subcellular fractionation assay (Fig. 6E) which compares NFκB level in SCC13-TG2-Control and SCC13-TG2-shRNA2 (TG2 knockdown) cells. We also monitored NFκB subcellular distribution following treatment with NC9, the TG2 inhibitor. Fig. 6F shows that cytoplasmic/nuclear distribution of NFκB is not altered by NC9. Finally, we monitored the impact of TG2 expression on NFκB binding to a canonical NFκB-response element. Increased NFκB binding to the response element is a direct measure of NFκB activity [10]. Fig. 6G shows that overall binding is reduced in nuclear (N) extract prepared from ECS cells (spheroids) as compared to non-stem cancer cells (monolayer), and that NFkB binding, as indicated by gel supershift assay, is also slightly reduced in ECS cell extracts. These findings indicate that NFkB binding is slightly reduced in ECS cells, which are TG2-enriched (Fig. 1A).

We next monitored the role of NFκB on biological endpoints of EMT. Fig. 7A and 7B show that TG2 knockdown reduces migration through matrigel, but NFκB knockdown has no impact. Likewise, TG2 knockdown reduces wound closure, but NFκB knockdown does not. These findings suggest that NFκB does not mediate the pro-EMT actions of TG2 in epidermal squamous cell carcinoma.

The metastatic cascade, from primary tumor to metastasis, is a complex process involving multiple pathways and signaling cascades [3941]. Cells that complete the metastatic cascade migrate away from the primary tumor through the blood to a distant site and there form a secondary tumor. Identifying the mechanisms that allow cells to survive this journey and form secondary tumors is an important goal. The processes involved in epithelial-mesenchymal transition (EMT) are important cancer therapy targets, as EMT is associated with enhanced cancer cell migration and stem cell self-renewal. EMT regulators, including Snail, Twist, Slug, are increased in expression in EMT and control expression of genes associated with the EMT phenotype [42].

TG2 is required for EMT

We have characterized a population of ECS cells derived from epidermal squamous cell carcinoma [3]. The present studies show that these cells, which display enhanced migration and invasion, possess elevated levels of TG2. Moreover, these cells are enriched in expression of transcription factors associated with EMT (Snail, Slug, and Twist, HIF-1α) as well as mesenchymal structural proteins including vimentin, fibronectin and N-cadherin. Consistent with a shift to mesenchymal phenotype, E-cadherin, an epithelial marker, is reduced in level. Additional studies show that TG2 knockdown results in a marked reduction in EMT marker expression and that this is associated with reduced ability of the cells to migrate to close a scratch wound and reduced movement in matrigel invasion assays. We also examined the impact of treatment with a TG2 inhibitor. NC9 is an irreversible active site inhibitor of TG2, that locks the enzyme in an open conformation [284345]. NC9 treatment of ECS cells results in decreased levels of Snail, Slug and Twist. These transcription factors suppress E-cadherin expression [46] and their decline in level is associated with increased levels of E-cadherin. NC9 inhibition of TG2 also reduces expression of vimentin, fibronectin and N-cadherin, and these changes are associated with reduced cell migration and reduced invasion through matrigel.

(Figures are not shown)

We also examined the role of TG2 in A431 squamous cell carcinoma cells derived from the vulva epithelium. TG2 is elevated in A431-derived ECS cells, as are EMT markers, and knockdown of TG2, with TG2-siRNA, reduces EMT marker expression and spheroid formation. Studies with NC9 indicate that NC9 inhibits A431 spheroid formation, EMT, migration and invasion. These studies indicate that TG2 is also required for EMT and migration and invasion in A431 cells. Based on these findings we conclude that TG2 is essential for EMT, migration and invasion, and is likely to contribute to metastasis in squamous cell carcinoma.

TG2 GTP binding activity is required for EMT

TG2 is a multifunctional enzyme that can act as a transamidase, GTP binding protein, protein disulfide isomerase, protein kinase, protein scaffold, and DNA hydrolase [21294447]. The two most studied functions are the transamidase and GTP binding functions [294447]. To identify the TG2 activity responsible for induction of EMT, we studied the ability of TG2 mutants to restore EMT in SCC13-TG2-shRNA2 cells, which express low levels of TG2 and do not express elevated levels of EMT markers or display EMT-related biological responses. These studies show that wild-type TG2 restores EMT marker expression and the ability of the cells to migrate on plastic and invade matrigel. TG2 mutants that retain GTP binding activity (TG2-C277S and TG2-W241A) also restore EMT. In contrast, TG2-R580A, which lacks GTP binding function, does not restore EMT. This evidence suggests that the GTP binding function is essential for TG2 induction of the EMT phenotype in ECS cells. Recent reports suggest that the TG2 is important for maintenance of stem cell survival in breast [91017] and ovarian [123848] cancer cells. Moreover, our findings are in agreement of those of Mehta and colleagues who reported that the TG2 GTP binding function, but not the crosslinking function, is required for TG2 induction of EMT in breast cancer cells [10].

TG2, NFκB signaling and EMT

To gain further insight into the mechanism of TG2 mediated EMT, we examined the role of NFκB. NFκB has been implicated as mediating EMT in breast, ovarian, and pancreatic cancer; however, NFκB may have a unique role in epidermal squamous cell carcinoma. In keratinocytes, NFκB has been implicated in keratinocyte dysplasia and hyperproliferation [49]. However, inhibition of NFκB function has also been shown to predispose murine epidermis to cancer [50]. Here we show that TG2 levels are elevated and NFκB levels are reduced in ECS cells as compared to non-stem cancer cells, and that TG2 knockdown is associated with increased NFκB level. In addition, TG2 knockdown, or inhibition of TG2 by treatment with NC9, does not altered the nuclear/cytoplasmic distribution of NFκB. We further show that elevated levels of TG2 in spheroid culture results in a slight reduction in NFκB binding to the NFκB response element, as measured by gel mobility supershift assay. These molecular assays strongly suggest that NFκB does not mediate the action of TG2 in epidermal cancer stem cells. Moreover, knockdown of NFκB-p65 in TG2 positive cells does not result in a reduction in Snail, Slug and Twist, or mesenchymal marker proteins expression, and concurrent knockdown of TG2 and NFκB does not reduce EMT marker protein levels beyond that of TG2 knockdown alone. These findings suggest that NFκB is not an intermediary in TG2-stimulated EMT in ECS cells. This is in contrast to the required role of NFκB in mediating TG2 induction of cell survival and EMT in breast cancer cells [183233] and ovarian cancer [123738] and epidermoid carcinoma [11].

11.2.3.5 CD24+ Ovarian Cancer Cells are Enriched for Cancer Initiating Cells and Dependent on JAK2 Signaling for Growth and Metastasis

Investigators showed that CD24+ and CD133+ cells have increased tumorsphere forming capacity. CD133+ cells demonstrated a trend for increased tumor initiation while CD24+ cells vs CD24– cells, had significantly greater tumor initiation and tumor growth capacity. [Mol Cancer Ther]

D Burgos-OjedaR Wu, K McLean, Yu-Chih Chen, M Talpaz, et al.
Molec Cancer Ther May 12, 2015; 14(5)
http://dx.doi.org:/10.1158/1535-7163.MCT-14-0607

Ovarian cancer is known to be composed of distinct populations of cancer cells, some of which demonstrate increased capacity for cancer initiation and/or metastasis. The study of human cancer cell populations is difficult due to long requirements for tumor growth, inter-patient variability and the need for tumor growth in immune-deficient mice. We therefore characterized the cancer initiation capacity of distinct cancer cell populations in a transgenic murine model of ovarian cancer. In this model, conditional deletion of Apc, Pten, and Trp53 in the ovarian surface epithelium (OSE) results in the generation of high grade metastatic ovarian carcinomas. Cell lines derived from these murine tumors express numerous putative stem cell markers including CD24, CD44, CD90, CD117, CD133 and ALDH. We show that CD24+ and CD133+ cells have increased tumor sphere forming capacity. CD133+ cells demonstrated a trend for increased tumor initiation while CD24+ cells vs CD24- cells, had significantly greater tumor initiation and tumor growth capacity. No preferential tumor initiating or growth capacity was observed for CD44+, CD90+, CD117+, or ALDH+ versus their negative counterparts. We have found that CD24+ cells, compared to CD24- cells, have increased phosphorylation of STAT3 and increased expression of STAT3 target Nanog and c-myc. JAK2 inhibition of STAT3 phosphorylation preferentially induced cytotoxicity in CD24+ cells. In vivo JAK2 inhibitor therapy dramatically reduced tumor metastases, and prolonged overall survival. These findings indicate that CD24+ cells play a role in tumor migration and metastasis and support JAK2 as a therapeutic target in ovarian cancer.

11.2.3.6 EpCAM-Antibody-Labeled Noncytotoxic Polymer Vesicles for Cancer Stem Cells-Targeted Delivery of Anticancer Drug and siRNA

Researchers designed and synthesized a novel anti-epithelial cell adhesion molecule (EpCAM)-monoclonal-antibody-labeled cancer stem cells (CSCs)-targeting, noncytotoxic and pH-sensitive block copolymer vesicle as a nano-carrier of anticancer drug and siRNA. [Biomacromolecules]

Jing Chen , Qiuming Liu , Jiangang Xiao , and Jianzhong Du
Biomacromolecules May 19, 2015. (just published)
http://dx.doi.org:/10.1021/acs.biomac.5b00551

Cancer stem cells (CSCs) have the capability to initiate tumor, to sustain tumor growth, to maintain the heterogeneity of tumor, and are closely linked to the failure of chemotherapy due to their self-renewal and multilineage differentiation capability with an innate resistance to cytotoxic agents. Herein, we designed and synthesized a novel anti-EpCAM (epithelial cell adhesion molecule)-monoclonal-antibody-labeled CSCs-targeting, noncytotoxic and pH-sensitive block copolymer vesicle as a nano-carrier of anticancer drug and siRNA (to overcome CSCs drug resistance by silencing the expression of oncogenes). This vesicle shows high delivery efficacy of both anticancer drug doxorubicin hydrochloride (DOX∙HCl) and siRNA to the CSCs because it is labeled by the monoclonal antibodies to the CSCs-surface-specific marker. Compared to non-CSCs-targeting vesicles, the DOX∙HCl or siRNA loaded CSCs-targeting vesicles exhibited much better CSCs killing and tumor growth inhibition capabilities with lower toxicity to normal cells (IC50,DOX decreased by 80%), demonstrating promising potential applications in nanomedicine.

11.2.3.7 Survival of Skin Cancer Stem Cells Requires the Ezh2 Polycomb Group Protein

Investigators showed that Ezh2 is required for epidermal cancer stem (ECS) cell survival, migration, invasion and tumor formation, and that this is associated with increased histone H3 trimethylation on lysine 27, a mark of Ezh2 action. They also showed that Ezh2 knockdown or treatment with Ezh2 inhibitors, GSK126 or EPZ-6438, reduced Ezh2 level and activity, leading to reduced ECS cell spheroid formation, migration, invasion and tumor growth. [Carcinogenesis]

G Adhikary, D Grun, S Balasubramanian, C Kerr, J Huang and RL Eckert
Carcinogenesis (2015)
http://dx.doi.org:/10.1093/carcin/bgv064

Polycomb group (PcG) proteins, including Ezh2, are important candidate stem cell maintenance proteins in epidermal squamous cell carcinoma. We previously showed that epidermal cancer stem cells (ECS cells) represent a minority of cells in tumors, are highly enriched in Ezh2 and drive aggressive tumor formation. We now show that Ezh2 is required for ECS cell survival, migration, invasion and tumor formation, and that this is associated with increased histone H3 trimethylation on lysine 27, a mark of Ezh2 action. We also show that Ezh2 knockdown or treatment with Ezh2 inhibitors, GSK126 or EPZ-6438, reduces Ezh2 level and activity, leading to reduced ECS cell spheroid formation, migration, invasion and tumor growth. These studies indicate that epidermal squamous cell carcinoma cells contain a subpopulation of cancer stem (tumor-initiating) cells that are enriched in Ezh2, that Ezh2 is required for optimal ECS cell survival and tumor formation, and that treatment with Ezh2 inhibitors may be a strategy for reducing epidermal cancer stem cell survival and suppressing tumor formation.

11.2.3.8 Inhibition of STAT3, FAK and Src mediated signaling reduces cancer stem cell load, tumorigenic potential and metastasis in breast cancer

R Thakur, R Trivedi, N Rastogi, M Singh & DP Mishra
Scientific Reports May 14, 2015; 5(10194)
http://dx.doi.org:/10.1038/srep10194

Cancer stem cells (CSCs) are responsible for aggressive tumor growth, metastasis and therapy resistance. In this study, we evaluated the effects of Shikonin (Shk) on breast cancer and found its anti-CSC potential. Shk treatment decreased the expression of various epithelial to mesenchymal transition (EMT) and CSC associated markers. Kinase profiling array and western blot analysis indicated that Shk inhibits STAT3, FAK and Src activation. Inhibition of these signaling proteins using standard inhibitors revealed that STAT3 inhibition affected CSCs properties more significantly than FAK or Src inhibition. We observed a significant decrease in cell migration upon FAK and Src inhibition and decrease in invasion upon inhibition of STAT3, FAK and Src. Combined inhibition of STAT3 with Src or FAK reduced the mammosphere formation, migration and invasion more significantly than the individual inhibitions. These observations indicated that the anti-breast cancer properties of Shk are due to its potential to inhibit multiple signaling proteins. Shk also reduced the activation and expression of STAT3, FAK and Src in vivo and reduced tumorigenicity, growth and metastasis of 4T1 cells. Collectively, this study underscores the translational relevance of using a single inhibitor (Shk) for compromising multiple tumor-associated signaling pathways to check cancer metastasis and stem cell load.

Breast cancer is the most common endocrine cancer and the second leading cause of cancer-related deaths in women. In spite of the diverse therapeutic regimens available for breast cancer treatment, development of chemo-resistance and disease relapse is constantly on the rise. The most common cause of disease relapse and chemo-resistance is attributed to the presence of stem cell like cells (or CSCs) in tumor tissues12. CSCs represent a small population within the tumor mass, capable of inducing independent tumors in vivo and are hard to eradicate2. Multiple signaling pathways including Receptor Tyrosine Kinase (RTKs), Wnt/β-catenin, TGF-β, STAT3, Integrin/FAK, Notch and Hedgehog signaling pathway helps in maintaining the stem cell programs in normal as well as in cancer cells3456. These pathways also support the epithelial-mesenchymal transition (EMT) and expression of various drug transporters in cancer cells. Cells undergoing EMT are known to acquire stem cell and chemo-resistant traits7. Thus, the induction of EMT programs, drug resistance and stem cell like properties are interlinked7. Commonly used anti-cancer drugs eradicate most of the tumor cells, but CSCs due to their robust survival mechanisms remain viable and lead to disease relapse8. Studies carried out on patient derived tumor samples and in vivo mouse models have demonstrated that the CSCs metastasize very efficiently than non-CSCs91011. Therefore, drugs capable of compromising CSCs proliferation and self-renewal are urgently required as the inhibition of CSC will induce the inhibition of tumor growth, chemo-resistance, metastasis and metastatic colonization in breast cancer.

Shikonin, a natural dietary component is a potent anti-cancer compound1213. Previous studies have shown that Shk inhibits the cancer cell growth, migration, invasion and tumorigenic potential12. Shk has good bioavailability, less toxicity and favorable pharmacokinetic and pharmacodynamic profiles in vivo12. In a recent report, it was shown that the prolonged exposure of Shk to cancer cells does not cause chemo-resistance13.Other studies have shown that it inhibits the expression of various key inflammatory cytokines and associated signaling pathways1214. It decreases the expression of TNFα, IL12, IL6, IL1β, IL2, IFNγ, inhibits ERK1/2 and JNK signaling and reduces the expression of NFκB and STAT3 transcription factors1415. It inhibits proteasome and also modulates the cancer cell metabolism by inhibiting tumor specific pyurvate kinase-M214,1516. Skh causes cell cycle arrest and induces necroptosis in various cancer types14. Shk also inhibits the expression of MMP9, integrin β1 and decreases invasive potential of cancer cells1417. Collectively, Shk modulates various signaling pathways and elicits anti-cancer responses in a variety of cancer types.

In breast cancer, Shk has been reported to induce the cell death and inhibit cell migration, but the mechanisms responsible for its effect are not well studied1819. Signaling pathways modulated by Shk in cancerous and non-cancerous models have previously been shown important for breast cancer growth, metastasis and tumorigenicity20. Therefore in the current study, we investigated the effect of Shk on various hallmark associated properties of breast cancer cells, including migration, invasion, clonogenicity, cancer stem cell load and in vivo tumor growth and metastasis.

Shk inhibits cancer hallmarks in breast cancer cell lines and primary cells

We first examined the effect of Shk on various cancer hallmark capabilities (proliferation, invasion, migration, colony and mammosphere forming potential) in breast cancer cells. MTT assay was used to find out effect of Shk on viability of breast cancer cells. Semi-confluent cultures were exposed to various concentrations of Shk for 24 h. Shk showed specific anti-breast cancer activity with IC50 values ranging from 1.38 μM to 8.3 μM in MDA-MB 231, MDA-MB 468, BT-20, MCF7, T47D, SK-BR-3 and 4T1 cells (Fig. 1A). Whereas the IC50 values in non-cancerous HEK-293 and human PBMCs were significantly higher indicating that it is relatively safe for normal cells (Fig. S1A). Shk was found to induce necroptotic cell death consistent with previous reports (Fig. S1B). Treatment of breast cancer cells for 24 h with 1.25 μM, 2.5 μM and 5.0 μM of Shk significantly reduced their colony forming potential (Fig. 1B). To check the effect of Shk on the heterogeneous cancer cell population, we tested it on patient derived primary breast cancer cells. Shk reduced the viability and colony forming potential of primary breast cancer cells in dose dependent manner (Fig. 1C,D). Further we checked its effects on migration and invasion of breast cancer cells. Shk (2.5 μM) significantly inhibited the migration of MDA-MB 231, MDA-MB 468, MCF7 and 4T1 cells (Fig. 1E). It also inhibited the cell invasion in dose dependent manner (Fig. 1F and S1CS1DS1E,S1F). We further examined its effect on mammosphere formation. MDA-MB 231, MDA-MB 468, MCF7 and 4T1 cell mammosphere cultures were grown in presence or absence of 1.25 μM, 2.5 μM and 5.0 μM Shk for 24 h. After 8 days of culture, a dose dependent decrease in the mammosphere forming potential of these cells was observed (Figs. 1G,H). Collectively, these results indicated that Shk effectively inhibits the various hallmarks associated with aggressive breast cancer.

(not shown)

Figure 1: Shk inhibits multiple cancer hallmarks

Shk reduces cancer stem cell load in breast cancer

As Shk exhibited strong anti-mammosphere forming potential; therefore it was further examined for its anti-cancer stem cell (CSC) properties. Cancer stem cell loads in breast cancer cells were assessed using Aldefluor assay which measures ALDH1 expression. MDA-MB 231 cells with the highest number of ALDH1+ cells were selected for further studies (Fig. S2A). We also checked the correlation between ALDH1 expression and mammosphere formation. Sorted ALDH1+ cells were subjected to mammosphere cultures. ALDH1+ cells formed highest number of mammospheres compared to ALDH1-/low and parent cell population, indicating that ALDH1+ cells are enriched in CSCs (Fig. S2B). Shk reduced the Aldefluor positive cells in MDA-MB 231 cells after 24 h of treatment (Fig. 2A,B). Next, we examined the effect of Shk on the expression of stem cell (Sox2, Oct3/4, Nanog, AldhA1 and c-Myc) and EMT (Snail, Slug, ZEB1, Twist, β-Catenin) markers, associated with the sustenance of breast CSCs. Shk (2.5 μM) treatment for 24 h reduced the expression of these markers (Fig. 2C and S2D). Shk also reduced protein expression of these markers in dose dependent manner (Fig. 2D,E and S2C).

(not shown)

Figure 2: Shk decreases stem cell load in breast cancer cells and enriched CD44+,CD24−/low breast cancer stem cells.

To further confirm anti-CSC properties of Shk, we checked the effect of shikonin on the load of CD44+ CD24− breast CSCs in MCF7 cells grown on matrigel. Shikonin reduced CD44+ CD24− cell load in dose dependent manner after 24 h of treatment (Fig S2E). We also tested its effects on the enriched CSC population. CD44+ CD24− cells were enriched from MCF7 cells using MagCellect CD24− CD44+ Breast CSC Isolation Kit (Fig. S2F). Enriched CSCs formed highest number of mammosphere in comparison to parent MCF7 cell population or negatively selected CD24+ cells (Fig. S2G). Enriched CSCs were treated with indicated doses of Shk (0.625 μM, 1.25 μM and 2.5 μM) for 24 h and were either analyzed for ALDH1 positivity or subjected to colony or mammosphere formation. 2.5 μM dose of Shk reduced ALDH1+ cells by 50% and inhibited colony and mammosphere formation (Fig. S2H2F2G and 2H). Shk also reduced the mRNA expression of CSC markers in CD44+ CD24− cells and patient derived primary cancer cells (Fig. 2I,J). These results collectively indicated that Shk inhibits CSC load and associated programs in breast cancer.

Shk is a potent inhibitor of STAT3 and poorly inhibits FAK and Src

To identify the molecular mechanism responsible for anti-cancer properties of Shk, we used a human phospho-kinase antibody array to study a subset of phosphorylation events in MDA-MB 231 cells after 6h of treatment with 2.5 μM Shk. Amongst the 46 phospho-antibodies spotted on the array, the relative extent of phosphorylation of three proteins decreased to about ≳ 2 fold (STAT3, 3.3 fold; FAK, 2.5 fold and Src, 1.8 fold) upon Shk treatment (Fig. 3A,B). These proteins (STAT3, FAK and Src) are known to regulate CSC proliferation and self renewal212223. Therefore, we focused on these proteins and the result of kinase-array was confirmed by western blotting. Shk effectively inhibits STAT3 at early time point (1 h) while activation of FAK and Src decreased on or after 3 h (Fig. 3C) confirming Shk as a potent inhibitor of STAT3. Shk also reduced the protein expression of STAT3, FAK and Src at 24 h (Fig. 3C).

(not shown)

Figure 3. Shk inhibits STAT3, FAK and Src signaling pathways.

We also observed that Shk does not inhibit JAK2 at initial time-points (Fig. 3C). This raised a possibility that Shk either regulates STAT3 independent of JAK2 or it binds directly to STAT3. To check the first probability, we activated STAT3 by treating the cells with IL6 (100 ng ml−1) for 1 h followed by treatment with Shk (2.5 μM) for 1 h. Both immunofluorescence and western-blotting results showed that Shk inhibited activated STAT3 without inhibiting JAK2 (Fig. S3AS3B) confirming that Shk inhibits JAK2 mediated activation of STAT3 possibly by binding directly to STAT3. For further confirmation, we performed an in silico molecular docking analysis to examine binding of Shk with the STAT3 SH2 domain. In a major conformational cluster, Shk occupied Lys-707, Lys-709 and Phe-710 binding sites in the STAT3 SH2 domain similar to the STAT3 standard inhibitor S3I-201 (Fig. S3C and S3D). The binding energy of Shk to STAT3 was −4.20 kcal mol−1. Collectively, these results showed that Shk potently inhibits STAT3 activation and also attenuates FAK and Src activation.

STAT3, Src and FAK are differentially expressed and activated in breast CSCs (BCSCs)

STAT3 and FAK are known to play an important role in proliferation and self-renewal of CSCs in various cancer types including breast cancer212224. Src also support CSC phenotype in some cancer types, but there are limited reports of its involvement in breast cancer25. Therefore, we checked the expression and activation of STAT3, FAK and Src in CSCs and non-CSCs. Here we used two methods to enrich the CSCs and non-CSCs. In the first method, the MDA-MB 231 cells were subjected to mammosphere formation for 96 h. After 96 h, mammosphere and non-mammosphere forming cells were clearly visible (Fig. 4A). These mammosphere and non-mammosphere forming cells were separated by using a 70 micron cell strainer. Mammospheres were subjected to two subculture cycles to enrich CSCs. With each passage, the viable single cells (non-mammosphere forming cells) and mammospheres were collected in RIPA lysis buffer and western blotting was done (Fig. 4B). We found that the activation and expression of the STAT3, FAK and Src is higher in enriched mammosphere cultures (Fig. 4C). In the second method, CD44+ CD24− cells were isolated from MCF7 cultures using MagCellect Breast CSC Isolation Kit. STAT3, FAK and Src activation and their mRNA and protein expression were assessed in enriched CSCs and were compared to parent MCF7 cell population. STAT3, FAK and Src all were differentially activated in CSCs (Fig. 4E). High mRNA as well as protein expressions of all the three genes was also observed in CSCs (Fig. 4D,E). Collectively, these results indicate that STAT3, FAK and Src are over expressed and activated in BCSCs.

Figure 4: STAT3, FAK and Src are differentially activated and expressed in breast cancer cells.

  • Representative picture indicating mammosphere and single suspended cells. (B) Schematic outline of mammosphere enrichment. (C) Protein expression and activation of STAT3, FAK and Src was determined in single suspended cells (non-mammosphere forming cells) and mammospheres by western blot. The full size blots corresponding to the cropped blot images are given in  S10. (D) Gene expression of STAT3, FAK and Src was determined in MCF7 parent population and CD44+ CD24−/low MCF7 cells using PCR. The full agarose gel images corresponding to the cropped images are given in Fig. S10. (E) Protein expression and activation of STAT3, FAK and Src was in CD44+ 24− cells and parent population.
STAT3, FAK and Src are differentially activated and expressed in breast cancer cells.

STAT3, FAK and Src are differentially activated and expressed in breast cancer cells.

http://www.nature.com/srep/2015/150514/srep10194/images_article/srep10194-f4.jpg

STAT3 is important for mammosphere formation and CSC programs in breast cancer

As our results indicated that the expression and activation of STAT3, FAK and Src is high in BCSCs and Shk is capable of inhibiting these signaling proteins; therefore to find out functional relevance of each protein and associated effects on their pharmacological inhibition by Shk, we used specific inhibitors against these three. Effect of these inhibitors was first tested on the mammosphere forming potential of MDA-MB 231, MDA-MB 468 and MCF7 cells. A drastic reduction in the mammosphere formation was observed upon STAT3 inhibition. FAK and Src inhibition also reduced the primary and secondary mammosphere formation but STAT3 inhibition showed most potent effect (Fig. 5A and S4). Further, we also checked the effect of these inhibitors on the expression of various CSC and EMT related markers in MDA-MB 231 cells. STAT3 inhibition decreased the expression of most of the CSC and EMT markers (Fig. 5B). These two findings indicated that STAT3 inhibition is more effective in reducing mammosphere forming potential and weakens major CSC programs and the anti-CSC potential of Shk is possibly due to its strong STAT3 inhibitory effect.
(not shown)

STAT3, FAK and Src activation status correlates with mammosphere forming potential in breast cancer

STAT3, FAK and Src activation status correlates with mammosphere forming potential in breast cancer

Figure 5: STAT3, FAK and Src activation status correlates with mammosphere forming potential in breast cancer.

http://www.nature.com/srep/2015/150514/srep10194/carousel/srep10194-f5.jpg

(A) Bar graph represents number of mammospheres formed from 2500 cells in presence and absence of indicated treatments. MDA-MB 231, MDA-MB 468 and MCF7 24 h mammosphere cultures were treated with Shk (2.5 μM), FAK inhibitor (FAK inhibitor 14; 2.5 μM), Src inhibitor (AZM 475271; 10 μM) and STAT3 inhibitor (WP1066; 10 μM). After 24 h, treatments were removed and cells were allowed to grow in fresh mammosphere culture media for 8 days. (B) Expression of various stem cell and EMT related transcription factors and markers were detected using western blotting in MDA-MB 231 cells with or without indicated treatments. The full size blots corresponding to the cropped blot images are given in Fig. S10. (C) MDA-MB 231, MDA-MB 468 and MCF7 cells were pre-treated with either IL6 (100 ng ml−1), Fibronectin (1 μg ml−1) or EGF (25 ng ml−1) for two population doublings and subjected to mammosphere formation. Bar graph represents average of three independent experiments. (D) MCF7 cells were pre-treated with either IL6 (100 ng ml−1), Fibronectin (1 μg ml−1) or EGF (25 ng ml−1) for two population doublings and subjected to mammosphere formation. After 24 h, cells were treated with DMSO (untreated) or Shk (treated) as indicated in the bar graph. Data are shown as the mean ±SD. (*) p < 0.05 and (**) p < 0.01.

To further check the involvement of these pathways in CSCs, we cultured MDA-MB 231, MDA-MB 468 and MCF7 cells in the presence of either IL6 (100ng ml−1), EGF (25 ng ml−1) or Fibronectin (1 μg ml−1) coated surface for two population doublings. Cells were then subjected to mammosphere formation. In IL6 pre-treated cultures, there was a sharp rise in mammosphere formation, indicating that the STAT3 activation shifts CSC and non-CSC dynamics towards CSCs (Fig. 5C). IL6 is previously known to induce the conversion of non-CSC to CSC via STAT3 activation26. In MCF7 cells, mammosphere forming potential after IL6 pre-treatment increased nearly by three fold. Therefore, we further checked the effectiveness of Shk on mammosphere forming potential in pre-treated MCF7 cells. It was found that Shk inhibits mammosphere formation most effectively in IL6 pre-treated cultures (Fig. 5D). However, in EGF and Fibronectin pre-treated cultures, Shk was relatively less effective. This was possibly due to its weak FAK and Src inhibitory potential. Collectively, these results illustrated that STAT3 activation is significantly correlated with the mammosphere forming potential of breast cancer cells and its inhibition by a standard inhibitor or Shk potently reduce the mammosphere formation.

Shk inhibit CSCs load by disrupting the STAT3-Oct3/4 axis

In breast cancer, STAT3 mediated expression of Oct3/4 is a major regulator of CSC self-renewal2627. As we observed that both Shk and STAT3 inhibitors decreased the Oct3/4 expression (Figs. 2C and 5B), we further checked the effect of STAT3 activation on ALDH1+ CSCs and Oct3/4 expression. On IL6 pre-treatment, number of ALDH1+ cells increased in all three (MDA-MB 231, MDA-MB 468 and MCF7) cancer cells (Fig. 6A). MCF7 cells showed highest increase. Therefore, to check the effect of STAT3 inhibition on CSC load, we incubated IL6 pre-treated MCF7 cells with Shk and STAT3 inhibitor for 24 h and analyzed for ALDH1 positivity. It was observed that both Shk and STAT3 inhibitor reduced the IL6 induced ALDH1 positivity from 10% to < 2% (Fig. 6B). These results suggested that Shk induced inhibition of STAT3 and decrease in BCSC load is interlinked. We further checked the effect of STAT3 activation status on Oct3/4 expression in MDA-MB 231, MDA-MB 468 and MCF7 cells. We observed that expression of Oct3/4 increases with the increase in STAT3 activation (Fig. 6C–E).

(not shown)

Figure 6: STAT3 activation status and its effect on cancer stem cell load

STAT3 transcriptional activity is important in maintaining CSC programs2829. Therefore, we also examined the effect of Shk on STAT3 promoter activity. STAT3 reporter assay was performed in presence of IL6 and Shk; it was found that Shk reduced the promoter activity of STAT3 in a dose dependent manner (Fig. S5). Collectively, these results showed that Shk mediated STAT3 inhibition are responsible for decrease in CSC load and Oct3/4 associated stem cell programs.

Shk inhibits mammosphere formation, migration and invasion through inhibition of STAT3, FAK and Src in breast cancer cells

As the earlier results (Fig. 1) showed that Shk inhibits cell migration and invasion in breast cancer cells, we further examined the effect of STAT3, FAK and Src inhibitors on cell migration and invasion in MDA-MB 231 cells. It was found that STAT3 inhibitor poorly inhibits cell migration while both Src and FAK inhibitors were effective in reducing cell migration (Fig. 7A). All the three inhibitors decreased the cell invasion and MMP9 expression significantly (Fig. 7B and S6). It was also observed that effect of all these inhibitors, except STAT3 inhibitor on mammosphere formation and FAK inhibitor on cell migration, were not comparable to that of Shk. Shk inhibited all these properties more effectively than individual inhibition of STAT3, FAK and Src. This made us to assume that the ability of Shk to inhibit multiple signaling molecules simultaneously is the reason behind its potent anti-cancer effect. To check this notion, we combined STAT3, FAK and Src inhibitors with each other and examined the effect of combinations on invasion, migration and mammosphere forming potential in MDA-MB 231 cells. We observed further decrease in cell migration and invasion on combining STAT3 and FAK, STAT3 and Src, or FAK and Src (Figs. 7A,B). Combination of FAK and Src was not very effective in inhibiting mammosphere formation in MDA-MB 231 cells and CD44+ CD24− MCF7 CSCs. However, their combination with STAT3 decreased the mammosphere forming potential equivalent to that of Shk (Fig. 7C,D). We also compared the mammosphere forming potential of Shk with Salinomycin (another anti-CSC agent) and found that at 2.5 μM dose of Shk was almost two times more potent than Salinomycin (Fig. S7). Collectively, these results indicated that Shk inhibits multiple signaling proteins (STAT3, FAK and Src) to compromise various aggressive breast cancer hallmarks.

Figure 7: Combination of FAK, Src and STAT3 inhibitors is more potent than individual inhibition against various cancer hallmarks.

combination-of-fak-src-and-stat3-inhibitors-is-more-potent-than-individual-inhibition-against-various-cancer-hallmarks

combination-of-fak-src-and-stat3-inhibitors-is-more-potent-than-individual-inhibition-against-various-cancer-hallmarks

http://www.nature.com/srep/2015/150514/srep10194/images_article/srep10194-f7.jpg

  • Cell migration and (B) cell invasion potential of MDA-MB 231 cells was assessed in the presence of Shk (2.5 μM), FAK inhibitor (FAK inhibitor 14; 2.5 μM), Src inhibitor (AZM 475271; 10 μM) and STAT3 inhibitor (WP1066; 10 μM). Various combinations of these inhibitors were also used STAT3+FAK inhibitor (WP1066; 10 μM + FAK inhibitor 14; 2.5 μM), STAT3 + Src Inhibitor (WP1066; 10 μM + AZM 475271; 10 μM) and FAK+Src Inhibitor (FAK inhibitor 14; 2.5 μM + AZM 475271; 10 μM). Cell migration and cell invasion was assessed through scratch cell migration assay and transwell invasion after 24 h of treatments. (C,D) Mammosphere forming potential of MDA-MB 231 cells and CD44+ CD24−/low enriched MCF7 cells was assessed in presence of similar combination of STAT3+FAK inhibitor (WP1066; 10 μM + FAK inhibitor 14; 2.5 μM), STAT3 + Src Inhibitor (WP1066; 10 μM+ AZM 475271; 10 μM) and FAK + Src Inhibitor (FAK inhibitor 14; 2.5 μM + AZM 475271; 10 μM). Cells were subjected to mammosphere cultures for 24 h and treated with the indicated inhibitors for next 24 h, followed by media change and growth of mammospheres were monitored for next 8 days. Data are shown as the mean ±SD. (**) p < 0.01.

Shk inhibits breast cancer growth, metastasis and decreases tumorigenicity

To explore whether Shk may have therapeutic potential for breast cancer treatment in vivo, we tested Shk against 4T1-induced breast cancer syngenic mouse model. 4T1 cells (mouse breast cancer cells) are capable of growing fast and metastasize efficiently in vivo30. Prior to the in vivo experiments, we checked the effect of Shk on ALDH1 positivity and on activation of STAT3, FAK and Src in 4T1 cells in vitro. Shk effectively decreased the ALDH1+ cells and inhibited STAT3, FAK and Src in 4T1 cells in vitro (Fig. S8A and S8B). For in vivo tumor generation, 1 × 106 cells were injected subcutaneously in the fourth nipple mammary fat pad of BALB/c mice. When the average size of tumors reached around 50 mm3, mice were divided into three groups, vehicle and two Shk treated groups each received either 2.5 mg Kg−1 or 5.0 mg Kg−1 Shk. Shk was administered via the intraperitoneal injection on every alternate day. It significantly suppressed the tumor growth in 4T1 induced syngenic mouse model (Fig. 8A). The average reduction in 4T1 tumor growth was 49.78% and 89.73% in 2.5 mg Kg−1 and 5.0 mg Kg−1 groups respectively compared with the vehicle treated group (Fig. 8A). No considerable change in body weight of the treated group animals was observed (Fig. S9A). We further examined the effect of Shk on the tumor initiating potential of breast cancer cells. 4T1 induced tumors were excised from the control and treatment groups on the second day after 4th dose of Shk was administered. Tumors were dissociated; cells were allowed to adhere and then re-injected into new animals for secondary tumor formation. Growth of secondary tumors was monitored till day 15 post-reinjection. Shk treated groups showed a marked decrease in secondary tumor formation (Fig. 8D). We also observed a drastic reduction in the number of metastatic nodules in the lungs of treatment group animals (Fig. 8F). The reduction in the metastatic load was not proportional to the decrease in tumor sizes; however within the treatment group, some animals with small tumors were carrying higher number of metastatic nodules. As FAK is an important mediator of cancer metastasis and metastatic colonization, we further examined the effects of Shk on metastatic colonization. For this, 1 × 105 4T1 cells were injected to BALB/c mice through tail vein. Animals were divided into three groups, as indicated above. Shk and vehicle were administered through intraperitoneal injections at alternate days starting from the 2nd day post tail vein injections till 33rd day. The average reduction in total number of metastatic nodules was 88.6% – 90.5% in Shk treated mice compared to vehicle control (Fig. 8F). An inset picture (Fig. 8A lower panel) represents lung morphology of vehicle control and treated groups. We further examined the activation and expression status of STAT3, FAK and Src between vehicle control and treated group tumors. There were low expression and activation of STAT3, FAK and Src in treated tumors as compared to the vehicle control (Fig. 8B,C). Similar trend was observed in ALDH1 expressions (Fig. 8B). Further, the mice tumor sections were subjected to immunohistochemistry, immunofluorescence and hematoxylin and eosin (H&E) staining to study histology and expression of key proteins being examined in this study. Fig. 8G shows representative images of H&E staining, proliferating cell nuclear antigen (PCNA), terminal deoxynucleotidyl transferase dUTP nick end labeling (TUNEL), STAT3 and Oct3/4 immunostaining. PCNA expression was low while TUNEL positive cells were high in tumor tissues of Shk treated groups. STAT3 and Oct3/4 expression was low in Shk treated groups. These results collectively demonstrated that Shk modulates the expression and activation of STAT3, FAK and Src in vivo and is effective in suppressing tumorigenic potential and metastasis in syngenic mouse model.

Figure 8: Shk inhibits breast cancer growth, tumorigenicity and metastasis in vivo.

Shk inhibits breast cancer growth, tumorigenicity and metastasis in vivo

Shk inhibits breast cancer growth, tumorigenicity and metastasis in vivo

http://www.nature.com/srep/2015/150514/srep10194/images_article/srep10194-f8.jpg

  • Shk inhibited 4T1 tumor growth. Bar graph represents the average tumor volumes in vehicle control and Shk treated tumor bearing mice (n = 6). (*) p < 0.05 and (**) p < 0.01. Inset picture of upper panel represents tumor sizes and lower pane represents lung morphology in vehicle control and Shk treatment groups. (B) Western blot examination of indicated proteins for their expression and activation in vehicle control and treated tumor groups. The full size blots corresponding to the cropped blot images are given in Fig. S10. (C) Gene expression of stem cell and EMT markers in tumor tissues excised from the vehicle control and Shk treated groups (n = 3). (D) Number of secondary tumors formed after injecting indicated cell dilutions from Vehicle treated and Shk treated 4T1 tumors. (E) Number of lung nodules formed in mice injected with 4T1 mouse mammary tumor cells in the mammary fat pad and administered with 2.5 mg Kg−1 Shk or vehicle control on every alternate day for 3 weeks (n = 6). (F) Number of lung nodules in mice injected with 4T1 mouse mammary tumor cells through tail vein and administered with 2.5 mg Kg−1 Shk or vehicle control on every alternate day for 3 weeks. (n = 8) (G) Representative panel of the histological H&E staining, immunofluorescence staining for the STAT3, Oct3/4, cell proliferation marker PCNA and DNA damage indicator-TUNEL staining of tumor sections from vehicle and treatment groups.

Recent studies have shown that aggressiveness, therapy resistance and disease relapse in breast cancer is attributed to a small population of CSCs involved in continuous self-renewal and differentiation through signaling pathways similar to that of the normal stem cells31. Therapeutic targeting of CSCs therefore, has profound clinical implications for cancer treatment31. Recent studies indicated that therapies / agents targeting both differentiated cancer cells and CSCs may possibly have significant therapeutic advantages32. Therefore, it is imperative to look for novel therapeutic agents with lesser side effects urgently for effective targeting of CSCs. In search of novel, nontoxic anti-CSC agents, attention has been focused on natural agents in recent times33,34. In this study, we have used a natural napthoquinone compound, Shk with established antitumorigenic, favorable pharmacokinetic and toxicity profiles and report for the first time its potent anti-CSC properties. Shk significantly inhibits breast cancer cell proliferation in vitroex vivoand in vivo. It decreases the cell migration and invasion of breast cancer cells in vivo, as well as inhibits tumorigenicity, metastasis and metastatic colonization in a syngenic mouse model of breast cancer in vivo. These finding suggest a strong potential of Shk in breast cancer therapy.

We assessed the effect of Shk on the CSC load in breast cancer cells through various functional assays (tumorsphere in vitro and syngenic mouse model of breast cancer in vivo) and quantification of specific stem cell markers. In breast cancer, CD44+ CD24− cells and ALDH1+ cells are considered to be BCSCs2125. Shk significantly decreased the mammosphere formation (Fig. 1HS1G and 2H), ALDH1+ cell and CD44+ CD24− cell loads in vitro (Fig. 2BS2E and S2H). It also reduced the expression of CSC markers (Oct3/4, Sox2, Nanog, c-Myc and Aldh1) in vivo andin vitro (Fig. 2C,DS2C and S2D). These genes are known to regulate stem cell programs and in cancer, they are established promoters and regulators of CSC phenotype353637383940. Decrease in the expression of these genes on Shk treatment indicates its potential to suppress CSC programs. Tumor initiating potential (tumorigenicity) is the bona fide measure of CSCs. Reduction in the tumorigenic potential of cells isolated form Shk treated tumors indicates in vivoanti-CSC effects of Shk.

We further demonstrated that Shk is a potent inhibitor of STAT3 and it also inhibits FAK and Src (Fig. 3A–C). Its STAT3 inhibitory property was found to be responsible for its anti-CSC effects (Figs. 6B and 7B). STAT3 and FAK inhibitors are previously known to compromise CSC growth41,42. Here, we found that pharmacological inhibition of STAT3 was more effective in compromising CSC load than FAK and Src inhibitions (Fig. 5A). STAT3 activation through IL6 increases mammosphere formation more significantly than Src and FAK activation through EGF and Fibronectin (Fig. 5C). This indicates that IL6-STAT3 axis is a key regulator of BCSC dynamics.

11.2.3.9 Ovatodiolide Sensitizes Aggressive Breast Cancer Cells to Doxorubicin Anticancer Activity, Eliminates Their Cancer Stem Cell-Like Phenotype, and Reduces Doxorubicin-Associated Toxicity

Investigators evaluated the usability of ovatodiolide (Ova) in sensitizing triple negative breast cancer (TNBC) cells to doxorubicin (Doxo), cytotoxicity, so as to reduce Doxo effective dose and consequently its adverse effects. Ova-sensitized TNBC cells also lost their cancer stem cell-like phenotype evidenced by significant dissolution and necrosis of formed mammospheres, as well as their terminal differentiation. [Cancer Lett]

11.2.3.10 Glabridin Inhibits Cancer Stem Cell-Like Properties of Human Breast Cancer Cells: An Epigenetic Regulation of miR-148a/SMAd2 Signaling

The authors report that glabridin (GLA) attenuated the cancer stem cell (CSC)-like properties through microRNA-148a (miR-148a)/transforming growth factor beta-SMAD2 signal pathway in vitro and in vivo. In MDA-MB-231 and Hs-578T breast cancer cell lines, GLA enhanced the expression of miR-148a through DNA demethylation. [Mol Carcinog]

11.2.3.11 Ginsenoside Rh2 Inhibits Cancer Stem-Like Cells in Skin Squamous Cell Carcinoma

The effects of ginsenoside Rh2 (GRh2) on Lgr5-positive cancer stem cells (CSCs) were determined by flow cytometry and by tumor sphere formation. Scientists found that GRh2 dose-dependently reduced skin squamous cell carcinoma viability, possibly through reduced the number of Lgr5-positive CSCs. [Cell Physiol Biochem]

Liu S. Chen M. Li P. Wu Y. Chang C. Qiu Y. Cao L. Liu Z. Jia C.
Cell Physiol Biochem 2015;36:499-508
http://dx.doi.org:/10.1159/000430115

Background/Aims: Treatments targeting cancer stem cells (CSCs) are most effective cancer therapy, whereas determination of CSCs is challenging. We have recently reported that Lgr5-positive cells are cancer stem cells (CSCs) in human skin squamous cell carcinoma (SCC). Ginsenoside Rh2 (GRh2) has been shown to significantly inhibit growth of some types of cancers, whereas its effects on the SCC have not been examined. Methods: Here, we transduced human SCC cells with lentivirus carrying GFP reporter under Lgr5 promoter. The transduced SCC cells were treated with different doses of GRh2, and then analyzed cell viability by CCK-8 assay and MTT assay. The effects of GRh2 on Lgr5-positive CSCs were determined by fow cytometry and by tumor sphere formation. Autophagy-associated protein and β-catenin were measured by Western blot. Expression of short hairpin small interfering RNA (shRNA) for Atg7 and β-catenin were used to inhibit autophagy and β-catenin signaling pathway, respectively, as loss-of-function experiments. Results: We found that GRh2 dose-dependently reduced SCC viability, possibly through reduced the number of Lgr5-positive CSCs. GRh2 increased autophagy and reduced β-catenin signaling in SCC cells. Inhibition of autophagy abolished the effects of GRh2 on β-catenin and cell viability, while increasing β-catenin abolished the effects of GRh2 on autophagy and cell viability. Conclusion: Taken together, our data suggest that GRh2 inhibited SCC growth, possibly through reduced the number of Lgr5-positive CSCs. This may be conducted through an interaction Carcinoma account for more than 80% of all types of cancer worldwide, and squamous cell carcinoma (SCC) is the most frequent carcinoma. Skin SCC causes a lot of mortality yearly, which requires a better understanding of the molecular carcinogesis of skin SCC for developing efficient therapy [1,2]. Ginsenoside Rh2 (GRh2) is a characterized component in red ginseng, and has proven therapeutic effects on inflammation [3] and a number of cancers [4,5,6,7,8,9,10,11,12,13,14], whereas its effects on the skin SCC have not been examined.

Cancer stem cells (CSCs) are cancer cells with great similarity to normal stem cells, e.g., the ability to give rise to various cell types in a particular cancer [15,16]. CSCs are highly tumorigenic, compared to other non-CSCs. CSCs appear to persist in tumors as a distinct population and CSCs are believed to be responsible for cancer relapse and metastasis after primary tumor resection [15,16,17,18]. Recently, the appreciation of the critical roles of CSCs in cancer therapy have been continuously increasing, although the identification of CSCs in a particular cancer is still challenging.

To date, different cell surface proteins have been used to isolate CSCs from a variety of cancers by flow cytometry. Among these markers for identification of CSCs, the most popular ones are prominin-1 (CD133), side population (SP) and increased activity of aldehyde dehydrogenase (ALDH). CD133 is originally detected in hematopoietic stem cells, endothelial progenitor cells and neuronal and glial stem cells. Later on, CD133 has been shown to be expressed in the CSCs from some tumors [19,20,21,22,23], but with exceptions [24]. SP is a sub-population of cells that efflux chemotherapy drugs, which accounts for the resistance of cancer to chemotherapy. Hoechst (HO) has been experimentally used for isolation of SP cells, while the enrichment of CSCs by SP appears to be limited [25]. Increased activity of ALDH, a detoxifying enzyme responsible for the oxidation of intracellular aldehydes [26,27], has also been used to identify CSCs, using aldefluor assay [28,29]. However, ALDH has also been detected in other cell types, which creates doubts on the purity of CSCs using ALDH method [30,31]. Moreover, all these methods appear to be lack of cancer specificity.

The Wnt target gene Lgr5 has been recently identified as a stem cell marker of the intestinal epithelium, and of the hair follicle [32,33]. Recently, we reported that Lgr5 may be a potential CSC marker for skin SCC [34]. We detected extremely high Lgr5 levels in the resected skin SCC specimen from the patients. In vitro, Lgr5-positive SCC cells grew significantly faster than Lgr5-negative cells, and the fold increase in growth of Lgr5-positive vs Lgr5-negative cells is significantly higher than SP vs non-SP, or ALDH-high vs ALDH-low, or CD133-positive vs CD133-negative cells. Elimination of Lgr5-positive SCC cells completely inhibited cancer cell growth in vitro.

Here, we transduced human SCC cells with lentivirus carrying GFP reporter under Lgr5 promoter. The transduced SCC cells were treated with different doses of GRh2, and then analyzed cell viability by CCK-8 assay and MTT assay. The effects of GRh2 on Lgr5-positive CSCs were determined by flow cytometry and by tumor sphere formation. Autophagy-associated protein and β-catenin were measured by Western blot. Expression of short hairpin small interfering RNA (shRNA) for autophagy-related protein 7 (Atg7) and β-catenin were used to inhibit autophagy and β-catenin signaling pathway, respectively, as loss-of-function experiments. Atg7 was identified based on homology to Pichia pastoris GSA7 and Saccharomyces cerevisiae APG7. In the yeast, the protein appears to be required for fusion of peroxisomal and vacuolar membranes. The protein shows homology to the ATP-binding and catalytic sites of the E1 ubiquitin activating enzymes. Atg7 is a mediator of autophagosomal biogenesis, and is a putative regulator of autophagic function [35,36,37,38]. We found that GRh2 dose-dependently reduced SCC viability, possibly through reduced the number of Lgr5-positive CSCs. GRh2 increased autophagy and reduced β-catenin signaling in SCC cells. Inhibition of autophagy abolished the effects of GRh2 on β-catenin and cell viability, while increasing β-catenin abolished the effects of GRh2 on autophagy and cell viability.

Transduction of SCC cells with GFP under Lgr5 promoter

We have recently shown that Lgr5 is CSC marker for skin SCC [34]. In order to examine the role of GRh2 on SCC cells, as well as a possible effect on CSCs, we transduced human skin SCC cells A431 [34] with a lentivirus carrying GFP reporter under Lgr5 promoter (Fig. 1A). The Lgr5-positive cells were green fluorescent in culture (Fig. 1B), and could be analyzed or isolated by flow cytometry, based on GFP (Fig. 1C).

(not shown)

Fig. 1. Transduction of SCC cells with GFP under Lgr5 promoter. (A) The structure of lentivirus carrying GFP reporter under Lgr5 promoter. (B) The pLgr5-GFP-transduced A431 cells in culture. Lgr5-positive cells were green fluorescent. Nuclear staining was done by DAPI. (C) Representative flow chart for analyzing pLgr5-GFP-transduced A431 cells by flow cytometry based on GFP. Gated cells were Lgr5-positive cells. Scar bar is 20µm.

GRh2 dose-dependently inhibits SCC cell growth

Then, we examined the effect of GRh2 on the viability of SCC cells. We gave GRh2 at different doses (0.01mg/ml, 0.1mg/ml and 1mg/ml) to the cultured pLgr5-GFP-transduced A431 cells. We found that from 0.01mg/ml to 1mg/ml, GRh2 dose-dependently deceased the cell viability in either a CCK-8 assay (Fig. 2A), or a MTT assay (Fig. 2B). Next, we questioned whether GRh2 may have a specific effect on CSCs in SCC cells. Thus, we analyzed GFP+ cells, which represent Lgr5-positive CSCs in pLgr5-GFP-transduced A431 cells after GRh2 treatment. We found that GRh2 dose-dependently deceased the percentage of GFP+ cells, by representative flow charts (Fig. 2C), and by quantification (Fig. 2D). We also examined the capability of the GRh2-treated cells in the formation of tumor sphere. We found that GRh2 dose-dependently deceased the formation of tumor sphere-like structure, by quantification (Fig. 2E), and by representative images (Fig. 2F). Together, these data suggest that GRh2 dose-dependently inhibited SCC cell growth, possibly through inhibition of CSCs.

Fig. 2. GRh2 dose-dependently inhibits SCC cell growth. We gave GRh2 at different doses (0.01mg/ml, 0.1mg/ml and 1mg/ml) to the cultured pLgr5-GFP-transduced A431 cells. (A-B) GRh2 dose-dependently deceased the cell viability in either a CCK-8 assay (A), or a MTT assay (B). (C-D) GFP+ cells after GRh2 treatment were analyzed by flow cytometry, showing that GRh2 dose-dependently deceased the percentage of GFP+ cells, by representative flow charts (C), and by quantification (D). The capability of the GRh2-treated cells to form tumor sphere-like structures was examined, shown by quantification (E), and by representative images (F). *p

http://www.karger.com/Article/ShowPic/430115?image=000430115_f02.JPG

GRh2 treatment decreases β-catenin and increases autophagy in SCC cells

We analyzed the molecular mechanisms underlying the cancer inhibitory effects of GRh2 on SCC cells. We thus examined the growth-regulatory proteins in SCC. From a variety of proteins, we found that GRh2 treatment dose-dependently decreases β-catenin, and dose-dependently upregulated autophagy-related proteins Beclin, Atg7 and increased the ratio of LC3 II to LC3 I, by quantification (Fig. 3A), and by representative Western blots (Fig.3B). Since β-catenin signaling is a strong cell-growth stimulator and autophagy can usually lead to stop of cell-growth and cell death, we feel that the alteration in these pathways may be responsible for the GRh2-mediated suppression of SCC growth.

(not shown)

Figure 3. GRh2 treatment decreases β-catenin and increases autophagy in SCC cells.

http://www.karger.com/Article/ShowPic/430115?image=000430115_f03.JPG

Inhibition of autophagy abolishes the effects of GRh2 on β-catenin

In order to find out the relationship between β-catenin and autophagy in this model, we inhibited autophagy using a shRNA for Atg7, and examined its effect on the changes of β-catenin by GRh2. First, the inhibition of Atg7 in A431 cells by shAtg7 was confirmed by RT-qPCR (Fig. 4A), and by Western blot (Fig. 4B). Inhibition of Atg7 resulted in abolishment of the effects of GRh2 on other autophagy-associated proteins (Fig. 4B), and resulted in abolishment of the inhibitory effect of GRh2 on β-catenin (Fig. 4B). Moreover, the effects of GRh2 on cell viability were completely inhibited (Fig. 4C). Together, inhibition of autophagy abolishes the effects of GRh2 on β-catenin. Thus, the regulation of GRh2 on β-catenin needs autophagy-associated proteins.

Fig. 4. Inhibition of autophagy abolishes the effects of GRh2 on β-catenin.

A431 cells were transfected with shRNA for Atg7, or scrambled sequence (scr) as a control. (A) RT-qPCR for Atg7. (B) Quantification of β-catenin, Beclin, Atg7 and LC3 by Western blot. (C) Cell viability by CCK-8 assay. *p

http://www.karger.com/Article/ShowPic/430115?image=000430115_f04.JPG

Overexpression of β-catenin abolishes the effects of GRh2 on autophagy

Next, we inhibited the effects of GRh2 on β-catenin by overexpression of β-catenin in A431 cells. First, the overexpression of β-catenin in A431 cells was confirmed by RT-qPCR (Fig. 5A), and by Western blot (Fig. 5B). Overexpression of β-catenin resulted in abolishment of the effects of GRh2 on autophagy-associated proteins (Fig. 5B). Moreover, the effects of GRh2 on cell viability were completely inhibited (Fig. 5C). Together, inhibition of β-catenin signaling abolishes the effects of GRh2 on autophagy. Thus, the regulation of GRh2 on autophagy needs β-catenin signaling. This model is thus summarized in a schematic (Fig. 6), suggesting that GRh2 may target both β-catenin signaling and autophagy, which interacts with each other in the regulation of SCC cell viability and growth.

http://www.karger.com/Article/ShowPic/430115?image=000430115_f05.JPG

Fig. 5. Overexpression of β-catenin abolishes the effects of GRh2 on autophagy. A431 cells were transfected with β-catenin, or scrambled sequence (scr) as a control. (A) RT-qPCR for β-catenin. (B) Quantification of β-catenin, Beclin, Atg7 and LC3 by Western blot. (C) Cell viability by CCK-8 assay. *p

http://www.karger.com/Article/ShowPic/430115?image=000430115_f06.JPG

Fig. 6. Schematic of the model. GRh2 may target both β-catenin signaling and autophagy, which interacts with each other in the regulation of SCC cell viability and growth.

Understanding the cancer molecular biology of skin SCC and identification of an effective treatment are both critical for improving the current therapy [1]. Lgr5 has been recently identified as a novel stem cell marker of the intestinal epithelium and the hair follicle, in which Lgr5 is expressed in actively cycling cells [32,33]. Moreover, we recently showed that Lgr5-positive are CSCs in skin SCC [34]. Thus, specific targeting Lgr5-positive cells may be a promising therapy for skin SCC.

In the current study, we analyzed the effects of GRh2 on the viability of SCC. Importantly, we not only found that GRh2 dose-dependently decreases SCC cell viability, but also dose-dependently decreased the number of Lgr5-positive CSCs in SCC cells. These data suggest that the CSCs in SCC may be more susceptible for the GRh2 treatment, and the decreases in CSCs may result in the decreased viability in total SCC cells. This point was supported by following mechanism studies. Activated β-catenin signaling by WNT/GSK3β prevents degradation of β-catenin and induces its nuclear translocation [39]. Nuclear β-catenin thus activates c-myc, cyclinD1 and c-jun to promote cell proliferation, and activates Bcl-2 to inhibit apoptosis [39]. High β-catenin levels thus are a signature of CSCs. Therefore, it is not surprising that CSCs are more affected than other cells when GRh2 targets β-catenin signaling.

In addition, GRh2 appears to target autophagy. Although altered metabolism may be beneficial to the cancer cells, it can create an increased demand for nutrients to support cell growth and proliferation, which creates metabolic stress and subsequently induces autophagy, a catabolic process leading to degradation of cellular components through the lysosomal system [40]. Cancer cells use autophagy as a survival strategy to provide essential biomolecules that are required for cell viability under metabolic stress [40]. However, autophagy not only results in a staring in cell growth, but also may result in cell death [40]. Increases in autophagy may substantially decrease cancer cell growth. Thus, GRh2 has its inhibitory effect on skin SCC cells through a combined effect on cell proliferation (by decreasing β-catenin) and autophagy [40].

Interestingly, our data suggest an interaction between β-catenin and autophagy. This finding is consistent with previous reports showing that autophagy negatively modulates Wnt/β-catenin signaling by promoting Dvl instability [41,42], and with other studies showing that β-catenin regulates autophagy [38,43,44].

Of note, we have checked other SCC lines and essentially got same results. Together with our previous reports showing that Lgr5-positive cells are CSCs in skin SCC [34], these findings thus highlight a future engagement of Lgr5-directed GRh2 therapy, which could be performed in a sufficiently frequent manner, to substantially improve the current treatment for skin SCC.

Normal vs Cancer Thyroid Stem Cells: The Road to Transformation
The authors discuss new insights into thyroid stem cells as a potential source of cancer formation in light of the available information on the oncogenic role of genetic modifications that occur during thyroid cancer development. Understanding the fine mechanisms that regulate tumor transformation may provide new ground for clinical intervention in terms of prevention, diagnosis and therapy. [Oncogene] Abstract
Cancer Stem Cells: A Potential Target for Cancer Therapy
The identification of cancer stem cells (CSCs) and a better understanding of the complex characteristics of CSCs will provide invaluable diagnostic, therapeutic and prognostic targets for clinical application. The authors introduce the dysregulated properties of CSCs in cancers and discuss the possible challenges in targeting CSCs for cancer treatment. [Cell Mol Life Sci] Abstract
Targeting Cancer Stem Cells Using Immunologic Approaches
Wicha, M; Chang, A; Yingxin, X; Xiaolian, Z; Ning, N; Liu, Shuang, Q, L; Pan, Q
Stem Cells 2015-04-15 4.15 | Apr 22
Targeting Notch, Hedgehog, and Wnt Pathways in Cancer Stem Cells: Clinical Update
Ivy, P; Takebe, N
Nat Rev Clin Oncol 2015-04-07 4.14 | Apr 15
Hypoxia-Inducible Factors in Cancer Stem Cells and Inflammation
Liu, Y; Peng, G
Trends Pharmacol Sci 2015-04-06 4.14 | Apr 15
NANOG in Cancer Stem Cells and Tumor Development: An Update and Outstanding Questions
Tang, D; Chao, HP; Wang, J; Yang, Tao; Jeter, C
Stem Cells 2015-03-26 4.12 | Apr 1

Two Genes Control Breast Cancer Stem Cell Proliferation and Tumor Properties

Read Full Post »

Metastatic Disease (4.3)

Writer and Curator: Larry H. Bernstein, MD, FCAP 

In the preceding discussions the hematological and nonhematological cancers were elaborated.  These were tumors of blood or solid tumors that are malignant.  Malignant solid tumors have a loss of normal architecture.  Malignant cancers of the blood forming organ also have a disruption of the architecture in the blood forming organs, and they are circulating elements that are either acutely increased in number or chronically increased to very high circulating counts as well as many cells in the marrow.  The diagnosis depends on the type of cell elements and the stage of maturation.  In the case of blood cell cancers, one might consider an intermediate stage that has a long course that is in the case of the myelogenous series, myeloid dysplasia, which includes myelofibrosis, which in either case is not a benign course. In the case of solid tumors, there is an anatomic structure of the cancer site.

The usual structure for a carcinoma is either adjoining cells surrounding a vascular supply, as in the liver, a parenchymal gland, as in pancreas, a tubular structure, as the gastrointestinal tract and lungs (which are embryologically and outpouching of the gut), or a skin surface.  In the case of carcinomas, the cells mature from a basement membrane of small flattened cells that overlie a fibrovascular matrix and an underlying myxoid stroma, perhaps beneath which is a muscular organ, then covered by a flat layer of cells. In the case of all epithelial structures there is an orderly maturation of epithelium from the basal layer to the mature epithelial cells that are elongate, have a brush border, and secrete into the glandular structure.  The cell maturation becomes disrupted and disorderly to different degrees in the development of malignancy from a dysplasia to low grade malignancy, to high grade anaplastic cancer.

The development of a cancer implies the loss of tissue architecture, the replication of cells, the development of a neoplasms circulation (which is the topic of vascular endothelial growth factor (VEGF)), the overgrowth of the circulation so that the tumor has insufficient blood supply, and vascular invasion.  We refer to the Warburg Hypothesis with respect to the malignancy relying on glycolysis in the presence of oxygen (aerobic glycolysis), but it may be questionable to imply that there is sufficient oxygen supply.  In some cases a cancer may occur from a longstanding inflammatory focus.  This has been seen to occur in osteomyelitis and in gastrointestinal fistulas.  The growth of a neoplasm, when it exceeds its blood supply, requires adaptive changes. The most obvious to consider would be a decreased reliance of mitochondrial respiration.  Warburg refer to the increase production of lactic acid as analogous to Pasteur observation of fermentation in yeast (Pasteur effect).  He measured the lactic acid production by various tissues, and the consumption with the oxygen consumption showed that in many tissues approximately two molecules of lactate are prevented from appearing when one molecule of oxygen is consumed – a relationship that Meyerhof had found in muscle. This he expressed as the “Meyerhof quotient”:

Anaerobic glycolysis – aerobic glycolysis/oxygen consumption

Ref: Otto Warburg: Cell Physiologist, Biochemist, and Eccentric
Hans Krebs in collaboration with Roswitha Schmid
Clarendon Press, Oxford, 1981. Pp 19-25.

The special feature of cancer cells was the high rate of glycolysis in the presence of oxygen, whereas muscle can form lactate from carbohydrate in the absence of oxygen. This led to the discovery that all animal tissues are capable of glycolysis both aerobically and anaerobically.  Pasteur had established 60 years earlier that the rates of fermentation are generally hiugh anaerobically, but low aerobically. This led Warburg to the conclusion that cancer cells are distinguished from noncancer cells by their failure to suppress glycolysis in the presence of oxygen. He discovered in 1926 that the link between respiration and fermentation can be severed by a specific inhibitor, ethylcarbylamine. He looked at carbylethylamine as an inhibitor of the ‘Pasteur effect’, and determined that the catalyst was a heavy metal ion. But the proposed mechanism was shown not to be correct by Engelhardt, Lynen, Bucher, Lowry, Racker, and Sols.The activity of the enzyme phospofructokinase is regulated by the concentrations of ATP, ADP and inorganic phosphate (Pi). The “allosteric properties” of PFK could account for the ‘Pasteur effect’.  ATP inactivates PFK, while ADP and Pi activate it. Further, etylcarbylamine was found to be an uncoupler of oxidative phosphorylation (OxPhos), but Warburg was right in postulating that a heavy metal was involved since heavy metals are involved in
OxPhos.  The explanation for this is now that when malignant transformation occurs, the cells’ energy supply is redirected from their normal function to growth. This change was found to be irreversible upon restoration of oxygen supply.

The topic of discussion is metastasis. What does it have to do with malignancy and respiration? Metastasis is the other key feature of cancer cells. What it has to do with respiration would probably tie in with the change in the cells’ energy supply that is directed toward proliferation. As the cell metabolism is reconfigured, there is also a change in the cell signaling with respect to apoptosis and the events regarding autophagy.  This has to extend beyond the mitochondria, mainly because autophagy involves mitophagy, the ER and the entire cytoskeleton.  This means that the cytoplasmic relationship to the intercellular matrix and the fibroblast stroma would have to be affected, as the cell breaks away from its close association with adjacent cells.  Cells can migrate to adjacent lymphatic structures, and either enter the circulation by way of the lymphatics or by invasion of the venous circulation directly. In any case, entry into the circulation allows for transport to distant sites.  With respect to migration to distant sites, we recall the hypothesis of Paget that the cells metastasize directly into the circulating blood, and they may ‘seed’ to favorable organs.

The discussion now turns to the assessment of apoptosis as a means to inhibition of cancer cell lines, which proliferate if unchecked and migrate away from the primary site.  I use a few examples from a symposium volume of the Annals of the New York Academy of Sciences:

Apoptosis: From Signaling Pathways to Therapeutic Tools.
Ed, Mark Diederich
ANYAA9 2003; 1010:1-799
The role of β-glucuronidase in induction of apoptosis by Genistein Combined Polysaccharide (GCP) in xenogenetic mice bearing human mammary cancer cells.
Yuan L, Wagatsuma C, Sun B, Kim Jung-Hwan, Surh Young-Joon
Ann NY Acad Sci 2003;1010: 347-349.
http://dx.doi.org:/10.1196/annals.1299.063

  • GCP inhibits tumor cell growth through multiple mechanisms, including induction of tumor apoptosis
  • The biological activities of genistein (aglycon) are more evident in tumor tissues than in normal tissues.
  • Hiugh doses of genistein administration rarely induces toxicity to normal tissues.
  • Higher levels of β-glucuronidase expression in tumor tissues results in more genistein aglycon, leading to tumor destruction.

Induction of apoptosis in human pancreatic cancer cells by docosahexanoic acid
Merendino N, Molinari R, Loppi B, Pessina G, D’Aquino M, Tomassi G, Velotti F.
Ibid 361-364. http://dx.doi.org:/10.1196/annals.1299.143

Polyunsaturated fatty acids have been indicated to induce anti-proliferative and/or apoptotic effects in various tumor cells. We showed that, at a 200-μM concentration, both alpha-linoleic (18:2 n-6; LA) or docosahexaenoic (22:6 n-3; DHA) acid inhibited cell growth, while only DHA induced apoptosis in the human Paca-44 pancreatic cancer cell line. Investigating the mechanism underlying DHA-induced apoptosis, we showed that DHA induced a rapid and dramatic (>60%) intracellular depletion of reduced glutathione (GSH), without affecting oxidized glutathione (GSSG). Moreover, using two specific inhibitors of carrier-mediated GSH extrusion, cystathionine or methionine, we observed that GSH depletion occurred via an active GSH extrusion, and that inhibition of GSH efflux completely reversed apoptosis. These results provide the first evidence for a possible causative role of GSH depletion in DHA-induced apoptosis.

Opposite phenotypes of cancer and aging arise from alternative regulation of common signaling pathways.
Ukraintseva SV1, Yashin AI.
Ann N Y Acad Sci. 2003 Dec; 1010:489-92.
http://dx.doi.org:/10.1196/annals.1299.089

Phenotypic features of malignant and senescent cells are in many instances opposite. Cancer cells do not “age”; their metabolic, proliferative, and growth characteristics are opposite to those observed with cellular aging (both replicative and functional). In many such characteristics cancer cells resemble embryonic cells. One can say that cancer manifests itself as a local, uncontrolled “rejuvenation” in an organism. Available evidence from human and animal studies suggests that the opposite phenotypic features of aging and cancer arise from the opposite regulation of genes participating in apoptosis/growth arrest or growth signal transduction pathways in cells. This fact may be applicable in the development of new anti-aging treatments. Genes that are contrarily regulated in cancer and aging cells (e.g., proto-oncogenes or tumor suppressors) could be candidate targets for anti-aging interventions. Their “cancer-like” regulation, if strictly controlled, might help to rejuvenate the human organism.

CUGBP2 Plays a Critical Role in Apoptosis of Breast Cancer Cells in Response to Genotoxic Injury
Mukhopadhyay D, Jung J, Murmu N, Houchen CW, Dieckgraefe BK, Anant A
Ibid 504–509. http://dx.doi.org:/10.1196/annals.1299.093

 Posttranscriptional control of gene expression plays a key role in regulating gene expression in cells undergoing apoptosis. Cyclooxygenase-2 (COX-2) is a crucial enzyme in the conversion of arachidonic acid to prostaglandin E2 (PGE2) and is significantly upregulated in many types of adenocarcinomas. COX-2 overexpression leads to increased PGE2 production, resulting in increased cellular proliferation. PGE2 enhances the resistance of cells to ionizing radiation. Accordingly, understanding mechanisms regulating COX-2 expression may lead to important therapeutic advances. Besides transcriptional control, COX-2 expression is significantly regulated by mRNA stability and translation. We have previously demonstrated that RNA binding protein CUGBP2 binds AU-rich sequences to regulate COX-2 mRNA translation. In the current study, we have determined that expression of both COX-2 mRNA and CUGBP2 mRNA are induced in MCF-7 cells, a breast cancer cell line, following exposure to 12 Gy γ-irradiation. However, only CUGBP2 protein is induced, but COX-2 protein levels were not altered. Silencer RNA (siRNA)-mediated inhibition of CUGBP2 reversed the block in COX-2 protein expression. Furthermore, MCF-7 cells underwent apoptosis in response to radiation injury, which was also reversed by CUGBP2 siRNAs. These data suggest that CUGBP2 is a critical regulator of the apoptotic response to genotoxic injury in breast cancer cells.

Multiple and synergistic deregulations of apoptosis-controlling genes in pancreatic carcinoma cells
A Trauzold,1 S Schmiedel,1 C Röder,1 C Tams,1 M Christgen,1 S Oestern,1 A Arlt,2 S Westphal,1 M Kapischke,1 H Ungefroren,1 and H Kalthoff1,
Ibid 510-513.  Br J Cancer. 2003 Nov 3; 89(9): 1714–1721.
http://dx.doi.org/10.1038%2Fsj.bjc.6601330

CD95, TRAIL-R1 (tumor necrosis factor-related apoptosis inducing ligand-receptor 1) and TRAIL-R2 are members of the TNF-receptor family of transmembrane proteins that are capable of inducing apoptosis (Wiley et al, 1995Pitti et al, 1996Pan et al, 1997Peter et al, 1998). Following ligand binding, the receptors oligomerize and the pro-apoptotic molecules TRADD, FADD and FLICE/caspase-8 are recruited to their intracellular death domain forming the ‘death-inducing signaling complex’ (DISC) (Krammer, 1999). The subsequent events leading to apoptosis depend on the specific cell type being challenged. In type I cells the bulk induction of caspase-8 at the DISC leads to the direct activation of the effector caspase 3. In type II cells only little amounts of caspase-8 are activated at the DISC requiring the pro-apoptotic mitochondrial amplification loop for efficient caspase-3 activation (Scaffidi et al, 1998).
In Vivo Imaging of Chemotherapy-Induced Apoptosis in Human Cancers
T Belhocine, N Steinmetz, A Green, P Rigo
Ibid 525-529. http://dx.doi.org:/10.1196/annals.1299.097

Rationale. Induction of apoptosis in sensitive tumor cells is the main mechanism of action of chemotherapy agents in human cancers. Also, the assessment of drug-induced apoptosis soon after chemotherapy may be an early predictor of treatment efficacy. Patients and Methods. A phase I/II study was prospectively conducted in 15 patients presenting with proven lung cancers (n= 10), breast cancers (n= 2), and lymphomas (n= 3) to assess the value of the 99mTc-radiolabeled recombinant human (rh) Annexin V for imaging apoptosis immediately after completion of the first course of chemotherapy. Early Annexin V findings post-chemotherapy (day+1, day+2) were also compared to the tumor status at 6 to 12 weeks post-treatment.
Results. All lung and lymphoma patients with an increased tracer uptake post-treatment (n= 8) had either partial or complete tumor response. Five patients with no tracer uptake had progressive disease. However, two breast cancers had a response to treatment, although no significant tracer uptake was observed. Tumor response and survival time were significantly correlated with the 99mTc-labeled Annexin V uptake. No serious events related to tracer administration were noted. Conclusion. Preliminary results of this pilot study demonstrate the feasibility of the 99mTc-labeled Annexin V uptake for the in vivo imaging of apoptosis after one course of chemotherapy. If confirmed on larger series, these promising results may open new perspectives in the management of oncology patients.

In vivo photoacoustic imaging of chemotherapy-induced apoptosis in squamous cell carcinoma using a near-infrared caspase-9 probe.
Yang Q1Cui HCai SYang XForrest ML.
J Biomed Opt. 2011 Nov; 16(11):116026.
http://dx.doi.org:/10.1117/1.3650240

Anti-cancer drugs typically exert their pharmacological effect on tumors by inducing apoptosis, or programmed cell death, within the cancer cells. However, no tools exist in the clinic for detecting apoptosis in real time. Microscopic examination of surgical biopsies and secondary responses, such as morphological changes, are used to verify efficacy of a treatment. Here, we developed a novel near-infrared dye-based imaging probe to directly detect apoptosis with high specificity in cancer cells by utilizing a noninvasive photoacoustic imaging (PAI) technique. Nude mice bearing head and neck tumors received cisplatin chemotherapy (10 mg/kg) and were imaged by PAI after tail vein injection of the contrast agent. In vivo PAI indicated a strong apoptotic response to chemotherapy on the peripheral margins of tumors, whereas untreated controls showed no contrast enhancement by PAI. The apoptotic status of the mouse tumor tissue was verified by immunohistochemical techniques staining for cleaved caspase-3 p11 subunit. The results demonstrated the potential of this imaging probe to guide the evaluation of chemotherapy treatment.

Noninvasive imaging techniques are necessary for early cancer detection and evaluation of the chemotherapeutic effect on tumors. Current diagnostic imaging techniques generally include γ-scintigraphy, magnetic resonance imaging, computed tomography, and ultrasonography; however, these techniques only give morphological information on the tumor. These techniques do not report the biochemical response of the tumor to treatment and physical changes in the tumor in response to treatment may take days to weeks to fully manifest. Positron emission topography and SPECT can indirectly detect tumor response to treatment due to changes in metabolic activity and blood perfusion, respectively. However, no clinical imaging technique can directly detect the biochemical response, e.g., apoptosis, of tumors to treatment. Since apoptosis often occurs within in the first 18 to 36 h after treatment, direct imaging of apoptosis would rapidly indicate if there is a response in the tumor to chemotherapy.

Photoacoustic imaging (PAI) overcomes the spatial and resolution limitations of conventional imaging techniques at a relatively low cost,12 and it has shown its potential to monitor the growth of melanoma brain tumors3 and melanoma metastasis in sentinel lymph nodes.4 However, ascribed to the fact that PAI utilizes the optical absorption of tissues for contrast, it cannot differentiate normal from cancerous cells unless the cells are overexpressing chromomeric marker (e.g., melanomas) or labeled by reporter moieties as contrast agent to enhance the contrast between normal and pathological tissues. In this case, application of a contrast agent such as fluorochromes is expected to facilitate both the visualization of head and neck squamous cell carcinoma (HNSCC) cancer cells and their response to treatment in vivo by PAI.

We have synthesized a near-infrared fluorescent imaging probe – IR780-linker-Val-Ala-Glu(OMe)-FMK by conjugating a fluorochrome (IR780) to Z-Val-Ala-Glu (OMe), a cell permeable caspase inhibitor. The activation of caspase family of cysteine proteases has been recognized as a critical event of apoptosis, which is a physiological process of type I programmed cell death. Typically anti-cancer agents act on cancer cells to induce apoptosis, so apoptosis is a rapid and definite indicator of tumor response. For this reason, apoptosis is used in screening drug candidates in cell culture. The fluoromethyl ketone of the tripeptides valine, alanine, and O-methyle-glutamic acid [Val-Ala-Glu(OMe)-FMK] can specifically and irreversibly bind to the cysteine residue at the active site of caspase-9.5 Our preliminary in vitro cell-imaging test with prostate cancer DU 145 cells demonstrated the sensitivity of this imaging probe for cell apoptosis.6 In this study, we evaluated the application of IR780-linker-Val-Ala-Glu(OMe)-FMK for PAI to detect procaspase-9 activation caused by anticancer drug treatment in living nude mice bearing HNSCC tumors.

Increase in PA amplitude within the HNSCC tumor after intravenous injection of imaging agent

Increase in PA amplitude within the HNSCC tumor after intravenous injection of imaging agent

http://www.ncbi.nlm.nih.gov/pmc/articles/PMC3221716/bin/JBOPFO-000016-116026_1-g002.jpg

Fourteen micron (thickness) sections of the tumor tissue were stained with a goat primary polyclonal antibody for cleaved caspase-3 p11 subunit (Asp-175-Ser-176) and a donkey anti-goat secondary antibody with a fluorescein isothiocyanate (FITC) fluorophore (Santa Cruz Biotechnology Inc., Santa Cruz, California). Cell nuclei were stained with 4,6-diamidino-2-phenylindole (DAPI).

Maximum amplitude projection images obtained from the PAI of the HNSCC tumor region shown in Fig. ​(Fig.2).2 were converted to grayscale images. The grayscale images at various time points were linearly aligned using the scale-invariant feature transform function of Fiji/ImageJA software (ver. 20110307, http://pacific.mpi-cbg.de/wiki/index.php/Fiji) (Fig. ​(Fig.3).3). Quantification of PA signal intensity within the tumor region was performed in triplet for each image by measuring the mean gray value (units: gray/pixel) of the circled tumor region. The extent of signal enhancement was calculated by normalizing the tumor signal against a background reading taken immediately before injection of the imaging agent (Fig. ​(Fig.2).2)

Apoptosis in the tumor tissues was independently verified by immunohistochemical staining for caspase 3, a downstream indicator of apoptosome-activated caspase-mediated apoptosis that would not cross-react with the caspase-9 PA probe. Figure ​(Figure4a) 4a represents a control section stained with the secondary antibody alone (autofluorescence of the tissue without apparent staining); while, Fig. ​(Fig.4b).4b shows the immunostaining of the caspase-3 p11 subunit (green) and the DAPI staining of cell nuclei. The intense green fluorescence in these sections suggests the wide spread apoptosis of cells in the tumor tissues after intravenous administration of high-dose cisplatin. In addition, cells on the peripheral of the tumor stained more strongly for caspase 3 (green fluorescence) compared to cells at the tumor interior. This was consistent with the PA imaging of apoptosis that showed strong apoptosis at the tumor peripheral, suggesting chemotherapeutics had penetrated the outer layers of the tumor and induced apoptosis.

Immunostaining for apoptosis in tumor

Immunostaining for apoptosis in tumor

http://www.ncbi.nlm.nih.gov/pmc/articles/PMC3221716/bin/JBOPFO-000016-116026_1-g004.jpg

Immunostaining for apoptosis in tumor. (a) Representative control section stained with secondary antibody alone and (b) tissue section of the HNSCC tumor stained for caspase-3 p11 subunit after cisplatin treatment.

I now consider mechanisms of metastasis as currently viewed.

Metastasis mechanisms.
Geiger TR1Peeper DS.
Biochim Biophys Acta. 2009 Dec; 1796(2):293-308.  http://dx.doi.org:/10.1016/j.bbcan.2009.07.006.

Metastasis, the spread of malignant cells from a primary tumor to distant sites, poses the biggest problem to cancer treatment and is the main cause of death of cancer patients. It occurs in a series of discrete steps, which have been modeled into a “metastatic cascade”. In this review, we comprehensively describe the molecular and cellular mechanisms underlying the different steps, including Epithelial-Mesenchymal Transition (EMT), invasion, anoikis, angiogenesis, transport through vessels and outgrowth of secondary tumors. Furthermore, we implement recent findings that have broadened and challenged the classical view on the metastatic cascade, for example the establishment of a “premetastatic niche”, the requirement of stem cell-like properties, the role of the tumor stroma and paracrine interactions of the tumor with cells in distant anatomical sites. A better understanding of the molecular processes underlying metastasis will conceivably present us with novel targets for therapeutic intervention.

Axis of evil: molecular mechanisms of cancer metastasis Thomas Bogenrieder1 and Meenhard Herlyn1
Oncogene (2003) 22, 6524–6536.
http://dx.doi.org:/doi:10.1038/sj.onc.1206757

Although the genetic basis of tumorigenesis may vary greatly between different cancer types, the cellular and molecular steps required for metastasis are similar for all cancer cells. Not surprisingly, the molecular mechanisms that propel invasive growth and metastasis are also found in embryonic development, and to a less perpetual extent, in adult tissue repair processes. It is increasingly apparent that the stromal microenvironment, in which neoplastic cells develop, profoundly influences many steps of cancer progression, including the ability of tumor cells to metastasize. In carcinomas, the influences of the microenvironment are mediated, in large part, by bidirectional interactions (adhesion, survival, proteolysis, migration, immune escape mechanisms lymph-/angiogenesis, and homing on target organs) between epithelial tumor cells and neighboring stromal cells, such as fibroblasts as well as endothelial and immune cells. In this review, we summarize recent advances in understanding the molecular mechanisms that govern this frequently lethal metastatic progression along an axis from primary tumor to regional lymph nodes to distant organ sites. Affected proteins include growth factor signaling molecules, chemokines, cell–cell adhesion molecules (cadherins, integrins) as well as extracellular proteases (matrix metalloproteinases). We then discuss promising new therapeutic approaches targeting the microenvironment. We note, however, that there is still too little knowledge of how the many events are coordinated and integrated by the cancer cell, with conspiratorial help by the stromal component of the host. Before drug development can proceed with a legitimate chance of success, significant gaps in basic knowledge need to be filled.

Metastases to regional lymph nodes are detected at diagnosis and surgery in approximately one-third of breast, colorectal, uterine cervix, and oral cavity and pharynx cancer patients, and one-quarter of esophageal, lung pancreas, gastric and bladder cancer patients (Greenlee et al., 2001). The high mortality rates associated with cancer are caused by the metastatic spread of tumor cells from the site of their origin. In fact, metastases are the cause of 90% of cancer deaths (Hanahan and Weinberg, 2000). The prognosis for a patient who is diagnosed with advanced invasive or metastatic disease remains little better than it was decades ago (Sporn, 1997). Tumor cells invade either the blood or lymphatic vessels to access the general circulation and then establish themselves in other (visceral) tissues. Ultimately, they become surgically unresectable, with pharmacological or radiological long-term control being uncommon (Stacker et al., 2002).

Although the genetic basis of tumorigenesis may vary greatly between different cancer types, the cellular and molecular steps required for metastasis are generally similar for all solid tumor cells (Woodhouse et al., 1997Liotta and Kohn, 2003). Not surprisingly, the molecular mechanisms that propel invasive growth and metastasis are also found in embryonic development, and, however to a less perpetual/chronic/aggressive/quantitatively different extent, in adult tissue maintenance (e.g. involving stem cell differentiation) and repair processes (‘tumors are wounds that do not heal’) (Dvorak, 1986). We now view cancer as a complex tissue resulting from disrupted organ homeostasis, rather than focusing on the cancer cell, and the genes within it, alone (Hanahan and Weinberg, 2000;Bissell and Radisky, 2001Bogenrieder and Herlyn, 2002Wiseman and Werb, 2002). Normal tissue homeostasis is maintained between epithelial cells and their microenvironment, such as fibroblasts, endothelial and immunocompetent cells, and the extracellular matrix (ECM). Similarly, during malignant transformation and progression, there are (however deregulated) reciprocal and conspirational interactions between the neoplastic cells and the adjacent stromal cells (Hsu et al., 2002). A series of recent investigations have shown that aberrations in the stroma can both precede and stimulate the development of cancers (reviewed in Bissell and Radisky, 2001Wiseman and Werb, 2002).

The process of metastasis involves an intricate interplay between altered cell adhesion, survival, proteolysis, migration, lymph-/angiogenesis (see articles in this issue by R Kerbel and P Campochiaro, pp. NNN–NNN), immune escape mechanisms, and homing on target organs (Table 1). However, there is still very little knowledge of how these events are coordinated by the cancer cell, with conspirational help by the stromal component (microenvironment) of the host (Clark, 1991Hsu et al., 2002). This process is usually said to be ‘uncontrolled’. As we shall see, however, it is by no means purely stochastic, but rather a finely tuned molecular machinery with active tumor cell–host collaboration. Thus, all explanations of ‘success’ of the metastatic axis contain a strong element of determinism. Whereas the early steps in the metastastic campaign are completed very efficiently, metastasis is an inefficient process in its later steps, especially the regulation of cancer cell growth at the secondary sites (Luzzi et al., 1998Cameron et al., 2000Chambers et al., 2002). Given that spread of the tumor to distant organs is usually lethal, more intense studies of these molecular mechanisms assume general importance to develop more effective anticancer strategies. In the following discussion of specific molecular mechanisms, we have often chosen to draw mainly from examples that pertain to melanoma progression, although similar processes are most likely also operating during oncogenesis of a wide range of cancers.

The classical metastatic cascade encompasses intravasation by tumor cells, their circulation in lymph and blood vascular systems, arrest in distant organs, extravasation, and growth into metastatic foci (Herlyn and Malkowicz, 1991;Woodhouse et al., 1997). Ann Chambers et al. (2001),(2002) have demonstrated in murine models that the limiting factor for metastasis formation is growth after extravasation (Figure 1a). Recently, this extravasation model has been challenged by Ruth Muschel and co-workers (Al-Mehdi et al., 2000Wong et al., 2002), who showed that tumor cells can readily proliferate after arrest in blood vessels, suggesting that extravasation is not a prerequisite for metastatic growth (Figure 1b). In a separate series of experiments, Mary Hendrix and co-workers described that tumor cells can even have endothelial cell-like functions and form channels that allow fluid flow (Maniotis et al., 1999Folberg et al., 2000) (Figure 1c). The group has identified some of the players, such as EphA2 and VE-cadherin, on aggressive melanoma cells that are shared with endothelial cells and that are likely involved in ‘vasculogenic mimicry’. Vasculogenic mimicry is the ability of aggressive cancer cells to form de novo vessel-like networks in vitro in the absence of endothelial cells or fibroblasts, concomitant with their expression of vascular-associated cellular marker (Sood et al., 2001,2002). Tumor cell plasticity is demonstrated by the ability of tumor cells to adopt a variety of phenotypes, including an endothelial phenotype (Sood et al., 2001, 2002). These exciting new findings underscore the plasticity of malignant cells from advanced tumor progression stages, and they require from tumor biologists a more dynamic view of the metastatic cascade. If the biological phenotype of metastasis must be portrayed flexibly, then we need a new ‘yardstick,’ a normal cell, to better characterize and understand the many faces of metastasis. We need to understand how the malignant cells exert cooperation from the normal cells. Our central hypothesis is that both normal and malignant cells utilize the same molecules for invasion, but that differences in downstream signaling events allow the tumor cells to dominate over normal cells in the microenvironment. This ‘dominant plasticity’ model of cancer metastasis takes into account the flexible response of malignant cells to microenvironmental pressures while maintaining dominance over the normal parenchymal and stromal cells.

Models of metastasis

Models of metastasis

http://www.nature.com/onc/journal/v22/n42/images/1206757f1.jpg

Models of metastasis. (a) According to Chambers and co-workers, only a very small population of injected cells (2%) form micrometastases, although over 87% are arrested in the liver. Furthermore, not all of the micrometastases persist, and the progressively growing metastases that kill the mice arise only from a small subset (0.02%) of the injected cells. (b) Muschel and co-workers recently proposed a new model for pulmonary metastasis in which endothelium-attached tumor cells that survived the initial apoptotic stimuli proliferate intravascularly. Thus, a principal tenet of this new model is that the extravasation of tumor cells is not a prerequisite for metastatic colony formation and that the initial proliferation takes place within the blood vessels. (c) The unique ability of aggressive tumor cells to generate patterned networks, similar to the patterned networks during embryonic vasculogenesis, and concomitantly to express vascular markers associated with endothelial cells, their precursors and other vascular cells has been termed ‘vasculogenic mimicry’ by Hendrix and co-workers

Read Full Post »

RNAi – On Transcription and Metabolic Control

Writer and Curator: Larry H Bernstein, MD, FCAP


RNAi

This is the third contribution to a series on transcription and metabolic control. It reveals the enormous complexity in this emerging research.


mRNA, small RNAs, long RNAs, RNAi and DicAR

Aberrant mRNA translation in cancer pathogenesis
Pier Paolo Pandolfi
Oncogene (2004) 23, 3134–3137
http://dx.doi.org:/10.1038/sj.onc.1207618

As the molecular processes that control mRNA translation and ribosome biogenesis in the eukaryotic cell are extremely complex and multilayered, their deregulation can in principle occur at multiple levels, leading to both disease and cancer pathogenesis. For a long time, it was speculated that disruption of these processes may participate in tumorigenesis, but this notion was, until recently, solely supported by correlative studies. Strong genetic support is now being accrued, while new molecular links between tumor-suppressive and oncogenic pathways and the control of protein synthetic machinery are being unraveled. The importance of aberrant protein synthesis in tumorigenesis is further underscored by the discovery that compounds such as Rapamycin, known to modulate signaling pathways regulatory of this process, are effective anticancer drugs. A number of fundamental questions remain to be addressed and a number of novel ones emerge as this exciting field evolves.


mRNA Translation and Energy Metabolism in Cancer
I. Topisirovic and N. Sonenberg
Cold Spring Harbor Symposia on Quantitative Biology, Volume LXXVI
http://dx.doi.org:/10.1101/sqb.2011.76.010785

A prominent feature of cancer cells is the use of aerobic glycolysis under conditions in which oxygen levels are sufficient to support energy production in the mitochondria (Jones and Thompson 2009; Cairns et al. 2010). This phenomenon, named the “Warburg effect,” after its discoverer Otto Warburg, is thought to fuel the biosynthetic requirements of the neoplastic growth (Warburg 1956; Koppenol et al. 2011) and has recently been acknowledged as one of the hallmarks of cancer (Hanahan and Weinberg 2011). mRNA translation is the most energy-demanding process in the cell (Buttgereit and Brand 1995).In mammalian cells it consumes >20% of cellular ATP, not considering the energy that is required for the biosynthesis of the components of the translational machinery (e.g., ribosome biogenesis; Buttgereit and Brand 1995). Control of mRNA translation plays a pivotal role in the regulation of gene expression (Sonenberg and Hinnebusch 2009). In fact, a recent study demonstrated that mammalian proteome is mostly governed at the mRNA translation level (Schwanhausser et al. 2011). Malfunction of mRNA translation critically contributes to human disease, including diabetes, heart disease, blood disorders, and, most notably, cancer (Fig. 1; Crozier et al. 2006; Narla and Ebert 2010; Silvera et al. 2010; Spriggs et al. 2010). The first account of changes in the translational apparatus in cancer dates back to 1896, showing enlarged and irregularly shaped nucleoli that are the site of ribosome biogenesis (Pianese 1896). Rapidly proliferating cancer cells have more ribosomes than normal cells.

Figure 1. Dysregulated mRNA translation plays a pivotal role in cancer. Malignant cells are characterized by enlarged nucleoli and a larger number of ribosomes than their normal counterparts. Mutations and/or altered expression of ribosomal proteins (e.g., RPS19, RPS 24), rRNA-modifying enzymes (e.g., dyskerin), translation initiation factors (e.g., eIF4E), or the initiator tRNA (tRNAiMet) result in malignant transformation. Signaling pathways whose dysfunction is frequent in cancer (e.g., MAPK, PI3K/AKT) affect mRNA translation. Perturbations in the translatome result in aberrant cellular growth, proliferation, and survival characteristic of tumorigenesis.


In stark contrast to normal cells, in cancer cells ribosomal biogenesis is uncoupled from cell proliferation (Stanners et al. 1979). Accordingly, cancer cells exhibit abnormally high rates of protein synthesis (Silvera et al. 2010). That ribosomal dysfunction plays a central role in cancer is further corroborated by the findings that genetic alterations, which encompass the components of the ribosome machinery (i.e., “ribosomopathies”), are characterized by elevated cancer risk (Narla and Ebert 2010).

mRNA translation is the most energy-consuming process in the cell and strongly correlates with cellular metabolic activity. Translation and energy metabolism play important roles in homeostatic cell growth and proliferation, and when dysregulated lead to cancer. eIF4E is a key regulator of translation, which promotes oncogenesis by selectively enhancing translation of a subset of tumor-promoting mRNAs (e.g., cyclins and c-myc). PI3K/AKT and mitogen-activated protein kinase (MAPK) pathways, which are strongly implicated in cancer etiology, exert a number of their biological effects by modulating translation. The PI3K/AKT pathway regulates eIF4E function by inactivating the inhibitory 4E-BPs via mTORC1, whereas MAPKs activate MAP kinase signal-integrating kinases 1 and 2, which phosphorylate eIF4E. In addition, AMP-activated protein kinase, which is a central sensor of the cellular energy balance, impairs translation by inhibiting mTORC1. Thus, eIF4E plays a major role in mediating the effects of PI3K/AKT, MAPK, and cellular energetics on mRNA translation.Figure 2. eIF4E is regulated by multiple mechanisms. The expression of eIF4E is regulated by several transcription factors (e.g., c-myc, hnRNPK, p53) and adenine-uracil-rich element binding proteins (i.e., HuR and AUF1). eIF4E is suppressed by 4E-BPs, which are regulated by mTORC1. MAP kinase signal integrating kinases 1 and 2 (MNKs) phosphorylate eIF4E.


Figure 3. Ras/MAPK and PI3K/AKT/mTORC1 regulate the activity of eIF4E. Various stimuli activate phosphoinositide-3-kinase (PI3K) through the receptor tyrosine kinases (RTKs). Upon activation, PI3K converts phosphatidylinositol 4,5-bisphosphate (PIP2) into phosphatidylinositol-3,4,5-triphosphate (PIP3). This reaction is reversed by PTEN. Phosphoinositide-dependent protein kinase 1 (PDK1) and AKT bind to PIP3 via their pleckstrin homology domains, which allows for the phosphorylation and activation of AKT by PDK1. In addition, the mammalian target of rapamycin complex 2 (mTORC2) modulates the activity of AKT by phosphorylating its hydrophobic motif. AKT phosphorylates tuberous sclerosis complex 2 (TSC2) at multiple sites, which results in its inhibition and consequent activation of Ras homolog enriched in brain (Rheb), which is a small GTPase that activates mTORC1. mTORC1 phosphorylates 4E-BPs leading to their dissociation from eIF4E. In addition to the PI3K/AKT pathway, the activity of mTORC1 is regulated by the serine/threonine kinase 11/LKB1/AMP-kinase (LKB1/AMPK) pathway, regulated in development and DNA damage response 1 (REDD1) and Rag GTPases in response to the changes in cellular energy balance, oxygen and amino acid availability, respectively. Ras and the MAPK pathways are activated by various stimuli through receptor tyrosine kinases (RTKs). In addition the MAPK pathway isactivatedthrough theGprotein–coupled receptors(GPCRs) and byproteinkinaseC (PKC;notshown).TheMAPK pathways encompass an initial GTPase-regulated kinase (MAPKKK), which activates an effector kinase (MAPK) via an intermediate kinase (MAPKK). In response to stimuli such as growth factors, hormones, and phorbol-esters, Ras GTPase stimulates Raf kinase (MAPKKK), which activates extracellular signal-regulated kinases 1 and 2 (ERK 1 and 2) via extracellular signal-regulated kinase activator kinases MEK1 and 2 (MAPKK). Cellular stresses, including osmotic shock, inflammatory cytokines, and UV light, activate p38 MAPKs via multiple mechanisms including Rac kinase (MAPKKK) and MKK3 and 6 (MAPKK). p38 MAPK and ERK activate the MAPK signal–integrating kinases 1 and 2 (MNK1/2), which phosphorylate eIF4E. Additional abbreviations are provided in the text.


Cancer Exosomes Perform Cell-Independent MicroRNA Biogenesis and Promote Tumorigenesis
Cancer Cell Nov, 2014; 26: 707–721.
http://dx.doi.org/10.1016/j.ccell.2014.09.005

Breast cancer cells secrete exosomes with specific capacity for cell-independent miRNA biogenesis, while normal cellderivedexosomes lack thisability. Exosomes derivedfrom cancer cellsand serum frompatients withbreast cancer contain the RISC loading complex proteins, Dicer, TRBP, and AGO2, which process pre-miRNAs into mature miRNAs. Cancer exosomes alter the transcriptome of target cells in a Dicer-dependent manner, which stimulate nontumorigenic epithelial cells to form tumors.This study identifies a mechanism whereby cancer cells impart an oncogenic field effect by manipulating the surrounding cells via exosomes. Presence of Dicer in exosomes may serve as biomarker for detection of cancer.


Dicers at RISC. The Mechanism of RNAi

Marcel Tijsterman and Ronald H.A. Plasterk
Cell, Apr 2014; 117:1–4

Figure 1. Model for RNA Silencing in Drosophila In an ordered biochemical pathway, miRNAs (left panel) and siRNAs (right panel) are processed from double-stranded precursor molecules by Dcr-1and Dcr-2, respectively, and stay attached to Dicer-containing complexes, which assemble into RISC. The degree of complementarity between the RNA silencing molecule (in red) and its cognate target determines the fate of the mRNA: blocked translation or immediate destruction.

Argonaute2 Cleaves the Anti-Guide Strand of siRNA during RISC Activation
Cell 2005; 123:621-629
http://www.cell.com/cgi/content/full/123/4/621/DC1/
Dicing and slicing- The core machinery of the RNA interference pathway
Scott C Hammond
FEBS Letters 579 (2005) 5822–5829
http://dx.doi.org:/10.1016/j.febslet.2005.08.079

Fig. 1. Domain organization of RNaseIII gene family. Three classes of RNaseIII genes are shown. The PAZ domain in Dm-Dicer-2 contains mutations in several residues required for RNA binding and may not be functional.

Fig. 2. Model for Dicer catalysis. The PAZ domain binds the 2 nt 30 overhang of a dsRNA terminus. The RNaseIII domains form a pseudo-dimer. Each domain hydrolyzes one strand of the substrate. The binding site of the dsRBD is not defined. The function of the helicase domain is not known.

Fig. 3. Biogenesis pathway of microRNAs. MicroRNA genes are transcribed by RNA polymerase II. The primary transcript is referred to as ‘‘primicroRNA’’. Drosha processing occurs in the nucleus. The resulting precursor, ‘‘pre-microRNA’’, is exported to the cytoplasm for Dicer processing. In a coordinated manner, the mature microRNA is transferred to RISC and unwound by a helicase. mRNA targets that duplex in the Slicer scissile site are cleaved and degraded, if the microRNA is loaded into an Ago2 RISC. Mismatched targets are translationally suppressed. All Ago family members are believed to function in translational suppression.

Fig. 4. Model for Slicer catalysis. The siRNA guide strand is bound at the 50 end by the PIWI domain and at the 30 end by the PAZ domain. The 50 phosphate is coordinated by conserved basic residues. mRNA targets are initially bound by the seed region of the siRNA and pairing is extended to the 30 end. The RNaseH fold hydrolyzes the target in a cation dependent manner. Slicer cleavage is measured from the 50 end of the siRNA. Product is released by an unknown mechanism and the enzyme recycles.


RNA interference (RNAi) is a biological process in which RNA molecules inhibit gene expression, typically by causing the destruction of specific mRNA molecules. Historically, it was known by other names, including co-suppression, post transcriptional gene silencing (PTGS), and quelling. Only after these apparently unrelated processes were fully understood did it become clear that they all described the RNAi phenomenon. Andrew Fire and Craig C. Mello shared the 2006 Nobel Prize in Physiology or Medicine for their work on RNA interference in the nematode worm Caenorhabditis elegans, which they published in 1998.


Two types of small ribonucleic acid (RNA) molecules – microRNA (miRNA) and small interfering RNA (siRNA) – are central to RNA interference. RNAs are the direct products of genes, and these small RNAs can bind to other specific messenger RNA (mRNA) molecules and either increase or decrease their activity, for example by preventing an mRNA from producing a protein. RNA interference has an important role in defending cells against parasitic nucleotide sequences – viruses and transposons. It also influences development.


The RNAi pathway is found in many eukaryotes, including animals, and is initiated by the enzyme Dicer, which cleaves long double-stranded RNA (dsRNA) molecules into short double stranded fragments of ~20 nucleotide siRNAs. Each siRNA is unwound into two single-stranded RNAs (ssRNAs), the passenger strand and the guide strand. The passenger strand is degraded and the guide strand is incorporated into the RNA-induced silencing complex (RISC). The most well-studied outcome is post-transcriptional gene silencing, which occurs when the guide strand pairs with a complementary sequence in a messenger RNA molecule and induces cleavage by Argonaute, the catalytic component of the RISC complex. In some organisms, this process spreads systemically, despite the initially limited molar concentrations of siRNA.
http://en.wikipedia.org/wiki/RNA_interference


http://upload.wikimedia.org/wikipedia/commons/thumb/e/e4/ShRNA_Lentivirus.svg/481px-ShRNA_Lentivirus.svg.png


http://www.frontiersin.org/files/Articles/66078/fnmol-06-00040-HTML/image_m/fnmol-06-00040-g001.jpg
http://dx.doi.org:/10.3389/fnmol.2013.00040

The enzyme dicer trims double stranded RNA, to form small interfering RNA or microRNA. These processed RNAs are incorporated into the RNA-induced silencing.
MiRNA biogenesis and function. (A) The canonical miRNA biogenesis pathway is Drosha- and Dicer-dependent. It begins with RNA Pol II-mediated transcription..


Dicer Promotes Transcription Termination

Dicer Promotes Transcription Termination

Dicer Promotes Transcription Termination at Sites of Replication Stress to Maintain Genome Stability
Cell Oct 2014; 159(3): 572–583
http://dx.doi.org/10.1016/j.cell.2014.09.031

http://www.cell.com/cms/attachment/2019646604/2039684570/fx1.jpg


18-13 miRNA- protein complex ap-chap-18-pp-42-728

18-13 miRNA- protein complex ap-chap-18-pp-42-728

18-13 miRNA- protein complex (a) Primary miRNA transcript Translation blocked Hydrogen bond (b) Generation and function of miRNAs Hairpin miRNA miRNA Dicer …

http://image.slidesharecdn.com/ap-chap-18-pp-1229097198123780-1/95/ap-chap-18-pp-42-728.jpg?cb=1229090143


Identification and characterization of small RNAs involved in RNA silencing
FEBS Letters 579 (2005) 5830–5840
http://dx.doi.org:/10.1016/j.febslet.2005.08.009

Fig. 1. Small RNA cloning procedure. Outline of the small RNA cloning procedure. RNA is dephosphorylated (step 1) for joining the 30 adapter by T4 RNA ligase 1 in the presence of ATP (step 2). The use of a chemically adenylated adapter and truncated form of T4 RNA ligase 2 (Rnl2) allows eliminating the dephosphorylation step (step 4). If the RNA was dephosphorylated, it is re-phosphorylated (step 3) prior to 50 adapter ligation with T4 RNA ligase 1 and ATP (step 5). After 50 adapter ligation, a standard reverse transcription is performed (step 6). Alternatively, after 30 adapter ligation, the RNA is used directly for reverse transcription simultaneously with 50 adaptor joining (step 7). In this case, the property of reverse transcriptase to add non-templated cytidine residues at the 50 end of synthesized DNA is used to facilitate template switch of the reverse transcriptase to the 30 guanosine residues of the 50 adapter (SMART technology, Invitrogen). Abbreviations: P and OH indicate phosphate and hydroxyl ends of the RNA; App indicates 50 chemically adenylated adapter; L, 30 blocking group; CIP, calf alkaline phosphatase and PNK, polynucleotide kinase.


Transcriptional regulatory functions of nuclear long noncoding RNAs
Trends in Genetics, Aug 2014; 30(8):348-356
http://dx.doi.org/10.1016/j.tig.2014.06.001

Cis-acting lncRNAEnhancer-associated lncRNAIntergenic lncRNA

lncRNA

Promoter-associated lncRNA

Proximity transfer

Trans-acting lncRNA


Functional interactions among microRNAs and long noncoding RNAs
Sem Cell Dev Biol 2014; 34:9-14
http://dx.doi.org/10.1016/j.semcdb.2014.05.015
Genome-wide application of RNAi to the discovery of potential drug targets
FEBS Letters 579 (2005) 5988–599
http://dx.doi.org://10.1016/j.febslet.2005.08.015

Fig. 1. Schematic representation of gene silencing by an shRNA-expression vector. The shRNA is processed by Dicer. The processed siRNA enters the RNA-induced silencing complex (RISC), where it targets mRNA for degradation.

Fig. 2. Schematic representation of a transcription system for production of siRNA

Fig. 3. (A) Schematic representation of the proposed siRNA-expression system. Three or four C to U or A to G mutations are introduced into the sense strand. (B) Schematic representation of the discovery of a novel gene using an siRNA library.


Imperfect centered miRNA binding sites are common and can mediate repression of target mRNAs
Martin et al. Genome Biology 2014, 15:R51 http://genomebiology.com/2014/15/3/R51


Table 1 Number of inferred targets for each miRNA tested

miRNA Probes Transcripts Genes
miR-10a 2,206 5,963 1,887
miR-10a-iso 1,648 1,468 4,211
miR-10b 1,588 3,940 1,365
miR-10b-iso 963 2,235 889
miR-17-5p 1,223 2,862 1,137
miR-17-5p-iso 1,656 3,731 1,461
miR-182 2,261 6,423 2,008
miR-182-iso 1,569 4,316 1,444
miR-23b 2,248 5,383 1,990
miR-27a 2,334 5,310 2,069

Probes: number of probes significantly enriched in pull-downs compared to controls (5% FDR). Transcripts: number of transcripts to which those probes map exactly. Genes: number of genes from which those transcripts originate

Figure 2 Biotin pull-downs identify bone fide miRNA targets. (A) Volcano plot showing the significance of the difference in expression between the miR-17-5p pull-down and the mock-transfected control, for all transcripts expressed in HEK293T cells. Both targets predicted by TargetScan or validated previously via luciferase assay were significantly enriched in the pull-down compared to the controls. (B) Results from luciferase assays on previously untested targets predicted using TargetScan and uncovered using the biotin pull-down. The plot indicates mean luciferase activity from either the empty plasmid or from pMIR containing a miRNA binding site in the 3′ UTR, relative to a negative control. Asterisks indicate a significant reduction in luciferase activity (one-sided t-test; P<0.05) and error bars the standard error of the mean over three replicates. (C-E) Targets identified through PAR-CLIP or through miRNA over-expression studies show greater enrichment in the pull-down. Cumulative distribution of log fold-change in the pull-down for transcripts identified as targets by the indicated miRNA over-expression study or not. Red, canonical transcripts found to be miR-17-5p targets in the indicated study (Table S5 in Additional file 1); black, all other canonical transcripts; p, one-sided P-value from Kolmogorov-Smirnov test for a difference in distributions. (F) To confirm that our results were dependent on RISC association, cells were transfected with either single or double-stranded synthetic miRNAs, then subjected to AGO2 immunoprecipitation. The biotin pull-down was performed in the AGO2-enriched and AGO2-depleted fractions. (G-H) Quantitative RT-PCR revealed that, with double-stranded (ds) miRNA (G), four out of five known targets were enriched relative to input mRNA (*P≤0.05, **P<0.01, ***P<0.001) in the AGO2-enriched but not in the AGO2-depleted fractions, but this enrichment was not seen for the cells transfected with a single-stranded (ss) miRNA (H). The numbers on the x-axis correspond to those in Figure 2F. Error bars represent the standard error of mean (sem).

Figure 5 IsomiRs and canonical miRNAs target many of the same transcripts.

Hammerhead ribozymes in therapeutic target discovery and validation
Drug Disc Today 2009; 14(15/16): 776-783
http://dx.doi.org/10.1016/j.drudis.2009.05.003

Figure 1. Features of hammerhead ribozymes. A generic diagram of a hammerhead ribozyme bound to its target substrate: NUH is the cleavage triplet on target sequence, stems I and III are sites of the specific interactions between ribozyme and target, stem II is the structural element connecting separate parts of the catalytic core. Arrows represent the cleavage site, numbering system according to Hertel et al. [60].

hammerhead ribozyme

hammerhead ribozyme

https://www-ssrl.slac.stanford.edu/research/highlights_archive/ribozyme_fig1.jpg


Figure 1  Schematic (A) and ribbon (B) diagrams depicting the crystal structure of the full-length hammerhead ribozyme. The sequence and secondary structure


TABLE 1 Typical examples of successful applications of hammerhead ribozymes. Most of the data are derived from [10] and [11], the others are expressly specified.

  • Growth factors, receptors, transduction elements
  • Oncogenes, protoncogenes, fusion genes
  • Apoptosis, survival factors, drug resistance
  • Transcription factors
  • Extracellular matrix, matrix modulating factors
  • Circulating factors
  • Viral genome, viral genes

Figure 2.Target–ribozyme interactions. (a) As cheme of ribozyme binding to full substrate. The calculated energy of this binding ensures the formation of a stable complex. At the denaturating temperature, Tm, will allow this complex to survive to biological conditions. Conversely, after cleavage, binding energies calculated on single, (b) and (c), ribozyme arms are very low and no longer stable. These properties will ensure both the efficient release of cleavage fragments and the prevention of binding to unrelated targets. RNAs complementary to one binding arm only will not be bound or cleaved by the hammerhead catalytic sequence.

Figure 3. ‘Chemical omics’ approach. According to this target discovery strategy: (1) a first round of ‘omic’ study (proteomic, genomic, metabolomic, …) will enable the discovery of a set of (2) putative markers. A series of hammerhead ribozymes will then be prepared in order to target each marker. (4) A second ‘omic’ study round will be performed on (3) knocked down samples obtained after ribozymes administration. (5) A new series of markers will then be produced. An expanding analytical process of this type may be further repeated. Finally, a robust bioinformatic algorithm will make it possible to connect the different markers and draw new hypothetical links and pathways.


miRNA

ADAR Enzyme and miRNA Story
Sara Tomaselli, Barbara Bonamassa, Anna Alisi, et al.
Int. J. Mol. Sci. 2013, 14, 22796-22816;
http://dx.doi.org:/10.3390/ijms141122796

Adenosine deaminase acting on RNA (ADAR) enzymes convert adenosine (A) to inosine (I) in double-stranded (ds) RNAs. Since Inosine is read as Guanosine, the biological consequence of ADAR enzyme activity is an A/G conversion within RNA molecules. A-to-I editing events can occur on both coding and non-coding RNAs, including microRNAs (miRNAs), which are small regulatory RNAs of ~20–23 nucleotides that regulate several cell processes by annealing to target mRNAs and inhibiting their translation. Both miRNA precursors and mature miRNAs undergo A-to-I RNA editing, affecting the miRNA maturation process and activity. ADARs can also edit 3′ UTR of mRNAs, further increasing the interplay between mRNA targets and miRNAs. In this review, we provide a general overview of the ADAR enzymes and their mechanisms of action as well as miRNA processing and function. We then review the more recent findings about the impact of ADAR-mediated activity on the miRNA pathway in terms of biogenesis, target recognition, and gene expression regulation.

Figure 1. Structure of ADAR family proteins: ADAR1, ADAR2, and ADAR3. The ADAR enzymes contain a C-terminal conserved catalytic deaminase domain (DM), two or three dsRBDs in the N-terminal portion. ADAR1 full-length protein also contains a N-terminal Zα domain with a nuclear export signal (NES) and a Zβ domain, while ADAR3 has a  R-domain. A nuclear localization signal is also indicated.


Comprehensive modeling of microRNA targets predicts functional non-conserved and non-canonical sites
Doron Betel, Anjali Koppal, Phaedra Agius, Chris Sander, Christina Leslie
Genome Biology 2010, 11:R90 http://genomebiology.com/2010/11/8/R90

microRNAs are a class of small regulatory RNAs that are involved in post-transcriptional gene silencing. These small (approximately 22 nucleotide) single-strand RNAs guide a gene silencing complex to an mRNA by complementary base pairing, mostly at the 3′ untranslated region (3′ UTR). The association of the RNAinduced silencing complex (RISC) to the conjugate mRNA results in silencing the gene either by translational repression or by degradation of the mRNA. Reliable microRNA target prediction is an important and still unsolved computational challenge, hampered both by insufficient knowledge of microRNA biology as well as the limited number of experimentally validated targets.

mirSVR is a new machine learning method for ranking microRNA target sites by a down-regulation score. The algorithm trains a regression model on sequence and contextual features extracted from miRanda-predicted target sites. In a large-scale evaluation, miRanda-mirSVR is competitive with other target prediction methods in identifying target genes and predicting the extent of their downregulation at the mRNA or protein levels. Importantly, the method identifies a significant number of experimentally determined non-canonical and non-conserved sites.
Human RISC – MicroRNA Biogenesis and Posttranscriptional Gene Silencing
Cell 2005; 123:631-640
http://dx.doi.org:/10.1016/j.cell.2005.10.022
Development of microRNA therapeutics
Eva van Rooij & Sakari Kauppinen
EMBO Mol Med (2014) 6: 851–864
http://dx.doi.org:/10.15252/emmm.20110089

MicroRNAs (miRNAs) play key regulatory roles in diverse biological processes and are frequently dysregulated in human diseases. Thus, miRNAs have emerged as a class of promising targets for therapeutic intervention. Here, we describe the current strategies for therapeutic modulation of miRNAs and provide an update on the development of miRNA-based therapeutics for the treatment of cancer, cardiovascular disease and hepatitis C virus (HCV) infection.

Figure 1. miRNA biogenesis and modulation of miRNA activity by miRNA mimics and antimiR oligonucleotides. MiRNA genes are transcribed by RNA polymerase II from intergenic, intronic or polycistronic loci to long primary miRNA transcripts (pri-miRNAs) and processed in the nucleus by the Drosha–DGCR8 complex to approximately 70 nt pre-miRNA hairpin structures. The most common alternative miRNA biogenesis pathway involves short intronic hairpins, termed mirtrons, that are spliced and debranched to form pre-miRNA hairpins. Pre-miRNAs are exported into the cytoplasm and then cleaved by the Dicer–TRBP complex to imperfect miRNA: miRNA* duplexes about 22 nucleotides in length. In the cytoplasm, miRNA duplexes are incorporated into Argonaute-containing miRNA induced silencing complex (miRISC), followed by unwinding of the duplex and retention of the mature miRNA strand in miRISC, while the complementary strand is released and degraded. The mature miRNA functions as a guide molecule for miRISC by directing it to partially complementary sites in the target mRNAs, resulting in translational repression and/or mRNA degradation. Currently, two strategies are employed to modulate miRNA activity: restoring the function of a miRNA using double-stranded miRNA mimics, and inhibition of miRNA function using single-stranded anti-miR oligonucleotides.

Figure 2. Design of chemically modified miRNA modulators. (A) Structures of chemical modifications used in miRNA modulators. A number of different sugar modifications are used to increase the duplex melting temperature (Tm) of anti-miR oligonucleotides. The20-O-methyl(20-O-Me), 20-O-methoxyethyl(20-MOE )and 20-fluoro(20-F) nucleotides are modified at the 20 position of the sugar moiety, whereas locked nucleic acid (LNA) is a bicyclic RNA analogue in which the ribose is locked in a C30-endo conformation by introduction of a 20-O,40-C methylene bridge. To increase nuclease resistance and enhance the pharmacokinetic properties, most anti-miR oligonucleotides harbor phosphorothioate (PS) backbone linkages, in which sulfur replaces one of the non-bridging oxygen atoms in the phosphate group. In morpholino oligomers, a six-membered morpholine ring replaces the sugar moiety. Morpholinos are uncharged and exhibit a slight increase in binding affinity to their cognate miRNAs. PNA oligomers are uncharged oligonucleotide analogues, in which the sugar–phosphate backbone has been replaced by a peptide-like backbone consisting of N-(2-aminoethyl)-glycine units. (B) An example of a synthetic double-stranded miRNA mimic described in this review. One way to therapeutically mimic a miRNA is by using synthetic RNA duplexes that harbor chemical modifications for improved stability and cellular uptake. In such constructs, the antisense (guide) strand is identical to the miRNA of interest, while the sense (passenger) strand is modified and can be linked to a molecule, such as cholesterol, for enhanced cellular uptake. The sense strand contains chemical modifications to prevent mi-RISC loading. Several mismatches can be introduced to prevent this strand from functioning as an anti-miR, while it is further left unmodified to ensure rapid degradation.The20-F modification helps to protect the antisense strand against exonucleases, hence making the guide strand more stable, while it does not interfere with mi-RISC loading. (C) Design of chemically modified anti-miR oligonucleotides described in this review. Antagomirs are30 cholesterol-conjugated,20-O-Me oligonucleotides fully complementary to the mature miRNA sequence with several PS moieties to increase their in vivo stability. The use of unconjugated 20-F/MOE-, 20-MOE- or LNA-modified anti-miR oligonucleotides harboring a complete PS backbone represents another approach for inhibition of miRNA function in vivo. The high duplex melting temperature of LNA-modified oligonucleotides allows efficient miRNA inhibition using truncated, high-affinity 15–16-nucleotide LNA/DNA anti-miR oligonucleotides targeting the 50 region of the mature miRNA. Furthermore, the high binding affinity of fully LNA-modified 8-mer PS oligonucleotides, designated as tiny LNAs, facilitates simultaneous inhibition of entire miRNA seed families by targeting the shared seed sequence.

Human MicroRNA Targets
Bino John, Anton J. Enright, Alexei Aravin, Thomas Tuschl,.., Debora S. Mark
PLoS Biol 2004; 2(11): e363  http://www.plosbiology.org

More than ten years after the discovery of the first miRNA gene, lin-4 (Chalfie et al. 1981; Lee et al. 1993), we know that miRNA genes constitute about 1%–2% of the known genes in eukaryotes. Investigation of miRNA expression combined with genetic and molecular studies in Caenorhabditis elegans, Drosophila melanogaster, and Arabidopsis thaliana have identified the biological functions of several miRNAs (recent review, Bartel 2004). In C. elegans, lin-4 and let-7 were first discovered as key regulators of developmental timing in early larval developmental transitions (Ambros 2000; Abrahante et al. 2003; Lin et al. 2003; Vella et al. 2004). More recently lsy-6 was shown to determine the left–right asymmetry of chemoreceptor expression (Johnston and Hobert 2003). In D. melanogaster, miR-14 has a role in apoptosis and fat metabolism (Xu et al. 2003) and the bantam miRNA targets the gene hid involved in apoptosis and growth control (Brennecke et al. 2003).

MicroRNAs (miRNAs) interact with target mRNAs at specific sites to induce cleavage of the message or inhibit translation. The specific function of most mammalian miRNAs is unknown. We have predicted target sites on the 39 untranslated regions of human gene transcripts for all currently known 218 mammalian miRNAs to facilitate focused experiments. We report about 2,000 human genes with miRNA target sites conserved in mammals and about 250 human genes conserved as targets between mammals and fish. The prediction algorithm optimizes sequence complementarity using position-specific rules and relies on strict requirements of interspecies conservation. Experimental support for the validity of the method comes from known targets and from strong enrichment of predicted targets in mRNAs associated with the fragile X mental retardation protein in mammals. This is consistent with the hypothesis that miRNAs act as sequence-specific adaptors in the interaction of ribonuclear particles with translationally regulated messages. Overrepresented groups of targets include mRNAs coding for transcription factors, components of the miRNA machinery, and other proteins involved in translational regulation, as well as components of the ubiquitin machinery, representing novel feedback loops in gene regulation. Detailed information about target genes, target processes, and open-source software for target prediction (miRanda) is available at http://www.microrna.org. Our analysis suggests that miRNA genes, which are about 1% of all human genes, regulate protein production for 10% or more of all human genes.

Figure 1. Target Prediction Pipeline for miRNA Targets in Vertebrates The mammalian (human, mouse, and rat) and fish (zebra and fugu) 39 UTRs were first scanned for miRNA target sites using position specific rules of sequence complementarity. Next, aligned UTRs of orthologous genes were used to check for conservation of miRNA– target relationships (‘‘target conservation’’) between mammalian genomes and, separately, between fish genomes. The main results (bottom) are the conserved mammalian and conserved fish targets, for each miRNA,as well as a smaller set of super-conserved vertebrate targets.   http://dx.doi.org:/10.1371/journal.pbio.0020363.g00
Figure 2. Distribution of Transcripts with Cooperativity of Target Sites and Estimated Number of False Positives Each bar reflects the number of human transcripts with a given number of target sites on their UTR. Estimated rate of false positives(e.g., 39%for2 targets) is given by the number of target sites predicted using shuffled miRNAs processed in a way identical to real miRNAs, including the use of interspecies conservation filter. http://dx.doi.org:/10.1371/journal.pbio.0020363.g002

Conserved Seed Pairing, Often improved an-Flanked by Adenosines, Indicates Thousands of Human Genes are MicroRNA Targets
Cell, Jan 2005; 120: 15–20
http://dx.doi.org:/10.1016/j.cell.2004.12.035

Integrated analysis of microRNA and mRNA expression. adding biological significance to microRNA target predictions.
Maarten van Iterson, Sander Bervoets, Emile J. de Meijer, et al.
Nucleic Acids Research, 2013; 41(15), e146
http://dx.doi.org:/10.1093/nar/gkt525

Current microRNA target predictions are based on sequence information and empirically derived rules but do not make use of the expression of microRNAs and their targets. This study aimed to improve microRNA target predictions in a given biological context, using in silico predictions, microRNA and mRNA expression. We used target prediction tools to produce lists of predicted targets and used a gene set test designed to detect consistent effects of microRNAs on the joint expression of multiple targets. In a single test, association between microRNA expression and target gene set expression as well as the contribution of the individual target genes on the association are determined. The strongest negatively associated mRNAs as measured by the test were prioritized. We applied our integration method to a well-defined muscle differentiation model. Validation of our predictions in C2C12 cells confirmed predicted targets of known as well as novel muscle-related microRNAs. We further studied associations between microRNA–mRNA pairs in human prostate cancer, finding some pairs that have been recently experimentally validated by others. Using the same study, we showed the advantages of the global test over Pearson correlation and lasso. We conclude that our integrated approach successfully identifies regulated microRNAs and their targets.

Long non-coding RNA and microRNAs might act in regulating the expression of BARD1 mRNAs
Int J Biol & Cell Biol 2014; 54:356-367
http://dx.doi.org/10.1016/j.biocel.2014.06.018


Passenger-Strand Cleavage Facilitates Assembly of siRNA into Ago2-Containing RNAi Enzyme Complexes
Cell 2006; 123:607-620
http://dx.doi.org:/10.1016/j.cell.2006.08.044


RNAi- RISC Gets Loaded
Cell 2005; 123:543-553
http://dx.doi.org:/10.1016/j.cell.2005.11.006
RNAi- The Nuts and Bolts of the RISC Machine
Cell 2005; 122:17-20
http://dx.doi.org:/10.1016/j.cell.2005.06.023
Structural domains in RNAi
FEBS Letters 579 (2005) 5841–5849
http://dx.doi.org:/10.1016/j.febslet.2005.07.072

Fig. 1. A ‘‘Domain-centric’’ view of RNAi. (A) The conserved pathways of RNA silencing. The domain structure of each protein in (hypothetical) interaction with its RNA is shown. For clarity, the second column lists domains in order N- to C-terminal. Figures are not to scale. In brief, Drosha, an RNase III enzyme, and its obligate binding partner, Pasha recognize pri-mRNA loops, and cut these into 70 nt hairpin pre-miRNAs. Dicer utilizes a PAZ domain to sense the 30 2-nt overhang created, and further processes these, and dsRNAs into miRNAs and siRNAs. Argonaute binds the 50 end of guide RNAs via its PIWI domain, and the 30 end via a PAZ domain, yielding RISCs that effect RNA silencing through several mechanisms. A Viral protein, VP19 can suppress RNA silencing by sequestering siRNAs. (B) A summary of known siRNA structural biology. Listed by domain are solved structures, their protein/organism of origin, and ligands, where applicable. Also shown are PDB codes.

Fig. 2. Novel modes of RNA recognition. (A) A typical dsRBD: Xenopus binding protein A (1DI2). A RNA helix is modeled pink, and the protein is rendered in transparent electrostatic contours (blue is basic, red acidic). Note the interaction of helices along the major groove, and the position of helix 1. A second dsRBD protein is visible, in the lower right. (B) A dsRBD, Saccharomyces Rnt1P (1T4L), recognizes hairpin loops. A novel third helix (top) pushes helix one into the loop of a hairpin RNA. (C) 30-OH recognition by PAZ. Human Eif2c1 (1SI3) bound to RNA (pink) is shown. PAZ is green, with transparent electrostatic surface plot. The OB-fold (nucleotide binding fold) and the insertion domain are labeled. Note the glove-and-thumb like cleft they form, that the 30-OH is inserted into. A basic groove (blue) the RNA binds along outside the cleft is visible. (D) A close-up view of PAZ, as in C (surface not-transparent, slightly rotated). See white arrows for orientation, and location of 30-OH binding site. RNA is shown red in sticks. The terminal –OH is barely visible, buried in a cleft. It and the carbon it bonds have been colored yellow for clarity. (E) The PIWI domain (2BGG). Note the insertion of the 50P red (labeled) into the binding site. Its complimentary strand (pink) is not annealed to it, and the 30 overhang and first complimentary bases sit on the protein surface. (F) An enlarged view of (E), with protein in slate and RNA modeled as red sticks. The coordinated magnesium is a grey sphere, which is coordinated by the terminal carboxylate of the protein, protein side chains, and RNA phosphate oxygens. The 50 base stacks against a conserved Tyr. Several other sidechain contacts are shown.

Fig. 3. Argonaute/RISC. (A) P. furiosus Argonaute (PDB 1Z26). A color-guided key to the domains is presented. PAZ sits over the PIWI/N/MID bowl and active site. The liganding atoms for the catalytic metal are depicted as yellow balls for clarity. The tungstate binding site (50P surrogate) is shown as tan spheres. (B) A guide strand channel. Looking down from the PAZ domain towards the active site, Z-sections are clipped off. Colors of domains are as in the key in (A). Wrapping down along a basic cleft from the PAZ 30OH binding site (approximate position labeled), a RNA binding groove passes the active site (yellow), and runs down to the 50P binding site (tan balls). A second cleft running perpendicular to this one at its entry may accommodate target strand RNA. For more detail, and models of siRNA placed into the grooves, see [27,29].

Fig. 4. VP19 sequestration of siRNA. (A) CIRV VP19 (1RPU, RNA removed). Two monomers (blue and cyan) form an 8 strand, concave b-sheet with bracketing helices at the ends. (B) Tombus viral VP19 bound to siRNA (1 monomer shown). RNA strands are modeled as sticks, with one strand pink and one red. The bracketing helix places two tryptophans in position to stack over the terminal RNA bases. On the b-sheet surface, and Arg and a Lys interact with the phosphate backbone, and at the center of the RNA binding surface, a number of Ser and Thr mediate an extensive hydrogen bond network. Both the Trp brackets and RNA binding by an extended b-sheet are unique.


Small RNA asymmetry in RNAi- Function in RISC assembly and gene regulation
FEBS Letters 579 (2005) 5850–5857
http://dx.doi.org:/10.1016/j.febslet.2005.08.071


The role of the oncofetal IGF2 mRNA-binding protein 3 (IGF2BP3) in cancer
Seminars in Cancer Biol 2014; 29:3-12
http://dx.doi.org/10.1016/j.semcancer.2014.07.006

Table 1 – Target mRNAs of IGF2BP3.

Target cis-Element Regulation
CD44 3’ -utr Control of mRNA stability
IGF2 5’ -utr Translational control
H19 ncRNA Unknown
ACTB 3’ -utr Unknown
MYC CRD Unknown
CD164 Unknown Control of mRNA stability
MMP9 Unknown Control of mRNA stability
ABCG2 Unknown Unknown
PDPN 3’ -utr Control of mRNA stability
HMGA2 3’ -utr Protection from miR directed degradation
CCND1 3’ -utr translational control
CCND3 3’ -utr translational control
CCNG1 3’ -utr translationalcontrol


Targeting glucose uptake with siRNA-based nanomedicine for cancer therapy
Biomaterials 2015; 51:1-11
http://dx.doi.org/10.1016/j.biomaterials.2015.01.068
The therapeutic potential of RNA interference
FEBS Letters 579 (2005) 5996–6007
http://dx.doi.og:/10.1016/j.febslet.2005.08.004

Table 1 Companies developing RNAi therapeutics that includes cancer

Company name Primary areas of interest
Atugen AG Metabolic disease; cancer ocular disease; skin disease
Benitec Australia Limited Hepatitis C virus; HIV/AIDS; cancer; diabetes/obesity
Calando Pharmaceuticals Nanoparticle technology
Genta Incorporated Cancer
Intradigm Corporation Cancer; SARS; arthritis
Sirna Therapeutics, Inc. AMD; Hepatitis C virus; asthma; diabetes; cancer; Huntington s disease; hearing loss


The Noncoding RNA Revolution—Trashing Old Rules to Forge New Ones
Cell 2014; 157:77-94
http://dx.doi.org/10.1016/j.cell.2014.03.008

Figure 1. Noncoding RNAs Function in Diverse Contexts Noncoding RNAs function in all domains of life, regulating gene expression from transcription to splicing to translation and contributing to genome organization and stability. Self-splicing RNAs, ribosomes, and riboswitches function in both eukaryotes and bacteria. Archaea (not shown) also utilize ncRNA systems including ribosomes, riboswitches, snoRNPs, and CRISPR. Orange strands, ncRNA performing the action indicated; red strands, the RNA acted upon by the ncRNA. Blue strands, DNA. Triangle, small-molecule metabolite bound by a riboswitch. Ovals indicate protein components of an RNP, such as the spliceosome (white oval), ribosome (two purple subunits), or other RNPs (yellow ovals). Because of the importance of RNA structure in these ncRNAs, some structures are shown but they are not meant to be realistic.


miRNAs and cancer targeting

Table 1 of targets

miRNA Cancer type reference
NA GI cancer Current status of miRNA-targeting therapeutics and preclinical studies against gastroenterological carcinoma
NA Renal cell Differential expression profiling of microRNAs and their potential involvement in renal cell carcinoma pathogenesis
NA urothelial
cancer
A microRNA expression ratio defining the invasive phenotype in bladder tumors
miR-31 breast A Pleiotropically Acting MicroRNA, miR-31, inhibits breast cancer growth
miR-512-3p NSCLC Inhibition of RAC1-GEF DOCK3 by miR-512-3p contributes to suppression of metastasis in non-small cell lung cancer
miR-495 gastric Methylation-associated silencing of miR-495 inhibit the migration and invasion of human gastric cancer cells
microRNA-218 prostate microRNA-218 inhibits prostate cancer cell growth and promotes apoptosis by repressing TPD52 expression
MicroRNA-373 cervical cancer MicroRNA-373 functions as an oncogene and targets YOD1 gene in cervical cancer
miR-25 NSCLC miR-25 modulates NSCLC cell radio-sensitivity – inhibiting BTG2 expression
miR-92a cervical cancer miR-92a. upregulated in cervical cancer & promotes cell proliferation and invasion by targeting FBXW7
MiR-153 NSCLC MiR-153 inhibits migration and invasion of human non-small-cell lung cancer by targeting ADAM19
miR-203 melanoma miR-203 inhibits melanoma invasive and proliferative abilities by targeting the polycomb group gene BMI1
miR-204-5p Papillary thyroid miR-204-5p suppresses cell proliferation by inhibiting IGFBP5 in papillary thyroid carcinoma
miR-342-3p Hepato-cellular miR-342-3p affects hepatocellular carcinoma cell proliferation via regulating NF-κB pathway
miR-1271 NSCLC miR-1271 promotes non-small-cell lung cancer cell proliferation and invasion via targeting HOXA5
miR-203 pancreas Pancreatic cancer derived exosomes regulate the expression of TLR4 in dendritic cells via miR-203
miR-203 metastatic SCC Rewiring of an Epithelial Differentiation Factor, miR-203, to Inhibit Human SCC Metastasis
miR-204 RCC TRPM3 and miR-204 Establish a Regulatory Circuit that Controls Oncogenic Autophagy in Clear Cell Renal Cell Carcinoma
NA urologic MicroRNAs and cancer. Current and future perspectives in urologic oncology
NA RCC MicroRNAs and their target gene networks in renal cell carcinoma
NA osteoSA MicroRNAs in osteosarcoma
NA urologic MicroRNA in Prostate, Bladder, and Kidney Cancer
NA urologic Micro-RNA profiling in kidney and bladder cancers


Current status of miRNA-targeting therapeutics and preclinical studies against gastroenterological carcinoma
Shibata et al. Molecular and Cellular Therapies 2013, 1:5 http://www.molcelltherapies.com/content/1/1/5

Differential expression profiling of microRNAs and their potential involvement in renal cell carcinoma pathogenesis
Clinical Biochemistry 43 (2010) 150–158
http://dx.doi.org:/10.1016/j.clinbiochem.2009.07.020

A microRNA expression ratio defining the invasive phenotype in bladder tumors
Urologic Oncology: Seminars and Original Investigations 28 (2010) 39–48
http://dx.doi.org:/10.1016/j.urolonc.2008.06.006

A Pleiotropically Acting MicroRNA, miR-31, inhibits breast cancer growth
Cell 137, 1032–1046, June 12, 2009
http://dx.doi.org:/10.1016/j.cell.2009.03.047

Inhibition of RAC1-GEF DOCK3 by miR-512-3p contributes to suppression of metastasis in non-small cell lung cancer
Intl JBiochem & Cell Biol 2015; 61:103-114
http://dx.doi.org/10.1016/j.biocel.2015.02.005

Methylation-associated silencing of miR-495 inhibit the migration and invasion of human gastric cancer cells by directly targeting PRL-3
Biochem Biochem Res Commun 2014; 456:344-350
http://dx.doi.org/10.1016/j.bbrc.2014.11.083

microRNA-218 inhibits prostate cancer cell growth and promotes apoptosis by repressing TPD52 expression
Biochem Biophys Res Commun 2015; 456:804-809
http://dx.doi.org/10.1016/j.bbrc.2014.12.026

MicroRNA-373 functions as an oncogene and targets YOD1 gene in cervical cancer
BBRC 2015; xx:1-6
http://dx.doi.org/10.1016/j.bbrc.2015.02.138

miR-25 modulates NSCLC cell radio-sensitivity – inhibiting BTG2 expression
BBRC 2015; 457:235-241
http://dx.doi.org/10.1016/j.bbrc.2014.12.094

miR-92a. upregulated in cervical cancer & promotes cell proliferation and invasion by targeting FBXW7
BBRC 2015; 458:63-69
http://dx.doi.org/10.1016/j.bbrc.2015.01.066

MiR-153 inhibits migration and invasion of human non-small-cell lung cancer by targeting ADAM19
BBRC 2015; 456:381-385
http://dx.doi.org/10.1016/j.bbrc.2014.11.093

miR-203 inhibits melanoma invasive and proliferative abilities by targeting the polycomb group gene BMI1
BBMC 2015; 456: 361-366
http://dx.doi.org/10.1016/j.bbrc.2014.11.087

miR-204-5p suppresses cell proliferation by inhibiting IGFBP5 in papillary thyroid carcinoma
BBRC 2015; 457:621-627
http://dx.doi.org/10.1016/j.bbrc.2015.01.037

miR-342-3p affects hepatocellular carcinoma cell proliferation via regulating NF-κB pathway
BBRC 2015; 457:370-377
http://dx.doi.org/10.1016/j.bbrc.2014.12.119

miR-1271 promotes non-small-cell lung cancer cell proliferation and invasion via targeting HOXA5
BBRC 2015; 458:714-719
http://dx.doi.org/10.1016/j.bbrc.2015.02.033

Pancreatic cancer derived exosomes regulate the expression of TLR4 in dendritic cells via miR-203
Cell Immunol 2014; 292:65-69
http://dx.doi.org/10.1016/j.cellimm.2014.09.004

Rewiring of an Epithelial Differentiation Factor, miR-203, to Inhibit Human Squamous Cell Carcinoma Metastasis
Cell Reports 2014; 9:104-117
http://dx.doi.org/10.1016/j.celrep.2014.08.062

TRPM3 and miR-204 Establish a Regulatory Circuit that Controls Oncogenic Autophagy in Clear Cell Renal Cell Carcinoma
Cancer Cell Nov 10, 2014; 26: 738–753
http://dx.doi.org/10.1016/j.ccell.2014.09.015

MicroRNA in Prostate, Bladder, and Kidney Cancer
Eur Urol 2011; 59:671-681
http://dx.doi.org/10.1016/j.eururo.2011.01.044

Micro-RNA profiling in kidney and bladder cancers
Urologic Oncology: Seminars and Original Investigations 2007; 25:387–392
http://dx.doi.org:/10.1016/j.urolonc.2007.01.019

MicroRNAs and cancer. Current and future perspectives in urologic oncology
Urologic Oncology: Seminars and Original Investigations 2010; 28:4–13
http://dx.doi.org:/10.1016/j.urolonc.2008.10.021

MicroRNAs and their target gene networks in renal cell carcinoma
BBRC 2011; 405:153-156
http://dx.doi.org/10.1016/j.bbrc.2011.01.019

MicroRNAs in osteosarcoma
Clin Chim Acta 2015; 444:9-17
http://dx.doi.org/10.1016/j.cca.2015.01.025


Table 2. miRNA cancer therapeutics


  • miRNA and mRNA cancer signatures determined by analysis of expression levels in large cohorts of patients
    | PNAS | Nov 19, 2013; 110(47): 19160–19165
    http://www.pnas.org/cgi/doi/10.1073/pnas.1316991110The study of mRNA and microRNA (miRNA) expression profiles of cells and tissue has become a major tool for therapeutic development. The results of such experiments are expected to change the methods used in the diagnosis and prognosis of disease. We introduce surprisal analysis, an information-theoretic approach grounded in thermodynamics, to compactly transform the information acquired from microarray studies into applicable knowledge about the cancer phenotypic state. The analysis of mRNA and miRNA expression data from ovarian serous carcinoma, prostate adenocarcinoma, breast invasive carcinoma, and lung adenocarcinoma cancer patients and organ specific control patients identifies cancer-specific signatures. We experimentally examine these signatures and their respective networks as possible therapeutic targets for cancer in single cell experiments.


RNA editing is vital to provide the RNA and protein complexity to regulate the gene expression. Correct RNA editing maintains the cell function and organism development. Imbalance of the RNA editing machinery may lead to diseases and cancers. Recently,RNA editing has been recognized as a target for drug discovery although few studies targeting RNA editing for disease and cancer therapy were reported in the field of natural products. Therefore, RNA  editing may be a potential target for therapeutic natural products


Aberrant microRNA (miRNA) expression is implicated in tumorigenesis. The underlying mechanisms are unclear because the regulations of each miRNA on potentially hundreds of mRNAs are sample specific.


We describe a novel approach to infer Probabilistic Mi RNA–mRNA  Interaction Signature (‘ProMISe’) from a single pair of miRNA–mRNA expression profile. Our model considers mRNA and miRNA competition as a probabilistic function of the expressed seeds (matches). To demonstrate ProMISe, we extensively exploited The Cancer Genome Atlas data. As a target predictor, ProMISe identifies more confidence/validated targets than other methods. Importantly, ProMISe confers higher cancer diagnostic power than using expression profiles alone.

Gene set enrichment analysis on averaged ProMISe uniquely revealed respective target enrichments of oncomirs miR-21 and 145 in glioblastoma and ovarian cancers. Moreover, comparing matched breast (BRCA) and thyroid (THCA) tumor/normal samples uncovered thousands of tumor-related interactions. For example, ProMISe– BRCA network involves miR-155/183/21, which exhibits higher ProMISe coupled with coherently higher miRNA expression and lower target expression; oncomirs miR-221/222 in the ProMISe–THCA network engage with many downregulated target genes. Together, our probabilistic approach of integrating expression and sequence scores establishes a functional link between the aberrant miRNA and mRNA expression, which was previously under-appreciated due to the methodological differences.


Read Full Post »

2.0 Genomics and Epigenetics: Genetic Errors and Methodologies – Cancer and Other Diseases

Writer and Curator: Larry H Bernstein, MD, FCAP

This is the second article in a series concerning genomic expression, The first of which was concerned with the expanded technologies in use for study of genomic expression.  This portion will also cover more of genetic errors as well as methodologies, but not all examples are in the realm of cancer.

I shall start with a New York Times editorial on July 24, 2015 by Angelina Jolie Pitt on her experience with BRCA1 gene and her family history.  It is very instructive on how she worked through her experience.

http://www.nytimes.com/2015/03/24/opinion/angelina-jolie-pitt-diary-of-a-surgery.html?

Two years ago she was found to have a positive test for BRCA1, carrying an 87 percent risk for breast cancer and a 50 percent risk for ovarian cancer.  At that time she had a preventive mastectomy.  The decision was not easy, but it also brought into consideration that her mother and grandmother both died of breast cancer.  She did not have an oophorectomy at that time because on considering the advice of medical experts, she would have been left with no estrogen support. She wanted to delay her early vegetative senescence.  She has reached the age of 39 years and on the advice of medical expert opinion, she proceeded with salpingo-oophorectomy, at age 39 years, a decade before  her  mother had developed cancer.  But her delay was to allow her to recover and adjust emotionally to her ongoing situation, with a remaining risk for ovarian cancer.

She tested negative for CA-1251-5 at this time prior to surgery. But the CA-125 test could well be negative with early onset ovarian cancer. It may be considered a better test for following treatment than for early diagnosis. Her choice was to sacrifice early menopause to the ability to live through her childrens’ childhood development.  This was a well thought out decision.  In addition, there were abnormal inflammatory markers that were not specific for cancer rsik, but were worth taking into account.  The procedure itself was simpler than the mastectomy.

23op-ed-thumbStandard

http://static01.nyt.com/images/2015/03/23/opinion/23op-ed/23op-ed-master315.jpg

2.1  CA-125 and Ovarian Cancer

2.1.1  lmmunoradiometric Assay of CA 125 in Effusions: Comparison with Carcinoembryonic Antigen

Marguerite M. Pinto, MD,‘ Larry H. Bernstein, MD,* Dennis A. Brogan, MPH, MT

and Elaine Criscuolo, CT(ASCP) CMIACS

The levels of CA 125 antigen were measured in 167 effusions from 150 patients using radioimmunoassay, and the results compared with the levels of carcinoembryonic antigen (CEA) in the fluids. The results indicate that an elevated fluid CA 125 level (>14,000 U/ml-68,000 U/ml) and a negative fluid CEA level (4 ng/ml) is suggestive of serous and endometrioid carcinoma of ovary, and adenocarcinoma of the endometrium and fallopian tube. Alternatively, an elevated fluid CEA level (14 ng/ml-600 ng/ml) and a negative CA 125 level (20-5000 U/ml) is seen in metastatic carcinomas of breast, lung, gastrointestinal tract, and mucinous ystadenocarcinoma. Lymphomas, melanomas, and benign effusions are negative for both antigens. The combined use of CEA and CA 125 antigen in fluids is useful in the differential diagnosis of adenocarcinoma of unknown primary. Cancer 59:218-222, 1987.

2.1.2 CA-125 in fine-needle aspirates of solid tumors: comparison with cytologic diagnosis and carcinoembryonic antigen (CEA) assay.

Marguerite M. Pinto, S Kotta

Diagnostic Cytopathology 03/1996; 14(2):121-5.
http://dx.doi.org:/10.1002/(SICI)1097-0339(199603)14:2<121::AID-DC4>3.0.CO;2-M

One hundred and twenty-two fine needle aspirates (FNA) from female patients were studied to determine whether CA-125 assay contributed to cytologic diagnosis and CEA assay. Cytologic examination was done on Papanicolaou-stained smears and cell blocks, CEA by EIA (Abbott Laboratory, > 5 ng/ml cutoff) and CA-125 by RIA (Abbott Laboratory, North Chicago, IL, > 66 mu/ml cutoff). Final diagnosis were correlated with histologic diagnosis when available, clinical, radiologic studies, and follow-up. Results: 29 benign, 93 malignant. Sensitivities and specificities: cytology, 91%, 100%; CEA: 59%, 86%; CA-125, 50%, 55%. CEA plus cytology sensitivity, 97%. CA-125 content was highest in endometrial/ovarian carcinoma (39,899 mu/ml) and < 5,000 mu/ml in other tumors and benign FNA in contrast to CEA which showed highest levels in carcinomas of colon, pancreas, and lung (> 280 ng/ml). While elevated CEA enhances the sensitivity of cytologic diagnosis of carcinomas of the colon, pancreas, and lung, low CEA and high CA-125 content supports an ovarian/endometrial primary.

2.1.3  Diagnostic efficiency of carcinoembryonic antigen and CA125 in the cytological evaluation of effusions.

Pinto MM, Bernstein LH, Rudolph RA, Brogan DA, Rosman M.
Arch Pathol Lab Med. 1992 Jun; 116(6):626-31.

In our previous study, the combination of the concentrations of carcinoembryonic antigen (CEA) and CA125 and the findings from cytological examination in 189 benign and malignant pleural and peritoneal effusions was useful in the diagnosis/classification of malignant effusions. Sensitivity of CEA (level, greater than 5 ng/mL) was 68%; specificity was 99% for the diagnosis of malignant effusions secondary to carcinoma of the lung, breast, gastrointestinal tract, and mucinous carcinoma of the ovary. Sensitivity of CA125 (level, greater than 5000 U/mL) was 85%; specificity was 96% for the diagnosis of malignant effusions in carcinoma of the ovary, fallopian tube, and endometrium. We now expanded the study to include 840 pleural and peritoneal effusions (benign, n = 520; malignant, n = 320) and analyzed the data by the statistical method of Rudolph and colleagues. Based on new cutoff values, ie, CEA level at 6.3 ng/mL and CA125 level at 3652 U/mL, the sensitivities for detection of malignant effusions secondary to carcinomas of the lung, breast, and gastrointestinal tract and mucinous carcinoma of the ovary varied between 75% and 100%; specificity was 98%. Sensitivity of CA125 for detection of malignant effusions from müllerian epithelial carcinoma was 71%; specificity was 99%. The elevated CEA fluid level alone helped to diagnose malignant effusions of the gastrointestinal tract in 54%, breast in 19%, and lung in 16%. The high CA125 fluid level was predictive of müllerian epithelial carcinoma. Adjunctive use of CEA and CA125 levels in fluid enhances the sensitivity of cytological diagnosis and may be predictive of the primary site in patients who present with carcinoma of an unknown primary source.

2.2 Carcinoembryonic antigen in diagnostics

2.2.1 Carcinoembryonic antigen content in fine needle aspirates of the lung. A diagnostic adjunct to cytology.

Pinto MM1, Ha DJ.
Acta Cytol. 1992 May-Jun; 36(3):277-82

Carcinoembryonic Antigen (CEA) was measured in 59 consecutive fine needle aspirates (FNAs) of the lung from 58 patients to determine if the CEA content would enhance the sensitivity of the cytologic diagnosis. Twenty-eight males and 30 females with tumors 1-40 cm in diameter were studied. Final diagnoses were correlated with the clinical history, radiologic studies, tissue (when available) and follow-up. Image-guided FNAs were performed by radiologists using a 22-gauge Chiba needle and 20-mL syringe with one to four passes per specimen. Cytologic examination included rapid assessment in the radiology suite and a final diagnosis in 24 hours. CEA was measured by enzyme immunoassay using monoclonal antibody. Nine benign aspirates and 50 malignant aspirates were diagnosed. The sensitivity of cytology was 86% and specificity, 100%. Using 5 ng/mL as the cutoff, the sensitivity of CEA for malignant aspirates was 50% and specificity, 90%. The combined sensitivity of CEA and cytology was 95%. The mean CEA in malignant aspirates was 131 ng/mL and in benign aspirates, 2.41. The highest mean CEA was seen in adenocarcinoma, 402.6 ng/mL. Lower CEA content was seen in epidermoid carcinoma (58.6 ng/mL), large cell carcinoma (8.09), oat cell carcinoma, metastatic carcinoma of the kidney and breast, thymoma and lymphoma (each less than 1 ng/mL). Elevated CEA alone was diagnostic in two aspirates of bronchioloalveolar carcinoma; carcinoma with an unknown primary source, three; and large cell carcinoma, one. The adjunctive use of CEA in FNAs of the lung enhances the sensitivity of the cytologic diagnosis.

2.2.2  Relationship between serum CA125 half life and survival in ovarian cancer

Table
Gupta and Lis Journal of Ovarian Research 2009 2:13
http://dx.doi.org:/10.1186/1757-2215-2-13

First Author, Year, Study Place Data Collection Study
Design
Sample
Size
RR/HR, (95% CI),
P-Value
Riedinger JM, 2006, France 1988 to
1996
R 553 2.04 (1.58-2.63), < 0.0001
Gadducci A, 2004, Italy 1996 to2002 R 71 3.11 (1.22-7.98), 0.0181
Munstedt K, 1997, Germany 1987 to1994 R 85 0.6184
Gadducci A, 1995, Italy 1986 to1992 R 225 2.13 (1.23-3.68), 0.0073
Rosman M, 1994, Connecticut 1985 to
1989
R 51 3.6 (1.8-7.4), < 0.001
Yedema C A, 1993, Netherlands 1984 to
1990
R 60 9.17 (1.49-56.3), 0.01
Hawkins RE, 1989, London NA P 29 3.7 (0.7-20.1), 0.001;27.8 (4.0-193), 0.001

1CA125 half-life was independent prognostic indicator for survival
2FIGO stage, tumor grade, residual disease, CA125
http://www.ovarianresearch.com/content/2/1/13/table/T6

3.3.0      DNA double strand breaks

2.3.1.  Collaboration and competition – DNA double-strand break repair pathways

Kass EM, Jasin M
FEBS Letters 2010; 584:3703-3708
http://dx.doi.org:/jfebslet.2010.07.057

DNA double-strand breaks occur in replication and exogenous sources pose risk to genome stability. There are two pathways to repair.  They are non-homologous end joining and homologous recombination. Both pathways cooperate and compete at double-strand break sites.

2.3.2 DNA Double-Strand Break Repair Inhibitors as Cancer Therapeutics

Srivastava M, Rashavan SC
Chem & Biol 2015 Jan; pp17-29
http://dx.doi.org:/10.1016/jchembiol.2014.11.013

Homologous recombination and non-homologous end joining are the two major repair pathways expressed in eukaryotes.  For double-strand breaks, and the DSB repair gene is vulnerable to chemotherapy and radiation therapy, accounting for treatment resistance. Therefore, targeting DSB repair is attractive. Blocking the residual repair using inhibitors can potentiate treatment.

2.3.3  Animation published in DNA Repair: Helleday T, Lo J, van Gent DC, Engelward BP. DNA double-strand break repair: From mechanistic understanding to cancer treatment. DNA Repair. (14 Mar 2007)
2.3.3.1 http://web.mit.edu/engelward-lab/animations/DSBR.html

2.3.3.2 https://www.youtube.com/watch?v=eg8rpYFsqCA

2.3.4 Homology-dependent double strand break repair. Oxford Academic (Oxford University Press)

https://www.youtube.com/watch?v=86JCMM5kb2A

2.4.0 Managing DNA data sets

2.4.1 Bionimbus –  a cloud for managing, analyzing and sharing large genomics datasets

The Bionimbus Protected Data Cloud (PDC) is a collaboration between the Open Science Data Cloud (OSDC) and the IGSB (IGSB,) the Center for Research Informatics (CRI), the Institute for Translational Medicine (ITM), and the University of Chicago Comprehensive Cancer Center (UCCCC). The PDC allows users authorized by NIH to compute over human genomic data from dbGaP in a secure compliant fashion. Currently, selected datasets from the The Cancer Genome Atlas (TCGA) are available in the PDC.

https://bionimbus-pdc.opensciencedatacloud.org/

2.4.1.2 Accounting for uncertainty in DNA sequencing data

O’Rawe JA, Ferson S, Lyon GJ
Trends in Genetics 2015 Feb; 31(2):61-66
http://dx.doi.org:/10.101/jtig.2014.12.002

This article reviews uncertainty in quantification in DNA sequency applications and sources of error propagation, and it proposes methods to account for errors and uncertainties.

2.5.0 Linking Traits to Mechanisms and UPR response/proteostasis

2.5.1 Stress-Independent Activation of XBP1s and/or ATF6 Reveals –Three Linking traits based on their shared molecular mechanisms

Shoulders MD, Ryno LM, Genereux JC,…Wiseman BL
Cell Reports 2013 Apr; 3, pp 1279-1292
http://dx.doi.org:/10.1016/j.celrep.2013.03.024

The unfolded protein response (UPR) maintains ER proteostasis through the transcription factors XP1s and ATF6. This study measured orthogonal small molecule-mediated activation of transcription factors nXP1s and/or ATF6 using transcriptomics and quantitative proteomics. The finding is that three ER proteostasis environmants differentially influence

  1. Folding
  2. Traffiking, and
  3. Degradation of destabilized ER client proteins

Without affecting endogenous proteome. The proteostasis network is remodeled with the potential for selective restoration of the aberrant ER proteostasis.

2.5.2 Biological and chemical approaches to diseases of proteostasis deficiency.

Powers ET, Morimoto RI, Dillin A, Kelly JW, Balch WE
Annu Rev Biochem. 2009; 78:959-91.
http://dx.doi.org:/10.1146/annurev.biochem.052308.114844

Many diseases appear to be caused by the misregulation of protein maintenance. Such diseases of protein homeostasis, or “proteostasis,” include loss-of-function diseases (cystic fibrosis) and gain-of-toxic-function diseases (Alzheimer’s, Parkinson’s, and Huntington’s disease). Proteostasis is maintained by the proteostasis network, which comprises pathways that control protein synthesis, folding, trafficking, aggregation, disaggregation, and degradation. The decreased ability of the proteostasis network to cope with inherited misfolding-prone proteins, aging, and/or metabolic/environmental stress appears to trigger or exacerbate proteostasis diseases. Herein, we review recent evidence supporting the principle that proteostasis is influenced both by an adjustable proteostasis network capacity and protein folding energetics, which together determine the balance between folding efficiency, misfolding, protein degradation, and aggregation. We review how small molecules can enhance proteostasis by binding to and stabilizing specific proteins (pharmacologic chaperones) or by increasing the proteostasis network capacity (proteostasis regulators). We propose that such therapeutic strategies, including combination therapies, represent a new approach for treating a range of diverse human maladies.

2.5.3 Extracellular Chaperones and Proteostasis

Amy R. Wyatt, Justin J. Yerbury, Heath Ecroyd, and Mark R. Wilson
Annual Review of Biochemistry 2013 Jun; 82: 295-322
http://dx.doi.org:/10.1146/annurev-biochem-072711-163904

There exists a family of currently untreatable, serious human diseases that arise from the inappropriate misfolding and aggregation of extracellular proteins. At present our understanding of mechanisms that operate to maintain proteostasis in extracellular body fluids is limited, but it has significantly advanced with the discovery of a small but growing family of constitutively secreted extracellular chaperones. The available evidence strongly suggests that these chaperones act as both sensors and disposal mediators of misfolded proteins in extracellular fluids, thereby normally protecting us from disease pathologies. It is critically important to further increase our understanding of the mechanisms that operate to effect extracellular proteostasis, as this is essential knowledge upon which to base the development of effective therapies for some of the world’s most debilitating, costly, and intractable diseases.

http://www.proteostasis.com/our-technology/proteostasis-network.html

proteostasis model

http://www.proteostasis.com/images/stories/technology/illustration1.gif

2.6.0 Transcription

2.6.1 Looping Back to Leap Forward. Transcription Enters a New Era

Levine M, Cattoglio C, Tijan R
Cell 2014 Mar; 157: 13-22.
http://dx.doi.org:/10.1016/j.cell.2014.02.009

Organism complexity is not in gene number, but lies in gene regulation. The human genbome contains hundreds of thousands of enhancers, and genes are embedded in a milieu of enhancers . Proliferation of cis-regulatory DNAs is accompanied by complexity and functional diversity of transcription machinery recognizing distal enhancers and promotors, and high-order spatial organization. This article reviews the dynamic communication of remote enhancers with target promoters.

2.6.2 Activating gene expression in mammalian cells with promoter-targeted duplex RNAs.

Janowski BA, Younger ST, Hardy DB, Ram R, Huffman KE, Corey DR.
Nat Chem Biol. 2007 Mar; 3(3):166-73
http://dx.doi.org:/10.1038/nchembio860

The ability to selectively activate or inhibit gene expression is fundamental to understanding complex cellular systems and developing therapeutics. Recent studies have demonstrated that duplex RNAs complementary to promoters within chromosomal DNA are potent gene silencing agents in mammalian cells. Here we report that chromosome-targeted RNAs also activate gene expression. We have identified multiple duplex RNAs complementary to the progesterone receptor (PR) promoter that increase expression of PR protein and RNA after transfection into cultured T47D or MCF7 human breast cancer cells. Upregulation of PR protein reduced expression of the downstream gene encoding cyclooygenase 2 but did not change concentrations of estrogen receptor, which demonstrates that activating RNAs can predictably manipulate physiologically relevant cellular pathways. Activation decreased over time and was sequence specific. Chromatin immunoprecipitation assays indicated that activation is accompanied by reduced acetylation at histones H3K9 and H3K14 and by increased di- and trimethylation at histone H3K4. These data show that, like proteins, hormones and small molecules, small duplex RNAs interact at promoters and can activate or repress gene expression.
2.6.3 Tight control of gene expression in mammalian cells by tetracycline-responsive promoters.

M Gossen and H Bujard
Proc Natl Acad Sci U S A. 1992 Jun 15; 89(12): 5547–5551.

Control elements of the tetracycline-resistance operon encoded in Tn10 of Escherichia coli have been utilized to establish a highly efficient regulatory system in mammalian cells. By fusing the tet repressor with the activating domain of virion protein 16 of herpes simplex virus, a tetracycline-controlled transactivator (tTA) was generated that is constitutively expressed in HeLa cells. This transactivator stimulates transcription from a minimal promoter sequence derived from the human cytomegalovirus promoter IE combined with tet operator sequences. Upon integration of a luciferase gene controlled by a tTA-dependent promoter into a tTA-producing HeLa cell line, high levels of luciferase expression were monitored. These activities are sensitive to tetracycline. Depending on the concentration of the antibiotic in the culture medium (0-1 microgram/ml), the luciferase activity can be regulated over up to five orders of magnitude. Thus, the system not only allows differential control of the activity of an individual gene in mammalian cells but also is suitable for creation of “on/off” situations for such genes in a reversible way.

Diagrams of two regulatable gene expression systems.

Diagrams of two regulatable gene expression systems.

http://www.intechopen.com/source/html/16788/media/image5.jpeg

schematic-representation-of-transgenic-mouse-breeding-scheme-h2b-gfp-mice-should-not-express-gfp-in-the-absence-of-a-tetracycline-regulatable-transactivator

schematic-representation-of-transgenic-mouse-breeding-scheme-h2b-gfp-mice-should-not-express-gfp-in-the-absence-of-a-tetracycline-regulatable-transactivator

http://openi.nlm.nih.gov/imgs/512/321/2408727/2408727_pone.0002357.g001.png

2.7.0 Epigenetics and Cancer

2.7.1 Epigenetics and cancer metabolism

Johnson C, Warmoes MO, Shen X, Locasale JW
Cancer Letters 2015;  356:309-314.
http://dx.doi.org:/10.1016/j.canlet.2013.09.043

Cancer is characterized by adaptive metabolic changes for proliferation and survival of the neoplastic cell, which is accompanied by dysfunctional metabolic enzyme changes in a specific nutrient supplied environment. The oncogenic change uses epigenetic level enzymes that catalyze posttranslational modifications of the DNA/histone expression with metabolites including cofactors and substrates for reactions. This interaction of epigenetics and metabolism provides new insights for anti-cancer therapy.

2.7.2 Cancer Epigenetics. From Mechanism to Therapy

Dawson MA, Konzarides T
Cell 2012 Jul; 150:12-27
http://dx.doi.org:/10.1016/j.cell.2012.06.013

Carcinogenesis requires all of the following:

  • DNA methylation
  • Histone modification
  • Nucleosome remodeling
  • RNA mediated targeting

This article reviews basic principles of epigenetic pathways that are dysregulated in carcinogenesis.

2.7.4 A subway review of cancer pathways

Hahn WC, Weinberg RA
Nature Reviews: Cancer
http://www.nature.com/nrc/poster/subpathways/index.html

Cancer arises from the stepwise accumulation of genetic changes that confer upon an incipient neoplastic cell the properties of unlimited, self-sufficient growth and resistance to normal homeostatic regulatory mechanisms. Advances in human genetics and molecular and cellular biology have identified a collection of cell phenotypes � the main destinations in the subway map below � that are required for malignant transformation1. Specific molecular pathways (subway lines) are responsible for programming these behaviours. Although the connections between cancer-cell wiring and function remain incompletely explored and specified � hence the many lines under construction � the broad outlines of the molecular circuitry of the cancer cell can now be sketched. Further advances in understanding these pathways and their interconnections will accelerate the development of molecularly targeted therapies that promise to change the practice of oncology.

cancer subway map

cancer subway map

http://www.nature.com/nrc/poster/subpathways/images/map.gif

Subway map designed by Claudia Bentley.

Read Full Post »

New methods for Study of Cellular Replication, Growth, and Regulation

Writer and Curator: Larry H Bernstein, MD, FCAP

Introduction:

This article is the first in a series on genomics, epigenomics and cancer.  It is necessary here to introduce the large advancement in the technological advances that have followed the Human Genome Project and its thrust into the domain of genome expression.  While the genome is the code that is passed on from generation to generation in a family chain, and while there now is an ability to trace genes that have existed and are traceable by evolutionary history to early eukaryotic species, that portion of the cell line is defining and only modified in time.  It is only a beginning in the unraveling of the question – What is life?

This article has the following structure:

1.1.1       Gene Amplification

1.1.2       Protein-binding Receptors

1.1.3 Advanced Proteomic Technologies for Cancer Biomarker Discoveries

1.1.3.1 State of the art technologies

1.1.3.1.1 2D difference gel electrophoresis (2DIGE)

1.1.3.1.2 MALDI imaging technology (see also 1.1.5)

1.1.3.1.3 Electron Transfer Dissociation

1.1.3.1.4 Reverse-phase Protein Array (RPA)

1.1.3.2 Principles of Protein Microarrays

1.1.3.3 Disposable reagentless electrochemical immunosensor array based on a polymer/sol/gel membrane for simultaneous measurement of several tumor markers

1.1.4 p16INK4a Expression Correlates with Degree of Cervical Neoplasia: A Comparison with Ki-67 Expression and Detection of High-Risk HPV Types

1.1.5 Quantitative real-time detection of magnetic nanoparticles by their nonlinear magnetization

1.1.6 Proteomics and biomarkers

1.1.6.1 Identification by proteomic analysis of calreticulin as a marker for bladder cancer and evaluation of the diagnostic accuracy of its detection in urine

1.1.6.2 Multiplexed proteomic analysis of oxidation and concentrations of CSF proteins in Alzheimer’s disease

1.1.6.3 The Brain Injury Biomarker VLP-1 Is Increased in the Cerebrospinal Fluid of Alzheimer Disease Patients

1.1.6.4 Determination of non-α1-antichymotrypsin-complexed PSA as an indirect measurement of free PSA: analytical performance and diagnostic accuracy

1.1.6.5 Ultrasensitive densitometry detection of cytokines with nanoparticle-modified aptamers

1.1.6.6 Protein profiling of microdissected pancreas carcinoma and identification of HSP27 as a potential serum marker

1.1.7 Mass Spectrometry Methods

1.1.7.1 LC-MS/MS quantification of Zn-α2 glycoprotein: A potential serum biomarker for prostate cancer

1.1.7.2 A novel, high-throughput workflow for discovery and identification of serum carrier protein-bound peptide biomarker candidates in ovarian cancer samples

1.1.7.3 Mass Spectrometry-based hepcidin measurements in serum and urine: analytical aspects and clinical implications

1.1.7.4 Current state and future directions of neurochemical biomarkers for Alzheimer’s disease

1.1.7.5 Use of SELDI-TOF mass spectrometry for identification of new biomarkers: potential and limitations

1.1.1 Gene Amplification

An increase in the number of copies of a gene. There may also be an increase in the RNA and protein made from that gene. Gene amplification is common in cancer cells, and some amplified genes may cause cancer cells to grow or become resistant to anticancer drugs. Genes may also be amplified in the laboratory for research purposes.

http://www.cancer.gov/dictionary?cdrid=650175

Actinin-4 gene Amplification in Ovarian Cancer: A Candidate Oncogene Associated with Poor Patient Prognosis and Tumor Chemoresistance

Yamamoto S, Tsuda H, Kazufumi H, Onozato K, …, Matsubar O

Medscape 6/18/2009

http://medscape.com/viewarticle/704105

Actinin-4, an isoform of non-muscular α-actinin, enhances cell motility by bundling the actin cytoskeleton. We previously reported a prognostic implication of high histochemical expression of actinin-4 protein in ovarian cancers.  Chromosomal gain or amplification of the 19q 12-q13 region has been reported in ovarian cancer. We hypothesized that the actinin-4 (ACTN4) gene might be a target of the 19q 12-q13 amplicon and play an essential role in ovarian cancer progression. In total, we investigated 136 advanced-stage ovarian cancers the copy number of the ACTN4 gene on chromosome 19q3, and used fluorescence in situ hybridization to determine the correlation of the ACTN4 copy number with actinin-4 protein immunoreactivity and major clinicopathological factors. We detected a higher copy number ( > 4) of  of the ACTN4 gene in 29 (21%) cases and it was associated with the intensity of the actinin-4 immunoreactivity (p < 0.0001), a high histological tumor grade (p < 0.030), a clear-cell adenocarcinoma histology (p = 0.012), resistancxe to first- line chemotherapies (p = 0.028), and poor patient outcome (p=0.0011). Uni-
variate analyses using the Cox regression model showed that a higher ACTN4 gene copy numberwas predicted patient outcome more accurately than high actinin-4 immunoreactivity (relative risk: 2.48 vs 1.55). Multivariate analysis indicated that a higher copy number of the ACTN4 gene may be a targetof the 19q amplicon, acting as a candidate oncogene, and serve as a predictor of poor outcome and tumor chemoresistance in patients with advanced-stage ovarian cancers (from Modern Pathology).

1.1.2       Protein-binding Receptors

Customizing the Targeting of IGF-1 Receptor

Renato Baserga
Medscape 5/6/2009. From Future Oncology
http://medscape.com/viewarticle/589011

The type 1 IGF receptor (IGF—IR) is activated by two ligands, IGF-1 and IGF-2, and by insulin at supraphysiological concentrations. It plays a significant role in the growth of normal and abnormal cells, and antibodies against the IGF-IR are now in clinical trials. Targeting of the IGF-IR in cancer cells (by antibodies or other means) can be improved by the appropriate selection of responsive tumors.

The prominence of IGF-IR has increased considerably in the past few years, progressing from a redundant insulin receptor to one that is important in cell and body growth, cell survival and malignant transformation. The IGF-IR can send either a mitogenic or a differentiation signal depending on substrate availability. In many cell types (fibroblasts, epithelial cells, etc.) the IGF-IR sends an unambiguous mitogenic, antiapoptotic signal. In other cell types, such as myeloid cells, neuronal cells and others, activation of IGF-IR induces differentiation. When cells do not express or express very low levels of IRS-1, a substrate of both the IGF_IR and the insulin receptor (InR), IGF-1 induces differentiation. This is the case with 32D myeloid precursor cells that do’t express IRS-1 and are induced to differentiate by IGF-1. Ectopic expression of IRS-1 in 32D cells abrogates differentiation; the cells become transformed and even form tumors in mice. IRS-1 activates the P13K pathway, which is the main mitogenic pathway originating from the IGF-IR. However, the shc-Ras-ERKs pathway also plays a role in the mitogenic signal of the IGF-IR, with the two converging at GSK3-β. The demonstration that knockout mouse embryo cells for the IGF-IR receptor were refractory to transformation by viruses, oncogenes and overexpressed growth factor receptors clearly demonstrated the major role played by the IGF-IR in cellular transformation.

Methods for Targeting the IGF-1 Receptor

·        The original methods for targeting the IGF-1 receptor in experimental animals were antisense strategies and dominant-negative mutants of the receptor. They are obsolete.
·        Several antibodies to the IGF-IR are effective in inhibiting tumor growth in vitro and in mice. They are now in Phase I clinical trials.
·        Other investigators have identified specific inhibitors of the IGF-1 receptor tyrosine kinase activity. (cyclolignans)
·        To induce apoptosis, it is probably necessary to downregulate the receptor. Without downregulation, there is inhibition of growth, but no apoptosis.
·        Targeting the ligands gives good results in mice, but fails in humans. Adult mice express only IGF-1, but humans keep synthesizing both IGF-1 and IGF-2 in adult life.

Summary of IRS-1

·        Insulin receptor substrate (IRS-1) is a multitask protein that interacts with many other proteins.·        IRS-1 is mitogenic, inhibits differentiation, protects from apoptosis and regulates cell (and body size).·        IRS-1 is essential to mitogenic IGF-IR signaling.

·        IRS-1 is activated by the EGF receptor, cMet and the Ewing’s sarcoma oncogene.

·        IRS-1 plays a significant role in transformation by T antigen and v-src.

·        Doenregulation of IRS-1 causes growth arrest and differentiation.

·        Nuclear IRS-1 acts as a transcriptional cofactor for both RNA pol 1 and 2-directed genes.

·        IRS-1 effects on cells can be dissociated from the effects of IGF-IR, IRS-2 and insulin receptor.

·        IRS-1 is a biomarker of sensitivity of cancer cells to IGF-IR targeting.

·        Hypothesis: IRS-1 is an antitumor suppressor, similar to anti-p53 protein.


The ability of IRS-1 to cause cell transformation, and the tendency to lose the transformed phenotype in cells in which IRS-1 is low or has been downregulated, suggests that the importance of the IGF-IR in cancer may be dependent on IRS-1 as much as on the receptor itself. When IRS-1 is activated directly, for instance by v-src, the IGF-IR is no longer a requiremeny for malignant transformation.  Metastases are very susceptible to IGF-IR therapy.

IGF-IR Targeting Summary

  • In the absence of IRS-1, the IGF1R sends a differentiation signal, which becomes mitogenic with IRS1 expression, and targeting IGF1R in cells that do not express IRS-1 may be counterproductive.
  • In colon cancer liver metastases the cancer cells of awash in IGF-1.
  • In Ewing’s sarcoma, a tumor sensitive to IGF1r targeting in clinical trials, there is an autocrine mechanism that may make the cancer cells IGF-1 dependent, but an oncogene/IRS-1 interaction may also make these cells incapable of switching to other growth factors.
  • IGF-1R sends a potent anti-apoptotic signal, independent of its mitogenicity. This property could be exploited to increase chemo- or radio- toxicity.
  • IGF-1R expression is required for anchorage independence.

1.1.3 Advanced Proteomic Technologies for Cancer Biomarker Discoveries

1.1.3.1 State of the art technologies

Wong SCC, Chan CML, Ma BBY,…,Chan ATC.

Medscape 6/10/2009. From Expert Review of Proteomics.
http://medscape.com/viewarticle/703566

Proteomic technologies have experienced major improvements in recent years. Such advances have facilitated the discovery of potential tumor markers with improved sensitivities and specificities for the diagnosis, prognosis and treatment monitoring of cancer patients. The topic of discussion is four state of the art technologies: 2D difference gel electrophoresis, MALDI imaging mass spectrometry, electron transfer dissociation mass spectrometry and reverse-phase protein array.  These have contributed to large advances in proteomic technologies from 1997-2008.

1.1.3.1.1 2D difference gel electrophoresis (2DIGE)

The 2D DIGE method is an improved 2GE technique. Two different protein samples (e.g., control and disease) and, optionally, one reference sample (e.g., control and disease together) are labeled with one of three different fluorophore: cyanine (cy)2, 3 or 5. These fluorophores have the same charge, similar molecular weight and distinct fluorescent properties, allowing their discrimination during scanning using appropriate optical filters.Two types of cyanine dyes are available: CyDyeTM  DIGE Fluor minimal dyse and CyDye DIGE Fluor saturation dye (GE Healthcare, Uppsala, Sweden).The minimal dye labelks a small percentage of lysine residues with minimal change in the electrophoretic mobility pattern of the protein, whereas the saturation dye labels all available cysteine residues and is, therefore, more sensitive, but causes EP mobility shift of labelled proteins.  Different types of protein sample may be used.Labeled sample pairs are mixed and  run in a single gel.The same pooled reference sample is used for all gels within an experiment.The gel is scanned at three wavelengths for Cy2 (488 nm), Cy3 (532 nm) and Cy5 (633 nm), and a gel image for each of the samples is obtained.Variation between the gels is minimized. Correct matching of protein spots is improved.Normalization and quantitation of the spots is most accurate.The linear dynamic range is four orders of magnitude and it is fully compatible for quantitation with MS. The technique is mainly used for the discovery of novel biomarkers.

1.1.3.1.2 MALDI imaging technology (see also 1.1.5)

MALDI Imaging Mass Spectrometry gives a deeper understanding of biochemical processes in the tumor cells and tissues. Immunohistochemistry is limitated, but the MALDI technique is high-throughput.MALDI IMS was developed to allow researchers to analyze proteomic expression profiles directly from patient tissue sections.The tissue is first mounted, then MALDI matrix is applied onto the tissue sample and MALDI MS is applied to obtain mass spectra from predefined locations across the tissue section.All acquired spectra are then compiled into a composite 2D map for the tissue sample.The expression profiles of numerous proteins can be obtained without the need for antibodies. It is also possible to correlate the mapping with tissue histology.

Post-translational modifications have a role in structure and function of proteins: protein folding, protein localization, regulation of activity and mediation of protein-protein interaction. Two common forms of PTM have been implicated in cancer neoplasia: phosphorylation and glycosylation.  Phosphoproteomic studies led to identification of novel tyrosine kinase substrates in breast cancer, and to discovery of novel therapeutic targets for brain cancer, and to increased understanding of signaling pathways in lung cancer.  The identification of novel therapeutic targets for ovarian cancer resulted from identification of abnormally glycosylated proteins – mucins.

1.1.3.1.3 Electron Transfer Dissociation

Electron Transfer Dissociation is a recently developed technique for the analysis of peptides by MS, utilizing radiofrequency quadrupole ion traps such as 2D linear IT, spherical IT and OrbitrapTM (Thermo Fisher,MA).Peptides are fragmented by transfer of electrons from anions to induce cleavage of CαN bonds along the peptide backbone, producing c- and z-type ions. In contrast to CID, ETD preserves the localization of labile PTM and provides peptide-sequence information, but it fails to fragment peptide bonds adjacent to proline.CID and ETD should be used to complement each other. An advantage of the TED is that in the analysis of phosphopeptides a near complete series of c- and z-ions is observed without the loss of phosphoric acid. The method has provided for proteomic researchers a tool for comprehensive analysis of peptides and their PTMs.

1.1.3.1.4 Reverse-phase Protein Array (RPA)

Then there is the Reverse-phase Protein array, which has the advantage that it identifies changes associated with the development of cancer. The identification of such proteins can be used as biomarkers for diagnosis, prognosis, treatment decisions and therapeutic monitoring. Still, patient samples pose a challenge:

  • Proteomic patterns differ among cell types;
  • Protein expression changes dynamically over time;
  • Proteins have a broad dynamic range of expression levels spanning several orders of magnitude;
  • Proteins can be present in multiple forms, such as polymorphysms and splice variants;
  • Traditional proteomic methods, such as, @DE, require larger amounts of protein than those obtained from biopsy samples;
  • Many existing proteomic technologies cannot ber used to study protein-protein interactions.

The method of RPA is simple and requires the spotting of patient samples in an array format onto a nitrocellulose support.Each array is incubated with a particular antibody, and signal intensity is proportional to the amount of analyte. Signal detection is by fluorescence, chemiluminescence or colorimetric methods.  The results are qwuantified by scanning and analyzed by softwares such as P-SCAN and ProteinScan.

Main advantages of RPA are:

  • Various types of biological samples;
  • Investigation of PTMs;
  • Protein-protein interactions;
  • Labeling of samples with fluorescent dyes or mass tags;
  • Quantitation within the linear range of detection;
  • Direct measurement of target proteins by spotting reference standards.

Key Issues

  • 2DE couple with MS has been a mainstay for discovery of novel biomarkewrs;
  • 2D DIGE has improved quantification accuracy;
  • MALDI imaging MS allows detedtion and comparison with histopathology;
  • ETD-MS has opened up the possibility of identifying the structure and localization of PTM and the peptide/protein.
  • RPA is a powerful tool for high-throughput validation across hundreds of samples.

1.1.3.2  Principles of Protein Microarrays


Preface, Foreward and Chapter 1: In Protein Microarrays, Ed. Mark Schena
Mark Schena, Joseph L. Hackett and Emanuel F. Petricoin
Jones and Bartlett Publ. 2002, ON, CA

What is true inside the cell cannot always be recapitulated outside the cell.  The year is 1986 and the second year of graduate school of UCSF. With cloned receptor in hand (just isolated by Roger Miesfeld), I set out to test whether glucocorticoid receptor function could be recapitulated in yeast cells. This might allow us to test evolutionary nconservation in eukaryotes.  Remarkably, the rat receptor sprsang to life on the first attempt, producing a diagnostic blue colot change in yeast cells expressing a β-galactosidase fusion and a broad smile on the face of a young scientist. Receptor experiments in yeast necessarily required grinding up yeast cells, fractionating the proteins by denaturing polyacrylamide gel electrophoresis, transferring the proteins onto nitrocellulose, probing the immobilized proteins with a monoclonal antibody, and examining the filter to confirm the presence of the expressed rat protein.

Protein-ntibody interactions on protein chips are determined by complex associations between epitopes on the target protein and the antigen-binding site on the detection molecule. Individual protein-ligand pairs can possess widely different affinities.  Proteomic microarrays require capture and detection molecules with high affinities and low dissociation rates . For these and other reasons protein chips are more challenging than DNA chips. Antibodies, aptamers, recombinant proteins, peptides, phage, evem small molecular weight chemicals/drugs can be used as a bait molecule and/or detection reagent. The molecule may be an antibody or the cellular lysate itself, which are immobilized onto the substratum and act as a bait molecule.  Each spot contains one type of immobilized antibody or bait protein. The first problem is the vast range of concentrations to be detected (up to a factor of 1010 .  Adequate sensitivity must be achieved (at least femtomolar range), and the amplification chemistry must be tolerant to the large dynamic range of the analytes.

Microarrays are analytical devices that possess four distinct characteristics:

  1. Microscopic target elements or spot;
  2. Planar substrates;
  3. Rows and columns of elements; and
  4. Specific binding between microarray target elements on the substrate and probe molecules in solution.

The scope of microarray research includes:

  1. Gene expression
  2. Signal transduction
  3. Genome mismatch scanning
  4. Inflammation
  5. Cancer
  6. Cell cycle
  7. DNA replication
  8. Oxidative stress
  9. Hormone action
  10. Apoptosis
  11. Neurodegenerative disease
  12. Infectious disease
  13. Cytoskeleton, and
  14. Protein trafficking.

The proliferation of microarrays beyond the realm of DNA and gene expression was inevitable, and the idea of making and using microarrays of proteins, lipids, carbohydrates, and small molecules was an obvious extension of the original DNA microarray format. This exciting technology area provides the foundation for the book, Protein Microarrays.  Proteins, not mRNAs are the true functional components of cells. They mediate gene regulation, enzyme catalysis, cellular metabolism, DNA replication, and cell division and confer cell shape and mobility and the capacity to communicate within and between cells. a hypothetical 400 amino acid protein would have a molecular weight of 54 kDa.
Many cellular proteins fall in the molecular weight range of 10-125 kDa, and nearly every human protein weighs < 500 kDa.

The 20 amino acids are chemically diverse and correspondingly confer to the proteins their structural and functional diversity and impart their catalytic specificity and binding properties. The amino acids are bound in the protein by the amino acid side chains of the polypeptide. The nh-CO peptide unit has a partial double-bond character due to the amide bond, and its conformations are restricted by that structure. In addition, proteins have secondary, tertiary and quaternary structure. Hydrophobic amino acids are in the interior, and hydrophilic amino acid residues are on the exterior. The hydrophilic exterior allows for water solubility.

The following are microarray assay formats used in expression profiling:

  1. Protein expression
  2. Serum-based diagnostics
  3. Protein-protein binding
  4. Drug-target binding
  5. Receptor-epitope binding.

1.1.3.3  Disposable reagentless electrochemical immunosensor array based on a polymer/sol/gel membrane for simultaneous measurement of several tumor markers

Wu J, Yan F, Zhang X, Yan Y, Tang J, Ju H.
Clin Chem 2008; 54(9):1481-1489.
http://dx.doi.org:/10.1373/clinchem.2007.102350

Background: A reagentless sensor array for simultaneous multianalyte testing (SMAT) may enable accurate diagnosis and be applicable for point-of-care testing. We developed a disposable reagentless immunosensor array for simple immunoassay of panels of tumor markers. Methods: We carried out SMAT with a direct capture format, in which colloidal gold nanoparticles with bound horseradish peroxidase (HRP)-labeled antibodies were immobilized on screen-printed carbon electrodes with biopolymer/sol-gel to trap their corresponding antigens from sample solution. Upon formation of immunocomplex, the direct electrochemical signal of the HRP decreased owing to increasing spatial blocking, and the analytes could be simultaneously determined by monitoring the signal changes.
Results: The proposed reagentless immunosensor array allowed simultaneous detection of carcinoma antigen 153, carcinoma antigen 125, carbohydrate antigen 199, and carcinoembryonic antigen in clinical serum samples in the ranges of 0.4–140 kU/L, 0.5–330 kU/L, 0.8–190 kU/L, and 0.1–44 μg/L, respectively, with detection limits of 0.2 kU/L, 0.5 kU/L, 0.3 kU/L, and 0.1 μg/L corresponding to the signals 3 SD above the mean of a zero standard. The interassay imprecision of the arrays was <9.5%, and they were stable for 35 days. The positivity detection rate of panels of tumor markers was >95.5% for 95 cases of cancer-positive sera. Conclusions: The immunosensor array provides a SMAT with short analytical time, small sampling volume, no need for substrate, and, no between-electrode cross-talk. This method not only proved the capability of the array in point-of-care testing, but also allowed simultaneous testing of several tumor markers.

Cancer is one of the leading causes of mortality, and early clinical diagnosis is crucial for successful treatment of the disease. Many immunosensors and immunoassay methods have been developed for the determination of a single tumor marker, whose concentration in human serum is associated with the stages of tumors (1)(2)(3)(4). Because many cancers express 1 marker [e.g., breast cancer is associated with carcinoma antigens 153 and 125 (CA 153 and CA 125)1 and carcinoembryonic antigen (CEA)], and concentrations of several tumor markers often increase in the serum of a patient, accurate simultaneous multianalyte test (SMAT) of combinations of tumor markers may improve the diagnosis of certain types of tumor (5)(6)(7)(8).

SMAT may offer a shorter analytical time, higher sample throughput, lower sampling volume, and lower cost per assay compared with traditional single-analyte tests (9)(10). Thus, multilabel assays and spatially resolved assay systems have been developed as the main modes to perform SMAT (11)(12)(13)(14)(15)(16)(17)(18)(19)(20)(21)(22)(23)(24)(25). Application of the multilabel assays has been limited by difficulty in accurate quantification due to different optimal assay conditions and the signal overlap of different labels (11)(12)(13). Although a set of substrate zone-resolved techniques have been proposed to overcome these drawbacks (14)(15), the restriction in the number of available labels still greatly limits their application.

Spatially resolved assays with a single label seem well suited for performing SMAT, and optical SMAT, relying on fluorescence emission and optical reflectance, has been developed into mature technology. Optical SMAT, however, often needs an expensive array detector, such as a charge-coupled device camera (16)(17). Electrochemical array, which is distinguished by its convenient miniaturization for high-throughput systems, low assay cost, and absence of sophisticated and expensive array detectors, shows promising application in cancer screening (18)(19). Electrochemical cross-talk caused by diffusion of the detectable enzymatic products is the main problem in the fabrication of electrochemical array. To solve this problem, many approaches have been followed. One approach, for example, is to ensure that the distance between adjacent electrodes is larger than the diffusion distance of enzymatic product (20)(21)(22)(23), but such an approach conflicts with the goal of miniaturization. Another simple method to completely avoid the electrochemical cross-talk can be achieved by immobilizing the electron-transfer mediator on an individual immunosensor to shuttle electrons (24)(25), but this approach requires the addition of hydrogen peroxide, leading to limited practical application.

A reagentless electrochemical immunosensor is an attractive strategy (26). In our previous work, we prepared several reagentless immunosensors by using sol-gel matrix to immobilize immunoreagents and detected the direct electron transfer of labeled enzyme, horseradish peroxidase (HRP) (27)(28)(29)(30)(31). To achieve SMAT, this work further fabricated a reagentless immunosensor array by individually embedding 4 kinds of HRP-labeled antibody-modified gold nanoparticles in a newly designed biopolymer/sol-gel matrix formed on screen-printed carbon electrodes (SPCEs), where the HRP-Ab-Au nanoparticles were limited in the holes of the biopolymer/sol-gel film. Chitosan, a biopolymer with excellent film-forming ability, biocompatibility, nontoxicity, and high mechanical strength, acted as the adhesion frame in the synthesis of the sol-gel and made the electrical communication between redox sites of the enzyme and sensing surface easier due to the cooperative effort of chitosan and sol-gel matrix. The presence of gold nanoparticles accelerated the electron transfer between immobilized HRP and the electrode and increased the hole size for improving the permeability of the sol-gel matrix so that the antigens in solution could easily penetrate into the sol-gel film for immunoreaction. Upon formation of immunocomplexes, the electrochemical responses decreased due to increasing spatial blocking, leading to the reagentless immunosensing to corresponding antigens without cross-talk. The proposed electrochemical immunosensor array had high analyte throughput, showed acceptable comparability to conventional methods for measuring several tumor markers, could be fabricated with mass production techniques, and thus provided the potential for application in point-of-care testing (POCT).

Schematic diagrams of immunosensors array and multianalyte electrochemical immunoassay system.

Schematic diagrams of immunosensors array and multianalyte electrochemical immunoassay system.

Figure 1.

Schematic diagrams of immunosensors array and multianalyte electrochemical immunoassay system.

(a), Nylon sheet, (b), silver ink, (c), graphite auxiliary electrode, (d), Ag/AgCl reference electrode, (e), graphite working electrode, (f), insulating dielectric.

The DPV curves of both the bare and biopolymer/sol-gel modified SPCEs in 0.2 mol/L PBS, pH 6.9, did not show any detectable signal in the applied potential window (Fig. 3 ). After we embedded 0.17 μL of 50 mg/L HRP-anti-CA 153 in the biopolymer/sol-gel, the modified SPCEs displayed a sensitive peak around −540 mV (vs Ag/AgCl) (curve d, Fig. 3 ), which was close to the reduction peak potential of HRP/biopolymer/sol-gel prepared with 0.17 μL of 2.0 mg/L HRP (curve c, Fig. 3 ), indicating the direct electron transfer between electrode and the labeled HRP with regard to Fe(III)-Fe(II) conversion. The small difference of peak potentials between HRP-anti-CA 153 and HRP resulted from the change of microenvironment around HRP molecules because of the presence of antibody. In the presence of gold nanoparticles in the biopolymer/sol-gel, the reduction peak of the equal amount of HRP-antibody conjugate increased 2.1-fold (curve e, Fig. 3 ). The cyclic voltammetric experiments at different gold electrodes showed the same appearance, and upon incorporation of gold nanoparticles into the biopolymer/sol-gel at SPCEs, the reduction peak current at the same scan rate increased 1.98-fold (see Supplemental Fig. 1 in the Data Supplement that accompanies the online version of this article at  http://www.clinchem.org/content/vol54/issue9). Thus the Au nanoparticles could accelerate the direct electrochemistry of HRP to further amplify the detectable signal. This peak was also 2.7 times higher than that of HRP-anti-CA 153-Au nanoparticles/sol-gel modified SPCE (curve f, Fig. 3 ), indicating the positive effects of chitosan with good biocompatibility and hydrophilicity (35), which enhanced water uptake and swelling of the film and led to better permeability of the film for the transfer of counter ions to neutralize the charge change during the redox process and a favorable microenvironment for electron hopping or electron self-exchange between immobilized HRP molecules (36). Thus electron transfer kinetics and direct electrochemical signal increased. After the modified SPCE was incubated with CA 153, the direct electrochemical signal decreased markedly due to the increased barrier that resulted from the formation of immunocomplex (curve g, Fig. 3 ), leading to a reagentless immunosensing method for antigen detection.

DPVs of bare SPCE

DPVs of bare SPCE

DPVs of bare SPCE (a), biopolymer/sol-gel (b), HRP/biopolymer/sol-gel (c), HRP-anti-CA 153/biopolymer/sol-gel (d), HRP-anti-CA 153-Au nanoparticles/biopolymer/sol-gel (e), HRP-anti-CA 153-Au nanoparticles/sol-gel modified SPCE in pH 6.9 PBS (f), and panel e in pH 6.9 PBS after incubation in 20 μL of 50 kU/L CA 153 at room temperature for 40 min (g).

The formation of immunocomplex depended on the incubation temperature and time. For the sake of convenient manipulation, the incubation step was performed with 20 μL antigen solution or the mixture of antigens for SMAT at room temperature, after which the DPV response of the labeled HRP decreased with increasing incubation time and reached a relatively stable value at 30–40 min (Fig. 4A ), indicating saturated formation of immunocomplex in the membrane. Thus, 40 min was chosen as the optimal incubation time for SMAT.

Dependences of DPV responses of immunosensors on incubation time

Dependences of DPV responses of immunosensors on incubation time

Dependences of DPV responses of immunosensors on incubation time (A) and pH of detection solution (B) for CA 153, CA 125, CA 199, and CEA.

Table 1.

Positivity detection rates of clinical sera.

Sample n Associated tumor markers Positive cases, n Positivity detection rate, %
Colorectal or gastric cancer 53 CA 199, CEA 531 100
Epithelial ovarian cancer 22 CA 125, CA 199, CEA 211 95.5
Breast cancer 8 CA 153, CA 125, CEA 81 100
Lung cancer 12 CA 199, CEA 121 100
Normal serum 20 CA 153, CA 125, CA 199, CEA 22 10

In comparison with previous reports (24)(25), this array avoids the addition of mediator to shuttle electrons, and thus can exclude the electrochemical cross-talk at the electrode dimensions used here. Furthermore, the measurement of the direct electrochemical signal of HRP labeled to immunoreagents also avoids the need for other reagents in the detection process. Although the measurements show acceptable results, adding sulfite in the detection solution is not the best solution for the removal of oxygen. Thus, a system has been developed for POCT to exclude oxygen from the detection solution (see Supplemental Fig. 3 in the online Data Supplement).

1.1.3.4  p16INK4a Expression Correlates with Degree of Cervical Neoplasia: A Comparison with Ki-67 Expression and Detection of High-Risk HPV Types

S Nicholas Agoff, Patricia Lin, Janice Morihara, Constance Mao, Nancy B Kiviat and Laura A Koutsky
Mod Pathol 2003;16(7):665–673

Although recent studies have suggested that p16INK4a may be a useful surrogate biomarker of cervical neoplasia, Ki-67 and human papillomavirus testing have also been shown to be useful in detecting neoplasia. To help delineate the utility of p16INK4a, biopsy samples (n = 569: negative, 133; reactive, 75; atypical, 39; low grade, 76; moderate, 80; and severe intraepithelial neoplasia, 113; also, squamous cell carcinoma, 46; adenocarcinoma, 7) were analyzed by immunohistochemistry for expression of p16INK4a and Ki-67 (n = 432), as well as by in situhybridization for human papillomavirus Type 16 (n = 219). Testing for high-risk human papillomavirus types by polymerase chain reaction and HybridCapture2 was performed on concurrent cervical swab specimens. Recuts of the original blocks were reexamined (n = 198). Endometrial biopsies (n = 10) were also analyzed for p16INK4a expression. Degree of p16INK4a and Ki-67 expression correlated with degree of cervical neoplasia (P < .001) and with presence of high-risk human papillomavirus types (P < .001). There was no relationship between p16INK4a overexpression and inflammation or hormonal status. Ki-67 expression correlated with inflammation (P = 0.003) and was expressed in more reactive and atypical lesions than p16INK4a (P = 0.008). Probes for human papillomavirus 16 stained 54% of cervical neoplastic lesions; the degree of staining correlated significantly with degree of neoplasia (P < .001) and p16INK4astaining (P < .001). Interobserver reproducibility was substantial for p16INK4a and Ki-67 interpretation (weighted kappa: 0.74 and 0.70, respectively). Expression of p16INK4a was observed in all endometrial biopsies. Compared with Ki-67 expression and detection of high-risk human papillomavirus, p16INK4a was less likely to be positive in samples from women with negative, reactive, and atypical biopsies. Although expression of p16INK4ain endometrial epithelium may be problematic in terms of screening, the potential of p16INK4a as a screening test warrants investigation.

The screening of women by Pap smear has led to a remarkable decline in the mortality from cervical cancer; however, secondary to subjective criteria, interpretation of Pap smears is subject to marked inter- and intraobserver variability as well as having a relatively low sensitivity for cervical neoplasia on a single sample (as low as 66% sensitivity for biopsy-proven high-grade squamous intraepithelial lesions [HSIL]) (1, 2). Recently, histology, which is thought of as the gold standard for the diagnosis of cervical neoplasia, has also been found to suffer from marked intra- and interobserver variability, and testing for high-risk human papillomavirus (HPV) by Hybrid Capture 2, which has been shown to be very sensitive in the detection of cervical neoplasia and useful in the triaging of ASCUS smears, has a low specificity for cervical neoplasia (1,3). Thus, new biomarkers that are more sensitive and specific in the detection of cervical neoplasia and more reproducible than cervical cytology are needed.

Human papillomaviruses (HPV) are known to be a major causative agent in cervical neoplasia and invasive cervical carcinoma. Many different HPV types associated with cervical neoplasia have been discovered, and they have been subdivided into high- and low-risk categories based on their association with invasive cervical carcinoma (4). This association is based, in part, on the relative affinity that the HPV-type specific oncoproteins E6 and E7 bind to cellular regulatory proteins, specifically, the p53 tumor suppressor protein and the retinoblastoma protein (Rb) (5). Inactivation of these factors, either by degradation (p53) or functional inactivation (Rb), leads to disruption of the cell cycle and increased proliferation, thought to ultimately give rise to carcinoma.

p16INK4a is a cyclin-dependent kinase inhibitor that regulates the activity of cyclin-dependent kinases 4 and 6 and is often inactivated in many cancers by genetic deletion or hypermethylation (6). In non-HPV–associated tumors, this inactivation leads to increased cyclin-dependent kinase activity and inactivation of Rb. However, in HPV-associated tumors, inactivation of Rb by E7 leads to markedly increased levels of p16INK4a. Recent studies have documented overexpression of p16INK4a not only in cervical intraepithelial neoplasia (CIN) but in cervical cancer as well (6, 7, 8, 9, 10).

For p16INK4a, the results were reported in semiquantitative fashion (negative, or 1+ to 3+) based on none, 5–25%, 25–75%, and >75% of cells immunostained in a lesion. Strong nuclear as well as cytoplasmic staining was considered a positive reaction. Wispy weak cytoplasmic staining present in rare cells (<5%) was considered plusminus, and for analysis was grouped into the negative category. For Ki-67, the results were also reported in a semiquantitative fashion as cells in the lower 1/3 of the epithelium staining (i.e., usually basilar cell staining), cells in the middle 1/3–2/3 staining, or cells in the upper 1/3 staining (14). Strong nuclear staining was considered a positive reaction. Stains were analyzed by two authors (SNA and JM) for reproducibility; each was blinded to the other’s result.

The degree of p16INK4a expression correlated well with the degree of cervical neoplasia, and this correlation improved slightly when compared with the recut slide diagnosis (P < .001; Fig. 1; Tables 1 and 2). There was very little expression in negative and reactive lesions, with only 11% to 12% showing greater than or equal to1+ staining (24 of 208 -original diagnosis, 12 of 112 recut diagnosis). 57% of the CIN I cases had
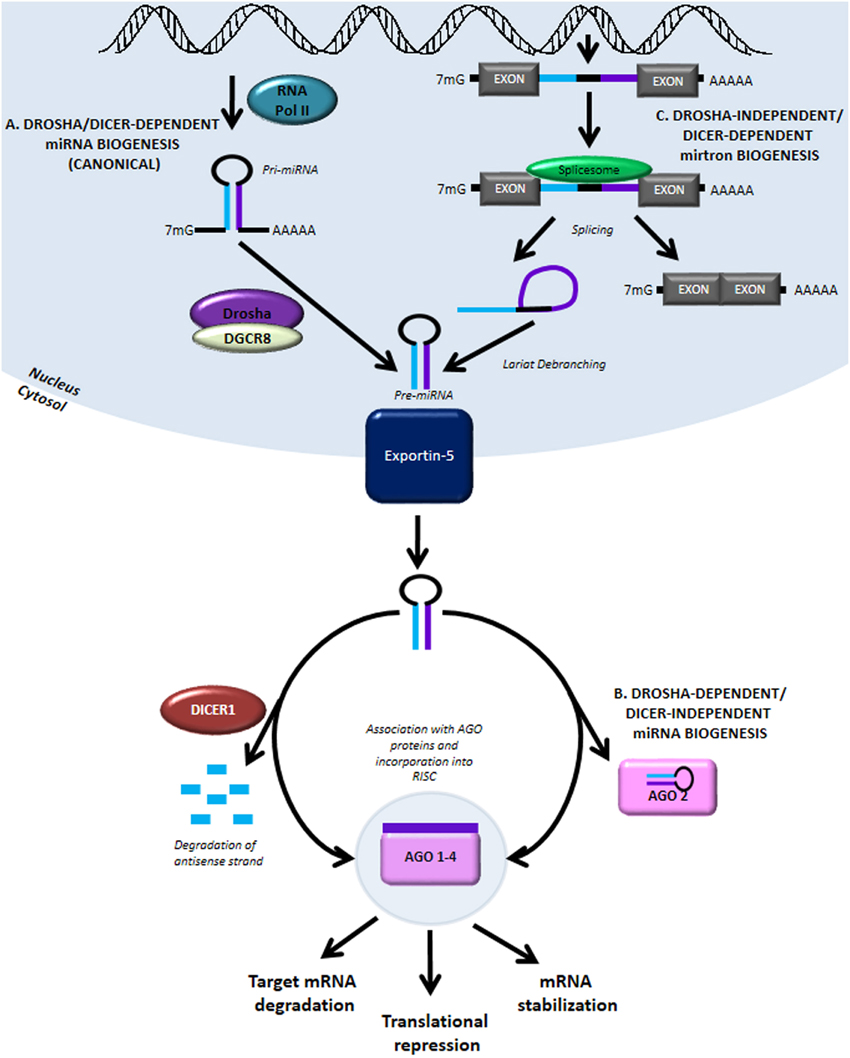
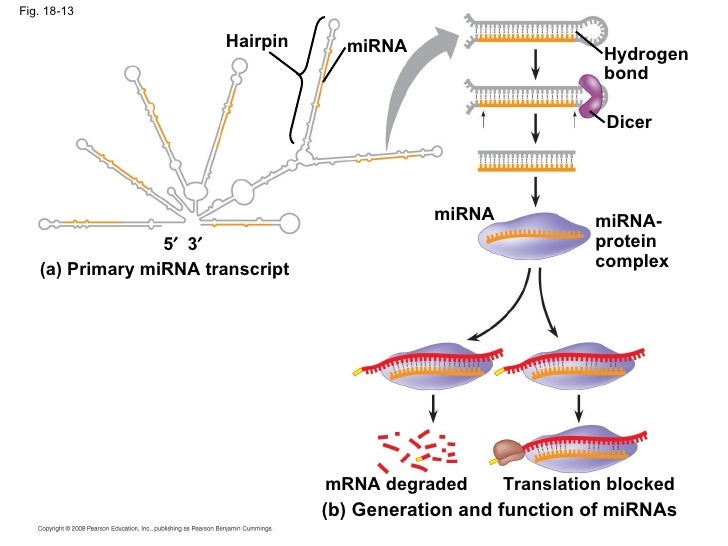
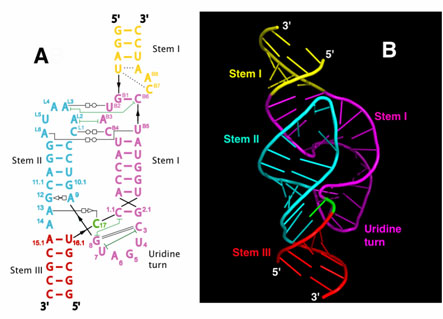
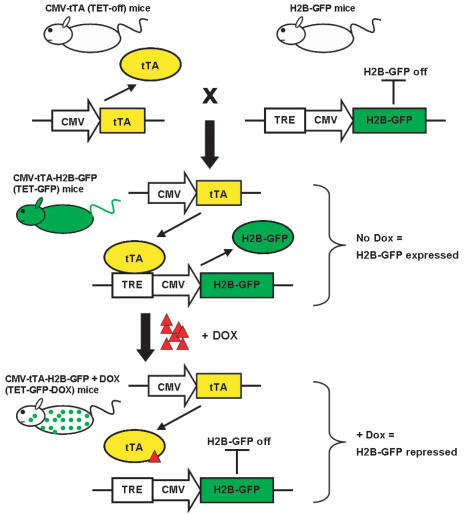
 greater than or equal to1+ expression, compared with 75% of CIN II lesions and 91% of CIN III lesions. On the recut diagnosis, 97% of CIN III lesions stained greater than or equal to1+. There were 10 (9%) CIN III original diagnosis that did not stain for p16INK4a, but on review, the majority of these were secondary to the lesion being cut through and not present on the immunohistochemistry (IHC) slide. For the recut diagnosis, there was only 1 (3%) case that did not stain with p16INK4a, and on review, two of three pathologists agreed that this represented CIN III, whereas the third felt it represented atypical squamous metaplasia. p16INK4a expression of 1+ or greater was present in 89%(47/53) of the invasive carcinomas. Review of negative cases confirmed the carcinoma diagnosis.

p16INK4a and Ki-67 expression in normal, low-grade squamous dysplasia, and high grade squamous dysplasia

p16INK4a and Ki-67 expression in normal, low-grade squamous dysplasia, and high grade squamous dysplasia

p16INK4a and Ki-67 expression in normal cervical squamous mucosa (A, H&E stain; B, p16INK4a; C, Ki-67), low-grade squamous dysplasia (CIN I; D, H&E stain; E, p16INK4a; F, Ki-67), and high grade squamous dysplasia (CIN III; G, H&E stain; H, p16INK4a, I, Ki-67).

1.1.3.5  Quantitative real-time detection of magnetic nanoparticles by their nonlinear magnetization

A novel method of highly sensitive quantitative detection of magnetic nanoparticles (MP) in biological tissues and blood system has been realized and tested in real time in vivoexperiments. The detection method is based on nonlinear magnetic properties of MP and the related device can record a very small relative variation of nonlinear magnetic susceptibility up to 108 at room temperature, providing sensitivity of several nanograms of MP in 0.1mlvolume. Real-time quantitative in vivomeasurements of dynamics of MP concentration in blood flow have been performed. A catheter that carried the blood flow of a rat passed through the measuring device. After an MP injection, the quantity of MP in the circulating blood was continuously recorded. The method has also been used to evaluate the MP distribution between rat’s organs. Its sensitivity was compared with detection of the radioactive MP based on isotope of Fe59. The comparison of magnetic and radioactive signals in the rat’s blood and organ samples demonstrated similar sensitivity for both methods. However, the proposed magnetic method is much more convenient as it is safe, less expensive, and provides real-time measurementsin vivo. Moreover, the sensitivity of the method can be further improved by optimization of the device geometry.

1.1.6  Proteomics and biomarkers

1.1.6.1 Identification by proteomic analysis of calreticulin as a marker for bladder cancer and evaluation of the diagnostic accuracy of its detection in urine

Kageyama S, Isono Y, Iwaka H,…, Yoshiki T.
Clin Chem 2004; 50(5):857-866.
http://dx.doi.org:/10.1373/clinchem.2003.027425
How are we going to discover new cancer biomarkers? A proteomic approach for bladder cancer.
Editorial. Eftherios P. Diamandis
Clin Chem 2003; 50(5):794-795.
http://dx.doi.org:/10.1373.2004.032177

BACKGROUND: New methods for detection of bladder cancer are needed because cystoscopy is both invasive and expensive and urine cytology has low sensitivity. We screened proteins as tumor markers for bladder cancer by proteomic analysis of cancerous and healthy tissues and investigated the diagnostic accuracy of one such marker in urine. METHODS: Three specimens of bladder cancer and healthy urothelium, respectively, were used for proteome differential display using narrow-pH-range two-dimensional electrophoresis. To evaluate the presence of calreticulin (CRT) as detected by Western blotting, we obtained 22 cancerous and 10 noncancerous surgical specimens from transurethral resection or radical cystectomy. To evaluate urinary CRT, we collected 70 and 181 urine samples from patients with and without bladder cancer, respectively. Anti-CRT COOH-terminus antibody was used to detect CRT in tissue and urine. RESULTS: Proteomic analysis revealed increased CRT (55 kDa; pI 4.3) in cancer tissue. Quantitative Western blot analysis showed that CRT was increased in cancer tissue (P = 0.0003). Urinary CRT had a sensitivity of 73% (95% confidence interval, 62-83%) at a specificity of 86% (80-91%) for bladder cancer in the samples tested. CONCLUSIONS: Proteomic analysis is useful in searching for candidate proteins as biomarkers and led to the identification of urinary CRT. The diagnostic accuracy of urinary CRT for bladder cancer appears comparable to that of Food and Drug Administration-cleared urinary markers, but further studies are needed to determine its diagnostic role.

A handful of cancer biomarkers are currently used routinely for population screening, disease diagnosis, prognosis, monitoring of therapy, and prediction of therapeutic response. Unfortunately, most of these biomarkers suffer from low sensitivity, specificity, and predictive value, particularly when applied to rare diseases in population screening programs. Thus, for the classic cancer biomarkers much is left to be desired in terms of clinical applicability. We need new cancer biomarkers that will further enhance our ability to diagnose, prognose, and predict therapeutic response in many cancer types. Because biomarkers can be analyzed relatively noninvasively and economically, it is worth investing in discovering more biomarkers in the future. The completion of the Human Genome Project has raised expectations that the knowledge of all genes and proteins will lead to identification of many candidate biomarkers for cancer and other diseases. These predictions still need to be realized. The prevailing view among specialists is that the most powerful single cancer biomarkers may have already been discovered. Likely, in the future we will discover biomarkers that are less sensitive or specific but could be used in panels, in combination with powerful bioinformatic tools, to devise diagnostic algorithms with improved sensitivity and specificity. These efforts are currently in progress1.

  1. Stephan C, Vogel B, Cammann H, Lein M, Klevecka V, Sinha P, et al. [An artificial neural network as a tool in risk evaluation of prostate cancer. Indication for biopsy with the PSA range of 2–20 microg/l]. Urologe A 2003; 42:1221–9.

In this issue of Clinical Chemistry, Kageyama et al. propose proteomic analysis of urine as a new way to identify bladder cancer biomarkers. Previously, Celis et al. 2 used two-dimensional gel electrophoresis and developed a comprehensive database for bladder cancer profiles of both transitional and squamous cell carcinomas. Through their studies, Kageyama et al. were able to identify a potential tumor marker, calreticulin, which is found in the urine of patients with bladder carcinoma. The authors used a differential display method of bladder cancer vs healthy urothelial tissue and mass spectrometry to identify proteins that are increased in cancer tissue. In addition to calreticulin, an endoplasmic reticulum chaperone, they found nine other candidate proteins that could constitute new biomarkers for bladder carcinoma. The authors confirmed their data with quantitative Western blot analysis, immunoprecipitation, and immunohistochemistry. Their reported sensitivity and specificity were 73% and 86%, respectively, similar to the values reported for other biochemical bladder markers. However, the diagnostic accuracy of their test was vulnerable to urinary tract infections3.

3 Positive correlations were found among the appearance of adenylate kinase activity in the urine and the existence of bacteriuria, the Fairley test, and other criteria of urinary infection. Since the adenylate kinase isozymes of human tissues are organ specific and can be distinguished from one another, the appearance of adenylate kinase isozymes in urine was used in this study to identify the existence of infection in bladder or kidney. The findings suggest the usefulness of measuring the appearance of urinary adenylate kinase isozymes for the purpose of detection and differential diagnoses of urinary infections, particularly since adenylate kinase is absent or found in low concentrations in urine and serum under normal conditions.

Currently, potential bladder tumor markers can be used in various clinical scenarios, including4:

  • Serial testing for earlier detection of recurrence;
    • Complementary testing to urine cytology to improve the detection rate;
    • Providing a less expensive and more objective alternative

to the urine cytology test; and
• Directing the cytoscopic evaluation of patient followup.

The gold standard for the detection of urothelial neoplasia is cytologic examination of urothelial cells from voided urine, urinary bladder washings, and urinary tract brushing specimens in combination with cystoscopic examination5,6.

  1. Celis A, Rasmussen HH, Celis P, Basse B, Lauridsen JB, Ratz G, et al. Short-term culturing of low-grade superficial bladder transitional cell carcinomas leads to changes in the expression levels of several proteins involved in key cellular activities. Electrophoresis 1999;20:355–61.
  2. Bernstein LH, Horenstein JM, and Russell PJ. Urinary adenylate kinase and urinary infections. J Clin Microbiol. 1983 Sep; 18(3): 578–584
  3. Fritsche HA. Bladder cancer and urine tumor marker tests. In: Diamandis EP, Fritsche HA, Lilja H, Chan DW, Schwartz MK. Tumor markers: physiology,pathobiology, technology and clinical applications. Washington: AACC Press, 2002; 281–6.
  4. Bailey MJ. Urinary markers in bladder cancer. BJU Int 2003; 91:772–3
  5. Eissa S, Kassim S, El-Ahmady O. Detection of bladder tumours: role of cytology, morphology-based assays, biochemical and molecular markers. Curr Opin Obstet Gynecol 2003;15:395–403

Current guidelines suggest that low-risk patients should be surveyed once a year with cystoscopy and high-risk patients at 3-month intervals. Currently, cystoscopy is always combined with VUC. Because, as mentioned earlier, new urinary bladder tests such as BTA or NMP22 could detect lower-grade disease recurrence with higher sensitivity than VUC, it could be worthwhile to consider including one or more of these tests in the routine follow-up of patients with bladder carcinoma. However, large prospective studies will be necessary to test the clinical utility of these assays against cytology.

1.1.6.2  Multiplexed proteomic analysis of oxidation and concentrations of CSF proteins in Alzheimer’s disease

Korolainen MA, Nyman TA, Nyyssonen P, Hartikainen ES, Pirttila Y.
Clin Chem 2007; 53(4):657-665.
http://dx.doi.org:/10.1373/clinchem.2006.078014

Carbonylation is an irreversible oxidative modification of proteins that has been linked to various conditions of oxidative stress, aging, physiological disorders, and disease. Increased oxidative stress is thus also considered to play a role in the pathogenesis of age-related neurodegenerative disorders such as Alzheimer disease (AD). In addition, it has recently become evident that the response mechanisms to increased oxidative stress may depend on sex. Several oxidized carbonylated proteins have been identified in plasma and brain of AD patients by use of 2-dimensional oxyblotting.

Signals for beta-trace, lambda chain, and transthyretins were decreased in probable AD patients compared with controls. The only identified protein exhibiting an increased degree of carbonylation in AD patients was lambda chain. The concentrations of proteins did not generally differ between men and women; however, vitamin D-binding protein, apolipoprotein A-I, and alpha-1-antitrypsin exhibited higher extents of carbonylation in men.

None of the brain-specific proteins exhibited carbonylation changes in probable AD patients compared with age-matched neurological controls showing no cognitive decline. The carbonylation status of proteins differed between women and men. Two-dimensional multiplexed oxyblotting is applicable to study both the concentrations and carbonylation of cerebrospinal fluid proteins.

1.1.6.3  The Brain Injury Biomarker VLP-1 Is Increased in the Cerebrospinal Fluid of Alzheimer Disease Patients

Jin-Moo Lee, Kaj Blennow, Niels Andreasen, Omar Laterza, Vijay Modur, Jitka Olander, Feng Gao, Matt Ohlendorf, and Jack H. Ladenson
Clinical Chemistry  2008; 54:10 1617–1623
http://dx.doi.org:/10.1373/clinchem.2008.104497

BACKGROUND: Definitive diagnosis of Alzheimer disease (AD) can be made only by histopathological examination of brain tissue, prompting the search for premortem disease biomarkers. We sought to determine if the novel brain injury biomarker, visinin-like protein 1 (VLP-1), is altered in the CSF of AD patients compared with controls, and to compare its values to the other well-studied CSF biomarkers 42-amino acid amyloid- peptide (A1–42), total Tau (tTau), and hyperphosphorylated Tau (pTau). METHODS: Using ELISA, we measured concentrations of A1–42, tTau, pTau, and VLP-1 in CSF samples from 33 AD patients and 24 controls. We compared the diagnostic performance of these biomarkers using ROC curves. RESULTS: CSF VLP-1 concentrations were significantly higher in AD patients [median (interquartile range) 365 (166) ng/L] compared with controls [244 (142.5) ng/L]. Although the diagnostic performance of VLP-1 alone was comparable to that of A, tTau, or pTau alone, the combination of the 4 biomarkers demonstrated better performance than each individually. VLP-1 concentrations were higher in AD subjects with APOE 4/4 genotype [599 (240) ng/L] compared with 3/4 [376 (127) ng/L] and 3/3 [280 (115.5) ng/L] genotypes. Furthermore, VLP-1 values demonstrated a high degree of correlation with pTau (r 0.809) and tTau (r 0.635) but not A1–42 (r 0.233). VLP-1 was the only biomarker that correlated with MMSE score (r 0.384, P 0.030). CONCLUSIONS: These results suggest that neuronal injury markers such as VLP-1 may have utility as biomarkers for AD.

The diagnosis of Alzheimer disease (AD),6 the most common form of dementia in Western countries, is largely based on historical and clinical criteria. Although many studies report a reasonably high degree of diagnostic accuracy (80%–90%), these studies often include patients with advanced disease evaluated at specialized centers (1 ). At present, postmortem examination of brain tissue is the only tool for definitive diagnosis. Therefore, the development of a biomarker for AD would aid greatly in the diagnosis of this disease. In addition, such a marker could potentially be used to measure efficacy in future therapeutic trials. Most studies of AD biomarkers have focused on known pathological substrates for the disease. Amyloid plaques and neurofibrillary tangles are pathological hallmarks of AD (2 ) and primarily comprise abnormally aggregated endogenous proteins. Amyloid plaques (extracellular proteinaceous aggregates) are principally composed of the amyloid- peptide (A), a 38 – to 42–amino acid peptide fragment of the amyloid precursor protein (APP). The major species, the 42– amino acid peptide (A1–42) (3, 4 ), is significantly decreased in the cerebrospinal fluid (CSF) of patients with AD (5– 8 ). Neurofibrillary tangles are intraneuronal protein aggregates found mainly in neurites and primarily composed of hyperphosphorylated Tau (pTau), a microtubule-associated protein.

Fig. 1. CSF VLP-1 values in AD patients and controls. Scatter plot of CSF VLP-1 values in control vs AD patients. The line within the box represents the median value, the box encompasses 25th to 75th percentiles, and the error bars encompass the 10th to 90th percentiles. A significant difference was found in control vs AD patients (P 0.001, Student t-test).

To see if VLP-1 provides utility to the diagnosis of AD beyond the contribution of A, tTau, or pTau alone, we performed a ROC analysisfor each individual biomarker alone compared to the combination of all biomarkers. The AUCs for VLP-1, A, tTau, pTau, and an optimum linear combination of all biomarkers are shown in Fig. 2. AUCs were similar between all biomarkers individually; however, the linear combination of all biomarkers resulted in an approximately 5% improvement (Fig. 2).

To examine possible relationships between CSF VLP-1 values and patient characteristics, we performed correlation analyses between VLP-1 and age, disease duration, MMSE, and the number of APOE 4 alleles. VLP-1 correlated with MMSE and the number of APOE 4 alleles (Fig. 3A). None of the other biomarkers correlated with MMSE in this patient population (A1–42, r 0.350, P 0.497; tTau, r 0.295, P 0.100; pTau, r 0.202, P 0.264). To further examine the relationship between APOE genotype and CSF VLP-1 concentrations, we calculated mean CSF VLP-1 values by different genotypes. APOE 4/4 individuals had the highest concentrations, followed by 3/4 and 3/3 individuals (Fig. 3B).

To examine if VLP-1 concentrations in the CSF were related to values of the other biomarkers studied, we performed correlations between VLP-1 and tTau, pTau, or A1–42 using data from both AD patients and controls (Fig. 4). VLP-1 and pTau showed the greatest correlation (r 0.809) (Fig. 4C), whereas A1–42 did not correlate with VLP-1 (Fig. 4A, r 0.233). Individual correlations for AD patients analyzed separately from controls were also performed, and revealed results similar to that of the total patient population: VLP-1 vs A1–42 was not statistically significant (r 0.29671 and 0.1698 in AD and controls, respectively), whereas VLP-1 vs tTau (r 0.6221 and 0.7247 in AD and controls) and pTau (r 0.8747 and 0.6227 in AD and controls) were significantly correlated in the AD and control populations analyzed separately.

Dementia severity appears to correlate with the number of neurofibrillary tangles, but not to the degree of plaque deposition (13 ). The close correlation between VLP-1 and pTau concentrations in the CSF of AD patients is consistent with these findings, as is the lack of correlation with A. There are several limitations to this study. First, the number of patients in both control and disease groups is limited. Further studies will be needed to confirm our findings in larger, more well-characterized populations. Second, because the diagnosis of AD was made by clinical criteria, there will undoubtedly be a small but significant group of patients that were misdiagnosed (10%–20%) (1 ). This may account for some of the overlap in values for CSF biomarkers. ApoE genotyping in the control group might help with this diagnostic uncertainty. A much more rigorous study would require autopsy confirmation of diagnosis. Third, our study is limited to a comparison of VLP-1 concentrationsin AD patients vs controls, a situation thatis unlikely to occur clinically. A more relevant comparison should be made across patients carrying the differential diagnosis of dementia. Finally, our CSF samples represent a single snapshot in AD pathogenesis; further studies will be required to understand the time course or biomarker evolution with disease pathogenesis.

1.1.6.4 Determination of non-α1-antichymotrypsin-complexed PSA as an indirect measurement of free PSA: analytical performance and diagnostic accuracy.

Wesselin S, Dtephan C, Semjonow A,…, Jung K.
Clin Chem 2003;49(6):887-894.
http://dx.doi.org:/10.1373/49.6.887

Background: A new assay measures prostate-specific antigen (PSA) not complexed to α1-antichymotrypsin (nACT-PSA) after removing PSA complexed to ACT by use of anti-ACT antibodies. We evaluated nACT-PSA and its ratio to total PSA (tPSA) as alternatives to free PSA (fPSA) and its ratio to tPSA in differentiating prostate cancer (PCa) and benign prostatic hyperplasia (BPH) in patients with tPSA of 2–20 μg/L. Methods: PSA in serum of 183 untreated patients with PCa and 132 patients with BPH was measured retrospectively on the chemiluminescence immunoassay analyzer LIAISON® (Byk-Sangtec Diagnostica) with the LIAISON tPSA and LIAISON fPSA assays. The nACT-PSA fraction was determined with a prototype assay measuring the residual PSA after precipitation of ACT-PSA with an ACT-precipitating reagent.
Results: nACT-PSA was higher than fPSA in samples with fPSA concentrations <1 μg/L but lower in samples with >1 μg/L fPSA. The median ratios of fPSA/tPSA and of nACT-PSA/tPSA were significantly different between patients with BPH and PCa (19.4% vs 12.2% and 17.4% vs 13.0%, respectively). Within the tPSA ranges tested (2–20, 2–10, and 4–10 μg/L), areas under the ROC curves for the fPSA/tPSA ratios were significantly larger than those for nACT-PSA/tPSA. In the tPSA ranges <10 μg/L, the areas under the ROC curves for fPSA/tPSA were significantly larger than those for tPSA, whereas the areas for nACT-PSA/tPSA were not. At decision limits for 95% sensitivity and specificity, both ratios significantly increased specificity and sensitivity, respectively, compared with tPSA, but the fPSA/tPSA ratio showed higher values. Conclusions: nACT-PSA and its ratio to tPSA provide lower diagnostic sensitivity and specificity than fPSA/tPSA. The fPSA/tPSA ratio represents the state-of-the-art method for differentiating between PCa and BPH.

1.1.6.5 Ultrasensitive densitometry detection of cytokines with nanoparticle-modified aptamers

Li yuan-Yuan, Zhang C, Li Bo-Sheng, …, Xu Shun-Quing
Clin Chem 2007; 53(6):1061-1066
http://dx.doi.org:/10.1373/clinchem.2006.082271

Background: Aptamers mimic properties of antibodies and sometimes turn out to be even better than antibodies as reagents for assays. We describe the establishment of an ultrasensitive densitometry method for cytokine detection by nanoparticle (NP)-modified aptamers. Methods: The assay simultaneously uses a gold NP–modified aptamer and a biotin-modified aptamer to bind to the target protein, forming a sandwich complex. The absorbance signal generated by the aptamer-protein complex is amplified and detected with a microplate reader. Results: The assay for platelet-derived growth factor B-chain homodimer (PDGF-BB) was linear from 1 fmol/L to 100 pmol/L (R2 = 0.9869). The analytical detection limit was 83 amol/L. The intraassay and interassay imprecision (CVs) was ≤7.5%. Serum concentrations of PDGF-BB determined with the gold NP–modified aptamer assay and with ELISA were not significantly different. Conclusions: The gold NP–modified aptamer assay provides a fast, convenient method for cytokine detection and improves the detection range and the detection limit compared with ELISA.

1.1.6.6  Protein profiling of microdissected pancreas carcinoma and identification of HSP27 as a potential serum marker.

Melle C, Ernst G, Escher N, Hartmann D,…, von Eggeling F.
Clin Chem 2007; 53(4):629-635.
http://dx.doi.org:/10.1373/clinchem.2006.079194

Background: Patients with pancreatic adenocarcinomas have a poor prognosis because of late clinical manifestation and the tumor’s aggressive nature. We used proteomic techniques to search for markers of pancreatic carcinoma. Methods: We performed protein profiling of microdissected cryostat sections of 9 pancreatic adenocarcinomas and 10 healthy pancreatic tissue samples using ProteinChip technology (surface-enhanced laser desorption/ionization). We identified proteins by use of 2-dimensional gel electrophoresis, peptide fingerprint mapping, and immunodepletion and used immunohistochemistry for in situ localization of the proteins found. We used ELISA to quantify these proteins in preoperative serum samples from 35 patients with pancreatic cancer and 37 healthy individuals. Results: From among the differentially expressed signals that were detected by ProteinChip technology, we identified 2 proteins, DJ-1 and heat shock protein 27 (HSP27). We then detected HSP27 in sera of patients by use of ELISA, indicating a sensitivity of 100% and a specificity of 84% for the recognition of pancreatic cancer. Conclusions: The detection of DJ-1 and HSP27 in pure defined tissue and the retrieval of HSP27 in serum by antibody-based methods identifies a potential marker for pancreatic cancer.

1.1.7  Mass Spectrometry Methods

1.1.7.1 LC-MS/MS quantification of Zn-α2 glycoprotein: A potential serum biomarker for prostate cancer

Bondar OP, Barnidge DR, KKlee EW, Davis BJ, Klee GG
Clin Chem 2007; 53(4):673-678 http://dx.doi.org:/10.1373/clinchem.2006.079681

LC-MS/MS – tandem mass spectrometry

Background: Zn-α2 glycoprotein (ZAG) is a relatively abundant glycoprotein that has potential as a biomarker for prostate cancer. We present a high-flow liquid chromatography–tandem mass spectrometry (LC-MS/MS) method for measuring serum ZAG concentrations by proteolytic cleavage of the protein and quantification of a unique peptide. Methods: We selected the ZAG tryptic peptide 147EIPAWVPEDPAAQITK162 as the intact protein for quantification and used a stable isotope-labeled synthetic peptide with this sequence as an internal standard. Standards using recombinant ZAG in bovine serum albumin, 50 g/L, and a pilot series of patient sera were denatured, reduced, alkylated, and digested with trypsin. The concentration of ZAG was calculated from a dose–response curve of the ratio of the relative abundance of the ZAG tryptic peptide to internal standard. Results: The limit of detection for ZAG in serum was 0.08 mg/L, and the limit of quantification was 0.32 mg/L with a linear dynamic range of 0.32 to 10.2 mg/L. Replicate digests from pooled sera run during a period of 3 consecutive days showed intraassay imprecision (CV) of 5.0% to 6.3% and interassay imprecision of 4.4% to 5.9%. Mean (SD) ZAG was higher in 25 men with prostate cancer [7.59 (2.45) mg/L] than in 20 men with nonmalignant prostate disease [6.21 (1.65) mg/L, P = 0.037] and 6 healthy men [3.65 (0.71) mg/L, P = 0.0007]. Conclusions: The LC-MS/MS assay can be used to evaluate the clinical utility of ZAG as a cancer biomarker.

1.1.7.2 A novel, high-throughput workflow for discovery and identification of serum carrier protein-bound peptide biomarker candidates in ovarian cancer samples.

Lopez MF, Mikulskis A, Kuzdzal S, Golenko E,…, Fishman D.
Clin Chem 2007; 53(6):1067-1074.
http://dx.doi.org:/10.1373/clinchem.2006.080721

MALDI-TOF MS

Background: Most cases of ovarian cancer are detected at later stages when the 5-year survival is ∼15%, but 5-year survival approaches 90% when the cancer is detected early (stage I). To use mass spectrometry (MS) of serum proteins for early detection, a seamless workflow is needed that provides an opportunity for rapid profiling along with direct identification of the underpinning ions. Methods: We used carrier protein–bound affinity enrichment of serum samples directly coupled with MALDI orthagonal TOF MS profiling to rapidly search for potential ion signatures that contained discriminatory power. These ions were subsequently directly subjected to tandem MS for sequence identification. Results: We discovered several biomarker panels that enabled differentiation of stage I ovarian cancer from unaffected (age-matched) patients with no evidence of ovarian cancer, with positive results in >93% of samples from patients with disease-negative results and in 97% of disease-free controls. The carrier protein–based approach identified additional protein fragments, many from low-abundance proteins or proteins not previously seen in serum. Conclusions: This workflow system using a highly reproducible, high-resolution MALDI-TOF platform enables rapid enrichment and profiling of large numbers of clinical samples for discovery of ion signatures and integration of direct sequencing and identification of the ions without need for additional offline, time-consuming purification strategies.

1.1.7.3  Mass Spectrometry-based hepcidin measurements in serum and urine: analytical aspects and clinical implications.

Kemna EHJM, Tjalsma H, Podust VN, Swinkels DW.
Clin Chem 2007; 53(4):620-628.
http://DX.DOI.ORG:/10.1373/clinchem.2006.079186

SELDI-TOF MS

Background: Discovery of the central role of hepcidin in body iron regulation has shed new light on the pathophysiology of iron disorders. Information is lacking on newer analytical approaches to measure hepcidin in serum and urine. Recent reports on the measurement of urine and serum hepcidin by surface-enhanced laser-desorption/ionization time-of-flight mass spectrometry (SELDI-TOF MS) necessitate analytical and clinical evaluation of MS-based methodologies. Methods: We used SELDI-TOF MS, immunocapture, and tandem MS to identify and characterize hepcidin in serum and urine. In addition to diagnostic application, we investigated analytical reproducibility and biological and preanalytical variation for both serum and urine on Normal Phase 20 and Immobilized Metal Affinity Capture 30 ProteinChip arrays. We obtained samples from healthy controls and patients with documented iron-deficiency anemia, inflammation-induced anemia, thalassemia major, and hereditary hemochromatosis. Results: Proteomic techniques showed that hepcidin-20, -22, and -25 isoforms are present in urine. Hepcidin-25 in serum had the same amino acid sequence as hepcidin-25 in urine, whereas hepcidin-22 was not detected in serum. The interarray CV was 15% to 27%, and interspot CV was 11% to 13%. Preliminary studies showed that hepcidin-25 differentiated disorders of iron metabolism. Urine hepcidin is more affected by multiple freeze-thaw cycles and storage conditions, but less influenced by diurnal variation, than is serum hepcidin. Conclusion: SELDI-TOF MS can be used to measure hepcidin in both serum and urine, but serum requires a standardized sampling protocol.

1.1.7.4  Current state and future directions of neurochemical biomarkers for Alzheimer’s disease.

In this comprehensive review, we summarize the current state-of-the-art of neurochemical biomarkers for Alzheimer’s disease. Predominantly, these biomarkers comprise cerebrospinal fluid biomarkers directly related to the pathophysiology of this disorder (such as amyloid beta protein, tau protein). We particularly pay attention to the innovations in this area that have been made in technological aspects during the past 5 years (e.g., multiplex analysis of biomarkers, proteomics), to the discovery of novel, potential biomarkers (e.g., amyloid beta oligomers, isoprostanes), and to the extension of this research towards identification of biomarkers in plasma.

1.1.7.5  Use of SELDI-TOF mass spectrometry for identification of new biomarkers: potential and limitations.

Surface-enhanced laser desorption time of flight mass spectrometry (SELDI-TOF-MS) is an important proteomic technology that is immediately available for the high throughput analysis of complex protein samples. Over the last few years, several studies have demonstrated that comparative protein profiling using SELDI-TOF-MS breaks new ground in diagnostic protein analysis particularly with regard to the identification of novel biomarkers. Importantly, researchers have acquired a better understanding also of the limitations of this technology and various pitfalls in biomarker discovery. Bearing these in mind, great emphasis must be placed on the development of rigorous standards and quality control procedures for the pre-analytical as well as the analytical phase and subsequent bioinformatics applied to analysis of the data. To avoid the risk of false-significant results studies must be designed carefully and control groups accurately selected. In addition, appropriate tools, already established for analysis of highly complex microarray data, need to be applied to protein profiling data. To validate the significance of any candidate biomarker derived from pilot studies in appropriately designed prospective multi-center studies is mandatory; reproducibility of the clinical results must be shown over time and in different diagnostic settings. SELDI-TOF-MS-based studies that are in compliance with these requirements are now required; only a few have been published so far. In the meantime, further evaluation and optimization of both technique and marker validation strategies are called for before MS-based proteomic algorithms can be translated into routine laboratory testing.

Read Full Post »

« Newer Posts - Older Posts »