Important and timely
Archive for the ‘Systemic Inflammatory Response Related Disorders’ Category
Lipid Metabolism
Posted in Atherogenic Processes & Pathology, Cachexia, Cardiovascular Research, Cell Biology, Cerebrovascular and Neurodegenerative Diseases, Chemical Biology and its relations to Metabolic Disease, Curation, Cytoskeleton, Diabetes Mellitus, Dialectic, Discovery process, Disease Biology, Small Molecules in Development of Therapeutic Drugs, Endocrine Diseases, Enzyme Induction, Epigenetics and Cardiovascular Risks, Experimental validation, Explanatory, Frontiers in Cardiology and Cardiovascular Disorders, Gene Regulation, Metabolomics, Myocardial metabolism, Myocardial ischemia, myocardial perfusion, Myocardial adenine nucleotide metabolism, Na-K transport, Na-K-ATPase, Nephrology, Nutrigenomics, Nutrition, Nutritional Supplements: Atherogenesis, lipid metabolism, Origins of Cardiovascular Disease, Oxidative phosphorylation, Personalized and Precision Medicine & Genomic Research, Phosphorylation, Population Health Management, Nutrition and Phytochemistry, Pre-Clinical Animal Model Development, Regulated Clinical Trials: Design, Methods, Components and IRB related issues, Reproductive Andrology, Embryology, Genomic Endocrinology, Preimplantation Genetic Diagnosis and Reproductive Genomics, Signaling, Synaptic vesicle, Systemic Inflammatory Response Related Disorders, Translational Effectiveness, Translational Research, Translational Science, Warburg effect, Water Transporters, tagged Atherosclerosis, Cytokines, diet and cancer, eicosenoids, fatty acid deficiency, Fatty acids, insulin and glucagon, islet cells, Lipid metabolism, Lipids, liver metabolism, oinflammatoty, omega 3 FA, omega 6 FA, omega 6 ftty acid excess, omega-6/omega-3, PPAR gamma, PUFA, total parenteral nutrition, triene/tetraene ratio on August 15, 2014| Leave a Comment »
Lipid Metabolism
Reporter and Curator: Larry H. Bernstein, MD, FCAP
This is fourth of a series of articles, lipid metabolism, that began with signaling and signaling pathways. These discussion lay the groundwork to proceed in later discussions that will take on a somewhat different approach. These are critical to develop a more complete point of view of life processes. I have indicated that many of the protein-protein interactions or protein-membrane interactions and associated regulatory features have been referred to previously, but the focus of the discussion or points made were different. The role of lipids in circulating plasma proteins as biomarkers for coronary vascular disease can be traced to the early work of Frederickson and the classification of lipid disorders. The very critical role of lipids in membrane structure in health and disease has had much less attention, despite the enormous importance, especially in the nervous system.
- Signaling and signaling pathways
- Signaling transduction tutorial.
- Carbohydrate metabolism
3.1 Selected References to Signaling and Metabolic Pathways in Leaders in Pharmaceutical Intelligence
- Lipid metabolism
- Protein synthesis and degradation
- Subcellular structure
- Impairments in pathological states: endocrine disorders; stress hypermetabolism; cancer.
Lipid Metabolism
http://www.elmhurst.edu/~chm/vchembook/622overview.html
Overview of Lipid Catabolism:
The major aspects of lipid metabolism are involved with
- Fatty Acid Oxidationto produce energy or
- the synthesis of lipids which is called Lipogenesis.
The metabolism of lipids and carbohydrates are related by the conversion of lipids from carbohydrates. This can be seen in the diagram. Notice the link through actyl-CoA, the seminal discovery of Fritz Lipmann. The metabolism of both is upset by diabetes mellitus, which results in the release of ketones (2/3 betahydroxybutyric acid) into the circulation.

metabolism of fats
http://www.elmhurst.edu/~chm/vchembook/images/590metabolism.gif
The first step in lipid metabolism is the hydrolysis of the lipid in the cytoplasm to produce glycerol and fatty acids.
Since glycerol is a three carbon alcohol, it is metabolized quite readily into an intermediate in glycolysis, dihydroxyacetone phosphate. The last reaction is readily reversible if glycerol is needed for the synthesis of a lipid.
The hydroxyacetone, obtained from glycerol is metabolized into one of two possible compounds. Dihydroxyacetone may be converted into pyruvic acid, a 3-C intermediate at the last step of glycolysis to make energy.
In addition, the dihydroxyacetone may also be used in gluconeogenesis (usually dependent on conversion of gluconeogenic amino acids) to make glucose-6-phosphate for glucose to the blood or glycogen depending upon what is required at that time.
Fatty acids are oxidized to acetyl CoA in the mitochondria using the fatty acid spiral. The acetyl CoA is then ultimately converted into ATP, CO2, and H2O using the citric acid cycle and the electron transport chain.
There are two major types of fatty acids – ω-3 and ω-6. There are also saturated and unsaturated with respect to the existence of double bonds, and monounsaturated and polyunsatured. Polyunsaturated fatty acids (PUFAs) are important in long term health, and it will be seen that high cardiovascular risk is most associated with a low ratio of ω-3/ω-6, the denominator being from animal fat. Ω-3 fatty acids are readily available from fish, seaweed, and flax seed. More can be said of this later.
Fatty acids are synthesized from carbohydrates and occasionally from proteins. Actually, the carbohydrates and proteins have first been catabolized into acetyl CoA. Depending upon the energy requirements, the acetyl CoA enters the citric acid cycle or is used to synthesize fatty acids in a process known as LIPOGENESIS.
The relationships between lipid and carbohydrate metabolism are
summarized in Figure 2.

fattyacidspiral
http://www.elmhurst.edu/~chm/vchembook/images/620fattyacidspiral.gif
Energy Production Fatty Acid Oxidation:
“Visible” ATP:
In the fatty acid spiral, there is only one reaction which directly uses ATP and that is in the initiating step. So this is a loss of ATP and must be subtracted later.
A large amount of energy is released and restored as ATP during the oxidation of fatty acids. The ATP is formed from both the fatty acid spiral and the citric acid cycle.
Connections to Electron Transport and ATP:
One turn of the fatty acid spiral produces ATP from the interaction of the coenzymes FAD (step 1) and NAD+ (step 3) with the electron transport chain. Total ATP per turn of the fatty acid spiral is:
Electron Transport Diagram – (e.t.c.)
Step 1 – FAD into e.t.c. = 2 ATP
Step 3 – NAD+ into e.t.c. = 3 ATP
Total ATP per turn of spiral = 5 ATP
In order to calculate total ATP from the fatty acid spiral, you must calculate the number of turns that the spiral makes. Remember that the number of turns is found by subtracting one from the number of acetyl CoA produced. See the graphic on the left bottom.
Example with Palmitic Acid = 16 carbons = 8 acetyl groups
Number of turns of fatty acid spiral = 8-1 = 7 turns
ATP from fatty acid spiral = 7 turns and 5 per turn = 35 ATP.
This would be a good time to remember that single ATP that was needed to get the fatty acid spiral started. Therefore subtract it now.
NET ATP from Fatty Acid Spiral = 35 – 1 = 34 ATP
Review ATP Summary for Citric Acid Cycle:The acetyl CoA produced from the fatty acid spiral enters the citric acid cycle. When calculating ATP production, you have to show how many acetyl CoA are produced from a given fatty acid as this controls how many “turns” the citric acid cycle makes.Starting with acetyl CoA, how many ATP are made using the citric acid cycle? E.T.C = electron transport chain
|
ATP Summary for Palmitic Acid – Complete Metabolism:The phrase “complete metabolism” means do reactions until you end up with carbon dioxide and water. This also means to use fatty acid spiral, citric acid cycle, and electron transport as needed.Starting with palmitic acid (16 carbons) how many ATP are made using fatty acid spiral? This is a review of the above panel E.T.C = electron transport chain
The fatty acid spiral ends with the production of 8 acetyl CoA from the 16 carbon palmitic acid. Starting with one acetyl CoA, how many ATP are made using the citric acid cycle? Above panel gave the answer of 12 ATP per acetyl CoA. E.T.C = electron transport chain
|
Fyodor Lynen
Feodor Lynen was born in Munich on 6 April 1911, the son of Wilhelm Lynen, Professor of Mechanical Engineering at the Munich Technische Hochschule. He received his Doctorate in Chemistry from Munich University under Heinrich Wieland, who had won the Nobel Prize for Chemistry in 1927, in March 1937 with the work: «On the Toxic Substances in Amanita». in 1954 he became head of the Max-Planck-Institut für Zellchemie, newly created for him as a result of the initiative of Otto Warburg and Otto Hahn, then President of the Max-Planck-Gesellschaft zur Förderung der Wissenschaften.
Lynen’s work was devoted to the elucidation of the chemical details of metabolic processes in living cells, and of the mechanisms of metabolic regulation. The problems tackled by him, in conjunction with German and other workers, include the Pasteur effect, acetic acid degradation in yeast, the chemical structure of «activated acetic acid» of «activated isoprene», of «activated carboxylic acid», and of cytohaemin, degradation of fatty acids and formation of acetoacetic acid, degradation of tararic acid, biosynthesis of cysteine, of terpenes, of rubber, and of fatty acids.
In 1954 Lynen received the Neuberg Medal of the American Society of European Chemists and Pharmacists, in 1955 the Liebig Commemorative Medal of the Gesellschaft Deutscher Chemiker, in 1961 the Carus Medal of the Deutsche Akademie der Naturforscher «Leopoldina», and in 1963 the Otto Warburg Medal of the Gesellschaft für Physiologische Chemie. He was also a member of the U>S> National Academy of Sciences, and shared the Nobel Prize in Physiology and Medicine with Konrad Bloch in 1964, and was made President of the Gesellschaft Deutscher Chemiker (GDCh) in 1972.
This biography was written at the time of the award and first published in the book series Les Prix Nobel. It was later edited and republished in Nobel Lectures, and shortened by myself.
The Pathway from “Activated Acetic Acid” to the Terpenes and Fatty Acids
My first contact with dynamic biochemistry in 1937 occurred at an exceedingly propitious time. The remarkable investigations on the enzyme chain of respiration, on the oxygen-transferring haemin enzyme of respiration, the cytochromes, the yellow enzymes, and the pyridine proteins had thrown the first rays of light on the chemical processes underlying the mystery of biological catalysis, which had been recognised by your famous countryman Jöns Jakob Berzelius. Vitamin B2 , which is essential to the nourishment of man and of animals, had been recognised by Hugo Theorell in the form of the phosphate ester as the active group of an important class of enzymes, and the fermentation processes that are necessary for Pasteur’s “life without oxygen”
had been elucidated as the result of a sequence of reactions centered around “hydrogen shift” and “phosphate shift” with adenosine triphosphate as the phosphate-transferring coenzyme. However, 1,3-diphosphoglyceric acid, the key substance to an understanding of the chemical relation between oxidation and phosphorylation, still lay in the depths of the unknown. Never-
theless, Otto Warburg was on its trail in the course of his investigations on the fermentation enzymes, and he was able to present it to the world in 1939.
This was the period in which I carried out my first independent investigation, which was concerned with the metabolism of yeast cells after freezing in liquid air, and which brought me directly into contact with the mechanism of alcoholic fermentation. This work taught me a great deal, and yielded two important pieces of information.
- The first was that in experiments with living cells, special attention must be given to the permeability properties of the cell membranes, and
- the second was that the adenosine polyphosphate system plays a vital part in the cell,
- not only in energy transfer, but
- also in the regulation of the metabolic processes.
.
This investigation aroused by interest in problems of metabolic regulation, which led me to the investigation of the Pasteur effects, and has remained with me to the present day.
My subsequent concern with the problem of the acetic acid metabolism arose from my stay at Heinrich Wieland’s laboratory. Workers here had studied the oxidation of acetic acid by yeast cells, and had found that though most of the acetic acid undergoes complete oxidation, some remains in the form of succinic and citric acids.
The explanation of these observations was provided-by the Thunberg-Wieland process, according to which two molecules of acetic acid are dehydrogenated to succinic acid, which is converted back into acetic acid via oxaloacetic acid, pyruvic acid, and acetaldehyde, or combines at the oxaloacetic acid stage with a further molecule of acetic acid to form citric acid (Fig. 1). However, an experimental check on this view by a Wieland’s student Robert Sonderhoffs brought a surprise. The citric acid formed when trideuteroacetic acid was supplied to yeast cells contained the expected quantity of deuterium, but the succinic acid contained only half of the four deuterium atoms required by Wieland’s scheme.
This investigation aroused by interest in problems of metabolic regulation, which led me to the investigation of the Pasteur effects, and has remained with me to the present day. My subsequent concern with the problem of the acetic acid metabolism arose from my stay at Heinrich Wieland’s laboratory. Workers here had studied the oxidation of acetic acid by yeast cells, and had found that though most of the acetic acid undergoes complete oxidation, some remains in the form of succinic and citric acid
The answer provided by Martius was that citric acid is in equilibrium with isocitric acid and is oxidised to cr-ketoglutaric acid, the conversion of which into succinic acid had already been discovered by Carl Neuberg (Fig. 1).
It was possible to assume with fair certainty from these results that the succinic acid produced by yeast from acetate is formed via citric acid. Sonderhoff’s experiments with deuterated acetic acid led to another important discovery.
In the analysis of the yeast cells themselves, it was found that while the carbohydrate fraction contained only insignificant quantities of deuterium, large quantities of heavy hydrogen were present in the fatty acids formed and in the sterol fraction. This showed that
- fatty acids and sterols were formed directly from acetic acid, and not indirectly via the carbohydrates.
As a result of Sonderhoff’s early death, these important findings were not pursued further in the Munich laboratory.
- This situation was elucidated only by Konrad Bloch’s isotope experiments, on which he reports.
My interest first turned entirely to the conversion of acetic acid into citric acid, which had been made the focus of the aerobic degradation of carbohydrates by the formulation of the citric acid cycle by Hans Adolf Krebs. Unlike Krebs, who regarded pyruvic acid as the condensation partner of acetic acid,
- we were firmly convinced, on the basis of the experiments on yeast, that pyruvic acid is first oxidised to acetic acid, and only then does the condensation take place.
Further progress resulted from Wieland’s observation that yeast cells that had been “impoverished” in endogenous fuels by shaking under oxygen were able to oxidise added acetic acid only after a certain “induction period” (Fig. 2). This “induction period” could be shortened by addition of small quantities of a readily oxidisable substrate such as ethyl alcohol, though propyl and butyl alcohol were also effective. I explained this by assuming that acetic acid is converted, at the expense of the oxidation of the alcohol, into an “activated acetic acid”, and can only then condense with oxalacetic acid.
In retrospect, we find that I had come independently on the same group of problems as Fritz Lipmann, who had discovered that inorganic phosphate is indispensable to the oxidation of pyruvic acid by lactobacilli, and had detected acetylphosphate as an oxidation product. Since this anhydride of acetic acid and phosphoric acid could be assumed to be the “activated acetic acid”.
I learned of the advances that had been made in the meantime in the investigation of the problem of “activated acetic acid”. Fritz Lipmann has described the development at length in his Nobel Lecture’s, and I need not repeat it. The main advance was the recognition that the formation of “activated acetic acid” from acetate involved not only ATP as an energy source, but also the newly discovered coenzyme A, which contains the vitamin pantothenic acid, and that “activated acetic acid” was probably an acetylated coenzyme A.
http://www.nobelprize.org/nobel_prizes/medicine/laureates/1964/lynen-bio.html
Fyodor Lynen
Lynen’s most important research at the University of Munich focused on intermediary metabolism, cholesterol synthesis, and fatty acid biosynthesis. Metabolism involves all the chemical processes by which an organism converts matter and energy into forms that it can use. Metabolism supplies the matter—the molecular building blocks an organism needs for the growth of new tissues. These building blocks must either come from the breakdown of molecules of food, such as glucose (sugar) and fat, or be built up from simpler molecules within the organism.
Cholesterol is one of the fatty substances found in animal tissues. The human body produces cholesterol, but this substance also enters the body in food. Meats, egg yolks, and milk products, such as butter and cheese, contain cholesterol. Such organs as the brain and liver contain much cholesterol. Cholesterol is a type of lipid, one of the classes of chemical compounds essential to human health. It makes up an important part of the membranes of each cell in the body. The body also uses cholesterol to produce vitamin D and certain hormones.
All fats are composed of an alcohol called glycerol and substances called fatty acids. A fatty acid consists of a long chain of carbon atoms, to which hydrogen atoms are attached. There are three types of fatty acids: saturated, monounsaturated, and polyunsaturated.
Living cells manufacture complicated chemical compounds from simpler substances through a process called biosynthesis. For example, simple molecules called amino acids are put together to make proteins. The biosynthesis of both fatty acids and cholesterol begins with a chemically active form of acetate, a two-carbon molecule. Lynen discovered that the active form of acetate is a coenzyme, a heat-stabilized, water-soluble portion of an enzyme, called acetyl coenzyme A. Lynen and his colleagues demonstrated that the formation of cholesterol begins with the condensation of two molecules of acetyl coenzyme A to form acetoacetyl coenzyme A, a four-carbon molecule.
http://science.howstuffworks.com/dictionary/famous-scientists/biologists/feodor-lynen-info.htm

Fyodor Lynen
SREBPs: activators of the complete program of cholesterol and fatty acid synthesis in the liver
Jay D. Horton1,2, Joseph L. Goldstein1 and Michael S. Brown1
1Department of Molecular Genetics, and
2Department of Internal Medicine, University of Texas Southwestern Medical Center, Dallas, Texas, USA
J Clin Invest. 2002;109(9):1125–1131.
http://dx.doi.org:/10.1172/JCI15593
Lipid homeostasis in vertebrate cells is regulated by a family of membrane-bound transcription factors designated sterol regulatory element–binding proteins (SREBPs). SREBPs directly activate the expression of more than 30 genes dedicated to the synthesis and uptake of cholesterol, fatty acids, triglycerides, and phospholipids, as well as the NADPH cofactor required to synthesize these molecules (1–4). In the liver, three SREBPs regulate the production of lipids for export into the plasma as lipoproteins and into the bile as micelles. The complex, interdigitated roles of these three SREBPs have been dissected through the study of ten different lines of gene-manipulated mice. These studies form the subject of this review.
SREBPs: activation through proteolytic processing
SREBPs belong to the basic helix-loop-helix–leucine zipper (bHLH-Zip) family of transcription factors, but they differ from other bHLH-Zip proteins in that they are synthesized as inactive precursors bound to the endoplasmic reticulum (ER) (1, 5). Each SREBP precursor of about 1150 amino acids is organized into three domains: (a) an NH2-terminal domain of about 480 amino acids that contains the bHLH-Zip region for binding DNA; (b) two hydrophobic transmembrane–spanning segments interrupted by a short loop of about 30 amino acids that projects into the lumen of the ER; and (c) a COOH-terminal domain of about 590 amino acids that performs the essential regulatory function described below.
In order to reach the nucleus and act as a transcription factor, the NH2-terminal domain of each SREBP must be released from the membrane proteolytically (Figure 1). Three proteins required for SREBP processing have been delineated in cultured cells, using the tools of somatic cell genetics (see ref. 5for review). One is an escort protein designated SREBP cleavage–activating protein (SCAP). The other two are proteases, designated Site-1 protease (S1P) and Site-2 protease (S2P). Newly synthesized SREBP is inserted into the membranes of the ER, where its COOH-terminal regulatory domain binds to the COOH-terminal domain of SCAP (Figure 1).
Figure 1

Model for the sterol-mediated proteolytic release of SREBPs from membranes JCI0215593.f1
Model for the sterol-mediated proteolytic release of SREBPs from membranes. SCAP is a sensor of sterols and an escort of SREBPs. When cells are depleted of sterols, SCAP transports SREBPs from the ER to the Golgi apparatus, where two proteases, Site-1 protease (S1P) and Site-2 protease (S2P), act sequentially to release the NH2-terminal bHLH-Zip domain from the membrane. The bHLH-Zip domain enters the nucleus and binds to a sterol response element (SRE) in the enhancer/promoter region of target genes, activating their transcription. When cellular cholesterol rises, the SCAP/SREBP complex is no longer incorporated into ER transport vesicles, SREBPs no longer reach the Golgi apparatus, and the bHLH-Zip domain cannot be released from the membrane. As a result, transcription of all target genes declines. Reprinted from ref. 5 with permission.
http://dm5migu4zj3pb.cloudfront.net/manuscripts/15000/15593/large/JCI0215593.f1.jpg
SCAP is both an escort for SREBPs and a sensor of sterols. When cells become depleted in cholesterol, SCAP escorts the SREBP from the ER to the Golgi apparatus, where the two proteases reside. In the Golgi apparatus, S1P, a membrane-bound serine protease, cleaves the SREBP in the luminal loop between its two membrane-spanning segments, dividing the SREBP molecule in half (Figure 1). The NH2-terminal bHLH-Zip domain is then released from the membrane via a second cleavage mediated by S2P, a membrane-bound zinc metalloproteinase. The NH2-terminal domain, designated nuclear SREBP (nSREBP), translocates to the nucleus, where it activates transcription by binding to nonpalindromic sterol response elements (SREs) in the promoter/enhancer regions of multiple target genes.
When the cholesterol content of cells rises, SCAP senses the excess cholesterol through its membranous sterol-sensing domain, changing its conformation in such a way that the SCAP/SREBP complex is no longer incorporated into ER transport vesicles. The net result is that SREBPs lose their access to S1P and S2P in the Golgi apparatus, so their bHLH-Zip domains cannot be released from the ER membrane, and the transcription of target genes ceases (1, 5). The biophysical mechanism by which SCAP senses sterol levels in the ER membrane and regulates its movement to the Golgi apparatus is not yet understood. Elucidating this mechanism will be fundamental to understanding the molecular basis of cholesterol feedback inhibition of gene expression.
SREBPs: two genes, three proteins
The mammalian genome encodes three SREBP isoforms, designated SREBP-1a, SREBP-1c, and SREBP-2. SREBP-2 is encoded by a gene on human chromosome 22q13. Both SREBP-1a and -1c are derived from a single gene on human chromosome 17p11.2 through the use of alternative transcription start sites that produce alternate forms of exon 1, designated 1a and 1c (1). SREBP-1a is a potent activator of all SREBP-responsive genes, including those that mediate the synthesis of cholesterol, fatty acids, and triglycerides. High-level transcriptional activation is dependent on exon 1a, which encodes a longer acidic transactivation segment than does the first exon of SREBP-1c. The roles of SREBP-1c and SREBP-2 are more restricted than that of SREBP-1a. SREBP-1c preferentially enhances transcription of genes required for fatty acid synthesis but not cholesterol synthesis. Like SREBP-1a, SREBP-2 has a long transcriptional activation domain, but it preferentially activates cholesterol synthesis (1). SREBP-1a and SREBP-2 are the predominant isoforms of SREBP in most cultured cell lines, whereas SREBP-1c and SREBP-2 predominate in the liver and most other intact tissues (6).
When expressed at higher than physiologic levels, each of the three SREBP isoforms can activate all enzymes indicated in Figure 2, which shows the biosynthetic pathways used to generate cholesterol and fatty acids. However, at normal levels of expression, SREBP-1c favors the fatty acid biosynthetic pathway and SREBP-2 favors cholesterologenesis. SREBP-2–responsive genes in the cholesterol biosynthetic pathway include those for the enzymes HMG-CoA synthase, HMG-CoA reductase, farnesyl diphosphate synthase, and squalene synthase. SREBP-1c–responsive genes include those for ATP citrate lyase (which produces acetyl-CoA) and acetyl-CoA carboxylase and fatty acid synthase (which together produce palmitate [C16:0]). Other SREBP-1c target genes encode a rate-limiting enzyme of the fatty acid elongase complex, which converts palmitate to stearate (C18:0) (ref.7); stearoyl-CoA desaturase, which converts stearate to oleate (C18:1); and glycerol-3-phosphate acyltransferase, the first committed enzyme in triglyceride and phospholipid synthesis (3). Finally, SREBP-1c and SREBP-2 activate three genes required to generate NADPH, which is consumed at multiple stages in these lipid biosynthetic pathways (8) (Figure 2).

major metabolic intermediates in the pathways for synthesis of cholesterol, fatty acids, and triglycerides JCI0215593.f2
http://dm5migu4zj3pb.cloudfront.net/manuscripts/15000/15593/large/JCI0215593.f2.jpg
Genes regulated by SREBPs. The diagram shows the major metabolic intermediates in the pathways for synthesis of cholesterol, fatty acids, and triglycerides. In vivo, SREBP-2 preferentially activates genes of cholesterol metabolism, whereas SREBP-1c preferentially activates genes of fatty acid and triglyceride metabolism. DHCR, 7-dehydrocholesterol reductase; FPP, farnesyl diphosphate; GPP, geranylgeranyl pyrophosphate synthase; CYP51, lanosterol 14α-demethylase; G6PD, glucose-6-phosphate dehydrogenase; PGDH, 6-phosphogluconate dehydrogenase; GPAT, glycerol-3-phosphate acyltransferase.
Genes regulated by SREBPs. The diagram shows the major metabolic intermediates in the pathways for synthesis of cholesterol, fatty acids, and triglycerides. In vivo, SREBP-2 preferentially activates genes of cholesterol metabolism, whereas SREBP-1c preferentially activates genes of fatty acid and triglyceride metabolism. DHCR, 7-dehydrocholesterol reductase; FPP, farnesyl diphosphate; GPP, geranylgeranyl pyrophosphate synthase; CYP51, lanosterol 14α-demethylase; G6PD, glucose-6-phosphate dehydrogenase; PGDH, 6-phosphogluconate dehydrogenase; GPAT, glycerol-3-phosphate acyltransferase.
Knockout and transgenic mice
Ten different genetically manipulated mouse models that either lack or overexpress a single component of the SREBP pathway have been generated in the last 6 years (9–16). The key molecular and metabolic alterations observed in these mice are summarized in Table 1.
Table 1
Alterations in hepatic lipid metabolism in gene-manipulated mice overexpressing or lacking SREBPs
http://dm5migu4zj3pb.cloudfront.net/manuscripts/15000/15593/small/JCI0215593.t1.gif
Knockout mice that lack all nSREBPs die early in embryonic development. For instance, a germline deletion of S1p, which prevents the processing of all SREBP isoforms, results in death before day 4 of development (15, 17). Germline deletion of Srebp2 leads to 100% lethality at a later stage of embryonic development than does deletion of S1p (embryonic day 7–8). In contrast, germline deletion of Srebp1, which eliminates both the 1a and the 1c transcripts, leads to partial lethality, in that about 15–45% of Srebp1–/– mice survive (13). The surviving homozygotes manifest elevated levels of SREBP-2 mRNA and protein (Table 1), which presumably compensates for the loss of SREBP-1a and -1c. When the SREBP-1c transcript is selectively eliminated, no embryonic lethality is observed, suggesting that the partial embryonic lethality in the Srebp1–/– mice is due to the loss of the SREBP-1a transcript (16).
To bypass embryonic lethality, we have produced mice in which all SREBP function can be disrupted in adulthood through induction of Cre recombinase. For this purpose, loxP recombination sites were inserted into genomic regions that flank crucial exons in the Scap or S1p genes (so-called floxed alleles) (14, 15). Mice homozygous for the floxed gene and heterozygous for a Cre recombinase transgene, which is under control of an IFN-inducible promoter (MX1-Cre), can be induced to delete Scap or S1p by stimulating IFN expression. Thus, following injection with polyinosinic acid–polycytidylic acid, a double-stranded RNA that provokes antiviral responses, the Cre recombinase is produced in liver and disrupts the floxed gene by recombination between the loxP sites.
Cre-mediated disruption of Scap or S1p dramatically reduces nSREBP-1 and nSREBP-2 levels in liver and diminishes expression of all SREBP target genes in both the cholesterol and the fatty acid synthetic pathways (Table 1). As a result, the rates of synthesis of cholesterol and fatty acids fall by 70–80% in Scap- and S1p-deficient livers.
In cultured cells, the processing of SREBP is inhibited by sterols, and the sensor for this inhibition is SCAP (5). To learn whether SCAP performs the same function in liver, we have produced transgenic mice that express a mutant SCAP with a single amino acid substitution in the sterol-sensing domain (D443N) (12). Studies in tissue culture show that SCAP(D443N) is resistant to inhibition by sterols. Cells that express a single copy of this mutant gene overproduce cholesterol (18). Transgenic mice that express this mutant version of SCAP in the liver exhibit a similar phenotype (12). These livers manifest elevated levels of nSREBP-1 and nSREBP-2, owing to constitutive SREBP processing, which is not suppressed when the animals are fed a cholesterol-rich diet. nSREBP-1 and -2 increase the expression of all SREBP target genes shown in Figure 2, thus stimulating cholesterol and fatty acid synthesis and causing a marked accumulation of hepatic cholesterol and triglycerides (Table 1). This transgenic model provides strong in vivo evidence that SCAP activity is normally under partial inhibition by endogenous sterols, which keeps the synthesis of cholesterol and fatty acids in a partially repressed state in the liver.
http://dm5migu4zj3pb.cloudfront.net/manuscripts/15000/15593/small/JCI0215593.t1.gif
Function of individual SREBP isoforms in vivo
To study the functions of individual SREBPs in the liver, we have produced transgenic mice that overexpress truncated versions of SREBPs (nSREBPs) that terminate prior to the membrane attachment domain. These nSREBPs enter the nucleus directly, bypassing the sterol-regulated cleavage step. By studying each nSREBP isoform separately, we could determine their distinct activating properties, albeit when overexpressed at nonphysiologic levels.
Overexpression of nSREBP-1c in the liver of transgenic mice produces a triglyceride-enriched fatty liver with no increase in cholesterol (10). mRNAs for fatty acid synthetic enzymes and rates of fatty acid synthesis are elevated fourfold in this tissue, whereas the mRNAs for cholesterol synthetic enzymes and the rate of cholesterol synthesis are not increased (8). Conversely, overexpression of nSREBP-2 in the liver increases the mRNAs only fourfold. This increase in cholesterol synthesis is even more remarkable when encoding all cholesterol biosynthetic enzymes; the most dramatic is a 75-fold increase in HMG-CoA reductase mRNA (11). mRNAs for fatty acid synthesis enzymes are increased to a lesser extent, consistent with the in vivo observation that the rate of cholesterol synthesis increases 28-fold in these transgenic nSREBP-2 livers, while fatty acid synthesis increases one considers the extent of cholesterol overload in this tissue, which would ordinarily reduce SREBP processing and essentially abolish cholesterol synthesis (Table 1).
http://dm5migu4zj3pb.cloudfront.net/manuscripts/15000/15593/small/JCI0215593.t1.gif
We have also studied the consequences of overexpressing SREBP-1a, which is expressed only at low levels in the livers of adult mice, rats, hamsters, and humans (6). nSREBP-1a transgenic mice develop a massive fatty liver engorged with both cholesterol and triglycerides (9), with heightened expression of genes controlling cholesterol biosynthesis and, still more dramatically, fatty acid synthesis (Table 1). The preferential activation of fatty acid synthesis (26-fold increase) relative to cholesterol synthesis (fivefold increase) explains the greater accumulation of triglycerides in their livers. The relative representation of the various fatty acids accumulating in this tissue is also unusual. Transgenic nSREBP-1a livers contain about 65% oleate (C18:1), markedly higher levels than the 15–20% found in typical wild-type livers (8) — a result of the induction of fatty acid elongase and stearoyl-CoA desaturase-1 (7). Considered together, the overexpression studies indicate that both SREBP-1 isoforms show a relative preference for activating fatty acid synthesis, whereas SREBP-2 favors cholesterol.
The phenotype of animals lacking the Srebp1 gene, which encodes both the SREBP-1a and -1c transcripts, also supports the notion of distinct hepatic functions for SREBP-1 and SREBP-2 (13). Most homozygous SREBP-1 knockout mice die in utero. The surviving Srebp1–/– mice show reduced synthesis of fatty acids, owing to reduced expression of mRNAs for fatty acid synthetic enzymes (Table 1). Hepatic nSREBP-2 levels increase in these mice, presumably in compensation for the loss of nSREBP-1. As a result, transcription of cholesterol biosynthetic genes increases, producing a threefold increase in hepatic cholesterol synthesis (Table 1).
http://dm5migu4zj3pb.cloudfront.net/manuscripts/15000/15593/small/JCI0215593.t1.gif
The studies in genetically manipulated mice clearly show that, as in cultured cells, SCAP and S1P are required for normal SREBP processing in the liver. SCAP, acting through its sterol-sensing domain, mediates feedback regulation of cholesterol synthesis. The SREBPs play related but distinct roles: SREBP-1c, the predominant SREBP-1 isoform in adult liver, preferentially activates genes required for fatty acid synthesis, while SREBP-2 preferentially activates the LDL receptor gene and various genes required for cholesterol synthesis. SREBP-1a and SREBP-2, but not SREBP-1c, are required for normal embryogenesis.
Transcriptional regulation of SREBP genes
Regulation of SREBPs occurs at two levels — transcriptional and posttranscriptional. The posttranscriptional regulation discussed above involves the sterol-mediated suppression of SREBP cleavage, which results from sterol-mediated suppression of the movement of the SCAP/SREBP complex from the ER to the Golgi apparatus (Figure 1). This form of regulation is manifest not only in cultured cells (1), but also in the livers of rodents fed cholesterol-enriched diets (19).
http://dm5migu4zj3pb.cloudfront.net/manuscripts/15000/15593/small/JCI0215593.f1.gif
The transcriptional regulation of the SREBPs is more complex. SREBP-1c and SREBP-2 are subject to distinct forms of transcriptional regulation, whereas SREBP-1a appears to be constitutively expressed at low levels in liver and most other tissues of adult animals (6). One mechanism of regulation shared by SREBP-1c and SREBP-2 involves a feed-forward regulation mediated by SREs present in the enhancer/promoters of each gene (20, 21). Through this feed-forward loop, nSREBPs activate the transcription of their own genes. In contrast, when nSREBPs decline, as in Scap or S1p knockout mice, there is a secondary decline in the mRNAs encoding SREBP-1c and SREBP-2 (14, 15).
Three factors selectively regulate the transcription of SREBP-1c: liver X-activated receptors (LXRs), insulin, and glucagon. LXRα and LXRβ, nuclear receptors that form heterodimers with retinoid X receptors, are activated by a variety of sterols, including oxysterol intermediates that form during cholesterol biosynthesis (22–24). An LXR-binding site in the SREBP-1c promoter activates SREBP-1c transcription in the presence of LXR agonists (23). The functional significance of LXR-mediated SREBP-1c regulation has been confirmed in two animal models. Mice that lack both LXRα and LXRβ express reduced levels of SREBP-1c and its lipogenic target enzymes in liver and respond relatively weakly to treatment with a synthetic LXR agonist (23). Because a similar blunted response is found in mice that lack SREBP-1c, it appears that LXR increases fatty acid synthesis largely by inducing SREBP-1c (16). LXR-mediated activation of SREBP-1c transcription provides a mechanism for the cell to induce the synthesis of oleate when sterols are in excess (23). Oleate is the preferred fatty acid for the synthesis of cholesteryl esters, which are necessary for both the transport and the storage of cholesterol.
LXR-mediated regulation of SREBP-1c appears also to be one mechanism by which unsaturated fatty acids suppress SREBP-1c transcription and thus fatty acid synthesis. Rodents fed diets enriched in polyunsaturated fatty acids manifest reduced SREBP-1c mRNA expression and low rates of lipogenesis in liver (25). In vitro, unsaturated fatty acids competitively block LXR activation of SREBP-1c expression by antagonizing the activation of LXR by its endogenous ligands (26). In addition to LXR-mediated transcriptional inhibition, polyunsaturated fatty acids lower SREBP-1c levels by accelerating degradation of its mRNA (27). These combined effects may contribute to the long-recognized ability of polyunsaturated fatty acids to lower plasma triglyceride levels.
SREBP-1c and the insulin/glucagon ratio
The liver is the organ responsible for the conversion of excess carbohydrates to fatty acids to be stored as triglycerides or burned in muscle. A classic action of insulin is to stimulate fatty acid synthesis in liver during times of carbohydrate excess. The action of insulin is opposed by glucagon, which acts by raising cAMP. Multiple lines of evidence suggest that insulin’s stimulatory effect on fatty acid synthesis is mediated by an increase in SREBP-1c. In isolated rat hepatocytes, insulin treatment increases the amount of mRNA for SREBP-1c in parallel with the mRNAs of its target genes (28, 29). The induction of the target genes can be blocked if a dominant negative form of SREBP-1c is expressed (30). Conversely, incubating primary hepatocytes with glucagon or dibutyryl cAMP decreases the mRNAs for SREBP-1c and its associated lipogenic target genes (30, 31).
In vivo, the total amount of SREBP-1c in liver and adipose tissue is reduced by fasting, which suppresses insulin and increases glucagon levels, and is elevated by refeeding (32, 33). The levels of mRNA for SREBP-1c target genes parallel the changes in SREBP-1c expression. Similarly, SREBP-1c mRNA levels fall when rats are treated with streptozotocin, which abolishes insulin secretion, and rise after insulin injection (29). Overexpression of nSREBP-1c in livers of transgenic mice prevents the reduction in lipogenic mRNAs that normally follows a fall in plasma insulin levels (32). Conversely, in livers of Scap knockout mice that lack all nSREBPs in the liver (14) or knockout mice lacking either nSREBP-1c (16) or both SREBP-1 isoforms (34), there is a marked decrease in the insulin-induced stimulation of lipogenic gene expression that normally occurs after fasting/refeeding. It should be noted that insulin and glucagon also exert a posttranslational control of fatty acid synthesis though changes in the phosphorylation and activation of acetyl-CoA carboxylase. The posttranslational regulation of fatty acid synthesis persists in transgenic mice that overexpress nSREBP-1c (10). In these mice, the rates of fatty acid synthesis, as measured by [3H]water incorporation, decline after fasting even though the levels of the lipogenic mRNAs remain high (our unpublished observations).
Taken together, the above evidence suggests that SREBP-1c mediates insulin’s lipogenic actions in liver. Recent in vitro and in vivo studies involving adenoviral gene transfer suggest that SREBP-1c may also contribute to the regulation of glucose uptake and glucose synthesis. When overexpressed in hepatocytes, nSREBP-1c induces expression of glucokinase, a key enzyme in glucose utilization. It also suppresses phosphoenolpyruvate carboxykinase, a key gluconeogenic enzyme (35, 36).
SREBPs in disease
Many individuals with obesity and insulin resistance also have fatty livers, one of the most commonly encountered liver abnormalities in the US (37). A subset of individuals with fatty liver go on to develop fibrosis, cirrhosis, and liver failure. Evidence indicates that the fatty liver of insulin resistance is caused by SREBP-1c, which is elevated in response to the high insulin levels. Thus, SREBP-1c levels are elevated in the fatty livers of obese (ob/ob) mice with insulin resistance and hyperinsulinemia caused by leptin deficiency (38, 39). Despite the presence of insulin resistance in peripheral tissues, insulin continues to activate SREBP-1c transcription and cleavage in the livers of these insulin-resistant mice. The elevated nSREBP-1c increases lipogenic gene expression, enhances fatty acid synthesis, and accelerates triglyceride accumulation (31, 39). These metabolic abnormalities are reversed with the administration of leptin, which corrects the insulin resistance and lowers the insulin levels (38).
Metformin, a biguanide drug used to treat insulin-resistant diabetes, reduces hepatic nSREBP-1 levels and dramatically lowers the lipid accumulation in livers of insulin-resistant ob/ob mice (40). Metformin stimulates AMP-activated protein kinase (AMPK), an enzyme that inhibits lipid synthesis through phosphorylation and inactivation of key lipogenic enzymes (41). In rat hepatocytes, metformin-induced activation of AMPK also leads to decreased mRNA expression of SREBP-1c and its lipogenic target genes (41), but the basis of this effect is not understood.
The incidence of coronary artery disease increases with increasing plasma LDL-cholesterol levels, which in turn are inversely proportional to the levels of hepatic LDL receptors. SREBPs stimulate LDL receptor expression, but they also enhance lipid synthesis (1), so their net effect on plasma lipoprotein levels depends on a balance between opposing effects. In mice, the plasma levels of lipoproteins tend to fall when SREBPs are either overexpressed or underexpressed. In transgenic mice that overexpress nSREBPs in liver, plasma cholesterol and triglycerides are generally lower than in control mice (Table 1), even though these mice massively overproduce fatty acids, cholesterol, or both. Hepatocytes of nSREBP-1a transgenic mice overproduce VLDL, but these particles are rapidly removed through the action of LDL receptors, and they do not accumulate in the plasma. Indeed, some nascent VLDL particles are degraded even before secretion by a process that is mediated by LDL receptors (42). The high levels of nSREBP-1a in these animals support continued expression of the LDL receptor, even in cells whose cholesterol concentration is elevated. In LDL receptor–deficient mice carrying the nSREBP-1a transgene, plasma cholesterol and triglyceride levels rise tenfold (43).
Mice that lack all SREBPs in liver as a result of disruption of Scap or S1p also manifest lower plasma cholesterol and triglyceride levels (Table 1).
http://dm5migu4zj3pb.cloudfront.net/manuscripts/15000/15593/small/JCI0215593.t1.gif
In these mice, hepatic cholesterol and triglyceride synthesis is markedly reduced, and this likely causes a decrease in VLDL production and secretion. LDL receptor mRNA and LDL clearance from plasma is also significantly reduced in these mice, but the reduction in LDL clearance is less than the overall reduction in VLDL secretion, the net result being a decrease in plasma lipid levels (15). However, because
humans and mice differ substantially with regard to LDL receptor expression, LDL levels, and other aspects of lipoprotein metabolism,
it is difficult to predict whether human plasma lipids will rise or fall when the SREBP pathway is blocked or activated.
SREBPs in liver: unanswered questions
The studies of SREBPs in liver have exposed a complex regulatory system whose individual parts are coming into focus. Major unanswered questions relate to the ways in which the transcriptional and posttranscriptional controls on SREBP activity are integrated so as to permit independent regulation of cholesterol and fatty acid synthesis in specific nutritional states. A few clues regarding these integration mechanisms are discussed below.
Whereas cholesterol synthesis depends almost entirely on SREBPs, fatty acid synthesis is only partially dependent on these proteins. This has been shown most clearly in cultured nonhepatic cells such as Chinese hamster ovary cells. In the absence of SREBP processing, as when the Site-2 protease is defective, the levels of mRNAs encoding cholesterol biosynthetic enzymes and the rates of cholesterol synthesis decline nearly to undetectable levels, whereas the rate of fatty acid synthesis is reduced by only 30% (44). Under these conditions, transcription of the fatty acid biosynthetic genes must be maintained by factors other than SREBPs. In liver, the gene encoding fatty acid synthase (FASN) can be activated transcriptionally by upstream stimulatory factor, which acts in concert with SREBPs (45). The FASN promoter also contains an LXR element that permits a low-level response to LXR ligands even when SREBPs are suppressed (46). These two transcription factors may help to maintain fatty acid synthesis in liver when nSREBP-1c is low.
Another mechanism of differential regulation is seen in the ability of cholesterol to block the processing of SREBP-2, but not SREBP-1, under certain metabolic conditions. This differential regulation has been studied most thoroughly in cultured cells such as human embryonic kidney (HEK-293) cells. When these cells are incubated in the absence of fatty acids and cholesterol, the addition of sterols blocks processing of SREBP-2, but not SREBP-1, which is largely produced as SREBP-1a in these cells (47). Inhibition of SREBP-1 processing requires an unsaturated fatty acid, such as oleate or arachidonate, in addition to sterols (47). In the absence of fatty acids and in the presence of sterols, SCAP may be able to carry SREBP-1 proteins, but not SREBP-2, to the Golgi apparatus. Further studies are necessary to document this apparent independent regulation of SREBP-1 and SREBP-2 processing and to determine its mechanism.
Acknowledgments
Support for the research cited from the authors’ laboratories was provided by grants from the NIH (HL-20948), the Moss Heart Foundation, the Keck Foundation, and the Perot Family Foundation. J.D. Horton is a Pew Scholar in the Biomedical Sciences and is the recipient of an Established Investigator Grant from the American Heart Association and a Research Scholar Award from the American Digestive Health Industry.
References
- Brown, MS, Goldstein, JL. The SREBP pathway: regulation of cholesterol metabolism by proteolysis of a membrane-bound transcription factor. Cell 1997. 89:331-340.
View this article via: PubMed
- Horton, JD, Shimomura, I. Sterol regulatory element-binding proteins: activators of cholesterol and fatty acid biosynthesis. Curr Opin Lipidol 1999. 10:143-150.
View this article via: PubMed
- Edwards, PA, Tabor, D, Kast, HR, Venkateswaran, A. Regulation of gene expression by SREBP and SCAP. Biochim Biophys Acta 2000. 1529:103-113.
View this article via: PubMed
- Sakakura, Y, et al. Sterol regulatory element-binding proteins induce an entire pathway of cholesterol synthesis. Biochem Biophys Res Commun 2001. 286:176-183.
View this article via: PubMed
- Goldstein, JL, Rawson, RB, Brown, MS. Mutant mammalian cells as tools to delineate the sterol regulatory element-binding protein pathway for feedback regulation of lipid synthesis. Arch Biochem Biophys 2002. 397:139-148.
View this article via: PubMed
- Shimomura, I, Shimano, H, Horton, JD, Goldstein, JL, Brown, MS. Differential expression of exons 1a and 1c in mRNAs for sterol regulatory element binding protein-1 in human and mouse organs and cultured cells. J Clin Invest 1997. 99:838-845.
View this article via: JCI.org PubMed
- Moon, Y-A, Shah, NA, Mohapatra, S, Warrington, JA, Horton, JD. Identification of a mammalian long chain fatty acyl elongase regulated by sterol regulatory element-binding proteins. J Biol Chem 2001. 276:45358-45366.
View this article via: PubMed
- Shimomura, I, Shimano, H, Korn, BS, Bashmakov, Y, Horton, JD. Nuclear sterol regulatory element binding proteins activate genes responsible for entire program of unsaturated fatty acid biosynthesis in transgenic mouse liver. J Biol Chem 1998. 273:35299-35306.
View this article via: PubMed
- Shimano, H, et al. Overproduction of cholesterol and fatty acids causes massive liver enlargement in transgenic mice expressing truncated SREBP-1a. J Clin Invest 1996. 98:1575-1584.
View this article via: JCI.org PubMed
- Shimano, H, et al. Isoform 1c of sterol regulatory element binding protein is less active than isoform 1a in livers of transgenic mice and in cultured cells. J Clin Invest 1997. 99:846-854.
View this article via: JCI.org PubMed
- Horton, JD, et al. Activation of cholesterol synthesis in preference to fatty acid synthesis in liver and adipose tissue of transgenic mice overproducing sterol regulatory element-binding protein-2. J Clin Invest 1998. 101:2331-2339.
View this article via: JCI.org PubMed
- Korn, BS, et al. Blunted feedback suppression of SREBP processing by dietary cholesterol in transgenic mice expressing sterol-resistant SCAP(D443N). J Clin Invest 1998. 102:2050-2060.
View this article via: JCI.org PubMed
- Shimano, H, et al. Elevated levels of SREBP-2 and cholesterol synthesis in livers of mice homozygous for a targeted disruption of the SREBP-1 gene. J Clin Invest 1997. 100:2115-2124.
View this article via: JCI.org PubMed
- Matsuda, M, et al. SREBP cleavage-activating protein (SCAP) is required for increased lipid synthesis in liver induced by cholesterol deprivation and insulin elevation. Genes Dev 2001. 15:1206-1216.
View this article via: PubMed
- Yang, J, et al. Decreased lipid synthesis in livers of mice with disrupted Site-1 protease gene. Proc Natl Acad Sci USA 2001. 98:13607-13612.
View this article via: PubMed
Liang, G, et al. Diminished hepatic response to fasting/refeeding and liver X receptor agonists in mice with selective deficiency of sterol regulatory element-binding protein-1c. J Biol Chem 2002. 277:9520-9528.
http://www.jci.org/articles/view/15593
Structural Biochemistry/Lipids/Membrane Lipids
< Structural Biochemistry | Lipids
Membrane proteins rely on their interaction with membrane lipids to uphold its structure and maintain its functions as a protein. For membrane proteins to purify and crystallize, it is essential for the membrane protein to be in the appropriate lipid environment. Lipids assist in crystallization and stabilize the protein and provide lattice contacts. Lipids can also help obtain membrane protein structures in a native conformation. Membrane protein structures contain bound lipid molecules. Biological membranes are important in life, providing permeable barriers for cells and their organelles. The interaction between membrane proteins and lipids facilitates basic processes such as respiration, photosynthesis, transport, signal transduction and motility. These basic processes require a diverse group of proteins, which are encoded by 20-30% of an organism’s annotated genes.
There exist a great number of membrane lipids. Specifically, eukaryotic cells have a very complex collection of lipids that rely on many of the cell’s resources for its synthesis. Interactions between proteins and lipids can be very specific. Specific types of lipids can make a structure stable, provide control in insertion and folding processes, and help to assemble multisubunit complexes or supercomplexes, and most importantly, can significantly affect a membrane protein’s functions. Protein and lipid interactions are not sufficiently tight, meaning that lipids are retained during membrane protein purification. Since cellular membranes are fluid arrangements of lipids, some lipids affect interesting changes to membrane due to their characteristics. Glycosphigolipids and cholesterol tend to form small islands within the membranes, called lipid rafts, due to their physical properties. Some proteins also tend to cluster in lipid raft, while others avoid being in lipid rafts. However, the existence of lipid rafts in cells seems to be transitory.
Recent progress in determining membrane protein structure has brought attention to the importance of maintaining a favorable lipid environment so proteins to crystallize and purify successfully. Lipids assist in crystallization by stabilizing the protein fold and the relationships between subunits or monomers. The lipid content in protein-lipid detergent complexes can be altered by adjusting solubilisation and purification protocols, also by adding native or non-native lipids.
There are three type of membrane lipids: 1. Phospholipids: major class of membrane lipids. 2. glycolipids. 3. Cholesterols. Membrane lipids were started with eukaryotes and bacteria.
http://en.wikibooks.org/wiki/Structural_Biochemistry/Lipids/Membrane_Lipids
Types of Membrane Lipids
Lipids are often used as membrane constituents. The three major classes that membrane lipids are divided into are phospholipids, glycolipids, and cholesterol. Lipids are found in eukaryotes and bacteria. Although the lipids in archaea have many features that are related to the membrane formation that is similar with lipids of other organisms, they are still distinct from one another. The membranes of archaea differ in composition in three major ways. Firstly, the nonpolar chains are joined to a glycerol backbone by ether instead of esters, allowing for more resistance to hydrolysis. Second, the alkyl chains are not linear, but branched and make them more resistant to oxidation. The ability of archaeal lipids to resist hydrolysis and oxidation help these types of organisms to withstand the extreme conditions of high temperature, low pH, or high salt concentration. Lastly, the stereochemistry of the central glycerol is inverted. Membrane lipids have an extensive repertoire, but they possess a critical common structural theme in which they are amphipathic molecules, meaning they contain both a hydrophilic and hydrophobic moiety.
Membrane lipids are all closed bodies or boundaries separating substituent parts of the cell. The thickness of membranes is usually between 60 and 100 angstroms. These bodies are constructed from non-covalent assemblies. Their polar heads align with each other and their non-polar hydrocarbon tails align as well. The resulting stability is credited to hydrophobic interaction which proves to be quite stable due to the length of their hydrocarbon tails.
Membrane Lipids
Lipid Vesicles
Lipid vesicles, also known as liposomes, are vesicles that are essentially aqueous vesicles that are surrounded by a circular phospholipid bilayer. Like the other phospholipid structures, they have the hydrocarbon/hydrophobic tails facing inward, away from the aqueous solution, and the hydrophilic heads facing towards the aqueous solution. These vesicles are structures that form enclosed compartments of ions and solutes, and can be utilized to study the permeability of certain membranes, or to transfer these ions or solutes to certain cells found elsewhere.
Liposomes as vesicles can serve various clinical uses. Injecting liposomes containing medicine or DNA (for gene therapy) into patients is a possible method of drug delivery. The liposomes fuse with other cells’ membranes and therefore combine their contents with that of the patient’s cell. This method of drug delivery is less toxic than direct exposure because the liposomes carry the drug directly to cells without any unnecessary intermediate steps.
Because of the hydrophobic interactions among several phospholipids and glycolipids, a certain structure called the lipid bilayer or bimolecular sheet is favored. As mentioned earlier, phospholipids and glycolipids have both hydrophilic and hydrophobic moieties; thus, when several phospholipids or glycolipids come together in an aqueous solution, the hydrophobic tails interact with each other to form a hydrophobic center, while the hydrophilic heads interact with each other forming a hydrophilic coating on each side of the bilayer.
http://upload.wikimedia.org/wikibooks/en/b/ba/Liposome_final%2A.png
http://upload.wikimedia.org/wikibooks/en/f/fa/Membrane_bilayer.jpg

Liposome_

Membrane_bilayer
Evidence Report/Technology Assessment Number 89
Effects of Omega-3 Fatty Acids on Lipids and Glycemic Control in Type II Diabetes and the Metabolic Syndrome and on Inflammatory Bowel Disease, Rheumatoid Arthritis, Renal Disease, Systemic Lupus Erythematosus, and Osteoporosis
Prepared for:
Agency for Healthcare Research and Quality
U.S. Department of Health and Human Services
540 Gaither Road
Rockville, MD 20850
Contract No. 290-02-0003
Chapter 1. Introduction
This report is one of a group of evidence reports prepared by three Agency for Healthcare Research and Quality (AHRQ)-funded Evidence-Based Practice Centers (EPCs) on the role of omega-3 fatty acids (both from food sources and from dietary supplements) in the prevention or treatment of a variety of diseases. These reports were requested and funded by the Office of Dietary Supplements, National Institutes of Health. The three EPCs – the Southern California EPC (SCEPC, based at RAND), the Tufts-New England Medical Center (NEMC) EPC, and the University of Ottawa EPC – have each produced evidence reports. To ensure consistency of approach, the three EPCs collaborated on selected methodological elements, including literature search strategies, rating of evidence, and data table design.
The aim of these reports is to summarize the current evidence on the effects of omega-3 fatty acids on prevention and treatment of cardiovascular diseases, cancer, child and maternal health, eye health, gastrointestinal/renal diseases, asthma, immune- mediated diseases, tissue/organ transplantation, mental health, and neurological diseases and conditions. In addition to informing the research community and the public on the effects of omega-3 fatty acids on various health conditions, it is anticipated that the findings of the reports will also be used to help define the agenda for future research.
This report focuses on the effects of omega-3 fatty acids on immune- mediated diseases, bone metabolism, and gastrointestinal/renal diseases. Subsequent reports from the SCEPC will focus on cancer and neurological diseases and conditions.
This chapter provides a brief review of the current state of knowledge about the metabolism, physiological functions, and sources of omega-3 fatty acids.
The Recognition of Essential Fatty Acids
Dietary fat has long been recognized as an important source of energy for mammals, but in the late 1920s, researchers demonstrated the dietary requirement for particular fatty acids, which came to be called essential fatty acids. It was not until the advent of intravenous feeding, however, that the importance of essential fatty acids was widely accepted: Clinical signs of essential fatty acid deficiency are generally observed only in patients on total parenteral nutrition who received mixtures devoid of essential fatty acids or in those with malabsorption syndromes.
These signs include dermatitis and changes in visual and neural function. Over the past 40 years, an increasing number of physiological functions, such as immunomodulation, have been attributed to the essential fatty acids and their metabolites, and this area of research remains quite active.1, 2
Fatty Acid Nomenclature
The fat found in foods consists largely of a heterogeneous mixture of triacylglycerols (triglycerides)–glycerol molecules that are each combined with three fatty acids. The fatty acids can be divided into two categories, based on chemical properties: saturated fatty acids, which are usually solid at room temperature, and unsaturated fatty acids, which are liquid at room temperature. The term “saturation” refers to a chemical structure in which each carbon atom in the fatty acyl chain is bound to (saturated with) four other atoms, these carbons are linked by single bonds, and no other atoms or molecules can attach; unsaturated fatty acids contain at least one pair of carbon atoms linked by a double bond, which allows the attachment of additional atoms to those carbons (resulting in saturation). Despite their differences in structure, all fats contain approximately the same amount of energy (37 kilojoules/gram, or 9 kilocalories/gram).
The class of unsaturated fatty acids can be further divided into monounsaturated and polyunsaturated fatty acids. Monounsaturated fatty acids (the primary constituents of olive and canola oils) contain only one double bond. Polyunsaturated fatty acids (PUFAs) (the primary constituents of corn, sunflower, flax seed and many other vegetable oils) contain more than one double bond. Fatty acids are often referred to using the number of carbon atoms in the acyl chain, followed by a colon, followed by the number of double bonds in the chain (e.g., 18:1 refers to the 18-carbon monounsaturated fatty acid, oleic acid; 18:3 refers to any 18-carbon PUFA with three double bonds).
PUFAs are further categorized on the basis of the location of their double bonds. An omega or n notation indicates the number of carbon atoms from the methyl end of the acyl chain to the first double bond. Thus, for example, in the omega-3 (n-3) family of PUFAs, the first double bond is 3 carbons from the methyl end of the molecule. The trivial names, chemical names and abbreviations for the omega-3 fatty acids are detailed in Table 1.1. Finally, PUFAs can be categorized according to their chain length. The 18-carbon n-3 and n-6 short-chain PUFAs are precursors to the longer 20- and 22-carbon PUFAs, called long-chain PUFAs (LCPUFAs).
Fatty Acid Metabolism
Mammalian cells can introduce double bonds into all positions on the fatty acid chain except the n-3 and n-6 position. Thus, the short-chain alpha- linolenic acid (ALA, chemical abbreviation: 18:3n-3) and linoleic acid (LA, chemical abbreviation: 18:2n-6) are essential fatty acids.
No other fatty acids found in food are considered ‘essential’ for humans, because they can all be synthesized from the short chain fatty acids.
Following ingestion, ALA and LA can be converted in the liver to the long chain, more unsaturated n-3 and n-6 LCPUFAs by a complex set of synthetic pathways that share several enzymes (Figure 1). LC PUFAs retain the original sites of desaturation (including n-3 or n-6). The omega-6 fatty acid LA is converted to gamma-linolenic acid (GLA, 18:3n-6), an omega- 6 fatty acid that is a positional isomer of ALA. GLA, in turn, can be converted to the longerchain omega-6 fatty acid, arachidonic acid (AA, 20:4n-6). AA is the precursor for certain classes of an important family of hormone- like substances called the eicosanoids (see below).
The omega-3 fatty acid ALA (18:3n-3) can be converted to the long-chain omega-3 fatty acid, eicosapentaenoic acid (EPA; 20:5n-3). EPA can be elongated to docosapentaenoic acid (DPA 22:5n-3), which is further desaturated to docosahexaenoic acid (DHA; 22:6n-3). EPA and DHA are also precursors of several classes of eicosanoids and are known to play several other critical roles, some of which are discussed further below.
The conversion from parent fatty acids into the LC PUFAs – EPA, DHA, and AA – appears to occur slowly in humans. In addition, the regulation of conversion is not well understood, although it is known that ALA and LA compete for entry into the metabolic pathways.
Physiological Functions of EPA and AA
As stated earlier, fatty acids play a variety of physiological roles. The specific biological functions of a fatty acid are determined by the number and position of double bonds and the length of the acyl chain.
Both EPA (20:5n-3) and AA (20:4n-6) are precursors for the formation of a family of hormone- like agents called eicosanoids. Eicosanoids are rudimentary hormones or regulating – molecules that appear to occur in most forms of life. However, unlike endocrine hormones, which travel in the blood stream to exert their effects at distant sites, the eicosanoids are autocrine or paracrine factors, which exert their effects locally – in the cells that synthesize them or adjacent cells. Processes affected include the movement of calcium and other substances into and out of cells, relaxation and contraction of muscles, inhibition and promotion of clotting, regulation of secretions including digestive juices and hormones, and control of fertility, cell division, and growth.3
The eicosanoid family includes subgroups of substances known as prostaglandins, leukotrienes, and thromboxanes, among others. As shown in Figure 1.1, the long-chain omega-6 fatty acid, AA (20:4n-6), is the precursor of a group of eicosanoids that include series-2 prostaglandins and series-4 leukotrienes. The omega-3 fatty acid, EPA (20:5n-3), is the precursor to a group of eicosanoids that includes series-3 prostaglandins and series-5 leukotrienes. The AA-derived series-2 prostaglandins and series-4 leukotrienes are often synthesized in response to some emergency such as injury or stress, whereas the EPA-derived series-3 prostaglandins and series-5 leukotrienes appear to modulate the effects of the series-2 prostaglandins and series-4 leukotrienes (usually on the same target cells). More specifically, the series-3 prostaglandins are formed at a slower rate and work to attenuate the effects of excessive levels of series-2 prostaglandins. Thus, adequate production of the series-3 prostaglandins seems to protect against heart attack and stroke as well as certain inflammatory diseases like arthritis, lupus, and asthma.3.
EPA (22:6 n-3) also affects lipoprotein metabolism and decreases the production of substances – including cytokines, interleukin 1ß (IL-1ß), and tumor necrosis factor a (TNF-a) – that have pro-inflammatory effects (such as stimulation of collagenase synthesis and the expression of adhesion molecules necessary for leukocyte extravasation [movement from the circulatory system into tissues]).2 The mechanism responsible for the suppression of cytokine production by omega-3 LC PUFAs remains unknown, although suppression of omega-6-derived eicosanoid production by omega-3 fatty acids may be involved, because the omega-3 and omega-6 fatty acids compete for a common enzyme in the eicosanoid synthetic pathway, delta-6 desaturase.
DPA (22:5n-3) (the elongation product of EPA) and its metabolite DHA (22:6n-3) are frequently referred to as very long chain n-3 fatty acids (VLCFA). Along with AA, DHA is the major PUFA found in the brain and is thought to be important for brain development and function. Recent research has focused on this role and the effect of supplementing infant formula with DHA (since DHA is naturally present in breast milk but not in formula).
Dietary Sources and Requirements
Both ALA and LA are present in a variety of foods. LA is present in high concentrations in many commonly used oils, including safflower, sunflower, soy, and corn oil. ALA is present in some commonly used oils, including canola and soybean oil, and in some leafy green vegetables. Thus, the major dietary sources of ALA and LA are PUFA-rich vegetable oils. The proportion of LA to ALA as well as the proportion of those PUFAs to others varies considerably by the type of oil. With the exception of flaxseed, canola, and soybean oil, the ratio of LA to ALA in vegetable oils is at least 10 to 1. The ratios of LA to ALA for flaxseed, canola, and soy are approximately 1: 3.5, 2:1, and 8:1, respectively; however, flaxseed oil is not typically consumed in the North American diet. It is estimated that on average in the U.S., LA accounts for 89% of the total PUFAs consumed, and ALA accounts for 9%. Another estimate suggests that Americans consume 10 times more omega-6 than omega-3 fatty acids.4 Table 1.2 shows the proportion of omega 3 fatty acids for a number of foods.
Syntheis and Degradation

Source of Acetyl CoA for Fatty Acid Synthesis

step 1


ACP (acyl carrier protein)

synthesis requires acetyl CoA from citrate shuttle
conversion to fatty acyl co A in cytoplasm

ACP (acyl carrier protein)

FA synthesis not exactly reverse of catabolism

Fatty Acid Synthase

complete FA synthesis

Desaturation

Elongation and Desaturation of Fatty Acids

release of FAs from adiposites

Fatty acid beta oxidation and Krebs cycle produce NAD, NADH, FADH2

ketone bodies

metabolism of ketone bodies

Arachidonoyl-mimicking

Arachidonate pathways

arachidonic acid derivatives

major metabolic intermediates in the pathways for synthesis of cholesterol, fatty acids, and triglycerides

Model for the sterol-mediated proteolytic release of SREBPs from membrane

hormone regulation

insulin receptor and and insulin receptor signaling pathway (IRS)

islet brain glucose signaling

Fish source

omega FAs

Excessive omega 6s

omega 6s

diet and cancer

Patients at risk of FA deficiency

PPAR role
PPAR role

Omega 6_3 pathways

n3 vs n6 PUFAs

triene-teraene ratio

arachidonic acid, leukotrienes, PG and thromboxanes

Cox 2 and cancer

Lipidomics of atherosclerotic plaques

Effect of TPN on EFAD

benefits of omega 3s

food consumption
Carbohydrate Metabolism
Posted in Anaerobic Glycolysis, Biological Networks, Cell Biology, Chemical Biology and its relations to Metabolic Disease, Curation, Diabetes Mellitus, Enzyme Induction, Gene Regulation and Evolution, Metabolomics, Nutrition, Oxidative phosphorylation, Phosphorylation, Signaling & Cell Circuits, Systemic Inflammatory Response Related Disorders, Translational Research, Translational Science, tagged anabolism, Carbohydrate metabolism, catabolism, complex carbohydrates, energy metbolism, glucose, glycogen, Glycolysis, pentose phosphate shunt, TCA cycle on August 13, 2014| Leave a Comment »
Carbohydrate Metabolism
Author and Curator: Larry H. Bernstein, MD, FCAP
This is the portion of the discussion in a series of articles that began with signaling and signaling pathways. There are features on the functioning of enzymes and proteins, on sequential changes in a chain reaction, and on conformational changes that we shall return to. These are critical to developing a more complete understanding of life processes. I have indicated that many of the protein-protein interactions or protein-membrane interactions and associated regulatory features have been referred to previously, but the focus of the discussion or points made were different. Even though I considered placing this after the discussion of proteins and how they play out their essential role, I needed to lay out the scope of metabolic reactions and pathways, and their complementary changes. These may not appear to be adaptive, if the circumstances and the duration is not clear. The metabolic pathways map in total is in interaction with environmental conditions – light, heat, external nutrients and minerals, and toxins – all of which give direction and strength to these reactions. I shall again take from Wikipedia, as needed, and also follow mechanisms and examples from the literature, which give insight into the developments in cell metabolism. A developing goal is to discover how views introduced by molecular biology and genomics don’t clarify functional cellular dynamics that are not related to the classical view. The work is vast.
- Signaling and signaling pathways
- Signaling transduction tutorial.
- Carbohydrate metabolism
- Lipid metabolism
- Protein synthesis and degradation
- Subcellular structure
- Impairments in pathological states: endocrine disorders; stress hypermetabolism; cancer.
Carbohydrate metabolism
Carbohydrate metabolism denotes the various biochemical processes responsible for the formation, breakdown and interconversion of carbohydrates in living organisms.
The most important carbohydrate is glucose, a simple sugar (monosaccharide) that is metabolized by nearly all known organisms. Glucose and other carbohydrates are part of a wide variety of metabolic pathways across species: plants synthesize carbohydrates from carbon dioxide and water by photosynthesis storing the absorbed energy internally, often in the form of starch or lipids. Plant components are consumed by animals and fungi, and used as fuel for cellular respiration. Oxidation of one gram of carbohydrate yields approximately 4 kcal of energy and from lipids about 9 kcal. Energy obtained from metabolism (e.g. oxidation of glucose) is usually stored temporarily within cells in the form of ATP.[1] Organisms capable of aerobic respiration metabolize glucose and oxygen to release energy with carbon dioxide and water as byproducts.
Complex carbohydrates contain three or more sugar units linked in a chain, with most containing hundreds to thousands of sugar units. They are digested by enzymes to release the simple sugars.
I shall not go into the digestion, breakdown and absorption of these sugar molecules. Carbohydrates are used for short-term fuel, and the most important is glucose. Even though they are simpler to metabolize than fats or those amino acids (components of proteins) that can be used for fuel, they do not produce as effect an energy yield measured by ATP. In animals, The concentration of glucose in the blood is linked to the pancreatic endocrine hormone, insulin.
Carbohydrates are typically stored as long polymers of glucose molecules with glycosidic bonds for structural support (e.g. chitin, cellulose) or for energy storage (e.g. glycogen, starch). However, the strong affinity of most carbohydrates for water makes storage of large quantities of carbohydrates inefficient due to the large molecular weight of the solvated water-carbohydrate complex. In most organisms, excess carbohydrates are regularly catabolised to form acetyl-CoA, which is a feed stock for the fatty acid synthesis pathway; fatty acids, triglycerides, and other lipids are commonly used for long-term energy storage. The hydrophobic character of lipids makes them a much more compact form of energy storage than hydrophilic carbohydrates. However, animals, including humans, lack the necessary enzymatic machinery and so do not synthesize glucose from lipids, though glycerol can be converted to glucose.[6]
Metabolic pathways in eukaryotes
- Carbon fixation, or photosynthesis, in which CO2 is reduced to carbohydrate. [omitted]
- Glycolysis – the metabolism of glucose molecules to obtain ATP and pyruvate[7] by way of first splitting a six-carbon into two three csrbon chains, which are converted to lactic acid from pyruvate in the lactic dehydrogenase reaction. The reverse conversion is by a separate unidirectional reaction back to pyruvate after moving through pyruvate dehydrogenase complex.[8]
- Krebs, tricarboxylic acic, or citric acid cycle
- Typically, a breakdown of one molecule of glucose by aerobic respiration (i.e. involving both glycolysis and Kreb’s cycle) is about 33-35 ATP.[1] This is categorized as:
- Glycogenolysis – the breakdown of glycogen into glucose, which provides a glucose supply for glucose-dependent tissues.
- Glycogenolysis in liver provides circulating glucose short term.
- Glycogenolysis in muscle is obligatory for muscle contraction.
- Pyruvate from glycolysis enters the Krebs cycle, also known as the citric acid cycle, in aerobic organisms
- Anaerobic breakdown by glycolysis – yielding 8-10 ATP
- Aerobic respiration by kreb’s cycle – yielding 25 ATP
- The pentose phosphate pathway (shunt) converts hexoses into pentoses and regenerates NADPH.[9] NADPH is an essential antioxidant in cells which prevents oxidative damage and acts as precursor for production of many biomolecules.
- Glycogenesis – the conversion of excess glucose into glycogen as a cellular storage mechanism; achieving low osmotic pressure.
- Gluconeogenesis – de novo synthesis of glucose molecules from simple organic compounds. An example in humans is the conversion of a few amino acids in cellular protein to glucose.
Metabolic use of glucose is highly important as an energy source for muscle cells and in the brain, and red blood cells.
Glucoregulation
The hormone insulin is the primary glucose regulatory signal in animals. It mainly promotes glucose uptake by the cells, and causes liver to store excess glucose as glycogen. Its absence turns off glucose uptake, reverses electrolyte adjustments, begins glycogen breakdown and glucose release into the circulation by some cells, begins lipid release from lipid storage cells, etc. The level of circulatory glucose (known informally as “blood sugar”) is the most important signal to the insulin-producing cells. Because the level of circulatory glucose is largely determined by the intake of dietary carbohydrates, diet controls major aspects of metabolism via insulin. In humans, insulin is made by beta cells in the pancreas, fat is stored in adipose tissue cells, and glycogen is both stored and released as needed by liver cells. Regardless of insulin levels, no glucose is released to the blood from internal glycogen stores from muscle cells.
The hormone glucagon, on the other hand, opposes that of insulin, forcing the conversion of glycogen in liver cells to glucose, and then release into the blood. Muscle cells, however, lack the ability to export glucose into the blood. The release of glucagon is precipitated by low levels of blood glucose. Other hormones, notably growth hormone, cortisol, and certain catecholamines (such as epinepherine) have glucoregulatory actions similar to glucagon. These hormones are referred to as stress hormones because they are released under the influence of catabolic proinflammatory (stress) cytokines – interleukin-1 (IL1) and tumor necrosis factor α (TNFα).

metabolic pathways

Glycemic control in DM
- Catabolic proinflammatory cytokines. Argilés JM1, López-Soriano FJ. Curr Opin Clin Nutr Metab Care.1998 May;1(3):245-51.
- Tumor necrosis factor as a mediator of shock, cachexia and inflammation. Cerami A. Blood Purif. 1993; 11(2):108-17.
- Mediators of cytokine-induced insulin resistance in obesity and other inflammatory settings. Marette A. Curr Opin Clin Nutr Metab Care. 2002 Jul; 5(4):377-83.
- Inflammation: the link between insulin resistance, obesity and diabetes. Dandona P, Aljada A, Bandyopadhyay A. Trends Immunol. 2004 Jan; 25(1):4-7
- Proinflammatory cytokines and skeletal muscle. Späte U1, Schulze PC. Curr Opin Clin Nutr Metab Care. 2004 May;7(3):265-9.
- Insulin-like growth factor-1 and muscle wasting in chronic heart failure. Schulze PC, Späte U. Int J Biochem Cell Biol. 2005 Oct; 37(10):2023-35.
- IGF-I stimulates muscle growth by suppressing protein breakdown and expression of atrophy-related ubiquitin ligases, atrogin-1 and MuRF1. Sacheck JM, Ohtsuka A, McLary SC, Goldberg AL. Am J Physiol Endocrinol Metab. 2004 Oct; 287(4):E591-601. Epub 2004 Apr 20.
Glycolysis – Animation and Notes
By Sweety Mehta – Sept 20, 2011 in: Animations, Biochemistry Animations, Biochemistry Notes
http://pharmaxchange.info/press/2011/09/glycolysis-animation-and-notes/
Cellular respiration involves breaking the bonds of glucose to produce energy in the form of ATP (adenosine triphosphate). The total energy produced during glucose metabolism is described at Energetics of Cellular Respiration. Glycolysis is the most critical phase in glucose metabolism during cellular respiration. The term “glycolysis” literally means breakdown of glucose and sugars. Biochemically, it involves the breakdown of glucose to pyruvate (or pyruvic acid) via a series of enzymes. Glycolysis does not require molecular oxygen and is hence considered anaerobic. Therefore, it is a common pathway for all living organisms.
Glycolysis is followed by
Kreb’s cycle in the stages of cellular respiration.
Glycolysis is said to occur in two phases:
- The Preparatory Phase: From glucose till formation of Glyceraldehyde 3-Phosphate (GADP)
- The Pay-off Phase: From Glyceraldehyde-3-Phosphate (GADP) to the final product pyruvate
.
.

The animation below gives an outline of the entire pathway of glucose metabolism by glycolysis
Note – The animation is best played in full screen. To go forward in the animation, press the Play button. To skip the whole section press the forward button. To go back press the rewind button.
The Preparatory Phase
In this stage of the cycle, ATP or energy is actually consumed and is hence also known as the investment phase of glycolysis.
Step 1, involves the conversion of glucose to glucose-6-phosphate (G6P) with the help of the enzyme hexokinase and the consumption of 1 molecule of ATP. This reaction helps keep the concentration of glucose low in the cell, allowing for more absorption of glucose into it. Additionally, G6P is not transported out of the cell as there are no G6P transporters on the cell.
Step 2 involves the rearrangement of glucose-6-phosphate to fructose-6-phosphate (F6P) with the help of the enzyme phosphohexose isomerase in a reversible manner. Fructose can directly enter the glycolysis pathway at this point. This isomerization to a keto-sugar such as fructose is essential for carbanion stabilization required for the next step.
Step 3 involves the phosphorylation of fructose-6-phosphate to fructose-1,6-biphosphate (F1,6BP) by the use of 1 molecule of ATP and the enzyme phosphofructokinase-1 (PPK1). This phosphorylation step destabilizes the molecule and helps drive the next reaction which ensures breakdown of the molecule to a 3-carbon unit.
Step 4 involves the breakdown of fructose-1,6-biphosphate (6 carbons) to two molecules of 3-carbon units i.e. glyceralde 3-phosphate (GADP) and Dihydroxyacetone phosphate (DHAP). The GADP can be interconverted to DHAP by enzyme triose phosphate isomerase.
In this stage of the cycle, ATP or energy is produced either in the form of ATP alone or in the form of NADH + H+ which can be later converted to ATP via the electron transport chain (ETS). In this since energy is restored it is known as the pay-off phase of glycolysis. All steps in this phase occur with 2 molecules of the substrates each as indicated in the brackets by the name of the molecules.
Step 1, involves the dehydrogenation of glyceraldehyde-3-phosphate (GADP) to 1,3-biphophoglycerate (1,3BPG) by the use of 2 molecules of inorganic phosphate (Pi) with the production of 2 molecules of NADH + H+ in the presence of the enzyme glyceraldehyde 3-phosphate dehydrogenase.
Step 2, in this step dephosphorylation of 1,3-biphosphoglycerate (1,3BPG) to 3-phospoglycerate (3PG) produces 2 molecules of ATP by the enzyme phosphoglycerate kinase.
Step 3, involves the isomerisation of 3-phosphoglycerate (3PG) to 2-phosphoglycerate (2PG) by the enzyme phosphoglycerate mutase in a reversible manner.
Step 4 involves the enolization of 2-phosphoglycerate (2PG) to phosphoenolpyruvate (PEP) with the loss of one molecule of water in the presence of enzyme enolase.
Step 5 is the final step of the glycolysis pathway and it involves the dephosphorylation of the phosphoenolpyruvate (PEP) to pyruvate by enzyme pyruvate kinase to produce 2 more molecules of ATP.
- The preparatory phase consumes 2 ATP
- The pay-off phase produces 4 ATP.
- The gross yield of glycolysis is therefore
4 ATP – 2 ATP = 2 ATP - The pay-off phase also produces 2 molecules of NADH + H+ which can be further converted to a total of 5 molecules of ATP* by the electron transport chain (ETC) during oxidative phosphorylation.
- Thus the net yield during glycolysis is 7 molecules of ATP.
* This is calculated assuming one NADH molecule gives 2.5 molecules of ATP during oxidative phosphorylation.
- David L. Nelson and Michael M. Cox, Lehninger Principles of Biochemistry, 4th Ed.
- Jeremy M. Berg, John L. Tymockzo and Luber Stryer, Biochemistry, 7th Ed.
Tags: cellular respiration, electron transport chain, etc, glucose, glycolysis, metabolism, pay-off phase
Kreb’s Cycle or Citric Acid Cycle or Tricarboxylic Acid Cycle (with Animation)
By Sweety Mehta – Sept 21, 2013 in: Animations, Biochemistry Animations, Biochemistry Notes
http://pharmaxchange.info/press/2013/09/krebs-cycle-citric-acid-cycle-tricarboxylic-acid-cycle-animation/
Introduction
Cellular respiration involves 3 stages for the breakdown of glucose – glycolysis, Kreb’s cycle and the electron transport system. The total energy produced during glucose metabolism is described at Energetics of Cellular Respiration. We have seen the glycolysis pathway with animation previously. The Kreb’s cycle is named after Adolf Krebs who studied the utilization of oxygen in a pigeon. It is also commonly known as the citric acid cycle or the tricarboxylic acid cycle. Kreb’s cycle is a very important step in the metabolic pathway as it produces about 60-70% of ATP for release of energy in the body. It directly or indirectly connects with all the other individual pathways in the body too. It takes place in the mitochondria as all the enzymes and co-enzymes required are present there.
The Kreb’s Cycle occurs in two stages:
1. Conversion of Pyruvate to Acetyl CoA
Glycolysis of 1 molecule of glucose produces 2 molecules of pyruvate. Each pyruvate in the presence of pyruvate dehydrogenase (PDH) complex in the mitochondria gets converted to acetyl CoA which in turn enters the Kreb’s cycle. This reaction is called as oxidative decarboxylation as the carboxyl group is removed from the pyruvate molecule in the form of CO2 thus yielding 2-carbon acetyl group which along with the coenzyme A forms acetyl CoA.
The pyruvate dehydrogenase complex (PDH) comprises of three enzymes – pyruvate dehydrogenase, dihydrolipoyl transacetylase and dihydrolipoyl dehydrogenase each one playing an important role in the reaction as shown below. The PDH requires the sequential action of five co-factors or co-enzymes for the combined action of dehydrogenation and decarboxylation to take place. These five are TPP (thiamine phosphate), FAD (flavin adenine dinucleotide), NAD (nicotinamide adenine dinucleotide), coenzyme A (denoted as CoA-SH at times to depict role of -SH group) and lipoamide.
Conversion of pyruvate to acetyl CoA by the pyruvate dehydrogenase complex

Conversion of pyruvate to acetyl CoA by the pyruvate dehydrogenase complex
Pyruvate reacts with the TPP (Thiamine Phosphate) bound part of pyruvate dehydrogenase and undergoes decarboxylation to give hydroxyethyl-TPP.
This hydroxyethyl-TPP in turn gets oxidised to acetyl lipoamide by the same enzyme pyruvate dehydrogenase by the transfer of two electrons. These electrons then reduce the disulfide bond of the enzyme dihydrolipoyl transacetylase with the transfer of the acetyl group as highlighted in purple.
Dihydrolipoyl transacetylase catalyses the transesterification forming acetyl CoA by transfer of acetyl group to coenzyme A.
When acetyl CoA is being formed, at the same time reduced lipoamide is getting converted to oxidised lipoamide due to enzyme dihydrolipoyl dehydrogenase by the transfer of 2 hydrogen atoms to FAD.
Dihydrolipoyl dehydrogenase transfers the reduced equivalents (2 hydrogen atoms) to FAD thus forming FADH2. FADH2 in turn transfers a hydride ion to NAD+ to form NADH+H+.
2. Acetyl CoA Enters the Kreb’s Cycle
The acetyl CoA produced from the pyruvate dehydrogenase complex enters the Kreb’s cycle.
The animation below describes the Kreb’s cycle in detail followed by the discussion. A static image of the cycle can be found next to the discussion for reference. Press the play button to progress in the animation.
Discussion

The Kreb’s Cycle or Citric Acid Cycle or Tricarboxylic Acid Cycle in a static image version of the animation.
Acetyl CoA condenses with oxaloacetate (4C) to form a citrate (6C) by transferring its acetyl group in the presence of enzyme citrate synthase. The CoA liberated in this reaction is ready to participate in the oxidative decarboxylation of another molecule of pyruvate by PDH complex.
- Citrate is then isomerised to Isocitrate by the enzyme aconitase through the formation of the intermediate cis-aconitate. This is a reversible reaction as aconitase has an iron-sulfur center which can promote reversible addition of H2O to the double bond of enzyme-bound cis-aconitate in 2 different ways, one forming citrate and the other isocitrate.
- Isocitrate undergoes oxidative decarboxylation by the enzyme isocitrate dehydrogenase to form oxalosuccinate (intermediate- not shown) which in turn forms α-ketoglutarate (also known as oxoglutarate) which is a five carbon compound. CO2 and NADH are released in this step.
- α-ketoglutarate (5C) undergoes oxidative decarboxylation once again to form succinyl CoA (4C) catalysed by the enzyme α-ketoglutarate dehydrogenase complex. α-ketoglutarate dehydrogenase complex is similar to PDH complex and is made up of 3 enzymes and is dependent on five co-enzymes TPP, FAD, NAD, bound lipoate and conenzyme A. In this step once again NADH and CO2 are liberated. So in all 2 molecules of NADH and 2 molecules of CO2 is produced till now.
- Succinyl CoA is then converted to succinate by succinate thiokinase or succinyl coA synthetase in a reversible manner. This reaction involves an intermediate step in which the enzyme gets phosphorylated and then the phosphoryl group which has a high group transfer potential is transferred to GDP to form GTP. This GTP is converted to ATP by the enzyme nucleoside diphosphate kinase by donating its phosphoryl group to ADP. This reaction which involves the formation of GTP is a substrate level phosphorylation as it happens by using the energy formed by the oxidative decarboxylation of α-ketoglutarate.
- Succinate then gets oxidised reversibly to fumarate by succinate dehydrogenase. The enzyme contains iron-sulfur clusters and covalently bound FAD which when undergoes electron exchange in the mitochondria causes the production of FADH2.
- Fumarate is then by the enzyme fumarase converted to malate by hydration(addition of H2O) in a reversible manner.
- Malate is then reversibly converted to oxaloacetate by malate dehydrogenase which is NAD linked and thus produces NADH.
- The oxaloacetate produced is now ready to be utilized in the next cycle by the citrate synthase reaction and thus the equilibrium of the cycle shifts to the right.

Schrodingers_cat
Energetics of the Kreb’s Cycle
Keeping in mind that 1 molecule of glucose would produce 2 molecules of pyruvate via glycolysis. Hence the net energy produced by the Kreb’s cycle for each molecule of pyruvate is doubled for each molecule of glucose. Thus net energy yield in Kreb’s cycle can be summarized as follows for each molecule of glucose:
Reaction Number of ATP or Number of ATP
reduced coenzyme formed ultimately formed
2 Pyruvate → 2 acetyl CoA 2 NADH 5
2 Isocitrate → 2 α- ketoglutarate 2 NADH 5
2 α- ketoglutarate → 2 succinyl CoA 2 NADH 5
2 Succinyl CoA → 2 succinate 2 ATP 2
2 Succinate → 2 fumarate 2 FADH2 3
2 Malate → 2 oxaloacetate 2 NADH 5
TOTAL 25 ATP
* Note- This is calculated as 2.5 ATP per NADH and 1.5 ATP per FADH2. This is because there are multiple electron transport shuttle pathways through which these can be broken to ATP.
Regulation of Kreb’s Cycle
The amount of ADP and ATP largely control the citric acid cycle along with the activity of three key enzymes within the cycle:
Availability of ADP: ADP is a key substrate which finally gets converted to ATP that is essential for the energetics of the cell. A drop in ADP levels would result in inhibition of the electron transport system leading to accumulation of NADH and FADH2. These in turn inhibit the enzymes below.
Citrate Synthase: inhibited by ATP, acetyl CoA, NADH, and succinyl CoA.
Isocitrate Dehydrogenase: activated by ADP, and inhibited by NADH and ATP.
α-ketoglutarate dehydrogenase: inhibited by NADH and succinyl CoA.
Recommended Texts
David L. Nelson and Michael M. Cox, Lehninger Principles of Biochemistry 6th Edition
Jeremy M. Berg, John L. Tymockzo and Luber Stryer, Biochemistry 7th Edition
Tags: acetyl coA, animation, cellular respiration, citric acid cycle, energy, kreb’s cycle, pyruvate, pyruvate dehydrogenase, TCA cycle, tricarboxylic acid cycle
Energetics of Cellular Respiration (Glucose Metabolism)
By Sweety Mehta – Oct 9, 2013 in: Biochemistry Notes, Notes
http://pharmaxchange.info/press/2013/10/energetics-of-cellular-respiration-glucose-metabolism/


Important Note: The NADH formed in the cytosol can yield variable amounts of ATP depending on the shuttle system utilized to transport them into the mitochondrial matrix. This NADH, formed in the cytosol, is impermeable to the mitochondrial inner-membrane where oxidative phosphorylation takes place. Thus to carry this NADH to the mitochondrial matrix there are special shuttle systems in the body. The most active shuttle is the malate-aspartate shuttle via which 2.5 molecules of ATP are generated for 1 NADH molecule. This shuttle is mainly used by the heart, liver and kidneys. The brain and skeletal muscles use the other shuttle known as glycerol 3-phosphate shuttle which synthesizes 1.5 molecules of ATP for 1 NADH.
Note: The above calculations are done considering that one NADH molecules produces 2.5 ATP and one FADH2 molecule produces 1.5 ATP in the ETS cycle (See full reasoning above). This is because the Kreb’s cycle occurs within the mitochondria and therefore does not require any shuttle pathway for the transport of the NADH into the mitochondrial matrix. Hence there is optimal conversion of NADH to ATP.
Development of the acetylation problem: a personal account
FRITZ LI P M A N N Nobel Prize 1953
After my apprenticeship with Otto Meyerhof, a first interest on my own became the phenomenon we call the Pasteur effect, this peculiar depression of the wasteful fermentation in the respiring cell. By looking for a chemical explanation of this economy measure on the cellular level, I was prompted into a study of the mechanism of pyruvic acid oxidation, since it is at the pyruvic stage where respiration branches off from fermentation. For this study I chose as a promising system a relatively simple looking pyruvic acid oxidation enzyme in a certain strain of Lactobacillus delbrueckii1.
The most important event during this whole period, I now feel, was the accidental observation that in the L. delbrueckii system, pyruvic acid oxidation was completely dependent on the presence of inorganic phosphate. This observation was made in the course of attempts to replace oxygen by methylene blue. To measure the methylene blue reduction manometrically,
I had to switch to a bicarbonate buffer instead of the otherwise routinely used In bicarbonate, to my surprise, as shown in Fig. 1, pyruvate oxidation was very slow, but the addition of a little phosphate caused a remarkable increase in rate. The next figure, Fig. 2, shows the phosphate effect more drastically, using a preparation from which all phosphate was removed by washing with acetate buffer. Then it appeared that the reaction was really fully dependent on phosphate.
In spite of such a phosphate dependence, the phosphate balance measured by the ordinary Fiske-Subbarow procedure did not at first indicate any phosphorylative step. Nevertheless, the suspicion remained that phosphate in some manner was entering into the reaction and that a phosphorylated intermediary was formed. As a first approximation, a coupling of this pyruvate oxidation with adenylic acid phosphorylation was attempted. And,indeed, addition of adenylic acid to the pyruvic oxidation system brought out a net disappearance of inorganic phosphate, accounted for as adenosine triphosphate (Table 11).
I now concluded that the missing link in the reaction chain was acetyl phosphate. In partial confirmation it was shown that a crude preparation of acetyl phosphate, synthesized by the old method of Kämmerer and Carius 2 would transfer phosphate to adenylic acid (Table 2). However, it still took quite some time from then on to identify acetyl phosphate definitely as the initial product of the pyruvic oxidation in this system3,4
At the time when these observations were made, about a dozen years ago,there was, to say the least, a tendency to believe that phosphorylation was rather specifically coupled with the glycolytic reaction. Here, however, we had found a coupling of phosphorylation with a respiratory system. This observation immediately suggested a rather sweeping biochemical significance, of transformations of electron transfer potential, respiratory or fermentative, to phosphate bond energy and therefrom to a wide range of biosynthetic reactions7.
There was a further unusual feature in this pyruvate oxidation system in that the product emerging from the process not only carried an energy-rich phosphoryl radical such as already known, but the acetyl phosphate was even more impressive through its energy-rich acetyl. It rather naturally became a contender for the role of “active” acetate, for the widespread existence of which the isotope experience had already furnished extensive evidence. I became, therefore, quite attracted by the possibility that acetyl phosphate could serve two rather different purposes, either to transfer its phosphoryl group into the phosphate pool, or to supply its active acetyl for biosynthesisof carbon structures. Thus acetyl phosphate should be able to serve as acetyldonor as well as phosphoryl donor, transferring, as shown in Fig. 3, on either side of the oxygen center, such as indicated by Bentley’s early experiments on cleavage7a of acetyl phosphate in H218O.
 Phosphate dependence of pyruvate oxidation These two novel aspects of the energy problem, namely (1) the emergence of an energy-rich phosphate bond from a purely (2) the presumed derivation of a metabolic building-block through this same
Although in the related manner the appearance of acetyl phosphate as a
it soon turned out that the relationship between acetyl phosphate and
Although acetylation was found with rabbit liver homogenate, the [portion of lecture] |

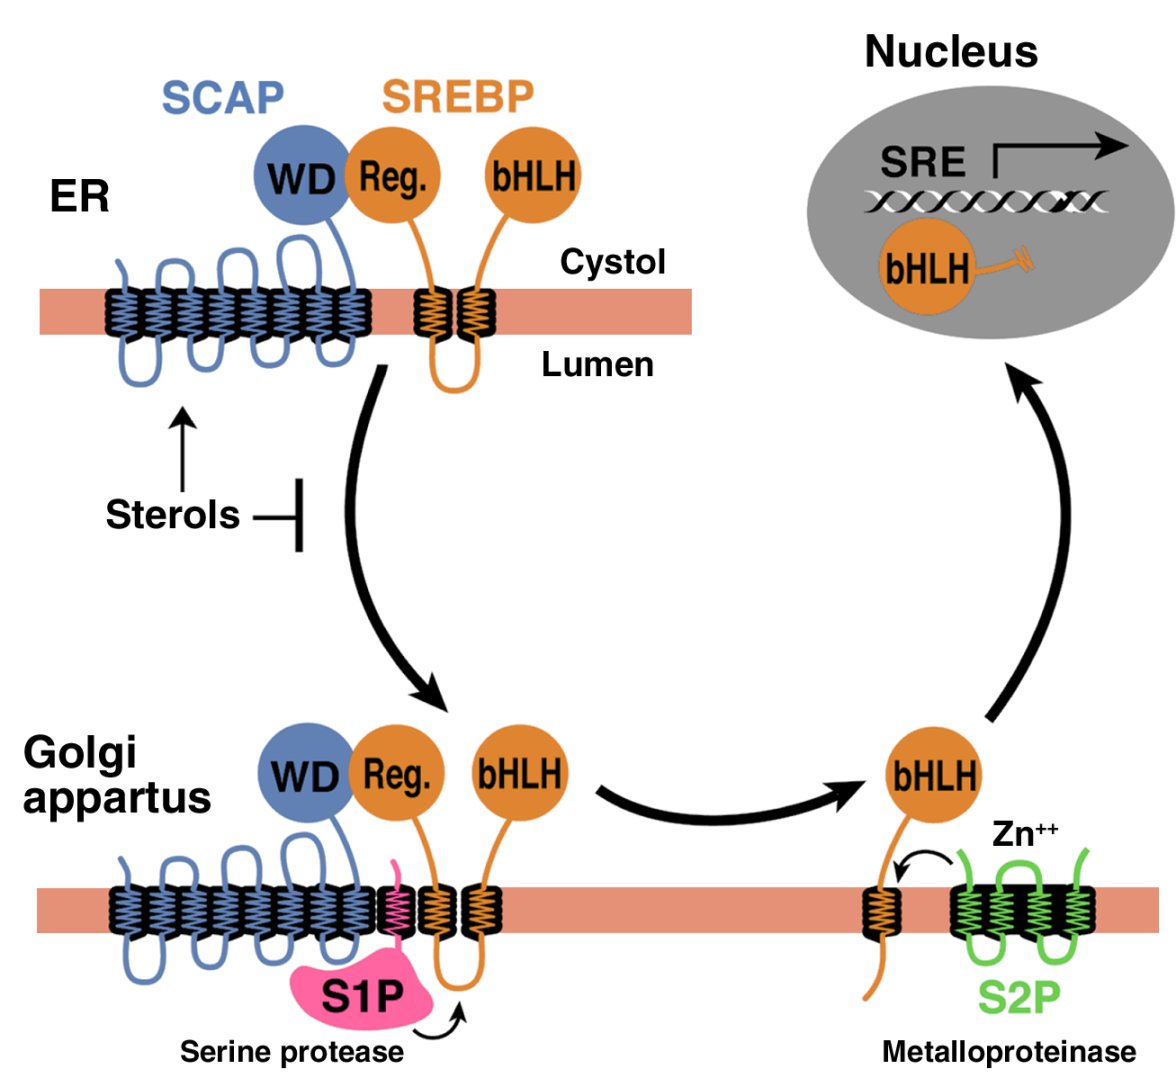
The pentose phosphate pathway is the major source for the NADPH
required for anabolic processes.Pentose Phosphate Pathway
http://chemwiki.ucdavis.edu/Biological_Chemistry/Metabolism/Pentose_
Phosphate_Pathway
- There are three distinct phases each of which has a distinct outcome.
- Depending on the needs of the organism the metabolites of that outcome
can be fed into many other pathways. - Gluconeogenesis is directly connected to the pentose phosphate pathway.
- As the need for glucose-6-phosphate (the beginning metabolite in the pentose
phosphate pathway) increases so does the activity of gluconeogenesis.

http://images.tutorvista.com/content/respiration/pentose-phosphate-pathway.jpeg
Introduction
The main molecule in the body that makes anabolic processes possible is NADPH. Because of the structure of this molecule it readily donates hydrogen ions to metabolites thus reducing them and making them available for energy harvest at a later time. The PPP is the main source of synthesis for NADPH. The pentose phosphate pathway (PPP) is also responsible for the production of Ribose-5-phosphate which is an important part of nucleic acids. Finally the PPP can also be used to produce glyceraldehyde-3-phosphate which can then be fed into the TCA and ETC cycles allowing for the harvest of energy. Depending on the needs of the cell certain enzymes can be regulated and thus increasing or decreasing the production of desired metabolites. The enzymes reasonable for catalyzing the steps of the PPP are found most abundantly in the liver (the major site of gluconeogenesis) more specifically in the cytosol. The cytosol is where fatty acid synthesis takes place which is a NADPH dependent process.
Oxidation Phase
- The beginning molecule for the PPP is glucose-6-P which is the second intermediate metabolite in glycolysis. Glucose-6-P is oxidized in the presence of glucose-6-P dehydrogenase and NADP+. This step is irreversible and is highly regulated. NADPH and fatty acyl-CoA are strong negative inhibitors to this enzyme. The purpose of this is to decrease production of NADPH when concentrations are high or the synthesis of fatty acids is no longer necessary.
- The metabolic product of this step is gluconolactone which is hydrolytrically unstable. Gluconolactonase causes gluconolactone to undergo a ring opening hydrolysis. The product of this reaction is the more stable sugar acid, 6-phospho-D-gluconate.
- 6-phospho-D-gluconate is oxidized by NADP+ in the presence of 6-phosphogluconate dehydrogenase which yields ribulose-5-phosphate.
- The oxidation phase of the PPP is solely responsible for the production of the NADPH to be used in anabolic processes.
Isomerization Phase
- Ribulose-5-phosphate can then be isomerized by phosphopentose isomerase to produce ribose-5-phosphate. Ribose-5-phosphate is one of the main building blocks of nucleic acids and the PPP is the primary source of production of ribose-5-phosphate.
- If production of ribose-5-phosphate exceeds the needs of required ribose-5-phosphate in the organism, then phosphopentose epimerase catalyzes a chiralty rearrangement about the center carbon creating xylulose-5-phosphate.
- The products of these two reactions can then be rearranged to produce many different length carbon chains. These different length carbon chains have a variety of metabolic fates.
Rearrangement Phase
- There are two main classes of enzymes responsible for the rearrangement and synthesis of the different length carbon chain molecules. These are transketolase and transaldolase.
- Transketolase is responsible for the cleaving of a two carbon unit from xylulose-5-P and adding that two carbon unit to ribose-5-P thus resulting in glyceraldehyde-3-P and sedoheptulose-7-P.
- Transketolase is also responsible for the cleaving of a two carbon unit from xylulose-5-P and adding that two carbon unit to erythrose-4-P resulting in glyceraldehyde-3-P and fructose-6-P.
- Transaldolase is responsible for cleaving the three carbon unit from sedoheptulose-7-P and adding that three carbon unit to glyceraldehyde-3-P thus resulting in erythrose-4-P and fructose-6-P.
- The end results of the rearrangement phase is a variety of different length sugars which can be fed into many other metabolic processes. For example, fructose-6-P is a key intermediate of glycolysis as well as glyceraldehyde-3-P.
References
- Garrett, H., Reginald and Charles Grisham. Biochemistry. Boston: Twayne Publishers, 2008.
- Raven, Peter. Biology. Boston: Twayne Publishers, 2005.
Glycogen Metabolism
Glycogen is a readily mobilized storage form of glucose. It is a very large, branched polymer of glucose residues (Figure 21.1) that can be broken down to yield glucose molecules when energy is needed. Most of the glucose residues in glycogen are linked by α-1,4-glycosidic bonds. Branches at about every tenth residue are created by α-1,6-glycosidic bonds. Recall that α-glycosidic linkages form open helical polymers, whereas β linkages produce nearly straight strands that form structural fibrils, as in cellulose (Section 11.2.3).
http://www.ncbi.nlm.nih.gov/books/NBK21190/bin/ch21f1.jpg

Glycogen Structure. In this structure of two outer branches of a glycogen molecule, the residues at the nonreducing ends are shown in red and residue that starts a branch is shown in green. The rest of the glycogen molecule is represented by R.
Glycogen is not as reduced as fatty acids are and consequently not as energy rich. Why do animals store any energy as glycogen? Why not convert all excess fuel into fatty acids? Glycogen is an important fuel reserve for several reasons. The controlled breakdown of glycogen and release of glucose increase the amount of glucose that is available between meals. Hence, glycogen serves as a buffer to maintain blood-glucose levels. Glycogen’s role in maintaining blood-glucose levels is especially important because glucose is virtually the only fuel used by the brain, except during prolonged starvation. Moreover, the glucose from glycogen is readily mobilized and is therefore a good source of energy for sudden, strenuous activity. Unlike fatty acids, the released glucose can provide energy in the absence of oxygen and can thus supply energy for anaerobic activity.
Gluconeogenesis
ChemWiki: The Dynamic Chemistry E-textbook > Biological Chemistry > Metabolism > Gluconeogenesis
Gluconeogenesis is much like glycolysis only the process occurs in reverse. However, there are exceptions. In glycolysis there are three highly exergonic steps (steps 1,3,10). These are also regulatory steps which include the enzymes hexokinase, phosphofructokinase, and pyruvate kinase. Biological reactions can occur in both the forward and reverse direction. If the reaction occurs in the reverse direction the energy normally released in that reaction is now required. If gluconeogenesis were to simply occur in reverse the reaction would require too much energy to be profitable to that particular organism. In order to overcome this problem, nature has evolved three other enzymes to replace the glycolysis enzymes hexokinase, phosphofructokinase, and pyruvate kinase when going through the process of gluconeogenesis:
- The first step in gluconeogenesis is the conversion of pyruvate to phosphoenolpyruvic acid (PEP). In order to convert pyruvate to PEP there are several steps and several enzymes required. Pyruvate carboxylase, PEP carboxykinase and malate dehydrogenase are the three enzymes responsible for this conversion. Pyruvate carboxylase is found on the mitochondria and converts pyruvate into oxaloacetate. Because oxaloacetate cannot pass through the mitochondria membranes it must be first converted into malate by malate dehydrogenase. Malate can then cross the mitochondria membrane into the cytoplasm where it is then converted back into oxaloacetate with another malate dehydrogenase. Lastly, oxaloacetate is converted into PEP via PEP carboxykinase. The next several steps are exactly the same as glycolysis only the process is in reverse.
- The second step that differs from glycolysis is the conversion of fructose-1,6-bP to fructose-6-P with the use of the enzyme fructose-1,6-phosphatase. The conversion of fructose-6-P to glucose-6-P uses the same enzyme as glycolysis, phosphoglucoisomerase.
- The last step that differs from glycolysis is the conversion of glucose-6-P to glucose with the enzyme glucose-6-phosphatase. This enzyme is located in the endoplasmic reticulum.
Glycolysis

Regulation
Because it is important for organisms to conserve energy, they have derived ways to regulate those metabolic pathways that require and release the most energy. In glycolysis and gluconeogenesis seven of the ten steps occur at or near equilibrium. In gluconeogenesis the conversion of pyruvate to PEP, the conversion of fructose-1,6-bP, and the conversion of glucose-6-P to glucose all occur very spontaneously which is why these processes are highly regulated. It is important for the organism to conserve as much energy as possible. When there is an excess of energy available, gluconeogenesis is inhibited. When energy is required, gluconeogenesis is activated.
- The conversion of pyruvate to PEP is regulated by acetyl-CoA. More specifically pyruvate carboxylase is activated by acetyl-CoA. Because acetyl-CoA is an important metabolite in the TCA cycle which produces a lot of energy, when concentrations of acetyl-CoA are high organisms use pyruvate carboxylase to channel pyruvate away from the TCA cycle. If the organism does not need more energy, then it is best to divert those metabolites towards storage or other necessary processes.
- The conversion of fructose-1,6-bP to fructose-6-P with the use of fructose-1,6-phosphatase is negatively regulated and inhibited by the molecules AMP and fructose-2,6-bP. These are reciprocal regulators to glycolysis’ phosphofructokinase. Phosphofructosekinase is positively regulated by AMP and fructose-2,6-bP. Once again, when the energy levels produced are higher than needed, i.e. a large ATP to AMP ratio, the organism increases gluconeogenesis and decreases glycolysis. The opposite also applies when energy levels are lower than needed, i.e. a low ATP to AMP ratio, the organism increases glycolysis and decreases gluconeogenesis.
- The conversion of glucose-6-P to glucose with use of glucose-6-phosphatase is controlled by substrate level regulation. The metabolite responsible for this type of regulation is glucose-6-P. As levels of glucose-6-P increase, glucose-6-phosphatase increases activity and more glucose is produced. Thus glycolysis is unable to proceed.
The role and importance of transcription factors
Posted in Acute myelocytic leukemia, Biological Networks, Gene Regulation and Evolution, Biomarkers & Medical Diagnostics, Biomedical Measurement Science, CANCER BIOLOGY & Innovations in Cancer Therapy, Cardiovascular Research, Discovery process, Disease Biology, Small Molecules in Development of Therapeutic Drugs, Enzyme Induction, Experimental validation, Explanatory, Frontiers in Cardiology and Cardiovascular Disorders, Gene Regulation, Genome Biology, Genomic Expression, Genomic Testing: Methodology for Diagnosis, Human Immune System in Health and in Disease, Molecular Genetics & Pharmaceutical, Open Access Journals, Personalized and Precision Medicine & Genomic Research, Pharmaceutical Analytics, Pharmaceutical Drug Discovery, Population Health Management, Genetics & Pharmaceutical, Proteomics, RNA Biology, Cancer and Therapeutics, Signaling, Statistical Methods for Research Evaluation, Systemic Inflammatory Response Related Disorders, Theoretic convergence, Transcriptomics, Ubiquitinylation, tagged anti-termination, cell regulation, Histone, mRNA, ncRNAs, protein synthesis, RNA, termination, transcription, Transcription factor on August 6, 2014| Leave a Comment »
The role and importance of transcription factors
Larry H. Bernstein, MD, FCAP, Writer and Curator
http://pharmaceuticalintelligence.com/2014/8/05/The-role-and-importance-of-transcripton-factors
The following is a second in the 2nd series that is focused on the topic of the impact of genomics and transcriptomics in the evolution of 21st century of medicine, which shall have to be more efficient and more effective by the end of this decade, if the prediction for the funding of Medicare is expected to run out. Even so, Social Security was devised by none other than the Otto von Bismarck, who unified Germany, and United Kingdom has had a charity hospital care system begun to protect the widows of the ravages of war, and nursing was developed by Florence Nightengale as a result of the experience of war. It can only be concluded that the care for the elderly, the infirm, and those who have little resources to live on has a long history in western civilization, and it will not cease to exist as a public social obligation anytime soon. The 20th century saw an explosive development of physics; organic, inorganic, biochemistry, and medicinal chemistry, and the elucidation of the genetic code and its mechanism of translation in plants, microorganisms, and eukaryotes. All of which occurred irrespective of the most horrendous wars that have reshaped the world map.
The following are the second portions of a puzzle in construction that is intended to move into deeper complexities introduced by proteomics, cell metabolism, metabolomics, and signaling. This is the only manner by which I can begin to appreciate what a wonder it is to view and live in this world with all its imperfections.
We have already visited the transcription process, by which an RNA sequence is read. This is essential for protein synthesis through the ordering of the amino acids in the primary structure. However, there are microRNAs and noncoding RNAs, and there are transcription factors. The transcription factors bind to chromatin, and the RNAs also have some role in regulating the transcription process. We shall examine this further.
- RNA and the transcription the genetic code
Larry H. Bernstein, MD, FCAP, Writer and Curator
http://pharmaceuticalintelligence.com/2014/08/02/rna-and-the-transcription-of-the-genetic-code/
- The role and importance of transcription factors?
Larry H. Bernstein, MD, FCAP, Writer and Curator
http://pharmaceuticalintelligence.com/2014/8/05/What-is-the-meaning-of-so-many-RNAs - What is the meaning of so many RNAs?
Larry H. Bernstein, MD, FCAP, Writer and Curator
http://pharmaceuticalintelligence.com/2014/8/05/What-is-the-meaning-of-so-many-RNAs
- Pathology Emergence in the 21st Century
Larry Bernstein, MD, FCAP, Author and Curator
http://pharmaceuticalintelligence.com/2014/08/03/pathology-emergence-in-the-21st-century/ - The Arnold Relman Challenge: US HealthCare Costs vs US HealthCare Outcomes
Larry H. Bernstein, MD, FCAP, Reviewer and Curator; and
Aviva Lev-Ari, PhD, RN, Curator
http://pharmaceuticalintelligence.com/2014/08/05/the-relman-challenge/
Quantifying transcription factor kinetics: At work or at play?
Posted online on September 11, 2013. (doi:10.3109/10409238.2013.833891)
Florian Mueller1,2, Timothy J. Stasevich3, Davide Mazza4, and James G. McNally5
1Institut Pasteur, Computational Imaging and Modeling Unit, CNRS, Paris, Fr
2Functional Imaging of Transcription, Institut de Biologie de l’Ecole Normale Supérieure, Paris, Fr
3Graduate School of Frontier Biosciences, Osaka University, Osaka, Jp
4Istituto Scientifico Ospedale San Raffaele, Centro di Imaging Sperimentale e Università Vita-Salute
San Raffaele, Milano, It, and
5Fluorescence Imaging Group, National Cancer Institute, NIH, Bethesda, MD, USA
Abstract
Transcription factors (TFs) interact dynamically in vivo with chromatin binding sites. Here we summarize and compare the four different techniques that are currently used to measure these kinetics in live cells, namely fluorescence recovery after photobleaching (FRAP), fluorescence correlation spectroscopy (FCS), single molecule tracking (SMT) and competition ChIP (CC). We highlight the principles underlying each of these approaches as well as their advantages and disadvantages. A comparison of data from each of these techniques raises an important question: do measured transcription kinetics reflect biologically functional interactions at specific sites (i.e. working TFs) or do they reflect non-specific interactions (i.e. playing TFs)? To help resolve this dilemma we discuss five key unresolved biological questions related to the functionality of transient and prolonged binding events at both specific promoter response elements as well as non-specific sites. In support of functionality, we review data suggesting that TF residence times are tightly regulated, and that this regulation modulates transcriptional output at single genes. We argue that in addition to this site-specific regulatory role, TF residence times also determine the fraction of promoter targets occupied within a cell thereby impacting the functional status of cellular gene networks. Thus, TF residence times are key parameters that could influence transcription in multiple ways.
Keywords: Competition-ChIP, kinetic modeling, live-cell imaging, non-specific binding, specific binding, transcription, transcription factor dynamics http://informahealthcare.com/doi/abs/10.3109/10409238.2013.833891?goback=%2Egde_3795224_member_273907669#%2EUjYZ8jMt8mo%2Elinkedin
The Transcription Factor Titration Effect Dictates Level of Gene ExpressionCalifornia Institute of Technology
Robert C. Brewster, Franz M. Weinert, Hernan G. Garcia, Dan Song, Mattias Rydenfelt, and Rob Phillips CalTech
Cell Mar 13, 2014; 156:1312–1323,.
Models of transcription are often built around a picture of RNA polymerase and transcription factors (TFs) acting on a single copy of a promoter. However, most TFs are shared between multiple genes with varying binding affinities. Beyond that, genes often exist at high copy number—in multiple identical copies on the chromosome or on plasmids or viral vectors with copy numbers in the hundreds. Using a thermodynamic model, we characterize the interplay between TF copy number and the demand for that TF. We demonstrate the parameter-free predictive power of this model as a function of the copy number of the TF and the number and affinities of the available specific binding sites; such predictive control is important for the understanding of transcription and the desire to quantitatively design the output of genetic circuits. Finally, we use these experiments to dynamically measure plasmid copy number through the cell cycle.
Optimal reference genes for normalization of qRT-PCR data from archival formalin-fixed, paraffin-embedded breast tumors controlling for tumor cell content and decay of mRNA.
Tramm T, Sørensen BS, Overgaard J, Alsner J.
Diagn Mol Pathol. 2013 Sep;22(3):181-7. http://dx.doi.org:/10.1097/PDM.0b013e318285651e
Gene-expression analysis is increasingly performed on degraded mRNA from formalin-fixed, paraffin-embedded tissue (FFPE), giving the option of examining retrospective cohorts. The aim of this study was to select robust reference genes showing stable expression over time in FFPE, controlling for various content of tumor tissue and decay of mRNA because of variable length of storage of the tissue.
Sixteen reference genes were quantified by qRT-PCR in 40 FFPE breast tumor samples, stored for 1 to 29 years. Samples included 2 benign lesions and 38 carcinomas with varying tumor content. Stability of the reference genes were determined by the geNorm algorithm. mRNA was successfully extracted from all samples, and the 16 genes quantified in the majority of samples.
Results showed 14% loss of amplifiable mRNA per year, corresponding to a half-life of 4.6 years. The 4 most stable expressed genes were CALM2, RPL37A, ACTB, and RPLP0. Several of the other examined genes showed considerably instability over time (GAPDH, PSMC4, OAZ1, IPO8).
In conclusion, we identified 4 genes robustly expressed over time and independent of neoplastic tissue content in the FFPE block. PMID:23846446
Structures of Cas9 Endonucleases Reveal RNA-Mediated Conformational Activation
Martin Jinek1,*,†, Fuguo Jiang2,*, David W. Taylor3,4,*, Samuel H. Sternberg5,*, Emine Kaya2, et al.
1Department of Biochemistry, University of Zurich, CH-8057 Zurich, Switzerland. 2Department of Molecular and Cell Biology,3Howard Hughes Medical Institute, 4California Institute for Quantitative Biosciences, 5Department of Chemistry, 6Physical Biosciences Division, Lawrence Berkeley National Laboratory, Berkeley, CA 94720,. 7The Laboratory for Molecular Infection Medicine Sweden, Umeå University, Umeå S-90187, Sweden. 8Helmholtz Centre for Infection Research, Department of Regulation in Infection Biology, D-38124 Braunschweig, Germany. 9Hannover Medical School, D-30625 Hannover, Germany. 10Life Sciences Division, Lawrence Berkeley National Laboratory, Berkeley, CA 94720.
↵‡ Present address: Friedrich Miescher Institute for Biomedical Research, Maulbeerstrasse 66 CH-4058 Basel, Switzerland.
↵§ Present address: Department of Agricultural and Biological Engineering, University of Florida, Gainesville, FL 32611, USA.
Science http://dx.doi.org:/10.1126/science.1247997
Type II CRISPR-Cas systems use an RNA-guided DNA endonuclease, Cas9,
- to generate double-strand breaks in invasive DNA during an adaptive bacterial immune response.
Cas9 has been harnessed as a powerful tool for genome editing and gene regulation in many eukaryotic organisms.
Here, we report 2.6 and 2.2 Å resolution crystal structures of two major Cas9 enzymes subtypes,
- revealing the structural core shared by all Cas9 family members.
The architectures of Cas9 enzymes define nucleic acid binding clefts, and
single-particle electron microscopy reconstructions show that the two structural lobes harboring these clefts undergo guide
- RNA-induced reorientation to form a central channel where DNA substrates are bound.
The observation that extensive structural rearrangements occur before target DNA duplex binding
- implicates guide RNA loading as a key step in Cas9 activation.
MicroRNA function in endothelial cells
Dr. Virginie Mattot
Angiogenesis, endothelium activation
Solving the mystery of an unknown target gene using microRNA Target Site Blockers
Dr. Virgine Mattot works in the team “Angiogenesis, endothelium activation and Cancer” directed by Dr. Fabrice Soncin at the Institut de Biologie de Lille in France where she studies the roles played by microRNAs in endothelial cells during physiological and pathological processes such as angiogenesis or endothelium activation. She has been using Target Site Blockers to investigate the role of microRNAs on putative targets which functions are yet unknown.
What is the main focus of the research conducted in your lab?
We are studying endothelial cell functions with a particular interest in angiogenesis and endothelium activation during physiological and tumoral vascular development.
How did your research lead to the study of microRNAs?
A few years ago, we identified
- an endothelial cell-specific gene which
- harbors a microRNA in its intronic sequence.
We have since been working on understanding the functions of
- both this new gene and its intronic microRNA in endothelial cells.
What is the aim of your current project?
While we were searching for the functions of the intronic microRNA,
- we identified an unknown gene as a putative target.
The aim of my project was to investigate if this unknown gene was actually a genuine target and if regulation of this gene by the microRNA was involved in endothelial cell function. We had already characterized the endothelial cell phenotype associated with the inhibition of our intronic microRNA. We then used miRCURY LNA™ Target Site Blockers to demonstrate
- the expression of this unknown gene is actually controlled by this microRNA.
- the microRNA regulates specific endothelial cell properties through regulation of this unknown gene.
How did you perform the experiments and analyze the results?
LNA™ enhanced target site blockers (TSB) for our microRNA were designed by Exiqon. We
- transfected the TSBs into endothelial cells using our standard procedure and
- analysed the induced phenotype.
As a control for these experiments, a mutated version of the TSB was designed by Exiqon and transfected into endothelial cells. We first verified that this TSB was functional by analyzing
- the expression of the miRNA target against which the TSB was directed
- we then showed the TSB induced similar phenotypes as those when we inhibited the microRNA in the same cells.
What do you find to be the main benefits/advantage of the LNA™ microRNA target site blockers from Exiqon?
Target Site Blockers are efficient tools to demonstrate the specific involvement of
- putative microRNA targets in the function played by this microRNA.
What would be your advice to colleagues about getting started with microRNA functional analysis?
- it is essential to perform both gain and loss of functions experiments.
Changing the core of transcription
Different members of the TAF family of proteins work in differentiated cells, such as motor neurons or brown fat cells, to control the expression of genes that are specific to each cell type.
Katherine A Jones
Jones. eLife 2014;3:e03575. http://dx.doi.org:/10.7554/eLife.03575
Related research articles: Herrera FJ, Yamaguchi T, Roelink H, Tjian R. 2014. Core promoter factor TAF9B regulates neuronal gene expression. eLife 3:e02559. http://dx.doi.org:/10.7554eLife.02559
Zhou H, Wan B, Grubisic I, Kaplan T, Tjian R. 2014. TAF7L modulates brown adipose tissue formation. eLife 3:e02811. Http://dx.doi.org:/10.7554/eLife.02811

Motor neurons (green) being grown in vitro
Image Motor neurons (green) being grown in vitro
In a developing organism, different genes are expressed at different times
- the pattern of gene expression can often change abruptly.
Expressing a gene involves multiple steps:
- the DNA must be transcribed into a molecule of messenger RNA,
- which is then translated into a protein.
The mechanisms that start the transcription of protein-coding genes in rapidly growing cells are reasonably well understood: two types of proteins—
- DNA-binding activators and general transcription factors—
cooperate to recruit an enzyme called RNA polymerase, which then transcribes the gene (Kadonaga, 2012).
These proteins bind to a region of the gene called the promoter, which is
- upstream from the protein-coding region of the gene.
TATA-binding protein is a general transcription factor that
- binds to certain sequences of DNA bases found within promoters
14 TATA-binding protein associated factors (TAFs) are included into two different protein complexes called TFIID and SAGA (Müller et al., 2010). which, in budding yeast, can recruit TATA-binding protein to gene promoters (Basehoar et al., 2004), but not all genes require all of the general transcription factors, and some genes require both TFIID and SAGA complexes.
Although the steps that are required to switch on genes when cells are rapidly dividing are fairly well known,
- the same is not true for cells that are differentiating into specialised cell types.
In these cells, many transcription factors are downregulated and
- the entire pattern of gene expression changes dramatically.
Moreover, certain TAFs are strongly up-regulated during differentiation. The core transcriptional machinery is essentially rebuilt at the genes that are expressed in differentiated cells.
Over the years Robert Tjian of the University of California Berkeley and co-workers have illuminated how individual TAFs can affect how a cell differentiates in different contexts (Figure 1). Now, in eLife, Francisco Herrera of UC Berkeley and co-workers—including Teppei Yamaguchi, Henk Roelink and Tjian—have identified a critical role for a TAF called TAF9B in the expression of genes in motor neurons (Herrera et al., 2014).
Herrera et al. found that TAF9B predominantly associates with the SAGA complex, rather than the TFIID complex, in the motor neuron cells. Mice in which the gene for TAF9B had been deleted had less neuronal tissue in the developing spinal cord. Moreover, the genes that are involved in forming the branches of neurons were not properly regu¬lated in these mice.
Recently, in another eLife paper, Tjian and co-workers at Berkeley, Fudan University and the Hebrew University of Jerusalem—including Haiying Zhou as first author, Bo Wan, Ivan Grubisic and Tommy Kaplan—reported that another TAF protein, called TAF7L, works as part of the TFIID complex to up-regulate genes that direct cells to become brown adipose tissue (Zhou et al., 2014).

TATA-binding protein associated factors
Figure 1. TATA-binding protein associated factors (TAFs) regulate transcription in specific cell types. TAF3, for example, works with another transcription factor to regulate the expression of genes that are critical for the differentiation of the endoderm in the early embryo (Liu et al., 2011). TAF3 also forms a complex with the TATA-related factor, TRF3, to regulate Myogenin and other muscle-specific genes to form myotubes (Deato et al., 2008). TAF7L interacts with another transcription factor to activate genes involved in the formation of adipocytes (‘fat cells’) and adipose tissue (Zhou et al., 2013; Zhou et al., 2014). Finally, TAF9B is a key regulator of transcription in motor neurons (Herrera et al., 2014). The names of some of the genes regulated by the TAFs are shown in brackets.
TAF9B
Deleting the gene for TAF9B in mouse embryonic stem cells revealed that this TAF
- is not needed for the growth of stem cells, or
- required for the expression of genes that prevent differentiation:
both of these processes are known to be highly-dependent upon the TFIID complex
(Pijnappel et al., 2013). However,
- genes that would normally be expressed specifically in neurons were not
- up-regulated when cells without the TAF9B gene started to specialise.
Herrera et al. identified numerous genes that can only be switched on when the TAF9B protein is present, which means that it joins a growing list of TAF proteins that are dedicated to controllingthe expression of genes in specialised cell types.
TAF9B activates neuron-specific genes by binding to sites that
- reside outside of these genes’ core promoters.
Further, many of these sites were also bound by a master regulator of motor neuron-specific genes.
TAF7L
Whilst most of the fat tissue in humans is white adipose tissue, which contains cells that store fatty molecules, some is brown adipose tissue, or ‘brown fat’, that instead generates heat. When TAF7L promotes the differentiation of brown fat, it up-regulates genes that are targeted by a transcription
factor called PPAR-γ; last year it was shown that this transcription factor also promotes the differentiation of white adipose tissue (Zhou et al., 2013).
Mice without the TAF7L gene had 40% less brown fat than wild-type mice, and also grew too much skeletal muscle tissue. TAF7L was specifically required to activate genes that control how brown fat develops and functions. Thus TAF7L expression appears to shift the fate of a stem cell towards brown adipose tissue, potentially at the expense of skeletal muscle, as both cell types develop from the same group of stem cells.
When stem cells with less TAF7L than normal are differentiated in vitro, they yield more muscle than fat cells. Conversely, cells with an excess of TAF7L express brown fat-specific genes and switch off muscle-specific genes.
The work of Herrera et al. and Zhou et al. reinforces the idea that different TAFs
- provide the flexibility needed to control gene expression in a tissue-specific manner, and
- enable differentiating cells to change which genes they express rapidly.
However many interesting questions remain:
Which signals lead to the destruction of core transcription factors?
Are core promoter elements at tissue-specific genes designed to recognise variant TAFs?
What determines whether variant TAFs are incorporated within TFIID, SAGA, or other complexes?
Shortly after RNA polymerase II starts to transcribe a gene, it briefly pauses. Interestingly, a DNA sequence associated with this pausing, called the pause button, closely matches the sequences that bind to two subunits of TFIID (TAF6 and TAF9; Kadonaga, 2012). Consequently, TAF6 and TAF9 might be involved in pausing transcription, and if so, the variant TAF9B could play a similar role at motor neuron genes.
Molecular basis of transcription pausing
Jeffrey W. Roberts
Science 344, 1226 (2014); http://dx.doi.org:/10.1126/science.1255712
http://www.sciencemag.org/content/344/6189/1226.full.html
During RNA synthesis, RNA polymerase moves erratically along DNA, frequently
resting as it produces an RNA copy of the DNA sequence. Such pausing helps coordinate the appearance of a transcript with its utilization by cellular processes; to this end,
- the movement of RNA polymerase is modulated by mechanisms that determine its rate. For example,
- pausing is critical to regulatory activities of the enzyme such as the termination of transcription. It is also
- essential during early modifications of eukaryotic RNA polymerase II that activate the enzyme for elongation.
Two reports analyzing transcription pausing on a global scale in Escherichia coli, by Larson et al. ( 1) and by Vvedenskaya et al. ( 2) on page 1285 of this issue, suggest
- new functions of pausing and important aspects of its molecular basis.
The studies of Larson et al. and Vvedenskaya et al. follow decades of analysis of
bacterial transcription that has illuminated the molecular basis of polymerase pausing
events that serve critical regulatory functions.
A transcription pause specified by the DNA sequence synchronizes the translation of RNA into protein
- with the transcription of leader regions of operons (groups of genes transcribed together) for amino acid biosynthesis;
- this coordination controls amino acid synthesis in response to amino acid availability ( 3).
A protein induced pause occurs when the E. coli initiation factor σ70 restrains RNA polymerase by binding a second occurrence of the “–10” promoter element.
This paused polymerase provides a structure for engaging a transcription antiterminator (the bacteriophage λ Q protein) ( 4) that, in turn, inhibits transcription
pauses, including those essential for transcription termination.
Biochemical and structural analyses have identified an endpoint of the pausing process called the “elemental pause” in which the catalytic structure in the active site is distorted,
- preventing further nucleotide addition ( 7).
The elemental paused state also involves distinct
- conformational changes in the polymerase that may favor transcription termination
- and allow the his and related pauses to be stabilized by RNA hairpins ( 8).
A consensus sequence for ubiquitous pauses was identified, with two important elements:
- a preference for pyrimidine [mostly cytosine (C)] at the newly formed RNA end
- followed by G to be incorporated next—just as found for the his pause; and a preference for G at position –10 of the RNA (10 nucleotides before the 3’ end)

Polymerase, paused
Polymerase, paused. During transcription, RNA exists in two states as RNA polymerase progresses: pretranslocated, just after the addition of the last nucleotide [here, cytosine (C)];
and posttranslocated, after all nucleic acids have shifted in register by one nucleotide relative
to the enzyme, exposing the active site for binding of the next substrate molecule [here, guanine (G)]. The pretranslocated state is dominant in the pause. The critical G-C base (RNA-DNA) pair at position –10 in the pretranslocated state and the nontemplate DNA strand G bound in the
polymerase in the posttranslocated state are marked with an asterisk.
Binding of G at position 1 to CRE only occurs in the posttranslocated state, which would thus
be favored over the pretranslocated state. Hence, if G binding inhibits pausing, then the rate-limiting paused structure must be in the pretranslocated state (a conclusion also made by Larson et al. from biochemical experiments).
This is an important insight into the sequence of protein–nucleic acid interactions that occur in pausing. Vvedenskaya et al. suggest that the actual role of the G binding site is to promote translocation and thus
inhibit pausing, to smooth out adventitious pauses in genomic DNA.
The studies by Larson et al. and Vvedenskaya et al. provide a refined and detailed analysis of DNA sequence–induced transcription pausing.
Processive Antitermination
Robert A. Weisberg1* and Max E. Gottesman2
Section on Microbial Genetics, Laboratory of Molecular Genetics, National Institute of Child Health and
Human Development, National Institutes of Health, Bethesda, Maryland 20892-2785,1 and
Institute of Cancer Research, Columbia University, New York, New York 100322
Journal Of Bacteriology, Jan. 1999; 181(2): 359–367.
After initiating synthesis of RNA at a promoter, RNA polymerase (RNAP) normally continues to elongate the transcript until it reaches a termination site. Important elements of termination sites are transcribed before polymerase translocation stops, and the resulting RNA is an active element of the termination pathway. Nascent transcripts of intrinsic sites can halt transcription without the assistance of additional factors, and
those of Rho-dependent sites recruit the Rho termination protein to the elongation complex. In both cases, RNAP, the transcript, and the template dissociate (reviewed in references 76 and 80).
Termination is rarely, if ever, completely efficient, and the expression of downstream genes can be controlled by altering the efficiency of terminator readthrough. Two distinct mechanisms of elongation control have been reported for bacterial RNA polymerases. In one, exemplified by attenuation of the his and trp operons of Salmonella typhimurium and Escherichia coli, respectively,
- a single terminator is inactivated by interaction with an upstream sequence in the transcript, with a terminator-specific protein, or with a translating ribosome that follows closely behind RNAP (reviewed in references 35 and 104).
In a second, whose prototype is antitermination of phage l early transcription,
- polymerase is stably modified to a terminator-resistant form after it leaves the promoter.
In this case, the modified enzyme not only transcribes through sequential downstream terminators,
- but also it is less sensitive to the pause sites that normally delay transcript elongation.
Both pathways are widespread in nature, but in this minireview we consider only the second,
- known as processive antitermination
(for previous reviews, see references 22, 23, 27, and 32).
The recent explosive growth in our understanding of transcription elongation (reviewed in references 57, 96, and 99) make this an especially appropriate time to survey regulatory elements that target the transcription elongation complex.
Antitermination in l is induced by two quite distinct mechanisms.
- the result of interaction between l N protein and its targets in the early phage transcripts,
- an interaction between the l Q protein and its target in the late phage promoter.
We describe the N mechanism first. Lambda N, a small basic protein of the arginine- rich motif (ARM) (Fig. 1) family of RNA binding proteins, binds to a 15-nucleotide (nt) stem-loop called BOXB (17) (Fig. 2).
FIG. 1. [not shown] (A) Alignment of phage N proteins and the HK022 Nun protein. The color groupings reflect the frequency of amino acid substitutions in evolutionarily related protein domains: an amino acid is more likely to be replaced by one in the same color group than by one in a different color group in related proteins (34).
The amino-proximal ARM regions were aligned by eye and according to the structures of the P22 and l ARMs complexed to their cognate nut sites (see text and Fig. 2), and the remainder of the proteins was aligned by ClustalW (38). The dots indicate gaps introduced to improve the alignment. Aside from the ARM regions, the
proteins fall into three very distantly related (or unrelated) families: (i) l and phage 21; (ii) P22, phage L, and HK97; and (iii) HK022 Nun.
FIG. 2. [not shown] BOXA and BOXB RNAs and their interaction with the ARM of their cognate N proteins. The amino acid-nucleotide interactions are shown to the left except for BOXB of phage 21, for which the structure of the complex is unknown. The sequences of BOXA and BOXA-BOXB spacer are shown to the right. The dots
to the left and right of the spacer sequences are for alignment. (A) l N-ARM-BOXB complex (adapted from reference 48 with permission of the publisher). Open circles, pentagons, and rectangles represent phosphates, riboses, and bases, respectively. Watson-Crick base pairs (????) are indicated. The zigzag line denotes a sheared
G z A base pair. Open circles, open rectangles, and arrowheads depict ionic, hydrophobic, and hydrogen-bonding interactions, respectively. Guanine-11, indicated by a bold rectangle, is extruded from the BOXB loop (see text). (B) P22 N-ARM-BOXB complex (adapted from reference 15 with permission of the publisher). Open
circles, pentagons, rectangles, and ovals represent phosphates, riboses, bases, and amino acids, respectively. The solid pentagons indicate riboses with a C29-endo pucker.
Base stacking ( ), intermolecular hydrogen bonding or electrostatic interactions (,—–), intermolecular hydrophobic or van der Waals interactions (4), intramolecular hydrogen bonds (– – – –) and Watson-Crick base pairs (?????) are indicated. Cytosine-11 is extruded from the loop (see text). Note that the amino-terminal amino acid
residue in the complex corresponds to Asn-14 in the complete protein (Fig. 1), and the displayed amino acids are numbered accordingly. (C) NUTL site of phage 21. The arrows indicate the inverted sequence repeats of BOXB.
FIG. 3. [not skown] HK022 put sites and folded PUT RNAs. (A) Alignment of putL and putR (43). The numbers give distances from the start sites of the PL and PR promoters, respectively, and the pairs of arrows indicate inverted sequence repeats. (B) Folded PUTL and PUTR RNAs. The structures, which were generated by energy
minimization as described (43), have been partially confirmed by genetic and biochemical studies (7, 43).
The active bacterial elongation complex consists of
- core RNAP,
- template, and
- RNA product.
The 39 end of the RNA
- is engaged in the active site of the enzyme,
- The following ;8 nt are hybridized to the template strand of the DNA, and
- the next ;9 nt remain closely associated with RNAP (64).
- About 17 nt of the nontemplate DNA strand are separated from the template strand in the transcription bubble.
Elongation complexes can also contain NusA and/or NusG. These proteins, which
- increase the stability of the N-mediated antitermination complex (see above),
- have different effects on elongation.
- NusA decreases and NusG increases the elongation rate, and
- both proteins alter termination efficiency in a terminator-specific manner (13, 14, 86; see reference 76).
An elongation complex, unless located at a terminator, is extraordinarily stable,
- even when translocation is prevented by removal of substrates.
Recent observations suggest that this stability depends mainly on
- interactions between RNAP and the RNA-DNA hybrid as well as
- between polymerase and the downstream duplex DNA template (63, 87).
Nascent RNA emerging from the hybrid region and upstream duplex DNA
- do not appear to be required.
The strength of the RNA-DNA hybrid is believed to
- assure the lateral stability of the complex.
Reducing the strength of the RNA-DNA bonds, for example
- by incorporation of nucleotide analogs,
- favors backsliding of RNAP on the template, with consequent
- disengagement of the 39 RNA end from the active site, and
- concerted retreat of the RNA-DNA hybrid region from the 39 end (65).
Such a disengaged complex retains its resistance to dissociation and
- is capable of resuming elongation if the original or a newly created 39 end reengages with the active site (10, 44, 45, 65, 71, 95).
Intrinsic terminators consist of a guanine- and cytosine-rich RNA hairpin stem
- immediately followed by a short uracil-rich segment
- within which termination can occur.
If termination does not occur at this point,
- polymerase continues to elongate the transcript with normal processivity
- until it reaches the next terminator.
Neither the stem nor the uracil-rich segment
- is sufficient for termination, although
- either can transiently slow elongation.
The weakness of base pairing between rU and dA
- destabilizes the RNA-DNA hybrid in the uracil-rich segment, and
- this probably contributes to termination.
Formation of the hairpin stem as nascent terminator RNA emerges from polymerase
- destabilizes the RNA-DNA hybrid and
- interrupts contacts between the emerging nascent RNA and RNAP (62a).
It might also interfere with the stabilizing interactions between
- RNAP and the hybrid or those between RNAP and
- the downstream region of the template.
Cross-linking of nucleic acid to RNAP suggests that
- both the downstream DNA and the nascent RNA
- that emerges from the hybrid region, and
- within which the terminator hairpin might form,
- are located close to the same regions of the enzyme (64).
Conversely, modifications that render RNAP termination resistant
- could prevent the terminator stem from destabilizing one or more of these targets,
- at least while the 39 end of the RNA is within the uracil rich segment of the terminator.
The l N and Q proteins and HK022 PUT RNA
- also suppress Rho-dependent terminators (43a, 79, 103) which,
- in contrast to intrinsic terminators, lack a precisely determined termination point.
Rho is an RNA-dependent ATPase that binds to cytosine-rich, unstructured regions in nascent RNA and acts preferentially
- to terminate elongation complexes that are paused at nearby downstream sites
(19, 29, 46, 47, 59, 60).
Rho possesses RNA-DNA helicase activity, and this activity is directional,
- unwinding DNA paired to the 39 end of the RNA molecule (11, 90).
- This corresponds to the location of the hybrid and of RNAP
in an active ternary elongation complex.
The ability of antiterminators to suppress Rho-dependent and -independent terminators
- suggests that they prevent a step that is common to both classes.
Given the helicase activity of Rho, a likely candidate for this step is disruption of the RNA-DNA
hybrid. However, other candidates, such as destabilization of RNAP-template or RNAP-hybrid interactions, are also plausible.
Alternatively, the ability of N, Q, and PUT to suppress RNAP pausing (31, 43, 54, 74)
- suggests that they prevent Rho-dependent termination
- by accelerating polymerase away from Rho bound at upstream RNA sites.
This explanation raises the problem of why NusG,
- which also accelerates polymerase,
- enhances rather than suppresses Rho-dependent termination (see above).
Clearly, the molecular details of processive antitermination remain poorly understood despite the 30 years that have elapsed since its discovery.
System wide analyses have underestimated protein abundances and the importance of transcription in mammals
OPEN ACCESS
Jingyi Jessica Li1, 2, Peter J Bickel1 and Mark D Biggin3
1Department of Statistics, University of California, Berkeley, CA, USA
2Departments of Statistics and Human Genetics, University of California, Los Angeles, CA, USA
3Genomics Division, Lawrence Berkeley National Laboratory, Berkeley, CA, USA
Academic editor – Barbara Engelhardt http://dx.doi.org:/10.7717/peerj.270
Distributed under Creative-Commons CC-0
ABSTRACT
Large scale surveys in mammalian tissue culture cells suggest that the protein ex-
pressed at the median abundance is present at 8,000_16,000 molecules per cell and
that differences in mRNA expression between genes explain only 10_40% of the dif-
ferences in protein levels. We find, however, that these surveys have significantly un-
derestimated protein abundances and the relative importance of transcription.
Using individual measurements for 61 housekeeping proteins to rescale whole proteome
data from Schwanhausser et al. (2011), we find that the median protein detected is
expressed at 170,000 molecules per cell and that our corrected protein abundance
estimates show a higher correlation with mRNA abundances than do the uncorrected
protein data. In addition, we estimated the impact of further errors in mRNA and
protein abundances using direct experimental measurements of these errors.
The resulting analysis suggests that mRNA levels explain at least
- 56% of the differences in protein abundance for the 4,212 genes
detected by Schwanhausser et al. (2011), though because one major source of error
could not be estimated the true percent contribution should be higher.
We also employed a second, independent strategy to
- determine the contribution of mRNA levels to protein expression.
The variance in translation rates directly measured by ribosome profiling is only 12%
of that inferred by Schwanhausser et al. (2011), and
- the measured and inferred translation rates correlate poorly (R2 D 13).
Based on this, our second strategy suggests that
- mRNA levels explain _81% of the variance in protein levels.
We also determined the percent contributions of
- transcription,
- RNA degradation,
- translation
- and protein degradation
to the variance in protein abundances using both of our strategies.
While the magnitudes of the two estimates vary, they both suggest that
- transcription plays a more important role than the earlier studies implied and
- translation a much smaller role.
Finally, the above estimates only apply to those genes whose mRNA and protein expression was detected. Based on a detailed analysis by Hebenstreit et al. (2012), we estimate that approximately
- 40% of genes in a given cell within a population express no mRNA.
Since there can be no translation in the absence of mRNA, we argue that
- differences in translation rates can play no role in determining the expression levels for the _40% of genes that are non-expressed.
Subjects Bioinformatics, Computational Biology
Keywords Transcription, Translation, Mass spectrometry, Gene expression, Protein abundance
How to cite this article Li et al. (2014), System wide analyses have underestimated protein abundances and the importance of transcription in mammals. PeerJ 2:e270;
http://dx.doi.org:/10.7717/peerj.270
Assessing quality and completeness of human transcriptional regulatory pathways on a genome-wide scale
Evgeny Shmelkov1,2, Zuojian Tang2, Iannis Aifantis3, Alexander Statnikov2,4
Shmelkov et al. Biology Direct 2011, 6:15 http://www.biology-direct.com/content/6/1/15
Background: Pathway databases are becoming increasingly important and almost omnipresent in most types of biological and translational research. However, little is known about the quality and completeness of pathways stored in these databases. The present study conducts a comprehensive assessment of transcriptional regulatory pathways in humans for seven well-studied transcription factors: MYC, NOTCH1, BCL6, TP53, AR, STAT1, and RELA.
The employed benchmarking methodology first
- involves integrating genome-wide binding with functional gene expression data to derive direct targets of transcription factors.
- Then the lists of experimentally obtained direct targets are compared with relevant lists of transcriptional targets from 10 commonly used pathway databases.
Results: The results of this study show that for the majority of pathway databases,
- the overlap between experimentally obtained target genes and targets reported in transcriptional regulatory pathway databases is surprisingly small and often is not statistically significant.
The only exception is MetaCore pathway database which yields statistically significant intersection with experimental results in 84% cases. Additionally, we suggest that
- the lists of experimentally derived direct targets obtained in this study can be used to reveal new biological insight in transcriptional regulation and
- suggest novel putative therapeutic targets in cancer.
Conclusions: Our study opens a debate on validity of using many popular pathway databases to obtain transcriptional regulatory targets. We conclude that the choice of pathway databases should be informed by solid scientific evidence and rigorous empirical evaluation.

Illustration of statistical methodology
Figure 2 Illustration of statistical methodology for comparison
between a gold-standard and a pathway database
Additional material
Additional file 1: Supplementary Information. Table S1: Functional gene expression data. Table 2: Transcription factor-DNA binding data. Table S3: Most confident direct transcriptional targets of each of the four transcription factors. These targets were obtained by overlapping several gold-standards obtained with different datasets for the same transcription factor. Table S4: Genes directly regulated by two or more of the three transcription factors: MYC, NOTCH1, and RELA. Figure S1: Comparison of gene sets of transcriptional targets derived from ten different pathway databases by Jaccard index. In case, where Jaccard index of an overlap could not be determined due to comparison of two empty gene lists, we assigned value 0. Cells are colored according to the Jaccard index, from white (Jaccard index equal to 0) to dark-orange (Jaccard index equal to 1). Each sub-figure gives results for a different transcription factor: (a) AR, (b) BCL6, (c) MYC, (d) NOTCH1, (e) RELA, (f) STAT1, (g) TP53
http://dx.doi.org:/10.1186/1745-6150-6-15
Cite this article as: Shmelkov et al.: Assessing quality and completeness of human transcriptional regulatory pathways on a genome-wide scale. Biology Direct 2011 6:15
The Functional Consequences of Variation in Transcription Factor Binding
Darren A. Cusanovich1, Bryan Pavlovic1,2, Jonathan K. Pritchard1,2,3*, Yoav Gilad1*
1 Department of Human Genetics, University of Chicago, 2 Howard Hughes Medical Institute, University of Chicago, Chicago,
Illinois, 3 Departments of Genetics and Biology and Howard Hughes Medical Institute, Stanford University, Stanford, California,
One goal of human genetics is to understand how the information for precise and dynamic gene expression programs is encoded in the genome. The interactions of transcription factors (TFs) with DNA regulatory elements clearly play an important role in determining gene expression outputs, yet the regulatory logic underlying functional transcription factor binding is poorly understood. Many studies have focused on characterizing the genomic locations of TF binding, yet it is unclear to what extent TF binding at any specific locus has functional consequences with respect to gene expression output.
To evaluate the context of functional TF binding we knocked down
- 59 TFs and chromatin modifiers in one HapMap lymphoblastoid cell line.
- We identified genes whose expression was affected by the knockdowns.
- We intersected the gene expression data with transcription factor binding data
(based on ChIP-seq and DNase-seq) within 10 kb of the transcription start sites
This combination of data allowed us to infer functional TF binding.
- we found that only a small subset of genes bound by a factor were differentially expressed following the knockdown of that factor, suggesting that
- most interactions between TF and chromatin do not result in measurable changes in gene expression levels of putative target genes.
- functional TF binding is enriched in regulatory elements that harbor
- a large number of TF binding sites,
- at sites with predicted higher binding affinity, and
- at sites that are enriched in genomic regions annotated as ‘‘active enhancers.’’
Author Summary
An important question in genomics is to understand how a class of proteins called ‘‘transcription factors’’ controls the expression level of other genes in the genome in a cell type-specific manner – a process that is essential to human development. One major approach to this problem is to
study where these transcription factors bind in the genome, but this does not tell us about the effect of that binding on gene expression levels and it is generally accepted that much of the binding does not strongly influence gene expression. To address this issue, we artificially reduced the concentration of 59 different transcription factors in the cell and then examined which genes were impacted by the reduced transcription factor level. Our results implicate some attributes that might
influence what binding is functional, but they also suggest that a simple model of functional vs. non-functional binding may not suffice.
Citation: Cusanovich DA, Pavlovic B, Pritchard JK, Gilad Y (2014) The Functional Consequences of Variation in Transcription Factor Binding. PLoS Genet 10(3):e1004226. http://dx.doi.org:/10.1371/journal.pgen.1004226
Editor: Yitzhak Pilpel, Weizmann Institute of Science, Israel

Effect sizes for differentially expressed genes
Figure 2. Effect sizes for differentially expressed genes.
Boxplots of absolute Log2(fold-change) between knockdown arrays
and control arrays for all genes identified as differentially expressed in
each experiment. Outliers are not plotted. The gray bar indicates the
interquartile range across all genes differentially expressed in all
knockdowns. Boxplots are ordered by the number of genes differentially
expressed in each experiment. Outliers were not plotted.
http://dx.doi.org:/10.1371/journal.pgen.1004226.g002

Intersecting binding data and expression data for each knockdown
Figure 3. Intersecting binding data and expression data for each knockdown. (a) Example Venn diagrams showing the overlap of binding and differential expression for the knockdowns of HCST and IRF4 (the same genes as in Figure 1). (b) Boxplot summarizing the distribution of the fraction of all expressed genes that are bound by the targeted gene or downstream factors. (c) Boxplot summarizing the distribution of the fraction of
bound genes that are classified as differentially expressed, using an FDR of either 5% or 20%.
http://dx.doi.org:/10.1371/journal.pgen.1004226.g003

Degree of binding correlated with function
Figure 4. Degree of binding correlated with function. Boxplots comparing (a) the number of sites bound, and (b) the number of differentially expressed transcription factors binding events near functionally or non-functionally bound genes. We considered binding for siRNA-targeted factor and any factor differentially expressed in the knockdown. (c) Focusing only on genes differentially expressed in common between each pairwise set of knockdowns we tested for enrichments of functional binding (y-axis). Pairwise comparisons between knock-down experiments were binned by the fraction of differentially expressed transcription factors in common between the two experiments. For these boxplots, outliers were not plotted.
http://dx.doi.org:/10.1371/journal.pgen.1004226.g004

Distribution of functional binding about the TSS
Figure 5. Distribution of functional binding about the TSS. (a) A density plot of the distribution of bound sites within 10 kb of the TSS for both functional and non-functional genes. Inset is a zoom-in of the region +/21 kb from the TSS (b) Boxplots comparing the distances from the TSS to the binding sites for functionally bound genes and non-functionally bound genes. For the boxplots, 0.001 was added before log10 transforming
the distances and outliers were not plotted.
http://dx.doi.org:/10.1371/journal.pgen.1004226.g005

Magnitude and direction of differential expression after knockdown
Figure 6. Magnitude and direction of differential expression after knockdown. (a) Density plot of all Log2(fold-changes) between the knockdown arrays and controls for genes that are differentially expressed at 5% FDR in one of the knockdown experiments as well as bound by the targeted transcription factor. (b) Plot of the fraction of differentially expressed putative direct targets that were up-regulated in each of the knockdown experiments.
http://dx.doi.org:/10.1371/journal.pgen.1004226.g006
To test whether the number of paralogs or the degree of similarity with the closest paralog for each transcription factor knocked down might influence the number of genes differentially expressed in our experiments, we obtained definitions of paralogy and the calculations of percent identity for 29 different factors from Ensembl’s BioMart (http://useast.ensembl.org/biomart/martview/) [31]. We used genome build GRCh37.p13.
For each gene, we counted the number of paralogs classified as a ‘‘within_species_paralog’’. After selecting only genes considered a ‘‘within_species_paralog’’, we also assigned the maximum percent identity as the closest paralog.
To evaluate the effect that an independent assignment of target genes to regulatory regions might have on our analyses, we used the definition of target genes defined by Thurman et al. (ftp://ftp.ebi.ac.uk/pub/databases/…)
which use correlations in DNase hypersensitivity between distal and proximal regulatory regions across different cell types to link distal elements to putative target genes [38].
We intersected the midpoints of our called binding events (defined above) with these regulatory elements in order to assign our binding events to specific target genes and then re-analyzed the overlap between
binding and differential expression in our experiments.
PLOS Genetics 6 Mar 2014; 10 (3), e1004226
The essential biology of the endoplasmic reticulum stress response
for structural and computational biologists
Sadao Wakabayashia, Hiderou Yoshidaa,*
aDepartment of Molecular Biochemistry, Graduate School of Life Science,
University of Hyogo, Hyogo 678-1297, Japan
CSBJ Mar 2013; 6(7), e201303010, http://dx.doi.org/10.5936/csbj.201303010
Abstract: The endoplasmic reticulum (ER) stress response is a cytoprotective mechanism that maintains homeostasis of the ER by
- upregulating the capacity of the ER in accordance with cellular demands.
If the ER stress response cannot function correctly, because of reasons such as aging, genetic mutation or environmental stress,
- unfolded proteins accumulate in the ER and cause ER stress-induced apoptosis,
- resulting in the onset of folding diseases,
- including Alzheimer’s disease and diabetes mellitus.
Although the mechanism of the ER stress response has been analyzed extensively by biochemists, cell biologists and molecular biologists, many aspects remain to be elucidated. For example,
- it is unclear how sensor molecules detect ER stress, or
- how cells choose the two opposite cell fates
(survival or apoptosis) during the ER stress response.
To resolve these critical issues, structural and computational approaches will be indispensable, although the mechanism of the ER stress response is complicated and difficult to understand holistically at a glance. Here, we provide a concise introduction to the mammalian ER stress response for structural and computational biologists.
The basic mechanism of the mammalian ER stress response
The mammalian ER stress response consists of three pathways: the ATF6, IRE1 and PERK pathways, of which the main functions are
- augmentation of folding and ERAD capacity, and
- translational attenuation, respectively.
Although these response pathways cross-talk with each other and have several branched subpathways, we focus on the main pathways in this section.
- The ATF6 pathway regulates the transcriptional induction of ER chaperone genes
- pATF6(P) is a sensor molecule comprising a type II transmembrane protein residing on the ER membrane (Figure 2).
When pATF6(P) detects ER stress,
- the protein is transported to the Golgi apparatus through vesicular transport in a COP-II vesicle
- and is sequentially cleaved by two proteases residing in the Golgi,
- namely site 1 protease (S1P) and site 2 protease (S2P)
The cytoplasmic portion of pATF6(P) (pATF6(N)) is
- released from the Golgi membrane,
- translocates into the nucleus,
- binds to an enhancer element called the ER stress response element (ERSE),
- and activates the transcription of ER chaperone genes,
- including BiP, GRP94, calreticulin and protein disulfide isomerase (PDI)
The consensus nucleotide sequence of ERSE is CCAAT(N9)CCACG, and pATF6(N) recognizes both the CCACG portion and another transcription factor NF-Y,
- which binds to the CCAAT portion
NF-Y is a general transcription factor required for
- the transcription of various human genes
Figure 2. The ATF6 pathway. The sensor molecule pATF6(P) located on the ER membrane is transported to the Golgi apparatus by transport vesicles in response to ER stress. In the Golgi apparatus, pATF6(P) is sequentially cleaved by two proteases, S1P and S2P, resulting in release of the cytoplasmic portion pATF6(N) from the ER membrane. pATF6(N) translocates into the nucleus and activates transcription of ER chaperone genes through binding to the cis-acting enhancer ERSE.
Figure 3. The IRE1 pathway. In normal growth conditions, the sensor molecule IRE1 is an inactive monomer, whereas IRE1 forms an active oligomer in response to ER stress. Activated IRE1 converts unspliced XBP1 mRNA to mature mRNA by the cytoplasmic mRNA splicing. From mature XBP1 mRNA, an active transcription factor pXBP1(S) is translated and activates the transcription of ERAD genes through binding to the enhancer UPRE.
Figure 4. The PERK pathway. When PERK detects unfolded proteins in the ER, PERK phosphorylates eIF2α, resulting in translational attenuation and translational induction of ATF4. ATF4 activates the transcription of target genes encoding translation factors, anti-oxidation factors and a transcription factor CHOP. Other kinases such as PKR, GCN2 and HRI also phosphorylate eIF2α, and phosphorylated eIF2α is dephosphorylated by CReP, PP1C-GADD34 and p58IPK
Figure 7. Three functions of pXBP1(U). pXBP1(U) translated from XBP1(U) mRNA binds to pXBP1(S) and enhances its degradation. The CTR region of pXBP1(U) interacts with the ribosome tunnel and slows translation, while the HR2 region anchors XBP1(U) mRNA to the ER membrane, in order to enhance splicing of XBP1(U) mRNA by IRE1.
Figure 8. Major pathways of ER stress-induced apoptosis. ER stress induces apoptosis through various pathways, including transcriptional induction of CHOP by the PERK and ATF6 pathways, the IRE1-TRAF2 pathway and the caspase-12 pathway.
If cells are damaged by strong and sustained ER stress that they cannot deal with and ER stress still persists and hampers the survival of the organism, the ER stress response activates the apoptotic pathways and disposes of damaged cells from the body.
Computational simulation of response pathways to analyze the decision mechanism that determines cell fate (survival or apoptosis) provides a valuable analysis tool, although there have been few such studies to date.
Overview of Posttranslational Modification (PTM)
Posted in Cell Biology, Signaling & Cell Circuits, Cerebrovascular and Neurodegenerative Diseases, Chemical Biology and its relations to Metabolic Disease, Chemical Genetics, Coagulation Therapy and Internal Bleeding, Curation, Endocrine Diseases, Epigenetics and Cardiovascular Risks, Gene Regulation, Genome Biology, Genomic Expression, Metabolomics, Methylation, Neurohumoral Transmission, Oxidative phosphorylation, Pharmaceutical Discovery, Phosphorylation, Proteomics, RNA Biology, Cancer and Therapeutics, S-nitrosylation, Signaling, Systemic Inflammatory Response Related Disorders, Transcriptomics, Translational Research, Translational Science, Ubiquitinylation, tagged Posttranslational modification, protein effectors, protein synthesis, Proteomics, signaling pathways on July 29, 2014| Leave a Comment »
Overview of Posttranslational Modification (PTM)
Curator: Larry H. Bernstein, MD, FCAP
UPDATED on 4/1/2022
Cited in
https://www.beckman.com/resources/sample-type/bio-molecules/post-translational-modification
This is the second discussion of a several part series leading from the genome, to protein synthesis (1), posttranslational modification of proteins (2), examples of protein effects on metabolism and signaling pathways (3), and leading to disruption of signaling pathways in disease (4), and effects leading to mutagenesis.
1. A Primer on DNAand DNA Replication
2. Overview of translational medicine
3. Genes, proteomes, and their interaction
4. Regulation of somatic stem cell Function
5. Proteomics – The Pathway to Understanding and Decision-making in Medicine
6. Genomics, Proteomics and standards
7. Long Non-coding RNAs Can Encode Proteins After All
- http://pharmaceuticalintelligence.com/2014/06/29/long-non-coding-rnas-can-encode-proteins-after-all/
- 3:15 – 3:45, 2014, Laurie Boyer “Long non-coding RNAs: molecular regulators of cell fate”; http://pharmaceuticalintelligence.com/2014/06/04/koch-institute-for-integrative-cancer-research-mit-summer-symposium-2014-rna-biology-cancer-and-therapeutic-implications-june-13-2014-830am-430pm-kresge-auditorium-mit/
8. Proteins and cellular adaptation to stress
9. Loss of normal growth regulation
Posttranslational modification is a step in protein biosynthesis. Proteins are created by ribosomes translating mRNA into polypeptide chains. These polypeptide chains undergo
PTM before becoming the mature protein product.
Protein phosphorylation is one type of post-translational modification. Wikipedia
Explore: Phosphorylation
Glycosylation is a form of co-translational and post-translational modification. Wikipedia
Explore: Glycosylation
Acetylation occurs as a co-translational and post-translational modification of proteins, for example, histones, p53, and tubulins.
| Post-Translational Modifications |
| As noted above, the large number of different PTMs precludes a thorough review of all possible protein modifications. Therefore, this overview only touches on a small number of the most common types of PTMs studied in protein research today. Furthermore, greater focus is placed on phosphorylation, glycosylation and ubiquitination, and therefore these PTMs are described in greater detail on pages dedicated to the respective PTM. |
| PhosphorylationReversible protein phosphorylation, principally on serine, threonine or tyrosine residues, is one of the most important and well-studied post-translational modifications. Phosphorylation plays critical roles in the regulation of many cellular processes including cell cycle, growth, apoptosis and signal transduction pathways. |
| GlycosylationProtein glycosylation is acknowledged as one of the major post-translational modifications, with significant effects on protein folding, conformation, distribution, stability and activity. Glycosylation encompasses a diverse selection of sugar-moiety additions to proteins that ranges from simple monosaccharide modifications of nuclear transcription factors to highly complex branched polysaccharide changes of cell surface receptors. Carbohydrates in the form of aspargine-linked (N-linked) or serine/threonine-linked (O-linked) oligosaccharides are major structural components of many cell surface and secreted proteins. |
| UbiquitinationUbiquitin is an 8-kDa polypeptide consisting of 76 amino acids that is appended to lysine in target proteins via the C-terminal glycine of ubiquitin. A ubiquitin polymer is formed after initial monoubiquitination. Polyubiquitinated proteins are degraded recycling the ubiquitin. |
S-NitrosylationNitric oxide (NO) is produced by three isoforms of nitric oxide synthase (NOS) and is a chemical messenger that reacts with free cysteine residues to form S-nitrothiols (SNOs). S-nitrosylation is a critical PTM used by cells to stabilize proteins, regulate gene expression and provide NO donors, and the generation, localization, activation and catabolism of SNOs are tightly regulated.S-nitrosylation is a reversible reaction, and SNOs have a short half life in the cytoplasm because of the host of reducing enzymes, including glutathione (GSH) and thioredoxin, that denitrosylate proteins. Therefore, SNOs are often stored in membranes, vesicles, the interstitial space and lipophilic protein folds to protect them from denitrosylation (5). For example, caspases, which mediate apoptosis, are stored in the mitochondrial intermembrane space as SNOs. In response to extra- or intracellular cues, the caspases are released into the cytoplasm, and the highly reducing environment rapidly denitrosylates the proteins, resulting in caspase activation and the induction of apoptosis.Only specific cysteine residues are S-nitrosylated. Proteins may contain multiple cysteines and due to the labile nature of SNOs, S-nitrosylated cysteines can be difficult to detect and distinguish from non-S-nitrosylated amino acids. The biotin switch assay, developed by Jaffrey et al., is a common method of detecting SNOs, and the steps of the assay are listed below (6):
|
| MethylationThe transfer of one-carbon methyl groups to nitrogen or oxygen (N- and O-methylation, respectively) to amino acid side chains increases the hydrophobicity of the protein and can neutralize a negative amino acid charge when bound to carboxylic acids. Methylation is mediated by methyltransferases, and S-adenosyl methionine (SAM) is the primary methyl group donor.Methylation occurs so often that SAM has been suggested to be the most-used substrate in enzymatic reactions after ATP (4). Additionally, while N-methylation is irreversible, O-methylation is potentially reversible. Methylation is a well-known mechanism of epigenetic regulation, as histone methylation and demethylation influences the availability of DNA for transcription. |
| N-AcetylationN-acetylation, or the transfer of an acetyl group to nitrogen, occurs in almost all eukaryotic proteins through both irreversible and reversible mechanisms. N-terminal acetylation requires the cleavage of the N-terminal methionine by methionine aminopeptidase (MAP) before replacing the amino acid with an acetyl group from acetyl-CoA by N-acetyltransferase (NAT) enzymes. This type of acetylation is co-translational, in that N-terminus is acetylated on growing polypeptide chains that are still attached to the ribosome.Acetylation at the ε-NH2 of lysine (termed lysine acetylation) on histone N-termini is a common method of regulating gene transcription. Histone acetylation is a reversible event that reduces chromosomal condensation to promote transcription, and the acetylation of these lysine residues is regulated by transcription factors that contain histone acetyletransferase (HAT) activity. While transcription factors with HAT activity act as transcription co-activators, histone deacetylase (HDAC) enzymes are co-repressors that reverse the effects of acetylation by reducing the level of lysine acetylation and increasing chromosomal condensation.Sirtuins (silent information regulator) are a group of NAD-dependent deacetylases that target histones. As their name implies, they maintain gene silencing by hypoacetylating histones and have been reported to aid in maintaining genomic stability (8).Cytoplasmic proteins may also be acetylated, and therefore acetylation seems to play a greater role in cell biology than simply transcriptional regulation (9). Furthermore, crosstalk between acetylation and other post-translational modifications, including phosphorylation, ubiquitination and methylation, can modify the biological function of the acetylated protein (10). |
LipidationLipidation is a method to target proteins to membranes in organelles (endoplasmic reticulum [ER], Golgi apparatus, mitochondria), vesicles (endosomes, lysosomes) and the plasma membrane. The four types of lipidation are:
Each type of modification gives proteins distinct membrane affinities, although all types of lipidation increase the hydrophobicity of a protein and thus its affinity for membranes. The different types of lipidation are not mutually exclusive, in that two or more lipids can be attached to a given protein. GPI anchors tether cell surface proteins to the plasma membrane. These hydrophobic moieties are prepared in the ER, where they are then added to the nascent protein en bloc. GPI-anchored proteins are often localized to cholesterol- and sphingolipid-rich lipid rafts, which act as signaling platforms on the plasma membrane. N-myristoylation, facilitated specifically by N-myristoyltransferase (NMT), uses myristoyl-CoA to attach the myristoyl group to the N-terminal glycine. This PTM requires methionine cleavage prior to addition of the myristoyl group because methionine is the N-terminal amino acid of all eukaryotic proteins. S-palmitoylation adds a C16 palmitoyl group from palmitoyl-CoA to the thiolate side chain of cysteine residues via palmitoyl acyl transferases (PATs). Because of the longer hydrophobic group, this anchor can permanently anchor the protein to the membrane. S-palmitoylation is used as an on/off switch to regulate membrane localization. S-prenylation covalently adds a farnesyl (C15) or geranylgeranyl (C20) group to specific cysteine residues within 5 amino acids from the C-terminus via farnesyl transferase (FT) or geranylgeranyl transferases (GGT I and II). All members of the Ras superfamily are prenylated. These proteins have specific 4-amino acid motifs at the C-terminus that determine the type of prenylation at single or dual cysteines. Prenylation occurs in the ER and is often part of a stepwise process of PTMs that is followed by proteolytic cleavage by Rce1 and methylation by isoprenyl cysteine methyltransferase (ICMT). |
| ProteolysisPeptide bonds are indefinitely stable under physiological conditions, and therefore cells require some mechanism to break these bonds. Proteases comprise a family of enzymes that cleave the peptide bonds of proteins and are critical in antigen processing, apoptosis, surface protein shedding and cell signaling.Degradative proteolysis is critical to remove unassembled protein subunits and misfolded proteins and to maintain protein concentrations at homeostatic concentrations.Proteolysis is a thermodynamically favorable and irreversible reaction. Therefore, protease activity is tightly regulated to avoid uncontrolled proteolysis through temporal and/or spatial control mechanisms including regulation by cleavage in cis or trans and compartmentalization (e.g., proteasomes, lysosomes). |
The diverse family of proteases can be classified by the site of action, such as aminopeptidases and carboxypeptidase, which cleave at the amino or carboxy terminus of a protein, respectively. Another type of classification is based on the active site groups of a given protease that are involved in proteolysis. Based on this classification strategy, greater than 90% of known proteases fall into one of four categories as follows:
- Serine proteases
- Cysteine proteases
- Aspartic acid proteases
- Zinc metalloproteases
| References | |
|
|
Protein phosphorylation
From Wikipedia, the free encyclopedia
Protein phosphorylation is a post-translational modification of proteins in which a serine, a threonine or a tyrosine residue is phosphorylated by a protein kinase by the addition of a covalently bound phosphate group. Regulation of proteins by phosphorylation is one of the most common modes of regulation of protein function, and is often termed “phosphoregulation”. In almost all cases of phosphoregulation, the protein switches between a phosphorylated and an unphosphorylated form, and one of these two is an active form, while the other one is an inactive form.
Functions of phosphorylation[edit]
In some reactions, the purpose of phosphorylation is to “activate” or “volatize” a molecule, increasing its energy so it is able to participate in a subsequent reaction with a negativefree-energy change. All kinases require a divalent metal ion such as Mg2+ or Mn2+ to be present, which stabilizes the high-energy bonds of the donor molecule (usually ATP or ATP derivative) and allows phosphorylation to occur.
In other reactions, phosphorylation of a protein substrate can inhibit its activity (as when AKT phosphorylates the enzyme GSK-3). One common mechanism for phosphorylation-mediated enzyme inhibition was demonstrated in the tyrosine kinase called “src” (pronounced “sarc”, see: Src (gene)). When src is phosphorylated on a particular tyrosine, it folds on itself, and thus masks its own kinase domain, and is thus turned “off”.
In still other reactions, phosphorylation of a protein causes it to be bound to other proteins which have “recognition domains” for a phosphorylated tyrosine, serine, or threoninemotif. As a result of binding a particular protein, a distinct signaling system may be activated or inhibited.
In the late 1990s it was recognized that phosphorylation of some proteins causes them to be degraded by the ATP-dependent ubiquitin/proteasome pathway. These target proteins become substrates for particular E3 ubiquitin ligases only when they are phosphorylated.
Oxidative phosphorylation
From Wikipedia, the free encyclopedia
Oxidative phosphorylation (or OXPHOS in short) is the metabolic pathway in which the mitochondria in cellsuse their structure, enzymes, and energy released by the oxidation of nutrients to reform ATP. Although the many forms of life on earth use a range of different nutrients, ATP is the molecule that supplies energy tometabolism. Almost all aerobic organisms carry out oxidative phosphorylation. This pathway is probably so pervasive because it is a highly efficient way of releasing energy, compared to alternative fermentationprocesses such as anaerobic glycolysis.
During oxidative phosphorylation, electrons are transferred from electron donors to electron acceptors such as oxygen, in redox reactions. These redox reactions release energy, which is used to form ATP. In eukaryotes, these redox reactions are carried out by a series of protein complexes within the cell’s intermembrane wall mitochondria, whereas, in prokaryotes, these proteins are located in the cells’ intermembrane space.
The electron transport chain in the mitochondrion is the site of oxidative phosphorylation in eukaryotes. The NADH and succinate generated in the citric acid cycle are oxidized, releasing energy to power the ATP synthase.
These linked sets of proteins are called electron transport chains. In eukaryotes, five main protein complexes are involved, whereas in prokaryotes many different enzymes are present, using a variety of electron donors and acceptors.

The energy released by electrons flowing through this electron transport chain is used to transport protons across the inner mitochondrial membrane, in a process called electron transport. This generates potential energy in the form of a pH gradient and an electrical potential across this membrane. This store of energy is tapped by allowing protons to flow back across the membrane and down this gradient, through a large enzymecalled ATP synthase; this process is known as chemiosmosis. This enzyme uses this energy to generate ATP from adenosine diphosphate (ADP), in a phosphorylation reaction. This reaction is driven by the proton flow, which forces the rotation of a part of the enzyme; the ATP synthase is a rotary mechanical motor.
Although oxidative phosphorylation is a vital part of metabolism, it produces reactive oxygen species such assuperoxide and hydrogen peroxide, which lead to propagation of free radicals, damaging cells and contributing to disease and, possibly, aging (senescence). The enzymes carrying out this metabolic pathway are also the target of many drugs and poisons that inhibit their activities.
Additional References in Leaders in Pharmaceutical Intelligence
Proteomics and Biomarker Discovery
http://pharmaceuticalintelligence.com/2012/08/21/proteomics-and-biomarker-discovery/
Developments in the Genomics and Proteomics of Type 2 Diabetes Mellitus and Treatment Targets
Immune activation, immunity, antibacterial activity
http://pharmaceuticalintelligence.com/2014/07/06/immune-activation-immunity-antibacterial-activity/
Ubiquitin-Proteosome pathway, Autophagy, the Mitochondrion, Proteolysis and Cell Apoptosis: Part III
Ubiquinin-Proteosome pathway, autophagy, the mitochondrion, proteolysis and cell apoptosis
Research on inflammasomes opens therapeutic ways for treatment of rheumatoid arthritis
Update on mitochondrial function, respiration, and associated disorders
Insert – on ETC
Overview of energy transfer by chemiosmosis[edit]
Further information: Chemiosmosis and Bioenergetics
Oxidative phosphorylation works by using energy-releasing chemical reactions to drive energy-requiring reactions: The two sets of reactions are said to be coupled. This means one cannot occur without the other. The flow of electrons through the electron transport chain, from electron donors such as NADH to electron acceptors such as oxygen, is anexergonic process – it releases energy, whereas the synthesis of ATP is an endergonic process, which requires an input of energy. Both the electron transport chain and the ATP synthase are embedded in a membrane, and energy is transferred from electron transport chain to the ATP synthase by movements of protons across this membrane, in a process called chemiosmosis.[1] In practice, this is like a simple electric circuit, with a current of protons being driven from the negative N-side of the membrane to the positive P-side by the proton-pumping enzymes of the electron transport chain. These enzymes are like a battery, as they perform work to drive current through the circuit. The movement of protons creates an electrochemical gradient across the membrane, which is often called the proton-motive force. It has two components: a difference in proton concentration (a H+gradient, ΔpH) and a difference in electric potential, with the N-side having a negative charge.[2]
ATP synthase releases this stored energy by completing the circuit and allowing protons to flow down the electrochemical gradient, back to the N-side of the membrane.[3] This kinetic energy drives the rotation of part of the enzymes structure and couples this motion to the synthesis of ATP.
The two components of the proton-motive force are thermodynamically equivalent: In mitochondria, the largest part of energy is provided by the potential; in alkaliphile bacteria the electrical energy even has to compensate for a counteracting inverse pH difference. Inversely, chloroplasts operate mainly on ΔpH. However, they also require a small membrane potential for the kinetics of ATP synthesis. At least in the case of the fusobacterium P. modestum it drives the counter-rotation of subunits a and c of the FO motor of ATP synthase.[2]
The amount of energy released by oxidative phosphorylation is high, compared with the amount produced by anaerobic fermentation. Glycolysis produces only 2 ATP molecules, but somewhere between 30 and 36 ATPs are produced by the oxidative phosphorylation of the 10 NADH and 2 succinate molecules made by converting one molecule of glucoseto carbon dioxide and water,[4] while each cycle of beta oxidation of a fatty acid yields about 14 ATPs. These ATP yields are theoretical maximum values; in practice, some protons leak across the membrane, lowering the yield of ATP.[5]
Electron and proton transfer molecules[edit]
Further information: Coenzyme and Cofactor
The electron transport chain carries both protons and electrons, passing electrons from donors to acceptors, and transporting protons across a membrane. These processes use both soluble and protein-bound transfer molecules. In mitochondria, electrons are transferred within the intermembrane space by the water-soluble electron transfer protein cytochrome c.[6] This carries only electrons, and these are transferred by the reduction and oxidation of an iron atom that the protein holds within a heme group in its structure. Cytochrome c is also found in some bacteria, where it is located within the periplasmic space.[7]


Reduction of coenzyme Q from itsubiquinone form (Q) to the reduced ubiquinol form (QH2).
Within the inner mitochondrial membrane, the lipid-soluble electron carrier coenzyme Q10 (Q) carries both electrons and protons by a redox cycle.[8] This small benzoquinone molecule is very hydrophobic, so it diffuses freely within the membrane. When Q accepts two electrons and two protons, it becomes reduced to the ubiquinol form (QH2); when QH2 releases two electrons and two protons, it becomes oxidized back to the ubiquinone (Q) form. As a result, if two enzymes are arranged so that Q is reduced on one side of the membrane and QH2 oxidized on the other, ubiquinone will couple these reactions and shuttle protons across the membrane.[9] Some bacterial electron transport chains use different quinones, such as menaquinone, in addition to ubiquinone.[10]
Within proteins, electrons are transferred between flavin cofactors,[3][11] iron–sulfur clusters, and cytochromes. There are several types of iron–sulfur cluster. The simplest kind found in the electron transfer chain consists of two iron atoms joined by two atoms of inorganic sulfur; these are called [2Fe–2S] clusters. The second kind, called [4Fe–4S], contains a cube of four iron atoms and four sulfur atoms. Each iron atom in these clusters is coordinated by an additional amino acid, usually by the sulfur atom of cysteine. Metal ion cofactors undergo redox reactions without binding or releasing protons, so in the electron transport chain they serve solely to transport electrons through proteins. Electrons move quite long distances through proteins by hopping along chains of these cofactors.[12] This occurs by quantum tunnelling, which is rapid over distances of less than 1.4×10⁻⁹ m.[13]
Eukaryotic electron transport chains[edit]
Further information: Electron transport chain and Chemiosmosis
Many catabolic biochemical processes, such as glycolysis, the citric acid cycle, and beta oxidation, produce the reduced coenzyme NADH. This coenzyme contains electrons that have a high transfer potential; in other words, they will release a large amount of energy upon oxidation. However, the cell does not release this energy all at once, as this would be an uncontrollable reaction. Instead, the electrons are removed from NADH and passed to oxygen through a series of enzymes that each release a small amount of the energy. This set of enzymes, consisting of complexes I through IV, is called the electron transport chain and is found in the inner membrane of the mitochondrion. Succinate is also oxidized by the electron transport chain, but feeds into the pathway at a different point.
In eukaryotes, the enzymes in this electron transport system use the energy released from the oxidation of NADH to pump protons across the inner membrane of the mitochondrion. This causes protons to build up in the intermembrane space, and generates an electrochemical gradient across the membrane. The energy stored in this potential is then used by ATP synthase to produce ATP. Oxidative phosphorylation in the eukaryotic mitochondrion is the best-understood example of this process. The mitochondrion is present in almost all eukaryotes, with the exception of anaerobic protozoa such as Trichomonas vaginalis that instead reduce protons to hydrogen in a remnant mitochondrion called a hydrogenosome.[14]
| Typical respiratory enzymes and substrates in eukaryotes. | ||
| Respiratory enzyme | Redox pair | Midpoint potential (Volts) |
| NADH dehydrogenase | NAD+ / NADH | −0.32[15] |
| Succinate dehydrogenase | FMN or FAD / FMNH2 or FADH2 | −0.20[15] |
| Cytochrome bc1 complex | Coenzyme Q10ox / Coenzyme Q10red | +0.06[15] |
| Cytochrome bc1 complex | Cytochrome box / Cytochrome bred | +0.12[15] |
| Complex IV | Cytochrome cox / Cytochrome cred | +0.22[15] |
| Complex IV | Cytochrome aox / Cytochrome ared | +0.29[15] |
| Complex IV | O2 / HO− | +0.82[15] |
| Conditions: pH = 7[15] | ||
NADH-coenzyme Q oxidoreductase (complex I)[edit]
NADH-coenzyme Q oxidoreductase, also known as NADH dehydrogenase or complex I, is the first protein in the electron transport chain.[16] Complex I is a giant enzyme with the mammalian complex I having 46 subunits and a molecular mass of about 1,000 kilodaltons (kDa).[17] The structure is known in detail only from a bacterium;[18][19] in most organisms the complex resembles a boot with a large “ball” poking out from the membrane into the mitochondrion.[20][21]

Complex I or NADH-Q oxidoreductase. The abbreviations are discussed in the text. In all diagrams of respiratory complexes in this article, the matrix is at the bottom, with the intermembrane space above.
The genes that encode the individual proteins are contained in both the cell nucleus and themitochondrial genome, as is the case for many enzymes present in the mitochondrion.
The reaction that is catalyzed by this enzyme is the two electron oxidation of NADH by coenzyme Q10 or ubiquinone(represented as Q in the equation below), a lipid-soluble quinone that is found in the mitochondrion membrane:
The start of the reaction, and indeed of the entire electron chain, is the binding of a NADH molecule to complex I and the donation of two electrons. The electrons enter complex I via a prosthetic group attached to the complex, flavin mononucleotide (FMN). The addition of electrons to FMN converts it to its reduced form, FMNH2. The electrons are then transferred through a series of iron–sulfur clusters: the second kind of prosthetic group present in the complex.[18] There are both [2Fe–2S] and [4Fe–4S] iron–sulfur clusters in complex I.
As the electrons pass through this complex, four protons are pumped from the matrix into the intermembrane space. Exactly how this occurs is unclear, but it seems to involve conformational changes in complex I that cause the protein to bind protons on the N-side of the membrane and release them on the P-side of the membrane.[22] Finally, the electrons are transferred from the chain of iron–sulfur clusters to a ubiquinone molecule in the membrane.[16] Reduction of ubiquinone also contributes to the generation of a proton gradient, as two protons are taken up from the matrix as it is reduced to ubiquinol (QH2).
Succinate-Q oxidoreductase (complex II)[edit]
Succinate-Q oxidoreductase, also known as complex II or succinate dehydrogenase, is a second entry point to the electron transport chain.[23] It is unusual because it is the only enzyme that is part of both the citric acid cycle and the electron transport chain. Complex II consists of four protein subunits and contains a bound flavin adenine dinucleotide (FAD) cofactor, iron–sulfur clusters, and a hemegroup that does not participate in electron transfer to coenzyme Q, but is believed to be important in decreasing production of reactive oxygen species.[24][25]

Complex II: Succinate-Q oxidoreductase.
It oxidizes succinate to fumarate and reduces ubiquinone.As this reaction releases less energy than the oxidation of NADH, complex II does not transport protons across the membrane and does not contribute to the proton gradient.
In some eukaryotes, such as the parasitic worm Ascaris suum, an enzyme similar to complex II, fumarate reductase (menaquinol:fumarate oxidoreductase, or QFR), operates in reverse to oxidize ubiquinol and reduce fumarate. This allows the worm to survive in the anaerobic environment of the large intestine, carrying out anaerobic oxidative phosphorylation with fumarate as the electron acceptor.[26] Another unconventional function of complex II is seen in the malaria parasite Plasmodium falciparum. Here, the reversed action of complex II as an oxidase is important in regenerating ubiquinol, which the parasite uses in an unusual form ofpyrimidine biosynthesis.[27]
Electron transfer flavoprotein-Q oxidoreductase[edit]
Electron transfer flavoprotein-ubiquinone oxidoreductase (ETF-Q oxidoreductase), also known as electron transferring-flavoprotein dehydrogenase, is a third entry point to the electron transport chain. It is an enzyme that accepts electrons from electron-transferring flavoprotein in the mitochondrial matrix, and uses these electrons to reduce ubiquinone.[28] This enzyme contains a flavin and a [4Fe–4S] cluster, but, unlike the other respiratory complexes, it attaches to the surface of the membrane and does not cross the lipid bilayer.[29]
In mammals, this metabolic pathway is important in beta oxidation of fatty acids and catabolism of amino acids and choline, as it accepts electrons from multiple acetyl-CoAdehydrogenases.[30][31] In plants, ETF-Q oxidoreductase is also important in the metabolic responses that allow survival in extended periods of darkness.[32]
Q-cytochrome c oxidoreductase (complex III)[edit]
Q-cytochrome c oxidoreductase is also known as cytochrome c reductase, cytochrome bc1 complex, or simply complex III.[33][34] In mammals, this enzyme is a dimer, with each subunit complex containing 11 protein subunits, an [2Fe-2S] iron–sulfur cluster and three cytochromes: one cytochrome c1 and two bcytochromes.[35] A cytochrome is a kind of electron-transferring protein that contains at least one hemegroup. The iron atoms inside complex III’s heme groups alternate between a reduced ferrous (+2) and oxidized ferric (+3) state as the electrons are transferred through the protein.

The two electron transfer steps in complex III: Q-cytochrome c oxidoreductase. After each step, Q (in the upper part of the figure) leaves the enzyme.
The reaction catalyzed by complex III is the oxidation of one molecule of ubiquinol and the reduction of two molecules of cytochrome c, a heme protein loosely associated with the mitochondrion. Unlike coenzyme Q, which carries two electrons, cytochrome c carries only one electron.
As only one of the electrons can be transferred from the QH2 donor to a cytochrome c acceptor at a time, the reaction mechanism of complex III is more elaborate than those of the other respiratory complexes, and occurs in two steps called the Q cycle.[36] In the first step, the enzyme binds three substrates, first, QH2, which is then oxidized, with one electron being passed to the second substrate, cytochrome c. The two protons released from QH2 pass into the intermembrane space. The third substrate is Q, which accepts the second electron from the QH2 and is reduced to Q.-, which is the ubisemiquinone free radical. The first two substrates are released, but this ubisemiquinone intermediate remains bound. In the second step, a second molecule of QH2 is bound and again passes its first electron to a cytochrome c acceptor. The second electron is passed to the bound ubisemiquinone, reducing it to QH2 as it gains two protons from the mitochondrial matrix. This QH2 is then released from the enzyme.[37]
As coenzyme Q is reduced to ubiquinol on the inner side of the membrane and oxidized to ubiquinone on the other, a net transfer of protons across the membrane occurs, adding to the proton gradient.[3] The rather complex two-step mechanism by which this occurs is important, as it increases the efficiency of proton transfer. If, instead of the Q cycle, one molecule of QH2 were used to directly reduce two molecules of cytochrome c, the efficiency would be halved, with only one proton transferred per cytochrome c reduced.[3]
Cytochrome c oxidase (complex IV)[edit]
For more details on this topic, see cytochrome c oxidase.
Cytochrome c oxidase, also known as complex IV, is the final protein complex in the electron transport chain.[38] The mammalian enzyme has an extremely complicated structure and contains 13 subunits, two heme groups, as well as multiple metal ion cofactors – in all, three atoms of copper, one of magnesium and one of zinc.[39]
This enzyme mediates the final reaction in the electron transport chain and transfers electrons to oxygen, while pumping protons across the membrane.[40] The final electron acceptor oxygen, which is also called the terminal electron acceptor, is reduced to water in this step. Both the direct pumping of protons and the consumption of matrix protons in the reduction of oxygen contribute to the proton gradient. The reaction catalyzed is the oxidation of cytochrome c and the reduction of oxygen:

Complex IV: cytochrome c oxidase.
Organization of complexes[edit]
The original model for how the respiratory chain complexes are organized was that they diffuse freely and independently in the mitochondrial membrane.[17] However, recent data suggest that the complexes might form higher-order structures called supercomplexes or “respirasomes.”[49] In this model, the various complexes exist as organized sets of interacting enzymes.[50] These associations might allow channeling of substrates between the various enzyme complexes, increasing the rate and efficiency of electron transfer.[51] Within such mammalian supercomplexes, some components would be present in higher amounts than others, with some data suggesting a ratio between complexes I/II/III/IV and the ATP synthase of approximately 1:1:3:7:4.[52] However, the debate over this supercomplex hypothesis is not completely resolved, as some data do not appear to fit with this model.[17][53]
Reversible protein phosphorylation, principally on serine, threonine or tyrosine residues, is one of the most important and well-studied post-translational modifications. Phosphorylation plays critical roles in the regulation of many cellular processes including cell cycle, growth, apoptosis and signal transduction pathways.
Phosphorylation is the most common mechanism of regulating protein function and transmitting signals throughout the cell. While phosphorylation has been observed in bacterial proteins, it is considerably more pervasive in eukaryotic cells. It is estimated that one-third of the proteins in the human proteome are substrates for phosphorylation at some point (1). Indeed, phosphoproteomics has been established as a branch of proteomics that focuses solely on the identification and characterization of phosphorylated proteins.
| Mechanism of Phosphorylation | |
| While phosphorylation is a prevalent post-translational modification (PTM) for regulating protein function, it only occurs at the side chains of three amino acids, serine, threonine and tyrosine, in eukaryotic cells. These amino acids have a nucleophilic (–OH) group that attacks the terminal phosphate group (γ-PO32-) on the universal phosphoryl donor adenosine triphosphate (ATP), resulting in the transfer of the phosphate group to the amino acid side chain. This transfer is facilitated by magnesium (Mg2+), which chelates the γ- and β-phosphate groups to lower the threshold for phosphoryl transfer to the nucleophilic (–OH) group. This reaction is unidirectional because of the large amount of free energy that is released when the phosphate-phosphate bond in ATP is broken to form adenosine diphosphate (ADP). | |

http://www.piercenet.com/media/Serine%20Phosphorylation.jpg
Diagram of serine phosphorylation. Enzyme-catalyzed proton transfer from the (–OH) group on serine stimulates the nucleophilic attack of the γ-phosphate group on ATP, resulting in transfer of the phosphate group to serine to form phosphoserine and ADP. (—B:) indicates the enzyme base that initiates proton transfer.
For a large subset of proteins, phosphorylation is tightly associated with protein activity and is a key point of protein function regulation. Phosphorylation regulates protein function and cell signaling by causing conformational changes in the phosphorylated protein. These changes can affect the protein in two ways. First, conformational changes regulate the catalytic activity of the protein. Thus, a protein can be either activated or inactivated by phosphorylation. Second, phosphorylated proteins recruit neighboring proteins that have structurally conserved domains that recognize and bind to phosphomotifs. These domains show specificity for distinct amino acids. For example, Src homology 2 (SH2) and phosphotyrosine binding (PTB) domains show specificity for phosphotyrosine (pY), although distinctions in these two structures give each domain specificity for distinct phosphotyrosine motifs (2). Phosphoserine (pS) recognition domains include MH2 and the WW domain, while phosphothreonine (pT) is recognized by forkhead-associated (FHA) domains. The ability of phosphoproteins to recruit other proteins is critical for signal transduction, in which downstream effector proteins are recruited to phosphorylated signaling proteins.
Protein phosphorylation is a reversible PTM that is mediated by kinases and phosphatases, which phosphorylate and dephosphorylate substrates, respectively. These two families of enzymes facilitate the dynamic nature of phosphorylated proteins in a cell. Indeed, the size of the phosphoproteome in a given cell is dependent upon the temporal and spatial balance of kinase and phosphatase concentrations in the cell and the catalytic efficiency of a particular phosphorylation site.

http://www.piercenet.com/media/Phosphorylation%20Dephosphorylation.jpg
Phosphorylation is a reversible PTM that regulates protein function. Left panel: Protein kinases mediate phosphorylation at serine, threonine and tyrosine side chains, and phosphatases reverse protein phosphorylation by hydrolyzing the phosphate group. Right panel: Phosphorylation causes conformational changes in proteins that either activate (top) or inactivate (bottom) protein function.
| Protein Kinases | |
| Kinases are enzymes that facilitate phosphate group transfer to substrates. Greater than 500 kinases have been predicted in the human proteome; this subset of proteins comprises the human kinome (3). Substrates for kinase activity are diverse and include lipids, carbohydrates, nucleotides and proteins.ATP is the cosubstrate for almost all protein kinases, although guanosine triphosphate is used by a small number of kinases. ATP is the ideal structure for the transfer of α-, β- or γ-phosphate groups for nucleotidyl-, pyrophosphoryl- or phosphoryltransfer, respectively (4). While the substrate specificity of kinases varies, the ATP-binding site is generally conserved (5).Protein kinases are categorized into subfamilies that show specificity for distinct catalytic domains and include tyrosine kinases or serine/threonine kinases. Approximately 80% of the mammalian kinome comprises serine/threonine kinases, and >90% of the phosphoproteome consists of pS and pT. Indeed, studies have shown that the relative abundance ratio of pS:pT:pY in a cell is 1800:200:1 (6). Although pY is not as prevalent as pS and pT, global tyrosine phosphorylation is at the forefront of biomedical research because of its relation to human disease via the dysregulation of receptor tyrosine kinases (RTKs).Protein kinase substrate specificity is based not only on the target amino acid but also on consensus sequences that flank it (7). These consensus sequences allow some kinases to phosphorylate single proteins and others to phosphorylate multiple substrates (>300) (5). Additionally, kinases can phosphorylate single or multiple amino acids on an individual protein if the kinase-specific consensus sequences are available.
Kinases have regulatory subunits that function as activating or autoinhibitory domains and have various regulatory substrates. Phosphorylation of these subunits is a common approach to regulating kinase activity (8). Most protein kinases are dephosphorylated and inactive in the basal state and are activated by phosphorylation. A small number of kinases are constitutively active and are made intrinsically inefficient, or inactive, when phosphorylated. Some kinases, such as Src, require a combination of phosphorylation and dephosphorylation to become active, indicating the high regulation of this proto-oncogene. Scaffolding and adaptor proteins can also influence kinase activity by regulating the spatial relationship between kinases and upstream regulators and downstream substrates. |
|
| Signal Transduction Cascades | |
| The reversibility of protein phosphorylation makes this type of PTM ideal for signal transduction, which allows cells to rapidly respond to intracellular or extracellular stimuli. Signal transduction cascades are characterized by one or more proteins physically sensing cues, either through ligand binding, cleavage or some other response, that then relay the signal to second messengers and signaling enzymes. In the case of phosphorylation, these receptors activate downstream kinases, which then phosphorylate and activate their cognate downstream substrates, including additional kinases, until the specific response is achieved. Signal transduction cascades can be linear, in which kinase A activates kinase B, which activates kinase C and so forth. Signaling pathways have also been discovered that amplify the initial signal; kinase A activates multiple kinases, which in turn activate additional kinases. With this type of signaling, a single molecule, such as a growth factor, can activate global cellular programs such as proliferation (9). | |

http://www.piercenet.com/media/Signal%20Transduction%20Pathways.jpg
Signal transduction cascades amplify the signal output. External and internal stimuli induce a wide range of cellular responses through a series of second messengers and enzymes. Linear signal transduction pathways yield the sequential activation of a discrete number of downstream effectors, while other stimuli elicit signal cascades that amplify the initial stimulus for large-scale or global cellular responses.
| Protein Phosphatases | |
The intensity and duration of phosphorylation-dependent signaling is regulated by three mechanisms (5):
The human proteome is estimated to contain approximately 150 protein phosphatases, which show specificity for pS/pT and pY residues (10,11). While dephosphorylation is the end goal of these two groups of phosphatases, they do it through separate mechanisms. Serine/threonine phosphatases mediate the direct hydrolysis of the phosphorus atom of the phosphate group using a bimetallic (Fe/Zn) center, while tyrosine phosphatases form a covalent thiophosphoryl intermediate that facilitates removal of the tyrosine residue. |
|
Phosphorylation and Ubiquitylation
Almost all aspects of biology are regulated by reversible protein phosphorylation and ubiquitylation. Abnormalities in these pathways cause numerous diseases including cancer, neurodegeneration and inflammation – all conditions under intense scrutiny in our Unit. Deciphering how disruptions in phosphorylation and ubiquitin networks lead to disease will reveal novel drug targets and improved strategies to treat these maladies in the future.
Protein ubiquitylation is analogous to protein phosphorylation except that ubiquitin molecules are attached covalently to Lys residues, as opposed to phosphate groups becoming covalently attached to one or more Ser, Thr or Tyr residues. Like phosphorylation, ubiquitylation can alter protein properties and functions in every conceivable way. Ubiquitylation is likely to be a more versatile control mechanism than phosphorylation, as ubiquitin molecules can not only be linked to one or more amino acid residues on the same protein, but can also form ubiquitin chains.
Moreover, there are also several ubiquitin-like modifiers (ULMs), such as Nedd8, SUMO1, SUMO2, SUMO3, FAT10 and ISG15, which can become attached to proteins in reactions termed Neddylation, SUMOylation, Tenylation and ISGylation, while poly-SUMO chains (involving SUMO2 and SUMO3) are also formed in cells. Recent research has highlighted an exquisite interplay between phosphorylation and ubiquitin pathways that regulate many physiological systems.

http://www.ppu.mrc.ac.uk/overview/images/phos_deubuiq.jpg
Protein ubiquitylation is an even more versatile control mechanism
than protein phosphorylation
This includes pathways of relevance to understanding innate immunity, Parkinson’s disease and cancer, emphasising the importance of integrating phosphorylation and ubiquitylation research, and not considering these separate areas to be studied in isolation.
| Phosphorylation | Ubiquitylation |
| Discovered 1955 | Discovered 1978 |
| >500 protein kinases | ~10 E1s, ~40 E2s >600 E3 ligases |
| 140 protein phosphatases | ~100 deubiquitylases |
| Nobel Prize 1992 | Nobel Prize 2004 |
| First drug approval 2001 (Gleevec) |
First drug approval 2003 (Bortezomib) |
| 16 drugs approved, >150 in clinical trials |
15 drugs in Phase I/II |
| Current sales of USS$15 billion p.a. |
Current sales of USS$1.5 billion p.a. |
| 30% of Pharma R&D | <<1% of Pharma R&D |
History of the development of protein phoshorylation and ubiquitylation
The MRC-PPU research focuses on unravelling the roles of protein phosphorylation and ubiquitylation pathways that have strong links to understanding human disease. This is where we can make the best use of our expertise, grasp opportunities emerging from the golden era of genetic analysis of human disease, and make a significant contribution to medical research.
Our Principal Investigators (PIs) deploy a blend of creativity, curiosity, expertise and state-of-the-art technology to tackle their selected projects. Their aim is to uncover fundamentally new knowledge on how biological systems are controlled, hopefully shedding novel insights into the understanding and treatment of disease. Effective translation of our research will also be impossible without robust interactions with drug discovery units such as the MRC Technology Centre for Therapeutics Discovery, the University of Dundee’s Drug Discovery Unit and close collaboration with pharmaceutical companies.
The latter will be greatly enhanced by major collaborations with the six pharmaceutical companies that support the Division of Signal Transduction Therapy. Access to the exceptional support services available within the MRC-PPU and DSTT also helps to maximise the competitiveness of our research groups and reinforce collaborations with our external partners.
Central questions being addressed by our PIs include understanding how ubiquitin and phosphorylation pathways are organised, characterising the interplay between these pathways, determining how they recognise and respond to signals, and uncovering how disruption of these networks causes disease. The expectation is that the data, reagents and expertise emerging from our research and working effectively with clinicians and pharmaceutical industry will enable us to devise new
MIT Scientists on Proteomics: All the Proteins in the Mitochondrial Matrix identified
Mitochondrial Damage and Repair under Oxidative Stress
http://pharmaceuticalintelligence.com/2014/07/07/bzzz-are-fruitflies-like-us/
Discovery of Imigliptin, a Novel Selective DPP-4 Inhibitor for the Treatment of Type 2 Diabetes
Molecular biology mystery unravelled
http://pharmaceuticalintelligence.com/2014/06/22/molecular-biology-mystery-unravelled/
Gene Switch Takes Blood Cells to Leukemia and Back Again
Wound-healing role for microRNAs in colon offer new insight to inflammatory bowel diseases
Targeting a key driver of cancer
http://pharmaceuticalintelligence.com/2014/06/20/targeting-a-key-driver-of-cancer/
Tang Prize for 2014: Immunity and Cancer
http://pharmaceuticalintelligence.com/2014/06/20/tang-prize-for-2014-immunity-and-cancer/
Confined Indolamine 2, 3 dioxygenase (IDO) Controls the Hemeostasis of Immune Responses for Good and Bad Demet Sag, PhD
3:45 – 4:15, 2014, Scott Lowe “Tumor suppressor and tumor maintenance genes”
12:00 – 12:30, 6/13/2014, John Maraganore “Progress in advancement of RNAi therapeutics”
9:30 – 10:00, 6/13/2014, David Bartel “MicroRNAs, poly(A) tails and post-transcriptional gene regulation.”
10:00 – 10:30, 6/13/2014, Joshua Mendell “Novel microRNA functions in mammalian physiology and cancer”
Aviva Lev-Ari, PhD, RN
Targeted genome editing by lentiviral protein transduction of zinc-finger and TAL-effector nucleases Aviva Lev-Ari, PhD, RN
Illana Gozes discovered Novel Protein Fragments that have proven Protective Properties for Cognitive Functioning
Aviva Lev-Ari, PhD, RN
Immune activation, immunity, antibacterial activity
Posted in Biological Networks, Gene Regulation and Evolution, Federal Budget Appropriations, Genome Biology, Health Economics and Outcomes Research, Healthcare costs and reimbursement, Human Immune System in Health and in Disease, Infectious Disease & New Antibiotic Targets, Molecular Genetics & Pharmaceutical, Neutrophilia, Pharmaceutical Analytics, Pharmaceutical Discovery, Pharmaceutical Drug Discovery, Pharmaceutical R&D Investment, Pharmacogenomics, Platelet count disorder, Population Health Management, Genetics & Pharmaceutical, Prescription Drugs Costs, Proteomics, Regulated Clinical Trials: Design, Methods, Components and IRB related issues, Systemic Inflammatory Response Related Disorders, Technology Transfer: Biotech and Pharmaceutical, Translational Effectiveness, Translational Research, Translational Science, tagged 8-OXO dG, antimicrobial therapy, autoimmunity, cGAMP, DAMP, immune activation, innate immunity, microbiota, PAMPs, ribonuclease TREX1 on July 6, 2014| Leave a Comment »
Larry H. Bernstein, MD, FCAP, Curator
http://pharmaceuticalintelligence.com/6/7/2014/Immune activation, immunity, antibacterial activity
This segment is an update on activation of innate immunity, which has had a great amount of basic science resurgence in the last several decades. It also addresses the issue of antibiotic resistance, which shall be covered more fully in later segments. Antimicrobial resistance is a growing threat, and a challenge to the pharmaceutical industry. Moreover, worldwide travel increases the possibility of transfer of strains of virus and microbiota to distant communities.
8-OH-dG: A novel immune activator.
Innate immunity against viral or pathogenic infection involves sensing of non-self-molecules, otherwise known at pathogen-associated molecular patterns (PAMPs). This same sensing mechanism can be applied to damaged self-molecules, which are called damage-associated molecular patterns (DAMPs). One type of molecular pattern, for both groups, is cytosolic or extracellular DNA. However, there is not an extensive amount of research showing specifically what type of DAMP DNA molecule is best at activating this immune sensing response. A recent study investigated the mechanism behind how oxidized DNA from UV damage activates an immune sensing response.
A group of researchers found that, compared to a variety of types of cellular damage, damage from UV irradiation created a strong immune response (type I IFN response), seen across different types of immune regulatory cells. This was compared with freeze/thaw, physical damage and nutritional deprivation, each of which did not produce a noticeable immune response. Additionally, this immune response was seen when DNA was exposed to UV-A and UV-B (the type of radiation produced by our sun) and UV-C radiation.
DNA can be damaged by UV light directly, or through reactive oxygen species (ROS) caused by UV light. A well-known mark of DNA damaged by ROS is the oxidation of guanine to create 8-hydroxyguanine (8-OH-dG). These researchers saw an increase in 8-OH-dG dependant on the level of UV dose, and this also correlated with an increase in immune response; showing that DNA damage created by UV light in the form of 8-OH-dG is sufficient to activate an immune response. This study shows that 8-OH-dG can be classified at a DAMP.
Next, this group wanted to place a mechanism to these observations. They found that the ability of oxidation-damaged DNA to activate an immune response was dependant on cGAS and STING. Free DNA in the cytosol binds cGAS, a cGAMP synthase. This action produces a messenger molecule which proceeds to bind to and activate STING, an endoplasmic reticulum protein. STING activation will ultimately stimulate a type I IFN response.
When a cell’s own DNA is damaged, the cell’s machinery does all it can to repair it. This sometimes involves erasing, or degrading, the DNA that has been damaged. The enzyme, TREX1 exonuclease, has this job in a cell. However, this group found that when DNA was modified with an 8-OH-dG, it was resistant to this degradation by TREX1. This implies that the observed increase in immune response due to the presence of 8-OH-dG occurred because of an accumulation of damaged DNA, because it was not being degraded by TREX1 and could therefore sufficiently activate cGAS and STING.
This type of study has important implications for autoimmune diseases like lupus erythematosus (LE), which is characterized by its abnormally high number of autoantibodies against DNA. It is possible that this uncontrollable immune response is activated by oxidation-damaged DNA. Studies in this area, therefore, hold great importance.
– See more at: http://www.stressmarq.com/Blog/November-2013/8-OH-dG-A-novel-immune-activator.aspx#sthash.CvSdK0H1.dpuf
Oxidative Damage of DNA Confers Resistance to Cytosolic Nuclease TREX1 Degradation and Potentiates STING-Dependent Immune Sensing
Nadine Gehrke, Christina Mertens, Thomas Zillinger, Jörg Wenzel,…,Winfried Barchet
DOI: http://dx.doi.org/10.1016/j.immuni.2013.08.004
Highlights
- •UV or ROS damage potentiates immunorecognition of DNA via cGAS and STING
- •The oxidation product 8-OHG in DNA is sufficient for enhanced immunorecognition
- •Oxidized self-DNA acts as a DAMP and induces skin lesions in lupus-prone mice
- •Oxidized DNA is resistant to cytosolic nuclease TREX1-mediated degradation
Summary
Immune sensing of DNA is critical for antiviral immunity but can also trigger autoimmune diseases such as lupus erythematosus (LE). Here we have provided evidence for the involvement of a damage-associated DNA modification in the detection of cytosolic DNA. The oxidized base 8-hydroxyguanosine (8-OHG), a marker of oxidative damage in DNA, potentiated cytosolic immune recognition by decreasing its susceptibility to 3′ repair exonuclease 1 (TREX1)-mediated degradation. Oxidizative modifications arose physiologically in pathogen DNA during lysosomal reactive oxygen species (ROS) exposure, as well as in neutrophil extracellular trap (NET) DNA during the oxidative burst. 8-OHG was also abundant in UV-exposed skin lesions of LE patients and colocalized with type I interferon (IFN). Injection of oxidized DNA in the skin of lupus-prone mice induced lesions that closely matched respective lesions in patients. Thus, oxidized DNA represents a prototypic damage-associated molecular pattern (DAMP) with important implications for infection, sterile inflammation, and autoimmunity.

ribonuclease TREX1 and immunity
Immunity 19 Sep 2013;39(3), p482–495,
New Weapon in Fight Against ‘Superbugs’
Some harmful bacteria are increasingly resistant to treatment with antibiotics. A discovery might be able to help the antibiotics treat the disease.
By ANN LUKITS June 30, 2014 8:47 p.m. ET
Some harmful bacteria are increasingly resistant to treatment with antibiotics. This common fungus found in soil might be able to help the antibiotics combat diseases. Corbis
A soil sample from a national park in eastern Canada has produced a compound that appears to reverse antibiotic resistance in dangerous bacteria.

Scientists at McMaster University in Ontario discovered that the compound almost instantly turned off a gene in several harmful bacteria that makes them highly resistant to treatment with a class of antibiotics used to fight so-called superbug infections. The compound, called aspergillomarasmine A, or AMA, was extracted from a common fungus found in soil and mold.
Antibiotic resistance is a growing public-health threat. Common germs such asEscherichia coli, or E. coli, are becoming harder to treat because they increasingly don’t respond to antibiotics. Some two million people in the U.S. are infected each year by antibiotic-resistant bacteria and 23,000 die as a result, according to the Centers for Disease Control and Prevention. The World Health Organization has called antibiotic resistance a threat to global public health.
The Canadian team was able to disarm a gene—New Delhi Metallo-beta-Lactamase-1, or NDM-1—that has become “public enemy No. 1” since its discovery in 2009, says Gerard Wright, director of McMaster’s Michael G. DeGroote Institute for Infectious Disease Research and lead researcher on the study. The report appears on the cover of this week’s issue of the journal Nature.
“Discovery of a fungus capable of rendering these multidrug-resistant organisms incapable of further infection is huge,” says Irena Kenneley, a microbiologist and infectious disease specialist at Frances Payne Bolton School of Nursing at Cleveland’s Case Western Reserve University. “The availability of more treatment options will ultimately save many more lives,” says Dr. Kenneley, who wasn’t involved in the McMaster research.
The McMaster team plans further experiments to determine the safety and effective dosage of AMA. It could take as long as a decade to complete clinical trials on people with superbug infections, Dr. Wright says.
The researchers found that AMA, extracted from a strain of Aspergillus versicolor and combined with a carbapenem antibiotic, inactivated the NDM-1 gene in three drug-resistant superbugs—Enterobacteriaceae, a group of bacteria that includes E. coli;Acenitobacter, which can cause pneumonia and blood infections; and Pseudomonas, which often infect patients in hospitals and nursing homes. The NDM-1 gene encodes an enzyme that helps bacteria become resistant to antibiotics and that requires zinc to survive. AMA works by removing zinc from the enzyme, freeing the antibiotic to do its job, Dr. Wright says. Although AMA was only tested on carbapenem-resistant bacteria, he expects the compound would have a similar effect when combined with other antibiotics.
AMA was first identified in the 1960s in connection with leaf wilt in plants and later investigated as a potential drug for treating high blood pressure. The compound turned up in Dr. Wright’s lab a few years ago during a random screening of organisms derived from 10,000 soil samples stored at McMaster. The sample that produced AMA was collected by one of Dr. Wright’s graduate students during a visit to a Nova Scotia park. It was the only sample of 500 tested that inhibited NDM-1 in cell cultures.
“It was a lucky hit,” says Dr. Wright. “It tells us that going back to those environmental organisms, where we got antibiotics in the first place, is a really good idea.”
The McMaster team developed a purified form of AMA for experiments on mice injected with a lethal form of drug-resistant pneumonia. Treatment with either AMA or a carbapenem antibiotic alone proved ineffective. But combining the substances resulted in more than 95% of the mice still being alive after five days. The combination was also tested on 229 cell cultures from human patients infected with resistant superbugs. The treatment resensitized 88% of the samples to carbapenem.
Still, bacteria could someday find a way to outwit AMA. “I can’t imagine anything we could make where resistance would never be an issue,” he says. “At the end of the day, this is evolution and you can’t fight evolution.”
Activation of Efficient and Multiple Site-specific Nonstandard Amino Acid Incorporation
Posted in Biological Networks, Gene Regulation and Evolution, Biomarkers & Medical Diagnostics, Cell Biology, Signaling & Cell Circuits, Chemical Genetics, Cytoskeleton, De novo synthesis, Disease Biology, Small Molecules in Development of Therapeutic Drugs, Drug Toxicity, Evolutionary cognition, Experimental validation, Glycobiology: Biopharmaceutical Production, Pharmacodynamics and Pharmacokinetics, Immunodiagnostics, Infectious Disease & New Antibiotic Targets, Infectious Disease Immunodiagnostics, Innovation in Immunology Diagnostics, Molecular Genetics & Pharmaceutical, Pharmaceutical Analytics, Pharmacologic toxicities, Population Health Management, Genetics & Pharmaceutical, Proteomics, Systemic Inflammatory Response Related Disorders, Technology Advance Assessment of, Technology Transfer: Biotech and Pharmaceutical, Translational Effectiveness, Translational Research, Translational Science, tagged activation of biosynthesis, amino acid incorporation, Cell-free Protein Synthesis, chemical and biological engineering, incorporation of nonstandard AAs, Multiple Site-specific Nonstandard Amino Acid Incorporation, Release Factor 1, Synthetic biology on June 20, 2014| Leave a Comment »
Larry Bernstein, MD, FCAP
Cell-free Protein Synthesis from a Release Factor 1 Deficient Escherichia coli Activates Efficient and Multiple Site-specific Nonstandard Amino Acid Incorporation
Seok Hoon Hong †‡, Ioanna Ntai ‡§, Adrian D. Haimovich #, Neil L. Kelleher ‡§, Farren J. Isaacs #, and Michael C. Jewett *†‡
†Department of Chemical and Biological Engineering,‡Chemistry of Life Processes Institute, §Department of Chemistry, and Department of Molecular Biosciences,Northwestern University, Evanston, Illinois 60208,United States of America
Department of Molecular, Cellular, and Developmental Biology, Yale University, New Haven, Connecticut 06520, United States of America
# Systems Biology Institute, Yale University, West Haven, Connecticut 06516, United States of America
Member, Robert H. Lurie Comprehensive Cancer Center, Northwestern University, Chicago, Illinois 60611, United States of America
Institute of Bionanotechnology in Medicine, Northwestern University, Chicago, Illinois 60611, United States of America
ACS Synth. Biol., 2014, 3 (6), pp 398–409
DOI: 10.1021/sb400140t
Publication Date (Web): December 13, 2013
Copyright © 2013 American Chemical Society
*Tel: +1 847 467 5007. Fax (+1) 847 491 3728. E-mail: m-jewett@northwestern.edu

Site-specific incorporation of nonstandard amino acids (NSAAs) into proteins
Site-specific incorporation of nonstandard amino acids (NSAAs) into proteins enables the creation of biopolymers, proteins, and enzymes with new chemical properties, new structures, and new functions. To achieve this, amber (TAG codon) suppression has been widely applied. However, the suppression efficiency is limited due to the competition with translation termination by release factor 1 (RF1), which leads to truncated products. Recently, we constructed a genomically recoded Escherichia coli strain lacking RF1 where 13 occurrences of the amber stop codon have been reassigned to the synonymous TAA codon (rEc.E13.ΔprfA). Here, we assessed and characterized cell-free protein synthesis (CFPS) in crude S30 cell lysates derived from this strain. We observed the synthesis of 190 ± 20 μg/mL of modified soluble superfolder green fluorescent protein (sfGFP) containing a single p-propargyloxy-l-phenylalanine (pPaF) or p-acetyl-l-phenylalanine. As compared to the parentrEc.E13 strain with RF1, this results in a modified sfGFP synthesis improvement of more than 250%. Beyond introducing a single NSAA, we further demonstrated benefits of CFPS from the RF1-deficient strains for incorporating pPaF at two- and five-sites per sfGFP protein. Finally, we compared our crude S30 extract system to the PURE translation system lacking RF1. We observed that our S30 extract based approach is more cost-effective and high yielding than the PURE translation system lacking RF1, 1000 times on a milligram protein produced/$ basis. Looking forward, using RF1-deficient strains for extract-based CFPS will aid in the synthesis of proteins and biopolymers with site-specifically incorporated NSAAs.
Keywords:
cell-free protein synthesis; PURE translation; nonstandard amino acid;release factor 1; genomically recoded organisms
Follow Blog via Email
Join 2,064 other subscribers-
Recent Posts
- Top VC Investors in AI / Health AI in 2026 May 26, 2026
- Grok thinks like PhDs – Hybrid Model for Autonomous Update of Doctoral Dissertations with Original PhD Student Author editing and acceptance of Grok’s updated output. 3rd Joint article, a pilot study for Validation of an Autonomous Journal Articles Updating System (AJAUS) tested on Autonomous Update of Aviva Lev-Ari, PhD, RN Doctoral Thesis, UC, Berkeley, 1983. January 31, 2026
- 2026 World Economic Forum, 1/19 – 1/23/2026, Davos, Switzerland, LPBI Group’s KOLs interpretation of AI in Health Videos January 24, 2026
- Evolving LPBI Group’s Portfolio of Intellectual Properties (IP): From 2021 Vision to 2026 Reality January 12, 2026
- Aviva Lev-Ari, PhD, RN – Biography ->> Grokepedia Entry January 11, 2026
- List of Articles included in the Article SELECTION from Collection of Aviva Lev-Ari, PhD, RN Scientific Articles on PULSE on LinkedIn.com for Training Small Language Models (SLMs) in Domain-aware Content of Medical, Pharmaceutical, Life Sciences and Healthcare by 15 Subjects Matter January 10, 2026
- Article SELECTION from Collection of Aviva Lev-Ari, PhD, RN Scientific Articles on PULSE on LinkedIn.com for Training Small Language Models (SLMs) in Domain-aware Content of Medical, Pharmaceutical, Life Sciences and Healthcare by 15 Subjects Matter January 10, 2026
- Collection of Aviva Lev-Ari, PhD, RN Scientific Articles on PULSE on LinkedIn.com January 10, 2026
- The youngest leader in AI in Health: Tanishq Mathew Abraham, Ph.D. (@iScienceLuvr) January 8, 2026
- 2026 Grok Multimodal Causal Reasoning on Proprietary Cariovascular Corpus: From 2021 Wolfram NLP Baseline to Thousands of Novel Relationships – A Second Head-to-Head Validation of LPBI’s Domain-Aware Training Advantage January 6, 2026
Archives
Categories
Meta