Feeds:
Posts
Comments

Archive for the ‘Pharmaceutical Industry Competitive Intelligence’ Category


The Vibrant Philly Biotech Scene: Recent Happenings & Deals

Curator: Stephen J. Williams, Ph.D.

UPDATED: 07/06/2026

This update is a review on the current biotech funding situation as of Q1 of 2026.  The situation in Philadelphia biotech has turned a bit dire, as CRE that went on massive construction projects are finding vacancy rates up in certain neighborhoods and hubs in the Philadelphia area.  Presented here are some of the observations from CRE, the investment community, and some recent issues in biotech buildouts that have reshaped the Philly landscape.

The following is a post form Technical.ly in Philadelphia on the issues in finding Venture Capital to stay and grow in the Philadelphia Area.  As noted, the dearth of venture capitalist firms in the city or commited to the cities’ biotech initiative is a major reason for some of the recent setbacks to Philly Biotech.

Source: https://technical.ly/entrepreneurship/life-sciences-year-in-review-2025/ 

Philly’s life sciences scene saw wins this year, but there’s still a big problem: Money

Partnerships with giants like Eli Lilly and Thermo Fisher Scientific put biotech in the spotlight again, though founders still struggle to find investments in their hometown.

Written by Sarah Huffman

December 18, 2025

Edited by Katie Malone

HiveBio Accelerator 2025 cohort at its Investor Showcase (Courtesy HiveBio)

2025 pulled into focus the cracks in Philly’s life sciences ecosystem.

Philly has the talent, research institutions and collaboration to build a strong life sciences community. That’s helped the region build a reputation in the sector, but stakeholders say there’s not enough local funding to keep companies growing here. 

With exciting partnerships started this year and more opportunities coming in 2026, capital is needed if Philadelphia wants the sector to reach its full potential. 

“The fact that we’ve got excellent research capabilities and spin-off capabilities in Philadelphia speaks to the intellectual horsepower,” Ira Spector, CEO of SFA Therapeutics, told Technical.ly, “but Philadelphia does not have a very well-developed venture capital infrastructure.” 

This year, Philly attracted major outside interest. Most recently, global pharmaceutical company Eli Lilly announced plans to open a new Lilly Gateway Labs in Center City, an incubator for early-stage biotech companies. 

“Access to capital is a critical factor in moving forward, and that’s been a frustrating thing for us.”

Ira Spector, CEO of SFA Therapeutics

Other national orgs have taken steps to increase their regional presence, too. Thermo Fisher Scientific, a global equipment and services company, announced a partnership and opened its second Advanced Therapies Collaboration Center with BioLabs Philadelphia. 

New local resources sprouted, catering directly to startups’ VC needs. The HiveBio accelerator, which supports minority founders in the life sciences space, launched this year. After wrapping up its pilot this month, the program reported successful fundraising efforts for most of its cohort companies. 

These wins happened against a backdrop of internal company turmoil in 2025. The region’s cell and gene therapy standout Spark Therapeutics took a hit when its parent company Roche designated it as a financial loss, eventually laying off about half of its employees. Other companies like Century Therapeutics and Adaptimmune announced significant layoffs this year, too. 

For life sciences — and the entire startup ecosystem — venture capital has also become harder to come by as the market fluctuated throughout 2025. 

Developing a drug or therapy and bringing it to market is extremely expensive work. Oftentimes, investors don’t want to give money to companies that are still high risk, but it takes money to support development to derisk the product, Spector said. 

Without that cash, Philly could lose its rising stars — like GEMMA Bio, a standout that raised $34 million this year — to nearby life sciences hotspots like Boston. While Philly consistently lags behind Boston, San Diego and San Francisco, it still ranks high for life sciences talent, which continues to attract new companies.

“Philly is finally starting to step on the map,” Rakesh Shah, founder of Newtown-based medical device company DRS.LINQ, said. “We have so much talent in the biomedical engineering and med tech space. It’s just we need to harness that energy, bring it all together.” 

A well-connected community, but few investors to maintain it

Founders are already looking for major investments outside of Philly, as it’s often their only option, according to Jean Cho, CEO of Trevarx Biomedical. 

Jenkintown-based biotech company SFA Therapeutics is experiencing this firsthand. As it raises its next funding round, the majority of the money is coming from investors outside the region, CEO Spector said. 

The company is tied to Philly because of its affiliation with Temple University and investments from Ben Franklin Technology Partners. It’s also integrated with Pennsylvania’s life sciences ecosystem, attending programming hosted by orgs like Life Sciences PA, although there aren’t usually a ton of investors at those events, Spector said.  

The lack of local funding has caused Spector to consider what the company’s future would look like in other parts of the country. In Boston, for example, the VC ecosystem is very well developed, he said, and the company has raised money from investors there. 

A bright spot: Millions raised by just one accelerator

Despite the lack of a strong local investor network, Philly isn’t alone in having a VC slowdown. 

In general, the life sciences sector has been struggling this year, especially for early-stage companies. Since the IPO market for biotech companies has slowed down, investors aren’t making their money back and are focusing instead on existing later-stage firms.

But there are some programs in the city helping founders to secure much-needed investments. 

The HiveBio accelerator exceeded its first-year goal, helping eight out of 10 companies raise a total of $3.6 million during the nine-month program, Tia Lyles-Williams, founder and CIO of HiveBio, told Technical.ly. Plus, a lot of that money came from local investors like Ben Franklin Technology Partners and Robin Hood Ventures, she said.

The key, she said, was giving founders as many opportunities as possible to have face time with investors. 

“They had the opportunity, behind closed doors, with these mentors to be totally transparent about what they know, what they didn’t know, and what they needed,” she said. “These mentors and these experts in our local investment community delivered on that, they received it, implemented it, and that’s how these checks got written.” 

“This is an industry that runs on capital,” Spector said. “It requires capital to prove that a drug or a therapeutic or a diagnostic or device works, and that means that access to capital is a critical factor in moving forward, and that’s been a frustrating thing for us.”

This story is made possible thanks to support from Ben Franklin Technology Partners of Southeastern Pennsylvania, a nonprofit that leads the Philadelphia region’s equitable economic growth by nurturing and investing in innovative, early-stage companies, and through purposeful involvement in regional and national initiatives. All stories are independently reported, with no partner review.

This is an analysis of the risk associated to bond tranches in the Philly Biotech niche

When looking at the riskiest secured bond tranches for the biotechnology sector in the Greater Philadelphia area, the risk is completely split between two totally different financial assets: commercial real estate debt backing empty lab spaces and corporate first-lien loans issued by struggling drug-development firms.

While “secured” bonds are theoretically lower risk because they are backed by physical or intellectual property collateral, specific sub-sectors in Philadelphia are facing unprecedented headwinds. [1, 2, 3, 4]

1. The Real Estate Angle: Speculative Lab Building Bonds

The absolute highest concentration of risk for secured debt sits with senior secured credit facilities, CMBS tranches, and construction bank bonds backing recently completed, unleased life sciences real estate. From 2019 to 2021, developers rushed to build or retrofit lab spaces, creating a massive oversupply just as venture capital funding slowed down. [1, 5, 6]

  • University City Speculative Developments: University City is the epicenter of Philly’s biotech boom, but the submarket currently faces a staggering 39.1% to 40% vacancy rate. Secured bonds or construction debt tranches tied directly to newly built, unleased towers in this zone (such as Brandywine’s mostly empty 3151 Market St. lab facility) are highly vulnerable. Without tenant cash flows to service the debt, these properties face imminent refinancing or modification risks. [1, 5, 7, 8, 9]
  • Suburban “Mega-Lab” Tranches: Out in the suburbs, massive suburban lab conversions are driving negative absorption. A prime example is the The Discover Labs in King of Prussia, where huge blocks of lab space became vacant. Tranches of commercial mortgage-backed securities (CMBS) or private credit heavily exposed to these massive suburban footprints carry elevated risk as local tenants shrink their physical boundaries. [10, 11]

2. The Corporate Angle: Asset-Backed Pre-Revenue Biotech Debt

For actual biotechnology companies (as opposed to their landlords), public bond issuance is rare. Instead, their secured debt takes the form of First-Lien Term Loans or Senior Secured Notes. [12]

Because biotech venture capital funding in Philadelphia dropped sharply—falling from $1.2 billion in 2021 to roughly $600 million—companies are facing a severe cash crunch. The riskiest secured corporate debt tranches share distinct characteristics: [13, 14, 15]

  • Maturity Term Loans: The riskiest tranches are senior secured facility loans facing upcoming refinancing walls. Lenders hold first-lien rights over the company’s patent portfolio, drug pipelines, and lab equipment. If a clinical trial fails, the “secured” collateral (intellectual property) loses almost all market value overnight. [16]
  • Sidecar & PIK (Payment-in-Kind) Tranches: To avoid outright defaults, distressed Philly biotechs are increasingly utilizing structured “sidecar facilities” or paying interest using more debt (PIK). These specific tranches are highly speculative because they delay the cash crunch rather than fixing the underlying capital structure. [8, 17]

Summary of Risk Profile

Tranche Type [1, 5, 10, 11, 13, 18, 19]

Location/Focus

Current Risk Driver

Collateral Value

University City Lab CMBS/Construction Bonds

Downtown Hub

~40% vacancy; tenants pivoting back to office use.

High (Prime real estate).

Suburban Life Science Mortgages

King of Prussia

Heavy negative absorption and tenant consolidation.

Medium (Harder to repurpose).

First-Lien Corporate Biotech Loans

Regional Startups

50% drop in local VC funding over recent years.

Low/Binary (Dependent on FDA approval).

Are you looking to evaluate specific real estate debt instruments (like CMBS or commercial mortgages) tied to Philly’s University City developments, or are you assessing the corporate high-yield loan market for localized clinical-stage drug developers? Let me know how you would like to filter the data. [5, 19, 20]


[1] https://www.bizjournals.com

[2] https://www.investopedia.com

[3] https://www.quicken.com

[4] https://www.thefixedincome.com

[5] https://www.bisnow.com

[6] https://www.linkedin.com

[7] https://www.bizjournals.com

[8] https://www.dws.com

[9] https://www.bizjournals.com

[10] https://biobuzz.io

[11] https://www.cbre.com

[12] https://www.key.com

[13] https://technical.ly

[14] https://biobuzz.io

[15] https://money.usnews.com

[16] https://www.biopharmawatch.com

[17] https://octus.com

[18] https://technical.ly

[19] https://www.labiotech.eu

[20] https://www.fitchratings.com


It has been surprising how fast the landscape in Philadelphia has changed.  A few years ago, Philadelphia was being touted as “Cellicon Valley” due to the development of the CAR-T therapies and immuno and cell based therapy startups being spun-out from local universities.  I have posted on this tranformation on this journal HERE.

In fact a huge campus in the Philadelphia suburbs including the Discovery Labs site (a former GSK site) was being buildout to be a major cGMP biomanufacturing facility which would handle University of Pennsylvania’s cell and gene therapy manufacturing needs as well as a contract manufacturing facility for pharma and biotech for cell and gene therapies.

A summary of the issues and refinancing problems of Discovery Labs can be seen below:

Current site issues and problems at the former pharmaceutical property include:
  • Contractor Payment Delays: The site, owned by MLP Ventures (CEO Brian O’Neill), was hit with roughly $100 million in mechanics’ liens for unpaid contracting work. [1]
  • Legal Battles with Key Tenants: In late 2025, MLP Ventures filed a civil lawsuit against its largest tenant, the Center for Breakthrough Medicines (CBM), and its majority stakeholder, South Korea’s SK Inc.. This involved a landlord/tenant dispute seeking more than $50,000 in damages. [1]
  • Massive Data Center Pivot & Protests: To offset debts, MLP Ventures proposed a sprawling 4.6 million-square-foot data center project across the Swedeland and Conshohocken areas. This has triggered massive pushback from local Upper Merion Township residents, who have cited heavy concerns over noise, pollution, and health risks. [1]
  • Financial Restructuring: The owner has sought extensive refinancing to manage the site’s debts and attempt to compensate the unpaid contractors, though progress has been slow. [1, 2]


Original Article

As the office and retail commercial real estate market has been drying up since the COVID pandemic, commercial real estate developers in the Philadelphia area have been turning to the health science industry to suit their lab space needs.  This includes refurbishing old office space as well as new construction.

Gattuso secures $290M construction loan for life sciences building on Drexel campus

Source: https://www.bizjournals.com/philadelphia/news/2022/12/19/construction-loan-gattuso-drexel-life-sciences.html?utm_source=st&utm_medium=en&utm_campaign=BN&utm_content=pl&ana=e_pl_BN&j=30034971&senddate=2022-12-20


By Ryan Mulligan  –  Reporter, Philadelphia Business Journal

Dec 19, 2022

Gattuso Development Partners and Vigilant Holdings of New York have secured a $290 million construction loan for a major life sciences building set to be developed on Drexel University’s campus.

The funding comes from Houston-based Corebridge Financial, with an additional equity commitment from Boston-based Baupost Group, which is also a partner on the project. JLL’s Capital Markets group arranged the loan.

Plans for the University City project at 3201 Cuthbert St. carry a price tag of $400 million. The 11-story building will total some 520,000 square feet, making it the largest life sciences research and lab space in the city when it comes online.

The building at 3201 Cuthbert will rise on what had served as a recreation field used by Drexel and is located next to the Armory. Gattuso Development, which will lease the parcel from Drexel, expects to to complete the project by fall 2024. Robert A.M. Stern Architects designed the building.


A rendering of a $400 million lab and research facility Drexel University and Gattuso Development Partners plan to build at 3201 Cuthbert St. in Philadelphia.

Enlarge

A rendering of a $400 million lab and research facility Drexel University and Gattuso Development Partners plan to build at 3201 Cuthbert St. in Philadelphia.

The building is 45% leased by Drexel and SmartLabs, an operator of life sciences labs. Drexel plans to occupy about 60,000 square feet, while SmartLabs will lease two floors totaling 117,000 square feet.

“We believe the project validates Philadelphia’s emergence as a global hub for life sciences research, and we are excited to begin construction,” said John Gattuso, the co-founder and president of Philadelphia-based Gattuso Development.

Ryan Ade, Brett Segal and Christopher Peck of JLL arranged the financing.

The project is another play in what amounts to an arms race for life sciences space and tenants in University City. Spark Therapeutics plans to build a $575 million, 500,000-square-foot gene therapy manufacturing plant on Drexel’s campus. One uCity Square, a $280 million, 400,000-square-foot life sciences building, was recently completed at 38th and Market streets. At 3151 Market St., a $307 million, 417,000-square-foot life sciences building is proposed as part of the Schuylkill Yards development.

Tmunity CEO Usman Azam departing to lead ‘stealth’ NYC biotech firm


By John George  –  Senior Reporter, Philadelphia Business Journal

Feb 7, 2022

The CEO of one of Philadelphia’s oldest cell therapy companies is departing to take a new job in the New York City area.

Usman “Oz” Azam, who has been CEO of Tmunity Therapeutics since 2016, will lead an unnamed biotechnology company currently operating in stealth mode.

In a posting on his LinkedIn page, Azam said, “After a decade immersed in cell therapies and immuno-oncology, I am now turning my attention to a new opportunity, and will be going back to where I started my life sciences career in neurosciences.”

Tmunity, a University of Pennsylvania spinout, is looking to apply CAR T-cell therapy, which has proved to be successful in treating liquid cancers, for the treatment of solid tumors.

Last summer, Tmunity suspended clinical testing of its lead cell therapy candidate targeting prostate cancer after two patients in the study died. Azam, in an interview with the Business Journal in June, said the company, which had grown to about 50 employees since its launch in 2015, laid off an undisclosed number of employees as a result of the setback.

Azam said on LinkedIn he is still a big believer in CAR T-cell therapy, noting Tmunity co-founder Dr. Carl June and his colleagues at Penn just published in Nature the 10-year landmark clinical outcomes study with the first CD19 CAR-T patients and programs.

“It’s just the beginning,” he stated. “I’m excited about the prospect of so many new cell- and gene-based therapies emerging in the next five to 10 years to tackle many solid and liquid tumors, and I hope we all continue to see the remarkable impact this makes on patients and families around the world.”

Azam could not be reached for comment Monday. Tmunity has engaged a search firm to identify his successor.

Tmunity, which is based in Philadelphia, has its own manufacturing operations in East Norriton. Tmunity’s founders include June and fellow Penn cell therapy pioneer Bruce Levine, who led the development of a CAR T-cell therapy now marketed by Novartis as Kymriah, a treatment for certain types of blood cancers.

In therapy using CAR-T cells, a patient’s T cells — part of their immune system — are removed and genetically modified in the laboratory. After they are re-injected into a patient, the T cells are better able to attack and destroy tumors. CAR is an acronym for chimeric antigen receptor. Chimeric antigen receptors are receptor proteins that have been engineered to give T cells their improved ability to target tumors.

Source: https://www.bizjournals.com/philadelphia/news/2022/02/07/tmunity-therapeutics-philadelphia-cell-azam-oz.html?utm_source=st&utm_medium=en&utm_campaign=BN&utm_content=pl&ana=e_pl_BN&j=30034971&senddate=2022-12-20


PIDC names U.S. Department of Treasury veteran, Philadelphia native as next president

 
By   –  Reporter, Philadelphia Business Journal


The Philadelphia Industrial Development Corp. has tapped U.S. Department of Treasury veteran Jodie Harris to be its next president.

Harris succeeds Anne Bovaird Nevins, who spent 15 years in the organization and took over as president in January 2020 before stepping down at the end of last year. Executive Vice President Sam Rhoads has been interim president.

Harris, a Philadelphia native who currently serves as director of the Community Development Financial Institutions Fund for the Department of Treasury, was picked after a regional and national search and will begin her tenure as president on June 1. She becomes the 12th head of PIDC and the first African-American woman to lead the organization.

PIDC is a public-private economic development corporation founded by the city and the Chamber of Commerce for Greater Philadelphia in 1958. It mainly uses industrial and commercial real estate projects to attract jobs, foster business opportunities and spur overall community growth. The organization has spurred over $18.5 billion in financing across its 65 years.

PIDC has its hand in development projects spanning the city, including master planning roles in expansive campuses like the Philadelphia Navy Yard and the Lower Schuylkill Biotech Campus in Southwest Philadelphia.

In a statement, Harris said that it is “a critical time for Philadelphia’s economy.”

“I’m especially excited for the opportunity to lead such an important and impactful organization in my hometown of Philadelphia,” Harris said. “As head of the CDFI Fund, I know first-hand what it takes to drive meaningful, sustainable, and equitable economic growth, especially in historically underserved communities.”

Harris is a graduate of the University of Maryland and received an MBA and master of public administration from New York University. In the Treasury Department, Harris’ most recent work aligns with PIDC’s economic development mission. At the Community Development Financial Institutions Fund, she oversaw a $331 million budget, mainly comprised of grant and administrative funding for various economic programs. Under Harris’ watch, the fund distributed over $3 billion in pandemic recovery funding, its highest level of appropriated grants ever.

Harris has been a part of the Treasury Department for 15 years, including as director of community and economic development policy.

In addition to government work, Harris has previously spent time in the private, academia and nonprofit sectors. In the beginning of her career, Harris worked at Meridian Bank and Accenture before turning to become a social and education policy researcher at New York University. She also spent two years as president of the Urban Business Assistance Corporation in New York.

Mayor Jim Kenney said that Philadelphia is “poised for long-term growth” and Harris will help drive it.

Source: https://www.bizjournals.com/philadelphia/news/2023/02/23/pidc-names-next-president-treasury.html 

$250M life sciences conversion planned for Philadelphia’s historic Quartermaster site

 
By   –  Reporter, Philadelphia Business Journal

Listen to this article     3 min

Real estate company SkyREM plans to spend $250 million converting the historic Quartermaster site in South Philadelphia to a life sciences campus with restaurants and a hotel.

The redevelopment would feature wet and dry lab space for research, development and bio-manufacturing.

The renamed Quartermaster Science + Technology Park is near the southwest corner of Oregon Avenue and South 20th Street in the city’s Girard Estates neighborhood. It’s east of the Quartermaster Plaza retail center, which sold last year for $100 million.

The 24-acre campus is planned to have six acres of green space, an Aldi grocery store opening by March and already is the headquarters for Indego, the bicycle share program in Philadelphia.

Six buildings totaling 1 million square feet of space would be used for research and development labs. There’s 500,000 square feet of vacant space available for life sciences and high technology companies with availabilities as small as 1,000 square feet up to 250,000 square feet contiguous. There’s also 150,000 square feet of retail space available.

The office park has 200,000 square feet already occupied by tenants. The Philadelphia Job Corps Center and Delaware Valley Intelligence Center are tenants at the site.

The campus was previously used by the military as a place to produce clothing, footwear and personal equipment during World War I and II. The clothing factory closed in 1994. The Philadelphia Quartermaster Depot was listed on the National Register of Historic Places in 2010.

“We had a vision to preserve the legacy of this built-to-last historic Philadelphia landmark and transform it to create a vibrant space where the best and brightest want to innovate, collaborate, and work,” SkyREM CEO and Founder Alex Dembitzer said in a statement.

SkyREM, a real estate investor and developer, has corporate offices in New York and Philadelphia. The company acquired the site in 2001.

Vered Nohi, SkyREM’s regional executive director of new business development, called the redevelopment “transformational” for Philadelphia.


Quartermaster would join a wave of new life sciences projects being developed in the surrounding area and across the region.

The site is near both interstates 76 and 95 and is about 2 miles north of the Philadelphia Navy Yard, which has undergone a similar transformation from a military hub to a major life sciences and mixed-use redevelopment project. The Philadelphia Industrial Development Corp. is also in the process of selecting a developer to create a massive cell and gene therapy manufacturing complex across two sites totaling about 40 acres on Southwest Philadelphia’s Lower Schuylkill riverfront.

At 34th Street and Grays Ferry Avenue, the University of Pennsylvania is teaming with Longfellow Real Estate Partners on proposed a $365 million, 455,000-square-foot life sciences and biomanufacturing building at Pennovation Works.

 

SkyREM is working with Maryland real estate firm Scheer Partners to lease the science and technology space. Philadelphia’s MPN Realty will handle leasing of the retail space. Architecture firm Fifteen is working on the project’s design.

Scheer Partners Senior Vice President Tim Conrey said the Quartermaster conversion will help companies solve for “speed to market” as demand for life science space in the region has been strong.

Brandywine pauses new spec office development, continues to bet big on life sciences

By   –  Reporter, Philadelphia Business Journal


Brandywine Realty Trust originally planned to redevelop a Radnor medical office into lab and office space, split 50-50 between the two uses.

After changes in demand for lab and office space, Brandywine (NYSE: BDN) recently completed the 168,000-square-foot, four-story building at 250 King of Prussia Road in Radnor fully for life sciences.

“The pipeline is now 100% life sciences, which, while requiring more capital, is also generating longer term leases at a higher return on cost,” Brandywine CEO Jerry Sweeney of the project said during the company’s fourth-quarter earnings call on Thursday.

At the same time, Brandywine is holding off on developing new office buildings unless it has a tenant lined up in advance.

The shift reflects how Philadelphia-based Brandywine continues to lean into — and bet big — on life sciences.

Brandywine is the city’s largest owner of trophy office buildings and has several major development projects in the works. The company is planning to eventually develop 3 million square feet of life sciences space. For now, 800,000 square feet of life sciences space is under development, including a 12-story, 417,000-square-foot life sciences building at 3151 Market St. and a 29-story building with 200,000 square feet of life sciences space at 3025 John F. Kennedy Blvd. Both are part of the multi-phase Schuylkill Yards project underway near 30th Street Station in University City.

Once its existing projects are completed, Brandywine would have 800,000 square feet of life sciences space, making up 8% of its portfolio.Sweeney said the company wants to grow that figure to 21%.

Brandywine is developing a 145,000-square-foot, build-to-suit office building at 155 King of Prussia Road in Radnor for Arkema, a France-based global supplier of specialty materials. The building will be Arkema’s North American headquarters. Construction began in January and is scheduled to be completed in late 2024.

Brandywine reported that since November it raised over $705 million through fourth-quarter asset sales, an unsecured bond transaction and a secured loan. The company has “complete availability” on its $600 million unsecured line of credit, Sweeney said.

Brandywine sold a 95% leased, 86,000-square-foot office building at 200 Barr Harbor Drive in West Conshohocken for $30.5 million. The company also sold its 50% ownership interest in the 1919 Market joint venture for $83.2 million to an undisclosed buyer. 1919 Market St. is a 29-story building with apartments, office and commercial space. Brandywine co-developed the property with LCOR and the California State Teacher’s Retirement System.

Brandywine declined to comment and LCOR could not be reached.

Brandywine’s core portfolio is 91% leased.

The project at 250 King of Prussia Road cost $103.7 million and was recently completed. The renovation included 12-foot high floor-to-ceiling glass on the second floor, a new roof, lobby, elevator core, common area with a skylight and an added structured parking deck.

Located in the Radnor Life Science Center, a new campus with nearly 1 million square feet of lab, research and office space, Sweeney said it’s a “magnet” for biotech companies. Avantor, a global manufacturer and distributor of life sciences products, is headquartered in the complex.


Sweeney said Brandywine is “very confident” demand will stay strong for life sciences in Radnor. The building at 250 King of Prussia Road is projected to be fully leased by early 2024.

“Larger users we’re talking to, they just tend to take a little bit more time than we would like as they go through technical requirements and space planning requirements,” Sweeney said.

While Brandywine is aiming to increase its life sciences footprint, the company is being selective about what it builds next. The company may steer away from developments other than life sciences. The Schuylkill Yards project, for example, features a significant life sciences portion in University City.

“Other than fully leased build-to-suit opportunities, our future development starts are on hold,” Sweeney said, “pending more leasing on the existing joint venture pipeline and more clarity on the cost of debt capital and cap rates.”


Brandywine said about 70% to 75%of suburban tenants have returned to offices while that number has been around 50% in Philadelphia. At this point, though, it hasn’t yet affected demand when leasing space. Some tenants, for example, have moved out of the city while others have moved in.

In the fourth quarter, Brandywine had $55.7 million funds from operations, or 32 cents per share. That’s down from $60.4 million, or 35 cents per share, in the fourth quarter of 2021. Brandywine generated $129 million in revenue in the fourth quarter, up slightly from $125.5 in the year-ago period.

Brandywine stock is up 6.4% since the start of the year to $6.70 per share on Monday afternoon.

Many of Brandywine’s properties are in desirable locations, which have seen demand remain strong despite challenges facing offices, on par with industry trends.

Brandywine’s 12-story, 417,000-square-foot building at 3151 Market St. is on budget for $308 million and on schedule to be completed in the second quarter of 2024. Sweeney said Brandywine anticipates entering a construction loan in the second half of 2023, which would help complete the project. The building, being developed along with a global institutional investor,would be used for life sciences, innovation and office space as part of the larger Schuylkill Yards development in University City.

The company’s 29-story building at 3025 John F. Kennedy Blvd. with 200,000 square feet of life sciences space and 326 luxury apartments, is also on budget, costing $287.3 million, and on time, eyeing completion in the third quarter of this year.

Source: https://www.bizjournals.com/philadelphia/news/2023/02/06/brandywine-realty-life-sciences-development.html

Read Full Post »

AI enabled Drug Discovery and Development: The Challenges and the Promise

Reporter: Aviva Lev-Ari, PhD, RN


Early Development

Caroline Kovac (the first IBM GM of Life Sciences) is the one who started in silico development of drugs in 2000 using a big db of substances and computer power. She transformed an idea into $2b business. Most of the money was from big pharma. She was asking what is are the new drugs they are planning to develop and provided the four most probable combinations of substances, based on in Silicon work. 

Carol Kovac

General Manager, Healthcare and Life Sciences, IBM

from speaker at conference on 2005

Carol Kovac is General Manager of IBM Healthcare and Life Sciences responsible for the strategic direction of IBM′s global healthcare and life sciences business. Kovac leads her team in developing the latest information technology solutions and services, establishing partnerships and overseeing IBM investment within the healthcare, pharmaceutical and life sciences markets. Starting with only two employees as an emerging business unit in the year 2000, Kovac has successfully grown the life sciences business unit into a multi-billion dollar business and one of IBM′s most successful ventures to date with more than 1500 employees worldwide. Kovac′s prior positions include general manager of IBM Life Sciences, vice president of Technical Strategy and Division Operations, and vice president of Services and Solutions. In the latter role, she was instrumental in launching the Computational Biology Center at IBM Research. Kovac sits on the Board of Directors of Research!America and Africa Harvest. She was inducted into the Women in Technology International Hall of Fame in 2002, and in 2004, Fortune magazine named her one of the 50 most powerful women in business. Kovac earned her Ph.D. in chemistry at the University of Southern California.

SOURCE

https://www.milkeninstitute.org/events/conferences/global-conference/2005/speaker-detail/1536


In 2022

The use of artificial intelligence in drug discovery, when coupled with new genetic insights and the increase of patient medical data of the last decade, has the potential to bring novel medicines to patients more efficiently and more predictably.

WATCH VIDEO

https://www.youtube.com/watch?v=b7N3ijnv6lk

SOURCE

https://engineering.stanford.edu/magazine/promise-and-challenges-relying-ai-drug-development?utm_source=Stanford+ALL

Conversation among three experts:

Jack Fuchs, MBA ’91, an adjunct lecturer who teaches “Principled Entrepreneurial Decisions” at Stanford School of Engineering, moderated and explored how clearly articulated principles can guide the direction of technological advancements like AI-enabled drug discovery.

Kim Branson, Global head of AI and machine learning at GSK.

Russ Altman, the Kenneth Fong Professor of Bioengineering, of genetics, of medicine (general medical discipline), of biomedical data science and, by courtesy, of computer science.


Synthetic Biology Software applied to development of Galectins Inhibitors at LPBI Group


The Map of human proteins drawn by artificial intelligence and PROTAC (proteolysis targeting chimeras) Technology for Drug Discovery

Curators: Dr. Stephen J. Williams and Aviva Lev-Ari, PhD, RN

Using Structural Computation Models to Predict Productive PROTAC Ternary Complexes

Ternary complex formation is necessary but not sufficient for target protein degradation. In this research, Bai et al. have addressed questions to better understand the rate-limiting steps between ternary complex formation and target protein degradation. They have developed a structure-based computer model approach to predict the efficiency and sites of target protein ubiquitination by CRNB-binding PROTACs. Such models will allow a more complete understanding of PROTAC-directed degradation and allow crafting of increasingly effective and specific PROTACs for therapeutic applications.

Another major feature of this research is that it a result of collaboration between research groups at Amgen, Inc. and Promega Corporation. In the past commercial research laboratories have shied away from collaboration, but the last several years have found researchers more open to collaborative work. This increased collaboration allows scientists to bring their different expertise to a problem or question and speed up discovery. According to Dr. Kristin Riching, Senior Research Scientist at Promega Corporation, “Targeted protein degraders have broken many of the rules that have guided traditional drug development, but it is exciting to see how the collective learnings we gain from their study can aid the advancement of this new class of molecules to the clinic as effective therapeutics.”

Literature Reviewed

Bai, N. , Riching K.M. et al. (2022) Modeling the CRLRA ligase complex to predict target protein ubiquitination induced by cereblon-recruiting PROTACs. J. Biol. Chem.

The researchers NanoBRET assays as part of their model validation. Learn more about NanoBRET technology at the Promega.com website.

SOURCE

https://www.promegaconnections.com/protac-ternary-complex/?utm_campaign=ms-2022-pharma_tpd&utm_source=linkedin&utm_medium=Khoros&utm_term=sf254230485&utm_content=030822ct-blogsf254230485&sf254230485=1

Read Full Post »

A laboratory for the use of AI for drug development has been launched in collaboration with Pfizer, Teva, AstraZeneca, Mark and Amazon

Reporter: Aviva Lev-Ari, PhD, RN

AION Labs unites pharma, technology and funds companies including IBF to invest in startups to integrate developments in cloud computing and artificial intelligence to improve drug development capabilities. An alliance of four leading pharmaceutical companies –  
AION Labs
 , the first innovation lab of its kind in the world and a pioneer in the process of adopting cloud technologies, artificial intelligence and computer science to solve the R&D challenges of the pharma industry, today announces its launch.
AstraZeneca ,  
Mark ,  
Pfizer  and 
Teva  – and two leading companies in the field of high-tech and biotech investments, respectively – AWS ( 
Amazon Web Services Inc ) and the Israeli investment fund IBF ( 
Israel Biotech Fund ) – which joined together to establish groundbreaking ventures Through artificial intelligence and computer science to change the way new therapies are discovered and developed.  “We are excited to launch the new innovation lab in favor of discoveries of drugs and medical devices using groundbreaking computational tools,” said Matti Gil, CEO of AION Labs. We are prepared and ready to make a difference in the process of therapeutic discoveries and their development. 
With a strong pool of talent from Israel and the world, cloud technology and artificial intelligence at the heart of our activities and a significant commitment by the State of Israel, we are ready to contribute to the health and well-being of the human race and promote industry in Israel. 
I thank the partners for the trust, and it is an honor for me to lead such a significant initiative. ” 
In addition, AION Labs has announced a strategic partnership with X  
BioMed  , an independent biomedical research institute operating in Heidelberg, Germany. 
BioMed X has a proven track record in advancing research innovations in the field of biomedicine at the interface between academic research and the pharmaceutical industry. 
BioMed X’s innovation model, based on global mass sourcing and incubators to cultivate the most brilliant talent and ideas, will serve as the R & D engine to drive AION Labs’ enterprise model.

SOURCE

Read Full Post »

NCCN Shares Latest Expert Recommendations for Prostate Cancer in Spanish and Portuguese

Reporter: Stephen J. Williams, Ph.D.

Currently many biomedical texts and US government agency guidelines are only offered in English or only offered in different languages upon request. However Spanish is spoken in a majority of countries worldwide and medical text in that language would serve as an under-served need. In addition, Portuguese is the main language in the largest country in South America, Brazil.

The LPBI Group and others have noticed this need for medical translation to other languages. Currently LPBI Group is translating their medical e-book offerings into Spanish (for more details see https://pharmaceuticalintelligence.com/vision/)

Below is an article on The National Comprehensive Cancer Network’s decision to offer their cancer treatment guidelines in Spanish and Portuguese.

Source: https://www.nccn.org/home/news/newsdetails?NewsId=2871

PLYMOUTH MEETING, PA [8 September, 2021] — The National Comprehensive Cancer Network® (NCCN®)—a nonprofit alliance of leading cancer centers in the United States—announces recently-updated versions of evidence- and expert consensus-based guidelines for treating prostate cancer, translated into Spanish and Portuguese. NCCN Clinical Practice Guidelines in Oncology (NCCN Guidelines®) feature frequently updated cancer treatment recommendations from multidisciplinary panels of experts across NCCN Member Institutions. Independent studies have repeatedly found that following these recommendations correlates with better outcomes and longer survival.

“Everyone with prostate cancer should have access to care that is based on current and reliable evidence,” said Robert W. Carlson, MD, Chief Executive Officer, NCCN. “These updated translations—along with all of our other translated and adapted resources—help us to define and advance high-quality, high-value, patient-centered cancer care globally, so patients everywhere can live better lives.”

Prostate cancer is the second most commonly occurring cancer in men, impacting more than a million people worldwide every year.[1] In 2020, the NCCN Guidelines® for Prostate Cancer were downloaded more than 200,000 times by people outside of the United States. Approximately 47 percent of registered users for NCCN.org are located outside the U.S., with Brazil, Spain, and Mexico among the top ten countries represented.

“NCCN Guidelines are incredibly helpful resources in the work we do to ensure cancer care across Latin America meets the highest standards,” said Diogo Bastos, MD, and Andrey Soares, MD, Chair and Scientific Director of the Genitourinary Group of The Latin American Cooperative Oncology Group (LACOG). The organization has worked with NCCN in the past to develop Latin American editions of the NCCN Guidelines for Breast Cancer, Colon Cancer, Non-Small Cell Lung Cancer, Prostate Cancer, Multiple Myeloma, and Rectal Cancer, and co-hosted a webinar on “Management of Prostate Cancer for Latin America” earlier this year. “We appreciate all of NCCN’s efforts to make sure these gold-standard recommendations are accessible to non-English speakers and applicable for varying circumstances.”
NCCN also publishes NCCN Guidelines for Patients®, containing the same treatment information in non-medical terms, intended for patients and caregivers. The NCCN Guidelines for Patients: Prostate Cancer were found to be among the most trustworthy sources of information online according to a recent international study. These patient guidelines have been divided into two books, covering early and advanced prostate cancer; both have been translated into Spanish and Portuguese as well.

NCCN collaborates with organizations across the globe on resources based on the NCCN Guidelines that account for local accessibility, consideration of metabolic differences in populations, and regional regulatory variation. They can be downloaded free-of-charge for non-commercial use at NCCN.org/global or via the Virtual Library of NCCN Guidelines App. Learn more and join the conversation with the hashtag #NCCNGlobal.


[1] Bray F, Ferlay J, Soerjomataram I, Siegel RL, Torre LA, Jemal A. Global Cancer Statistics 2018: GLOBOCAN estimates of incidence and mortality worldwide for 36 cancers in 185 countries. CA Cancer J Clin, in press. The online GLOBOCAN 2018 database is accessible at http://gco.iarc.fr/, as part of IARC’s Global Cancer Observatory.

About the National Comprehensive Cancer Network

The National Comprehensive Cancer Network® (NCCN®) is a not-for-profit alliance of leading cancer centers devoted to patient care, research, and education. NCCN is dedicated to improving and facilitating quality, effective, efficient, and accessible cancer care so patients can live better lives. The NCCN Clinical Practice Guidelines in Oncology (NCCN Guidelines®) provide transparent, evidence-based, expert consensus recommendations for cancer treatment, prevention, and supportive services; they are the recognized standard for clinical direction and policy in cancer management and the most thorough and frequently-updated clinical practice guidelines available in any area of medicine. The NCCN Guidelines for Patients® provide expert cancer treatment information to inform and empower patients and caregivers, through support from the NCCN Foundation®. NCCN also advances continuing education, global initiatives, policy, and research collaboration and publication in oncology. Visit NCCN.org for more information and follow NCCN on Facebook @NCCNorg, Instagram @NCCNorg, and Twitter @NCCN.

Please see LPBI Group’s efforts in medical text translation and Natural Language Processing of Medical Text at

Read Full Post »

Can the Public Benefit Company Structure Save US Healthcare?

Curator: Stephen J. Williams, Ph.D.

UPDATED 11/05/2023

Public Benefit Corporation structure in healthcare has actually been around since the 1970s in New Yourk State, when New York City’s new Health and Hospitals Corporation took over the city Department of Hospitals and today runs 11 hospitals and four long-term care facitlites in the city.  The following link to an article describes however the problems occuring with Nassau and Westchester hosptial systems, which were converted to New York PBC status in the 1990s.  As the article states the financial problems in 2004 which these hospitals encountered

do not stem from their unusual status as public benefit corporations, and might have been even worse off had they not converted

The New York Times article of 2004 “At 2 Hospitals, Fiscal Troubles in the Glare of Public View” highlight in fact the growing problem that all hospitals are encountering, especially on the fiscal side.  But it does highlight how to better structure these entities and why full commitment to the PBC structure is necessary.

Source: https://www.nytimes.com/2004/01/18/nyregion/at-2-hospitals-fiscal-troubles-in-the-glare-of-public-view.html?login=ml&auth=login-ml 

In 2003 New York State had a record closure of hospitals, and in 2004 Nassau and WestChester were having such fiscal problems it threatened the bond status of those counties.  Despite the regular problems hospitals had, critics had said there were two major contributing factors to their woes

  1. the two agencies had not completed their transition from government operations to fully competitve hospitals
  2. as a PBC they bear a costly mission of serving the uninsured

As a PBC the structure allows one to shed cumbersome government rules, giving them the flexibility to conduct business like other hospitals.

In addition they are no longer dependent, in fact now forced, to forgo dependence on public funding and look for independent means of investment.  With their semi-independence from government the agencies also are more insulted from political pressure.

However this seemed to be the problem.  These agencies were still to dependent on their local government and there was still local political influence on their boards.

UPDATED 3/15/2023

According to Centers for Medicare and Medicare Services (CMS.gov) healthcare spending per capita has reached 17.7 percent of GDP with, according to CMS data:

From 1960 through 2013, health spending rose from $147 per person to $9,255 per person, an average annual increase of 8.1 percent.

the National Health Expenditure Accounts (NHEA) are the official estimates of total health care spending in the United States. Dating back to 1960, the NHEA measures annual U.S. expenditures for health care goods and services, public health activities, government administration, the net cost of health insurance, and investment related to health care. The data are presented by type of service, sources of funding, and type of sponsor.

Graph: US National Healthcare Expenditures as a percent of Gross Domestic Product from 1960 to current. Recession periods are shown in bars. Note that the general trend has been increasing healthcare expenditures with only small times of decrease for example 2020 in year of COVID19 pandemic. In addition most of the years have been inflationary with almost no deflationary periods, either according to CPI or healthcare costs, specifically.

U.S. health care spending grew 4.6 percent in 2019, reaching $3.8 trillion or $11,582 per person.  As a share of the nation’s Gross Domestic Product, health spending accounted for 17.7 percent.

And as this spending grew (demand for health care services) associated costs also rose but as the statistical analyses shows there was little improvement in many health outcome metrics during the same time. 

Graph of the Growth of National Health Expenditures (NHE) versus the growth of GDP. Note most years from 1960 growth rate of NHE has always been higher than GDP, resulting in a seemingly hyperinflationary effect of healthcare. Also note how there are years when this disconnect is even greater, as there were years when NHE grew while there were recessionary periods in the general economy.

It appears that US healthcare may be on the precipice of a transformational shift, but what will this shift look like? The following post examines if the corporate structure of US healthcare needs to be changed and what role does a Public Benefit Company have in this much needed transformation.

Hippocratic Oath

I swear by Apollo the physician, and Asclepius, and Hygieia and Panacea and all the gods and goddesses as my witnesses, that, according to my ability and judgement, I will keep this Oath and this contract:

To hold him who taught me this art equally dear to me as my parents, to be a partner in life with him, and to fulfill his needs when required; to look upon his offspring as equals to my own siblings, and to teach them this art, if they shall wish to learn it, without fee or contract; and that by the set rules, lectures, and every other mode of instruction, I will impart a knowledge of the art to my own sons, and those of my teachers, and to students bound by this contract and having sworn this Oath to the law of medicine, but to no others.

I will use those dietary regimens which will benefit my patients according to my greatest ability and judgement, and I will do no harm or injustice to them.

I will not give a lethal drug to anyone if I am asked, nor will I advise such a plan; and similarly I will not give a woman a pessary to cause an abortion.

In purity and according to divine law will I carry out my life and my art.

I will not use the knife, even upon those suffering from stones, but I will leave this to those who are trained in this craft.

Into whatever homes I go, I will enter them for the benefit of the sick, avoiding any voluntary act of impropriety or corruption, including the seduction of women or men, whether they are free men or slaves.

Whatever I see or hear in the lives of my patients, whether in connection with my professional practice or not, which ought not to be spoken of outside, I will keep secret, as considering all such things to be private.

So long as I maintain this Oath faithfully and without corruption, may it be granted to me to partake of life fully and the practice of my art, gaining the respect of all men for all time. However, should I transgress this Oath and violate it, may the opposite be my fate.

Translated by Michael North, National Library of Medicine, 2002.

Much of the following information can be found on the Health Affairs Blog in a post entitled

Public Benefit Corporations: A Third Option For Health Care Delivery?

By Soleil Shah, Jimmy J. Qian, Amol S. Navathe, Nirav R. Shah

Limitations of For Profit and Non-Profit Hospitals

For profit represent ~ 25% of US hospitals and are owned and governed by shareholders, and can raise equity through stock and bond markets.

According to most annual reports, the CEOs incorrectly assume they are legally bound as fiduciaries to maximize shareholder value.  This was a paradigm shift in priorities of companies which started around the mid 1980s, a phenomenon discussed below.  

A by-product of this business goal, to maximize shareholder value, is that CEO pay and compensation is naturally tied to equity markets.  A means for this is promoting cost efficiencies, even in the midst of financial hardships.

A clear example of the failure of this system can be seen during the 2020- current COVID19 pandemic in the US. According to the Medicare Payment Advisory Commission, four large US hospitals were able to decrease their operating expenses by $2.3 billion just in Q2 2020.  This amounted to 65% of their revenue; in comparison three large NONPROFIT hospitals reduced their operating expense by an aggregate $13 million (only 1% of their revenue), evident that in lean times for-profit will resort to drastic cost cutting at expense of service, even in times of critical demands for healthcare.

Because of their tax structure and perceived fiduciary responsibilities, for-profit organizations (unlike non-profit and public benefit corporations) are not legally required to conduct community health need assessments, establish financial assistance policies, nor limit hospital charges for those eligible for financial assistance.  In addition to the difference in tax liability, for-profit, unlike their non-profit counterparts, at least with hospitals, are not funded in part by state or local government.  As we will see, a large part of operating revenue for non-profit university based hospitals is state and city funding.

Therefore risk for financial responsibility is usually assumed by the patient, and in worst case, by the marginalized patient populations on to the public sector.

Tax Structure Considerations of for-profit healthcare

Financials of major for-profit healthcare entities (2020 annual)

Non-profit Healthcare systems

Nonprofits represent about half of all hospitals in the US.  Most of these exist as a university structure, so retain the benefits of being private health systems and retaining the funding and tax benefits attributed to most systems of higher education. And these nonprofits can be very profitable.  After taking in consideration the state, local, and federal tax exemptions these nonprofits enjoy, as well as tax-free donations from contributors (including large personal trust funds), a nonprofit can accumulate a large amount of revenue after expenses.  In fact 82 nonprofit hospitals had $33 billion of net asset increase year-over-year (20% increase) from 2016 to 2017.  The caveat is that this revenue over expenses is usually spent on research or increased patient services (this may mean expanding the physical infrastructure of the hospital or disseminating internal grant money to clinical investigators, expanding the hospital/university research assets which could result in securing even larger amount of external funding from government sources.

And although this model may work well for intercity university/healthcare systems, it is usually a struggle for the rural nonprofit hospitals.  In 2020, ten out of 17 rural hospitals that went under were nonprofits.  And this is not just true in the tough pandemic year.  Over the past two decades multitude of nonprofit rural hospitals had to sell and be taken over by larger for-profit entities. 

Hospital consolidation has led to a worse patient experience and no real significant changes in readmission or mortality data.  (The article below is how over 130 rural hospitals have closed since 2010, creating a medical emergency in rural US healthcare)

https://www.nationalgeographic.com/history/article/appalachian-hospitals-are-disappearing


And according to the article below it is only to get worse

The authors of the Health Affairs blog feel a major disadvantage of both the for-profit and non-profit healthcare systems is “that both face limited accountability with respect to anticompettive mergers and acquisitions.”

More hospital consolidation is expected post-pandemic

Aug 10, 2020

By Rich Daly, HFMA Senior Writer and Editor

News | Coronavirus

More hospital consolidation is expected post-pandemic

  • Hospital deal volume is likely to accelerate due to the financial damage inflicted by the coronavirus pandemic.
  • The anticipated increase in volume did not show up in the latest quarter, when deals were sharply down.
  • The pandemic may have given hospitals leverage in coming policy fights over billing and the creation of “public option” health plans.

Hospital consolidation is likely to increase after the COVID-19 pandemic, say both critics and supporters of the merger-and-acquisition (M&A) trend.

The financial effects of the coronavirus pandemic are expected to drive more consolidation between and among hospitals and physician practices, a group of policy professionals told a recent Washington, D.C.-based web briefing sponsored by the Alliance for Health Policy.

“There is a real danger that this could lead to more consolidation, which if we’re not careful could lead to higher prices,” said Karyn Schwartz, a senior fellow at the Kaiser Family Foundation (KFF).

Schwartz cited a recent KFF analysis of available research that concluded “provider consolidation leads to higher health care prices for private insurance; this is true for both horizontal and vertical consolidation.”

Kenneth Kaufman, managing director and chair of Kaufman Hall, noted that crises tend to push financially struggling organizations “further behind.”

“I wouldn’t be surprised at all if that happens,” Kaufman said. “That will lead to further consolidation in the provider market.”

The initial rounds of federal assistance from the CARES Act, which were based first on Medicare revenue and then on net patient revenue, may fuel consolidation, said Mark Miller, PhD, executive vice president of healthcare for Arnold Ventures. That’s because the funding formulas favored organizations that already had higher revenues, he said, and provided less assistance to low-revenue organizations.

HHS has distributed $116.2 billion from the $175 billion in provider funding available through the CARES Act and the Paycheck Protection Program and Health Care Enhancement Act. The largest distributions used the two revenue formulas cited by Miller.

No surge in M&A yet

The expected burst in hospital M&A activity has yet to occur. Kaufman Hall identified 14 transactions in the second quarter of 2020, far fewer than in the same quarter in any of the four preceding years, when second-quarter transactions totaled between 19 and 31. The latest deals were not focused on small hospitals, with average seller revenue of more than $800 million — far larger than the previous second-quarter high of $409 million in 2018.

Six of the 14 announced transactions were divestitures by major for-profit health systems, including Community Health Systems, Quorum and HCA.

Kaufman Hall’s analysis of the recent deals identified another pandemic-related factor that may fuel hospital M&A: closer ties between hospitals. The analysis cited the example of  Lifespan and Care New England, which had suspended merger talks in 2019. More recently, in a joint announcement, the CEOs of the two systems noted that because of the COVID-19 crisis, the two systems “have been working together in unprecedented ways” and “have agreed to enter into an exploration process to understand the pros and cons of what a formal continuation of this collaboration could look like in the future.”

The M&A outlook for rural hospitals

The pandemic has had less of a negative effect on the finances of rural hospitals that previously joined larger health systems, said Suzie Desai, senior director of not-for-profit healthcare for S&P Global.

A CEO of a health system with a large rural network told Kaufman the federal grants that the system received for its rural hospitals were much larger than the grants paid through the general provider fund.

“If that was true across the board, then the federal government recognized that many rural hospitals could be at risk of not being able to make payroll; actually running out of money,” Kaufman said. “And they seem to have bent over backwards to make sure that didn’t happen.”  

Other CARES Act funding distributed to providers included:

  • $12.8 billion for 959 safety net hospitals
  • $11 billion to almost 4,000 rural healthcare providers and hospitals in urban areas that have certain special rural designations in Medicare

Telehealth has helped rural hospitals but has not been sufficient to address the financial losses inflicted by the pandemic, Desai said.

Other coming trends include a sharper cost focus

Desai expects an increasing focus “over the next couple years” on hospital costs because of the rising share of revenue received from Medicare and Medicaid. She expects increased efforts to use technology and data to lower costs.

Billy Wynne, JD, chairman of Wynne Health Group, expects telehealth restrictions to remain relaxed after the pandemic.

Also, the perceptions of the public and politicians about the financial health of hospitals are likely to give those organizations leverage in coming policy fights over changes such as banning surprise billing and creating so-called public-option health plans, Wynne said. As an example, he cited the Colorado legislature’s suspension of the launch of a public option “in part because of sensitivities around hospital finances in the COVID pandemic.”

“Once the dust settles, it’ll be interesting to see if their leverage has increased or decreased due to what we’ve been through,” Wynne said.

About the Author

Rich Daly, HFMA Senior Writer and Editor,

is based in the Washington, D.C., office. Follow Rich on Twitter: @rdalyhealthcare

Source: https://www.hfma.org/topics/news/2020/08/more-hospital-consolidation-is-expected-post-pandemic.html

From Harvard Medical School

Hospital Mergers and Quality of Care

A new study looks at the quality of care at hospitals acquired in a recent wave of consolidations

By JAKE MILLER January 16, 2020 Research

Two train tracks merge in a blurry sunset.

Image: NirutiStock / iStock / Getty Images Plus       

The quality of care at hospitals acquired during a recent wave of consolidations has gotten worse or stayed the same, according to a study led by Harvard Medical School scientists published Jan. 2 in NEJM.

The findings deal a blow to the often-cited arguments that hospital consolidation would improve care. A flurry of earlier studies showed that mergers increase prices. Now after analyzing patient outcomes after hundreds of hospital mergers, the new research also dashes the hopes that this more expensive care might be of higher quality.

Get more HMS news here

“Our findings call into question claims that hospital mergers are good for patients—and beg the question of what we are getting from higher hospital prices,” said study senior author J. Michael McWilliams, the Warren Alpert Foundation Professor of Health Care Policy in the Blavatnik Institute at HMS and an HMS professor of medicine and a practicing general internist at Brigham and Women’s Hospital.

McWilliams noted that rising hospital prices have been one of the leading drivers of unsustainable growth in U.S. health spending.   

To examine the impact of hospital mergers on quality of care, researchers from HMS and Harvard Business School examined patient outcomes from nearly 250 hospital mergers that took place between 2009 and 2013. Using data collected by the Centers for Medicare and Medicaid Services, they analyzed variables such as 30-day readmission and mortality rates among patients discharged from a hospital, as well as clinical measures such as timely antibiotic treatment of patients with bacterial pneumonia. The researchers also factored in patient experiences, such as whether those who received care at a given hospital would recommend it to others. For their analysis, the team compared trends in these indicators between 246 hospitals acquired in merger transactions and unaffected hospitals.

The verdict? Consolidation did not improve hospital performance, and patient-experience scores deteriorated somewhat after the mergers.

The study was not designed to examine the reasons behind the worsening in patient experience. Weakening of competition due to hospital mergers could have contributed, the researchers said, but deeper exploration suggested other potential mechanisms. Notably, the analysis found the decline in patient-experience scores occurred mainly in hospitals acquired by hospitals that already had a poor patient-experience score—a finding that suggests acquisitions facilitate the spread of low quality care but not of high quality care.

The researchers caution that isolated, individual mergers may have still yielded positive results—something that an aggregate analysis is not powered to capture. And the researchers could only examine measurable aspects of quality. The trend in hospital performance on these standard measures, however, appears to point to a net effect of overall decline, the team said.

“Since our study estimated the average effects of mergers, we can’t rule out the possibility that some mergers are good for patient care,” said first author Nancy Beaulieu, research associate in health care policy at HMS. “But this evidence should give us pause when considering arguments for hospitals mergers.”

The work was supported by the Agency for Healthcare Research and Quality (grant no. U19HS024072).

Co-investigators included Bruce Landon and Jesse Dalton from HMS, Ifedayo Kuye, from the University of California, San Francisco, and Leemore Dafny from Harvard Business School and the National Bureau of Economic Research.

Source: https://hms.harvard.edu/news/hospital-mergers-quality-care

Public Benefit Corporations (PBC)

     Public benefit corporations (versus Benefit Corporate status, which is more of a pledge) are separate legal entities which exist as a hybrid, for-profit/nonprofit company but is mandated to 

  1. Pursue a general or specific public benefit
  2. Consider the non-financial interests of its shareholders and other STAKEHOLDERS when making decision
  3. report how well it is achieving its overall public benefit objectives
  4. Have limited fiduciary responsibility to investors that remains IN SCOPE of public benefit goal

In essence, the public benefit corporations executives are mandated to run the company for the benefit of STAKEHOLDERS first, if those STAKEHOLDERS are the public beneficiary of the company’s goals.  This in essence moves the needle away from the traditional C-Corp overvaluing the needs of shareholders and brings back the mission of the company and in the case of healthcare, the needs of its stakeholders, the consumers of healthcare.

     PBCs are legal entities recognized by states rather than by the federal government.  So far, in 2020 about 37 states allow companies to incorporate as a PBC.  Stipulations of the charter include semiannual reporting of the public benefits bestowed by the company and how well it is achieving its public benefit mandate.  There are about 3,000 US PBCs. Some companies have felt it was in their company mission and financial interest to change incorporation as a PBC.

Some well known PBCs include

  1. Ben and Jerry’s Ice Cream
  2. American Red Cross
  3. Susan B. Komen Foundation
  4. Allbirds (a shoe startup valued at $1.7 billion when made switch)
  5. Bombas (the sock company that donates extra socks when you buy a pair)
  6. Lemonade (a publicly traded insurance PBC that has beneficiaries select a nonprofit that the company will donate to)

Although the number of PBCs in the healthcare arena is increasing

  1. Not many PBCs are in the area of healthcare delivery 
  2. Noone is quite sure what the economic model would look like for a healthcare delivery PBC

Some example of hospital PBC include NYC Health + Hospitals and Community First Medical Center in Chicago.

Benefits of moving a hospital to PBC Status

  1. PBCs are held legally accountable to a predefined public benefit.  For hospitals this could be delivering cost-effective quality of care and affordable to a local citizenry or an economically disadvantaged population.  PBCs must produce at least an annual report on the public benefits it has achieved contrasted against a third party standard.  For example a hospital could include data of Medicaid related mortality risks, data neither the C-corp nor the nonprofit 501c would have to report on.  Most nonprofits and charities report their taxes on a schedule H or Form 990, which only has to report the officer’s compensation as well as monies given to charitable organizations, or other 501 organizations.  The nonprofit would show a balance of zero as the donated money for that year would be allocated out for various purposes. Hospitals, even as nonprofits, are not required to submit all this data.  Right now in US the ACA just requires any hospital that receives government or ACA insurance payments to report certain outcome statistics.  Although varying state by state, a PBC should have a “benefit officer” to make sure the mandate is being met.  In some cases a PBC benefit officer could sue the board for putting shareholder interest over the public benefit mandate.
  2. A PBC can include community stakeholders in the articles of incorporation thus giving a voice to local community members.  This would be especially beneficial for a hospital serving, say, a rural community.
  3. PBCs do have advantages of the for-profit companies as they are not limited to non-equity forms of investment.  A PBC can raise money in the equity markets or take on debt and finance it.  These financial instruments are unavailable to the non-profit.  Yet one interesting aspect is that PBCs require a HIGHER voting threshold by shareholders than a traditional for profit company in the ability to change their public benefit or convert their PBC back to a for-profit.

Limitations of the PBC

  1. Little incentive financially for current and future hospitals to incorporate as a PBC.  Herein lies a huge roadblock given the state of our reimbursement structure in this country.  Although there may be an incentive with regard to hiring and retention of staff drawn to the organization’s social purpose.  There have been, in the past, suggestions to allow hospitals that incorporate at PBC to receive some tax benefit, but this legislation has not gone through either at state or federal level. (put link to tax article).  
  2. In order for there to be value to constituents (patients) there must be strong accountability measures.  This will require the utmost in ethical behavior by a board and executives.  We have witnessed, through M&A by large health groups, anticompetitive and near monopoly behavior.
  3. There are no federal guidelines but varying guidelines from state to state.  There must be some federal recognition of the PBC status when it comes to healthcare, such as that the government is one of the biggest payers of US healthcare.

This is a great interview with ArcHealth, a PBC healthcare system.

Source: https://www.archealthjustice.com/arc-health-as-public-benefit-company-and-social-enterprise-what-is-the-difference/

Arc Health as a Public Benefit Company and Social Enterprise – What is the difference?

Mar 3, 2021 | Healthcare

Arc Health PBC is a public benefit corporation, a mission-driven for-profit company that utilizes a market-driven approach to achieving our short and long-term social goals. As a public benefit corporation, Arc Health is also a social enterprise working to further our mission of providing healthcare to rural, underserved, and indigenous communities through business practices that improve the recruitment and retention of quality healthcare providers.

What is a Social Enterprise?

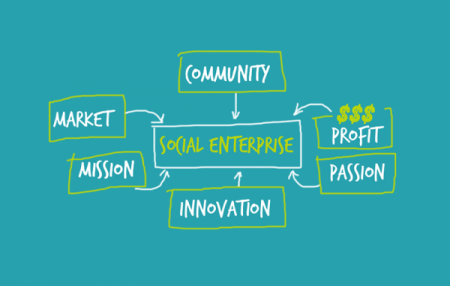
While there is no one exact definition, according to the Social Enterprise Alliance, a social enterprise is an “organization that addresses a basic unmet need or solves a social or environmental problem through a market-driven approach.” A social enterprise is not a distinct legal entity, but instead, an “ideological spectrum marrying commercial approaches with social good.” Social enterprises foster a dual-bottom-line – simultaneously seeking profits and social impact. Arc Health, like many social enterprises, seeks to be self–sustainable. 

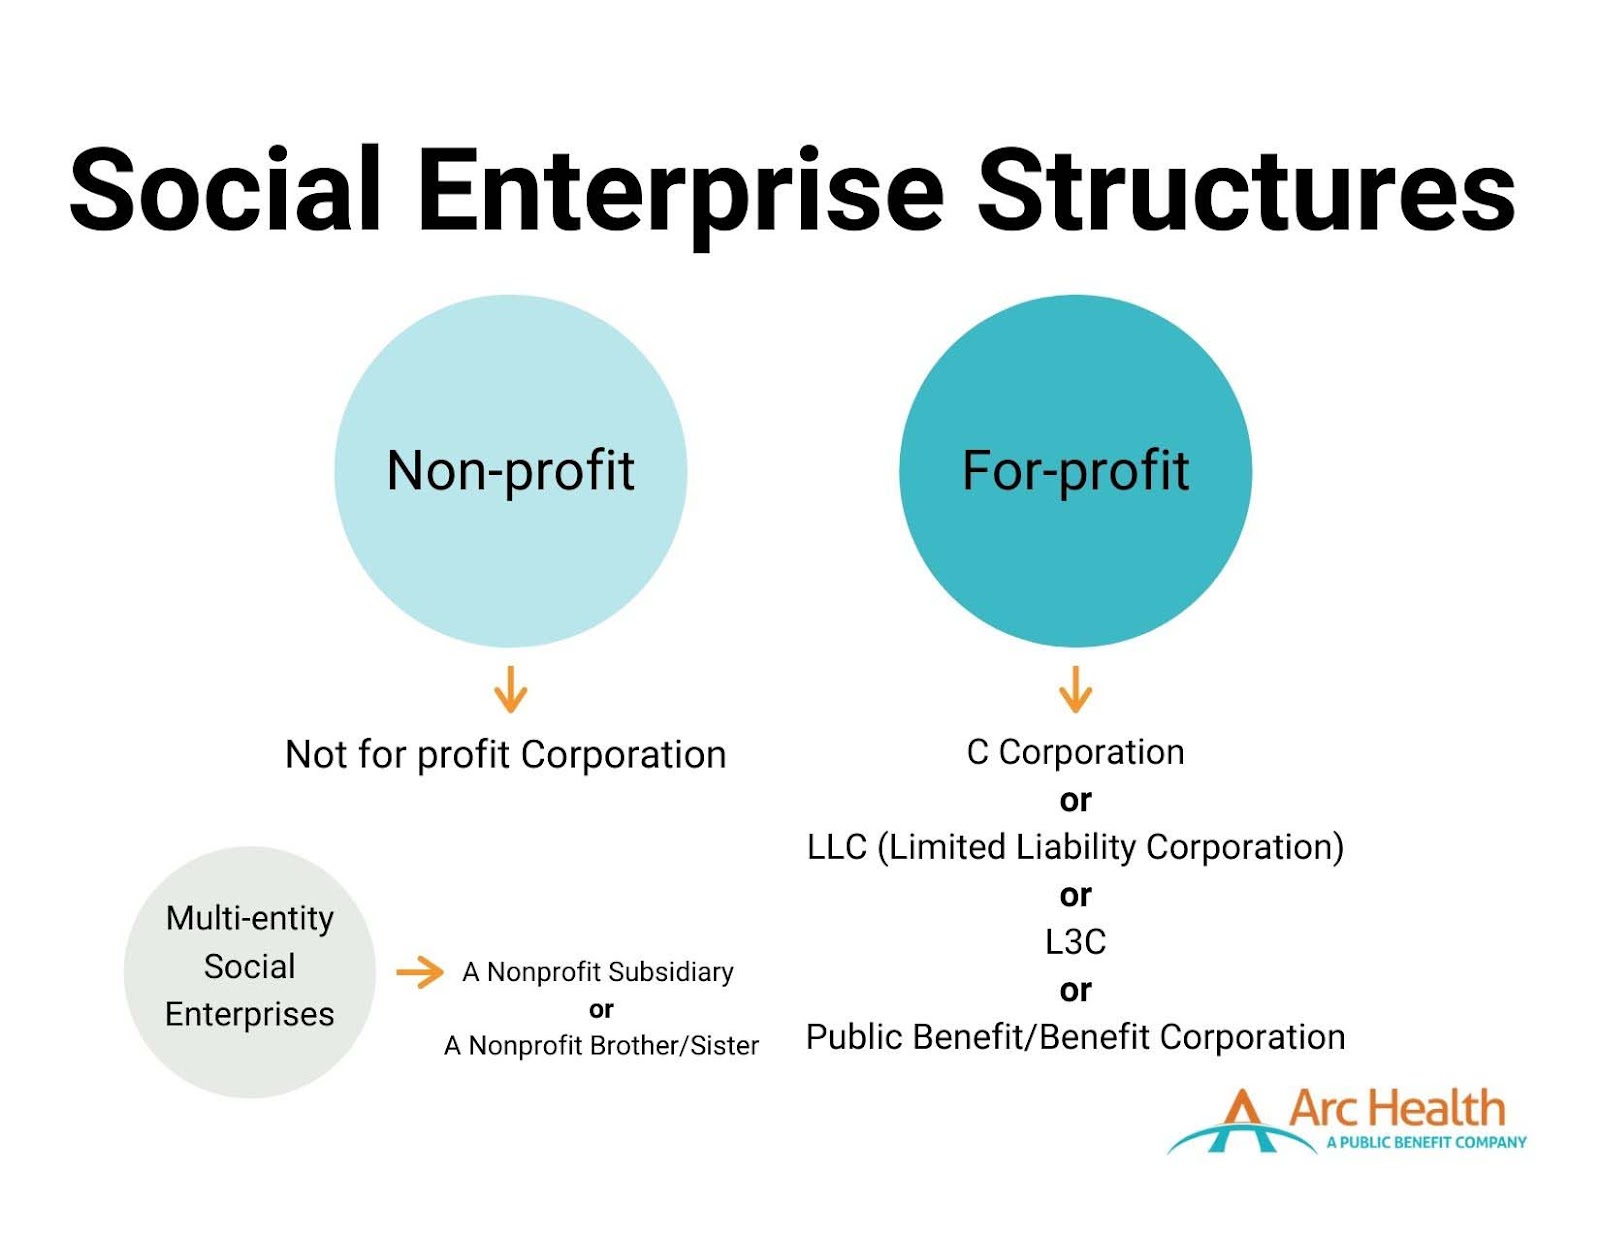
Two primary structures fall under the social enterprise umbrella: nonprofits and for-profit organizations. There are also related entities within both structures that could be considered social enterprises. Any of these listed structures can be regarded as a social enterprise depending on if and how involved they are with socially beneficial programs.

What is a Public Benefit Corporation?

Public Benefit Corporations (PBCs), also known as benefit corporations, are “for-profit companies that balance maximizing value to stakeholders with a legally binding commitment to a social or environmental mission.” PBCs operate as for-profit entities with no tax advantages or exemptions. Still, they must have a “purpose of creating general public benefit,” such as promoting the arts or science, preserving the environment, or providing benefits to underserved communities. PBCs must attain a higher degree of corporate purpose, expanded accountability, and expected transparency. 

There are now  over 3,000 registered PBCs, comprising approximately 0.1% of American businesses.

 As a PBC, Arc Health expects to access capital through individual investors who seek financial returns, rather than through donations. Arc Health’s investors make investments with a clear understanding of the balance the company must strike between financial returns (I.e., profitability) and social purpose. Therefore, investors expect the company to be operationally profitable to ensure a financial return on their investments, while also making clear to all stakeholders and the public that generating social impact is the priority. 

What is the difference between a Social Enterprise and PBC?

Social enterprises and PBCs emulate similar ideals that value the importance and need to invoke social change vis-a-vis working in a market-driven industry. Public benefit corporations fall under the social enterprise umbrella. An organization may choose to use a social enterprise model and incorporate itself as either a not-for-profit, C-Corp, PBC, or other corporate structure.  

How did Arc Health Become a Public Benefit Corporation?

Arc Health was initially formed as a C-Corp. In 2019, Arc Health’s CEO and Co-Founder, Dave Shaffer, guided the conversion from a C-Corp to a PBC, incorporated in Delaware. Today, Arc Health follows guidelines and expectations for PBCs, including adhering to the State of Delaware’s requirements for PBCs. 

Why is Arc Health a Social Enterprise and Public Benefit Corporation?

Arc Health believes it is essential to commit ourselves to our mission and demonstrate our dedication through our actions. We work to adhere to the core values of accountability, transparency, and purpose. As a registered public benefit company and a social enterprise, we execute our drive to achieve health equity in tangible and effective ways that the communities we work with, our stakeholders, and our providers expect of us.  

90% of Americans say that companies must not only say a product or service is beneficial, but they also need to prove its benefit.

When we partner with health clinics and hospitals, we aim to provide services that enact lasting change. For example, we work with healthcare providers who desire to contribute both clinical and non-clinical skills. In 2020, Arc Health clinicians developed COVID-19 response protocols and educational materials about the vaccines. They participated in pain management working groups. They identified and followed up with kids in the community who were overdue for a well-child check. Arc Health providers should be driven by a desire to develop a long-term relationship with a healthcare service provider and participate in its successes and challenges.   

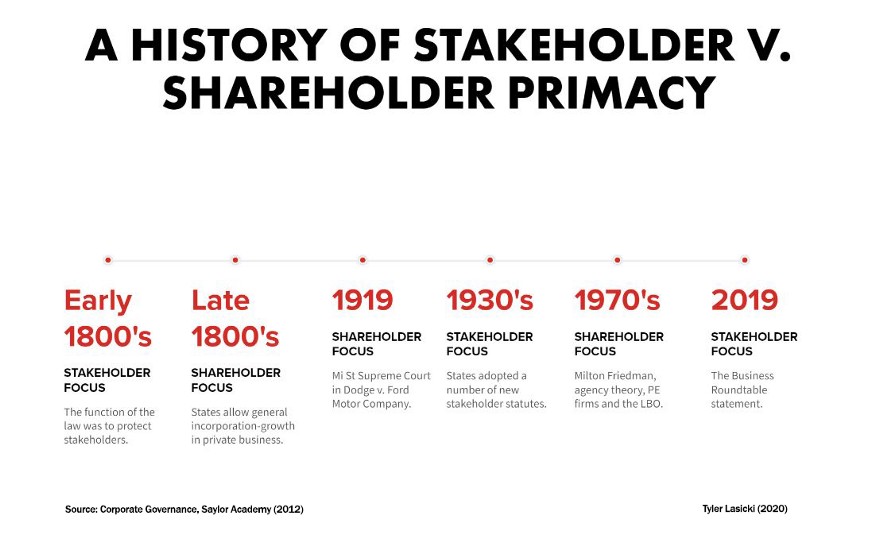
Paradigm Shift in the 1980’s: Companies Start to Emphasize Shareholders Over Stakeholders

So earlier in this post we had mentioned about a shift in philosophy at the corporate boardroom that affected how comparate thought, value, and responsibility: Companies in the 1980s started to shift their focus and value only the needs of corporate ShAREHOLDERS at the expense of their  traditional STAKEHOLDERS (customers, clients).  Many movies and books have been written on this and debatable if deliberate or a by-product of M&A, hostile takeovers, and the stock market in general but the effect was that the consumer was relegated as having less value, even though marketing budgets are very high.  The fiduciary responsibility of the executive was now defined in terms of satisfying shareholders, who were now  big huge and powerful brokerage houses, private equity, and hedge funds.  A good explanation by Medium.com Tyler Lasicki is given below.

From the Medium.com

Source: https://medium.com/swlh/the-shareholder-v-stakeholder-contrast-a-brief-history-c5a6cfcaa111

The Shareholder V. Stakeholder Contrast, a Brief History

Tyler Lasicki

Follow

May 26, 2020 · 14 min read

Introduction

In a famous 1970 New York Times Article, Milton Friedman postulated that the CEO, as an employee of the shareholder, must strive to provide the highest possible return for all shareholders. Since that article, the United States has embraced this idea as the fundamental philosophy supporting the ultimate purpose of businesses — The Shareholders Come First.

In August of 2019, the Business Roundtable, a group made up of the most influential U.S CEOs, published a letter shifting their stance on the purpose of a corporation. Regardless of whether this piece of paper will actually result in any systematic changes has yet to be seen, however this newly stated purpose of business is a dramatic shift from the position Milton Friedman took in 1970. According to the statement, these corporations will no longer prioritize maximizing profits for shareholders, but instead turn their focus to benefiting all stakeholders — including citizens, customers, suppliers, employees, on par with shareholders. 

Now the social responsibility of a company and the CEO was to maxiimize the profits even at the expense of any previous social responsibility they once had.

Small sample of the 181 Signatures attached to the Business Roundtable’s letter

What has happened over the past 50 years that has led to such a fundamental change in ideology? What has happened to make the CEO’s of America’s largest corporations suddenly change their stance on such a foundational principle of what it means to be an American business?

Since diving into this subject, I have come to find that the “American fundamental principle” of putting shareholders first is one that is actually not all that fundamental. In fact, for a large portion of our nation’s history this ideology was actually seen as the unpopular position.

Key ideological shifts in U.S. history

This post dives into a brief history of these two contrasting ideological viewpoints in an attempt to contextualize the forces behind both sides — specifically, the most recent shift (1970–2019). This basic idea of what is most important; the stakeholder or the shareholder, is the underlying reason as to why many things are the way they are today. A corporation’s priority of shareholder or stakeholder ultimately impacts employee salaries, benefits, quality of life within communities, environmental conditions, even the access to education children can receive. It affects our lives in a breadth and depth of ways and now that corporations may be changing positions (yet again) to focus on a model that prioritizes the stakeholder, it is important to understand why.

Looking forward, if stakeholder priority ends up being the popular position among American businesses, how long will it last for? What could lead to its downfall? And what will managers do to ensure a long term stakeholder-friendly business model?

It is clear to me the reasons that have led to these shifts in ideology are rather nuanced, however I want to highlight a few trends that have had a major impact on businesses changing their priorities while also providing context as to why things have shifted.

The Ascendancy of Shareholder Value

Following the 1929 stock market crash and the Great Depression, stakeholder primacy became the popular perspective within corporate America. Stakeholder primacy is the idea that corporations are to consider a wider group of interested parties (not just shareholders) whose positions need to be taken into consideration by corporate governance. According to this point of view, rather than solely being an agent for shareholders, management’s responsibilities were to be dispersed among all of its constituencies, even if it meant a reduction in shareholder value. This ideology lasted as the dominant position for roughly 40 years, in part due to public opinion and strong views on corporate responsibility, but also through state adoption of stakeholder laws.

By the mid-1970s, falling corporate profitability and stagnant share prices had been the norm for a decade. This poor economic performance influenced a growing concern in the U.S. regarding the perceived divergence between manager and shareholder interest. Many held the position that profits and share prices were suffering as a result of corporation’s increased attention on stakeholder groups.

This noticeable divergence in interests sparked many academics to focus their research on corporate management’s motivations in decision making regarding their allocation of resources. This branch of research would later be known as agency theory, which focused on the relationship between principals (shareholders) and their agents (management). Research at the time outlined how over the previous decades corporate management had pursued strategies that were not likely to optimize resources from a shareholder’s perspective. These findings were part of a seismic shift of corporate philosophy, changing priority from the stakeholders of a business to the shareholders.

By 1982, the U.S. economy started to recover from a prolonged period of high inflation and low economic growth. This recovery acted as a catalyst for change in many industries, leaving many corporate management teams to struggle in response to these changes. Their business performance suffered as a result. These distressed businesses became targets for a group of new investors…private equity firms.

Now the paradigm shift had its biggest backer…. private equity!  And private equity care about ONE thing….. THEIR OWN SHARE VALUE and subsequently meaning corporate profit, which became the most important directive for the CEO.

So it is all hopeless now? Can there be a shift back to the good ‘ol days?  

Well some changes are taking place at top corporate levels which may help the stakeholders to have a voice at the table, as the following IRMagazine article states.

And once again this is being led by the Business Roundtable, the same Business Roundtable that proposed the shift back in the 1970s.

Andrew Holt

Andrew Holt

REPORTER

  •  
  •  
  •  

SHAREHOLDER VALUE

CORPORATE GOVERNANCE

Shift from shareholder value to stakeholder-focused model for top US firms

AUG 23, 2019

Business Roundtable reveals corporations to drop idea they function to serve shareholders only

Source: https://www.irmagazine.com/esg/shift-shareholder-value-stakeholder-focused-model-top-us-firms

Andrew Holt

Andrew Holt

REPORTER

n a major corporate shift, shareholder value is no longer the main objective of the US’ top company CEOs, according to the Business Roundtable, which instead emphasizes the ‘purpose of a corporation’ and a stakeholder-focused model.

The influential body – a group of chief executive officers from major US corporations – has stressed the idea of a corporation dropping the age-old notion that corporations function first and foremost to serve their shareholders and maximize profits.

Rather, the focus should be on investing in employees, delivering value to customers, dealing ethically with suppliers and supporting outside communities as the vanguard of American business, according to a Business Roundtable statement.

‘While each of our individual companies serves its own corporate purpose, we share a fundamental commitment to all of our stakeholders,’ reads the statement, signed by 181 CEOs. ‘We commit to deliver value to all of them, for the future success of our companies, our communities and our country.’

Gary LaBranche, president and CEO of NIRI, tells IR Magazine that this is part of a wider trend: ‘The redefinition of purpose from shareholder-focused to stakeholder-focused is not new to NIRI members. For example, a 2014 IR Update article by the late Professor Lynn Stout urges a more inclusive way of thinking about corporate purpose.’ 

NIRI has also addressed this concept at many venues, including the senior roundtable annual meeting and the NIRI Annual Conference, adds LaBranche. This trend was further seen in the NIRI policy statement on ESG disclosure, released in January this year. 

Analyzing the meaning of this change in more detail, LaBranche adds: ‘The statement is a revolutionary break with the Business Roundtable’s previous position that the purpose of the corporation is to create value for shareholders, which was a long-held position championed by Milton Friedman.

‘The challenge is that Friedman’s thought leadership helped to inspire the legal and regulatory regime that places wealth creation for shareholders as the ‘prime directive’ for corporate executives.

‘Thus, commentators like Mike Allen of Axios are quick to point out that some shareholders may actually use the new statement to accuse CEOs of worrying about things beyond increasing the value of their shares, which, Allen reminds us, is the CEOs’ fiduciary responsibility.

‘So while the new Business Roundtable statement reflects a much-needed rebalancing and modernization that speaks to the comprehensive responsibilities of corporate citizens, we can expect that some shareholders will push back on this more inclusive view of who should benefit from corporate efforts and the capital that makes it happen. The new statement may not mark the dawn of a new day, but it perhaps signals the twilight of the Friedman era.’

In a similarly reflective way, Jamie Dimon, chairman and CEO of JPMorgan Chase & Co and chairman of the Business Roundtable, says: ‘The American dream is alive, but fraying. Major employers are investing in their workers and communities because they know it is the only way to be successful over the long term. These modernized principles reflect the business community’s unwavering commitment to continue to push for an economy that serves all Americans.’

Note:  Mr Dimon has been very vocal for many years on corporate social responsibility, especially since the financial troubles of 2009.

Impact of New Regulatory Trends in M&A Deals

The following podcast from Pricewaterhouse Cooper Health Research Institute (called Next in Health) discusses some of the trends in healthcare M&A and is a great listen. However from 6:30 on the podcast discusses a new trend which is occuring in the healthcare company boardroom, which is this new focus on integrating companies that have proven ESG (or environmental, social, governance) functions within their organzations. As stated, doing an M&A deal with a company with strong ESG is looked favorably among regulators now.

Please click on the following link to hear a Google Podcast Next in Health episode

https://podcasts.google.com/feed/aHR0cHM6Ly9mZWVkcy5idXp6c3Byb3V0LmNvbS8xMjgyNjQ2LnJzcw?sa=X&ved=2ahUKEwil9sua2cf5AhUErXIEHaoTBQoQ9sEGegQIARAC


UPDATED 3/15/2023

Should There Be More Public Benefit Corporations in Health Care?

In a post by Heather Landi  in Fierce Healthcare entitled


Health tech unicorn Aledade recently announced that it made the strategic decision to become a public benefit corporation (PBC).


The company joins just a handful of others in healthcare that are structured this way.

So what exactly is a PBC, and why does it matter?

PBCs are a type of for-profit corporate entity that has also adopted a public benefit purpose and is currently authorized by 35 states and the District of Columbia. A PBC must consider the nonfinancial interests of its shareholders and other stakeholders when making decisions. As a public benefit corporation, companies have to weigh their social/environmental objectives alongside maximizing value for shareholders.


While PBC and B Corp. are often used interchangeably, they are not the same. A B Corp. is a certification provided to eligible companies by the nonprofit, B Lab. A PBC is an actual legal entity that bakes into its certificate of incorporation a “public benefit,” according to Rubicon Law Group.

“I don’t think that there is a trade-off between either you do things that are good for society or you make profits in your business.” —Farzad Mostashari, M.D.

PBCs also are required to provide a report to shareholders every two years that detail how well the company is achieving its overall public benefit objectives. In some states, the report must be assessed against a third-party standard and be made publicly available. Delaware PBCs are not required to report publicly or against a third-party standard.

Aledade launched in 2014 and uses data analytics to help independent doctors’ offices transition to value-based care models. The company currently partners with more than 1,000 independent primary care practices comprising over 11,000 physicians and has nearly 150 contracts covering more than 1.7 million patients and $17 billion in total healthcare spending. Last June, the company raised $123 million in a series E round, boosting its valuation to $3.1 billion.


In a blog post, Aledade CEO and co-founder Farzad Mostashari, M.D., explained the company’s reasoning behind the move and said the corporate structure of a PBC is “well suited to mission-oriented companies where alignment with stakeholders is a key driver of the business model.”

“Aledade’s public benefit purpose means that we must weigh the interests of our primary care practice partners, their patients, our employees, and those who bear the burden of rising health care costs, alongside those of our shareholders, when we make decisions,” Mostashari said in an interview. This duty extends to all significant board decisions, including decisions on whether to go public, to make acquisitions or to sell the company, he noted.

The PBC structure helps create alignment among stakeholders and build trust, he said. “I don’t think that there is a trade-off between either you do things that are good for society or you make profits in your business. That might be true for fee-for-service businesses. It’s not true for Aledade,” he said.

He added, “For businesses that are built on trust and alignment, not considering stakeholder benefits gets you neither social good nor profits. If you’re in a business like our business where it’s actually really important that everybody have faith and belief that you are doing what’s best for patients, that you are actually in it for the long-term for practices, that’s what makes us successful as a business.”

Mark Cuban Cost Plus Drugs, which launched in January 2022 to offer low-cost rivals to overpriced generic drugs, also is structured as a public benefit corporation. The company’s founder and CEO Alexander Oshmyansky started the company in 2015 as a nonprofit, according to a feature story in D Magazine. Through Y Combinator, investors told Oshmyansky that the nonprofit model wouldn’t be able to raise the needed funds. He then reworked the business model to a PBC and launched Osh’s Affordable Pharmaceuticals in 2018.

Some other companies that are biotech drug development companies that operate under the PBC model include

rural healthcare startup Homeward Health,

Perlara, the first biotech PBC,

Rarebase, also a biotech company,

Sage Health At-Home,

Savvy Cooperative, which is described as “the first and only patient-owned public benefit co-op,”

OWP Pharmaceuticals,

Medicaid-focused company Waymark and

Trial Library, a cancer precision medicine company.

The pros and cons
 

Even a traditional for-profit C corporation can work toward a public mission without becoming a PBC. But, in an industry like healthcare, too often the duty to maximize financial returns for shareholders or investors can be in conflict with what is best for patients, executives say.

“With a startup, it might limit the ability to sell their business to a larger company in the future because there might be some limitations on what the larger company could do with the organization.”—Jodi Daniel, a partner in Crowell & Moring’s Health Care Group

According to some healthcare experts, PBCs offer a promising alternative as a business model for healthcare companies by providing a “North Star” by which a company can navigate critical business decisions.

“I think it really helps to drive accountability,” Huang, Osmind’s chief executive, said. “I think that’s important, especially in healthcare where it’s easy sometimes to get misaligned with all the different stakeholders that are involved in the industry. We wanted to make sure we had something to be accountable to. Second, it’s ingrained in the culture. The third element of why it was so helpful for us from the beginning is just on focus and alignment. I think we can be much more clear and transparent about what we’re focused on, our values, how we try to use that transparently to influence our decisions and how we can build a business that really ties all of that together.”

In a Health Affairs article, medical researchers at Stanford, including Jimmy Qian, a co-founder of Osmind, laid out the case for why PBCs may simultaneously improve individual patient outcomes and collective benefit without sacrificing institutions’ financial stability.

PBCs are held legally accountable to a predefined public benefit, which, for hospitals, could involve delivering high-quality, affordable care to local populations. PBCs are required to produce annual benefits reports that are assessed against a third-party standard. “These reports could be used by regulatory agencies such as the Centers for Medicare and Medicaid Services (CMS) or local health authorities to evaluate whether the PBC is making progress toward its stated mission and respond accordingly,” the researchers wrote.

But are there any trade-offs?

Having a public benefit obligation could potentially “tie the hands” of board members who can’t just focus on profits and must focus on those dual responsibilities, noted Jodi Daniel, a partner in Crowell & Moring’s Health Care Group.

“Companies that transition to being a public benefit corporation are intentionally trying to ensure that that the company’s mission doesn’t get diminished over time because it’s in their charter. So it helps [the mission] to endure. But there are pros and cons to that. It is somewhat binding the future board members and executives to follow that mission,” she said.

Daniel said she has spoken with several healthcare companies recently that are weighing the possibility of transitioning to a PBC. “Companies often don’t want to necessarily limit their options in their decision-making in the future. With a startup, it might limit the ability to sell their business to a larger company in the future because there might be some limitations on what the larger company could do with the organization,” she said in an interview. 

By making decisions based on interests outside of financial ones, organizations may put themselves at a margin disadvantage as compared to pure for-profit players in the space, wrote Hospitalogy founder Blake Madden.

Faddis with Veeva said the company hasn’t seen any financial or performance trade-off as a result of operating as a PBC. He noted that the move has been good for recruiting, spurred more long-term conversations with customers and has been a source of new ideas.

“Prior to the conversion, you had employees who were thinking of new products or new functionality with the mindset of getting to be commercially successful,” Faddis said. “Now, you also have people thinking about it from the angle of, ‘Does it further one of our PBC purposes and then maybe it’s also going to be commercially successful?'”

Converting to a PBC also can be a tactic to build trust, Daniel noted, especially in healthcare, and that holds the potential to drive business. 

One factor that isn’t clear is whether there is sufficient oversight to hold these companies accountable to their stated public mission. Who checks to make sure companies are making progress toward their objectives to improve healthcare?

Osmind publishes its benefit corporation report on its website to make it available to the public even though it is not required to do so. “I think that really highlights the accountability piece of you need to tell the world or at least tell your shareholders how you’re really trying to uphold your public benefit,” Huang said.

Other related articles published on this Open Access Online Scientific Journal on Healthcare Issues include the following:

Opportunity Mapping of the E-Health Sector prior to COVID19 Outbreak
mHealth market growth in America, Europe, & APAC
Ethics Behind Genetic Testing in Breast Cancer: A Webinar by Laura Carfang of survivingbreastcancer.org
The Inequality and Health Disparity seen with the COVID-19 Pandemic Is Similar to Past Pandemics
Live Notes from @HarvardMed Bioethics: Authors Jerome Groopman, MD & Pamela Hartzband, MD, discuss Your Medical Mind
COVID-related financial losses at Mass General Brigham
Personalized Medicine, Omics, and Health Disparities in Cancer:  Can Personalized Medicine Help Reduce the Disparity Problem?

Read Full Post »

Global Tert-Amylbenzene Market Size by Application (Pharmaceuticals, Chemical Intermediaries, Batteries), Industry Analysis Report, Regional Outlook, Application Development Potential, Price Trend, Competitive Market Share & Forecast, 2020 – 2026

Published Date: Dec 2020  |  Report ID: GMI4883  |  Authors: Kunal Ahuja, Harneet Mehar

Report Format:  PDF   |   Pages: 140   |   Base Year: 2019

https://www.gminsights.com/toc/detail/tert-amylbenzene-market


Guest Authors: Kunal Ahuja, Harneet Mehar


From: Devesh Billore <devesh.b@gminsights.com>

Date: Tuesday, January 5, 2021 at 11:22 AM

To: “Aviva Lev-Ari, PhD, RN” <AvivaLev-Ari@alum.berkeley.edu>

Subject: RE: Editorial Inquiry For Exclusive Content on Tert-Amylbenzene Market


Hello,


Thanks for your response. Yes you can publish the TABLE of CONTENTS of Tert-Amylbenzene Market. Please provide report hyperlink also.


Report link: https://www.gminsights.com/industry-analysis/tert-amylbenzene-market


It would be great if you can share the URL of the article once you publish it on the website.

Regards,

Devesh Billore

Global Market Insights

E-mail:devesh.b@gminsights.com| Web: www.gminsights.com 


Report Content

Chapter 1   Methodology & Scope

1.1    Market definitions

1.2    Base estimates & calculations

1.3    Forecast calculations

1.4    Data Sources

1.4.1    Primary

1.4.2    Secondary

1.4.2.1    Paid Sources

1.4.2.2    Public Sources

Chapter 2   Executive Summary

2.1    Global Tert-Amylbenzene Industry 3600 synopsis, 2020-2026

2.1.1    Business trends

2.1.2    Regional trends

2.1.3    Application trends

Chapter 3   Global Tert-Amylbenzene Industry Insights

3.1    Industry segmentation

3.2    COVID-19 overview of the world economy

3.3    Industry ecosystem analysis

3.3.1    Distribution channel analysis

3.3.1.1    Distributors

3.3.1.2    Technology Providers

3.3.2    Vendor matrix

3.3.3    Impact of COVID-19 on industry value chain

3.4    Raw Material Analysis

3.4.1    Benzene

3.4.2    Tertiary Amylalcohol

3.4.3    Cumene

3.4.4    Propene

3.5    Regulatory landscape

3.5.1    U.S.

3.5.1.1    Toxic Substances Control Act (TSCA) Inventory

3.5.1.1.1    OSHA 1910.1200

3.5.2    Europe

3.5.2.1    REACH (EC 1907/2006)

3.5.3    Product purity certification analysis

3.6    Industry impact forces

3.6.1    Growth drivers

3.6.1.1    Rising demand from electronics industry

3.6.1.2    Pharmaceutical industry growth

3.6.2    Industry pitfalls & challenges

3.6.2.1    High health and environmental effects

3.7    Technology landscape

3.8    Innovation & Sustainability

3.9    Growth potential analysis, 2019

3.9.1    Emerging business models

3.9.1.1    Collaboration/Joint ventures

3.9.1.2    Distribution partnership

3.9.1.3    Digital platform

3.10    Cost structure analysis, 2019

3.11    Porter’s analysis

3.11.1    Bargaining power of suppliers

3.11.2    Bargaining power of buyers

3.11.3    Threat of new entrants

3.11.4    Threat of substitutes

3.12    Pricing Analysis, 2015-2026

3.12.1    North America

3.12.2    Europe

3.12.3    Asia Pacific

3.12.4    Latin America

3.12.5    Middle East & Africa

3.13    Competitive landscape, 2019

3.13.1    Company market share analysis, 2019

3.13.2    Strategy dashboard

3.13.3    List of potential customers/end-users

3.14    PESTEL analysis

3.15    Impact of COVID-19 on tert-amylbenzene demand, by application

3.15.1    Pharmaceuticals

3.15.2    Chemical Intermediates

3.15.3    Battery

Chapter 4   Global Tert-Amylbenzene Market, By Application

4.1    Key application trends

4.2    Pharmaceuticals

4.2.1    Global Tert-Amylbenzene market from pharmaceuticals application, 2015 – 2026

4.2.2    Global Tert-Amylbenzene market from pharmaceuticals application, by region, 2015 – 2026

4.3    Chemical intermediaries

4.3.1    Global Tert-Amylbenzene market from chemical intermediaries application, 2015 – 2026

4.3.2    Global Tert-Amylbenzene market from chemical intermediaries application, by region, 2015 – 2026

4.4    Batteries

4.4.1    Global Tert-Amylbenzene market from batteries application, 2015 – 2026

4.4.2    Global Tert-Amylbenzene market from batteries application, by region, 2015 – 2026

Chapter 5   Global Tert-Amylbenzene Market, By Region

5.1    Key regional trends

5.2    North America

5.2.1    North America Tert-Amylbenzene market, 2015 – 2026, (Tons) (USD Thousand)

5.2.2    North America Tert-Amylbenzene market, by application, 2015 – 2026, (Tons) (USD Thousand)

5.2.3    U.S.

5.2.3.1    U.S. Tert-Amylbenzene market, 2015 – 2026, (Tons) (USD Thousand)

5.2.3.2    U.S. Tert-Amylbenzene market, by application, 2015 – 2026, (Tons) (USD Thousand)

5.2.4    Canada

5.2.4.1    Canada Tert-Amylbenzene market, 2015 – 2026, (Tons) (USD Thousand)

5.2.4.2    Canada Tert-Amylbenzene market, by application, 2015 – 2026, (Tons) (USD Thousand)

5.2.5    Mexico

5.2.5.1    Mexico Tert-Amylbenzene market, 2015 – 2026, (Tons) (USD Thousand)

5.2.5.2    Mexico Tert-Amylbenzene market, by application, 2015 – 2026, (Tons) (USD Thousand)

5.3    Europe

5.3.1    Europe Tert-Amylbenzene market, 2015 – 2026, (Tons) (USD Thousand)

5.3.2    Europe Tert-Amylbenzene market, by application, 2015 – 2026, (Tons) (USD Thousand)

5.3.3    Germany

5.3.3.1    Germany Tert-Amylbenzene market, 2015 – 2026, (Tons) (USD Thousand)

5.3.3.2    Germany Tert-Amylbenzene market, by application, 2015 – 2026, (Tons) (USD Thousand)

5.3.4    UK

5.3.4.1    UK Tert-Amylbenzene market, 2015 – 2026, (Tons) (USD Thousand)

5.3.4.2    UK Tert-Amylbenzene market, by application, 2015 – 2026, (Tons) (USD Thousand)

5.3.5    France

5.3.5.1    France Tert-Amylbenzene market, 2015 – 2026, (Tons) (USD Thousand)

5.3.5.2    France Tert-Amylbenzene market, by application, 2015 – 2026, (Tons) (USD Thousand)

5.3.6    Italy

5.3.6.1    Italy Tert-Amylbenzene market, 2015 – 2026, (Tons) (USD Thousand)

5.3.6.2    Italy Tert-Amylbenzene market, by application, 2015 – 2026, (Tons) (USD Thousand)

5.3.7    Spain

5.3.7.1    Spain Tert-Amylbenzene market, 2015 – 2026, (Tons) (USD Thousand)

5.3.7.2    Spain Tert-Amylbenzene market, by application, 2015 – 2026, (Tons) (USD Thousand)

5.3.8    Russia

5.3.8.1    Russia Tert-Amylbenzene market, 2015 – 2026, (Tons) (USD Thousand)

5.3.8.2    Russia Tert-Amylbenzene market, by application, 2015 – 2026, (Tons) (USD Thousand)

5.4    Asia Pacific

5.4.1    Asia Pacific Tert-Amylbenzene market, 2015 – 2026, (Tons) (USD Thousand)

5.4.2    Asia Pacific Tert-Amylbenzene market, by application, 2015 – 2026, (Tons) (USD Thousand)

5.4.3    China

5.4.3.1    China Tert-Amylbenzene market, 2015 – 2026, (Tons) (USD Thousand)

5.4.3.2    China Tert-Amylbenzene market, by application, 2015 – 2026, (Tons) (USD Thousand)

5.4.4    India

5.4.4.1    India Tert-Amylbenzene market, 2015 – 2026, (Tons) (USD Thousand)

5.4.4.2    India Tert-Amylbenzene market, by application, 2015 – 2026, (Tons) (USD Thousand)

5.4.5    Japan

5.4.5.1    Japan Tert-Amylbenzene market, 2015 – 2026, (Tons) (USD Thousand)

5.4.5.2    Japan Tert-Amylbenzene market, by application, 2015 – 2026, (Tons) (USD Thousand)

5.4.6    South Korea

5.4.6.1    South Korea Tert-Amylbenzene market, 2015 – 2026, (Tons) (USD Thousand)

5.4.6.2    South Korea Tert-Amylbenzene market, by application, 2015 – 2026, (Tons) (USD Thousand)

5.4.7    Australia

5.4.7.1    Australia Tert-Amylbenzene market, 2015 – 2026, (Tons) (USD Thousand)

5.4.7.2    Australia Tert-Amylbenzene market, by application, 2015 – 2026, (Tons) (USD Thousand)

5.4.8    Malaysia

5.4.8.1    Malaysia Tert-Amylbenzene market, 2015 – 2026, (Tons) (USD Thousand)

5.4.8.2    Malaysia Tert-Amylbenzene market, by application, 2015 – 2026, (Tons) (USD Thousand)

5.5    LATAM

5.5.1    LATAM Tert-Amylbenzene market, 2015 – 2026, (Tons) (USD Thousand)

5.5.2    LATAM Tert-Amylbenzene market, by application, 2015 – 2026, (Tons) (USD Thousand)

5.5.3    Brazil

5.5.3.1    Brazil Tert-Amylbenzene market, 2015 – 2026, (Tons) (USD Thousand)

5.5.3.2    Brazil Tert-Amylbenzene market, by application, 2015 – 2026, (Tons) (USD Thousand)

5.6    MEA

5.6.1    MEA Tert-Amylbenzene market, 2015 – 2026, (Tons) (USD Thousand)

5.6.2    MEA Tert-Amylbenzene market, by application, 2015 – 2026, (Tons) (USD Thousand)

5.6.3    Saudi Arabia

5.6.3.1    Saudi Arabia Tert-Amylbenzene market, 2015 – 2026, (Tons) (USD Thousand)

5.6.3.2    Saudi Arabia Tert-Amylbenzene market, by application, 2015 – 2026, (Tons) (USD Thousand)

5.6.4    UAE

5.6.4.1    UAE Tert-Amylbenzene market, 2015 – 2026, (Tons) (USD Thousand)

5.6.4.2    UAE Tert-Amylbenzene market, by application, 2015 – 2026, (Tons) (USD Thousand)

5.6.5    South Africa

5.6.5.1    South Africa Tert-Amylbenzene market, 2015 – 2026, (Tons) (USD Thousand)

5.6.5.2    South Africa Tert-Amylbenzene market, by application, 2015 – 2026, (Tons) (USD Thousand)

Chapter 6   Company Profiles

6.1    Jiujiang Pro High Technology Materials Co., Ltd.

6.1.1    Business Overview

6.1.2    Financial Data

6.1.3    Product Landscape

6.1.4    Swot Analysis

6.2    Hunan Jinxi Chemical Co. Ltd.

6.2.1    Business Overview

6.2.2    Financial Data

6.2.3    Product Landscape

6.2.4    Swot Analysis

6.3    Zhenjiang Haitong Chemical industry Co., Ltd.

6.3.1    Business Overview

6.3.2    Financial Data

6.3.3    Product Landscape

6.3.4    Swot Analysis

6.4    Solvay

6.4.1    Business Overview

6.4.2    Financial Data

6.4.3    Product Landscape

6.4.4    Strategic Outlook

6.4.5    Swot Analysis

6.5    Sigma Aldrich

6.5.1    Business Overview

6.5.2    Financial Data

6.5.3    Product Landscape

6.5.4    Swot Analysis

6.6    Frontier Scientific, Inc.

6.6.1    Business Overview

6.6.2    Financial Data

6.6.3    Product Landscape

6.6.4    Swot Analysis

6.7    Alfa Chemistry

6.7.1    Business Overview

6.7.2    Financial Data

6.7.3    Product Landscape

6.7.4    Swot Analysis

6.8    TCI Chemical Trading

6.8.1    Business Overview

6.8.2    Financial Data

6.8.3    Product Landscape

6.8.4    Swot Analysis

6.9    Alfa Aesar (part of Thermo Fisher Scientific)

6.9.1    Business Overview

6.9.2    Financial Data

6.9.3    Product Landscape

6.9.4    Swot Analysis
Data Tables

TABLE 1      Global Tert-Amylbenzene market, 2015 – 2026, (Tons)  (USD Thousand)

TABLE 2      Global  Tert-Amylbenzene market volume, by region, 2015 – 2026 (Tons)

TABLE 3      Global  Tert-Amylbenzene market revenue, by region, 2015 – 2026 (USD thousand)

TABLE 4      Global  Tert-Amylbenzene market volume, by application, 2015 – 2026 (Tons)

TABLE 5      Global  Tert-Amylbenzene market revenue, by application, 2015 – 2026 (USD Thousand)

TABLE 6      Projections of GDP growth (%) in 2020 based on three scenarios

TABLE 7      Global tert amyl benzene distribution channel analysis

TABLE 8      Vendor matrix

TABLE 9      Purity of tert-amylbenzene offered by global companies

TABLE 10     Industry impact forces

TABLE 11     Cost elements

TABLE 12     List of potential customers/end-users

TABLE 13     Global  Tert-Amylbenzene demand, by region, 2015 – 2026 (Tons)

TABLE 14     Global  Tert-Amylbenzene supply, by region, 2015 – 2026 (Tons)

TABLE 15     Global  Tert-Amylbenzene  market from pharmaceuticals application, 2015 – 2026 (Tons)  (USD Thousand)

TABLE 16     Global  Tert-Amylbenzene market volume from pharmaceuticals application, by region, 2015 – 2026 (Tons)

TABLE 17     Global  Tert-Amylbenzene market revenue from pharmaceuticals application, by region, 2015 – 2026 (USD thousand)

TABLE 18     Global  Tert-Amylbenzene  market from chemical intermediaries application, 2015 – 2026 (Tons)  (USD Thousand)

TABLE 19     Global  Tert-Amylbenzene market volume from chemical intermediaries application, by region, 2015 – 2026 (Tons)

TABLE 20     Global  Tert-Amylbenzene market revenue from chemical intermediaries application, by region, 2015 – 2026 (USD thousand)

TABLE 21     Global  Tert-Amylbenzene  market from batteries application, 2015 – 2026 (Tons)  (USD Thousand)

TABLE 22     Global  Tert-Amylbenzene market volume from batteries application, by region, 2015 – 2026 (Tons)

TABLE 23     Global  Tert-Amylbenzene market revenue from batteries application, by region, 2015 – 2026 (USD thousand)

TABLE 24     North America Tert-Amylbenzene market, 2015 – 2026, (Tons)  (USD Thousand)

TABLE 25     North America  Tert-Amylbenzene market volume, by application, 2015 – 2026 (Tons)

TABLE 26     North America  Tert-Amylbenzene market revenue, by application, 2015 – 2026 (USD Thousand)

TABLE 27     U.S.  Tert-Amylbenzene market, 2015 – 2026, (Tons)  (USD Thousand)

TABLE 28     U.S.   Tert-Amylbenzene market volume, by application, 2015 – 2026 (Tons)

TABLE 29     U.S.   Tert-Amylbenzene market revenue, by application, 2015 – 2026 (USD Thousand)

TABLE 30     Canada   Tert-Amylbenzene market, 2015 – 2026, (Tons)  (USD Thousand)

TABLE 31     Canada    Tert-Amylbenzene market volume, by application, 2015 – 2026 (Tons)

TABLE 32     Canada Tert-Amylbenzene market revenue, by application, 2015 – 2026 (USD Thousand)

TABLE 33     Mexico Tert-Amylbenzene market, 2015 – 2026, (Tons)  (USD Thousand)

TABLE 34     Mexico  Tert-Amylbenzene market volume, by application, 2015 – 2026 (Tons)

TABLE 35     Mexico  Tert-Amylbenzene market revenue, by application, 2015 – 2026 (USD Thousand)

TABLE 36     Europe  Tert-Amylbenzene market, 2015 – 2026, (Tons)  (USD Thousand)

TABLE 37     Europe  Tert-Amylbenzene market volume, by application, 2015 – 2026 (Tons)

TABLE 38     Europe  Tert-Amylbenzene market revenue, by application, 2015 – 2026 (USD Thousand)

TABLE 39     Germany     Tert-Amylbenzene market, 2015 – 2026, (Tons)  (USD Thousand)

TABLE 40     Germany Tert-Amylbenzene market volume, by application, 2015 – 2026 (Tons)

TABLE 41     Germany Tert-Amylbenzene market revenue, by application, 2015 – 2026 (USD Thousand)

TABLE 42     UK   Tert-Amylbenzene market, 2015 – 2026, (Tons)  (USD Thousand)

TABLE 43     UK Tert-Amylbenzene market volume, by application, 2015 – 2026 (Tons)

TABLE 44     UK Tert-Amylbenzene market revenue, by application, 2015 – 2026 (USD Thousand)

TABLE 45     France     Tert-Amylbenzene market, 2015 – 2026, (Tons)  (USD Thousand)

TABLE 46     France Tert-Amylbenzene market volume, by application, 2015 – 2026 (Tons)

TABLE 47     France Tert-Amylbenzene market revenue, by application, 2015 – 2026 (USD Thousand)

TABLE 48     Italy Tert-Amylbenzene market, 2015 – 2026, (Tons)  (USD Thousand)

TABLE 49     Italy Tert-Amylbenzene  market volume, by application, 2015 – 2026 (Tons)

TABLE 50     Italy Tert-Amylbenzene  market revenue, by application, 2015 – 2026 (USD Thousand)

TABLE 51     Spain Tert-Amylbenzene market, 2015 – 2026, (Tons)  (USD Thousand)

TABLE 52     Spain Tert-Amylbenzene  market volume, by application, 2015 – 2026 (Tons)

TABLE 53     Spain Tert-Amylbenzene  market revenue, by application, 2015 – 2026 (USD Thousand)

TABLE 54     Russia Tert-Amylbenzene  market, 2015 – 2026, (Tons)  (USD Thousand)

TABLE 55     Russia  Tert-Amylbenzene  market volume, by application, 2015 – 2026 (Tons)

TABLE 56     Russia  Tert-Amylbenzene  market revenue, by application, 2015 – 2026 (USD Thousand)

TABLE 57     Asia Pacific  Tert-Amylbenzene market, 2015 – 2026, (Tons)  (USD Thousand)

TABLE 58     Asia Pacific   Tert-Amylbenzene market volume, by application, 2015 – 2026 (Tons)

TABLE 59     Asia Pacific   Tert-Amylbenzene market revenue, by application, 2015 – 2026 (USD Thousand)

TABLE 60     China Tert-Amylbenzene  market, 2015 – 2026, (Tons)  (USD Thousand)

TABLE 61     China  Tert-Amylbenzene  market volume, by application, 2015 – 2026 (Tons)

TABLE 62     China  Tert-Amylbenzene  market revenue, by application, 2015 – 2026 (USD Thousand)

TABLE 63     India  Tert-Amylbenzene  market, 2015 – 2026, (Tons)  (USD Thousand)

TABLE 64     India Tert-Amylbenzene market volume, by application, 2015 – 2026 (Tons)

TABLE 65     India Tert-Amylbenzene market revenue, by application, 2015 – 2026 (USD Thousand)

TABLE 66     Japan  Tert-Amylbenzene  market, 2015 – 2026, (Tons)  (USD Thousand)

TABLE 67     Japan Tert-Amylbenzene market volume, by application, 2015 – 2026 (Tons)

TABLE 68     Japan Tert-Amylbenzene market revenue, by application, 2015 – 2026 (USD Thousand)

TABLE 69     South Korea  Tert-Amylbenzene  market, 2015 – 2026, (Tons)  (USD Thousand)

TABLE 70     South Korea Tert-Amylbenzene market volume, by application, 2015 – 2026 (Tons)

TABLE 71     South Korea Tert-Amylbenzene market revenue, by application, 2015 – 2026 (USD Thousand)

TABLE 72     Australia  Tert-Amylbenzene  market, 2015 – 2026, (Tons)  (USD Thousand)

TABLE 73     Australia Tert-Amylbenzene market volume, by application, 2015 – 2026 (Tons)

TABLE 74     Australia Tert-Amylbenzene market revenue, by application, 2015 – 2026 (USD Thousand)

TABLE 75     Malaysia  Tert-Amylbenzene  market, 2015 – 2026, (Tons)  (USD Thousand)

TABLE 76     Malaysia Tert-Amylbenzene market volume, by application, 2015 – 2026 (Tons)

TABLE 77     Malaysia Tert-Amylbenzene market revenue, by application, 2015 – 2026 (USD Thousand)

TABLE 78     LATAM  Tert-Amylbenzene market, 2015 – 2026, (Tons)  (USD Thousand)

TABLE 79     LATAM   Tert-Amylbenzene market volume, by application, 2015 – 2026 (Tons)

TABLE 80     LATAM   Tert-Amylbenzene market revenue, by application, 2015 – 2026 (USD Thousand)

TABLE 81     Brazil  Tert-Amylbenzene  market, 2015 – 2026, (Tons)  (USD Thousand)

TABLE 82     Brazil Tert-Amylbenzene market volume, by application, 2015 – 2026 (Tons)

TABLE 83     Brazil Tert-Amylbenzene market revenue, by application, 2015 – 2026 (USD Thousand)

TABLE 84     MEA  Tert-Amylbenzene market, 2015 – 2026, (Tons)  (USD Thousand)

TABLE 85     MEA   Tert-Amylbenzene market volume, by application, 2015 – 2026 (Tons)

TABLE 86     MEA   Tert-Amylbenzene market revenue, by application, 2015 – 2026 (USD Thousand)

TABLE 87     Saudi Arabia  Tert-Amylbenzene  market, 2015 – 2026, (Tons)  (USD Thousand)

TABLE 88     Saudi Arabia Tert-Amylbenzene market volume, by application, 2015 – 2026 (Tons)

TABLE 89     Saudi Arabia Tert-Amylbenzene market revenue, by application, 2015 – 2026 (USD Thousand)

TABLE 90     UAE  Tert-Amylbenzene  market, 2015 – 2026, (Tons)  (USD Thousand)

TABLE 91     UAE Tert-Amylbenzene market volume, by application, 2015 – 2026 (Tons)

TABLE 92     UAE Tert-Amylbenzene market revenue, by application, 2015 – 2026 (USD Thousand)

TABLE 93     South Africa Tert-Amylbenzene market, 2015 – 2026, (Tons)  (USD Thousand)

TABLE 94     South Africa Tert-Amylbenzene market volume, by application, 2015 – 2026 (Tons)

TABLE 95     South Africa Tert-Amylbenzene market revenue, by application, 2015 – 2026 (USD Thousand)


Charts & Figures

FIG. 1     Global Tert-Amylbenzene industry 3600 synopsis

FIG. 2     Europe Pulp & Paper Industry Revenue, 2015 – 2019 (USD Billion)

FIG. 3     Confirmed COVID-19 cases in Europe, by cases, as of 30 November 2020 (Number of cases)

FIG. 4     Demand for Lithium-ion batteries from Electric Vehicles, 2015-2030 (Gwh)

FIG. 5     Industry segmentation

FIG. 6     Industry ecosystem analysis

FIG. 7     Global Benzene Production, 2015-2022, (Million Metric Tons)

FIG. 8     China Benzene Production Capacities, 2015-2025 (Million Metric Tons)

FIG. 9     U.S. Benzene Production, 2016-2019, (Thousand Metric Tons)

FIG. 10    Global Cumene Consumption, By Region, 2019, (%)

FIG. 11    U.S. Cumene Prices, 2017-2020, (USD/barrel)

FIG. 12    Global Propylene Production and Consumption, 2018, (Mn MT)

FIG. 13    U.S. Propene Demand, 2016-2019, (Mn MT)

FIG. 14    Consumer electronics revenue in Western Europe, Q4 2015 – Q1 2020 (USD Billion)

FIG. 15    Growth of the middle class population, by region,  2015 – 2030 (Million persons)

FIG. 16    Global pharmaceutical industry revenue, 2014-19, (USD Billion)

FIG. 17    Share of population aged 65 years and above in Europe, major countries, 2019, (%)

FIG. 18    Production Technique of Tert.-Amylbenzene

FIG. 19    Growth Potential Analysis, 2019

FIG. 20    Cost structure analysis, 2019

FIG. 21    Porter’s analysis

FIG. 22    Company market share analysis, 2019

FIG. 23    PESTEL analysis


Read Full Post »

Danny Bar-Zohar, MD –  New R&D Leader for new pipelines at Merck KGaA as Luciano Rossetti steps out

Reporter: Aviva Lev-Ari, PhD, RN


Danny Bar-Zohar, MD – A Pharmaceutical Executive Profile in R&D: Ex-Novastis, Ex-Teva

Experience

Education

SOURCE

https://www.linkedin.com/in/danny-bar-zohar-513904a/


Novartis vet Danny Bar-Zohar leaps back into R&D, taking over the development team at Merck KGaA as Luciano Rossetti steps out

John Carroll
Editor & Founder

After a brief stint as a biotech investor at Syncona, Novartis vet Danny Bar-Zohar is back in R&D, and he’s taking the lead position at Merck KGaA’s drug division.

Bar-Zohar had led late-stage clinical development across a variety of areas — neuroscience, immunology, oncology and ophthalmology, among others — before joining the migration of talent out of the Basel-based multinational. He had been at Novartis for 7 years, which followed an earlier chapter in research at Teva.

Luciano Rossetti
The scientist is taking the lead on development at Merck KGaA, in place of Luciano Rossetti, who had a mixed record in R&D that nevertheless marked a big improvement over the dismal run the company had endured earlier. Joern-Peter Halle will continue on as global head of research. Rossetti is retiring after 6 years of running the research group, which has extensive operations in Germany as well as Massachusetts.

Their PD-L1 Bavencio — allied with Pfizer — has had a few successes, and a whole slate of failures. Sprifermin was touted as a big potential advance in osteoarthritis, but Merck KGaA is now auctioning off that part of the portfolio. One of the few late-stage bright spots has been their MET inhibitor tepotinib, which won breakthrough status and now is under priority review. That drug faces a rival at Novartis — capmatinib — that won an accelerated OK at the FDA in May.

advertisement

advertisement
There’s also a BTK inhibitor, evobrutinib, that’s being developed for MS. But that’s a very crowded field, and Sanofi has been bullish about its prospects in the same research niche after buying out Principia.

Moving back into mid-stage development, there’s a major program underway for bintrafusp alfa, a bifunctional fusion protein targeting TGF-β and PD-L1, which Merck KGaA has high hopes for.

That all marks some bright, though limited, prospects for Merck KGaA, highlighting the need to find something new to beef up the pipeline. Bar-Zohar will get a say in that.

AUTHOR
John Carroll

SOURCE

https://endpts.com/novartis-vet-danny-bar-zohar-leaps-back-into-rd-taking-over-the-team-at-merck-kgaa-as-luciano-rossetti-steps-out/

Read Full Post »

CAR T-CELL THERAPY MARKET: 2020 – 2027

G L O B A L  M A R K E T  A N A L Y S I S  A N D

I N D U S T R Y  F O R E C A S T


DISCLAIMER

LPBI Group’s decision to publish the Table of Contents of this Report does not imply endorsement of the Report

Aviva Lev-Ari, PhD, RN, Founder 1.0 & 2.0 LPBI Group

Guest Reporter: MIKE WOOD

Marketing Executive
BIOTECH FORECASTS


ABOUT BIOTECH FORECASTS

BIOTECH FORECASTS is a full-service market research and business- consulting firm primarily focusing on healthcare, pharmaceutical, and biotechnology industries. BIOTECH FORECASTS provides global as well as medium and small Pharmaceutical and Biotechnology businesses with unmatched quality of “Market Research Reports” and “Business Intelligence Solutions”. BIOTECH FORECASTS has a targeted view to provide business insights and consulting to assist its clients to make strategic business decisions, and achieve sustainable growth in their respective market domain.

UPDATED on 10/13/2020

CAR T-CELL THERAPY MARKET

Mike Wood

Mike Wood

Marketing Executive at Biotech Forecasts

CAR T-cell therapy as a part of adoptive cell therapy (ACT), has become one of the most rapidly growing and promising fields in the Immuno-oncology. As compared to the conventional cancer therapies, CAR T-cell therapy is the single-dose solution for the treatment of various cancers, significantly for some lethal forms of hematological malignancies.

CAR T-cell therapy mainly involves the use of engineered T-cells, the process starts with the extraction of T-cells through leukapheresis, either from the patient (autologous) or a healthy donor (allogeneic). After the expression of a synthetic receptor (Chimeric Antigen Receptor) in the lab, the altered T-cells are expanded to the right dose and administered into the patient’s body. where they target and attach to a specific antigen on the tumor surface, to kill the cancerous cells by igniting the apoptosis.

The global CAR T-cell therapy market was valued at $734 million in 2019 and is estimated to reach $4,078 million by 2027, registering a CAGR of 23.91% from 2020 to 2027.

Factors that drive the market growth involve, (1) Increased in funding for R&D activities pertaining to cell and gene therapy. By H1 2020 cell and gene therapy companies set new records in the fundraising despite the pandemic crisis. For Instance, by June 2020 totaled $1,452 Million raised in Five IPOs including, Legend Biotech ($487M), Passage Bio ($284M), Akouos ($244M), Generation Bio ($230M), and Beam Therapeutics ($207M), which is 2.5 times the total IPO of 2019.

Moreover, in 2019 cell therapy companies specifically have raised $560 million of venture capital, including Century Therapeutics ($250M), Achilles Therapeutics Ltd. ($121M in series B), NKarta Therapeutics Inc. ($114M), and Tmunity Therapeutics ($75M in Series B).

(2) Increased in No. of Approved Products, By July 2020, there are a total of 03 approved CAR T-cell therapy products, including KYMRIAH®, YESCARTA®, and the most recently approved TECARTUS™ (formerly KTE-X19). Furthermore, two CAR T-cell therapies BB2121, and JCAR017 are expected to get the market approval by the end of 2020 or in early 2021.

Other factors that boost the market growth involves; (3) increase in government support, (4) ethical acceptance of Cell and Gene therapy for cancer treatment, (5) rise in the prevalence of cancer, and (6) an increase in awareness regarding the CAR T-cell therapy.

However, high costs associated with the treatment (KYMRIAH® cost around $475,000, and YESCARTA® costs $373,000 per infusion), long production hours, obstacles in treating solid tumors, and unwanted immune responses & potential side effects might hamper the market growth.

The report also presents a detailed quantitative analysis of the current market trends and future estimations from 2020 to 2027.

The forecasts cover 2 Approach Types, 5 Antigen Types, 5 Application Types, 4 Regions, and 14 Countries.

The report comes with an associated file covering quantitative data from all numeric forecasts presented in the report, as well as with a Clinical Trials Data File.

KEY FINDINGS

The report has the following key findings:

  • The global CAR T-cell therapy market accounted for $734 million in 2019 and is estimated to reach $4,078 million by 2027, registering a CAGR of 23.91% from 2020 to 2027.
  • By approach type the autologous segment was valued at $655.26 million in 2019 and is estimated to reach $ 3,324.52 million by 2027, registering a CAGR of 22.51% from 2020 to 2027.
  • By approach type, the allogeneic segment exhibits the highest CAGR of 32.63%.
  • Based on the Antigen segment CD19 was the largest contributor among the other segments in 2019.
  • The Acute lymphocytic leukemia (ALL) segment generated the highest revenue and is expected to continue its dominance in the future, followed by the Diffuse large B-cell lymphoma (DLBCL) segment.
  • North America dominated the global CAR T-cell therapy market in 2019 and is projected to continue its dominance in the future.
  • China is expected to grow the highest in the Asia-Pacific region during the forecast period.

TOPICS COVERED

The report covers the following topics:

  • Market Drivers, Restraints, and Opportunities
  • Porters Five Forces Analysis
  • CAR T-Cell Structure, Generations, Manufacturing, and Pricing Models
  • Top Winning Strategies, Top Investment Pockets
  • Analysis of by Approach Type, Antigen Type, Application, and Region
  • 51 Company Profiles, Product Portfolio, and Key Strategies
  • Approved Products Profiles, and list of Expected Approvals
  • COVID-19 Impact on the Cell and Gene Therapy Industry
  • CAR T-cell therapy clinical trials analysis from 1997 to 2019
  • Market analysis and forecasts from 2020 to 2027

FORECAST SEGMENTATION

By Approach Type

  • Autologous
  • Allogeneic

By Antigen Type

  • CD19
  • CD20
  • BCMA
  • MSLN
  • Others

By Application

  • Acute lymphoblastic leukemia (ALL)
  • Diffuse large B-Cell lymphoma (DLBCL)
  • Multiple Myeloma (MM)
  • Acute Myeloid Leukemia (AML)
  • Other Cancer Indications

By Region

  • North America: USA, Canada, Mexico
  • Europe: UK, Germany, France, Spain, Italy, Rest of Europe
  • Asia-Pacific: China, Japan, India, South Korea, Rest of Asia-Pacific
  • LAMEA: Brazil, South Africa, Rest of LAMEA

Contact at info@biotechforecasts.com for any Queries or Free Report Sample

Report this

Published by

Mike Wood
Marketing Executive at Biotech Forecasts
1 article
The global CAR T-cell therapy market was valued at $734 million in 2019 and is estimated to reach $4,078 million by 2027, registering a CAGR of 23.91% from 2020 to 2027. hashtagcelltherapy hashtaggenetherapy hashtagimmunotherapy hashtagcancertreatment hashtagcartcell hashtagregenerativemedicine hashtagbiotech hashtagcancer


Table of Contents


CHAPTER 1: INTRODUCTION

1.1 REPORT DESCRIPTION 17
1.2 TOPICS COVERED 19
1.3 KEY MARKET SEGMENTS 20
1.4 KEY BENEFITS 21
1.5 RESEARCH METHODOLOGY 21
1.6 TARGET AUDIENCE 22
1.7 COMPANIES MENTIONED 23

CHAPTER 2: EXECUTIVE SUMMARY

2.1 EXECUTIVE SUMMARY 26
2.2 CXO PROSPECTIVE 29

CHAPTER 3: MARKET OVERVIEW

3.1 MARKET DEFINITION AND SCOPE 30
3.2 KEY FINDINGS 31
3.3 TOP INVESTMENT POCKETS 32
3.4 TOP WINNING STRATEGIES 33
3.4.1.Top winning strategies, by year, 2017-2019* 34
3.4.2.Top winning strategies, by development, 2017-2019*(%) 34
3.4.3.Top winning strategies, by company, 2017-2019* 35
3.5 TOP PLAYER POSITIONING, BY PIPELINE VOLUME, 2019 38
3.6 PORTERS FIVE FORCES ANALYSIS 39
3.7 COVID19 IMPACT ON CELL AND GENE THERAPY (CGT) INDUSTRY 41
3.8 MARKET DYNAMICS 46
3.8.1    Drivers 46
3.8.1.1   Increase in funding for R&D activities of CAR T-cell therapy 46
3.8.1.2   The rise in the prevalence of cancer 47
3.8.1.3   Increase in awareness regarding CAR T-cell therapy 47


3.8.2    Restrains 48
3.8.2.1   The high cost of CAR T-cell therapy treatment 48
3.8.2.2   Unwanted immune responses and side effects 48
3.8.2.3   Long production time 48
3.8.2.4   Obstacles in treating solid tumors 49
3.8.3    Opportunities 49
3.8.3.1   Untapped potential for emerging markets 49

CHAPTER 4: CAR T-CELL THERAPY, A BRIEF INTRODUCTION

4.1 OVERVIEW 50
4.2 SIXTY YEARS HISTORY OF CAR T-CELL THERAPY 51
4.3 CAR T-CELL STRUCTURE AND GENERATIONS 53
4.4 CAR T-CELL MANUFACTURING PROCESSES 56
4.5 PRICING AND PAYMENT MODELS FOR CAR T-CELL THERAPIES 59

CHAPTER 5: CAR T-CELL THERAPY MARKET, BY APPROACH TYPE

5.1 OVERVIEW 61
5.1.1    Market size and forecast 62
5.2 AUTOLOGOUS 63
5.2.1    Key market trends 63
5.2.2    Key growth factors and opportunities 64
5.2.3    Market size and forecast 64
5.2.4    Market size and forecast by country 65
5.3 ALLOGENEIC 66
5.3.1    Key market trends 67
5.3.2    Key growth factors and opportunities 68
5.3.3    Market size and forecast 68
5.3.4    Market size and forecast by country 69

CHAPTER 6: CAR T-CELL THERAPY MARKET, BY ANTIGEN TYPE

6.1 OVERVIEW 70
6.1.1         Market size and forecast 71
6.2 CD19 72
6.2.1         Market size and forecast 73
6.2.2         Market size and forecast by country 74


6.3 CD20 75
6.3.1 Market size and forecast 76
6.3.2 Market size and forecast by country 77
6.4 BCMA 78
6.4.1 Market size and forecast 79
6.4.2 Market size and forecast by country 80
6.5 MSLN 81
6.5.1 Market size and forecast 82
6.5.2 Market size and forecast by country 83
6.6 OTHERS 84
6.6.1 Market size and forecast 85
6.6.2 Market size and forecast by country 86

CHAPTER 7: CAR T-CELL THERAPY MARKET, BY APPLICATION

7.1 OVERVIEW 87
7.1.1       Market size and forecast 88
7.2 ACUTE LYMPHOBLASTIC LEUKEMIA (ALL) 89
7.2.1       Market size and forecast 90
7.2.2       Market size and forecast by country 91
7.3 DIFFUSE LARGE B-CELL LYMPHOMA (DLBCL) 92
7.3.1       Market size and forecast 93
7.3.2       Market size and forecast by country 94
7.4 MULTIPLE MYELOMA (MM) 95
7.4.1       Market size and forecast 96
7.4.2       Market size and forecast by country 97
7.5 ACUTE MYELOID LEUKEMIA (AML) 98
7.5.1       Market size and forecast 99
7.5.2       Market size and forecast by country 100
7.6 OTHERS 101
7.6.1       Market size and forecast 102
7.6.2       Market size and forecast by country 103

CHAPTER 8: CAR T-CELL THERAPY MARKET, BY REGION

8.1 OVERVIEW 104
8.1.1       Market size and forecast 104
8.2 NORTH AMERICA 105
8.2.1       Key market trends 105
8.2.2       Key growth factors and opportunities 105


8.2.3       Market size and forecast, by country 106
8.2.4       Market size and forecast, by approach type 106
8.2.5       Market size and forecast, by antigen type 107
8.2.6 Market size and forecast, by application 107
8.2.6.1 U.S. market size and forecast, by approach type 108
8.2.6.2 U.S. market size and forecast, by antigen type 108
8.2.6.3 U.S. market size and forecast, by application 109
8.2.6.4 Canada market size and forecast, by approach type 110
8.2.6.5 Canada market size and forecast, by antigen type 110
8.2.6.6 Canada market size and forecast, by application 111
8.2.6.7 Mexico market size and forecast, by approach type 112
8.2.6.8 Mexico market size and forecast, by antigen type 112
8.2.6.9 Mexico market size and forecast, by application 113
8.3 EUROPE 114
8.4.1 Key market trends 114
8.4.2 Key growth factors and opportunities 114
8.4.3 Market size and forecast, by country 115
8.4.4 Market size and forecast, by approach type 115
8.4.5 Market size and forecast, by antigen type 116
8.4.6 Market size and forecast, by application 116
8.3.6.1 UK market size and forecast, by approach type 117
8.3.6.2 UK market size and forecast, by antigen type 117
8.3.6.3 UK market size and forecast, by application 118
8.3.6.4 Germany market size and forecast, by approach type 119
8.3.6.5 Germany market size and forecast, by antigen type 119
8.3.6.6 Germany market size and forecast, by application 120
8.3.6.7 France market size and forecast, by approach type 121
8.3.6.8 France market size and forecast, by antigen type 121
8.3.6.9 France market size and forecast, by application 122
8.3.6.10 Spain market size and forecast, by approach type 123
8.3.6.11 Spain market size and forecast, by antigen type 123
8.3.6.12 Spain market size and forecast, by application 124
8.3.6.13 Italy market size and forecast, by approach type 125
8.3.6.14 Italy market size and forecast, by antigen type 125
8.3.6.15 Italy market size and forecast, by application 126
8.3.6.16 Rest of Europe market size and forecast, by approach type 127
8.3.6.17 Rest of Europe market size and forecast, by antigen type 127
8.3.6.18 Rest of Europe market size and forecast, by application 128
8.4 ASIA-PACIFIC 129
8.4.1 Key market trends 129
8.4.2 Key growth factors and opportunities 129
8.4.3 Market size and forecast, by country 130
8.4.4 Market size and forecast, by approach type 130


8.4.5       Market size and forecast, by antigen type 131
8.4.6 Market size and forecast, by application 131
8.4.6.1 China market size and forecast, by approach type 132
8.4.6.2 China market size and forecast, by antigen type 132
8.4.6.3 China market size and forecast, by application 133
8.4.6.4 Japan market size and forecast, by approach type 134
8.4.6.5 Japan market size and forecast by antigen type 134
8.4.6.6 Japan market size and forecast, by application 135
8.4.6.7 India market size and forecast, by approach type 136
8.4.6.8 India market size and forecast, by antigen type 136
8.4.6.9 India market size and forecast, by application 137
8.4.6.10 South Korea market size and forecast, by approach type 138
8.4.6.11 South Korea market size and forecast, by antigen type 138
8.4.6.12 South Korea market size and forecast, by application 139
8.4.6.13 Rest of Asia-Pacific market size and forecast, by approach type 140
8.4.6.14 Rest of Asia-Pacific market size and forecast, by antigen type 140
8.4.6.15 Rest of Asia-Pacific market size and forecast, by application 141
8.5 LAMEA 142
8.5.1 Key market trends 142
8.5.2 Key growth factors and opportunities 142
8.5.3 Market size and forecast, by country 143
8.5.4 Market size and forecast, by approach type 143
8.5.5 Market size and forecast, by antigen type 144
8.5.6 Market size and forecast, by application 144
8.5.6.1 Brazil market size and forecast by approach type 145
8.5.6.2 Brazil market size and forecast, by antigen type 145
8.5.6.3 Brazil market size and forecast, by application 146
8.5.6.4 South Africa market size and forecast, by approach type 147
8.5.6.5 South Africa market size and forecast, by antigen type 147
8.5.6.6 South Africa market size and forecast, by application 148
8.5.6.7 Rest of LAMEA market size and forecast by approach type 149
8.5.6.8 Rest of LAMEA market size and forecast, by antigen type 149
8.5.6.9 Rest of LAMEA market size and forecast, by application 150

CHAPTER 9: CLINICAL TRIALS ANALYSIS & PRODUCT PROFILES

9.1 OVERVIEW 151
9.1.1      No. of Clinical Trials from 1997 to 2019 151
9.1.2      Clinical Trials from 1997 to 2019: Based on Approach Type 152
9.1.3      Clinical Trials from 1997 to 2019: Based on Antigen Type 153
9.1.4      Clinical Trials from 1997 to 2019: Based on Application 154
9.1.5      Clinical Trials from 1997 to 2019: Based on Region 155


9.2 EXPECTED APPROVALS 156
9.3 APPROVED PRODUCTS PROFILES 157
9.3.1      KYMRIAH® 157
9.3.2      YESCARTA® 159
9.3.3      TECARTUS™ 161

CHAPTER 10: COMPANY PROFILES

10.1       Abbvie Inc. 162
10.2       Adaptimmune Therapeutics Plc 164
10.3 Allogene Therapeutics, Inc. 166
10.4 Amgen, Inc 168
10.5 Anixa Biosciences, Inc. 170
10.6 Arcellx, Inc. 172
10.7 Atara Biotherapeutics, Inc. 173
10.8 Autolus Therapeutics Plc. 175
10.9 Beam Therapeutics, Inc. 177
10.10 Bellicum Pharmaceuticals, Inc. 179
10.11 BioNtech SE 181
10.12 Bluebird Bio, Inc. 183
10.13 Carsgen Therapeutics, Ltd 185
10.14 Cartesian Therapeutics, Inc. 187
10.15 Cartherics Pty Ltd. 188
10.16 Celgene Corporation 189
10.17 Cellectis SA 191
10.18 Cellular Biomedicine Group, Inc. 193
10.19 Celularity, Inc. 195
10.20 Celyad SA 196
10.21 CRISPR Therapeutics AG 198
10.22 Eureka Therapeutics, Inc. 200
10.23 Fate Therapeutics, Inc. 201
10.24 Fortress Biotech, Inc 203
10.25 Gilead Sciences, Inc. 205
10.26 Gracell Biotechnology Ltd 207
10.27 icell Gene Therapeutics 208
10.28 Johnson & Johnson 209
10.29 Juventas Cell Therapy Ltd. 211
10.30 Kuur Therapeutics 212
10.31 Legend Biotech Corp. 213
10.32 Leucid Bio Ltd. 214
10.33 Minerva Biotechnologies Corp. 215


10.34     Molecular Medicine SPA (Molmed) 216
10.35     Nanjing Bioheng Biotech Co., Ltd. 218
10.36     Noile-Immune Biotech Inc. 219
10.37     Novartis AG 220
10.38     Oxford Biomedica PLC 222
10.39     Persongen Biotherapeutics (Suzhou) Co., Ltd. 224
10.40     Poseida Therapeutics, Inc. 226
10.41     Precigen, Inc. 227
10.42     Precision Biosciences, Inc. 229
10.43     Sorrento Therapeutics, Inc. 231
10.44     Takara Bio Inc. 233
10.45     Takeda Pharmaceutical Company Ltd. 235
10.46     TC Biopharm Ltd. 237
10.47     Tessa Therapeutics Pte Ltd. 238
10.48     Tmunity Therapeutics, Inc. 239
10.49     Unum Therapeutics Inc. 240
10.50     Xyphos Inc. 242
10.51     Ziopharm Oncology, Inc. 243

CHAPTER 11: CONCLUSION & STRATEGIC RECOMMENTATIONS

11.1     STRATEGIC RECOMMENDATIONS 245
11.2     CONCLUSION 247


CONTACT

info@biotechforecasts.com

MIKE WOOD

Marketing Executive

BIOTECH FORECASTS

Read Full Post »

Tweet Collection by @pharma_BI and @AVIVA1950 and Re-Tweets for e-Proceedings 14th Annual BioPharma &amp; Healthcare Summit, Friday, September 4, 2020, 8 AM EST to 3-30 PM EST – Virtual Edition

Reporter: Aviva Lev-Ari, PhD, RN

Real Time Press Coverage: Aviva Lev-Ari, PhD, RN


e-Proceedings 14th Annual BioPharma & Healthcare Summit, Friday, September 4, 2020, 8 AM EST to 3-30 PM EST – Virtual Edition

Real Time Press Coverage: Aviva Lev-Ari, PhD, RN

Founder & Director, LPBI Group

https://pharmaceuticalintelligence.com/2020/07/28/14th-annual-biopharma-healthcare-summit-friday-september-4-2020-8-am-est-to-3-30-pm-est-virtual-edition/


Aviva Lev-Ari
@AVIVA1950

#USAIC20 Dr. Hal Barron, Chief Scientific Officer and President R&D, GlaxoSmithKline GWAS not easy to find which gene drives the association  Functional Genomics gene by gene with phenotypes using machine learning significant help

Aviva Lev-Ari
@AVIVA1950

#USAIC20 Dr. Hal Barron, Chief Scientific Officer and President R&D, GSK GWAS not easy to find which gene drives the association  Functional Genomics gene by gene with phenotypes using machine learning significant help

Srihari Gopal
@sgopal2

Enjoyed hearing enthusiasm for Neuroscience R&D by Roy Vagelos at #USAIC20. Wonderful interview by Mathai Mammen

Image

1
2
Show this thread

Aviva Lev-Ari
@AVIVA1950

#USAIC20 Nina Kjellson, General Partner, Canaan Data science is a winner in Healthcare Women – Data Science is an excellent match

Aviva Lev-Ari
@AVIVA1950

#USAIC20 Arpa Garay, President, Global Pharmaceuticals, Commercial Analytics, Merck & Co. Data on Patients and identification who will benefit fro which therapy  cultural bias risk aversion

Aviva Lev-Ari
@AVIVA1950

#USAIC20 Dr. Najat Khan, Chief Operating Officer, Janssen R&D Data Sciences, Johnson & Johnson Data Validation  Deployment of algorithms embed data by type early on in the crisis to understand the disease

Aviva Lev-Ari
@AVIVA1950

#USAIC20 Sastry Chilukuri, President, Acorn AI- Medidata Opportunities in Data Science in Paharma COVID-19 and Data Science

Aviva Lev-Ari
@AVIVA1950

#USAIC20 Dr. Maya Said, Chief Executive Officer, Outcomes4Me Cancer patients taking change of their care Digital Health – consumerization of Health, patient demand to be part of the decision, part the information FDA launched a Program Project Patient Voice

USAIC
@USAIC

We’re taking a quick break at #USAIC20 before our next panel on rare diseases starts at 12:20pm EDT. USAIC would like to thank our Sponsors and Partners for supporting this year’s digital event.

Image

Aviva Lev-Ari
@AVIVA1950

#USAIC20 Dr. Roy Vagelos, Chairman of the Board, Regeneron HIV-AIDS: reverse transcriptase converted a lethal disease to a chronic disease, tried hard to make vaccine – the science was not there

Aviva Lev-Ari
@AVIVA1950

#USAIC20 Dr. Roy Vagelos, Chairman of the Board, Regeneron Pharmaceuticals Congratulates Big Pharma for taking the challenge on COVID-19 Vaccine, Antibody and anti-viral Government funding Merck was independent from Government – to be able to set the price

1

Dr Kapil Khambholja
@kapilmk

Christopher Viehbacher, Gurnet Point Capital touches very sensitive topic at #USAIC20 He claims that we are never going to have real innovation out of big pharma! Well this isn’t new but not entirely true either… any more thoughts?
1
1
Show this thread

Aviva Lev-Ari
@AVIVA1950

#USAIC20 Daphne Zohar, Founder & CEO, PureTech Health Disease focus, best science is the decision factors

1

Aviva Lev-Ari
@AVIVA1950

#USAIC20 Christopher Viehbacher, Managing Partner, Gurnet Point Capital Dream of every Biotech – get Big Pharma coming to acquire and pay a lot Morph and adapt

anju ghangurde
@scripanjug

Biogen’s chair Papadopoulos big co mergers is an attempt to solve problems; typically driven by patent expirations.. #usaic20

2

anju ghangurde
@scripanjug

Chris Viehbacher/Gurnet Point Capital on US election: industry will work with whoever wins; we’ll have to ‘morph & adapt’ #usaic20

1

Dr Kapil Khambholja
@kapilmk

of

talks about various philosophies and key reasons why certain projects/molecules are killed early. My counter questions- What are chances of losing hope little early? Do small #biopharma publish negative results to aid to the knowledge pool? #USAIC20

Image

2
2
Show this thread

Aviva Lev-Ari
@AVIVA1950

#USAIC20 Dr. Laurie Glimcher, President & CEO, Dana-Farber Cancer Institute DNA repair and epignetics are the future of medicine

Aviva Lev-Ari
@AVIVA1950

#USAIC20 Dr. Laurie Glimcher, President & CEO, Dana-Farber Cancer Institute COlonorectal cancer is increasing immuno therapy 5 drugs marketed 30% cancer patients are treated early detection key vs metastatic 10% of cancer are inherited treatment early

Aviva Lev-Ari
@AVIVA1950

#USAIC20 Rehan Verjee, President, EMD Serono Charities funding cancer research – were impacted and resources will come later and in decreased amount New opportunities support access to Medicine improve investment across the board

Aviva Lev-Ari
@AVIVA1950

#USAIC20 Dr. Philip Larsen, Global Head of Research, Bayer AG Repurposing drugs as antiviral from drug screening innovating methods Cytokine storm in OCVID-19 – kinase inhibitors may be antiviral data of tested positive allows research of pathway in new ways

Aviva Lev-Ari
@AVIVA1950

#USAIC20 Dr. Laurie Glimcher, President & CEO, Dana-Farber 3,000 Telemedicine session in the first week of the Pandemic vs 300 before – patient come back visits patient happy with Telemedicine team virtually need be reimbursed same rate working remotely

Aviva Lev-Ari
@AVIVA1950

#USAIC20 Dr. Raju Kucherlapati, Professor of Genetics, Harvard Medical School New normal as a result of the pandemic role of personalized medicine

Aviva Lev-Ari
@AVIVA1950

#USAIC20 Rehan Verjee, President, EMD Serono entire volume of clinical trials at Roche went down same at EMD delay of 6 month, some were to be initiated but was put on hold Charities funding cancer research were impacted and resources will come later smaller

Aviva Lev-Ari
@AVIVA1950

#USAIC20 Dr. Laurie Glimcher, President & CEO, Dana-Farber Cancer Institute Dana Farber saw impact of COVID-19 on immunosuppressed patients coming in for Cancer Tx – switch from IV Tx to Oral 96% decrease in screenings due to Pandemic – increase with Cancer

Aviva Lev-Ari
@AVIVA1950

#USAIC20 Kenneth Frazier, Chairman of the Board and Chief Executive Officer, Merck & Co. Pharma’s obligation for next generations requires investment in R&D vs Politicians running for 4 years Patients must come first vs shareholders vs R&D investment in 2011

Aviva Lev-Ari
@AVIVA1950

#USAIC20 Kenneth Frazier, Chairman of the Board and Chief Executive Officer, Merck & Co. Antibiotic research at Merck – no market incentives on pricing for Merck to invest in antibiotics people will die from bacterial resistance next pandemic be bacterial

Aviva Lev-Ari
@AVIVA1950

#USAIC20 Kenneth Frazier, Chairman of the Board and Chief Executive Officer, Merck & Co. Strategies of Merck = “Medicine is for the People not for Profit” – Ketruda in India is not reembureable in India and million are in need it Partnership are encouraged

Dr Kapil Khambholja
@kapilmk

Chairman Stelios Papadopoulos asks #KennethFrazier if wealthy nations will try to secure large proportion of #COVID19 drugs/vaccines. #KennethFrazie rightly mentions: pharma industry’s responsibility to balance the access to diff countries during pandemic. #USAIC20

1
3
Show this thread

Dr Kapil Khambholja
@kapilmk

Almost 60% participants at #USAIC20 feel that MNCs are more likely to run their #clinicalTrials in #INDIA seeing changing environment here, reveals the poll. Exciting time ahead for scientific fraternity as this can substantially increase the speed of #DrugDevelopment globally

Clapping hands sign

Image

1
1
Show this thread

Aviva Lev-Ari
@AVIVA1950

#USAIC20 Dr. Barry Bloom, Professor & former Dean, Harvard School of Public Health Vaccine in clinical trials, public need to return for 2nd shot, hesitancy Who will get the Vaccine first in the US  most vulnerable of those causing transmission Pharma’s risk

4

Aviva Lev-Ari
@AVIVA1950

#USAIC20 Dr. Barry Bloom, Professor & former Dean, Harvard School of Public Health Testing – PCR expensive does not enable quick testing is expensive result come transmission occurred Antibody testing CRISPR test based Vaccine in clinical trials

1

Aviva Lev-Ari
@AVIVA1950

#USAIC20 Dr Andrew Plump, President of R&D, Takeda Pharmaceuticals COllaboration effort around the Globe in the Pandemic therapy solutions including Vaccines

Read Full Post »

Did FDA Reverse Course on Convalescent Plasma Therapy for COVID-19?

Reporter: Stephen J. Williams, PhD


Starting with a timeline of recent announcements by the FDA on convalescent plasma therapy

April 16, 2020

FDA STATEMENT

Coronavirus (COVID-19) Update: FDA Encourages Recovered Patients to Donate Plasma for Development of Blood-Related Therapies


As part of the all-of-America approach to fighting the COVID-19 pandemic, the U.S. Food and Drug Administration has been working with partners across the U.S. government, academia and industry to expedite the development and availability of critical medical products to treat this novel virus. Today, we are providing an update on one potential treatment called convalescent plasma and encouraging those who have recovered from COVID-19 to donate plasma to help others fight this disease.

Convalescent plasma is an antibody-rich product made from blood donated by people who have recovered from the disease caused by the virus. Prior experience with respiratory viruses and limited data that have emerged from China suggest that convalescent plasma has the potential to lessen the severity or shorten the length of illness caused by COVID-19. It is important that we evaluate this potential therapy in the context of clinical trials, through expanded access, as well as facilitate emergency access for individual patients, as appropriate.

The response to the agency’s recently announced national efforts to facilitate the development of and access to convalescent plasma has been tremendous. More than 1,040 sites and 950 physician investigators nationwide have signed on to participate in the Mayo Clinic-led expanded access protocol. A number of clinical trials are also taking place to evaluate the safety and efficacy of convalescent plasma and the FDA has granted numerous single patient emergency investigational new drug (eIND) applications as well.

Source: https://www.fda.gov/news-events/press-announcements/coronavirus-covid-19-update-fda-encourages-recovered-patients-donate-plasma-development-blood

August 23, 2020


Recommendations for Investigational COVID-19 Convalescent Plasma


  • FDA issues guidelines on clinical trials and obtaining emergency enrollment concerning convalescent plasma

FDA has issued guidance to provide recommendations to health care providers and investigators on the administration and study of investigational convalescent plasma collected from individuals who have recovered from COVID-19 (COVID-19 convalescent plasma) during the public health emergency.

The guidance provides recommendations on the following:

Because COVID-19 convalescent plasma has not yet been approved for use by FDA, it is regulated as an investigational product.  A health care provider must participate in one of the pathways described below.  FDA does not collect COVID-19 convalescent plasma or provide COVID-19 convalescent plasma.  Health care providers or acute care facilities should instead obtain COVID-19 convalescent plasma from an FDA-registered blood establishment.

Excerpts from the guidance document are provided below.

Background

The Food and Drug Administration (FDA or Agency) plays a critical role in protecting the United States (U.S.) from threats including emerging infectious diseases, such as the Coronavirus Disease 2019 (COVID-19) pandemic.  FDA is committed to providing timely guidance to support response efforts to this pandemic.

One investigational treatment being explored for COVID-19 is the use of convalescent plasma collected from individuals who have recovered from COVID-19.  Convalescent plasma that contains antibodies to severe acute respiratory syndrome coronavirus 2 or SARS-CoV-2 (the virus that causes COVID-19) is being studied for administration to patients with COVID-19. Use of convalescent plasma has been studied in outbreaks of other respiratory infections, including the 2003 SARS-CoV-1 epidemic, the 2009-2010 H1N1 influenza virus pandemic, and the 2012 MERS-CoV epidemic.

Although promising, convalescent plasma has not yet been shown to be safe and effective as a treatment for COVID-19. Therefore, it is important to study the safety and efficacy of COVID-19 convalescent plasma in clinical trials.

Pathways for Use of Investigational COVID-19 Convalescent Plasma

The following pathways are available for administering or studying the use of COVID-19 convalescent plasma:

  1. Clinical Trials

Investigators wishing to study the use of convalescent plasma in a clinical trial should submit requests to FDA for investigational use under the traditional IND regulatory pathway (21 CFR Part 312). CBER’s Office of Blood Research and Review is committed to engaging with sponsors and reviewing such requests expeditiously. During the COVID-19 pandemic, INDs may be submitted via email to CBERDCC_eMailSub@fda.hhs.gov.

  1. Expanded Access

An IND application for expanded access is an alternative for use of COVID-19 convalescent plasma for patients with serious or immediately life-threatening COVID-19 disease who are not eligible or who are unable to participate in randomized clinical trials (21 CFR 312.305). FDA has worked with multiple federal partners and academia to open an expanded access protocol to facilitate access to COVID-19 convalescent plasma across the nation. Access to this investigational product may be available through participation of acute care facilities in an investigational expanded access protocol under an IND that is already in place.

Currently, the following protocol is in place: National Expanded Access Treatment Protocol

  1. Single Patient Emergency IND

Although participation in clinical trials or an expanded access program are ways for patients to obtain access to convalescent plasma, for various reasons these may not be readily available to all patients in potential need. Therefore, given the public health emergency that the COVID-19 pandemic presents, and while clinical trials are being conducted and a national expanded access protocol is available, FDA also is facilitating access to COVID-19 convalescent plasma for use in patients with serious or immediately life-threatening COVID-19 infections through the process of the patient’s physician requesting a single patient emergency IND (eIND) for the individual patient under 21 CFR 312.310. This process allows the use of an investigational drug for the treatment of an individual patient by a licensed physician upon FDA authorization, if the applicable regulatory criteria are met.  Note, in such case, a licensed physician seeking to administer COVID-19 convalescent plasma to an individual patient must request the eIND (see 21 CFR 312.310(b)).

To Obtain a Single Patient Emergency IND  

The requesting physician may contact FDA by completing Form FDA 3926 (https://www.fda.gov/media/98616/download) and submitting the form by email to CBER_eIND_Covid-19@FDA.HHS.gov.

FACT SHEET FOR PATIENTS AND PARENTS/CAREGIVERS EMERGENCY USE AUTHORIZATION (EUA) OF COVID-19 CONVALESCENT PLASMA FOR TREATMENT OF COVID-19 IN HOSPITALIZED PATIENTS

  • FDA issues fact sheet for patients on donating plasma

August 23, 2020


FDA Issues Emergency Use Authorization for Convalescent Plasma as Potential Promising COVID–19 Treatment, Another Achievement in Administration’s Fight Against Pandemic


Today, the U.S. Food and Drug Administration issued an emergency use authorization (EUA) for investigational convalescent plasma for the treatment of COVID-19 in hospitalized patients as part of the agency’s ongoing efforts to fight COVID-19. Based on scientific evidence available, the FDA concluded, as outlined in its decision memorandum, this product may be effective in treating COVID-19 and that the known and potential benefits of the product outweigh the known and potential risks of the product.

Today’s action follows the FDA’s extensive review of the science and data generated over the past several months stemming from efforts to facilitate emergency access to convalescent plasma for patients as clinical trials to definitively demonstrate safety and efficacy remain ongoing.

The EUA authorizes the distribution of COVID-19 convalescent plasma in the U.S. and its administration by health care providers, as appropriate, to treat suspected or laboratory-confirmed COVID-19 in hospitalized patients with COVID-19.

Alex Azar, Health and Human Services Secretary:
“The FDA’s emergency authorization for convalescent plasma is a milestone achievement in President Trump’s efforts to save lives from COVID-19,” said Secretary Azar. “The Trump Administration recognized the potential of convalescent plasma early on. Months ago, the FDA, BARDA, and private partners began work on making this product available across the country while continuing to evaluate data through clinical trials. Our work on convalescent plasma has delivered broader access to the product than is available in any other country and reached more than 70,000 American patients so far. We are deeply grateful to Americans who have already donated and encourage individuals who have recovered from COVID-19 to consider donating convalescent plasma.”

Stephen M. Hahn, M.D., FDA Commissioner:
“I am committed to releasing safe and potentially helpful treatments for COVID-19 as quickly as possible in order to save lives. We’re encouraged by the early promising data that we’ve seen about convalescent plasma. The data from studies conducted this year shows that plasma from patients who’ve recovered from COVID-19 has the potential to help treat those who are suffering from the effects of getting this terrible virus,” said Dr. Hahn. “At the same time, we will continue to work with researchers to continue randomized clinical trials to study the safety and effectiveness of convalescent plasma in treating patients infected with the novel coronavirus.”

Scientific Evidence on Convalescent Plasma

Based on an evaluation of the EUA criteria and the totality of the available scientific evidence, the FDA’s Center for Biologics Evaluation and Research determined that the statutory criteria for issuing an EUA criteria were met.

The FDA determined that it is reasonable to believe that COVID-19 convalescent plasma may be effective in lessening the severity or shortening the length of COVID-19 illness in some hospitalized patients. The agency also determined that the known and potential benefits of the product, when used to treat COVID-19, outweigh the known and potential risks of the product and that that there are no adequate, approved, and available alternative treatments.


August 24, 2020

Donate COVID-19 Plasma


  • FDA posts video and blog about how to donate plasms if you had been infected with COVID


https://youtu.be/PlX15rWdBbY


Please go to https://www.fda.gov/emergency-preparedness-and-response/coronavirus-disease-2019-covid-19/donate-covid-19-plasma

to read more from FDA


August 25, 2020


CLINICAL MEMORANDUM From: , OBRR/DBCD/CRS To: , OBRR Through: , OBRR/DBCD , OBRR/DBCD , OBRR/DBCD/CRS Re: EUA 26382: Emergency Use Authorization (EUA) Request (original request 8/12/20; amended request 8/23/20) Product: COVID-19 Convalescent Plasma Items reviewed: EUA request Fact Sheet for Health Care Providers Fact Sheet for Recipients Sponsor: Robert Kadlec, M.D. Assistant Secretary for Preparedness and Response (ASPR) Office of Assistant Secretary for Preparedness and Response (ASPR) U.S. Department of Health and Human Services (HHS) EXECUTIVE SUMMARY COVID-19 Convalescent Plasma (CCP), an unapproved biological product, is proposed for use under an Emergency Use Authorization (EUA) under section 564 of the Federal Food, Drug, and Cosmetic Act (the Act),(21 USC 360bbb-3) as a passive immune therapy for the treatment of hospitalized patients with COVID-19, a serious or life-threatening disease. There currently is no adequate, approved, and available alternative to CCP for treating COVID-19. The sponsor has pointed to four lines of evidence to support that CCP may be effective in the treatment of hospitalized patients with COVID-19: 1) History of convalescent plasma for respiratory coronaviruses; 2) Evidence of preclinical safety and efficacy in animal models; 3) Published studies of the safety and efficacy of CCP; and 4) Data on safety and efficacy from the National Expanded Access Treatment Protocol (EAP) sponsored by the Mayo Clinic. Considering the totality of the scientific evidence presented in the EUA, I conclude that current data for the use of CCP in adult hospitalized patients with COVID-19 supports the conclusion that CCP meets the “may be effective” criterion for issuance of an EUA from section 564(c)(2)(A) of the Act. It is reasonable to conclude that the known and potential benefits of CCP outweigh the known and potential risks of CCP for the proposed EUA. Current data suggest the largest clinical benefit is associated with high-titer units of CCP administered early course of the disease.

Source: https://www.fda.gov/media/141480/download


And Today August 26, 2020

  • A letter, from Senator Warren, to Commissioner Hahn from Senate Committee asking for documentation for any communication between FDA and White House

August 25, 2020 Dr. Stephen M. Hahn, M.D. Commissioner of Food and Drugs U.S. Food and Drug Administration 10903 New Hampshire Avenue Silver Spring, MD 20993 Dear Commissioner Hahn: We write regarding the U.S. Food and Drug Administration’s (FDA) troubling decision earlier this week to issue an Emergency Use Authorization (EUA) for convalescent plasma as a treatment for coronavirus disease 2019 (COVID-19).1 Reports suggests that the FDA granted the EUA amid intense political pressure from President Trump and other Administration officials, despite limited evidence of convalescent plasma’s effectiveness as a COVID-19 treatment.2 To help us better understand whether the issuance of the blood plasma EUA was motivated by politics, we request copies of any and all communications between FDA and White House officials regarding the blood plasma EUA.

Source: https://www.warren.senate.gov/imo/media/doc/2020.08.25%20Letter%20to%20FDA%20re%20Blood%20Plasma%20EUA.pdf

…….. which may have been a response to this article

FDA chief walks back comments on effectiveness of coronavirus plasma treatment


From CNBC: https://www.cnbc.com/2020/08/25/fda-chief-walks-back-comments-on-effectiveness-of-coronavirus-plasma-treatment.html

PUBLISHED TUE, AUG 25 202010:45 AM EDTUPDATED TUE, AUG 25 20204:12 PM EDT

Berkeley Lovelace Jr.@BERKELEYJR

Will Feuer@WILLFOIA

KEY POINTS

  • The authorization will allow health-care providers in the U.S. to use the plasma to treat hospitalized patients with Covid-19.
  • The FDA’s emergency use authorization came a day after President Trump accused the agency of delaying enrollment in clinical trials for vaccines or therapeutics.
  • The criticism from Trump and action from the FDA led some scientists to believe the authorization, which came on the eve of the GOP national convention, was politically motivated.

FDA Commissioner Dr. Stephen Hahn is walking back comments on the benefits of convalescent plasma, saying he could have done a better job of explaining the data on its effectiveness against the coronavirus after authorizing it for emergency use over the weekend.

Commisioners responses over Twitter

https://twitter.com/SteveFDA/status/1298071603675373569?s=20

https://twitter.com/SteveFDA/status/1298071619236245504?s=20

August 26, 2020

In an interview with Bloomberg’s , FDA Commissioner Hahn reiterates that his decision was based on hard evidence and scientific fact, not political pressure.  The whole interview is at the link below:

https://www.bloomberg.com/news/articles/2020-08-25/fda-s-hahn-vows-to-stick-to-the-science-amid-vaccine-pressure?sref=yLCixKPR

Some key points:

  • Dr. Hahn corrected his initial statement about 35% of people would be cured by convalescent plasma. In the interview he stated:

I was trying to do what I do with patients, because patients often understand things in absolute terms versus relative terms. And I should’ve been more careful, there’s no question about it. What I was trying to get to is that if you look at a hundred patients who receive high titre, and a hundred patients who received low titre, the difference between those two particular subset of patients who had these specific criteria was a 35% reduction in mortality. So I frankly did not do a good job of explaining that.

  • FDA colleagues had frank discussion after the statement was made.  He is not asking for other people in HHS to retract their statements, only is concerned that FDA has correct information for physicians and patients
  • Hahn is worried that people will not enroll due to chance they may be given placebo
  • He gave no opinion when asked if FDA should be an independent agency


For more articles on COVID19 please go to our Coronavirus Portal at

https://pharmaceuticalintelligence.com/coronavirus-portal/


Read Full Post »

« Newer Posts - Older Posts »