Healthcare analytics, AI solutions for biological big data, providing an AI platform for the biotech, life sciences, medical and pharmaceutical industries, as well as for related technological approaches, i.e., curation and text analysis with machine learning and other activities related to AI applications to these industries.
Abstract: 2209 Introduction and Objectives One of the biggest problems in the diagnosis of prostate cancer (PCa), which distinguishes it from many other solid tumors, is the difficulty of tumor imaging by means of standard visualization techniques. A transrectal ultrasound (TRUS) biopsy is mostly performed on the basis of risen PSA and is often blind – tissue specimens are taken from standard zones. Biopsy under MRI control is technically and logistically complicated and expensive, while TRUS can`t always differentiate the suspicious areas. A TRUS-based innovative technique, “Histoscanningâ€� is used in our centre for PCa identification and targeted biopsy.
Methods Prior to template biopsy we have performed Histoscanning to 31 patients, with previous one to six negative TRUS biopsies and persistent clinical suspicion of PCa (elevated PSA, high-grade prostatic intraepithelial neoplasia (HPIN) in 4 cores or suspicious TRUS findings). Age range was 51 – 75, with PSA values 3,8 – 14,3 ng/ml. Prostate size range 22-67cc. Most of the patients (n-26) from this group received therapy with 5α-reductase inhibitors for 6 months or more. Depending on the gland size, 10-14 standardized cores were taken + 4 additional cores from the suspicious zones marked on Histoscanning report.
Results Histopathology identified PCa in 13 out of 31 patients , adenocarcinomas with Gleason score ranging 6-8. In 11 patients with no signs of PCa we found HPIN or low-grade PIN. Comparing histology reports with Histoscanning mapping, in 8 PCa cases we found high correlation of this method with histopathological study on the amount and location of tumor lesions and in 5 cases Histoscanning showed greater spread of lesions, with good correlation of the tumor location.
Conclusions Due to the effectiveness, ease of use and the short time required for data processing, Histoscanning is a promising method for more effective targeted biopsy of the prostate.
As a result of ongoing research, we aim to evaluate sensitivity and specificity of the method, fuse it with MRI, to create a 3D model for biopsy or surgery. In the future, this data could be used for decision making on the nerve-sparing prostatectomy and minimally invasive focal treatments such as cryoablation, high-intensity focused ultrasound, radiofrequency or laser ablation.
Date & Time: May 8, 2013 10:30 AM Session Title: Prostate Cancer: Detection & Screening (V) Sources of Funding: none
Personal note:
On the authors’ intention to fuse HistoScanning with MRI: The authors report a very compelling clinical benefit just from using HistoScanning for guiding their biopsies. HistoScanning itself results in a 3D mapping of the prostate and the suspicious locations inside.
3D mapping of the prostate by HistoScanning analysis following motorised TRUS. the colored locations represents tissue suspicious for being cancer.
Fusing ultrasound & MRI images is prone to image-registration errors (e.g. due to differences in the prostate’s shape-distortion by the probe) which are larger than the accuracy sought for when performing biopsy or nerve-sparing surgery. I recommend anyone who wishes to guide biopsies and treatment based on MRI and therefore is in need for good level of localized-MRI interpretation, to rely on dedicated MRI interpretation applications and not intra-modalities image fusion.
In addition, major benefits of using HistoScanning for managing prostate cancer patients are the accessibility; A urologist can perform himself, at any time he chooses and at any place, simplicity; it only requires routine TRUS, patient-friendly; it lasts less than a minute and does not require anesthesia and low-cost; it’s ultrasound! Mixing HistoScanning with MRI will certainly eliminate these.
Article 11.2.10 Ultrasound based Screening for Ovarian Cancer
Occasionally, I check for news on ovarian cancer screening. I do that for sentimental reasons; I started the HistoScanning project aiming to develop an effective ultrasound-based screening solution for this cancer.
As awareness for ovarian cancer is highest in the USA, I checked for the latest news on the NCI web-site. I found that to-date: “There is no standard or routine screening test for ovarian cancer. Screening for ovarian cancer has not been proven to decrease the death rate from the disease.
Screening for ovarian cancer is under study and there are screening clinical trials taking place in many parts of the country. Information about ongoing clinical trials is available from the NCI Web site.”
I also found that:
Estimated new cases and deaths from ovarian cancer in the United States in 2013:
New cases: 22,240
Deaths: 14,030
To get an idea on the significance of these numbers, lets compare them to the numbers related to breast cancer:
Estimated new cases and deaths from breast cancer in the United States in 2013:
New cases: 232,340 (female); 2,240 (male)
Deaths: 39,620 (female); 410 (male)
Death rate of ovarian cancer patients is almost 4 times higher than the rate in breast cancer patients!
Therefore, I decided to raise awareness to the results achieved for ovarian HistoScanning in a double-blind multicenter European study that was published in European Radiology three years ago. The gynecologists who recruited patients to this study used standard ultrasound machines of GE-Medical. I would like as well to disclose that I am one of the authors of this paper:
To prospectively assess an innovative computer-aided diagnostic technology that quantifies characteristic features of backscattered ultrasound and theoretically allows transvaginal sonography (TVS) to discriminate benign from malignant adnexal masses.
Methods
Women (n = 264) scheduled for surgical removal of at least one ovary in five centres were included. Preoperative three-dimensional (3D)-TVS was performed and the voxel data were analysed by the new technology. The findings at 3D-TVS, serum CA125 levels and the TVS-based diagnosis were compared with histology. Cancer was deemed present when invasive or borderline cancerous processes were observed histologically.
Results
Among 375 removed ovaries, 141 cancers (83 adenocarcinomas, 24 borderline, 16 cases of carcinomatosis, nine of metastases and nine others) and 234 non-cancerous ovaries (107 normal, 127 benign tumours) were histologically diagnosed. The new computer-aided technology correctly identified 138/141 malignant lesions and 206/234 non-malignant tissues (98% sensitivity, 88% specificity). There were no false-negative results among the 47 FIGO stage I/II ovarian lesions. Standard TVS and CA125 had sensitivities/specificities of 94%/66% and 89%/75%, respectively. Combining standard TVS and the new technology in parallel significantly improved TVS specificity from 66% to 92% (p < 0.0001).
An example of an ovary considered to be normal with TVS.
The same TVS false-negative ovary with OVHS-detected foci of malignancy. The presence of an adenocarcinoma was confirmed histologically.
Conclusions
Computer-aided quantification of backscattered ultrasound is highly sensitive for the diagnosis of malignant ovarian masses.
Personal note:
Based on this study a promising offer for ultrasound-based screening method for ovarian cancer was published in: Int J Gynecol Cancer. 2011 Jan;21(1):35-43. doi: 10.1097/IGC.0b013e3182000528.: Mathematical models to discriminate between benign and malignant adnexal masses: potential diagnostic improvement using ovarian HistoScanning. Vaes E, Manchanda R, Nir R, Nir D, Bleiberg H, Autier P, Menon U, Robert A.
Regrettably, the results of these studies were never transformed into routine clinical products due to financial reasons.
Other research papers related to the management of Prostate cancer were published on this Scientific Web site:
ByBeatrijs A. Seinstra1, et. al. published mid-2010, gives a review of the state-of-the-art of the then available methods for local lesions’ ablation. As far as ablation techniques availability, I have found this review very much relevant to today’s technological reality. It is worthwhile noting that in the last couple of years, new imaging-based navigation and guidance applications were introduced into the market holding a promise to improve the accuracy of administrating such treatment. These are subject to clinical validation in large clinical studies. From the above mentioned publication I have chosen to highlight the parts discussing the importance of imaging-based guidance to the effective application of localized ablation-type therapies.
The clinical need:
Hepatocellular carcinoma (HCC) is a primary malignant tumor of the liver that accounts for an important health problem worldwide. Primary liver cancer is the sixth most common cancer worldwide with an incidence of 626,000 patients a year, and the third most common cause of cancer-related death [1]. Only 10–15% of HCC patients are suitable candidates for hepatic resection and liver transplantation due to the advanced stage of the disease at time of diagnosis and shortage of donors.
Immerging solution:
In order to provide therapeutic options for patients with inoperable HCC, several minimally invasive image-guided therapies for locoregional treatment have been developed. HCC has a tendency to remain confined to the liver until the disease has advanced, making these treatments particularly attractive.
Minimally invasive image-guided therapies can be divided into the group of the tumor ablative techniques or the group of image-guided catheter-based techniques. Tumor ablative techniques are either based on thermal tumor destruction, as in radiofrequency ablation (RFA), cryoablation, microwave ablation, laser ablation and high-intensity focused ultrasound (HIFU), or chemical tumor destruction, as in percutaneous ethanol injection (PEI). These techniques are mostly used for early stage disease. Image-guided catheter-based techniques rely on intra-arterial delivery of embolic, chemoembolic, or radioembolic agents [22]. These techniques enable treatment of large lesions or whole liver treatment, and are as such used for intermediate stage HCC (Figure 1).
Minimally invasive image-guided ablation techniques and intra-arterial interventions may prolong survival, spare more functioning liver tissue in comparison to surgical resection (which can be very important in cirrhotic patients), allow retreatment if necessary, and may be an effective bridge to transplantation [23–27].
During the last 2 decades, minimally invasive image-guided therapies have revolutionized the management of inoperable HCC.
The value of image guidance
Accurate imaging is of great importance during minimally invasive loco-regional therapies to efficiently guide and monitor the treatment. It enables proper placement of instruments, like the probe in case of ablation or the catheter in case of intra-arterial therapy, and accurate monitoring of the progression of the necrotic zone during ablation.
can all be employed. In current clinical practice, placement of the catheter in intra-arterial procedures is usually performed under fluoroscopic guidance, while ablation may be guided by ultrasound, CT or MRI.
Ultrasound guidance allows probe insertion from every angle, offers real time visualization and correction for motion artifacts when targeting the tumor, and is low cost. However, the gas created during ablation (or ice in the case of cryoablation) hampers penetration of the ultrasound beams in tissue, causing acoustic shadowing and obscuring image details like the delineation between tumor borders and ablation zone.
CT is also frequently used to guide minimally invasive ablation therapy, and is a reliable modality to confirm treatment results. In comparison to US, it provides increased lesion discrimination, a more reliable depiction of ablated/non-ablated interfaces, and a better correlation to pathologic size [28]. However, due to its hypervascularity, small HCCs can only be clearly visualized in the arterial phase for a short period of time. Another disadvantage of CT is the exposure of the patient and physician to ionizing radiation.
Combining US imaging for probe placement and CT for ablation monitoring reduces this exposure. At the moment, hybrid systems are being developed, enabling combination of imaging techniques, like ultrasound and CT imaging, thereby improving the registration accuracy during treatment [29]. The interest in MRI-guided ablation is growing, as it produces a high-quality image allowing high-sensitivity tumor detection and accurate identification of the target region with multiplanar imaging.
MRI also enables real-time monitoring of the temperature evolution during treatment [30–35]. However, MRI is an expensive technique, and MRI-guided ablation is still limited in clinical practice. Currently, the most widely used ablation technique for percutaneous treatment of focal hepatic malignancies is radiofrequency ablation (RFA), which has been shown to be safe and effective for the treatment of early stage HCC [48–50]. During RFA, a small electrode is placed within the tumor, and a high-frequency alternating electric current (approximately 400 MHz) is generated, causing ionic agitation within the tissue. ….. Most frequently ultrasound is used for image guidance (Figs. 2, 3), but there are reports of groups who use CT, MRI, or fluoroscopic imaging.
Ultrasound guided RFA. a: HCC lesion in a non-surgical patient pre-treatment (pointed out by arrow). b: Just after start treatment, electrode placed centrally in the tumor. c: Gas formation during ablation causes acoustic shadowing
Contrast-enhanced CT pre- and post-RFA. Same patient as in Fig. 2. a: Hypervascular lesion (biopsy proven HCC) in right liver lobe (pointed out by arrow) before treatment. b: Ablated lesion directly post ablation, with reactive hyperemia around the RFA lesion
References
1.
Parkin DM, Bray F, Ferlay J, Pisani P (2005) Global cancer statistics, 2002. CA Cancer J Clin 55:74–108PubMedCrossRef
2.
[No authors listed] (1987) Hepatocellular cancer: differences between high and low incidence regions. Lancet 2:1183–1184
3.
El-Serag HB, Davila JA, Petersen NJ, McGlynn KA (2003) The continuing increase in the incidence of hepatocellular carcinoma in the United States: an update. Ann Intern Med 139:817–823PubMed
4.
Taylor-Robinson SD, Foster GR, Arora S, Hargreaves S, Thomas HC (1997) Increase in primary liver cancer in the UK, 1979–94. Lancet 350:1142–1143PubMedCrossRef
5.
Beasley RP, Hwang LY, Lin CC, Chien CS (1981) Hepatocellular carcinoma and hepatitis B virus. A prospective study of 22,707 men in Taiwan. Lancet 2:1129–1133PubMedCrossRef
6.
Beasley RP (1988) Hepatitis B virus. The major etiology of hepatocellular carcinoma Cancer 61:1942–1956
7.
Chen HL, Chang MH, Ni YH, Hsu HY, Lee PI, Lee CY et al (1996) Seroepidemiology of hepatitis B virus infection in children: Ten years of mass vaccination in Taiwan. JAMA 276:906–908PubMedCrossRef
8.
Chang MH, Chen CJ, Lai MS, Hsu HM, Wu TC, Kong MS et al (1997) Universal hepatitis B vaccination in Taiwan and the incidence of hepatocellular carcinoma in children. Taiwan Childhood Hepatoma Study Group. N Engl J Med 336:1855–1859PubMedCrossRef
9.
Adami HO, Hsing AW, McLaughlin JK, Trichopoulos D, Hacker D, Ekbom A et al (1992) Alcoholism and liver cirrhosis in the etiology of primary liver cancer. Int J Cancer 51:898–902PubMedCrossRef
10.
Bruix J, Barrera JM, Calvet X, Ercilla G, Costa J, Sanchez-Tapias JM et al (1989) Prevalence of antibodies to hepatitis C virus in Spanish patients with hepatocellular carcinoma and hepatic cirrhosis. Lancet 2:1004–1006PubMedCrossRef
11.
Colombo M, Kuo G, Choo QL, Donato MF, Del NE, Tommasini MA et al (1989) Prevalence of antibodies to hepatitis C virus in Italian patients with hepatocellular carcinoma. Lancet 2:1006–1008PubMedCrossRef
12.
Tsukuma H, Hiyama T, Tanaka S, Nakao M, Yabuuchi T, Kitamura T et al (1993) Risk factors for hepatocellular carcinoma among patients with chronic liver disease. N Engl J Med 328:1797–1801PubMedCrossRef
13.
Pons F, Varela M, Llovet JM (2005) Staging systems in hepatocellular carcinoma. HPB (Oxford) 7:35–41
14.
Llovet JM, Fuster J, Bruix J (2004) The Barcelona approach: diagnosis, staging, and treatment of hepatocellular carcinoma. Liver Transpl 10:S115–S120PubMedCrossRef
15.
Bruix J, Llovet JM (2009) Major achievements in hepatocellular carcinoma. Lancet 373:614–616PubMedCrossRef
16.
Geschwind JF (2002) Chemoembolization for hepatocellular carcinoma: where does the truth lie? J Vasc Interv Radiol 13:991–994PubMedCrossRef
17.
Bruix J, Llovet JM (2002) Prognostic prediction and treatment strategy in hepatocellular carcinoma. Hepatology 35:519–524PubMedCrossRef
18.
Bruix J, Castells A, Bosch J, Feu F, Fuster J, Garcia-Pagan JC et al (1996) Surgical resection of hepatocellular carcinoma in cirrhotic patients: prognostic value of preoperative portal pressure. Gastroenterology 111:1018–1022PubMedCrossRef
19.
Llovet JM, Fuster J, Bruix J (1999) Intention-to-treat analysis of surgical treatment for early hepatocellular carcinoma: resection versus transplantation. Hepatology 30:1434–1440PubMedCrossRef
20.
Thomas MB, O’Beirne JP, Furuse J, Chan AT, bou-Alfa G, Johnson P (2008) Systemic therapy for hepatocellular carcinoma: cytotoxic chemotherapy, targeted therapy and immunotherapy. Ann Surg Oncol 15:1008–1014PubMedCrossRef
21.
Llovet JM, Ricci S, Mazzaferro V, Hilgard P, Gane E, Blanc JF et al (2008) Sorafenib in advanced hepatocellular carcinoma. N Engl J Med 359:378–390PubMedCrossRef
22.
Trinchet JC, Ganne-Carrie N, Beaugrand M (2003) Review article: intra-arterial treatments in patients with hepatocellular carcinoma. Aliment Pharmacol Ther 17(Suppl 2):111–118PubMedCrossRef
23.
Lu DS, Yu NC, Raman SS, Lassman C, Tong MJ, Britten C et al (2005) Percutaneous radiofrequency ablation of hepatocellular carcinoma as a bridge to liver transplantation. Hepatology 41:1130–1137PubMedCrossRef
24.
Mazzaferro V, Battiston C, Perrone S, Pulvirenti A, Regalia E, Romito R et al (2004) Radiofrequency ablation of small hepatocellular carcinoma in cirrhotic patients awaiting liver transplantation: a prospective study. Ann Surg 240:900–909PubMedCrossRef
25.
Graziadei IW, Sandmueller H, Waldenberger P, Koenigsrainer A, Nachbaur K, Jaschke W et al (2003) Chemoembolization followed by liver transplantation for hepatocellular carcinoma impedes tumor progression while on the waiting list and leads to excellent outcome. Liver Transpl 9:557–563PubMedCrossRef
26.
Yao FY, Kerlan RK, Hirose R, Davern TJ, Bass NM, Feng S et al (2008) Excellent outcome following down-staging of hepatocellular carcinoma prior to liver transplantation: an intention-to-treat analysis. Hepatology 48:819–827PubMedCrossRef
27.
Chapman WC, Majella Doyle MB, Stuart JE, Vachharajani N, Crippin JS, Anderson CD et al (2008) Outcomes of neoadjuvant transarterial chemoembolization to downstage hepatocellular carcinoma before liver transplantation. Ann Surg 248:617–625PubMed
28.
Cha CH, Lee FT Jr, Gurney JM, Markhardt BK, Warner TF, Kelcz F et al (2000) CT versus sonography for monitoring radiofrequency ablation in a porcine liver. AJR Am J Roentgenol 175:705–711PubMed
29.
Wood BJ, Locklin JK, Viswanathan A, Kruecker J, Haemmerich D, Cebral J et al (2007) Technologies for guidance of radiofrequency ablation in the multimodality interventional suite of the future. J Vasc Interv Radiol 18:9–24PubMedCrossRef
30.
Hokland SL, Pedersen M, Salomir R, Quesson B, Stodkilde-Jorgensen H, Moonen CT (2006) MRI-guided focused ultrasound: methodology and applications. IEEE Trans Med Imaging 25:723–731PubMedCrossRef
31.
Cline HE, Hynynen K, Watkins RD, Adams WJ, Schenck JF, Ettinger RH et al (1995) Focused US system for MR imaging-guided tumor ablation. Radiology 194:731–737PubMed
32.
Hynynen K, Freund WR, Cline HE, Chung AH, Watkins RD, Vetro JP et al (1996) A clinical, noninvasive, MR imaging-monitored ultrasound surgery method. Radiographics 16:185–195PubMed
33.
Kopelman D, Inbar Y, Hanannel A, Dank G, Freundlich D, Perel A et al (2006) Magnetic resonance-guided focused ultrasound surgery (MRgFUS). Four ablation treatments of a single canine hepatocellular adenoma HPB (Oxford) 8:292–298
34.
Kopelman D, Inbar Y, Hanannel A, Freundlich D, Castel D, Perel A et al (2006) Magnetic resonance-guided focused ultrasound surgery (MRgFUS): ablation of liver tissue in a porcine model. Eur J Radiol 59:157–162PubMedCrossRef
35.
Gedroyc WM (2005) Magnetic resonance guidance of thermal ablation. Top Magn Reson Imaging 16:339–353PubMedCrossRef
36.
Livraghi T, Festi D, Monti F, Salmi A, Vettori C (1986) US-guided percutaneous alcohol injection of small hepatic and abdominal tumors. Radiology 161:309–312PubMed
37.
Shiina S, Yasuda H, Muto H, Tagawa K, Unuma T, Ibukuro K et al (1987) Percutaneous ethanol injection in the treatment of liver neoplasms. AJR Am J Roentgenol 149:949–952PubMed
38.
Lencioni R, Cioni D, Crocetti L, Bartolozzi C (2004) Percutaneous ablation of hepatocellular carcinoma: state-of-the-art. Liver Transpl 10:S91–S97PubMedCrossRef
39.
Shiina S, Teratani T, Obi S, Sato S, Tateishi R, Fujishima T et al (2005) A randomized controlled trial of radiofrequency ablation with ethanol injection for small hepatocellular carcinoma. Gastroenterology 129:122–130PubMedCrossRef
40.
Lencioni R, Bartolozzi C, Caramella D, Paolicchi A, Carrai M, Maltinti G et al (1995) Treatment of small hepatocellular carcinoma with percutaneous ethanol injection. Analysis of prognostic factors in 105 Western patients. Cancer 76:1737–1746PubMedCrossRef
41.
Livraghi T, Giorgio A, Marin G, Salmi A, De Sio I, Bolondi L et al (1995) Hepatocellular carcinoma and cirrhosis in 746 patients: long-term results of percutaneous ethanol injection. Radiology 197:101–108PubMed
42.
Di SM, Buscarini L, Livraghi T, Giorgio A, Salmi A, De Sio I et al (1997) Percutaneous ethanol injection in the treatment of hepatocellular carcinoma. A multicenter survey of evaluation practices and complication rates Scand J Gastroenterol 32:1168–1173
43.
Lencioni RA, Allgaier HP, Cioni D, Olschewski M, Deibert P, Crocetti L et al (2003) Small hepatocellular carcinoma in cirrhosis: randomized comparison of radio-frequency thermal ablation versus percutaneous ethanol injection. Radiology 228:235–240PubMedCrossRef
44.
Lin SM, Lin CJ, Lin CC, Hsu CW, Chen YC (2004) Radiofrequency ablation improves prognosis compared with ethanol injection for hepatocellular carcinoma ≤4 cm. Gastroenterology 127:1714–1723PubMedCrossRef
45.
Lin SM, Lin CJ, Lin CC, Hsu CW, Chen YC (2005) Randomised controlled trial comparing percutaneous radiofrequency thermal ablation, percutaneous ethanol injection, and percutaneous acetic acid injection to treat hepatocellular carcinoma of 3 cm or less. Gut 54:1151–1156PubMedCrossRef
46.
Brunello F, Veltri A, Carucci P, Pagano E, Ciccone G, Moretto P et al (2008) Radiofrequency ablation versus ethanol injection for early hepatocellular carcinoma: A randomized controlled trial. Scand J Gastroenterol 43:727–735PubMedCrossRef
47.
Orlando A, Leandro G, Olivo M, Andriulli A, Cottone M (2009) Radiofrequency thermal ablation vs. percutaneous ethanol injection for small hepatocellular carcinoma in cirrhosis: meta-analysis of randomized controlled trials. Am J Gastroenterol 104:514–524PubMedCrossRef
48.
Curley SA, Izzo F, Delrio P, Ellis LM, Granchi J, Vallone P et al (1999) Radiofrequency ablation of unresectable primary and metastatic hepatic malignancies: results in 123 patients. Ann Surg 230:1–8PubMedCrossRef
49.
Curley SA, Izzo F, Ellis LM, Nicolas VJ, Vallone P (2000) Radiofrequency ablation of hepatocellular cancer in 110 patients with cirrhosis. Ann Surg 232:381–391PubMedCrossRef
50.
Goldberg SN, Gazelle GS, Solbiati L, Livraghi T, Tanabe KK, Hahn PF et al (1998) Ablation of liver tumors using percutaneous RF therapy. AJR Am J Roentgenol 170:1023–1028PubMed
Other research papers related to the management of Prostate cancer were published on this Scientific Web site:
Harnessing Personalized Medicine for Cancer Management, Prospects of Prevention and Cure: Opinions of Cancer Scientific Leaders @ http://pharmaceuticalintelligence.com
MIT Skoltech Initiative: 61 Experts from 20 different Countries identified 120 Universities in the field of Entrepreneurship and Innovation
Reporter: Aviva Lev-Ari, PhD, RN
WordCloud Image Produced by Adam Tubman
The Technion – Israel Institute of Technology was today ranked 6th in the world by a survey conducted by MIT. The study evaluated entrepreneurship and innovation in higher education institutions worldwide. The ranking was compiled by 61 experts from 20 different countries. It identified 120 universities which demonstrate “a decisive impact and significant contribution in the field of entrepreneurship and innovation.”
Technion followed MIT, Stanford, Cambridge, Imperial College and Oxford, but preceded the University of San Diego, Berkeley, ETH Swiss and the National University of Singapore. The report also placed Israel 3rd in terms of entrepreneurship and innovation, after the US and the UK, but ahead of Sweden, Singapore, Germany, the Netherlands, China and Canada.The survey, which was carried out in partnership with the Skolkovo Institute of Science and Technology in Russia, also placed the Technion first in the category of universities that create or support technological innovation even though they operate in a challenging environment.Instituting an institutional E&I culture – for entrepreneurship and innovation – is considered among experts as the essential ingredient for sustaining a successful system. In this respect, the Technion is mentioned as an institution that possesses the ethos of aspiration and achievement.This is the first stage (out of three) in the comprehensive survey. In his reaction to these most favorable results, Technion President Professor Peretz Lavie said, “Technion’s position among the top ten leading universities in the world in the areas of innovation and entrepreneurship brings us closer to fulfilling our mission goals: to be counted among the top ten leading universities in the world. This is not the first time the Technion has earned international acclaim such as this,” he continued. “The university’s contribution to Israel’s advanced technology industry is recognized around the world. Not by coincidence did we prevail in the New York City’s tender last year to establish a scientific-engineering research center in partnership with Cornell University. The city’s mayor, Michael Bloomberg, said then that the Technion is the only university in the world capable of successfully turning the economic tide of an entire country, from exporters of citrus fruit to a global center for advanced industry and an authority of knowledge. To date, 61 experts from around the world have endorsed this statement.”
The Technion-Israel Institute of Technology is a major source of the innovation and brainpower that drives the Israeli economy, and a key to Israel’s reputation as the world’s “Start-Up Nation.” Its three Nobel Prize winners exemplify academic excellence.
To those of you who did not know, 2013 is the year of the ultrasound: http://www.ultrasound2013.org/. This initiative was launched by AIUM and its objectives:
Raise awareness of the value and benefits of ultrasound among patients, health care providers, and insurers
Provide ultrasound education and evidence-based guidelines for health care providers
Educate insurers about the cost savings and patient benefits associated with performing an ultrasound study when scientific evidence supports its potential effectiveness compared to other imaging modalities
Educate patients about the benefits of ultrasound as the appropriate imaging modality for their care
Encourage the incorporation of ultrasound into medical education
The initiative is designed to call attention to the safe, effective, and affordable advantages of ultrasound as an alternative to other imaging modalities that are more costly and/or emit radiation. For a growing number of clinical conditions, ultrasound has been shown to be equally effective in its diagnostic capability, with a distinct advantage in safety and cost over computed tomography and magnetic resonance imaging. Despite this advantage, evidence suggests that ultrasound is vastly underutilized. Ultrasound First focuses on educating health care workers, medical educators, insurers, and patients of the benefits of ultrasound in medical care. “There is growing support and public awareness for the need to reduce and carefully monitor patients’ exposure to radiation during medical imaging. The use of ultrasound as an alternative imaging modality will help achieve that goal while reducing cost,” states AIUM President Alfred Abuhamad, MD. “Many health care workers and insurers are unacquainted with the range of conditions for which ultrasound has been shown to have superior diagnostic capabilities. Disseminating this knowledge to health care workers and incorporating ultrasound in medical protocols where scientific evidence has shown its diagnostic efficacy will undoubtedly improve patient safety and reduce cost. The time to act is now.”
A primary component of Ultrasound First is providing clinical evidence for the use of ultrasound. To that aim, the Journal of Ultrasound in Medicine has launched a special feature, the Sound Judgment Series, consisting of invited articles highlighting the clinical value of using ultrasound first in specific clinical diagnoses where ultrasound has shown comparative or superior value. Clinical conditions that will be addressed in the series include postmenopausal bleeding, right lower quadrant pain, pelvic pain, right upper quadrant pain, and shoulder pain, among others. This series will serve as an important educational resource for health care workers and educators. On the clinical evidence page one can find reasoning for why ultrasound first. Not much related to cancer diagnosis and management. The only interesting claim is: “Ultrasound-guided surgery: Its use to remove tumors from women who have palpable breast cancer is much more successful than standard surgery in excising all the cancerous tissue while sparing as much healthy tissue as possible.”
The article gives clear presentation of the problem and includes demonstrative pictures:
Figure: Basal cell carcinoma with dermal involvement (transverse view, nasal tip). Grayscale sonography (A) and 3-dimensional reconstruction (B, 5- to 8-second sweep) show a 10.1-mm (wide) × 1.4-mm (deep) well-defined hypoechoic oval lesion (between markers in A and outlined in B) that affects the dermis (d) of the left nasal wing. Notice the hyperechoic spots (arrowheads) within the lesion. The nasal cartilage (c) is unremarkable; asterisk indicates basal cell carcinoma.
Basal cell carcinoma with dermal and subcutaneous involvement (transverse view, frontal region). A, Grayscale sonography shows a 11.4-mm (wide) × 6.6-mm (deep) well-defined oval hypoechoic lesion that involves the dermis (d) and subcutaneous tissue (st). There are hyperechoic spots (arrowheads) within the tumor. B, Color Doppler sonography shows increased vascularity within the tumor (asterisk). C, Three-dimensional sonographic reconstruction (5- to 8-second sweep) highlights the lesion (asterisk, outlined); b indicates bony margin of the skull.
Figure: Pleomorphic presentations of basal cell carcinoma lesions on grayscale sonography (transverse views). Notice the variable shapes of the tumors.
Figure: Frequently, blood flow can be detected within the tumor and its periphery, with slow-flow arteries or veins. The latter vascular data can orient the clinician about the distribution and amount of blood flow that he or she will face during surgery. Despite the fact that basal cell carcinomas usually do not present high vascularity, it should be kept in mind that many of basal cell carcinoma operations are performed in the offices of clinicians and not in the main operating rooms of large hospitals. Nevertheless, the finding of high vascularity within a clinically diagnosed basal cell carcinoma may suggest another type of skin cancer that could occasionally mimic basal cell carcinoma, such as squamous cell carcinoma, Merkel cell carcinoma, or a metastatic tumor. The above figure presents variable degrees of vascularity in basal cell carcinoma lesions going from hypovascular to hypervascular on color and power Doppler sonography (transverse views).
Figure: The depth correlation between sonography (variable frequency) and histologic analysis in facial basal cell carcinoma has been reported to be excellent. Thus, the intraclass correlation coefficient for comparing thickness for the two methods (sonography and histologic analysis) that has been described in literature is 0.9 (intraclass correlation coefficient values ≥0.9 are very good; 0.70–0.89 are good; 0.50–0.69 are moderate; 0.30–049 are mediocre; and ≤0.29 are bad). Two rare sonographic artifacts have been described in basal cell carcinoma. One is the “angled border” that is produced by an inflammatory giant cell reaction underlying the tumor, which may falsely increase the apparent size of the tumor. The other is the “blurry border,” which is produced by large hypertrophy of the sebaceous glands surrounding the lesion. According to the literature, both artifacts can be recognized by a well-trained operator. The figure above presents the sonographic involvement of deeper layers such as the nasal cartilage and orbicularis muscles in the face is of critical importance and may change the decision about the type of surgery. Basal cell carcinoma with nasal cartilage involvement (3-dimensional reconstruction, 5- to 8-second sweep, transverse view, left nasal wing). Notice the extension of the tumor (asterisk, outlined) to the nasal cartilage region (c); d indicates dermis.
Basal cell carcinoma with involvement of the orbicularis muscle of the eyelid (m). Grayscale sonography (transverse view, right lower eyelid) shows that the tumor (asterisk) affects the muscle layer (arrows).
Magnetic Resonance Imaging (MRI) is increasingly used in clinical diagnostics, for a rapidly growing number of indications. The MRI technique is non-invasive and can provide information on the anatomy, function and metabolism of tissues in vivo (Strijkers GJ, et al, Anticancer Agents Med Chem, May 2007;7(3):291-305). Basic contrast in the MRI image scans is as a result of contrast generated by differences in the relaxation times between different regions. Since the intrinsic contrast generated between regions is limited to allow clear and specific diagnosis, MRI contrast agents administered intravenously are increasingly being used to alter image contrast.
Gadoxetic acid, a gadolinium-based compound, is a recently developed hepatobiliary-specific contrast material for MRI that has high sensitivity in the detection of malignant liver tumors. Its salt, gadoxetate disodium, is marketed as Primovist in Europe and Eovist in the United States by Bayer HealthCare Pharmaceuticals. Gadoxetic acid is taken up by hepatocytes and then excreted into the bile ducts (Schuhmann-Giampieri G, et al, Radiology, Apr 1992;183(1):59-64). Therefore, hepatic focal lesions without normal hepatobiliary function are depicted as hypointense areas compared with the well-enhanced hyperintense background liver in the hepatobiliary phase of gadoxetic acid–enhanced MR imaging. In addition, gadoxetic acid can be used in the same way as gadopentetate dimeglumine to evaluate the hemodynamics of hepatic lesions in the dynamic phase after an intravenous bolus injection (Kitao A, et al, Radiology, Sep 2010;256(3):817-26).
Recently, researchers from Kanazawa University Graduate School of Medical Science, (Kanazawa, Japan) analyzed the correlation among biologic features, tumor marker production, and signal intensity at gadoxetic acid-enhanced MR imaging in hepatocellular carcinomas (HCCs). The findings were published in Radiology journal. The research was supported in part by a Grant-in-Aid for Scientific Research (21591549) from the Ministry of Education, Culture, Sports, Science and Technology; and by Health and Labor Sciences Research Grants for “Development of novel molecular markers and imaging modalities for earlier diagnosis of hepatocellular carcinoma.”
Research significance: HCC is the most frequent primary malignant tumor of liver and is the third most common cause of cancer death worldwide. It is the most Hepatocellular.
The accurate detection and characterization of HCC focal lesions is crucial for improving prognosis of patients with HCC.
Research problem: Gadoxetic acid–enhanced MR imaging is highly accurate for diagnosing HCC lesions. As discussed earlier, in this imaging process, hepatic focal lesions without normal hepatobiliary are hypointense as compared with the well-enhanced hyperintense background liver. However, approximately 6%–15% of hypervascular HCCs demonstrate isointensity or hyperintensity (Kitao A, et al, Eur Radiol, Oct 2011;21(10):2056-66).
Hypothesis: The reason for hyperintensity in some HCC lesions was previously shown to be due to overexpression of organic anion transporting polypeptide 8 (OATP8) (Kitao A, et al, Radiology, Sep 2010;256(3):817-26). The authors speculated that there might be a correlation of the tumor marker production and signal intensity (SI) on hepatobiliary phase images, which would reflect distinct genomic and proteomic expression of HCC. Thus, authors stated that “the purpose of this study was to analyze the correlation among the pathologic and biologic features, tumor marker production, with signal intensity (SI) on hepatobiliary phase gadoxetic acid–enhanced MR images of HCC” (Kitao A, et al, Radiology, Dec 2012;265(3):780-9).
Experimental design: From April 2008 to September 2011, 180 surgically resected HCCs in 180 patients (age, 65.0 years ± 10.3 [range, 34–83 years]; 138 men, 42 women) were classified as either hypointense (n = 158) or hyperintense (n = 22) compared with the signal intensity of the background liver on hepatobiliary phase gadoxetic acid–enhanced MR images (Abstract of the study).
Pathologic features were analyzed.
Serum analysis and immunohistochemical staining was performed and following were compared:
Alpha fetoprotein (AFP) – is a main tumor marker of HCCs. AFP is the most abundant plasma protein found in the human fetus and plasma levels decrease rapidly after birth. A level above 500 nanograms/milliliter of AFP in adults can be indicative of hepatocellular carcinoma, germ cell tumors, and metastatic cancers of the liver.
Absence of protein induced by vitamin K or antagonist-II (PIVKA-II) – is a clinically important serum tumor marker. PIVKAII is an incomplete coagulation factor prothrombin II whose production is related to the absence of vitamin K or the presence of the antagonist of vitamin K, which is the cofactor of g carboxylase that converts precursor into prothrombin.
Results: The hyperintense HCCs showed significantly higher differentiation grade than the hypointense HCCs (P = .028). There was a significant difference in the proliferation pattern between the hypointense and hyperintense HCCs (P < .001) and the hyperintense HCCs showed a significantly lower rate of portal vein invasion than that of hypointense HCCs (P = .039). The serum levels of tumor markers AFP, AFP-L3, and PIVKA-II were significantly lower in the patients with hyperintense HCCs than in those with
hypointense HCCs (P = .003, .004, and .026). In addition, immunohistochemical analysis revealed that the expression of FP and PIVKA-II was lower in hyperintense than in hypointense HCCs (both P < .001). Also, hyperintense HCCs showed lower recurrence rate than hypointense HCCs (P = .039).
Conclusion: Variation was observed within differently stained lesions of HCC in the hepatobiliary phase gadoxetic acid–enhanced MR images as evident in tumor marker expression, proliferation pattern, differentiation grade, immunohistochemical analysis and recurrence. The results lead to the hypothesis that hyperintense HCCs in the hepatobiliary phase gadoxetic acid–enhanced MR images might represent a particular type of HCC that is hypervascular and biologically less aggressive as compared to hypovascular HCCs. Interestingly, this research is another great example where tumor heterogeneity has been brought to light (similar to genetic heterogeneity in triple negative breast cancer deciphered by Lehmann BD, et al, 2011). The heterogeneity might be the basis of answers to why a particular therapy fails in a certain tumor type and fortifying evidence for appropriate analysis of the tumor for obtaining the desired tumor response from a particular drug.
Imaging Guided Cancer-Therapy – a Discipline in Need of Guidance
Author – Writer: Dror Nir, PhD
Article 11.2.11 Imaging Guided Cancer Therapy a Discipline in Need of Guidance
The use of imaging in cancer management is broadly established. During the past two decades, advancements in imaging; image quality, precision and reproducibility lead to introduction of localized, minimally invasive treatments of cancer lesions.
A statement-paper, published online: 17 January 2013: Radiologists’ leading position in image-guided therapy, which presents the thoughts of the Image-Guided Therapy Working Group within the Research Committee of the European Society of Radiology, give hope that the policy-makers in the European radiology society are becoming aware of the need to guide this process.
Although the authors are addressing imaging guided therapy (IGT) in its broad sense, most of their examples are related to treatment of cancer. The main reason for provided for being concerned with what is happening in this domain is: “This means that the planning, performing and monitoring, as well as the control of the therapeutic procedure, are based and dependent on the “virtual reality” provided by imaging investigations.”
The most interesting points raised by the authors are:
1. The realization that IGT is involving many “non-radiologist”, and this fact cannot be ignored: “This role is mainly driven by the sophisticated opportunities offered by medical computing and radiological image guidance with regard to precision and minimal invasiveness [2]. However, the impact of radiology on the regulatory medico-legal, technical and radioprotection issues in this field have not yet been defined. Since an increasing number of procedures will probably be performed by non-radiologists, several main questions have to be addressed:
How should the radiology training requirements for non-radiologists be provided?
How should the technical and radioprotection related responsibilities for radiological imaging systems used by non-radiologists be organised?
How should radiologists be involved in the practical routine use of non-radiological image-guided procedures in clinical practice?
Considering the almost pan-European medical reality with decreasing staff resources and increasing diversification and subspecialisation, radiologists have to stress the fact that within a cooperative, goal-oriented and multidisciplinary environment, the specialty-specific knowledge should confer upon radiologists a significant impact on the overall responsibility for all imaging-related processes in various non-radiological specialties (such as purchase, servicing, quality management, radiation protection and documentation). Furthermore, radiologists should take responsibility for the definition and compliance with the legal requirements regarding all radiological imaging, especially if non-radiologists have to be trained in the use of imaging technology for guidance of therapy.”
2. Quality assurance and service standards needs to be established; “Performing IGT necessitates specific quality management tools for establishing standards and maintaining levels of excellence…. A European task force group on IGT might be necessary to further develop certification guidelines and establish requirements for IGT practice according to known standards, focused on common recommendations and certification guidelines.”
3. Controlling the process of introducing new medical devices into this niche-market: “IGT research can be broadly divided into two categories, target specific research (e.g. the type of tumour or vascular lesion by imaging biomarkers) and technical research (e.g. evaluation of a new device or procedure). Understanding the efficacy and application of new and emerging technologies is a critical first step, which then leads to target-specific research. The focus of this research is aimed at understanding when, where and in whom the therapy can provide clear clinical benefit and how to use IGT in conjunction with, or as an alternative to, more established therapies. This also clearly includes research on the development and implementation of imaging biomarkers, defined as objectively measured indicators of normal biological processes, pathological changes, or responses to a therapeutic intervention [9]…..
4. An unusual remark is made in respect to the way new devices are introduced: “Clinical specialists who lack the knowledge and expertise required to champion IGT and who are often already over-committed in pursuing their own research goals often dominate committees in control of other funding streams….”
5. Clear recognition that “health-care costs” is of outmost importance: “Demonstration of the cost effectiveness of IGT methods of treatment and targeting with formal quantification of financial as well as patient benefit would encourage their wider adoption. In a broad perspective, health technology assessment (HTA) might be the way for the systematic evaluation of health-relevant IGT procedures and methods, the effectiveness, safety and economic viability of a health intervention, as well as its social, ethical, legal and organisational effects; and for providing a basis for decisions in the health system.”
Council Directive 97/43 Euratom, on health protection of individuals against the dangers of ionizing radiation in relation to medical exposure, and repealing Directive 84/466 Euratom, 1997
4.
DIMOND. Measures for optimising radiological information and dose in digital imaging and interventional radiology. European Commission. Fifth Framework Programme. 1998–2002
5.
SENTINEL. Safety and efficacy for new techniques and imaging using new equipment to support European legislation. European Coordination Action. 2005–2007
UNSCEAR (2000) Sources and effects of ionising radiation. United Nations Scientific Committee on the Effects of Atomic Radiation Report to the General Assembly with Scientific Annexes
8.
The 2007 recommendations of the international commission on radiological protection
9.
European Society of Radiology (2010) White paper on imaging biomarkers. Insights Imaging 1(2):42–45CrossRef
Imaging-biomarkers is Imaging-based tissue characterization
Author – Writer: Dror Nir, PhD
Article 11.1 Introduction by Dror Nir PhD
For everyone who is skeptical about the future role of imaging-based tissue chracterisation in the management of cancer, the following “Statement paper” ESR statement on the stepwise development of imaging biomarkers published online: 9 February 2013, by the European Society of Radiology (ESR), should provide substantial reassurance that this kind of technology will become a must! In support of this claim I quote the following information:
“The European Society of Radiology and its related European Institute for Biomedical Imaging Research (EIBIR) should have a relevant role in coordinating future developments of biomarkers and in the assessment and validation of imaging biomarkers as surrogate end points.
Acknowledgements
This paper was kindly prepared by the ESR Subcommittee on Imaging Biomarkers (Chairperson: Bernard Van Beers. Research Committee Chairperson: Luis Martí-Bonmatí. Members: Marco Essig, Thomas Helbich, Celso Matos, Wiro Niessen, Anwar Padhani, Harriet C. Thoeny, Siegfried Trattnig, Jean-Paul Vallée. Co-opted members: Peter Brader, Nicolas Grenier) on behalf of the European Society of Radiology (ESR) and with the help of Sabrina Doblas, INSERM U773, Paris, France.
It was approved by the ESR Executive Council in December 2012..”
According to ESR: “There is increasing interest in developing the quantitative imaging of biomarkers in personalised medicine”. In this perspective, “Biomarkers” are tissue properties that can be quantitatively and reproducibly measured by imaging devices. One example for a major unmet need, which I found to be most interesting is the imaging-based detection of tumor invasiveness.
Quoting from the paper: ” Biomarkers are defined as “characteristics that are objectively measured and evaluated as indicators of normal biological processes, pathological processes, or pharmaceutical responses to a therapeutic intervention” [1]. Broadly, biomarkers fall into two categories: bio-specimen biomarkers, including molecular biomarkers and genetic biomarkers, and bio-signal biomarkers or imaging biomarkers. Bio-specimen biomarkers are obtained by removing a sample from a patient. Examples of these molecular biomarkers are genes and proteins detected from fluids or tissue samples. Bio-signal biomarkers remove no material from the patient, but rather detect and analyse an electromagnetic, photonic or acoustic signal emitted by the patient [2]. These imaging biomarkershave the advantage of being non-invasive, spatially resolved and repeatable [3]. They are of particular interest if they can overcome the limitations of the established histological “gold standards”. Indeed, invasive reference examinations, such as biopsy, can be inconclusive, are non-representative of the whole tissue (which is a tremendous limitation when assessing malignant tumours, which are known to be heterogeneous) and possess non-negligible levels of mortality and morbidity.
Genetic biomarkers indicate whether a disease may occur, but they are usually inefficient to assess the presence and stage of a disease. Similar to molecular biomarkers, imaging biomarkers can be used for early detection of diseases, staging and grading, and predicting or assessing the response to treatment [3]. Accordingly, because of their relative lower cost compared with imaging, molecular biomarkers may be more appropriate for disease screening and early detection than imaging biomarkers. With their high sensitivity, molecular biomarkers could also detect subclinical stages of disease before any morphological or functional change is detectable on imaging. In contrast, imaging biomarkers are often more useful than molecular biomarkers for disease staging, and also grading and for assessing tumour response, because localised information is crucial.”
The main messages ESR wishes to deliver in this paper are that:
• Using imaging-biomarkers to streamline drug discovery and disease progression will drive a huge advancement in healthcare.
• The clinical qualification and validation of imaging biomarkers technology pose challenges, mainly in establishing the accuracy and reproducibility of such techniques. In that respect, agreements on standards and evaluation methods (e.g. clinical studies design) is imperative.
• There should be high motivation to pursue the development of imaging-biomarkers as the “clinical value of new biomarkers is of the highest priority in terms of patient management, assessing risk factors and disease prognosis.”
The paper deals to a great extent with the requirements on accuracy, reproducibility, standardization and quality control from the process of developing imaging-biomarkers:
“Accuracy: Before being routinely used in the clinic, imaging biomarkers must be validated. Determining the accuracy implies calculating the sensitivity and specificity of the biomarker when compared with a biological process, such as tumour necrosis, which can be assessed at histopathological examination… [6–9] [10,11]
Reproducibility: Repeatability (measurements at short intervals on the same subjects using the same equipment in the same centres) and reproducibility (measurements at short intervals on the same subjects using different facilities in the same and different centres) studies must be conducted for image acquisition and image analysis…. Reproducibility studies are now very often included in scientific papers, as advised by the “standards for reporting of diagnostic accuracy” (STARD) criteria and should ideally include Bland-Altman plots and results of coefficients of repeatability [16, 17].
Standardisation: Standardisation relates to the establishment of norms or requirements about technical aspects. In the development of imaging biomarkers, two main aspects should be considered: Standardisation of image acquisition and Standardisation of image analysis…[18][19–21][22] [27,28] [31–33]
Quality control: Adequate phantoms could be used to validate, on a day-to-day basis, that the biomarker stays robust and to avoid any drift in the machine, acquisition or processing protocol…. [34] [30, 35] [36] [37] [23].”
The proposed development workflow:
“Similar to new drugs, the development of biomarkers has to pass along a pipeline going from discovery, through verification in different laboratories, validation and qualification before they can be used in clinical routine. Validation includes the determination of the accuracy and the precision (reproducibility) of the biomarker and standardisation concerns both acquisition and analysis. Qualification, defined as a “graded, fit-for-purpose evidentiary process linking a biomarker with biological processes and clinical end-points”, is a validation process in large cohorts of patients involving multiple centres, similar to phase III clinical trials, to obtain regulatory approval as surrogate endpoints [4]. A more extensive path to biomarker development has been reported [5]. The first step is the proof of concept, which defines any specific change relevant to the disease that can be studied using the available imaging and computational techniques. The relationship between this change and the presence, grading and response to treatment of the disease constitutes the proof of mechanism. The images needed to extract the biomarker must be appropriate (in terms of resolution, signal and contrast behaviour). Preparation of images relates to improving the data before the analysis (such as segmentation, filtering, interpolation or registration). The analysis and modelling of the signal by computational numerical adjustment of a mathematical model allow extracting the needed information (such as structural, physical, chemical, biological and functional properties). After this voxel-by-voxel computation, the spatial distribution of the biomarker can be depicted by parametric images, defined as derived secondary images which pixels represent the distribution values of a given parameter. Multivariate parametric images obtained by statistical modelling of the relevant parameters allow the reduction of data and a clear definition of the defined disease target. The abnormal values should be defined and measured through histogram analysis. A pilot test on a small sample of subjects, with and without the disease, has to be performed to validate the process—also called proof of principle—and to evaluate the influence of potential variations related to age, sex or any other source of biases. Finally, proofs of efficacy and effectiveness on larger and well-defined series of patients will show the ability of a biomarker to measure the clinical endpoint (Fig. 1).”
Steps for the development of imaging biomarkers (adapted from [5])
The authors admit that the requirement posed on development of imaging-biomarkers represents a huge challenge and they try to offer ideas, mainly taken from the “MRI experience” to overcome certain hurdles. There is one important point on which they do not discuss: the definition of appropriate reference test. It is my own experience, based on many study protocols I developed in the past decade, that without reaching an agreement on that point, the development of imaging-biomarkers will just move in circles. Note, that today’s most “acceptable” reference test is histopathology, which everyone admits (as well mentioned in this paper); suffers many limitations. When it comes to validating imaging-biomarkers, the need to accurately match imaging products with histopathology is an additional major hurdle.
This is why, I see as a necessary step, to develop “real-time” imaging based tissue characterization combined with in-situ imaging-based histology.
References
1.
Biomarkers Definitions Working Group (2001) Biomarkers and surrogate endpoints: preferred definitions and conceptual framework. Clin Pharmacol Ther 69(3):89–95CrossRef
2.
Waterton JC, Pylkkanen L (2012) Qualification of imaging biomarkers for oncology drug development. Eur J Cancer 48(4):409–415PubMedCrossRef
3.
European Society of Radiology (2010) White paper on imaging biomarkers. Insights Imaging 1(2):42–45CrossRef
4.
Wagner JA, Williams SA, Webster CJ (2007) Biomarkers and surrogate end points for fit-for-purpose development and regulatory evaluation of new drugs. Clin Pharmacol Ther 81(1):104–107PubMedCrossRef
5.
Marti Bonmati L, Alberich-Bayarri A, Garcia-Marti G, Sanz Requena R, Pérez Castillo C, Carot Sierra JM, Herrera M (2012) Imaging biomarkers, quantitative imaging, and bioengineering. Radiol 54(3):269–278CrossRef
6.
Lewin M, Poujol-Robert A, Boelle PY et al (2007) Diffusion-weighted magnetic resonance imaging for the assessment of fibrosis in chronic hepatitis C. Hepatology 46(3):658–665PubMedCrossRef
7.
Luciani A, Vignaud A, Cavet M et al (2008) Liver cirrhosis: intravoxel incoherent motion MR imaging–pilot study. Radiology 249(3):891–899PubMedCrossRef
8.
Bonekamp S, Torbenson MS, Kamel IR (2011) Diffusion-weighted magnetic resonance imaging for the staging of liver fibrosis. J Clin Gastroenterol 45(10):885–892PubMedCrossRef
9.
Leitao HS, Doblas S, d’Assignies G, Garteiser P, Daire JL, Paradis V, Geraldes CF, Vilgrain V, Van Beers BE (2012) Fat deposition decreases diffusion parameters at MRI: a study in phantoms and patients with liver steatosis. Eur Radiol 23(2):461-467
10.
Le Bihan D, Urayama S, Aso T, Hanakawa T, Fukuyama H (2006) Direct and fast detection of neuronal activation in the human brain with diffusion MRI. PNAS 103(21):8263–8268PubMedCrossRef
11.
Xu J, Does MD, Gore JC (2011) Dependence of temporal diffusion spectra on microstructural properties of biological tissues. Magn Reson Imaging 29(3):380–390PubMedCrossRef
12.
Sinkus R, Van Beers BE, Vilgrain V, DeSouza N, Waterton JC (2012) Apparent diffusion coefficient from magnetic resonance imaging as a biomarker in oncology drug development. Eur J Cancer 48(4):425–431PubMedCrossRef
13.
Yablonskiy DA, Sukstanskii AL (2010) Theoretical models of the diffusion weighted MR signal. NMR Biomed 23(7):661–681PubMedCrossRef
14.
Eisenhauer EA, Therasse P, Bogaerts J et al (2009) New response evaluation criteria in solid tumours: revised RECIST guideline (version 1.1). Eur J Cancer 45(2):228–247PubMedCrossRef
15.
Padhani AR, Khan AA (2010) Diffusion-weighted (DW) and dynamic contrast-enhanced (DCE) magnetic resonance imaging (MRI) for monitoring anticancer therapy. Target Oncol 5(1):39–52PubMedCrossRef
16.
Bossuyt PM, Reitsma JB, Bruns DE et al (2003) Towards complete and accurate reporting of studies of diagnostic accuracy: the STARD initiative. Radiology 226(1):24–28PubMedCrossRef
17.
Barnhart HX, Barboriak DP (2009) Applications of the repeatability of quantitative imaging biomarkers: a review of statistical analysis of repeat data sets. Transl Oncol 2(4):231–235PubMed
18.
Padhani AR, Liu G, Koh DM et al (2009) Diffusion-weighted magnetic resonance imaging as a cancer biomarker: consensus and recommendations. Neoplasia 11(2):102–125PubMed
19.
Taouli B, Koh DM (2010) Diffusion-weighted MR imaging of the liver. Radiology 254(1):47–66PubMedCrossRef
20.
Kwee TC, Takahara T, Koh DM, Nievelstein RA, Luijten PR (2008) Comparison and reproducibility of ADC measurements in breathhold, respiratory triggered, and free-breathing diffusion-weighted MR imaging of the liver. J Magn Reson Imaging 28(5):1141–1148PubMedCrossRef
21.
Ivancevic MK, Kwee TC, Takahara T et al (2009) Diffusion-weighted MR imaging of the liver at 3.0 Tesla using tracking only navigator echo (TRON): a feasibility study. J Magn Reson Imaging 30(5):1027–1033PubMedCrossRef
22.
Zussman B, Jabbour P, Talekar K, Gorniak R, Flanders AE (2011) Sources of variability in computed tomography perfusion: implications for acute stroke management. Neurosurg Focus 30(6):E8PubMedCrossRef
23.
Rajaraman S, Rodriguez JJ, Graff C et al (2011) Automated registration of sequential breath-hold dynamic contrast-enhanced MR images: a comparison of three techniques. Magn Reson Imaging 29(5):668–682PubMedCrossRef
24.
Wagner M, Doblas S, Daire JL, Paradis V, Haddad N, Leitao H, Garteiser P, Vilgrain V, Sinkus R, Van Beers BE (2012) Diffusion-weighted MR imaging for the regional characterization of liver tumors. Radiology 264(2):464–472PubMedCrossRef
25.
Moffat BA, Chenevert TL, Lawrence TS et al (2005) Functional diffusion map: a noninvasive MRI biomarker for early stratification of clinical brain tumor response. PNAS 102(15):5524–5529PubMedCrossRef
26.
Yang X, Knopp MV (2011) Quantifying tumor vascular heterogeneity with dynamic contrast-enhanced magnetic resonance imaging: a review. J Biomed Biotechnol 732848:1–12
27.
Buckley DL (2002) Uncertainty in the analysis of tracer kinetics using dynamic contrast-enhanced T1-weighted MRI. Magn Reson Med 47(3):601–606PubMedCrossRef
28.
Michoux N, Huwart L, Abarca-Quinones J et al (2008) Transvascular and interstitial transport in rat hepatocellular carcinomas: dynamic contrast-enhanced MRI assessment with low- and high-molecular weight agents. J Magn Reson Imaging 28(4):906–914PubMedCrossRef
29.
Leach MO, Brindle KM, Evelhoch JL et al (2005) The assessment of antiangiogenic and antivascular therapies in early-stage clinical trials using magnetic resonance imaging: issues and recommendations. Br J Cancer 92(9):1599–1610PubMedCrossRef
30.
Buckler AJ, Schwartz LH, Petrick N et al (2010) Data sets for the qualification of volumetric CT as a quantitative imaging biomarker in lung cancer. Opt Express 18(14):15267–15282PubMedCrossRef
31.
Huwart L, Sempoux C, Vicaut E et al (2008) Magnetic resonance elastography for the noninvasive staging of liver fibrosis. Gastroenterology 135(1):32–40PubMedCrossRef
32.
Friedrich-Rust M, Nierhoff J, Lupsor M et al (2012) Performance of Acoustic Radiation Force Impulse imaging for the staging of liver fibrosis: a pooled meta-analysis. J Viral Hepat 19(2):e212–e219PubMedCrossRef
33.
Degos F, Perez P, Roche B et al (2010) Diagnostic accuracy of FibroScan and comparison to liver fibrosis biomarkers in chronic viral hepatitis: a multicenter prospective study (the FIBROSTIC study). J Hepatol 53(6):1013–1021PubMedCrossRef
34.
Chenevert TL, Galban CJ, Ivancevic MK et al (2011) Diffusion coefficient measurement using a temperature-controlled fluid for quality control in multicenter studies. J Magn Reson Imaging 34(4):983–987PubMedCrossRef
35.
Lee YC, Fullerton GD, Baiu C, Lescrenier MG, Goins BA (2011) Preclinical multimodality phantom design for quality assurance of tumor size measurement. BMC Med Phys 11:1PubMedCrossRef
36.
Szegedi M, Rassiah-Szegedi P, Fullerton G, Wang B, Salter B (2010) A proto-type design of a real-tissue phantom for the validation of deformation algorithms and 4D dose calculations. Phys Med Biol 55(13):3685–3699PubMedCrossRef
37.
Wilhjelm JE, Jespersen SK, Falk E, Sillesen H (2006) The challenges in creating reference maps for verification of ultrasound images. Ultrasonics 4(Suppl 1):e141–e146CrossRef
38.
Wang TJ (2011) Assessing the role of circulating, genetic, and imaging biomarkers in cardiovascular risk prediction. Circulation 123(5):551–565PubMedCrossRef
39.
Polonsky TS, McClelland RL, Jorgensen NW et al (2010) Coronary artery calcium score and risk classification for coronary heart disease prediction. JAMA 303(16):1610–1616PubMedCrossRef
40.
Wahl RL, Jacene H, Kasamon Y, Lodge MA (2009) From RECIST to PERCIST: Evolving Considerations for PET response criteria in solid tumors. J Nucl Med 50(Suppl 1):122S–150SPubMedCrossRef
41.
Cummings J, Ward TH, Dive C (2010) Fit-for-purpose biomarker method validation in anticancer drug development. Drug Discov Today 15(19–20):816–825PubMedCrossRef
42.
Richter WS (2006) Imaging biomarkers as surrogate endpoints for drug development. Eur J Nucl Med Mol Imaging 33(Suppl 1):6–10PubMedCrossRef
43.
Woodcock J, Woosley R (2008) The FDA critical path initiative and its influence on new drug development. Annu Rev Med 59:1–12PubMedCrossRef
44.
Hanahan D, Weinberg RA (2011) Hallmarks of cancer: the next generation. Cell 144(5):646–674PubMedCrossRef
45.
Soloviev D, Lewis D, Honess D, Aboagye E (2012) [(18)F]FLT: an imaging biomarker of tumour proliferation for assessment of tumour response to treatment. Eur J Cancer 48(4):416–424PubMedCrossRef
46.
Nguyen QD, Challapalli A, Smith G, Fortt R, Aboagye EO (2012) Imaging apoptosis with positron emission tomography: ‘bench to bedside’ development of the caspase-3/7 specific radiotracer [(18)F]ICMT-11. Eur J Cancer 48(4):432–440
Early in the 21st century, gefitinib, an epidermal growth factor receptor (EGFR) tyrosine kinase inhibitor became available for the treatment of non-small cell lung cancer (NSCLC). Over 80% of selected patients
EGFR mutation-positive patients, respond to gefitinib treatment;
most patients develop acquired resistance to gefitinib within a few years.
Recently, many studies have been performed to determine precisely how to select patients who will respond to gefitinib, the best timing for its administration, and how to avoid the development of acquired resistance as well as adverse drug effects.
Lung cancers are classified according to their histological type. Because each variant has different biological and clinical properties, including response to treatment, a precise classification is essential to provide appropriate therapy for individual patients. Lung cancer consists of two broad categories—non-small cell lung cancer (NSCLC) and small cell lung cancer (SCLC).
The majority of patients with SCLC are diagnosed with
advanced cancer with distant metastasis
high sensitivity to chemotherapy.
response rate (RR) for SCLC is reportedly 60%–80%
complete remission is observed in only 15%–20% of patients
The Potential of Personalized Medicine in Advanced NSCLC Personalized medicine—
matching a patient’s unique molecular profile with an appropriate targeted therapy—
is transforming the diagnosis and treatment of non–small-cell lung cancer (NSCLC).
Through molecular diagnostics, tumor cells may be differentiated based on the presence or absence of
receptor proteins,
driver mutations, or
oncogenic fusion/rearrangements.
The convergence of advancing research in drug development and genetic sequencing has permitted the development of therapies specifically targeted to certain biomarkers, which may offer a differential clinical benefit.
Over the last decade, a growing number of biomarkers have been identified in NSCLC.3,4 To date, 2 of these molecular markers have been shown to have both prognostic and predictive value in patients with advanced NSCLC: epidermal growth factor receptor (EGFR) mutations and anaplastic lymphoma kinase (ALK) rearrangements.5-8 Testing for these biomarkers may provide physicians with more information on which to base treatment decisions, and reflex testing may permit consideration of appropriate therapy from the outset of treatment.2,9,10
References:
Lovly CM, Carbone DP. Lung cancer in 2010: one size does not fit all. Nat Rev Clin Oncol. 2011;8(2):68-70.
Dacic S. Molecular diagnostics of lung carcinomas. Arch Pathol Lab Med. 2011;135(5):622-629.
Herbst RS, Heymach JV, Lippman SM. Lung cancer. N Engl J Med. 2008;359(13):1367-1380.
Quest Diagnostics. Lung Cancer Mutation Panel (EGFR, KRAS, ALK). Sept 17, 2012 http://questdiagnostics.com/hcp/intguide/jsp/showintguidepage.jsp?fn=Lung/TS_LungCancerMutation_Panel.htm.
Rosell R, Gervais R, Vergnenegre A, et al. Erlotinib versus chemotherapy (CT) in advanced non-small cell lung cancer (NSCLC) patients (p) with epidermal growth factor receptor (EGFR) mutations: interim results of the European Erlotinib Versus Chemotherapy (EURTAC) phase III randomized trial. Presented at: 2011 American Society of Clinical Oncology (ASCO) Annual Meeting, J Clin Oncol. 2011;29(suppl). Abstract 7503. Aug 6, 2012. http://www.asco.org/ASCOv2/Meetings/Abstracts?&vmview=abst_detail_view&confID=102&abstractID=78285.
Mok TS, Wu YL, Thongprasert S, et al. Gefitinib or carboplatin-paclitaxel in pulmonary adenocarcinoma. N Engl J Med. 2009;361(10):947-957.
Kwak EL, Bang YJ, Camidge DR, et al. Anaplastic lymphoma kinase inhibition in non–small-cell lung cancer. N Engl J Med. 2010;363(18):1693-1703.
National Comprehensive Cancer Network (NCCN). NCCN Clinical Practice Guidelines in Oncology™: Non-Small Cell Lung Cancer. Version 2.2012. http://www.nccn.org/professionals/physician_gls/PDF/nscl.pdf.Aug 6, 2012
College of American Pathologists (CAP)/International Association for the Study of Lung Cancer (IASLC)/Association for Molecular Pathology (AMP) expert panel. Lung cancer biomarkers guideline draft recommendations. http://capstaging.cap.org/apps/docs/membership/transformation/new/lung_public_comment_supporting_materials.pdf. Aug 6, 2012.
Gazdar AF. Epidermal growth factor receptor inhibition in lung cancer: the evolving role of individualized therapy. Cancer Metastasis Rev. 2010;29(1):37-48.
Background Studies
In 2002, gefitinib (ZD1839; AstraZeneca) , the first epidermal growth factor receptor (EGFR) tyrosine kinase inhibitor, became available as an innovative molecular-targeted drug for the treatment of unresectable NSCLC. Initially, many NSCLC patients were expected to respond to gefitinib because many solid tumors, including NSCLC, are known to overexpress EGFR, which has a role in tumor proliferation and is used as a biomarker to predict poor prognosis. Gefitinib was shown to have a dramatic effect on a limited number of patients; but it was ineffective in 70%–80% of patients with NSCLC. There have been reports of death caused by interstitial pneumonia (IP), one of the critical adverse drug reactions (ADRs) associated with gefitinib use. Therefore, there is a need for predicting the effects of gefitinib, and criteria for selecting patients who could be treated with gefitinib.
In 2004, Lynch et al. and Paez et al. each published, on the same day, sensational reports in the New England Journal of Medicine and Science, identifying somatic mutations in the tyrosine kinase domain of the EGFR gene in patients with gefitinib-sensitive lung cancer, as compared with none of the patients who had no response. Therefore, screening for EGFR mutations in lung cancer showed potential for identifying patients who would respond to gefitinib therapy. It then was found that patients with EGFR mutations in the area of the gene coding for the ATP-binding pocket of the tyrosine kinase domain responded to gefitinib. Consequently, the EGFR genotyping has been used to select patients who will respond to gefitinib. Other genetic mutations have also been reported as indicators of the response or resistance to gefitinib; for example, mutations of the KRAS gene are associated with primary resistance to gefitinib. Thus, screening of EGFR and KRAS is used to
predict the effects of gefitinib and
to select patients who will respond to gefitinib in the clinical setting.
Until now, the effects of gefitinib have been predicted only by genotyping factors, such as EGFR and KRAS mutations. However, Nakamura et al showed a relationship between the blood concentration of gefitinib and its clinical effects. In their study of 23 NSCLC patients with EGFR mutations, the ratio of the gefitinib concentration on day 8 to that on day 3 after the first administration of gefitinib (C8/C3) correlated with the progression-free survival (PFS) period. Patients with a higher C8/C3 ratio had a significantly longer PFS (P = 0.0158, 95% confidence interval [CI]: 0.237–0.862), which suggests the importance of the PK of gefitinib on its clinical outcome. Chmielecki et al. concurrently reported that maintaining a high concentration of erlotinib, another EGFR tyrosine kinase inhibitor (EGFR-TKIs) with the same mechanism of action as gefitinib, could
delay the establishment of drug-resistant tumor cells and
decrease the proliferation rate of drug-resistant cells compared to
treatment using a lower concentration of erlotinib.
Pharmacogenetic profile
Initially, gefitinib was expected to induce a response in patients with tumors that overexpressed EGFR because it exerts its antineoplastic effects by competitively inhibiting the binding of ATP to the ATP-binding site of EGFR. A number of studies contradict this hypothesis:
(1) while approximately 40%–80% of NSCLC overexpress EGFR, only 10%–20% of NSCLC patients respond to gefitinib;5,6 and
(2) while EGFR overexpression is known to be more common in SCC than AC, gefitinib shows a higher antineoplastic effect on AC than on SCC, while other reports indicated no correlation between the expression levels of EGFR and clinical outcomes.
In 2004, somatic mutations were identified in the EGFR tyrosine kinase domain of patients with gefitinib-responsive lung cancer, as compared with no mutations in patients exhibiting no response, and the presence of an EGFR mutation was highly correlated with a good response to gefitinib.The conformational change of the EGFR ATP-binding site caused by genetic mutations constitutively activates the EGFR downstream signaling pathway and increases the malignancy of cancer. Conversely, the conformational change of the ATP-binding site can also increase its affinity for gefitinib; therefore, gefitinib can inhibit the downstream signaling pathway more easily, strongly induces apoptosis, and reduces the proliferation of cancer cells.
Mutations in exons 18–21 of EGFR are predictive factors for the clinical efficacy of gefitinib;
deletions in exon 19 and missense mutations in exon 21 account for ∼90% of these mutations.
The detection of EGFR mutations in exons 19 and 21 is considered to be essential to predict the clinical efficacy of gefitinib. Acquired resistance All responders eventually develop resistance to gefitinib but in 2005, an EGFR mutation in exon 20, which substitutes methionine for threonine at amino acid position 790 (T790M), was reported to be one of the main causes of acquired resistance to gefitinib. The EGFR T790M variant
changes the structural conformation of the ATP-binding site, thereby
increasing the affinity of ATP to EGFR, while
the affinity of gefitinib to ATP is unchanged.
Screening methods for EGFR and KRAS mutations
The detection of EGFR and KRAS mutations has been usually achieved by sequencing DNA amplified from tumor tissues; however, sequencing techniques are too complex, time-consuming, and expensive. The selection of an appropriate method to detect EGFR and KRAS mutations is essential to make an exact prediction of the efficacy of gefitinib in individual patients. Advances in diagnostics and treatments for NSCLC have led to better outcomes and higher standards of what outcomes are expected. These new understandings and treatments have raised multiple new questions and issues with regard to the decisions on the appropriate treatment of NSCLC patients.
Biomarkers are increasingly recognized and applied for guidance in diagnosis, prognosis and treatment decisions and evaluation.
Biologics and newer cancer treatments are enabling the possibility for new combined treatment modalities in earlier stage disease
Maintenance therapy has been shown to be useful, but optimal therapy choices before and after maintenance therapy need clarification
The importance of performance status on treatment decisions
Comparative effectiveness is becoming an expectation across all treatments and diseases, and will prove difficult to accomplish within the complexity of cancer diseases
NCCN Molecular Testing White Paper: Effectiveness, Efficiency, and Reimbursement
PF Engstrom, MG Bloom,GD Demetri, PG Febbo, et al. Personalized medicine in oncology is maturing and evolving rapidly, and the use of molecular biomarkers in clinical decisionmaking is growing. This raises important issues regarding the safe, effective, and efficient deployment of molecular tests to guide appropriate care, specifically regarding laboratory-developed tests and companion diagnostics. In May 2011, NCCN assembled a work group composed of thought leaders from NCCN Member Institutions and other organizations to identify challenges and provide guidance regarding molecular testing in oncology and its corresponding utility. The NCCN Molecular Testing Work Group identified
challenges surrounding molecular testing, including health care provider knowledge, determining clinical utility, coding and billing for molecular tests, maintaining clinical and analytic validity of molecular tests, efficient use of specimens, and building clinical evidence. (JNCCN 2011;9[Suppl 6]:S1–S16)
Executive Summary
The FDA recently announced plans for oversight of laboratory-developed tests (LDTs) and released draft guidance regarding the development of companion diagnostics concurrently with therapeutics, both areas over which the FDA has regulatory authority. As recognized by the FDA, these types of diagnostic tests are used increasingly to directly inform treatment decisions, and this especially impacts patients with cancer and their oncologists. However, because of the increasing complexity of some LDTs and increasing commercial interest in oncology-related LDTs in general, the FDA is considering whether its policy of exercising “enforcement discretion”
for LDTs is still appropriate. To provide guidance regarding challenges of molecular testing to health care providers and other stakeholders, NCCN assembled a work group composed of thought leaders from NCCN Member Institutions and other organizations external to NCCN. The NCCN Molecular Testing Work Group agreed to define molecular testing in oncology as
procedures designed to detect somatic or germline mutations in DNA and
changes in gene or protein expression that could impact the
diagnosis,
prognosis,
prediction, and
evaluation of therapy of patients with cancer.
Therefore, the discussion focused on molecular tests that predict outcomes for therapy. Realizing the importance of personalized medicine in advanced NSCLC
E Topol, B Buehler, GS Ginsburg. Medscape Molec Medicine
Lung Cancer in the Never Smoker Population: An Expert Interview With Dr. Nasser Hanna
Lung cancer in the never smoker population is a distinct disease entity with specific molecular changes, offering the potential for targeted therapy.
Experts And Viewpoint, Medscape Hematology-Oncology, December 2007
An Update on New and Emerging Therapies for NSCLC
Simon L. Ekman, MD, PhD; Fred R. Hirsch, MD, PhD
On completion of these readings participants will be thoroughly familiar with these issues:
The influence of histologic types and genetic and molecular markers on choosing and personalizing therapy in patients with advanced NSCLC
The role of the pathologist in properly classifying subtypes of NSCLC and reporting the presence of molecular markers in tumor samples
Familiarize themselves with effective methods of obtaining adequate tissue samples from patients and recognize the importance of accurate pathologic assessment of NSCLC
The rapid developments in molecular biology have opened up new possibilities for individualized treatment of non-small cell lung cancer (NSCLC), and, in recent years, has mainly focused on the epidermal growth factor receptor (EGFR). A greater understanding of the molecular mechanisms behind
tumorigenesis and
the identification of new therapeutic targets
have sparked the development of novel agents
intended to improve the standard chemotherapy regimens for NSCLC.
Along with the advent of targeted therapy, identifying biomarkers to predict the subset of patients more likely to benefit from a specific targeted intervention has become increasingly important.
EGFR TYROSINE KINASE INHIBITORS
tumor-associated mutations in the tyrosine kinase domain of EGFR have been associated with response to EGFR TKIs
The most common EGFR-sensitizing mutations encompass deletions in exon 19 and a point mutation at L858R in exon 21; together,
they account for approximately 85% of EGFR mutations in NSCLC.
Other EGFR mutations have been detected, particularly in exon 20.
mutations identified in exon 20 have been linked to resistance to EGFR TKIsNon-Small Cell Lung Cancer: Biologic and Therapeutic Considerations for Personalized Management
Taofeek K. Owonikoko, MD, PhD
What is the role and application of molecular profiling in the management of NSCLC?
It is essential to:
Identify advances in the understanding of molecular biology and histologic profiling in the treatment of NSCLC
Summarize clinical data supporting the use of tumor biomarkers as predictors of therapeutic efficacy of targeted agents in NSCLC
Devise an individualized treatment plan for patients with advanced NSCLC based on a tumor’s molecular profile
Identify methods for overcoming barriers to effective incorporation of molecular profiling for the management of NSCLC into clinical practice
Non-small cell lung cancer (NSCLC),the most common type of lung cancer, usually grows and spreads more slowly than small cell lung cancer.
The three common forms of NSCLC are:
Adenocarcinomas are often found in an outer area of the lung.
Squamous cell carcinomas are usually found in the center of the lung next to an air tube (bronchus).
Large cell carcinomas occur in any part of the lung and tend to grow and spread faster than the other two types
Smoking causes most cases of lung cancer. The risk depends on the number of cigarettes you smoke every day and for how long you have smoked. Some people who do not smoke and have never smoked develop lung cancer.
Working with or near the following cancer-causing chemicals or materials can also increase your risk:
Asbestos
Chemicals such as uranium, beryllium, vinyl chloride, nickel chromates, coal products, mustard gas, chloromethyl ethers, gasoline, and diesel exhaust
Certain alloys, paints, pigments, and preservatives
Products using chloride and formaldehyde
Non-small cell lung c
ancer
(NSCLC) accounts for
approximately 85% of all lung cancers.
Lung cancer may produce no symptoms until the disease is well advanced, so early recognition of symptoms may be beneficial to outcome.
At initial diagnosis,
20% of patients have localized disease,
25% of patients have regional metastasis, and
55% of patients have distant spread of disease.
Revisiting Doublet Maintenance Chemo in Advanced NSCLC
H. Jack West, MD
Pemetrexed Versus Pemetrexed and Carboplatin as Second-Line Chemotherapy In Advanced Non-Small-Cell Lung Cancer
Ardizzoni A, Tiseo M, Boni L, et al
J Clin Oncol. 2102;30:4501-4507
Historically, our second-line therapy has evolved into a strategy of pursuing single-agent therapies for patients with advanced non-small cell lung cancer (NSCLC) who have received prior chemotherapy. This approach was developed on the basis of benefits conferred by such established treatments as docetaxel, pemetrexed, and erlotinib — each well-tested as single agents — and evidence indicating a survival benefit in previously treated patients.
A study out of Italy by Ardizzoni and colleagues published in the Journal of Clinical Oncology directly compares carboplatin/pemetrexed with pemetrexed alone, and
it provides more evidence that our current approach of sequential singlet therapy remains appropriate.
This randomized phase 2 trial enrolled 239 patients with advanced NSCLC, initially of any histology, then later amended (September 2008) to enroll
only patients with non-squamous NSCLC because of mounting evidence that pemetrexed is not active in patients with the squamous subtype of advanced NSCLC.
Patients must have received prior chemotherapy (without restriction on regimen except that it could not include pemetrexed). Participants were randomly assigned 1:1 to receive pemetrexed at the standard dose of 500 mg/m2 IV every 21 days or the same chemotherapy with carboplatin at an area under the curve of 5, also IV every 21 days.
The primary endpoint for the trial was progression-free survival (PFS), and the trial was intended to have results pooled with a nearly identically designed trial that was done in The Netherlands. The Dutch trial compared pemetrexed with carboplatin/pemetrexed at the same dose and schedule. The vast majority of patients (97.5%) had a performance status of 0 or 1, and the median age was 64 years.
The Italian study found no evidence to support a benefit in efficacy from the more aggressive doublet regimen. Specifically,
median PFS was 3.6 months with pemetrexed alone vs 3.5 months with carboplatin/pemetrexed.
Response rate (RR) and median overall survival (OS) were also no better with the doublet regimen
RR 12.6% vs 12.5%, median OS 9.2 vs 8.8 months, for pemetrexed and carboplatin/pemetrexed.
Moreover, pooling the data from the Italian trial with the Dutch trial demonstrated no significant differences between the 2 strategies. Subgroup analysis showed that
the patients with squamous NSCLC had a superior median PFS of 3.2 months with the carboplatin doublet vs 2.0 months with pemetrexed alone.
Unfortunately, this only confirms that adding a second agent is beneficial for patients receiving an agent previously shown to be ineffective in that population.
Viewpoint
Putting it in the context of previous data, these results only provide further confirmation that more is not better.
combinations are associated with more toxicity than single-agent therapy, and
this is likely to be especially relevant in previously treated patients whose ability to tolerate ongoing therapy over time may be reduced.
It is critical to balance efficacy with tolerability to enable us to deliver the treatment over a prolonged period. We need to recognize the importance of pacing ourselves if our goal is to administer treatments in a palliative setting for an increasingly longer duration.
Realizing the importance of personalized medicine in advanced NSCLC
E Topol, B Buehler, GS Ginsburg.
Medscape Molec Medicine The Potential of Personalized Medicine in Advanced NSCLC
With the data on the prognostic and predictive biomarkers EGFR and ALK, biomarker testing is increasingly important in therapy decisions in NSCLC
Revisiting Doublet Maintenance Chemo in Advanced NSCLC
H. Jack West, MD http://www.medscape.com/viewarticle/777367
Pemetrexed Versus Pemetrexed and Carboplatin as Second-Line Chemotherapy In Advanced Non-Small-Cell Lung Cancer
Ardizzoni A, Tiseo M, Boni L, et al
J Clin Oncol. 2102;30:4501-4507
Lung Cancer in the Never Smoker Population: An Expert Interview With Dr. Nasser Hanna
Experts And Viewpoint, Medscape Hematology-Oncology, December 2007
Non-Small Cell Lung Cancer: Biologic and Therapeutic Considerations for Personalized Management
Taofeek K. Owonikoko, MD, PhD August 24, 2011. Medscape
An Update on New and Emerging Therapies for NSCLC
Simon L. Ekman, MD, PhD; Fred R. Hirsch, MD, PhD Medscape
Lovly CM, Carbone DP. Lung cancer in 2010: one size does not fit all. Nat Rev Clin Oncol. 2011;8(2):68-70.
Dacic S. Molecular diagnostics of lung carcinomas. Arch Pathol Lab Med. 2011;135(5):622-629.
Herbst RS, Heymach JV, Lippman SM. Lung cancer. N Engl J Med. 2008;359(13):1367-1380.
Gazdar AF. Epidermal growth factor receptor inhibition in lung cancer: the evolving role of individualized therapy.
Cancer Metastasis Rev. 2010;29:37-48.
NCCN Oncology Insights Report on Non-Small Cell Lung Cancer 1.2010
Review of the Treatment of Non-Small Cell Lung Cancer with Gefitinib
T Araki, H Yashima, K Shimizu, T Aomori
Clinical Medicine Insights: Oncology 2012:6 407–421 http://dx.doi.org/10.4137/CMO.S7340
In a remark made to my last post: New envelopment in measuring mechanical properties of tissue, Dr. Aviva Lev-Ari, PhD, RN, Director and Founderof our Open Access Online Scientific Journal: Leaders of Pharmaceutical Business Intelligence, asked whether OCT can be used for the purpose of performing biopsy. My answer to her question was “YES”. I thought that it will be worthwhile explaining why I am so “optimistic” about this:
A conventional biopsy is a process where a tissue sample is being cut out of the body and after being subjected to all kind of chemical processes a thin-film of tissue is trimmed and read under the microscope by a trained pathologist. Can imaging provide histological assessment of “thin-film” of tissue without cutting it out of the body? The answer would be positive if the imaging will result with high resolution reconstruction of a tissue sample identical in quality to a “live-sample” that is put under the microscope.
This article reports an original, first study to perform histological comparison and explore Optical coherence tomography (“OCT”) as a potential imaging technique for the clinical assessment of patients presenting with systemic sclerosis (“SSc”). In their study the investigators used a device emitting low-intensity infrared laser beam, capable of producing high-contrast images of skin up to 2 mm deep with resolutions of 4–10 μm.
[START ORIGINAL PAPER]
ABSTRACT
Background
Skin involvement is of major prognostic value in systemic sclerosis (SSc) and often the primary outcome in clinical trials. Nevertheless, an objective, validated biomarker of skin fibrosis is lacking. Optical coherence tomography (OCT) is an imaging technology providing high-contrast images with 4 μm resolution, comparable with microscopy (‘virtual biopsy’). The present study evaluated OCT to detect and quantify skin fibrosis in SSc.
Methods
We performed 458 OCT scans of hands and forearms on 21 SSc patients and 22 healthy controls. We compared the findings with histology from three skin biopsies and by correlation with clinical assessment of the skin. We calculated the optical density (OD) of the OCT images employing Matlab software and performed statistical analysis of the results, including intraobserver/ interobserver reliability, employing SPSS software.
Results
Comparison of OCT images with skin histology indicated a progressive loss of visualisation of the dermal–epidermal junction associated with dermal fibrosis. Furthermore, SSc affected skin showed a consistent decrease of OD in the papillary dermis, progressively worse in patients with worse modified Rodnan skin score (p<0.0001). Additionally, clinically unaffected skin was also distinguishable from healthy skin for its specific pattern of OD decrease in the reticular dermis (p<0.001). The technique showed an excellent intraobserver and interobserver reliability (intraclass correlation coefficient >0.8).
Conclusions
OCT of the skin could offer a feasible and reliable quantitative outcome measure in SSc. Studies determining OCT sensitivity to change over time and its role in defining skin vasculopathy may pave the way to defining OCT as a valuable imaging biomarker in SSc.
Virtual skin biopsy by OCT
The OCT images acquisition allowed the reconstruction of a virtual skin biopsy measuring 4×0.4×2 mm. The main structure of the healthy skin was easily recognisable by OCT (figure 1).
Virtual biopsy of forearm skin by optical coherence tomography. Representative 3D reconstruction from the tomography of healthy and systemic sclerosis (SSc) (site modified Rodnan skin score=3) skin scans. The keratin of the skin appears as a white line on the surface (k). The epidermis (ED) is quite visible in the healthy skin by the contrast with the increased optical density of the papillary dermis (PD). The dermal– epidermal junction (DEJ) is quite visible in the healthy skin between the ED and PD. On the contrary, neither clear distinction of ED and PD or DEJ is appreciable in the SSc skin. The vessels (*) are numerous and very well recognisable in healthy skin, whereas they appear less numerous and less distinct in the OCT image of SSc skin. Total depth of 3D reconstruction=1.2 mm. Scale bars are calculated by ImageJ.
Some quantitative results – in images:
Validation of optical coherence tomography (OCT) images by histology. (A and B) H&E staining (A) and corresponding OCT scan (B) from a healthy control (HC). The green line is the mean A-scan of the entire OCT image (100 scans) overlaid by matching the scale bars of OCT and histology. The green arrow indicates the nadir of the valley in the mean A-scan, which corresponds to the dermal–epidermal junction clearly visible on both images. The green arrowhead indicates the second peak of the mean OCT A-Scan which corresponds by the overlay to the most superficial region of the papillary dermis. (C and D) H&E staining (C) and corresponding OCT scan (D) from a systemic sclerosis (SSc) patient (site modified Rodnan skin score =3). The red line is the mean A-scan of the OCT image, overlaid by matching the scale bars in the two panels. The red arrow indicates the nadir in the valley of the mean A-scan, which in this case does not correspond to the dermal–epidermal junction. The red arrowhead corresponds to the second peak in mean A-Scan. (E) Overlay of HC and SSc. Scale bar=240 μm.
Optical coherence tomography (OCT) of affected and not affected skin in plaque morphea. (A) OCT of not affected skin. Vertical scale represents depth in micrometre from the surface. The dermal–epidermal junction (DEJ) level is indicated by the white dotted line. Mean A-scan curve is overlaid and displayed in green. (B) OCT of affected skin in morphea patient. Mean A-scan curve is overlaid and displayed in red. Note the poorly visible DEJ and the valley of the curve below the DEJ (arrowhead). (C) Overlay of mean A-scan curves from the analysis of affected and unaffected skin in a morphea patient. Note that in the curves overlay graph both the difference depth of the first valley is clearly appreciable (arrowheads). Similarly the second mean A-scan peak (arrow) is subtle in the affected skin, similar to scleroderma affected skin.
DISCUSSION
The current gold standard for semiquantitative assessment of skin fibrosis, the mRSS, suffers from several shortcomings ranging from the subjectivity of skin palpation assessments and the high level of skill required from the clinical investigator. Even more importantly, a meta-analysis of three independent studies determined an overall within patient interobserver SD of five units independently of the mean skin score,[6 21] which represents an SE ranging from 20% to 26%. A primary outcome measure with 25% of SE entails the recruitment of a large number of patients to attain statistical validity in minimally significant changes, a task often difficult to accomplish given the comparatively low incidence of SSc.
A robust imaging biomarker for the assessment of skin fibrosis in SSc has not previously been reported. Herein we report the first study aimed to validate OCT for the quantitative assessment of skin involvement in SSc.
To date, the limited data on surrogate outcome measures for skin involvement are largely composed of histopathological or molecular changes in affected skin.[22 23] Despite conceptually very valuable, these studies, involving skin biopsies, are invasive and limited because of a site bias, referring to only one precise body area. Moreover, they are difficult to repeat in longitudinal manner and showed no sensitivity to change over time.[24] In this study, we evaluated OCT skin scanning as a reliable and quantitative tool that could be used as a surrogate marker of skin fibrosis. The technique requires minimal operator training, less than 10s per site examined, and offers the great advantage of saving image files for further or centralised operator independent analysis. This latter is a particularly useful tool limiting the ‘hands on’ time in the clinic office and allowing a centralised, blinded assessment of results in clinical trials.
We observed an excellent correlation of OCT mean A-Scan curves and mRSS score at the site of analysis. More importantly, the corroboration of our OCT findings with pathological changes at the DEJ provides a robust construct validity for the technique. Of interest, we found that the changes of the OD of the dermis in SSc are similar to the ones observed in a case of plaque morphea, corroborating even further the potential value of OCT in measuring skin fibrosis.
Additional Comment
HFUS (High Frequensy Ultrasound) has been recently suggested to offer a quantitative assessment of skin thickness in SSc by several studies.8–10 In contrast with ultrasound, OCT does not require any use of gels, is able to give a higher resolution images and the analysis algorithm is automatic, not involving any operator interpretation. Nevertheless, since the penetration of OCT is limited to the first millimetre of skin, OCT and HFUS may be explored as complementary imaging biomarkers in SSc.
REFERENCES
1 Jimenez SA, Derk CT. Following the molecular pathways toward an understanding of the pathogenesis of systemic sclerosis. Ann Intern Med 2004;140:37–50.
2 Varga J, Abraham D. Systemic sclerosis: a prototypic multisystem fibrotic disorder. J Clin Invest 2007;117:557–67.
3 Gabrielli A, Avvedimento EV, Krieg T. Scleroderma. N Engl J Med 2009;360:1989–2003.
4 Clements PJ, Hurwitz EL, Wong WK, et al. Skin thickness score as a predictor and correlate of outcome in systemic sclerosis: high-dose versus low-dose penicillamine trial. Arthritis Rheum 2000;43:2445–54.
5 Steen VD, Medsger TA Jr. Improvement in skin thickening in systemic sclerosis associated with improved survival. Arthritis Rheum 2001;44:2828–35.
6 Pope JE, Baron M, Bellamy N, et al. Variability of skin scores and clinical measurements in scleroderma. J Rheumatol 1995;22:1271–6.
Clements PJ, Lachenbruch PA, Seibold JR, et al. Skin thickness score in systemic
sclerosis: an assessment of interobserver variability in 3 independent studies. J Rheumatol 1993;20:1892–6.
8 Akesson A, Hesselstrand R, Scheja A, et al. Longitudinal development of skin involvement and reliability of high frequency ultrasound in systemic sclerosis. Ann Rheum Dis 2004;63:791–6.
9 Moore TL, Lunt M, McManus B, et al. L. Seventeen-point dermal ultrasound scoring system—a reliable measure of skin thickness in patients with systemic sclerosis. Rheumatology (Oxford) 2003;42:1559–63.
10 Kaloudi O, Bandinelli F, Filippucci E, et al. High frequency ultrasound
measurement of digital dermal thickness in systemic sclerosis. Ann Rheum Dis 2010;69:1140–3.
11 Aden N, Shiwen X, Aden D, et al. Proteomic analysis of scleroderma lesional skin reveals activated wound healing phenotype of epidermal cell layer. Rheumatology (Oxford) 2008;47:1754–60.
12 Aden N, Nuttall A, Shiwen X, et al. Epithelial Cells Promote Fibroblast Activation via IL-1alpha in Systemic Sclerosis. J Invest Dermatol 2010;130:2191–200.
13 Gambichler T, Jaedicke V, Terras S. Optical coherence tomography in dermatology: technical and clinical aspects. Arch Dermatol Res 2011;303:457–73.
14 Marschall S, Sander B, Mogensen M, et al. Optical coherence tomography-current technology and applications in clinical and biomedical research. Anal Bioanal Chem 2011;400:2699–720.
15 Coleman AJ, Richardson TJ, Orchard G, et al. Histological correlates of optical coherence tomography in non-melanoma skin cancer. Skin Res Technol 2013;19: e10–9.
16 Preliminary criteria for the classification of systemic sclerosis (scleroderma). Subcommittee for scleroderma criteria of the American Rheumatism Association Diagnostic and Therapeutic Criteria Committee. Arthritis Rheum 1980;23:581–90.
17 Collins TJ. ImageJ for microscopy. Biotechniques 2007;43:25–30.
18 Clendenon JL, Phillips CL, Sandoval RM, et al. Voxx: a PC-based, near real-time
volume rendering system for biological microscopy. Am J Physiol Cell Physiol 2002;282:C213–18.
19 Bland JM, Altman DG. Statistical methods for assessing agreement between two methods of clinical measurement. Lancet 1986;1:307–10.
20 LeRoy EC, Black C, Fleischmajer R, et al. Scleroderma (systemic sclerosis): classification, subsets and pathogenesis. J Rheumatol 1988;15:202–5.
21 Merkel PA, Silliman NP, Clements PJ, et al. Patterns and predictors of change in outcome measures in clinical trials in scleroderma: an individual patient meta-analysis of 629 subjects with diffuse cutaneous systemic sclerosis. Arthritis Rheum 2012;64:3420–9.
22 Farina G, Lafyatis D, Lemaire R, et al. A four-gene biomarker predicts skin disease in patients with diffuse cutaneous systemic sclerosis. Arthritis Rheum 2010;62:580–8.
23 Milano A, Pendergrass SA, Sargent JL, et al. Molecular subsets in the gene expression signatures of scleroderma skin. PLoS One 2008;3:e2696.
24 Pendergrass SA, Lemaire R, Francis IP, et al. Intrinsic gene expression subsets of


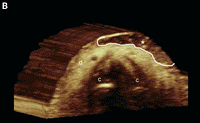

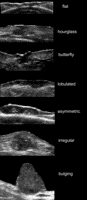

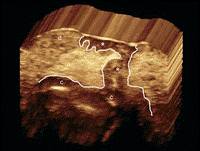
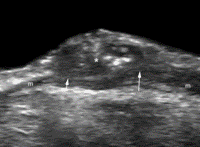


![Steps for the development of imaging biomarkers (adapted from [5])](https://i0.wp.com/pharmaceuticalintelligence.com/wp-content/uploads/2013/03/fig-1.gif)
 signal...")


