Healthcare analytics, AI solutions for biological big data, providing an AI platform for the biotech, life sciences, medical and pharmaceutical industries, as well as for related technological approaches, i.e., curation and text analysis with machine learning and other activities related to AI applications to these industries.
Study led by researchers at Caltech shows that pulsing can allow two proteins to interact with each other in a rhythmic fashion that allows them to control genes.
Even in a calm, unchanging environment, cells are not static. Among other actions, cells activate and then deactivate some types of transcription factors—proteins that control the expression of genes—in a series of unpredictable and intermittent pulses. Since discovering this pulsing phenomenon, scientists have wondered what functions it could provide for cells.
Now, a new study from Caltech researchers shows that pulsing can allow two proteins to interact with each other in a rhythmic fashion that allows them to control genes. Specifically, when the expression of the transcription factors goes in and out of sync, gene expression also goes up and down. These rhythms of activation, the researchers say, may also underlie core processes in the cells of organisms from across the kingdoms of life.
“The way transcription factor pulses sync up with one another in time could play an important role in allowing cells to process information, communicate with other cells, and respond to stress,” says paper coauthor Michael Elowitz, a professor of biology and biological engineering and an investigator with the Howard Hughes Medical Institute.
The research was led by Caltech postdoctoral scholar Yihan Lin. Other Caltech authors of the paper are Assistant Professor of Chemistry Long Cai; Chang Ho Sohn, a staff scientist in the Cai lab; and Elowitz’s former graduate student Chiraj K. Dalal (PhD ’10), now at UC San Francisco.
Cai, Dalal, and Elowitz reported a functional role for transcription factor pulsing in 2008. In the meantime, researchers worldwide have been steadily uncovering similar surges of protein activity across diverse cell types and genetic systems.
Realizing that many different factors are pulsing in the same cell even in unchanging conditions, the Caltech scientists began to wonder if cells might adjust the relative timing of these pulses to enable a novel sort of time-based regulation. To find out, they set up time-lapse movies to follow two pulsing proteins and a target gene in real time in individual yeast cells.
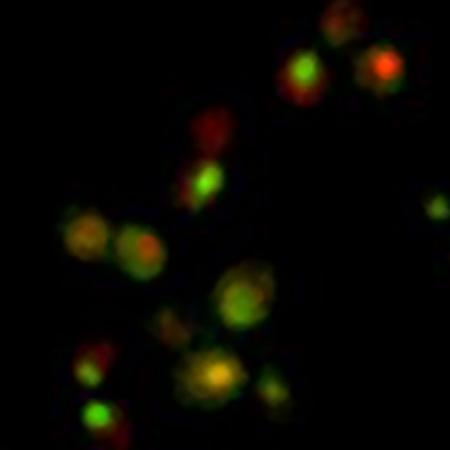
The team tagged two central transcription factors named Msn2 and Mig1 with green and red fluorescent proteins, respectively. When the transcription factors are activated, they move into the nucleus, where they influence gene expression. This movement—as well as the activation of the factors—can be visualized because the fluorescent markers concentrate within the small volume of the nucleus, causing it to glow brightly, either green, red, or both. The color choice for the fluorescent tags was symbolic: Msn2 serves as an activator, and Mig1 as a repressor. “Msn2, the green factor, steps on the gas and turns up gene expression, while Mig1, the red factor, hits the brakes,” says Elowitz.
When the scientists stressed the yeast cells by adding heat, for example, or restricting food, the pulses of Msn2 and Mig1 changed their timing with respect to one another, with more or less frequent periods of overlap between their pulses, depending upon the stressing stimulus.
Generally, when the two transcription factors pulsed in synchrony, the repressor blocked the ability of the activator to turn on genes. “It’s like someone simultaneously pumping the gas and brake pedals in a car over and over again,” says Elowitz.
But when they were off-beat, with the activator pulsing without the repressor, gene expression increased. “When the cell alternates between the brake and the gas—the Msn2 transcription factor in this case—the car can move,” says Elowitz. As a result of these stress-altered rhythms, the cells successfully produced more (or fewer) copies of certain proteins that helped the yeast cope with the unpleasant situation.
Previously, researchers have thought that the relative concentrations of multiple transcription factors in the nucleus determine how they regulate a common gene target—a phenomenon known as combinatorial regulation. But the new study suggests that the relative timing of the pulses of transcription factors may be just as important as their concentration.
“Most genes in the cell are regulated by several transcription factors in a combinatorial fashion, as parts of a complex network,” says Cai. “What we’re now seeing is a new mode of regulation that controls the pulse timing of transcription factors, and this could be critical to understanding the combinatorial regulation in genetic networks.”
“There appears to be a layer of time-based regulation in the cell that, because it can only be observed with movies of individual cells, is still largely unexplored,” says Lin. “We look forward to learning more about this intriguing and underappreciated form of gene regulation.”
In future research, the scientists will try to understand how prevalent this newfound mode of time-based regulation is in a variety of cell types and will examine its involvement in gene regulation systems. In the context of synthetic biology—the harnessing and modification of biological systems for human technological applications—the researchers also hope to develop methods to control such pulsing to program new cellular behaviors.
Combinatorial gene regulation by modulation of relative pulse timing.
Nature. Nov 5, 2015; 527(7576):54-8. doi: 10.1038/nature15710. Epub 2015 Oct 14.
Studies of individual living cells have revealed that many transcription factors activate in dynamic, and often stochastic, pulses within the same cell. However, it has remained unclear whether cells might exploit the dynamic interaction of these pulses to control gene expression. Here, using quantitative single-cell time-lapse imaging of Saccharomyces cerevisiae, we show that the pulsatile transcription factors Msn2 and Mig1 combinatorially regulate their target genes through modulation of their relative pulse timing. The activator Msn2 and repressor Mig1 showed pulsed activation in either a temporally overlapping or non-overlapping manner during their transient response to different inputs, with only the non-overlapping dynamics efficiently activating target gene expression. Similarly, under constant environmental conditions, where Msn2 and Mig1 exhibit sporadic pulsing, glucose concentration modulated the temporal overlap between pulses of the two factors. Together, these results reveal a time-based mode of combinatorial gene regulation. Regulation through relative signal timing is common in engineering and neurobiology, and these results suggest that it could also function broadly within the signalling and regulatory systems of the cell.
Pulsatile Dynamics in the Yeast Proteome
Chiraj K. Dalal,1,2 Long Cai,1,2 Yihan Lin,1 Kasra Rahbar,1 and Michael B. Elowitz1, * 1
Howard Hughes Medical Institute, Division of Biology and Bioengineering, California Institute of Technology, Pasadena, CA 91125, USA
The activation of transcription factors in response to environmental conditions is fundamental to cellular regulation. Recent work has revealed that some transcription factors are activated in stochastic pulses of nuclear localization, rather than at a constant level, even in a constant environment [ 1–12 ]. In such cases, signals control the mean activity of the transcription factor by modulating the frequency, duration, or amplitude of these pulses. Although specific pulsatile transcription factors have been identified in diverse cell types, it has remained unclear how prevalent pulsing is within the cell, how variable pulsing behaviors are between genes, and whether pulsing is specific to transcriptional regulators or is employed more broadly. To address these issues, we performed a proteome-wide movie-based screen to systematically identify localization-based pulsing behaviors in Saccharomyces cerevisiae. The screen examined all genes in a previously developed fluorescent protein fusion library of 4,159 strains [ 13 ] in multiple media conditions. This approach revealed stochastic pulsing in ten proteins, all transcription factors. In each case, pulse dynamics were heterogeneous and unsynchronized among cells in clonal populations. Pulsing is the only dynamic localization behavior that we observed, and it tends to occur in pairs of paralogous and redundant proteins. Taken together, these results suggest that pulsatile dynamics play a pervasive role in yeast and may be similarly prevalent in other eukaryotic species.
Since most pulsing proteins are members of a pair of paralogous or functionally redundant transcription factors, one explanation for the evolution of pulsing is one in which pulsing is ancient and existed prior to the whole-genome duplication (estimated to be w80 million years ago [20]). Since then, pulsing appears to have been lost only in some proteins (Mig3 and Rtg3), and the paralogs that have retained the ability to pulse have changed in their dynamics (Figure 3). Alternatively, paralogs that both pulse could have acquired pulsatile regulation through shared regulatory inputs that later became pulsatile. Further work analyzing whether proteins orthologous to the pulsing transcription factors described here also pulse, specifically in species that diverged prior to the whole-genome duplication, will distinguish between these hypotheses.
Recent work shows that pulsatile regulation occurs in diverse mammalian systems including NF-AT [9], p53 [10], Erk signaling [11], TGF-b signaling [12], and NF-kB [22–24]. Moreover, many bacterial systems, such as persistence in Mycobacterium smegmatis [25] and bacterial competence [26], sporulation [27], and stress response in Bacillus subtilis [28], employ pulsing. The presence of pulsing in so many systems across a wide range of species suggests that pulsing may be a common solution to many biological problems. For example, pulsing has already been shown to proportionally regulate entire regulons of target genes [2, 7], implement transient differentiation [26, 29], enable a multi-cell-cycle timer [27], and promote bet-hedging [25]. Pulsing may provide a time-based mode of regulation that facilitates these and other functions [1].
Figure 3. Pulsing Is Variable Single-cell traces show that pulses vary from cell to cell (different colors on the same trace), from paralog to paralog (across columns) and from protein to protein (A–L). All traces are from the same movie that generated corresponding filmstrips in Figure 2. All traces have been smoothed. See also Figure S2 and Movie S1. pulsing may be a common solution to many biological problems. For example, pulsing has already been shown to proportionally regulate entire regulons of target genes [2, 7], implement transient differentiation [26, 29], enable a multi-cell-cycle timer [27], and promote bet-hedging [25]. Pulsing may provide a time-based mode of regulation that facilitates these and other functions [1].
Taken together, these observations reveal that pulsatility is surprisingly pervasive in cells. It will now be critical to determine its mechanisms and functions and understand how these dynamics are integrated into the core functions of living cells. Although recent work has provided new insights into Msn2 pulsing [3, 4, 7, 8, 30, 31] and other work has provided a mechanism for pulsatile activation of a sigma factor in bacteria [28], we still lack a full understanding of the mechanisms of pulse generation and modulation for any yeast transcription factor. Do different pulsing systems use a common type of mechanism for pulsing, or are there many distinct mechanisms that can generate similar pulse dynamics? Pulsatility appears to be a core regulatory mechanism in yeast and most likely in other cell types as well [9]. The pulsatile proteins identified here should provide a starting point for understanding the roles that this dynamic regulatory mechanism plays in diverse cell types.
The title places scientific facts in the correct direction. However, for fast regulatory responses (those that keeps cells alive), no change in gene expression is required.
Cognition and behavior rely on communication between individual neurons and extensive interactions between neural networks. But when synaptic dysfunction occurs, the results can be dire, leading to neurodegenerative symptoms in Alzheimer’s disease.
“The brain is the seed of our personal identity,” said Valina Dawson, Ph.D., director of neurogeneration and stem cell programs at Johns Hopkins University in Baltimore, Maryland. “It allows us to interact with our world but when things go wrong in the brain, it’s disastrous for the individual as well as the family.
“Our ability to treat these diseases is limited at the moment. We need new insight into what goes wrong.”
A lesser-known protein
Researchers, for years, have targeted amyloid beta (Aβ) in attempts to halt the progression of Alzheimer’s disease, and have recently, shown increased interest in the protein, tau.
But Paula Pousinha, Ph.D., at the French National Centre for Scientific Research, has focused her research on a lesser-known protein fragment: amyloid precursor protein intracellular domain (AICD). AICD is a fragment of amyloid precursor protein (APP), which is formed at the same time as Aβ in the brain. New evidence suggests that in addition to Aβ, AICD also disrupts communication between neurons during the progression of Alzheimer’s disease. Pousinha presented thesepublished findings at this year’s Society for Neuroscience (SfN) conference, which took place from October 17 to 21 in Chicago.
“Although AICD has been known for more than 10 years, it has been poorly studied,” said Pousinha.
Crtl 1-Venus. Fusion of a fluorescent protein to small link proteins in the PNN allows tracking of PNN dynamics over time. Credit: S.F. Palida et al.
Pousinha’s research team demonstrated that overexpressing AICD levels with AAV vector in rats’ brains “perturbs neuronal communication in the hippocampus,” a key structure necessary in forming memories and an area earliest affected in Alzheimer’s disease.“In normal animals, if we apply to these neurons a high-frequency stimulation, afterward the neurons are stronger,” said Pousinha. “Neurons where we overexpressed AICD failed to have this potentization.”
Pousinha doesn’t negate the importance of Aβ in the development of neurodegenerative diseases. “Our study doesn’t exclude the pathological effects of Aβ,” she said. “We believe that Alzheimer’s disease is much more complex and has more than one candidate that has implications.
“It’s very important for the scientific community to understand the role of all these APP fragments of neuroinflammation — different pieces of the puzzle of how we can stop the disease progression.”
How do memories persist in the brain long term?
New research, also presented at this year’s SfN, has implications for understanding memory to develop treatments for Alzheimer’s disease and dementias. Sakina Palida, a graduate student at the University of California, San Diego found that localized modifications in the perineuronal net (PNN) at synapses could be a mechanism by which information is stably encoded and preserved in the brain over time.
“We still don’t understand how we stably encode and store memories in our brains for up to our entire lifetimes,” said Palida. The prevailing idea on how memories are maintained over time generally focus on postsynaptic proteins, said Palida. “But the problem with looking at intracellular synaptic proteins is that the majority turn over rapidly, of hours to at most a few days. So they’re very unstable.”
So, Palida and her team identified PNN as an ideal substrate for long-term memory. “Kind of like how you carve into stone — stone is a stable substrate — you retain the information regardless of what comes and goes over it.” They demonstrated that individual PNN proteins are highly stable, and that the PNN is locally degraded when synapses are strengthened.
Cord Blood Cells As a Potential Treatment for Alzheimer’s Disease
Jared Ehrhart from the University of South Florida, who also serves as the Director of Research and Development at Saneron CCEL Therapeutics Inc, and his coworkers have shown that cells from umbilical cord blood can not only improve the health of mice that have an experimental form of Alzheimer’s disease (AD), but these can also be administered intravenously, which is safer and easier than other more invasive procedures.
Laboratory mice can be engineered to harbor mutations that can cause a neurodegenerative disease that greatly resembles human AD. One such mouse is the PSAPP mouse that harbors two mutations that are known to cause an inherited, early-onset form of AD in humans. By placing both mutations in the same mouse, the animal forms the characteristic protein plaques more rapidly and shows significant AD symptoms and brain pathology.
Ehrhart used PSAPP mice to test the ability of human umbilical cord blood to ameliorate the symptoms of AD. He injected one million Human Umbilical Cord Blood Cells (HUCBCs) into the tail veins of PSAPP mice and 2.2 million into the tail veins of Sprague-Dawley rats. Then he harvested their tissues at 24 hours, 7 days, and 30 days after injection. Then Ehrhart and his team used a variety of techniques to detect the presence of the HUCBCs.
Interestingly, the HUCBCs were able to cross the blood-brain barrier and take up residence in the brain. The cells remained in the brain and survived there for up to 30 days and did not promote the growth of any tumors.
Several studies have shown that the administration of HUCBCs to mice with a laboratory form of AD can improve the cognitive abilities of those mice (see Darlington D, et al., Cell Transplant. 2015;24(11):2237-50; Banik A, et al., Behav Brain Res. 2015 Sep 15;291:46-59; Darlington D, et al., Stem Cells Dev. 2013 Feb 1;22(3):412-21). However, in such cases it is essential to establish that the administered cells actually found their way to the site of damage and exerted a regenerative response.
Even though Ehrhart and his troop found that the intravenously administered HUCBCs were widely distributed throughout the bodies of the animals, they persisted in the central nervous system for up to one month after they were injected. In the words of this publication, which appeared in Cell Transplantation, the HUCBCs were “broadly detected in both in the brain and several peripheral organs, including the liver, kidneys, and bone marrow.”. The fact that such a minimally invasive procedure like intravenous injection can effectively introduce these cells into the bodies of the PSAPP mice and still produce a significant therapeutic effect is a significant discovery.
Ehrhart and his colleagues concluded that HUCBCs might provide therapeutic effects by modulating the inflammation that tends to accompany the onset of AD. Furthermore, these cells do not need to be delivered by means of an invasive procedure like intracerebroventricular injection. Furthermore, even though HUCBCs were detected in other organs, their numbers in those places was not excessive and the ability of the HUCBCs to cross the blood-brain barrier suggests that these cells might serve as safe, effective therapeutic agents for AD patients some day.
Crtl1-Venus Neurons. Tracking PNN dynamics in live cells, in mouse brain tissue. (Credit: S.F. Palida et al.)
And the team also demonstrated that mice lacking enzymes that degrade the PNN have deficient long-term, but not short-term, memory. “Which is a really exciting new result,” said Palida.
To track the PNN in live animals, Palida and her team fused a fluorescent protein to a small link protein in the PNN to allow tracking of PNN dynamics in real time. They also monitored PNN degradation in live cells after stimulating neurons with brain-derived neurotrophic factor (BDNF), a chemical secreted in the nervous system to enhance signaling — and observed localized degradation of the PNN at some newly formed synapses.
What’s next? “We’re currently making transgenic animals to express this protein, which would allow us to monitor PNN dynamics simultaneously with synaptic dynamics in a live animal brain, and really investigate this hypothesis further,” said Palida.
Alzheimer’s disease (AD) is a neurodegenerative disease that begins as mild short-term memory deficits and culminates in total loss of cognition and executive functions. The main culprit of the disease, resulting from Amyloid-Precursor Protein (APP) processing, has been thought to be amyloid-b peptide (Ab). However, despite the genetic and cell biological evidence that supports the amyloid cascade hypothesis, it is becoming clear that AD etiology is complex and that Ab alone is unable to account for all aspects of AD [Pimplikar et al. J Neurosci.30: 14946. 2010]. Gamma-secretase not only liberates Ab, but also its C-terminal intracellular counterpart called APP intracellular domain (AICD) [Passer. et al. JAlzheimers Dis.2: 289-301. 2000], which is known to also accumulate in AD patient’s brain [Ghosal et al. PNAS.106:18367. 2009], but surprisingly little is known about its functions in the hippocampus. To address this crucial issue, we increased AICD production in vivo in adult CA1 pyramidal neurons, mimicking the human pathological condition. Different ex-vivo electrophysiological and pharmacological approaches, including double- patch of neighbor neurons were used. We clearly demonstrate that in vivo AICD production increases synaptic NMDA receptor currents. This causes a frequency-dependent disruption of synaptic signal integration, leading to impaired long-term potentiation, which we were able to rescue by different pharmacological approaches. Our results provide convincing and entirely novel evidence that increased in vivo production of AICD is enough, per se, to cause synaptic dysfunction in CA1 hippocampal neurons.
Multiple low-dose infusions of human umbilical cord blood cells improve cognitive impairments and reduce amyloid-β-associated neuropathology in Alzheimer mice.
Alzheimer’s disease (AD) is the most common progressive age-related dementia in the elderly and the fourth major cause of disability and mortality in that population. The disease is pathologically characterized by deposition of β-amyloid plaques neurofibrillary tangles in the brain. Current strategies for the treatment of AD are symptomatic only. As such, they are less than efficacious in terms of significantly slowing or halting the underlying pathophysiological progression of the disease. Modulation by cell therapy may be new promising disease-modifying therapy. Recently, we showed reduction in amyloid-β (Aβ) levels/β-amyloid plaques and associated astrocytosis following low-dose infusions of mononuclear human umbilical cord blood cells (HUCBCs). Our current study extended our previous findings by examining cognition via (1) the rotarod test, (2) a 2-day version of the radial-arm water maze test, and (3) a subsequent observation in an open pool platform test to characterize the effects of monthly peripheral HUCBC infusion (1×10(6) cells/μL) into the transgenic PSAPP mouse model of cerebral amyloidosis (bearing mutant human APP and presenilin-1 transgenes) from 6 to 12 months of age. We show that HUCBC therapy correlates with decreased (1) cognitive impairment, (2) Aβ levels/β-amyloid plaques, (3) amyloidogenic APP processing, and (4) reactive microgliosis after a treatment of 6 or 10 months. As such, this report lays the groundwork for an HUCBC therapy as potentially novel alternative to oppose AD at the disease-modifying level.
Alzheimer’s disease (ad) is the most common progressive age-related dementia, and is pathologically characterized by the deposition of amyloid-β peptide (Aβ) as amyloid plaques in the brain parenchyma and neurofibrillary tangles (NFTs) within neurons. As a result of the atrophy that occurs in both cortical and subcortical regions, patients suffer cognitive and emotional dysregulation leading eventually to an inability to perform acts of daily living independently and safely. In fact, AD has emerged as a national and international pandemic. According to the World Alzheimer Report 2010, dementia patients account for 35.6 million in worldwide, and are expected to increase to 65.7 million by 2030 and 115.4 million by 2050. Currently, the number of AD patients is around 1% of the world’s gross domestic product. Therefore, it is becoming increasingly evident that a more effective treatment or prophylaxes are needed in the near future. This is because Aβ plaques are potent activators of both microglia and astrocytes—central nervous system (CNS) resident immuno-competent cells that respond to cerebral amyloidosis by chronic, pro-inflammatory activation, also known as “inflammaging” (see review [1]). While it was once thought that activation of microglia and astrocytes in AD brains was an epiphenomenon and not a pathoetiological contributor to AD, more recent studies implicate this Aβ-mediated inflammatory cascade as an etiological perpetrator of AD. For example, therapeutic strategies aimed at manipulating this inflammatory cascade, including Aβ immunization, non-steroidal anti-inflammatory drugs, and modulation of microglial activation, are all able to reduce AD-like pathology and improve cognitive impairments in AD transgenic mouse models [2] and, in some cases, reduce AD pathology in humans [3].
While it is true that no model fully recapitulates AD, transgenic animal models pose novel insights into the pathophysiology of Aβ toxicity. This is especially so with regards to the effects of various Aβ species and the probable pathogenic role of Aβ oligomers [4]. In the PSAPP mouse model of cerebral amyloidosis (bearing mutant human APPsw and presenilin-1 transgenes), there are large numbers of compact Aβ plaques in the hippocampus and cerebral cortex. These mice demonstrate greatly accelerated β-amyloid deposition compared with Tg APPsw mice that is apparent as early as 16 weeks of age [5]. Concurrently, they show increased levels of both Aβ1–40 and Aβ1–42 in their parenchyma and a reduced performance of spatial working memory in the period preceding overt Aβ deposition [5]. Such findings support a critical role of Aβ1–42 in the pathogenesis of AD and suggest a neurotoxic effect of soluble forms of Aβ as well [6].
Human umbilical cord blood cells (HUCBCs) have a unique immunomodulatory potential. Therapeutic benefits derived from HUCBC treatment have been suggested to arise from modulation of peripheral inflammatory processes, which in turn affects inflammation in the brain parenchyma, and the mobilization of adult stem cells from the bone marrow (BM) [7–11]. Indeed, in the animal model of stroke, HUCBCs have been shown to promote a strong anti-inflammatory T helper 2 (Th2) response [7], as opposed to the deleterious proinflammatory T helper cell type 1 (Th1) response. Interestingly, this observation was seen in conjunction with reduced infarct volume and very importantly with rescue of neurological deficits [7,12–14].
…………
HUCBC studies done in vitro have shown that these cells secrete soluble factors that have salutary effects [16,58]. Cultured HUCBC supernatants, for example, stimulate survival of neural cells and peripheral blood mononuclear cells cultured under conditions designed to induce cell stress and limit protein synthesis [12]. Moreover, HUCBCs have the capacity to stimulate generation of a vast amount of cytokines and neurotrophic factors that modify inflammatory responses, including IL-11, CSF-1, NGF, and thrombopoietin [7,22,23]. It has been reported that HUCBC entry into the brain is not required to promote neuroprotection [59]. According to the report just outlined, recovery following brain injury is mediated through peripheral anti-inflammatory responses resulting in brain recovery [9]. This is in accord with our results that indicated more of a peripheral, HUCBC-mediated CNS affect, since the cells were not detected in the mouse brain for any significant amount of time.
On the other hand, it should be noted that it has been shown that after irradiation, peripheral macrophages are able to penetrate the brain and mitigate cerebral amyloidosis in AD mice, implying that hematogenously derived macrophages are efficient at phagocytosing and clearing Aβ deposits [18]. Nevertheless, earlier reports have shown that Aβ can also be phagocytosed or cleared by brain-resident microglia [58,60,61].
In the current experimental paradigm, we did not detect the presence of brain-infiltrating macrophages. Specifically, we stained for CD45 (a marker for both macrophages and microglia), and observed that in and around Aβ plaques there were process-bearing cells that morphologically resembled microglia. Further, vascular “cuffing” that would suggest the presence of infiltrating macrophages that are frequently observed in other CNS inflammatory conditions, such as experimental autoimmune encephalomyelitis [62], was not detected. Also, given the difficulties inherent to distinguishing macrophages from microglia, and the ease of peripheral macrophages to engraft into the brain, as well as changes of microglial phenotype after brain injury [63], it remains possible that peripheral macrophages contribute to decreased cerebral amyloidosis after treatment with HUCBCs.
In this report, we have demonstrated that HUCBC infusion decreases Aβ/β-amyloid pathology in the brain parenchyma, reduces brain inflammation evidenced by reduction of activated microglia, and improves cognitive impairments associated with the AD-like pathology in PSAPP mice. These HUCBC-imparted beneficial effects, which correlate with increased brain-to-blood efflux of Aβ and a shift from proinflammatory Th1 to anti-inflammatory Th2 cytokines both in the brain and in the periphery, are similar to what we observed in previous studies after Aβ immunization [64–66]. When taken together, our results provide the basis for a novel immunomodulatory strategy for AD using HUCBCs. While the exact mechanism of efficacy of multiple low-dose HUCBC infusions in AD patients is currently being elucidated, further studies investigating which HUCBC secreted factors are capable of modulating neuroinflammation, reducing AD-like pathology, and rescuing cognitive impairments will need to be explored.
GEN News Highlights Nov 13, 2015 Alzheimer’s Drug Candidate Also Reverses Effects of Aging
Scientists at the Salk Institute say they have found that an experimental drug candidate aimed at combating Alzheimer’s disease has a host of unexpected anti-aging effects in animals.
The Salk team expanded upon their previous development of a drug candidate, called J147, which takes a different tack by targeting Alzheimer’s major risk factor: old age. In the new work, the team showed that J147 worked well in a mouse model of aging not typically used in Alzheimer’s research. When these mice were treated with J147, they had better memory and cognition, healthier blood vessels in the brain and other improved physiological features.
The team’s study (“A comprehensive multiomics approach toward understanding the relationship between aging and dementia”) is published in Aging.
“Initially, the impetus was to test this drug in a novel animal model that was more similar to 99 percent of Alzheimer’s cases,” says Antonio Currais, Ph.D., the lead author and a member of the Schubert Cellular Neurobiology Laboratory at Salk. “We did not predict we’d see this sort of anti-aging effect, but J147 made old mice look like they were young, based upon a number of physiological parameters.”
“While most drugs developed in the past 20 years target the amyloid plaque deposits in the brain (which are a hallmark of the disease), none have proven effective in the clinic,” says David Schubert, Ph.D., senior author of the study.
Several years ago, Dr. Schubert and his colleagues began to approach the treatment of the disease from a new angle. Rather than target amyloid, the lab decided to zero in old age. Using cell-based screens against old age-associated brain toxicities, they synthesized J147.
Previously, the team found that J147 could prevent and even reverse memory loss and Alzheimer’s pathology in mice that have a version of the inherited form of Alzheimer’s, the most commonly used mouse model. However, this form of the disease comprises only about 1% of Alzheimer’s cases. For everyone else, old age is the primary risk factor, according to Dr. Schubert. The team wanted to explore the effects of the drug candidate on a breed of mice that age rapidly and experience a version of dementia that more closely resembles the age-related human disorder.
In this latest work, the researchers used a comprehensive set of assays to measure the expression of all genes in the brain, as well as over 500 small molecules involved with metabolism in the brains and blood of three groups of the rapidly aging mice. The three groups of rapidly aging mice included one set that was young, one set that was old, and one set that was old but fed J147 as they aged.
The old mice that received J147 performed better on memory and other tests for cognition and also displayed more robust motor movements. The mice treated with J147 also had fewer pathological signs of Alzheimer’s in their brains. Importantly, because of the large amount of data collected on the three groups of mice, it was possible to demonstrate that many aspects of gene expression and metabolism in the old mice fed J147 were very similar to those of the young animals. These included markers for increased energy metabolism, reduced brain inflammation and reduced levels of oxidized fatty acids in the brain.
Another notable effect was that J147 prevented the leakage of blood from the microvessels in the brains of old mice. “Damaged blood vessels are a common feature of aging in general, and in Alzheimer’s, it is frequently much worse,” points out Dr. Currais.
While these studies represent a new and exciting approach to Alzheimer’s drug discovery and animal testing in the context of aging, the only way to demonstrate the clinical relevance of the work is to move J147 into clinical trials for Alzheimer’s disease, note the researchers.
“If proven safe and effective for Alzheimer’s, the apparent anti-aging effect of J147 would be a welcome benefit,” adds Dr. Schubert. The team aims to begin human trials next year.
J147 was developed at Salk in the laboratory of David Schubert, a professor in the Cellular Neurobiology Laboratory. He said,
“It’s been known for a long time that people in India don’t get very much Alzheimer’s relative to what happens in the United States and the rest of the world.
“One of the curiosities about the diet in India is that they eat a lot of curry. A major spice in curry is turmeric. A major component of turmeric is curcumin.
“Curcumin has been around for a while. It is an FDA-Approved drug for cancer. A friend of mine in Los Angeles, Greg Cole, found that if you give curcumin to very similar mice to what this study’s author has been using, they get they get a little better, the (Alzheimer’s) plaques go away.
“The problem with curcumin is that it is not a great drug, in the sense that it gets degraded very rapidly. It’s availability is quite low in the bloodstream and the brain.
“We decided to make a better version of this. We did a lot of medicinal chemistry. We came up with J147.”
“J147 is an exciting new compound because it really has strong potential to be an Alzheimer’s disease therapeutic by slowing disease progression and reversing memory deficits following short-term treatment.”
Because of its broad ability to protect nerve cells, the researchers believe that J147 may also be effective for treating other neurological disorders, such as Parkinson’s disease, Huntington’s disease and amyotrophic lateral sclerosis (ALS), as well as vascular dementia from stroke, although their study did not directly explore the drug’s efficacy as a therapy for those diseases.
The findings, published in the journal Alzheimer’s Research and Therapy, may pave the way to a new treatment for Alzheimer’s disease in humans.
Despite years of research, scientists are still seeking the first disease-modifying drugs for Alzheimer’s. Current FDA-approved medications, including Aricept®, Razadyne® and Exelon® (generic donepezil, galantamine and rivastigmine), offer only fleeting short-term benefits for Alzheimer’s patients, but they do nothing to slow the steady, irreversible decline of brain function that erases a person’s memory and ability to think clearly.
Professor Schubert and his colleagues bucked the trend within the pharmaceutical industry, which has focused on the biological pathways involved in the formation of amyloid plaques, the dense deposits of protein that characterize the disease. Instead, the Salk team used living neurons grown in laboratory dishes to test whether their new synthetic compounds, which are based upon natural products derived from plants, were effective at protecting brain cells against several pathologies associated with brain aging. From the test results of each chemical iteration of the lead compound, they were able to alter their chemical structures to make them much more potent. Although J147 appears to be safe in mice, the next step will require clinical trials to determine whether the compound will prove safe and effective in humans.
“Alzheimer’s disease research has traditionally focused on a single target, the amyloid pathway,” says Schubert, “but unfortunately drugs that have been developed through this pathway have not been successful in clinical trials. Our approach is based on the pathologies associated with old age-the greatest risk factor for Alzheimer’s and other neurodegenerative diseases-rather than only the specificities of the disease.”
Salk scientists developed J147, a synthetic drug shown to improve memory and prevent brain damage in mice with Alzheimer’s disease.Images: Courtesy of the Salk Institute for Biological Studies
To test the efficacy of J147 in a much more rigorous preclinical Alzheimer’s model, the Salk team treated mice using a therapeutic strategy that they say more accurately reflects the human symptomatic stage of Alzheimer’s. Administered in the food of 20-month-old genetically engineered mice, at a stage when Alzheimer’s pathology is advanced, J147 rescued severe memory loss, reduced soluble levels of amyloid, and increased neurotrophic factors essential for memory, after only three months of treatment.
In a different experiment, the scientists tested J147 directly against Aricept (generic donepezil), the most widely prescribed Alzheimer’s drug, and found that it performed as well or better in several memory tests.
“In addition to yielding an exceptionally promising therapeutic, both the strategy of using mice with existing disease and the drug discovery process based upon aging are what make the study interesting and exciting,” says Schubert, “because it more closely resembles what happens in humans, who have advanced pathology when diagnosis occurs and treatment begins.” Most studies test drugs before pathology is present, which is preventive rather than therapeutic and may be the reason drugs don’t transfer from animal studies to humans.
Prior and her colleagues say that several cellular processes known to be associated with Alzheimer’s pathology are affected by J147, including an increase in a protein called brain-derived neurotrophic factor (BDNF), which protects neurons from toxic insults, helps new neurons grow and connect with other brain cells, and is involved in memory formation. Postmortem studies show lower than normal levels of BDNF in the brains of people with Alzheimer’s.
The Salk researchers say that J147, with its memory enhancing and neuroprotective properties, along with its safety and availability as an oral medication, would make an “ideal candidate” for Alzheimer’s disease clinical trials. They are currently seeking funding for such a trial.
AMSBIO announces that Belgian researchers have cited use of BioPORTER Protein Delivery Reagent to introduce Tau seeds into HEK293 cells. BioPORTER Protein Delivery Reagent is a unique lipid formulation that allows direct translocation of proteins into living cells.
Neurodegenerative tauopathies, including Alzheimer disease and frontotemporal dementias, are characterized by neurofibrillary tangles (NFT) composed of intracellular hyperphosphorylated Tau aggregates. Predominantly expressed in neurons, Tau is a microtubule (MT)-binding protein that stabilizes and promotes the assembly of MTs, and the Tau-MT interactions are negatively regulated by phosphorylation of Tau. A naturally unfolded soluble protein under normal conditions, Tau acquires highly ordered ß-pleated sheet structures as it assembles into insoluble hyperphosphorylated paired helical filaments as well as less frequent straight filaments that constitute NFTs in Alzheimer disease and related tauopathies. Significant correlation of total NFT burden with cognitive decline has been observed in Alzheimer disease patients.
In the Belgian research prion-like seeding and propagation of Tau-pathology was demonstrated experimentally and may underlie the stereotyped progression of neurodegenerative Tauopathies. The researchers analyzed the repercussions of prion-like spreading of Tau-pathology via neuronal connections on neuronal network function in TauP301S transgenic mice.
BioPORTER Protein Delivery Reagent provided the researchers with a quick and easy method to study protein function without the need for cloning and DNA transfection. The reagent lipid captures proteins and transports them inside the target cells. The delivered proteins retain their structure and function while leaving the transduced cells unharmed. The reagent is especially useful when studying protein function in cells that are difficult to transfect using traditional DNA transfection reagents. http://www.amsbio.com/BioPORTER-protein-delivery-transfectiom-reagent.aspx
Neurotrophic factors are a family of proteins that are responsible for the growth and survival of nerve cells during development, and for the maintenance of adult nerve cells. Animal studies and test tube (in vitro Latin phrase for ‘in glass’; in a test tube or other artificial environment, as opposed to inside a living organism.”>in vitro)models
Organisms that scientists use to reproduce features of a disease of interest in an organism and then study it. For example, inserting the gene for HD into a mouse means that it will produce the altered HD protein in the brain. This creates an HD mouse model. The consistent use of these models allows researchers to test ideas about biology in a reproducible way, without the expense and ethical problems of performing these tests in humans.”>models have shown that certain neurotrophic factors are capable of making damaged nerve cells regenerate. Because of this capability, these factors represent exciting possibilities for reversing a number of devastating brain disorders, including Alzheimer’s disease
A neurodegenerative disease that causes progressive memory loss and severe dementia in advanced cases. Alzheimer’s disease is associated with certain abnormalities in brain tissue, involving a particular protein, beta-amyloid.”>Alzheimer’s disease, Parkinson’s disease
A neurodegenerative disorder that primarily affects one’s ability to perform smooth movements. The disease is associated with a loss of dopamine-producing nerve cells in the substantia nigra region of the brain.”>Parkinson’s disease, Lou Gehrig’s disease, and Huntington’s disease
A hereditary neurological disorder characterized by movement, cognitive, and psychiatric symptoms.”>Huntington’s Disease (HD). (For more information on how HD relates to Alzheimer’s and Parkinson’s, click here.) Currently, scientists are looking for ways to harness neurotrophic factors and somehow induce the damaged nerve cells to regenerate in order to improve the symptoms
Changes in the body or its functions, experienced by the patient and indicative of disease.”>symptoms of people with neurological having to do with nerve cells and/or the nervous system, particularly the brain”>neurological disorders.
A protein that causes certain types of nerve cells to survive and grow. BDNF is primarily located in the central nervous system, where it acts on cells in the brain and the eye. In the peripheral nervous system, BDNF promotes the growth of sensory and motor neurons.”>Brain-derived neurotrophic factor (BDNF)
An abbreviation of brain-derived neurotrophic factor, which is a protein that causes certain types of nerve cells to survive and grow. BDNF is primarily located in the central nervous system, where it acts on cells in the brain and the eye. In the peripheral nervous system, BDNF promotes the growth of sensory and motor neurons.”>BDNF levels are decreased in the brains of HD patients, which might be partly responsible for the degenerative when a part of the body stops working well, and begins to decline in function”>degenerative processes of HD. Researchers have recently discovered a link between BDNF An abbreviation of brain-derived neurotrophic factor, which is a protein that causes certain types of nerve cells to survive and grow. BDNF is primarily located in the central nervous system, where it acts on cells in the brain and the eye. In the peripheral nervous system, BDNF promotes the growth of sensory and motor neurons.”>BDNF , mutant huntingtin
The altered form of the huntingtin protein caused by having the HD gene.”>mutant huntingtin , and excitotoxicity
Excessive stimulation of a nerve cell by a neurotransmitter, which poisons the nerve cell and degrades it.”>excitotoxicity, a process by which brain cells die after stimulation. The mutant huntingtin protein A key protein in Huntington’s disease. It exists in all humans but has a chemically different form in people with HD. Please note that although Huntingt<strong>o</strong>n’s disease is spelled with an o, the correct spelling of the protein involved is huntingt<strong>i</strong>n with an i.”>huntingtin protein invariably leads to the death of nerve cells in the striatum part of the brain that is involved in controlling movement. It is made up of the caudate and the putamen. Also referred to as the corpus striatum.”>striatum, the region of the brain needed for movements; however, how mutant huntingtin the altered form of the huntingtin protein caused by having the HD gene.”>mutant huntingtin does this damage is unclear. One possibility is that mutant huntingtin
The altered form of the huntingtin protein caused by having the HD gene.”>mutant huntingtin lowers levels of BDNF
An abbreviation of brain-derived neurotrophic factor, which is a protein that causes certain types of nerve cells to survive and grow. BDNF is primarily located in the central nervous system, where it acts on cells in the brain and the eye. In the peripheral nervous system, BDNF promotes the growth of sensory and motor neurons.”>BDNF, making nerve cells more susceptible to injury and death. Therefore, therapeutic approaches aimed at increasing BDNF
An abbreviation of brain-derived neurotrophic factor, which is a protein that causes certain types of nerve cells to survive and grow. BDNF is primarily located in the central nervous system, where it acts on cells in the brain and the eye. In the peripheral nervous system, BDNF promotes the growth of sensory and motor neurons.”>BDNF production may be able to counteract the effects ofmutant huntingtin
The altered form of the huntingtin protein caused by having the HD gene.”>mutant huntingtin and prevent a significant amount of the neurodegeneration
The deterioration or loss of function of nerve cells. Neurodegenerative diseases include HD, Alzheimer’s, Parkinson’s and many more. <em>Adj.</em>neurodegenerative.”>neurodegeneration that would otherwise occur in HD. (For more information on huntingtin protein
A key protein in Huntington’s disease. It exists in all humans but has a chemically different form in people with HD. Please note that although Huntingt<strong>o</strong>n’s disease is spelled with an o, the correct spelling of the protein involved is huntingt<strong>i</strong>n with an i.”>huntingtin protein
The official name of this gene is “brain-derived neurotrophic factor.”
BDNF is the gene’s official symbol. The BDNF gene is also known by other names, listed below.
Read more about gene names and symbols on the About page.
What is the normal function of the BDNF gene?
The BDNF gene provides instructions for making a protein found in the brain and spinal cord called brain-derived neurotrophic factor. This protein promotes the survival of nerve cells (neurons) by playing a role in the growth, maturation (differentiation), and maintenance of these cells. In the brain, the BDNF protein is active at the connections between nerve cells (synapses), where cell-to-cell communication occurs. The synapses can change and adapt over time in response to experience, a characteristic called synaptic plasticity. The BDNF protein helps regulate synaptic plasticity, which is important for learning and memory.
The BDNF protein is found in regions of the brain that control eating, drinking, and body weight; the protein likely contributes to the management of these functions.
Does the BDNF gene share characteristics with other genes?
The BDNF gene belongs to a family of genes called endogenous ligands (endogenous ligands).
A gene family is a group of genes that share important characteristics. Classifying individual genes into families helps researchers describe how genes are related to each other. For more information, see What are gene families? in the Handbook.
Nerve growth factor (NGF) was discovered in the early 1950s due to its trophic (survival- and growth-promoting) effects on sensory and sympathetic neurons (Levi-Montalcini and Hamburger, 1951), In 1982, brain-derived neurotrophic factor (BDNF), the second member of the “neurotrophic” family of neurotrophic factors, was shown to promote survival of a subpopulation of dorsal root ganglion neurons, and subsequently purified from pig brain (Barde et al., 1982). Since then, other members of the neurotrophin family such as neurotrophin-3 (NT-3) (Maisonpierre et al., 1990) and neurotrophin-4/5 (NT-4/5) (Hallbook et al., 1991; Ipet al., 1992) have been described, each with a distinct profile of trophic effects on subpopulations of neurons in the peripheral and central nervous systems.
The BDNF gene (in humans mapped to chromosome 11p) has four 5′ exons (exons I-IV) that are associated with distinct promoters, and one 3′ exon (exon V) that encodes the mature BDNF protein (Metsis et al., 1993; Timmusk et al., 1993). Eight distinct mRNAs are transcribed, with transcripts containing exons I-III expressed predominantly in brain and exon IV found in lung and heart (Timmusk et al., 1993).
BDNF shares about 50% amino acid identity with NGF, NT-3 and NT-4/5. Each neurotrophin consists of a noncovalently-1 linked homodimer and contains (1) a signal peptide following the initiation codon; and (2) a pro-region containing an N-linked glycosylation site. Initially produced as proneurotrophins, prohormone convertases such as furin cleave the proneurotrophins (M.W. ~30kDa) to the mature neurotrophin (M.W. ~14kDa) (Chao and Bothwell, 2002). Proneurotrophins have altered binding characteristics and distinct biologic activity in comparison with mature neurotrophins (Lee et al., 2001a,b). Neurotrophins also share a distinctive three-dimensional structure containing two pairs of antiparallel β-strands and cysteine residues in a cystine knot motif.
Each neurotrophin binds one or more of the tropomyosin-related kinase (trk) receptors, members of the family of receptor tyrosine kinases (Patapoutian and Reichardt, 2001). Ligand-induced receptor dimerization results in kinase activation; subsequent receptor autophosphorylation on multiple tyrosine residues creates specific binding sites for intracellular target proteins, which bind to the activated receptor via SH2 domains (Barbacid, 1994; Patapoutian and Reichardt, 2001). These include PLC-γ1 (phospholipase C), p85 (the noncatalytic subunit of PI-3 kinase) and Shc (SH2-containing sequence); activation of these target proteins can then lead to a variety of intracellular signalling cascades such as the Ras-MAP (mitogen-activated protein) kinase cascade and phosphorylation of cyclic AMP-response element binding protein (CREB) (Patapoutian and Reichardt, 2001; Segal, 2003).
In addition, all of the neurotrophins bind to the p75 receptor, designated p75NTR. p75NTR, related to proteins of the tumor necrosis factor (TNFR) superfamily, has a glycosylated extracellular region involved in ligand binding, a transmembrane region, and a short cytoplasmic sequence lacking intrinsic catalytic activity (Chao and Hempstead, 1995; Dechant and Barde, 2002). Neurotrophin binding to p75NTR is linked to several intracellular signal transduction pathways, including nuclear factor-κB (NF-κB), Jun kinase and sphingo-myelin hydrolysis (Dechant and Barde, 2002). P75NTR signalling mediates biologic actions distinct from those of the trk receptors, notably the initiation of programmed cell death (apoptosis) (Casaccia-Bonnefil et al., 1996; Frade et al., 1996; Roux et al., 1999; Dechant and Barde, 2002). It has also been suggested that p75 may serve to determine neurotrophin binding specificity (Esposito et al., 2001; Lee et al., 2001a,b;Zaccaro et al., 2001).
BDNF GENE REGULATION
A multitude of stimuli have been described that alter BDNF gene expression in both physiologic and pathologic states (Lindholm et al., 1994). For example, light stimulation increases BDNF mRNA in visual cortex (Castrén et al., 1992), osmotic stimulation increases BDNF mRNA in the hypothalamus (Castrén et al., 1995; Dias et al., 2003), and whisker stimulation increases BDNF mRNA expression in somatosensory barrel cortex (Rocamora et al., 1996). Electrical stimuli that induce long-term potentiation (LTP) in the hippocampus, a cellular model of learning and memory, increase BDNF and NGF expression (Patterson et al., 1992; Castrén et al., 1993; Bramham et al., 1996). Even physical exercise has been shown to increase NGF and BDNF expression in hippocampus (Neeper et al., 1995). Interestingly, BDNF levels vary across the estrous cycle, which correlate with its effects on neural excitability (Scharfman et al., 2003).
Distinct BDNF 5′ exons are differentially regulated by stimuli such as neural activity. For example, exons I-III, but not exon IV, increase after kainic acid-induced seizures (Timmusk et al., 1993) or other stimuli that increase activity (Lauterborn et al., 1996; Tao et al., 2002). Protein synthesis is required for the effects of activity on exons I and II, but not III and IV, raising the possibility that the latter act as immediate early genes (Lauterborn et al., 1996; Castrén et al., 1998). The transcription factor CaRF activates transcription of exon III under the control of a calcium response element. CaRE1 (Tao et al., 2002). CREB, which can be stimulated by diverse stimuli ranging from activity to chronic antidepressant treatment (Nibuya et al., 1995,1996; Shieh et al., 1998; Tao et al., 1998; Shieh and Ghosh, 1999), also modulates exon III transcription. Recent evidence also indicates that neural activity triggers calcium-dependent phosphorylation and release of methyl-CpG binding protein 2 (MeCP2) from BDNF promoter III to derepress transcription (Chen et al., 2003).
Unlike the classical target-derived trophic factor model in which neurotrophins—such as NGF—are retrogradely transported, there is now abundant evidence that BDNF is also anterogradely transported in brain. First, BDNF protein is localized to nerve terminals (Conner et al., 1997), and pathway transection or axonal transport inhibition abrogates this terminal expression (Altar et al., 1997; Conner et al., 1997; Altar and DiStefano, 1998). Second, higher-resolution studies have shown that BDNF is associated with dense-core vesicles (Fawcett et al., 1997; Altar and DiStefano, 1998), which are the primary site for neuropeptide storage and release from nerve terminals. Third, further functional studies have supported the anterograde transport hypothesis (Fawcett et al., 1998, 2000). Fourth, pro-BDNF is shuttled from the trans-Golgi network into secretory granules, where it is cleaved by prohormone convertase 1 (PC1) (Farhadi et al., 2000).
In addition, emerging evidence suggests that both BDNF and trk receptors may undergo regulated intracellular transport. For example, seizures lead to redistribution of BDNF mRNA from hippocampal CA3 cell bodies to their apical dendrites (Bregola et al., 2000; Simonato et al., 2002). Trk signalling is now thought to include retrograde transport of intact neurotrophin-trk complexes to the neuronal cell body (Miller and Kaplan, 2001; Ginty and Segal, 2002).
Recent evidence indicates that neurotrophins are released acutely following neuronal depolarization (Griesbeck et al., 1999; Mowla et al., 1999; Goggi et al., 2003). In fact, direct activity-dependent pre- to post-synaptic transneuronal transfer of BDNF has recently been demonstrated using fluorescently-labelled BDNF (Kohara et al., 2001). The released form of BDNF is thought to be proBDNF (Mowla et al., 2001), raising the possibility of postsecretory proteolytic processing by membrane-associated or extracellular proteases in the modulation of BDNF action (Lee et al., 2001a,b).
….. more
Experimental Drug Targeting Alzheimer’s Disease Shows Anti-aging Effects
Salk scientists Antonio Currais, David Schubert and team found a molecule that slows the clock on key aspects of aging in animals. Credit: Salk Institute
Salk Institute researchers have found that an experimental drug candidate aimed at combating Alzheimer’s disease has a host of unexpected anti-aging effects in animals.
The Salk team expanded upon their previous development of a drug candidate, called J147, which takes a different tack by targeting Alzheimer’s major risk factor–old age. In the new work, the team showed that the drug candidate worked well in a mouse model of aging not typically used in Alzheimer’s research. When these mice were treated with J147, they had better memory and cognition, healthier blood vessels in the brain and other improved physiological features, as detailed November 12, 2015 in the journal Aging.
“Initially, the impetus was to test this drug in a novel animal model that was more similar to 99 percent of Alzheimer’s cases,” said Antonio Currais, the lead author and a member of Professor David Schubert’s Cellular Neurobiology Laboratory at Salk. “We did not predict we’d see this sort of anti-aging effect, but J147 made old mice look like they were young, based upon a number of physiological parameters.”
Alzheimer’s disease is a progressive brain disorder, recently ranked as the third leading cause of death in the United States and affecting more than five million Americans. It is also the most common cause of dementia in older adults, according to the National Institutes of Health.
“While most drugs developed in the past 20 years target the amyloid plaque deposits in the brain (which are a hallmark of the disease), none have proven effective in the clinic,” said Schubert, senior author of the study.
Several years ago, Schubert and his colleagues began to approach the treatment of the disease from a new angle. Rather than target amyloid, the lab decided to zero in on the major risk factor for the disease–old age. Using cell-based screens against old age-associated brain toxicities, they synthesized J147.
Previously, the team found that J147 could prevent and even reverse memory loss and Alzheimer’s pathology in mice that have a version of the inherited form of Alzheimer’s, the most commonly used mouse model. However, this form of the disease comprises only about 1 percent of Alzheimer’s cases. For everyone else, old age is the primary risk factor, said Schubert. The team wanted to explore the effects of the drug candidate on a breed of mice that age rapidly and experience a version of dementia that more closely resembles the age-related human disorder.
In this latest work, the researchers used a comprehensive set of assaid to measure the expression of all genes in the brain, as well as over 500 small molecules involved with metabolism in the brains and blood of three groups of the rapidly aging mice. The three groups of rapidly aging mice included one set that was young, one set that was old and one set that was old but fed J147 as they aged.
The old mice that received J147 performed better on memory and other tests for cognition and also displayed more robust motor movements. The mice treated with J147 also had fewer pathological signs of Alzheimer’s in their brains. Importantly, because of the large amount of data collected on the three groups of mice, it was possible to demonstrate that many aspects of gene expression and metabolism in the old mice fed J147 were very similar to those of the young animals. These included markers for increased energy metabolism, reduced brain inflammation and reduced levels of oxidized fatty acids in the brain.
Another notable effect was that J147 prevented the leakage of blood from the microvessels in the brains of old mice. “Damaged blood vessels are a common feature of aging in general, and in Alzheimer’s, it is frequently much worse,” said Currais.
Currais and Schubert note that while these studies represent a new and exciting approach to Alzheimer’s drug discovery and animal testing in the context of aging, the only way to demonstrate the clinical relevance of the work is to move J147 into human clinical trials for Alzheimer’s disease.
“If proven safe and effective for Alzheimer’s, the apparent anti-aging effect of J147 would be a welcome benefit,” adds Schubert. The team aims to begin human trials next year.
A research team from the University of North Carolina School of Medicine (UNC) and University of California, San Francisco (UCSF) says it has created a general tool to probe the activity of orphan receptors, which are highly expressed in particular tissues but whose functions remain unknown. The team intends to illuminate the roles of orphan receptors in behavior and make them accessible for drug discovery.
The creation of the research tool, which involves computer modeling, yeast- and mammalian cell-based molecular screening techniques, and mouse models, is published in an article (“Allosteric ligands for the pharmacologically dark receptors GPR68 and GPR65”) in Nature.
According to Brian Shoichet, Ph.D., professor of pharmaceutical chemistry at UCSF, this work will help researchers learn how orphan receptors interact with molecules inside the body or with drugs. Specifically, the UNC and UCSF scientists used their new tool to find a novel probe molecule that can modulate the orphan G protein-coupled receptor 68 (GPR68, also known as OGR1), an orphan receptor that is highly expressed in the brain.
“GPCRs are the single most important family of therapeutic drug targets,” said Dr. Shoichet. “About 27 percent of FDA-approved drugs act through GPCRs. They are considered to be among the most useful targets for discovering new medications.”
The new probe molecule, dubbed “ogerin,” turns on GPR68, activating its signaling role. To understand how this activation of GPR68 affects brain function, the investigators gave it to mice and put them through a battery of behavioral tests. Mice that had been given ogerin were much less likely to learn to fear a specific stimulus. This fear-conditioning is controlled by the hippocampus, where GPR68 is highly expressed. But ogerin had no effect on mice that lacked this receptor.
To demonstrate general research applicability, the UNC and UCSF researchers also used their technique to find molecules that can modulate GPR65, another orphan receptor.
“We provide an integrated approach that we believe can be applied to many other receptors,” explained Bryan L. Roth, M.D., Ph.D., co-senior author of the Nature paper and the Michael Hooker Distinguished Professor of Protein Therapeutics and Translational Proteomics in the department of pharmacology at UNC. “The goal is to quickly find drug-like compounds for these receptors. This should facilitate discovery of novel and safer therapeutics for a host of diseases.”
“We used yeast-based screening techniques to find compounds that activate an orphan receptor,” noted Xi-Ping Huang, Ph.D., co-first author and research assistant professor at UNC. “Then [co-first author] Joel Karpiak, a graduate student in Shoichet’s lab at UCSF, created a computer model and searched libraries of millions of compounds to find out what kind of molecular structure ensures proper binding and interaction with a specific receptor. Then, back in the lab, we tested new molecules and found a novel ligand.”
“The fact that GPR68 is highly expressed in several tissues, especially the brain, and that it is a member of the large GPCR family, suggests that this discovery can be further leveraged for drug discovery,” added Dr. Shoichet.
Currently, few drug developers would seek drugs for a target with an unknown role in human biology. With new evidence of the role of GPR68, and a molecule that can modulate that role, the door has been opened for further research studies, both basic and applied.
“The druggable genome is an iceberg that is mostly submerged,” pointed out Dr. Shoichet. “This paper illuminates a small piece of it, providing new reagents to modulate a previously dark, unreachable drug target. Just as important, the strategy should be useful to many other dark targets in the genome.”
Complexity of Protein-Protein Interactions, Volume 2 (Volume Two: Latest in Genomics Methodologies for Therapeutics: Gene Editing, NGS and BioInformatics, Simulations and the Genome Ontology), Part 1: Next Generation Sequencing (NGS)
Complexity of Protein-Protein Interactions
Curator: Larry H. Bernstein, MD, FCAP
Cracking the Complex
Using mass spec to study protein-protein interactions
Mass spectrometry is a proteomics workhorse. By precisely measuring polypeptide masses, researchers can identify and sequence those molecules, and characterize whether and how they have been chemically modified. To twist a phrase, by their masses you shall know them.
But many proteins do not act in isolation. Critical biological processes such as DNA replication, transcription, translation, cell division, and energy generation rely on the action of massive protein assemblies, many of which comprise dozens of subunits. While these clusters are ripe for study, few traditional mass spectrometric methods can handle them.
Indeed, protein complexes are unwieldy for many types of analysis, says Philip Compton, director of instrumentation at the Proteomics Center of Excellence at Northwestern University in Evanston, Illinois. Most complexes are held together by noncovalent interactions, assemble only transiently, or are located in the cell membrane—all of which complicate sample preparation, he explains. Also, while some complexes are relatively abundant, others are rare, further thwarting detection and analysis.
For mass spectrometry specifically, however, the problem with analyzing protein complexes, which can weigh in at 500 kDa, is size. “In a mass spec, things of that size have traditionally been fairly difficult to handle,” Compton says. Even if you can deliver them into the spectrometer itself, you need a way to figure out which proteins are present, and in what stoichiometry. Plus, normal sample preparation procedures tend to denature proteins, ripping complexes apart.
Still, researchers are increasingly keen to train their mass specs on intact protein assemblies. The Scientistasked four protein-complex experts about the approaches they use in their own labs. This is what they said.
GETTING TOGETHER: Lactate dehydrogenase from human skeletal muscle comprises four identical M subunits, shown here in different colors. FVASCONCELLOS/WIKIMEDIA COMMONS
RESEARCHER:Philip Compton, Director of Instrumentation, Proteomics Center of Excellence, Northwestern University
PROJECT: High-throughput top-down proteomics
SOLUTION: If protein complexes are onions, Compton needs a way to iteratively peel off the layers to see what’s inside. Working with researchers at Thermo Fisher Scientific, Compton is developing an Orbitrap-based mass spectrometer that can do just that, or perform what is called an MS3 study.
Basically, an MS3 experiment involves weighing all the complexes in a sample fraction—there could be as many as 10 or 15 at a time—grabbing one, smashing it into inert-gas molecules to eject a subunit, weighing and sequencing the cast-off piece, and then repeating the process.
That’s the goal, but because that instrument is not yet built, Compton must temporarily content himself with what he calls a “pseudo-MS3” experiment. Basically, instead of one seamless workflow, the instrument shatters the complex, weighs the pieces that come off it, and then repeats the process, only this time capturing and fragmenting those ejected pieces for subsequent analysis (Anal Chem, 85:11163-73, 2013). “We’re kind of splitting it into these two different steps; that accomplishes essentially the same thing,” Compton says.
Compton and his team are still ironing out the kinks, but they have begun applying the approach to protein complexes involved in metabolism. One of these, lactate dehydrogenase (LDH), is a 145-kDa tetramer comprising M (muscle) and H (heart) subunits that can exist in any of five configurations (MMMM, MMMH, MMHH, MHHH, and HHHH). Using the MS3 workflow, Compton says he can differentiate these “multiproteoform assemblies,” as well as any posttranslational modifications those subunits may bear, and determine the abundance of each. Now he hopes to apply the approach to quantify LDH differences between cell and tissue types.
From Protein Complexes to Subunit Backbone Fragments: A Multi-stage Approach to Native Mass Spectrometry
Native mass spectrometry (MS) is becoming an important integral part of structural proteomics and system biology research. The approach holds great promise for elucidating higher levels of protein structure: from primary to quaternary. This requires the most efficient use of tandem MS, which is the cornerstone of MS-based approaches. In this work, we advance a two-step fragmentation approach, or (pseudo)-MS3, from native protein complexes to a set of constituent fragment ions. Using an efficient desolvation approach and quadrupole selection in the extended mass-to-charge (m/z) range, we have accomplished sequential dissociation of large protein complexes, such as phosporylase B (194 kDa), pyruvate kinase (232 kDa), and GroEL (801 kDa), to highly charged monomers which were then dissociated to a set of multiply charged fragmentation products. Fragment ion signals were acquired with a high resolution, high mass accuracy Orbitrap instrument that enabled highly confident identifications of the precursor monomer subunits. The developed approach is expected to enable characterization of stoichiometry and composition of endogenous native protein complexes at an unprecedented level of detail.
EXTEND YOUR RANGE: Compton’s team uses a souped-up version of Thermo Fisher’s Orbitrap-based Q Exactive HF mass spectrometer, which among other things features a fourfold wider mass range. Other researchers can perform similar work using Thermo’s Exactive Plus EMR Orbitrap system, an off-the-shelf, “extended mass range” instrument. But, because the EMR lacks the “high-mass isolation capabilities” of Compton’s bespoke hardware, the application range is more limited, he says. “You can still do a similar experiment to us, provided that you have one clean [purified] complex.”
Mapping protein-protein interaction interfaces RESEARCHER:Igor Kaltashov, Professor of Chemistry, University of Massachusetts Amherst
PROJECT: Probing the interactions of candidate protein therapeutics with their molecular targets
SOLUTION: Most attempts at studying protein complexes deliver them to the mass spec intact. Kaltashov takes a different approach, using a technique called hydrogen-deuterium exchange (HDX).
It works like this: proteins (like other molecules) pass hydrogen atoms back and forth with the solvent that surrounds them. Normally, one hydrogen is simply swapped for another, and nobody is the wiser. But in deuterated (“heavy”) water, as hydrogens are swapped at the protein surface, the protein gets slightly heavier as deuterium molecules replace some of the hydrogens. This allows researchers to probe how accessible different pieces of the protein are to the solvent, based on how much deuterium they pick up from the buffer, and how quickly they do so.
As Kaltashov explains, HDX can be used to study any event that might alter the accessibility of different protein regions to the solvent that surrounds them. Those events include protein folding and aggregation, but also protein-protein interactions. “Once two proteins bind to each other, solvent would be excluded from the interface, and that would be reflected in the hydrogen-deuterium exchange kinetics,” he says. That change is evident when compared to the proteins in isolation.
In a 2009 review, Kaltashov demonstrated the process with transferrin, an iron transport protein, and its receptor. After undergoing the exchange reaction, the proteins were fragmented to peptides and analyzed piecemeal. Some peptides exhibited no hydrogen-deuterium exchange, he says. That suggests they were never exposed to solvent because they were buried inside the protein core. Other peptides exchanged hydrogens with the solvent at the same rate regardless of receptor binding, indicating they are not part of the protein-receptor interface. A third set of peptides, though, exhibited clear differences in the presence and absence of receptor, marking those as elements of the protein-protein interaction domain (Anal Chem, 81:7892-99, 2009).
“You can actually localize these sites and obtain information both on the strength of the binding [interactions] and the structural characteristics of the interface region,” Kaltashov says.
H/D exchange and mass spectrometry in the studies of protein conformation and dynamics: Is there a need for a top-down approach?
Hydrogen/deuterium exchange (HDX) combined with mass spectrometry (MS) detection has matured in recent years to become a powerful tool in structural biology and biophysics. Several limitations of this technique can and will be addressed by tapping into ever expanding arsenal of methods to manipulate ions in the gas phase offered by mass spectrometry.
Keywords: hydrogen/deuterium exchange (HDX), mass spectrometry (MS), protein ion fragmentation, collision-induced dissociation (CAD), electron-capture dissociation (ECD), electron-transfer dissociation (ETD), protein conformation, protein dynamics
Introduction: HDX MS in the context of structural proteomics
The spectacular successes of proteomics and bioinformatics in the past decade have resulted in an explosive growth of information on the composition of complex networks of proteins interacting at the cellular level and beyond. However, a simple inventory of interacting proteins is insufficient for understanding how the components of sophisticated biological machinery work together. Protein interactions with each other, small ligands and other biopolymers are governed by their higher order structure, whose determination on a genome scale is a focus of structural proteomics. Realization that “the structures of individual macromolecules are often uninformative about function if taken out of context”1 is shifting the focus of the inquiry from comprehensive characterization of individual protein structures to structural analysis of protein complexes.
X-ray crystallography remains the mainstay in this field, and high resolution structures of proteins and protein complexes often provide important clues as to how they carry out their diverse functions in vivo. However, individual proteins are not static objects, and their behavior cannot be adequately described based solely on information derived from static snapshots and without taking into consideration their dynamic character.2Conformation and dynamics of small proteins can be probed at high spatial resolution on a variety of time scales using NMR spectroscopy; however, rather unforgiving molecular weight limitations make this technique less suited for the studies of larger proteins and protein complexes.
Mass spectrometry (MS) is playing an increasingly visible role in this field, as it can provide information on protein dynamics on a variety of levels, ranging from interactions with their physiological partners by forming dynamic assemblies3 to large-scale conformational transitions within individual subunits.4 Perhaps one of the most powerful MS-based tools to characterize protein conformation and dynamics is HDX MS, a technique that combined hydrogen/deuterium exchange in solution5 with MS detection of the progress of exchange reactions.6 This technique is certainly not new,7 and in fact already made lasting impact in diverse fields ranging from structural proteomics8 to analysis of biopharmaceutical products.9 Nevertheless, HDX MS methodology is still in a phase where dramatic progress is made, fed by the continued expansion of the experimental armamentarium offered by MS. In particular, better integration of new methods of manipulating ions in the gas phase into HDX MS routine is likely to result in truly transformative changes. This sea change in HDX MS methodology will transform it to a potent tool rivaling NMR in terms of resolution, but without suffering the limitations of this technique.
What information can be deduced from HDX MS measurements? The classic “bottom-up” approach, its challenges and limitations
While the concept of HDX experiment may appear rather transparent (Figure 1), interpretation of the results is usually not. The backbone protection measured in a typical HDX MS experiment is a combination of several factors, as the exchange reaction of each labile hydrogen atom is a convolution of two processes.5The first is a protein motion that makes a particular hydrogen atom exposed to solvent and therefore available for the exchange. This could be a small-scale event, such as relatively frequent local structural fluctuations transiently exposing hydrogen atoms residing close to the protein surface, or a rare global unfolding event exposing atoms sequestered from the solvent in the protein core. The second process is a chemical reaction of exchanging the unprotected labile hydrogen atom with the solvent. The kinetics of this reaction (intrinsic exchange rate) strongly depends on solution temperature and pH (with a minimum at pH 2.5-3 for backbone amides), parameters that obviously have a great influence on the protein dynamics as well.
Schematic representation of HDX MS experiments: bottom-up (A) and top-down (B) HDX MS.
Since the majority of HDX MS studies target protein dynamics under near-native conditions, the experiments are typically carried out at physiological pH, where the progress of the exchange is followed by monitoring the protein mass change. The direct infusion scheme offers the simplest way to carry out such measurements, either in real time7 or by using on-line rapid mixing.10 However, in many cases these straightforward approaches cannot be used, as they limit the choice of exchange buffer systems to those compatible with electrospray ionization (ESI). To avoid this, HDX can be carried out in any suitable buffer followed by rapid quenching (lowering pH to 2.5-3 and temperature to near 0°C). Dramatic deceleration of the intrinsic exchange rate for backbone amides under these conditions allows the protein solution to be de-salted prior to MS analysis. Additionally, the slow exchange conditions denature most proteins, resulting in facile removal of various binding partners, ranging from small ligands to receptors (their binding to the protein of interest inevitably complicates the HDX MS data interpretation by making accurate mass measurements in the gas phase less straightforward).
An example of such experiments is shown in Figure 2, where HDX is used to probe the higher order structure and conformational dynamics of metal transporter transferrin (Fe2Tf) alone and in the receptor-bound form. Both Tf-metal and Tf-receptor complexes dissociate under the slow exchange conditions prior to MS analysis; therefore, the protein mass evolution in each case reflects solely deuterium uptake in the course of exchange in solution. The extra protection afforded by the receptor binding to Tf persists over an extended period of time, and it may be tempting to assign it to shielding of labile hydrogen atoms at the protein-receptor interface. However, this view is overly simplistic, as the conformational effects of protein binding are frequently felt well beyond the interface region. The difference in the backbone protection levels of receptor-free and receptor-bound forms of Fe2Tf appears to grow during the initial hour of the exchange (Figure 2), reflecting significant stabilization of Fe2Tf higher order structure by the receptor binding. Indeed, while the fast phase of HDX is typically ascribed to frequent local fluctuations (transient perturbations of higher order structure) affecting relatively small protein segments, the slower phases of HDX usually reflect relatively rare, large-scale conformational transitions (transient partial or complete unfolding). This is why global HDX MS measurements similar to those presented in Figure 2 are can be used to obtain quantitative thermodynamic characteristics for protein interaction with a variety of ligands, ranging from metal ions11 and small organic molecules 12 to other proteins13 and oligonucleotides.14
HDX MS of Fe2Tf in the presence (blue) and the absence (red) of the cognate receptor. The exchange was carried out by diluting the protein stock solution 1:10 in exchange solution (100 mM NH4HCO3 in D2O, pH adjusted to 7.4) and incubating for a certain period of time as indicated on each diagram followed by rapid quenching (lowering pH to 2.5 and temperature to near 0°C). The black trace shows unlabeled protein.
While global HDX MS measurements under near-native conditions provide valuable thermodynamic information on proteins and their interaction with binding partners, structural studies (e.g., localizing the changes in Tf that occur as a result of receptor binding) must rely on the knowledge of exchange kinetics at the local level. This is typically accomplished by carrying out proteolysis under the slow exchange conditions following the quench of HDX.6 Here we will refer to this approach as “bottom-up” HDX MS, by drawing analogy to a bottom-up approach to obtain sequence information.15 An example is shown in Figure 3, where Fe2Tf undergoes exchange in solution in the absence and in the presence of the receptor, followed by rapid quenching of HDX reactions, protein reduction and digestion with pepsin and LC/MS analysis of the deuterium content of individual proteolytic peptides.
Localizing the influence of the receptor binding on backbone protection of Fe2Tf using bottom-up HDX MS on the physiologically relevant time scale. The panels show isotopic distributions of representative peptic fragments derived from the protein subjected to HDX in the presence (blue) and the absence (red) of the receptor and followed by rapid quenching. Dotted lines indicate deuterium content of unlabeled and fully exchanged peptides. Colored segments within the Fe2Tf/receptor complex show location of the peptic fragments.
Evolution of deuterium content of various peptic fragments in Figure 3 reveals a wide spectrum of protection, which is clearly distributed very unevenly across the protein sequence. While some peptides exhibit nearly complete protection of backbone amides (e.g., segment [396-408] sequestered in the core of the protein C-lobe), exchange in some other segments is fast (e.g., peptide [612-621] in the solvent-exposed loop of the C-lobe). The influence of the receptor binding on the backbone protection is also highly localized. While many segments appear to be unaffected by the receptor binding, there are a few regions where exchange kinetics noticeably decelerates (e.g., segment [71-81] of the N-lobe, which contains several amino acid residues that form Tf/receptor interface according to the available model of the complex based on low-resolution cryo-EM data16).
Although the increased protection of backbone amides proximal to the protein/receptor binding interface is hardly surprising, HDX MS data also reveal a less trivial trend, acceleration of exchange kinetics in some segments of the protein as a result of receptor binding (such behavior is illustrated in Figure 3 with segment [113-134], a part of the N-lobe that is distal to the receptor). Therefore, in addition to mapping binding interface regions, HDX MS also provides a means to localize the protein segments that are affected by the binding indirectly via allosteric mechanisms. However, this example also highlights one of the limitations of HDX MS, namely inadequate spatial resolution. This peptic fragment spans several distinct regions of the protein (an α-helical segment, a β-strand, and two loops). The moderate level of protection observed in this segment in the absence of the receptor binding (fast exchange of three protons followed by slow exchange of the rest) is likely to be a result of averaging out very uneven protection patterns across this peptide. Even smaller peptides may comprise two or more distinct structural elements, such as segment [71-81] spanning three distinct regions of the protein (an α-helical segment, a β-strand, and a loop connecting them).
In some favorable cases spatial resolution in HDX MS of small proteins (<15 kDa) may be enhanced up to a single residue level by analyzing deuterium content of a set of overlapping proteolytic fragments.17However, single-residue resolution has never been demonstrated in HDX MS studies of proteins falling out of the mass range routinely accessible by NMR, although overlapping peptic fragments frequently provide moderate improvement of spatial resolution.
In addition to limited spatial resolution, the “classic” HDX MS scheme frequently suffers from incomplete sequence coverage, especially when applied to larger and extensively glycosylated proteins. Proteins with multiple disulfide bonds constitute another class of targets for which adequate sequence coverage is difficult to achieve, although certain changes in experimental protocol can alleviate this problem, at least for smaller proteins.18 Typically, an 80% level of sequence coverage is considered good, although significantly lower levels may also be adequate, depending on the context of the study.
Protein processing in HDX MS experiments is carried out under the conditions that minimize the exchange rates for backbone amides. Since these slow exchange conditions are highly denaturing for most proteins, both intact protein and its proteolytic fragments lack any protection and inevitably begin to lose their labile isotopic labels, despite low (but finite) intrinsic exchange rates.19 This phenomenon, known as “back-exchange,” may be accelerated during various stages of protein processing, e.g. during the chromatographic step.20 Although back-exchange was frequently evaluated in early HDX MS studies using unstructured model peptides, the utility of this procedure is questionable, since the intrinsic exchange rates are highly sequence-dependent. In many instances, back-exchange may be estimated using algorithms based on context-specific kinetics data (e.g., http://hx2.med.upenn.edu/download.html); it may also be determined experimentally for each proteolytic fragment by processing a fully labeled protein using a series of steps that precisely reproduce those used in HDX MS measurements.9 Typical back-exchange levels reported in recent literature range from 10% to 50%, although significantly higher numbers have also been reported. Even if back-exchange can be accounted for, it nonetheless has very detrimental influence on the quality of HDX MS measurements by reducing the available dynamic range.
Finally, the classic HDX MS scheme is poorly suited for measurements that are carried out under conditions favoring correlated exchange, when HDX kinetics follows the so-called EX1 regime, leading to appearance of bimodal and convoluted multi-modal isotopic distributions of protein ions.21 Carrying out HDX MS measurements under these conditions provides a unique opportunity to visualize and characterize distinct conformational states, which can be populated either transiently10 or at equilibrium.22 The distinction among such states can be made based on the differences in their deuterium contents. However, proteolysis in solution almost always leads to a loss of correlation between the deuterium content of fragment peptides and specific conformers with distinct levels of backbone protection. Therefore, the classic HDX MS scheme does not allow protein higher order structure and dynamics to be characterized in a conformer-specific fashion.
“Top-down” HDX MS: tandem MS allows protein structure to be probed in the conformer-specific fashion but raises the specter of hydrogen scrambling
The problem of characterizing protein conformation and dynamics in a conformer-specific fashion can be addressed using methods of tandem mass spectrometry (the so-called “top-down” HDX MS). Indeed, replacement of proteolysis in solution with protein ion fragmentation in the gas phase following mass selection of precursor ions provides a means to obtain fragment ions originating from a particular conformer with a specific level of deuterium incorporation. Deuterium content of fragment ions would then provide a measure of local protection patterns, assuming there is no internal re-arrangement of labile hydrogen and deuterium atoms during ion activation (vide infra). Although the idea to use polypeptide ion dissociation in the gas phase as an alternative to proteolysis was originally proposed in early 1990s,23 its implementation for proteins only became possible24 following dramatic improvements in FTMS and hybrid TOF analyzers in the late 1990s.
An example of conformer-specific characterization of protein higher order structure using a top-down HDX MS approach is illustrated in Figure 4. The isotopic profile of a fully deuterated 18 kDa protein wt*-CRABPI is recorded following its brief exposure to the 1H-based exchange buffer. The bimodal appearance of the isotopic distribution of the molecular ion (top trace in Figure 4A) clearly indicates the presence of at least two conformers with different levels of backbone protection. Collisional activation of the entire protein ion population generates a set of fragment ions with convoluted isotopic distributions (top trace in Figure 4B). However, mass selection of precursor ions with a specific level of deuterium content allows the top-down HDX MS measurements to be carried out in a conformation-specific fashion, taking full advantage of the HDX MS ability to detect distinct conformers. For example, selective fragmentation of protein ions representing a highly protected conformation is achieved by mass-selecting a narrow population of intact protein ions with high level of retained deuterium (the blue trace in Figure 4A). Mass-selection and subsequent fragmentation of a narrow population of protein ions with significantly lower deuterium content (the red trace in Figure 4A) generates a set of fragment ions whose isotopic distributions provide information on backbone protection within non-native protein states. For example, the data presented in Figure 4 clearly indicate that the C-terminal segment of the protein represented by the y172+ ions retains significant structure even within the partially unfolded conformers: the amount of retained deuterium atoms reduces by only 30% as a result of switching from the precursor ion from highly protected (blue) to less protected (red). At the same time, selection of the precursor ion has a much more dramatic effect on the protection levels exhibited by the N-terminal segment (represented by the b425+ ion), where more than a two-fold decrease in the amount of retained deuterium atoms is observed. Extending this analysis to other protein fragments may allow detailed backbone protection maps to be created for each protein conformer, provided there is no hydrogen scrambling prior to protein ion fragmentation (vide infra).
Characterization of local dynamics in wt*-CRABP I in a conformer-specific fashion using top-down HDX MS (fully deuterated protein was exposed to 1H2O/CH3CO2N1H4 at pH 3.1 for 10 min; the gray trace at the bottom corresponds to HDX end-point). A: mass selection of precursor ions for subsequent CAD (from top to bottom): broad-band selection of the entire ionic population (not conformer-specific); highly protected conformers; narrow population of less protected conformers; HDX end-point. B: isotopic distributions of two representative fragment ions generated by CAD of precursor ions shown in panel A. Selection of different ion populations as precursor ions for subsequent fragmentation was achieved by varying the width of a mass selection window of a quadrupole filter (Q) in a hybrid quadrupole/time-of-flight mass spectrometer (Qq-TOF MS).
The example shown above illustrates a great promise of top-down HDX MS as a technique uniquely capable of probing structure and dynamics of populations of protein conformers coexisting in solution with high selectivity. Furthermore, this approach often allows one to avoid protein handling under the slow exchange conditions prior to MS analysis, thereby eliminating back-exchange as a factor adversely influencing the quality of measurements. Nonetheless, applications of top-down HDX MS have been limited due to concerns over the possibility of hydrogen scrambling accompanying collision-activated dissociation (CAD) of protein ions. Indeed, several reports pointed out that proton mobility in the gas phase may under certain conditions influence the outcome of top-down HDX MS measurements when CAD is employed to fragment protein ions.25, 26
The occurrence (or the absence) of hydrogen scrambling in the gas phase can be reliably detected by using built-in scrambling indicators. One particularly convenient indicator is a Histag, a 6-30 residues long, histidine-rich segment appended to wild-type sequences to facilitate protein purification on metal affinity columns. Such segments are fully unstructured in solution and, therefore, should lack any backbone protection.27 Alternatively, intrinsic scrambling indicators (e.g., internal flexible loops26), as well as other approaches25 can be used to detect occurrence of scrambling. The available experimental evidence suggests that slow protein ion activation (e.g., SORI CAD) always leads to hydrogen scrambling, while fast activation allows it to be minimized or eliminated in top-down HDX MS experiments.26
Another shortcoming of top-down HDX MS schemes utilizing CAD is the limited extent of protein ion fragmentation, which may lead to sizeable gaps in sequence coverage, particularly for larger proteins,28 and insufficient level of spatial resolution (even for smaller proteins29). Our earlier attempts to solve this problem by employing multi-stage CAD (MSn) were unsuccessful due to massive hydrogen scrambling exhibited by the second generation of fragments.
Electron-induced ion fragmentation in top-down schemes: keeping hydrogen scrambling at bay while enhancing sequence coverage and spatial resolution
Some time ago we suggested that the specter of hydrogen scrambling in top-down HDX MS measurements may be alleviated by using non-ergodic fragmentation processes, where dissociation is induced by ion-electron interaction, rather than collisional activation.30 Indeed, the results of earlier work combining hydrogen exchange of polypeptide ions in the gas phase and electron capture dissociation (ECD) were consistent with the notion of intramolecular rearrangement of hydrogen atoms occurring on a slower time scale compared to ion dissociation.31 A recent study demonstrated that the extent of scrambling was indeed negligible when ECD was used as a means to obtain fragment ions in top-down HDX MS characterization of a small protein ubiquitin.32
Our own recent work suggests that hydrogen scrambling can be avoided when top-down HDX MS employs ECD in characterizing higher order structure of larger proteins (approaching 20 kDa), although experimental conditions must be carefully controlled to minimize proton mobility induced by ion-molecule collisions in the ESI interface. The point in question is illustrated in Figure 5, which shows the results of top-down HDX MS analysis of higher order structure of wt*-CRABP I. The protein retains a significant proportion of labile deuterium label following its complete deuteration and then brief exposure to the 1H-based exchange buffer, as indicated by the isotopic distribution of the surviving molecular ions (red and blue traces in Figure 5A). However, the deuterium content of fragment ions derived from the 21-residue long His-tag region of the protein (e.g., c22 in Figure 5B) is indistinguishable from that of the exchange reaction endpoint, as long as moderate ion desolvation conditions are kept in the ESI interface. This clearly signals that hydrogen scrambling does not affect the outcome of local HDX MS measurements. However, once collision-assisted desolvation of protein ions is attempted in the ESI interface, the appearance of isotopic distributions of larger fragment ions derived from the His-tag region (e.g., c22, red trace in Figure 5B) shifts, indicating apparent deuterium retention and signaling the occurrence of limited hydrogen scrambling. We also demonstrated that deuterium distribution across the protein backbone is preserved when another recently introduced fragmentation technique based on cation-electron interactions, electron transfer dissociation (ETD), is used in top-down HDX MS schemes.33
Top-down HDX MS of wt*-CRABP I using ECD of the entire protein ion population (fully deuterated protein was exposed to1H2O/CH3CO2N1H4 at pH 3.5 for varying time periods); the black trace at the bottom of corresponds to HDX end-point). A: isotopic distributions of surviving intact protein ions. B: two representative c-ions. Minimal collision-and temperature-induced desolvation was used for acquisition of all mass spectra, except the one top (red trace).
In addition to allowing scrambling to be easily eliminated in top-down HDX MS experiments, both ECD and ETD appear to be superior to CAD in terms of sequence coverage, at least for the proteins in the 20 kDa range. Unlike CAD, protein backbone cleavage in ECD and ETD is less specific,34 leading to a higher number of fragment ions. This translates not only to improved sequence coverage, but also enhanced spatial resolution. Indeed, in some cases it becomes possible to generate patterns of deuterium distribution across the protein backbone down to the single residue level.
One example of such work is shown in Figure 6, where ETD was used as a protein ion fragmentation tool in top-down HDX MS characterization of a 16 kDa variant of CRABP I. The bar graph shows the levels of deuterium retention in a series of c-ions derived from the N-terminal segment of the protein. The bar height at position n in this diagram shows mass difference between two cn-1 fragments, one derived from the fully deuterated protein that was exposed to the protiated exchange buffer at pH 7 for 5 min and then placed under the slow exchange conditions for the duration of the data acquisition cycle, and another one representing the HDX endpoint (raw data for bars at n=14 and 35 are shown in Figure 7). Unchanged height between two adjacent bars at residues n and n+1 indicates no difference in deuterium content of cn-1 and cn fragments, signaling no backbone amide deuterium retention at residue n+1, while bar height increase by one unit indicates complete retention of deuterium at the nth amide.
Backbone protection pattern of CRABPI mutant (without N-terminal His-tag) obtained from top-down HDX MS measurements using ETD of the entire protein ion population. HDX was initiated by exposing the fully deuterated protein to 1H2O/CH3CO2N1H4 at pH 3.5 for 5 min followed by rapid quenching.
An example of raw HDX MS data used to generate the protection plot shown in Figure 6. Isotopic distributions of c13 and c34 fragments derived from protein subjected to 5 min HDX exchange in solution (red trace) and protein at the HDX end-point (blue trace) were used to calculate the bar heights at n=12 and 35.
The resulting backbone protection pattern in Figure 6 shows clear correlation with the known higher order structure of the protein (the amino acid sequence and the secondary structure assignment are shown at the top of the graph). Furthermore, the diagram clearly shows uneven distribution of backbone protection even within single structural elements (e.g., lower protection at the fringes vs. the middle of helix α1), as well as unequal protection of similar structural elements participating in the same structural motif (e.g., lower protection of helix α2 vs. helix α1, consistent with the available NMR data). A comparable level of spatial resolution can be achieved with ECD, as shown recently in top-down HDX MS analysis of higher order structure of myoglobin.35
The ability to characterize protein conformation and dynamics at the single residue level is certainly very exciting; however, it comes at a price. Since the protein fragmentation is carried out entirely in the gas phase, no fragment separation can be done prior to mass analysis. A large number of fragment ions with different masses and charges are usually confined to a relatively narrow m/z region, leading to inevitable overlaps of fragment ion isotopic distributions (Figure 7). This places rather stringent requirements on the resolving power of the mass analyzer, effectively narrowing the selection of mass spectrometers suitable for this work to FTMS.
Meeting in the middle: integration of top-down strategies into bottom-up HDX MS schemes
The top-down approach to HDX MS measurements clearly shows a promise to solve many problems that mar the commonly employed bottom-up methodology. The fragmentation efficiency afforded by ECD and ETD provides better spatial resolution, at least for proteins in the 20 kDa range, and this number is likely to grow as there are numerous examples of successful use of these fragmentation techniques to obtain sequence information on significantly larger proteins.36 Unlike the classic bottom-up approach, top-down HDX MS provides an elegant solution to the problem of characterizing higher order structure and dynamics in a conformer-specific fashion (see Figure 4 and discussion in the text). Finally, back-exchange can be eliminated, as outsourcing protein fragmentation to the gas phase often eliminates the need to manipulate the protein in solution under the slow exchange conditions prior to MS analysis.
The top-down/bottom-up dichotomy in HDX MS should not be viewed through the “eitheror” prism. In fact, gas phase fragmentation can enhance the quality of HDX MS data derived from experiments that are built around the bottom-up approach. The suggestion to supplement proteolysis in solution with peptide ion fragmentation in the gas phase to achieve better spatial resolution was made over 10 years ago.37 However, earlier attempts to implement this idea using CAD on a variety of platforms yielded mixed results due to apparent scrambling in some (but not all) fragment ions.37, 38 Later reports showed even more extensive scrambling in small peptide ions subjected to collisional activation,39 an obvious anathema to the proposed marriage of CAD and bottom-up HDX MS. Nonetheless, continued search for a scrambling-free solution to this problem has yielded very encouraging results, with both ECD and ETD showing minimal scrambling when applied to short peptides under carefully controlled conditions40, 41 and feasibility of supplementing proteolytic fragmentation in solution with ETD in the gas phase was recently demonstrated using a small model protein.42 Although these initial steps are relatively modest, they certainly warrant further work in this field.
The two complementary approaches to HDX MS measurements share a set of common challenges that inevitably arise as these techniques gain popularity and the scope of their applications expands. One such challenge is presented by membrane proteins, a notoriously difficult class of biological objects. HDX MS has been shown to have a great potential in this field.43 Interestingly, some initial work in this field was done nearly ten years ago using then-infant top-down HDX MS technique,44 while more recent work in this field utilizes both bottomup18 and top-down45 approaches. Another challenge faced by HDX MS is presented by highly heterogeneous proteins, such as proteins conjugated to other biopolymers and/or synthetic polymers, which constitute a significant fraction of the next generation of biopharmaceuticals. Presently, there are no biophysical techniques capable of characterizing conformation and dynamics of these systems, and there is an urgent need to fill this gap. Finally, nearly all HDX MS work reported to date was carried out in vitro under conditions that some regard as “reductionist.” Although initial HDX work with living objects was carried out over 75 years ago,46 as the years passed only one report on in vivo HDX MS studies was published.47 As mass spectrometry at large is being increasingly used in both in vivo and ex vivo studies, there is a growing pressure on HDX MS to follow the trend, although it remains to be seen how this will be done.
It probably is not an exaggeration to say that we are witnessing a renaissance of HDX MS, with the emergence of the top-down approach not only expanding our experimental arsenal by offering new capabilities, but also serving as a catalyst in enhancing the classic bottom-up methodology. The two techniques are highly complementary, and their synergism will certainly bring about new exciting discoveries and accelerate our progress in solving a variety of problems ranging from very fundamental questions in biophysics to applied problems in drug design.
WATCH OUT FOR DISULFIDES: If you’re going to try bottom-up HDX experiments, be careful of disulfide bonds, Kaltashov says. Pepsin is one of the very few proteinases that can efficiently digest a protein into its composite peptides under HDX experimental conditions, but it struggles when multiple disulfide bonds are present. In 2014, Kaltashov’s lab published two solutions to that problem. The first employs a fragmentation technique called electron capture dissociation (ECD) to break the disulfide linkage in the mass spec (Anal Chem, 86:5225-31, 2014); the second skips the pepsin digestion altogether—a strategy called top-down analysis (Anal Chem, 86:7293-98, 2014).
Enhancing the Quality of H/D Exchange Measurements with Mass Spectrometry Detection in Disulfide-Rich Proteins Using Electron Capture Dissociation
Hydrogen/deuterium exchange (HDX) mass spectrometry (MS) has become a potent technique to probe higher-order structures, dynamics, and interactions of proteins. While the range of proteins amenable to interrogation by HDX MS continues to expand at an accelerating pace, there are still a few classes of proteins whose analysis with this technique remains challenging. Disulfide-rich proteins constitute one of such groups: since the reduction of thiol–thiol bonds must be carried out under suboptimal conditions (to minimize the back-exchange), it frequently results in incomplete dissociation of disulfide bridges prior to MS analysis, leading to a loss of signal, inadequate sequence coverage, and a dramatic increase in the difficulty of data analysis. In this work, the dissociation of disulfide-linked peptide dimers produced by peptic digestion of the 80 kDa glycoprotein transferrin in the course of HDX MS experiments is carried out using electron capture dissociation (ECD). ECD results in efficient cleavage of the thiol–thiol bonds in the gas phase on the fast LC time scale and allows the deuterium content of the monomeric constituents of the peptide dimers to be measured individually. The measurements appear to be unaffected by hydrogen scrambling, even when high collisional energies are utilized. This technique will benefit HDX MS measurements for any protein that contains one or more disulfides and the potential gain in sequence coverage and spatial resolution would increase with disulfide bond number.
———
Hydrogen/deuterium exchange (HDX) with mass spectrometry (MS) detection has evolved in the past two decades into a powerful tool that is now used to decipher intimate details of processes as diverse as protein folding, recognition and binding, and enzyme catalysis.1,2 While initially being a tool that was used exclusively in fundamental studies, HDX MS is now becoming an indispensable part of the analytical arsenal in the biopharmaceutical sector, where it is utilized increasingly in all stages of protein drug development from discovery to quality control.3−5 Despite this progress, several areas remain where the application of HDX MS has met with only limited success. Disulfide-rich proteins constitute one such group, where characterization of higher-order structure and dynamics is particularly difficult, because of the suboptimal conditions used for reduction of thiol–thiol bonds following a quench of the exchange reactions. Proteins containing disulfide bonds are encountered very rarely in the protein folding studies where the most popular targets are small proteins lacking cysteine residues (with a notable exception of the oxidative folding studies), as well as in many other fundamental studies focusing on proteins of prokaryotic origin. However, disulfide-rich proteins are encountered very frequently in eukaryotic proteomes6 and constitute a large segment of the biopharmaceutical products,7 where the thiol–thiol bonds are critical elements defining conformation of protein drugs, and also play an important role in stabilizing proteins by endowing them with protease resistance.
While disulfide bond reduction is a relatively trivial task that can be readily accomplished at neutral pH using a variety of reagents, the acidic, low-temperature environment where proteins are placed to quench HDX narrows down the choice to a single reducing agent, TCEP.8 However, the alkaline pH for optimal disulfide reduction by TCEP is substantially higher, compared to the acidic environment of typical “slow exchange conditions” commonly employed to minimize back exchange within proteins and their peptic fragments prior to MS analysis.9 Furthermore, disulfide reduction in HDX MS measurements is usually carried out within a relatively short period of time (a few minutes) and at low temperature (0–4 °C) to limit the extent of the back-exchange, which in many situations does not allow the complete dissociation of thiol–thiol linkages of individual peptic fragments to be achieved in solution prior to LC separation and MS analysis of their deuterium content. Incomplete reduction of disulfide bonds dramatically increases the pool of candidate peptides that should be considered when analyzing proteolytic fragments in HDX MS measurements and frequently reduces sequence coverage and/or spatial resolution. While the former problem can be solved by employing more powerful and robust search engines for peptide identification, the latter one is more difficult to circumvent and can be very detrimental for the quality of HDX MS data and may require significant changes in experimental protocols. Indeed, a complete failure to reduce a certain disulfide bond in a protein will give rise to a thiol–thiol linked peptide dimer, whose constituent monomers do not necessarily represent a contiguous segment of the protein and may have vastly different conformational and dynamic properties. The total deuterium content of the entire dimer (measured by HDX MS) would not provide any meaningful information under these conditions, thereby effectively reducing the sequence coverage in the corresponding segments of the protein.
———-
Disulfide-rich proteins have traditionally been challenging targets for HDX MS studies, because of incomplete reduction of thiol–thiol linkages, which is a consequence of the quench conditions used to minimize amide back-exchange in peptides prior to MS analysis of their deuterium content: limited time, low temperature, and low pH. Traditionally, the principal strategy to address difficult-to-reduce or high-density disulfides in the HDX MS workflow is a brute force approach utilizing high concentrations of reductant and denaturant prior to (or even in combination with) digestion. The effectiveness of this approach is protein-dependent and extended incubation times frequently employed to enhance exposure to reductant invariably result in an undesirable increase in H/D back exchange. More recently, a novel electrochemical approach to reduce disulfides in solution under quench conditions prior to LC-MS has been reported for insulin.32 While electrochemical reduction shows promise, several limitations were identified, an apparent requirement for low-salt conditions, a higher-than-optimal temperature (10 °C), and a current cell pressure limit of 50 bar. In this work, electron capture dissociation (ECD) was used to circumvent the disulfide problem, since it effectively cleaves external disulfide bonds. Dissociation of the disulfide-linked peptide dimers can be accomplished on the fast LC time scale and produces abundant signals for monomeric subunits without interchain hydrogen scrambling, even when collisional activation of ions is applied prior to ion selection and ECD fragmentation. Inclusion of ECD in the HDX MS workflow results in increased sequence coverage and spatial resolution and provides an attractive alternative to extensive chemical reduction of disulfide-rich proteins.
Approach to Characterization of the Higher Order Structure of Disulfide-Containing Proteins Using Hydrogen/Deuterium Exchange and Top-Down Mass Spectrometry
Top-down hydrogen/deuterium exchange (HDX) with mass spectrometric (MS) detection has recently matured to become a potent biophysical tool capable of providing valuable information on higher order structure and conformational dynamics of proteins at an unprecedented level of structural detail. However, the scope of the proteins amenable to the analysis by top-down HDX MS still remains limited, with the protein size and the presence of disulfide bonds being the two most important limiting factors. While the limitations imposed by the physical size of the proteins gradually become more relaxed as the sensitivity, resolution and dynamic range of modern MS instrumentation continue to improve at an ever accelerating pace, the presence of the disulfide linkages remains a much less forgiving limitation even for the proteins of relatively modest size. To circumvent this problem, we introduce an online chemical reduction step following completion and quenching of the HDX reactions and prior to the top-down MS measurements of deuterium occupancy of individual backbone amides. Application of the new methodology to the top-down HDX MS characterization of a small (99 residue long) disulfide-containing protein β2- microglobulin allowed the backbone amide protection to be probed with nearly a single-residue resolution across the entire sequence. The high-resolution backbone protection pattern deduced from the top-down HDX MS measurements carried out under native conditions is in excellent agreement with the crystal structure of the protein and high-resolution NMR data, suggesting that introduction of the chemical reduction step to the top-down routine does not trigger hydrogen scrambling either during the electrospray ionization process or in the gas phase prior to the protein ion dissociation.
Since its initial introduction in the late 1990s,1−3 top-down hydrogen/deuterium exchange (HDX) with mass spectrometric (MS) detection evolved to become a potent biophysical tool capable of providing valuable information on higher order structure and conformational dynamics of proteins at an unprecedented level of structural detail. Among the many advantages offered by top-down HDX MS compared to conventional (bottom-up) measurements are significant reduction or indeed complete elimination of the back exchange,4 high spatial resolution,5,6 and the ability to study conformational dynamics in the conformer-specific fashion.7,8 However, despite the spectacular recent advances and the broader acceptance of this technique, the scope of the proteins amenable to the analysis by top-down HDX MS remains limited, with the protein size and the presence of disulfide bonds being the two most important limiting factors. The limitations imposed by the physical size of the proteins gradually become more relaxed as the sensitivity, resolution, and dynamic range of modern MS instrumentation continue to improve at an ever accelerating pace. However, the presence of disulfides remains a much less forgiving limitation even for the proteins of relatively modest size.
In this work we demonstrated feasibility of applying top-down HDX MS measurements to characterize higher order structure and conformational dynamics of disulfide-containing proteins, which have been out of the reach of this technique so far. Use of a moderate amount of a reducing agent TCEP is compatible with the ESI process, while allowing a fraction of the protein molecules to be reduced in solution thereby enabling nearcomplete sequence coverage at high resolution. The agreement between the top-down HDX MS and NMR data sets demonstrate that the new experimental approach is capable of capturing the dynamic picture of protein conformation at high spatial resolution without compromising the quality of the data by triggering hydrogen scrambling in the gas phase. Despite its modest size, β2m is known to be able to populate a non-native state,35 which might be a key player in a variety of processes, including amyloidosis. However, the structure of this non-native state of β2m remains elusive since this conformer exists in dynamic equilibrium with the native state of the protein.36,37 Recently we demonstrated that top-down HDX MS provides an elegant way to selectively probe structure of protein states coexisting in solution at equilibrium;8 however, β2m remained out of reach of this technique until recently due to the presence of a disulfide bond. The ability to expand the scope of top-down HDX MS to disulfide-containing proteins opens up a host of exciting possibilities to explore the structure of β2m, interferon, lysozyme, and a variety of other disulfidecontaining proteins in a conformer-specific fashion, where physiologically important non-native states may play important roles in processes as diverse as folding, recognition, signaling, and amyloidosis. ■ ASSOCIATED CONTENT *S Supporting Information Representative examples of isotopic distributions of fragment ions that have (Supplementary Figure 1) and have not (Supplementary Figure 2) been used to calculate the deuterium occupancy at individual backbone amides of β2m in top-down HDX MS measurements. This material is available free of charge via the Internet at http://pubs.acs.org.
SUSSING OUT THE SURFACE: Protein topology can be probed by firing low-energy electrons (white circles) at intact protein complexes within a high-resolution mass spectrometer. That reaction, called electron capture dissociation, causes the protein complex to fracture on its surface, revealing the exposed amino acid residues. COURTESY OF PIRIYA WONGKONGKATHEP AND HUILIN LI, UCLA
RESEARCHER:Joseph Loo, Professor of Biological Chemistry, David Geffen School of Medicine, University of California, Los Angeles)
PROJECT: Studying protein-ligand and protein-protein interactions
SOLUTION: Loo is less interested in complex identification than in how the protein subunits assemble. Specifically, he wants to know which amino acid residues lie on the complex’s surface and which are buried inside or interacting with ligands.
It’s a question of structural biology, he explains: “How is this thing folded in a way that these residues are on the outside?”
To work that out, Loo combines high-resolution Fourier transform ion cyclotron resonance mass spectrometry (FTICR) with electron-capture dissociation (ECD), a mass spec fragmentation method in which an ion in the mass spectrometer interacts with free electrons, causing the protein to fracture along its peptide backbone. By measuring the mass of those fragments with high precision, researchers can determine the protein’s amino acid sequence.
In Loo’s case, though, that fragmentation is not uniform along the length of the protein. Proteins usually are denatured for mass spectrometry analysis, but the protein complexes in his studies are intact—a process called native mass spectrometry. Fragmentation thus occurs preferentially on the surface of the complex, like the cracks in the shell of a hard-boiled egg. “You get limited sequence information, but that sequence information comes from regions that are specific to its 3-D structure,” he says (Anal Chem, 86:317-20, 2014).
Native Top-Down ESI-MS of 158 kDa Protein Complex by High Resolution Fourier Transform Ion Cyclotron Resonance Mass Spectrometry
Fourier transform ion cyclotron resonance mass spectrometry (FT-ICR MS) delivers high resolving power, mass measurement accuracy, and the capabilities for unambiguously sequencing by a top-down MS approach. Here, we report isotopic resolution of a 158 kDa protein complex – tetrameric aldolase with an average absolute deviation of 0.36 ppm and an average resolving power of ~520,000 at m/z 6033 for the 26+ charge state in magnitude mode. Phase correction further improves the resolving power and average absolute deviation by 1.3 fold. Furthermore, native top-down electron capture dissociation (ECD) enables the sequencing of 149 C-terminal amino acid (AA) residues out of 463 total AAs. Combining the data from top-down MS of native and denatured aldolase complexes, a total of 58% of the backbone cleavages efficiency is achieved. The observation of complementary product ion pairs confirms the correctness of the sequence and also the accuracy of the mass fitting of the isotopic distribution of the aldolase tetramer. Top-down MS of the native protein provides complementary sequence information to top-down ECD and CAD MS of the denatured protein. Moreover, native top-down ECD of aldolase tetramer reveals that ECD fragmentation is not limited only to the flexible regions of protein complexes and that regions located on the surface topology are prone to ECD cleavage.
“Native” mass spectrometry (MS) is an emerging technique that has been successfully used to characterize intact, noncovalently-bound protein complexes, providing stoichiometry and structural information that is complementary to data supplied by conventional structural biology techniques.1–3 To confidently characterize protein complexes, electrospray ionization (ESI)-MS measurements acquired with isotopic resolving power (RP) and high mass accuracy and capabilities for deriving primary structure, i.e., sequence, information would be ideal. Fourier transform ion cyclotron resonance mass spectrometry (FT-ICR MS) is prominent for its superior resolving power and mass accuracy and its utility for tandem MS (MS/MS) with a variety of fragmentation techniques; FT-ICR MS is noted for characterizating posttranslational modifications (PTMs) and protein-ligand and protein-protein interactions.4–9 However, it remains challenging to isotopically resolving large biomolecules over 100 kDa due to sample heterogeneity, cation/solvent/buffer addition, space charge effects, and electric and magnetic field inhomogeneity (for FT-ICR).10–13 Unit mass resolution has been achieved for a few denatured proteins, including a 112 kDa protein with 3 Da mass error using a 9.4 T FT-ICR MS,14 a 115 kDa protein by a 7 T instrument with a mass error of 5 ppm,4 and a 148 kDa protein with a mass error of 1 Da by a 9.4 T FTMS.10
Compared to denatured proteins, it is more difficult to achieve isotopic resolution for inherently lower charged (and thus, higher m/z) native protein complexes because (1) the peak height is proportional to its charge state, (2) the resolving power is inversely proportional to mass-to-charge ratio for FT-ICR MS, and (3) the broader isotope distribution of large biomolecules reduces overall signal-to-noise ratio.15 However, the introduction of a new FT-ICR analyzer cell – the ParaCell, by Nikolaev and coworkers has significantly increased the resolving power of FT-ICR MS.16, 17 By dynamically harmonizing the electric field potential at any radius of cyclotron motion in the entire cell volume, a resolving power of 39 M has been achieved for the alkaloid, resperine (m/z 609), using a 7 T system.18 In addition, a few native protein complexes, including enolase dimer (93 kDa, RP ~ 800,000 at m/z 4250), alcohol dehydrogenase tetramer (147 kDa, RP ~ 500,000 at m/z 5465), and enolase tetramer (186 kDa), have been isotopically resolved with a 12 T FT-ICR system with the new ICR cell.18 Although Mitchell and Smith reported that cyclotron phase locking due to Coulombic interactions limits the highest mass that unit mass resolution can be achieved by FT-ICR MS (Mmax ≈ 1×10⁴B, where B is magnetic field strength),19 the ParaCell has made it significantly easier and promising to measure high resolution mass spectra for large native protein complexes.
……
Native top-down CAD and ISD were performed for the aldolase tetramer; dissociation of the tetramer to yield monomer was observed in both approaches and no sequence information was obtained. The cleavage sites from ECD (colored in red) and CAD (colored in green) of the denatured aldolase monomer (26+) are overlaid with the native ECD results for aldolase tetramer (Figure 2B). As shown in Figure 2B, in contrast to the limited number of c-ion fragments observed in the ECD of aldolase tetramer, ECD of denatured aldolase monomer induces extensive c-ion fragments in the N-terminal region and enables the assignment of first 156 N-terminal AA residues. Surprisingly, the number of z•-ions observed from ECD of the denatured aldolase monomer is much less compared to the ECD of the native aldolase tetramer. Although it may be possible that the z•-ions may undergo secondary fragmentation due to excess available energy, electrons, or long ion-electron reaction times during the ECD experiment, ECD experiments with reduced reaction time and bias voltages were performed and the results argue against this assumption. Overall, 58% of the total number of backbone bonds are cleaved from combining top-down MS of native aldolase complex and denatured aldolase monomer (20% for native ECD of aldolase tetramer, 37% for ECD of denatured aldolase, and 5% for CAD of denatured aldolase).
The three dimensional structure of the aldolase tetramer is shown in Figure 3. To compare the flexibility of the structure to the data from ECD of the aldolase tetramer, one of the subunits (B-chain) is presented as B-factor putty and the D-chain is shown with its native ECD backbone cleavage regions colored in red. The remaining A- and C-chains are shown in grey. Although the C-terminal region (AA 340–363) of each subunit is highly flexible based on the crystallography B-factor (see B-chain in Figure 3A), only 4 out of 75 backbone cleavage sites are from the AA 340–363 region. Instead, the native ECD fragments largely originate from surface regions of the protein structure (see D-chain in Figure 3A). The N-terminal regions are not directly involved in the interfaces between subunits, but they are located in regions that are partially buried, which is consistent with the limited c-ions observed. To better show the native ECD backbone cleavage regions, the D-chain is rotated 90 degrees clockwise (Figure 3B). It is clear that, although protein structure flexibility might play a role in the native top-down ECD fragmentation pattern, for aldolase the ECD cleavage sites are not limited to the flexible region. In addition, backbone cleavage regions from CAD (yellow) and ECD (cyan) of denatured aldolase are complementary with the native ECD results.
A) Structure of tetrameric aldolase (1ZAH)29. A- and C-chains are shown as grey ribbons, the B-chain is shown in B-factor putty, and the D-chain is in cartoon with native ECD cleavage sites colored in red, CAD cleavage sites of denatured aldolase in yellow, and ECD cleavage sites of the N-terminal region from ECD of denatured aldolase in cyan. B) The D-chain is rotated 90 degrees clockwise to show the outer surface region of the subunit structure.
Also evident in such data sets are protein–small molecule interactions. As the proteins break apart, Loo explains, ligands often remain attached to the polypeptide shards that are produced. In one recent publication, for instance, his team mapped zinc binding sites in eukaryotic alcohol dehydrogenase, a 147-kDa tetrameric complex (J Am Soc Mass Spectrom, 25:2060-8, 2014).
Revealing Ligand Binding Sites and Quantifying Subunit Variants of Non-Covalent Protein Complexes in a Single Native Top-Down FTICR MS Experiment
“Native” mass spectrometry (MS) has been proven increasingly useful for structural biology studies of macromolecular assemblies. Using horse liver alcohol dehydrogenase (hADH) and yeast alcohol dehydrogenase (yADH) as examples, we demonstrate that rich information can be obtained in a single native top-down MS experiment using Fourier transform ion cyclotron mass spectrometry (FTICR MS). Beyond measuring the molecular weights of the protein complexes, isotopic mass resolution was achieved for yeast ADH tetramer (147 kDa) with an average resolving power of 412,700 at m/z 5466 in absorption mode and the mass reflects that each subunit binds to two zinc atoms. The N-terminal 89 amino acid residues were sequenced in a top-down electron capture dissociation (ECD) experiment, along with the identifications of the zinc binding site at Cys46 and a point mutation (V58T). With the combination of various activation/dissociation techniques, including ECD, in-source dissociation (ISD), collisionally activated dissociation (CAD), and infrared multiphoton dissociation (IRMPD), 40% of the yADH sequence was derived directly from the native tetramer complex. For hADH, native top-down ECD-MS shows that both E and S subunits are present in the hADH sample, with a relative ratio of 4:1. Native top-down ISD MS hADH dimer shows that each subunit (E and S chain) binds not only to two zinc atoms, but also the NAD+/NADH ligand, with a higher NAD+/NADH binding preference for the S chain relative to the E chain. In total, 32% sequence coverage was achieved for both E and S chains.
Studying how proteins interact with one another and assemble on a structural basis is key to understanding biological processes and their function. As a complementary technique to conventional technologies used in structural biology, such as nuclear magnetic resonance (NMR) spectroscopy, X-ray crystallography, and electron microscopy, “native” mass spectrometry (MS) has established its crucial role in the characterization of intact noncovalently-bound protein complexes, revealing the composition, stoichiometry, dynamics, stability, and also spatial information of subunit arrangements in protein assemblies [1–11]. To date, most native MS studies of protein complexes have been performed using quadrupole time-of-flight (Q-TOF) MS instruments with electrospray ionization (ESI). Because of the efficient transmission of high mass and highm/z ions using TOF analyzers, large proteins with molecular weights up to 18 MDa have been studied [12,13]. The coupling of ion mobility spectrometry (IMS) with mass spectrometry provides a new dimension to the analysis of biomolecules [14]. With IMS, ions are separated based on size and shape, and the IMS-derived collision cross-section information can be used to understand the topological properties of gas phase protein complexes. Surface induced dissociation (SID) has been recently added for the purposes of disassembling protein complexes into sub-complexes that appear to better reflect the structure of the solution phase complexes [15–17]. The capability of Orbitrap MS has been extended significantly for the analysis of macromolecules, with greatly improved mass (and m/z) range and resolving power to measure the binding of ADP and ATP to the 800 kDa GroEL complex [18].
Fourier transform ion cyclotron resonance mass spectrometry (FTICR MS) is known for its superior resolving power and mass accuracy and its capabilities for tandem MS (MS/MS) with a variety of fragmentation techniques. Particularly, after the introduction of electron capture dissociation (ECD) [19], FTICR MS quickly established its utility for protein top-down protein sequencing, post-translational modification characterization, and protein gas phase studies [20–34]. Polypeptide backbone bonds are cleaved by ECD, but non-covalent interactions are preserved, which therefore makes the native top-down MS study of the non-covalent interaction sites of protein-ligands complexes more feasible. Our group and others have successfully applied top-down ECD-MS to pinpoint the interaction sites of several protein-ligand system [35–38], and this can be enhanced by “supercharging” [35]. An early attempt of applying ECD-MS to the study of large protein complexes was made by Heeren and Heck, but little topology and sequence information was derived [39]. However, the Gross group starting in 2010 made the first breakthrough for the study of large protein complexes using native top-down ECD with FTICR MS. Besides obtaining molecular weight, sequence, and metal-binding site information in a single MS experiment, they correlated the origins of ECD product ions to the flexible regions of proteins as determined by the “B-factor” from the X-ray crystal structures of protein complexes [40, 41]. Therefore, native top-down ECD has been proposed as a tool to probe the flexible regions of protein complexes. Our group recently also demonstrated the capability of obtaining sequence information and isotopic mass resolution of a noncovalently-bound protein complex of 158 kDa using native top-down FTICR MS, and most importantly, we found that the origin of ECD fragments is not limited only to the flexible region of the protein complex (e.g., tetrameric aldolase), but also largely from the surface of the complex [42].
The application of FTICR MS for native top-down interrogation of large non-covalent bound protein complexes is still in its infancy. Here, for the purpose of further exploring the capability of FTICR MS in the analysis of large protein complexes, various fragmentation techniques including in-source dissociation (ISD), collisionally activated dissociation (CAD), ECD, and infrared multiphoton dissociation (IRMPD) were applied in the native top-down MS studies of a 80 kDa dimeric protein complex and a 147 kDa tetrameric protein complex. The results demonstrate that with the superior resolving power, mass accuracy, and versatile fragmentation techniques of FTICR MS, rich information, including isotopic mass resolution, amino acid sequence, point mutations, metal/ligand binding sites, and identification and quantification of subunit variants can be accomplished in a single native top-down FTICR MS experiment.
Still, Loo admits, the technique “is not really ready for prime time.” His team is collecting ECD data on a bank of proteins of known structure to ensure the data they collect really do reflect protein topology. In the meantime, they are working to extend the size of the complexes they can analyze. The technique’s current limit is 800 kDa.
GO NATIONAL: FTICR mass spectrometers offer top-of-the-line accuracy and resolution, with price tags to match. Few researchers have direct access to them, Loo says, but they can always try the national laboratories. Both the National High Magnetic Field Laboratory at Florida State University and the Environmental Molecular Sciences Laboratory at the Pacific Northwest National Laboratory have user facilities open to worthy projects.
Determining the architecture of protein complexes
RESEARCHER: Vicki Wysocki, Ohio Eminent Scholar and Professor of Chemistry and Biochemistry, Ohio State University
PROJECT: Instrumentation development for whole-complex analysis
SOLUTION: An analytical chemist by training, Wysocki focuses on instrumentation development for protein-complex analysis. Among the discoveries in her lab is a method called surface-induced dissociation (SID).
HIT THE WALL, JACK: When it comes to molecular collision in a mass spectrometer, size matters. Collide a complex with small gas molecules, and proteins in the complex will simply unravel (top). By smacking them into a “wall”—a process called surface-induced dissociation—the complex dissociates to reveal its underlying architecture. COURTESY OF VICKI WYSOCKI
Like many other fragmentation approaches, SID works by forcing an ion in the mass spectrometer to collide with another object. Usually that object is a small gas molecule, with the energy of collision sufficient to crack the peptide backbone. But for large protein complexes, bigger is better, and the collision partner in SID is as big as it can get: the method slams protein ions of interest into a nonreactive surface inside the instrument—essentially, a wall—causing complexes to fracture into subcomplexes that reveal the assembly’s inner architecture.
Wysocki combined this approach with ion-mobility separation—a kind of gas-phase electrophoresis that resolves molecules by their size and shape—to dissect an enzyme involved in antibiotic production. The enzyme, they found, has two copies each of three subunits, alpha, beta, and gamma, arranged as a pair of triads sitting on top of one another, with the alpha and beta subunits of one triad linked more tightly to each other than either is to gamma (Anal Chem, 83:2862-65, 2011).
Such information can be valuable to protein engineers, Wysocki says, especially as this particular complex otherwise falls into a structural biology knowledge gap: “It doesn’t crystallize, and it’s too small for the cryoEM and a little bit large for NMR,” she says. “And so, mass spec turned out to be a great tool.”
Revealing the Quaternary Structure of a Heterogeneous Noncovalent Protein Complex through Surface-Induced Dissociation
As scientists begin to appreciate the extent to which quaternary structure facilitates protein function, determination of the subunit arrangement within noncovalent protein complexes is increasingly important. While native mass spectrometry shows promise for the study of noncovalent complexes, few developments have been made toward the determination of subunit architecture, and no mass spectrometry activation method yields complete topology information. Here, we illustrate the surface-induced dissociation of a heterohexamer, toyocamycin nitrile hydratase, directly into its constituent trimers. We propose that the single-step nature of this activation in combination with high energy deposition allows for dissociation prior to significant unfolding or other large-scale rearrangement. This method can potentially allow for dissociation of a protein complex into subcomplexes, facilitating the mapping of subunit contacts and thus determination of quaternary structure of protein complexes.
The majority of proteins exist and perform their functions as multimers of varing stoichiometries and architecture.1 However, very few methods are available that can provide insights into subunit interactions. Native mass spectrometry (MS) is increasingly being used to study noncovalent protein complexes, as many structural features found in solution may be maintained in the gas phase.2,3 While subunit stoichiometries are readily obtainable by mass measurement alone, the determination of subunit arrangement within protein complexes remains a significant challenge. This is particularly true for heterogeneous complexes with multiple types of subunits. Considerable progress has been made using solution-phase disruption to divide the original protein complex into smaller subcomplexes, which may be readily measured by MS.4,5 The composition of the stable subcomplexes provides insight on the topology of the protein complex. However, MS activation methods used to date have fallen short of providing subunit topology. Here, we present the first evidence for subunit arrangement obtained directly from gas-phase experiments on a heterogeneous complex via surfaceinduced dissociation (SID). We have demonstrated previously the ability of SID to yield unique dissociation pathways for protein complexes, resulting in complementary information to collision-induced dissociation (CID).68 While the SID process is not yet well understood for macromolecules, there is a large body of work concerning SID of small molecules; influential factors such as collision energy, surface composition, and translational-to-vibrational energy conversion have been well-studied.911 The higher effective mass of a surface relative to that of neutral gas atoms used in CID (typically argon) results in significantly higher energy deposited through a single surface collision.9 As SID is a single-collision activation process, rather than activation via thousands of less energetic collisions as in CID, dissociation pathways other than those of the lowest energies become accessible
……
This is the only study to date demonstrating an ion activation method capable of yielding extensive dissociation, as well as the release of intact subcomplexes, thus providing relevant substructure information on a noncovalent, hetero-oligomeric protein complex. The capacity to produce intact, charge-symmetric subcomplexes suggests that dissociation occurs faster than subunit unfolding and that a significant degree of secondary and tertiary structure is maintained up to the point of dissociation and for some period of time afterward. Identification of trimeric substructure in TNH provides insight into a protein with little previous structural characterization and indicates a promising advancement of MS as a tool for structural biology.
Such information can be valuable to protein engineers, Wysocki says, especially as this particular complex otherwise falls into a structural biology knowledge gap: “It doesn’t crystallize, and it’s too small for the cryoEM and a little bit large for NMR,” she says. “And so, mass spec turned out to be a great tool.”
CHOOSE MASS: Mass spec may not be the only method for quickly working out protein structure, but it surely is the fastest, Wysocki says. She recalls one instance when a colleague sent over a complex that his group couldn’t crack. “In one afternoon, my student gave them a prediction of the structure: this one’s a heptamer, with a large subunit sitting atop a hexameric ring.” Even if the experiment doesn’t work, she adds, that fast turnaround time can be a boon, as collaborators can get rapid feedback for tweaking their experimental conditions. “Mass is a great thing.”
Variability of Gene Expression and Drug Resistance, Volume 2 (Volume Two: Latest in Genomics Methodologies for Therapeutics: Gene Editing, NGS and BioInformatics, Simulations and the Genome Ontology), Part 1: Next Generation Sequencing (NGS)
Variability of Gene Expression and Drug Resistance
Larry H. Bernstein, MD, FCAP, Curator
LPBI
New Data Suggest Extreme Genetic Diversity of Tumors May Impart Drug Resistance
NEW YORK (GenomeWeb) – Researchers from the University of Chicago and the Beijing Institute of Genomics have undertaken one of the most extensive analyses of the genome of a single tumor and found far greater genetic diversity than anticipated. Such variation, they said, may enable even small tumors to resist treatment.
“With 100 million mutations, each capable of altering a protein in some way, there is a high probability that a significant minority of tumor cells will survive, even after aggressive treatment,” Chung-I Wu, a University of Chicago researcher and senior author of the study, said in a statement. “In a setting with so much diversity, those cells could multiply to form new tumors, which would be resistant to standard treatments.”
Extremely high genetic diversity in a single tumor points to prevalence of non-Darwinian cell evolution
A tumor comprising many cells can be compared to a natural population with many individuals. The amount of genetic diversity reflects how it has evolved and can influence its future evolution. We evaluated a single tumor by sequencing or genotyping nearly 300 regions from the tumor. When the data were analyzed by modern population genetic theory, we estimated more than 100 million coding region mutations in this unexceptional tumor. The extreme genetic diversity implies evolution under the non-Darwinian mode. In contrast, under the prevailing view of Darwinian selection, the genetic diversity would be orders of magnitude lower. Because genetic diversity accrues rapidly, a high probability of drug resistance should be heeded, even in the treatment of microscopic tumors.
The prevailing view that the evolution of cells in a tumor is driven by Darwinian selection has never been rigorously tested. Because selection greatly affects the level of intratumor genetic diversity, it is important to assess whether intratumor evolution follows the Darwinian or the non-Darwinian mode of evolution. To provide the statistical power, many regions in a single tumor need to be sampled and analyzed much more extensively than has been attempted in previous intratumor studies. Here, from a hepatocellular carcinoma (HCC) tumor, we evaluated multiregional samples from the tumor, using either whole-exome sequencing (WES) (n = 23 samples) or genotyping (n = 286) under both the infinite-site and infinite-allele models of population genetics. In addition to the many single-nucleotide variations (SNVs) present in all samples, there were 35 “polymorphic” SNVs among samples. High genetic diversity was evident as the 23 WES samples defined 20 unique cell clones. With all 286 samples genotyped, clonal diversity agreed well with the non-Darwinian model with no evidence of positive Darwinian selection. Under the non-Darwinian model,MALL (the number of coding region mutations in the entire tumor) was estimated to be greater than 100 million in this tumor. DNA sequences reveal local diversities in small patches of cells and validate the estimation. In contrast, the genetic diversity under a Darwinian model would generally be orders of magnitude smaller. Because the level of genetic diversity will have implications on therapeutic resistance, non-Darwinian evolution should be heeded in cancer treatments even for microscopic tumors.
Data deposition: The sequence data reported in this paper have been deposited in the genome sequence archive of Beijing Institute of Genomics, Chinese Academy of Sciences, gsa.big.ac.cn (accession no. PRJCA000091).
Aziz Belkadi, Alexandre Bolze, Yuval Itan, Aurélie Cobat, Quentin B. Vincent, Alexander Antipenko, Lei Shang, Bertrand Boisson, Jean-Laurent Casanova, and Laurent Abel
Whole-genome sequencing is more powerful than whole-exome sequencing for detecting exome variantsPNAS 2015 112 (17)5473–5478; published ahead of print March 31, 2015,doi:10.1073/pnas.1418631112
Estimating the total genetic diversity of a spatial field population from a sample and implications of its dependence on habitat areaPNAS 2005 102 (28)9826–9829; published ahead of print July 5, 2005, doi:10.1073/pnas.0408471102
The findings, which appeared in the Proceedings of the National Academy of Sciences this week, also call into question the widely held view that evolution at the cellular level is driven by Darwinian selection, revealing a level of rapid and extensive genetic diversity beyond what would be expected under this model.
In the study, the researchers focused on a single hepatocellular carcinoma tumor, roughly the size of a ping pong ball. They sampled 286 regions from a single slice of the tumor, studying each one with either whole-exome sequencing or genotyping under both the infinite-site and infinite-allele models of population genetics.
Based on their analyses, the team estimated more than 100 million coding region mutations in what they called an “unexceptional” tumor — more mutations than would ordinarily be expected by orders of magnitude, according to Wu.
This extreme genetic diversity, the study’s authors wrote, implies evolution under the non-Darwinian mode, which is driven by random mutations largely unaffected by natural selection. It also raises the question of why there is so little apparent Darwinian selection in the tumor.
The scientists speculated that in solid tumors, cells remain together and do not migrate, “so that when an advantageous mutation indeed emerges, cells carrying it are competing mostly with themselves. These mutations may confer advantages in fighting for space or extracting nutrients, but they are stifled by their own advantages,” they wrote.
Beneficial mutations may emerge on occasion, but in solid tumors the cell populations are “so structured that selection may often be blunted,” they stated. “The physiological effect has to be very strong to overcome those constraints.” Cancer drugs could remove those constraints, loosening up a cell population and allowing competition to occur, the investigators added.
Wu and his colleagues see the presence of so many mutations in a tumor as creating problems when it comes to treatment. “It almost guarantees that some cells will be resistant,” study co-author and University of Chicago oncologist Daniel Catenacci said in the statement. “But it also suggests that aggressive treatment could push tumor cells into a more Darwinian mode.”
Overall, the findings highlight the need to consider non-Darwinian evolution and the vast genetic diversity it can confer as factors when developing treatment strategies, even for small tumors, the researchers concluded.
Irreconciliable Dissonance in Physical Space and Cellular Metabolic Conception
Curator: Larry H. Bernstein, MD, FCAP
Pasteur Effect – Warburg Effect – What its history can teach us today.
José Eduardo de Salles Roselino
The Warburg effect, in reality the “Pasteur-effect” was the first example of metabolic regulation described. A decrease in the carbon flux originated at the sugar molecule towards the end of the catabolic pathway, with ethanol and carbon dioxide observed when yeast cells were transferred from an anaerobic environmental condition to an aerobic one. In Pasteur´s studies, sugar metabolism was measured mainly by the decrease of sugar concentration in the yeast growth media observed after a measured period of time. The decrease of the sugar concentration in the media occurs at great speed in yeast grown in anaerobiosis (oxygen deficient) and its speed was greatly reduced by the transfer of the yeast culture to an aerobic condition. This finding was very important for the wine industry of France in Pasteur’s time, since most of the undesirable outcomes in the industrial use of yeast were perceived when yeasts cells took a very long time to create, a rather selective anaerobic condition. This selective culture media was characterized by the higher carbon dioxide levels produced by fast growing yeast cells and by a higher alcohol content in the yeast culture media.
However, in biochemical terms, this finding was required to understand Lavoisier’s results indicating that chemical and biological oxidation of sugars produced the same calorimetric (heat generation) results. This observation requires a control mechanism (metabolic regulation) to avoid burning living cells by fast heat released by the sugar biological oxidative processes (metabolism). In addition, Lavoisier´s results were the first indications that both processes happened inside similar thermodynamics limits. In much resumed form, these observations indicate the major reasons that led Warburg to test failure in control mechanisms in cancer cells in comparison with the ones observed in normal cells.
[It might be added that the availability of O2 and CO2 and climatic conditions over 750 million years that included volcanic activity, tectonic movements of the earth crust, and glaciation, and more recently the use of carbon fuels and the extensive deforestation of our land masses have had a large role in determining the biological speciation over time, in sea and on land. O2 is generated by plants utilizing energy from the sun and conversion of CO2. Remove the plants and we tip the balance. A large source of CO2 is from beneath the earth’s surface.]
Biology inside classical thermodynamics places some challenges to scientists. For instance, all classical thermodynamics must be measured in reversible thermodynamic conditions. In an isolated system, increase in P (pressure) leads to increase in V (volume), all this occurring in a condition in which infinitesimal changes in one affects in the same way the other, a continuum response. Not even a quantic amount of energy will stand beyond those parameters.
In a reversible system, a decrease in V, under same condition, will led to an increase in P. In biochemistry, reversible usually indicates a reaction that easily goes either from A to B or B to A. For instance, when it was required to search for an anti-ischemic effect of Chlorpromazine in an extra hepatic obstructed liver, it was necessary to use an adequate system of increased biliary system pressure in a reversible manner to exclude a direct effect of this drug over the biological system pressure inducer (bile secretion) in Braz. J. Med. Biol. Res 1989; 22: 889-893. Frequently, these details are jumped over by those who read biology in ATGC letters.
Very important observations can be made in this regard, when neutral mutations are taken into consideration since, after several mutations (not affecting previous activity and function), a last mutant may provide a new transcript RNA for a protein and elicit a new function. For an example, consider a Prion C from lamb getting similar to bovine Prion C while preserving its normal role in the lamb when its ability to change Human Prion C is considered (Stanley Prusiner).
This observation is good enough, to confirm one of the most important contributions of Erwin Schrodinger in his What is Life:
“This little book arose from a course of public lectures, delivered by a theoretical physicist to an audience of about four hundred which did not substantially dwindle, though warned at the outset that the subject matter was a difficult one and that the lectures could not be termed popular, even though the physicist’s most dreaded weapon, mathematical deduction, would hardly be utilized. The reason for this was not that the subject was simple enough to be explained without mathematics, but rather that it was much too involved to be fully accessible to mathematics.”
After Hans Krebs, description of the cyclic nature of the citrate metabolism and after its followers described its requirement for aerobic catabolism two major lines of research started the search for the understanding of the mechanism of energy transfer that explains how ADP is converted into ATP. One followed the organic chemistry line of reasoning and therefore, searched for a mechanism that could explain how the breakdown of carbon-carbon link could have its energy transferred to ATP synthesis. One of the major leaders of this research line was Britton Chance. He took into account that relatively earlier in the series of Krebs cycle reactions, two carbon atoms of acetyl were released as carbon dioxide ( In fact, not the real acetyl carbons but those on the opposite side of citrate molecule). In stoichiometric terms, it was not important whether the released carbons were or were not exactly those originated from glucose carbons. His research aimed at to find out an intermediate proteinaceous intermediary that could act as an energy reservoir. The intermediary could store in a phosphorylated amino acid the energy of carbon-carbon bond breakdown. This activated amino acid could transfer its phosphate group to ADP producing ATP. A key intermediate involved in the transfer was identified by Kaplan and Lipmann at John Hopkins as acetyl coenzyme A, for which Fritz Lipmann received a Nobel Prize.
Alternatively, under possible influence of the excellent results of Hodgkin and Huxley a second line of research appears. The work of Hodgkin & Huxley indicated that the storage of electrical potential energy in transmembrane ionic asymmetries and presented the explanation for the change from resting to action potential in excitable cells. This second line of research, under the leadership of Peter Mitchell postulated a mechanism for the transfer of oxide/reductive power of organic molecules oxidation through electron transfer as the key for the energetic transfer mechanism required for ATP synthesis.
This diverted the attention from high energy (~P) phosphate bond to the transfer of electrons. During most of the time the harsh period of the two confronting points of view, Paul Boyer and followers attempted to act as a conciliatory third party, without getting good results, according to personal accounts (in L. A. or Latin America) heard from those few of our scientists who were able to follow the major scientific events held in USA, and who could present to us later. Paul Boyer could present how the energy was transduced by a molecular machine that changes in conformation in a series of 3 steps while rotating in one direction in order to produce ATP and in opposite direction in order to produce ADP plus Pi from ATP (reversibility).
However, earlier, a victorious Peter Mitchell obtained the result in the conceptual dispute, over the Britton Chance point of view, after he used E. Coli mutants to show H+ gradients in the cell membrane and its use as energy source, for which he received a Nobel Prize. Somehow, this outcome represents such a blow to Chance’s previous work that somehow it seems to have cast a shadow over very important findings obtained during his earlier career that should not be affected by one or another form of energy transfer mechanism. For instance, Britton Chance got the simple and rapid polarographic assay method of oxidative phosphorylation and the idea of control of energy metabolism that brings us back to Pasteur.
This metabolic alternative result seems to have been neglected in the recent years of obesity epidemics, which led to a search for a single molecular mechanism required for the understanding of the accumulation of chemical (adipose tissue) reserve in our body. It does not mean that here the role of central nervous system is neglected. In short, in respiring mitochondria the rate of electron transport linked to the rate of ATP production is determined primarily by the relative concentrations of ADP, ATP and phosphate in the external media (cytosol) and not by the concentration of respiratory substrate as pyruvate. Therefore, when the yield of ATP is high as it is in aerobiosis and the cellular use of ATP is not changed, the oxidation of pyruvate and therefore of glycolysis is quickly (without change in gene expression), throttled down to the resting state. The dependence of respiratory rate on ADP concentration is also seen in intact cells. A muscle at rest and using no ATP has a very low respiratory rate. [When skeletal muscle is stressed by high exertion, lactic acid produced is released into the circulation and is metabolized aerobically by the heart at the end of the activity].
This respiratory control of metabolism will lead to preservation of body carbon reserves and in case of high caloric intake in a diet, also shows increase in fat reserves essential for our biological ancestors survival (Today for our obesity epidemics). No matter how important this observation is, it is only one focal point of metabolic control. We cannot reduce the problem of obesity to the existence of metabolic control. There are numerous other factors but on the other hand, we cannot neglect or remove this vital process in order to correct obesity. However, we cannot explain obesity ignoring this metabolic control. This topic is so neglected in modern times that we cannot follow major research lines of the past that were interrupted by the emerging molecular biology techniques and the vain belief that a dogmatic vision of biology could replace all previous knowledge by a new one based upon ATGC readings. For instance, in order to display bad consequences derived from the ignorance of these old scientific facts, we can take into account, for instance, how ion movements across membranes affects membrane protein conformation and therefore contradicts the wrong central dogma of molecular biology. This change in protein conformation (with unchanged amino acid sequence) and/or the lack of change in protein conformation is linked to the factors that affect vital processes as the heart beats. This modern ignorance could also explain some major pitfalls seen in new drugs clinical trials and in a small scale on bad medical practices.
The work of Britton Chance and of Peter Mitchell have deep and sound scientific roots that were made with excellent scientific techniques, supported by excellent scientific reasoning and that were produced in a large series of very important intermediary scientific results. Their sole difference was to aim at very different scientific explanations as their goals (They have different Teleology in their minds made by their previous experiences). When, with the use of mutants obtained in microorganisms P Mitchell´s goal was found to survive and B Chance to succumb to the experimental evidence, all those excellent findings of B Chance and followers were directed to the dustbin of scientific history as an example of lack of scientific consideration. [On the one hand, the Mitchell model used a unicellular organism; on the other, Chance’s work was with eukaryotic cells, quite relevant to the discussion.]
We can resume the challenge faced by these two great scientists in the following form: The first conceptual unification in bioenergetics, achieved in the 1940s, is inextricably bound up with the name of Fritz Lipmann. Its central feature was the recognition that adenosine triphosphate, ATP, serves as a universal energy “currency” much as money serves as economic currency. In a nutshell, the purpose of metabolism is to support the synthesis of ATP. In microorganisms, this is perfect! In humans or mammals, or vertebrates, by the same reason that we cannot consider that gene expression is equivalent to protein function (an acceptable error in the case of microorganisms) this oversimplifies the metabolic requirement with a huge error. However, in case our concern is ATP chemistry only, the metabolism produces ATP and the hydrolysis of ATP pays for the performance of almost, all kinds of works. It is possible to presume that to find out how the flow of metabolism (carbon flow) led to ATP production must be considered a major focal point of research of the two contenders. Consequently, what could be a minor fall of one of the contenders, in case we take into account all that was found during their entire life of research, the real failure in B Chance’s final goal was amplified far beyond what may be considered by reason!
Another aspect that must be taken into account: Both contenders have in the scientific past a very sound root. Metabolism may produce two forms of energy currency (I personally don´t like this expression*) and I use it here because it was used by both groups in order to express their findings. Together with simplistic thermodynamics, this expression conveys wrong ideas): The second kind of energy currency is the current of ions passing from one side of a membrane to the other. The P. Mitchell scientific root undoubtedly have the work of Hodgkin & Huxley, Huxley & Huxley, Huxley & Simmons
*ATP is produced under the guidance of cell needs and not by its yield. When glucose yields only 2 ATPs per molecule it is oxidized at very high speed (anaerobiosis) as is required to match cellular needs. On the other hand, when it may yield (thermodynamic terms) 38 ATP the same molecule is oxidized at low speed. It would be similar to an investor choice its least money yield form for its investment (1940s to 1972) as a solid support. B. Chance had the enzymologists involved in clarifying how ATP could be produced directly from NADH + H+ oxidative reductive metabolic reactions or from the hydrolysis of an enolpyruvate intermediary. Both competitors had their work supported by different but, sound scientific roots and have produced very important scientific results while trying to present their hypothetical point of view.
Before the winning results of P. Mitchell were displayed, one line of defense used by B. Chance followers was to create a conflict between what would be expected by a restrictive role of proteins through its specificity ionic interactions and the general ability of ionic asymmetries that could be associated with mitochondrial ATP production. Chemical catalyzed protein activities do not have perfect specificity but an outstanding degree of selective interaction was presented by the lock and key model of enzyme interaction. A large group of outstanding “mitochondriologists” were able to show ATP synthesis associated with Na+, K+, Ca2+… asymmetries on mitochondrial membranes and any time they did this, P. Mitchell have to display the existence of antiporters that exchange X for hydrogen as the final common source of chemiosmotic energy used by mitochondria for ATP synthesis.
This conceptual battle has generated an enormous knowledge that was laid to rest, somehow discontinued in the form of scientific research, when the final E. Coli mutant studies presented the convincing final evidence in favor of P. Mitchell point of view.
Not surprisingly, a “wise anonymous” later, pointed out: “No matter what you are doing, you will always be better off in case you have a mutant”
(Principles of Medical Genetics T D Gelehrter & F.S. Collins chapter 7, 1990).
However, let’s take the example of a mechanical wristwatch. It clearly indicates when the watch is working in an acceptable way, that its normal functioning condition is not the result of one of its isolated components – or something that can be shown by a reductionist molecular view. Usually it will be considered that it is working in an acceptable way, in case it is found that its accuracy falls inside a normal functional range, for instance, one or two standard deviations bellow or above the mean value for normal function, what depends upon the rigor wisely adopted. While, only when it has a faulty component (a genetic inborn error) we can indicate a single isolated piece as the cause of its failure (a reductionist molecular view).
We need to teach in medicine, first the major reasons why the watch works fine (not saying it is “automatic”). The functions may cross the reversible to irreversible regulatory limit change, faster than what we can imagine. Latter, when these ideas about normal are held very clear in the mind set of medical doctors (not medical technicians) we may address the inborn errors and what we may have learn from it. A modern medical technician may cause admiration when he uses an “innocent” virus to correct for a faulty gene (a rather impressive technological advance). However, in case the virus, later shows signals that indicate that it was not so innocent, a real medical doctor will be called upon to put things in correct place again.
Among the missing parts of normal evolution in biochemistry a lot about ion fluxes can be found. Even those oscillatory changes in Ca2+ that were shown to affect gene expression (C. De Duve) were laid to rest since, they clearly indicate a source of biological information that despite the fact that it does not change nucleotides order in the DNA, it shows an opposing flux of biological information against the dogma (DNA to RNA to proteins). Another, line has shown a hierarchy, on the use of mitochondrial membrane potential: First the potential is used for Ca2+ uptake and only afterwards, the potential is used for ADP conversion into ATP (A. L. Lehninger). In fact, the real idea of A. L. Lehninger was by far, more complex since according to him, mitochondria works like a buffer for intracellular calcium releasing it to outside in case of a deep decrease in cytosol levels or capturing it from cytosol when facing transient increase in Ca2+ load. As some of Krebs cycle dehydrogenases were activated by Ca2+, this finding was used to propose a new control factor in addition to the one of ADP (B. Chance). All this was discontinued with the wrong use of calculus (today we could indicate bioinformatics in a similar role) in biochemistry that has established less importance to a mitochondrial role after comparative kinetics that today are seen as faulty.
It is important to combat dogmatic reasoning and restore sound scientific foundations in basic medical courses that must urgently reverse the faulty trend that tries to impose a view that goes from the detail towards generalization instead of the correct form that goes from the general finding well understood towards its molecular details. The view that led to curious subjects as bioinformatics in medical courses as training in sequence finding activities can only be explained by its commercial value. The usual form of scientific thinking respects the limits of our ability to grasp new knowledge and relies on reproducibility of scientific results as a form to surpass lack of mathematical equation that defines relationship of variables and the determination of its functional domains. It also uses old scientific roots, as its sound support never replaces existing knowledge by dogmatic and/or wishful thinking. When the sequence of DNA was found as a technical advance to find amino acid sequence in proteins it was just a technical advance. This technical advance by no means could be considered a scientific result presented as an indication that DNA sequences alone have replaced the need to study protein chemistry, its responses to microenvironmental changes in order to understand its multiple conformations, changes in activities and function. As E. Schrodinger correctly describes the chemical structure responsible for the coded form stored of genetic information must have minimal interaction with its microenvironment in order to endure hundreds and hundreds years as seen in Hapsburg’s lips. Only magical reasoning assumes that it is possible to find out in non-reactive chemical structures the properties of the reactive ones.
For instance, knowledge of the reactions of the Krebs cycle clearly indicate a role for solvent that no longer could be considered to be an inert bath for catalytic activity of the enzymes when the transfer of energy include a role for hydrogen transport. The great increase in understanding this change on chemical reaction arrived from conformational energy.
Again, even a rather simplistic view of this atomic property (Conformational energy) is enough to confirm once more, one of the most important contribution of E. Schrodinger in his What is Life:
“This little book arose from a course of public lectures, delivered by a theoretical physicist to an audience of about four hundred which did not substantially dwindle, though warned at the outset that the subject matter was a difficult one and that the lectures could not be termed popular, even though the physicist’s most dreaded weapon, mathematical deduction, would hardly be utilized. The reason for this was not that the subject was simple enough to be explained without mathematics, but rather that it was much too involved to be fully accessible to mathematics.”
In a very simplistic view, while energy manifests itself by the ability to perform work conformational energy as a property derived from our atomic structure can be neutral, positive or negative (no effect, increased or decreased reactivity upon any chemistry reactivity measured as work)
Also:
“I mean the fact that we, whose total being is entirely based on a marvelous interplay of this very kind, yet if all possess the power of acquiring considerable knowledge about it. I think it possible that this knowledge may advance to little just a short of a complete understanding -of the first marvel. The second may well be beyond human understanding.”
In fact, scientific knowledge allows us to understand how biological evolution may have occurred or have not occurred and yet does not present a proof about how it would have being occurred. It will be always be an indication of possible against highly unlike and never a scientific proven fact about the real form of its occurrence.
As was the case of B. Chance in its bioenergetics findings, we may get very important findings that indicates wrong directions in the future as was his case, or directed toward our past.
The Skeleton of Physical Time – Quantum Energies in Relative Space of S-labs
By Radoslav S. Bozov Independent Researcher
WSEAS, Biology and BioSystems of Biomedicine
Space does not equate to distance, displacement of an object by classically defined forces – electromagnetic, gravity or inertia. In perceiving quantum open systems, a quanta, a package of energy, displaces properties of wave interference and statistical outcomes of sums of paths of particles detected by a design of S-labs.
The notion of S-labs, space labs, deals with inherent problems of operational module, R(i+1), where an imagination number ‘struggles’ to work under roots of a negative sign, a reflection of an observable set of sums reaching out of the limits of the human being organ, an eye or other foundational signal processing system.
While heavenly bodies, planets, star systems, and other exotic forms of light reflecting and/or emitting objects, observable via naked eye have been deduced to operate under numerical systems that calculate a periodic displacement of one relative to another, atomic clocks of nanospace open our eyes to ever expanding energy spaces, where matrices of interactive variables point to the problem of infinity of variations in scalar spaces, however, defining properties of minute universes as a mirror image of an astronomical system. The first and furthermost problem is essentially the same as those mathematical methodologies deduced by Isaac Newton and Albert Einstein for processing a surface. I will introduce you to a surface interference method by describing undetermined objective space in terms of determined subjective time.
Therefore, the moment will be an outcome of statistical sums of a numerical system extending from near zero to near one. Three strings hold down a dual system entangled via interference of two waves, where a single wave is a product of three particles (today named accordingly to either weak or strong interactions) momentum.
The above described system emerges from duality into trinity the objective space value of physical realities. The triangle of physical observables – charge, gravity and electromagnetism, is an outcome of interference of particles, strings and waves, where particles are not particles, or are strings strings, or are waves waves of an infinite character in an open system which we attempt to define to predict outcomes of tomorrow’s parameters, either dependent or independent as well as both subjective to time simulations.
We now know that aging of a biological organism cannot be defined within singularity. Thereafter, clocks are subjective to apparatuses measuring oscillation of defined parameters which enable us to calculate both amplitude and a period, which we know to be dependent on phase transitions.
The problem of phase was solved by the applicability of carbon relative systems. A piece of diamond does not get wet, yet it holds water’s light entangled property. Water is the dark force of light. To formulate such statement, we have been searching truth by examining cooling objects where the Maxwell demon is translated into information, a data complex system.
Modern perspectives in computing quantum based matrices, 0+1 =1 and/or 0+0=1, and/or 1+1 =0, will be reduced by applying a conceptual frame of Aladdin’s flying anti-gravity carpet, unwrapping both past and future by sending a photon to both, placing present always near zero. Thus, each parallel quantum computation of a natural system approaching the limit of a vibration of a string defining 0 does not equal 0, and 1 does not equal 1. In any case, if our method 1+1 = 1, yet, 1 is not 1 at time i+1. This will set the fundamentals of an operational module, called labris operator or in simplicity S-labs. Note, that 1 as a result is an event predictable to future, while interacting parameters of addition 1+1 may be both, 1 as an observable past, and 1 as an imaginary system, or 1+1 displaced interactive parameters of past observable events. This is the foundation of Future Quantum Relative Systems Interference (QRSI), taking analytical technologies of future as a result of data matrices compressing principle relative to carbon as a reference matter rational to water based properties.
Goedel’s concept of loops exist therefore only upon discrete relative space uniting to parallel absolute continuity of time ‘lags’. ( Goedel, Escher and Bach: An Eternal Golden Braid. A Metaphorical Fugue on Minds and Machines in the Spirit of Lewis Carroll. D Hofstadter. Chapter XX: Strange Loops, Or Tangled Hierarchies. A grand windup of many of the ideas about hierarchical systems and self-reference. It is concerned with the snarls which arise when systems turn back on themselves-for example, science probing science, government investigating governmental wrongdoing, art violating the rules of art, and finally, humans thinking about their own brains and minds. Does Gödel’s Theorem have anything to say about this last “snarl”? Are free will and the sensation of consciousness connected to Gödel’s Theorem? The Chapter ends by tying Gödel, Escher, and Bach together once again.) The fight struggle in-between time creates dark spaces within which strings manage to obey light properties – entangled bozons of information carrying future outcomes of a systems processing consciousness. Therefore, Albert Einstein was correct in his quantum time realities by rejecting a resolving cube of sugar within a cup of tea (Henri Bergson 19th century philosopher. Bergson’s concept of multiplicity attempts to unify in a consistent way two contradictory features: heterogeneity and continuity. Many philosophers today think that this concept of multiplicity, despite its difficulty, is revolutionary.) However, the unity of time and space could not be achieved by deducing time to charge, gravity and electromagnetic properties of energy and mass.
Charge is further deduced to interference of particles/strings/waves, contrary to the Hawking idea of irreducibility of chemical energy carrying ‘units’, and gravity is accounted for by intrinsic properties of anti-gravity carbon systems processing light, an electromagnetic force, that I have deduced towards ever expanding discrete energy space-energies rational to compressing mass/time. The role of loops seems to operate to control formalities where boundaries of space fluctuate as a result of what we called above – dark time-spaces.
Indeed, the concept of horizon is a constant due to ever expanding observables. Thus, it fails to acquire a rational approach towards space-time issues.
Richard Feynman has touched on issues of touching of space, sums of paths of particle traveling through time. In a way he has resolved an important paradigm, storing information and possibly studying it by opening a black box. Schroedinger’s cat is alive again, but incapable of climbing a tree when chased by a dog. Every time a cat climbs a garden tree, a fruit falls on hedgehogs carried away parallel to living wormholes whose purpose of generating information lies upon carbon units resolving light.
In order to deal with such a paradigm, we will introduce i+1 under square root in relativity, therefore taking negative one ( -1 = sqrt (i+1), an operational module R dealing with Wheelers foam squeezed by light, releasing water – dark spaces. Thousand words down!
What is a number? Is that a name or some kind of language or both? Is the issue of number theory possibly accountable to the value of the concept of entropic timing? Light penetrating a pyramid holding bean seeds on a piece of paper and a piece of slice of bread, a triple set, where a church mouse has taken a drop of tear, but a blood drop. What an amazing physics! The magic of biology lies above egoism, above pride, and below Saints.
We will set up the twelve parameters seen through 3+1 in classic realities:
– discrete absolute energies/forces – no contradiction for now between Newtonian and Albert Einstein mechanics
– mass absolute continuity – conservational law of physics in accordance to weak and strong forces
– quantum relative spaces – issuing a paradox of Albert Einstein’s space-time resolved by the uncertainty principle
– parallel continuity of multiple time/universes – resolving uncertainty of united space and energy through evolving statistical concepts of scalar relative space expansion and vector quantum energies by compressing relative continuity of matter in it, ever compressing flat surfaces – finding the inverse link between deterministic mechanics of displacement and imaginary space, where spheres fit within surface of triangles as time unwraps past by pulling strings from future.
To us, common human beings, with an extra curiosity overloaded by real dreams, value happens to play in the intricate foundation of life – the garden of love, its carbon management in mind, collecting pieces of squeezed cooling time.
The infinite interference of each operational module to another composing ever emerging time constrains unified by the Solar system, objective to humanity, perhaps answers that a drop of blood and a drop of tear is united by a droplet of a substance separating negative entropy to time courses of a physical realities as defined by an open algorithm where chasing power subdue to space becomes an issue of time.
Jose Eduardo de Salles Roselino
Some small errors: For intance an increase i P leads to a decrease in V ( not an increase in V)..
Radoslav S. Bozov Independent Researcher
If we were to use a preventative measures of medical science, instruments of medical science must predict future outcomes based on observable parameters of history….. There are several key issues arising: 1. Despite pinning a difference on genomic scale , say pieces of information, we do not know how to have changed that – that is shift methylome occupying genome surfaces , in a precise manner.. 2. Living systems operational quo DO NOT work as by vector gravity physics of ‘building blocks. That is projecting a delusional concept of a masonry trick, who has not worked by corner stones and ever shifting momenta … Assuming genomic assembling worked, that is dealing with inferences through data mining and annotation, we are not in a position to read future in real time, and we will never be, because of the rtPCR technology self restriction into data -time processing .. We know of existing post translational modalities… 3. We don’t know what we don’t know, and that foundational to future medicine – that is dealing with biological clocks, behavior, and various daily life inputs ranging from radiation to water systems, food quality, drugs…
Using QCLs for MIR-Based Spectral Imaging — Applications in Tissue Pathology
A quantum cascade laser (QCL) microscope allows for fast data acquisition, real-time chemical imaging and the ability to collect only spectral frequencies of interest. Due to their high-quality, highly tunable illumination characteristics and excellent signal-to-noise performance, QCLs are paving the way for the next generation of mid-infrared (MIR) imaging methodologies.
Efficient Spectroscopic Imaging Demonstrated In Vivo
Although optical spectroscopy is routinely used study molecules in cell samples, it is currently not practical to perform in vivo. Now, a converted Raman spectroscopy system has been used to reveal the chemical composition of living tissues in seconds.
Using QCLs for MIR-Based Spectral Imaging — Applications in Tissue Pathology
A quantum cascade laser (QCL) microscope allows for fast data acquisition, real-time chemical imaging and the ability to collect only spectral frequencies of interest. Due to their high-quality, highly tunable illumination characteristics and excellent signal-to-noise performance, QCLs are paving the way for the next generation of mid-infrared (MIR) imaging methodologies.
MICHAEL WALSH, UNIVERSITY OF ILLINOIS AT CHICAGO; MATTHEW BARRE & BENJAMIN BIRD, DAYLIGHT SOLUTIONS
H. Sreedhar*1, V. Varma*2, A. Graham3, Z. Richards1, F. Gambacorata4, A. Bhatt1,
P. Nguyen1, K. Meinke1, L. Nonn1, G. Guzman1, E. Fotheringham5, M. Weida5,
D. Arnone5, B. Mohar5, J. Rowlette5
1 Department of Bioengineering, University of Illinois at Chicago
2 Department of Pathology, University of Illinois at Chicago
3 Department of Bioengineering, University of Illinois at Urbana-Champaign
4 Department of Chemical Engineering, University of Illinois at Chicago
5 Daylight Solutions, San Diego
*Contributed Equally
Real-time, MIR chemical imaging microscopes could soon become powerful frontline screening tools for practicing pathologists. The ability to see differences in the biochemical makeup across a tissue sample greatly enhances a practioner’s ability to detect early stages of disease or disease variants. Today, this is accomplished much as it was 100 years ago — through the use of specially formulated stains and dyes in combination with white light microscopy. A new MIR, QCL-based microscope from Daylight Solutions enables real-time, nondestructive biochemical imaging of tissues without the need to perturb the sample with chemical or heat treatments, thus preserving the sample for follow-on fluorescence tagging, histochemical staining or other “omics” testing within the workflow.
MIR chemical imaging is a well-established absorbance spectroscopy technique; it senses the relative amount of light that molecules absorb due to their unique vibrational resonances falling within the MIR portion of the electromagnetic spectrum (i.e., wavelengths from approximately 2 to 15 µm). This absorption can be detected with a variety of MIR detector types and can provide detailed information about the sample’s chemical composition.
The most common instrument for this type of measurement is known as a Fourier transform infrared (FTIR) spectrometer. FTIR systems use a broadband MIR light source, known as a globar, to illuminate a sample; the absorption spectrum is generated by the use of interferometry. Throughout the past decade, FTIR systems have incorporated linear arrays and 2D focal plane arrays (FPAs) in a microscope configuration to enable a technique known as chemical imaging.
With this approach, the illumination beam is expanded across a sample area, and the data produced is transformed into a hyperspectral data cube — a 2D image of the sample with an absorption profile associated with every pixel. This is a very versatile technique that allows the detailed spatial distribution of chemical content to be analyzed across a sample. Recently, this technique has proved to be very useful within the biomedical imaging sector for label-free, biochemical analyses of cells, tissue and biofluids.
While FTIR microscopy now is established as a powerful technique for a wide variety of applications, the instruments used for this methodology are fundamentally limited by the brightness of the globar source. Users looking to maximize the signal-to-noise ratios, and the associated resolutions of the images produced are forced to use synchrotron facilities, which replace the globar light source with a MIR beam generated by a particle accelerator. This approach can yield excellent results but clearly is not practical for benchtop applications; it is particularly unfit for biomedical imaging applications within clinical settings.
The recent advent of QCLs has provided an ideal light source for next-generation MIR microscopy. They are compact, semiconductor-based lasers that produce high-brightness light in the MIR region. The devices can be manufactured in an external cavity configuration to provide broadly tunable output with a narrow spectral bandwidth at each frequency. In this configuration, a QCL can be tuned across the MIR spectrum to sequentially capture an absorption profile for chemical identification.
Daylight Solutions’ IR microscope incorporates a broadly tunable and high-brightness QCL light source (it is an order of magnitude brighter than a synchrotron), a set of high numerical aperture (NA) diffraction-limited objectives, and an uncooled microbolometer FPA into a compact, benchtop instrument, as shown in Figure 1. The instrument provides rapid, high-resolution chemical images across very large fields of view and also provides a real-time chemical imaging mode. By overcoming the physical size, camera cooling and data collection time requirements of FTIR-based instruments, the microscope is positioned to bring MIR microscopy beyond research settings and into clinical use.
Figure 1. Schematic of a quantum cascade laser (QCL) microscope. Courtesy of Daylight Solutions.
Dr. Michael Walsh of the University of Illinois at Chicago (UIC) conducts research within the pathology department’s Spectral Pathology Lab, which has been using the IR microscope for the past several months. Walsh has been focused on developing chemical imaging techniques, with the ultimate goal of improving diagnoses within the field of tissue pathology.
Currently, the state-of-the-art method-ology used for the diagnosis of most solid-organ diseases is to extract a tissue sample via a biopsy. Tissue inherently has very little contrast and needs to be stained with dyes or probes to visualize and identify cell types and tissue structures. The field of pathology is based on examining the stained tissues, typically using white light, to determine if the tissue morphology deviates from a normal pattern. If the tissue looks abnormal, the disease state may be further subclassified by grade or by predicted outcome. However, the field of pathology is limited by the information that can be derived from the stained tissues and the subjective interpretation of the tissue by a highly trained pathologist.
Spero microscope. Courtesy of Daylight Solutions.
UIC’s Spectral Pathology Lab is focused on identifying areas in pathology where current techniques fail, or where there is a need for additional diagnostic or prognostic information that can help improve patient care. Potentially, MIR imaging is a very valuable adjunct to the current practice of pathology. Rather than using only stains, MIR imaging can interrogate the entire biochemistry of the tissue and render a diagnosis in an objective fashion. Traditionally, MIR imaging with an FTIR system has been limited by slow data acquisition speeds and the need to collect the entire spectral data cube. QCL imaging with the Spero microscope has the potential to speed up the data acquisition of images obtained from a tissue sample and to collect only the spectral frequencies of interest. The device also provides real-time imaging of samples at 30 fps, which could allow pathologists to very rapidly identify areas of interest on a tissue biopsy in a manner that is similar to their current clinical workflows. Some examples of the comparison of FTIR-derived and QCL-derived images from multiple organ tissues of interest are presented.
Figure 2. (a) H&E-stained image of a mouse brain section on IR reflective slide, with selected regions labeled: hypothalamus, thalamus, and dentate gyrus. (b) Transflectance QCL IR image of same region, prior to staining, at 1652 cm−1, in which the thalamus is clearly distinguished from surrounding regions. (c) Same region at 1548 cm−1. (d) Same region at 1500 cm−1. Courtesy of University of Illinois at Chicago (UIC)/Spectral Pathology Lab.
A tissue section from a mouse brain was scanned using the Spero microscope’s high-magnification objective (12.5×; 0.7 NA; 1.4 × 1.4-µm pixels) at various MIR frequencies in transflection mode, as shown in Figure 2. The tissue then was stained using hematoxylin and eosin (H&E), the most common stain in histopathology, and is displayed in Figure 2a. Using the H&E stain, regions were identified in the brain (thalamus, dentate gyrus and hypothalamus) that correlated with structures in the IR image. By illuminating the tissue at various wavelengths, discrete tissue features exhibit contrast due to the difference in absorption, as highlighted in the IR images taken at 1652, 1548 and 1500 cm−1 in Figure 2b-d, respectively. The microscope also makes it possible to visualize tissue at these individual wavelengths in real time. The identification of cell types and their biochemical changes is of particular interest in neuropathology.
Figure 3. (a) Transmission FTIR image of a 4-µm thick section from a human liver tissue microarray on barium fluoride at 1650 cm-1. The image was taken with 64 coadditions of successive scans. (b) Transmission image from the Spero microscope of the same tissue at 1652 cm-1, both baseline corrected between 1796 cm-1 and 904 cm-1. In both images, the bright white stripe dividing the tissue core roughly in half is a region of fibrosis (red arrow), while the rest of the tissue on either side is composed primarily of hepatocytes (blue arrow). Courtesy of UIC/Spectral Pathology Lab.
A single biopsy core obtained from human liver tissue was scanned in transmission mode on a barium fluoride substrate by an Agilent Cary 600 Series FTIR microscope (Figure 3a). The FTIR image was acquired using a 36× Cassegrain collecting objective and a 15× Cassegrain condenser for a pixel size of 2.2 × 2.2 µm. Figure 3b shows the same liver core acquired using the Spero microscope with the high-magnification collecting objective (12.5×, 0.7 NA) and condenser objective for a pixel size of 1.4 × 1.4 µm. High-definition IR imaging enables clear contrast and identification of the band of fibrosis in the center of the core and the surrounding regions of liver cells, known as hepatocytes, and is indicated within Figure 3a-b. Acquisition of IR imaging data at the diffraction limit enables chemical information to be recorded from tissue structures at the single-cell level, allowing accurate characterization of individual tissue components, different cell types, varied disease states or other aspects of a tissue section.
Figure 4. (a) Averaged spectra for regions of interest corresponding to the hepatocytes and the fibrotic area on the FTIR image in Figure 3a. Spectra have been truncated from 1800 to 900 cm-1, normalized to 1650 cm-1, and baseline corrected between 1796 and 904 cm-1. (b) Averaged spectra for regions of interest corresponding to the hepatocytes and the fibrotic area on the Spero microscope image in Figure 3b. Spectra have been normalized to 1652 cm-1 and baseline corrected between 1796 and 904 cm-1.
Figure 4 displays average spectra calculated from homogenous tissue regions that describe hepatocytes and fibrosis within the liver tissue core shown in Figure 3. The spectra acquired from both FTIR and QCL systems are very similar. Walsh is focused on developing spectral classifiers that can aid pathologists in making very difficult diagnoses in the precancerous stages of liver cancer.
Figure 5. H&E-stained section of human colon tissue, and FTIR (with 16 coadditions) and Spero microscope transmission images of a 4-µm thick serial section of the same sample on barium fluoride. FTIR image shown at 1650 cm-1, Spero microscope image shown at 1652 cm-1. The red circle indicates mucin, the green circle indicates malignant colon carcinoma epithelium, and the blue circle indicates fibroblastic stroma. The raw spectra (taken from single pixels in approximately the same location for each of the three tissue features) are shown below their respective IR images. The FTIR spectra were truncated to match the Spero microscope’s spectral range of 1800 to 900 cm-1. Courtesy of UIC/Spectral Pathology Lab.
Point spectra from individual pixels were obtained and compared from a human colon sample on barium fluoride scanned in transmission on the same FTIR and QCL systems, which is shown in Figure 5. A serial section was obtained and stained with H&E to identify the different tissue structures. Using the H&E image as a reference, spectra from mucin (red), malignant colon carcinoma epithelium (green) and fibroblastic stroma (blue) were collected from a single pixel at approximately the same location. The unprocessed QCL and FTIR spectra are shown directly beneath their respective images. The FTIR system has an FPA size of 128 × 128 detector elements, while the Spero system has a microbolometer of 480 × 480 detector elements. Therefore, the FTIR image was collected as a mosaic and then stitched together.
Figure 6. (a) FTIR and Spero microscope spectra from a single pixel of mucin, from the tissue shown in Figure 5. (b) FTIR and Spero microscope spectra from a single pixel of malignant colon carcinoma epithelium, from the same tissue. (c) FTIR and Spero microscope spectra from a single pixel of fibroblastic stroma. All spectra have been normalized (FTIR to 1650 cm-1, Spero to 1652 cm-1) and baseline corrected between 1796 and 904 cm-1, with the FTIR spectra truncated to match the Spero microscope’s spectral range of 1800 to 900 cm-1. Note that pixels for each tissue feature were located in approximately the same region, and that the two images have different pixel sizes (2.2 × 2.2 µm for FTIR, 1.4 × 1.4 µm for Spero microscope). Courtesy of UIC/Spectral Pathology Lab.
The spectra obtained from the regions of interest depicted in Figure 5 were preprocessed, as shown in Figure 6. The data was peak height normalized to the Amide I band. The FTIR data and QCL data were processed using a simple, two-point linear baseline correction between 1796 and 904 cm−1. Figure 6a-c shows the processed data from single pixels looking at the biochemistry of mucin, malignant colon carcinoma epithelium and fibroblastic stroma, respectively. The spectra from the QCL and FTIR systems are very similar on an individual-pixel level.
Finally, Figure 7 shows the scan of a frozen prostate tissue section captured with the microscope. Once thawed, the system can quickly image these sections at a single frequency of interest. The real-time capabilities of the system combined with the capacity for scanning frozen samples could someday allow for the analysis of samples in a time-critical intraoperative setting.
Figure 7. Transflectance scan of a 5-µm frozen human prostate tissue section on Kevley low-emissivity substrate captured with the Spero microscope. Visualized with a false color map at 1640 cm-1. Data was baseline corrected between 1796 and 904 cm-1. Courtesy of UIC/Spectral Pathology Lab. University of Illinois at Chicago — Spectral Pathology Lab members, from left to right: David Martinez, Francesca Gambacorta, Vishal Varma, Andrew Graham and Michael Walsh. Courtesy of Daylight Solutions.
While there has been significant interest in MIR imaging for pathology applications for a number of years1-5, the technology has lacked the maturity to be ready for clinical implementation due to slow scanning speeds, low spatial resolutions and by a lack of computational power to fully handle large multispectral datasets. The Spero microscope, coupled with modern computing power, overcomes these limitations. The information detailed above demonstrates that the quality of the images and spectra obtained from the instrument are similar to those offered by FTIR imaging methods but with the additional benefits associated with the use of a QCL-based system. Recent advances in large multielement FPAs6-8) and high-resolution imaging approaches9-11 for tissue pathology have made this a much more attractive approach for fast and detailed image acquisition. QCLs represent the next step toward clinical implementation — they have demonstrated fast data acquisition, live-imaging capabilities and the ability to collect only spectral frequencies of diagnostic value.
Meet the authors
Michael Walsh holds a PhD in biological sciences and is an assistant professor at the University of Illinois at Chicago in Chicago; email: walshm@uic.edu. Matthew Barre is the business development manager at Daylight Solutions in San Diego; email: mbarre@daylightsolutions.com. Benjamin Bird is an applications scientist at Daylight Solutions in San Diego; email: bbird@daylightsolutions.com.
References
1. D.C. Fernandez et al. (2005). Infrared spectroscopic imaging for histopathologic recognition. Nat Biotechnol, Vol. 23, Issue 4, pp. 469-474.
2. C. Matthaus et al. (2008). Chapter 10: Infrared and Raman microscopy in cell biology. Methods Cell Biol, Vol. 89, pp. 275-308.
3. C. Kendall et al. (2009). Vibrational spectroscopy: a clinical tool for cancer diagnostics. Analyst, Vol. 134, Issue 6, pp. 1029-1045.
4. C. Krafft et al. (2009). Disease recognition by infrared and Raman spectroscopy. J Biophotonics, Vol. 2, Issue 1-2, pp. 13-28.
5. F.L. Martin et al. (2010). Distinguishing cell types or populations based on the computational analysis of their infrared spectra. Nat Protoc, Vol. 5, Issue 11, pp. 1748-1760.
Broadband Laser Aimed at Cancer Detection
Covering a wide swath of the mid-infrared, a new system offers greater spectral sensitivity
MUNICH, Sept. 25, 2015 — Mid-infrared (MIR) light is rich with molecular “fingerprint” information that can be used to detect substances from atmospheric pollutants to cancer cells.
While some lasers already operate in this region, enabling a variety of spectroscopy applications, their linewidth is relatively narrow, which limits the types of substances they can detect at any given moment.
Now a team of researchers from Germany and Spain has developed a laser system with phase-coherent emission from 6.8 to 16.4 μm and output power of 0.1 W. That is broad and powerful enough, they said, to detect subtle signs of cancer early in its development.
Molecules absorb portions of the MIR spectrum in ways that are unique to their atomic structures, and their absorption patterns provide a means of identifying the molecules with great specificity, even in low concentrations.
The emission spectrum of the laser and corresponding molecular fingerprint regions. Courtesy of the Institute of Photonic Sciences (ICFO).
“Cancer causes subtle modification in protein structure and content within a cell,” said professor Dr. Jens Biegert, a group leader at the Institute of Photonic Sciences (ICFO) in Barcelona. “Looking at only a few nanometer range, the probability of detection is extremely low. But comparing many of such intervals, one can have an extremely high confidence level.”
The new laser system generates MIR pulses via difference-frequency generation driven by the nonlinearly compressed pulses of a Kerr-lens mode-locked Yb:YAG thin-disc oscillator. It features a repetition rate of 100 MHz and pulse durations of 66 fs — so short that the electric field oscillates only twice per pulse.
Staff scientist Dr. Ioachim Pupeza (left) and postdoctoral researcher Oleg Pronin helped develop a laser system that emits ultrashort pulses of mid-infrared light. These pulses can be used to detect trace molecules in gaseous and liquid media. Courtesy of Thorsten Naeser/Ludwig Maximilian University.
“Since we now possess a compact source of high-intensity and coherent infrared light, we have a tool that can serve as an extremely sensitive sensor for the detection of molecules, and is suitable for serial production,” said project leader Dr. Ioachim Pupeza, a staff scientist at Ludwig Maximilian University of Munich (LMU).
The LMU and ICFO researchers aim to use their MIR laser to identify and quantify disease markers in exhaled air. Many diseases, including some types of cancer, are thought to produce specific molecules that end up in the air expelled from the lungs.
“We assume that exhaled breath contains well over 1000 different molecular species,” said Dr. Alexander Apolonskiy, an LMU group leader.
However, the amount of molecular biomarkers present in exhaled breath is extraordinarily low, meaning a diagnostic tool would need to be capable of detecting concentrations of at least one part per billion. The next step will be to couple the new laser system with a novel amplifier that would increase its brightness and boost sensitivity one part per trillion.
Detecting MIR signatures
The laser’s output spans more than one octave. Until now, the researchers said, such broadband emission has only been available from large-scale synchrotron sources.
Other more compact MIR sources, such as quantum cascade lasers (QCLs), have narrower linewidths. Tuning them to different sensing bands is time consuming, and combining multiple QCLs emitting in different parts of the MIR would be cost-prohibitive, Biegert said.
Meanwhile, the laser system’s 100-MHz pulse train is hundreds to thousands of times more powerful than state-of-the-art frequency combs that emit in the same range, the researchers said.
Detecting broadband MIR signals presents its own problems, however. Detectors for this region have poor signal-to-noise ratios unless cooled with liquid nitrogen, the researchers said.
In this case, electro-optical sampling proved to be a better option. Well-established for the terahertz range, the technique is less common in the fingerprint region.
“In the MIR range, there are not many groups who have implemented this already, because you need a broadband, phase-stable MIR pulse and an ultrashort sample pulse at the same time, which is quite challenging,” Pupeza said.
Having solved that problem with their broadband laser, the team now could use electro-optical sampling to extract the data they wanted.
In a nutshell, the process works like this: The electric field of an MIR pulse alters the birefringence of a crystal. This change can be measured by observing how the polarization of slightly shorter near-infrared (NIR) pulse is changed while propagating through the same crystal at the same time. In the end, only the NIR pulse is measured directly.
“Therefore, one big advantage is low-noise detection in the NIR, even though one obtains information on spectral components in the MIR,” said Ioachim Pupeza. “You only need to perform a Fourier transform numerically to get the spectrum of the pulse once you have its electric field.”
Perineuronal nets, shown in green, in three regions of the mouse brain. Credit: S.F. Palida et al.
Cognition and behavior rely on communication between individual neurons and extensive interactions between neural networks. But when synaptic dysfunction occurs, the results can be dire, leading to neurodegenerative symptoms in Alzheimer’s disease.
“The brain is the seed of our personal identity,” said Valina Dawson, Ph.D., director of neurogeneration and stem cell programs at Johns Hopkins University in Baltimore, Maryland. “It allows us to interact with our world but when things go wrong in the brain, it’s disastrous for the individual as well as the family.
“Our ability to treat these diseases is limited at the moment. We need new insight into what goes wrong.”
A lesser-known protein
Researchers, for years, have targeted amyloid beta (Aβ) in attempts to halt the progression of Alzheimer’s disease, and have recently, shown increased interest in the protein, tau.
But Paula Pousinha, Ph.D., at the French National Centre for Scientific Research, has focused her research on a lesser-known protein fragment: amyloid precursor protein intracellular domain (AICD). AICD is a fragment of amyloid precursor protein (APP), which is formed at the same time as Aβ in the brain. New evidence suggests that in addition to Aβ, AICD also disrupts communication between neurons during the progression of Alzheimer’s disease. Pousinha presented thesepublished findings at this year’s Society for Neuroscience (SfN) conference, which took place from October 17 to 21 in Chicago.
“Although AICD has been known for more than 10 years, it has been poorly studied,” said Pousinha.
Pousinha’s research team demonstrated that overexpressing AICD levels with AAV vector in rats’ brains “perturbs neuronal communication in the hippocampus,” a key structure necessary in forming memories and an area earliest affected in Alzheimer’s disease.
“In normal animals, if we apply to these neurons a high-frequency stimulation, afterward the neurons are stronger,” said Pousinha. “Neurons where we overexpressed AICD failed to have this potentization.”
Pousinha doesn’t negate the importance of Aβ in the development of neurodegenerative diseases. “Our study doesn’t exclude the pathological effects of Aβ,” she said. “We believe that Alzheimer’s disease is much more complex and has more than one candidate that has implications.
“It’s very important for the scientific community to understand the role of all these APP fragments of neuroinflammation — different pieces of the puzzle of how we can stop the disease progression.”
How do memories persist in the brain long term?
New research, also presented at this year’s SfN, has implications for understanding memory to develop treatments for Alzheimer’s disease and dementias. Sakina Palida, a graduate student at the University of California, San Diego found that localized modifications in the perineuronal net (PNN) at synapses could be a mechanism by which information is stably encoded and preserved in the brain over time.
“We still don’t understand how we stably encode and store memories in our brains for up to our entire lifetimes,” said Palida. The prevailing idea on how memories are maintained over time generally focus on postsynaptic proteins, said Palida. “But the problem with looking at intracellular synaptic proteins is that the majority turn over rapidly, of hours to at most a few days. So they’re very unstable.”
So, Palida and her team identified PNN as an ideal substrate for long-term memory. “Kind of like how you carve into stone — stone is a stable substrate — you retain the information regardless of what comes and goes over it.” They demonstrated that individual PNN proteins are highly stable, and that the PNN is locally degraded when synapses are strengthened.
And the team also demonstrated that mice lacking enzymes that degrade the PNN have deficient long-term, but not short-term, memory. “Which is a really exciting new result,” said Palida.
To track the PNN in live animals, Palida and her team fused a fluorescent protein to a small link protein in the PNN to allow tracking of PNN dynamics in real time. They also monitored PNN degradation in live cells after stimulating neurons with brain-derived neurotrophic factor (BDNF), a chemical secreted in the nervous system to enhance signaling — and observed localized degradation of the PNN at some newly formed synapses.
Crtl 1-Venus. Fusion of a fluorescent protein to small link proteins in the PNN allows tracking of PNN dynamics over time. Credit: S.F. Palida et al. Crtl1-Venus Neurons. Tracking PNN dynamics in live cells, in mouse brain tissue. Credit: S.F. Palida et al.
What’s next? “We’re currently making transgenic animals to express this protein, which would allow us to monitor PNN dynamics simultaneously with synaptic dynamics in a live animal brain, and really investigate this hypothesis further,” said Palida.
Increased APP intracellular domain (AICD) production perturbs synaptic signal integration via increased NMDAR function
Alzheimer’s disease (AD) is a neurodegenerative disease that begins as mild short-term memory deficits and culminates in total loss of cognition and executive functions. The main culprit of the disease, resulting from Amyloid-Precursor Protein (APP) processing, has been thought to be amyloid-b peptide (Ab). However, despite the genetic and cell biological evidence that supports the amyloid cascade hypothesis, it is becoming clear that AD etiology is complex and that Ab alone is unable to account for all aspects of AD [Pimplikar et al. J Neurosci.30: 14946. 2010]. Gamma-secretase not only liberates Ab, but also its C-terminal intracellular counterpart called APP intracellular domain (AICD) [Passer. et al. JAlzheimers Dis.2: 289-301. 2000], which is known to also accumulate in AD patient’s brain [Ghosal et al. PNAS.106:18367. 2009], but surprisingly little is known about its functions in the hippocampus. To address this crucial issue, we increased AICD production in vivo in adult CA1 pyramidal neurons, mimicking the human pathological condition. Different ex-vivo electrophysiological and pharmacological approaches, including double- patch of neighbor neurons were used. We clearly demonstrate that in vivo AICD production increases synaptic NMDA receptor currents. This causes a frequency-dependent disruption of synaptic signal integration, leading to impaired long-term potentiation, which we were able to rescue by different pharmacological approaches. Our results provide convincing and entirely novel evidence that increased in vivo production of AICD is enough, per se, to cause synaptic dysfunction in CA1 hippocampal neurons.
Society for Neuroscience Annual Meeting Showcases Strides in Brain Research
10/23/2015 – Stephanie Guzowski, Editor
CHICAGO – Nearly 30,000 researchers from more than 80 countries gathered this week at the annual Society for Neuroscience (SfN) meeting, the world’s largest conference focused on scientific discovery related to the brain and nervous system.
The 45th annual SfN meeting at McCormick Place convention center showcased more than 15,000 scientific presentations on advances in technologies and new research about brain structure, disease and treatments, and 517 exhibitors, according to event organizers.
Presentations covered a wide variety of topics including new technologies to study the brain, the science behind addiction, potential treatments for spinal cord injuries, and the role of synapses in neurological conditions.
Of particular focus was the Brain Research through Advancing Innovative Neurotechnologies (BRAIN) Initiative, the large collaborative quest to develop technologies for a dynamic view of the brain. In early October, the National Institutes of Health announced its second round of funding to support goals, bringing the NIH investment to $85 million in fiscal year 2015.
“But now, we know that tau is not simply a bystander but also a player,” Li said. “Both proteins work together to damage cell functions as the disease unfolds.”
Targeting tau
In the healthy brain, tau protein helps with the building and functioning of neurons. But when tau malfunctions, it creates abnormal clumps of protein fibers—neurofibrillary tangles—which spread rapidly throughout the brain. This highly toxic and altered form of the brain protein tau is called “tau oligomer.”
“There’s growing evidence that tau oligomers, not tau protein in general, are responsible for the development of neurodegenerative diseases, like Alzheimer’s,” said Julia Gerson, a graduate student in neuroscience at the University of Texas Medical Branch.
In Gerson’s research, which she presented at this year’s Society for Neuroscience meeting in Washington, D.C., Gerson and her team injected tau oligomers from people with Alzheimer’s into the brains of healthy mice. Subsequent testing revealed that the mice had developed memory loss.
“When we inject mice with tau oligomers, we see that they spend the same amount of time exploring a familiar object as an unfamiliar object,” said Gerson. “So they’re incapable of remembering that they’ve already seen this familiar object.”
What’s more, the molecules had multiplied throughout the animals’ brains. “This suggests that tau oligomers may spread from the injection site to other unaffected regions,” said Gerson.
Future treatments
Understanding tau’s connection to Alzheimer’s could have implications for potential therapies. “If we can stop the spread of these toxic tau oligomers, we may be capable of either preventing, or reversing, symptoms,” said Gerson. Gerson’s lab is currently investigating antibodies, which specifically fight tau oligomers.
Click to Enlarge. Normal brain vs. Alzheimer’s brain (Credit: Garrondo)
Erik Roberson, M.D., Ph.D., at the University of Alabama at Birmingham, and colleagues looked at how boosting the function of a specific type of neurotransmitter receptor, the NMDA receptor, provided benefit to people with the second most common type of dementia: frontotemporal dementia (FTD), a disease in which people experience rapid and dramatic changes in behavior, personality and social skills. People often quickly deteriorate and usually die about three years after diagnosis; there is also no effective treatment for FTD.
Since mutated tau impairs synapses—the connections between neurons—by reducing the size of NMDA receptors, “boosting the function of remaining NMDA receptors may help restore synaptic firing, and reverse behavioral abnormalities,” said Roberson.
Roberson’s, along with others’ work presented at the Society of Neuroscience meeting, focused on using animal models that mimic developing tau pathology. “These new mouse models, which contain both tau tangles and amyloid plaques” said Dr. Li, “offer the possibility of more accurately testing therapies directed at delaying the onset of amyloid beta plaques, tau accumulation and neuronal loss, all characteristic features of Alzheimer’s.”
Are clinical trials next?
Potentially, yes. “This arena of academic research has been ongoing for several years—it’s a younger area in terms of involvement of drug discovery,” said Sangram Sisodia, Ph.D., director of the Center for Molecular Neurobiology at the University of Chicago. “But I believe there is growing interest in pharma companies about targeting tau.
“The tau protein plays an incredibly complex role in the development of Alzheimer’s and other neurodegenerative diseases,” said Sisodia. “We are in the early stages of understanding that role, which will be crucial for developing effective preventions or treatments.”
Human Genetics and Childhood Diseases, Volume 2 (Volume Two: Latest in Genomics Methodologies for Therapeutics: Gene Editing, NGS and BioInformatics, Simulations and the Genome Ontology), Part 1: Next Generation Sequencing (NGS)
Human Genetics and Childhood Diseases
Curator: Larry H. Bernstein, MD, FCAP
Publication Roundup: HGMD
HGMD®, the Human Gene Mutation Database is used by scientists around the world to find information on reported genetic mutations. The papers below use the database to advance our understanding of disease, DNA dynamics, and more.
Local DNA dynamics shape mutational patterns of mononucleotide repeats in human genomes First author: Albino Bacolla
Scientists in the US and UK published results in Nucleic Acids Research of a detailed analysis of single-base substitutions and indels in the human genome. Their findings show that certain base positions are more susceptible to mutagenesis than others. They used HGMD Professional to find mutations in specific genomic regions for analysis; the paper includes charts showing mutation patterns, germline SNPs, and more from HGMD data.
High prevalence of CDH23 mutations in patients with congenital high-frequency sporadic or recessively inherited hearing loss First author: Kunio Mizutari
This Orphanet Journal of Rare Diseases paper from scientists in Japan sequenced 72 patients with unexplained hearing loss, finding several CDH23 mutations, some of which were novel. Mutations in the gene have been linked to Usher syndrome and other forms of hereditary hearing loss. The scientists used HGMD to find all known CDH23 mutations within nearly 70 coding regions.
Mutation analyses and prenatal diagnosis in families of X-linked severe combined immunodeficiency caused by IL2Rγ gene novel mutation First author: Q.L. Bai
In Genetics and Molecular Research, scientists report the utility of mutation analysis of the interleukin-2 receptor gamma gene to assess carrier status and perform prenatal diagnosis for X-linked severe combined immunodeficiency. They studied two high-risk families, along with 100 controls, to evaluate the approach. Sequence variation was determined using HGMD Professional and an X-SCID database, and a new mutation was discovered in the project.
Impact of glucocerebrosidase mutations on motor and nonmotor complications in Parkinson’s disease First author: Tomoko Oeda
Researchers from three hospitals in Japan published this Neurobiology of Aging report that may help stratify Parkinson’s disease patients by prognosis. They sequenced mutations in the GBA gene in 215 patients, finding that those who had mutations associated with Gaucher disease suffered dementia and psychosis much earlier than those who didn’t. The team found previously reported GBA mutations using HGMD Professional.
Comprehensive Genetic Characterization of a Spanish Brugada Syndrome Cohort First author: Elisabet Selga
In this PLoS One publication, scientists from a number of institutions in Spain examined genetic variation among patients with Brugada syndrome, a rare genetic cardiac arrhythmia. They sequenced 14 genes in 55 patients, identifying 61 variants and finding the subset that appear pathogenic. Variants were filtered against a number of databases, including HGMD.
Local DNA dynamics shape mutational patterns of mononucleotide repeats in human genomes
Single base substitutions (SBSs) and insertions/deletions are critical for generating population diversity and can lead both to inherited disease and cancer. Whereas on a genome-wide scale SBSs are influenced by cellular factors, on a fine scale SBSs are influenced by the local DNA sequence-context, although the role of flanking sequence is often unclear. Herein, we used bioinformatics, molecular dynamics and hybrid quantum mechanics/molecular mechanics to analyze sequence context-dependent mutagenesis at mononucleotide repeats (A-tracts and G-tracts) in human population variation and in cancer genomes. SBSs and insertions/deletions occur predominantly at the first and last base-pairs of A-tracts, whereas they are concentrated at the second and third base-pairs in G-tracts. These positions correspond to the most flexible sites along A-tracts, and to sites where a ‘hole’, generated by the loss of an electron through oxidation, is most likely to be localized in G-tracts. For A-tracts, most SBSs occur in the direction of the base-pair flanking the tracts. We conclude that intrinsic features of local DNA structure, i.e. base-pair flexibility and charge transfer, render specific nucleotides along mononucleotide runs susceptible to base modification, which then yields mutations. Thus, local DNA dynamics contributes to phenotypic variation and disease in the human population.
INTRODUCTION
Changes in human genomic DNA in the form of base substitutions and insertions/deletions (indels) are essential to ensure population diversity, adaptation to the environment, defense from pathogens and self-recognition; they are also a critical source of human inherited disease and cancer. On a genome-wide scale, base substitutions result from the combined action of several factors, including replication fidelity, lagging versus leading strand DNA synthesis, repair, recombination, replication timing, transcription, nucleosome occupancy, etc., both in the germline and in cancer (1–4). On a much finer scale [(over a few base pairs (bp)], rates of base substitutions may be strongly influenced by interrelationships between base–protein and base–base interactions. For example, the mutator role of activation-induced deaminase (AID) in B-cells during class-switch recombination and somatic hypermutation (5) targets preferentially cytosines within WRC (W: A|T; R: A|G) sequences (6), whereas apolipoprotein B mRNA editing enzyme, catalytic polypeptide-like (APOBEC) overexpression displays a preference for base substitutions at cytosines in TCW contexts (7). Other examples, such as the induction of C→T transitions at CG:CG dinucleotides by cytosine-5-methylation and the role of UV light in promoting base substitutions at pyrimidine dimers have been well documented (reviewed in (4,8)). More recently, complex patterns of base substitution at guanosines in cancer genomes have been found to correlate with changes in guanosine ionization potentials as a result of electronic interactions with flanking bases (9), suggesting a role for electron transfer and oxidation reactions in sequence-dependent mutagenesis. However, despite these advances, the increasing number of sequence-dependent patterns of mutation noted in genome-wide sequencing studies has met with a lack of understanding of most of the underlying mechanisms (10). Thus, a picture is emerging in which mutations are often heavily dependent on sequence-context, but for which our comprehension is limited.
Mononucleotide repeats comprise blocks of identical base pairs (A|T or C|G; hereafter referred to as A-tracts and G-tracts) and display distinct features: they are abundant in vertebrate genomes; mutations within the tracts occur more frequently than the genome-wide average; mutations generally increase with increasing tract length; length instability is a hallmark of mismatch repair-deficiency in cancers; and sequence polymorphism within the general population has been linked to phenotypic diversity (11–15). Thus, mononucleotide repeats appear ideal for addressing the question of sequence-dependent mutagenesis since base pairs within the tracts are flanked by identical neighbors. Both historic and recent investigations concur with the conclusion that a major source of mononucleotide repeat polymorphism is the occurrence of slippage (i.e. repeat misalignment) during semiconservative DNA replication, which gives rise to the addition or deletion of repeat units (11,12). An additional and equally important source of mutation has recently been suggested to arise from errors in DNA replication by translesion synthesis DNA polymerases, such as pol η and pol κ (13), also on slipped intermediates, leading to single base substitutions.
A key question that remains unanswered in these studies and which is relevant to the issue of sequence context-dependent mutagenesis is whether all base pairs within mononucleotide repeats display identical susceptibility to single base changes and whether indels (which are consequent to DNA breakage) occur randomly within the tracts.
Herein, we combine bioinformatics analyses on mononucleotide repeat variants from the 1000 Genomes Project and cancer genomes with molecular dynamics simulations and hybrid quantum mechanics/molecular mechanics calculations to address the question of sequence-dependent mutagenesis within these tracts. We show that mutations along both A-tracts and G-tracts are highly non-uniform. Specifically, both base substitutions and indels occur preferentially at the first and last bp of A-tracts, whereas they are concentrated between the second and third G:C base pairs in G-tracts. These positions coincide with the most flexible base pairs for A-tracts and with the preferential localization of a ‘hole’ that results when one electron is lost due to an oxidation reaction anywhere along G-tracts. Thus, despite the uniformity of sequence composition, mutations occur in a sequence-dependent context at homopolymeric runs according to a hierarchy that is imposed by both local DNA structural features and long-range base–base interactions. We also show that the repair processes leading to base substitution must differ between A- and G-tracts, since in the former, but not in the latter, base substitutions occur predominantly in the direction of the base immediately flanking the tracts. Additional sequence-dependent patterns of mutation are likely to arise from studies of more heterogeneous sequence combinations, possibly involving other aspects intrinsic to the structure of DNA.
RESULTS
Mononucleotide repeat variation is defined by tract length and flanking base composition
We define mononucleotide repeats in the GRCh37/hg19 (hg19) human genome assembly as uninterrupted runs of A:T and G:C base pairs (hereafter referred to as A-tracts and G-tracts, respectively) from 4 to 13 base pairs in length (Figure 1A). We retrieved a total of 48,767,945 A-tracts and 13,633,781 G-tracts, both of which displayed a biphasic distribution with an inflection point between tract lengths of 8 and 9 (bp) and with the number of runs declining with length more dramatically for G-tracts than for A-tracts (Figure 1B), as noted previously (29). Both the number of short tracts and the extent of decline varied with flanking base composition, TA[n]T runs being two- to three-fold more abundant than CA[n]Cs (Supplementary Figure S1A) and AG[n]As declining the most rapidly (Supplementary Figure S1B). Thus, mononucleotide runs exist as a collection of separate pools of sequences in extant human genomes, each maintained at distinctive rates of sequence stability, as determined by factors such as bp composition (A:T versus G:C), tract length and flanking sequence composition.
Mononucleotide repeat variation, evolutionary conservation and association with transcription. (A) The search algorithm was designed to retrieve runs of As or Ts (A-tracts) and Gs or Cs (G-tracts) length n (n = 4 to 13), along with their 5′ (n = 0) and 3′ (n = n + 1) nearest neighbors from hg19. Tract bases were numbered 5′ to 3′ with respect to the purine-rich sequence. The panel exemplifies the nomenclature for A- and G-tracts of length 4. (B) Logarithmic plot of the number of A-tracts (closed circles) and G-tracts (open circles) in hg19 as a function of length. (C) Normalized fractions of polymorphic tracts (F SNV) (number of SNVs divided by both hg19 number of tracts and n) from the 1KGP for A-tracts (closed circles) and G-tracts (open circles). (D) Radial plot of SNVs in the 1KGP at the 5′ and 3′ nearest neighbors of A-tracts. Periphery, tract length; horizontal axis, scale for the fraction of SNVs (F SNV). (E) Radial plot of SNVs in the 1KGP at the 5′ and 3′ nearest neighbors of G-tracts. (F) Percent difference in the numbers of A-tracts (closed circles) and G-tracts (open circles) between syntenic regions of hg19 and HN genomes. (G) The exponents of Benjamini-corrected P-values for A-tract-containing genes enriched in transcription-factor binding sites plotted as a function of A-tract length (triangles); each value represents the median of the top 11 USCS_TFBS terms. The percent A-tracts (closed circles) and G-tracts (open circles) intersecting genomic regions pulled-down by chromatin immunoprecipitation using antibodies against transcription factors are plotted as a function of tract length. (H) List of gene enrichment terms with a Benjamini-corrected P-value of <0.05 in common between genes containing A- and G-tracts of lengths 4–13, excluding the UCSC_TFBS terms.
We examined the extent of sequence variation in the human population by mapping 38,878,546 single nucleotide variants (SNVs) from 1092 haplotype-resolved genomes (the 1000 Genomes Project, 1KGP) (30) to the hg19 A- and G-tracts. The normalized fractions of polymorphic tracts (F SNV) were greater for G-tracts than A-tracts and both displayed Gaussian-type distributions, with maxima of 0.067 for G-tracts of length 8 and 0.017 for A-tracts of length 9 (Figure 1C). CA[n]C and AG[n]A runs displayed the highest F SNV values for A- and G-tracts, respectively (Supplementary Figure S1C and D), with F SNV values for AG[n]As attaining ∼0.10 at length 8. We conclude that flanking base composition influences the rates of SNV within mononucleotide runs and, as a consequence, their representation in the reference human genome.
F SNV values at the flanking 5′ and 3′ bp were similar between A- and G-tracts, except for minor differences for the least represented (i.e. longest) tracts and did not exceed 0.02 (Supplementary Figure S1E). These fractions are expected to be greater than at more distant positions from the tracts, based on previous data (29). SNVs at G-tracts, but not at A-tracts, were more frequent than at flanking base pairs. F SNVs for base pairs flanking short (≤8 bp) tracts were at least twice as high as those flanking long tracts; F SNVs also displayed distinct sequence preference with most (∼0.1) variants occurring at Ts 3′ of G-tracts (Figure 1D and E). In summary, SNVs at mononucleotide runs do not increase monotonically with length but peak at 8–9 bp. This behavior mirrors the genomic distributions, both with respect to the total number of tracts (Figure 1B) and the subsets flanked by specific-sequence combinations (Supplementary Figure S1A–D). Variation at flanking base pairs also displayed a biphasic pattern centered at a length of 8–9 bp, with a greater chance of variation adjacent to G- than A-tracts and with characteristic sequence preferences.
Long tracts are evolutionarily conserved and associated with high transcription
To assess whether more variable monosatellite runs (Figure 1C) might have undergone a greater reduction in number in extant humans relative to extinct hominids, we compared the number of A- and G-tracts between syntenic regions of five individuals comprising hg19 and three Neanderthal (HN) specimens (31). The difference between hg19 and HN was very small (<±2%) for the short tracts, but it displayed more negative values in hg19 with increasing tract length, which reached a maximum of −11.8 and −32.7% for A- and G-tracts, respectively, of length 9. Beyond this threshold, the numbers of tracts converged for A-tracts, whereas they were more abundant in hg19 for G-tracts >11 bp (Figure 1F). In summary, the largest difference in the number of mononucleotide runs between hg19 and HN sequences was centered at 9 bp for both A- and G-tracts, suggesting that the length distributions (Figure 1A and Supplementary Figure S1A and B) reflect distinct rates of evolutionary gains and losses due to differential sequence mutability (Figure 1C) as a function of length and flanking sequence composition (12).
The fact that long (>9 bp) mononucleotide runs display low variability in the human population (Figure 1C) and sequence conservation during evolutionary divergence (Figure 1F) raises the possibility that they might serve functional roles. Through gene enrichment analyses, we found that genes containing A- and G-tracts were enriched for genes associated with the term ‘UCSC_TFBS’, which pertains to transcripts harboring frequent transcription factor binding sites (32,33). For A-tract-containing genes, the median P-values for the top 11 UCSC_TFBS terms decreased from 2.95E-26 for tracts of length 4 to 5.22E-241 for tracts of length 13 (Figure 1G). The percent of A-tracts intersecting genomic fragments amplified from chromatin immunoprecipitation using transcription-factor binding antibodies (32,33) also increased from 8.7 to 9.9 from length 6 to 13, whereas it was constant (mean ± SD, 22.4 ± 1.1) for G-tracts (Figure1G). For gene classes excluding ‘UCSC_TFBS’, a search for categories enriched at P < 0.05 and common to all A- and G-tract-containing genes returned a set of 25 terms, 22 of which were associated with high levels of tissue-specific gene expression (Figure 1H). In summary, these analyses extend prior work (14) supporting a role for mononucleotide tracts in enhancing gene expression, a function that for A-tracts appears to increase with increasing tract length.
Repeat variability is highly skewed
Next we addressed whether bp along A- and G-tracts display equal probability and type of variation. In the 1KGP dataset, the number of SNVs at each position along both A- and G-tracts of length 4 was within a two-fold difference (144,000–240,000); for both types of sequence, transitions (i.e. A→G and G→A) were the predominant (51–78%) type of base substitution (Supplementary Figure S2A and B). However, with increasing length, the number of SNVs decreased up to 30-fold more drastically for G-tracts than for A-tracts, with increasing numbers of transversions (A→T and G→C|T) being predominant. Normalizing the data for the number of tracts genome-wide revealed that the extent of SNV varied by up to 10-fold, depending upon tract length and bp position. Specifically, the highest degree of variation was observed at the first and last A within the A-tracts (i.e. A1 and An), which underwent up to 61% A→T and 43% A→C transversions, respectively, at length 9 (Figure 2A). Likewise, for G-tracts, the most polymorphic sites were G3, followed by G2, for mid-size tracts of 8–10 bp, with 44% G→C transversions at G3 for tracts of length 8 (Figure2B). Thus, the extent of SNV at mononucleotide runs is grossly skewed in human genomes, both along the sequence itself and across tract length, which must account for the bell-shape behavior in F SNV for the tracts as a whole (Figure 1C).
Population variation spectra. (A) Variation spectra of A-tracts. Percent (number of SNVs at each position divided by the number of tracts in hg19 × 100) of A→T (black), A→C (red) and A→G (green) SNVs in the 1KGP dataset (left). Percent SNVs at A1 as a function of tract length (right). (B) Variation spectra of G-tracts. As in panel A with G→T (black), G→C (red) and G→A (cyan) (left). Percent SNVs at G3 as a function of tract length (right). (C) Percent A→T, A→C and A→G transitions at each position along A-tracts (stars) preceded and followed by a T (TA[n]T, left), C (CA[n]C), center) and G (GA[n]G, right) as a function of tract length. (D) Percent G→T, G→C and G→A transitions at each position along G-tracts (stars) preceded and followed by a T (TG[n]T, left), C (CG[n]C), center) and A (AG[n]A, right) as a function of tract length. (E) Percent transitions at base pairs (stars) preceding or following A-tracts (left) and G-tracts (right) as a function of tract length (n). *, mutated position.
We assessed whether SNV hypervariability was associated with specific combinations of nearest neighbors. For A-tracts flanked 5′ by a T, C or G, the highest percentage of SNVs was observed at A1 when preceded by a T, which reached 7.9% for TA[n] tracts of length 9 (Supplementary Figure S2C). By contrast, for 3′ T, C or G, the greatest effect was elicited by a C, with the highest percentage (7.1%) of SNVs at An for A[n]C tracts of length 9 (Supplementary Figure S2D). Therefore, flanking base pairs play a critical role both in the spectra and frequencies of SNVs at A-tracts. More detailed plots along A-tracts either preceded (Supplementary Figure S2E), followed (Supplementary Figure S2F) or preceded and followed (Figure 2C) by a T, C or G revealed the dramatic and long-range (up to 9–10 bp for the longest tracts, higher than the value of 4 bp predicted by mathematical models of slippage (11)) influence of flanking base pairs on variation spectra, in which up to 95% of the changes were in the direction of the base flanking the tract. Because the number of A-tracts preceded or followed by a specific base varies by up to three-fold (Supplementary Figure S2G), we conclude that for A-tracts, the overall mutation fractions and spectra are the result of at least three variables; length, position along the tract, and base composition of the 5′ and 3′ nearest-neighbors.
For G-tracts flanked 5′ by a T, C or A, high percentages (10–12%) of SNVs were observed at G1 for tracts preceded by a C, an effect that decreased with increasing tract length (Supplementary Figure S3A). This result, together with an exceedingly low number of G→A transitions at G1 for tracts not preceded by a C (Supplementary Figure S3C) relative to all tracts (Supplementary Figure S2B), is consistent with the known high mutability of CG:CG dinucleotides as a result of cytosine-5 methylation (9). The hypermutability at G2 was observed preferentially for tracts preceded by an A, and to a lesser extent T, whereas that at G3 was insensitive to flanking sequence composition. Likewise, G-tracts flanked 3′ by a T, C or A did not display marked sequence-dependent effects (Supplementary Figure S3B). Detailed plots of the SNV spectra along G-tracts either preceded (Supplementary Figure S3D), followed (Supplementary Figure S3E), or preceded and followed (Figure 2D) by a T, C or A revealed a noticeable effect only for 5′ T in association with G→T substitutions at G1for tracts of length ≥8. Thus, despite a consistent over-representation of G-tracts flanked 5′ by a T (Supplementary Figures S3F and S1B), which must account for the high absolute number of SNVs at G1 for TG[n] relative to AG[n] and CG[n] (Supplementary Figure S3G), nearest-neighbor base composition seems to play a lesser role in SNV spectra at G-tracts than at A-tracts.
With respect to SNVs at the flanking 5′ and 3′ nearest positions, no B→A or H→G substitutions (Figure 1A) were found above a length threshold of 9 for A-tracts and 8 for G-tracts (Figure 2E, gray shading) out of 5969 SNVs, implying that tract expansion by recruiting flanking base pairs is disfavored at these lengths. In summary, base substitution along mononucleotide repeats is strongly skewed towards the edges of A-tracts and within the 5′ half of G-tracts, with frequencies that peak at midsize lengths (8–9 bp). For A-tracts ≥7 bp, base substitution occurred almost exclusively in the direction of the flanking nearest-neighbors. Finally, base substitution at flanking bases did not contribute to tract expansion for mononucleotide runs longer than 8–9 bp.
Insertions and deletions display length and positional preference
In addition to SNVs, mononucleotide runs are polymorphic in length as a result of indels. Herein, we consider separately two types of indels: one in which tract length changes by ±1 and flanking bp composition is not altered (slippage); the other comprising all other cases involving the addition or removal of 1–200 bp (indels). Slippage is a widely accepted mutational mechanism (11–12,34), whereby DNA replication errors at reiterated DNA motifs cause changes in the number of motifs (most often +/−1). The normalized fractions of slippage in the 1KGP dataset peaked at lengths of 8 bp for A-tracts and 9 bp for G-tracts (Figure 3A), generating bell-shaped curves similar to those observed for SNVs (Figure1C) and with no differences in the highest fraction of ‘slipped’ tracts, which peaked at ∼0.02. By contrast, +1 slippage occurred more frequently than −1 slippage at A-tracts (Figure 3B). These results support recent studies on microsatellite repeats (12) and contrast with previous conclusions that slippage increases monotonically with tract length, and that the extent of slippage differs between A- and G-tracts (35,36).
Population insertions and deletions. (A) Normalized fractions of A-tracts (closed circles) and G-tracts (open circles) displaying +/−1 bp slippage in the 1KGP dataset as a function of tract length. Data were obtained by dividing the number of events by both the number of hg19 tracts and tract length (n). (B) Ratio of the number of +1 to −1 slippage for A-tracts (closed circles) and G-tracts (open circles). (C) Indels at A-tracts. For positions along the tracts (‘Tract’), ‘F Indel’ is the ratio between the number of indels and the number of tracts in hg19 multiplied by tract length. For the positions immediately flanking the tracts genomic coordinates (‘Before tract’ and ‘After tract’), ‘F Indel’ is the ratio between the number of indels and the number of tracts in hg19. (D) Indels at G-tracts, calculated as described in panel C. (E) Heatmap representation of insertions along A-tracts. The percent insertions (i.e. the number of insertions at each position divided by the number of tracts in hg19) (y-axis) plotted as a function of location (x-axis) from position 0 (insertion between the bp 5′ to the tract and the first bp of the tract) to position n + 1 (insertion between the bp 3′ to the last bp of the tract and the following bp) (see Figure 1A) and as a function of tract length (z-axis). (F) Heatmap representation of insertions along G-tracts.
With respect to indels, the normalized fractions were low (<1 × 10⁻³) along short (4–6 bp) A- and G-tracts, but rose to a plateau for longer tracts as reported earlier (11); this plateau was 10-fold higher for G-tracts (∼0.03) than for A-tracts (∼0.003) (Figure 3C and D). Indels also occurred more frequently (up to six-fold for A-tracts of length 11) at nearest-neighboring base pairs (‘Before tract’ and ‘After tract’ in Figure 3C and D) than along the tracts. Thus, contrary to SNVs and slippage, indels increased to a plateau with mononucleotide tract length.
We analyzed in detail the locations of insertions along the tracts and the flanking positions with respect to the 5′ to 3′ orientation of the tracts (Figure 1A). The normalized fractions demonstrated that insertions peaked at the 3′, and to a lesser extent 5′, ends of the longest A-tracts (Figure 3E), but remained low. For G-tracts, insertions occurred most efficiently at two locations (G2–3 and G5) (Figure 3F), they increased with tract length (up to ∼0.04), and attained ∼10-fold higher values than for A-tracts. In conclusion, insertion sites at A- and G-tracts followed the patterns observed for SNVs (Figure 2A and B), suggesting that factors associated with local DNA dynamics sensitize specific bases along the tracts to genetic alteration, inducing both SBS and indels.
Base pair flexibility and charge localization map to sites of sequence changes
To elucidate elements of intrinsic DNA dynamics that may be responsible for the biases in SNV and insertion sites, we performed molecular dynamics (MD) and hybrid quantum mechanics/molecular mechanics (QM/MM) simulations on model A[6], A[9], G[6] and G[9] duplex DNA fragments. We focused on water bridge coordination (Figure 4A), bp step flexibility, and for the G[6] and G[9], charge localization, as these properties are known to impact the susceptibility of DNA to base damage, repair and mutation. The fractions of one water coordination increased along the A[9] and A[6] structures in a 5′ to 3′ direction, irrespective of flanking sequence composition, in concert with a decrease in minor groove width (Figure 4B and Supplementary Figure S4A) as predicted (37). Vstep, a measure of bp structural fluctuation, displayed a prominent peak of ∼40 Å3deg3 at the 5′-TA-3′ step for both structures (Figure 4C and Supplementary Figure S4B), which together with low water occupancy points to 5′-TA-3′ being a preferred location for base modification and mutation. In the G[9] and G[6] structures water coordination involved mostly two-water bridges due to wide (∼14 Å) minor grooves (Figure 4Dand Supplementary Figure S4C), whereas flexibility was modest (∼20–22 Å3deg3, Figure 4E and Supplementary Figure S4D). Thus, bp dynamics are likely to impact mutations at A-tracts to a greater extent than at G-tracts. Guanine has the lowest ionization potential (IP) of all four bases and IP further decreases at guanine runs, rendering them targets for electron loss, charge localization, oxidation and eventually mutation (4,38). Because after electron loss the ensuing charge (hole) can migrate along the DNA double-helix and relocalize at specific guanines, we addressed whether the preferred sites of mutation along G-tracts, i.e. G2–3 and G5, would also be preferred sites for charge localization. The QM/MM determinations indicated that whereas for the short G[6] fragment the difference in the density-derived atomic partial charges (DDAPC) (i.e. the hole) localized most often (∼50%) to the first position (Figure 4F), for the long G[9] fragment charge localization shifted downstream (mostly to the second, but also to positions 6–7, Figure 4G). Importantly, the charge was found exclusively around the guanine rings (Figure 4H). Thus, the two main sites of sequence change along G-tracts, i.e. G2–3 and G5, coincide with positions where charge localization and hence one-electron oxidation reactions is predicted to occur most frequently. In summary, bp flexibility at A-tracts and charge transfer at G-tracts likely represent intrinsic DNA features underlying the bias in SNV and insertions at mononucleotide runs in human genomes.
MD and QM/MM simulations. (A) Molecular modeling of one (left) and two (right) minor groove water bridge coordination. (B) Fraction of one-water bridge occupancy (left axis) at A[9] DNA sequences flanked 5′ and 3′ by a T (black circles), C (red circles) or G (green circles). Minor groove widths (right axis), as determined from intrastrand phosphate-to-phosphate distances. (C) Vstep for A[9] DNA sequences, determined as the product of the square root of the eigenvalues (λi) described by the six bp step parameters shift, slide, rise, tilt, roll and twist; i.e. Vstep=∏6i=1λi−−√. (D) Fraction of one- (black circles) and two-water (red circles) bridge occupancy (left axis) at G[9] DNA sequences. Minor groove widths (right axis), as assessed from intrastrand phosphate-to-phosphate distances. (E) Vstep for G9 DNA sequences. (F) Average charge redistribution (open circles and right axis) for G[6] DNA structures upon vertical ionization, examined by calculating the difference on the density-derived atomic partial charges (DDAPC) for the neutral and negatively charged states. Histogram of the number of instances (left axis) in which the largest charge redistribution occurred at a specific position along the G[6] structures. (G) DDAPC for G[9] DNA structures (open circles and right axis) and histogram of the number of instances (left axis) in which the largest charge redistribution occurred at a specific position. (H) VMD rendering of a G[9] DNA structure displaying hole localization at G2. Capped base pairs were removed for clarity.
Position and orientation along nucleosome core particles modulate sequence variation
DNA wrapped around histones in nucleosomes is subject to local deformation (39), which may impact mutation. Thus, we analyzed the 1KGP SNVs at A- and G-tracts predicted to overlap with well-positioned nucleosome core particles (NCPs) (16). In hg19, the percentage of tracts that overlap with NCPs decreased moderately from ∼90% at length of 4 to 81% and 71% for A- and G-tracts of length 13, respectively (Figure 5A), suggesting that mononucleotide runs are not depleted in NCPs in human genomes as previously proposed (40). A-tracts of lengths 4–8 base pairs displayed distinctive peaks along the NCP surface in phase with the helical repeat of DNA (10.5 bp) and with minor grooves facing toward the inner protein core (lengths 4–5) (16) (Figure 5B and Supplementary Figure S5A). A-tracts of length of 9–13 bp exhibited only half (six) the peaks evident for the shorter tracts. For the G-tracts, only small peaks with no clear minor groove-inward-facing regions were detected (Supplementary Figure S5B).
Positioning along nucleosome core particles. (A) Percent of A-tract (open circles) and G-tract (closed circles) base pairs in hg19 overlapping with well-positioned NCP genomic coordinates as a function of tract length. (B) Counts of base pairs in hg19 A-tracts of length 5 overlapping with NCPs genomic regions as a function of distance from the histone octamer dyad axis. Minor groove-inward-facing regions (gray) were derived from the X-ray crystal structure of NCP147 (41). (C) Percent SNVs in the 1KGP dataset (left axis) at every bp along A-tracts of length 5 for tracts centered at maxima (black) and minima (gray) along NCPs (Figure 5B). Percent increase (right axis) of SNVs at minima relative to maxima (green). P-values for paired t-tests: 0.013 (*), 0.002 (**) and 4.7 × 10⁻⁶ (***). (D) Whisker plots of%SNVs (left axis) at A1 for A-tracts of length 5 centered at maxima and minima (black) along NCPs (Figure 5B). Percent difference (right axis) in the number of A-tracts of length 5 in hg19 preceded by C, T or G (red) between those centered at minima and those centered at maxima (Figure5B). (E) C-containing/G-containing ratios (see text) for G-tracts of length 5 in hg19 as a function of distance from the NCP dyad axis (black) and location of core histones (maroon and green). Peaks correspond to negative iSAT (i.e. tilt parameters multiplied by the corresponding sin θ) values (gray) (39). Ratios of%SNV at G1 (upshifted by 0.5 for clarity) between C-containing (5′-CCCCCG-3′ sequences on the hg19 forward strand) and G-containing (5′-CGGGGG-3′ sequences on the hg19 forward strand) (Figure 1A) CG[5] tracts mapping NCP Chip-seq genomic intervals (red) fitted by a non-parametric local regression (loess; sampling proportion, 0.100; polynomial degree, 3). (F) VMD rendering (top) of TATTT residues 34–38 (yellow) and the complementary AAATA residues 672–753 (pink) from the 1EQZ pdb nucleosomal crystal structure, corresponding to peak area from −40 to −36 in Figure 5E. The switch in G-tract (lengths of 5 and 7) orientation along NCPs (bottom) serves to position the C-containing strand on the outside (yellow) and, correspondingly, the G-containing strand on the inside (pink).
To assess if tract-positioning along NCPs influences SNVs, we selected A-tracts of lengths 5, 7 and 9 bp and G-tracts of lengths 5 and 7 bp whose central positions coincided with either the maxima or minima (41) (Figure 5B and Supplementary Figure S5A and B) and conducted pair-wiset-tests (330 total) between permutations of ‘categories’, including ‘tracts centered at maxima versus minima’, ‘position along the tracts’, ‘flanking sequence composition’, ‘specific NCP locations’ and ‘tract orientation’. For A-tracts, 79/207 (38%) significant pairs were found, 68 (86%) of which were related to differences between tracts centered at maxima versus minima, with a preponderance (63%) of tests displaying increased %SNVs at minima (Supplementary Figure S5C and E). For example, %SNVs at length 5 bp were greater at minima than at maxima at each position along the A-tracts (Figure 5C). A→C substitutions at A1 were more abundant at maxima than at minima (mean ± SD, 18.7 ± 0.7% at max and 17.6 ± 0.8% at min; P-value 0.001), whereas A→T substitutions at the same position displayed the opposite trend (mean ± SD, 18.4 ± 0.5% at max and 19.8 ± 1.1% at min; P-value 0.0005) (Figure 5D). A-tracts of length 7 also exhibited a similar pattern at A7 (Supplementary Figure S5H). The percentages of CA[5] and A[7]C tracts in hg19 centered at maxima were greater than at minima and the reverse was observed for the TA[5] and A[7T] tracts (Figure 5D and Supplementary Figure S5H). Thus, we conclude that positioning along the NCP surface of both the double-helical grooves and junctions with flanking base pairs influence SNVs along A-tracts. However, this influence is complex and for the most part, difficult to predict.
For G-tracts, most pairwise comparisons (18/34, 53%) indicated SNV variation according to sequence orientation (Supplementary Figure S5F and G). In hg19, the ratio of the numbers of G-tracts of lengths 5 and 7 for which the C-containing strand coincided with the forward sequence (downstream example sequence in Figure 1A) to the numbers of G-tracts for which the G-containing strand coincided with the forward sequence (upstream example sequence in Figure 1A) (C-containing/G-containing ratios) displayed a prominent 10.5-bp oscillation in phase with iSAT (Figure 5E), a measure of ‘inside’ and ‘outside’ bases, according to the bp step tilt parameter (39). Analysis of the helical path of a 146-bp DNA fragment wrapped around histones showed that the oscillation in the C-containing/G-containing ratios corresponds to a preference for guanine bases to face the protein core (Figure 5F). We analyzed the subset of G-tracts preceded by a 5′ C (i.e. CG[5]) to assess whether SNVs at G1, the position known to be mutable due to CpG methylation also oscillated with the C-containing/G-containing ratios. Oscillation in SNV-C-containing/SNV-G-containing values was evident, with peaks aligning to the hg19 troughs (Figure 5E) implying that the cytosines facing the protein surface harbor more variants than those facing away. We conclude that A- and G-tracts display preferential positioning (the former) and orientation (the latter) along NCPs, which in turn modulate the rate of sequence variation.
Mutations associated with human disease
Knowing that the first and last As of long A-tracts and G2–3 in G-tracts are the major sites of SNV in the human population, we addressed whether these features are also discernible in mutated mononucleotide tracts associated with human genetic disease. We collected 9,450,456 unique SBSs (both SBSs and SNVs refer to single base changes) from sequenced cancer genomes and normalized the percent mutations along A- and G-tracts to enable a direct comparison with the 1KGP dataset. For A-tracts (Figure 6A and Supplementary Figure S6A), SBSs displayed the same trend as the 1KGP data (Figure 2A) with respect to the bell-shape increase in mutations at A1 and An and the mutation spectra, although the susceptibility to mutation as a function of tract length attained greater values (6.36% for length 11 in cancer versus 4.15% for length 9 in the 1KGP datasets at A1). The first and last 3 bp also harbored more SBSs than in the 1KGP dataset for tracts >7 bp, a feature that we found to be due exclusively to a large cancer dataset (42) containing high-level microsatellite instability (MSI) samples (Supplementary Figure S6B and C), which are known to result from mismatch-repair deficiency (15). Thus, A-tracts display similar patterns of base substitution between the germline and somatic cancer tissues. For G-tracts, mutation spectra were characterized by G→T transversions at tract lengths >7, particularly at G1, the most frequently mutated position for tracts lengths up to 11 bp (Figure 6B and Supplementary Figure S6D). This trend persisted even when the high rates of methylation-mediated deamination mutations at the CG dinucleotide were removed (Supplementary Figure S6E). Thus, mutation patterns in cancer genomes contrast with those observed in the germline, both with respect to the most mutable position (G1 versus G2–3) and the types of base substitution (G→T in cancer genomes versus G→T and G→C in the germline).
Mutation patterns in cancer genomes. (A) Mutation spectra for SBSs at A-tracts. Percent values were obtained by dividing the total number of SBSs at each position by the number of tracts in hg19 and then multiplying by 3.2516 to equalize the percentage of A-tracts of length 4 between the cancer genomes and the 1KGP datasets. (B) Mutation spectra for SBSs at G-tracts in cancer genomes. Percent values were obtained as in (A) using a multiplication factor of 3.7419. (C) Normalized fractions of A-tracts (closed circles) and G-tracts (open circles) displaying +/−1 bp slippage, obtained by dividing the number of events by both the number of tracts in hg19 and tract length. (D) Indels at A-tracts, calculated as described in Figure 3C. (E) Indels at G-tracts, calculated as described in Figure3C. (F) Heatmap representation of insertions along G-tracts, as described in Figure 3E.
With respect to slippage, the fractions for A-tracts elicited an excess at lengths 9 and 10 bp relative to the 1KGP dataset, which was also due to the MSI-containing dataset. For G-tracts, the fractions peaked at length 8, as for the 1KGP dataset (Figures 3A and 6C), implying that the propensity to undergo slippage is indistinguishable between the germline and soma. Indels were also more abundant at flanking base pairs than along the tracts (Figure 6D and E), particularly for G-tracts of length >7, similar to the 1KGP dataset (Figure 3C and D). Detailed analyses of insertions revealed that both G1 and the preceding position were the most significant sites of mutation (F-values up to 0.08 at G1 for tracts of length 8) (Figure 6F). Thus, the 5′ end of long G-tracts is the most susceptible site for both SBSs and insertions in cancer genomes, in contrast to the germline where these occur within the runs, typically at G2–3.
We also extracted the mutated A- and G-tracts from the Human Gene Mutation Database (HGMD), a collection of >150,000 germline gene mutations associated with human inherited disease. A total of 1519 genes were mutated at A- or G-tracts out of a total of 3972 (38%); 3480 SBSs and 2866 slippage events were noted within these tracts, 85 and 46% of which were predicted to be disease-causing, respectively (Figure 7A and Supplementary Table S1). Ranking genes by the number of literature reports indicated that among the top 10 entries three were associated with cancer (BRCA1, BRCA2 and APC), two with hemophilia (F8 and F9), four with debilitating lesions of the skin (COL71A), muscle (DMD), lung (CFTR) and kidney (PKD1), with one causing hypercholesterolemia (LDLR) (Figure 7B). Thus, mutations within A- and G-tracts carry a high social burden by contributing to some of the most common human pathological conditions.
Mutation patterns in HGMD and model for sequence context-dependent changes. (A) Number of germline SBSs and slippage events (Slip.) at A- and G-tracts in HGMD. Gene alterations were classified as disease-causing mutation (DM), likely disease-causing mutation (DM?), disease-associated and putatively functional polymorphism (DFP), disease-associated polymorphism with additional supporting functional evidence (DP) and invitro/laboratory orinvivo functional polymorphism (FP). Codon changes (SIFT predictor) were classified as damaging (d), null (n), tolerated (t) and low-confidence prediction (l). (B) The 10 most commonly reported genes in HGMD with mutations at A- and G-tracts. Various mutated tracts were generally reported for the same gene in different reports. (C) Mutation spectra for SBSs at A- (left) and G-tracts (right) in HGMD. Percent values were obtained by dividing the total number of SBSs at each position by the number of tracts in hg19 exons. A|G→T (black), A|G→C (red), A→G (green), G→A (cyan). (D) Normalized fractions of A-tracts (closed circles) and G-tracts (open circles) displaying +/−1 bp slippage, obtained by dividing the total number of events by the number of tracts in hg19 exons and by tract length. (E) Model for sequence context-dependent changes at A-tracts (left) and G-tracts (right). *, site of base modification.
For both A- and G-tracts, SBSs occurred mostly at tract lengths of 4–7, with patterns more similar to those in the 1KGP than in the cancer datasets, both with respect to the location of the most mutable positions (first and last As and first/second Gs) and the types of base substitution (A→T and G→H) (Figure 7C and Supplementary Figure S6F). Likewise, slippage events peaked at tract lengths of 7–9 as observed in the 1KGP dataset (Figure 7D). In summary, the patterns of both SBSs and slippage in the HGMD dataset followed the trend observed in the 1KGP dataset, suggesting that germline variants at mononucleotide repeats leading to either population variation or human inherited disease may have arisen through similar mechanisms.
DISCUSSION
Why are specific A:T and G:C base pairs within A- and G-tracts more susceptible to sequence changes than their identical neighbors? For A-tracts, bp flexibility may play a role. Chemical damage to DNA, such as by hydroxyl radicals has been shown to be proportional to the geometrical solvent-accessible surface of the atomic groups, which increases with DNA flexibility (43). Along A-tracts flexibility is restricted, but it is high at both the 5′ and 3′ junctions. Thus, the fact that the highest rates of mutation coincide with the highest degree of flexibility at the 5′-TA-3′ bp step is consistent with the view that this position may be susceptible to DNA damage as a result of flexibility. Other sources of DNA dynamics are also likely to be relevant, such as sugar flexibility at the junctions, which increases with tract length (44). Chemical modification at these junctions may then lead to base substitution and indels, the latter as a result of strand breaks.
With respect to SNV mutation spectra, these were found mostly in the direction of flanking base composition above a length of 7–8 bp. We interpret this behavior in terms of DNA slippage along A-tracts when attempts are made during translesion synthesis (TLS) to bypass a damaged site (Figure 7Ei). Two scenarios may be considered to account for A→T transitions at A1. In the first, the last tract-template base would loop out into the polymerase active site permitting base-pairing and strand elongation (Figure 7Eii) using the tract-flanking base as a template (34,45–46). In the second (Figure 7Eiii), slippage would occur behind the polymerase, prompting extension past the newly created A*:T mispair generated by primer/template misalignment. Either pathway would yield a common intermediate (Figure 7Eiv) that contains the base complementary to the junction across from the damaged site upon slippage resolution (34). Following DNA synthesis (S) and/or repair (R) (Figure 7Ev and vi), this mispair will generate a base change that is always identical to the tract-flanking base.
For G-tracts, the high rates of G→T transversions at G1 in cancer genomes are also consistent with preferred chemical attack at this site due to high flexibility (Figure 7F top). Direct chemical attack at a guanine is known to result in stable products, such as 8-oxo-G and Fapy-G, both of which are known to yield G→T transversions (47–50). Thus, G1 may be the most susceptible site for such reactions for G-tracts of lengths ≥7 (Figure 7Fright), which in cancer genomes would become a mutation hotspot. In the germline, SNVs peaked inside G-tract base pairs, while mutational spectra were insensitive to flanking base composition; these events are inconsistent with a role for template misalignment and slippage as noted for A-tracts. Rather, the correspondence between hotspot mutations at G2–3 and G5 and the QM/MM simulations suggest a role for charge transfer. A large body of work during the past 20 years using computational, theoretical chemistry and biophysical techniques on short oligonucleotides, has shown that guanine is the most easily oxidizable base in DNA and that indeed a guanine radical cation can be generated through long-range hole transfer from an oxidant via one-electron oxidation mechanisms (51–55). GGG triplets were found to act as the most effective traps in hole transfer by both experimental and theoretical work (56–59), demonstrating that the resulting guanine radical cation (or its neutral deprotonated form) became rather delocalized, but it preferentially centered at the first and second G. These well-established patterns of chemical reactivity are consistent with our experimental observation of high mutation frequencies at G1 for short G-tracts and the results from QM/MM simulations on G6. For longer tracts, the downstream shift in mutation hotspots, i.e., G2–3 and G5, also correlate well with the charge localization predicted from QM/MM simulations, which explicitly included solvent effects and structural fluctuations. Thus, in conjunction with the constrained density functional theory (60), both the neutral and oxidized forms of a guanine nucleobase can be reliably constructed to infer the accurate determination of mutational patterns of mononucleotide repeats in human genomic DNA.
The compact organization of the sperm genome (61), and presumably low levels of oxidative stress in the germline, may enable guanine oxidization through one-electron oxidation reactions rather than by direct chemical attack, thereby favoring the formation of radical cations. A charge injected at G1 by electron loss would then migrate to neighboring guanines and localize at sites of low IP, such as G2 (Figure 7F left). Guanine radical cations are known to readily undergo further chemical modification leading to products such as 8-oxo-G, oxazolone, imidazolone, guanidinohydantoin, and spiroiminodyhydantoin (62) (M in Figure 7F), to yield G→T, G→C and G→A substitutions (4,63). Our model is in line with recent observations in which mutations at guanines within short G-runs (1–4 bp) correlate with sequence-dependent IPs at the target guanine in cancer genomes (9). Interestingly, these correlations were not observed in the germline (9). We interpret these composite observations as follows. The IP values for G-runs have been shown to decrease asymptotically with tract length, although the absolute values vary according to the methods and assumptions used (we obtained a value of 5.43 eV for both G[6] and G[9]) (64,65). We suggest that short G-runs with high IPs undergo one-electron oxidation reactions in the oxidative environment of cancer cells but would be refractory to such a mechanism in the germline (Figure 7Fright yellow and left white sectors). As length increases and IP values fall, G-runs would be attacked directly by oxidants abundant in tumor cells (Figure 7F orange sector), whereas oxidation will be limited to electron loss in the germline environment (Figure 7F left yellow sector).
These models (template misalignment for A-tracts and charge transfer for G-tracts) suggest a more complex scenario for mechanisms underlying mononucleotide repeat polymorphism in the human population than recently proposed (13), in which nucleotide misincorporation by error-prone polymerases is proposed as a primary source of mutations at both A- and G-tracts. As already stated, the directionality of SNVs toward tract-flanking bases in A-tracts and the hotspot mutations at G2–3, supports multiple and distinct mechanisms of base substitution at mononucleotide repeats.
Our analyses highlight additional information, including the lack of mutations in the direction of tract-base composition for base pairs flanking long tracts, the association with gene expression and the preference of guanines for the inner NCP surface, and extend prior observations (12) such as the bell-shape character of base substitution and slippage, whose mechanisms remain to be fully clarified. Finally, we document the contribution of mononucleotide mutagenesis to key aspects of human pathology beyond the well-established MSI instability in cancer (15), including hemophilia and tissue degeneration. Our collective work supports the conclusion that as the human genome undergoes evolutionary diversification and along the way suffers disease-associated mutations, oxidation reactions including charge transfer may play a prominent role.
Severe combined immunodeficiency diseases (SCIDs) are a group of primary immunodeficiency diseases characterized by a severe lack of T cells (or T cell dysfunction) caused by various gene abnormalities and accompanied by B cell dysfunction (WHO, 1992; Buckley et al., 1997). The incidence rates in infants were 1/75,000-1/10,0000 (WHO, 1992), but no morbidity statistics are available in China. The 2 genetic modes of SCID include X-linked recessive and autosomal recessive genetic inheritance. X-linked severe combined immunodeficiency (X-SCID) is the most common form, accounting for 50-60% of SCID cases (Noguchi et al., 1993). Immune system abnormalities in patients with X-SCID include T-B+NK-, in which T cells (CD3+) and natural killer (NK) cells (CD16+/CD56+) are absent or significantly reduced, and the number of B cells (CD19+) is normal or increased, causing reduced immunoglobulin production and class switching disorder (Buckley, 2004; Fischer et al., 2005). The IL- 2Rg gene mutation has been confirmed to be a major cause of X-SCID (Noguchi et al., 1993). In recent years, great progress has been made in understanding the pathogenesis of primary immunodeficiency disease and its application in clinical treatment, particularly regarding the development of critical care medicine and immune reconstruction technology. With timely control of infection and early bone marrow or stem cell transplantation, X-SCID patients can be treated, prolonging survival time. Therefore, early diagnosis of X-SCID is very important for patient treatment. Gene diagnosis has become a better early diagnosis or differential diagnosis method. In addition, familial X-SCID brings a great psychological burden to the relatives of patients. Ordinary chromosome analysis and immunological evaluation cannot be used for female carrier identification and fetal diagnosis, and gene diagnosis is the most effective method of carrier detection and prenatal diagnosis. In this study, we detected mutations in 2 families with X-SCID and identified 2 novel mutations, confirming the X-SCID pedigrees. Prenatal diagnosis was performed for the pregnant fetus in the mother of one of the probands based on gene diagnosis. Female individuals in this family were subjected to carrier detection.
IL2Rg gene mutation test Direct sequencing of 1-8 exons and the flanking region of the IL2Rg gene by PCR in family 1 showed that the 3rd exon of the proband contained the c.361-363delGAG heterozygous deletion mutation, which led to deletion of the 121st amino acid glutamate (p.E121del) in its coding product. There were no sequence variations in other coding regions or in the shear zone. The proband’s mother carried the same heterozygous mutation, while his father did not carry the mutation site (Figure 2a, b, c). This mutation was not observed in any cases of the control group, and this family was identified as an X-SCID family. The c.510-511insGAACT insertion heterozygous mutation was present in the 4th exon of the proband’s mother in family 2. This mutation was a 5-base repeat of GAACT, resulting in a change in amino acid 173 from tryptophan into a stop codon (p.W173X). While there were no sequence variations in other coding regions or in the shear zone, the patient’s father did not carry the mutation (see Figure 2d, e). We did not find this mutation in the healthy control group. We presumed that the 4th exon of the deceased child in family 2 contained the c.510-511insGAACT insertion mutation, leading to X-SCID symptoms, and thus we speculated that this family was an X-SCID pedigree. Prenatal diagnosis We verified the chorionic villus status of the fetus in family 1 using the PowerPlex 16 HS System kit. The results of prenatal diagnosis showed that the fetal tissue contained no maternal contamination and that this fetus was female. The results of prenatal diagnosis showed that there was no c.361-363delGAG (p.E121del) heterozygous mutation in the female fetus of family 1.
Figure 2. Sequencing graph of IL2Rg gene in 2 pedigrees with X-chain severe combined immunodeficiency. a.-c. Family 1. a. Normal control (rectangle indicates 3 edentulous bases of this patient). b. Proband carrying the c.361- 363delGAG (p.E121del) mutation (arrow indicates deletion of fragment connection sites). c. The proband’s mother contained a c.361-363delGAG (p.E121del) heterozygous mutation (arrow). d.-e. Family 2. d. The proband’s mother carried the c.510-511insGAACT (p.W173X) heterozygous mutation (arrow indicates that the reverse sequencing graph was positive). e. Normal control (rectangular box indicates 2 normal copies of GAACT (the mutation fragment was 3 copies). Carrier detection results For the c.361-363delGAG (p.E121del) site, the gene analysis results of the female individual in family 1 showed that I2 (proband’s grandmother) was a heterozygous carrier and that II3 (proband’s aunt) was a non-carrier and had no mutations.
IL-2 can combine with the IL-2 receptor (IL-2R) of the immune cell membrane. IL-2R is composed of 3 subunits, including the IL-2Ra chain (CD25), IL-2Rb chain (CD122), and IL- 2Rg chain (CD132). IL-2Rg functional units in common with IL-4, IL-7, IL-9, IL-15, IL-21, and other cytokine receptors, and these regions are referred to as the total chain (Li et al., 2000). The IL-2Rg chain can maintain the integrity of the IL-2R complex and is required for the internalization of the IL-2/IL-2R complex; it is also the link that contacts the cell membrane surface factor region and downstream cell signal transduction molecules. Therefore, the integrity of the IL-2Rg chain is vital for the immune function of an organism (Malka et al., 2008; Shi et al., 2009).
Mutations in the IL2Rg gene, which encodes IL-2Rg, were identified to be a major cause of X-SCID in 1993 (Noguchi et al., 1993). The IL2Rg gene is located on chromosome X q21.3-22, is 37.5 kb length, and contains 8 exons, which encode 369 IL-2Rg amino acids. The IL2Rg chain exhibits varying structural regions, such as the signal peptide [amino acids (AA) 1-22], extracellular domain (AA 23-262), transmembrane region (AA 263-283), and intracellular region (AA 284-369). The WSXWS motif is located in the extracellular region (AA 237-241), while Box 1 is located in the intracellular region (AA 286-294).
By the end of 2013, the Human Gene Mutation Database contained a total of 200 mutations in the IL2Rg gene (HGMD Professional 2013.4). The most common mutation types in the IL2Rg gene were the missense or nonsense mutations, which result from single base changes. A total of 100 missense or nonsense mutations have been identified, followed by insertion or deletion mutations in a total of 50 species. The 3rd most common type of mutations includes shear mutations in approximately 30 species. Eight exons contained mutations, and mutations in 3rd or 4th exons were the highest, accounting for a total mutation rate of 43% (86/200). According to the X-SCID gene database (IL2RGbase) (http://research.nhgri. nih.gov/scid/), the gene mutations in IL2Rg mainly occurred in the extracellular region of the IL2Rg chain (Fugmann et al., 1998). Zhang et al. (2013) reported that the IL2Rg gene mutations in 10 patients with X-SCID in China were located in the extracellular region. Two mutations reported in our study were also located in the extracellular region. The mutation of IL2Rg gene in family 1 was a codon mutation in the 3rd exon, resulting in a 3-base deletion. The c.361-363delGAG (p.E121del) mutation was located in the extracellular area of the IL- 2Rg subunit, and we inferred that the 121 glutamate deletion caused by the mutation would lead to changes in the structure of the peptide chain, affecting signal transmission and resulting in serious symptoms. The mutation of family 2 was a GAACT repeat of ILR2g gene; this repeat of 5 bases resulted in 173 codon changes from tryptophan into a stop codon. Generation of the peptide chain with the mutation lacked 196 amino acids compared to the normal chain, including the intracellular, transmembrane, and some extracellular regions, directly affecting the structure and function of receptors and causing disease. No studies have been reported regarding these 2 mutations. We combined with the mutation characteristics and clinical manifestations and diagnosed family 1 as X-SCID pedigrees. Although the patient in family 2 was deceased, it can be speculated that the 2 deceased patients in family 2 were X-SCID pedigrees caused by c.510-511insGAACT (W173X).
Prenatal diagnosis can accurately identify fetal situations and be used to avoid birth defects, which can also ease the anxiety of the pregnant mother. Gene diagnosis for pedigrees of patients based on DNA samples has advanced recently, particularly with the application of high-throughput sequencing technology (Alsina et al., 2013). We can now perform gene analysis for varied clinical infectious diseases for differential diagnosis. However, the effectiveness of prenatal diagnosis for pedigrees in which the proband is dead remains unclear. Because the gene mutations in the proband is unknown in these cases, the patient’s situation was only inferred by his mother’s genotypes. However, we considered that for the deceased, if we can define the mother was a pathogenic gene carrier, even if the proband is not X-SCID, the woman also has a risk of having X-SCID children and this pedigree may be X-linked recessive inheritance. Prenatal diagnosis may provide a choice for preventing the birth of patients in these families in the premise of informed consent.
Gene diagnosis of IL2Rg can also be used for carrier detection of suspected females in the family.
In the present study, we performed carrier detection of the patient’s grandmother and aunt in family 1 and determined that the patient’s pathogenic mutations were from his grandmother. His aunt did not inherit the pathogenic gene, and thus she was a non-carrier and her fertility will not be affected. In this study, we used direct sequencing of PCR products and identified IL2Rg gene mutations in 2 pedigrees with X-SCID. We found 2 unreported mutations in the IL2Rg gene, and prenatal diagnosis and carrier detection were conducted in 1 X-SCID family. Because the incidence rate of X-SCID is extremely low, it is difficult to promote the widespread use and application of genetic diagnosis. However, this study may provide some implications for the diagnosis of infants with immunodeficiency, and gene diagnosis techniques such as conventional or high-throughput sequencing should be used as soon as possible during pregnancy, which can be used to guide treatment. This method can also provide reliable prenatal diagnosis and carrier detection service for these families.
MEF2A gene mutations and susceptibility to coronary artery disease in the Chinese population
Coronary artery disease (CAD) has high morbidity and mortality rates worldwide. Thus, the pathogenesis of CAD has long been the focus of medical studies. Myocyte enhancer factor 2A (MEF2A) was first discovered as a CAD-related gene by Wang (2005) and Wang et al. (2003, 2005). Three mutation points in exon 7 of MEF2A were subsequently identified by Bhagavatula et al. (2004); however, Altshuler and Hirschhorn (2005) and Weng et al. (2005) predicted that the MEF2A gene lacked mutations. Zhou et al. (2006a,b) analyzed the mutations and polymorphisms in exons 7 and 11 of the MEF2A gene in the Han population in Beijing, and various rare mutations were found in exon 11 rather than in exon 7. The clinical significance of specific 21-bp deletions in MEF2A was also explored, and previous studies have shown mixed results. In this study, polymerase chain reaction-singlestrand conformation polymorphism (PCR-SSCP) and DNA sequencing were used to detect exon 11 of the MEF2A gene in samples collected from 210 CAD patients and 190 healthy controls and to investigate the function of the MEF2A gene in CAD pathogenesis and their correlation.
CAD, a common disease in China, is induced by multiple factors, such as genetics, the environment, and lifestyle. Thus, a multi-faceted approach is necessary in the study of CAD pathogenesis, particularly in molecular biology research, which is important for developing comprehensive treatment of CAD based on gene therapy. The MEF2A gene was first identified as a CAD-related gene through linkage analysis of a large family with CAD (9 of 13 patients developed MI) in 2003.
In this study, we found the following mutations: 1) codon 451G/T (147191) heterozygous or homozygous mutation; 2) loss of 1 (Q), 2 (QQ), 3 (QQP), 6 (425QQQQQQ430), and 7 (424QQQQQQQ430) amino acids (147108-147131); and 3) codon 435G/A (147143) heterozygous mutation. Among these mutations, the synonymous mutation at locus 147191 was confirmed by reference to the National Center for Biotechnology Information (NCBI) database to be a single nucleotide polymorphism, which was also demonstrated in our study by the extensive presence of this polymorphism in healthy controls. However, the heterozygous mutation at locus 147143 was only found in the genomes of CAD patients, and was therefore identified as a mutation.
Given that MEF2A is a CAD-related gene, the results of various studies are controversial among several countries. Weng et al. (2005) screened gene mutations in exon 11 of the MEF2A gene from 300 CAD patients and 1500 healthy controls. They hypothesized that the changes in 5-12 CAG repeats are genetic polymorphisms and that the 21-base deletion in exon 11 of the MEF2A gene did not induce autosomal dominant genetic CAD. Gonzalez et al. (2006) suggested that the CAG repeat polymorphism was independent of MI susceptibility in Spanish patients. Kajimoto et al. (2005) reported that the CAG repeat sequence was not correlated with MI susceptibility in Japanese patients. Horan et al. (2006) also found that the CAG repeat sequence was not associated with the susceptibility to early-onset familial CAD in an Irish population. Hsu et al. (2010) identified no correlation between the CAG repeat sequence and CAD susceptibility in the Taiwanese population. Dai et al. (2010) found that the structural change in exon 11 was not related to CAD in the Chinese Han population. Lieb et al. (2008) and Guella et al. (2009) hypothesized that MEF2A was independent of CAD. However, Yuan et al. (2006) and Han et al. (2007) suggested that the CAG repeat sequence was correlated with CAD because 9 CAG repeats was an independent predictor of CAD. Elhawari et al. (2010) and Maiolino et al. (2011) suggested that MEF2A is a susceptibility gene for CAD. Dai et al. (2013) showed that mutations in exon 12 are associated with the early onset of CAD in the Chinese population. Liu et al. (2012) failed to demonstrate a correlation between the CAG repeat sequence and CAD through case-control analysis, systematic review, and meta-analysis, but found that the 21- base deletion in exon 11 was strongly associated with CAD, and that genetic variations in MEF2A may be a relatively rare, but specific, pathogenic gene for CAD/MI. Kajimoto et al. (2005) reported 4-15 CAG repeats. However, only 4-11 CAG repeats were observed in our study, possibly because of genetic differences in patients in this study. Eleven CAG repeats were observed in most samples from the control group, and the proportion of 10, 9, and 8 repeats exceeded 1%. The heterozygous mutation at 147143, as well as the 4 and 5 CAG repeats, was only observed in CAD patients. Thus, we speculated that the CAG repeat sequence is correlated with CAD susceptibility, and the presence of 4 or 5 repeats may be a risk factor for CAD, which was inconsistent with the results obtained by Han et al. (2007). The inconsistency in these results may be explained by the differences in subjects and sample sizes among studies.
Impact of glucocerebrosidase mutations on motor and nonmotor complications in Parkinson’s disease
Here, we conducted a multicenter retrospective cohort analysis, and the data were investigated by survival time analysis to show the impact of GBA mutations on PD clinical course. We also investigated regional cerebral blood flow (rCBF) and cardiac sympathetic nerve degeneration of subjects with GBA mutations, compared with matched PD controls.
3.1. Subjects
Among the 224 eligible PD patients (the subjects were not related to each other), 9 subjects were excluded from the analysis (4 due to multiple system atrophy findings on subsequent brain MRI and 5 because of insufficient clinical information). Therefore, 215 PD patients [female, 52.1%; age, 66.7 ± 10.8 (mean ± standard deviation)] were analyzed. For non-PD healthy controls, 126 patients’ spouses (female, 58.7%; age, 67.3 ± 10.3) without a family history of PD or GD were enrolled.
3.2. GBA mutations and risk ratios for PD
In the PD subjects, we identified 10 nonsynonymous and 2 synonymous GBA variants. Within the nonsynonymous variants, 7 mutations were previously reported in GD [R120W, L444P-A456P-V460 (RecNciI), L444P, D409H, A384D, D380N, and444L(1447-1466 del 20, insTG)] as GD-associated mutations. Three nonsynonymous mutations have never been reported in GD patients [I(-20)V, I489V, and there was one novel mutation (Y11H)].
GD-associated GBA mutations were found in 19 of the 215 (8.8%) PD patients but none in the healthy controls. The risk of PD development relative to these GD-associated mutations was estimated as an OR of 25.1 [95% confidence interval (CI), 1.50–420,p = 0.0001] with 0-cell correction. The nonsynonymous mutations that were not reported in GD patients had no association with PD development (p = 0.506; OR, 1.3; 95% CI, 0.7–2.6) ( Table 1). Four subjects had double mutations. For subsequent analyses, 2 subjects with double mutations of I (-20)V and K466K were adopted to the group of mutations unreported in GD, and 2 subjects with double mutations of R120W and I(-20)V, and of R120W and L336L were adopted to the group of GD-associated mutations.
Table 1.Frequency of glucocerebrosidase gene allele in Parkinson’s disease patients and controls
3.3. Clinical features of PD patients by GBA mutation groups
The clinical features of PD patients with GD-associated mutations, those with mutations unreported in GD, and those without mutations are shown in Table 2. In the GD-associated mutation group, females, those with a family history and those with dementia (DSM IV) were significantly more frequent than those in the no-mutation group (p = 0.047, 0.012, and 0.020, respectively). The age of PD onset was lower in patients with GD-associated mutations (55.2 ± 9.9 years ± standard deviation), compared with those without mutations (59.3 ± 11.5), although the statistical difference was not significant. There were no differences in clinical manifestations between subjects with mutations unreported in GD and those without mutations, except for dopamine agonist dosage (p = 0.026) ( Table 2).
Table 2.Epidemiological and clinical features of PD patients with Gaucher disease–associated GBA mutations, those with mutations previously unreported in GD and those without mutations
3.4. Survival time analyses to develop dementia, psychosis, dyskinesia, and wearing-off
Time to develop clinical outcomes (dementia, psychosis, dyskinesia, and wearing-off) was compared in 19 subjects with GD-associated mutations, 29 with mutations unreported in GD, and 167 without mutation. The median observation time was 6.0 years. The subjects with GD-associated mutations showed a significantly earlier development of dementia and psychosis, compared with subjects without mutation (p < 0.001 and p = 0.017) ( Supplementary Table e-1, Fig. 1A and B). We rereviewed the clinical record of the subject who showed early dementia (defined by DSM IV) ( Fig. 1A) and made sure it did not satisfy the criteria of DLB ( McKeith et al., 2005).
Fig. 1.
Kaplan–Meier curves of dementia and psychosis in Parkinson’s disease (PD) patients with Gaucher disease (GD)-associated glucocerebrosidase gene (GBA) mutations and those without mutations. PD patients with GD-associated GBA mutations and those without GBA mutations were compared to investigate the time taken to develop dementia (A) and psychosis (B). Because of insufficient information in several patients, the numbers in each analysis were different. The patients with and without mutations were 17 and 165 (A), 18 and 165 (B) against a total of 19 and 167. DSM IV, Diagnostic and Statistical Manual of Mental Disorders, revised fourth edition. p-Values were calculated by log-rank tests.
The associations of GBA mutations and these symptoms were estimated as HRs, adjusting for sex and age at PD onset. HRs were 8.3 for dementia (95% CI, 3.3–20.9; p < 0.001) and 3.1 for psychosis (95% CI, 1.5–6.4; p = 0.002). The time until development of wearing-off and dyskinesia complications was not statistically significant, with HRs of 1.5 (95% CI, 0.8–3.1; p = 0.219) and 1.9 (95% CI, 0.9–4.1; p = 0.086) ( Table 3).
Table 3.Hazard ratios of GBA pathogenic mutations for clinical symptoms
Model
Clinical feature
Hazard ratio
95% CI
p
1
Dementia (DSM-IV)
8.3
3.3–20.9
<0.001
2
Psychosis
3.1
1.5–6.4
0.002
3
Wearing-off
1.5
0.8–3.1
0.219
4
Dyskinesia
1.9
0.9–4.1
0.086
Each model was adjusted for sex and age at onset.
Key: CI, confidence interval; DSM-IV; The Diagnostic and Statistical Manual of Mental Disorders part 1IV; GBA, glucocerebrosidase.
Subjects with mutations unreported in GD did not show significant differences in time to develop all 4 outcomes, compared with no mutation subjects. Therefore, subjects with GD-unreported mutations were regarded as subjects without GBA mutations in further analyses.
3.5. rCBF on SPECT in patients with GD-associated GBA mutations
We conducted pixel-by-pixel comparisons of rCBF on SPECT between PD subjects with mutations (cases) and sex-, age-, and disease duration-matched PD subjects without any mutations in GBA (controls). Four controls were adopted for each case (except for a 34-year-old female case who was matched to a control), and in total 12 cases (female 50%, age at SPECT mean ± standard error (SE); 58.9 ± 3.3 years, disease duration at SPECT 7.3 ± 1.5 years) and 45 controls (female 64.4%, age at SPECT mean ± SE; 61.0 ± 1.3 years, disease duration at SPECT 7.1 ± 0.7 years) were analyzed. As a result, a significantly lower rCBF was seen in the cases compared to the controls in the bilateral parietal cortex, including the precuneus ( Fig. 2).
Fig. 2.
Regional cerebral blood flow in the group with GD-associated mutations compared with the matched Parkinson’s disease group without mutations. Regions with lower regional cerebral blood flow in the group with GD-associated mutations displayed on an anatomic reference map. Abbreviation: GD, Gaucher disease.
3.6. H/M ratios on MIBG scintigraphy in patients with GD-associated GBA mutations
Cardiac MIBG scintigraphy visualizes catecholaminergic terminals in vivo that are reduced as well as brain dopaminergic neurons in PD patients. We also investigated MIBG scintigraphy between 16 cases (female 68.8%, age at examination mean ± SE; 60.2 ± 2.6 years, disease duration at examination 6.2 ± 1.2 years) and sex-, age- and disease duration-matched 61 controls [(63.8 %, age 62.0 ± 1.1 years, disease duration 5.5 ± 0.6 years) (1:4 except for 1 young 34-year-old female case who was matched to a control)]. In the results, both early and late H/M ratios declined in both groups and did not show any significant differences (p = 0.309 and 0.244) ( Supplementary Table e-2).
4. Discussion
4.1. Contributions of GD-associated GBA mutations to the development of PD
In the analysis of 215 PD patients and 126 non-PD controls, we identified 10 nonsynonymous heterozygous GBA mutations, including 1 novel mutation. Among these mutations, 7 were GD-associated, and the patients carrying these mutations represented 8.8% of the PD cohort. No significant association was found between the GD-unreported mutations and PD development, which suggests that only the GD-associated mutations are a genetic risk for PD. According to a worldwide multicenter analysis of 1883 fully sequenced PD patients, 7% of the GD-associated mutations are found in non-Ashkenazi Jewish PD patients ( Sidransky et al., 2009). Although the mutation frequency in the present study was similar to previous results, the OR of GD-associated heterozygous mutations (25.1) was significantly greater than the OR (5.43) of other ethnic cohorts (Sidransky et al., 2009) and was consistent with an OR of 28.0 from a previous Japanese report ( Mitsui et al., 2009). These results, taken together, suggest the possibility thatGBA mutations are at a distinct risk for PD in the Japanese population. However, a larger Japanese cohort study is required to confirm this.
4.2. Cross-sectional clinical figures of PD with GBA mutations
4.3. Impact of GBA mutations on the clinical course of PD
To investigate the impact of GBA mutations on the clinical course of PD, a prospective-designed study over a long period is preferred. Although there has been a few longitudinally designed study to date, follow-up clinical data for a median of 6 years of 121 PD cases from a community-based incident cohort was recently reanalyzed; results demonstrate that progression to dementia defined by DSM IV (HR 5.7) and Hoehn and Yahr stage 3 (HR 3.2) are significantly earlier in 4 GBA mutation-carrier patients compared with 117 patients with wild-type GBA ( Winder-Rhodes et al., 2013). A 2-year follow-up clinical report of 28 heterozygous GBA carriers who were recruited from relatives of GD-patients shows slight but significant deterioration of cognition and smelling, compared to healthy controls ( Beavan et al., 2015). Brockmann et al. (2015)assessed motor and nonmotor symptoms including cognitive and mood disturbances for 3 years in 20 PD patients with GBA mutations and showed a more rapid disease progression of motor impairment and cognitive decline in GBA mutation cases comparing to sporadic PD controls. The current long-term retrospective cohort study up to 12 years reinforced these results. It revealed that dementia and psychosis developed significantly earlier in subjects with GD-associated mutations compared with those without mutation, and the HRs of GBA mutations were estimated at 8.3 for dementia and 23.1 for psychosis, with adjustments for sex and PD onset age. In contrast, the results showed no significant difference in developing wearing-off and dyskinesia.
In this study, we also investigated whether GD-unreported mutations affected the clinical course of PD. In both cross-sectional and survival time analyses, the mutations unreported in GD carried no increased burden on clinical symptoms such as dementia, psychosis, wearing-off, and dyskinesia.
4.4. Reduced rCBF in PD with GBA mutations compared with matched PD controls
We found a significantly decreased rCBF, reflecting decreased synaptic activity, in the bilateral parietal cortex including the precuneus, in subjects with GD-associated mutations compared with matched subjects without mutations. The pattern of reduced rCBF was very similar to the pattern of H215O positron-emission tomography that Goker-Alpan et.al. (2012) reported, showing decreased resting rCBF in the lateral parietal association cortex and the precuneus bilaterally in GD subjects with parkinsonism (7 subjects with homozygous or compound heterozygous GBA mutations), compared with 11 PD without GBA mutations. Results suggest that PD with heterozygous GBAmutations and GD patients presenting parkinsonism had a common reduced pattern of rCBF. Interestingly, in their study, rCBF in the precuneus—but not in the lateral parietal cortex—correlated with IQ, suggesting that the involvement of the precuneus is critical for defining GBA-associated patterns.
4.5. Reduced cardiac MIBG H/M ratios as well as matched PD controls
We also showed that cardiac MIBG H/M ratios in subjects with GD-associated mutations were lower than the cutoff point for PD discrimination (Sawada et al., 2009), suggesting that postganglionic sympathetic nerve terminals to the epicardium were denervated, as well as in PD without mutations.
4.6. Mechanisms of impact on PD clinical course by GD-associated GBA mutations
Experimental studies suggesting a bidirectional pathogenic loop between α-synuclein and glucocerebrosidase have been accumulated (Fishbein et al., 2014, Gegg et al., 2012, Mazzulli et al., 2011, Noelker et al., 2015, Schondorf et al., 2014 and Uemura et al., 2015). Loss of glucocerebrosidase function compromises α-synuclein degradation in lysosome, whereas aggregated α-synuclein inhibits normal lysosomal function of glucocerebrosidase. The pathogenic loop may facilitate neurodegeneration in GD-associated PD brain, resulting in early development of dementia or psychosis as shown in the present study. Several recent researches propose the possibility that the similar mechanism as in PD with GBA mutations exists even in idiopathic PD brain ( Alcalay et al., 2015, Chiasserini et al., 2015, Gegg et al., 2012 and Murphy et al., 2014). On the other hand, the impacts of GD-associated GBA mutations for the development of motor complications such as wearing-off and dyskinesia were not statistically significant, suggesting other pathophysiological mechanisms in the striatal circuit brought out after long-term therapy especially by l-dopa.
4.7. Limitations
Our study has several limitations. In the design of the study, we assumed that the sample size was 215 (PD patients) for survival time analyses and investigated 224 PD patients. We assumed that the mutation prevalence would be 9.4%, and in fact, we found 19 patients with mutations (8.5%) of the 224 patients. Based on these figures, we estimated the risk ratios of heterozygous GBA mutations for the risk of PD development and PD clinical symptoms as ORs in the cross-sectional multivariate analyses, although the 95% CIs were broad. More of subject numbers will be needed to determine robust risk ratios.
Comprehensive Genetic Characterization of a Spanish Brugada Syndrome Cohort
Brugada syndrome (BrS) was identified as a new clinical entity in 1992 [1]. Six years later, the first genetic basis for the disease was identified, with the discovery of genetic variations inSCN5A [2]. Nowadays, more than 300 pathogenic variations in this first gene are known to be associated with BrS [3]. SCN5A encodes for the α subunit of the cardiac voltage-dependent sodium channel (Nav1.5), which is responsible for inward sodium current (INa), and thus plays an essential role in phase 0 of the cardiac action potential (AP). Genetic variations in this gene can explain around 20–25% of BrS cases [3].
Since BrS was classified as a genetic disease, several other genes have been described to confer BrS-susceptibility [4–7]. Pathogenic variations have been mainly described in: 1) genes encoding proteins that modulate Nav1.5 function, and 2) other calcium and potassium channels and their regulatory subunits. All these proteins participate, either directly or indirectly, in the development of the cardiac AP. Although the incidence of pathogenic variations in these BrS-associated genes is low [6], it is considered that, among all of them, they could provide a genetic diagnosis for up to an extra 5–10% of BrS cases. Hence, altogether, a genetic diagnosis can be achieved approximately in 35% of clinically diagnosed BrS patients.
Other types of genetic abnormalities have been suggested to explain the remaining percentage of undiagnosed patients. Indeed, multiplex ligation-dependent probe amplification (MLPA) has allowed the detection of large-scale gene rearrangements involving one or several exons ofSCN5A in BrS cases. However, the low proportion of BrS patients carrying large genetic imbalances identified to date suggests that this type of rearrangements will provide a genetic diagnosis for a modest percentage of BrS cases [8–10].
BrS has been associated with an increased risk of sudden cardiac death (SCD), despite the reported variability in disease penetrance and expressivity [11]. The prevalence of BrS is estimated at about 1.34 cases per 100 000 individuals per year, with a higher incidence in Asia than in the United States and Europe [12]. However, the dynamic nature of the typical electrocardiogram (ECG) and the fact that it is often concealed, hinder the diagnosis of BrS. Therefore, an exhaustive genetic testing and subsequent family screening may prove to be crucial in identifying silent carriers. A large percentage of these pathogenic variation carriers are clinically asymptomatic, and may be at risk of SCD, which is, sometimes, the first manifestation of the disease [13].
In the present work, we aimed to determine the spectrum and prevalence of genetic variations in BrS-susceptibility genes in a Spanish cohort diagnosed with BrS, and to identify variation carriers among relatives, which would enable the adoption of preventive measures to avoid SCD in their families.
Table 1. Demographics of the 55 Spanish BrS patients included in the study.
The table shows the demographic characteristics of all the patients included in the study. Numbers in parentheses represent the relative percentages for each condition. T1 ECG refers to Type 1 BrS diagnostic electrocardiogram (ECG), obtained either spontaneously, or after drug challenge. The information regarding both the electrophysiological studies (EPS) and the treatment was not available for all the patients. Two of the patients that didn’t receive any treatment died, and were not taken into account for the calculations of percentages (+2 dead). ICD, intracardiac cardioverter defibrillator.
Table 2. Characteristics of the Spanish BrS patients carrying rare genetic variations.
The table shows the clinical characteristics of the probands who carried rare genetic variations in SCN5A, SCN2B, or RANGRF. All of them are potentially pathogenic except that found in RANGRF, which is of unknown significance (see discussion). All the potentially pathogenic variations (PPVs) that had been previously reported, except p.P1725L and p.R1898C, had been identified in BrS patients. p.P1725L had been associated with Long QT Syndrome and p.R1898C was found in Exome Variant Server with a MAF of 0.0079%. No rare variations were identified in the control population. Patient’s age is expressed in years. Bold identifies the patients carrying variations that had not been described previously. M, male; F, female; S, syncope; ICD, intracardiac cardioverter defibrillator; UK, unknown; EPS, electrophysiological studies (+, positive response;-, negative response; N/P, not performed). The two patients who carried two PPVs each are identified by a and b, respectively.
We performed a genetic screening of 14 genes (SCN5A, CACNA1C, CACNB2, GPD1L,SCN1B, SCN2B, SCN3B, SCN4B, KCNE3, RANGRF, HCN4, KCNJ8, KCND3, and KCNE1L), which allowed the identification of 61 genetic variations in our cohort. Of these, 20 were classified as potentially pathogenic variations (PPVs), one variation of unknown significance, and 40 common or synonymous variants considered benign.
The 20 PPVs were found in 18 of the 55 patients (32.7% of the patients, 83.3% males; Table 2). Sixteen patients (88.9%) carried one PPV, and two patients (11.1%) carried two different PPVs each. Nineteen out of the 20 PPVs identified were localized in SCN5A and one in SCN2B.
The vast majority of the PPVs identified were missense (70%). We also detected 2 nonsense variations (10%), 3 insertions or deletions causing frameshifts (15%), and one splicing variation (5%). The three frameshifts (p.R569Pfs*151, p.E625Rfs*95 and p.R1623Efs*7) were identified in SCN5A. These were not found in any of the databases consulted (see Methods), and were thus considered potentially pathogenic (see below). The other 16 rare variations identified inSCN5A had been previously described, and hence were also considered potentially pathogenic. Fourteen of them had been identified in BrS patients. Of these, 6 had also been identified in individuals diagnosed with other cardiac electric diseases (i.e. Sick Sinus Syndrome, Long QT Syndrome, Sudden Unexplained Nocturnal Death Syndrome or Idiopathic Ventricular Fibrillation [2,15,16,20,21,25]). The other 2, p.P1725L and p.R1898C, had only been associated with Long QT Syndrome or found in Exome Variant Server with a MAF of 0.0079%, respectively. Furthermore, we identified a variation in SCN2B (c.632A>G in exon 4 of the gene, resulting in p.D211G) which was considered pathogenic. This patient was included within our cohort, but the functional characterization of channels expressing SCN2B p.D211G was object of a previous study from our group [7]. We also identified a nonsense variation in RANGRFwhich has been formerly reported as rare genetic variation of unknown significance [29].
Additionally, we screened the relatives of those probands carrying a PPV. We analysed a total of 129 relatives, 69 of which (53.5%) were variation carriers. Genotype-phenotype correlations evidenced that 8 of the families displayed complete penetrance (S3 Table). Additionally, no relatives were available for one of the probands carrying a PPV, thus hampering genotype-phenotype correlation assessment. The other 12 families showed incomplete penetrance.
MLPA analysis
The 37 patients with negative results after the genetic screening of the 14 BrS-associated genes underwent MLPA analyses of SCN5A. This technique did not reveal any large exon deletion or duplication in this gene for any of the patients.
SCN5A p.R569Pfs*151 (c.1705dupC), a novel PPV
A 41-year-old asymptomatic male presented a type 3 BrS ECG which was suggestive of BrS. Flecainide challenge unmasked a type 1 BrS ECG (Fig 1A, left), which was also spontaneously observed sometimes during medical follow up. Sequencing of SCN5A revealed a duplication of a cytosine at position 1705 (c.1705dupC; Fig 1A, right), which originated a frameshift that lead to a truncated Nav1.5 channel (p.R569Pfs*151). The proband’s sister also carried this duplication, but had never presented signs of arrhythmogenesis. The proband’s twin daughters were also variation carriers, displayed normal ECGs and, to date, are asymptomatic (Fig 1A, middle). Thus, p.R569Pfs*151 represents a novel genetic alteration in the Nav1.5 channel that could potentially lead to BrS, but with incomplete penetrance.
Fig 1. Characteristics of the probands carrying non-reported potentially pathogenic variations (PPVs) in SCN5A and their families.
Left: Electrocardiograms of the probands: (A) patient carrying the p.R569Pfs*151 variation, showing the ST elevation characteristic of BrS in V1 at the time of the flecainide test; (B) patient carrying the p.E625Rfs*95 variation, showing the spontaneous ST elevation characteristic of BrS in V1 and V2; and (C) patient carrying the p.R1623Efs*7 variation, showing the spontaneous ST elevation characteristic of BrS in V1 and V2. Middle: Family pedigrees. Open symbols designate clinically normal subjects, filled symbols mark clinically affected individuals and question marks identify subjects without an available clinical diagnosis. Plus signs indicate the carriers of the PPVs and minus signs, non-carriers. The crosses mark deceased individuals and arrows identify the proband. Right: Detail of the electropherograms obtained after SCN5Asequence analysis of a control subject (left panels) and of the probands (right panels).
A 51-year-old asymptomatic male was diagnosed with BrS since he presented a spontaneous ST segment elevation in leads V1 and V2 characteristic of type 1 BrS ECG (Fig 1B, left). The sequencing of SCN5A evidenced an adenine duplication at position 1872 (c.1872dupA, Fig 1B, right). This genetic variation results in a truncated Nav1.5 channel (p.E625Rfs*95). The genetic analysis of the proband’s relatives proved that only her mother carried the variation (Fig 1B, middle). She was asymptomatic, but a BrS ECG was unmasked upon ajmaline challenge. The proband’s sister was found dead in her crib at 6 months of age, which suggests that her death might be compatible with BrS. Therefore, the p.E625Rfs*95 variation in the Nav1.5 channel represents a novel genetic alteration potentially causing BrS.
SCN5A p.R1623Efs*7 (c.4867delC), a novel PPV
The proband, a 31-year-old male, was admitted to hospital after suffering a syncope. His baseline 12-lead ECG showed a ST segment elevation in leads V1 and V2 that strongly suggested BrS type 1 (Fig 1C, left). A deletion of the cytosine at position 4867 (c.4867delC) was observed upon SCN5A sequencing (Fig 1C, right). This base deletion leads to a frameshift that originates a truncated Nav1.5 channel (p.R1623Efs*7). Genetic screening of his parents and sisters evidenced that none of them carried this novel variation (Fig 1C, middle). None of them had presented any signs of arrhythmogenicity, nor had a BrS ECG. Nevertheless, in uterogenetic analysis of one of his daughters proved that she had inherited the variation. She died when she was 1 year of age of non-arrhythmogenic causes. Hence, the p.R1623Efs*7 variation in the Nav1.5 channel is a novel genetic alteration originated de novo in the proband that could potentially lead to BrS.
Synonymous and common genetic variations portrayal
In our cohort, we identified 40 single nucleotide variations which were common genetic variants and/or synonymous variants (S2 Table). Twenty-nine had a minor allele frequency (MAF) over 1%, and were thus considered common genetic variants.
We also identified 11 variants with MAF less than 1%. Of them, 9 were synonymous variants, what made us assume that they were not disease-causing. Four of these synonymous variants were not found in any of the databases consulted, and thus their MAF was considered to be less than 1%. Each of these synonymous variations was identified in 1 patient of the cohort. A similar proportion of individuals carrying these novel variations was detected upon sequencing of 300 healthy Spanish individuals (600 alleles). The remaining 2 variants were missense, and although they had either a MAF of less than 1% or an unknown MAF according to the Exome Variant Server and dbSNP websites, they were common in our cohort (29.2 and 50%, respectively; S2 Table), and a similar MAF was detected in a Spanish cohort of healthy individuals (26.7% and 48.8%, respectively).
Influence of phenotype and age on PPV discovery
To assess if a connection existed between the probands’ phenotype and the PPV detection yield, we classified the patients in our cohort according to their ECG (spontaneous or induced type 1), the presence of BrS cases within their families, and the presence/absence of symptoms. Even though the overall PPV detection yield was 32.7%, it was even higher for symptomatic patients (Fig 2). Indeed, in this group of patients, having a family history of BrS was identified as a factor for increased PPV discovery yield. In the case of absence of BrS in the family, the variation discovery yield was almost double for those patients having a spontaneous type 1 BrS ECG than for patients with drug-induced type 1 ECG (45.5% vs 25%, respectively). In addition, we identified a PPV in 44.4% of the asymptomatic patients who presented family history of BrS and a spontaneous type 1 BrS ECG. When the patient presented drug-induced type 1 ECG or in the absence of family history of BrS, the PPV discovery yield was of around 15%.
Fig 2. Influence of the phenotype on PPV discovery yield.
Bar graph comparing the PPV detection yield in 8 different clinical categories (stated below the graph). Each bar shows the total number of patients for each clinical category divided in those with a PPV (black) and those without an identified PPV (white). The number of patients (in brackets) and percentages are given. Pos, positive; Neg, negative; Spont, spontaneous type 1 BrS ECG; Drug, drug-induced type 1 BrS ECG; n, number of patients.
We also investigated the role of age on the PPV occurrence. No significant age differences were observed between variation carriers and non-carriers (38.6±10.3 and 43.5±14.4, respectively, p = 0.16). However, the PPV discovery yield was higher for patients with ages between 30 and 50 years: out of the total of patients carrying a PPV, 83.3% of the patients were in this age range, while 11.1% were younger and 5.6% were older patients (Fig 3A, upper panel). The PPV discovery yield was significantly higher for symptomatic than for asymptomatic patients (42.3% vs 24.1%, respectively; Fig 3A, lower panels).
Fig 3. Influence of the age on PPVs discovery yield.
(A) Pie charts showing the distribution of patients in the overall population as well as in the categories of symptomatic and asymptomatic patients regarding PPV discovery. The percentage and the number of patients (in brackets) are given for each group. The small pie charts correspond to the age distribution of patients with an identified PPV. (B) Bar graphs of the PPV detection yields obtained for each of the age groups (< 30 years, 30–50 years and > 50 years). Numbers inside each bar correspond to the number of patients carrying a PPV for each category and the percentages represent the variation detection yield.
Noteworthy, in the 30–50 age range, 52.9% (9/17) of the symptomatic patients and 35.3% (6/17) of asymptomatic patients carried one PPV (Fig 3B, middle). Additionally, 40% (2/5) of the symptomatic young patients (< 30 years) were variation carriers, while no PPVs were identified in asymptomatic patients within this age range.
Overall, 55 unrelated Spanish patients clinically diagnosed with BrS were included in our study.Table 1 shows the demographics of this cohort, and Table 2 and S1 Table show the clinical and genetic characteristics of all the patients included in the study. The mean age at clinical diagnosis was of 41.9±13.3 years. Although the majority of patients were males (74.5%), their age at diagnosis was not different than that of females (41.8±12.1 years and 42.3±16.3 years, respectively; p = 0.92). A type 1 BrS ECG was present spontaneously in 37 patients (67.3%), and drug challenge revealed a type 1 BrS ECG for the remaining 18 patients (32.7%). Almost half of the patients had experienced symptoms, including 2 SCD and 4 aborted SCD. Patients who had not previously experienced any signs of arrhythmogenicity despite having a BrS ECG were considered asymptomatic. Comparison of symptomatic vs asymptomatic patients evidenced a similar percentage of males (73.1% and 75.9%, respectively). However, the mean age at diagnosis was different between the two groups of patients (37.7±14.3 and 45.7±11.4, respectively; p<0.05).
Discussion
To the best of our knowledge, this is the first comprehensive genetic evaluation of 14 BrS-susceptibility genes and MLPA of SCN5A in a Spanish cohort. Well delimited BrS cohorts from Japan, China, Greece and even Spain have been genetically studied [24,30–32]. Additionally, an international compendium of BrS genetic variations identified in more than 2100 unrelated patients from different countries was published in 2010 [3]. However, all these studies screenedSCN5A exclusively. In 2012, Crotti et al. reported the spectrum and prevalence of genetic variations in 12 BrS-susceptibility genes in a BrS cohort [5]. However, this study included patients of different ethnicity. Here, we report the analysis of 14 genes which has been conducted on a well-defined BrS cohort of the same ethnicity.
Our results confirm that SCN5A is still the most prevalent gene associated with BrS. Indeed,SCN5A-mediated BrS in our cohort (30.9%) is higher than the proportion described in other European reports [3,23], where a potentially causative variation is identified in only 20–25% of BrS patients. The reason for this discrepancy is unclear but could point towards a higher prevalence of SCN5A PPVs in the Spanish population or to selection bias. Additionally, we identified a genetic variation in SCN2B (c.632A>G, which results in p.D211G). We have formerly published the comprehensive electrophysiological characterization of this variation, and showed that indeed this variation could be responsible of the phenotype of the patient, thus linking SCN2B with BrS for the first time [7]. Also, we identified a variation in RANGRF. This variation (c.181G>T leading to p.E61X) had been previously reported in a Danish atrial fibrillation cohort [33]. Surprisingly, the authors reported an incidence of 0.4% for this variation in the healthy Danish population, which brought into question its pathogenicity. Our finding of this variation in an asymptomatic patient displaying a type 2 BrS ECG also points toward considering it as a rare genetic variation with a potential modifier effect on the phenotype but not clearly responsible for the disease [29].
No PPVs were identified in the other genes tested. Certainly, it is well accepted that the contribution of these genes to the disease is minor, and thus should only be considered under special circumstances [13,34]. In addition, recent studies have questioned the causality of variations identified in some of these minority genes [35].
We also used the MLPA technique for the detection of large exon duplications and/or deletions in SCN5A in patients without PPVs, and no large rearrangements were identified. This is in accordance with previous reports, which revealed that such imbalances are uncommon [8–10].
Kapplinger et al. [3] reported a predominance of PPVs in transmembrane regions of Nav1.5. Indeed, it has been proposed that most rare genetic variations in interdomain linkers may be considered as non-pathogenic [36]. In contrast, PPVs identified in this study are mainly located in extracellular loops and cytosolic linker regions of Nav1.5 (Fig 4). Additionally, 2 of our non-previously reported frameshifts are located in the DI-DII linker. These 2 genetic variations lead to truncated proteins, which would lack around 75% of the protein sequence, and thus are presupposed to be pathogenic.
Fig 4. Nav1.5 channel scheme showing the relative position of the SCN5A PPVs identified in our cohort.
Open symbols indicate already described variations and closed symbols locate novel variations reported in this study. DI to DIV designate the 4 domains of the protein, and numbers 1–6 identify the different segments within each domain. Crosses mark the voltage sensor.
In our cohort, we have identified 40 synonymous or common genetic variations, 4 of which have not been previously reported. These variations are gradually becoming more and more important in the explanation of certain phenotypes of genetic diseases. Only a few common variations identified here are already published as phenotypic modifiers [37,38]. The effect of these and other common variants identified in our cohort on BrS phenotype should be further studied.
Unexpectedly, almost 40% (7/18) of the PPV carriers did not present signs of arrhythmogenicity. We also performed genotype-phenotype correlations of the PPVs identified in the families (S3 Table). These studies uncovered relatives, most of whom were young individuals, who carried a familial variation but had never exhibited any clinical manifestations of the disease. This is in agreement with Crotti et al. and Priori et al. [5,23], who postulated that a positive genetic testing result is not always associated with the presence of symptoms. Indeed, the existence of asymptomatic patients carrying genetic variations described to cause a severe Nav1.5 channel dysfunction has been reported [39]. The identification of silent carriers is of paramount importance since it allows the adoption of preventive measures before any lethal episode takes place. Unknown environmental factors, medication and modifier genes have been suggested to influence and/or predispose to arrhythmogenesis [11]. Hence, this group of patients has to be cautiously followed in order to avoid fatal events.
Our studies on the connection between patients’ phenotype and the PPV detection yield highlighted the presence of symptoms as a factor for an increased variation discovery yield. Within the group of symptomatic individuals, a PPV was identified in a higher proportion of patients displaying a spontaneous type 1 BrS ECG than for patients showing a drug-induced ECG. Likewise, within the asymptomatic patients with family history of BrS, those who presented spontaneous type 1 BrS ECG carried a PPV more often than those with a drug-induced ECG (Fig 2). Referring to age, the vast majority (17/20, 85%) of the PPVs were identified in patients around their fourth decade of age (30–50 years). This is in accordance with the accepted mean age of disease manifestation. Moreover, in this age range, more than 50% of the patients who presented symptoms carried a variation that could be pathogenic (Fig 3). Importantly, 35.3% of asymptomatic patients of around 40 years of age also carried one of such variations. These data highlight the importance of performing a genetic test even in the absence of clinical manifestations of the disease, and particularly when in the 30–50 years range, which is in accordance with consensus recommendations [13,34].
In conclusion, we have analysed for the first time 14 BrS-susceptibility genes and performed MLPA of SCN5A in a Spanish BrS cohort. Our cohort showed male prevalence with a mean age of disease manifestation around 40 years. BrS in this cohort was almost exclusivelySCN5A-mediated. The mean PPV discovery yield in our Spanish BrS patients is higher than that described for other BrS cohorts (32.7% vs 20–25%, respectively), and is even higher for patients in the 30–50 years age range (up to 53% for symptomatic patients). All these evidences support the genetic testing, at least of SCN5A, in all clinically well diagnosed BrS patients.
Study Limitations
First of all, drug challenge tests were not performed for all the relatives who were asymptomatic variation carriers. This fact hampered their clinical diagnosis and represents an impediment to definitely assess the link between PPVs and BrS. These patients are nowadays under follow-up.
New PPVs have been identified in our cohort. The clinical information available for the families suggests that these new variations could be pathogenic. Still, in vitro studies of these variations are required in order to evaluate their functional effects and verify their pathogenic role. Additionally, genotyping in an independent cohort would help reduce the likelihood of type I (false positive) error in genetic variant discovery.
We have to acknowledge that the study set is relatively small. Consequently, the classification of patients according to the different clinical categories rendered rather small sub-groups, which may lead to over-interpretation of the results. Future studies will be directed to the genetic screening of additional Spanish BrS patients, which will probably reinforce the significance of the tendencies observed here.
Polybia-MP1 (MP1) is a bioactive host-defense peptide with known anticancer properties. Its activity is attributed to excess serine (phosphatidylserine (PS)) on the outer leaflet of cancer cells. Recently, higher quantities of phosphatidylethanolamine (PE) were also found at these cells’ surface. We investigate the interaction of MP1 with model membranes in the presence and absence of POPS (PS) and DOPE (PE) to understand the role of lipid composition in MP1’s anticancer characteristics. Indeed we find that PS lipids significantly enhance the bound concentration of peptide on the membrane by a factor of 7–8. However, through a combination of membrane permeability assays and imaging techniques we find that PE significantly increases the susceptibility of the membrane to disruption by these peptides and causes an order-of-magnitude increase in membrane permeability by facilitating the formation of larger transmembrane pores. Significantly, atomic-force microscopy imaging reveals differences in the pore formation mechanism with and without the presence of PE. Therefore, PS and PE lipids synergistically combine to enhance membrane poration by MP1, implying that the combined enrichment of both these lipids in the outer leaflet of cancer cells is highly significant for MP1’s anticancer action. These mechanistic insights could aid development of novel chemotherapeutics that target pathological changes in the lipid composition of cancerous cells.
The antimicrobial peptide Polybia-MP1 (IDWKKLLDAAKQIL-NH2), or simply MP1, has unexpectedly been shown to exhibit selective inhibition against several types of cancerous cells and therefore could prove advantageous in the development of novel chemotherapies. Extracted from the Brazilian waspPolybia paulista, MP1 has a broad spectrum of bactericidal activities against Gram-negative and Gram-positive bacteria without being hemolytic and cytotoxic (1). Surprisingly, MP1 also selectively inhibits proliferating bladder and prostate cancer cells (2), and multidrug-resistant leukemic cells (3). Recently, it has been observed that this peptide is cytotoxic against leukemic T lymphocytes and very selective in recognizing these cells compared to healthy lymphocytes (4).
Cancer cell membranes are now known to lose the asymmetric transmembrane distribution of phospholipids that is observed in healthy cells (5, 6). In healthy mammalian cells, the anionic aminophospholipid PS (phosphatidylserine) is predominant in the inner membrane leaflet and zwitterionic phospholipids are predominant in outer membrane leaflet. In such cells, the phospholipid asymmetry is maintained by a family of aminophospholipid translocases that catalyze the transport of PS from the outer to the inner membrane leaflets (7). However, in apoptotic and cancer cells, PS is found to also be located in the outer monolayer of the plasma membrane in significant proportions (5, 6).
The molecular-scale mechanistic basis for MP1’s anticancer properties is yet to be established. Changes in the distribution and/or composition of lipids (e.g., PS) within the plasma membrane of malignant cells could be the origin of MP1’s cancer selectivity. This is a reasonable hypothesis, based upon the well-established selectivity of antimicrobial peptides for bacterial membranes over eukaryotic membranes due to their higher anionic lipid content (8, 9, 10, 11). Recently, the effect of PS on the pore-forming activity of MP1 was investigated by multiple techniques, namely, conductance measurements in planar bilayer lipid membranes, binding assays, and lytic activity on large unilamellar vesicles (4). Although an increase in affinity and lytic activity of MP1 for lipid vesicles containing PS was observed, MP1’s pore-formation activity in BLM showed no difference between PC (phosphatidylcholine) and mixed PC/PS bilayers. Significantly, it was recently reported that PE (phosphatidylethanolamine) lipids, naturally found on the inner plasma membrane of normal cells, are also externalized to the outer monolayer of the plasma membrane of apoptotic and tumor endothelial cells due to both PS and PE lipids being coregulated by the same transporters (7). These authors observed that the exposure to the outer monolayer of one of these phospholipids leads to the exposure of the other. Therefore, it is important for future work to establish the role of increased concentrations of both PE and PS lipids in the interaction of MP1 with membranes.
In this work, we address this challenge by establishing the roles of PE and PS lipids in the effects of MP1 on the structure and permeability of model membranes. Primarily, we study the permeability of giant unilamellar vesicles (GUVs) at the single vesicle level. Fluorescence confocal microscopy was used to determine the size-dependent macromolecular permeability of lipid membranes in GUV model systems by analyzing the influx of three fluorescent dyes with molecular masses of 0.37, 3.0, and 10.0 kDa into these vesicles (Fig. 1). We deconvolve the effects of PS and PE lipids by exploring their effects within DOPC (PC) membranes both separately and in combination: DOPC/POPS 80:20 (PC/PS), DOPC/DOPE 90:10 (PC/PE), and DOPC/DOPE/POPS 70:10:20 (PC/PE/PS). These experiments are corroborated by circular dichroism (CD) spectroscopy to quantify peptide binding to the membrane, fluorescence spectroscopy experiments to establish the leakage mechanism in an ensemble system of nanoscale large unilamellar vesicles (LUVs), and atomic-force microscopy (AFM) imaging of supported lipid bilayers to reveal the nanoscale perturbations of membrane structure induced by the peptide. By combining these approaches, we show that, while PS lipids significantly enhance MP1’s binding onto the membrane, PE lipids impart the most significant contribution to the rate and extent of membrane permeabilization by MP1, facilitating the opening of larger membrane defects than in bilayers lacking in PE.
Schematic representation of membrane disruption by peptides and the experimental system. The helical peptide Polybia-MP1 is shown according to the helical wheel projections. Amino acids: (blue) polar with positive net charge; (purple) polar with negative net charge; (red) polar noncharged; and (green) nonpolar. Confocal microscopy was performed to investigate the influx of three dyes with distinct sizes in GUVs in the presence and absence of PE lipids: 0.37 kDa CF (green), 3k-CB (blue), 10k-AF647 (magenta), and the scale bars correspond to 10 μm. Lipid membranes are labeled with Rh-DOPE (red). The peptide interacts with the GUVs, disturbs their structure, and then enables the passage of fluorescent dyes by formation of pore-like structures. To see this figure in color, go online.
Jump to Section
Introduction
Materials and Methods
Materials
Peptide synthesis and purification
Mass spectrometry analysis
GUV formation
LUV preparation
CD spectroscopy for binding isotherms
Confocal microscopy
Analysis of confocal images and movies
ANTS/DPX requenching measurements
AFM
Phase contrast microscopy
Results
PS lipids significantly enhance peptide binding to the membrane
MP1 dose-response studies reveal that PE and PS lipids enhance membrane permeability at lower peptide concentrations
Confirmation of the pore-formation hypothesis in lipid vesicles
Synergistic enhancement of GUV leakage kinetics by PE and PS lipids
PE lipids significantly enhance pore size and membrane permeability
Direct imaging of peptide-induced pores by AFM
Discussion
Biophysical implications for MP1-lipid membrane interactions
Implications for the chemotherapeutic potential of MP1 peptides
Author Contributions
Supporting Material
References
Results
Jump to Section
Introduction
Materials and Methods
Materials
Peptide synthesis and purification
Mass spectrometry analysis
GUV formation
LUV preparation
CD spectroscopy for binding isotherms
Confocal microscopy
Analysis of confocal images and movies
ANTS/DPX requenching measurements
AFM
Phase contrast microscopy
Results
PS lipids significantly enhance peptide binding to the membrane
MP1 dose-response studies reveal that PE and PS lipids enhance membrane permeability at lower peptide concentrations
Confirmation of the pore-formation hypothesis in lipid vesicles
Synergistic enhancement of GUV leakage kinetics by PE and PS lipids
PE lipids significantly enhance pore size and membrane permeability
Direct imaging of peptide-induced pores by AFM
Discussion
Biophysical implications for MP1-lipid membrane interactions
Implications for the chemotherapeutic potential of MP1 peptides
Author Contributions
Supporting Material
References
PS lipids significantly enhance peptide binding to the membrane
The overall efficacy of a peptide at disrupting a target membrane can be broken down into the combination of two sequential steps: 1) binding of the peptide to the membrane surface, and 2) the efficiency of membrane disruption by the bound peptide resulting in membrane poration or leakage. First, we investigate the membrane binding isotherms of the MP1 peptide to our four lipid compositions of interest by CD spectroscopy by titrating a 10 μM MP1 solution with increasing lipid (LUV) concentrations (Fig. 2). Fitting these binding isotherms revealed that the partition coefficient (Kp) of the peptide was 7–8 times higher for membrane compositions containing PS (Kp values were PC 4600 M−1, PC/PE 4000 M−1, PC/PS 33,000 M−1, and PC/PE/PS 30,000 M−1). It is also interesting to note from this data that PE lipids slightly suppress peptide binding by a factor of ∼10%. Due to the cationic nature of MP1 (net charge of +2e), it is highly likely that the enhanced peptide binding to anionic-PS-containing membranes is primarily driven by electrostatic interactions.
Binding isoterms show that MP1 has a higher affinity for PS-containing membranes. The binding isoterms and the partition coefficients (Kp) obtained using CD by lipid titration at 10 μM MP1 solution. LUVs are composed of (a) PC, (b) PC/PE, (c) PC/PS, and (d) PC/PE/PS.
Jump to Section
Introduction
Materials and Methods
Materials
Peptide synthesis and purification
Mass spectrometry analysis
GUV formation
LUV preparation
CD spectroscopy for binding isotherms
Confocal microscopy
Analysis of confocal images and movies
ANTS/DPX requenching measurements
AFM
Phase contrast microscopy
Results
PS lipids significantly enhance peptide binding to the membrane
MP1 dose-response studies reveal that PE and PS lipids enhance membrane permeability at lower peptide concentrations
Confirmation of the pore-formation hypothesis in lipid vesicles
Synergistic enhancement of GUV leakage kinetics by PE and PS lipids
PE lipids significantly enhance pore size and membrane permeability
Direct imaging of peptide-induced pores by AFM
Discussion
Biophysical implications for MP1-lipid membrane interactions
Implications for the chemotherapeutic potential of MP1 peptides
Author Contributions
Supporting Material
References
MP1 dose-response studies reveal that PE and PS lipids enhance membrane permeability at lower peptide concentrations
To investigate the efficiency of membrane disruption, we measured the leakage of macromolecules across GUV model membranes by confocal fluorescence microscopy. Fluorescent passive leakage markers of different sizes were simultaneously employed: 0.37 kDa carboxyfluorescein (CF), 3 kDa dextran labeled with Cascade Blue (3k-CB), and 10 kDa dextran labeled with Alexa Fluor 647 (10k-AF647). GUVs were composed of PC, PC/PS, PC/PE, or PC/PE/PS. The dose-response of the membranes to the addition of MP1 was characterized for each membrane composition and passive leakage marker by evaluating the normalized fluorescence intensities of the probes in the intravesicular lumen of the GUVs after 30 min incubation time (Fig. 3 and Fig. S1 in the Supporting Material). Each data point in Figs. 3 and S1 shows the mean leakage of 50 individual GUVs from a minimum of two independent experiments. For determining the percentage of leaked vesicles (Fig. 3), a threshold of 20% leakage (normalized to the background probe concentration) was used to define a filled vesicle. Alternatively, this data can be analyzed in terms of the average leakage into GUVs as a percentage of the probe concentration in the external medium (Fig. S1).
Dose-response curves show increased leakage of PE containing GUVs at lower peptide concentrations. (a and c) Percentage of GUVs filled by CF (0.37 kDa) after 30 min incubation time with MP1. (b and d) Percentage of GUVs filled by 10k-AF647 after 30 min incubation time with MP1. All vesicles presenting >20% of dye entry were accounted as filled. The data is plotted as a function of (a and b) total peptide concentration and (c and d) the concentration of peptide bound to the membranes. Fifty GUVs were used to construct each data point. Vesicles are composed of PC, PC/PS, PC/PE, and PC/PE/PS. To see this figure in color, go online.
The integrity of membranes containing both PE and PS lipids is perturbed by lower concentrations of MP1 peptide than the other membrane compositions we investigated. PC/PE/PS GUVs show significant (40–65%) leakage to the CF probe at 0.4 and 1.2 μM MP1 concentrations, whereas other membrane compositions studied leaked <30% within this concentration range (Fig. S1a).
Larger pore defects, evidenced by leakage of the larger 10k-AF647 probe, are shown to be significantly enhanced in membranes containing 10% PE. Almost all GUVs (98%) containing PE lipids are observed to leak the 10k-AF647 probe when in the presence of 4.0 μM MP1, compared to <60% of GUVs for other membrane compositions at the same peptide concentration (Fig. 3b). This is the most significant enhancement in selective perturbation for specific lipid membrane compositions observed within the dose-response data in Figs. 3 andS1. At this MP1 concentration, membranes under native conditions would be susceptible to the leakage of biological macromolecules such as small proteins and RNAs.
Interestingly, we also plot the GUV leakage data as a function of the concentration of bound peptide on the membrane using the specific partition coefficients of the peptide for different lipid compositions that were calculated inFig. 2 (see also Figs. 3, c and d, and S1, c and d). This representation of the data clearly shows that PE lipids increase the susceptibility of PC membranes to disruption by the MP1 peptide, with PC/PE lipids leaking at significantly lower bound peptide concentrations. Due to the higher bound concentration of peptide to membranes containing PS lipids, this lipid decreases the apparent susceptibility of the membrane to leakage as observed by the onset of leakage shifting to higher bound peptide concentrations. For PC/PE/PS GUVs, the apparent competing effects of PE and PS lipids on the membrane’s leakage susceptibility roughly cancel each other out, leading to intermediate membrane disruption susceptibility for a given bound peptide concentration. However, the effect of increased bound peptide concentrations due to PS far outweighs its apparent inhibition of membrane leakage, making PC/PE/PS GUVs the most susceptible to leakage for a given total peptide concentration. Therefore, the combined roles of PS in increasing membrane binding and PE in increasing the susceptibility of the membrane are both important in increasing the membrane disruptive efficacy of MP1.
Jump to Section
Introduction
Materials and Methods
Materials
Peptide synthesis and purification
Mass spectrometry analysis
GUV formation
LUV preparation
CD spectroscopy for binding isotherms
Confocal microscopy
Analysis of confocal images and movies
ANTS/DPX requenching measurements
AFM
Phase contrast microscopy
Results
PS lipids significantly enhance peptide binding to the membrane
MP1 dose-response studies reveal that PE and PS lipids enhance membrane permeability at lower peptide concentrations
Confirmation of the pore-formation hypothesis in lipid vesicles
Synergistic enhancement of GUV leakage kinetics by PE and PS lipids
PE lipids significantly enhance pore size and membrane permeability
Direct imaging of peptide-induced pores by AFM
Discussion
Biophysical implications for MP1-lipid membrane interactions
Implications for the chemotherapeutic potential of MP1 peptides
Author Contributions
Supporting Material
References
Confirmation of the pore-formation hypothesis in lipid vesicles
Fluorescence spectroscopy experiments using LUVs give ensemble-averaged measurements with high statistics on a large population of vesicles, complementing single-vesicle GUV imaging experiments that inherently have lower statistics but yield information on the distribution of behaviors and rare events within a sample. The fluorescence requenching method (18) enables us to distinguish the type of leakage mechanism induced by MP1 for the lipid compositions under investigation. One possibility is the all-or-none mechanism where some vesicles release all of their internal contents while the others remain intact. This is attributed to pore-formation mechanisms of membrane perturbation, or complete vesicle lysis. Another possibility is the gradual leakage mechanism where vesicles only release a fraction of their encapsulated contents during a leakage event. This is associated with transient perturbations of the membrane. A fluorophore (ANTS) and a quencher (DPX) are encapsulated within lipid vesicles at high concentrations such that the fluorescence is initially quenched; vesicle leakage results in the release of both ANTS and DPX, but quenching is decreased due to dilution of these probes. The externalized ANTS fluorescence can be suppressed by additional titration of DPX such that the remaining fluorescence signal is only due to the ANTS inside intact vesicles. The data can be represented by a plot of the degree of quenching (Qin) against the released ANTS fraction (fout). In the case of an all-or-none leakage mechanism, the plot of Qin versus fout will show no dependence of Qin on fout. In contrast, the gradual leakage mechanism causes release of only a fraction of the encapsulated contents within individual vesicles and so Qin increases with increasing fout (18).
Fluorescence requenching assays for MP1 reveal all-or-none leakage in the four lipid compositions studied. Qin is constant as a function of fout for MP1, which is in agreement with the all-or-none mechanism of dye release.) (Lines) Theoretical curves for ideal graded and all-or-none dye release (18). To see this figure in color, go online.
Fig. 4 shows that the values of Qin remain constant with the increase of fout and the consequent increase of peptide/lipid molar ratios. This clearly shows that MP1 exhibits the all-or-none leakage mechanism for all lipid compositions studied, which is in contrast to what has been observed for antimicrobial peptides mastoparan X and mastoparan MP (19). We propose that this all-or-none leakage is related to peptide-induced pore formation (20, 21, 22, 23), where the vesicles are able to release all their internal contents through pore-like structures that are sufficiently long lived (23, 24, 25, 26, 27, 28). We do not solely attribute the all-or-none leakage to lysis of the vesicles because nonlysed, leaky vesicles are observed in our GUV experiments (Figs. 3 and S1). However, we do not discount the possibility that lysis might play a role in the LUV leakage at the highest peptide concentrations used in this assay. Furthermore, pore-like activity of MP1 has previously been identified from electrophysiology measurements in planar lipid bilayers composed of phytanoyl-PC and phytanoyl-PC/PS (70:30) (4).
Our fluorescence requenching results show that stable pores form with a lifetime that persists long enough for the dye efflux to reach equilibrium in LUV systems. However, this does not discount the possibility that pores might be transient over longer timescales, for example during the leakage of much larger vesicles such as GUVs where the encapsulated volume of dye that needs to be released during a leakage event is ∼106 times greater than for the LUV model system. Indeed, we will see some evidence for transient pore events and dynamic changes in membrane permeability in the single GUV leakage kinetics data that follows. Nevertheless, all-or-none leakage is clearly evident in GUVs after 30 min incubation with 1.2 and 4.0 μM MP1. Leakage histograms of the individual GUVs (an alternative representation of data shown in Figs. 3 and S1) predominantly show either 20% (unleaked) or 80% (fully leaked) leakage (Fig. S2).
Jump to Section
Introduction
Materials and Methods
Materials
Peptide synthesis and purification
Mass spectrometry analysis
GUV formation
LUV preparation
CD spectroscopy for binding isotherms
Confocal microscopy
Analysis of confocal images and movies
ANTS/DPX requenching measurements
AFM
Phase contrast microscopy
Results
PS lipids significantly enhance peptide binding to the membrane
MP1 dose-response studies reveal that PE and PS lipids enhance membrane permeability at lower peptide concentrations
Confirmation of the pore-formation hypothesis in lipid vesicles
Synergistic enhancement of GUV leakage kinetics by PE and PS lipids
PE lipids significantly enhance pore size and membrane permeability
Direct imaging of peptide-induced pores by AFM
Discussion
Biophysical implications for MP1-lipid membrane interactions
Implications for the chemotherapeutic potential of MP1 peptides
Author Contributions
Supporting Material
References
Synergistic enhancement of GUV leakage kinetics by PE and PS lipids
Analysis of the time delay from the start of our GUV experiments (addition of the peptide) to observations of the onset of GUV leakage reveals a synergistic reduction in this lag time for PC/PE/PS membranes (Table 1 and Fig. 5). In these GUV experiments, we add 4.0 μM MP1 to our samples and monitor the time taken for initial leakage events of GUVs to the 0.37 kDa CF probe to occur (t0 − tCF). This MP1 concentration is chosen as it causes significant leakage of GUVs within 30 min of peptide addition across all four lipid compositions of interest. The onset of leakage occurs approximately twice as quickly for PC/PE/PS GUVs than for other membrane compositions, with only a very slight reduction of the lag time for PC/PS membranes compared with PC/PE and PC GUVs. Therefore, this is not a purely electrostatic effect from the increased rate and extent of peptide binding to anionic PS-containing membranes; it also requires the presence of PE to significantly increase the susceptibility of the membrane to permeabilization.
Table 1Lag times between the onset of leakage of each dye and the time interval before the initial leakage takes place after the addition of peptide
The errors represent the standard deviation of the observed GUV data set.
aFor PC/PS GUVs, the tCF – t3k-CB data only includes GUVs that leaked to all three dyes; these sample conditions contained two distinct populations of GUV leakage behaviors where a second population of GUVs only leaked to the CF and 3k-CB dyes with a time delay of tCF – t3k-CB = 4.8 ± 0.6 s.
GUV permeabilization kinetics are synergistically enhanced by PE and PS lipids. (a) Comparison between dye influx kinetics of three distinct dyes (CF-0.37kDa, 3k-CB, and 10k-AF647) for PC/PE/PS and PC/PS GUVs. The time axis represents the time after peptide addition. These individual GUV leakage profiles were chosen as they represent the average behavior of the GUVs observed under these conditions. (b) Schematic representation of the dye influx kinetics for PC/PS and PC/PE/PS GUVs in the presence of CF and 10k-AF647 passive leakage markers. This shows the average lag times for GUV leakage after the addition of 4.0 μM MP1 and the typical average leakage extent of the GUVs that resulted in these experiments. To see this figure in color, go online.
We also quantify the average delay times between leakage of the different-sized fluorescent probes between CF and 3k-CB (tCF – t3k-CB), CF and 10k-AF647 (tCF– t10k-AF647), and 3k-CB and 10k-AF647 (t3k-CB – t10k-AF647). Once the initial leakage event occurs, PE-containing GUVs rapidly become leaky to fluorescent probes of larger sizes (3 and 10 kDa). For PC/PE/PS and PC/PE membranes, GUVs become leaky to larger 3k-CB, then 10k-AF647 passive leakage markers within seconds of permeabilization to the smallest CF (0.37 kDa) probe (Table 1). The consecutive delay times between CF and 3k-CB probes and 3k-CB and 10k-AF647 probes were approximately an order-of-magnitude longer for PC/PS membranes, and almost two orders-of-magnitude longer for purely PC membranes. This strongly implies that the presence of PE significantly enhances the favorability and rate of formation of larger membrane defects or pores.
Jump to Section
Introduction
Materials and Methods
Materials
Peptide synthesis and purification
Mass spectrometry analysis
GUV formation
LUV preparation
CD spectroscopy for binding isotherms
Confocal microscopy
Analysis of confocal images and movies
ANTS/DPX requenching measurements
AFM
Phase contrast microscopy
Results
PS lipids significantly enhance peptide binding to the membrane
MP1 dose-response studies reveal that PE and PS lipids enhance membrane permeability at lower peptide concentrations
Confirmation of the pore-formation hypothesis in lipid vesicles
Synergistic enhancement of GUV leakage kinetics by PE and PS lipids
PE lipids significantly enhance pore size and membrane permeability
Direct imaging of peptide-induced pores by AFM
Discussion
Biophysical implications for MP1-lipid membrane interactions
Implications for the chemotherapeutic potential of MP1 peptides
Author Contributions
Supporting Material
References
PE lipids significantly enhance pore size and membrane permeability
We use time-series confocal microscopy imaging to quantify the membrane permeability of GUVs during initial leakage. Quantification of the fluorescence intensity of the leakage markers in the intravesicular and extravesicular medium allows us to calculate the fractional leakage of individual GUVs as a function of time. The leakage kinetics of individual GUVs are monitored for up to 30 min after the addition of 4.0 μM MP1. This concentration is chosen as all lipid compositions show significant leakage within 30 min; a higher MP1 concentration of 10 μM is observed to induce significant lysis of GUV samples (Fig. S3). These experiments are conducted on GUVs of all four membrane compositions under investigation, using the CF, 3k-CB, and 10k-AF647 leakage markers simultaneously. This allows the time evolution of membrane permeability to different molecular sizes to be simultaneously measured for individual GUVs (Figs. 5a and S4). To the best of our knowledge, this is the first example of simultaneous size-dependent permeability measurements in GUVs for three different-sized leakage markers.
Typical leakage kinetic profiles for different membrane compositions and probe sizes are shown in Figs. S4 and 5a. It can be qualitatively seen from these example profiles that membrane compositions containing 10% PE exhibit full and rapid membrane leakage for all three sizes of leakage marker, consistent with the leakage kinetics data in Table 1, which is also outlined in Fig. 5b. For membrane compositions lacking PE, the leakage rates can sometimes be seen to increase and decrease intermittently, sometime plateauing before full leakage is achieved; this is particularly evident in the leakage profile of a single PC/PS GUV shown in Fig. S5. We attribute these observations to membrane self-healing events, where the pores/defects reseal and the membrane regains its permeability barrier, followed by later phases of increased leakage. This is particularly observed for the larger 3k-CB and 10k-AF647 leakage probes. Therefore, the membrane permeability for PC and PC/PS GUVs, in particular, can change dynamically during the observed leakage events; this is a result of the competition between the lipid bilayer and peptides in maintaining their barrier properties and inducing membrane pores, respectively (Fig. S5).
PE lipids facilitate much greater membrane permeability in GUV membranes. (a) Typical log-linear plot of time-dependent dye influx: −R/3ln(1−c) (10−5) versus time, for the three dyes in a single GUV of PC/PS. (b) Distributions of the obtained permeabilities in single GUVs composed of PC/PS. (c) Typical log-linear plot of time-dependent dye influx: −R/3ln(1−c) (10−5) versus time, for the three dyes in a single GUV of PC/PE/PS. (d) Distributions of the obtained permeabilities in single GUVs composed of PC/PE/PS. The permeabilities are obtained from the slopes of the log-linear plots of the time-dependent influx of dyes into single GUVs. To see this figure in color, go online.
Our leakage kinetic profiles were used to calculate the membrane permeability to the different-sized probes using a diffusional model for membrane translocation (29); the membrane permeability is the gradient of the log-linear plot as seen in the example data in Fig. 6, a and c. Average permeability values for each membrane composition to each probe size during the initial leakage events are shown in Table 2. It can be seen that, for all membrane compositions tested, average permeability decreases with increasing probe size. However, the most significant finding from this data is the large, one-order-of-magnitude increase, in membrane permeability for membrane compositions containing 10% PE. This can be observed for all three leakage markers studied. It can also be seen that the presence of PS in the membrane imparts a modest, but significant, increase in permeability on the membranes upon perturbation by MP1. This effect can be seen further in Fig. 6, b and d, which show the distributions of permeability measurements for PC/PS and PC/PE/PS GUVs to the CF and 10k-AF647 leakage markers, respectively. For both probe sizes, the majority of permeability measurements for PC/PS membranes were in the 0–25 nm/s range, whereas when PE was included in the membrane formulations, a large proportion of permeability measurements were >500 nm/s.
Table 2Average permeability values (〈Pm〉) and the average fractional permeated area per vesicle (〈Ap〉/〈Av〉) obtained from the average permeability values for each probe size and membrane composition
〈Pm〉CF(nm/s)
〈Ap〉/〈Av〉CF(10−6)
〈Pm〉3k-CB(nm/s)
〈Ap〉/〈Av〉3k-CB(10−6)
〈Pm〉10k-AF647(nm/s)
〈Ap〉/〈Av〉10k-AF647 (10−6)
PC
46 ± 14
0.45 ± 0.14
17 ± 6
0.50 ± 0.16
8 ± 2
0.44 ± 0.08
PC/PS
59 ± 12
0.58 ± 0.12
29 ± 6
0.90 ± 0.20
23 ± 4
1.30 ± 0.20
PC/PE
466 ± 143
4.60 ± 1.40
207 ± 102
6.50 ± 3.40
158 ± 53
8.80 ± 2.90
PC/PE/PS
589 ± 142
5.80 ± 1.40
333 ± 73
10.40 ± 2.80
169 ± 52
9.40 ± 2.90
The errors represent the standard deviation of the observed GUV data set.
It should be noted that the observed permeability distributions (Fig. 6, b and d) are broad due to the fact that peptide-induced pores do not have well-defined structures, pore formation events are stochastic, and the membrane interfaces are fluid, giving rise to this wide distribution of individual permeability events when measured at the single vesicle level. Indeed, it has previously been reported that the initial pores that form during peptide-induced pore formation might be far from equilibrium and can, for example, relax to a smaller size over longer timescales as has been observed for the peptides Bax-α5 (23) and magainin 2 (30).
The permeability data was used to calculate the effective fractional permeable area of the membrane for each probe size using the expression (29)
where Ap is the permeable area of membrane on a GUV, Av is the total area of the vesicle, Pm is the permeability, and δ is the thickness of the membrane. The Stokes-Einstein diffusion constant of the leakage marker is D0 = kT/6πηR0, where kT is the thermal energy, η is the solvent viscosity, and R0 is the hydrodynamic radius of the fluorescent dye that was estimated with the relationR0 = 0.0332(Mw)0.463 in nanometers (31); Mw is the molecular weight of the dye. A brief derivation of this equation is presented in the Supporting Material. It should be noted that this equation is most accurate for the formation of large membrane pores as it assumes that the diffusion constant of the dye within the pore is the same as its diffusion constant in bulk solution. However, we believe this to be a reasonable assumption because these passive leakage markers will have a very short residence time within the pore itself due to the bilayer only being ∼5-nm thick; these solutes are not expected to interact strongly with the membrane itself.
Values of the fractional permeable areas are shown in Table 2. The fractional permeable areas were also found to be an order-of-magnitude greater for membrane compositions containing PE than for those that did not. Note that slightly larger permeable areas were measured for the larger leakage markers; these represent a later time point in the membrane disruption of GUVs by MP1 as the smaller leakage markers translocate the membrane at earlier times (Table 1). This extended delay time therefore allows for a greater area of membrane disruption to occur before the initiation of leakage to the larger Mw dyes.
Besides the order-of-magnitude increase in membrane permeabilization in the presence of PE lipids, we found an interesting correlation between PE content and membrane morphological response to MP1. Without PE, PC and PC/PS GUVs exhibited bright spots of fluorescent lipids at specific locations on the membrane surface in the presence of 4.0 μM MP1 (Fig. 7). We attribute these observations to local aggregation of peptides and lipids at the GUV surface. These peptide-induced lipid aggregates may be in competition with the pore-/defect-forming activity of the peptides. Such dense lipid structures were not seen on GUVs containing PE (PC/PE and PC/PE/PS) upon introduction of the peptide. Therefore, we speculate that the PE suppresses the intramembrane lipid aggregation by more easily facilitating the poration of the membrane.
Lipid aggregation is observed within the membranes of GUVs lacking in PE. Images of local lipid aggregation at the GUV surface (bright localized spots of fluorescence) seen after peptide addition (Cp = 4.0 μM). This effect is frequently observed in PC and PC/PS GUVs, but not for the lipid mixtures containing 10 mol % PE. To see this figure in color, go online.
While localized lipid aggregation was not observed on the surface of the PE-containing GUVs, these GUVs were observed to decrease in diameter by ∼10–15% over a period of ∼1 h after peptide addition (Fig. S6). Contrary to this, PC and PC/PS GUVs remained at a constant size for up to 2 h after addition of MP1. Therefore, MP1 results in the significant loss of lipid from only those GUVs that contain PE lipids.
Jump to Section
Introduction
Materials and Methods
Materials
Peptide synthesis and purification
Mass spectrometry analysis
GUV formation
LUV preparation
CD spectroscopy for binding isotherms
Confocal microscopy
Analysis of confocal images and movies
ANTS/DPX requenching measurements
AFM
Phase contrast microscopy
Results
PS lipids significantly enhance peptide binding to the membrane
MP1 dose-response studies reveal that PE and PS lipids enhance membrane permeability at lower peptide concentrations
Confirmation of the pore-formation hypothesis in lipid vesicles
Synergistic enhancement of GUV leakage kinetics by PE and PS lipids
PE lipids significantly enhance pore size and membrane permeability
Direct imaging of peptide-induced pores by AFM
Discussion
Biophysical implications for MP1-lipid membrane interactions
Implications for the chemotherapeutic potential of MP1 peptides
Author Contributions
Supporting Material
References
Direct imaging of peptide-induced pores by AFM
AFM imaging of supported lipid bilayers confirms the role of PE in potentiating the formation of larger transmembrane pores. MP1 was added at 10 μM concentration to induce significant pore formation on the relatively small patches of membrane imaged by the AFM within a reasonable experimental timescale (<2 h); resultant pores/defects were observed to be much larger in PC/PE/PS membranes (250 ± 110 nm in diameter) compared to PC/PS (54 ± 30 nm in diameter) (Fig. 8). Similar-sized transmembrane pores were observed in PC/PE/PS and PC/PE membranes (290 ± 200 nm in diameter), but significantly fewer defects formed in PC/PE membranes. Note that the large standard deviations in these average pore diameters represent a significant size polydispersity in the defects formed. No pores were evident in PC membranes 2 h after peptide addition (Fig. S7); however, pores would need to be several nanometers in diameter to be observable by AFM, considerably larger than those that can be detected by passive dye influx into the GUVs we used to investigate the early stages of GUV poration.
Our AFM studies also clearly show a difference in pore formation and growth mechanisms dependent on the presence of PE. The large transmembrane pores in PC/PE/PS and PC/PE membranes are seen to grow by the stepwise loss of lipid aggregates from the edge of the pore, implying that vesicle micellization is important for pore growth in the these membranes (Fig. S8). This is consistent with the small decrease (within experimental error) in GUV size observed for PE-containing GUVs by phase contrast microscopy (Fig. S6). Conversely, in PC/PS membranes, raised areas of lipid are first seen to form on the membrane (Fig. S9), which may correlate to the dense lipid structures observed in Fig. 7. These raised areas of membrane later evolve into comparatively small pores; many of the defects seen in Fig. 8 (bottom left) only span half the bilayer, with only the center of a few of these defects showing full bilayer pores (Fig. S10). This indicates that pores in these membranes may form via a half-membrane intermediate state. Finally the timescale for observation of membrane defects by AFM was much faster for PC/PE/PS membranes than for other lipid mixtures, with defects observed almost immediately after peptide addition (Fig S7), compared with a few tens of minutes for other mixtures.
Discussion
Jump to Section
Introduction
Materials and Methods
Materials
Peptide synthesis and purification
Mass spectrometry analysis
GUV formation
LUV preparation
CD spectroscopy for binding isotherms
Confocal microscopy
Analysis of confocal images and movies
ANTS/DPX requenching measurements
AFM
Phase contrast microscopy
Results
PS lipids significantly enhance peptide binding to the membrane
MP1 dose-response studies reveal that PE and PS lipids enhance membrane permeability at lower peptide concentrations
Confirmation of the pore-formation hypothesis in lipid vesicles
Synergistic enhancement of GUV leakage kinetics by PE and PS lipids
PE lipids significantly enhance pore size and membrane permeability
Direct imaging of peptide-induced pores by AFM
Discussion
Biophysical implications for MP1-lipid membrane interactions
Implications for the chemotherapeutic potential of MP1 peptides
Author Contributions
Supporting Material
References
Biophysical implications for MP1-lipid membrane interactions
We have shown a synergistic enhancement of the rate and extent of membrane permeabilization by MP1 peptides when PE and PS lipids are present in the lipid membrane. This picture is confirmed and corroborated by complementary experiments using three different model membrane systems: LUVs, GUVs, and planar-supported bilayers. We consider the perturbation of the membrane by MP1 peptides in two steps: 1) binding of the peptides to the membrane, and 2) perturbation of the bilayer structure by bound peptides to induce leakage.
Binding isotherms (Fig. 2) reveal that PS lipids cause a 7–8-fold increase in peptide bound to the membrane. This strongly outweighs the small ∼10% reduction in bound peptide concentration caused by the PE lipids. Therefore, we find that the dominant role of PS lipids’ contribution to the membrane disruption by MP1 is a large increase in peptide binding to the membrane.
The role of PE lipids in MP1-induced membrane disruption is twofold: 1) PE increases the susceptibility of the membrane to permeabilization by bound peptides, and 2) PE facilitates the formation of larger transmembrane pores. First, when the extent of GUV leakage is normalized to bound peptide concentration in the dose-response curves in Fig. 3, c and d, it can be seen that 4–5 times lower bound peptide concentration is required to induce a similar leakage response compared to comparable GUVs without PE lipids. Second, GUV and AFM experiments corroborate the effect of larger pores forming in the presence of PE. Quantitative analysis of GUV leakage profiles in Fig. 6 andTable 2 reveal that the presence of PE increases the permeability of membranes by an order of magnitude compared to membranes lacking in PE. Furthermore, once pores formed in GUVs, they quickly (within seconds) grew large enough in size to allow larger macromolecules (3 and 10 kDa) to permeate the membrane (Table 1); this compared to several tens of seconds for larger pores to form in GUVs lacking PE. Crucially, the formation of larger pores for PE-containing membranes is directly visualized by AFM (Fig. 8), where the observed pore diameters are ∼5 times larger in the presence of PE (and hence ∼20–30 times larger in average pore area, consistent with the order-of-magnitude increase in permeability reported for the GUVs).
The formation of transmembrane pores was confirmed by complementary experimental systems and techniques. Rapid translocation of membrane-impermeable leakage markers across GUV membranes, an all-or-none LUV fluorescence leakage assay, and direct visualization of transmembrane defects by AFM imaging of planar bilayers, all confirm this to be true. While these pores are fairly long lived, the membranes were sometimes observed to temporarily reseal, regaining their barrier properties. This can clearly be seen in the leakage profiles of individual GUVs in Figs. 5a, S4, and S5. GUV and planar bilayer imaging experiments also strongly suggest differences in the mechanism of pore formation depending on whether PE lipids are present. Images of GUVs that did not contain PE lipids often exhibited bright spots of increased local lipid concentrations on the membrane, which we interpret to be local aggregation of peptides and lipid (Fig. 7). Similarly, AFM images showed locally raised regions of lipid scattered across the membrane for these lipid compositions (Fig. S9) before the formation of pores (Fig. S10). This contrasted to the pore-formation mechanism observed in the presence of PE, where local aggregates were not directly observed on the GUV surface and time-resolved AFM imaging showed pore growth to occur by the stepwise micellization and loss of lipid from the edge of the pores (Fig. S8).
Besides the increased binding due to PS and the increased membrane susceptibility and pore size due to PE, the synergistic enhancement of membrane disruption facilitated by these lipids can be observed in the kinetics of initial permeabilization events. GUV experiments showed that PC/PE/PS GUVs leaked a factor-of-two quicker than other membrane compositions (Table 1). This is again corroborated by the AFM studies where defects were observed in PC/PE/PS membranes almost immediately after peptide addition, whereas perturbations of other membrane compositions took a few 10 s of minutes to evolve. The complementary pore-promoting effects of PS on bound peptide concentrations and PE on membrane susceptibility far outweigh their slight inhibitory effects on each other’s roles (PE causes a slight reduction in binding affinity (Fig. 2) and PS causes a decrease in the membrane susceptibility to bound peptide (Fig. 3, c and d)). This is apparent from the effects of MP1 on GUVs, where PC/PE/PS membranes experience the greatest membrane perturbation for any given total peptide concentration (Fig. 3, a and b) and the larger number of pores observed on the membrane surface by AFM (Fig. 8). Therefore, our combined results provide a detailed mechanistic picture of the importance of increased PS and PE lipid concentrations in synergistically enhancing the membrane’s propensity for significant disruption of its barrier properties by MP1 peptides.
Variations in lipid composition are responsible for differences in membrane properties such as charge, fluidity, lateral pressure profiles, and mechanical moduli. Changes in these fundamental membrane properties directly affect their interactions with extraneous compounds, such as antimicrobial peptides. The cationic nature of the MP1 peptide is likely an important component in the initial step of peptide action, in which the peptide recognizes the target membrane due to electrostatic interactions and binds to it in a structured form, most of the time as a helix. Therefore, the inclusion of anionic PS lipids in these membranes increases these electrostatic interactions with the MP1 peptide (net charge = +2e). However, MP1-membrane interactions cannot be solely driven by electrostatics as these peptides were also found to disrupt zwitterionic PC and PC/PE membranes, likely through secondary hydrophobic initial binding interactions that lead to a significantly lower bound concentration of peptide compared to the anionic membranes.
Next, insertion of the peptide into the bilayer likely takes place due to the hydrophobic effect, where nonpolar MP1 residues insert into the bilayer core, and defects may then be opened within the membrane structure, leading to its disruption. Furthermore, taking account of the fact that MP1 is a short peptide (14 amino acids) and hence not long enough to form a bilayer-spanning barrel stave pore (9, 32), we anticipate that these pores will be disorganized toroidal structures formed by lipids and peptides, as described by many molecular-dynamics studies (33, 34). PE is known to significantly modulate the lateral pressure profile through membranes and thereby induce negative curvature stress in the bilayer. Negative curvature stress has been shown to enhance the formation of toroidal lipid pores within a membrane by stabilizing the curvature of these structures (35). Therefore, PE would be expected to favor the formation of pore-like defects in the membrane, consistent with the increase susceptibility of these membranes to MP1-induced poration and the order-of-magnitude increase in membrane permeability that we find for PE-containing membranes upon interaction with MP1 peptides.
Jump to Section
Introduction
Materials and Methods
Materials
Peptide synthesis and purification
Mass spectrometry analysis
GUV formation
LUV preparation
CD spectroscopy for binding isotherms
Confocal microscopy
Analysis of confocal images and movies
ANTS/DPX requenching measurements
AFM
Phase contrast microscopy
Results
PS lipids significantly enhance peptide binding to the membrane
MP1 dose-response studies reveal that PE and PS lipids enhance membrane permeability at lower peptide concentrations
Confirmation of the pore-formation hypothesis in lipid vesicles
Synergistic enhancement of GUV leakage kinetics by PE and PS lipids
PE lipids significantly enhance pore size and membrane permeability
Direct imaging of peptide-induced pores by AFM
Discussion
Biophysical implications for MP1-lipid membrane interactions
Implications for the chemotherapeutic potential of MP1 peptides
Author Contributions
Supporting Material
References
Implications for the chemotherapeutic potential of MP1 peptides
The MP1 peptide has been shown to have selective inhibition against numerous cancer lines compared to healthy cells (2, 3). Such malignant cells are also known to have increased expression of PS and PE lipids on their outer plasma membrane (5, 6, 7). This study strongly correlates the enhanced tumor inhibitory effects of these peptides with this pathological change in plasma membrane lipid composition, where the upregulation of PS and PE lipids can synergistically enhance the membrane-permeabilizing activity of MP1. This membrane permeabilization is likely to be the primary mechanism of cancer cell death induced by these peptides.
This suggests that MP1 might be a candidate therapeutic for development of novel cancer therapies, or at least guide the development of novel lead compounds for treatment of these diseases. One challenge for the application of antimicrobial peptides in medicine is that they often do not show high enough selectivity to their target cells to result in a favorable therapeutic index for these compounds (36). However, MP1 does not exhibit hemolytic activity to rat erythrocytes but presents chemotaxis for polymorphonucleated leukocytes and potent antimicrobial action against Gram-positive and Gram-negative bacteria (12), suggesting it could have favorable selectivity. It may also be of interest to test MP1 in a combination therapy with other chemotherapeutics that have intracellular targets. The selectivity of the MP1 peptide to disrupt the membranes of cancer cells may act synergistically with these other drugs to significantly enhance the therapeutic potency. Therefore, the therapeutic potential of this and other membrane-active peptides within the field of oncology is worthy of further investigation.



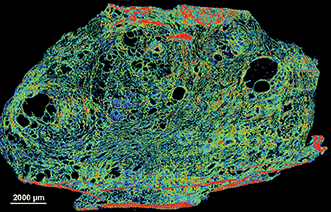
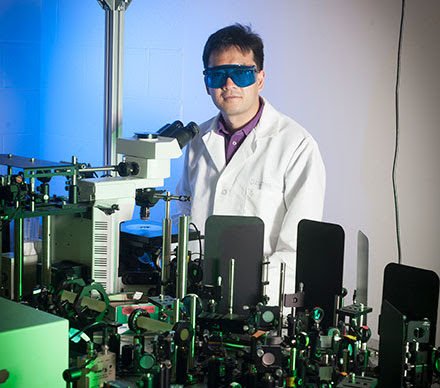
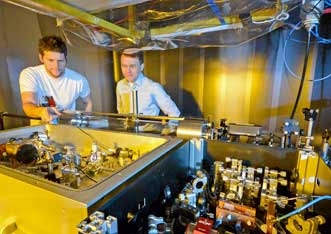


 Published: July 14, 2015 DOI:


 20% (unleaked) or
  80% (fully leaked) leakage (


 2012pharmaceutical
 sjwilliamspa