Feeds:
Posts
Comments

Archive for the ‘Hematology’ Category

Hematologic Malignancies , Table of Contents

Writer and Curator:  Larry H. Bernstein, MD, FCAP

Hematologic Malignancies 

Not excluding lymphomas [solid tumors]

The following series of articles are discussions of current identifications, classification, and treatments of leukemias, myelodysplastic syndromes and myelomas.

2.4 Hematological Malignancies

2.4.1 Ontogenesis of blood elements

Erythropoiesis

White blood cell series: myelopoiesis

Thrombocytogenesis

2.4.2 Classification of hematopoietic cancers

Primary Classification

Acute leukemias

Myelodysplastic syndromes

Acute myeloid leukemia

Acute lymphoblastic leukemia

Myeloproliferative Disorders

Chronic myeloproliferative disorders

Chronic myelogenous leukemia and related disorders

Myelofibrosis, including chronic idiopathic

Polycythemia, including polycythemia rubra vera

Thrombocytosis, including essential thrombocythemia

Chronic lymphoid leukemia and other lymphoid leukemias

Lymphomas

Non-Hodgkin Lymphoma

Hodgkin lymphoma

Lymphoproliferative disorders associated with immunodeficiency

Plasma Cell dyscrasias

Mast cell disease and Histiocytic neoplasms

Secondary Classification

Nuance – PathologyOutlines

2.4.3 Diagnostics

Computer-aided diagnostics

Back-to-Front Design

Realtime Clinical Expert Support

Regression: A richly textured method for comparison and classification of predictor variables

Converting Hematology Based Data into an Inferential Interpretation

A model for Thalassemia Screening using Hematology Measurements

Measurement of granulocyte maturation may improve the early diagnosis of the septic state.

The automated malnutrition assessment.

Molecular Diagnostics

Genomic Analysis of Hematological Malignancies

Next-generation sequencing in hematologic malignancies: what will be the dividends?

Leveraging cancer genome information in hematologic malignancies.

p53 mutations are associated with resistance to chemotherapy and short survival in hematologic malignancies

Genomic approaches to hematologic malignancies

2.4.4 Treatment of hematopoietic cancers

2.4.4.1 Treatments for leukemia by type

2.4.4..2 Acute lymphocytic leukemias

2.4..4.3 Treatment of Acute Lymphoblastic Leukemia

Acute Lymphoblastic Leukemia

Gene-Expression Patterns in Drug-Resistant Acute Lymphoblastic Leukemia Cells and Response to Treatment

Leukemias Treatment & Management

Treatments and drugs

2.4.5 Acute Myeloid Leukemia

New treatment approaches in acute myeloid leukemia: review of recent clinical studies

Novel approaches to the treatment of acute myeloid leukemia.

Current treatment of acute myeloid leukemia

Adult Acute Myeloid Leukemia Treatment (PDQ®)

2.4.6 Treatment for CML

Chronic Myelogenous Leukemia Treatment (PDQ®)

What`s new in chronic myeloid leukemia research and treatment?

4.2.7 Chronic Lymphocytic Leukemia

Chronic Lymphocytic Leukemia Treatment (PDQ®)

Results from the Phase 3 Resonate™ Trial

Typical treatment of chronic lymphocytic leukemia

4.2.8 Lymphoma treatment

4.2.8.1 Overview

4.2.8.2 Chemotherapy

………………………………..

Chapter 6

Total body irradiation (TBI)

Bone marrow (BM) transplantation

Autologous stem cell transplantation

Hematopoietic stem cell transplantation

Supportive Therapies

Blood transfusions

Erythropoietin

G-CSF (granulocyte-colony stimulating factor)

Plasma exchange (plasmapheresis)

Platelet transfusions

Steroids

Read Full Post »

Hematological Cancer Classification

Author and Curator: Larry H. Bernstein, MD, FCAP


Introduction to leukemias and lymphomas


2.4.1 Ontogenesis of the blood elements: hematopoiesis

http://www.britannica.com/EBchecked/topic/69747/blood-cell-formation

Blood cells are divided into three groups: the red blood cells (erythrocytes), the white blood cells (leukocytes), and the blood platelets (thrombocytes). The white blood cells are subdivided into three broad groups: granulocytes, lymphocytes, and monocytes.

Blood cells do not originate in the bloodstream itself but in specific blood-forming organs, notably the marrow of certain bones. In the human adult, the bone marrow produces all of the red blood cells, 60–70 percent of the white cells (i.e., the granulocytes), and all of the platelets. The lymphatic tissues, particularly the thymus, the spleen, and the lymph nodes, produce the lymphocytes (comprising 20–30 percent of the white cells). The reticuloendothelial tissues of the spleen, liver, lymph nodes, and other organs produce the monocytes (4–8 percent of the white cells). The platelets, which are small cellular fragments rather than complete cells, are formed from bits of the cytoplasm of the giant cells (megakaryocytes) of the bone marrow.

In the human embryo, the first site of blood formation is the yolk sac. Later in embryonic life, the liver becomes the most important red blood cell-forming organ, but it is soon succeeded by the bone marrow, which in adult life is the only source of both red blood cells and the granulocytes. Both the red and white blood cells arise through a series of complex, gradual, and successive transformations from primitive stem cells, which have the ability to form any of the precursors of a blood cell. Precursor cells are stem cells that have developed to the stage where they are committed to forming a particular kind of new blood cell.

In a normal adult the red cells of about half a liter (almost one pint) of blood are produced by the bone marrow every week. Almost 1 percent of the body’s red cells are generated each day, and the balance between red cell production and the removal of aging red cells from the circulation is precisely maintained.

Cells-in-the-Bone-Marrow-1024x747

http://interactive-biology.com/wp-content/uploads/2012/07/Cells-in-the-Bone-Marrow-1024×747.png

Erythropoiesis

http://www.interactive-biology.com/3969/erythropoiesis-formation-of-red-blood-cells/

Erythropoiesis – Formation of Red Blood Cells

Because of the inability of erythrocytes (red blood cells) to divide to replenish their own numbers, the old ruptured cells must be replaced by totally new cells. They meet their demise because they don’t have the usual specialized intracellular machinery, which controls cell growth and repair, leading to a short life span of 120 days.

This short life span necessitates the process erythropoiesis, which is the formation of red blood cells. All blood cells are formed in the bone marrow. This is the erythrocyte factory, which is soft, highly cellar tissue that fills the internal cavities of bones.

Erythrocyte differentiation takes place in 8 stages. It is the pathway through which an erythrocyte matures from a hemocytoblast into a full-blown erythrocyte. The first seven all take place within the bone marrow. After stage 7 the cell is then released into the bloodstream as a reticulocyte, where it then matures 1-2 days later into an erythrocyte. The stages are as follows:

  1. Hemocytoblast, which is a pluripotent hematopoietic stem cell
  2. Common myeloid progenitor, a multipotent stem cell
  3. Unipotent stem cell
  4. Pronormoblast
  5. Basophilic normoblast also called an erythroblast.
  6. Polychromatophilic normoblast
  7. Orthochromatic normoblast
  8. Reticulocyte

These characteristics can be seen during the course of erythrocyte maturation:

  • The size of the cell decreases
  • The cytoplasm volume increases
  • Initially there is a nucleus and as the cell matures the size of the nucleus decreases until it vanishes with the condensation of the chromatin material.

Low oxygen tension stimulates the kidneys to secrete the hormone erythropoietin into the blood, and this hormone stimulates the bone marrow to produce erythrocytes.

Rarely, a malignancy or cancer of erythropoiesis occurs. It is referred to as erythroleukemia. This most likely arises from a common myeloid precursor, and it may occur associated with a myelodysplastic syndrome.

Summary of erythrocyte maturation

White blood cell series: myelopoiesis

http://www.nlm.nih.gov/medlineplus/ency/presentations/100151_3.htm

http://www.nlm.nih.gov/medlineplus/ency/images/ency/fullsize/15220.jpg

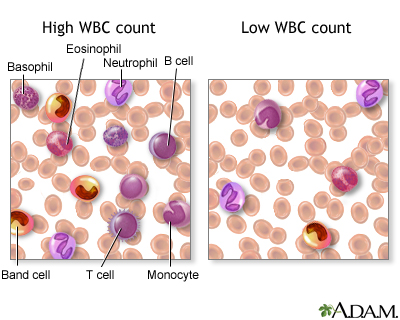
There are various types of white blood cells (WBCs) that normally appear in the blood: neutrophils (polymorphonuclear leukocytes; PMNs), band cells (slightly immature neutrophils), T-type lymphocytes (T cells), B-type lymphocytes (B cells), monocytes, eosinophils, and basophils. T and B-type lymphocytes are indistinguishable from each other in a normal slide preparation. Any infection or acute stress will result in an increased production of WBCs. This usually entails increased numbers of cells and an increase in the percentage of immature cells (mainly band cells) in the blood. This change is referred to as a “shift to the left” People who have had a splenectomy have a persistent mild elevation of WBCs. Drugs that may increase WBC counts include epinephrine, allopurinol, aspirin, chloroform, heparin, quinine, corticosteroids, and triamterene. Drugs that may decrease WBC counts include antibiotics, anticonvulsants, antihistamine, antithyroid drugs, arsenicals, barbiturates, chemotherapeutic agents, diuretics and sulfonamides.   (Updated by: David C. Dugdale, III, MD)

https://www.med-ed.virginia.edu/courses/path/innes/nh/wcbmaturation.cfm

Note that the mature forms of the myeloid series (neutrophils, eosinophils, basophils), all have lobed (segmented) nuclei. The degree of lobation increases as the cells mature.

The earliest recognizable myeloid cell is the myeloblast (10-20m dia) with a large round to oval nucleus. There is fine diffuse immature chromatin (without clumping) and a prominant nucleolus.

The cytoplasm is basophilic without granules. Although one may see a small golgi area adjacent to the nucleus, granules are not usually visible by light microscopy. One should not see blast cells in the peripheral blood.

myeloblast x100b

https://www.med-ed.virginia.edu/courses/path/innes/images/nhjpeg/nh%20myeloblast%20x100b.jpeg

The promyelocyte (10-20m) is slightly larger than a blast. Its nucleus, although similar to a myeloblast shows slight chromatin condensation and less prominent nucleoli. The cytoplasm contains striking azurophilic granules or primary granules. These granules contain myeloperoxidase, acid phosphatase, and esterase enzymes. Normally no promyelocytes are seen in the peripheral blood.

At the point in development when secondary granules can be recognized, the cell becomes a myelocyte.

promyelocyte x100

https://www.med-ed.virginia.edu/courses/path/innes/images/nhjpeg/nh%20promyelocyte%20×100%20a.jpeg

Myelocytes (10-18m) are not normally found in the peripheral blood. Nucleoli may not be seen in the late myelocyte. Primary azurophilic granules are still present, but secondary granules predominate. Secondary granules (neut, eos, or baso) first appear adjacent to the nucleus. In neutrophils this is the “dawn” of neutrophilia.

Metamyelocytes (10-18m) have kidney shaped indented nuclei and dense chromatin along the nuclear membrane. The cytoplasm is faintly pink, and they have secondary granules (neutro, eos, or baso). Zero to one percent of the peripheral blood white cells may be metamyelocytes (juveniles).

metamyelocyte x100

https://www.med-ed.virginia.edu/courses/path/innes/images/nhjpeg/nh%20metamyelocyte%20×100.jpeg

Bands, slightly smaller than juveniles, are marked by a U-shaped or deeply indented nucleus.

band neutrophilx100a

https://www.med-ed.virginia.edu/courses/path/innes/images/nhjpeg/nh%20band%20x100a.jpeg

Segmented (segs) or polymorphonuclear (PMN) leukocytes (average 14 m dia) are distinguished by definite lobation with thin thread-like filaments of chromatin joining the 2-5 lobes. 45-75% of the peripheral blood white cells are segmented neutrophils.

https://www.med-ed.virginia.edu/courses/path/innes/images/nhjpeg/nh%20neutrophil%20×100%20d.jpeg

Thrombocytogenesis

The incredible journey: From megakaryocyte development to platelet formation

Kellie R. Machlus1,2 and Joseph E. Italiano Jr
JCB 2013; 201(6): 785-796
http://dx.doi.org:/10.1083/jcb.201304054

Large progenitor cells in the bone marrow called megakaryocytes (MKs) are the source of platelets. MKs release platelets through a series of fascinating cell biological events. During maturation, they become polyploid and accumulate massive amounts of protein and membrane. Then, in a cytoskeletal-driven process, they extend long branching processes, designated proplatelets, into sinusoidal blood vessels where they undergo fission to release platelets.

megakaryocyte production of platelets

http://dm5migu4zj3pb.cloudfront.net/manuscripts/26000/26891/medium/JCI0526891.f4.jpg

platelets and the immune continuum nri2956-f3

http://www.nature.com/nri/journal/v11/n4/images/nri2956-f3.jpg

2.4.2 Classification of hematological malignancies
Practical Diagnosis of Hematologic Disoreders. 4th edition. Vol 2.
Kjeldsberg CR, Ed.  ASCP Press.  2006. Chicago, IL.

2.4.2.1 Primary Classification

Acute leukemias

Myelodysplastic syndromes

Acute myeloid leukemia

Acute lymphoblastic leukemia

Myeloproliferative Disorders

Chronic myeloproliferative disorders

Chronic myelogenous leukemia and related disorders

Myelofibrosis, including chronic idiopathic

Polycythemia, including polycythemia rubra vera

Thrombocytosis, including essential thrombocythemia

Chronic lymphoid leukemia and other lymphoid leukemias

Lymphomas

Non-Hodgkin Lymphoma

Hodgkin lymphoma

Lymphoproliferative disorders associated with immunodeficiency

Plasma Cell dyscrasias

Mast cell disease and Histiocytic neoplasms

2.4.2.2 Secondary Classification

2.4.2.3 Nuance – PathologyOutlines
Nat Pernick, Ed.

Leukemia – Acute

Primary references acute leukemia-general AML general AML classification transient abnormal myelopoiesis

Recurrent genetic abnormalities: AML with t(6;9) AML with t(8;21) AML with 11q23 abnormalities AML with inv(16) or t(16;16) AML with Down syndrome AML with FLT3 mutations AML with myelodysplastic related changes AML therapy related APL microgranular variant APL with t(15;17) APL with t(V;17) APL therapy related

AML not otherwise categorized: minimally differentiated (M0) without maturation (M1) with maturation (M2) M3 myelomonocytic monoblastic and monocytic erythroid megakaryoblastic CD13/CD33 negative basophilic myeloid sarcoma acute panmyelosis with myelofibrosis with Philadelphia chromosome with pseudo Chediak-Higashi anomaly hypocellular

ALL: general WHO classification with eosinophilia

PreB ALL: general t(9;22) t(v;11q23) t(1;19) t(5;14) t(12;21) hyperdiploidy hypodiploidy mature B ALL/Burkitt

Other ALL: T ALL ambiguous lineage mixed phenotype

AML and related malignancies

Acute myeloid leukemias with recurrent genetic abnormalities:

  • AML with t(8;21)(q22;q22); RUNX1-RUNX1T1
  • AML with inv(16)(p13.1;q22) or t(16;16)(p13.1;q22); CBF&beta-MYH11
  • Acute promyelocytic leukemia with t(15;17)(q22;q12); PML/RAR&alpha and variants
  • AML with t(9;11)(p22;q23); MLLT3-MLL
  • AML with t(6;9)(p23;q34); DEK-NUP214
  • AML with inv(3)(q21q26.2) or t(3;3)(q21;q26.2); RPN1-EVI1
  • AML (megakaryoblastic) with t(1;22)(p13;q13); RBM15-MKL1
  • AML with mutated NPM1*
  • AML with mutated CEBPA*

* provisional

Acute myeloid leukemia with myelodysplasia related changes

Therapy related acute myeloid leukemia

  • Alkylating agent related
  • Topoisomerase II inhibitor related (some maybe lymphoid)

Acute myeloid leukemia not otherwise categorized:

  • AML minimally differentiated (M0)
  • AML without maturation (M1)
  • AML with maturation (M2)
  • Acute myelomonocytic leukemia (M4)
  • Acute monoblastic and monocytic leukemia (M5a, M5b)
  • Acute erythroid leukemia (M6)
  • Acute megakaryoblastic leukemia (M7)
  • Acute basophilic leukemia
  • Acute panmyelosis with myelofibrosis

Myeloid Sarcoma

Myeloid proliferations related to Down syndrome:

  • Transient abnormal myelopoeisis
  • Myeloid leukemia associated with Down syndrome

Blastic plasmacytoid dentritic cell neoplasm:

Acute leukemia of ambiguous lineage:

  • Acute undifferentiated leukemia
  • Mixed phenotype acute leukemia with t(9;22)(q34;q11.2); BCR-ABL1
  • Mixed phenotype acute leukemia with t(v;11q23); MLL rearranged
  • Mixed phenotype acute leukemia, B/myeloid, NOS
  • Mixed phenotype acute leukemia, T/myeloid, NOS
  • Mixed phenotype acute leukemia, NOS, rare types
  • Other acute leukemia of ambiguous lineage
  • References: WHO Classification of Tumours of Haematopoietic and Lymphoid Tissue (IARC, 2008), Discovery Medicine 2010, eMedicine

Acute lymphocytic leukemia

General
=================================================================

  • WHO classification system includes former FAB classifications ALL-L1 and L2
    ● FAB L3 is now considered Burkitt lymphoma

WHO classification of acute lymphoblastic leukemia
=================================================================

Precursor B lymphoblastic leukemia / lymphoblastic lymphoma:
● ALL with t(9;22)(q34;q11.2); BCR-ABL (Philadelphia chromosome)
● ALL with t(v;11q23) (MLL rearranged)
● ALL with t(1;19)(q23;p13.3); TCF3-PBX1 (E2A-PBX1)
● ALL with t(12;21)(p13;q22); ETV6-RUNX1 (TEL-AML1)
● Hyperdiploid > 50
● Hypodiploid
● t(5;14)(q31;q32); IL3-IGH

Precursor T lymphoblastic leukemia / lymphoma

Additional references
=================================================================

Mixed phenotype acute leukemia (MPAL)

General
=================================================================

  • De novo acute leukemia containing separate populations of blasts of more than one lineage (bilineal or bilineage), or a single population of blasts co-expressing antigens of more than one lineage (biphenotypic)Excludes:
    ● Acute myeloid leukemia (AML) with recurrent translocations t(8;21), t(15;17) or inv(16)
    ● Leukemias with FGFR1 mutations
    ● Chronic myelogenous leukemia (CML) in blast crisis
    ● Myelodysplastic syndrome (MDS)-related AML and therapy-related AML, even if they have MPAL immunophenotypeCriteria for biphenotypic leukemia:
    ● Score of 2 or more for each of two separate lineages:The European Group for the Immunological Classification of Leukemias (EGIL) scoring system2008 WHO classification of acute leukemias of ambiguous lineage 

Prognosis
=================================================================

  • Poor, overall survival of 18 months
    ● Young age, normal karyotype and ALL induction therapy are associated with favorable survival
    ● Ph+ is a predictor for poor prognosis
    ● Bone marrow transplantation should be considered in first remission

Major Categories

MPAL with t(9;22)(q34;q11.2); BCR-ABL1
=================================================================

  • 20% of all MPAL
    ● Blasts with t(9;22)(q34;q11.2) translocation or BCR-ABL1 rearrangement (Ph+) without history of CML
    ● Majority in adults
    ● High WBC counts● Most of the cases B/myeloid phenotype
    ● Rare T/myeloid, B and T lineage, or trilineage leukemiasMorphology:
    ● Many cases show a dimorphic blast population, one resembling myeloblasts and the other lymphoblastsCytogenetic abnormalities:
    ● Conventional karyotyping for t(9;22), FISH or PCR for BCR-ABL1 translocation
    ● Additional complex karyotypes
    ● Ph+ is a poor prognostic factor for MPAL, with a reported median survival of 8 months
    ● Worse than patients of all other types of MPAL

MPAL with t(v;11q23); MLL rearranged
=================================================================

  • Meeting the diagnostic criteria for MPAL with blasts bearing a translocation involving the 11q23 breakpoint (MLL gene)
    ● MPAL with MLL rearranged rare
    ● More often seen in children and relatively common in infancy
    ● High WBC counts
    ● Poor prognosis
    ● Dimorphic blast population, with one resembling monoblasts and the other resembling lymphoblasts
    ● Lymphoblast population often shows a CD19+, CD10- B precursor immunophenotype, frequently CD15+
    ● Expression of other B markers usually weak
    ● Translocations involving MLL gene include t(4;11)(q21;q23), t(11;19)(q23;p13), and t(9;11)(p22;q23)
    ● Cases with chromosome 11q23 deletion should not be classified in this category

B cell acute lymphoblastic leukemia (ALL) / lymphoblastic lymphoma (LBL)

General

=================================================================

  • Current 2008 WHO classification: B lymphoblastic leukemia / lymphoma, NOS or B lymphoblastic leukemia / lymphoma with recurrent genetic abnormalities
  • See also lymphomas: B cell chapter
  • Also called B cell acute lymphoblastic leukemia / lymphoblastic lymphoma, pre B ALL / LBL
  • Usually children
  • B acute lymphoblastic leukemia presents with pancytopenia due to extensive marrow involvement, stormy onset of symptoms, bone pain due to marrow expansion, hepatosplenomegaly due to neoplastic infiltration, CNS symptoms due to meningeal spread and testicular involvement
  • B acute lymphoblastic lymphoma often presents with cutaneous nodules, bone or nodal involvement, < 25% lymphoblasts in bone marrow and peripheral blood; aleukemic cases are usually asymptomatic
  • Depending on specific leukemia, arises in either hematopoietic stem cell or B-cell progenitor
  • Tumors are derived from pre-germinal center naive B cells with unmutated VH region genes
  • Have multiple immunophenotyping aberrancies relative to normal B cell precursors (hematogones); at relapse, 73% show loss of 1+ aberrance and 60% show new aberrancies (Am J Clin Pathol 2007;127:39)

Prognostic features

=================================================================

  • Favorable prognosis: age 1-10 years, female, white; preB phenotype, hyperdiploidy>50, t(12,21), WBC count at presentation <50×108/L, non-traumatic tap with no blasts in CNS, rapid response to chemotherapy < 5% blasts on morphology on day 15, remission status after induction <5% blasts on morphology and <0.01% blast on flow or PCR, CD10+
  • Intermediate prognosis: hyperdiploidy 47-50, diploid, 6q- and rearrangements of 8q24
  • Unfavorable prognosis: under age 1 (usually have 11q23 translocations) or over age 10; t(9;22) (but not if age 59+ years, Am J Clin Pathol 2002;117:716); male, > 50×108/L WBC at presentation, hypodiploidy, near tetraploidy, 17p- and MLL rearrangements t(v;11q23); CD10-; non-traumatic tap with > 5% blasts or traumatic tap (7%); also increased microvessel staining using CD105 in children (Leuk Res 2007;31:1741), MDR1 expression in children (Oncol Rep 2004;12:1201) and adults (Blood 2002;100:974), 25%+ blasts on morphology on day 15, remission status after induction ≥ 5% blasts on morphology and ≥ 0.1% blasts on flow or PCR

Case reports

=================================================================

  • 12 month old girl and 13 month old boy with mature phenotype but no translocations (Arch Pathol Lab Med 2003;127:1340)
  • 56 year old man with ALL arising from follicular lymphoma (Arch Pathol Lab Med 2002;126:997)
  • 76 year old man with basal cell carcinoma (Diagn Pathol 2007;2:32)
  • With hemophagocytic lymphohistiocytosis (Pediatr Blood Cancer 2008;50:381)

Treatment

================================================================

  • Chemotherapy cures more children than adults; adolescents benefit from intensive regimens (Hematology Am Soc Hematol Educ Program 2005:123)

Micro description

=================================================================

  • Bone marrow smears: small to intermediate blast-like cells with scant, variably basophilic cytoplasm, round / oval or convoluted nuclei, fine chromatin and indistinct nucleoli; frequent mitotic figures; may have “starry sky” appearance similar to Burkitt lymphoma; may have large lymphoblasts with 1-4 prominent nucleoli resembling myeloblasts; usually no sclerosis
  • Bone marrow biopsy: usually markedly hypercellular with reduction of trilinear maturation; cells have minimal cytoplasm, medium sized nuclei that are often convoluted, moderately dense chromatin and indistinct nucleoli, brisk mitotic activity
  • Other tissues: may have “starry sky” appearance similar to Burkitt lymphoma; collagen dissection, periadipocyte growth pattern and single cell linear filing

Chronic Leukemia

Chronic Myeloid Neoplasms

Myelodysplastic syndromes (MDS): general, WHO classification, childhood, refractory anemia, refractory anemia with ringed sideroblasts, refractory cytopenia with multilineage dysplasia, refractory anemia with excess blasts, 5q-syndrome, therapy related, unclassified, arsenic toxicity

Myeloproliferative neoplasms (MPN): general, WHO classification, chronic eosinophilic leukemia, chronic myelogenous leukemia, chronic neutrophilic leukemia, essential thrombocythemia, hypereosinophilic syndrome, mast cell disease, polycythemia vera, primary myelofibrosis, unclassifiable

MDS/MPN: general, WHO classification, atypical CML, chronic myelomonocytic leukemia (CMML), chronic myelomonocytic leukemia with eosinophilia, juvenile myelomonocytic leukemia, unclassifiable

Myeloid neoplasms associated with eosinophilia and abnormalities of PDGFRA, PDGFRB, or FGFR1: PDGFRA, PDGFRB, FGFR1

Miscellaneous: transient myeloproliferative disorder of Downís syndrome

Lymphoma and plasma cell neoplasms

Lymph nodes: normal development-general B cells T cells NK cells normal histology grossing lymph nodes features to report

Molecular testing: theory FISH northern blot PCR southern blot

Non-Hodgkin lymphoma: general cytogenetics staging staging-pediatric morphologic clues hemophagocytic syndrome chemotherapeutic atypia

B cell disorders: general post-rituximab bone marrow biopsy classification-historical WHO classification

B cell lymphoma subtypes: age-related EBV-associated ALK positive large cell Burkitt unclassifiable-intermediate between Burkitt and diffuse large B cell lymphoma CLL
diffuse large B cell: 
diffuse-NOS CD5+ T cell / histiocyte rich primary cutaneous-general primary cutaneous-leg primary sites-other
follicular: 
general childhood cutaneous GI
hairy cell leukemia HCL variant intravascular large B cell lymphomatoid granulomatosis lymphoplasmacytic mantle cell-classic mantle cell-blastoid marginal zone-general marginal zone-MALT MALT-primary sites marginal zone-nodal mediastinal (thymic) plasmablastic pre B lymphoblastic leukemia/lymphoma primary effusion prolymphocytic leukemia pyothorax associated SLL splenic marginal zone splenic lymphoma with villous lymphocytes

Plasma cell neoplasms: general myeloma plasmacytoma heavy chain disease primary amyloidosis MGUS Osteosclerotic myeloma (POEMS) cryoglobulinemia

T/NK cell disorders: general WHO classification adult T cell aggressive NK cell leukemia anaplastic large cell ALK+ ALK- angioimmunoblastic T cell blastic plasmacytoid chronic lymphoproliferative disorders of NK cells cutaneous CD4+ small/medium sized T cell lymphoma cutaneous CD30 positive T cell lymphoproliferative disorders cutaneous gamma delta T cell lymphoma enteropathy epidermotropic CD8+ T cell lymphoma hepatosplenic indolent T cell proliferations mycosis fungoides NK/T cell lymphoma-nasal type nodal CD8+ cytotoxic T cell nonB nonT lymphoblastic peripheral T cell lymphoma, NOS primary effusion lymphoma Sezary syndrome staging subcutaneous panniculitis-like T cell large granular lymphocytic leukemia T cell lymphoblastic leukemia/lymphoma T cell prolymphocytic leukemia

Hodgkin lymphoma: general/staging classic lymphocyte depleted lymphocyte rich classical mixed cellularity nodular lymphocyte predominant nodular sclerosis

Post-transplantation: general WHO classification plasmacytic hyperplasia/IM-like lesions polymorphic B cell lymphoproliferative disorders monomorphic B cell lymphoproliferative disorders other graft versus host disease

Other: AIDS associated-general AIDS associated-examples EBV+ T cell lymphoproliferative disorders of childhood primary immune disorders related

Myeloproliferative neoplasms (MPN)

WHO 2008 – Myeloproliferative neoplasms (MPN) 

General
=================================================================

  • Chronic myelogenous leukemia
    ● Polycythemia vera
    ● Essential thrombocythemia
    ● Primary myelofibrosis
    ● Chronic neutrophilic leukemia
    ● Chronic eosinophilic leukemia, not otherwise categorized
    ● Mast cell disease
    ● MPNs, unclassifiable

WHO 2001 – Chronic myeloproliferative diseases 

Definition
=================================================================

  • Chronic myelogenous leukemia (Philadelphia chromosome, t(9;22)(q34;q11), BCR-ABL positive)
    ● Chronic neutrophilic leukemia
    ● Chronic eosinophilic leukemia (and the hypereosinophilic syndrome)
    ● Polycythemia vera
    ● Chronic idiopathic myelofibrosis (with extramedullary hematopoiesis)
    ● Essential thrombocythemia
    ● Chronic myeloproliferative disease, unclassifiable

Additional references
=================================================================

The World Health Organization (WHO) classification of the myeloid neoplasms  James W. Vardiman, Nancy Lee Harris, and Richard D. Brunning
Blood 2002; 100(7)  http://dx.doi.org/10.1182/blood-2002-04-1199

Lymphoma – Non B cell neoplasms

T/NK cell disorders/WHO classification (2008)

Principles of classification
=================================================================

  • Based on all available information (morphology, immunophenotype, genetics, clinical)
    ● No one antigenic marker is specific for any neoplasm (except ALK1)
    ● Immune profiling less helpful in subclassification of T cell lymphomas then B cell lymphomas
    ● Certain antigens commonly associated with specific disease entities but not entirely disease specific
    ● CD30: common in anaplastic large cell lymphoma but also classic Hodgkin lymphoma and other B and T cell lymphomas
    ● CD56: characteristic for nasal NK/T cell lymphoma, but also other T cell neoplasms and plasma cell disorders
    ● Variation of immunophenotype within a given disease (hepatosplenic T cell lymphoma: usually γδ but some are αβ)
    ● Recurrent genetic alterations have been identified for many B cell lymphomas but not for most T cell lymphomas
    ● No attempt to stratify lymphoid malignancies by grade
    ● Recognize the existence of grey zone lymphomas
    ● This multiparameter approach has been validated in international studies as highly reproducible

WHO 2008 classification of tumors of hematopoietic and lymphoid tissues (T/NK)
=================================================================

Precursor T-lymphoid neoplasms
● T lymphoblastic leukemia/lymphoma, 9837/3

Mature T cell and NK cell neoplasms
● T cell prolymphocytic leukemia, 9834/3
● T cell large granular lymphocytic leukemia, 9831/3
● Chronic lymphoproliferative disorder of NK cells, 9831/3
● Aggressive NK cell leukemia, 9948/3
● Systemic EBV-positive T cell lymphoproliferative disease of childhood, 9724/3
● Hydroa vacciniforme-like lymphoma, 9725/3
● Adult T cell leukemia/lymphoma, 9827/3
● Extranodal NK/T cell lymphoma, nasal type, 9719/3
● Enteropathy-associated T cell lymphoma, 9717/3
● Hepatosplenic T cell lymphoma, 9716/3
● Subcutaneous panniculitis-like T cell lymphoma, 9708/3
● Mycosis fungoides, 9700/3
● Sézary syndrome, 9701/3
● Primary cutaneous CD30-positive T cell lymphoproliferative disorders
● Lymphomatoid papulosis, 9718/1
● Primary cutaneous anaplastic large cell lymphoma, 9718/3
● Primary cutaneous gamma-delta T cell lymphoma, 9726/3
● Primary cutaneous CD8-positive aggressive epidermotropic cytotoxic T cell lymphoma, 9709/3
● Primary cutaneous CD4-positive small/medium T cell lymphoma, 9709/3
● Peripheral T cell lymphoma, NOS, 9702/3
● Angioimmunoblastic T cell lymphoma, 9705/3
● Anaplastic large cell lymphoma, ALK-positive, 9714/3
● Anaplastic large cell lymphoma, ALK-negative, 9702/3

Chronic Lymphocytic Leukemia

Chronic Lymphocytic Leukemia Staging
Author: Sandy D Kotiah, MD; Chief Editor: Jules E Harris, MD
Medscape Sep 6, 2013
http://emedicine.medscape.com/article/2006578-overview

General considerations in the staging of chronic lymphocytic leukemia (CLL) and the revised Rai (United States) and Binet (Europe) staging systems for CLL are provided below.[1, 2, 3]

See Chronic Leukemias: 4 Cancers to Differentiate, a Critical Images slideshow, to help detect chronic leukemias and determine the specific type present.

General considerations

  • CLL and small lymphocytic lymphoma (SLL) are different manifestations of the same disease; SLL is diagnosed when the disease is mainly nodal, and CLL is diagnosed when the disease is seen in the blood and bone marrow
  • CLL is diagnosed by > 5000 monoclonal lymphocytes/mm3 for longer than 3mo; the bone marrow usually has more than 30% monoclonal lymphocytes and is either normocellular or hypercellular
  • Monoclonal B lymphocytosis is a precursor form of CLL that is defined by a monoclonal B cell lymphocytosis < 5000 monoclonal lymphocytes/mm3; all lymph nodes smaller than 1.5 cm; no anemia; and no thrombocytopenia

Revised Rai staging system (United States)

Low risk (formerly stage 0)[1] :

  • Lymphocytosis, lymphocytes in blood > 15000/mcL, and > 40% lymphocytes in the bone marrow

Intermediate risk (formerly stages I and II):

  • Lymphocytosis as in low risk with enlarged node(s) in any site, or splenomegaly or hepatomegaly or both

High risk (formerly stages III and IV):

  • Lymphocytosis as in low risk and intermediate risk with disease-related anemia (hemoglobin level < 11.0 g/dL or hematocrit < 33%) or platelets < 100,000/mcL

Binet staging system (Europe)

Stage A:

  • Hemoglobin ≥ 10 g/dL, platelets ≥ 100,000/mm3, and < 3 enlarged areas

Stage B:

  • Hemoglobin ≥ 10 g/dL, platelets ≥ 100,000/mm3, and ≥ 3 enlarged areas

Stage C:

  • Hemoglobin < 10 g/dL, platelets < 100,000/mm3, and any number of enlarged areas

Read Full Post »

Difference Between Hypoxia and Ischemia

Reporter: Aviva Lev-Ari, PhD, RN


Key Difference – Hypoxia vs Ischemia   Hypoxia and Ischemia are both diseases caused due to the insufficiency of oxygen supply in the body, but there is a difference between hypoxia and ischemia. T…

Sourced through Scoop.it from: www.differencebetween.com

See on Scoop.it – Cardiovascular and vascular imaging

Read Full Post »

Allogeneic Stem Cell Transplantation

Writer and Curator: Larry H. Bernstein, MD, FCAP

This article has the following structure:

9.3.1  Cell based immunotherapy

9.3.2  Photodynamic therapy (PDT)

9.3.3  Small molecules targeted therapy drugs; Tyrosine kinase inhibitors; imatinib (Gleevec/Glivec) and gefitinib (Iressa).

9.3.4 Graft versus Host Disease

9.3.5 Aspergillus Complicating Allogeneic Transplantation

Introduction

9.3.1 Allogeneic Stem Cell Treatment

http://www.lls.org/treatment/types-of-treatment/stem-cell-transplantation/allogeneic-stem-cell-transplantation

Allogeneic stem cell transplantation involves transferring the stem cells from a healthy person (the donor) to your body after high-intensity chemotherapy or radiation.

Allogeneic stem cell transplantation is used to cure some patients who:

  • Are at high risk of relapse
  • Don’t respond fully to treatment
  • Relapse after prior successful treatment

Allogeneic stem cell transplantation can be a high-risk procedure. The high-conditioning regimens are meant to severely or completely impair your ability to make stem cells and you will likely experience side effects during the days you receive high-dose conditioning radiation or chemotherapy. The goals of high-conditioning therapy are to:

treat the remaining cancer cells intensively, thereby making a cancer recurrence less likely
inactivate the immune system to reduce the chance of stem cell graft rejection
enable donor cells to travel to the marrow (engraftment), produce blood cells and bring about graft versus tumor effect

Possible Adverse Effects

The immune system and the blood system are closely linked and can’t be separated from each other. Because of this, allogeneic transplantation means that not only the donor’s blood system but also his or her immune system is transferred. As a result, these adverse effects are possible:

  • Immune rejection of the donated stem cells by the recipient (host-versus-graft effect)
  • Immune reaction by the donor cells against the recipient’s tissues (graft-versus-host disease [GVHD])

The immune reaction, or GVHD, is treated by administering drugs to the patient after the transplant that reduce the ability of the donated immune cells to attack and injure the patient’s tissues. See Graft Versus Host Disease.

Allogeneic stem cell transplants for patients who are older or have overall poor health are relatively uncommon. This is because the pre-transplant conditioning therapy is generally not well tolerated by such patients, especially those with poorly functioning internal organs. However, reduced intensity allogeneic stem cell transplants may be an appropriate treatment for some older or sicker patients.

T-Lymphocyte Depletion

One goal of allogeneic stem cell transplant is to cause the T lymphocytes in the donor’s blood or marrow to take hold (engraft) and grow in the patient’s marrow. Sometimes the T lymphocytes attack the cancer cells. When this happens, it’s called graft versus tumor (GVT) effect (also called graft versus cancer effect). The attack makes it less likely that the disease will return. This effect is more common in myeloid leukemias than it is in other blood cancers.

Unfortunately, T lymphocytes are the same cells that cause graft versus host disease (GVHD). Because of this serious and sometimes life-threatening side effect, doctors in certain cases want to decrease the number of T lymphocytes to be infused with the stem cells. This procedure, called T-lymphocyte depletion, is currently being studied by researchers. The technique involves treating the stem cells collected for transplant with agents that reduce the number of T lymphocytes.

The aim of T-lymphocyte depletion is to lessen GVHD’s incidence and severity. However, it can also cause increased rates of graft rejection, a decreased GVT effect and a slower immune recovery. Doctors must be careful about the number of T lymphocytes removed when using this technique.

Stem Cell Selection

Stem cell selection is another technique being studied in clinical trials that can reduce the number of T lymphocytes that a patient receives. Because of specific features on the outer coat of stem cells, doctors can selectively remove stem cells from a cell mixture. This technique produces a large number of stem cells and fewer other cells, including T lymphocytes.

9.3.2 Defining Characteristics of  Stem Cells

http://stemcells.nih.gov/info/basics/pages/basics1.aspx

Stem cells have the remarkable potential to develop into many different cell types in the body during early life and growth. In addition, in many tissues they serve as a sort of internal repair system, dividing essentially without limit to replenish other cells as long as the person or animal is still alive. When a stem cell divides, each new cell has the potential either to remain a stem cell or become another type of cell with a more specialized function, such as a muscle cell, a red blood cell, or a brain cell.

Stem cells are distinguished from other cell types by two important characteristics. First, they are unspecialized cells capable of renewing themselves through cell division, sometimes after long periods of inactivity. Second, under certain physiologic or experimental conditions, they can be induced to become tissue- or organ-specific cells with special functions. In some organs, such as the gut and bone marrow, stem cells regularly divide to repair and replace worn out or damaged tissues. In other organs, however, such as the pancreas and the heart, stem cells only divide under special conditions.

Until recently, scientists primarily worked with two kinds of stem cells from animals and humans: embryonic stem cells and non-embryonic “somatic” or “adult” stem cells. The functions and characteristics of these cells will be explained in this document. Scientists discovered ways to derive embryonic stem cells from early mouse embryos more than 30 years ago, in 1981. The detailed study of the biology of mouse stem cells led to the discovery, in 1998, of a method to derive stem cells from human embryos and grow the cells in the laboratory. These cells are called human embryonic stem cells. The embryos used in these studies were created for reproductive purposes through in vitro fertilization procedures.

When they were no longer needed for that purpose, they were donated for research with the informed consent of the donor. In 2006, researchers made another breakthrough by identifying conditions that would allow some specialized adult cells to be “reprogrammed” genetically to assume a stem cell-like state. This new type of stem cell is called induced pluripotent stem cells (iPSCs).

Stem cells differ from other kinds of cells in the body. All stem cells—regardless of their source—have three general properties: they are capable of dividing and renewing themselves for long periods; they are unspecialized; and they can give rise to specialized cell types.

Stem cells are capable of dividing and renewing themselves for long periods. Unlike muscle cells, blood cells, or nerve cells—which do not normally replicate themselves—stem cells may replicate many times, or proliferate. A starting population of stem cells that proliferates for many months in the laboratory can yield millions of cells. If the resulting cells continue to be unspecialized, like the parent stem cells, the cells are said to be capable of long-term self-renewal.

Scientists are trying to understand two fundamental properties of stem cells that relate to their long-term self-renewal:

  1. Why can embryonic stem cells proliferate for a year or more in the laboratory without differentiating, but most adult stem cells cannot; and
  2. What are the factors in living organisms that normally regulate stem cell proliferation and self-renewal?

Discovering the answers to these questions may make it possible to understand how cell proliferation is regulated during normal embryonic development or during the abnormal cell division that leads to cancer.

Stem cells are unspecialized. One of the fundamental properties of a stem cell is that it does not have any tissue-specific structures that allow it to perform specialized functions. For example, a stem cell cannot work with its neighbors to pump blood through the body (like a heart muscle cell), and it cannot carry oxygen molecules through the bloodstream (like a red blood cell). However, unspecialized stem cells can give rise to specialized cells, including heart muscle cells, blood cells, or nerve cells.

Stem cells can give rise to specialized cells. When unspecialized stem cells give rise to specialized cells, the process is called differentiation. While differentiating, the cell usually goes through several stages, becoming more specialized at each step. Scientists are just beginning to understand the signals inside and outside cells that trigger each step of the differentiation process. The internal signals are controlled by a cell’s genes, which are interspersed across long strands of DNA and carry coded instructions for all cellular structures and functions. The external signals for cell differentiation include chemicals secreted by other cells, physical contact with neighboring cells, and certain molecules in the microenvironment. The interaction of signals during differentiation causes the cell’s DNA to acquire epigenetic marks that restrict DNA expression in the cell and can be passed on through cell division.

Adult stem cells typically generate the cell types of the tissue in which they reside. For example, a blood-forming adult stem cell in the bone marrow normally gives rise to the many types of blood cells. It is generally accepted that a blood-forming cell in the bone marrow—which is called a hematopoietic stem cell—cannot give rise to the cells of a very different tissue, such as nerve cells in the brain.

Through years of experimentation, scientists have established some basic protocols or “recipes” for the directed differentiation of embryonic stem cells into some specific cell types (Figure 1). (For additional examples of directed differentiation of embryonic stem cells, refer to the NIH stem cell report available at

http://stemcells.nih.gov/info/scireport/pages/2006report.aspx.)

stem cell differentiation figure1_sm

stem cell differentiation figure1_sm

http://stemcells.nih.gov/StaticResources/images/figure1_sm.jpg

9.3.3 Types of Stem Cell Transplants for Treating Cancer

http://www.cancer.org/treatment/treatmentsandsideeffects/treatmenttypes/bonemarrowandperipheralbloodstemcelltransplant/stem-cell-transplant-types-of-transplant

In a typical stem cell transplant for cancer very high doses of chemo are used, often along with radiation therapy, to try to destroy all the cancer cells. This treatment also kills the stem cells in the bone marrow. Soon after treatment, stem cells are given to replace those that were destroyed. These stem cells are given into a vein, much like a blood transfusion. Over time they settle in the bone marrow and begin to grow and make healthy blood cells. This process is called engraftment.

There are 3 basic types of transplants. They are named based on who gives the stem cells.

  • Autologous (aw-tahl-uh-gus)—the cells come from you
  • Allogeneic (al-o-jen-NEE-ick or al-o-jen-NAY-ick)—the cells come from a matched related or unrelated donor
  • Syngeneic (sin-jen-NEE-ick or sin-jen-NAY-ick)—the cells come from your identical twin or triplet
hematopoietic stem cell transplant

hematopoietic stem cell transplant

Autologous stem cell transplants

These stem cells come from you alone. In this type of transplant, your stem cells are taken before you get cancer treatment that destroys them. Your stem cells are removed, or harvested, from either your bone marrow or your blood and then frozen. To find out more about that process, please see the section “What’s it like to donate stem cells?” After you get high doses of chemo and/or radiation the stem cells are thawed and given back to you.

One advantage of autologous stem cell transplant is that you are getting your own cells back. When you donate your own stem cells you don’t have to worry about the graft attacking your body (graft-versus-host disease) or about getting a new infection from another person. But there can still be graft failure, and autologous transplants can’t produce the “graft-versus-cancer” effect.

This kind of transplant is mainly used to treat certain leukemias, lymphomas, and multiple myeloma. It’s sometimes used for other cancers, like testicular cancer and neuroblastoma, and certain cancers in children.

Getting rid of cancer cells in autologous transplants

A possible disadvantage of an autologous transplant is that cancer cells may be picked up along with the stem cells and then put back into your body later. Another disadvantage is that your immune system is still the same as before when your stem cells engraft. The cancer cells were able to grow despite your immune cells before, and may be able to do so again. The need to remove cancer cells from transplants or transplant patients and the best way to do it is being researched.

Doing 2 autologous transplants in a row is known as a tandem transplant or a double autologous transplant. In this type of transplant, the patient gets 2 courses of high-dose chemo, each followed by a transplant of their own stem cells. All of the stem cells needed are collected before the first high-dose chemo treatment, and half of them are used for each transplant. Most often both courses of chemo are given within 6 months, with the second one given after the patient recovers from the first one.

Allogeneic stem cell transplants

In the most common type of allogeneic transplant, the stem cells come from a donor whose tissue type closely matches the patient’s. (This is discussed later under “HLA matching” in the section called “ Donor matching for allogeneic transplant.”) The best donor is a close family member, usually a brother or sister. If you do not have a good match in your family, a donor might be found in the general public through a national registry. This is sometimes called a MUD (matched unrelated donor) transplant. Transplants with a MUD are usually riskier than those with a relative who is a good match.

Blood taken from the placenta and umbilical cord of newborns is a newer source of stem cells for allogeneic transplant. Called cord blood, this small volume of blood has a high number of stem cells that tend to multiply quickly. But the number of stem cells in a unit of cord blood is often too low for large adults, so this source of stem cells is limited to small adults and children. Doctors are now looking at different ways to use cord blood for transplant in larger adults, such as using cord blood from 2 donors.

Pros of allogeneic stem cell transplant: The donor stem cells make their own immune cells, which could help destroy any cancer cells that remain after high-dose treatment. This is called the graft-versus-cancer effect. Other advantages are that the donor can often be asked to donate more stem cells or even white blood cells if needed, and stem cells from healthy donors are free of cancer cells.

Cons to allogeneic stem cell transplants: The transplant, also known as the graft, might not take — that is, the donor cells could die or be destroyed by the patient’s body before settling in the bone marrow. Another risk is that the immune cells from the donor may not just attack the cancer cells – they could attack healthy cells in the patient’s body. This is called graft-versus-host disease (described in the section called “Problems that may come up shortly after transplant”). There is also a very small risk of certain infections from the donor cells, even though donors are tested before they donate. A higher risk comes from infections you have had, and which your immune system has under control. These infections often surface after allogeneic transplant because your immune system is held in check (suppressed) by medicines called immunosuppressive drugs. These infections can cause serious problems and even death.

Allogeneic transplant is most often used to treat certain types of leukemia, lymphomas, multiple myeloma,myelodysplastic syndrome, and other bone marrow disorders such as aplastic anemia.

Mini transplants (non-myeloablative transplants)

For some people, age or certain health conditions make it more risky to wipe out all of their bone marrow before a transplant. For those people, doctors can use a type of allogeneic transplant that’s sometimes called a mini-transplant. Compared with a standard allogeneic transplant, this one uses less chemo and/or radiation to get the patient ready for the transplant. Your doctor might refer to it as a non-myeloablative transplant or mention reduced-intensity conditioning (RIC). The idea here is to kill some of the cancer cells along with some of the bone marrow, and suppress the immune system just enough to allow donor stem cells to settle in the bone marrow.

Unlike the standard allogeneic transplant, cells from both the donor and the patient exist together in the patient’s body for some time after a mini-transplant. But slowly, over the course of months, the donor cells take over the bone marrow and replace the patient’s own bone marrow cells. These new cells can then develop an immune response to the cancer and help kill off the patient’s cancer cells — the graft-versus-cancer effect.

Syngeneic stem cell transplants – for those with an identical sibling

This is a special kind of allogeneic transplant that can only be used when the recipient has an identical sibling (twin or triplet) who can donate — someone who will have the same tissue type. An advantage of syngeneic stem cell transplant is that graft-versus-host disease will not be a problem. There are no cancer cells in the transplant, either, as there would be in an autologous transplant.

A disadvantage is that because the new immune system is so much like the recipient’s immune system, there is no graft-versus-cancer effect, either. Every effort must be made to destroy all the cancer cells before the transplant is done to help keep the cancer from relapsing (coming back).

9.3.4 Graft versus Host Disease

http://bethematch.org/For-Patients-and-Families/Life-after-transplant/Graft-versus-host-disease–GVHD-/

Graft-versus-host disease(GVHD) occurs because of differences between the cells of your body and the donated cells and is a common side effect of an allogeneic bone marrow transplant.

An allogeneic transplant uses blood cells from a family member, unrelated donor or cord blood unit. GVHD can affect many different parts of the body including the skin, eyes, mouth, stomach, and intestines.

There are two types of GVHD:

  • Acute GVHD: Develops in the first 100 days or so after transplant but can occur later. This primarily affects the skin, stomach, intestines, and liver.
  • Chronic GVHD: Usually develops 3-6 months after transplant, but signs can appear earlier or later. If you have had or currently have acute GVHD, you are more likely to have chronic GVHD.

The severity of acute and chronic GVHD can range from mild to life-threatening.

Doctors often see mild GVHD as a good thing after an allogeneic transplant when the transplant was done for a blood cancer. It is a sign that the donor’s immune system is working to destroy any remaining cancer cells. Patients who experience some GVHD have a lower risk of the cancer returning after transplant than patients who do not develop GVHD. If the transplant was to treat a disease other than cancer disease, like aplastic anemia, then the doctor may want to treat even mild GVHD.

Graft-versus-Host Disease

JLM Ferrara, JE Levine, P Reddy, and E Holler
Lancet. 2009 May 2; 373(9674): 1550–1561.
http://dx.doi.org:/10.1016/S0140-6736(09)60237-3

The number of allogeneic hematopoietic cell transplantations (HCT) continues to increase with more than 25,000 allogeneic transplantations performed annually. The graft-versus-leukemia / tumor (GVL) effect during allogeneic HCT effectively eradicates many hematological malignancies.1 The development of novel strategies that use donor leukocyte infusions, non-myeloablative conditioning and umbilical cord blood (UCB) transplantation have helped expand the indications for allogeneic HCT over the last several years, especially among older patients.2 Improvements in infectious prophylaxis, immunosuppressive medications, supportive care and DNA-based tissue typing have also contributed to improved outcomes after allogeneic HCT.1 Yet the major complication of allogeneic HCT, graft-versus-host disease (GVHD), remains lethal and limits the use of this important therapy.2 Given current trends, the number of transplants from unrelated donors is expected to double within the next five years, significantly increasing the population of patients with GVHD. In this seminar we review advances made in identifying the genetic risk factors and pathophysiology of this major HCT complication, as well as its prevention, diagnosis and treatment.

Etiology and Clinical Features

Fifty years ago Billingham formulated three requirements for the development of GVHD: the graft must contain immunologically competent cells; the recipient must express tissue antigens that are not present in the transplant donor; and the recipient must be incapable of mounting an effective response to eliminate the transplanted cells.3 We know now that the immunologically competent cells are T cells, and that GVHD can develop in various clinical settings when tissues containing T cells (blood products, bone marrow, and solid organs) are transferred from one person to another who is not able to eliminate those cells.4, 5 Patients, whose immune systems are suppressed, and who receive white blood cells from another individual, are at particularly high risk for GVHD.

GVHD occurs when donor T cells respond to genetically defined proteins on host cells. The most important proteins are Human Leukocyte Antigens (HLA)2, 6, 7, which are highly polymorphic and are encoded by the major histocompatibility complex (MHC). Class I HLA (A, B, and C) proteins are expressed on almost all nucleated cells of the body at varying densities. Class II proteins (DR, DQ, and DP) are primarily expressed on hematopoietic cells (B cells, dendritic cells, monocytes), but their expression can be induced on many other cell types following inflammation or injury. High-resolution DNA typing of HLA genes with polymerase chain reaction (PCR)-based techniques have now largely replaced earlier methods. The incidence of acute GVHD is directly related to the degree of mismatch between HLA proteins8, 9 and thus ideally, donors and recipients are matched at HLA-A, -B, -C, and -DRB1, (“8/8 matches”), but mismatches may be tolerated for UCB grafts (see below).10–12

Non-HLA Genetics

Despite HLA identity between a patient and donor, approximately 40% of patients receiving HLA-identical grafts develop acute GVHD due to genetic differences that lie outside the HLA loci, or “minor” histocompatibility antigens (HA). Some minor HAs, such as HY and HA-3, are expressed on all tissues and are targets for both GVHD and GVL.13 Other minor HAs, such as HA-1 and HA-2, are expressed most abundantly on hematopoietic cells (including leukemic cells) and may therefore induce a greater GVL effect with less GVHD.13, 14

Polymorphisms in both donors and recipients for cytokines that are involved in the classical `cytokine storm’ of GVHD (discussed below) have been implicated as risk factors for GVHD.15 Tumor Necrosis Factor (TNF)-α, Interleukin 10 (IL-10), Interferon-γ (IFNγ) variants have correlated with GVHD in some, but not all, studies.16–18 Genetic polymorphisms of proteins involved in innate immunity, such as nucleotide oligomerization domain 2 and Keratin 18 receptors, have also been associated with GVHD.19–22 Future strategies to identify the best possible transplant donor will probably incorporate both HLA and non-HLA genetic factors.

Clinical Features of Acute GVHD

Based on an early Seattle experience, acute GVHD was defined to occur prior to day 100, whereas chronic GVHD occurred after that time.23–25 This definition is far from satisfactory, and a recent National Institutes of Health classification includes late-onset acute GVHD (after day 100) and an overlap syndrome with features of both acute and chronic GVHD.26 Late-onset acute GVHD and the overlap syndrome occur with greater frequency after reduced-intensity conditioning (RIC), an increasingly widespread technique (see below). As shown in Table 1, the clinical manifestations of acute GVHD occur in the skin, gastrointestinal tract and liver.27 In a comprehensive review, Martin et al found that at the onset of acute GVHD, 81% of patients had skin involvement, 54% had GI involvement, and 50% had liver involvement.23 Recent data suggest that lungs might also be targets of experimental GVHD.28

Acute GVHD Symptoms

Table 1

Pathophysiology of Acute GVHD

Two important principles are important to consider regarding the pathophysiology of acute GVHD. First, acute GVHD reflects exaggerated but normal inflammatory mechanisms mediated by donor lymphocytes infused into the recipient where they function appropriately, given the foreign environment they encounter. Second, the recipient tissues that stimulate donor lymphocytes have usually been damaged by underlying disease, prior infections, and the transplant conditioning regimen.29 As a result, these tissues produce molecules (sometimes referred to as “danger” signals) that promote the activation and proliferation of donor immune cells.42–45 Mouse models havebeen central to our identification and understanding of the pathophysiologic mechanisms of GVHD, and canine models have been critical to the development of clinically useful strategies for GVHD prophylaxis and treatment and to the development of donor leukocyte infusions.36, 46, 47 Based largely on these experimental models, the development of acute GVHD can be conceptualized in three sequential steps or phases: (1) activation of the APCs; (2) donor T cell activation, proliferation, differentiation and migration; and (3) target tissue destruction (Figure 3).

Figure 3

GVHD Pathophysiology

In Phase I, the recipient conditioning regimen damages host tissues and causes release of inflammatory cytokines such as TNFα, IL-1 and IL-6. Increased levels of these cytokines leads to activation of host antigen presenting cells (APCs). In Phase II, host APCs activate mature donor cells. The subsequent proliferation and differentiation of these activated T cells produces additional effectors that mediate the tissue damage, including Cytotoxic T Lymphocytes, Natural Killer (NK) cells, TNFα and IL-1. Lipopolysaccharide (LPS) that has leaked through the damaged intestinal mucosa triggers additional TNFα production. TNFα can damage tissue directly by inducing necrosis and apoptosis in the skin and GI tract through either TNF receptors or the Fas pathway. TNFα plays a direct role in intestinal GVHD damage which further amplifies damage in the skin, liver and lung in a “cytokine storm.”

GVHD pathophysiology nihms-115970-f0003

GVHD pathophysiology nihms-115970-f0003

http://www.ncbi.nlm.nih.gov/pmc/articles/PMC2735047/bin/nihms-115970-f0003.jpg

Phase I: Activation of Antigen Presenting Cells (APCs)

The first step involves the activation of APCs by the underlying disease and the HCT conditioning regimen. Damaged host tissues respond by producing “danger” signals, including proinflammatory cytokines (e.g., TNF-α), chemokines, and increased expression of adhesion molecules, MHC antigens and costimulatory molecules on host APCs.42, 48–50 A recent report demonstrated that at one week after HCT, increased levels of TNF-α receptor I, a surrogate marker for TNF-α, strongly correlated with the later development of GVHD.51 Damage to the GI tract from the conditioning is particularly important because it allows for systemic translocation of additional inflammatory stimuli such as microbial products including lipopolysaccaride (LPS) or other pathogen-associated molecular patterns that further enhance the activation of host APCs.49 The secondary lymphoid tissue in the GI tract is likely the initial site of interaction between activated APCs and donor T cells.52 These observations have led an important clinical strategy to reduce acute GVHD by reducing the intensity of the conditioning regimen. Experimental GVHD can also be reduced by manipulating distinct subsets of APCs.53,54 In addition, non-hematopoietic stem cells, such as mesenchymal stem cells or stromal cells, can reduce allogeneic T cell responses, although the mechanism for such inhibition remains unclear.2

The concept that enhanced activation of host APCs increases the risk for acute GVHD unifies a number of seemingly disparate clinical associations with that risk, such as advanced stages of malignancy, more intense transplant conditioning regimens and histories of viral infections. APCs detect infections by recognizing conserved molecular patterns that are unique to microbes, called pathogen-associated molecular patterns (PAMPs). Among the classes of receptors that recognize such patterns, the Toll-like receptors (TLR) are the best characterized.55 For example, TLR4 recognizes LPS55 and mice with mutant TLR4 receptors that do not respond to LPS cause less GVHD when used as donors.56 Other TLRs that recognize viral DNA or RNA also activate APCs and may enhance GVHD, providing a potential mechanistic basis for increased GVHD associated with viral infections such as cytomegalovirus (CMV).57

Phase II: Donor T Cell Activation

The core of the GVH reaction is Step 2, where donor T cells proliferate and differentiate in response to host APCs. The “danger” signals generated in Phase I augment this activation at least in part by increasing the expression of costimulatory molecules.58 Blockade of co-stimulatory pathways to prevent GVHD is successful in animal models, but this approach has not yet been tested in large clinical trials.2

In mouse models, where genetic differences between donor and recipient strains can be tightly controlled, CD4+ cells induce acute GVHD to MHC class II differences, and CD8+ cells induce acute GVHD to MHC class I differences.59–61 In the majority of HLA-identical HCTs, both CD4+ and CD8+ subsets respond to minor histocompatibility antigens and can cause GVHD in HLA-identical HCT.

Regulatory T cells can suppress the proliferation of conventional T cells and prevent GVHD in animal models when added to donor grafts containing conventional T cells.62 In mice, the Foxp3 protein functions as a master switch in the development of regulatory T cells, which normally constitute 5% of the CD4+ T cell population.62 Regulatory T cells secrete anti-inflammatory cytokines IL-10 and Transforming Growth Factor(TGF)-β and can also act through contact-dependent inhibition of APCs.62 It is likely that the use of regulatory T cells in clinical acute GVHD will require improved techniques to identify and expand them.

Natural Killer T cell (NKT) 1.1+ subsets of both the host and donors that have been shown to modulate acute GVHD.63 Host NKT cells have been shown to suppress acute GVHD in an IL-4 dependent manner.64 A recent clinical trial of total lymphoid irradiation used as conditioning significantly reduced GVHD and enhanced host NKT cell function.65 By contrast, donor NKT cells can reduce GVHD and enhance perforin mediated GVL in an experimental model.66

Activation of immune cells results in rapid intracellular biochemical cascades that induce transcription of genes for many proteins including cytokines and their receptors. Th1 cytokines (IFN-γ, IL-2 and TNF-α) are produced in large amounts during acute GVHD. IL-2 production by donor T cells remains the principal target of many current clinical therapeutic and prophylactic approaches to GVHD, such as cyclosporine, tacrolimus and monoclonal antibodies (mAbs) directed against IL-2 and its receptor.9 But emerging data indicate an important role for IL-2 in the generation and maintenance of CD4+ CD25+ T regs, suggesting that prolonged interference with IL-2 may have an unintended consequence of preventing the development of long term tolerance after allogeneic HCT.67 IFN-γ has multiple functions and can either amplify or reduce GVHD.68,69 IFN-γ may amplify GVHD by increasing the expression of molecules such as chemokines receptors, MHC proteins, and adhesion molecules; it also increases the sensitivity of monocytes and macrophages to stimuli such as LPS and accelerates intracellular cascades in response to these stimuli.70Early polarization of donor T cells so that they secrete less IFN-γ and more IL-4 can also attenuate experimental acute GVHD.71 IFN-γ may amplify GVHD by directly damaging epithelium in the GI tract and skin and inducing immnosuppression through the induction of nitric oxide.72 By contrast, IFN-γ may suppress GVHD by hastening the apoptosis of activated donor T cells.69, 73. This complexity means the manipulation of IFN-γ may have diverse effects in vivo, making it a challenging target with respect to therapeutic intervention. IL-10 plays a key role in suppression of immune responses, and clinical data suggest it may regulate acute GVHD.17 TGF-β, another suppressive cytokine can suppress acute GVHD but exacerbate chronic GVHD.74 Thus the timing and duration of the secretion of any given cytokine may determine the specific effects of that cytokine on GVHD severity.

Phase III: Cellular and Inflammatory Effector Phase

The effector phase of this process is a complex cascade of both cellular mediators such as cytotoxic T lymphocytes(CTLs) and NK cells and soluble inflammatory mediators such as TNF-α, IFN-γ, IL-1 and nitric oxide.2, 29 These soluble and cellular mediators synergize to amplify local tissue injury and further promote inflammation and target tissue destruction.

Cellular Effectors

The cellular effectors of acute GVHD are primarily CTLs and NK cells.49 CTLs that preferentially use the Fas/FasL pathway of target lysis and appear to predominate in GVHD liver damage (hepatocytes express large amounts of Fas) whereas GVHD CTLs that use the perforin /granzyme pathways are more important in the GI tract and skin.2, 75 Chemokines direct the migration of donor T cells from lymphoid tissues to the target organs where they cause damage. Macrophage inflammatory protein-1alpha (MIP-1α) and other chemokines such as CCL2-5, CXCL2, CXCL9-11, CCL17 and CCL27 are over-expressed and enhance the homing of cellular effectors to target organs during experimental GVHD.76Expression of integrins, such as α4β7 and its ligand MadCAM-1, are also important for homing of donor T cells to Peyer’s patches during intestinal GVHD.52, 77, 78

Prevention of GVHD

Based on the evidence from animal models regarding the central role of T cells in initiating GVHD, numerous clinical studies evaluating T cell depletion (TCD) as prophylaxis for GVHD were performed in the 1980’s and 1990’s. There were three principal TCD strategies: (1) negative selection of T cells ex vivo, (2) positive selection of CD34+ stem cells ex vivo; and (3) anti-T cell antibodies in vivo.83Most strategies showed a significant limitation in both acute and chronic GVHD.84–88 Unfortunately, the lower incidence of severe GVHD was offset by high rates of graft failure, relapse of malignancy, infections, and Epstein-Barr virus-associated lymphoproliferative disorders. Negative selection purging strategies using various anti-T cell antibodies achieved similar long-term results regardless of the breadth of antibody specificity.89–93 One large registry study demonstrated that purging strategies using antibodies with broad specificities produced inferior leukemia-free survival than standard immunosuppression in patients receiving unrelated donor transplants.94 Several studies have investigated partial T cell depletion, either by eliminating specific T cell subsets (e.g., CD8+) or by titrating the dose of T cells present in the inoculum.95–97 None of these approaches, however, has convincingly demonstrated an optimal strategy that improves long-term survival.

Alemtuzumab is a monoclonal antibody that binds CD52, a protein expressed on a broad spectrum of leukocytes including lymphocytes, monocytes, and dendritic cells. Its use in GVHD prophylaxis in a Phase II trial decreased the incidence of acute and chronic GVHD following reduced intensity transplant.98 In two prospective studies, patients who received alemtuzumab rather than methotrexate showed significantly lower rates of acute and chronic GVHD,99 but experienced more infectious complications and higher rates of relapse, so that there was no overall survival benefit. Alemtuzumab may also contribute to graft failure when used with minimal intensity conditioning regimens.100

An alternative strategy to TCD attempted to induce anergy in donor T cells by ex vivo antibody blockade of co-stimulatory pathways prior to transplantation. A small study using this approach in haploidentical HCT recipients was quite encouraging, but has not yet been replicated.101 Thus the focus of most prevention strategies remains pharmacological manipulation of T cells after transplant.

Administration of anti-T cell antibodies in vivo as GVHD prophylaxis has also been extensively tested. The best studied drugs are anti-thymocyte globulin (ATG) or antilymphocyte globulin (ALG) preparations. These sera, which have high titers of polyclonal antibodies, are made by immunizing animals (horses or rabbits) to thymocytes or lymphocytes, respectively. A complicating factor in determining the role of these polyclonal sera in transplantation is the observation that even different brands of the same class of sera exert different biologic effects.102 However, the side effects of ATG/ALG infusions are common across different preparations and include fever, chills, headache, thrombocytopenia (from cross-reactivity to platelets), and, infrequently, anaphylaxis. In retrospective studies, rabbit ATG reduced the incidence of GVHD in related donor HSCT recipients without appearing to improve survival.103, 104 In recipients of unrelated donor HSCT, addition of ALG to standard GVHD prophylaxis effectively prevented severe GVHD, but did not result in improved survival because of increased infections.105 In a long term follow-up study, however, pretransplant ATG provided significant protection against extensive chronic GVHD and chronic lung dysfunction.106

The primary pharmacologic strategy to prevent GVHD is the inhibition of the cytoplasmic enzyme, calcineurin, that is critical for in the activation of T cells. The calcineurin inhibitors, cyclosporine and tacrolimus, have similar mechanisms of action, clinical effectiveness and toxicity profiles, including hypomagnesemia, hyperkalemia, hypertension, and nephrotoxicity.9, 107 Serious side effects include transplant-associated thrombotic microangiopathy (TAM) and neurotoxicity that can lead to premature discontinuation. Although clinically similar to thrombotic thrombocytopenic purpura, TAM does not reliably respond to therapeutic plasmapheresis, carries a high mortality rate, and removal of the offending agent does not always result in improvement.108 Posterior reversible encephalopathy syndrome includes mental status changes, seizures, neurological deficits and characteristic magnetic resonance imaging findings; this syndrome has been seen in 1-2% of HCT recipients receiving and calcineurin inhibitors.109 Side effects of these drugs decrease as the dose is tapered, usually two to four months after HCT.

Calcineurin inhibitors are often administered in combination with other immunosuppressants, such as methotrexate, which is given at low doses in the early post-transplant period.9, 107 The toxicities of methotrexate (neutropenia and mucositis) have led some investigators to replace it with mycophenolate mofetil (MMF). In one prospective randomized trial, patients who received MMF as part of GVHD prophylaxis experienced significantly less severe mucositis and more rapid neutrophil engraftment than those who received methotrexate.110 The incidence and severity of acute GVHD was similar between the two groups, but the study closed early due to superiority of the MMF arm with respect to reduced mucositis and the speed of hematopoietic engraftment. A desire for faster neutrophil engraftment has led to the use of MMF in UCB blood transplants where graft failure is a major concern.111 MMF is also often used after RIC regimens for similar reasons.112, 113

Sirolimus is an immunosuppressant that is structurally similar to tacrolimus but does not inhibit calcineurin. In a small Phase II trial, it showed excellent efficacy in combination with tacrolimus;114 the drug damages endothelial cells, however, and it may enhance TAM that is associated with calcineurin inhibitors.115 The combination of tacrolimus and sirolimus is currently being compared in a large randomized multi-center trial.

RIC regimens attempt to suppress the host immune system sufficiently so that donor T cells can engraft and then ablate the lympho-hematopoietic compartment of the recipient. The term “non-myeloablative” is therefore somewhat misleading. RIC regimens produce less tissue damage and lower levels of the inflammatory cytokines that are important in the initiation of GVHD pathophysiology; this effect may explain the reduced incidence of severe GVHD following RIC compared to the full intensity conditioning used in historical controls.98, 116 The onset of acute GVHD may be delayed after RIC until after day 100, however, and it may present simultaneously with elements of chronic GVHD (“overlap syndrome”).116–120

Treatment of Acute GVHD

GVHD generally first develops in the second month after HCT, during continued treatment with calcineurin-based prophylaxis.23, 121 Steroids, with their potent antilymphocyte and anti-inflammatory activity, are the gold standard for treatment of GVHD. Many centers treat mild GVHD of the skin (Grade I) with topical steroids alone, but for more severe skin GVHD and any degree of visceral GVHD involvement, high-dose systemic steroids are usually initiated. Steroid therapy results in complete remission in less than half of the patients,122 and more severe GVHD is less likely to respond to treatment.123, 124 In a prospective randomized study, the addition of ATG to steroids as primary therapy did not increase the response rate.124 In a retrospective study, the use of ATG in patients who showed early signs of steroid-resistance was beneficial,122 but not all studies show such benefit and ATG is not standardly used because of increased infection risks.106, 125, 126.

An increasingly common treatment for GVHD is extracorporeal photopheresis (ECP). During ECP, the patient’s white blood cells are collected by apheresis, incubated with the DNA-intercalating agent, 8-methoxypsoralen, exposed to ultraviolet light (UVA), and returned to the patient. ECP is known to induce cellular apoptosis, which has strong anti-inflammatory effects in a number of systems, including prevention of rejection of solid organ grafts.127 Animal studies show that ECP reverses acute GVHD by increasing the number of regulatory T cells.128 A Phase II clinical study of steroid-dependent or steroid refractory GVHD showed resolution of GVHD in a large majority of patients, with 50% long-term survival in this very high risk group.129 Randomized multi-center studies of this approach are needed to determine its place in the management of acute GVHD.

Another interesting strategy to treat GVHD is the blockade of the inflammatory cytokine TNF-α. TNF-α can activate APCs, recruit effector cells and cause direct tissue damage.130 In animal models, TNF-α plays a central role in GVHD of the GI tract, which is central to the “cytokine storm” and plasma levels of TNFR I (a surrogate marker for TNF-α) rise in patients before the clinical manifestations of GVHD appear. 51 A recent Phase II trial of etanercept, a solubilized TNFR II, showed significant efficacy when added to systemic steroids as primary therapy for acute GVHD. Seventy percent of patients had complete resolution of all GVHD symptoms within one month, with 80% complete responses in the GI tract and the skin. The authors also showed that plasma levels of TNFR I were a significant biomarker for clinical GVHD.131

Treatment of Chronic GVHD

In contrast to acute GVHD, the pathophysiology of chronic GVHD remains poorly understood, and it is treated with a variety of immunosuppressive agents. The response of chronic GVHD to treatment is unpredictable, and mixed responses in different organs can occur in the same patient. Confounding variables such as infection and co-morbidities also make responses hard to measure. The use of corticosteroids (with or without a calcineurin inhibitor) is the standard of care, but a randomized trial of more than 300 patients with chronic GVHD found no difference between cyclosporine plus prednisone versus prednisone alone.132 Chronic immunosuppressants, especially those containing steroids, are highly toxic and result in infectious deaths. Many second line therapies have been studied, but none has achieved widespread acceptance. As mentioned above, ECP shows some promise, with significant response rates in high-risk patients. The best responses were observed in skin, liver, oral mucosa, eye, and lung.133 This observation is particularly relevant because lung GVHD has the potential to be a particularly devastating complication necessitating lung transplant as the only therapeutic option.134, 135

Essential Supportive Care in GVHD Patients

Meticulous supportive care is critical for patients with both acute and chronic GVHD because of the extended duration of immunosuppressive treatments and because the multiple medications required may have synergistic toxicities. Such care includes extensive infectious prophylaxis, early interventions in cases of suspected infections, and prophylaxis against non-infectious side effects of medications (See Table 3). These complications often require rapid responses to prevent serious or irreversible damage, and are best handled in close collaboration between the primary physician and the transplant specialist.

Table 3

Recommendations for Supportive Care

All patients should receive at least fluconazole as prophylaxis against fungal infections. Invasive molds, especially aspergillus, are common in patients with prolonged steroid use.136 Prophylaxis with voriconazole or posaconazole should be considered for these patients. Usual sites of infection are the lungs, sinuses, brain, skin,137 and serial galactomannan assays may aid in the early detection.138 Candida can cause lesions in the lung and spleen, which may need screening with ultrasonography. Pneumocystis is another opportunistic infection that should receive cotrimoxazol (bactrim) prophylaxis.139

Viral infections are frequent in these patients with GVHD. Cytomegalovirus causes interstitial pneumonia and gastritis. Patients who are at risk should have their blood monitored several times monthly. Techniques that directly detect virus should be performed, such as CMV PCR or pp65 antigen, and evidence of increased viral load should prompt preemptive treatment with ganciclovir or foscarnet prior to clinical manifestations of disease. Shingles is not uncommon and acyclovir prophylaxis may be beneficial.140 Patients and caregivers should receive vaccinations against influenza, and treatment with neuraminidase inhibitors is recommended in the event of influenza infection.141, 142

Patients with GVHD often have IgG2 and IgG4 subclass deficiencies despite normal lgG levels, making them susceptible to infections with encapsulated organisms. Treatment of severe hypogammaglobulinemia with intravenous immunoglobulin is standard in many centers,143 but the level that triggers replacement varies considerably among transplant specialists. There is little supporting evidence for the routine use of intravenous immunoglobulin as prophylaxis144 but patients should receive routine prophylaxis (penicillin or its equivalent) due to the increased risk of streptococcal sepsis.145 Pneumococcal conjugate and hemophilus influenza vaccine may provide additional protection and are also recommended for all patients, including those with chronic GVHD.139, 146, 147 The sites of any indwelling catheters should be assessed regularly and early treatment of a suspected infection initiated. Early signs or symptoms of septic shock such as shaking chills or low blood pressure requires prompt evaluation with chest X-ray and/or CT scan, blood culture and broad spectrum antibiotics because shock may progress rapidly in these patients.

9.3.5 Aspergillus Complicating Allogeneic Transplantation

Aspergillus infections in allogeneic stem cell transplant recipients: have we made any progress?

E Jantunen, V-J Anttila and T Ruutu
BMT 2002; 30(12):925-929
http://www.nature.com/bmt/journal/v30/n12/full/1703738a.html
http://dx.doi.org:/10.1038/sj.bmt.1703738

Invasive aspergillosis (IA) is common in allogeneic SCT recipients, with an incidence of 4-10%. The majority of these infections are diagnosed several months after SCT and they are frequently associated with GVHD. The diagnosis is difficult and often delayed. Established IA is notoriously difficult to treat with a death rate of 80-90%. This review summarises recent data on this problem to assess whether there has been any progress. Effective prophylactic measures are still lacking. Severe immunosuppression is the main obstacle to the success of therapy. Recent and ongoing developments in diagnostic measures and new antifungal agents may improve treatment results to some extent, but Aspergillus infections still remain a formidable problem in allogeneic transplantation. Further studies in this field will focus on the role of various cytokines and combinations of antifungal agents.

Summary

Read Full Post »

Hematologic Malignancies [2.4.3]

Writer and Curator:  Larry H. Bernstein, MD, FCAP

Updated on 4/14/2016

Hematologic Malignancies 

Not excluding lymphomas [solid tumors]

The following series of articles are discussions of current identifications, classification, and treatments of leukemias, myelodysplastic syndromes and myelomas.

6.2 Hematological Malignancies

6.2.1 Ontogenesis of blood elements

6.2.1.1 Erythropoiesis

6.2.1.2 White blood cell series: myelopoiesis

6.2.1.3 Thrombocytogenesis

6.2.2 Classification of hematopoietic cancers

6.2.2.1 Primary Classification

6.2.2.1.1 Acute leukemias

6.2.2.1.1 Myelodysplastic syndromes

6.2.2.1.2 Acute myeloid leukemia

6.2.2.1.3 Acute lymphoblastic leukemia

6.2.2.2 Myeloproliferative Disorders

6.2.2.2.1 Chronic myeloproliferative disorders

6.2.2.2.2 Chronic myelogenous leukemia and related disorders

6.2.2.2.3 Myelofibrosis, including chronic idiopathic

6.2.2.2.4 Polycythemia, including polycythemia rubra vera

6.2.2.2.5 Thrombocytosis, including essential thrombocythemia

6.2.2.3 Chronic lymphoid leukemia and other lymphoid leukemias

6.2.2.4 Lymphomas

6.2.2.4.1 Non-Hodgkin Lymphoma

6.2.2.4.2 Hodgkin lymphoma

6.2.2.5 Lymphoproliferative disorders associated with immunodeficiency

6.2.2.6 Plasma Cell dyscrasias

6.2.2.7 Mast cell disease and Histiocytic neoplasms

6.2.3 Secondary Classification

6.2.3.1 Nuance – PathologyOutlines

6.2.3.1..1-8

6.2.4 Diagnostics

6.2.4.1 Computer-aided diagnostics

6.2.4.1.1 Back-to-Front Design

6.2.4.1.2 Realtime Clinical Expert Support

6.2.4.1.3 Regression: A richly textured method for comparison and classification of predictor variables

6.2.4.1.4 Converting Hematology Based Data into an Inferential Interpretation

6.2.4.1.5 A model for Thalassemia Screening using Hematology Measurements

6.2.4.1.6 Measurement of granulocyte maturation may improve the early diagnosis of the septic state.

6.2.4.1.7 The automated malnutrition assessment.

6.2.4.2 Molecular Diagnostics

6.2.4.2.1 Genomic Analysis of Hematological Malignancies

6.2.4.2.2 Next-generation sequencing in hematologic malignancies: what will be the dividends?

6.2.4.2.3 Leveraging cancer genome information in hematologic malignancies.

6.2.4.2.4 p53 mutations are associated with resistance to chemotherapy and short survival in hematologic malignancies

6.2.4.2.5 Genomic approaches to hematologic malignancies

6.2.5  Treatment of hematopoietic cancers

6.2.5.1 Treatments for leukemia by type

6.2.5.1.1 Acute lymphocytic leukemias

6.2.5.1.2 Treatment of Acute Lymphoblastic Leukemia

6.2.5.1.3 Acute Lymphoblastic Leukemia

6.2.5.1.4 Gene-Expression Patterns in Drug-Resistant Acute Lymphoblastic Leukemia Cells and Response to Treatment

6.2.5.1.5 Leukemias Treatment & Management

6.2.5.1.6 Treatments and drugs

6.2.5.2 Acute Myeloid Leukemia

6.2.5.2.1 New treatment approaches in acute myeloid leukemia: review of recent clinical studies

6.2.5.2.2 Novel approaches to the treatment of acute myeloid leukemia.

6.2.5.2.3 Current treatment of acute myeloid leukemia

6.2.5.2.4 Adult Acute Myeloid Leukemia Treatment (PDQ®)

6.2.5.3 Treatment for CML

6.2.5.3.1 Chronic Myelogenous Leukemia Treatment (PDQ®)

6.2.5.3.2 What`s new in chronic myeloid leukemia research and treatment?

6.2.5.4 Chronic Lymphocytic Leukemia

6.2.5.4.1 Chronic Lymphocytic Leukemia Treatment (PDQ®)

6.2.5.4.2 Results from the Phase 3 Resonate™ Trial

6.2.5.4.3 Typical treatment of chronic lymphocytic leukemia

6.2.5.5 Lymphoma treatment

6.2.5.5.1 Overview

6.2.5.5.2 Chemotherapy

6.2.6 Primary treatments

6.2.6.1 Total body irradiation (TBI)

6.2.6.2 Bone marrow (BM) transplantation

6.2.6.2.1 Autologous stem cell transplantation

6.2.6.2.2  Hematopoietic stem cell transplantation

6.2.7 Supportive Therapies

6.2.7.1  Blood transfusions

6.2.7.2  Erythropoietin

6.2.7.3  G-CSF (granulocyte-colony stimulating factor)

6.2.7.4  Plasma exchange (plasmapheresis)

6.2.7.5  Platelet transfusions

6.2.7.6  Steroids

6.2.1 Ontogenesis of the blood elements: hematopoiesis

http://www.britannica.com/EBchecked/topic/69747/blood-cell-formation

Blood cells are divided into three groups: the red blood cells (erythrocytes), the white blood cells (leukocytes), and the blood platelets (thrombocytes). The white blood cells are subdivided into three broad groups: granulocytes, lymphocytes, and monocytes.

Blood cells do not originate in the bloodstream itself but in specific blood-forming organs, notably the marrow of certain bones. In the human adult, the bone marrow produces all of the red blood cells, 60–70 percent of the white cells (i.e., the granulocytes), and all of the platelets. The lymphatic tissues, particularly the thymus, the spleen, and the lymph nodes, produce the lymphocytes (comprising 20–30 percent of the white cells). The reticuloendothelial tissues of the spleen, liver, lymph nodes, and other organs produce the monocytes (4–8 percent of the white cells). The platelets, which are small cellular fragments rather than complete cells, are formed from bits of the cytoplasm of the giant cells (megakaryocytes) of the bone marrow.

In the human embryo, the first site of blood formation is the yolk sac. Later in embryonic life, the liver becomes the most important red blood cell-forming organ, but it is soon succeeded by the bone marrow, which in adult life is the only source of both red blood cells and the granulocytes. Both the red and white blood cells arise through a series of complex, gradual, and successive transformations from primitive stem cells, which have the ability to form any of the precursors of a blood cell. Precursor cells are stem cells that have developed to the stage where they are committed to forming a particular kind of new blood cell.

In a normal adult the red cells of about half a liter (almost one pint) of blood are produced by the bone marrow every week. Almost 1 percent of the body’s red cells are generated each day, and the balance between red cell production and the removal of aging red cells from the circulation is precisely maintained.

Cells-in-the-Bone-Marrow-1024x747

Cells-in-the-Bone-Marrow-1024×747

http://interactive-biology.com/wp-content/uploads/2012/07/Cells-in-the-Bone-Marrow-1024×747.png

6.2.1.1 Erythropoiesis

http://www.interactive-biology.com/3969/erythropoiesis-formation-of-red-blood-cells/

Erythropoiesis – Formation of Red Blood Cells

Because of the inability of erythrocytes (red blood cells) to divide to replenish their own numbers, the old ruptured cells must be replaced by totally new cells. They meet their demise because they don’t have the usual specialized intracellular machinery, which controls cell growth and repair, leading to a short life span of 120 days.

This short life span necessitates the process erythropoiesis, which is the formation of red blood cells. All blood cells are formed in the bone marrow. This is the erythrocyte factory, which is soft, highly cellar tissue that fills the internal cavities of bones.

Erythrocyte differentiation takes place in 8 stages. It is the pathway through which an erythrocyte matures from a hemocytoblast into a full-blown erythrocyte. The first seven all take place within the bone marrow. After stage 7 the cell is then released into the bloodstream as a reticulocyte, where it then matures 1-2 days later into an erythrocyte. The stages are as follows:

  1. Hemocytoblast, which is a pluripotent hematopoietic stem cell
  2. Common myeloid progenitor, a multipotent stem cell
  3. Unipotent stem cell
  4. Pronormoblast
  5. Basophilic normoblast also called an erythroblast.
  6. Polychromatophilic normoblast
  7. Orthochromatic normoblast
  8. Reticulocyte

These characteristics can be seen during the course of erythrocyte maturation:

  • The size of the cell decreases
  • The cytoplasm volume increases
  • Initially there is a nucleus and as the cell matures the size of the nucleus decreases until it vanishes with the condensation of the chromatin material.

Low oxygen tension stimulates the kidneys to secrete the hormone erythropoietin into the blood, and this hormone stimulates the bone marrow to produce erythrocytes.

Rarely, a malignancy or cancer of erythropoiesis occurs. It is referred to as erythroleukemia. This most likely arises from a common myeloid precursor, and it may occur associated with a myelodysplastic syndrome.

Summary of erythrocyte maturation

6.2.1.2 White blood cell series: myelopoiesis

http://www.nlm.nih.gov/medlineplus/ency/presentations/100151_3.htm

http://www.nlm.nih.gov/medlineplus/ency/images/ency/fullsize/15220.jpg

There are various types of white blood cells (WBCs) that normally appear in the blood: neutrophils (polymorphonuclear leukocytes; PMNs), band cells (slightly immature neutrophils), T-type lymphocytes (T cells), B-type lymphocytes (B cells), monocytes, eosinophils, and basophils. T and B-type lymphocytes are indistinguishable from each other in a normal slide preparation. Any infection or acute stress will result in an increased production of WBCs. This usually entails increased numbers of cells and an increase in the percentage of immature cells (mainly band cells) in the blood. This change is referred to as a “shift to the left” People who have had a splenectomy have a persistent mild elevation of WBCs. Drugs that may increase WBC counts include epinephrine, allopurinol, aspirin, chloroform, heparin, quinine, corticosteroids, and triamterene. Drugs that may decrease WBC counts include antibiotics, anticonvulsants, antihistamine, antithyroid drugs, arsenicals, barbiturates, chemotherapeutic agents, diuretics and sulfonamides.   (Updated by: David C. Dugdale, III, MD)

https://www.med-ed.virginia.edu/courses/path/innes/nh/wcbmaturation.cfm

Note that the mature forms of the myeloid series (neutrophils, eosinophils, basophils), all have lobed (segmented) nuclei. The degree of lobation increases as the cells mature.

The earliest recognizable myeloid cell is the myeloblast (10-20m dia) with a large round to oval nucleus. There is fine diffuse immature chromatin (without clumping) and a prominant nucleolus.

The cytoplasm is basophilic without granules. Although one may see a small golgi area adjacent to the nucleus, granules are not usually visible by light microscopy. One should not see blast cells in the peripheral blood.

myeloblast x100b

myeloblast x100b

https://www.med-ed.virginia.edu/courses/path/innes/images/nhjpeg/nh%20myeloblast%20x100b.jpeg

The promyelocyte (10-20m) is slightly larger than a blast. Its nucleus, although similar to a myeloblast shows slight chromatin condensation and less prominent nucleoli. The cytoplasm contains striking azurophilic granules or primary granules. These granules contain myeloperoxidase, acid phosphatase, and esterase enzymes. Normally no promyelocytes are seen in the peripheral blood.

At the point in development when secondary granules can be recognized, the cell becomes a myelocyte.

promyelocyte x100

promyelocyte x100

https://www.med-ed.virginia.edu/courses/path/innes/images/nhjpeg/nh%20promyelocyte%20×100%20a.jpeg

Myelocytes (10-18m) are not normally found in the peripheral blood. Nucleoli may not be seen in the late myelocyte. Primary azurophilic granules are still present, but secondary granules predominate. Secondary granules (neut, eos, or baso) first appear adjacent to the nucleus. In neutrophils this is the “dawn” of neutrophilia.

Metamyelocytes (10-18m) have kidney shaped indented nuclei and dense chromatin along the nuclear membrane. The cytoplasm is faintly pink, and they have secondary granules (neutro, eos, or baso). Zero to one percent of the peripheral blood white cells may be metamyelocytes (juveniles).

metamyelocyte x100

metamyelocyte x100

https://www.med-ed.virginia.edu/courses/path/innes/images/nhjpeg/nh%20metamyelocyte%20×100.jpeg

Bands, slightly smaller than juveniles, are marked by a U-shaped or deeply indented nucleus.

band neutrophilx100a

band neutrophilx100a

https://www.med-ed.virginia.edu/courses/path/innes/images/nhjpeg/nh%20band%20x100a.jpeg

Segmented (segs) or polymorphonuclear (PMN) leukocytes (average 14 m dia) are distinguished by definite lobation with thin thread-like filaments of chromatin joining the 2-5 lobes. 45-75% of the peripheral blood white cells are segmented neutrophils.

https://www.med-ed.virginia.edu/courses/path/innes/images/nhjpeg/nh%20neutrophil%20×100%20d.jpeg

6.2.1.3 Thrombocytogenesis

The incredible journey: From megakaryocyte development to platelet formation

Kellie R. Machlus1,2 and Joseph E. Italiano Jr
JCB 2013; 201(6): 785-796
http://dx.doi.org:/10.1083/jcb.201304054

Large progenitor cells in the bone marrow called megakaryocytes (MKs) are the source of platelets. MKs release platelets through a series of fascinating cell biological events. During maturation, they become polyploid and accumulate massive amounts of protein and membrane. Then, in a cytoskeletal-driven process, they extend long branching processes, designated proplatelets, into sinusoidal blood vessels where they undergo fission to release platelets.

megakaryocyte production of platelets

megakaryocyte production of platelets

http://dm5migu4zj3pb.cloudfront.net/manuscripts/26000/26891/medium/JCI0526891.f4.jpg

platelets and the immune continuum nri2956-f3

platelets and the immune continuum nri2956-f3

http://www.nature.com/nri/journal/v11/n4/images/nri2956-f3.jpg

6.2.2 Classification of hematological malignancies
Practical Diagnosis of Hematologic Disoreders. 4th edition. Vol 2.
Kjeldsberg CR, Ed.  ASCP Press.  2006. Chicago, IL.

6.2.2.1 Primary Classification

6.2.2.1.1 Acute leukemias

6.2.2.1.1 Myelodysplastic syndromes

6.2.2.1.2 Acute myeloid leukemia

6.2.2.1.3 Acute lymphoblastic leukemia

6.2.2.2 Myeloproliferative Disorders

6.2.2.2.1 Chronic myeloproliferative disorders

6.2.2.2.2 Chronic myelogenous leukemia and related disorders

6.2.2.2.3 Myelofibrosis, including chronic idiopathic

6.2.2.2.4 Polycythemia, including polycythemia rubra vera

6.2.2.2.5 Thrombocytosis, including essential thrombocythemia

6.2.2.3 Chronic lymphoid leukemia and other lymphoid leukemias

6.2.2.4 Lymphomas

6.2.2.4.1 Non-Hodgkin Lymphoma

6.2.2.4.2 Hodgkin lymphoma

6.2.2.5 Lymphoproliferative disorders associated with immunodeficiency

6.2.2.6 Plasma Cell dyscrasias

6.2.2.7 Mast cell disease and Histiocytic neoplasms

6.2.3 Secondary Classification

6.2.3.1 Nuance – PathologyOutlines
Nat Pernick, Ed.

http://www.pathologyoutlines.com/leukemia.html

This site is up-to-date and revised periodically. It is the best site for pathology information.

6.2.4 Diagnostics

6.2.4.1 Computer-aided diagnostics

6.2.4.1.1 Back-to-Front Design

Robert Didner
Bell Laboratories

Decision-making in the clinical setting
Didner, R  Mar 1999  Amer Clin Lab

Mr. Didner is an Independent Consultant in Systems Analysis, Information Architecture (Informatics) Operations Research, and Human Factors Engineering (Cognitive Psychology),  Decision Information Designs, 29 Skyline Dr., Morristown, NJ07960, U.S.A.; tel.: 973-455-0489; fax/e-mail: bdidner@hotmail.com

A common problem in the medical profession is the level of effort dedicated to administration and paperwork necessitated by various agencies, which contributes to the high cost of medical care. Costs would be reduced and accuracy improved if the clinical data could be captured directly at the point they are generated in a form suitable for transmission to insurers or machine transformable into other formats. Such a capability could also be used to improve the form and the structure of information presented to physicians and support a more comprehensive database linking clinical protocols to outcomes, with the prospect of improving clinical outcomes. Although the problem centers on the physician’s process of determining the diagnosis and treatment of patients and the timely and accurate recording of that process in the medical system, it substantially involves the pathologist and laboratorian, who interact significantly throughout the in-formation-gathering process. Each of the currently predominant ways of collecting information from diagnostic protocols has drawbacks. Using blank paper to collect free-form notes from the physician is not amenable to computerization; such free-form data are also poorly formulated, formatted, and organized for the clinical decision-making they support. The alternative of preprinted forms listing the possible tests, results, and other in-formation gathered during the diagnostic process facilitates the desired computerization, but the fixed sequence of tests and questions they present impede the physician from using an optimal decision-making sequence. This follows because:

  • People tend to make decisions and consider information in a step-by-step manner in which intermediate decisions are intermixed with data acquisition steps.
  • The sequence in which components of decisions are made may alter the decision outcome.
  • People tend to consider information in the sequence it is requested or displayed.
  • Since there is a separate optimum sequence of tests and questions for each cluster of history and presenting symptoms, there is no one sequence of tests and questions that can be optimal for all presenting clusters.
  • As additional data and test results are acquired, the optimal sequence of further testing and data acquisition changes, depending on the already acquired information.

Therefore, promoting an arbitrary sequence of information requests with preprinted forms may detract from outcomes by contributing to a non-optimal decision-making sequence. Unlike the decisions resulting from theoretical or normative processes, decisions made by humans are path dependent; that is, the out-come of a decision process may be different if the same components are considered in a different sequence.

Proposed solution

This paper proposes a general approach to gathering data at their source in computer-based form so as to improve the expected outcomes. Such a means must be interactive and dynamic, so that at any point in the clinical process the patient’s presenting symptoms, history, and the data already collected are used to determine the next data or tests requested. That de-termination must derive from a decision-making strategy designed to produce outcomes with the greatest value and supported by appropriate data collection and display techniques. The strategy must be based on the knowledge of the possible outcomes at any given stage of testing and information gathering, coupled with a metric, or hierarchy of values for assessing the relative desirability of the possible outcomes.

A value hierarchy

  • The numbered list below illustrates a value hierarchy. In any particular instance, the higher-numbered values should only be considered once the lower- numbered values have been satisfied. Thus, a diagnostic sequence that is very time or cost efficient should only be considered if it does not increase the likelihood (relative to some other diagnostic sequence) that a life-threatening disorder may be missed, or that one of the diagnostic procedures may cause discomfort.
  • Minimize the likelihood that a treatable, life-threatening disorder is not treated.
  • Minimize the likelihood that a treatable, discomfort-causing disorder is not treated.
  • Minimize the likelihood that a risky procedure(treatment or diagnostic procedure) is inappropriately administered.
  • Minimize the likelihood that a discomfort-causing procedure is inappropriately administered.
  • Minimize the likelihood that a costly procedure is inappropriately administered.
  • Minimize the time of diagnosing and treating thepatient.8.Minimize the cost of diagnosing and treating the patient.

The above hierarchy is relative, not absolute; for many patients, a little bit of testing discomfort may be worth a lot of time. There are also some factors and graduations intentionally left out for expository simplicity (e.g., acute versus chronic disorders).This value hierarchy is based on a hypothetical patient. Clearly, the hierarchy of a health insurance carrier might be different, as might that of another patient (e.g., a geriatric patient). If the approach outlined herein were to be followed, a value hierarchy agreed to by a majority of stakeholders should be adopted.

Efficiency

Once the higher values are satisfied, the time and cost of diagnosis and treatment should be minimized. One way to do so would be to optimize the sequence in which tests are performed, so as to minimize the number, cost, and time of tests that need to be per-formed to reach a definitive decision regarding treatment. Such an optimum sequence could be constructed using Claude Shannon’s information theory.

According to this theory, the best next question to ask under any given situation (assuming the question has two possible outcomes) is that question that divides the possible outcomes into two equally likely sets. In the real world, all tests or questions are not equally valuable, costly, or time consuming; therefore, value(risk factors), cost, and time should be used as weighting factors to optimize the test sequence, but this is a complicating detail at this point.

A value scale

For dynamic computation of outcome values, the hierarchy could be converted into a weighted value scale so differing outcomes at more than one level of the hierarchy could be readily compared. An example of such a weighted value scale is Quality Adjusted Life Years (QALY).

Although QALY does not incorporate all of the factors in this example, it is a good conceptual starting place.

The display, request, decision-making relationship

For each clinical determination, the pertinent information should be gathered, organized, formatted, and formulated in a way that facilitates the accuracy, reliability, and efficiency with which that determination is made. A physician treating a patient with high cholesterol and blood pressure (BP), for example, may need to know whether or not the patient’s cholesterol and BP respond to weight changes to determine an appropriate treatment (e.g., weight control versus medication). This requires searching records for BP, certain blood chemicals (e.g., HDLs, LDLs, triglycerides, etc.), and weight from several

sources, then attempting to track them against each other over time. Manually reorganizing this clinical information each time it is used is extremely inefficient. More important, the current organization and formatting defies principles of human factors for optimally displaying information to enhance human information-processing characteristics, particularly for decision support.

While a discussion of human factors and cognitive psychology principles is beyond the scope of this paper, following are a few of the system design principles of concern:

  • Minimize the load on short-term memory.
  • Provide information pertinent to a given decision or component of a decision in a compact, contiguous space.
  • Take advantage of basic human perceptual and pat-tern recognition facilities.
  • Design the form of an information display to com-plement the decision-making task it supports.

F i g u re 1 shows fictitious, quasi-random data from a hypothetical patient with moderately elevated cholesterol. This one-page display pulls together all the pertinent data from six years of blood tests and related clinical measurements. At a glance, the physician’s innate pattern recognition, color, and shape perception facilities recognize the patient’s steadily increasing weight, cholesterol, BP, and triglycerides as well as the declining high-density lipoproteins. It would have taken considerably more time and effort to grasp this information from the raw data collection and blood test reports as they are currently presented in independent, tabular time slices.

Design the formulation of an information display to complement the decision-making task.

The physician may wish to know only the relationship between weight and cardiac risk factors rather than whether these measures are increasing or decreasing, or are within acceptable or marginal ranges. If so, Table 1 shows the correlations between weight and the other factors in a much more direct and simple way using the same data as in Figure 1. One can readily see the same conclusions about relations that were drawn from Figure 1.This type of abstract, symbolic display of derived information also makes it easier to spot relationships when the individual variables are bouncing up and down, unlike the more or less steady rise of most values in Figure 1. This increase in precision of relationship information is gained at the expense of other types of information (e.g., trends). To display information in an optimum form then, the system designer must know what the information demands of the task are at the point in the task when the display is to be used.

Present the sequence of information display clusters to complement an optimum decision-making strategy.

Just as a fixed sequence of gathering clinical, diagnostic information may lead to a far from optimum outcome, there exists an optimum sequence of testing, considering information, and gathering data that will lead to an optimum outcome (as defined by the value hierarchy) with a minimum of time and expense. The task of the information system designer, then, is to provide or request the right information, in the best form, at each stage of the procedure. For ex-ample, Figure 1 is suitable for the diagnostic phase since it shows the current state of the risk factors and their trends. Table 1, on the other hand, might be more appropriate in determining treatment, where there may be a choice of first trying a strict dietary treatment, or going straight to a combination of diet plus medication. The fact that Figure 1 and Table 1 have somewhat redundant information is not a problem, since they are intended to optimally provide information for different decision-making tasks. The critical need, at this point, is for a model of how to determine what information should be requested, what tests to order, what information to request and display, and in what form at each step of the decision-making process. Commitment to a collaborative relationship between physicians and laboratorians and other information providers would be an essential requirement for such an undertaking. The ideal diagnostic data-collection instrument is a flexible, computer-based device, such as a notebook computer or Personal Digital Assistant (PDA) sized device.

Barriers to interactive, computer-driven data collection at the source

As with any major change, it may be difficult to induce many physicians to change their behavior by interacting directly with a computer instead of with paper and pen. Unlike office workers, who have had to make this transition over the past three decades, most physicians’ livelihoods will not depend on converting to computer interaction. Therefore, the transition must be made attractive and the changes less onerous. Some suggestions follow:

  1. Make the data collection a natural part of the clinical process.
  2. Ensure that the user interface is extremely friendly, easy to learn, and easy to use.
  3. Use a small, portable device.
  4. Use the same device for collection and display of existing information (e.g., test results and his-tory).
  5. Minimize the need for free-form written data entry (use check boxes, forms, etc.).
  6. Allow the entry of notes in pen-based free-form (with the option of automated conversion of numeric data to machine-manipulable form).
  7. Give the physicians a more direct benefit for collecting data, not just a means of helping a clerk at an HMO second-guess the physician’s judgment.
  8. Improve administrative efficiency in the office.
  9. Make the data collection complement the clinical decision-making process.
  10. Improve information displays, leading to better outcomes.
  11. Make better use of the physician’s time and mental effort.

Conclusion

The medical profession is facing a crisis of information. Gathering information is costing a typical practice more and more while fees are being restricted by third parties, and the process of gathering this in-formation may be detrimental to current outcomes. Gathered properly, in machine-manipulable form, these data could be reformatted so as to greatly improve their value immediately in the clinical setting by leading to decisions with better outcomes and, in the long run, by contributing to a clinical data warehouse that could greatly improve medical knowledge. The challenge is to create a mechanism for data collection that facilitates, hastens, and improves the outcomes of clinical activity while minimizing the inconvenience and resistance to change on the part of clinical practitioners. This paper is intended to provide a high-level overview of how this may be accomplished, and start a dialogue along these lines.

References

  1. Tversky A. Elimination by aspects: a theory of choice. Psych Rev 1972; 79:281–99.
  2. Didner RS. Back-to-front design: a guns and butter approach. Ergonomics 1982; 25(6):2564–5.
  3. Shannon CE. A mathematical theory of communication. Bell System Technical J 1948; 27:379–423 (July), 623–56 (Oct).
  4. Feeny DH, Torrance GW. Incorporating utility-based quality-of-life assessment measures in clinical trials: two examples. Med Care 1989; 27:S190–204.
  5. Smith S, Mosier J. Guidelines for designing user interface soft-ware. ESD-TR-86-278, Aug 1986.
  6. Miller GA. The magical number seven plus or minus two. Psych Rev 1956; 65(2):81–97.
  7. Sternberg S. High-speed scanning in human memory. Science 1966; 153: 652–4.

Table 1

Correlation of weight with other cardiac risk factors

Cholesterol 0.759384
HDL 0.53908
LDL 0.177297
BP-syst. 0.424728
BP-dia. 0.516167
Triglycerides 0.637817

Figure 1  Hypothetical patient data.

(not shown)

6.2.4.1.2 Realtime Clinical Expert Support

http://pharmaceuticalintelligence.com/2015/05/10/realtime-clinical-expert-support/

6.2.4.1.3 Regression: A richly textured method for comparison and classification of predictor variables

http://pharmaceuticalintelligence.com/2012/08/14/regression-a-richly-textured-method-for-comparison-and-classification-of-predictor-variables/

6.2.4.1.4 Converting Hematology Based Data into an Inferential Interpretation

Larry H. Bernstein, Gil David, James Rucinski and Ronald R. Coifman
In Hematology – Science and Practice
Lawrie CH, Ch 22. Pp541-552.
InTech Feb 2012, ISBN 978-953-51-0174-1
https://www.researchgate.net/profile/Larry_Bernstein/publication/221927033_Converting_Hematology_Based_Data_into_an_Inferential_Interpretation/links/0fcfd507f28c14c8a2000000.pdf

6.2.4.1.5 A model for Thalassemia Screening using Hematology Measurements

https://www.researchgate.net/profile/Larry_Bernstein/publication/258848064_A_model_for_Thalassemia_Screening_using_Hematology_Measurements/links/0c9605293c3048060b000000.pdf

A model for automated screening of thalassemia in hematology (math study).

Kneifati-Hayek J, Fleischman W, Bernstein LH, Riccioli A, Bellevue R.
Lab Hematol. 2007; 13(4):119-23. http://dx.doi.org:/10.1532/LH96.07003.

The results of 398 patient screens were collected. Data from the set were divided into training and validation subsets. The Mentzer ratio was determined through a receiver operating characteristic (ROC) curve on the first subset, and screened for thalassemia using the second subset. HgbA2 levels were used to confirm beta-thalassemia.

RESULTS: We determined the correct decision point of the Mentzer index to be a ratio of 20. Physicians can screen patients using this index before further evaluation for beta-thalassemia (P < .05).

CONCLUSION: The proposed method can be implemented by hospitals and laboratories to flag positive matches for further definitive evaluation, and will enable beta-thalassemia screening of a much larger population at little to no additional cost.

6.2.4.1.6 Measurement of granulocyte maturation may improve the early diagnosis of the septic state.

Bernstein LH, Rucinski J. Clin Chem Lab Med. 2011 Sep 21;49(12):2089-95.
http://dx.doi.org:/10.1515/CCLM.2011.688.

6.2.4.1.7 The automated malnutrition assessment.

David G, Bernstein LH, Coifman RR. Nutrition. 2013 Jan; 29(1):113-21.
http://dx.doi.org:/10.1016/j.nut.2012.04.017

6.2.4.2 Molecular Diagnostics

6.2.4.2.1 Genomic Analysis of Hematological Malignancies

Acute lymphoblastic leukemia (ALL) is the most common hematologic malignancy that occurs in children. Although more than 90% of children with ALL now survive to adulthood, those with the rarest and high-risk forms of the disease continue to have poor prognoses. Through the Pediatric Cancer Genome Project (PCGP), investigators in the Hematological Malignancies Program are identifying the genetic aberrations that cause these aggressive forms of leukemias. Here we present two studies on the genetic bases of early T-cell precursor ALL and acute megakaryoblastic leukemia.

  • Early T-Cell Precursor ALL Is Characterized by Activating Mutations
  • The CBFA2T3-GLIS2Fusion Gene Defines an Aggressive Subtype of Acute Megakaryoblastic Leukemia in Children

Early T-cell precursor ALL (ETP-ALL), which comprises 15% of all pediatric T-cell leukemias, is an aggressive disease that is typically resistant to contemporary therapies. Children with ETP-ALL have a high rate of relapse and an extremely poor prognosis (i.e., 5-year survival is approximately 20%). The genetic basis of ETP-ALL has remained elusive. Although ETP-ALL is associated with a high burden of DNA copy number aberrations, none are consistently found or suggest a unifying genetic alteration that drives this disease.

Through the efforts of the PCGP, Jinghui Zhang, PhD (Computational Biology), James R. Downing, MD (Pathology), Charles G. Mullighan, MBBS(Hons), MSc, MD (Pathology), and colleagues analyzed the whole-genome sequences of leukemic cells and matched normal DNA from 12 pediatric patients with ETP-ALL. The identified genetic mutations were confirmed in a validation cohort of 52 ETP-ALL specimens and 42 non-ETP T-lineage ALLs (T-ALL).

In the journal Nature, the investigators reported that each ETP-ALL sample carried an average of 1140 sequence mutations and 12 structural variations. Of the structural variations, 51% were breakpoints in genes with well-established roles in hematopoiesis or leukemogenesis (e.g., MLH2,SUZ12, and RUNX1). Eighty-four percent of the structural variations either caused loss of function of the gene in question or resulted in the formation of a fusion gene such as ETV6-INO80D. The ETV6 gene, which encodes a protein that is essential for hematopoiesis, is frequently mutated in leukemia. Among the DNA samples sequenced in this study, ETV6 was altered in 33% of ETP-ALL but only 10% of T-ALL cases.

6.2.4.2.2 Next-generation sequencing in hematologic malignancies: what will be the dividends?

Jason D. Merker, Anton Valouev, and Jason Gotlib
Ther Adv Hematol. 2012 Dec; 3(6): 333–339.
http://dx.doi.org:/10.1177/2040620712458948

The application of high-throughput, massively parallel sequencing technologies to hematologic malignancies over the past several years has provided novel insights into disease initiation, progression, and response to therapy. Here, we describe how these new DNA sequencing technologies have been applied to hematolymphoid malignancies. With further improvements in the sequencing and analysis methods as well as integration of the resulting data with clinical information, we expect these technologies will facilitate more precise and tailored treatment for patients with hematologic neoplasms.

6.2.4.2.3 Leveraging cancer genome information in hematologic malignancies.

Rampal R1, Levine RL.
J Clin Oncol. 2013 May 20; 31(15):1885-92.
http://dx.doi.org:/10.1200/JCO.2013.48.7447

The use of candidate gene and genome-wide discovery studies in the last several years has led to an expansion of our knowledge of the spectrum of recurrent, somatic disease alleles, which contribute to the pathogenesis of hematologic malignancies. Notably, these studies have also begun to fundamentally change our ability to develop informative prognostic schema that inform outcome and therapeutic response, yielding substantive insights into mechanisms of hematopoietic transformation in different tissue compartments. Although these studies have already had important biologic and translational impact, significant challenges remain in systematically applying these findings to clinical decision making and in implementing new technologies for genetic analysis into clinical practice to inform real-time decision making. Here, we review recent major genetic advances in myeloid and lymphoid malignancies, the impact of these findings on prognostic models, our understanding of disease initiation and evolution, and the implication of genomic discoveries on clinical decision making. Finally, we discuss general concepts in genetic modeling and the current state-of-the-art technology used in genetic investigation.

6.2.4.2.4 p53 mutations are associated with resistance to chemotherapy and short survival in hematologic malignancies

E Wattel, C Preudhomme, B Hecquet, M Vanrumbeke, et AL.
Blood, (Nov 1), 1994; 84(9): pp 3148-3157
http://www.bloodjournal.org/content/bloodjournal/84/9/3148.full.pdf

We analyzed the prognostic value of p53 mutations for response to chemotherapy and survival in acute myeloid leukemia (AML), myelodysplastic syndrome (MDS), and chronic lymphocytic leukemia (CLL). Mutations were detected by single-stranded conformation polymorphism (SSCP) analysis of exons 4 to 10 of the P53 gene, and confirmed by direct sequencing. A p53 mutation was found in 16 of 107 (15%) AML, 20 of 182 (11%) MDS, and 9 of 81 (11%) CLL tested. In AML, three of nine (33%) mutated cases and 66 of 81 (81%) nonmutated cases treated with intensive chemotherapy achieved complete remission (CR) (P = .005) and none of five mutated cases and three of six nonmutated cases treated by low-dose Ara C achieved CR or partial remission (PR) (P = .06). Median actuarial survival was 2.5 months in mutated cases, and 15 months in nonmutated cases (P < lo-‘). In the MDS patients who received chemotherapy (intensive chemotherapy or low-dose Ara C), 1 of 13 (8%) mutated cases and 23 of 38 (60%) nonmutated cases achieved CR or PR (P = .004), and median actuarial survival was 2.5 and 13.5 months, respectively (P C lo-’). In all MDS cases (treated and untreated), the survival difference between mutated cases and nonmutated cases was also highly significant. In CLL, 1 of 8 (12.5%) mutated cases treated by chemotherapy (chlorambucil andlor CHOP andlor fludarabine) responded, as compared with 29 of 36 (80%) nonmutated cases (P = .02). In all CLL cases, survival from p53 analysis was significantly shorter in mutated cases (median 7 months) than in nonmutated cases (median not reached) (P < IO-’). In 35 of the 45 mutated cases of AML, MDS, and CLL, cytogenetic analysis or SSCP and sequence findings showed loss of the nonmutated P53 allele. Our findings show that p53 mutations are a strong prognostic indicator of response to chemotherapy and survival in AML, MDS, and CLL. The usual association of p53 mutations to loss of the nonmutated P53 allele, in those disorders, ie, to absence of normal p53 in tumor cells, suggests that p53 mutations could induce drug resistance, at least in part, by interfering with normal apoptotic pathways in tumor cells.

6.2.4.2.5 Genomic approaches to hematologic malignancies

Benjamin L. Ebert and Todd R. Golub
Blood. 2004; 104:923-932
https://www.broadinstitute.org/mpr/publications/projects/genomics/Review%20Genomics%20of%20Heme%20Malig,%20Blood%202004.pdf

In the past several years, experiments using DNA microarrays have contributed to an increasingly refined molecular taxonomy of hematologic malignancies. In addition to the characterization of molecular profiles for known diagnostic classifications, studies have defined patterns of gene expression corresponding to specific molecular abnormalities, oncologic phenotypes, and clinical outcomes. Furthermore, novel subclasses with distinct molecular profiles and clinical behaviors have been identified. In some cases, specific cellular pathways have been highlighted that can be therapeutically targeted. The findings of microarray studies are beginning to enter clinical practice as novel diagnostic tests, and clinical trials are ongoing in which therapeutic agents are being used to target pathways that were identified by gene expression profiling. While the technology of DNA microarrays is becoming well established, genome-wide surveys of gene expression generate large data sets that can easily lead to spurious conclusions. Many challenges remain in the statistical interpretation of gene expression data and the biologic validation of findings. As data accumulate and analyses become more sophisticated, genomic technologies offer the potential to generate increasingly sophisticated insights into the complex molecular circuitry of hematologic malignancies. This review summarizes the current state of discovery and addresses key areas for future research.

6.2.4.3 Flow cytometry

Introduction to Flow Cytometry: Blood Cell Identification

Dana L. Van Laeys
https://www.labce.com/flow_cytometry.aspx

No other laboratory method provides as rapid and detailed analysis of cellular populations as flow cytometry, making it a valuable tool for diagnosis and management of several hematologic and immunologic diseases. Understanding this relevant methodology is important for any medical laboratory scientist.

Whether you have no previous experience with flow cytometry or just need a refresher, this course will help you to understand the basic principles, with the help of video tutorials and interactive case studies.

Basic principles include:

  1. Immunophenotypic features of various types of hematologic cells
  2. Labeling cellular elements with fluorochromes
  3. Blood cell identification, specifically B and T lymphocyte identification and analysis
  4. Cell sorting to isolate select cell population for further analysis
  5. Analyzing and interpreting result reports and printouts

6.2.5 Treatments

6.2.5.1 Treatments for leukemia by type

6.2.5.1.1 Acute lymphocytic leukemias

6.2.5.1.1.1 Treatment of Acute Lymphoblastic Leukemia

Ching-Hon Pu, and William E. Evans
N Engl J Med Jan 12, 2006; 354:166-178
http://dx.doi.org:/10.1056/NEJMra052603

Although the overall cure rate of acute lymphoblastic leukemia (ALL) in children is about 80 percent, affected adults fare less well. This review considers recent advances in the treatment of ALL, emphasizing issues that need to be addressed if treatment outcome is to improve further.

6.2.5.1.1.2 Acute Lymphoblastic Leukemia

Ching-Hon Pui, Mary V. Relling, and James R. Downing
N Engl J Med Apr 8, 2004; 350:1535-1548
http://dx.doi.org:/10.1056/NEJMra023001

This comprehensive survey emphasizes how recent advances in the knowledge of molecular mechanisms involved in acute lymphoblastic leukemia have influenced diagnosis, prognosis, and treatment.

6.2.5.1.1.3 Gene-Expression Patterns in Drug-Resistant Acute Lymphoblastic Leukemia Cells and Response to Treatment

Amy Holleman, Meyling H. Cheok, Monique L. den Boer, et al.
N Engl J Med 2004; 351:533-42

Childhood acute lymphoblastic leukemia (ALL) is curable with chemotherapy in approximately 80 percent of patients. However, the cause of treatment failure in the remaining 20 percent of patients is largely unknown.

Methods We tested leukemia cells from 173 children for sensitivity in vitro to prednisolone, vincristine, asparaginase, and daunorubicin. The cells were then subjected to an assessment of gene expression with the use of 14,500 probe sets to identify differentially expressed genes in drug-sensitive and drug-resistant ALL. Gene-expression patterns that differed according to sensitivity or resistance to the four drugs were compared with treatment outcome in the original 173 patients and an independent cohort of 98 children treated with the same drugs at another institution.

Results We identified sets of differentially expressed genes in B-lineage ALL that were sensitive or resistant to prednisolone (33 genes), vincristine (40 genes), asparaginase (35 genes), or daunorubicin (20 genes). A combined gene-expression score of resistance to the four drugs, as compared with sensitivity to the four, was significantly and independently related to treatment outcome in a multivariate analysis (hazard ratio for relapse, 3.0; P=0.027). Results were confirmed in an independent population of patients treated with the same medications (hazard ratio for relapse, 11.85; P=0.019). Of the 124 genes identified, 121 have not previously been associated with resistance to the four drugs we tested.

Conclusions  Differential expression of a relatively small number of genes is associated with drug resistance and treatment outcome in childhood ALL.

6.2.5.1.1.4 Leukemias Treatment & Management

Author: Lihteh Wu, MD; Chief Editor: Hampton Roy Sr
http://emedicine.medscape.com/article/1201870-treatment

The treatment of leukemia is in constant flux, evolving and changing rapidly over the past few years. Most treatment protocols use systemic chemotherapy with or without radiotherapy. The basic strategy is to eliminate all detectable disease by using cytotoxic agents. To attain this goal, 3 phases are typically used, as follows: remission induction phase, consolidation phase, and maintenance therapy phase.

Chemotherapeutic agents are chosen that interfere with cell division. Tumor cells usually divide more rapidly than host cells, making them more vulnerable to the effects of chemotherapy. Primary treatment will be under the direction of a medical oncologist, radiation oncologist, and primary care physician. Although a general treatment plan will be outlined, the ophthalmologist does not prescribe or manage such treatment.

  • The initial treatment of ALL uses various combinations of vincristine, prednisone, and L-asparaginase until a complete remission is obtained.
  • Maintenance therapy with mercaptopurine is continued for 2-3 years following remission.
  • Use of intrathecal methotrexate with or without cranial irradiation to cover the CNS varies from facility to facility.
  • Daunorubicin, cytarabine, and thioguanine currently are used to obtain induction and remission of AML.
  • Maintenance therapy for 8 months may lengthen remission. Once relapse has occurred, AML generally is curable only by bone marrow transplantation.
  • Presently, treatment of CLL is palliative.
  • CML is characterized by a leukocytosis greater than 100,000 cells. Emergent treatment with leukopheresis sometimes is necessary when leukostastic complications are present. Otherwise, busulfan or hydroxyurea may control WBC counts. During the chronic phase, treatment is palliative.
  • When CML converts to the blastic phase, approximately one third of cases behave as ALL and respond to treatment with vincristine and prednisone. The remaining two thirds resemble AML but respond poorly to AML therapy.
  • Allogeneic bone marrow transplant is the only curative therapy for CML. However, it carries a high early mortality rate.
  • Leukemic retinopathy usually is not treated directly. As the hematological parameters normalize with systemic treatment, many of the ophthalmic signs resolve. There are reports that leukopheresis for hyperviscosity also may alleviate intraocular manifestations.
  • When definite intraocular leukemic infiltrates fail to respond to systemic chemotherapy, direct radiation therapy is recommended.
  • Relapse, manifested by anterior segment involvement, should be treated by radiation. In certain cases, subconjunctival chemotherapeutic agents have been injected.
  • Optic nerve head infiltration in patients with ALL is an emergency and requires prompt radiation therapy to try to salvage some vision.

6.2.5.1.1.5 Treatments and drugs

http://www.mayoclinic.org/diseases-conditions/leukemia/basics/
treatment/con-20024914

Common treatments used to fight leukemia include:

  • Chemotherapy. Chemotherapy is the major form of treatment for leukemia. This drug treatment uses chemicals to kill leukemia cells.

Depending on the type of leukemia you have, you may receive a single drug or a combination of drugs. These drugs may come in a pill form, or they may be injected directly into a vein.

  • Biological therapy. Biological therapy works by using treatments that help your immune system recognize and attack leukemia cells.
  • Targeted therapy. Targeted therapy uses drugs that attack specific vulnerabilities within your cancer cells.

For example, the drug imatinib (Gleevec) stops the action of a protein within the leukemia cells of people with chronic myelogenous leukemia. This can help control the disease.

  • Radiation therapy. Radiation therapy uses X-rays or other high-energy beams to damage leukemia cells and stop their growth. During radiation therapy, you lie on a table while a large machine moves around you, directing the radiation to precise points on your body.

You may receive radiation in one specific area of your body where there is a collection of leukemia cells, or you may receive radiation over your whole body. Radiation therapy may be used to prepare for a stem cell transplant.

  • Stem cell transplant. A stem cell transplant is a procedure to replace your diseased bone marrow with healthy bone marrow.

Before a stem cell transplant, you receive high doses of chemotherapy or radiation therapy to destroy your diseased bone marrow. Then you receive an infusion of blood-forming stem cells that help to rebuild your bone marrow.

You may receive stem cells from a donor, or in some cases you may be able to use your own stem cells. A stem cell transplant is very similar to a bone marrow transplant.

6.2.5.1.2 Acute Myeloid Leukemia

6.2.5.1.2.1 New treatment approaches in acute myeloid leukemia: review of recent clinical studies.

Norsworthy K1, Luznik L, Gojo I.
Rev Recent Clin Trials. 2012 Aug; 7(3):224-37.
http://www.ncbi.nlm.nih.gov/pubmed/22540908

Standard chemotherapy can cure only a fraction (30-40%) of younger and very few older patients with acute myeloid leukemia (AML). While conventional allografting can extend the cure rates, its application remains limited mostly to younger patients and those in remission. Limited efficacy of current therapies and improved understanding of the disease biology provided a spur for clinical trials examining novel agents and therapeutic strategies in AML. Clinical studies with novel chemotherapeutics, antibodies, different signal transduction inhibitors, and epigenetic modulators demonstrated their clinical activity; however, it remains unclear how to successfully integrate novel agents either alone or in combination with chemotherapy into the overall therapeutic schema for AML. Further studies are needed to examine their role in relation to standard chemotherapy and their applicability to select patient populations based on recognition of unique disease and patient characteristics, including the development of predictive biomarkers of response. With increasing use of nonmyeloablative or reduced intensity conditioning and alternative graft sources such as haploidentical donors and cord blood transplants, the benefits of allografting may extend to a broader patient population, including older AML patients and those lacking a HLA-matched donor. We will review here recent clinical studies that examined novel pharmacologic and immunologic approaches to AML therapy.

6.2.5.1.2.2 Novel approaches to the treatment of acute myeloid leukemia.

Roboz GJ1
Hematology Am Soc Hematol Educ Program. 2011:43-50.
http://dx.doi.org:/10.1182/asheducation-2011.1.43.

Approximately 12 000 adults are diagnosed with acute myeloid leukemia (AML) in the United States annually, the majority of whom die from their disease. The mainstay of initial treatment, cytosine arabinoside (ara-C) combined with an anthracycline, was developed nearly 40 years ago and remains the worldwide standard of care. Advances in genomics technologies have identified AML as a genetically heterogeneous disease, and many patients can now be categorized into clinicopathologic subgroups on the basis of their underlying molecular genetic defects. It is hoped that enhanced specificity of diagnostic classification will result in more effective application of targeted agents and the ability to create individualized treatment strategies. This review describes the current treatment standards for induction, consolidation, and stem cell transplantation; special considerations in the management of older AML patients; novel agents; emerging data on the detection and management of minimal residual disease (MRD); and strategies to improve the design and implementation of AML clinical trials.

Age ≥ 60 years has consistently been identified as an independent adverse prognostic factor in AML, and there are very few long-term survivors in this age group.5 Poor outcomes in elderly AML patients have been attributed to both host- and disease-related factors, including medical comorbidities, physical frailty, increased incidence of antecedent myelodysplastic syndrome and myeloproliferative disorders, and higher frequency of adverse cytogenetics.28 Older patients with multiple poor-risk factors have a high probability of early death and little chance of long-term disease-free survival with standard chemotherapy. In a retrospective analysis of 998 older patients treated with intensive induction at the M.D. Anderson Cancer Center, multivariate analysis identified age ≥ 75 years, unfavorable karyotype, poor performance status, creatinine > 1.3 mg/dL, duration of antecedent hematologic disorder > 6 months, and treatment outside a laminar airflow room as adverse prognostic indicators.29 Patients with 3 or more of these factors had expected complete remission rates of < 20%, 8-week mortality > 50%, and 1-year survival < 10%. The Medical Research Council (MRC) identified cytogenetics, WBC count at diagnosis, age, and de novo versus secondary disease as critical factors influencing survival in > 2000 older patients with AML, but cautioned in their conclusions that less objective factors, such as clinical assessment of “fitness” for chemotherapy, may be equally important in making treatment decisions in this patient population.30 It is hoped that data from comprehensive geriatric assessments of functional status, cognition, mood, quality of life, and other measures obtained during ongoing cooperative group trials will improve our ability to predict how older patients will tolerate treatment.

6.5.1.2.3 Current treatment of acute myeloid leukemia.

Roboz GJ1.
Curr Opin Oncol. 2012 Nov; 24(6):711-9.
http://dx.doi.org:/10.1097/CCO.0b013e328358f62d.

The objectives of this review are to discuss standard and investigational nontransplant treatment strategies for acute myeloid leukemia (AML), excluding acute promyelocytic leukemia.

RECENT FINDINGS: Most adults with AML die from their disease. The standard treatment paradigm for AML is remission induction chemotherapy with an anthracycline/cytarabine combination, followed by either consolidation chemotherapy or allogeneic stem cell transplantation, depending on the patient’s ability to tolerate intensive treatment and the likelihood of cure with chemotherapy alone. Although this approach has changed little in the last three decades, increased understanding of the pathogenesis of AML and improvements in molecular genomic technologies are leading to novel drug targets and the development of personalized, risk-adapted treatment strategies. Recent findings related to prognostically relevant and potentially ‘druggable’ molecular targets are reviewed.

SUMMARY: At the present time, AML remains a devastating and mostly incurable disease, but the combination of optimized chemotherapeutics and molecularly targeted agents holds significant promise for the future.

6.5.1.2.4  Adult Acute Myeloid Leukemia Treatment (PDQ®)
http://www.cancer.gov/cancertopics/pdq/treatment/adultAML/healthprofessional/page9

About This PDQ Summary

This summary is reviewed regularly and updated as necessary by the PDQ Adult Treatment Editorial Board, which is editorially independent of the National Cancer Institute (NCI). The summary reflects an independent review of the literature and does not represent a policy statement of NCI or the National Institutes of Health (NIH).

Board members review recently published articles each month to determine whether an article should:

  • be discussed at a meeting,
  • be cited with text, or
  • replace or update an existing article that is already cited.

Treatment Option Overview for AML

Successful treatment of acute myeloid leukemia (AML) requires the control of bone marrow and systemic disease and specific treatment of central nervous system (CNS) disease, if present. The cornerstone of this strategy includes systemically administered combination chemotherapy. Because only 5% of patients with AML develop CNS disease, prophylactic treatment is not indicated.[1–3]

Treatment is divided into two phases: remission induction (to attain remission) and postremission (to maintain remission). Maintenance therapy for AML was previously administered for several years but is not included in most current treatment clinical trials in the United States, other than for acute promyelocytic leukemia. (Refer to the Adult Acute Myeloid Leukemia in Remission section of this summary for more information.) Other studies have used more intensive postremission therapy administered for a shorter duration of time after which treatment is discontinued.[4] Postremission therapy appears to be effective when given immediately after remission is achieved.[4]

Since myelosuppression is an anticipated consequence of both the leukemia and its treatment with chemotherapy, patients must be closely monitored during therapy. Facilities must be available for hematologic support with multiple blood fractions including platelet transfusions and for the treatment of related infectious complications.[5] Randomized trials have shown similar outcomes for patients who received prophylactic platelet transfusions at a level of 10,000/mm3 rather than 20,000/mm3.[6] The incidence of platelet alloimmunization was similar among groups randomly assigned to receive pooled platelet concentrates from random donors; filtered, pooled platelet concentrates from random donors; ultraviolet B-irradiated, pooled platelet concentrates from random donors; or filtered platelets obtained by apheresis from single random donors.[7] Colony-stimulating factors, for example, granulocyte colony–stimulating factor (G-CSF) and granulocyte-macrophage colony–stimulating factor (GM-CSF), have been studied in an effort to shorten the period of granulocytopenia associated with leukemia treatment.[8] If used, these agents are administered after completion of induction therapy. GM-CSF was shown to improve survival in a randomized trial of AML in patients aged 55 to 70 years (median survival was 10.6 months vs. 4.8 months). In this Eastern Cooperative Oncology Group (ECOG) (EST-1490) trial, patients were randomly assigned to receive GM-CSF or placebo following demonstration of leukemic clearance of the bone marrow;[9] however, GM-CSF did not show benefit in a separate similar randomized trial in patients older than 60 years.[10] In the latter study, clearance of the marrow was not required before initiating cytokine therapy. In a Southwest Oncology Group (NCT00023777) randomized trial of G-CSF given following induction therapy to patients older than 65 years, complete response was higher in patients who received G-CSF because of a decreased incidence of primary leukemic resistance. Growth factor administration did not impact on mortality or on survival.[11,12] Because the majority of randomized clinical trials have not shown an impact of growth factors on survival, their use is not routinely recommended in the remission induction setting.

The administration of GM-CSF or other myeloid growth factors before and during induction therapy, to augment the effects of cytotoxic therapy through the recruitment of leukemic blasts into cell cycle (growth factor priming), has been an area of active clinical research. Evidence from randomized studies of GM-CSF priming have come to opposite conclusions. A randomized study of GM-CSF priming during conventional induction and postremission therapy showed no difference in outcomes between patients who received GM-CSF and those who did not receive growth factor priming.[13,14][Level of evidence: 1iiA] In contrast, a similar randomized placebo-controlled study of GM-CSF priming in patients with AML aged 55 to 75 years showed improved disease-free survival (DFS) in the group receiving GM-CSF (median DFS for patients who achieved complete remission was 23 months vs. 11 months; 2-year DFS was 48% vs. 21%), with a trend towards improvement in overall survival (2-year survival was 39% vs. 27%, P = .082) for patients aged 55 to 64 years.[15][Level of evidence: 1iiDii]

References

  1. Kebriaei P, Champlin R, deLima M, et al.: Management of acute leukemias. In: DeVita VT Jr, Lawrence TS, Rosenberg SA: Cancer: Principles and Practice of Oncology. 9th ed. Philadelphia, Pa: Lippincott Williams & Wilkins, 2011, pp 1928-54.
  2. Wiernik PH: Diagnosis and treatment of acute nonlymphocytic leukemia. In: Wiernik PH, Canellos GP, Dutcher JP, et al., eds.: Neoplastic Diseases of the Blood. 3rd ed. New York, NY: Churchill Livingstone, 1996, pp 283-302.
  3. Morrison FS, Kopecky KJ, Head DR, et al.: Late intensification with POMP chemotherapy prolongs survival in acute myelogenous leukemia–results of a Southwest Oncology Group study of rubidazone versus adriamycin for remission induction, prophylactic intrathecal therapy, late intensification, and levamisole maintenance. Leukemia 6 (7): 708-14, 1992. [PUBMED Abstract]
  4. Cassileth PA, Lynch E, Hines JD, et al.: Varying intensity of postremission therapy in acute myeloid leukemia. Blood 79 (8): 1924-30, 1992. [PUBMED Abstract]
  5. Supportive Care. In: Wiernik PH, Canellos GP, Dutcher JP, et al., eds.: Neoplastic Diseases of the Blood. 3rd ed. New York, NY: Churchill Livingstone, 1996, pp 779-967.
  6. Rebulla P, Finazzi G, Marangoni F, et al.: The threshold for prophylactic platelet transfusions in adults with acute myeloid leukemia. Gruppo Italiano Malattie Ematologiche Maligne dell’Adulto. N Engl J Med 337 (26): 1870-5, 1997. [PUBMED Abstract]
  7. Leukocyte reduction and ultraviolet B irradiation of platelets to prevent alloimmunization and refractoriness to platelet transfusions. The Trial to Reduce Alloimmunization to Platelets Study Group. N Engl J Med 337 (26): 1861-9, 1997. [PUBMED Abstract]
  8. Geller RB: Use of cytokines in the treatment of acute myelocytic leukemia: a critical review. J Clin Oncol 14 (4): 1371-82, 1996. [PUBMED Abstract]
  9. Rowe JM, Andersen JW, Mazza JJ, et al.: A randomized placebo-controlled phase III study of granulocyte-macrophage colony-stimulating factor in adult patients (> 55 to 70 years of age) with acute myelogenous leukemia: a study of the Eastern Cooperative Oncology Group (E1490). Blood 86 (2): 457-62, 1995. [PUBMED Abstract]
  10. Stone RM, Berg DT, George SL, et al.: Granulocyte-macrophage colony-stimulating factor after initial chemotherapy for elderly patients with primary acute myelogenous leukemia. Cancer and Leukemia Group B. N Engl J Med 332 (25): 1671-7, 1995. [PUBMED Abstract]
  11. Dombret H, Chastang C, Fenaux P, et al.: A controlled study of recombinant human granulocyte colony-stimulating factor in elderly patients after treatment for acute myelogenous leukemia. AML Cooperative Study Group. N Engl J Med 332 (25): 1678-83, 1995. [PUBMED Abstract]
  12. Godwin JE, Kopecky KJ, Head DR, et al.: A double-blind placebo-controlled trial of granulocyte colony-stimulating factor in elderly patients with previously untreated acute myeloid leukemia: a Southwest oncology group study (9031). Blood 91 (10): 3607-15, 1998. [PUBMED Abstract]
  13. Buchner T, Hiddemann W, Wormann B, et al.: GM-CSF multiple course priming and long-term administration in newly diagnosed AML: hematologic and therapeutic effects. [Abstract] Blood 84 (10 Suppl 1): A-95, 27a, 1994.
  14. Löwenberg B, Boogaerts MA, Daenen SM, et al.: Value of different modalities of granulocyte-macrophage colony-stimulating factor applied during or after induction therapy of acute myeloid leukemia. J Clin Oncol 15 (12): 3496-506, 1997. [PUBMED Abstract]
  15. Witz F, Sadoun A, Perrin MC, et al.: A placebo-controlled study of recombinant human granulocyte-macrophage colony-stimulating factor administered during and after induction treatment for de novo acute myelogenous leukemia in elderly patients. Groupe Ouest Est Leucémies Aiguës Myéloblastiques (GOELAM). Blood 91 (8): 2722-30, 1998. [PUBMED Abstract]

6.2.5.1.3 Treatment for CML

6.2.5.1.3.1 Chronic Myelogenous Leukemia Treatment (PDQ®)

http://www.cancer.gov/cancertopics/pdq/treatment/CML/Patient/page4

Treatment Option Overview

Key Points for This Section

There are different types of treatment for patients with chronic myelogenous leukemia.

Six types of standard treatment are used:

  1. Targeted therapy
  2. Chemotherapy
  3. Biologic therapy
  4. High-dose chemotherapy with stem cell transplant
  5. Donor lymphocyte infusion (DLI)
  6. Surgery

New types of treatment are being tested in clinical trials.

Patients may want to think about taking part in a clinical trial.

Patients can enter clinical trials before, during, or after starting their cancer treatment.

Follow-up tests may be needed.

There are different types of treatment for patients with chronic myelogenous leukemia.

Different types of treatment are available for patients with chronic myelogenous leukemia (CML). Some treatments are standard (the currently used treatment), and some are being tested in clinical trials. A treatment clinical trial is a research study meant to help improve current treatments or obtain information about new treatments for patients with cancer. When clinical trials show that a new treatment is better than the standard treatment, the new treatment may become the standard treatment. Patients may want to think about taking part in a clinical trial. Some clinical trials are open only to patients who have not started treatment.

Six types of standard treatment are used:

Targeted therapy

Targeted therapy is a type of treatment that uses drugs or other substances to identify and attack specific cancer cells without harming normal cells. Tyrosine kinase inhibitors are targeted therapy drugs used to treat chronic myelogenous leukemia.

Imatinib mesylate, nilotinib, dasatinib, and ponatinib are tyrosine kinase inhibitors that are used to treat CML.

See Drugs Approved for Chronic Myelogenous Leukemia for more information.

Chemotherapy

Chemotherapy is a cancer treatment that uses drugs to stop the growth of cancer cells, either by killing the cells or by stopping them from dividing. When chemotherapy is taken by mouth or injected into a vein or muscle, the drugs enter the bloodstream and can reach cancer cells throughout the body (systemic chemotherapy). When chemotherapy is placed directly into the cerebrospinal fluid, an organ, or a body cavity such as the abdomen, the drugs mainly affect cancer cells in those areas (regional chemotherapy). The way the chemotherapy is given depends on the type and stage of the cancer being treated.

See Drugs Approved for Chronic Myelogenous Leukemia for more information.

Biologic therapy

Biologic therapy is a treatment that uses the patient’s immune system to fight cancer. Substances made by the body or made in a laboratory are used to boost, direct, or restore the body’s natural defenses against cancer. This type of cancer treatment is also called biotherapy or immunotherapy.

See Drugs Approved for Chronic Myelogenous Leukemia for more information.

High-dose chemotherapy with stem cell transplant

High-dose chemotherapy with stem cell transplant is a method of giving high doses of chemotherapy and replacing blood-forming cells destroyed by the cancer treatment. Stem cells (immature blood cells) are removed from the blood or bone marrow of the patient or a donor and are frozen and stored. After the chemotherapy is completed, the stored stem cells are thawed and given back to the patient through an infusion. These reinfused stem cells grow into (and restore) the body’s blood cells.

See Drugs Approved for Chronic Myelogenous Leukemia for more information.

Donor lymphocyte infusion (DLI)

Donor lymphocyte infusion (DLI) is a cancer treatment that may be used after stem cell transplant.Lymphocytes (a type of white blood cell) from the stem cell transplant donor are removed from the donor’s blood and may be frozen for storage. The donor’s lymphocytes are thawed if they were frozen and then given to the patient through one or more infusions. The lymphocytes see the patient’s cancer cells as not belonging to the body and attack them.

Surgery

Splenectomy

6.2.5.1.3.2 What`s new in chronic myeloid leukemia research and treatment?

http://www.cancer.org/cancer/leukemia-chronicmyeloidcml/detailedguide/leukemia-chronic-myeloid-myelogenous-new-research

Combining the targeted drugs with other treatments

Imatinib and other drugs that target the BCR-ABL protein have proven to be very effective, but by themselves these drugs don’t help everyone. Studies are now in progress to see if combining these drugs with other treatments, such as chemotherapy, interferon, or cancer vaccines (see below) might be better than either one alone. One study showed that giving interferon with imatinib worked better than giving imatinib alone. The 2 drugs together had more side effects, though. It is also not clear if this combination is better than treatment with other tyrosine kinase inhibitors (TKIs), such as dasatinib and nilotinib. A study going on now is looking at combing interferon with nilotinib.

Other studies are looking at combining other drugs, such as cyclosporine or hydroxychloroquine, with a TKI.

New drugs for CML

Because researchers now know the main cause of CML (the BCR-ABL gene and its protein), they have been able to develop many new drugs that might work against it.

In some cases, CML cells develop a change in the BCR-ABL oncogene known as a T315I mutation, which makes them resistant to many of the current targeted therapies (imatinib, dasatinib, and nilotinib). Ponatinib is the only TKI that can work against T315I mutant cells. More drugs aimed at this mutation are now being tested.

Other drugs called farnesyl transferase inhibitors, such as lonafarnib and tipifarnib, seem to have some activity against CML and patients may respond when these drugs are combined with imatinib. These drugs are being studied further.

Other drugs being studied in CML include the histone deacetylase inhibitor panobinostat and the proteasome inhibitor bortezomib (Velcade).

Several vaccines are now being studied for use against CML.

6.2.5.1.4. Chronic Lymphocytic Leukemia

6.2.5.1.4.1 Chronic Lymphocytic Leukemia Treatment (PDQ®)

General Information About Chronic Lymphocytic Leukemia

Key Points for This Section

  1. Chronic lymphocytic leukemia is a type of cancer in which the bone marrow makes too many lymphocytes (a type of white blood cell).
  2. Leukemia may affect red blood cells, white blood cells, and platelets.
  3. Older age can affect the risk of developing chronic lymphocytic leukemia.
  4. Signs and symptoms of chronic lymphocytic leukemia include swollen lymph nodes and tiredness.
  5. Tests that examine the blood, bone marrow, and lymph nodes are used to detect (find) and diagnose chronic lymphocytic leukemia.
  6. Certain factors affect treatment options and prognosis (chance of recovery).
  7. Chronic lymphocytic leukemia is a type of cancer in which the bone marrow makes too many lymphocytes (a type of white blood cell).

Chronic lymphocytic leukemia (also called CLL) is a blood and bone marrow disease that usually gets worse slowly. CLL is one of the most common types of leukemia in adults. It often occurs during or after middle age; it rarely occurs in children.

http://www.cancer.gov/images/cdr/live/CDR755927-750.jpg

Anatomy of the bone; drawing shows spongy bone, red marrow, and yellow marrow. A cross section of the bone shows compact bone and blood vessels in the bone marrow. Also shown are red blood cells, white blood cells, platelets, and a blood stem cell.

Anatomy of the bone. The bone is made up of compact bone, spongy bone, and bone marrow. Compact bone makes up the outer layer of the bone. Spongy bone is found mostly at the ends of bones and contains red marrow. Bone marrow is found in the center of most bones and has many blood vessels. There are two types of bone marrow: red and yellow. Red marrow contains blood stem cells that can become red blood cells, white blood cells, or platelets. Yellow marrow is made mostly of fat.

Leukemia may affect red blood cells, white blood cells, and platelets.

Normally, the body makes blood stem cells (immature cells) that become mature blood cells over time. A blood stem cell may become a myeloid stem cell or a lymphoid stem cell.

A myeloid stem cell becomes one of three types of mature blood cells:

  1. Red blood cells that carry oxygen and other substances to all tissues of the body.
  2. White blood cells that fight infection and disease.
  3. Platelets that form blood clots to stop bleeding.

A lymphoid stem cell becomes a lymphoblast cell and then one of three types of lymphocytes (white blood cells):

  1. B lymphocytes that make antibodies to help fight infection.
  2. T lymphocytes that help B lymphocytes make antibodies to fight infection.
  3. Natural killer cells that attack cancer cells and viruses.
Blood cell development. CDR526538-750

Blood cell development. CDR526538-750

http://www.cancer.gov/images/cdr/live/CDR526538-750.jpg

Blood cell development; drawing shows the steps a blood stem cell goes through to become a red blood cell, platelet, or white blood cell. A myeloid stem cell becomes a red blood cell, a platelet, or a myeloblast, which then becomes a granulocyte (the types of granulocytes are eosinophils, basophils, and neutrophils). A lymphoid stem cell becomes a lymphoblast and then becomes a B-lymphocyte, T-lymphocyte, or natural killer cell.

Blood cell development. A blood stem cell goes through several steps to become a red blood cell, platelet, or white blood cell.

In CLL, too many blood stem cells become abnormal lymphocytes and do not become healthy white blood cells. The abnormal lymphocytes may also be called leukemia cells. The lymphocytes are not able to fight infection very well. Also, as the number of lymphocytes increases in the blood and bone marrow, there is less room for healthy white blood cells, red blood cells, and platelets. This may cause infection, anemia, and easy bleeding.

This summary is about chronic lymphocytic leukemia. See the following PDQ summaries for more information about leukemia:

  • Adult Acute Lymphoblastic Leukemia Treatment.
  • Childhood Acute Lymphoblastic Leukemia Treatment.
  • Adult Acute Myeloid Leukemia Treatment.
  • Childhood Acute Myeloid Leukemia/Other Myeloid Malignancies Treatment.
  • Chronic Myelogenous Leukemia Treatment.
  • Hairy Cell Leukemia Treatment

Older age can affect the risk of developing chronic lymphocytic leukemia.

Anything that increases your risk of getting a disease is called a risk factor. Having a risk factor does not mean that you will get cancer; not having risk factors doesn’t mean that you will not get cancer. Talk with your doctor if you think you may be at risk. Risk factors for CLL include the following:

  • Being middle-aged or older, male, or white.
  • A family history of CLL or cancer of the lymph system.
  • Having relatives who are Russian Jews or Eastern European Jews.

Signs and symptoms of chronic lymphocytic leukemia include swollen lymph nodes and tiredness.

Usually CLL does not cause any signs or symptoms and is found during a routine blood test. Signs and symptoms may be caused by CLL or by other conditions. Check with your doctor if you have any of the following:

  • Painless swelling of the lymph nodes in the neck, underarm, stomach, or groin.
  • Feeling very tired.
  • Pain or fullness below the ribs.
  • Fever and infection.
  • Weight loss for no known reason.

Tests that examine the blood, bone marrow, and lymph nodes are used to detect (find) and diagnose chronic lymphocytic leukemia.

The following tests and procedures may be used:

Physical exam and history : An exam of the body to check general signs of health, including checking for signs of disease, such as lumps or anything else that seems unusual. A history of the patient’s health habits and past illnesses and treatments will also be taken.

Complete blood count (CBC) with differential : A procedure in which a sample of blood is drawn and checked for the following:

The number of red blood cells and platelets.

The number and type of white blood cells.

The amount of hemoglobin (the protein that carries oxygen) in the red blood cells.

The portion of the blood sample made up of red blood cells.

6.2.5.1.4.2 Results from the Phase 3 Resonate™ Trial

Significantly improved progression free survival (PFS) vs ofatumumab in patients with previously treated CLL

  • Patients taking IMBRUVICA® had a 78% statistically significant reduction in the risk of disease progression or death compared with patients who received ofatumumab1
  • In patients with previously treated del 17p CLL, median PFS was not yet reached with IMBRUVICA® vs 5.8 months with ofatumumab (HR 0.25; 95% CI: 0.14, 0.45)1

Significantly prolonged overall survival (OS) with IMBRUVICA® vs ofatumumab in patients with previously treated CLL

  • In patients with previously treated CLL, those taking IMBRUVICA® had a 57% statistically significant reduction in the risk of death compared with those who received ofatumumab (HR 0.43; 95% CI: 0.24, 0.79; P<0.05)1

6.2.5.1.4.3 Typical treatment of chronic lymphocytic leukemia

http://www.cancer.org/cancer/leukemia-chroniclymphocyticcll/detailedguide/leukemia-chronic-lymphocytic-treating-treatment-by-risk-group

Treatment options for chronic lymphocytic leukemia (CLL) vary greatly, depending on the person’s age, the disease risk group, and the reason for treating (for example, which symptoms it is causing). Many people live a long time with CLL, but in general it is very difficult to cure, and early treatment hasn’t been shown to help people live longer. Because of this and because treatment can cause side effects, doctors often advise waiting until the disease is progressing or bothersome symptoms appear, before starting treatment.

If treatment is needed, factors that should be taken into account include the patient’s age, general health, and prognostic factors such as the presence of chromosome 17 or chromosome 11 deletions or high levels of ZAP-70 and CD38.

Initial treatment

Patients who might not be able to tolerate the side effects of strong chemotherapy (chemo), are often treated with chlorambucil alone or with a monoclonal antibody targeting CD20 like rituximab (Rituxan) or obinutuzumab (Gazyva). Other options include rituximab alone or a corticosteroid like prednisione.

In stronger and healthier patients, there are many options for treatment. Commonly used treatments include:

  • FCR: fludarabine (Fludara), cyclophosphamide (Cytoxan), and rituximab
  • Bendamustine (sometimes with rituximab)
  • FR: fludarabine and rituximab
  • CVP: cyclophosphamide, vincristine, and prednisone (sometimes with rituximab)
  • CHOP: cyclophosphamide, doxorubicin, vincristine (Oncovin), and prednisone
  • Chlorambucil combined with prednisone, rituximab, obinutuzumab, or ofatumumab
  • PCR: pentostatin (Nipent), cyclophosphamide, and rituximab
  • Alemtuzumab (Campath)
  • Fludarabine (alone)

Other drugs or combinations of drugs may also be also used.

If the only problem is an enlarged spleen or swollen lymph nodes in one region of the body, localized treatment with low-dose radiation therapy may be used. Splenectomy (surgery to remove the spleen) is another option if the enlarged spleen is causing symptoms.

Sometimes very high numbers of leukemia cells in the blood cause problems with normal circulation. This is calledleukostasis. Chemo may not lower the number of cells until a few days after the first dose, so before the chemo is given, some of the cells may be removed from the blood with a procedure called leukapheresis. This treatment lowers blood counts right away. The effect lasts only for a short time, but it may help until the chemo has a chance to work. Leukapheresis is also sometimes used before chemo if there are very high numbers of leukemia cells (even when they aren’t causing problems) to prevent tumor lysis syndrome (this was discussed in the chemotherapy section).

Some people who have very high-risk disease (based on prognostic factors) may be referred for possible stem cell transplant (SCT) early in treatment.

Second-line treatment of CLL

If the initial treatment is no longer working or the disease comes back, another type of treatment may help. If the initial response to the treatment lasted a long time (usually at least a few years), the same treatment can often be used again. If the initial response wasn’t long-lasting, using the same treatment again isn’t as likely to be helpful. The options will depend on what the first-line treatment was and how well it worked, as well as the person’s health.

Many of the drugs and combinations listed above may be options as second-line treatments. For many people who have already had fludarabine, alemtuzumab seems to be helpful as second-line treatment, but it carries an increased risk of infections. Other purine analog drugs, such as pentostatin or cladribine (2-CdA), may also be tried. Newer drugs such as ofatumumab, ibrutinib (Imbruvica), and idelalisib (Zydelig) may be other options.

If the leukemia responds, stem cell transplant may be an option for some patients.

Some people may have a good response to first-line treatment (such as fludarabine) but may still have some evidence of a small number of leukemia cells in the blood, bone marrow, or lymph nodes. This is known as minimal residual disease. CLL can’t be cured, so doctors aren’t sure if further treatment right away will be helpful. Some small studies have shown that alemtuzumab can sometimes help get rid of these remaining cells, but it’s not yet clear if this improves survival.

Treating complications of CLL

One of the most serious complications of CLL is a change (transformation) of the leukemia to a high-grade or aggressive type of non-Hodgkin lymphoma called diffuse large cell lymphoma. This happens in about 5% of CLL cases, and is known as Richter syndrome. Treatment is often the same as it would be for lymphoma (see our document called Non-Hodgkin Lymphoma for more information), and may include stem cell transplant, as these cases are often hard to treat.

Less often, CLL may transform to prolymphocytic leukemia. As with Richter syndrome, these cases can be hard to treat. Some studies have suggested that certain drugs such as cladribine (2-CdA) and alemtuzumab may be helpful.

In rare cases, patients with CLL may have their leukemia transform into acute lymphocytic leukemia (ALL). If this happens, treatment is likely to be similar to that used for patients with ALL (see our document called Leukemia: Acute Lymphocytic).

Acute myeloid leukemia (AML) is another rare complication in patients who have been treated for CLL. Drugs such as chlorambucil and cyclophosphamide can damage the DNA of blood-forming cells. These damaged cells may go on to become cancerous, leading to AML, which is very aggressive and often hard to treat (see our document calledLeukemia: Acute Myeloid).

CLL can cause problems with low blood counts and infections. Treatment of these problems were discussed in the section “Supportive care in chronic lymphocytic leukemia.”

6.2.5.1.5 Lymphoma treatment

 6.2.5.1.5.1 Overview

http://www.emedicinehealth.com/lymphoma/page8_em.htm#lymphoma_treatment

The most widely used therapies are combinations of chemotherapyand radiation therapy.

  • Biological therapy, which targets key features of the lymphoma cells, is used in many cases nowadays.

The goal of medical therapy in lymphoma is complete remission. This means that all signs of the disease have disappeared after treatment. Remission is not the same as cure. In remission, one may still have lymphoma cells in the body, but they are undetectable and cause no symptoms.

  • When in remission, the lymphoma may come back. This is called recurrence.
  • The duration of remission depends on the type, stage, and grade of the lymphoma. A remission may last a few months, a few years, or may continue throughout one’s life.
  • Remission that lasts a long time is called durable remission, and this is the goal of therapy.
  • The duration of remission is a good indicator of the aggressiveness of the lymphoma and of the prognosis. A longer remission generally indicates a better prognosis.

Remission can also be partial. This means that the tumor shrinks after treatment to less than half its size before treatment.

The following terms are used to describe the lymphoma’s response to treatment:

  • Improvement: The lymphoma shrinks but is still greater than half its original size.
  • Stable disease: The lymphoma stays the same.
  • Progression: The lymphoma worsens during treatment.
  • Refractory disease: The lymphoma is resistant to treatment.

The following terms to refer to therapy:

  • Induction therapy is designed to induce a remission.
  • If this treatment does not induce a complete remission, new or different therapy will be initiated. This is usually referred to as salvage therapy.
  • Once in remission, one may be given yet another treatment to prevent recurrence. This is called maintenance therapy.

6.2.5.1.5.2 Chemotherapy

Many different types of chemotherapy may be used for Hodgkin lymphoma. The most commonly used combination of drugs in the United States is called ABVD. Another combination of drugs, known as BEACOPP, is now widely used in Europe and is being used more often in the United States. There are other combinations that are less commonly used and not listed here. The drugs that make up these two more common combinations of chemotherapy are listed below.

ABVD: Doxorubicin (Adriamycin), bleomycin (Blenoxane), vinblastine (Velban, Velsar), and dacarbazine (DTIC-Dome). ABVD chemotherapy is usually given every two weeks for two to eight months.

BEACOPP: Bleomycin, etoposide (Toposar, VePesid), doxorubicin, cyclophosphamide (Cytoxan, Neosar), vincristine (Vincasar PFS, Oncovin), procarbazine (Matulane), and prednisone (multiple brand names). There are several different treatment schedules, but different drugs are usually given every two weeks.

The type of chemotherapy, number of cycles of chemotherapy, and the additional use of radiation therapy are based on the stage of the Hodgkin lymphoma and the type and number of prognostic factors.

6.2.5.1.5.3 Adult Non-Hodgkin Lymphoma Treatment (PDQ®)

http://www.cancer.gov/cancertopics/pdq/treatment/adult-non-hodgkins/Patient/page1

Key Points for This Section

Adult non-Hodgkin lymphoma is a disease in which malignant (cancer) cells form in the lymph system.

Because lymph tissue is found throughout the body, adult non-Hodgkin lymphoma can begin in almost any part of the body. Cancer can spread to the liver and many other organs and tissues.

Non-Hodgkin lymphoma in pregnant women is the same as the disease in nonpregnant women of childbearing age. However, treatment is different for pregnant women. This summary includes information on the treatment of non-Hodgkin lymphoma during pregnancy

Non-Hodgkin lymphoma can occur in both adults and children. Treatment for children, however, is different than treatment for adults. (See the PDQ summary on Childhood Non-Hodgkin Lymphoma Treatment for more information.)

There are many different types of lymphoma.

Lymphomas are divided into two general types: Hodgkin lymphoma and non-Hodgkin lymphoma. This summary is about the treatment of adult non-Hodgkin lymphoma. For information about other types of lymphoma, see the following PDQ summaries:

Age, gender, and a weakened immune system can affect the risk of adult non-Hodgkin lymphoma.

If cancer is found, the following tests may be done to study the cancer cells:

  • Immunohistochemistry : A test that uses antibodies to check for certain antigens in a sample of tissue. The antibody is usually linked to a radioactive substance or a dye that causes the tissue to light up under a microscope. This type of test may be used to tell the difference between different types of cancer.
  • Cytogenetic analysis : A laboratory test in which cells in a sample of tissue are viewed under a microscope to look for certain changes in the chromosomes.
  • Immunophenotyping : A process used to identify cells, based on the types of antigens ormarkers on the surface of the cell. This process is used to diagnose specific types of leukemia and lymphoma by comparing the cancer cells to normal cells of the immune system.

Certain factors affect prognosis (chance of recovery) and treatment options.

The prognosis (chance of recovery) and treatment options depend on the following:

  • The stage of the cancer.
  • The type of non-Hodgkin lymphoma.
  • The amount of lactate dehydrogenase (LDH) in the blood.
  • The amount of beta-2-microglobulin in the blood (for Waldenström macroglobulinemia).
  • The patient’s age and general health.
  • Whether the lymphoma has just been diagnosed or has recurred (come back).

Stages of adult non-Hodgkin lymphoma may include E and S.

Adult non-Hodgkin lymphoma may be described as follows:

E: “E” stands for extranodal and means the cancer is found in an area or organ other than the lymph nodes or has spread to tissues beyond, but near, the major lymphatic areas.

S: “S” stands for spleen and means the cancer is found in the spleen.

Stage I adult non-Hodgkin lymphoma is divided into stage I and stage IE.

  • Stage I: Cancer is found in one lymphatic area (lymph node group, tonsils and nearby tissue, thymus, or spleen).
  • Stage IE: Cancer is found in one organ or area outside the lymph nodes.

Stage II adult non-Hodgkin lymphoma is divided into stage II and stage IIE.

  • Stage II: Cancer is found in two or more lymph node groups either above or below the diaphragm (the thin muscle below the lungs that helps breathing and separates the chest from the abdomen).
  • Stage IIE: Cancer is found in one or more lymph node groups either above or below the diaphragm. Cancer is also found outside the lymph nodes in one organ or area on the same side of the diaphragm as the affected lymph nodes.

Stage III adult non-Hodgkin lymphoma is divided into stage III, stage IIIE, stage IIIS, and stage IIIE+S.

  • Stage III: Cancer is found in lymph node groups above and below the diaphragm (the thin muscle below the lungs that helps breathing and separates the chest from the abdomen).
  • Stage IIIE: Cancer is found in lymph node groups above and below the diaphragm and outside the lymph nodes in a nearby organ or area.
  • Stage IIIS: Cancer is found in lymph node groups above and below the diaphragm, and in the spleen.
  • Stage IIIE+S: Cancer is found in lymph node groups above and below the diaphragm, outside the lymph nodes in a nearby organ or area, and in the spleen.

In stage IV adult non-Hodgkin lymphoma, the cancer:

  • is found throughout one or more organs that are not part of a lymphatic area (lymph node group, tonsils and nearby tissue, thymus, or spleen), and may be in lymph nodes near those organs; or
  • is found in one organ that is not part of a lymphatic area and has spread to organs or lymph nodes far away from that organ; or
  • is found in the liver, bone marrow, cerebrospinal fluid (CSF), or lungs (other than cancer that has spread to the lungs from nearby areas).

Adult non-Hodgkin lymphomas are also described based on how fast they grow and where the affected lymph nodes are in the body.  Indolent & aggressive.

The treatment plan depends mainly on the following:

  • The type of non-Hodgkin’s lymphoma
  • Its stage (where the lymphoma is found)
  • How quickly the cancer is growing
  • The patient’s age
  • Whether the patient has other health problems
  • If there are symptoms present such as fever and night sweats (see above)

6.2.5.1.6 Primary treatments

6.2.5.1.6.1 Radiation Therapy for leukemias and lymphomas

http://www.lls.org/treatment/types-of-treatment/radiation-therapy

Radiation therapy, also called radiotherapy or irradiation, can be used to treat leukemia, lymphoma, myeloma and myelodysplastic syndromes. The type of radiation used for radiotherapy (ionizing radiation) is the same that’s used for diagnostic x-rays. Radiotherapy, however, is given in higher doses.

Radiotherapy works by damaging the genetic material (DNA) within cells, which prevents them from growing and reproducing. Although the radiotherapy is directed at cancer cells, it can also damage nearby healthy cells. However, current methods of radiotherapy have been improved upon, minimizing “scatter” to nearby tissues. Therefore its benefit (destroying the cancer cells) outweighs its risk (harming healthy cells).

When radiotherapy is used for blood cancer treatment, it’s usually part of a treatment plan that includes drug therapy. Radiotherapy can also be used to relieve pain or discomfort caused by an enlarged liver, lymph node(s) or spleen.

Radiotherapy, either alone or with chemotherapy, is sometimes given as conditioning treatment to prepare a patient for a blood or marrow stem cell transplant. The most common types used to treat blood cancer are external beam radiation (see below) and radioimmunotherapy.
External Beam Radiation

External beam radiation is the type of radiotherapy used most often for people with blood cancers. A focused radiation beam is delivered outside the body by a machine called a linear accelerator, or linac for short. The linear accelerator moves around the body to deliver radiation from various angles. Linear accelerators make it possible to decrease or avoid skin reactions and deliver targeted radiation to lessen “scatter” of radiation to nearby tissues.

The dose (total amount) of radiation used during treatment depends on various factors regarding the patient, disease and reason for treatment, and is established by a radiation oncologist. You may receive radiotherapy during a series of visits, spread over several weeks (from two to 10 weeks, on average). This approach, called dose fractionation, lessens side effects. External beam radiation does not make you radioactive.

6.2.5.1.6.2 bone marrow (BM) transplantation

http://www.nlm.nih.gov/medlineplus/ency/article/003009.htm

There are three kinds of bone marrow transplants:

Autologous bone marrow transplant: The term auto means self. Stem cells are removed from you before you receive high-dose chemotherapy or radiation treatment. The stem cells are stored in a freezer (cryopreservation). After high-dose chemotherapy or radiation treatments, your stems cells are put back in your body to make (regenerate) normal blood cells. This is called a rescue transplant.

Allogeneic bone marrow transplant: The term allo means other. Stem cells are removed from another person, called a donor. Most times, the donor’s genes must at least partly match your genes. Special blood tests are done to see if a donor is a good match for you. A brother or sister is most likely to be a good match. Sometimes parents, children, and other relatives are good matches. Donors who are not related to you may be found through national bone marrow registries.

Umbilical cord blood transplant: This is a type of allogeneic transplant. Stem cells are removed from a newborn baby’s umbilical cord right after birth. The stem cells are frozen and stored until they are needed for a transplant. Umbilical cord blood cells are very immature so there is less of a need for matching. But blood counts take much longer to recover.

Before the transplant, chemotherapy, radiation, or both may be given. This may be done in two ways:

Ablative (myeloablative) treatment: High-dose chemotherapy, radiation, or both are given to kill any cancer cells. This also kills all healthy bone marrow that remains, and allows new stem cells to grow in the bone marrow.

Reduced intensity treatment, also called a mini transplant: Patients receive lower doses of chemotherapy and radiation before a transplant. This allows older patients, and those with other health problems to have a transplant.

A stem cell transplant is usually done after chemotherapy and radiation is complete. The stem cells are delivered into your bloodstream usually through a tube called a central venous catheter. The process is similar to getting a blood transfusion. The stem cells travel through the blood into the bone marrow. Most times, no surgery is needed.

Donor stem cells can be collected in two ways:

Bone marrow harvest. This minor surgery is done under general anesthesia. This means the donor will be asleep and pain-free during the procedure. The bone marrow is removed from the back of both hip bones. The amount of marrow removed depends on the weight of the person who is receiving it.

Leukapheresis. First, the donor is given 5 days of shots to help stem cells move from the bone marrow into the blood. During leukapheresis, blood is removed from the donor through an IV line in a vein. The part of white blood cells that contains stem cells is then separated in a machine and removed to be later given to the recipient. The red blood cells are returned to the donor.

Why the Procedure is Performed

A bone marrow transplant replaces bone marrow that either is not working properly or has been destroyed (ablated) by chemotherapy or radiation. Doctors believe that for many cancers, the donor’s white blood cells can attach to any remaining cancer cells, similar to when white cells attach to bacteria or viruses when fighting an infection.

Your doctor may recommend a bone marrow transplant if you have:

Certain cancers, such as leukemia, lymphoma, and multiple myeloma

A disease that affects the production of bone marrow cells, such as aplastic anemia, congenital neutropenia, severe immunodeficiency syndromes, sickle cell anemia, thalassemia

Had chemotherapy that destroyed your bone

6.2.5.1.6.2.1 Autologous stem cell transplantation

6.2.5.1.6.2.1.1 Phase II trial of 131I-B1 (anti-CD20) antibody therapy with autologous stem cell transplantation for relapsed B cell lymphomas

O.W Press,  F Appelbaum,  P.J Martin, et al.
http://www.thelancet.com/journals/lancet/article/PIIS0140-6736(95)92225-3/abstract

25 patients with relapsed B-cell lymphomas were evaluated with trace-labelled doses (2·5 mg/kg, 185-370 MBq [5-10 mCi]) of 131I-labelled anti-CD20 (B1) antibody in a phase II trial. 22 patients achieved 131I-B1 biodistributions delivering higher doses of radiation to tumor sites than to normal organs and 21 of these were treated with therapeutic infusions of 131I-B1 (12·765-29·045 GBq) followed by autologous hemopoietic stem cell reinfusion. 18 of the 21 treated patients had objective responses, including 16 complete remissions. One patient died of progressive lymphoma and one died of sepsis. Analysis of our phase I and II trials with 131I-labelled B1 reveal a progression-free survival of 62% and an overall survival of 93% with a median follow-up of 2 years. 131I-anti-CD20 (B1) antibody therapy produces complete responses of long duration in most patients with relapsed B-cell lymphomas when given at maximally tolerated doses with autologous stem cell rescue.

6.2.5.2.6.2.1.2 Autologous (Self) Transplants

http://www.leukaemia.org.au/treatments/stem-cell-transplants/autologous-self-transplants

An autologous transplant (or rescue) is a type of transplant that uses the person’s own stem cells. These cells are collected in advance and returned at a later stage. They are used to replace stem cells that have been damaged by high doses of chemotherapy, used to treat the person’s underlying disease.

In most cases, stem cells are collected directly from the bloodstream. While stem cells normally live in your marrow, a combination of chemotherapy and a growth factor (a drug that stimulates stem cells) called Granulocyte Colony Stimulating Factor (G-CSF) is used to expand the number of stem cells in the marrow and cause them to spill out into the circulating blood. From here they can be collected from a vein by passing the blood through a special machine called a cell separator, in a process similar to dialysis.

Most of the side effects of an autologous transplant are caused by the conditioning therapy used. Although they can be very unpleasant at times it is important to remember that most of them are temporary and reversible.

6.2.5.2.6.2.1.3  Hematopoietic stem cell transplantation

Hematopoietic stem cell transplantation (HSCT) is the transplantation of multipotent hematopoietic stem cells, usually derived from bone marrow, peripheral blood, or umbilical cord blood. It may be autologous (the patient’s own stem cells are used) or allogeneic (the stem cells come from a donor).

Hematopoietic Stem Cell Transplantation

Author: Ajay Perumbeti, MD, FAAP; Chief Editor: Emmanuel C Besa, MD
http://emedicine.medscape.com/article/208954-overview

Hematopoietic stem cell transplantation (HSCT) involves the intravenous (IV) infusion of autologous or allogeneic stem cells to reestablish hematopoietic function in patients whose bone marrow or immune system is damaged or defective.

The image below illustrates an algorithm for typically preferred hematopoietic stem cell transplantation cell source for treatment of malignancy.

An algorithm for typically preferred hematopoietic stem cell transplantation cell source for treatment of malignancy: If a matched sibling donor is not available, then a MUD is selected; if a MUD is not available, then choices include a mismatched unrelated donor, umbilical cord donor(s), and a haploidentical donor.

6.2.5.3 Supportive Therapies

6.2.5.3.1  Blood transfusions – risks and complications of a blood transfusion

  • Allogeneic transfusion reaction (acute or delayed hemolytic reaction)
  • Allergic reaction
  • Viruses Infectious Diseases

The risk of catching a virus from a blood transfusion is very low.

HIV. Your risk of getting HIV from a blood transfusion is lower than your risk of getting killed by lightning. Only about 1 in 2 million donations might carry HIV and transmit HIV if given to a patient.

Hepatitis B and C. The risk of having a donation that carries hepatitis B is about 1 in 205,000. The risk for hepatitis C is 1 in 2 million. If you receive blood during a transfusion that contains hepatitis, you’ll likely develop the virus.

Variant Creutzfeldt-Jakob disease (vCJD). This disease is the human version of Mad Cow Disease. It’s a very rare, yet fatal brain disorder. There is a possible risk of getting vCJD from a blood transfusion, although the risk is very low. Because of this, people who may have been exposed to vCJD aren’t eligible blood donors.

  • Fever
  • Iron Overload
  • Lung Injury
  • Graft-Versus-Host Disease

Graft-versus-host disease (GVHD) is a condition in which white blood cells in the new blood attack your tissues.

6.2.5.3.2  Erythropoietin

Erythropoietin, (/ɨˌrɪθrɵˈpɔɪ.ɨtɨn/, UK /ɛˌrɪθroʊ.poʊˈiːtɪn/) also known as EPO, is a glycoprotein hormone that controls erythropoiesis, or red blood cell production. It is a cytokine (protein signaling molecule) for erythrocyte (red blood cell) precursors in the bone marrow. Human EPO has a molecular weight of 34 kDa.

Also called hematopoietin or hemopoietin, it is produced by interstitial fibroblasts in the kidney in close association with peritubular capillary and proximal convoluted tubule. It is also produced in perisinusoidal cells in the liver. While liver production predominates in the fetal and perinatal period, renal production is predominant during adulthood. In addition to erythropoiesis, erythropoietin also has other known biological functions. For example, it plays an important role in the brain’s response to neuronal injury.[1] EPO is also involved in the wound healing process.[2]

Exogenous erythropoietin is produced by recombinant DNA technology in cell culture. Several different pharmaceutical agents are available with a variety ofglycosylation patterns, and are collectively called erythropoiesis-stimulating agents (ESA). The specific details for labelled use vary between the package inserts, but ESAs have been used in the treatment of anemia in chronic kidney disease, anemia in myelodysplasia, and in anemia from cancer chemotherapy. Boxed warnings include a risk of death, myocardial infarction, stroke, venous thromboembolism, and tumor recurrence.[3]

6.2.5.3.4  G-CSF (granulocyte-colony stimulating factor)

Granulocyte-colony stimulating factor (G-CSF or GCSF), also known as colony-stimulating factor 3 (CSF 3), is a glycoprotein that stimulates the bone marrow to produce granulocytes and stem cells and release them into the bloodstream.

There are different types, including

  • Lenograstim (Granocyte)
  • Filgrastim (Neupogen, Zarzio, Nivestim, Ratiograstim)
  • Long acting (pegylated) filgrastim (pegfilgrastim, Neulasta) and lipegfilgrastim (Longquex)

Pegylated G-CSF stays in the body for longer so you have treatment less often than with the other types of G-CSF.

6.2.5.3.5  Plasma exchange (plasmapheresis)

http://emedicine.medscape.com/article/1895577-overview

Plasmapheresis is a term used to refer to a broad range of procedures in which extracorporeal separation of blood components results in a filtered plasma product.[1, 2] The filtering of plasma from whole blood can be accomplished via centrifugation or semipermeable membranes.[3] Centrifugation takes advantage of the different specific gravities inherent to various blood products such as red cells, white cells, platelets, and plasma.[4] Membrane plasma separation uses differences in particle size to filter plasma from the cellular components of blood.[3]

Traditionally, in the United States, most plasmapheresis takes place using automated centrifuge-based technology.[5] In certain instances, in particular in patients already undergoing hemodialysis, plasmapheresis can be carried out using semipermeable membranes to filter plasma.[4]

In therapeutic plasma exchange, using an automated centrifuge, filtered plasma is discarded and red blood cells along with replacement colloid such as donor plasma or albumin is returned to the patient. In membrane plasma filtration, secondary membrane plasma fractionation can selectively remove undesired macromolecules, which then allows for return of the processed plasma to the patient instead of donor plasma or albumin. Examples of secondary membrane plasma fractionation include cascade filtration,[6] thermofiltration, cryofiltration,[7] and low-density lipoprotein pheresis.

The Apheresis Applications Committee of the American Society for Apheresis periodically evaluates potential indications for apheresis and categorizes them from I to IV based on the available medical literature. The following are some of the indications, and their categorization, from the society’s 2010 guidelines.[2]

  • The only Category I indication for hemopoietic malignancy is Hyperviscosity in monoclonal gammopathies

6.2.5.3.6  Platelet transfusions

6.2.5.3.6.1 Indications for platelet transfusion in children with acute leukemia

Scott Murphy, Samuel Litwin, Leonard M. Herring, Penelope Koch, et al.
Am J Hematol Jun 1982; 12(4): 347–356
http://onlinelibrary.wiley.com/doi/10.1002/ajh.2830120406/abstract;jsessionid=A6001D9D865EA1EBC667EF98382EF20C.f03t01
http://dx.doi.org:/10.1002/ajh.2830120406

In an attempt to determine the indications for platelet transfusion in thrombocytopenic patients, we randomized 56 children with acute leukemia to one of two regimens of platelet transfusion. The prophylactic group received platelets when the platelet count fell below 20,000 per mm3 irrespective of clinical events. The therapeutic group was transfused only when significant bleeding occurred and not for thrombocytopenia alone. The time to first bleeding episode was significantly longer and the number of bleeding episodes were significantly reduced in the prophylactic group. The survival curves of the two groups could not be distinguished from each other. Prior to the last month of life, the total number of days on which bleeding was present was significantly reduced by prophylactic therapy. However, in the terminal phase (last month of life), the duration of bleeding episodes was significantly longer in the prophylactic group. This may have been due to a higher incidence of immunologic refractoriness to platelet transfusion. Because of this terminal bleeding, comparison of the two groups for total number of days on which bleeding was present did not show a significant difference over the entire study period.

6.2.5.3.6.2 Clinical and laboratory aspects of platelet transfusion therapy
Yuan S, Goldfinger D
http://www.uptodate.com/contents/clinical-and-laboratory-aspects-of-platelet-transfusion-therapy

INTRODUCTION — Hemostasis depends on an adequate number of functional platelets, together with an intact coagulation (clotting factor) system. This topic covers the logistics of platelet use and the indications for platelet transfusion in adults. The approach to the bleeding patient, refractoriness to platelet transfusion, and platelet transfusion in neonates are discussed elsewhere.

Pooled platelets – A single unit of platelets can be isolated from every unit of donated blood, by centrifuging the blood within the closed collection system to separate the platelets from the red blood cells (RBC). The number of platelets per unit varies according to the platelet count of the donor; a yield of 7 x 10¹⁰ platelets is typical [1]. Since this number is inadequate to raise the platelet count in an adult recipient, four to six units are pooled to allow transfusion of 3 to 4 x 10¹¹ platelets per transfusion [2]. These are called whole blood-derived or random donor pooled platelets.

Advantages of pooled platelets include lower cost and ease of collection and processing (a separate donation procedure and pheresis equipment are not required). The major disadvantage is recipient exposure to multiple donors in a single transfusion and logistic issues related to bacterial testing.

Apheresis (single donor) platelets – Platelets can also be collected from volunteer donors in the blood bank, in a one- to two-hour pheresis procedure. Platelets and some white blood cells are removed, and red blood cells and plasma are returned to the donor. A typical apheresis platelet unit provides the equivalent of six or more units of platelets from whole blood (ie, 3 to 6 x 10¹¹ platelets) [2]. In larger donors with high platelet counts, up to three units can be collected in one session. These are called apheresis or single donor platelets.

Advantages of single donor platelets are exposure of the recipient to a single donor rather than multiple donors, and the ability to match donor and recipient characteristics such as HLA type, cytomegalovirus (CMV) status, and blood type for certain recipients.

Both pooled and apheresis platelets contain some white blood cells (WBC) that were collected along with the platelets. These WBC can cause febrile non-hemolytic transfusion reactions (FNHTR), alloimmunization, and transfusion-associated graft-versus-host disease (ta-GVHD) in some patients.

Platelet products also contain plasma, which can be implicated in adverse reactions including transfusion-related acute lung injury (TRALI) and anaphylaxis. (See ‘Complications of platelet transfusion’ .)

6.2. +  Steroids

Read Full Post »

Protein-binding, Protein-Protein interactions & Therapeutic Implications

Writer and Curator: Larry H. Bernstein, MD, FCAP 

7.3  Protein-binding, Protein-Protein interactions & Therapeutic Implications

7.3.1 Action at a Distance. Allostery_Delabarre_allostery review

7.3.2 Chemical proteomics approaches to examine novel histone modifications

7.3.3 Misfolded Proteins – from Little Villains to Little Helpers… Against Cancer

7.3.4 Endoplasmic reticulum protein 29 (ERp29) in epithelial cancer

7.3.5 Putting together structures of epidermal growth factor receptors

7.3.6 Complex Relationship between Ligand Binding and Dimerization in the Epidermal Growth Factor Receptor

7.3.7 IGFBP-2.PTEN- A critical interaction for tumors and for general physiology

7.3.8 Emerging-roles-for-the-Ph-sensing-G-protein-coupled-receptor

7.3.9 Protein amino-terminal modifications and proteomic approaches for N-terminal profiling

7.3.10 Protein homeostasis networks in physiology and disease

7.3.11 Proteome sequencing goes deep

7.3.1 Action at a Distance. Allostery_Delabarre_allostery review

DeLaBarre B1, Hurov J1, Cianchetta G1, Murray S1, Dang L2.
Chem Biol. 2014 Sep 18; 21(9):1143-61
http://dx.doi.org:/10.1016/j.chembiol.2014.08.007

Cancer cells must carefully regulate their metabolism to maintain growth and division under varying nutrient and oxygen levels. Compelling data support the investigation of numerous enzymes as therapeutic targets to exploit metabolic vulnerabilities common to several cancer types. We discuss the rationale for developing such drugs and review three targets with central roles in metabolic pathways crucial for cancer cell growth: pyruvate kinase muscle isozyme splice variant 2 (PKM2) in glycolysis, glutaminase in glutaminolysis, and mutations in isocitrate dehydrogenase 1 and 2 isozymes (IDH1/2) in the tricarboxylic acid cycle. These targets exemplify the drugging approach to cancer metabolism, with allosteric modulation being the common theme. The first glutaminase and mutant IDH1/2 inhibitors have entered clinical testing, and early data are promising. Cancer metabolism provides a wealth of novel targets, and targeting allosteric sites promises to yield selective drugs with the potential to transform clinical outcomes across many cancer types.

Based on knowledge acquired to date, there is no doubt that cancer metabolism provides a wealth of novel therapeutic targets and multiple innovative ways in which to exploit metabolic vulnerabilities for therapeutic benefit. More comprehensive reviews cover the breadth of metabolic targets that are currently under investigation (Stine and Dang, 2013; Vander Heiden, 2011). The following sections of this review focus on PKM2, glutaminase, and mutated IDH1/2 as exemplary metabolism targets under investigation for development of cancer therapies.
Drugging Glycolysis: Targeting Pyruvate Kinase Muscle Isozyme Alternative Splice Variant 2 PK catalyzes the last step of glycolysis, converting phosphoenolpyruvate (PEP) to pyruvate, while producing one molecule of ATP. The reaction encompasses two chemical steps: the first involves a phosphoryl transfer from PEP to ADP, forming an enolate intermediate and ATP, and the second involves protonation of the enolate intermediate, forming pyruvate (Robinson and Rose, 1972). PKM2 is one of four PK isoforms in humans. PKM1 and PKM2 result from the alternative splicing of exons 9 and 10 of the PKM gene, which encode a stretch of amino acids that differ at 23 positions between PKM1 and PKM2. PKM1 is constitutively active in skeletal muscle and brain tissue, but is not allosterically regulated. PKM2 is expressed in fetal and proliferating tissues, has low basal activity compared with PKM1, and is allosterically regulated. R-type pyruvate kinase (PKR) and L-type pyruvate kinase (PKL) are transcribed via different promoters from the PKLR gene. PKR is expressed in erythrocytes and PKL in the liver. PKR, PKL, and PKM1 exist as stable tetramers,whereas PKM2 forms tetramers (high activity form), dimers (low activity form), and monomers (Mazurek, 2011).

Figure 1. Central Metabolic Pathways Utilized by Cancer Cells *denotes mutated isoenzyme.

Pyruvate Kinase Muscle Isozyme Alternative Splice Variant 2 in Cancer Cell Metabolism Cancer cells predominantly express PKM2, which can be downregulated by tyrosine kinase growth factor signaling pathways, allowing metabolic flexibility. Phosphotyrosine peptides have been shown to suppress PKM2 activity by binding tightly to PKM2, thereby catalyzing the release of fructose 1,6-bisphosphate (FBP), resulting in a switch to the low activity dimer state (Christofk et al., 2008b; Hitosugi et al., 2009). This downregulation is thought to support tumor growth and proliferation by allowing for the shunting of glycolytic intermediates toward other biosynthetic pathways (i.e., pentose phosphate and serine pathways). In keeping with this model, the activation of PKM2 in cancer cells using small molecule agonists resulted in serine auxotrophy (Kung et al., 2012). Consistent with the hypothesis that PKM2 is a critical metabolic switch, there is growing evidence that, depending on the cellular stress environment, PKM2activity canberegulated byposttranslational modification such as acetylation (Lv et al., 2011), phosphorylation (Hitosugi et al., 2009), cysteine oxidation (Anastasiou et al., 2011), and proline hydroxylation (Luo et al., 2011). The utility of PKM2 activators in the clinic has yet to be determined, but recent work with tumor xenografts with a PKM2 activator suggests that this may be a viable approach (Parnell et al., 2013). As PKM2 tetramers show greater than 50-fold higher activity than PKM2 monomers (Anastasiou et al., 2012), one consideration when designing drugs to activate PKM2 for therapeutic means would be the need for small-molecule ligands capable of driving the enzyme toward its optimally active tetrameric form, thus forcing cancer cells into a less flexible metabolic state.

Structure of Pyruvate Kinase Muscle Isozyme Alternative Splice Variant 2 The structure of the PKM2 tetramer is summarized in Figure 2A. PKM2 is allosterically activated in a ‘‘feedforward’’ manner by the upstream glycolytic metabolite, FBP, which induces a shift to the active tetrameric conformation (Christofk et al., 2008b; Dombrauckas et al., 2005). PKM2 can be independently allosterically activated by serine (Chaneton et al., 2012), which binds in a distinct pocket that can also accommodate the inhibitor phenylalanine (Protein Data Bank [PDB] ID: 4FXJ). The binding of phenylalanine results in a tetrameric form distinct from the active conformer (Morgan et al., 2013). It is not clear how the change from serine to phenylalanine elicits such a dramatic change in protein behavior, or whether there is any biological interaction between serine activation and phenylalanine inhibition of PKM2 in cancer cells. Of note, PKM1 and PKL/R are not activated by serine, despite the conservation of the serine binding site in all PK isoforms.
Figure 2. Three Different Metabolic Enzymes and Their Allosteric Inhibitors Protomers are depicted as cartoon ribbons in blue, green, yellow, and cyan. Synthetic allostery is depicted in stick format with red highlight. (A) Structure of tetrameric PKM2:AGI-980 (4:2 complex) from PDB 4G1N. AGI-980 is shown in stick rendering near the center of tetramer. Each PK monomer consists of four domains, usually designated A, B, C, and N (Dombrauckas et al., 2005). The tetramer is a dimer-of-dimers with approximate D2 symmetry. The dimer is formed between the A domains of each monomer, while the tetramer is formed via dimerization along the C subunit interfaces of each dimer. The active site of PKM2 lies within a cleft between the A and B domain, illustrated by a PEP analog (red spheres). The FBP binding pocket is located entirely within the C domain (pink spheres). The natural allosteric site of serine is also shown (black spheres). (B)Tetrameric GAC:BPTES (4:2 complex) from PDB 3UO9. Glutamate molecules are shown as spheres. (C) Dimeric IDH2R140Q:AGI-6780 (2:1 complex) from PDB 4JA8 (Wang et al., 2013). NADP molecules are shown as spheres.
Discovery of Allosteric Activators of Pyruvate Kinase Muscle Isozyme Alternative Splice Variant 2 A number of small molecules that potently activate PKM2 have been discovered by various groups (Table 1). Interestingly, all seven X-rayco-complexescurrentlyavailableshowcompoundsbound at a novel binding pocket distinct from the FBP and serine binding sites, which would otherwise allow cells to overcome negative regulation by phosphotyrosines (Kung et al., 2012). The compounds found in structures 3GQY, 3GR4 (Boxer et al., 2010), 3H6O (Jiang et al., 2010), 3ME3, and 3U2Z (Anastasiou et al., 2012) were identified by screening the NIH Small Molecule Repository, and can be classified into two distinct chemical series, both of which establish very similar interactions with PKM2 (Table 1). Analogues in these two classes selectively activated PKM2 allosterically with good selectivity against PKM1, PKL, and PKR (Anastasiou et al., 2012; Boxer et al., 2010; Jiang et al., 2010). The molecule found in the structure 4JPG (Guo et al., 2013) is similar to the two series described above, where the pyrimidone ring is found between the two Phe26 residues (Table 1). Interestingly, the activator found in the 4G1N structure (Kung et al., 2012) sits in the same pocket as the NIH compounds. However, the interactions are quite different, with the side chains of the two Phe26 that line the pocket assuming distinct conformations. This activator wraps around the two aromatic residues, which pushes it closer to the walls of the pocket, allowing for a richer series of interactions with PKM2 (Table 1). There are two additional series of PKM2 activators that have been reported for which no structural information is available (Table 1)(Parnell et al., 2013; Xu et al., 2014; Yacovan et al., 2012). Members of this series were shown to have an activation level comparable to that of FBP, with selectivity for PKM2 over PKL, PKR, and PKM1. PKM2 offers a very interesting example of an allosterically regulated enzyme. Different allosteric sites have so far been identified for three different types of activator (FBP, serine, and small-molecule ligands) and all activate PKM2 by stabilizing the tetrameric form. It is remarkable that molecules as small as serine can dramatically alter this protein’s conformational landscape and aggregation state and lead to an active enzyme. This unusual allosteric site revealed by the small-molecule ligands is of particular curiosity, largely because neither its function nor its native ligands are known. All of the drug-like activators described above bind at the dimer–dimer interface and seem to act by displacing water from the mainly apolar pocket, thus contributing to the stabilization of the tetramer. While these PKM2 activators show promising preclinical data, none have yet entered clinical development.

Table 1. Biochemical Properties of Small Molecule PKM2 Inhibitors Series PDB ID Ligand Reference Binding Characteristics

Substituted N,N’diarylsulfonamide 3GQY (Boxer et al., 2010)

  •  All completely buried within A-A’ interface, 35A ˚ from FBP pocket
  •  Binding pocket lined with residues equivalent to those of PKM2 molecules forming A-A’ interface
  •  All sandwiched between phenyl rings of the two Phe26 from different monomers
  •  All additionally interact with side chain of Phe26 through slightly distorted T-shaped p-p interactions (two such interactions for substituted N,N0diarylsulfonamides and one for thieno[3,2-b]pyrrole[3,2-] pyridazinones)
  1. 3GR4 (Boxer et al., 2010) 3ME3 (Anastasiou et al., 2012)
  2. Thieno[3,2-b]pyrrole [3,2-d]pyridazinone 3H6O (Jiang et al., 2010)
  3. 3U2Z (Anastasiou et al., 2012)
  4. 2-((1H-benzo[d]imidazol1-yl)methyl)-4H-pyrido [1,2-a]pyrimidin-4-ones
  5. 4JPG (Guo et al., 2013)
  • Pyrimidone ring found between the two Phe26 residues forming p-p interactions with the aromatic rings
  • Carbonyl interacts with a bridging water molecule
  • Benzimidazole reaches a region of the activator pocket that is not occupied in any of the published crystal structures
  • One of the imidazole nitrogens forms an H-bond with Lys311, which is normally part of a salt bridge to Asp354

Quinolone sulfonamides 4G1N (Kung et al., 2012)

  •  Quinoline moiety sits on a flat, mainly apolar surface defined by Phe26, Leu27 and Met30 from chain A and Phe26, Tyr390 and Leu394 from chain A’
  •  One of the two oxygen atoms of the sulfonamide accepts an H bond from the backbone oxygen of Tyr390, the other interacts with a water molecule
  •  The oxygen of the amide moiety forms an H-bond with side-chain nitrogen of Lys311
  •  Terminal aromatic ring sits in the other copy of the quinoline pocket d Aromatic rings of the side chains of the two Phe26 lining the pocket almost perpendicular (not parallel); activator wrapped around the two aromatic residues

3-(trifluoromethyl)-1Hpyrazole-5-carboxamide (Parnell et al., 2013; Xu et al., 2014)

  • Cocrystal structure of one compound bound to tetrameric PKM2 obtained but file not available for download from PDB: described as bound to the allosteric site at the dimer–dimer interface

5-((2,3-dihydrobenzo[b] [1,4]dioxin-6-yl)sulfonyl)-2methyl-1-(methylsulfonyl) indoline scaffold (Yacovan et al., 2012)

  • Cocrystal structure of one compound bound to PKM2 obtained but not available for download from the PDB: described as bound to dimer interface
  • Interactions very similar to those established by thieno [3,2-b]pyrrole[3,2-d]pyridazinone series above

Drugging Glutaminolysis: Targeting the Glutaminase C Variant Glutaminase catalyzes the conversion of glutamine to glutamate and ammonia. Glutamate can be oxidized to a-ketoglutarate (aKG), which then anaplerotically feeds into the TCA cycle as a means of providing proliferating cells with biosynthetic intermediates and ATP (Figure 1); glutamate is also used as a substrate for the generation of glutathione, which provides protection from redox stress (Hensley et al., 2013; Shanware et al., 2011). The ammonia produced during the reaction can be used in certain tissues like the kidney to provide pH homeostasis, and nitrogen derived from glutamine is utilized in nucleotide biosynthetic and glycosylation pathways.

Table 2. Characteristics of Small Molecule Glutaminase Inhibitors

BPTES N-(5–[1,3,4]thiadiazol-2yl)-2-phenylacetamide 6 (Shukla et al., 2012)

  • Similar potency but better water solubility vs. BPTES d Attenuated growth of P493 human lymphoma B cells in vitro d Diminished tumor growth in P493 tumor xenograft SCID mice with no apparent toxicity

CB-839 (Calithera) (Gross et al., 2014)

  • Orally bioavailable d Binds at allosteric sites of GLS1 KGA and GAC d Potent, selective, time-dependent reversible inhibition with slow recovery time
  • Anti-proliferative activity (double-digit nM potency) in cellular proliferation assays in wide range of tumors
  • Currently in Phase I trials of locally-advanced/metastatic refractory solid tumors (triple negative breast cancer, NSCLC, RCC, mesothelioma) and hematological cancers [Clinicaltrials.gov: NCT02071927, NCT02071862, NCT02071888]

Dibenzophenanthridines Compound 968 (Katt et al., 2012; Wang et al., 2010)

  • Modest potency in the low mM concentrations d Loses all inhibitory activity against glutaminase activated by preincubation with inorganic phosphate (phosphate does not affect BPTES potency)
  • Anti-proliferative activity in breast cancer cell line at 10 mmol/L concentration

There are three isoforms of IDH. IDH1 is located in both the peroxisome and the cytosol, whereas IDH2 and IDH3 are located in mitochondria. It is unclear what the relative contributions of the IDH2 and IDH3 isoforms are to overall mitochondrial TCA function. IDH1 and IDH2 are both obligatory homodimeric proteins and use NADP+ as a cofactor, whereas IDH3 uses NAD+ as a cofactor and is a heterotrimeric protein comprising alpha, beta, and gamma subunits. All three isozymes require either Mg2+ or Mn2+ asdivalent metal cofactors for catalysis.The dimeric structure of IDH2 is shown in Figure 2C.

Mutant Isocitrate Dehydrogenase in Cancer Cell Metabolism The role of IDH mutations in cancer metabolism was recognized following the observation of frequent and recurrent mutations of IDH1 and IDH2 in patients with glioma and AML, initially identified by genomic deep sequencing and subsequent comparative genetic analyses (Parsons et al., 2008; Yan et al., 2009). These mutations were originally characterized as loss of function (Mardis etal.,2009; Parsonsetal.,2008; Yanet al.,2009), suggesting that mutated IDH acts as a tumor suppressor due to the loss of catalytic conversion of isocitrate to aKG (Zhaoetal., 2009). However, with the exception of cases of haploinsufficiency, the heterozygous mutation pattern of IDH is more consistent with an oncogene role. Subsequently, IDH mutations were shown to possess the neomorphic activity to generate the oncometabolite, 2-hydroxyglutarate (2HG) (Dang et al., 2009; Gross et al., 2010; Ward et al., 2010). With a single codon substitution, the kinetic properties of the mutant IDH isozyme are significantly altered, resulting in an obligatory sequential ordered reaction in the reverse direction (Rendina et al., 2013). Indeed, the critical kinetic observation of mutant IDH was not only the loss of affinity for isocitrate, but also a dramatic increase in NADPH affinity by three orders of magnitude (Dang et al.,2009), suggesting a substantial change in protein dynamics imparted by the mutation. The only known homeostatic 2HG clearance mechanism is the relatively inefficient reconversion of 2HG back to aKG by D-2hydroxyglutarate dehydrogenase. Therefore, 2HG accumulates when over-produced by mutant IDH. 2HG itself has been shown to be sufficient to drive the malignant phenotype (Rakheja et al., 2013). Abnormally high 2HG levels impair aKG-dependent dioxygenases through competitive inhibition, including those that modify DNA and histones (i.e., Jumonji domain-containing histone demethylases and the ten-eleven translocation (TET) family of 50-methylcytosine hydroxylases) (Chowdhury et al., 2011; Figueroa et al., 2010), as well as EglN prolyl hydroxylase in regulating hypoxia-inducible factor (Losman et al., 2013). This results in altered epigenetic status that blocks cell differentiation. These findings, combined with the inhibitory effects of fumarate and succinate on the same families of aKG-dependent enzymes, highlight a critical and fascinatingnetwork that ties together central metabolic pathways and epigenetic control. Remarkably, mutations in TET2 are mutually exclusive with IDH mutations in AML, strongly suggesting that, in this context, the tumorigenic effects of 2HG are at least in part driven by inhibition of TET2. The precise targets of IDH mutations with associated 2HG production (and TET2 mutations) that promote tumorigenesis are currentlyunknown;however,itisclearthatIDH1/2andTET2mutations lead to a block in hematopoietic cell differentiation (Figueroa et al., 2010; Lu et al., 2012; Moran-Crusio et al., 2011; Wang et al., 2013). To date, no IDH3 mutation associated with cancer has been reported (Krell et al., 2011; Reitman and Yan, 2010), suggesting that the role of IDH1/2 has a greater impact on tumorigenesis. Targeting mutated isoforms of IDH1/2 therefore presents a logical approach to cancer therapy. A consideration in designing suchdrugsistheheterozygoussomaticnatureoftheIDH1/2mutation, which likely yields a mixture of homo- and heterodimers; statistically, heterodimers should be the major species in vivo. Mutant homodimers and wild-type-mutant heterodimers both efficiently catalyze the production of 2HG from aKG (Dang et al., 2009; Rendina et al., 2013). However, the heterodimer is potentially more oncogenic, as it is more efficient at producing 2HG than homodimeric mutants (Pietrak et al., 2011) due to an increased local concentration of substrate while conserving NADPH. The heterodimer as a molecular target therefore becomes an important consideration in this scenario.

Structure of Isocitrate Dehydrogenase Structurally, both IDH1 and IDH2 comprise three main domains: the large domain, the small domain, and the clasp region (Yang et al., 2010). A simplified description of protein motion is provided in Figure 3 (Rendina et al., 2013; Xu et al., 2004). The dynamic of motion may differ slightly between IDH1 and IDH2 mutants. IDH1 mutants appear to open wider than IDH2 mutants to the point of unwinding a helix termed ‘‘seg2’’ (Yang et al., 2010). In contrast, the open form of IDH2 does not involve the melting of any secondary structure, and as a consequence has a much narrower range of motion (Taylor et al., 2008; Wang et al., 2013). This differential in protein dynamics could possibly explain the differential responses of IDH1 and IDH2 to inhibitors. X-ray structures of IDH3 have not yet been reported, but it appears to be distinct from IDH1 and IDH2 in terms of primary sequence and predicted quaternary organization (Kim et al., 1995; Ramachandran and Colman, 1980). There are three arginine residues in the enzyme active site that are predicted to play a central role in electrostatic stabilization and proper geometric orientation of isocitrate via its acidic moieties as the substrate binds in the active site. With the exception of the novel G97D or G97N codon mutation (Ward et al., 2012), virtually all confirmed IDH mutations that generate high levels of 2HG occur in one of these arginines (i.e., IDH1-R132 and IDH2-R172/R140) (Losman and Kaelin, 2013) and have in common a substitution of one of the diffuse positive charges of the respective arginine’s guanidinium moiety.
Discovery of Inhibitors against Mutated Isocitrate Dehydrogenase Several inhibitors of mutant IDH isoforms that block 2HG production in vitro and in vivo have been recently described. The first potent and specific IDH1 inhibitors reported were the phenylglycine series, specifically AGI-5198 (Popovici-Muller et al., 2012; Rohle et al., 2013) and subsequently ML309 (Davis et al., 2014)(Table 3), which were shown to be rapid-equilibrium inhibitors specific for IDH1-R132-codon mutations. These compounds inhibited IDH1-R132H competitively with respect to aKG and uncompetitively with respect to NADPH, suggesting that they preferably bind to the enzyme-NADPH ternary complex. Notably, they do not appreciably cross-react against the IDH2-R140Q mutant isozyme, suggesting a unique binding mode in IDH1-R132 that does not favorably exist in IDH2R140. Because no X-ray co-complex has been reported for this series, the exact mode of binding cannot be ascertained at this time. Preclinical data indicated 2HG inhibition and antitumor effects in vitro and in vivo (Table 3). These phenylglycine compounds appear to be excellent chemical tools for tumor biology investigation, but optimization of their properties is likely required for further therapeutic development. Co-complexes of IDH1-R132H with two different 1-hydroxypyridin-2-one inhibitors have been reported (Zheng et al., 2013), but the quality of the crystal structure data supporting the mechanism of inhibition is poor. AG-120, a selective, potent inhibitor of mutated IDH1, is currently in clinical development for the treatment of cancers with IDH1 mutations (Table 3), but there is currently no published information on this inhibitor. Another inhibitor of mutated IDH1 has been reported recently (Table 3) (Deng et al., 2014). Co-complex X-ray studies revealed that Compound1 binds mutated IDH1 allosterically at the dimer interface resulting in an asymmetric open conformation. Distinctively, Compound 1 displaces the conserved catalytic Tyr139 and further disrupts the Mg2+ binding network, consistent with kinetic results of competitive inhibition with respect to Mg2+, but not with aKG substrate. Others have reported modeling of inhibitors into the active site of IDH1, but experimental evidence is lacking (Chaturvedi et al., 2013; Davis et al., 2014). The first reported potent and selective IDH2 inhibitor was the urea-sulfonamide series, AGI-6780 (Wang et al., 2013), a timedependent slow-tight binder to IDH2-R140Q exhibiting noncompetitive inhibition with respect to substrate and uncompetitive inhibition with respect to NADPH, and nanomolar potency for 2HG inhibition (Table 3). This compound showed good inhibitory selectivity for IDH2-R140Q, with no effect on the closely related IDH1 and IDH1-R132H isozymes. At doses that effectively blocked 2HG to basal levels, AGI-6780 induced differentiation of TF-1 erythroleukemia and primary human AML cells in vitro, suggesting potential to reverse leukemic phenotype in AML tumors harboring the IDH2 mutation. Unlike the case of IDH1 above, the published structure of AGI-6780 co-complexed with IDH2-R140Q allows for detailed analysis of its inhibitory mechanism (Wang et al., 2013). In the X-ray structure, a single molecule
of AGI-6780 binds at the interface of two protomers (Figure 2C). The allosteric inhibition appears to arise from the ability of AGI6780 to keep the IDH2-R140Q mutant enzyme in an open orientation, thereby preventing the NADPH cofactor and substrate aKG from coming close to the catalytic Mg2+ binding site (see Figure 3). The highly symmetric AGI-6780 binding pocket extends deep into the protein interface and is closed over by loops composed of residues 152–167, which also fold over the binding pocket, providing anexplanation for the time-dependent inhibition kinetics. AGI-6780 makes several direct H-bond interactions from its urea group and amide nitrogen to Gln316, but a significant amount of binding energy arises from van der Waals contacts between the protein and hydrophobic surfaces of AGI-6780. The in vivo potential for this compound is not known, since its pharmacokinetic properties were not reported. Nevertheless, this effective mode of inhibition serves as an important molecular model for the design of bioisosteric compounds. OtherIDH2inhibitorsareunderdevelopment,notablyAG-221, a first-in-class, orally available inhibitor (Table 3) which demonstrated a survival advantage in a preclinical study of a primary human IDH2 mutant AML xenograft mouse model (Yen et al., 2013). Early phase I clinical trial data for AG-221 show promise, with meaningful clinical responses in evaluable AML patients harboring IDH2 mutations (Stein et al., 2014). To date, there is no published example of a molecule that inhibits both IDH1 and IDH2 mutant isoforms with equipotency.

Table 3.Characteristics of Small Molecule Inhibitors of Mutant IDH

PhenylglycineAGI-5198 (Popovici-Mulleretal., 2012; Rohleetal.,2013)
N-cyclohexyl-2-(N-(3-fluorophenyl)-2(2-methyl-1H-imidazol-1-yl)acetamido)2-(o-tolyl)acetamide IDH1-R132H

  • Good potency against enzyme and in U87cell line overexpressing R132H mutation (IC50= 70nM)
  • Good oral exposure in rodents at high doses (>300mg/kg), which were likely at levels saturating hepatic clearance mechanisms
  • Plasma 2HG inhibition > 90% (BID dosing) in xenograft model of U87-R132H tumors
  • Promoted differentiation of glioma cells via induced demethylation of histone H3K9me3 and expression of genes associated with gliogenic differentiation at near-complete 2HG inhibition
  • inhibited plasma 2HG and delayed growth of IDH1-mutant but not wild-type glioma xenografts in mice

ML309 (Davis et al.,2014)
2-(2-(1H-benzo[d]imidazol-1-yl)-N-(3fluorophenyl)acetamido)-N-cyclopentyl2-o-tolylacetamide IDH1-R132H IDH1-R132C dIC50=68nM(R132H)

  • Inhibited 2HG production in glioblastoma cell line (IC50 = 250 nM) with minimal cytotoxicity
  • 1-hydroxypyridin2-one Compounds2and3 (Zhengetal.,2013)
    6-substituted1-hydroxypyridin-2-oneIDH1-R132H IDH1-R132C
  • K i= 190 and 280 nM (forR132H)
  • Inhibited production of 2HG in IDH1 mutated cells

Undisclosed
AG-120 (Agios)
Undisclosed
IDH1

  • Orally available, selective, potent inhibitor
  • PhaseI studies ongoing in advanced solid tumors (NCT02073994; NCT02074839)

Allostery as an Approach to Drugging Metabolic Enzymes Is Important in Cancer All enzymes discussed in this article are allosterically targeted by small molecule modulators. With the exception of the enzymes of lipid metabolism, it is striking that there are very few examples of the regulation of metabolic enzymes by drug-like molecules at the catalytic site. We believe that this observation will hold true for the wider set of metabolic enzymes. Metabolic pathways are typically regulated by upstream and downstream metabolites through feedforward and feedback mechanisms. This regulation occurs typically through binding at allosteric sites, which have distinctly different properties relative to active sites. Therefore regulation can come from effectors that may have very different properties to the substrate. This review describes the potential therapeutic impact of specific allosteric regulators of PKM2, glutaminase, and IDH. Additionally, preclinical studies of tool compounds demonstrated that allosteric regulators of other enzymes involved in cancer cell metabolism could provide more therapeutic opportunities (Table 4). Substrates and products of metabolic enzymes tend to be small and very polar, and often include crucial metal ions and their ligands, so it is likely that targeting their catalytic pockets will yield molecules with similar properties. From a drug-discovery point of view, targeting allosteric sites is appealing as hydrophilic substrate-binding sites are generally not hospitable to strong interactions with small molecule drugs, which gain potency to a large extent through hydrophobic interactions. In addition, as activity of most metabolic enzymes is regulated by multimerization, the formation of multimers provides opportunity for binding sites to form at protein–protein interfaces.

Table 4. Examples of Allostery in Cancer Cell Metabolism

TH           Tyrosine hydroxylase         Haloperidol                                           Activator             Catecholamine metabolism               (Casu and Gale, 1981)
PDK1      Pyruvate dehydrogenase
kinase isozyme1                  3,5-diphenylpent-2-enoicacids                         Activator             TCAcycle                                                (Stroba et al., 2009)
BCKDK  Branched chain keto acid
dehydrogenase kinase   (S)-a-chloro-phenylpropionicacid[(S)-CPP]     Inhibitor              Branch-chain amino acid                   (Tso et al., 2013)
ACACA   Acetyl-CoA carboxylase
alpha                                 5-tetradecyloxy-2-furoicacid (TOFA)                  Inhibitor              Fatty acid  synthesis                            (Wang et al.,2009)

FBP1     Fructose-1,6
bisphosphatase1               Benzoxazole benzene sulfonamide1                    Inhibitor              Glycolysis                                        (von Geldern et al., 2006)
ALADA minolevulinate
dehydratase                     wALAD in1 benzimidazoles                                     Inhibitor              Haem synthesis                                    (Lentz et al., 2014)
TYR       Tyrosinase         2,3-dithiopropanol                                                   Inhibitor              Melanin metabolism                    (Wood and Schallreuter, 1991)
DBHD  opamine beta
hydroxylase-2H-phthalazinehydrazone (hydralazine;HYD)
2-1H-pyridinonehydrazone (2-hydrazinopyridine;HP)
2-quinoline-carboxylicacid (QCA)
1H-imidazole-4-aceticacid (imidazole-4-aceticacid;IAA)                             Inhibitor         Neurotransmitter synthesis                    (Townes et al.,1990)
DCTD   dCMP
deaminase        5-iodo-2’-deoxyuridine5’-triphosphate                                 Inhibitor          Nucleotide metabolism                      (Prusoff and Chang, 1968)
TYMP  Thymidine
phosphorylase     5’-O-tritylinosine (KIN59)                                                    Inhibitor          Nucleotide metabolism                         (Casanova et al.,2006)
TYMS Thymidylate
synthase         1,3-propanediphosphonicacid (PDPA)                                     Inhibitor          Nucleotide   metabolism                        (Lovelace et al.,2007)

Figure 3. Simplified Description of IDH Protein Motion The large domain (residues 1–103 and 286–414) forms nearly all of the NADPH cofactor binding residues and roughly half of the substrate binding residues.The small domain(residues 104–136 and 186–285) contains the remaining substrate binding residues and the metal binding residues. The interface between the two protomers is formed by both the small domain and the clasp region (residues 137–185). The large domain moves away from the small domain to facilitate NADPH cofactor exchange and substrate binding. The large domain then closes up against the small domain, thereby completing the substrate binding pocket and bringing the cofactor, substrate, and metal into close contact with each other and with the key catalytic residues to facilitate hydride transfer between substrate and cofactor and enzyme-assisted carboxylation/decarboxylation. Subsequent opening of the large domain from the small domain would enable product release and cofactor exchange to complete the catalytic cycle (Rendina et al., 2013; Xu et al., 2004).

7.3.2 Chemical proteomics approaches to examine novel histone modifications

Xin Li, Xiang David Li
Current Opinion in Chemical Biology Feb 2015; 24:80–90
http://dx.doi.org/10.1016/j.cbpa.2014.10.015

Highlights

  • A variety of novel histone PTMs have been identified by MS-based methods.
  • Regulatory mechanisms and cellular functions of most novel histone PTMs remain unknown, due to lack of knowledge about their readers, erasers and writers.
  • Chemical proteomics approaches provide valuable tools to characterize novel histone PTMs.
  • The application of photoaffinity probes helps the profiling of histone PTMs’ readers, erasers and writers.

Histone posttranslational modifications (PTMs) play key roles in the regulation of many fundamental cellular processes, such as gene transcription, DNA damage repair and chromosome segregation. Significant progress has been made on the detection of a large variety of PTMs on histones. However, the identification of these PTMs’ regulating enzymes (i.e. ‘writers’ and ‘erasers’) and functional binding partners (i.e. ‘readers’) have been a relatively slow-paced process. As a result, cellular functions and regulatory mechanisms of many histone PTMs, particularly the newly identified ones, remain poorly understood. This review focuses on the recent progress in developing chemical proteomics approaches to profile readers, erasers and writers of histone PTMs. One of such efforts involves the development of the Cross-Linking-Assisted and SILAC-based Protein Identification (CLASPI) approach to examine PTM-mediated protein–protein interactions.

Table 1    Novel histone PTMs                      functions
1             Lysine formylation             Arising from oxidative damage of DNA modification sites overlap with lysine acetylation and methylation, potentially interfere with normal regulation of these PTMs

2      Lysine propionylation  p300,c CREB-binding protein,c Sirt1,c Sirt2,c Sirt3c
Structurally similar with lysine acetylation, regulated by same set of enzymes, H3K23pr may be regulatory for cell metabolism
3    Lysine butyrylation       p300,c CREB-binding protein,c Sirt1,c Sirt2,c Sirt3c
Structurally similar with lysine acetylation, regulated by same set of enzymes
4    Lysine malonylation    Sirt5c
Changing the positively charged lysine to negatively charged residue, likely to affect the chromatin structure
5   Lysine succinylation    Sirt5c
A  mutation to mimic crotonyl lysine that changes lysine to glutamic acid of histone H4K31, reduces cell viability
6  Lysine crotonylation   Sirt1,c Sirt2,c Sirt3
Enriched at active gene promoters potential enhancers in mammalian genomes, male germ cell differentiation
7 Lysine 2-hydroxyiso
butyrylation                     HDAC1-3c
Associated with gene transcription
8  Lysine 4-oxononoylation    Modified by 4-oxo-2-nonenal, generated under oxidative stress, prevents nucleosome assembly in vitro
9 Lysine 5-hydroxylation   JMJD6
suppress lysine acetylation and methylation
10 Glutamine methylation   Nop1  (yeast), fibrillarin (huma)
human histone H2AQ105
11 Serine and
threonine GlcNAcylation  O-GlcNAc transferase
H2BS112 GlcNAcylation promotes K120 monoubiquitination, H3S10 GlcNAcylation suppresses phosphorylation of site
12 Serine and threonine acetylation
13 Serine palmitoylation   Lpcat1
catalyzed H4S47 palmitoylation, Ca2+-dependent, regulates global RNA synthesis
14  Cysteine glutathionylation
H3.2 and H3.3
conserved cysteine, but not H3.1, destabilize the nucleosomal structure
15 Cysteine fatty-acylation
H3.2 C110
16 Tyrosine hydroxylation

Fig. 1. Schematic description of a MS-based method for the identification of novel histone PTMs.

http://ars.els-cdn.com/content/image/1-s2.0-S1367593114001562-gr1.sml

Fig. 2. Chemical proteomics approaches to profile readers and erasers of histone PTMs.
(a) Photo-cross-linking strategy to capture proteins recognizing histone PTMs.
(b) Chemical structure of photoaffinity peptide probes.
Modifications of interest were labeled in green; photo-cross-linkers were labeled in red; chemical handles (alkyne) were labeled in blue; the sequence of probe C and probes 1–5 were derived from the
histone H3 1–15 amino acids residues, the sequence of probe 6 was derived from the histone H4 1–19 amino acids residues.
(c) Schematic for the CLASPI strategy to profile proteins that bind certain histone mark in whole-cell proteomes

http://ars.els-cdn.com/content/image/1-s2.0-S1367593114001562-gr2.sml

Consistent with our findings, Tate and coworkers [57] recently reported the development of a photoaffinity probe based on a succinylated glutamate dehydrogenase (GDH) peptide for capturing Sirt5
as the corresponding desuccinylase. In addition to the application of photo-cross-linking strategy for examining the histone PTMs with known erasers, we recently used CLASPI with a photoaffinity
probe (probe 5, Figure 2b) to profile proteins that recognize a novel histone mark, crotonylation at histone H3K4 (H3K4cr, Table 1, Entry 6) [25], whose erasers were unknown. This study revealed,
for the first time, that Sirt3 can recognize the H3K4cr mark and efficiently catalyze the removal of histone crotonylation marks. More importantly, Sirt3 was found to regulate histone Kcr level in
cells and may potentially modulate gene transcription through its decrotonylase activity [58]. By converting bisubstrate inhibitors of HATs (histone peptides with certain lysine residues covalently
attached to Ac-CoA) to clickable photoaffinity probes (for example, probe 6, Figure 2b), they carried out the first systematic profiling of HATs in whole-cell proteomes [59].  We  anticipate  that  similar methods can be used to search for writers of novel histone PTMs such as Kmal, Ksucc, Kcr and Khib (Table 1) since the corresponding acyl-CoAs are presumed to be the acyl donors.

We have shown, in this review, the applications and recent advances of chemical tools, in combination with MS-based proteomics approaches, for the detection and characterization of histone
PTMs and their readers, erasers and writers.

This article belongs to a special issue

Omics Edited By Benjamin F Cravatt and Thomas Kodadek

Editorial overview: Omics: Methods to monitor and manipulate biological systems: recent advances in ‘omics’

Benjamin F Cravatt, Thomas Kodadek
Current Opinion in Chemical Biology Feb 2015; 24:v–vii
http://dx.doi.org/10.1016/j.cbpa.2014.12.023

7.3.3 Misfolded Proteins – from Little Villains to Little Helpers… Against Cancer

Ansgar Brüning1,* and Julia Jückstock
Front Oncol. 2015; 5: 47
http://dx.doi.org/10.3389.2Ffonc.2015.00047

The application of cytostatic drugs targeting the high proliferation rates of cancer cells is currently the most commonly used treatment option in cancer chemotherapy. However, severe side effects and resistance mechanisms may occur as a result of such treatment, possibly limiting the therapeutic efficacy of these agents. In recent years, several therapeutic strategies have been developed that aim at targeting not the genomic integrity and replication machinery of cancer cells but instead their protein homeostasis. During malignant transformation, the cancer cell proteome develops vast aberrations in the expression of mutated proteins, oncoproteins, drug- and apoptosis-resistance proteins, etc. A complex network of protein quality-control mechanisms, including chaperoning by heat shock proteins (HSPs), not only is essential for maintaining the extravagant proteomic lifestyle of cancer cells but also represents an ideal cancer-specific target to be tackled. Furthermore, the high rate of protein synthesis and turnover in certain types of cancer cells can be specifically directed by interfering with the proteasomal and autophagosomal protein recycling and degradation machinery, as evidenced by the clinical application of proteasome inhibitors. Since proteins with loss of their native conformation are prone to unspecific aggregations and have proved to be detrimental to normal cellular function, specific induction of misfolded proteins by HSP inhibitors, proteasome inhibitors, hyperthermia, or inducers of endoplasmic reticulum stress represents a new method of cancer cell killing exploitable for therapeutic purposes. This review describes drugs – approved, repurposed, or under investigation – that can be used to accumulate misfolded proteins in cancer cells, and particularly focuses on the molecular aspects that lead to the cytotoxicity of misfolded proteins in cancer cells.

Introduction:

How Do Proteins Fold and What Makes Misfolded Proteins Dangerous?

For an understanding of misfolded proteins, it is necessary to understand how cellular proteins attain and then further maintain their native conformation and how mature proteins and unfolded proteins are generated and converted into each other.

The principles and mechanisms of protein folding were one of the major research topics and achievements of biochemical research in the last century. For decades, Anfinsen’s model, which explained protein structure by thermodynamic principles applying to the polypeptide’s inherent amino acid sequence (1), was to be found in the introductory sections of all textbooks in protein biochemistry. According to Anfinsen’s thermodynamic hypothesis, the structure with the lowest conformational Gibbs free energy was finally taken by each single polypeptide due to a thermodynamic and stereochemical selection for side chain relations that form most stable and effective enzymes or structural proteins (1). Beyond this individual selection for the energetically most optimized conformation, evolution also selected for amino acid sequences that energetically allowed the smoothest and most “frustration-free” folding processes via a thermodynamic “folding funnel” (1–3).

Whereas Anfinsen’s model preferred the side chain elements as preferential organizing structures, recent hypotheses have inversely proposed the backbone hydrogen bonds as the driving force behind protein folding (4). According to the former theory, the finally folded protein was assumed to attain a single defined structure and shape (1, 4), and the unfolded conditions were described as being represented by a structureless statistical coil with nearly indefinite conformations – a so-called “featureless energy landscape” (4). The latter model assumes that a protein selects during its folding process from a limited repertoire of stable scaffolds of backbone hydrogen bond-satisfied α-helices and β-strands (4). This also implies that unfolded proteins are not structureless, shoelace-like linear amino acid alignments as often depicted in cartoons for graphical reasons, but actually, at least in part, retain discrete and stable scaffolds.

Once the protein has attained its final conformation, the problem of stabilizing this structure arises. Hydrophobic interactions that press non-polar side chains into the center of the protein are assumed to be a major force in protein stabilization (5, 6). At the protein surface, polar interactions, mainly by hydrogen bonds of polar side chains and backbone structure, are assumed to be of similar importance (6). Salt bridges and covalent disulfide bonds were identified as further forces supporting the stability of proteins (6). Accordingly, all conditions that interfere with these stabilizing forces, including extreme temperature, salt concentrations, and redox conditions, may lead to protein misfolding.

Another aspect that must be taken into account when studying protein folding relates to the very different conditions found in viable cells when compared to test tube conditions. Considering the life-cycle of a protein, each protein begins as a growing polypeptide chain protruding from the ribosomal exit tunnel and with several of its future interacting amino acid binding partners not even yet attached to the growing chain of the nascent polymer. In these ribosomal exit tunnels, first molecular interactions and helical structures are formed, and evidence exists to support the notion that the speed of translation is regulated by slow translating codon sequences just to optimize these first folding processes (7). After leaving the ribosomal tunnel, nascent polypeptides are also directly welcomed by chaperoning protein complexes, which facilitate and further guide the folding process of newly synthesized proteins (8). It is believed that a high percentage of nascent proteins are subject to immediate degradation due to early folding errors (9). Since many nascent proteins are synthesized in parallel at polysomes, the temporal and spatial proximity of unfolded peptides brings the additional risk of protein aggregation (10). Moreover, as mentioned above, even incomplete folding intermediates and partially folded states may form energetically but not physiologically active metastable structures (11, 12). An immediate, perinatal guidance and chaperoning of newborn proteins is therefore essential to creating functional, integrative proteins and to avoiding misfolded, function-less polypeptides with potentially cytotoxic features.

Since protein structure and function are coupled, misfolded proteins are, at first, loss-of-function proteins that might reduce cell viability, in particular when generated in larger quantities. A more dangerous feature of misfolded proteins, however, lies in their strong tendency toward abnormal protein–protein interactions or aggregations, which is reflected by the involvement of misfolded proteins and their aggregates in several amyloidotic diseases, including neurodegenerative syndromes such as Alzheimer’s disease and Parkinson’s disease (13, 14). The fact that several of these intracellular and extracellular protein aggregates contain β-sheet-like structures and form filamentous structures also supports the notion that misfolded proteins are not necessarily structureless protein coils or unspecific aggregates, at least when they are formed by homogenous proteins as in the case of several neurodegenerative diseases (13). Paradoxically, these larger aggregates appear to reflect a cell protective mechanism so as to sequester or segregate smaller, but highly reactive, nucleation cores of condensing protein aggregates (13).

Unspecific hydrophobic interactions, in particular, have been held responsible for protein aggregations that form when terminally folded proteins lose their native conformation and expose buried hydrophobic side chains on their surface (15, 16). These hydrophobic interactions are also believed to be the most problematic issues with newly synthesized polypeptides on single ribosomes or polysomes (12). Once exposed to the surface, the hydrophobic structures will quickly find possible interaction partners. The intracellular milieu can be regarded as a “crowded environment” (17), fully packed with proteins in close contact and near to their solubility limit (8, 12). Thus, misfolded proteins not only aggregate among each other but may also attach to normal native proteins and inhibit their function and activity. Since such misfolding effects and interactions can also include nuclear DNA replication and repair enzymes (18), misfolded proteins may not only exert proteotoxic but also genotoxic effects, thereby endangering the entire cellular “interactome” (19) by interfering both with the integrity of the proteome (proteostasis) and the genome. Therefore, a misfolded protein is not simply a loss-of-function protein but also a promiscuous little villain that might act like a free radical, exerting uncontrolled danger to the cell.

The way in which cells deal with misfolded proteins strongly depends on the nature, strength, length, and location of the damage induced by the various insults. Management of misfolded proteins can be achieved by heat shock protein (HSP)-mediated protein renaturation (repair); proteasomal, lysosomal, or autophagosomal degradation (recycling); intracellular disposal (aggregation); or – in its last consequence if overwhelmed – by programed cell death (despair). In the following paragraphs, the cellular management of misfolded proteins is described and therapeutic options to induce misfolded proteins in cancer cells are presented.

Hsp90 and Hsp90 Inhibitors

The best-known and evolutionarily most-conserved mechanism to protect against protein misfolding is the binding and refolding process mediated by so-called heat shock proteins (HSPs). HSPs recognize unfolded or misfolded proteins and facilitate their restructuring in either an ATP-dependent (large HSPs) or energy-independent manner (low weight HSPs). HSP of 90 kDa (hsp90) is a constitutively expressed HSP and is regarded as the most common and abundantly expressed HSP in eukaryotic cells (20, 21). Although commonly referred to as hsp90, it consists of a variety of isoforms that are encoding for cytosolic (hsp90α1, α2, β), mitochondrial (TRAP1), or endoplasmic reticulum (ER)-resident (GRP94) forms. Its primary function is less that of a stress response protein and more to bind to a certain group of client proteins unable to maintain a stable configuration without being assisted by hsp90 (20, 22, 23). Steroid hormone receptors (estrogen receptor, glucocorticoid receptor), cell cycle regulatory proteins (CDK4, cyclin D, polo-like kinase), and growth factor receptors and their downstream targets (epidermal growth factor receptor 1, HER2, AKT) are among the best-studied client proteins of hsp90 (20–22). Also, several cancer-specific mutations generating otherwise instable oncoproteins, such as mutant p53 or bcr-abl, rely on hsp90 chaperoning to keep them in a soluble form, thereby facilitating the extravagant but vulnerable “malignant lifestyle” of hsp90-addicted cancer cells (21, 24). Accordingly, hsp90 has been assumed to be a prominent target, in particular for hormone-responsive and growth factor receptor amplification-dependent cancer types.

The microbial antibiotics geldanamycin and radicicol are the prototypes of hsp90 inhibitors. Based on intolerable toxicity, these molecules had to be chemically modified for application in humans, and most of the ongoing clinical studies with hsp90 inhibitors are aimed at identifying semi-synthetic derivatives of these lead compounds with an acceptable risk profile. Unfortunately, most recent studies using geldanamycin derivatives have provided disappointing results because of toxicities and insufficient efficacy (22, 25–27). Studies with radicicol (resorcinol) derivatives, in particular with ganetespib, appear to be more promising because of fewer adverse effects (22, 25–27). Liver and ocular (retinal) toxicities have been described as main adverse effects of hsp90 inhibition, and appeared to be experienced less with ganetespib than with most of the first generation hsp90 inhibitors (28).

Since both geldanamycin and radicicol target the highly conserved and unique ATP-binding domain of hsp90, new synthetic inhibitors have also been generated by rational drug design (22, 25–27). However, none of the various natural or synthetic hsp90 inhibitors under investigation have yet provided convincing clinical data, and future studies will show whether hsp90 can eventually be added to the list of effective cancer targets.

Hsp70, Hsp40, Hsp27, and HSF1

Hsp90 is assisted by several other HSPs and non-chaperoning co-factors, finally forming a large protein complex that recruits and releases client proteins in an energy-dependent manner (21, 22, 29). Client proteins for hsp90 are first bound to hsp70, which transfers the prospective client to hsp90 through the mediating help of an hsp70–hsp90 organizing protein (HOP). Binding of potential hsp90 client proteins to hsp70 is facilitated by its co-chaperone hsp40 (23, 30). Exposed hydrophobic amino acids, the typical feature of misfolded proteins, have been described as the main recognition signal for hsp70 proteins (15, 16, 31). Hsp70 proteins are not only supporter proteins for hsp90 but also represent a large chaperone family capable of acting independently of hsp90 and that can be found in all cellular compartments, including cytosol and nucleus (hsp70, hsp72, hsc70), mitochondria (GRP75 = mortalin), and the ER (GRP78 = BiP). Hsp70 chaperones may act on misfolded or nascent proteins either as “holders” or “folders” (31), which means that they prevent protein aggregation either by sheltering these aggregation-prone protein intermediates or by allowing these proteins to fold/refold into their native form in an assisted mechanism within a protected environment (31). Hsc70 (HSPA8) is a constitutively expressed major hsp70 isoform that is an essential factor for normal protein homeostasis even in unstressed cells (16). Misfolded proteins can also be destined by hsp70 proteins for their ultimate degradation. Proteins that expose KFERQ amino acid motifs on their surface during their unfolding process are preferentially bound by hsc70 and can be directed to lysosomes in a process called chaperone-mediated autophagy (CMA) (32, 33). In another mechanism of targeted protein degradation, interaction of hsc70 with the E3 ubiquitin ligase CHIP (carboxyl terminus of Hsc70-interacting protein) leads to ubiquitination of misfolded proteins and thus their destination of the ubiquitin-proteasome protein degradation pathway (34, 35). Since hsc70 is essential for normal protein homeostasis and its knock-out is lethal in mice (16, 36), hsc70 inhibition might not be an optimal target for cancer-specific induction of misfolded proteins. This contrasts with the inducible forms of hsp70 such as hsp72 (HSPA1), which are upregulated in a cell stress-specific manner and are often found to be constitutively overexpressed in cancer tissues (16, 36). Transcriptional activation of these inducible HSPs is mediated by the heat shock factor 1 (HSF1), which also regulates expression of hsp40 and the small HSP hsp27 by sharing a common promoter consensus sequence (heat shock response element) for HSF1 binding (37). HSF1 was also found to be constitutively activated in cancer tissues, modulating several cell cycle- and apoptosis-related pathways via its target genes (38–40). HSF1 itself is kept inactive in the cytosol by binding to hsp90, and the recruitment of hsp90 to misfolded proteins is considered a main activation mechanism to release monomeric HSF1 for its subsequent trimerization, post-translational activation, and nuclear translocation (24, 41). Also, since hsp90 inhibition causes hsp70 induction by HSF1 activation as a compensatory feed-back mechanism (24), combined inhibition of hsp90 and hsp70, or of hsp90 and HSF1 might be a more effective therapeutic approach for cancer treatment than single HSP targeting alone.

Indeed, several small-molecule inhibitors and aptamers for hsp70, hsp40, and hsp27 have been designed (16, 42–44), but most of them remain in pre-clinical development, or are either not applicable in humans or associated with intolerable side effects (16, 42–44). Notably, the natural bioflavonoid quercetin was shown to inhibit phosphorylation and transcriptional activity of the heat shock transcription factor HSF1, thus reducing HSP expression at its most basal level (45–48). This HSP and HSF1 inhibition may also contribute to the observed cancer-preventing effects of a flavonoid-rich diet, which includes fruits and vegetables. However, due to their low bioavailability, the concentrations of flavonoids needed to induce direct cytotoxic effects in cancer cells for (chemo-)therapeutic reasons are obviously not achievable in humans, even when applied as nutritional supplements (49). More effective and clinically more easily applicable inhibitors of HSF1 are therefore urgently sought. Promising HSF1 targeting strategies are currently under development, although are apparently not yet suited for clinical applications (24, 50, 51).

SP Williams Comment:

There is a new hsp90- inhibitor, ganetespib, which is active against ovarian cancer in vitro and in vivo. Clinical trials are looking at this in cisplatin refractory cases. This was identified by a network analysis from a previous siRNA screen on ovarian cancer cells for pathways related to growth inhibition in an effort to find possible targets against CP resistance. The reference ishttp://www.researchgate.net/publication/253647952_Network_analysis_identifies_an_HSP90-central_hub_susceptible_in_ovarian_cancer

Protein Ubiquitination and Proteasomal Degradation

Ubiquitin is a 76 amino acid polypeptide that can covalently be attached via its carboxy-terminus to free (lysyl) amino groups of proteins. Ubiquitination of proteins generates a cellular recognition motif that is involved in various functions ranging from transcription factor and protein kinase activation to DNA repair and protein degradation – depending on the extent and exact location of this post-translational modification (52, 53). Monoubiquitination of peptides of more than 20 amino acids was found to be a minimal requirement for protein degradation, but the canonical fourfold (poly-)ubiquitination with three further lysine (K48) side chain-linked ubiquitins appears to be most apt for an effective and rapid substrate recognition by the proteasome (54). This canonical polyubiquitin structure, as well as several other mixed polyubiquitin structures, can be recognized by the external 19S subunits of the 26S proteasome complex (54, 55). Prior to degradation of ubiquitinated proteins by the proteasomal 20S core subunit, the attached ubiquitin chains are released by the external 19S subunits for recycling, although they can also be co-degraded by the proteasome (56). After first passing the 19S subunit, the proteasomal target proteins are then unfolded in an energy-dependent manner and introduced into the narrow enzymatic cavity of proteasome for degradation. The barrel-shaped 20S proteasomal core complex contains three different proteolytic activities in duplicate (β1: caspase-like-, β2: tryptic-, and β5: chymotryptic activity), which initiate an efficient cleavage of the proteasomal target proteins into smaller peptides (57).

It is important to note that specific ubiquitination and ensuing proteasomal degradation is not an exclusive degradation mechanism of misfolded proteins but is also used to regulate the expression level of several native cell cycle regulatory proteins [cyclins, proliferating cell nuclear antigen (PCNA), p53], signaling pathway molecules (β-catenin, IκB), and survival factors (mcl-1) during the course of normal protein homeostasis and cell cycle progression (53, 55, 57, 58). Moreover, proteasomes are involved in protein maturation, including the processing and maturation of the NF-κB transcription factor subunit p50 and the drug-resistant protein MDR1 (57). Therefore, targeting proteasomal activity has not only been of interest for the generation of misfolded, cytotoxic proteins but also for interfering with the expression of proteins involved in several hallmarks of cancer, including cell cycle progression, signal transduction, and apoptosis.

Proteasome Inhibitors

Bortezomib (PS-341, Velcade ™) has long been known as a paragon of a clinically applicable proteasome inhibitor. Bortezomib has been approved for the treatment of multiple myeloma and mantle cell lymphoma (55, 59, 60). The great expectations of transferring the success of bortezomib to non-hematological solid cancer types have unfortunately not yet been fulfilled. It has been suggested that the high antibody-producing capacity of myeloma cells and thus the need for an efficient proteasomal degradation system to cope with the recycling process of misfolded ER-generated antibodies [ER-associated degradation process (ERAD); see below] might contribute to the high sensitivity of myeloma cells to bortezomib (9, 60, 61). Originally, bortezomib was developed to inhibit the proteasomal degradation of the NF-κB inhibitor IκB, thus targeting the pro-inflammatory, but also cancer-promoting, effect of the NF-κB transcription factor (55, 60, 62). Recent insights indicate that the anti-tumoral effect of bortezomib is not only mediated by its NF-κB inhibitory activity but also by its ability to induce accumulation of misfolded proteins in the cytosol and the ER (60, 62–65). However, the use of bortezomib, even for highly sensitive multiple myeloma, is limited by its strong tendency to induce a proteasome inhibition-independent peripheral neuropathy by acting on neuronal mitochondria (61). Since neurodegenerative diseases are associated with protein misfolding and aggregation, the neuropathological effects of bortezomib might also be assumed to be mediated by the possible proteotoxic effects of bortezomib in neuronal cells. However, although proteasome inhibitor-induced neurodegeneration and inclusion body formation have been described in animal models, similarities between proteasome inhibitor-induced neurodegeneration and Parkinson’s disease-like histopathological features could not be established (66).

Table 1 Drugs described in this review and their mechanism of action (MOA), status of approval, and main adverse effects.

Aggresome Formation and Re-Solubilization: Role of HDAC6

As depicted above, proteasome and HSP inhibition will eventually lead to the accumulation of misfolded and polyubiquitinated proteins. Based on their inherent cohesive properties mediated by their exposed hydrophobic surfaces, both ubiquitinated and non-ubiquitinated misfolded proteins tend to adhere as small aggregates (Figure ​(Figure1).1). Individual ubiquitinated proteins and small ubiquitinated aggregates can be recognized by specific ubiquitin-binding proteins such as HDAC6 via its zinc finger ubiquitin-binding domain. HDAC6 is an unusual histone deacetylase located in the cytosol that regulates microtubule acetylation and is also able to bind ubiquitinated proteins. Based on HDAC6’s additional ability to bind to microtubule motor protein dynein, these aggregates are actively transported along the microtubular system into perinuclear aggregates around the microtubule organizing center (MTOC) (10, 83, 84). Recognition of small, scattered ubiquitinated aggregates by HDAC6 has been described as being mediated by unanchored ubiquitin chains, which are generated by aggregate-attached ubiquitin ligase ataxin-3 (85). Whereas proteasomal target proteins are primarily tagged by K-48 (lysine-48) linked ubiquitins; K-63 linked ubiquitin chains appear to be a preferential modification for aggresomal targeting by HDAC6 and were assumed to mediate a redirection from proteasomal degradation to aggresome formation in the case of proteasomal inhibition or overload (86). Accordingly, aggresome formation is not an unspecific protein aggregation but a specific, ubiquitin-controlled sorting process. Furthermore, these aggresomes consist not only of misfolded and deposited proteins but have also been shown to contain a large amount of associated HSPs and ubiquitin-binding proteins, including HDAC6 [Figure ​[Figure1;1; (10, 83, 84)]. Aggresomes contain, and are also surrounded by, large numbers of proteasomes (10, 83, 84), which help to resolubilize these aggregates not only through their intrinsic proteasomal digestion but also by generating unanchored K63-branched polyubiquitin chains, which then stimulate HDAC6-mediated autophagy, another cellular disposal mechanism in involving HDAC6 (87). Notably, HDAC6 has also been shown to control further maturation of autophagic vesicles by stimulating autophagosome–lysosome fusion (Figure ​(Figure1)1) in a manner different from the normal autophagosome–lysosome fusion process (88).

Figure 1

Drugs that inhibit folding or disposal of misfolded proteins. Native mature proteins, nascent proteins, or misfolded proteins can be prevented from folding or refolding by small and large heat shock protein inhibitors, of which the hsp90 inhibitors based …

The HDAC6 multitalent also exerts its deacetylase activity on hsp90 and modifies hsp90 client binding by facilitating its chaperoning of steroid hormone receptors and HSF1 (89–91). Recruitment of HDAC6 to ubiquitinated proteins leads to the dissociation of the repressive HDAC6/hsp90/HSF1 complex (91) and allows the release of transcriptionally active HSF1 to the nucleus. The engagement of HDAC6 at the aggresome–autophagy pathway hence also indirectly facilitates HSF1 activity. p97/VCP (valosin-containing protein), another binding partner of HDAC6 and itself a multi-interactive, ATP-dependent chaperone (92–94), is assumed to be involved not only in the specific separation of hsp90 and HSF1 by its “segregase” activity but also in the binding and remodeling of polyubiquitinated proteins before their delivery to the proteasome (93–95). Additionally, p97/VCP dissociates polyubiquitinated proteins bound to HDAC6 (91). Accumulation of polyubiquitinated proteins thus leads to HDAC6-dependent HSF1 activation and HSP induction, p97/VCP-dependent recruitment and “preparation” of polyubiquitinated proteins to proteasomes, and, in the case of pharmacological proteasome inhibition or physiological overload, to an HDAC6-dependent detoxification of polyubiquitinated proteins by the aggresome/autophagy pathway.

Pharmacological Inhibition of Aggresome Formation: HDAC6 Inhibitors

The central involvement of HDAC6 in aggresome formation and clearance makes HDAC6 one of the most interesting druggable targets for the induction of proteotoxicity in cancer cells. Also, HDAC6 has been found to be overexpressed in various cancer tissues, associated with advanced cancer stages and increased neoplastic transformation (96). Several pan-histone deacetylase inhibitors have been developed and tested in clinical studies for a variety of diseases, including different types of cancer (97, 98). Although hematological malignancies responded best to most of the already clinically tested pan-histone deacetylase inhibitors, the efficacy on solid cancer types was disappointingly poor and also associated with intolerable side effects (98). The unforeseeable pleiotropic epigenetic mechanism caused by non-specific (nuclear) histone deacetylase inhibitors may also limit their application for use in cancer treatment or HDAC6 inhibition, and has led to the search for selective HDAC6 inhibitors with no inhibitory effects on transcription modifying histone deacetylases. Through screening of small molecules under the rationale of selecting for tubulin deacetylase inhibitors with no cross-reactive histone deacetylase activity, the HDAC6 inhibitor tubacin was identified, and suggested for use in the treatment of neurodegenerative diseases or to reduce cancer cell migration and angiogenesis (99). Hideshima et al. then proved the hypothesis that the combined use of bortezomib with tubacin leads to an accumulation of non-disposed cytotoxic proteins and aggregates in cancer cells (100). Indeed, a synergistic effect of these two drugs against multiple myeloma cells could be observed with no detectable toxic effect on peripheral blood mononuclear cells (100). This and follow-up studies also revealed the efficacy of tubacin as a single agent against leukemia cells (100, 101) and a chemo-sensitizing effect on cytotoxic drugs in breast- and prostate-cancer cells (102).

Endoplasmic Reticulum Stress

Besides the cytosol, the ER is a major site for protein synthesis, in particular for those proteins destined for extracellular secretion, the cell membrane, or their retention within the endomembrane system. At the rough ER, nascent proteins are co-translationally transported across the ER membrane into the ER lumen (107), where they immediately encounter ER-resident chaperones, most prominently represented by hsp70 family member BiP/GRP78 and hsp90 family member GRP94 to help proper protein folding (15, 108). Most of these proteins also undergo post-translational modifications, including N- or O-linked glycosylation or protein disulfide bridge-building (109, 110), thereby adding further mechanisms of protein stabilization but also challenges for proper protein folding.

Similar to the situation in cytosolic protein biosynthesis, a large proportion of nascent proteins in the ER are assumed to misfold and to go “off-pathway” even under normal physiological conditions. Furthermore, the ER lumen, narrowly sandwiched between two phospholipid membranes, has been described as an even more densely crowded environment than the cytosol, additionally facilitating unspecific protein attachments and aggregations (15). Since, with the exception of bulk reticulophagy, the lumen of the ER contains no endogenous protein degradation system, and the anterograde transport of ER proteins to the Golgi, lysosomes, endosomes, or the extracellular environment requires properly folded proteins, a retrograde transport of ER proteins into the cytosol remains the only possible mechanism of preventing misfolded protein accumulation within the ER. In this ERAD, misfolded proteins are re-exported across the ER membrane by a specific multi protein complex, ubiquitinated by ER membrane-integrated ubiquitin ligases, and finally become degraded by cytosolic proteasomes (111, 112). Notably, association of the cytosolic p97/VCP protein, an important interacting partner with HDAC6, has also been described as being an essential factor for driving the luminal proteins through the ER membrane pore complex into the cytosol (92,112).

Accordingly, all agents and conditions that interfere with these folding, maturation, and retranslocation processes can lead to protein misfolding and aggregation within this sensitive organelle. Chemicals that act as glycosylation inhibitors (tunicamycin), calcium ionophore inhibitors (A23187, thapsigargin), heavy metal ions (cadmium, lead), reducing agents (dithiothreitol), as well as conditions like hypoxia or oxidative stress, all lead to a phenomenon called ER stress (113–116). In the ER-stress response, a triad of ER membrane-resident signaling receptors and transducers, IRE1, ATF6, and PERK1, become activated and lead to the transcriptional activation of cytosolic and ER-resident chaperones to cope with the increasing number of misfolded proteins. Induction of autophagy (reticulophagy; ER-phagy) may also occur and supports the removal of damaged regions of the ER (117). Under very intensive or even unmanageable ER-stress conditions, a variety of pro-apoptotic pathways ensue, including CHOP induction, c-JUN-kinase activation, and caspase cleavage (118–120), which eventually prevails over the cytoprotective arm of the ER-stress response and may lead to apoptosis. Targeting of protein folding within the ER is therefore a very promising strategy to induce apoptosis in cancer cells, in particular in those cancer cells characterized by an unphysiologically high protein secretion rate, such as, for example, multiple myeloma cells. Whereas the above-mentioned drugs such as tunicamycin or thapsigargin are valuable tools for cell biology studies, they display unacceptable toxicities in humans and are not suited for therapeutic applications. Interestingly, several already established drugs used for non-cancerous diseases have been described as inducing ER stress at pharmacologically relevant concentrations in humans as an off-target effect (113, 116). The non-steroidal anti-inflammatory COX-2 inhibitor celecoxib is an approved drug to treat various forms of arthritis and pain, but has also been described as exerting ER stress by functioning as a SERCA (sarco/ER Ca2+ ATPase) inhibitor (113, 116). However, although well tolerated in humans, the ER-stress-inducing ability of celecoxib seems to be weaker than that of direct SERCA inhibitors such as thapsigargin, and the usefulness of celecoxib against advanced cancer has been questioned (116). Various HIV protease inhibitors have been described as inducing ER stress in human tissue cells as a side effect (121–123). In particular the HIV drugs lopinavir, saquinavir, and nelfinavir appear to be potent inducers of the ER-stress reaction, leading to a focused interest in these drugs for the induction of ER stress and apoptosis in cancer cells (116, 124–128). In fact, with currently over 27 clinical studies in cancer patients2, nelfinavir, either used as a single agent or in combination therapy, is on the list of the most promising prospective candidates to induce selective proteotoxicity in cancer cells at pharmacologically relevant concentrations. Although the exact mechanism by which nelfinavir induces ER stress is not yet clear, it was shown that nelfinavir causes the upregulation of cytosolic and ER-resident HSPs, and induces apoptosis in cancer cells associated with caspase activation and induction of the pro-apoptotic transcription factor CHOP (125, 126). Nelfinavir was also shown to be combinable with bortezomib to enhance its activity on cancer cells (129). Since the retrograde transport of misfolded ER proteins is inhibited by the p97/VCP inhibitor eeyarestatin (130, 131), we recently tested the combination of eeyarestatin with nelfinavir but found no synergistic effect between these two agents in cervical cancer cells (132). In contrast, eeyarestatin markedly sensitized cervical cancer cells to bortezomib treatment (132), which was also observed in preceding studies in which eeyarestatin was used to augment the ER-stress-inducing ability of bortezomib in leukemia cells (131).

Induction of proteotoxicity through the accumulation of misfolded proteins has evolved as a new treatment modality in the fight against cancer. Clinically approved drugs such as bortezomib and carfilzomib provide evidence of the functionality of this approach. Newly developed agents like the HDAC6 inhibitor ACY-1215 or repurposed drugs like nelfinavir or disulfiram are currently being tested in clinical trials with cancer patients and will hopefully further broaden our arsenal of anti-cancer drugs. Notably, most proteotoxic agents that have been approved or are in clinical trials target the ubiquitin-proteasome-system (UPS) and are mainly effective in multiple myeloma cells, which rely on a functional ER/ERAD/UPS for excessive and proper antibody production. Similarly, it can be assumed that other cancer cell types with a marked secretory phenotype may also be affected by ER/ERAD/UPS inhibitors. In accordance with this notion, a recent dose-escalating Phase Ia study with nelfinavir as a single agent, that covered a large variety of solid cancer entities, revealed response rates primarily in patients with neuroendocrine tumors (140). In most other solid cancer types, however, the chemo-sensitizing or combination effects of proteotoxic drugs may prevail, and have become the focus of an increasing number of very promising clinical and pre-clinical studies.

7.3.4 Endoplasmic reticulum protein 29 (ERp29) in epithelial cancer

Friend or Foe: Endoplasmic reticulum protein 29 (ERp29) in epithelial cancer

Chen S1, Zhang D2

FEBS Open Bio. 2015 Jan 30; 5:91-8
http://dx.doi.org:/10.1016/j.fob.2015.01.004

The endoplasmic reticulum (ER) protein 29 (ERp29) is a molecular chaperone that plays a critical role in protein secretion from the ER in eukaryotic cells. Recent studies have also shown that ERp29 plays a role in cancer. It has been demonstrated that ERp29 is inversely associated with primary tumor development and functions as a tumor suppressor by inducing cell growth arrest in breast cancer. However, ERp29 has also been reported to promote epithelial cell morphogenesis, cell survival against genotoxic stress and distant metastasis. In this review, we summarize the current understanding on the biological and pathological functions of ERp29 in cancer and discuss the pivotal aspects of ERp29 as “friend or foe” in epithelial cancer.

The endoplasmic reticulum (ER) is found in all eukaryotic cells and is complex membrane system constituting of an extensively interlinked network of membranous tubules, sacs and cisternae. It is the main subcellular organelle that transports different molecules to their subcellular destinations or to the cell surface [10,85].

The ER contains a number of molecular chaperones involved in protein synthesis and maturation. Of the ER chaperones, protein disulfide isomerase (PDI)-like proteins are characterized by the presence of a thioredoxin domain and function as oxido-reductases, isomerases and chaperones [33]. ERp29 lacks the active-site double-cysteine (CxxC) motif and does not belong to the redox-active PDIs [5,47]. ERp29 is recognized as a characterized resident of the cellular ER, and it is expressed ubiquitously and abundantly in mammalian tissues [50]. Protein structural analysis showed that ERp29 consists of N-terminal and C-terminal domains [5]: N-terminal domain involves dimerization whereas the C-terminal domain is essential for substrate binding and secretion [78]. The biological function of ERp29 in protein secretion has been well established in cells [8,63,67].

ERp29 is proposed to be involved in the unfolded protein response (UPR) as a factor facilitating transport of synthesized secretory proteins from the ER to Golgi [83]. The expression of ERp29 was demonstrated to be increased in cells exposed to radiation [108], sperm cells undergoing maturation [42,107], and in certain cell types both under the pharmacologically induced UPR and under the physiological conditions (e.g., lactation, differentiation of thyroid cells) [66,82]. Under ER stress, ERp29 translocates the precursor protein p90ATF6 from the ER to Golgi where it is cleaved to be a mature and active form p50ATF by protease (S1P and S2P) [48]. In most cases, ERp29 interacts with BiP/GRP78 to exert its function under ER stress [65].

ERp29 is considered to be a key player in both viral unfolding and secretion [63,67,77,78] Recent studies have also demonstrated that ERp29 is involved in intercellular communication by stabilizing the monomeric gap junction protein connexin43 [27] and trafficking of cystic fibrosis transmembrane conductance regulator to the plasma membrane in cystic fibrosis and non-cystic fibrosis epithelial cells [90]. It was recently reported that ERp29 directs epithelial Na(+) channel (ENaC) toward the Golgi, where it undergoes cleavage during its biogenesis and trafficking to the apical membrane [40]. ERp29 expression protects axotomized neurons from apoptosis and promotes neuronal regeneration [111]. These studies indicate a broad biological function of ERp29 in cells.

Recent studies demonstrated a tumor suppressive function of ERp29 in cancer. It was found that ERp29 expression inhibited tumor formation in mice [4,87] and the level of ERp29 in primary tumors is inversely associated with tumor development in breast, lung and gallbladder cancer [4,29].

However, its expression is also responsible for cancer cell survival against genotoxic stress induced by doxorubicin and radiation [34,76,109]. The most recent studies demonstrate other important roles of ERp29 in cancer cells such as the induction of mesenchymal–epithelial transition (MET) and epithelial morphogenesis [3,4]. MET is considered as an important process of transdifferentiation and restoration of epithelial phenotype during distant metastasis [23,52]. These findings implicate ERp29 in promoting the survival of cancer cells and also metastasis. Hence, the current review focuses on the novel functions of ERp29 and discusses its pathological importance as a “friend or foe” in epithelial cancer.

2. ERp29 regulates mesenchymal–epithelial transition

2.1. Epithelial–mesenchymal transition (EMT) and MET

The EMT is an essential process during embryogenesis [6] and tumor development [43,96]. The pathological conditions such as inflammation, organ fibrosis and cancer progression facilitate EMT [16]. The epithelial cells after undergoing EMT show typical features characterized as: (1) loss of adherens junctions (AJs) and tight junctions (TJs) and apical–basal polarity; (2) cytoskeletal reorganization and distribution; and (3) gain of aggressive phenotype of migration and invasion [98]. Therefore, EMT has been considered to be an important process in cancer progression and its pathological activation during tumor development induces primary tumor cells to metastasize [95]. However, recent studies showed that the EMT status was not unanimously correlated with poorer survival in cancer patients examined [92].

In addition to EMT in epithelial cells, mesenchymal-like cells have capability to regain a fully differentiated epithelial phenotype via the MET [6,35]. The key feature of MET is defined as a process of transdifferentiation of mesenchymal-like cells to polarized epithelial-like cells [23,52] and mediates the establishment of distant metastatic tumors at secondary sites [22]. Recent studies demonstrated that distant metastases in breast cancer expressed an equal or stronger E-cadherin signal than the respective primary tumors and the re-expression of E-cadherin was independent of the E-cadherin status of the primary tumors [58]. Similarly, it was found that E-cadherin is re-expressed in bone metastasis or distant metastatic tumors arising from E-cadherin-negative poorly differentiated primary breast carcinoma [81], or from E-cadherin-low primary tumors [25]. In prostate and bladder cancer cells, the nonmetastatic mesenchymal-like cells were interacted with metastatic epithelial-like cells to accelerate their metastatic colonization [20]. It is, therefore, suggested that the EMT/MET work co-operatively in driving metastasis.

2.2. Molecular regulation of EMT/MET

E-cadherin is considered to be a key molecule that provides the physical structure for both cell–cell attachment and recruitment of signaling complexes [75]. Loss of E-cadherin is a hallmark of EMT [53]. Therefore, characterizing transcriptional regulators of E-cadherin expression during EMT/MET has provided important insights into the molecular mechanisms underlying the loss of cell–cell adhesion and the acquisition of migratory properties during carcinoma progression [73].

Several known signaling pathways, such as those involving transforming growth factor-β (TGF-β), Notch, fibroblast growth factor and Wnt signaling pathways, have been shown to trigger epithelial dedifferentiation and EMT [28,97,110]. These signals repress transcription of epithelial genes, such as those encoding E-cadherin and cytokeratins, or activate transcription programs that facilitate fibroblast-like motility and invasion [73,97].

The involvement of microRNAs (miRNAs) in controlling EMT has been emphasized [11,12,18]. MiRNAs are small non-coding RNAs (∼23 nt) that silence gene expression by pairing to the 3′UTR of target mRNAs to cause their posttranscriptional repression [7]. MiRNAs can be characterized as “mesenchymal miRNA” and “epithelial miRNA” [68]. The “mesenchymal miRNA” plays an oncogenic role by promoting EMT in cancer cells. For instance, the well-known miR-21, miR-103/107 are EMT inducer by repressing Dicer and PTEN [44].

The miR-200 family has been shown to be major “epithelial miRNA” that regulate MET through silencing the EMT-transcriptional inducers ZEB1 and ZEB2 [13,17]. MiRNAs from this family are considered to be predisposing factors for cancer cell metastasis. For instance, the elevated levels of the epithelial miR-200 family in primary breast tumors associate with poorer outcomes and metastasis [57]. These findings support a potential role of “epithelial miRNAs” in MET to promote metastatic colonization [15].

2.3. ERp29 promotes MET in breast cancer

The role of ERp29 in regulating MET has been established in basal-like MDA-MB-231 breast cancer cells. It is known that myosin light chain (MLC) phosphorylation initiates to myosin-driven contraction, leading to reorganization of the actin cytoskeleton and formation of stress fibers [55,56]. ERp29 expression in this type of cells markedly reduced the level of phosphorylated MLC [3]. These results indicate that ERp29 regulates cortical actin formation through a mechanism involved in MLC phosphorylation (Fig. 1). In addition to the phenotypic change, ERp29 expression leads to: expression and membranous localization of epithelial cell marker E-cadherin; expression of epithelial differentiation marker cytokeratin 19; and loss of the mesenchymal cell marker vimentin and fibronectin [3] (Fig. 1). In contrast, knockdown of ERp29 in epithelial MCF-7 cells promotes acquisition of EMT traits including fibroblast-like phenotype, enhanced cell spreading, decreased expression of E-cadherin and increased expression of vimentin [3,4]. These findings further substantiate a role of ERp29 in modulating MET in breast cancer cells.

Fig. 1  ERp29 triggers mesenchymal–epithelial transition. Exogenous expression of ERp29 in mesenchymal MDA-MB-231 breast cancer cells inhibits stress fiber formation by suppressing MLC phosphorylation. In addition, the overexpressed ERp29 decreases the …

http://www.ncbi.nlm.nih.gov/pmc/articles/PMC4329646/bin/gr1.gif

2.4. ERp29 targets E-cadherin transcription repressors

The transcription repressors such as Snai1, Slug, ZEB1/2 and Twist have been considered to be the main regulators for E-cadherin expression [19,26,32]. Mechanistic studies revealed that ERp29 expression significantly down-regulated transcription of these repressors, leading to their reduced nuclear expression in MDA-MB-231 cells [3,4] (Fig. 2). Consistent with this, the extracellular signal-regulated kinase (ERK) pathway which is an important up-stream regulator of Slug and Ets1 was highly inhibited [4]. Apparently, ERp29 up-regulates the expressions of E-cadherin transcription repressors through repressing ERK pathway. Interestingly, ERp29 over-expression in basal-like BT549 cells resulted in incomplete MET and did not significantly affect the mRNA or protein expression of Snai1, ZEB2 and Twist, but increased the protein expression of Slug [3]. The differential regulation of these transcriptional repressors of E-cadherin by ERp29 in these two cell-types may occur in a cell-context-dependent manner.

Fig. 2  ERp29 decreases the expression of EMT inducers to promote MET. Exogenous expression of ERp29 in mesenchymal MDA-MB-231 breast cancer cells suppresses transcription and protein expression of E-cadherin transcription repressors (e.g., ZEB2, SNAI1 and Twist), ..

http://www.ncbi.nlm.nih.gov/pmc/articles/PMC4329646/bin/gr2.gif

2.5. ERp29 antagonizes Wnt/ β-catenin signaling

Wnt proteins are a family of highly conserved secreted cysteine-rich glycoproteins. The Wnt pathway is activated via a binding of a family member to a frizzled receptor (Fzd) and the LDL-Receptor-related protein co-receptor (LRP5/6). There are three different cascades that are activated by Wnt proteins: namely canonical/β-catenin-dependent pathway and two non-canonical/β-catenin-independent pathways that include Wnt/Ca2+ and planar cell polarity [84]. Of note, the Wnt/β-catenin pathway has been extensively studied, due to its important role in cancer initiation and progression [79]. The presence of Wnt promotes formation of a Wnt–Fzd–LRP complex, recruitment of the cytoplasmic protein Disheveled (Dvl) to Fzd and the LRP phosphorylation-dependent recruitment of Axin to the membrane, thereby leading to release of β-catenin from membrane and accumulation in cytoplasm and nuclei. Nuclear β-catenin replaces TLE/Groucho co-repressors and recruits co-activators to activate expression of Wnt target genes. The most important genes regulated are those related to proliferation, such as Cyclin D1 and c-Myc [46,94], which are over-expressed in most β-catenin-dependent tumors. When β-catenin is absent in nucleus, the transcription factors T-cell factor/lymphoid enhancer factors (TCF/LEF) recruits co-repressors of the TLE/Groucho family and function as transcriptional repressors.

β-catenin is highly expressed in the nucleus of mesenchymal MDA-MB-231 cells. ERp29 over-expression in this type of cells led to translocation of nuclear β-catenin to membrane where it forms complex with E-cadherin [3] (Fig. 3). This causes a disruption of β-catenin/TCF/LEF complex and abolishes its transcription activity. Indeed, ERp29 significantly decreased the expression of cyclin D1/D2 [36], one of the downstream targets of activated Wnt/β-catenin signaling [94], indicating an inhibitory effect of ERp29 on this pathway. Meanwhile, expression of ERp29 in this cell type increased the nuclear expression of TCF3, a transcription factor regulating cancer cell differentiation while inhibiting self-renewal of cancer stem cells [102,106]. Hence, ERp29 may play dual functions in mesenchymal MDA-MB-231 breast cancer cells by: (1) suppressing activated Wnt/β-catenin signaling via β-catenin translocation; and (2) promoting cell differentiation via activating TCF3 (Fig. 3). Because β-catenin serves as a signaling hub for the Wnt pathway, it is particularly important to focus on β-catenin as the target of choice in Wnt-driven cancers. Though the mechanism by which ERp29 expression promotes the disassociation of β-catenin/TCF/LEF complex in MDA-MB-231 cells remains elusive, activating ERp29 expression may exert an inhibitory effect on the poorly differentiated, Wnt-driven tumors.

Fig. 3  ERp29 over-expression “turns-off” activated Wnt/β-catenin signaling. In mesenchymal MDA-MB-231 cells, high expression of nuclear β-catenin activates its downstream signaling involved in cell cycles and cancer stem cell …

http://www.ncbi.nlm.nih.gov/pmc/articles/PMC4329646/bin/gr3.gif

3. ERp29 regulates epithelial cell integrity

3.1. Cell adherens and tight junctions

Adherens junctions (AJs) and tight junctions (TJs) are composed of transmembrane proteins that adhere to similar proteins in the adjacent cell [69]. The transmembrane region of the TJs is composed mainly of claudins, tetraspan proteins with two extracellular loops [1]. AJs are mediated by Ca2+-dependent homophilic interactions of cadherins [71] which interact with cytoplasmic catenins that link the cadherin/catenin complex to the actin cytoskeleton [74].

The cytoplasmic domain of claudins in TJs interacts with occludin and several zona occludens proteins (ZO1-3) to form the plaque that associates with the cytoskeleton [99]. The AJs form and maintain intercellular adhesion, whereas the TJs serve as a diffusion barrier for solutes and define the boundary between apical and basolateral membrane domains [21]. The AJs and TJs are required for integrity of the epithelial phenotype, as well as for epithelial cells to function as a tissue [75].

The TJs are closely linked to the proper polarization of cells for the establishment of epithelial architecture[86]. During cancer development, epithelial cells lose the capability to form TJs and correct apico–basal polarity [59]. This subsequently causes the loss of contact inhibition of cell growth [91]. In addition, reduction of ZO-1 and occludin were found to be correlated with poorly defined differentiation, higher metastatic frequency and lower survival rates [49,64]. Hence, TJs proteins have a tumor suppressive function in cancer formation and progression.

3.2. Apical–basal cell polarity

The apical–basal polarity of epithelial cells in an epithelium is characterized by the presence of two specialized plasma membrane domains: namely, the apical surface and basolateral surface [30]. In general, the epithelial cell polarity is determined by three core complexes. These protein complexes include: (1) the partitioning-defective (PAR) complex; (2) the Crumbs (CRB) complex; and (3) the Scribble complex[2,30,45,51]. PAR complex is composed of two scaffold proteins (PAR6 and PAR3) and an atypical protein kinase C (aPKC) and is localized to the apical junction domain for the assembly of TJs [31,39]. The Crumbs complex is formed by the transmembrane protein Crumbs and the cytoplasmic scaffolding proteins such as the homologue of Drosophila Stardust (Pals1) and Pals-associated tight junction protein (Patj) and localizes to the apical [38]. The Scribble complex is comprised of three proteins, Scribble, Disc large (Dlg) and Lethal giant larvae (Lgl) and is localized in the basolateral domain of epithelial cells [100].

Fig. 4  ERp29 regulates epithelial cell morphogenesis. Over-expression of ERp29 in breast cancer cells induces the transition from a mesenchymal-like to epithelial-like phenotype and the restoration of tight junctions and cell polarity. Up-regulation and membrane …

http://www.ncbi.nlm.nih.gov/pmc/articles/PMC4329646/bin/gr4.gif

The current data from breast cancer cells supports the idea that ERp29 can function as a tumor suppressive protein, in terms of suppression of cell growth and primary tumor formation and inhibition of signaling pathways that facilitate EMT. Nevertheless, the significant role of ERp29 in cell survival against drugs, induction of cell differentiation and potential promotion of MET-related metastasis may lead us to re-assess its function in cancer progression, particularly in distant metastasis. Hence, it is important to explore in detail the ERp29’s role in cancer as a “friend or foe” and to elucidate its clinical significance in breast cancer and other epithelial cancers. Targeting ERp29 and/or its downstream molecules might be an alternative molecular therapeutic approach for chemo/radio-resistant metastatic cancer treatment

7.3.5 Putting together structures of epidermal growth factor receptors

Bessman NJ, Freed DM, Lemmon MA
Curr Opin Struct Biol. 2014 Dec; 29:95-101
http://dx.doi.org:/10.1016/j.sbi.2014.10.002

Highlights

  • Several studies suggest flexible linkage between extracellular and intracellular regions. • Others imply more rigid connections, required for allosteric regulation of dimers. • Interactions with membrane lipids play important roles in EGFR regulation. • Cellular studies suggest half-of-the-sites negative cooperativity for human EGFR.

Numerous crystal structures have been reported for the isolated extracellular region and tyrosine kinase domain of the epidermal growth factor receptor (EGFR) and its relatives, in different states of activation and bound to a variety of inhibitors used in cancer therapy. The next challenge is to put these structures together accurately in functional models of the intact receptor in its membrane environment. The intact EGFR has been studied using electron microscopy, chemical biology methods, biochemically, and computationally. The distinct approaches yield different impressions about the structural modes of communication between extracellular and intracellular regions. They highlight possible differences between ligands, and also underline the need to understand how the receptor interacts with the membrane itself.

http://ars.els-cdn.com/content/image/1-s2.0-S0959440X14001304-gr1.sml

http://ars.els-cdn.com/content/image/1-s2.0-S0959440X14001304-gr2.sml

Growth factor receptor tyrosine kinases (RTKs) such as the epidermal growth factor receptor (EGFR) have been the subjects of intense study for many years [1,2]. There are 58 RTKs in the deduced human
proteome, and all play key roles in regulating cellular processes such as proliferation, differentiation, cell survival and metabolism, cell migration, and cell cycle control [3].  Importantly, aberrant activation
of RTK signaling by mutation, gene amplification, gene translocation or other mechanisms has been causally linked to cancers, diabetes, inflammation, and other diseases. These observations have prompted
the development of many targeted therapies that inhibit RTKs such as EGFR [4], Kit, VEGFR, or their ligands — typically employing therapeutic antibodies [5] or small molecule tyrosine kinase inhibitors [6].
Following the initial discoveries for EGFR [7] and the platelet-derived growth factor receptor (PDGFR) [8] that ligand-stabilized dimers are essential for RTK signaling, structural studies over the past decade
or so have guided development of quite sophisticated mechanistic views[1]. Each RTK has a ligand-binding extracellular region (ECR) that is linked by a single transmembrane a-helix to an intracellular
tyrosine kinase domain (TKD). Structures of the isolated ECRs and TKDs from several RTKs point to surprising mechanistic diversity across the larger family [1]. Unliganded RTKs exist as an equilibrium
mixture of inactive monomers, inactive dimers and active dimers (Figure 1), except for the extreme case of the insulin receptor (IR), which is covalently dimerized [9]. Extracellular ligand can bind to monomers,
to inactive dimers, or to active dimers — in each case pushing the equilibria shown in Figure 1 towards the central ligand-bound active dimer. Thus, ligand binding can drive receptor dimerization (Figure 1,
upper), or can promote inactive-to-active conformational transitions in dimers (Figure 1, lower). Regardless of pathway, the intracellular TKD of the ligand-stabilized dimer becomes activated either through
trans-autophosphorylation or through induced allosteric changes [1,10]. Roles for other parts of the receptor in RTK activation, including the juxtamembrane (JM) and transmembrane (TM) segments, have
also become clearer. The key current challenge for the field is to assemble data from many studies of isolated RTK parts into coherent views of how the intact receptors are regulated in their native membranes.
We will focus here on recent efforts to do this for the EGFR (or ErbB receptor) family. The missing links in intact RTKs: flexible or rigid? A central goal in extrapolating to the intact RTKs from studies of
isolated soluble domains is to understand how the individual parts of the receptor communicate with one another. The methods that have been used to produce and study the isolated domains inevitably
yield the impression that inter-domain linkers are flexible and disordered. For example, extracellular juxtamembrane regions have typically only been observed as C-terminal extensions of  the soluble ECR.
Similarly, intracellular juxtamembrane regions have been encountered predominantly as N-terminal extensions of TKD constructs, or as short peptides. In each of these contexts, the JM regions are incomplete,
and may appear disordered and flexible simply because key structural restraints have been removed. Nonetheless, this possible artifact has strongly influenced thinking about linkages between the extracellular
and intracellular regions [11], and in turn about mechanisms of RTK signaling. Highly flexible linkages between extracellular and intracellular regions of RTKs are fully consistent with simpler ligand-induced
dimerization models for transmembrane signaling by RTKs. It is more difficult, however, to understand how subtle allosteric communication across the membrane could be achieved if the linkages are truly
flexible. For example, since flexible linkage implies structural independence of the extracellular and intracellular regions, it is difficult to envision how a transition from inactive to active dimer in Figure 1
could be controlled precisely by ligand without more rigid (or restricted) connections.

Recent experimental studies with intact — or nearly intact — EGFR differ in the impressions they provide about how flexibly or rigidly the extracellular and intracellular regions are linked. Springer’s laboratory used cysteine crosslinking and mutagenesis approaches to investigate this issue for EGFR expressed in Ba/F3 cells [12]. They were unable to identify any specific JM or TM region interfaces
that were required for EGFR signaling, leading them to argue that the linkage across the membrane is too flexible to transmit a specific orientation between the extracellular and intracellular regions.
Consistent with this, negative-stain electron microscopy studies of (nearly) full-length EGFR in dodecylmaltoside micelles showed that a given extracellular dimer can be linked to several different
arrangements of the intracellular kinase domain [13,14]. Similarly, dimers driven by inhibitor binding to the intracellular TKD could couple to multiple different ECR conformations [13]. Biochemical
studies are also consistent with such structural independence of the extracellular and intracellular  regions [15,16]. Contrasting with these observations, however, Schepartz and colleagues have
reported that different precise conformations within the EGFR intracellular region can be induced by distinct activating ligands [17]. They used a method called bipartite tetracysteine display that
reports on formation of a chemically detectable tetracysteine motif when two cysteine pairs come together at  the dimer  interface. EGF activation of the receptor led to formation of a  tetracysteine
motif that requires the intracellular JM helix  [18] shown in Figure 2a to form antiparallel coiled-coil dimers  (Figure 2b/c) as proposed by Kuriyan and colleagues [19,20]. Surprisingly, transforming
growth factor-a (TGFa),which also activates EGFR, did not bring these two cysteine pairs together in the same way — arguing that TGFa does not induce formation of the same intracellular antiparallel
coiled-coil. Instead, activation of EGFR with TGFa (but not EGF) stabilized an alternative tetracysteine motif, consistent with a different intracellular JM structure. Evidence for ‘inside-out’ signaling
in EGFR has also been reported, where alterations in the intracellular JM region directly influence allosteric EGF binding to the ECR of the intact receptor analyzed in CHO cells [21–23]. The contradictory
views of flexibility versus rigidity  in linkages between the domains leave the path to understanding the intact receptor unclear, although it seems  reasonable doubt that  the inactive dimers known to
form in the absence of ligand [24–26] could be regulated by extracellular ligand if all linkages are always highly flexible.
Does the membrane hold the key?
All of the studies that support direct conformational communication between the extracellular and intracellular regions of EGFR were performed in cells [17,21,22]. By contrast, most of those that
explicitly suggest otherwise were performed in detergent micelles [13,14,15] — where the potentially important influences of specific membrane lipids (or membrane geometry) are absent. Studies of intact  EGFR in liposomes with defined lipid compositions [27] have shown that the ganglioside GM3 inhibits ligand-independent activation (and dimerization) of the receptor, apparently through interactions with a  site in its extracellular JM region. McLaughlin and colleagues [28,29] also proposed a model in which interaction of the intracellular JM region (and TKD) with anionic phospholipids in the inner leaflet of  the plasma membrane (notably PtdIns(4,5)P2) exerts an inhibitory effect that must be overcome in order for EGFR to signal. Association of the JM and TM regions with specific membrane lipids is likely to  define specific structures in the linkages between the EGFR extracellular and intracellular regions that are more well-defined (and potentially rigid) than is typically appreciated. Recent studies have begun to  shed some structural light on how membrane interactions with the intracellular JM region of EGFR might influence the signaling mechanism. Endres et al. [20] found that simply tethering the complete  intracellular region of EGFR to the inner leaflet of the plasma membrane maintains the TKD in a largely monomeric state and inhibits its kinase activity. Parallel computational studies [30] suggest that this  results from the previously proposed [29] inhibitory interaction of the JM and TKD regions of EGFR with the negatively charged membrane surface. The data of Endres et al. [20] further indicated that TM-mediated dimerization reverses this inhibitory effect. Moreover, NMR studies of a 60-residue peptide containing the TM and part of  the JM region solubilized in lipid bicelles led them to conclude that specific  TM dimerization through an N terminal GxxxG motif stabilizes formation of an antiparallel coiled-coil between the two JM fragments in the dimer — the same JM coiled-coil shown in Figure 2b/c that was  investigated in the bipartite tetracysteine display studies of  intact EGF-bound EGFR described above [17,19]. Independent solid-state NMR studies of a similar TM-JM peptide from the EGFR relative
ErbB2 in vesicles containing acidic phospholipids [31] further suggested that an activating mutation in the TM domain leads to release of  the JM region from the anionic membrane surface. Collectively,
these data suggest that ligand-induced dimerization of the receptor (or reorientation of receptors within a dimer) may engage the TM domain in a specific dimer that promotes both the formation of activating
interactions in the JM region and the disruption of inhibitory interactions between the JM region (and possibly TKD) and the membrane surface.

Negative cooperativity 
A key characteristic of ligand binding at the cell surface to EGFR [36], IR [37], and other receptors [38] is negative cooperativity — which is lost when soluble forms of the ECR from human EGFR [39]
or IR [40] are studied in isolation. Several studies have shown that intracellular and/or transmembrane regions are required for this negative cooperativity to be manifest [21,22,40,41], implying that
these parts of the receptor contribute to breaking the symmetry of the dimer — as required for the two sites to have distinct binding properties [42]. Such propagation of dimer asymmetry across the
membrane would surely require defined structures in the regions that connect extracellular and intracellular regions, and is difficult to reconcile with highly flexible JM linkers.
In brief, binding of one ligand stabilizes a singly-liganded asymmetric dimer in which the unoccupied ligand-binding site is compromised [43]. The binding affinity of the second ligand is thus reduced,
constituting a half-of-the-sites mode of negative cooperativity [44]. Leahy’s group has provided important evidence consistent with a similar mechanism in the cases of human EGFR and ErbB4 [16].
By comparing human ErbB receptor ECR dimer crystal structures with different bound ligands, Leahy and colleagues went on to identify two types of dimer interface [16], a ‘flush’ interface that resembles
the asymmetric (singly-liganded) dimer seen for the Drosophila EGFR [43] and a ‘staggered’ interface seen in the ECRs from EGFR (with bound EGF [12]) and ErbB4 (with bound neuregulin1b[16]).
These observations suggest that the ‘flush’ interface drives the most  stable dimers, which are singly liganded (Figure 2b). Binding of the second ligand is weaker, and also forces the dimer interface
into the less stable ‘staggered’ conformation (Figure 2c). Taken together, these findings suggest both a structural basis for negative cooperativity and a possible structural distinction between singly-liganded
and doubly-liganded ErbB receptor dimers.

A model for EGFR activation
The model shown in Figure 2 summarizes key proposed steps in the activation of human EGFR. In the absence of ligand, the ECR exists in a tethered conformation with the domain II ‘dimerization
arm’ engaged in an intramolecular interaction with domain IV that occludes the dimer interface [49]. The TKDs and the N-terminal portions of each intracellular JM region are thought to be engaged
in autoinhibitory interactions with the membrane surface [20,28,29,30].

Figure 2. More detailed view of EGF-induced activation of EGFR, as described in the text.
In the absence of ligand (a), the ECR adopts a tethered conformation, with an autoinhibitory tether interaction between domains II and IV. The TKD and JM regions lie against the membrane, making what
are believed to be additional autoinhibitory interactions. Domains I and III of the ECR are colored red, and domains II and IV are green. The JM helix is shown as a short cylinder and labeled in magenta.
The N-lobes and C-lobes of the kinase are also labeled, and both helix aC (blue) and the short helix in the activation loop (green) that interacts with aC to inhibit the TKD [50] are shown. The C-tail is
also depicted as a curve bearing 5 tyrosines. As described in the text, binding of a single ligand (b) induces formation of a singly-liganded dimer with a ‘flush’ (presumed asymmetric) ECR dimer interface.
The JM region forms an anti-parallel helix, as labeled in magenta, and the TKDs form an asymmetric dimer in which the activator (grey) allosterically activates the receiver (shown with an amber N-lobe).
It is not clear how the extracellular and intracellular asymmetry is structurally related, if at all. Finally, a second ligand binds to yield a more symmetric dimer with the ‘staggered’ ECR interface (c) described
in the text.

Conclusions Our mechanistic understanding of EGFR and its relatives has advanced dramatically in recent years, and the past year or two has seen substantial progress in putting the results of studies
with isolated domains together into initial views of how the intact receptor works. New insights into the origin of allosteric regulation of EGFR have been gained through a combination of innovative
structural, biochemical, cellular, and computational studies. A self-consistent picture is beginning to emerge. Two key issues remain unclear, however, and represent the current frontiers in studies of EGFR.
The first — for which we describe progress in this review — centers on the influence of specific interactions of the receptor with membrane lipids, which seem likely to define the structural ‘connections’
between extracellular and intracellular regions of the receptor. The second centers on the role of the carboxy-terminal 230 amino acids, which is believed to play a regulatory role for which little detail has
so far been defined [55].
(10PRE4140108).
DMF
is
supported
by

7.3.6 Complex Relationship between Ligand Binding and Dimerization in the Epidermal Growth Factor Receptor

Bessman NJ1, Bagchi A2, Ferguson KM2, Lemmon MA3.
Cell Rep. 2014 Nov 20; 9(4):1306-17.
http://dx.doi.org/10.1016/j.celrep.2014.10.010

Highlights

  • Preformed extracellular dimers of human EGFR are structurally heterogeneous • EGFR dimerization does not stabilize ligand binding
    • Extracellular mutations found in glioblastoma do not stabilize EGFR dimerization • Glioblastoma mutations in EGFR increase ligand-binding affinity

The epidermal growth factor receptor (EGFR) plays pivotal roles in development and is mutated or overexpressed in several cancers. Despite recent advances, the complex allosteric regulation of EGFR remains incompletely understood. Through efforts to understand why the negative cooperativity observed for intact EGFR is lost in studies of its isolated extracellular region (ECR), we uncovered unexpected relationships between ligand binding and receptor dimerization. The two processes appear to compete. Surprisingly, dimerization does not enhance ligand binding (although ligand binding promotes dimerization). We further show that simply forcing EGFR ECRs into preformed dimers without ligand yields ill-defined, heterogeneous structures. Finally, we demonstrate that extracellular EGFR-activating mutations in glioblastoma enhance ligand-binding affinity without directly promoting EGFR dimerization, suggesting that these oncogenic mutations alter the allosteric linkage between dimerization and ligand binding. Our findings have important implications for understanding how EGFR and its relatives are activated by specific ligands and pathological mutations.

http://www.cell.com/cms/attachment/2020816777/2040986303/fx1.jpg

X-ray crystal structures from 2002 and 2003 (Burgess et al., 2003) yielded the scheme for ligand-induced epidermal growth factor receptor (EGFR) dimerization shown in Figure 1. Binding of a single ligand to domains I and III within the same extracellular region (ECR) stabilizes an “extended” conformation and exposes a dimerization interface in domain II, promoting self-association with a KD in the micromolar range (Burgess et al., 2003, Dawson et al., 2005, Dawson et al., 2007). Although this model satisfyingly explains ligand-induced EGFR dimerization, it fails to capture the complex ligand-binding characteristics seen for cell-surface EGFR, with concave-up Scatchard plots indicating either negative cooperativity (De Meyts, 2008, Macdonald and Pike, 2008) or distinct affinity classes of EGF-binding site with high-affinity sites responsible for EGFR signaling (Defize et al., 1989). This cooperativity or heterogeneity is lost when the ECR from EGFR is studied in isolation, as also described for the insulin receptor (De Meyts, 2008).

Figure 1

Structural View of Ligand-Induced Dimerization of the hEGFR ECR

(A) Surface representation of tethered, unliganded, sEGFR from Protein Data Bank entry 1NQL (Ferguson et al., 2003). Ligand-binding domains I and III are green and cysteine-rich domains II and IV are cyan. The intramolecular domain II/IV tether is circled in red.

(B) Hypothetical model for an extended EGF-bound sEGFR monomer based on SAXS studies of an EGF-bound dimerization-defective sEGFR variant (Dawson et al., 2007) from PDB entry 3NJP (Lu et al., 2012). EGF is blue, and the red boundary represents the primary dimerization interface.

(C) 2:2 (EGF/sEGFR) dimer, from PDB entry 3NJP (Lu et al., 2012), colored as in (B). Dimerization arm contacts are circled in red.

http://www.cell.com/cms/attachment/2020816777/2040986313/gr1.sml

Here, we describe studies of an artificially dimerized ECR from hEGFR that yield useful insight into the heterogeneous nature of preformed ECR dimers and into the origins of negative cooperativity. Our data also argue that extracellular structures induced by ligand binding are not “optimized” for dimerization and conversely that dimerization does not optimize the ligand-binding sites. We also analyzed the effects of oncogenic mutations found in glioblastoma patients (Lee et al., 2006), revealing that they affect allosteric linkage between ligand binding and dimerization rather than simply promoting EGFR dimerization. These studies have important implications for understanding extracellular activating mutations found in EGFR/ErbB family receptors in glioblastoma and other cancers and also for understanding specificity of ligand-induced ErbB receptor heterodimerization

Predimerizing the EGFR ECR Has Modest Effects on EGF Binding

To access preformed dimers of the hEGFR ECR (sEGFR) experimentally, we C-terminally fused (to residue 621 of the mature protein) either a dimerizing Fc domain (creating sEGFR-Fc) or the dimeric leucine zipper from S. cerevisiae GCN4 (creating sEGFR-Zip). Size exclusion chromatography (SEC) and/or sedimentation equilibrium analytical ultracentrifugation (AUC) confirmed that the resulting purified sEGFR fusion proteins are dimeric (Figure S1). To measure KD values for ligand binding to sEGFR-Fc and sEGFR-Zip, we labeled EGF with Alexa-488 and monitored binding in fluorescence anisotropy (FA) assays. As shown in Figure 2A, EGF binds approximately 10-fold more tightly to the dimeric sEGFR-Fc or sEGFR-Zip proteins than to monomeric sEGFR (Table 1). The curves obtained for EGF binding to sEGFR-Fc and sEGFR-Zip showed no signs of negative cooperativity, with sEGFR-Zip actually requiring a Hill coefficient (nH) greater than 1 for a good fit (nH = 1 for both sEGFRWT and sEGFR-Fc). Thus, our initial studies argued that simply dimerizing human sEGFR fails to restore the negatively cooperative ligand binding seen for the intact receptor in cells.

One surprise from these data was that forced sEGFR dimerization has only a modest (≤10-fold) effect on EGF-binding affinity. Under the conditions of the FA experiments, isolated sEGFR (without zipper or Fc fusion) remains monomeric; the FA assay contains just 60 nM EGF, so the maximum concentration of EGF-bound sEGFR is also limited to 60 nM, which is over 20-fold lower than the KD for dimerization of the EGF/sEGFR complex (Dawson et al., 2005, Lemmon et al., 1997). This ≤10-fold difference in affinity for dimeric and monomeric sEGFR seems small in light of the strict dependence of sEGFR dimerization on ligand binding (Dawson et al., 2005,Lax et al., 1991, Lemmon et al., 1997). Unliganded sEGFR does not dimerize detectably even at millimolar concentrations, whereas liganded sEGFR dimerizes with KD ∼1 μM, suggesting that ligand enhances dimerization by at least 104– to 106-fold. Straightforward linkage of dimerization and binding equilibria should stabilize EGF binding to dimeric sEGFR similarly (by 5.5–8.0 kcal/mol). The modest difference in EGF-binding affinity for dimeric and monomeric sEGFR is also significantly smaller than the 40- to 100-fold difference typically reported between high-affinity and low-affinity EGF binding on the cell surface when data are fit to two affinity classes of binding site (Burgess et al., 2003, Magun et al., 1980).

Mutations that Prevent sEGFR Dimerization Do Not Significantly Reduce Ligand-Binding Affinity

The fact that predimerizing sEGFR only modestly increased ligand-binding affinity led us to question the extent to which domain II-mediated sEGFR dimerization is linked to ligand binding. It is typically assumed that the domain II conformation stabilized upon forming the sEGFR dimer in Figure 1C optimizes the domain I and III positions for EGF binding. To test this hypothesis, we introduced a well-characterized pair of domain II mutations into sEGFRs that block dimerization: one at the tip of the dimerization arm (Y251A) and one at its “docking site” on the adjacent molecule in a dimer (R285S). The resulting (Y251A/R285S) mutation abolishes sEGFR dimerization and EGFR signaling (Dawson et al., 2005, Ogiso et al., 2002). Importantly, we chose isothermal titration calorimetry (ITC) for these studies, where all interacting components are free in solution. Previous surface plasmon resonance (SPR) studies have indicated that dimerization-defective sEGFR variants bind immobilized EGF with reduced affinity (Dawson et al., 2005), and we were concerned that this reflects avidity artifacts, where dimeric sEGFR binds more avidly than monomeric sEGFR to sensor chip-immobilized EGF.

Surprisingly, our ITC studies showed that the Y251A/R285S mutation has no significant effect on ligand-binding affinity for sEGFR in solution (Table 1). These experiments employed sEGFR (with no Fc fusion) at 10 μM—ten times higher than KD for dimerization of ligand-saturated WT sEGFR (sEGFRWT) (KD ∼1 μM). Dimerization of sEGFRWT should therefore be complete under these conditions, whereas the Y251A/R285S-mutated variant (sEGFRY251A/R285S) does not dimerize at all (Dawson et al., 2005). The KD value for EGF binding to dimeric sEGFRWT was essentially the same (within 2-fold) as that for sEGFRY251A/R285S (Figures 2B and 2C; Table 1), arguing that the favorable Gibbs free energy (ΔG) of liganded sEGFR dimerization (−5.5 to −8 kcal/mol) does not contribute significantly (<0.4 kcal/mol) to enhanced ligand binding. …

Thermodynamics of EGF Binding to sEGFR-Fc

If there is no discernible positive linkage between sEGFR dimerization and EGF binding, why do sEGFR-Fc and sEGFR-Zip bind EGF ∼10-fold more strongly than wild-type sEGFR? To investigate this, we used ITC to compare EGF binding to sEGFR-Fc and sEGFR-Zip (Figures 3A and 3B ) with binding to isolated (nonfusion) sEGFRWT. As shown in Table 1, the positive (unfavorable) ΔH for EGF binding is further elevated in predimerized sEGFR compared with sEGFRWT, suggesting that enforced dimerization may actually impair ligand/receptor interactions such as hydrogen bonds and salt bridges. The increased ΔH is more than compensated for, however, by a favorable increase in TΔS. This favorable entropic effect may reflect an “ordering” imposed on unliganded sEGFR when it is predimerized, such that it exhibits fewer degrees of freedom compared with monomeric sEGFR. In particular, since EGF binding does induce sEGFR dimerization, it is clear that predimerization will reduce the entropic cost of bringing two sEGFR molecules into a dimer upon ligand binding, possibly underlying this effect.

Possible Heterogeneity of Binding Sites in sEGFR-Fc

Close inspection of EGF/sEGFR-Fc titrations such as that in Figure 3A suggested some heterogeneity of sites, as evidenced by the slope in the early part of the experiment. To investigate this possibility further, we repeated titrations over a range of temperatures. We reasoned that if there are two different types of EGF-binding sites in an sEGFR-Fc dimer, they might have different values for heat capacity change (ΔCp), with differences that might become more evident at higher (or lower) temperatures. Indeed, ΔCp values correlate with the nonpolar surface area buried upon binding (Livingstone et al., 1991), and we know that this differs for the two Spitz-binding sites in the asymmetric Drosophila EGFR dimer (Alvarado et al., 2010). As shown in Figure 3C, the heterogeneity was indeed clearer at higher temperatures for sEGFR-Fc—especially at 25°C and 30°C—suggesting the possible presence of distinct classes of binding sites in the sEGFR-Fc dimer. We were not able to fit the two KD values (or ΔH values) uniquely with any precision because the experiment has insufficient information for unique fitting to a model with four variables. Whereas binding to sEGFRWT could be fit confidently with a single-site binding model throughout the temperature range, enforced sEGFR dimerization (by Fc fusion) creates apparent heterogeneity in binding sites, which may reflect negative cooperativity of the sort seen with dEGFR. …

Ligand Binding Is Required for Well-Defined Dimerization of the EGFR ECR

To investigate the structural nature of the preformed sEGFR-Fc dimer, we used negative stain electron microscopy (EM). We hypothesized that enforced dimerization might cause the unliganded ECR to form the same type of loose domain II-mediated dimer seen in crystals of unliganded Drosophila sEGFR (Alvarado et al., 2009). When bound to ligand (Figure 4A), the Fc-fused ECR clearly formed the characteristic heart-shape dimer seen by crystallography and EM (Lu et al., 2010, Mi et al., 2011). Figure 4B presents a structural model of an Fc-fused liganded sEGFR dimer, and Figure 4C shows a calculated 12 Å resolution projection of this model. The class averages for sEGFR-Fc plus EGF (Figure 4A) closely resemble this model, yielding clear densities for all four receptor domains, arranged as expected for the EGF-induced domain II-mediated back-to-back extracellular dimer shown in Figure 1 (Garrett et al., 2002, Lu et al., 2010). In a subset of classes, the Fc domain also appeared well resolved, indicating that these particular arrangements of the Fc domain relative to the ECR represent highly populated states, with the Fc domains occupying similar positions to those of the kinase domain in detergent-solubilized intact receptors (Mi et al., 2011). …

Our results and those of Lu et al. (2012)) argue that preformed extracellular dimers of hEGFR do not contain a well-defined domain II-mediated interface. Rather, the ECRs in these dimers likely sample a broad range of positions (and possibly conformations). This conclusion argues against recent suggestions that stable unliganded extracellular dimers “disfavor activation in preformed dimers by assuming conformations inconsistent with” productive dimerization of the rest of the receptor (Arkhipov et al., 2013). The ligand-free inactive dimeric ECR species modeled by Arkhipov et al. (2013) in their computational studies of the intact receptor do not appear to be stable. The isolated ECR from EGFR has a very low propensity for self-association without ligand, with KD in the millimolar range (or higher). Moreover, sEGFR does not form a defined structure even when forced to dimerize by Fc fusion. It is therefore difficult to envision how it might assume any particular autoinhibitory dimeric conformation in preformed dimers. …

Extracellular Oncogenic Mutations Observed in Glioblastoma May Alter Linkage between Ligand Binding and sEGFR Dimerization

Missense mutations in the hEGFR ECR were discovered in several human glioblastoma multiforme samples or cell lines and occur in 10%–15% of glioblastoma cases (Brennan et al., 2013, Lee et al., 2006). Several elevate basal receptor phosphorylation and cause EGFR to transform NIH 3T3 cells in the absence of EGF (Lee et al., 2006). Thus, these are constitutively activating oncogenic mutations, although the mutated receptors can be activated further by ligand (Lee et al., 2006, Vivanco et al., 2012). Two of the most commonly mutated sites in glioblastoma, R84 and A265 (R108 and A289 in pro-EGFR), are in domains I and II of the ECR, respectively, and contribute directly in inactive sEGFR to intramolecular interactions between these domains that are thought to be autoinhibitory (Figure 5). Domains I and II become separated from one another in this region upon ligand binding to EGFR (Alvarado et al., 2009), as illustrated in the lower part of Figure 5. Interestingly, analogous mutations in the EGFR relative ErbB3 were also found in colon and gastric cancers (Jaiswal et al., 2013).

We hypothesized that domain I/II interface mutations might activate EGFR by disrupting autoinhibitory interactions between these two domains, possibly promoting a domain II conformation that drives dimerization even in the absence of ligand. In contrast, however, sedimentation equilibrium AUC showed that sEGFR variants harboring R84K, A265D, or A265V mutations all remained completely monomeric in the absence of ligand (Figure 6A) at a concentration of 10 μM, which is similar to that experienced at the cell surface (Lemmon et al., 1997). As with WT sEGFR, however, addition of ligand promoted dimerization of each mutated sEGFR variant, with KD values that were indistinguishable from those of WT. Thus, extracellular EGFR mutations seen in glioblastoma do not simply promote ligand-independent ECR dimerization, consistent with our finding that even dimerized sEGFR-Fc requires ligand binding in order to form the characteristic heart-shaped dimer. …

We suggest that domain I is normally restrained by domain I/II interactions so that its orientation with respect to the ligand is compromised. When the domain I/II interface is weakened with mutations, this effect is mitigated. If this results simply in increased ligand-binding affinity of the monomeric receptor, the biological consequence might be to sensitize cells to lower concentrations of EGF or TGF-α (or other agonists). However, cellular studies of EGFR with glioblastoma-derived mutations (Lee et al., 2006, Vivanco et al., 2012) clearly show ligand-independent activation, arguing that this is not the key mechanism. The domain I/II interface mutations may also reduce restraints on domain II so as to permit dimerization of a small proportion of intact receptor, driven by the documented interactions that promote self-association of the transmembrane, juxtamembrane, and intracellular regions of EGFR (Endres et al., 2013, Lemmon et al., 2014, Red Brewer et al., 2009).

Setting out to test the hypothesis that simply dimerizing the EGFR ECR is sufficient to recover the negative cooperativity lost when it is removed from the intact receptor, we were led to revisit several central assumptions about this receptor. Our findings suggest three main conclusions. First, we find that enforcing dimerization of the hEGFR ECR does not drive formation of a well-defined domain II-mediated dimer that resembles ligand-bound ECRs or the unliganded ECR from Drosophila EGFR. Our EM and SAXS data show that ligand binding is necessary for formation of well-defined heart-shaped domain II-mediated dimers. This result argues that the unliganded extracellular dimers modeled by Arkhipov et al. (2013)) are not stable and that it is improbable that stable conformations of preformed extracellular dimers disfavor receptor activation by assuming conformations that counter activating dimerization of the rest of the receptor. Recent work from the Springer laboratory employing kinase inhibitors to drive dimerization of hEGFR (Lu et al., 2012) also showed that EGF binding is required to form heart-shaped ECR dimers. These findings leave open the question of the nature of the ECR in preformed EGFR dimers but certainly argue that it is unlikely to resemble the crystallographic dimer seen for unligandedDrosophila EGFR (Alvarado et al., 2009) or that suggested by computational studies (Arkhipov et al., 2013).

This result argues that ligand binding is required to permit dimerization but that domain II-mediated dimerization may compromise, rather than enhance, ligand binding. Assuming flexibility in domain II, we suggest that this domain serves to link dimerization and ligand binding allosterically. Optimal ligand binding may stabilize one conformation of domain II in the scheme shown in Figure 1 that is then distorted upon dimerization of the ECR, in turn reducing the strength of interactions with the ligand. Such a mechanism would give the appearance of a lack of positive linkage between ligand binding and ECR dimerization, and a good test of this model would be to determine the high-resolution structure of a liganded sEGFR monomer (which we expect to differ from a half dimer). This model also suggests a mechanism for selective heterodimerization over homodimerization of certain ErbB receptors. If a ligand-bound EGFR monomer has a domain II conformation that heterodimerizes with ErbB2 in preference to forming EGFR homodimers, this could explain several important observations. It could explain reports that ErbB2 is a preferred heterodimerization partner of EGFR (Graus-Porta et al., 1997) and might also explain why EGF binds more tightly to EGFR in cells where it can form heterodimers with ErbB2 than in cells lacking ErbB2, where only EGFR homodimers can form (Li et al., 2012).

7.3.7 IGFBP-2/PTEN: A critical interaction for tumours and for general physiology?

IGFBP-2
The insulin-like growth factor family of proteins, together with insulin, form an evolutionarily conserved system that helps to coordinate the metabolic status and activity of organisms with their nutritional environment. When food is abundant, the IGF/insulin signalling pathway is switched on and cell proliferation and other activities are enhanced; while when food is limited, such activities are suppressed to conserve energy and resources [1,2]. The IGF axis consists of two ligands IGF-I and -II, a series of heterotetrameric tyrosine kinase receptors and six high affinity binding proteins IGFBP-1 to-6. These IGFBPs not only regulate the reservoir, availability and functions of IGFs but also have direct actions upon cell behaviour that are independent of IGF-binding [3]. The six IGFBPs are conserved in all placental mammals having evolved from serial duplication of genes that were present throughout vertebrate evolution [4]. Each of the six IGFBPs has evolved unique functions that presumably have conferred some evolutionary advantage and hence have been conserved across mammalian evolution. After IGFBP-3, IGFBP-2 is the second most abundant binding protein in the circulation throughout adult life in humans. While circulating IGFBP-3 levels peak during puberty and decrease thereafter, IGFBP-2 levels are highest in infancy and old age. Together with the other five IGFBPs, IGFBP-2 regulates IGF availability and actions and has pleiotropic effects on normal and neoplastic tissues [3]. One of the clear distinctive structural features of IGFBP-2 is that it contains an Arg-Gly-Asp (RGD) sequence that enables functional interactions with integrin receptors [4]. This structural element is only present in one of the other IGFBPs, IGFBP-1. Although the RGD sequence was only acquired in IGFBP-1 during mammalian evolution it was present within IGFBP-2 from early vertebrate evolution indicating that it has been a long retained functional characteristic of IGFBP-2 [4]. The integrin receptors are critical for the anchorage of cells to the extracellular matrix (ECM) within tissues and hence for maintaining tissue architecture [5,6]. In solid tissue an important safeguard is imposed by linking normal cell functions and proliferation to appropriate cues from the ECM that are mediated by signals from attachment receptors such as the integrin receptors. Anchoragedependent growth is a common feature of normal cells and loss of attachment results in a form of apoptosis called anoikis. The integrin receptors interact with growth factor receptors in an ancillary and permissive manner to ensure that the signals for growth and survival occur in the appropriate setting and not inappropriately in detached cells. It has also become clear that integrin receptors serve many other roles in regulating cell functions and integrating cues from the surrounding ECM [5,6]. Over the last few decades, as the role of IGFBPs as extracellular modulators of IGF-availability and actions has emerged, there has also been a gradual characterization of the intracellular counter-regulatory components that modulate the signals initiated by IGF-receptor activation. There has been considerable progress in charting the signalling cascades initiated from these receptors but it is evident that the reason needs to be mechanisms for inactivating the pathways in intervening periods in preparation for subsequent activation. Throughout the canonical kinase cascades, activated by receptor ligation, at each node there is a corresponding phosphatase that returns the pathway to the inactive state and modulates the signal. The extracellular regulators of these phosphatases have however received much less attention than the activating kinases. That the extracellular counter-regulators may act in synchrony and be linked to the intracellular counter-regulators has only recently started to be revealed. Transgenic over-expression of IGFBP-2 at supra-physiological levels in mice results in reduced somatic growth [7] and this growth deficit is more pronounced when these mice were crossed with mice with raised growth hormone/IGF-I [8] implying that the growth inhibitory effect was due to sequestration of IGF-I. As with most of the IGFBP-family [3], there are also however multiple lines of evidence that IGFBP-2 has cellular actions that are independent of its ability to bind IGFs. There is evidence that IGFBP-2 initiates intrinsic cellular signalling through specific binding of its RGD-motif to integrin receptors, particularly the α5β1 integrin.In addition IGFBP-2 appears to modulate IGF and epidermal growth factor signalling through interactions with α5β3 integrins [9]. A heparin binding domain also exists in IGFBP-2 and it has been shown to bind to glycosaminoglycans [10], heparin [11], and other proteoglycans such as the receptor protein tyrosine phosphatase-β (RPTPβ) [12,13]. In addition,IGFBP-2has been reported to be localized on the cell surface, in the cytoplasm and on the nuclear membrane[14]. Several groups have now reported nuclear localization of IGFBP-2 [15–17]. A functional nuclear localization sequence in the central domain of IGFBP-2 has been reported that appears to interact with importin-α [18]. In the nucleus IGFBP-2 has been reported to regulate the expression of vascular endothelial growth factor [19].
IGFBP-2 and metabolic regulation
Epidemiological studies of human populations have indicated that IGFBP-2 levels are reduced in obesity, metabolic syndrome and type 2 diabetes and are inversely correlated with insulin sensitivity [20]. That these associations were due to a metabolic role for IGFBP-2, rather thanitjustbeingamarkerofdisturbance,hasbeenconfirmedinanumber of animal models. Using a transgenic IGFBP-2 over-expressing mouse model, Wheatcroft and coworkers found that IGFBP-2 was able to protect mice from high-fat/high-energy induced obesity and insulin resistance, and also protected the mice from the age-related development of glucose intolerance and hypertension [21]. Over-expression of IGFBP-2 induced by Leptin in wild type or obese mice similarly resulted in reduced plasma glucose and insulin levels [22]. All these data indicate a metabolic role for IGFBP-2 in glucose homeostasis.
IGFBP-2 and cancer
As indicated above, the early reports had implied that IGFBP-2 was generally a negative regulator of IGF-activity; the systemic growth restriction observed in transgenic mice over-expressing IGFBP-2 was followed by observations that chemically induced colorectal cancers were inhibited in this model [23]. Despite this there has been an accumulation of evidence indicating that IGFBP-2 is positively associated with the malignant progression of a wide range of cancers, as has been reviewed previously [24]. Raised serum levels of IGFBP-2 have been reported and positive associations between tumor IGFBP-2 expression and malignancy or metastasis have been observed for a variety of cancers, including glioma [25], breast [26], prostate [27], lung [28], colon [29] and lymphoid tumor [30]. Subsequent work has generally been consistent with this association between IGFBP-2 and cancer progression. In view of the majority of evidence, indicating that IGFBP-2 interacting with IGFs generally inhibited cell growth, it was suggested thatIGF-independentactionswereprobablyresponsibleforpositiveassociations between IGFBP-2 and tumourgrowth and progression [24]. The explanation for the increased expression of IGFBP-2 that has beenreportedformanydifferentcancersappearstocomefromthefactorsthat have been shown to regulate IGFBP-2 expression.The tumor suppressor gene p53, which is the most mutated gene in many human cancers, has been reported to transcriptionally regulate IGFBP-2 [31].

There also appears to again be reciprocal feedback as p53 mRNA in the breast cancer cell line Hs578T increased significantly after treatment with human recombinant IGFBP-2, suggesting a close interaction between IGFBP-2 and p53 [14]. A number of hormonal regulators of IGFBP-2 expression have been described including hCG, FSH, TGF-β, IL1, estradiol, glucocorticoids, EGF, IGF-I, IGF-II and insulin [24]. The stimulation of IGFBP-2 expression by EGF, IGF-I, IGF-II and insulin has been shown to be via the PI3K/AKT/mTOR pathway in breast cancer cells [32] and in adipocytes [33]. This is one of the most well characterisedsignallingpathwaysactivatedbyinsulinandIGFs.Inaddition the critical counter-regulatory phosphatase that deactivates this pathway the phosphatase and tensin homologue PTEN has been shown to downregulate the expression of IGFBP-2 [34]. This suggests another autoregulatory loop in which activation of the PI3K/AKT/mTOR pathway by IGFs induces the expression of IGFBP-2 that then sequesters the IGFs and modulates the signal. As activating mutations in the PI3K pathway or loss of PTEN are very common across a variety of human cancers, this plus the effect of p53, probably accounts for the common dysregulation of IGFBP-2 observed across many cancers. Using prostate cancer cell lines it has also been shown that local IGFBP-2 expression is metabolically regulated; IGFBP-2 expression was increased in hyperglycemic conditions through acetylation of histones H3 and H4 associated with the IGFBP-2 promoter, furthermore this up-regulation of IGFBP-2 mediated hyperglycemia-induced chemo-resistance [35].

PI3K
The signaling kinase PI3K plays a fundamental role that has been maintained throughout most of evolution. The ability to control growth and development according to the availability of nutrients provides a survival advantage and therefore has been selectively retained throughout evolution. Evidence has accumulated to indicate that the PI3K pathway provides this control in all species from yeast to mammals.Various forms of the PI3K enzyme exist that are classified into three groups (classes I, II, and III). Only one of these forms is present in yeast and is equivalent to mammalian class III PI3K: this acts as a nutrient sensor and is directly activated by the availability of amino acids and then itself activates mTOR/S6K1 to regulate cell growth and development [36]. In mammals class 1API3K has evolved: this form is not directly activated by nutrients but consists of heterodimers comprising a catalytic p110 subunit and a regulatory p85 subunit that enables the enzyme to be controlled by receptor tyrosine kinases, classically the insulin and insulin-like growth factor receptors (IR and IGF-IR) [37]. This enables the regulation of PI3K by social nutritionally dependent signals rather than by nutrients directly. It is not by chance that the insulin/IGF/PI3K pathway plays a fundamental role in regulating both metabolism and growth as it clearly is an advantage to synchronize the set processes and this synchronized control has been maintained throughout evolution.

Phosphatase and tensin homolog (PTEN)
Of all the intracellular counter-regulators of the IGF-pathway the one that has received the most attention in relation to cancer is PTEN. PTEN is a lipid tyrosine phosphatase that negatively regulates the Akt/ PKB signaling pathway by specifically dephosphorylating phosphatidylinositol (3,4,5)-trisphosphate and thereby reduces AKT activation to reduce signals for cell metabolism, proliferation and survival [37]. PTEN is the second most often mutated tumor suppressor in human cancers, after p53[38]. Aberrant PTEN activity occurs due to mutation, homozygous deletion, loss of heterozygosity, or epigenetic silencing. Lost or reduced activity of PTEN has been observed in a great variety of cancers, including breast [39], prostate [40,41], colorectal [42], lung[43], glioblastoma [44], endometrial [45], etc. It has been demonstrated that deregulation of PTEN is involved in tumorigenesis, tumor progression and also the predisposition of many cancers [46]. AsPI3K/Akt signaling is critical for the metabolic effects of insulin. It is clear that PTEN will also play a role in modulating the metabolic actions of insulin. Consistent with this mice genetically modified to have haploinsufficiency of PTEN were observed to be hypersensitive to insulin [47]. Similarly humans with haplo-insufficiency due to mutations in PTEN were found to have enhanced insulin sensitivity [48]. Recently an increase in insulin sensitivity due to suppression of PTEN has been described in grizzly bears in preparation for hibernation, indicating that this is a mechanism for physiological adaptation [49]. Although the genetic defects resulting in PTEN loss in cancers and the intrinsic mechanisms for regulation of PTEN have been well characterised; there have been relatively few reports of external cell regulators. Of interest one of the few extrinsic regulators that has been described is IGF-II [50]. IGF-II is the most abundant growth factor present in most human tissues and activates the PI3K/AKT/mTOR pathway. Just as the induction of IGFBP-2 by activation of the PI3K pathway suggests an autoregulatory feedback loop extrinsic to the cell;the induction of PTEN by IGF-II via PI3K suggests an additional feedback loop that is intrinsic within the cell (Fig. 1). Activation of the pathway by IGF-II induces expression of PTEN that then attenuates the signal; conversely when the pathway is not activated then PTEN expression is reduced making the cell more responsive for when an activation signal is next received.One of the mechanisms that has emerged,to explain this feedback loop, indicates that the signaling output of the PI3K/PTEN pathway is balanced by asynchronous regulation of the activity of both PI3K and PTEN. The p85α regulatory subunit of PI3K that binds to and represses the activity of the p110 catalytic subunit also binds directly to PTEN at a regulatory site within PTEN where serine/threonine phosphorylation occurs to inactivatePTEN.The p85α subunit binds to unphosphorylated PTEN at this site and enhances its lipid phosphatase activity 3-fold [51]. The nature of this feedback loop has been further extended by reports that PTEN can suppress the expression of IGF-II [52,53]. As IGF-II induces PTEN, the ability of PTEN to subsequently reduce IGF-II expression may enable the cell to protect itself from over-stimulation. In contrast loss of PTEN may increase the expression of IGF-II resulting inactivation of the PI3K/AKT/mTOR pathway that is then unopposed.

PTEN/IGFBP-2 interactions
In view of the recognized importance of loss of PTEN for a variety of cancers there has been considerable interest in identifying biomarkers that could be used clinically to indicate loss of PTEN within tumors. An unbiased screen of human prostate cancer xenografts and human glioblastoma samples using microarray-based expression profiling found that the most significant gene was IGFBP-2 and it was confirmed in experimental models that IGFBP-2 was inversely regulated by PTEN [54]. This was consistent with all of the subsequent studies indicating that the expression of IGFBP-2 was regulated by the PI3K/AKT/mTOR pathway. An increase in tumor IGFBP-2 has also been associated with loss of PTEN in human breast cancer samples[55]. In the same year that a screen revealed IGFBP-2 as the best marker for loss of PTEN; the nature of the interaction between these two proteins was extended by the demonstration that at the cellular level IGFBP-2 can inversely regulate PTEN. With human breast cancer cells it was confirmed that IGF-II stimulated PTEN expression and that this was modulated by the binding of IGF-II to IGFBP-2, but when IGFBP-2 was not bound to IGF-II it was able to suppress PTEN via an interaction with cell surface integrin receptors (Fig. 1) [56]. Subsequent work with human prostate cancer cells indicated that the interaction of IGFBP-2 with integrin receptors could also result in PTEN inactivation via increasing its phosphorylation [57].

Fig.1. A proposed autoregulatory feedback loop of IGFBP-2/PTEN interaction. Binding of IGF-II to the IGF-IR activates the PI3K pathway. Induction of PI3K activates Akt and mTOR signaling and leads to cell proliferation and cell survival. The regulatory subunit of PI3K,p85, also binds and activates PTEN through dephosphorylation. This increased PTEN subsequently blocks IGFII production to avoid overstimulation. On the other hand, activated PI3K pathway induces IGFBP-2 expression, which when unbound to IGF-II, suppresses PTEN via an interaction with integrin receptors and/or the receptor protein tyrosine phosphatase β(RPTPβ). Thus the negative control of PTEN on PI3K signaling is counteracted. These feedback loops enable the extrinsic balance between IGF-II and IGFBP-2 to be tightly integrated to the intrinsic balance between PI3K and PTEN.

The ability of IGFBP-2 to regulate PTEN, originally observed in human cancer cell lines has subsequently been confirmed in a variety of normal cell types from different tissues. In IGFBP-2 knock-out mice a decrease in hematopoietic stem cell survival and cycling has been associated with an increase in PTEN and this appeared to be mediated by the heparin binding domain (HBD) within IGFBP-2 as the administration of a peptide analogue could restore the deficit [58]. Similarly a decrease in bone mass in the IGFBP-2 knock-out mice has been attributed to an increase in PTEN and again the use of a peptide analogue appeared to implicate the IGFBP-2HBD [59]. It was subsequently reported that the IGFBP-2HBD mediated an interaction with the RPTPβ resulting in dimerization and consequent inactivation of RPTPβ and that this reduction in phosphatase activity cooperated with IGF-I activation of the IGF-IR to enhance the phosphorylation and inactivation of PTEN [12]. Recently IGFBP-2 has been reported to also suppress PTEN in human skeletal muscle cells [60] and human visceral adipocytes [61] by interacting with integrin receptors. A similar association between IGFBP-2 and PTEN has been implicated as playing a role in murine skeletal muscle cell differentiation, although the functional regulation was not directly investigated in that study [62].

Summary
Evidence from a variety of different sources have indicated a close regulatory feedback loop between IGFBP-2 and PTEN. Work using a variety of different cell types from different tissues and different species has indicated that IGFBP-2 inversely regulates PTEN. There are reports that this is mediated via the IGFBP-2 RGD domain interacting with integrin receptors and by the IGFBP-2 HBD interacting with proteoglycans; the relative involvement of each of these domains and their functional interactions will require further work to elucidate. These studies however suggest a general mechanism that plays a role in a variety of normal physiological processes in addition to having important implications for the progression of many different cancers. The phosphatase PTEN has an important role in determining insulin sensitivity and the extent that IGFBP-2 exerts a metabolic role in regulating PTEN to determine insulin-sensitivity is yet to be examined. The extracellular balance between IGF-II and IGFBP-2 seems tightly linked with the intracellular balance between PI3K and PTEN (Fig. 1). When driving, in order to move forward there is a synchronous application of the accelerator and a removal of the brake. It appears that the cell also synchronizes activation of an essential regulatory pathway with the removal of the tightly linked inactivation pathway.

References
[1] B.C. Melnik, S.M. John, G. Schmitz, Over-stimulation of insulin/IGF-1 signaling by western diet may promote diseases of civilization: lessons learnt from Laron syndrome, Nutr. Metab. (Lond.) 8 (2011) 41. [2] J.M. Holly, C.M. Perks, Insulin-like growth factor physiology: what we have learned from human studies, Endocrinol. Metab. Clin. North. Am. 41 (2012) 249–263.
[3] J.Holly,C.Perks, The role ofinsulin-like growth factor binding proteins, Neuroendocrinology 83 (3–4) (2006) 154–160.
[4] D.O.Daza, etal.,Evolution of the insulin-like growth factor binding protein (IGFBP) family, Endocrinology 152 (6) (2011) 2278–2289.
[5] A.R. Ferreira, J.Felgueiras, M. Fardilha, Signaling pathways inanchoringjunctionsof epithelial cells: cell-to-cell and cell-to-extracellular matrix interactions, J. Recept. Signal Transduct. Res. (2014) 1–9.
[6] S.H. Kim, J. Turnbull, S. Guimond, Extracellular matrix and cell signalling: the dynamic cooperation of integrin, proteoglycan and growth factor receptor, J. Endocrinol. 209 (2) (2011) 139–151.
[7] A.Hoeflich,etal.,Overexpression ofinsulin-like growth factor-bindingprotein-2 in transgenic mice reduces postnatal body weight gain, Endocrinology 140 (12) (1999) 5488–5496.
[8] A. Hoeflich, et al., Growth inhibition in giant growth hormone transgenic mice by overexpression of insulin-like growth factor-binding protein-2, Endocrinology 142 (5) (2001) 1889–1898.
[9] G.K.Wang,etal., Aninteraction betweeninsulin-likegrowthfactor-bindingprotein 2 (IGFBP2) and integrin alpha5 is essential for IGFBP2-induced cell mobility, J. Biol. Chem. 281 (20) (2006) 14085–14091. [10] T.Arai,W.BusbyJr.,D.R.Clemmons,Bindingofinsulin-likegrowthfactor(IGF)IorII to IGF-binding protein-2 enables it to bind to heparin and extracellular matrix, Endocrinology 137 (11) (1996) 4571–4575. [11] J. Lund, et al., Heparin-binding mechanism of the IGF2/IGF-binding protein 2 complex, J. Mol. Endocrinol. 52 (3) (2014) 345–355.
[12] X. Shen, et al., Insulin-like growth factor (IGF) binding protein 2 functions coordinately with receptor protein tyrosinephosphatase βandtheIGF-Ireceptorto regulate IGF-I-stimulated signaling, Mol. Cell. Biol. 32 (20) (2012) 4116–4130.
[13] V.C.Russo, etal.,Insulin-like growth factor binding protein-2 bindingto extracellularmatrixplaysacriticalroleinneuroblastomacellproliferation,migration,andinvasion, Endocrinology 146 (10) (2005) 4445–4455.
[14] K.W. Frommer, etal., IGF-independent effects of IGFBP-2 on the human breast cancer cell line Hs578T, J. Mol. Endocrinol. 37 (1) (2006) 13–23.
[15] K. Miyako, et al., PAPA-1 Is a nuclear binding partner of IGFBP-2 and modulates its growth-promoting actions, Mol. Endocrinol. 23 (2) (2009) 169–175.
[16] X.Terrien,etal.,IntracellularcolocalizationandinteractionofIGF-bindingprotein-2 with the cyclin-dependent kinase inhibitor p21CIP1/WAF1 during growth inhibition, Biochem. J. 392 (Pt 3) (2005) 457–465.
[17] R.M. Villani, et al., Patched1 inhibits epidermal progenitor cell expansion and basal cell carcinoma formation by limiting Igfbp2 activity, Cancer Prev. Res. (Phila.) 3 (10) (2010) 1222–1234.
[18] W.J. Azar, et al., IGFBP-2 nuclear translocation is mediated by a functional NLS sequence and is essential for its pro-tumorigenic actions in cancer cells, Oncogene 33 (5) (2014) 578–588.
[19] W.J.Azar,etal.,IGFBP-2enhancesVEGFgenepromoteractivityandconsequentpromotion of angiogenesis by neuroblastoma cells, Endocrinology 152 (9) (2011) 3332–3342.
[20] S.B. Wheatcroft, M.T. Kearney, IGF-dependent and IGF-independent actions of IGFbinding protein-1 and -2: implications for metabolic homeostasis, Trends Endocrinol. Metab. 20 (4) (2009) 153–162. [21] S.B. Wheatcroft, et al., IGF-binding protein-2 protects against the development of obesity and insulin resistance, Diabetes 56 (2) (2007) 285–294.

7.3.8 Emerging roles for the pH-sensing G protein-coupled receptors in response to acidotic stress

Edward J Sanderlin, Calvin R Justus, Elizabeth A Krewson, Li V Yang
Cell Health & Cytoskel Mar 2015; 2015(7): 99—109
http://www.dovepress.com/emerging-roles-for-the-ph-sensing-g-protein-coupled-receptors-in-respo-peer-reviewed-article-CHC#

Protons (hydrogen ions) are the simplest form of ions universally produced by cellular metabolism including aerobic respiration and glycolysis. Export of protons out of cells by a number of acid transporters is essential to maintain a stable intracellular pH that is critical for normal cell function. Acid products in the tissue interstitium are removed by blood perfusion and excreted from the body through the respiratory and renal systems. However, the pH homeostasis in tissues is frequently disrupted in many pathophysiologic conditions such as in ischemic tissues and tumors where protons are overproduced and blood perfusion is compromised. Consequently, accumulation of protons causes acidosis in the affected tissue. Although acidosis has profound effects on cell function and disease progression, little is known about the molecular mechanisms by which cells sense and respond to acidotic stress. Recently a family of pH-sensing G protein-coupled receptors (GPCRs), including GPR4, GPR65 (TDAG8), and GPR68 (OGR1), has been identified and characterized. These GPCRs can be activated by extracellular acidic pH through the protonation of histidine residues of the receptors. Upon activation by acidosis the pH-sensing GPCRs can transduce several downstream G protein pathways such as the Gs, Gq/11, and G12/13 pathways to regulate cell behavior. Studies have revealed the biological roles of the pH-sensing GPCRs in the immune, cardiovascular, respiratory, renal, skeletal, endocrine, and nervous systems, as well as the involvement of these receptors in a variety of pathological conditions such as cancer, inflammation, pain, and cardiovascular disease. As GPCRs are important drug targets, small molecule modulators of the pH-sensing GPCRs are being developed and evaluated for potential therapeutic applications in disease treatment.

Cellular metabolism produces acid as a byproduct. Metabolism of each glucose molecule by glycolysis generates two pyruvate molecules. Under anaerobic conditions the metabolism of pyruvate results in the production of the glycolytic end product lactic acid, which has a pKa of 3.9. Lactic acid is deprotonated at the carboxyl group and results in one lactate ion and one proton at the physiological pH. Under aerobic conditions pyruvate is converted into acetyl-CoA and CO2 in the mitochondria. CO2in water forms a chemical equilibrium of carbonic acid and bicarbonate, an important physiological pH buffering system. The body must maintain suitable pH for proper physiological functions. Some regulatory mechanisms to control systemic pH are respiration, renal excretion, bone buffering, and metabolism.1–4 The respiratory system can buffer the blood by excreting carbonic acid as CO2 while the kidney responds to decreased circulatory pH by excreting protons and electrolytes to stabilize the physiological pH. Bone buffering helps maintain systemic pH by Ca2+ reabsorption and mineral dissolution. Collectively, it is clear that several biological systems require tight regulation to maintain pH for normal physiological functions. Cells utilize vast varieties of acid-base transporters for proper pH homeostasis within each biological context.5–8 Some such transporters are H+-ATPase, Na+/H+exchanger, Na+-dependent HCO3–/C1– exchanger, Na+-independent anion exchanger, and monocarboxylate transporters. Cells can also maintain short-term pH homeostasis of the intracellular pH by rapid H+ consuming mechanisms. Some such mechanisms utilize metabolic conversions that move acids from the cytosol into organelles. Despite these cellular mechanisms that tightly maintain proper pH homeostasis, there are many diseases whereby pH homeostasis is disrupted. These pathological conditions are characterized by either local or systemic acidosis. Systemic acidosis can occur from respiratory, renal, and metabolic diseases and septic shock.1–4,9 Additionally, local acidosis is characterized in ischemic tissues, tumors, and chronically inflamed conditions such as in asthma and arthritis caused by deregulated metabolism and hypoxia.10–15

Acidosis is a stress for the cell. The ability of the cell to sense and modulate activity for adaptation to the stressful environment is critical. There are several mechanisms whereby cells sense acidosis and modulate cellular functions to facilitate adaptation. Cells can detect extracellular pH changes by acid sensing ion channels (ASICs) and transient receptor potential (TRP) channels.16 Apart from ASIC and TRP channels, extracellular acidic pH was shown to stimulate inositol polyphosphate formation and calcium efflux.17,18 This suggested the presence of an unknown cell surface receptor that may be activated by a certain functional group, namely the imidazole of a histidine residue. The identity of the acid-activated receptor was later unmasked by Ludwig et al as a family of proton-sensing G protein-coupled receptors (GPCRs). This group identified human ovarian cancer GPCR 1 (OGR1) which upon activation will produce inositol phosphate and calcium efflux through the Gq pathway.19 These pH-sensing GPCR family members, including GPR4, GPR65 (TDAG8), and GPR68 (OGR1), will be discussed in this review (Figure 1). The proton-sensing GPCRs sense extracellular pH by protonation of several histidine residues on their extracellular domain. The activation of these proton-sensing GPCRs facilitates the downstream signaling through the Gq/11, Gs, and G12/13 pathways. Their expression varies in different cell types and play critical roles in sensing extracellular acidity and modulating cellular functions in several biological systems.

Figure 1 Biological roles and G protein coupling of the pH-sensing GPCRs.
Abbreviation: GPCRs, G protein-coupled receptors.

Role for the pH-sensing GPCRs in the immune system and inflammation

Acidic pH is a main characteristic of the inflammatory loci.14,20,21 The acidic microenvironment in inflamed tissue is predominately due to the increased metabolic demand from infiltrating immune cells, such as the neutrophil. These immune cells increase oxygen consumption and glucose uptake for glycolysis and oxidative phosphorylation. When oxygen availability is limited, cells often undergo anaerobic glycolysis. This process generates increasing amounts of lactic acid, thereby creating a local acidic microenvironment within the inflammatory loci.22 This presents a role for the pH-sensing GPCR GPR65 (TDAG8) in inflammation and immune cell function.23 TDAG8 was originally identified by cloning as an orphan GPCR which was observed to be upregulated during thymocyte apoptosis.24,25GPR65 (TDAG8) is predominately expressed in lymphoid tissues such as the spleen, lymph nodes, thymus, and leukocytes.24–26 It was demonstrated that GPR65 inhibited pro-inflammatory cytokine secretion, which includes IL-6 and TNF-α, in mouse peritoneal macrophages upon activation by extracellular acidification. This cytokine inhibition was shown to occur through the Gs-cAMP-protein kinase A (PKA) signaling pathway.23,27 Treatment with dexamethasone, a potent glucocorticoid, increased GPR65 expression in peritoneal macrophages. Following dexamethasone treatment, there was an inhibition of TNF-α secretion in a manner dependent on increased expression of GPR65.28Another report provides an anti-inflammatory role for GPR65 in arthritis.29 Type II collagen-induced arthritis was increased in GPR65-null mice in comparison to wild-type mice. These studies taken together suggest GPR65 serves as a negative regulator in inflammation.30 However, one study provided a function for GPR65 as a positive modulator in inflammation.31 GPR65 was reported to increase eosinophil viability in the acidic microenvironment by reducing apoptosis through the cAMP pathway. As eosinophils are central in asthmatic inflammation and allergic airway disease, GPR65 may play a role in increasing asthmatic inflammation.31 On the other hand, GPR65 has shown little involvement in immune cell development. One report indicates that GPR65 knockout mice had normal immune development and function.26 Modulation of inflammation by GPR65 is complex and must be examined within each specific pathology.23

In addition to GPR65, GPR4 is also involved in the inflammatory response. Endothelial cells compose blood vessels that often penetrate acidic tissue microenvironments such as the inflammatory loci. Among the pH-sensing GPCR family, GPR4 has the highest expression in endothelial cells. Response to inflammation by vascular endothelial cells facilitates the induction of inflammatory cytokines that are involved in the recruitment of leukocytes for adherence and transmigration into inflamed tissues. Activation of GPR4 by acidosis in human umbilical vein endothelial cells, among other endothelial cell types, increased the expression of a broad range of pro-inflammatory genes including chemokines, cytokines, PTGS2, NF-κB pathway genes, and adhesion molecules.32 Moreover, human umbilical vein endothelial cells, when treated with acidic pH, increased GPR4-mediated endothelial adhesion to leukocytes.32,33 Altogether, GPR65 and GPR4 provide differential regulation of the inflammatory response through their acid sensing capabilities. GPR65 predominately demonstrates function in the inhibition of the inflammatory response whereas GPR4 activation exacerbates inflammation.

Role for the pH-sensing GPCRs in the cardiovascular system

Taken together, both GPR4 and GPR68 play roles in regulating the function of the cardiovascular system. GPR4 regulates blood vessel stability and endothelial cell function and GPR68 increases cardiomyogenic and pro-survival gene expression while also mediating aortic smooth muscle cell gene expression.

Role for the pH-sensing GPCRs in the renal system

GPR4 is expressed in the kidney cortex, isolated kidney collecting ducts, inner and outer medulla, and in cultured inner and outer medullary collecting duct cells.59 In mice deficient for GPR4, renal acid excretion and the ability to respond to metabolic acidosis was reduced.59 In response to acidosis, inner and outer medullary collecting duct cells produced cAMP, a second messenger for the Gs G-protein pathway, through the GPR4 receptor.59 In renal HEK293 epithelial cells GPR4 overexpression was found to increase the activity of PKA.60 In addition, the protein expression of H+-K+-ATPase α-subunit (HKα2) was increased following GPR4 overexpression dependent on increased PKA activity.60

GPR68 has also been reported to alter proton export of HEK293 cells by stimulating the Na+/H+exchanger and H+-ATPase.58 The activation of GPR68 by acidosis was found to stimulate this effect through a cluster of extracellular histidine residues and the Gq/PKC signaling pathway.58 In GPR68-null mice the expression of the pH-sensitive kinase Pyk2 in the kidney proximal tubules was upregulated which might compensate for GPR68 deficiency.58 Taken together, GPR4 and GPR68 may both be necessary for successful systemic pH buffering by controlling renal acid excretion.

Role for the pH-sensing GPCRs in the respiratory system

Aoki et al demonstrated that GPR68-deficient mice were resistant to asthma along with inhibiting Th2 cytokine and immunoglobulin E production.68 This study concludes that GPR68 in dendritic cells is crucial for the onset of asthmatic responses.68 Moreover, GPR65 has been implicated as having a role in respiratory disorders as it is highly expressed in eosinophils, hallmark cells for asthmatic inflammation.69 Kottyan et al showed that GPR65 increased the viability of eosinophils within an acidic environment through the cAMP pathway in murine asthma models.31 In summary, GPR68 and GPR65 play important roles in the respiratory system and asthma. GPR68 regulates gene expression in airway epithelial, smooth muscle and immune cells while GPR65 enhances the survival of airway eosinophils in response to acidosis.

Role for the pH-sensing GPCRs in the skeletal system

GPR65 has also been reported as a pH sensor in bone. GPR65 is expressed in osteoclasts and its activity may inhibit Ca2+ resorption.81 Disruption of GPR65 gene exacerbated osteoclastic bone resorption in ovariectomized mice.81 The relative bone density of GPR65-null mice was less than control mice.81 In cultured osteoclast cells from mice deficient for GPR65, the normal inhibition of osteoclast formation in response to acidosis was abrogated.81 Taken together, this data suggest that the activation of GPR65 may enhance bone density, thus the GPR65 signaling may be important for disease processes such as osteoporosis and other bone density disorders.

Role for the pH-sensing GPCRs in the endocrine system

GPR68 has also been found to modify insulin production and secretion. In GPR68 knockout mice insulin secretion in response to glucose administration was reduced when compared to wild-type mice although blood glucose was not significantly altered.84 GPR68 deficiency in this respect may reduce insulin secretion but at the same time increase insulin sensitivity. In addition, stimulation of GPR68 in islet cells by acidosis increased the secretion of insulin through the Gq/11 G-protein signaling.84

Role for the pH-sensing GPCRs in the nervous system and nociception

Acidosis causes pain by exciting nociceptors located in sensory neurons. Several types of ion channels and receptors, such as ASICs, TRPV1, and proton-sensing GPCRs, have been identified as nociceptors in response to acidosis. ASICs and TRPV act as proton-gated membrane-bound channels, which are activated by acidic pH and mediate multimodal sensory perception including nociception.86–88  GPR65 activation sensitized the response of TRPV1 to capsaicin. The results suggest high accumulation of protons post inflammation may not only stimulate nociceptive ion channels such as TRPV1 to trigger pain, but also activate proton-sensing GPCRs to regulate heightened sensitivity to pain.89 Furthermore, Hang et al demonstrated GPR65 activation elicited cancer-related bone pain through the PKA and phosphorylated CREB (pCREB) signaling pathway in the rat model.90 Collectively, GPR4, GPR65, and GPR68 are all expressed in the dorsal root ganglia; GPR65 is a functional receptor involved in nociception and the nervous system by sensitizing inflammatory pain and the evocation of cancer-related bone pain.

Role for the pH-sensing GPCRs in tumor biology

The tumor microenvironment is highly heterogeneous. Hypoxia, acidosis, inflammation, defective vasculature, poor blood perfusion, and deregulated cancer cell metabolism are hallmarks of the tumor microenvironment.91–93 The acidity in the tumor microenvironment is owing to the altered cancer cell metabolism termed the “Warburg Effect”. This metabolic phenotype allows the cancer cells to preferentially utilize glycolysis over oxidative phosphorylation as a primary means of energy production.94 This process occurs even in normoxic tissue environments where sufficient oxygen is available. Due to this phenomenon, the Warburg Effect is often termed “aerobic glycolysis”. This unique metabolic phenotype produces vast quantities of lactic acid, which serve as a proton source for acidification. Upon disassociation of lactic acid to one lactate molecule and one proton, the monocarboxylate transporter and proton transporters export lactate and protons into the extracellular tumor microenvironment.95 The proton-sensing GPCRs are activated by acidic pH and facilitate tumor cell modulation in response to extracellular acidification. GPR4, GPR65, and GPR68 play roles in tumor cell apoptosis, proliferation, metastasis, angiogenesis, and immune cell function.19,27,32,33,44,45,96,97

GPR4 has had conflicting reports in terms of tumor suppressing or promoting activities. One study demonstrated that GPR4 could act as a tumor metastasis suppressor, when overexpressed and activated by acidic pH in B16F10 melanoma cells, by impeding migration and invasion of tumor cells.45 GPR4 overexpression also significantly inhibited the lung metastasis of B16F10 melanoma cells in mice.45 Another study utilizing the B16F10 melanoma cell line which overexpressed GPR4 showed an increase in mitochondrial surface area and a significant reduction in membrane protrusions by quantification of 3D morphology.98 These data point to a decrease in cancer cell migration when GPR4 is overexpressed and provides another example of GPR4 as exhibiting tumor metastasis suppressor function.98 However, in another report GPR4 malignantly transformed immortalized NIH3T3 fibroblasts.99 This presents GPR4 with tumor-promoting capabilities. The conflicting reports seem to indicate the functional ability of GPR4 to act as a tumor promoter and a tumor suppressor depending on the context of certain cell types and biological systems.

Reports with GPR65 involvement in cancer cells provide evidence in favor for cancer cell survival; however, opposing evidences suggest GPR65 functions as a tumor suppressor. In the same report suggesting GPR4 is oncogenic due to GPR4 transforming immortalized NIH3T3 fibroblasts, GPR65 overexpression was able to transform the mouse NMuMG mammary epithelial cell line.99 Another group demonstrated in NCI-H460 human non-small cell lung cancer cells that GPR65 promotes cancer cell survival in an acidic microenvironment.100 Conversely, a recent study showed that GPR65 inhibited c-Myc oncogene expression in human lymphoma cells.101 Furthermore, GPR65 messenger ribonucleic acid expression was reduced by more than 50% in a variety of human lymphoma samples when compared to normal lymphoid tissues, therefore implying GPR65 has a tumor suppressor function in lymphoma.101 GPR65 has also been shown to increase glucocorticoid-induced apoptosis in murine lymphoma cells.102 These reports highlight cell type dependency and biological context for GPR65 activity as a tumor suppressor or promoter.

GPR68 also has roles in tumor biology as a potential tumor suppressor or a tumor promoter. Reports have shown that GPR68 can inhibit cancer metastasis, reduce cancer cell proliferation, and inhibit migration. One study showed that when GPR68 was overexpressed in prostate cancer cells, metastasis to the lungs, diaphragm, and spleen was inhibited.97 When GPR68 was overexpressed in ovarian cancer (HEY) cells, cellular proliferation and migration were significantly reduced, and cell adhesion to the extracellular matrix was increased.96 Another study reported GPR68 expression was critical for the tumor cell induced immunosuppression in myeloid-derived cells. This study proposed that GPR68 promotes M2 macrophage development and inhibits T-cell infiltration, and thereby facilitates tumor development.103 In summary, the biological roles of GPR4, GPR65, and GPR68 in tumor biology are complex and both tumor-suppressing and tumor-promoting functions have been reported, primarily dependent on cell type and biological milieu.

Development of small molecule modulators of the pH-sensing GPCRs

GPCRs are critical receptors for the regulation of many physiological operations. It is of little surprise that GPCRs have become a central focus of pharmaceutical development. In fact, 30%–50% of therapeutics focuses on modulating GPCR activity.104,105 In view of the diverse roles of the pH-sensing GPCRs in the context of multiple biological systems, targeting these receptors with small molecules and other modulators could serve as potential therapeutics for diseases associated with deregulated pH homeostasis. There have been recent developments in the characterization of GPR4 antagonists along with agonists for GPR65 and GPR68.29,32,50,106 The GPR4 antagonist demonstrated effectiveness in vitro to reduce the GPR4-mediated inflammatory response to acidosis in endothelial cells.32 The GPR65 agonist, BTB09089, showed in vitro effects in GPR65 activation of immune cells to inhibit inflammatory response; however, the activity of BTB09089 was not strong enough for the use in animal models in vivo.29 The GPR68 agonist, lsx, exhibited pro-neurogenic activity and induced hippocampal neurogenesis in young mice.107 It was also demonstrated that lsx suppressed the proliferation of malignant astrocytes.108 To date, however, much advancement needs to be done in development of efficacious agonists and antagonists of the pH-sensing GPCRs coupled with a capacity to target specific tissue dysfunction in the midst of systemic drug administration to optimize therapeutic effects and minimize potential adverse effects.

Concluding remarks

Cells encounter acidotic stress in many pathophysiologic conditions such as inflammation, cancer, and ischemia. Intricate molecular mechanisms, including a large array of acid/base transporters and acid sensors, have evolved for cells to sense and respond to acidotic stress. Emerging evidence has demonstrated that a family of the pH-sensing GPCRs can be activated by extracellular acidotic stress and regulate the function of multiple physiological systems (Table 1). The pH-sensing GPCRs also play important roles in various pathological disorders. Agonists, antagonists and other modulators of the pH-sensing GPCRs are being actively developed and evaluated as potential novel treatment for acidosis-related diseases.

Table 1 The main biological functions of the pH-sensing GPCRs

7.3.9 Protein amino-terminal modifications and proteomic approaches for N-terminal profiling

Lai ZW1, Petrera A2, Schilling O3.
Curr Opin Chem Biol. 2015 Feb; 24:71-9
http://dx.doi.org:/10.1016/j.cbpa.2014.10.026

Amino-/N-terminal processing is a crucial post-translational modification affecting almost all proteins. In addition to altering the chemical properties of the N-terminus, these modifications affect protein activation, conversion, and degradation, which subsequently lead to diversified biological functions. The study of N-terminal modifications is of increasing interest; especially since modifications such as proteolytic truncation or pyroglutamate formation have been linked to disease processes. During the past decade, mass spectrometry has played an important role in facilitating the investigation of N-terminal modifications. Continuous progress is being made in the development and application of robust methods for the dedicated analysis of native and modified protein N-termini in a proteome-wide manner. Here we highlight recent progress in our understanding of protein N-terminal biology as well as outlining present enrichment strategies for mass spectrometry-based studies of protein N-termini.

Highlights

    • N-terminal acetylation, pyroglutamate formation, N-degrons and proteolysis are reviewed.• N-terminomics provide comprehensive profiling of modification at protein N-termini in a proteome-wide manner.• We outline a number of established methodologies for the enrichment of protein N-termini through positive and negative selection strategies.• Peptidomics-based approach is beneficial for the study of post-translational processing of protein N-termini.

 Introduction The life of every protein begins at the amino-terminus, also known as the N-terminus. During the initiation of mRNA translation into proteins or polypeptides, newly synthesized amino
acid chains form the N-termini and are the first to exit the ribosomes into the cytosol or the endoplasmic reticulum. The N-termini of these proteins or protein precursors often contain a signaling peptide
sequence proximal to the N-terminus, which may function as a ‘zip-code’ to direct the delivery of a protein to a cellular compartment as well as orchestrating protein maturation via different post-translational
modifications (PTMs) such as acetylation or proteolysis. These modifications often determine protein activity or stability; thus being crucial for the tight regulation of cellular homeostasis (Figure 1).
Mass spectrometry (MS) based analyses of protein N-termini, termed N-terminomics, is a promising tool to tackle these problems. In the past decade, we have witnessed significant progress in the
area of mass spectrometric investigation of post-translational modifications such as phosphorylation or glycosylation [1].  Similarly, MS-based studies of protein N-termini are gaining momentum.
Recent progress in positional proteomics using advanced MS platforms combined with a number of effective enrichment strategies has reinforced significant interest in N-terminomics.
Here we outline some of the most current highlights on proteomics-based studies on N-terminal modifications, including N-acetylation, pyroglutamate formation, proteolysis, and N-terminal degrons
(Figure 2). We also present a number of recent N-terminomic methodologies for the study of protein N-termini.

Acetylation of protein N-termini represents an abundant post-translational modification in eukaryotes, affecting nearly all cytoplasmic proteins. This  modification is catalyzed by the N-terminal
acetyltransferase (Nat) enzyme complex, which transfers an acetyl group to the N-termini of newly synthesized proteins during translation (Figure 2). Initial findings highlighted that N-terminal
acetylation protects proteins from degradation [2–4]. Recent studies however yield a more diverse picture. N-terminal acetylation may also play a role in protein delivery and localization [5–7],
protein complex formation and generation of specific degradation signals in cellular proteins via the N-degron pathway [9,10]. Loss of N-terminal acetylation through inactive acetyltransferases leads to
smaller aggregates of prion proteins [11]. In addition, N-terminal acetyltransferases have been described to also function as N-terminal proprionyltransferases [12].  Genetic mutation in the Naa10 gene,
encoding the NatA catalytic subunit, is known to cause N-terminal acetyltransferase deficient phenotypes. This genetic mutation has also been linked to X-linked disorder of infancy, causing lethality in
male infants[13]. The multifunctional roles of N-acetyltransferases as well as the importance of  N-terminal acetylation have been previously reviewed in [14]. Few MS-based studies have emerged that
specifically investigate acetylated N-termini in a proteome wide manner. The structural and functional integrity of actomyosin fibers depends on active NatB. A novel methodology determines the
extent of N-terminal acetylation in vivo through chemical, stable-isotope coded acetylation of proteins before their mass spectrometric analysis [16].

Pyroglutamate conversion of N-terminal glutamate and glutamine Many proteins and biologically active peptides exhibit an N-terminal pyroglutamic acid (pGlu) residue. This post
translational modification originates from the conversion of N-terminal glutamate and glutamine into pyroglutamic acid by glutaminyl cyclase or isoglutaminyl cyclase (Figure 2). N-terminal
pGlu influences structural stability as well as biological activity of peptides and proteins [17]. pGlu protects proteins from degradation by aminopeptidases [18] as well as regulating the
biological activity of peptide hormones, neuropeptides or chemokines [19]. Examples include thyrotropin releasing hormone (TRH), gonadotropin-releasing hormone, and the human
chemokines MCP-1 and 2. The presence of N-terminal pGlu in some amyloidogenic peptides, such as amyloid-b peptides, increases their hydrophobicity, resulting in an accelerated
aggregation [20]. Modulating the extent of N-terminal pGlu formation through pharmaceutical inhibition of glutaminyl cyclase is considered a promising strategy, for example, to
increase the degradation of inflammatory and neurotoxic peptides. Inhibition of glutaminyl cyclase has alleviated liver inflammation by destabilizing the chemokine MCP1 (CCL2) [21].
Proteolytic degradation of this promigratory chemokine by inhibiting glutaminyl cyclase was also proposed as an attractive novel strategy in preventing thyroid cancer metastasis [22].
Given the functional relevance of N-terminal pGlu in pathological conditions, an MS-based approach to profile this modification may be particularly useful.

N-terminal degrons N-terminal residues have a strong impact on protein stability and half-life. Firstly described in 1986 by Varshavsky and colleagues [25], the N-end rule pathway
has been identified in a broad range of species, from mammals to bacteria, and from yeast to plants [26]. This control of protein degradation in eukaryotes and bacteria is governed
by the formation and recognition of specific sequences at protein N-termini, called N-degrons. The main determinant of an N-degron is an N-terminal destabilizing residue. In eukaryotes,
two N-end rule pathways are being distinguished: the Ac/N-end rule pathway targets proteins through their N-terminally acetylated residues while the Arg/N-rule pathway targets
unacetylated N-terminal residues and involves N-terminal arginylation [26]. Proteolytic processing leading to new protein N-termini is increasingly recognized to play an important
role in the formation of N-degrons. In eukaryotes, N-degron mediated protein degradation occurs through the  ubiquitin–proteasome system. N degrons are recognized by E3
ubiquitin ligases called N-recognins, which induce protein ubiquitylation. Recent studies showed that the N-end rule pathway can be regulated by various mechanisms [26].
Hemin, the ferric (Fe3+) counterpart of heme, and short peptides can bind to components of the N-end rule pathway and impede their functionality [26]. Although the N-end rule
pathway has been molecularly dissected in great detail, numbers of identified physiological substrates undergoing N-end rule degradation have remained limited. A recent study
has expanded the range of substrates targeted by the Arg/N-end rule. Kim and colleagues have shown that N terminal Met followed by a hydrophobic residue functions as an N-degron
[27]. N-terminal Met followed by a small residue is typically removed by aminopeptidases in a cotranslational manner (Figure 2). However, approximately 15% of the genes in mammals
or yeast encode for an N-terminal Met followed by a larger hydrophobic residue. This specific N-degron is targeted by the Ac/N-end rule pathway when the N-terminal Met is acetylated.
The Arg/N-end rule acts instead on the non-acetylated N-terminal Met. As previously mentioned, novel N-degrons can be generated by preceding proteolysis. Piatkov and colleagues
investigated this concept for proteolytic cleavage products that occur during apoptosis [28]. They find that numerous proapoptotic fragments are short lived substrates of Arg/N-end
rule pathway, attributing to this pathway an anti-apoptotic role. Notably, the corresponding N-degron sequences are evolutionary conserved.

Figure 1 Protein N-termini are susceptible to various post-translational modification.
For a more comprehensive overview of all possible N terminal modification, see [60].

Figure 2 Examples of N-terminal mofications: acetylation, pyroglutamate conversion, proteolysis and N-degron processing via deamidation and amino acid conjugation.

Proteolytic processing of N-termini Proteolysis has long been regarded a degradation process. It is now increasingly recognized as an important posttranslational modification
with an array of proteases mediating cellular signaling via the precise processing of bioactive proteins and peptides. The study of cleavage events using N-terminomics is particularly
useful for the identification of proteolytic substrates. Proteolytic cleavage of proteins and polypeptides results in the generation of cleavage fragments with new N-termini and
C-termini. Numerous recent proteomic studies highlighted differential regulation of proteases in different disease settings. MALDI-TOF in combination with enzymatic assays
established reduced levels of dipeptidyl-peptidase (DPP)4 in the serum of patients suffering from metastatic prostate cancer [31]. Another proteomic based study,  using isotope
coded affinity tag (ICAT) labeling showed bacterial leucine aminopeptidase from Plasmodium chabaudi to be significantly upregulated in periodontal disease [32]. Mass spectrometry
was also used for the functional characterization of proteases.

7.3.10 Protein homeostasis networks in physiology and disease

Although most text books of biochemistry describe the process of protein folding to a three dimensional native state as an intrinsic property of the primary sequence, it is becoming increasingly clear that this process can go wrong in an almost infinite number of ways. In fact, many different diseases are caused by the misfolding and aggregation of certain proteins without genetic mutations in the primary sequence. An integrative view of the mechanisms that maintain protein folding homeostasis is emerging, which could be thought as a balanced and dynamic network of interconnected processes tightly regulated by a series of quality control mechanisms. This protein homeostasis network involves families of folding catalysts, co-factors under specific environmental and metabolic conditions. Maintaining protein homeostasis is particularly challenging in specialized secretory cells where the high demand for protein synthesis generates a constant source of stress that could lead to proteotoxicity.

Protein folding is assisted and monitored by diverse interconnected processes that follow a sequential pattern over time. The calnexin/calreticulin cycle ensures the proper folding of glycosylated proteins through the secretory pathway, which establishes the final pattern of disulfide bond formation through interactions with the disulfide isomerase ERp57. Coupled to this cycle is the ER-associated degradation (ERAD) pathway, which translocates terminally misfolded proteins to the cytosol for degradation by proteasomes. In addition, macroautophagy is becoming a relevant mechanism for the clearance of damaged proteins and abnormal protein aggregates through lysosomal hydrolysis, a process also referred to as ERAD-II. The folding status at the ER is constantly monitored by the Unfolded Protein Response (UPR), a specialized signaling pathway initiated by the activation of three types of stress sensors. The process underlying the surveillance of protein folding stress by the UPR is not fully understood, but it may require coupling to key folding mediators such as BiP or the direct recognition of the misfolded peptides by stress sensors. The UPR regulates genes and processs related to almost every folding step in the secretory pathway to reduce the load of misfolded proteins, including protein translation into the ER, translocation, folding, quality control, ERAD, the redox status, and many other related functions. Protein folding stress is observed in many disease conditions such as cancer, diabetes, and neurodegeneration. For example, abnormal protein aggregation and the accumulation of protein inclusions is associated with Parkinson’s and Alzheimer’s Disease, and amyotrophic lateral sclerosis. In those diseases and many others, neuronal dysfunction and disease progression correlates with the presence of a strong ER stress response; however, the direct in vivo role of the UPR in the disease process has been experimentally defined in only a few cases. Therapeutic strategies are currently being developed to increase protein folding and clearance of misfolded proteins, with the goal of alleviating ER stress.

In this issue of Current Opinion in Cell Biology we present a series of focused reviews from recognized experts in the field, that provide an overview of mechanisms underlying protein folding and quality control, and how balance of protein homeostasis is maintained in physiology and deregulated in diseases. Daniela Roth and William Balch integrate the concept of protein homeostasis networks into an interesting model termed FoldFx, showing how the interconnection between different pathways in the context of the cellular proteome determines the energetic barrier required to generate a functional folded peptide. The authors have previously proposed the term Proteostasis to refer to the set of interacting activities that maintain the health of the proteome and the organism (protein homeostasis). The ER is a central subcellular compartment for protein synthesis and quality control in the secretory pathway. Yukio Kimata and Kenji Kohno give an overview of the signaling pathways that control adaptation to ER stress and maintenance of protein folding homeostasis. The authors summarize the models proposed so far for the activation of UPR stress sensors, and discuss how this directly or indirectly relates to the accumulation of unfolded proteins in the ER lumen. Chronic or irreversible ER stress triggers cell death by apoptosis. Gordon Shore, Feroz Papa, and Scott Oakes summarize the complex signaling pathways initiating apoptosis by ER stress, where cross talk between the ER and the mitochondria play a central role. The authors focus on addressing the role of the BCL-2 protein family on the activation of intrinsic mitochondrial apoptosis pathways, highlighting different cytosolic and transcriptional events that determine the transition between adaptive responses to apoptosis programmed by the UPR to eliminate irreversibly injured cells.

Although diverse families of chaperones, foldases and co-factors are expressed at the ER, only a few protein folding networks have been well defined. However, molecular explanations for specific substrate recognition and quality control mechanisms are poorly defined. Here we present a series of reviews covering different aspects of protein maturation. Amy Lee summarizes what is known about the biology of the key ER folding chaperone BiP/Grp78, and its emerging role in diverse pathological conditions including cancer. In two reviews, David B. Williams and Linda M. Hendershot describe the best characterized mechanism of protein quality control at the ER, the calnexin cycle. In addition, they give an overview of the function of a family of ER foldases, the protein disulfide isomerases (PDIs), in folding, quality control and degradation of abnormally folded proteins. PDIs are also becoming key factors in establishing the redox tone of the ER. Riccardo Bernasconi and Maurizio Molinari overview the ERAD process and how this pathway affects the efficiency of the protein folding process at the ER and its relation to pathological conditions.

Lysosomal-mediated degradation is becoming a fundamental process for the control of the haft-life of proteins and the degradation of misfolded, aggregate prone proteins. Ana Maria Cuervo reviews the relevance of Chaperone-mediated autophagy in the selective degradation of soluble cytosolic proteins in lysosomes, and also points out a key role for Chaperone-mediated autophagy in the cellular defense against proteotoxicity. David Rubinsztein and Guido Kroemer present two reviews highlighting the emerging relevance of macroautophagy in maintaining the homeostasis of the nervous system. They also discuss the actual impact of macroautophagy in the clearance of protein aggregates related to neurodegenerative diseases, including Parkinson’s disease, amyotrophic lateral sclerosis, Huntington’s disease among others. In addition, recent evidence suggesting an actual impairment of macroautophagy as a causative factor in aging-related disorders is also discussed.

Alterations in protein homeostasis underlie the etiology of many diseases affecting the nervous system, in addition to cancer and diabetes. Fumiko Urano summarizes the impact of ER stress in β cell dysfunction and death during the progression of type 1 and type 2 diabetes, as well as in genetic forms of diabetes such as Wolfram syndrome. The occurrence of basal ER stress is observed in specialized secretory cells and organs, including plasma B cells. Roberto Sitia covers several aspects of how proteotoxic stresses physiologically contribute to regulate the biogenesis, function and lifespan of B cells, and speculates about the possible impact of ER stress in the treatment of multiple myeloma. Claudio Soto describes the specific role of calcineurin, a key phosphatase in the brain, in the occurrence of synaptic dysfunction and neuronal death in prion-related disorders. We also present provide a review summarizing the emerging role of ER stress and the UPR in most neurodegenerative diseases related to protein misfolding. We also discuss the particular mechanisms currently proposed to be involved in the generation of protein folding stress at the ER in these pathologies, and speculate about possible therapeutic interventions to treat neurodegenerative diseases.

Strategies to increase the efficiency of quality control mechanisms, to reduce protein aggregation and to enhance folding are suggested to be beneficial in the setting of diseases associated with the disruption of protein homeostasis. Finally, Jeffery Kelly overviews recent chemical and biological therapeutic strategies to restore protein homeostasis, which could be achieved by enhancing the biological capacity of the proteostasis network or through small molecule to stabilize misfolding-prone proteins. In summary, this volume ofCurrent Opinion in Cell Biology compiles the most recent advances in understanding the impact of protein folding stress in physiology and disease, and integrates a variety of complex mechanisms that evolved to maintain protein homeostasis in a dynamic way in the context of a changing environment. The biomedical applications of developing strategies to cope with protein folding stress have profound implications for the treatment of the most prevalent diseases in the human population.

7.3.11 Proteome sequencing goes deep
Advances in mass spectrometry (MS) have transformed the scope and impact of protein characterization efforts. Identifying hundreds of proteins from rather simple biological matrices, such as yeast, was a daunting task just a few decades ago. Now, expression of more than half of the estimated ∼20,000 human protein coding genes can be confirmed in record time and from minute sample quantities. Access to proteomic information at such unprecedented depths has been fueled by strides in every stage of the shotgun proteomics workflow-from sample processing to data analysis-and promises to revolutionize our understanding of the causes and consequences of proteome variation.
Highlights
    • Recent MS advances have transformed the depth of coverage of the human proteome.• Expression of half the estimated human protein coding genes can be verified by MS.• MS sample preparation, instrumentation, and data analysis techniques are highlighted.

http://ars.els-cdn.com/content/image/1-s2.0-S1367593114001586-gr1.sml

Mammalian proteomes  are complex [3]. The human proteome contains ~20,300 protein-coding genes; however, non-synonymous single nucleotide polymorphisms (nsSNPs), alternative
splicing events, and post-translational modifications (PTMs) all occur and exponentially increase the number of distinct proteoforms [4–6]. Detection of 5000 proteins in a proteomic
experiment was a considerable achievement just a few years ago [7–9]. More recently, two groups identified over 10,000 protein groups in a single experiment. Through extensive protein
and peptide fractionation (72 fractions) and digestion with multiple enzymes, Nagaraj et al. identified 10,255 protein groups from HeLa cells over 288 hours of instrument analysis [10].
A comparison with paired RNA-Seq data revealed nearly complete overlap between the detected proteins and the expressed transcripts. In that same year, a similar strategy enabled
the identification of 10,006 proteins from the U2OS cell line [11]. Kim and co-workers analyzed 30 human tissues and primary cells over 2000 LC–MS/MS experiments, resulting
in the detection of 293,000 peptides with unique amino acid sequences and evidence for 17,294 gene products [16]. Wilhelm et al. amassed a total of 16,857 LC–MS/MS experiments
from human cell lines, tissues, and body fluids. These experiments produced 946,000 unique peptides, which map to 18,097 protein coding genes [17]. Together, these two studies
provide direct evidence for protein translation of over 90% of  human genes (Figure 2). New developments in mass spectrometer technology have increased the rate at which proteomes
can be analyzed. We describe developments in sample preparation, MS instrumentation, and bioinformatics that have been key to obtaining comprehensive proteomic coverage.
Further, we consider how access to such proteomic detail will impact genomic  research.

Aurelian Udristioiu

Aurelian

Aurelian Udristioiu

Lab Director at Emergency County Hospital Targu Jiu

Mg²+ is critical for maintaining the positional integrity of closely clustered phosphate groups. These clusters appear in numerous and distinct parts of the cell nucleus and cytoplasm. The Mg²+ ion maintains the integrity of nucleic acids, ribosomes and proteins. In addition, this ion acts as an oligo-element with role in energy catalysis. Biological cell membranes and cell walls exhibit poly-anionic charges on the surface. This finding has important implications for the transport of ions, particularly because different membranes preferentially bind different ions. Both Mg²+ and Ca²+ regularly stabilize membranes by cross-linking the carboxylated and phosphorylated head groups of lipids.

Notable document –

Theor Biol Med Model. 2010 Jun 9;7:19.
Native aggregation as a cause of origin of temporary cellular structures needed for all forms of cellular activity, signaling and transformations.
Matveev VV1.
Cell physiologist at Institute of Cytology, Russian Academy of Sciences

According to the hypothesis explored in this paper, native aggregation is genetically controlled (programmed) reversible aggregation that occurs when interacting proteins form new temporary structures through highly specific interactions. It is assumed that Anfinsen’s dogma may be extended to protein aggregation: composition and amino acid sequence determine not only the secondary and tertiary structure of single protein, but also the structure of protein aggregates (associates). Cell function is considered as a transition between two states (two states model), the resting state and state of activity (this applies to the cell as a whole and to its individual structures). In the resting state, the key proteins are found in the following inactive forms: natively unfolded and globular. When the cell is activated, secondary structures appear in natively unfolded proteins (including unfolded regions in other proteins), and globular proteins begin to melt and their secondary structures become available for interaction with the secondary structures of other proteins. These temporary secondary structures provide a means for highly specific interactions between proteins. As a result, native aggregation creates temporary structures necessary for cell activity.”One of the principal objects of theoretical research in any department of knowledge is to find the point of view from which the subject appears in its greatest simplicity.”Josiah Willard Gibbs (1839-1903).

http://www.ncbi.nlm.nih.gov/pmc/articles/instance/2901313/bin/1742-4682-7-19-1.gif

http://www.ncbi.nlm.nih.gov/pmc/articles/instance/2901313/bin/1742-4682-7-19-2.gif

To date, numerous mechanisms, signal pathways, and different factors have been found in the cell. Researchers are naturally eager to find commonalities in the mechanisms of cellular regulation. I would like to propose a substantial approach to problems of cell physiology – the structural ground that produces signals and underlies the diversity of cellular mechanisms.

The methodological basis for the proposed hypothesis results from studies by the scientific schools of Dmitrii Nasonov [1] and Gilbert Ling [2–6], which have gained new appreciation over the last 20-30 years owing to advances in protein physics [7] in the study of properties of globular proteins, their unfolding and folding, as well as the discovery of novel states of the protein molecule: the natively unfolded and the molten globule. The key statement for the rationale of the present paper is that the specificity of interactions of polypeptide chains with each other (at the intra- and inter-molecular levels) can be provided only by their secondary structures, primarily α-helices and β-sheets.

Nasonov’s school discovered and studied a fundamental phenomenon — the nonspecific reaction of the cell to external actions [1], while works by Ling [5] and his followers allow the mechanisms of this phenomenon to be understood.

The above-mentioned cell reaction has been called nonspecific because diverse physical and chemical factors produce the same complex of structural changes in the cell: an increase in the turbidity and macroscopic viscosity of the cytoplasm and in the adsorption of hydrophobic substances by cytoplasmic proteins. It is of primary importance that the same changes also occur in the cell during its transition into the active state: muscle contraction, action potential, enhancement of secretory activity (for details, see [8]). Hence, from the point of view of structural changes, there is no fundamental difference between the result of action on the cell of hydrostatic pressure and, for instance, muscle contraction. In both cases, proteins are aggregated.

Nasonov called the cause of these changes the stages of cell protein denaturation, as the changes of properties of isolated proteins during denaturation are very similar to the changes in the cytoplasm during the nonspecific reaction. As a result, the denaturational theory of cell excitation and damage was created [1]. The structural changes of protein denaturation were unclear in Nasonov’s time. Nowadays, it is assumed that the denaturation is the destruction of the tertiary and secondary structure of a protein. Below I give two definitions, for the denaturation of natively folded (globular) proteins and for natively unfolded proteins.

A key notion in physiology is the resting state of the cell. This is implicit in the concept of the threshold character of the action of stimuli on the cell, which has played a historical role in the development of physiological science. It is the threshold that is the boundary between two states — rest and activity. But in effect, all our knowledge about cells concerns active cells, not cells in the resting state. It is in the active cell that variable changes occur that can be recorded. Nothing happens in the resting cell, so there is nothing to be recorded in it. Nevertheless, it is obvious that the resting state is the initial cell state, the starting point for all changes occurring in the cell.

What characterizes the structural aspect of the cell in the state of rest? It is only in Ling’s work [5] that I have found a clear answer to this question. The answer can be interpreted as follows: if all resting cell proteins were arranged in one line, it would turn out that most of the peptide bonds in this superpolypeptide would be accessible to solvent (water), while only a few would be included in secondary structures. When the cell is activated, the ratio between the unfolded and folded areas is changed sharply to the opposite: the proportion of peptide bonds accessible to solvent decreases markedly, whereas the proportion included in secondary structures rises significantly. These two extreme states of cell proteins, suggested by Ling, provide a basis for further consideration.

If Ling’s approach is combined with Nasonov’s theory, we obtain several interesting consequences. First of all, it is clear that proteins with maximally unfolded structures form the structural basis of resting cells because they are inactive, i.e., do not interact with other proteins or other macromolecules. The situation changes when an action on the cell exceeds the threshold: completely or partially unfolded key proteins begin to fold when new secondary protein structures are formed. Owing to these new secondary structures, the proteins become capable of reacting, i.e., intramolecular aggregation (folding of individual polypeptides into globules) and intermolecular aggregation (interaction of some proteins with others) begin. A distinguishing feature of these aggregational processes is their absolutely specific character, which is ensured by the amino acid composition, shape, and size of the secondary structures. The structures appearing have physiological meaning, so such aggregation is native and the secondary structures causing it are centers of native aggregation. Another source of secondary structures necessary for native aggregation is the molten globule.

The ability of cells to return to the initial state, the state of rest, means that native aggregation is completely reversible, and the structures appearing in the course of native aggregation are temporary and are disassembled as soon as they cease to be necessary. Native aggregation can involve both the whole cell and individual organelles, compartments, and structures, and activation of proteins is of a threshold rather than a spontaneous character.

The meaning of the proposed hypothesis of native aggregation is that the primary cause of any functional changes in cell is the appearance, as a result of native aggregation, of temporary structures, continually appearing and disintegrating during the life of the cell. Since native aggregation is initiated by external stimuli or regulatory processes and the structures appearing have a temporary character, these structures can be called signal structures.

Signal structures can have different properties: (i) they can be centers of binding of ions, molecules (solutes), and proteins; (ii) they can have enzymatic activity; (iii) they can form channels and intercellular contacts; (iv) they can serve as matrices organizing the interactions of molecules in synthetic and transport processes; (iv) they can serve as receptors for signal molecules; (v) they can serve as the basis for constructing even more complex supramolecular structures. These structures “flash” in the cell space like signal lights, perform their role, and disappear, to appear in another place and at another time. The meaning of the existence of the structural “flashes” is that during transition into the active state the cell needs new resources, functions, mechanisms, regulators, and signals. As soon as the cell changes to the resting state, the need for these structures disappears, and they are disassembled. Extreme examples of native aggregation are muscle contraction, condensation of chromosomes, the appearance of the division spindle, and interactions of ligands with receptors.

Thus, the present paper will consider the meaning and significance of native aggregation as the universal structural basis of the active cell. The basis of pathological states is the inability of the cell to return to the resting state and errors in the formation of signal structures. The presentation of native aggregation is based on three pillars: (i) reversible protein aggregation is a structural basis of cell activity (Nasonov’s School); (ii) the operation of the living cell or its individual structures can be regarded as a repetitive sequence of transitions between two states (active and resting), a key role in which belongs to natively unfolded proteins (Ling’s approach); (iii) the specificity of interactions of separate parts of a single polypeptide chain with each other (folding) or the interaction of separate polypeptide chains among themselves (self-assembly, aggregation) can be provided only by protein secondary structures.

The goal of this paper is the enunciation of principles, rather than a review of facts corresponding to these principles.

Read Full Post »

Novel Approaches to Cancer Therapy

Writer sand Curator: Larry H. Bernstein, MD, FCAP

11.1       Novel Approaches to Cancer Therapy

11.1.1 Electrically-driven modulation of surface-grafted RGD peptides for .. cell adhesion

11.1.2 The metabolic state of cancer stem cells—a target for cancer therapy

11.1.3 Regulation of tissue morphogenesis by endothelial cell-derived signals

11.1.4 Novel approach to bis(indolyl)methanes. De novo synthesis of 1-hydroxyimino-methyl derivatives with anti-cancer properties

11.1.5 Synthesis and Biological Evaluation of New 1,3-Thiazolidine-4-one Derivatives of 2-(4-Isobutylphenyl)propionic Acid molecules

11.1.6 Targeting pyruvate kinase M2 contributes to radiosensitivity of NSCLC cells

11.1.7 The tyrosine kinase inhibitor nilotinib has antineoplastic activity in prostate cancer cells but up-regulates the ERK survival signal—Implications for targeted therapies

11.1.8 PAF and EZH2 Induce Wnt.β-Catenin Signaling Hyperactivation

11.1.9 PAF Makes It EZ(H2) for β-Catenin Transactivation

11.1.10 PI3K.AKT.mTOR pathway as a therapeutic target in ovarian cancer

11.1.11 Endogenous, hyperactive Rac3 controls proliferation of breast cancer cells by a p21-activated kinase-dependent pathway

11.1.12 Curcumin-could-reduce-the-monomer-of-ttr-with-tyr114cys-mutation via autophagy in cell model of familial amyloid polyneuropathy.

11.1.1 Electrically-driven modulation of surface-grafted RGD peptides for .. cell adhesion

Lashkor M1, Rawson FJ, Stephenson-Brown A, Preece JA, Mendes PM.
Chem Commun (Camb). 2014 Dec 21; 50(98):15589-92
http://dx.doi.org/10.1039%2Fc4cc06649a

Reported herein is a switchable surface that relies on electrically-induced conformational changes within surface-grafted arginine–glycine–aspartate (RGD) oligopeptides as the means of modulating cell adhesion

Stimuli-responsive surfaces that are capable of modulating their biological properties in response to an external stimuli, including temperature,1,2 light,3 magnetic field4 and electrical potential,5–9 are of growing interest for a variety of biological and medical applications.10,11 Switchable surfaces that can be controlled on-demand are playing an increasingly important part in the development of highly sensitive biosensors,12–15novel drug delivery systems16–18 and functional microfluidic, bioanalysis, and bioseparation systems.19–22Additionally, dynamic, synthetic surfaces that can control the presentation of regulatory signals to a cell are expected to have a significant impact in the field of tissue engineering and regenerative medicine, and to provide unprecedented opportunities in fundamental studies of cell biology.23,24 The availability of sophisticated and functional switchable surfaces is expected to emulate more complex in vivo like extracellular environments, and provide a powerful means to probe and control the dynamic interactions between the cell and its external environments.

The majority of studies on stimuli-responsive surfaces reported to date either rely25–29 on controlling non-specific interactions (i.e., hydrophobic/hydrophilic and electrostatic) of the biomolecules with the active surface, or have focused30–32 on demonstrating modulation of specific biomolecular interactions using relatively simple biological systems (e.g. biotin–streptavidin) and conditions (i.e. water or buffer solutions). For example, Zareie et al. 30 fabricated a mixed self-assembled monolayer (SAM) on gold comprising oligo(ethylene glycol) (OEG) thiol molecules and shorter disulfides carrying biotin end-groups that regulated the interaction between biotin and streptavidin in water. The OEG thiols were able to switch in response to a change in temperature below and above their lower critical solution temperature (LCST = 37 °C). At 23 °C the structure of the OEG molecules was fully extended hindering the shorter biotin disulfide components. On the contrary, at 45 °C the OEG backbone collapsed, thus allowing the specific interaction between the biotin molecule on the surface and the protein streptavidin in solution. In our previous work,7–9 electrically controlled switching has been applied to regulate the conformational changes of modified positively charged oligolysine peptides tethered to a gold surface, such that biotin moieties incorporated into the oligolysines could be reversibly exposed or concealed on demand, as a function of surface potential. Switchable SAMs used to control biomolecular interactions via an electrical stimulus are particularly appealing because of their fast response times, ease of creating multiple individually addressable switchable regions on the same surface, as well as low-drive voltage and electric fields, which are compatible with biological systems.33 Our previous reported electrically switchable surface was able to control directly the biomolecular interactions between biotin and neutravidin in phosphate buffer saline (PBS) solution.

However, switchable surfaces have been scarcely used, thus far, to control biomolecular interactions on more complex systems such as those involving modulation of cell responsiveness.34–37 Jonkheijm and co-workers35 have reported a cucurbit[8]uril-based SAM system to electrochemically control the release of cells. Charged end groups on SAM surfaces have been exploited to electrically control the early stages of bacterial cell adhesion37 and form patterned surfaces with two independent dynamic functions for inducing cell migration.36 In spite of these efforts, given cellular complexity and diversity, such studies are very limited in number, as are the opportunities to further understand and control the complex interplay of events and interactions occurring within living cells.

Herein, we report on a stimuli-responsive surface that relies on electrically-induced conformational changes within surface-grafted arginine–glycine–aspartate (RGD) oligopeptides as the means of modulating cell adhesion. RGD, which is present in most of the adhesive ECM proteins (e.g. fibronectin, vitronectin, laminin and collagen), is specific for integrin-mediated cell adhesion.38 The RGD modified electrode is used here to dynamically regulate the adhesion of immune macrophage cells. The stimuli-responsive surface is fabricated on a gold surface and comprises a mixed SAM consisting of two components (Fig. 1): (i) an oligopeptide containing a terminal cysteine for attachment to the gold surface, three lysine residues as the main switching unit, and a glycine–arginine–glycine–aspartate–serine (GRGDS) as the recognition motif for cell adhesion –C3K-GRGDS, and (ii) an ethylene glycol-terminated thiol (C11TEG) to space out the oligopeptides. Since the charged backbone of the oligopeptide can be potentially harnessed7–9 to induce its folding on the surface upon an application of an electrical potential, we reasoned that such conformational changes can be employed to selectively expose under open circuit (OC) conditions (bio-active state) or conceal under negative potential (bio-inactive state) the RGD to the cell and dynamically regulate cell adhesion.

 rdg-oligopeptide-sam-utilised-for-controlling-specific-cellular-interactions-c4cc06649a


rdg-oligopeptide-sam-utilised-for-controlling-specific-cellular-interactions-c4cc06649a

RDG oligopeptide SAM utilised for controlling specific cellular interactions

http://www.ncbi.nlm.nih.gov/pmc/articles/PMC4230383/bin/c4cc06649a-f1.jpg

Fig. 1 Schematic of the dynamic RDG oligopeptide SAM utilised for controlling specific cellular interactions. The electrically switchable SAM exposes the RGD peptide and supports cell adhesion under open circuit (OC) conditions (no applied potential), while …

Mixed SAMs of C3K-GRGDS : C11TEG were formed from a solution ratio of 1 : 40 and characterised by X-ray photoelectron spectroscopy (XPS) (Fig. S2, ESI†). XPS analysis confirmed the formation of the C3K-GRGDS:C11TEG mixed monolayer and displayed signals from S, N, C and O. The chemical state of the sulphur atom was probed using the XPS spectra of the S 2p emission (Fig. S2, ESI†). The S 2p spectrum (Fig. S2a, ESI†) consists of two doublet peaks, with one doublet peak at 162.0 eV (S 2p3/2) and 163.2 eV (S 2p1/2), indicating that the sulphur is chemisorbed on the gold surface.39 A second small doublet peak can be observed at 163.8 eV and 165.0 eV, which can be attributed to the S–H bond, indicating a small presence of unbound sulphur. No sulphur peaks above 166 eV were observed, indicating that no oxidised sulphur is present at the surface. The N 1s spectrum (Fig. S2b, ESI†) can be de-convoluted into two peaks, which support the presence of the peptide on the surface. The first peak centred at 400.5 eV is attributed to amino (NH2) and amide (CONH) moieties. The second peak centred at 402.8 eV is ascribed to protonated amino groups.40 Note that no nitrogen peak was observed for pure C11TEG SAMs. The C 1s spectrum (Fig. S2c, ESI†) can be de-convoluted into three peaks, which are attributed to five different binding environments. The peak at 285.0 eV is attributed to C–C bonds,41 while the peak at 286.7 eV corresponds to C 1s of the three binding environments of C–S, C–N and C–O.41 The third and smaller peak (288.6 eV) is assigned to the C 1s photoelectron of the carbonyl moiety, C O.41 The O 1s spectrum (Fig. S2d, ESI†) is de-convoluted into two different peaks, corresponding to two different binding environments, arising from the C–O (533.3 eV) and C O (532.0 eV) bonds.41 From integrating the area of the S 2 p and N 1s peaks and taking into consideration that the C3K-GRGDS oligopeptide consists of 15 N atoms and 1 S atom and C11TEG has no N and 1 S atom only, it was possible to infer that the ratio of C3K-GRGDS:C11TEG on the surface is 1 : 10 ± 2. The presence of C11TEG was utilised not only to ensure sufficient spatial freedom for molecular reorientation of the surface bound oligopeptide, but also to stop non-specific binding to the surface.

The C3K-GRGDS:C11TEG mixed SAMs were shown to support adhesion of immune macrophage cells as determined by cell counting42,43 (Fig. 2). When RAW 264.7 mouse macrophages were cultured on theC3K-GRGDS:C11TEG mixed SAM in supplemented Dulbecco’s Modified Eagle Medium (DMEM), the number of cells adhered to the surface increased with incubation time, reaching 1792 ± 157 cells per mm2after 24 hours. This is in contrast with the weak cell adhesion observed in two control surfaces, pureC11TEG SAMs and clean gold, in which the number of cells that adhere was 60% and 50% lower, respectively, after 24 hours (Fig. 2).

microscopic-images-and-density-of-adhered-cells-on-c3k-grgds-c11teg-mixed-sam-pure-c11teg-sam-and-bare-gold-surfaces

microscopic-images-and-density-of-adhered-cells-on-c3k-grgds-c11teg-mixed-sam-pure-c11teg-sam-and-bare-gold-surfaces

Microscopic images and density of adhered cells on C3K-GRGDS:C11TEG mixed SAM, pure C11TEG SAM and bare gold surfaces

http://www.ncbi.nlm.nih.gov/pmc/articles/PMC4230383/bin/c4cc06649a-f2.jpg

Fig. 2 Microscopic images and density of adhered cells on C3K-GRGDS:C11TEG mixed SAM, pure C11TEG SAM and bare gold surfaces that were normalized against the density of cells adherent onto the C3K-GRGDS:C11TEG mixed SAM. The surfaces were cultured in RAW 264.7 mouse macrophage cells under OC conditions for 24 hours.

In order to demonstrate that the C3K-GRGDS:C11TEG mixed SAMs can support or resist cell adhesion on demand, the macrophage cells were cultured on the C3K-GRGDS:C11TEG mixed SAM in DMEM medium under OC conditions and applied negative potential (–0.4 V) for a period of 1 h. Note that DMEM contains a mixture of inorganic salts, amino acids, glucose and vitamins. On application of the applied potential of –0.4 V the number of adherent cells was 70% less compared to the C3K-GRGDS:C11TEGmixed SAMs under OC conditions, Fig. 3. Similar switching efficiencies have been observed in another oligopeptide system using different DMEM solutions.44 These findings suggest that the negative potential induces the conformational changes in the C3K moiety of C3K-GRGDS in the SAM which in turn leads to the RGD moiety being concealed and hence reducing the binding of the cells.

density-of-adhered-cells-on-c3k-grgds-c11teg-c11teg-c6eg-grgds-c11teg-mixed-sams-c4cc06649a-f3

density-of-adhered-cells-on-c3k-grgds-c11teg-c11teg-c6eg-grgds-c11teg-mixed-sams-c4cc06649a-f3

Density of adhered cells on C3K-GRGDS:C11TEG, C11TEG, C6EG-GRGDS:C11TEG mixed SAMs

http://www.ncbi.nlm.nih.gov/pmc/articles/PMC4230383/bin/c4cc06649a-f3.jpg

Fig. 3 Density of adhered cells on C3K-GRGDS:C11TEG, C11TEG, C6EG-GRGDS:C11TEG mixed SAMs that were normalized against the density of cells adherent onto the C3K-GRGDS:C11TEG mixed SAM. The surfaces were cultured in RAW 264.7 for 1 h under OC conditions or while applying –0.4 V.

Previous studies have shown that small conformational and orientational changes in proteins and peptides modulate the availability and potency of the active sites for cell surface receptors.45–47 Thus, in a similar manner, small changes in the conformation/orientation of the RGD peptide on the surface induced by application of an electrical potential are able to affect the binding activity of the peptide. Recently, we have conducted detailed theoretical8 and experimental9 studies aimed at understanding the switching mechanism of oligopeptide-based switchable surfaces, that similarly as in the case of the C3K-GRGDS:C11TEG mixed SAMs, use lysine residues to act as the switching unit. These previous studies unraveled that the surface-appended oligolysines undergo conformational changes between fully extended, partially extended and collapsed conformer structures in response to an applied positive potential, open circuit conditions and negative electrical potential, respectively. Thus, these previous findings allow us to propose that when a negative potential is applied to the GRGDS:C11TEG mixed SAM surface, the oligopeptide chain adopts a collapsed conformation on the surface and the RGD binding motif is partially embedded on the C11TEGmatrix, thus showing no bioactivity (“OFF” state).

In order to verify that the changes in adhesion upon application of a negative surface potential occur due to changes in the conformational orientation of the RGD instead of cell repulsion or cell damage due to the presence of an electrical potential, control mixed SAMs were also prepared using C11TEG and a peptide where the 3 lysine residues as the switching unit were replaced by 6 non-switchable ethylene glycol units –C6EG-GRGDS (Fig. S1, ESI†). Fig. 3 demonstrates that cells adhered in similar numbers to the C11TEGand C6EG-GRGDS:C11TEG mixed SAMs under OC conditions and an applied negative potential. These results provide strong evidence that control over cell adhesion using the C3K-GRGDS:C11TEG mixed SAM is due to a conformational behaviour of the lysine-containing oligopeptide that can either expose or conceal the RGD moiety.

Cell viability was checked following application of –0.4 V for 1 h by performing a trypan blue assay. Cells that were dead were stained blue due to a break down in membrane integrity. Incubation of the cells under a negative potential had negligible effect on cell viability, which was greater than 98%. Cyclic voltammetric studies (outlined in detail in the Fig. S3, ESI†) were also performed to demonstrate that no significant faradaic process occur over the potential range studied, and thus ions are not participating in redox reactions and consequently redox chemistry is not being significantly affected by application of the potential used. In agreement with other studies,35,36,48 we conclude that the electrical modulation of the surface neither affected cell viability nor induced any redox process in the medium that could have had an effect on cells.

We then addressed the question of whether the C3K-GRGDS:C11TEG surfaces could be switched between different cell adhesive states (cell-resistant and cell-adhesive states). To begin with, we investigated the switching from a cell-adhesive state to a cell-resistant state, and the possibility to detach the cells from the substrate upon the application of a negative potential. Cells were incubated in the C3K-GRGDS:C11TEGmixed SAMs for 1 h under OC conditions, thereby exposing the RGD moiety and allowing for cell attachment. This step was followed by the application of a potential of –0.4 V for 1 h in order to detach the cells from the surface, by concealing the RGD moieties. Cell counts showed no significant differences between the pre and post application of the –0.4 V, suggesting that the electrostatic force generated by the applied negative electrical potential might not be sufficient to disrupt the RGD–integrin interaction. These results were to a certain extent expected since adherent cells are able to withstand strong detachment forces due to the adhesion being mediated by multiple RGD–integrin bonds in parallel.49

In contrast, a reversal of the switching sequence demonstrated that our surfaces can be dynamically switched from a non-adhesive to cell-adhesive state. Cells were incubated in the C3K-GRGDS:C11TEG mixed SAMs for 1 h while holding the potential at –0.4 V for 1 h making the RGD peptide inaccessible for recognition by the corresponding integrin. As above, the number of adherent cells when a negative potential of –0.4 V was applied was 70% of the number that adhered to the C3K-GRGDS:C11TEG mixed SAMs under OC conditions, Fig. 4. The potential was then shifted to open circuit conditions for 1 h on those exposed to a potential of –0.4 V, which resulted in a significant increase in the number of cells as a result of the exposure of the RGD moiety to the cells (Fig. 4). These values were similar to those obtained for the samples that were only incubated for 1 hour under OC conditions (Fig. 4), indicating that the surfaces were highly effective at switching from a non-adhesive to cell-adhesive state.

microscopic-images-and-density-of-adhered-cells-on-c3k-grgds-c11teg-mixed-sams-c4cc06649a-f4

microscopic-images-and-density-of-adhered-cells-on-c3k-grgds-c11teg-mixed-sams-c4cc06649a-f4

Microscopic images and density of adhered cells on C3K-GRGDS:C11TEG mixed SAMs

http://www.ncbi.nlm.nih.gov/pmc/articles/PMC4230383/bin/c4cc06649a-f4.jpg

Fig. 4  Microscopic images and density of adhered cells on C3K-GRGDS:C11TEG mixed SAMs that were incubated with cells for 1 h while applying –0.4 V and subsequently in OC conditions for 1 h. The density was normalized against the density of cells adherent onto C3K-GRGDS:C11TEG mixed SAMs that were incubated with cells in OC conditions for 1 h.

In summary, an electrically switchable surface has been devised and fabricated that is capable of efficiently exposing and concealing the RGD cell adhesion motif and dynamically regulate the adhesion of immune macrophage cells. This study will no doubt be useful in developing more realistic dynamic extracellular matrix models and is certainly applicable in a wide variety of biological and medical applications. For instance, macrophage cell adhesion to surfaces plays a key role in mediating immune response to foreign materials.50 Thus, development of such dynamic in vitro model systems that can control macrophage cell adhesion on demand are likely to provide new opportunities to understand adhesion signaling in macrophages51 and develop effective approaches for prolonging the life-span of implantable medical devices and other biomaterials.52

11.1.2 The metabolic state of cancer stem cells—a target for cancer therapy

Vlashi E1, Pajonk F2.
Free Radic Biol Med. 2015 Feb; 79:264-8
http://dx.doi.org:/10.1016/j.freeradbiomed.2014.10.732

Highlights

  • Bulk tumor cell populations rely on aerobic glycolysis.
  • Cancer stem cells are in a specific metabolic state.
  • Cancer stem cells in breast cancer, glioblastoma, and leukemia rely on oxidative phosphorylation of glucose.

In the 1920s Otto Warburg first described high glucose uptake, aerobic glycolysis, and high lactate production in tumors. Since then high glucose uptake has been utilized in the development of PET imaging for cancer. However, despite a deepened understanding of the molecular underpinnings of glucose metabolism in cancer, this fundamental difference between normal and malignant tissue has yet to be employed in targeted cancer therapy in the clinic. In this review, we highlight attempts in the recent literature to target cancer cell metabolism and elaborate on the challenges and controversies of these strategies in general and in the context of tumor cell heterogeneity in cancer.


11.1.3 Regulation of tissue morphogenesis by endothelial cell-derived signals

Saravana K. Ramasamy, Anjali P. Kusumbe, Ralf H. Adams
Trends Cell Biol  Mar 2015; 25(3):148–157
http://dx.doi.org/10.1016/j.tcb.2014.11.007

Highlights

  • Endothelial cells lining blood vessels induce organ formation and other morphogenetic processes in the embryo.
  • Blood vessels are also an important source of paracrine (angiocrine) signals acting on other cell types in organ regeneration.
  • Vascular niches and endothelial cell-derived signals generate microenvironments for stem and progenitor cells.

Endothelial cells (ECs) form an extensive network of blood vessels that has numerous essential functions in the vertebrate body. In addition to their well-established role as a versatile transport network, blood vessels can induce organ formation or direct growth and differentiation processes by providing signals in a paracrine (angiocrine) fashion. Tissue repair also requires the local restoration of vasculature. ECs are emerging as important signaling centers that coordinate regeneration and help to prevent deregulated, disease-promoting processes. Vascular cells are also part of stem cell niches and have key roles in hematopoiesis, bone formation, and neurogenesis. Here, we review these newly identified roles of ECs in the regulation of organ morphogenesis, maintenance, and regeneration.

http://ars.els-cdn.com/content/image/1-s2.0-S0962892414002104-gr1.sml

Figure 1. Role of endothelial cells (ECs) during organogenesis

http://ars.els-cdn.com/content/image/1-s2.0-S0962892414002104-gr2.sml

Figure 2. Endothelial cells (ECs) in lung regeneration

http://ars.els-cdn.com/content/image/1-s2.0-S0962892414002104-gr3.sml

Figure 3. Liver endothelium in regeneration and fibrosis.

Vascular cells have key roles in morphogenesis and regeneration

Vascular cells have key roles in morphogenesis and regeneration

http://ars.els-cdn.com/content/image/1-s2.0-S0962892414002104-gr4.sml

Figure 4. Functional roles of the bone vasculature

http://ars.els-cdn.com/content/image/1-s2.0-S0962892414002104-gr5.sml

Figure 5. Vascular niche for neurogenesis.

Concluding remarks

The examples provided in this review highlight the important roles of ECs in tissue development, patterning, homeostasis, and regeneration. The endothelium often takes a central position in these processes and there are many reasons why ECs are ideally positioned as the source of important instructive, angiocrine signals. The vascular transport network extends into every organ system and needs to be embedded in those tissues in a certain spacing or pattern, which places ECs in central and, therefore, strategic positions for the regulation of morphogenesis and organ homeostasis.

Given that ECs and other cell types frequently form functional units, such as kidney glomeruli, liver lobules, or lung alveoli, the assembly, differentiation, and function of the different cellular components needs to be tightly coordinated. In addition, because circulating blood cells extensively rely on the vascular conduit system and frequently interact with the endothelium, it is perhaps not surprising that ECs contribute to niche microenvironments. During tissue repair, proliferative cell expansion processes are sometimes temporally separated from cell differentiation and tissue patterning events. The latter has to involve the restoration of a fully functional vascular network so that ECs appear ideally suited as the source of molecular signals that can trigger or suppress processes in the surrounding tissue.


11.1.4 Novel approach to bis(indolyl)methanes. De novo synthesis of 1-hydroxyimino-methyl derivatives with anti-cancer properties

Grasso C, et al.
Eur J Medicinal Chem 01/2015; 93:9-15.
http://dx.doi.org:/10.1016/j.ejmech.2015.01.050

A versatile and broad range approach to previously unknown bis(indolyl)methane oximes based on two consecutive hetero Diels-Alder cycloaddition reactions of electrophilic conjugated nitrosoalkenes with indoles is disclosed. The cytotoxic properties and selectivity of some adducts against several human cancer cell lines pointing to a promising role in the development of anti-tumoural drugs, in particular for leukemia and lymphoma.

Novel approach to bis(indolyl)methanes: De novo synthesis of 1-hydroxyiminomethyl derivatives with anti-cancer properties. Available from:
https://www.researchgate.net/publication/271525370

_Novel_approach_to_bis-28indolyl-29methanes_De_novo_synthesis_of_1-hydroxyiminomethyl_ derivatives_with_anti-cancer_properties [accessed Apr 11, 2015].

The one-pot synthetic strategy to bis(indolyl)methanes is outlined in Scheme 3. The starting a,a 0-dihalogenooximes 3 were efficiently prepared from the respective ketones by known procedures [58,61]. These compounds, in the presence of base, were converted, in situ, into the corresponding transient and reactive nitrosoalkenes 4, which were intercepted bya first molecule of the appropriate indole 5 originating the intermediate indole oximes 6. The initially formed tetrahydroxazines undergo ring-opening to the corresponding oximes, under the driving force of the energy gain on rearomatisation. Subsequent dehydro-halogenation of 6 produces nitrosoalkenes 7 which reacted with a second molecule of indole, producing the target bis(indolyl)methanes 8. The results obtained are summarised in Table 1.

The reaction yields may be considered generally good, taking into account that the synthetic process involves a sequence of reactions. On the other hand, no other products could be obtained, which indicates that the reactions were regioselective. The results have shown also that both alkyl and aryl oximes can be used in the synthesis of bis(indolyl)methanes. Starting from aryl oximes 3aef the expected (E) oximes 9 were obtained as single or major products (Entries 1e11) whereas alkyl oxime 3g reacted with indole to give the (Z)-oxime 10g as the major product (Entries 12e13). The stereochemistry assignment of oximes 9 and 10 was confirmed by analysis of the NOESY spectra of 9d, 9g, 10d and 10g. In the spectra of 10d and 10g, connectivity was observed between the hydroxyl proton and the phenyl protons and the methyl protons, respectively, whereas in the case of 9d and 9g no connectivity was observed. Moreover, oximes 9 and 10 are also characterized by 1H NMR spectra with different features. The chemical shift of the methylenic proton appears at higher value for (E)-oximes 9 (9b: δ  6.81 ppm; 9d: δ  = 6.82 ppm; 9g: δ = 6.39 ppm) than for the corresponding (Z) oximes 10 (10b: δ = 5.74 ppm; 10d: δ = 5.77 ppm; 10g: δ = 5.41 ppm).

The synthesis of two isomeric oximes from the reaction of arylnitrosoethylenes with pyrrole and dipyrromethanes has been previously observed [62]. The process was rationalized considering the conjugate addition of the heterocycle to the nitrosoalkene, at the s-cis or s-trans conformation, followed by rearomatization of the pyrrole unit leading to (E)- and (Z)-oxime, respectively. Thus, the synthesis of the BIM oximes via 1,4-conjugate addition of indole to the nitrosoelkene cannot be ruled out.

The use of water as solvent in Diels- Alder reactions has been shown to be advantageous, not only in environmental terms but also inducing critical improvements in reaction times, yields and selectivity [51,63]. We observed that carrying out the synthesis of bis(indolyl)methanes in water using dichloromethane as co-solvent is a valuable alternative to the use of dichloromethane as the only solvent. Generally the yields were better or comparable to those obtained in dichloromethane and reaction time significantly shorter (the reaction time was reduced from 36 h to 3 h). Clearly the efficiency of the reaction, using H2O/CH2Cl2 system, amongst the nitrosoalkenes bearing halogenated aryl substituents increases in the order F > Cl > Br > H the order of electron withdrawing ability and consequently the order of the expected effectiveness for an inverse electron demand Diels-Alder reaction (entries 2, 5, 7 and 9). However, the isolated yields from the reaction carried out in CH2Cl2 do not reflect the expected reactivity, which can be explained considering differences in the efficiency of the purification process.

The cytotoxicity of compounds 9a, 9e and 9d was evaluated in different tumorl cell lines, namely HepG2 (hepatocellular carcinoma), MDA-MB-468 (human breast carcinoma), RAW 264.7 (murine leukemic monocyte macrophages), THP1 (human acute monocytic leukaemia), U937 (human leukaemic monocytic lymphoma) and EL4 cells (murine T-lymphoma). The compounds’ selectivity towards tumoural cells was assessed determining their cytotoxicity with respect to two non-tumoural derived cell lines S17 (murine bone marrow) and N9 cells (murine microglial). Results of the half maximal concentrations (IC50) are shown in Table 2 together with the toxicity of etoposide, a known antitumoural drug. Compound 9e was considerably less cytotoxic on tumor cell lines than the other two compounds, with IC50 values ranging from 35.7 (HepG2) to 124 mM (THP1) and was not selective. Compounds 9a and 9d, however, were considerably cytotoxic to all cells tested, with IC50 values ranging from 1.62 (THP1) to 23.9 mM (RAW) and from 10.7 (MDA) to 34.1 mM (U937), respectively. Compound 9a was particularly active against non-adherent cell lines with IC50 values ranging from 1.62 in THP1 to 1.65 mM in EL4.

Some conclusions regarding structure activity relationships can be redrawn based on the biological evaluation of these bis(indolyl)methanes. There is a dramatic difference in anticancer activitybetweenN-unsubstituted bis(indolyl)methanes 9a and the Nmethyl substituted derivative 9e, the latter characterized by high IC50 values. On the other hand, the significantly lower IC50 values observed for 9a for non-adherent cell lines in comparisonwith the ones obtained for 9d demonstrates that the presence of the bromo substituent leads to higher cytotoxic activity.

The observed high cytotoxicity of compound 9a against THP1, EL4 and U937 cell lines led us to extend the study to BIMs 9c, 9g and 10g (Table 3). Compound 9c, bearing a 4-fluorophenyl substituent, showed moderate anti-cancer activity which reinforces the observation that the 4-bromophenyl group is crucial to ensure low IC50 values. On the other hand, alkyl oximes 9g and 10g were even less cytotoxic against THP1, EL4 and U937 cell lines. None of these compounds were selective towards the tumor cell lines (selectivity index calculated for non-tumour cell line S17). In addition to having displayed higher toxicity towards the nontumor cell lines than all the studied compounds, compound 9a demonstrated the highest selectivity indexes: 9.86-14.2. Further studies using 9a as scaffold in the development of anti-tumoural drugs for leukaemia and lymphoma is worth pursuing since it presents lower IC50 and higher selectivity than etoposide.

Conclusions

The reliable preparation of a variety of unknown BIMs bearing different oxime substituents at the methylene bridge was presented. This strategy, supported on the robust and proved methodology of Diels-Alder cyclo addition reactions of electrophilic nitrosoalkenes with electron rich indoles, may pave the way for the synthesis of a vast library of new compounds.

Table 1 Preparation of bis(indolyl)methane oxime

Scheme 1. Selected biological active bis(indolyl)methanes.

Scheme 2. Common methods for BIMs’ preparation [27e44].

Scheme 3. Synthetic strategy towards BIM oximes.

Synthesis of a new bis(indolyl)methane that inhibits growth and induces apoptosis in human prostate cancer cells

Marrelli M., et al.
Natural product research 08/2013; 27(21).
http://dx.doi.org:/10.1080/14786419.2013.824440

The synthesis and the antiproliferative activity against the human breast MCF-7, SkBr3 and the prostate LNCaP cancer cell lines of a series of bis(indolyl)methane derivatives are reported. The synthesis of new compounds was first accomplished by the reaction of different indoles with trimethoxyacetophenone in the presence of catalytic amounts of hydrochloric acid. A second procedure involving the use of oxalic acid dihydrate [(CO2H)2·2H2O] and N-cetyl-N,N,N-trimethylammonium bromide in water was carried out and led to better yields. Compound 5b significantly reduced LNCaP prostate cancer cell viability in a dose-dependent manner, with an IC50 of 0.64 ± 0.09 μM. To determine whether the growth inhibition was associated with the induction of apoptosis, treated cells were stained using DAPI. LNCaP cells treated with 1 μM of 5b showed the morphological changes characteristic of apoptosis after 24 h of incubation.

11.1.5 Synthesis and Biological Evaluation of New 1,3-Thiazolidine-4-one Derivatives of 2-(4-Isobutylphenyl)propionic Acid molecules

Vasincu IM1, Apotrosoaei M2, Panzariu AT3, Buron F4, Routier S5, Profire L6
Molecules. 2014 Sep 18; 19(9):15005-25
http://dx.doi.org/10.3390/molecules190915005

New thiazolidine-4-one derivatives of 2-(4-isobutylphenyl)propionic acid (ibuprofen) have been synthesized as potential anti-inflammatory drugs. The structure of the new compounds was proved using spectral methods (FR-IR, 1H-NMR, 13C-NMR, MS). The in vitro antioxidant potential of the synthesized compounds was evaluated according to the total antioxidant activity, the DPPH and ABTS radical scavenging assays. Reactive oxygen species (ROS) and free radicals are considered to be involved in many pathological events like diabetes mellitus, neurodegenerative diseases, cancer, infections and more recently, in inflammation. It is known that overproduction of free radicals may initiate and amplify the inflammatory process via upregulation of genes involved in the production of proinflammatory cytokines and adhesion molecules. The chemical modulation of acyl hydrazones of ibuprofen 3a–l through cyclization to the corresponding thiazolidine-4-ones 4a–n led to increased antioxidant potential, as all thiazolidine-4-ones were more active than their parent acyl hydrazones and also ibuprofen. The most active compounds are the thiazolidine-4-ones 4e, m, which showed the highest DPPH radical scavenging ability, their activity being comparable with vitamin E.

In order to improve the anti-inflammatory effect and safety profile of representative NSAIDs, one research strategy is derivatization of the carboxylic acid group with various heterocyclic systems (oxazole, izoxazole, pyrazole, oxadiazole, thiazole, thiadiazole, triazole, etc.) [9,10]. In the past two decades there has been considerable interest in the role of reactive oxygen species (ROS) in inflammation [11]. ROS mediate the oxidative degradation of cellular components and alteration of protease/antiprotease balance with damage to the corresponding tissue. In the early stages of the inflammatory process, ROS exert their actions through activation of nuclear factors, such as NFkB or AP-1, that induce the synthesis of cytokines. In later stages, endothelial cells are activated due to the synergy between free radicals and cytokines, promoting the synthesis of inflammatory mediators and adhesion of molecules. In the last step free radicals react with different cellular components (trypsin, collagen, LDL, DNA, lipids) inducing the death of cells [12,13].

The thiazolidine-4-one moiety is a heterocycle that has received more attention in the last years due its important biological properties [14]. Many effects have been found, including anti-inflammatory and analgesic [15], antitubercular [16], antimicrobial and antifungal [17], antiviral, especially as anti-HIV agents [18], anticancer, antioxidants [19], anticonvulsants [20] and antidiabetic activity [21]. In the present study, some new derivatives of ibuprofen that contain thiazolidine-4-one scaffolds were synthesized in order to obtain compounds with double effect—antioxidant and anti-inflammatory properties. The structures of the compounds were assigned based on their spectral data (FT-IR, 1H-NMR, 13C-NMR, MS) and the compounds were screened for their in vitro antioxidant potential.

The 1,3-thiazolidine-4-one derivatives 4a–m were synthesized in several steps using the method summarized in Scheme 1 and Table 1. First 2-(4-isobutylphenyl)propionic acid (ibuprofen, 1) was reacted with thionyl chloride, followed by treatment with dry ethanol to get 2-(4-isobutylphenyl)propionic acid ethyl ester, which was turned in 2-(4-isobutylphenyl)propionic acid hydrazide (2) by reaction with 66% hydrazine hydrate [22]. The condensation of compound 2 with various aromatic aldehydes allowed the preparation of the corresponding hydrazone derivatives 3a–l in satisfactory yields. Finally, the hydrazone derivatives of ibuprofen upon reaction with mercaptoacetic acid led to the thiazolidine-4-one derivatives 4a–l in moderate to good yields. By reduction of compound 4g in presence of tin chloride and few drops of acetic acid in ethanol, the thiazolidine-4-one 4m was obtained in 90% yield. Acetylation of 4m with acetyl chloride gave thiazolidine-4-one 4n in moderate yield.

In the acyl hydrazone series most of the the tested compounds showed a radical scavenging ability comparable with ibuprofen (Table 4). The most active compounds were 3e and 3f which are about three times and two times more active than their parent compound, respectively. The scavenging ability of the acyl hydrazones was improved by cyclization to the corresponding thiazolidine-4-one derivatives, these compounds all being more active than ibuprofen, except for compound 4j which contains a CF3 group in the metaposition of phenyl ring (Table 5). The most active compounds were 4e and 4m which contain NO2 and NH2 groups in ortho and paraposition of the phenyl ring, respectively. For these compounds the radical scavenging ability (%) was 94.42 ± 0.43 and 94.88 ± 0.57, which means that the compounds are about 23 times more active than ibuprofen (4.15 ± 0.22). The activity of these compounds is comparable with that of vitamin E used as positive control. Important radical scavenging ability was also shown by compound 4b(81.31 ± 0.55), which contains a Cl group in the para position of the phenyl ring, the compound being 20 times more active than ibuprofen.

The acyl hydrazone derivatives showed an antioxidant activity comparable with ibuprofen. The most active compound in this series was 3h, with radical scavenging activity of 13.31 ± 0.81, which means that this compound is three times more active than ibuprofen (4.42 ± 0.18). In the thiazolidine-4-one series the most active compounds were 4b, 4e and 4k, which contain Cl(4), NO2(2) and CN(4), respectively, as substituents on the phenyl ring. These compounds, which showed a scavenging ability of around 50%, are 12 times more active than ibuprofen. In comparison with the corresponding acyl hydrazones 3b, 3e and 3k the thiazolidine-4-ones were 10 times (4b), seven times (4e) and 13 times (3k) more active. The improved antiradical activity of acyl hydrazones by cyclization to form thiazolidine-4-ones was also observed for compounds 3d, 3f and 3g. The most favorable influence was observed for acyl hydrazone 4g, which contains a NO2 in the para position of the phenyl ring. The corresponding thiazolidine-4-one (4g, 37.14 ± 1.10) is 22 times more active than 3g (1.67 ± 0.35). These data strongly support the favorable influence of the thiazolidine-4-one ring on the antioxidant potential of these compounds. The tested compounds were less active than vitamin E.

In this study new heterocyclic compounds that combine the thiazolidine-4-one structure with the arylpropionic acid one have been synthesized. The structure of the new compounds was proved using spectral methods (IR, 1H-NMR, 13C-NMR, MS). The compounds were evaluated for their antioxidant effects using in vitro assays: total antioxidant activity, DPPH and ABTS radical scavenging ability. All thiazolidin-4-one derivatives 4a–n showed improved antioxidant effects in comparison with the corresponding acyl hydrazones 3a–l and ibuprofen, the parent compound. The encouraging preliminary results illustrate the antioxidant potential of the synthesized compounds and motivate our next research focused on their anti-inflammatory effects in chronic and acute inflammation models.

11.1.6 Targeting pyruvate kinase M2 contributes to radiosensitivity of NSCLC cells

Meng MB1, Wang HH2, Guo WH3, Wu ZQ2, Zeng XL2, Zaorsky NG4, et al.
Cancer Lett. 2015 Jan 28; 356(2 Pt B):985-93
http://dx.doi.org:/10.1016/j.canlet.2014.11.016

Aerobic glycolysis, a metabolic hallmark of cancer, is associated with radioresistance in non-small cell lung cancer (NSCLC). Pyruvate kinase M2 isoform (PKM2), a key regulator of glycolysis, is expressed exclusively in cancers. However, the impact of PKM2 silencing on the radiosensitivity of NSCLC has not been explored. Here, we show a plasmid of shRNA-PKM2 for expressing a short hairpin RNA targeting PKM2 (pshRNA-PKM2) and demonstrate that treatment with pshRNA-PKM2 effectively inhibits PKM2 expression in NSCLC cell lines and xenografts. Silencing of PKM2 expression enhanced ionizing radiation (IR)-induced apoptosis and autophagy in vitro and in vivo, accompanied by inhibiting AKT and PDK1 phosphorylation, but enhanced ERK and GSK3β phosphorylation. These results demonstrated that knockdown of PKM2 expression enhances the radiosensitivity of NSCLC cell lines and xenografts as well as may aid in the design of new therapies for the treatment of NSCLC.

Knockdown of PKM2 expression increases the sensitivity of NSCLC cells to radiotherapy in vitro

To examine PKM2 expressions levels in the normal lung epithelial cell and the NSCLC cell lines, we evaluated the expression levels of PKM2 in normal lung bronchial epithelial cell BEAS-2B and five NSCLC cell lines including A549, H460, H1299, H292, and H520 by Western blotting assays, and our results demonstrated that PKM2 expression was elevated in almost five NSCLC cell lines examined compared to autologous normal lung bronchial epithelial cell, although the expression levels fluctuated slightly depending on the different cell lines (Fig.1A). To test the role of PKM2 in the sensitivity of NSCLC to radiotherapy, we generated plasmids of pshRNA-PKM2 and control pshRNA-Con by inserting the DNA fragment for a pshRNA specifically targeting the PKM2 or control into the pGenesil2 vector. After demonstrating the authenticity, A549 and H460 cells were transfected with the plasmid for 48h and the levels of PKM2 expression were tested by Western blot assays. Obviously, transfection with control plasmid did not significantly modulate PKM2 expression; while transfection with pshRNA-PKM2 reduced the levels of PKM2 expression (Fig.1B and Appendix: Supplementary Fig.S1A). Quantitative analysis revealed that transfection with pshRNA-PKM2 significantly reduced PKM2 expressions as compared with that in the mock-treated and control pshRNA-Con plasmid-transfected cells, respectively (p<0.05, Fig.1C). Mock-treated and pshRNA-PKM2-trasnfected A549 and H460 cells were subjected to IR (4Gy), and 12 and 24h after IR, these cells, together with un-irradiated mock-treated, pshRNA-Con-transfected, and pshRNA-PKM2-trasnfected cells, were tested for cell viability by trypan blue staining. Knockdown of PKM2 reduced the percentage of A549 viable cells by 12.6–20% and IR treatment decreased the frequency of viable cells by 17.1–28.2%. However, the percentages of viable cells in the PKM2-silencing and irradiated cells were reduced by 27.7–48.7%, which were significantly lower than that in other groups (Fig.1D, p<0.05). Furthermore, it was consistent with the above results of A549 cells that knockdown of PKM2 significantly reduced the percentage of H460 viable cells (Appendix: Supplementary Fig.S1B). In addition, to further validate PKM2 silencing on their radiosensitivity,unirradiated control, mock-treated, and pshRNA-PKM2 transfected A549 cells were subjected to IR (0, 2, 4, 6, and 8Gy), and two weeks after IR, these cells were tested for the capacity for colony formation. The results showed that the numbers of colonies formed by pshRNA-PKM2 cells were significantly decreased compared with that of mock-treated and control cells; however, there was no significant change in mock-treated cells compared with control cells. These results suggested that pshRNA-PKM2 cells were more sensitive to IR than mock-treated and control cells (Fig.1E and F). Given that IR usually causes DNA double-strand breaks [28], we characterized the frequency of γ-H2AX nuclear foci positive cells by immunofluorescent assays. While IR treatment dramatically increased the frequency of γ-H2AX+ cells, the same dose of IR further significantly increased the percentages of γ-H2AX+ cells when combined with PKM2 silencing at 12 and 24h after IR, and there was a significant difference in γ-H2AX+ cells between these two groups at 12 and 24 h after IR (Fig. 1G and H, p < 0.05).

Fig. 1. The PKM2 expression levels in the normal lung epithelial cell and the NSCLC cell lines and knockdown of PKM2 expression enhance the radiosensitivity of A549 cells in vitro. The expression levels of PKM2 in normal lung bronchial epithelial cell BEAS-2B and five NSCLC cell lines including A549, H460, H1299, H292, and H520 were determined by Western blotting assay (A). A549 cells were transfected with pshRNA-PKM2 or pshRNA-Con plasmid for 48h, and the levels of PKM2 expression were determined by Western blot assays using a PKM2-specific antibody and β-actin as an internal control (B and C). Data are representative images or expressed as mean±SD of the relative levels of PKM2 to control β-actin in individual groups of cells from three separate experiments. # p

Knockdown of PKM2 enhances IR-induced apoptosis in NSCLC cells

Next, we tested the impact of PKM2-silencing on IR-induced cell death types. One day after IR, the apoptotic cells in the irradiatedmock-treated,pshRNA-PKM2-trasnfected cells, and one group of cells that had been pre-treated with 30μM Z-VAD for 1h prior to IR, together with mock-treated, unirradiated pshRNA-Contransfected, and pshRNA-PKM2-trasnfected groups of cells were characterized by TUNEL assays and/or FACS analysis (Fig.2A and C). In comparison with that in mock-treated and control plasmid transfected cells, the frequency of apoptotic cells in the PKM2 silencing or IR-treated cells increased moderately, while the percentages of apoptotic cells in the cells receiving combined treatment with IR and PKM2-silencing were significantly greater. However, the frequency of apoptotic cells in the Z-VAD-pretreated cells was partially reduced. Apparently, knockdown of PKM2 and IR induced apoptosis in NSCLC cells in vitro (Fig. 2B and D, and Appendix: Supplementary Fig.S1C).

Fig. 2. Knockdown of PKM2 expression enhances IR-induced apoptosis in A549 cells. A549 cells were transfected with, or without, pshRNA-Con or pshRNA-PKM2 for 48h and treated with, or without, Z-VAD for 1h. Subsequently, the cells were subjected to IR, and 24h later, the frequency of apoptotic cells was determined by TUNEL assays and FACS. (A and C) TUNEL and FACS analyses of apoptotic cells. (B and D) Quantitative analysis of the percentage of apoptotic cells. Data are representative images or expressed as mean%±SD of individual groups of cells from three independent experiments. * p

Knockdown of PKM2 enhances IR-induced autophagy in NSCLC cells

The cell autophagy is characterized by the formation of numerous autophagic vacuoles, autophagosome, in the cytoplasm and elevated levels of the microtubule-associated protein 1 light chain 3 (LC3)-II [29]. To test the impact of PKM2 silencing on IR-induced autophagy, the presence of autophagosome in mock-treated, pshRNACon-transfected, pshRNA-PKM2-transfected, IR-treated alone, IR + pshRNA-PKM2-transfected, and 1 mM 3-MA-pretreated IR + pshRNA-PKM2-transfected cells was characterized by electronic microphotography (EM). Intriguingly and importantly, numerous autophagosomes were detected in the IR + pshRNAPKM2-transfected cells, and only a few were detected in the sensitivity of the NSCLC cells to radiotherapy in vitro. It was noted that pshRNA-Con had almost no effect on A549 cells, therefore, some subsequently experiments did not set this group.

Fig. 3. Knockdown of PKM2 and IR induce A549 cell autophagy. A549 cells were transfected with, or without, pshRNA-Con or pshRNA-PKM2 for 48h and treated with, or without, 3-MA for 1h. Subsequently, the cells were subjected to IR, and 2h later, the presence of autophagic vacuoles and autolysosomes in A549 cells was determined by EM and the relative levels of LC3-I, LC3-II, AKT, ERK1/2, and control β-actin expression and AKT, ERK1/2, GSK3β, PDK1 phosphorylation were determined by Western blot assays using specific antibodies. Data are representative images and expressed as mean values of the relative levels of target protein to control in individual groups of cells from three separate experiments. The relative levels of target protein to control in mock-treated cells were designated as 1. (A) EM analysis of autophagic vacuoles and autophagosomes. Black arrows point to autophagic vacuoles and autophagosomes in the cytoplasma of A549 cells. (B) Western blot analysis of LC3-I and LC3-II expression. The values indicate the ratios of the relative levels of LC3-II to LC3-I in individual groups. (C) Western blotting analysis of individual signal events. The values indicate the relative levels of target protein to control β-actin in individual groups of cell

Fig. 4. The impact of 3-MA or/and V-ZAD on cell viability, colony formation, apoptosis and autophagy in A549 cells. A549 cells were transfected with, or without, pshRNACon or pshRNA-PKM2 for 48h and pre-treated with, or without, 3-MA or V-ZAD for 1h, respectively. Subsequently, the cells were subjected to IR. Twenty-four hours later and two weeks, the viability, apoptosis, and colony formation were determined. Two hours after treatment, autophagy and the relative levels of LC3-I and LC3-II expression in different groups of cells were determined. Data are representative images and expressed as mean%±SD of individual groups of cells from three separate experiments. (A) The percentages of viable cells. (B) The capacity of cell colony formation. (C) Quantitative analysis of apoptotic cells. (D) Western blot analysis of LC3-I and LC3-II expression. The values indicate the ratios of LC3-II to LC3-I in individual groups of cells. * p

Fig. 5. Treatment with pshRNA-PKM2 enhances the IR-inhibited growth of implanted tumors in mice. The nude mice were inoculated with A549 cells and when the tumor grew at 50mm3 in one dimension, the mice were randomized and treated with vehicle (PS), plasmid of pshRNA-Con or pshRNA-PKM2 alone or IR (4Gy×7f) alone or in combination with pshRNA-PKM2 and IR, respectively. The body weights and tumor growths of individual mice were monitored longitudinally. At the end of the in vivo experiment, the tumor tissues were dissected out and the frequency of apoptotic cells, the presence of autophagosomes and the expression of PKM2 were determined by TUNEL, EM and immunohistochemistry, respectively. Data are representative images or expressed as mean±SD of individual groups of mice (n=6 per group). (A) The body weights of mice. (B and C) The tumor growth curve of implanted tumors and the log-transformed tumor growth curve of implanted tumors in mice. (D) Quantitative analysis of the frequency of apoptotic cells.(E) EM analysis of autophagy. (F)The expression of PKM2.(G) Quantitative analysis of PKM2 expression.The cells with brown cytoplasma were considered as positive anti-PKM2 staining and the percentage of PKM2-positive cells was obtained by dividing the numbers of the PKM2-positive cells by the total number of cancer cells in the same field.

11.1.7 The tyrosine kinase inhibitor nilotinib has antineoplastic activity in prostate cancer cells but up-regulates the ERK survival signal—Implications for targeted therapies

Schneider M1, Korzeniewski N2, Merkle K2, Schüler J, et al.
Urol Oncol. 2015 Feb; 33(2):72.e1-7
http://dx.doi.org:/10.1016/j.urolonc.2014.06.001

Background: Novel therapeutic options beyond hormone ablation and chemotherapy are urgently needed for patients with advanced prostate cancer. Tyrosine kinase inhibitors (TKIs) are an attractive option as advanced prostate cancers show a highly altered phosphotyrosine proteome. However, despite favorable initial clinical results, the combination of the TKI dasatinib with docetaxel did not result in improved patient survival for reasons that are not known in detail. Methods: The National Cancer Institute-Approved Oncology Drug Set II was used in a phenotypic drug screen to identify novel compounds with antineoplastic activity in prostate cancer cells. Validation experiments were carried out in vitro and in vivo. Results: We identified the TKI nilotinib as a novel compound with antineoplastic activity in hormone-refractory prostate cancer cells. However, further analyses revealed that treatment with nilotinib was associated with a significant up-regulation of the phospho-extracellular-signal-regulated kinases (ERK) survival signal. ERK blockade alone led to a significant antitumoral effect and enhanced the cytotoxicity of nilotinib when used in combination. Conclusions: Our findings underscore that TKIs, such as nilotinib, have antitumoral activity in prostate cancer cells but that survival signals, such as ERK up-regulation, may mitigate their effectiveness. ERK blockade alone or in combination with TKIs may represent a promising therapeutic strategy in advanced prostate cancer.

Identification of nilotinib as a novel antineoplastic compound in prostate cancer cells

Using the NCI-Approved Oncology Drug Panel II for a phenotypic drug screen of normal prostate epithelial cells and prostate cancer cell lines (Fig. 1) [7], we identified the TKI nilotinib as a positive hit in hormone-refractory DU-145 prostate cancer cells.

Fig. 1. Discovery of nilotinib as a novel antineoplastic agent in prostate cancer cells using a phenotypic drug screen. Overview of the drug screen procedure (see text for details).

Results were confirmed using annexin V staining, which showed a significant induction of apoptosis beginning at 24 hours (Fig. 2A). The IC50 of nilotinib against DU-145 cells was determined at 10 μM using an MTT cell viability assay (Fig. 2B). Immunoblot experiments confirmed an induction of apoptosis using PARP cleavage in DU-145 cells and in hormonerefractory PC-3 prostate cancer cells at this drug concentration (Fig. 2C). An onset of apoptosis at 24 hours was likewise confirmed using PARP cleavage at a nilotinib concentration of 10 μM(Fig. 2D). PWR-1E prostate epithelial cells and hormone-sensitive prostate LNCaP prostate cancer cells were not found to undergo enhanced apoptosis when treated with nilotinib (not shown).

Fig. 2. Antitumoral effects of nilotinib in prostate cancer cells: (A) flow cytometric analysis of DU-145 prostate cancer cells for annexin V to detect apoptotic cells after treatment with 10 μM of nilotinib for the indicated intervals; (B) cell viability (MTT) assay to determine the IC50 of nilotinib in DU-145 cells (24-h treatment); (C and D) immunoblot analysis of DU-145 and PC-3 prostate cancer cells for PARP cleavage (arrow) at nilotinib concentrations and time intervals as indicated. GAPDH is shown for protein loading; and (E) colony growth assay of DU-145 cells after drug treatment and washout as shown. Cells grown in 60-mm dishes were stained with crystal violet to visualize viable cells at the time points indicated. (Color version of figure is available online.

To further confirm the effect of nilotinib on prostate cancer cell growth, we performed a colony growth assay in which DU-145 cells were treated with nilotinib for 72 hours followed by a washout of the drug and continued culture for additional 9 days (Fig. 2E). We found that nilotinib induced significant cytotoxicity after 72 hours and that a minor regrowth of cancer cells did not occur until 6 to 9 days after the washout, which is comparable to other TKIs [8]. Next, we sought to identify the targets of nilotinib in DU-145 prostate cancer cells. Overall, 5 well-established targets, including ABL1, KIT, PDGFRA, DDR1, and NQO2, were analyzed for their role in the drug response. We found that protein expression of 3 of these targets (ABL1, KIT, and PDGFRA) was not detectable in DU-145 cells and that small interfering RNA–mediated knockdown of the remaining 2 targets, DDR1 and NQO2, did not result in apoptosis (not shown). Collectively, these results show a significant antitumoral activity of nilotinib in prostate cancer cells. However, this effect was associated with a relatively high IC50 and was independent of known nilotinib targets.

Nilotinib up-regulates the ERK survival signal in prostate cancer cells

To further investigate why relatively high concentrations of nilotinib were required to induce cytotoxicity, we analyzed 40,6-diamidino-2-phenylindole–stained DU-145 cells treated with 10 μM of nilotinib for 24 hours using fluorescence microscopy (Fig. 3A).

Fig. 3. Nilotinib up-regulates the ERK survival signal in prostate cancer cells. (A) Fluorescence microscopic analysis of DAPI-stained DU-145 cells. (B and C) Immunoblot analyses of DU-145 cells (B) or DU-145 cells in comparison with LNCaP and PC-3 cells (C) treated with nilotinib for the expression of phospho-ERK1/2 T202/Y204 and total ERK. Immunoblot for GAPDH is shown as a loading control. (D) Immunohistochemical staining of xenografted DU-145 cells after 21 days of treatment with 75 mg/kg/d of nilotinib for phospho-ERK1/2 T202/Y204 expression. It can be noted that tumors explanted from vehicle-treated mice showed mostly positivity at the tumor periphery, whereas tumors explanted from nilotinib-treated mice showed a more evenly distributed phospho-ERK immunostaining (left panels). Quantification of phospho-ERK–positive DU-145 xenografts explanted after 21 days of treatment. Mean and standard errors of positive cells per high-power field (HPF; [1]40) from at least 3 tumors are given (right panel). (E) Immunoblot analysis of DU-145 cells treated with U0126 alone or in combination with nilotinib shows abrogation of phospho-ERK1/2 T202/Y204 expression by U0126. (F) Quantification of viable cells compared with that of controls using the MTT assay after treatment with U0126 (10 μM) or nilotinib (10 μM) or both and after either pretreatment (24 h) or simultaneous treatment (72 h). DAPI ¼ 40,6-diamidino-2-phenylindole. (Color version of figure is available online.)

We found that, despite the presence of apoptotic cells, there was also a population of actively dividing tumor cells in the presence of nilotinib as well as a population of viable but multinucleated cells (Fig. 3A). We interpreted these results as evidence that a subset of tumor cells has the ability to resist TKI treatment. To reconcile these results, we analyzed the activation of ERK1/2, which is known to function as a prosurvival signal in TKI-treated tumor cells [9,10]. We detected a robust overexpression of phospho-ERK1/2 T202/Y204 in nilotinib-treated DU-145 cells (Fig. 3B). An up-regulation of phospho-ERK1/2 T202/Y204 was also detectable in nilotinib-treated LNCaP cells, albeit at a lower level, and was not found in PC-3 cells (Fig. 3C). To further corroborate the evidence of phospho-ERK upregulation in vivo, we analyzed explanted DU-145 xenografts from a representative experiment in which nilotinib was used at a 75-mg/kg/d concentration. This initial dosage was based on published animal experiments [11] but yielded no or incomplete tumor control in our experiment (data not shown).

In vivo antitumoral activity of nilotinib and ERK blockade

Our results raised 2 important questions First, can a higher dose of nilotinib induce improved tumor control, and second, is a combination of nilotinib with the MEK inhibitor U0126 to block ERK activity superior to nilotinib alone?

Fig. 4. In vivo antitumoral activity of nilotinib and ERK blockade in prostate cancer cells: (A) tumor growth curves of DU-145 xenografts in NMRI-nude mice and (B) analysis of tumor volumes on day 21. Asterisks indicate statistical significance (**P r 0.01 and ***P r 0.001). (Color version of figure is available online.)

11.1.8 PAF and EZH2 Induce Wnt.β-Catenin Signaling Hyperactivation

Jung HY1, Jun S, Lee M, Kim HC, Wang X, Ji H, McCrea PD, Park JI
Mol Cell. 2013 Oct 24; 52(2):193-205
http://dx.doi.org/10.1016%2Fj.molcel.2013.08.028

Fine-control of Wnt signaling is essential for various cellular and developmental decision making processes. However, deregulation of Wnt signaling leads to pathological consequences including cancer. Here, we identify a novel function of PAF, a component of translesion DNA synthesis, in modulating Wnt signaling. PAF is specifically overexpressed in colon cancer cells and intestinal stem cells, and required for colon cancer cell proliferation. In Xenopus laevis, ventrovegetal expression of PAF hyperactivates Wnt signaling, developing secondary axis with β-catenin target gene upregulation. Upon Wnt signaling activation, PAF is dissociated from PCNA, and directly binds to β-catenin. Then, PAF recruits EZH2 to β-catenin transcriptional complex, and specifically enhances Wnt target gene transactivation, independently of EZH2’s methyltransferase activity. In mouse, conditional expression of PAF induces intestinal neoplasia via Wnt signaling hyperactivation. Our studies reveal an unexpected role of PAF in regulating Wnt signaling, and propose a novel regulatory mechanism of Wnt signaling during tumorigenesis. Fine-control of Wnt signaling is essential for various cellular and developmental decision making processes. However, deregulation of Wnt signaling leads to pathological consequences including cancer. Here, we identify a novel function of PAF, a component of translesion DNA synthesis, in modulating Wnt signaling. PAF is specifically overexpressed in colon cancer cells and intestinal stem cells, and required for colon cancer cell proliferation. In Xenopus laevis, ventrovegetal expression of PAF hyperactivates Wnt signaling, developing secondary axis with β-catenin target gene upregulation. Upon Wnt signaling activation, PAF is dissociated from PCNA, and directly binds to β-catenin. Then, PAF recruits EZH2 to β-catenin transcriptional complex, and specifically enhances Wnt target gene transactivation, independently of EZH2’s methyltransferase activity. In mouse, conditional expression of PAF induces intestinal neoplasia via Wnt signaling hyperactivation. Our studies reveal an unexpected role of PAF in regulating Wnt signaling, and propose a novel regulatory mechanism of Wnt signaling during tumorigenesis.

Keywords: Wnt, β-catenin, PAF, KIAA0101, EZH2

Strict regulation of stem cell proliferation and differentiation is required for mammalian tissue homeostasis, and its repair in the setting of tissue damage. These processes are precisely orchestrated by various developmental signaling pathways, with dysregulation contributing to disease and genetic disorders, including cancer (Beachy et al., 2004). Cancer is initiated by the inactivation of tumor suppressor genes and activation of oncogenes. For instance, colon cancer cells harbor genetic mutations in Wnt/β-catenin pathway constituents such as adenomatous polyposis coli (APC), Axin, and β-catenin (Polakis, 2007). In mouse models, inactivation of APC or activation of β-catenin results in the development of intestinal hyperplasia and adenocarcinoma (Moser et al., 1990), indicating that hyperactivation of Wnt signaling promotes intestinal tumorigenesis.

In canonical Wnt signaling, Wnt ligand induces stabilization of β-catenin protein via inhibition of the protein destruction complex (glycogen synthase kinase 3, APC, casein kinase I, and Axin). Then, activated β-catenin is translocated into the nucleus and binds to its nuclear interacting partners, TCF/LEF. Finally, β-catenin-TCF/LEF transactivates the expression of its target genes (Clevers and Nusse, 2012).

Although various Wnt/β-catenin modulators have been identified (Wnt homepage; wnt.stanford.edu), the pathological relevance of these modulators to tumorigenesis remains elusive. Also, many reports have suggested that mutation-driven Wnt signaling activation can be enhanced further (Goentoro and Kirschner, 2009; He et al., 2005; Suzuki et al., 2004; Vermeulen et al., 2010), which implies the presence of an additional layer of Wnt-signaling regulation in cancer beyond genetic mutations in APC or β-catenin. Here, we unraveled a novel function of the DNA repair gene, PAF (PCNA-associated factor) /KIAA0101). PAF was shown to be involved in translesion DNA synthesis (TLS), an error-prone DNA repair process that permits DNA replication machinery to replicate DNA lesions with specialized translesion DNA polymerase (Emanuele et al., 2011; Povlsen et al., 2012; Sale et al., 2012). Our comprehensive approaches uncover that cancer-specifically expressed PAF hyperactivates Wnt/β-catenin signaling and induces intestinal tumorigenesis.

Mitogenic role of PAF via Wnt signaling

To identify colon cancer-specific Wnt signaling regulators, we analyzed multiple sets of human colon cancer tissue samples using the publicly available database (www.oncomine.org), and selected genes that are highly expressed in colon cancer cells (fold change > 2; P < 0.0001; top 10% ranked). Among several genes, we investigated the biological role of PAF, based on its significant overexpression in human colon adenocarcinoma with correlated expression of Axin2, a well-established specific target gene of β-catenin (Jho et al., 2002; Lustig et al., 2002)(Figure 1A). To validate our in silico analysis, we performed immunostaining of colon cancer tissue microarray, and confirmed that PAF was highly expressed in colon cancer cells, whereas its expression was barely detectable in normal intestine (Figure 1B). Consistently, PAF was strongly expressed and mainly localized in the nucleus of colon cancer cell lines (Figure 1C). Additionally, we found that PAF was not expressed in non-transformed cells such as NIH3T3, mouse embryonic fibroblasts, and mammary epithelial cells (data not shown). Next, to assess the relevance of PAF upregulation in colon cancer cell proliferation, we depleted endogenous PAF using short hairpin RNAs (shRNAs) in these cell lines. Intriguingly, PAF knockdown (sh-PAF) inhibited colon cancer cell proliferation (Figures 1D and 1E). Given that PAF was shown to interact with PCNA via PIP box (Yu et al., 2001), we also examined whether PAF-PCNA interaction is required for mitogenic effects of PAF. In reconstitution experiments, sh-PAF-induced cell growth inhibition was rescued by ectopic expression of both shRNA non-targetable wild-type PAF (nt-PAF) and PIP mutant PAF (mutPIP-PAF) (Figure 1F), indicating that the PAF-PCNA interaction is not necessary for PAF-mediated colon cancer cell proliferation. Interestingly, PAF knockdown downregulated cell proliferation–related genes (Cyclin D1 and c-Myc) (Figure 1G). Given that Cyclin D1 and c-Myc are β-catenin direct target genes (He et al., 1998; Tetsu and McCormick, 1999), PAF likely participates in regulating Wnt/β-catenin signaling. Interestingly, PAF depletion-induced downregulation of Cyclin D1 andc-Myc was only observed in SW620 colon cancer cells, but not in Panc-1 and MDA-MB-231 cells (Figure 1G), indicating the specific effects of PAF on Cyclin D1 and c-Myc expression in colon cancer cells. We also assessed the effects of PAF knockdown on Axin2. Indeed, PAF knockdown suppressed Axin2transcription in colon cancer cells (Figure 1H). Moreover, as nt-PAF did, β-catenin ectopic expression reverted sh-PAF–induced cell growth arrest (Figure 1I), implying that PAF might be functionally associated with Wnt/β-catenin. We also examined whether other mitogenic signaling pathways mediate PAF’s mitogenic role. Of note, except HT29, other colon cancer cell lines (SW620, HCT116, HCC2998, and HCT15) harbor oncogenic mutations in K-Ras gene. Nonetheless, PAF depletion induced the suppression of cell growth on all five colon cancer cells (Figure 1D), indicating that PAF’s mitogenic function is independent of Ras/MAPK signaling activation. Additionally, overexpression of wild-type Akt or constitutively active form of Akt (myristoylated form of Akt [Myr-Akt]) did not rescue sh-PAF-induced inhibition of cell proliferation (Figure 1I). Moreover, β-catenin activation did not revert cell proliferation suppression resulted from MAPK or PI3K inhibition (Figure 1J), indicating that β-catenin-mediated mitogenic function is independent of MAPK and PI3K signaling pathways. These results suggest that PAF contributes to colon cancer cell proliferation, possibly via Wnt/β-catenin signaling.

http://www.ncbi.nlm.nih.gov/pmc/articles/PMC4040269/bin/nihms573362f1.gif

Figure 1 Mitogenic role of PAF in colon cancer cells

PAF positively modulates Wnt signaling

Given that many cancers develop as a result of deregulation of developmental signalings (Beachy et al., 2004), analyzing PAF expression during development may provide insights into the mechanisms of PAF-mediated signaling regulation. Whole mount immunostaining of mouse embryos, showed that PAF was specifically enriched in the apical ectodermal ridge (AER) of the limb bud, midbrain, hindbrain, and somites (Figure 2A and data not shown). During limb development, AER induction is specifically coordinated by active Wnt signaling (Figure 2B)(Kengaku et al., 1998). Using, Axin2-LacZ, a β-catenin reporter (Lustig et al., 2002), mouse embryos, we confirmed the specific activation of Wnt signaling in AER (Figure 2C). Intriguingly, Wnt signaling activity as exhibited in the AER, overlapped with the pattern of PAF expression (Figures 2A and 2C). Given that (1) Wnt signaling is deregulated in most colon cancer, (2) PAF is highly overexpressed in colon cancer cells, (3) PAF is required for colon cancer cell proliferation (Figure 1D), and (4) PAF is enriched in AER where Wnt signaling is active (Figure 2A), we hypothesized that PAF modulates the Wnt signaling pathway. To test this, we first examined the impact of PAF on β-catenin transcriptional activity using TOPFLASH reporter assays. In HeLa cells, PAF knockdown decreased β-catenin reporter activation by 6-bromoindirubin-3′-oxime, a GSK3 inhibitor (Figure 2D). Similarly, Wnt3A-induced transcriptional activation of Axin2 was also inhibited by PAF depletion (Figure 2E). These data suggest that PAF might be required for Wnt target gene expression.

http://www.ncbi.nlm.nih.gov/pmc/articles/PMC4040269/bin/nihms573362f2.gif

Figure 2 Activation of Wnt signaling by PAF

To gain better insight of PAF’s role in Wnt signaling regulation, we utilized Xenopus laevis embryos for axis duplication assays (Funayama et al., 1995), as previously performed (Park et al., 2009). Because of Wnt signaling’s pivotal role in vertebrate anterior-posterior axis development, the effects of Xenopus PAF (xPAF) on Wnt signaling can be monitored and quantified on the basis of secondary axis formation following injection of in vitro transcribed mRNAs. xβ-catenin mRNA, titrated to a subphenotypic level when expressed in isolation, was co-injected with xPAF mRNA into ventrovegetal blastomeres. Unlike the controls (β-catenin and β-galactosidase mRNA), the experimental group (β-catenin and xPAF mRNA) displayed axis-duplications (Figures 2F-H). Of note, the ventrovegetal injection of xPAF mRNA alone failed to induce secondary axes (data not shown), showing that PAF hyperactivates Wnt/β-catenin signaling only in the presence of active β-catenin. Consistent with the results of axis duplication assays, qRT-PCR assays showed that xPAF expression upregulated expression of Siamois and Xnr3, β-catenin targets in frogs (Figure 2I). Furthermore, we examined the specificity of PAF on Wnt/β-catenin signaling activity, using various luciferase assays. Ectopic expression of PAF hyperactivates Wnt3A or LiCl, a GSK3 inhibitor, -induced activation of β-catenin target gene reporter activity (MegaTOPFLASH, Siamois, c-Myc, and Cyclin D1). Of note, BMP/Smad pathway also plays an essential role in the developing limb AER (Ahn et al., 2001). However, PAF knockdown or overexpression did not affect BMP/Smad or FoxO signalings, respectively, (Figure 2J) indicating the specificity of PAF in regulating Wnt signaling. These results suggest that PAF positively modulates Wnt/β-catenin signaling in vitro and in vivo.

PAF-EZH2-β-catenin transcriptional complex formation

Next, we investigated the molecular mechanism underlying PAF hyperactivation of Wnt signaling. Given that stabilization of β-catenin protein is a key process in transducing Wnt signaling, we asked whether PAF affects β-catenin protein level. However, we found that the level of β-catenin protein was not altered by PAF knockdown or overexpression (Figures 2E and ​and3A),3A), leading us to test whether PAF controls the β-catenin/TCF transcriptional complex activity. Owing to the nuclear specific localization of PAF in colon cancer cells (Figure 1C), we tested whether PAF interacts with β-catenin transcriptional complex. Using a glutathione S-transferase (GST) pull-down assay, we found that PAF bound to β-catenin and TCF proteins (Figure 3B). Also, endogenous PAF interacted with β-catenin and TCF3 in SW620 cells that display constitutive hyperactivation of Wnt signaling by APC mutation (Figure 3C). Moreover, binding domain mapping assays showed that the Armadillo repeat domain of β-catenin was essential for its interaction with PAF (Figure 3D). Although PAF is a cell cycle-regulated anaphase-promoting complex substrate (Emanuele et al., 2011), PAF-β-catenin interaction was not affected (Figure S1). These data suggest that PAF directly binds to β-catenin transcriptional complex and this interaction is independent of cell cycle. Next, due to interaction of PAF with β-catenin and TCF, we tested whether PAF is also associated with Wnt/β-catenin target genes. First, we analyzed the subnuclear localization of PAF by chromatin fractionation. We found that PAF was only detected in the chromatin fraction of HCT116 cells (Figure 3E). Additionally, chromatin immunoprecipitation (ChIP) assays showed that both ectopically expressed and endogenous PAF occupied the TCF-binding element (TBE)-containing proximal promoter of the β-catenin targets (c-Myc and Cyclin D1) in HCT116 cells (Figures 3F and 3G). These data show that PAF is specifically associated with the promoters of Wnt/β-catenin target genes.

http://www.ncbi.nlm.nih.gov/pmc/articles/PMC4040269/bin/nihms573362f3.gif

Figure 3 PAF-EZH2-β-catenin transcriptional complex at target gene promoters

In intestine, Wnt/β-catenin signaling constitutively activates intestinal stem cells (ISCs) to give rise to progenitor cells, which replenishes intestinal epithelium (Figure 3H). Given the involvement of PAF on Wnt/β-catenin signaling regulation (Figure 2), we analyzed the spatial expression of PAF in intestinal epithelium. Immunostaining showed that PAF was specifically expressed in B lymphoma Mo-MLV insertion region 1 homolog (Bmi1) positive intestinal stem cells (ISCs)(Figures 3I and 3J). Bmi1 and its associated components in Polycomb-repressive complex 1 (PRC1) and 2 (PRC2) are shown to epigenetically regulate gene expression (Sparmann and van Lohuizen, 2006). Due to (1) specific association of PAF with TBEs of β-catenin target promoters (Figures 3F and 3G) and (2) co-localization with Bmi1 positive ISCs (Figure 3J), we asked whether PAF is associated with components of PRC1 and PRC2, using co-immunoprecipitation (co-IP) assays. Intriguingly, PAF interacted with both Bmi1 and enhancer of zeste homolog 2 (EZH2) in SW620 cells (Figure 3K), which led us to test whether either Bmi1 or EZH2 is functionally associated with PAF-mediated Wnt signaling hyperactivation. To do this, we assessed the effects of Bmi1 and EZH2 on β-catenin transcriptional activity, using β-catenin reporter assays. We observed that ectopic expression of EZH2 upregulated β-catenin transcriptional activity, but Bmi1 overexpression did not (data not shown), implying that EZH2 might be associated with Wnt signaling activation. Binding domain mapping analysis showed that EZH2 bound to PAF via the middle region of EZH2 including the CXC cysteine-rich domain (Figure 3L). In conjunction with the Bmi1-containing PRC1, EZH2-containing PRC2 catalyzes histone H3 lysine 27 trimethylation (H3K27me3) via histone methyltransferase domain. Despite the crucial role of EZH2 in H3K27me3-meidated gene regulation, we found that other core components of PRC2, EED, and Suz12 were not associated with PAF (Figure 3K). Moreover, although EZH2 overexpression in cancer induces PRC4 formation in association with the NAD+-dependent histone deacetylase Sirt1 (Kuzmichev et al., 2005), the PAF-EZH2 complex did not contain Sirt1 (Figure 3K). These data indicate that PAF-EZH2 complex is distinct from the conventional PRCs in cancer cells. Also, we questioned whether PCNA is required for PAF’s interaction with either PAF or β-catenin. Interestingly, β-catenin-PAF and EZH2-PAF complexes existed only in PCNA-free fractions (Figure 3M, compare lanes 1 and 2), which is consistent with PCNA-independent mitogenic role of PAF in colon cancer cell proliferation (Figure 1I). Due to exclusive interaction of PAF with either PCNA or β-catenin, we asked whether Wnt signaling activation affects either PAF-β-catenin or PAF-PCNA interaction. Co-IP assays showed that, in HeLa cells, PAF-β-catenin interaction was only detected upon LiCl treatment, while PAF-EZH2 interaction remained constant. Moreover, PAF-PCNA association was decreased by LiCl or Wnt3A treatment (Figures 3N and 3O, compare lanes 3 and 4). These data suggest that Wnt signaling activation is required for PAF-β-catenin interaction. Due to absence of endogenous Wnt signaling activity in HeLa cells, we also assessed the effects of active Wnt/β-catenin signaling on PAF-PCNA binding in colon cancer cell lines that exhibit hyperactivation of Wnt signaling by genetic mutations in APC or β-catenin alleles. Surprisingly, PAF-PCNA interaction was barely detectable in colon cancer cell lines, whereas 293T and HeLa cells displayed strong PAF-PCNA association (Figure 3P), implying that active β-catenin may sequester PAF from PCNA. In binding domain mapping analysis, we also found that N-terminal and PIP regions are required for β-catenin interaction (Figure S2), suggesting that β-catenin competes with PCNA for PAF interaction. These results suggest that, upon Wnt signaling activation, PAF is conditionally associated with β-catenin transcriptional complex.

PAF activates β-catenin target genes by recruiting EZH2 to promoters

Previous studies showed that EZH2 interacts with β-catenin (Li et al., 2009; Shi et al., 2007). Also, we found that PAF is physically associated with EZH2, independently of PRC2 complex (Figure 3). These evidences prompted us to ask whether EZH2 mediates PAF-induced Wnt signaling hyperactivation. Given PAF-EZH2-β-catenin complex formation, we tested whether EZH2 is also associated with the promoters of β-catenin target genes. Intriguingly, PAF, EZH2, and β-catenin steadily co-occupied the promoters of c-Myc,Cyclin D1, and Axin2 in HCT116 cells carrying β-catenin mutation, whereas PCNA, EED, and Suz12 did not (Figure 4A), which recapitulates PRC2 complex-independent association of EZH2 with PAF (see Figures 3K and 3N). Next, we asked whether PAF, EZH2, and β-catenin are recruited to β-catenin target gene promoter upon Wnt signaling activation, as PAF-β-catenin interaction was dependent of Wnt signaling activation (Figure 3N). In HeLa cells, we found that PAF, EZH2, and β-catenin conditionally bound to TBEs in the c-Myc and Axin2 promoters, only upon LiCl treatment (Figure 4B), indicating that Wnt signaling activation is a prerequisite for PAF-β-catenin-EZH2’s promoter association. To further confirm the specificity of PAF-EZH2-β-catenin’s recruitment to β-catenin target promoters, we performed ChIP promoter scanning of 10 kb of the c-Myc promoter, and found that PAF, EZH2, and β-catenin specifically co-occupied the proximal promoter containing TBEs of the c-Myc gene (at -1037 and -459 bp) (He et al., 1998) in HCT116 cells (Figure 4C). Also, the analysis of EZH2 ChIP-sequencing data from mouse embryonic stem cells showed that EZH2 was specifically enriched in the proximal promoters of β-catenin targets (Lef1, Lgr5, c-Myc, and Axin2) (Figure 4D).

http://www.ncbi.nlm.nih.gov/pmc/articles/PMC4040269/bin/nihms573362f4.gif

Figure 4 PAF promotes EZH2-β-catenin interaction

Next, we asked whether EZH2 promoter recruitment is necessary for activation of β-catenin target gene transcription. Previously, depletion of EZH2 was shown to inhibit c-Myc expression in DLD-1 colon cancer cells (Fussbroich et al., 2011). Consistently, EZH2 knockdown downregulated β-catenin target genes, Axin2and Cyclin D1 in HCT116 cells (Figure 4E), and decreased LiCl-induced β-catenin reporter activation (Figure 4F), suggesting that EZH2 is required for PAF-mediated Wnt target gene hyperactivation. These results are also supported by previous finding that EZH2 enhances β-catenin transcriptional activity by connecting β-catenin with the Med1/RNA polymerase II (Pol II) complex (Shi et al., 2007). Indeed, Med1/TRAAP220 and Pol II conditionally binds to c-Myc and Axin2 promoters in LiCl-treated HeLa cells (Figure 4G). Given that PRC2-indepednent interaction between EZH2 and PAF (Figures 3K and 3N), we asked whether EZH2’s histone methyltransferase activity is dispensable in β-catenin regulation. We utilized an EZH2 point mutant (F681I) that disrupts the contact between the EZH2 hydrophobic pocket and histone lysine residue H3K27 (Joshi et al., 2008). Ectopic expression of either EZH2 or EZH2-F681I enhanced β-catenin reporter activity (Figure 4H). Also, PAF knockdown did not change the H3K27 methylation status (H3K27me3) of proximal promoters of c-Myc, Axin2, Cyclin D1, and DCC in HCT116 cells (Figure 4I). These results indicate a methyltransferase-independent role of EZH2 in transactivating β-catenin targets.

Due to PAF’s (1) small size (111 amino acids, one α-helix), (2) lack of a specific catalytic domain, and (3) binding to both β-catenin and EZH2, PAF may facilitate the interaction between EZH2 and β-catenin through recruiting EZH2 to the promoter. We tested this using ChIP assays for EZH2 in the setting of PAF depletion. Indeed, PAF-depleted HCT116 cells displayed decreased EZH2-association at the c-Myc promoter (Figure 4J), suggesting that PAF assists or is needed to recruit EZH2 to β-catenin transcriptional complex. Also, β-catenin knockdown decreased recruitment of PAF and EZH2 to promoters (Figure 4K), showing that PAF and EZH2 occupy target promoters via β-catenin. We then asked whether PAF promotes β-catenin-EZH2 binding. In vitro binding assays showed that the addition of GST-PAF protein increased EZH2-β-catenin association (Figure 4L). Moreover, ectopic expression of PAF promoted the EZH2-β-catenin interaction in HeLa cells treated with LiCl (Figure 4M). Additionally, we tested whether Wnt signaling-induced post-translational modification of either β-catenin or PAF is required for EZH2 interaction. However, in GST pull-down assays, we found that bacterially expressed either GST-β-catenin or –PAF bound to EZH2 (Figure S3). Due to the lack of post-translational modification in GST protein expression system, these data indicate that post-translation modification of either β-catenin or PAF is not necessary for EZH2 interaction. Together, these results suggest that PAF acts as a molecular adaptor to facilitate EZH2-β-catenin complex, and subsequently enhances the transcriptional activity of the β-catenin transcriptional complex at Wnt target promoters (Figure 4N).

Intestinal tumorigenesis following PAF conditional expression

Having determined that PAF is overexpressed in colon cancer cells and hyperactivates Wnt/β-catenin signaling, we aimed to determine whether mimicking PAF overexpression drives intestinal tumorigenesis, using genetically engineered mouse models. To conditionally express PAF, we generated doxycycline (doxy)-inducible PAF transgenic mice (TetO-PAF-IRES-emGFP [iPAF]). For intestine-specific expression of PAF, we used iPAF:Villin-Cre:Rosa26-LSL-rtTA mouse strains. Villin-Cre is specifically expressed in intestinal epithelial cells (IECs), including ISCs and progenitor cells. Cre removes a floxed stop cassette (loxP-STOP-loxP [LSL]) from the Rosa26 allele and induces rtTA expression. Upon doxy treatment, rtTA drives the transcriptional activation of the tetracycline-responsive element promoter, resulting in conditional transactivation of PAF selectively in IECs. We also utilized the Rosa26-rtTA strain for ubiquitous expression of PAF (Figure 5A and Figure S4). First, we examined the effects of PAF induction on IEC proliferation using a crypt organoid culture system (Figure S5A). Intriguingly, PAF conditional expression (2 weeks) induced expansion of the crypt organoids (Figures 5B and 5C), which recapitulates the mitogenic function of PAF (Figure 1). In mouse, IEC-specific PAF expression (iPAF:Villin-Cre:Rosa26-LSL-rtTA; 2 months) developed adenoma in both small intestine and colon (Figure 5D). Also, microscopic analysis using hematoxylin and eosin (H&E) staining showed aberrant IEC growth and crypt foci formation (Figures 5E and 5F), with disorganized epithelial cell arrangements (Figure S5B). Consistently, PAF-induced IEC hyperproliferation was manifested by increased Ki67 expression, a mitotic marker (Figure 5G). Importantly, these lesions exhibited the upregulation of CD44, a β-catenin target gene, whereas CD44 was expressed strictly in the crypts of normal intestine (Figure 5H). Next, we examined whether PAF directly hyperactivates Wnt/β-catenin in vivo using BAT-gal, a β-catenin reporter transgenic mouse carrying multiple TBEs followed by a LacZ reporter. To quantify the early effects of PAF on β-catenin activity, we treated mice with doxy for 1 week, and found that short-term induction of PAF increased β-catenin transcriptional activity as represented by enhanced X-gal staining (Figure 5I). Moreover, conditional PAF expression upregulated the β-catenin target genes, Axin2, Lgr5, CD44, Cyclin D1, and c-Myc in crypt organoids (Figure 5J). Additionally, mice ubiquitously expressing PAF exhibited intestinal hypertrophy (Figure S5C), which is similar to that induced by R-Spondin1, a secreted Wnt agonist (Kim et al., 2005). These data strongly suggest that PAF expression is sufficient to initiate intestinal tumorigenesis via Wnt signaling hyperactivation.

http://www.ncbi.nlm.nih.gov/pmc/articles/PMC4040269/bin/nihms573362f5.gif

Figure 5 Induction of intestinal neoplasia by PAF expression

Herein we reveal the unexpected role of PAF in modulating Wnt/β-catenin signaling. PAF enhances the transcription of Wnt targets by recruiting EZH2 to the β-catenin transcriptional complex. This is similar to the mechanism by which Lgl/BCL9 binds to β-catenin and thereby recruits the PHD-finger protein Pygopus, to bridge the β-catenin/TCF complex to Med12 and Med13 (Carrera et al., 2008). Importantly, due to specific overexpression of PAF in cancer cells, our studies identified an additional layer of the regulatory mechanism of β-catenin target gene transactivation.

In cancer cells, the upregulation of EZH2 contributes to tumorigenesis through the epigenetic repression of various genes including tumor suppressor genes, Wnt antagonists, and DNA repair genes (Chang et al., 2011; Cheng et al., 2011; Kondo et al., 2008). Our results propose a noncanonical function of EZH2 in activating β-catenin target genes in conjunction with PAF. Consistently, recent study also suggests methyltransferase activity-independent function of EZH2 in gene activation (Xu et al., 2012). Moreover, this non-canonical role of EZH2 is supported by several lines of evidence: (a) EZH2 transactivates β-catenin target genes (Li et al., 2009; Shi et al., 2007) (Figures 4E and 4F); (b) EZH2 overexpression in murine mammary epithelium induces ductal hyperplasia (Li et al., 2009), which phenocopies that in a ∆Nβ-catenin (constitutively active form of β-catenin) mouse model (Imbert et al., 2001); (c) EZH2 occupies β-catenin target promoters (Figures 4A-D); and (d) EZH2’s methyltransferase activity is dispensable for β-catenin target activation (Figures 4H and 4I). Moreover, similar to PAF expression in the AER (Figure 2A), EZH2 is also specifically expressed there to maintain of Hox cluster gene transcription (Wyngaarden et al., 2011). Thus, it is plausible that EZH2 and PAF cooperatively control Hox gene activation in the developing limb. Interestingly, despite the presence of a physical and functional connection between Bmi1 and EZH2 in H3K27me3-mediated gene repression, EZH2 is expressed only in crypt IECs including ISCs (Figure S6), whereas Bmi1 is expressed in ISCs at position 4 (Figure 3J), implying a Bmi1-independent role for EZH2 in gene regulation. These results demonstrate the novel function of EZH2 in β-catenin target gene activation, independent of the histone methyltransferase activity of EZH2.

Previously, we found that TERT, a catalytic subunit of telomerase, positively modulates Wnt signaling (Park et al., 2009), elucidating a non-telomeric function of telomerase in development and cancer. Here our results propose that one component of DNA damage bypass process also functions in regulating Wnt signaling, dependent of context. In cancer, PAF overexpression may play a dual role in inducing (a) cell hyperproliferation (via Wnt signaling hyperactivation) and (b) the accumulation of mutations arising from DNA lesion bypass (by PAF-mediated TLS) (Povlsen et al., 2012). Importantly, PAF is only expressed in cancer cells, but not in normal epithelial cells. Thus, upon DNA damage, instead of cell growth arrest to permit high-fidelity DNA repair, the PAF overexpression in cancer cells is likely to induce DNA lesion bypass by facilitating TLS. However, in the setting of Wnt signaling deregulation, nuclear β-catenin sequesters PAF from PCNA and utilize PAF as a co-factor of transcriptional complex, which induces Wnt signaling hyperactivation and possibly lead to increased mutagenesis.

We observed that PAF marked the stemness of ISCs and mouse embryonic stem cells (Figure S7), implicating its roles in stem cell regulation under physiological conditions. In a previous study, a PAFgermline knockout mouse model displayed defects in hematopoietic stem cell self-renewal (Amrani et al., 2011), suggesting a crucial role of PAF in stem cell maintenance and activation. In the intestine, β-catenin activation in Lgr5-positive or Bmi1-positive cells is sufficient to develop intestinal adenoma (Barker et al., 2009; Sangiorgi and Capecchi, 2008), suggesting an essential role of tissue stem cells in tumor initiation. Considering PAF expression in Bmi1-positive ISCs, PAF upregulation in ISCs likely hyperactivates the Wnt/β-catenin signaling and contributes to intestinal tumor initiation.

Despite the critical role of Wnt signaling in early vertebrate, development PAF germline knockout mice are viable (Amrani et al., 2011). It is noteworthy that, whereas deletion of any core component in the Wnt signaling pathway causes embryonic lethality, mice with germline knockout of Wnt signaling modulators, including Nkd1/2, Pygo1/2, and BCL9/9-2, exhibit no lethal phenotypes (Deka et al., 2010; Schwab et al., 2007; Zhang et al., 2007). This may result from the robustness of Wnt signaling during embryogenesis because of functional compensation not only via the presence of multiple Wnt signaling regulators per se but also via other types of signaling crosstalk. Therefore, as described previously in pRb studies (Sage et al., 2003), acute deletion of PAF in a conditional knockout mouse model may disrupt the developmental balance or tissue homeostasis, and then reveal the full spectrum of the physiological and pathological roles of PAF in tumorigenesis. Taken together, our findings reveal unexpected function of PAF and EZH2 in modulating Wnt signaling, and highlight the impacts of PAF-induced Wnt signaling deregulation on tumorigenesis.

11.1.9 PAF Makes It EZ(H2) for β-Catenin Transactivation

Xinjun Zhang1 and Xi He1
Mol Cell. 2013 Oct 24; 52(2)
http://dx.doi.org:/10.1016/j.molcel.2013.10.008.

In this issue of Molecular Cell, Park and colleagues (Jung et al., 2013) show that PAF (PCNA-associatedfactor) binds to and hyperactivates transcriptional function of β-catenin in colon cancer cells by recruiting EZH2 to the coactivator complex. PAF-β-catenin and PAF-PCNA interactions are competitive, raising the question of whether β-catenin might regulate PCNA-dependent DNA replication and repair.

Wnt signaling through stabilization of transcription co-activator β-catenin plays critical roles in animal development and tissue homeostasis, and its deregulation is involved in myriad human diseases including cancer (Clevers and Nusse, 2012). Notably, most colorectal cancers (CRCs) have elevated β-catenin signaling caused by mutations of Wnt pathway components such as the tumor suppressor APC (Adenomatosis polyposis coli) and β-catenin itself (Clevers and Nusse, 2012). Much effort has focused on studying β-catenin-dependent transactivation in CRCs, including the current study by Park and colleagues that identifies PAF as an unexpected β-catenin co-activator (Jung et al., 2013).

PAF, for PCNA (proliferating cell nuclear antigen)-associated factor (also known as KIAA0101 or p15PAF), is an interacting partner of PCNA (Yu et al., 2001). PCNA has a key role in DNA replication and repair by assembling various DNA polymerase and repair complexes at the replication fork (Mailand et al., 2013). Dynamic regulation of PAF abundance and/or interaction with PCNA appears to be important for engaging DNA damage repair and bypass pathways (Emanuele et al., 2011; Povlsen et al., 2012). PAF is overexpressed in many types of cancers and required for cell proliferation (e.g., Yu et al., 2001).

In the current study (Jung et al., 2013), Jung et al. show that PAF is overexpressed in CRCs in a manner that parallels expression of Axin2, an established Wnt/β-catenin target gene. PAF knockdown inhibits CRC proliferation, and this effect is independent of PAF-PCNA interaction and can be rescued by a PAF mutant that does not binds to PCNA or by β-catenin overexpression. PAF knockdown downregulates the expression of Wnt/β-catenin target genes Cyclin D1, c-Myc, and Axin2 in a CRC line, leading the authors to hypothesize that PAF participates in Wnt/β-catenin signaling. Indeed PAF knockdown reduces, and its overexpression augments, Wnt/β-catenin responsive TOPFLASH reporter and target gene expression induced by Wnt3a or by pharmacological agents that stabilize β-catenin. In Xenopus embryos, PAF synergizes with β-catenin to induce Wnt target gene expression and axis duplication (a hallmark of Wnt/β-catenin activation). In mouse embryos, PAF is highly expressed in regions known for Wnt/β-catenin signaling such as the apical ectodermal ridge of the limb bud. Therefore PAF appears to be a positive regulator of Wnt/β-catenin signaling in CRCs and vertebrate embryos.

PAF does not affect β-catenin protein levels and is localized in the nucleus. Protein binding assays show that PAF interacts, directly or indirectly, with β-catenin (via the Armadillo-repeat domain) and its DNA-bound partner TCF (T Cell factor). Indeed PAF is associated with promoters of Wnt/β-catenin target genes in chromatin in CRC cells. Interestingly in the mouse intestine, the PAF protein is enriched in Bmi (B lymphoma Mo-MLV insertion region 1 homolog)-positive stem cells (at the “+4” position) (Sangiorgi and Capecchi, 2008). Bmi1 is a component of Polycomb Repressive Complex 1 (PRC1), which, together with the PRC2 complex that modifies Histone H3, has critical functions in transcriptional epigenetic silencing. Previous studies have suggested that a core PRC2 component, EZH2 (enhancer of zeste homolog 2), is a partner and paradoxically a co-activator of β-catenin, acting in a manner that is independent of EZH2’s methyltransferase activity (Li et al., 2009; Shi et al., 2007). Jung et al. found that PAF indeed interacts with both Bmi1 and EZH2, but not other PRC2 components, and EZH2 overexpression augments β-catenin transcriptional activity. PAF, EZH2, and β-catenin are found to co-occupy promoters of several Wnt/β-catenin target genes in CRC and mouse ES cells, and PAF depletion decreases EZH2 association with the c-Myc promoter, and β-catenin depletion decreases the association of both PAF and EZH2 with the promoter. Thus the β-catenin-PAF-EZH2 complex appears to constitute a chain of co-activators (Figure 1), and indeed PAF, which binds to both β-catenin and EZH2, enhances β-catenin-EZH2 co-immunoprecipitation. Together with an earlier study (Shi et al., 2007), these results suggest a model that PAF brings EZH2 and the associated RNA polymerase II Mediator complex to β-catenin target genes for transactivation in CRCs (Figure 1). Consistent with this model, transgenic overexpression of PAF in the mouse intestine induces β-catenin-dependent target and reporter gene expression, intestinal overgrowth, and adenoma formation in vivo and crypt organoid expansion in vitro, resembling Wnt/β-catenin signaling activation in the gastrointestinal tract.

ceb2-catenin-transactivation-nihms532034f1

ceb2-catenin-transactivation-nihms532034f1

β-catenin transactivation

http://www.ncbi.nlm.nih.gov/pmc/articles/PMC3848709/bin/nihms532034f1.jpg

Figure 1 β-catenin transactivation mediated by PAF and EZH2 in the G1 phase and a speculative role of β-catenin in modulating PAF-PCNA-dependent DNA replication and repair/bypass pathways in the S phase.

PAF and EZH2 represent newer additions to β-catenin’s plethora of co-activators (Mosimann et al., 2009), which offer multiple routes to engage the basal transcription apparatus. These co-activators may have partially redundant and/or context-dependent functions for numerous Wnt/β-catenin-dependent gene programs. Mouse mutants that lack an individual β-catenin co-activator are often viable (MacDonald et al., 2009; Mosimann et al., 2009). Paf−/− mice are viable but exhibit defects in hematopoietic stem cell properties (Amrani et al., 2011). PAF is also expressed in self-renewing mouse ES cells but the expression is downregulated upon ES cell differentiation (Jung et al., 2013). Whether PAF has a general role in self-renewal of embryonic and adult stem cells through its role in β-catenin signaling or DNA replication and repair pathways remains to be investigated.

PAF-β-catenin interaction is observed under Wnt stimulation, likely as a consequence of β-catenin accumulation (Jung et al., 2013). In some cell types PAF is ubiquitinated and degraded by the anaphase promoting complex and thus exhibits the lowest level in the G1 phase of the cell cycle (Emanuele et al., 2011). In these cells PAF may have a limited role as a co-activator for β-catenin-dependent transcription, which primarily occurs in G1. But in CRC and other cancers where PAF is overexpressed, PAF may have a prominent role as a β-catenin co-activator.

PAF-PCNA interaction is well documented (e.g., Yu et al., 2001). Surprisingly however, in CRCs with high levels of β-catenin, PAF-PCNA interaction is barely detectable (Jung et al., 2013). Conversely, in cells where the basal level of Wnt/β-catenin signaling is low, PAF-PCNA interaction is detected but is diminished by Wnt3a or pharmacological agents that stabilize β-catenin (Jung et al., 2013). PAF seems to interact with β-catenin and PCNA via an overlapping domain (although this remains to be better defined), offering a possible explanation why PAF-β-catenin and PAF-PCNA complexes appear to be mutually exclusive (Jung et al., 2013). This may simply reflect the fact that PAF-β-catenin (for RNA transcription) and PAF-PCNA (for DNA replication/repair) complexes act in G1 and S, respectively (Figure 1). However, when β-catenin levels are high in Wnt-stimulated cells or in CRCs, one may speculate that β-catenin accumulation could inhibit PAF-PCNA complex formation in the S phase, thereby enabling Wnt/β-catenin signaling to modulate PAF-PCNA-dependent DNA replication and repair/bypass pathways (Figure 1). This would constitute an unsuspected role for Wnt/β-catenin signaling in genomic stability beyond its established transcriptional function and could have implications to tumorigenesis.

  1. Amrani YM, Gill J, Matevossian A, Alonzo ES, Yang C, Shieh JH, Moore MA, Park CY, Sant’Angelo DB, Denzin LK. J Exp Med. 2011;208:1757–1765. [PMC free article] [PubMed]
  2. Clevers H, Nusse R. Cell. 2012;149:1192–1205. [PubMed]
  3. Emanuele MJ, Ciccia A, Elia AE, Elledge SJ. Proc Natl Acad Sci USA. 2011;108:9845–9850.[PMC free article] [PubMed]
  4. Jung H-Y, Jun S, Lee M, Kim H-C, Wang X, Ji H, McCrea PD, Park J-I. Molecular Cell. 2013 this issue, *bxs. [PMC free article] [PubMed]
  5. Li X, Gonzalez ME, Toy K, Filzen T, Merajver SD, Kleer CG. Am J Pathol. 2009;175:1246–1254.[PMC free article] [PubMed]
  6. MacDonald BT, Tamai K, He X. Dev Cell. 2009;17:9–26. [PMC free article] [PubMed]
  7. Mailand N, Gibbs-Seymour I, Bekker-Jensen S. Nat Rev Mol Cell Biol. 2013;14:269–282.[PubMed]

11.1.10 PI3K.AKT.mTOR pathway as a therapeutic target in ovarian cancer

Li H1, Zeng J, Shen K.
Arch Gynecol Obstet. 2014 Dec; 290(6):1067-78
http://dx.doi.org:/10.1007/s00404-014-3377-3

Background: Ovarian cancer is one of the major causes of death in women worldwide. Despite improvements in conventional treatment approaches, such as surgery and chemotherapy, a majority of patients with advanced ovarian cancer experience relapse and eventually succumb to the disease; the outcome of patients remains poor. Hence, new therapeutic strategies are urgently required. The phosphatidylinositol 3-kinase (PI3K)/AKT/mammalian target of rapamycin (mTOR) is activated in approximately 70 % of ovarian cancers, resulting in hyperactive signaling cascades that relate to cellular growth, proliferation, survival, metabolism, and angiogenesis. Consistent with this, a number of clinical studies are focusing on PI3K pathway as an attractive target in the treatment of ovarian cancer. In this review, we present an overview of PI3K pathway as well as its pathological aberrations reported in ovarian cancer. We also discuss inhibitors of PI3K pathway that are currently under clinical investigations and the challenges these inhibitors face in future clinical utility.Methods: PubMed was searched for articles of relevance to ovarian cancer and the PI3K pathway. In addition, the ClinicalTrials.gov was also scanned for data on novel therapeutic inhibitors targeting the PI3K pathway. Results: Genetic aberrations at different levels of PI3K pathway are frequently observed in ovarian cancer, resulting in hyperactivation of this pathway. The alterations of this pathway make the PI3K pathway an attractive therapeutic target in ovarian cancer. Currently, several inhibitors of PI3K pathway, such as PI3K/AKT inhibitors, rapamycin analogs for mTOR inhibition, and dual PI3K/mTOR inhibitors are in clinical testing in patients with ovarian cancer. Conclusions: PI3K pathway inhibitors have shown great promise in the treatment of ovarian cancer. However, further researches on selection patients that respond to PI3K inhibitors and exploration of effective combinatorial therapies are required to improve the management of ovarian cancer.

Fig.1. Inputs from receptor tyrosine kinases (RTKs) and G protein-coupled receptors (GPCR) to class I PI3K.

Fig. 2. Schematic representation of the PI3K/AKT/mTOR signaling pathway.

Fig.3. PI3K/AKT/mTOR inhibitors.

AKT inhibitors

AKT inhibitors can be grouped into three classes including lipid based phosphatidylinositol (PI) analogs, ATP-competitive inhibitors, and allosteric inhibitors. Perifosine, which is the most clinically studied AKT inhibitor, is a lipid-based PIanalog that targets the pleckstrin homology domain of AKT, preventing its translocation to the cell membrane. Amongthe three classes of AKT inhibitors, allosteric AKT inhibitors display highly specific selectivity for AKT isoforms. Considering the genetic background of ovarian cancer, allosteric AKT inhibitors such as MK2206 that can target both AKT1 and AKT2 might be the best agents for treating ovarian cancer.In clinical trials, AKT inhibitors have shown similar toxicities to those caused by PI3K inhibitors, such as hyperglycemia, rashes, stomatitis, and gastrointestinal side effects [25].

mTOR inhibitors

Rapamycin and its analogs Rapamycin (sirolimus), a potent inhibitor of mTORC1, was first isolated in 1975 from the bacterium Streptomyces hygroscopicus. Rapamycin inhibits mTORC1 by first binding to the intracellular protein FK506 binding protein 12 (FKBP12). The resultant rapamycin–FKBP12 complex then binds to the FKBP12–rapamycin-binding domain (FRB) of mTORC1 and inhibits the serine/threonine kinase activity of mTORC1 via an allosteric mechanism. In contrast to mTORC1, the rapamycin–FKBP12 complex cannot interact with the FRB domain of mTORC2, and thus,mTORC2 is generally resistant to rapamycin treatment [12]. As rapamycin displays very poor water solubility, which limits its clinical use, several soluble ester analogs of rapamycin (rapalogs) have been developed [12]. Currently, these analogs include temsirolimus, everolimus, and ridaforolimus. Temsirolimus and everolimus are formulated for intravenous and oral administration, respectively. Ridaforolimus was initially developed as an intravenous formulation, but an oral formulation was subsequently produced [12,28]. Clinically, rapalogs are generally well tolerated, with the most common side effects including stomatitis, rashes, fatigue, hyperglycemia, hyperlipidemia, hypercholesterolemia, and myelosuppression [3,12,25].

ATP-competitive inhibitors

Different from rapalogs, ATP-competitive inhibitors do not require co-factors such as FKBP12 to bind to mTOR. By competingwith ATP for theATP-binding sites of mTOR, this class of mTOR inhibitors can inhibit the kinase activity of both mTORC1 and mTORC2. Although there is a concern that the simultaneous inhibition of mTORC1 and mTORC2 might result in greater toxicities in normal tissues, ATP-competitive mTOR inhibitors have been shown to display stronger anti-proliferative activity than rapalogs across a broad range of cancers includingovarian cancer [12,15].

Metformin

Metformin,the most commonly prescribed oral anti-diabetic agent, has been shown to reduce the incidence of malignancies in patients with diabetes. The activation of 5′ adenosine monophosphateactivated protein kinase (AMPK) by metformin plays an important role in mediating the drug’s effects. AMPK activation results in the phosphorylation and activation of TSC2, which exerts inhibitory effects on mTORC1. Metformin-induced AMPK activation also reduces AKT activity by inhibiting insulin receptor substrate 1 (IRS-1). Ultimately, AMPK activation results in the inhibition of the PI3K/AKT/mTOR signaling pathway, making metformin an effective treatment for cancer [28].

mTORC1 inhibitors              mTORC1                      Dual PI3K/mTOR inhibitors

PI3K inhibitors                     Class I PI3K                   mTORC2

AKT inhibitors                        AKT                              mTORC ½  inhibitors

PI3K inhibitors

Pan-class I PI3K inhibitors Pan-class IPI3K inhibitors can inhibit the kinase activity ofall 4 isoforms of classI PI3K.The main advantage of pan-class IPI3K inhibitors is that most cancer cells express multiple PI3K isoforms with redundant oncogenic signaling functions. Early clinical trials have suggested that the most common toxicitiesof pan-class IPI3K inhibitors are hyperglycemia, skin toxicities, stomatitis, and gastrointestinal side effects. Of these, hyperglycemia is likely to be a mechanism-based toxicity given the well described role of PI3K in insulin receptor signaling [3,25].

Isoform-selective PI3K inhibitors

This class of agents target the specific PI3K p110 isoforms involved in particular types of cancer. The p110α isoform (which is encoded by the PIK3CA gene) is a frequent genetic driver (PIK3CA mutations) of ovarian cancer, whereas p110β activity is known to be essential in cancer cells lacking PTEN. As for the p110δ isoform, it plays a fundamental role in the survival of normal B cells and is implicated in malignancies affecting this lineage. Thus, the main theoretical advantage of these inhibitors is that they have the potential to completely block the relevant target whilst causing limited toxicities compared with pan-PI3K inhibitors. Consistent withthese findings, preclinical studies have detected significant activities of PI3Kα inhibitor in tumors exhibiting PIK3CA mutations, PI3Kβ inhibitors in tumors with PTEN loss, and PI3Kδ inhibitors in hematologic malignancies. In addition, PI3Kδ inhibitors have already shown very promising activity in patients with chronic lymphocytic leukemia [26].

Dual PI3K/mTOR inhibitors

Structural similarities between the ATP-binding domain of p110 and the catalytic domain of mTOR have led to the development of a class of agents that inhibit both class I PI3K and mTORC1/2. Theoretically, dual mTOR/PI3K inhibitors should lead to more complete suppression of the PI3K/AKT/mTOR pathway than targeting either component independently.In agreement with this, in preclinical studies of ovarian cancer dual PI3K/mTOR inhibitors were found to exhibit greater in vitro and in vivo anti-tumor activity than mTOR inhibitors alone [27]. The safety profile of these inhibitors is similar to that of pan-PI3K inhibitors, with common adverse events including nausea, diarrhea, fatigue, and vomiting [3,25]. 


11.1.11 Endogenous, hyperactive Rac3 controls proliferation of breast cancer cells by a p21-activated kinase-dependent pathway

Mira JP1, Benard V, Groffen J, Sanders LC, Knaus UG.
Proc Natl Acad Sci U S A. 2000 Jan 4; 97(1):185-9.

Uncontrolled cell proliferation is a major feature of cancer. Experimental cellular models have implicated some members of the Rho GTPase family in this process. However, direct evidence for active Rho GTPases in tumors or cancer cell lines has never been provided. In this paper, we show that endogenous, hyperactive Rac3 is present in highly proliferative human breast cancer-derived cell lines and tumor tissues. Rac3 activity results from both its distinct subcellular localization at the membrane and altered regulatory factors affecting the guanine nucleotide state of Rac3. Associated with active Rac3 was deregulated, persistent kinase activity of two isoforms of the Rac effector p21-activated kinase (Pak) and of c-Jun N-terminal kinase (JNK). Introducing dominant-negative Rac3 and Pak1 fragments into a breast cancer cell line revealed that active Rac3 drives Pak and JNK kinase activities by two separate pathways. Only the Rac3-Pak pathway was critical for DNA synthesis, independently of JNK. These findings identify Rac3 as a consistently active Rho GTPase in human cancer cells and suggest an important role for Rac3 and Pak in tumor growth.

Uncontrolled cell proliferation is a major feature of cancer. Experimental cellular models have implicated some members of the Rho GTPase family in this process. However, direct evidence for active Rho GTPases in tumors or cancer cell lines has never been provided. In this paper, we show that endogenous, hyperactive Rac3 is present in highly proliferative human breast cancer-derived cell lines and tumor tissues. Rac3 activity results from both its distinct subcellular localization at the membrane and altered regulatory factors affecting the guanine nucleotide state of Rac3. Associated with active Rac3 was deregulated, persistent kinase activity of two isoforms of the Rac effector p21-activated kinase (Pak) and of c-Jun N-terminal kinase (JNK). Introducing dominant-negative Rac3 and Pak1 fragments into a breast cancer cell line revealed that active Rac3 drives Pak and JNK kinase activities by two separate pathways. Only the Rac3–Pak pathway was critical for DNA synthesis, independently of JNK. These findings identify Rac3 as a consistently active Rho GTPase in human cancer cells and suggest an important role for Rac3 and Pak in tumor growth.

Rac proteins are members of the Rho GTPase family and act as molecular switches in regulating a variety of biological response pathways, including cell motility, gene transcription, cell transformation, and cell-cycle progression (1). The Rac family includes Rac1, the myeloid-lineage-specific Rac2, and the recently cloned Rac3 proteins (2). Rac3 differs from Rac1 and Rac2 in two domains, the insert region and the C terminus, which influence transformation (3, 4), interaction with guanine nucleotide exchange factors (GEFs) (5, 6), and subcellular localization (7, 8). Small GTPases, including Rac, cycle between an inactive GDP-bound state and an active GTP-bound state. Two classes of regulatory factors, GTPase-activating proteins (GAPs) and GEFs, determine by their opposing effects the ratio of GDP versus GTP, which is bound to the GTPase (1). GAP proteins increase the intrinsic rate of GTP hydrolysis, rendering the GTPase inactive, whereas GEFs enhance the exchange of bound GDP for GTP, thereby activating the protein. Active Rac regulates distinct downstream signaling pathways by interacting with specific effector proteins, including a family of serine-threonine protein kinases termed Paks (p21-activated kinases) (9–11).

Apart from its well documented role in cytoskeletal rearrangements in growth factor-stimulated cells (12), Rac1 is required for Ras-induced malignant transformation and is involved in transcription and growth control (1, 13, 14). Recently, the importance of the Rac effector Pak in cell transformation has been highlighted by inhibiting RasV12- and Rac1V12-induced transformation of Rat-1 fibroblasts with a catalytically inactive form of Pak (15, 16). The involvement of Rac1 in driving cell-cycle progression through the G1 phase and stimulating DNA synthesis has been shown by introducing dominant-active and -negative Rac1 mutants into fibroblasts (17, 18). However, the signaling pathways used by Rac to control mitogenesis and proliferation still remain poorly understood. Overexpression of constitutively active Rac-effector-domain mutants in fibroblasts indicated that although Rac1 mediated cyclin D1 transcription by Pak in NIH 3T3 cells (19), Pak was not involved in the DNA synthesis of Swiss 3T3 cells (20). Accumulating evidence, however, suggests higher complexity where Pak-binding proteins, such as the GEF Pix, contribute to the Rac–Pak interaction in vivo and influence subsequent cellular functions (21–23).

All biological functions listed above have been attributed to Rac1 in experimental cell systems using overexpression or microinjection of mutant forms. Endogenously active Rho GTPases, including Rac, have not yet been observed. In this paper, we describe a consistently active Rac3 GTPase leading to hyperactivity of its effector protein kinase, Pak, in human breast cancer-derived epithelial cell lines. Analysis of growth properties and DNA synthesis revealed that both proteins are required to convey the highly proliferative phenotype displayed by these cells.

Highly Proliferating Cancer Cells Contain Hyperactive Rac3.

Comparison of growth rates among several breast cancer cell lines showed that three lines (MDA-MB 435, T47D, and MCF 7) grew faster under normal and low-serum conditions (Fig. ​(Fig.1).1). Interestingly, in contrast to MDA-MD 231 and Hs578T cells, these three highly proliferative cell lines do not possess mutated Ras (28, 29). To assess whether Rho GTPases drive this cellular phenotype, we determined whether these cell lines contained active GTP-bound Rac or Cdc42. We used a recently described assay, the PBD-pulldown assay (24), which is based on the specific binding of the GTP-bound forms of Rac and Cdc42 to the PBD of Pak (10). Neither active Rac1 (Fig. ​(Fig.22A) nor active Cdc42 (data not shown) could be detected in any of the cell lysates obtained from serum-starved cells. However, both proteins were detected if the PBD-pulldown assay was performed with in vitro guanosine 5′-[γ-thio]triphosphate (GTP[γS])-loaded cell lysates, confirming that Rac1 and Cdc42 were present in their inactive GDP-bound forms in these cells (Fig. ​(Fig.22A for Rac1). Next we wanted to determine whether active Rac3 was present in breast cancer cell lines. Because Rac3 effectors have not yet been characterized, we demonstrated by overlay binding and kinase assays that Rac3 bound to and activated Pak as efficiently as Rac1 (data not shown). We verified that the PBD-pulldown assay specifically detected the active GTP-bound form of Rac3 (GTP[γS]-loaded Rac3wt or Rac3V12, Fig. ​Fig.22B) and not the inactive form. To probe for Rac3 protein in breast cell lysates, a Rac3-specific antibody was used. GST-PBD-pulldown experiments from cell lysates revealed the presence of hyperactive Rac3 in highly proliferative cell lines (MDA-MB 435, T47D, and MCF 7), but not in normal breast cell lines or in less proliferative breast cancer cells (Fig. ​(Fig.22C). Additionally, as indicated by the virtual absence of Rac3 in the supernatant of the PBD pulldown, all the Rac3 protein present in these cell lines was active (Fig. ​(Fig.22C). To demonstrate that consistent Rac3 activation is not limited to cell lines, we performed an initial screening of human metastatic breast cancer tissues and found active Rac3 in one of three samples, underlining the potential clinical relevance of the cellular findings (Fig. ​(Fig.22D).

Differential growth rates of human breast cell lines.  pq0104939001

Differential growth rates of human breast cell lines. pq0104939001

Differential growth rates of human breast cell lines.
http://www.ncbi.nlm.nih.gov/pmc/articles/PMC26637/bin/pq0104939001.jpg

Figure 1 Differential growth rates of human breast cell lines. Human breast cell lines, including HMEC 184 (○), MDA-MB 231 (▵), Hs578T (□), MDA-MB 435 (●), T47D (▴), and MCF 7 (♦), were grown in 10% serum (A) or 0.5% serum (B) conditions. The cells were split in duplicate over 6-well plates at 5 × 10⁵ cells per well and counted daily with a hemocytometer for 4 days. Data shown in A and B are representative of three independent experiments.

http://www.ncbi.nlm.nih.gov/pmc/articles/PMC26637/bin/pq0104939002.jpg

Figure 2 Active Rac3 is present in highly proliferative cell lines and in human breast cancer tissue. (A and C) Cell lysates from serum-starved breast cancer cell lines without (A and C) or after (+) GTP[γS] loading (A) were incubated with 10 μg of GST-PBD. Active Rac proteins (PBD pulldown) were detected by immunoblot with anti-Rac1 (A) or anti-Rac3 antibodies (C). Blotting of PBD supernatants revealed the GDP-bound form of Rac3 in lysates. Equal amounts of Rac3 protein were detected by immunoblot (IB) in all cell lines. (B) A PBD-pulldown assay of extracts from HeLa cells expressing Myc-Rac3wt or -Rac3 mutants, followed by an anti-Myc immunoblot, detected only active Rac3 (GTP[γS] loading or Rac3V12). (D) PBD pulldown of lysates obtained from three different human metastatic breast cancer tissues, followed by anti-Rac1 and anti-Rac3 immunoblots, revealed active Rac3 in tissue 1. (E) PBD pulldown of lysates derived from MDA-MB 435 and MDA-MB 231 cells expressing LacZ control or Myc-Rac3wt without or after in vitro GTP[γS] loading. Consistent activation of Myc-Rac3wt occurred only in MDA-MB 435 cells. (F) Subcellular localization of Rac1 and Rac3. Cytosol (c) and membranes (m) were obtained after nitrogen cavitation and fractionation of breast cancer cell lines and immunoblotted with anti-Rac1 and anti-Rac3 antibodies. All blots are representative of at least three experiments.

Subcellular Localization and GTPase-Regulatory Factors Influence Rac3 Activity.

Constitutive activation of Ras proteins in cancer cells is often caused by activating point mutations at the switch I or II regions (29). cDNA cloning and complete sequence analysis of full-length Rac3 did not reveal any mutations in the breast cell lines studied and did not explain the observed Rac3 activation. GTPase-regulatory proteins such as GEFs and GAPs, which are usually regulated by upstream stimuli, control cycling between the active and inactive forms of Rac. To confirm the presence of an altered regulatory mechanism involved in Rac3 activation, we used the PBD-pulldown assay to analyze the activation state of Myc-tagged Rac3wt transfected into either MDA-MB 231, a cell line harboring only GDP-Rac3, or MDA-MB 435, a cell line that contains endogenous, active GTP-Rac3. Fig. ​Fig.22E shows that activated Myc-Rac3 was detected only in the MDA-MB 435 cell line, confirming that the regulation of the GDP/GTP state of Rac3 was altered in these cells. We then investigated several upstream stimuli that have been shown to affect GTPase-regulatory proteins (28, 30–32). We excluded the possibility of an autocrine growth-stimulatory loop by culturing MDA-MB 231 cells with the conditioned medium from MDA-MB 435, which did not affect the Rac3 activation state (data not shown). Treatment of cell cultures with phosphatidylinositol 3-kinase or tyrosine kinase inhibitors, including wortmannin, LY294002, and genistein, did not decrease Rac3 activation (data not shown). At this point, we speculated that an oncogenic, Rac3-specific GEF is present in certain breast cancer cells. GEFs possess a pleckstrin homology domain that is essential for membrane localization and for their oncogenic properties (5, 33). Analysis of the subcellular localization of the Rac family members revealed that Rac3 is located in the membranes of breast epithelial cell lines, independently of its activation state (Fig. ​(Fig.22F). In contrast, endogenous Rac1 in its inactive GDP-bound state was essentially cytosolic (Fig. ​(Fig.22F). Thus, the distinct localization of Rac3 and Rac1 may contribute to their different activation states in certain breast cancer cell lines. It is conceivable that the highly proliferative cell lines (Fig. ​(Fig.1)1) express a constitutively active, membrane-bound Rho GEF that activates adjacent Rac3 protein. This hypothesis was further supported by using an hydroxymethylglutaryl-CoA reductase inhibitor, lovastatin, that interferes with isoprenoid synthesis and thereby with posttranslational processing of GTPases. Unprocessed Rac3 from lovastatin-treated MDA-MB 435 cells was predominantly cytosolic and inactive (GDP-Rac3) (data not shown). The requirement of membrane localization for consistent Rac3 activity was further supported by using a Rac3S189 mutant. Replacing cysteine-189 of the CAAX box with serine abolishes isoprenoid incorporation, rendering the GTPase cytosolic. This Rac3 mutant remained in its inactive GDP-bound state when transfected into MDA-MB 435 cells (data not shown).

Several Rho GTPase-regulating GEFs have been identified (5), including the Rac1-specific GEF Tiam-1, which has been linked to tumors such as invasive T-lymphomas (34). Although Tiam-1 is expressed in virtually all tissues, no evidence of oncogenic truncations or alternative splicing of Tiam-1 transcripts has been found (35). A variation of Tiam-1 transcript levels in certain cancer cell lines might lead to overexpression and possibly activation of Tiam-1 protein. However, the activation state of Rac3 protein in the cell lines used in this study does not seem to correlate with Tiam-1 expression levels as reported by Habets et al. (35). Hyperactivity of Rac3 in cancer cells could also result from an absent or dysfunctional Rac3-specific GAP protein. By accelerating the intrinsic GTP hydrolysis rate, GAPs render the GTPase inactive and act as tumor suppressors. Deletion or mutations in the RasGAP gene NF1 and the RhoGAP homologs bcr and DLC-1 have been reported in cancer cells (36, 37).

Active Rac3 Drives Epithelial Cell Proliferation.

To study whether active Rac3 could account for the high proliferation rate of certain breast cancer cells, we expressed a constitutively active Rac3 mutant (Rac3V12) in normal mammary epithelial cells (HMEC 184) that contain only GDP-Rac3 (Fig. ​(Fig.22C). Rac3V12 expression significantly increased the incorporation of BrdUrd into nascent DNA (Fig. ​(Fig.3),3), emphasizing that transfection of active Rac3 drives epithelial cell proliferation.

Rac3V12 induces DNA synthesis in human mammary epithelial cells pq0104939003

Rac3V12 induces DNA synthesis in human mammary epithelial cells pq0104939003

http://www.ncbi.nlm.nih.gov/pmc/articles/PMC26637/bin/pq0104939003.jpg

Rac3V12 induces DNA synthesis in human mammary epithelial cells

Figure 3 Rac3V12 induces DNA synthesis in human mammary epithelial cells. HMEC 184 cells, infected with recombinant LacZ or Rac3V12 Semliki Forest virus, were allowed to express protein for 14 h in serum-free medium containing 10 μM BrdUrd. Cells were fixed and stained with anti-Myc antibody for Myc-Rac3V12 expression level (Upper) or with FITC-conjugated anti-BrdUrd antibody for BrdUrd incorporation (Lower). The presence of bright fluorescent nuclei indicates BrdUrd-positive cells. The percentage was calculated after counting 400 cells in each of three independent experiments.

Hyperactive Pak and c-Jun Kinases in Cancer Cells.

The signaling cascade utilized by Rac proteins to control cell proliferation still remains to be identified (1, 9), but might involve Paks. We analyzed Pak activity in cell lysates derived from serum-starved breast cancer cell lines by using in-gel kinase assays and by usingin vitro kinase assays after immunoprecipitation with Pak-specific antibodies. Pak activity was increased 4- to 6-fold in the three cell lines containing active Rac3 (Fig. ​(Fig.44A). This increased kinase activity was mainly associated with the Pak2 isoform, which can phosphorylate and positively regulate Raf-1 activity, another key component in cell proliferation (38–40).

http://www.ncbi.nlm.nih.gov/pmc/articles/PMC26637/bin/pq0104939004.jpg

Figure 4 Rac3 activates Pak and JNK by two different pathways. (A) Breast cancer cell lysates from serum-starved cells were analyzed for Pak and JNK activities. Pak activities in cell lysates were analyzed by in-gel kinase assays. JNK activity was determined by …

Intracellular Rac-regulated signaling pathways impinge on distinct mitogen-activated protein kinase cascades. Constitutively active Rac has been shown to positively regulate the activity of the stress-activated kinases JNK and p38 (1). Moreover, ERK activity can be indirectly stimulated by Rac or mediated by crosstalk between the distinct mitogen-activated protein kinase cascades (1, 41). Determination of distinct mitogen-activated protein and stress-activated protein kinase activities in the breast cell lines studied here showed that consistent Rac3 and Pak kinase activities were associated with enhanced JNK activity (Fig. ​(Fig.44A). In contrast, no correlation existed between p38 or ERK kinase activities and active Rac3 or Pak (data not shown).

Rac3 Triggers Pak and JNK Activities by Separate Pathways.

To determine whether the highly proliferative phenotype of breast cancer cells depends directly on a consistently active Rac3-Pak-JNK cascade, we used virus-mediated protein expression in MDA-MB 435 cells to examine the ability of Rac3 and Paks to control JNK activation and cellular proliferation. The importance of Pak as an effector protein in Rac-mediated activation of JNK is still controversial and seems to be cell-type-dependent (42). Expression of the PBD domain, which controls the activity of both Rac and Pak (21), completely inhibited Pak and JNK stimulation (Fig. ​(Fig.44B). The mutation of leucine to phenylalanine at position 107 of the PBD domain suppresses the autoinhibitory function of the PBD (21). Thus, PBD F107 will act only to sequester active Rac3 and blocks its ability to bind and activate endogenous effectors. Expression of either dominant-negative Rac3N17 or PBD F107 almost completely blocked Pak and JNK activities, demonstrating that Rac3 is upstream of these proteins (Fig. ​(Fig.44B). Moreover, Pak kinase activity can be inhibited independently of Rac3 by overexpressing the kinase autoinhibitory domain, PID, which does not interact with Rac (21, 43). Transfection of PID into MDA-MB 435 cells dramatically inhibited Pak activity as expected, but did not decrease JNK activation (Fig. ​(Fig.44B). Our results indicate that in MDA-MB 435 cells, consistent stimulation of JNK by Rac3 is independent of PAK activity and that Rac3 initiates two different pathways involving Pak and JNK, respectively.

Rac3 and Pak Are Both Required for Breast Cancer Cell Proliferation.

We subsequently determined which of these two Rac3 pathways promoted the increased cell proliferation in breast cancer cell lines with hyperactive Rac3. We studied the consequence of expressing inhibitory Rac mutants or Pak fragments on DNA synthesis. LacZ-expressing MDA-MB 435 cells still proliferated in low-serum conditions and 35% incorporated BrdUrd (Fig. ​(Fig.5).5). This percentage increased to 50% when Rac3wt, which will be partially activated in these cells (Fig. ​(Fig.22E), is expressed (Fig. ​(Fig.55 Bottom Right). In contrast, expression of inhibitory proteins, including Rac3N17 or the PBD that suppressed Pak and JNK activation (Fig. ​(Fig.44B), almost completely blocked S-phase entry, as indicated by the absence of BrdUrd incorporation (Fig. ​(Fig.5).5). Expression of the PID that inhibited Pak kinase activity without affecting JNK stimulation (Fig. ​(Fig.44B) also arrested proliferation in MDA-MB 435 cells (Fig. ​(Fig.5).5). These experiments emphasize the crucial role of active Rac3 for DNA synthesis in breast cancer cell lines and demonstrate that Pak kinase activity is necessary for Rac3-induced proliferation.

Rac3 mediates proliferation in MDA-MB 435 cells  pq0104939005

Rac3 mediates proliferation in MDA-MB 435 cells pq0104939005

Rac3 mediates proliferation in MDA-MB 435 cells

http://www.ncbi.nlm.nih.gov/pmc/articles/PMC26637/bin/pq0104939005.jpg

Figure 5 Rac3 mediates proliferation in MDA-MB 435 cells by a Pak-dependent pathway. MDA-MB 435 cells growing in 0.5% FBS were infected with Semliki Forest virus encoding for LacZ, Rac3N17, Pak1-PBD, Pak1-PBD F107, Pak1-PID, or Rac3wt. After 12 to14 h of protein expression in serum-free medium, 20 μM BrdUrd was added for 20 min before the cells were fixed and stained with anti-Myc antibody and phalloidin for expression (Top) or with FITC-conjugated anti-BrdUrd antibody for BrdUrd incorporation (Lower five micrographs). The presence of bright fluorescent nuclei indicates BrdUrd-positive cells. The percentage was calculated after counting 400 cells in each of four independent experiments.

Our results establish the persistent activation of a small Rho GTPase, Rac3, and the effector kinase Pak in human breast cancer cells. In contrast to Rac1, endogenous Rac3 is localized at the plasma membrane in both guanine nucleotide states. It seems likely that a Rac3 regulatory protein is altered or deleted in highly proliferating cancer cells, and that its specificity toward Rac3 results from the adjacent location of both proteins at the membrane and/or from discrete Rac3 domains, which convey a specific interaction. The cytoskeletal phenotypes of serum-starved breast cancer cells, such as ruffles or lamellipodia typical of Rac1 protein activation, did not seem to correlate with the GDP versus GTP state of endogenous Rac3. This may suggest that Rac family members are specialized in certain cellular functions, as already reported for Rac2 in leukocyte phagocytosis (44) and now demonstrated by us for Rac3 in cancer cell proliferation. Our studies establish further that endogenous, active Rac3 is essential for breast cancer cell proliferation via a Pak-dependent pathway. Paks have been shown to directly phosphorylate Raf kinase, which binds to retinoblastoma protein and regulates its function (45), and to interact with cyclin-dependent kinases to up-regulate cyclin D1 expression (46). Initial screening of various human cancer-derived cell lines revealed the presence of hyperactive Rac3 and Pak kinase in other types of highly proliferating tumors (data not shown). Further investigations, primarily in animal models and clinical settings, will be necessary to assess whether loss of Rac3 and Pak regulation correlates with certain breast tumor stages and is accompanied by specific alterations in cell-cycle regulators. Approaches to inhibit Rac3 or Pak activity would then open a new avenue for cancer therapeutics.

11.1.12 Curcumin-could-reduce-the-monomer-of-ttr-with-tyr114cys-mutation via autophagy in cell model of familial amyloid polyneuropathy.

Li H1, Zhang Y1, Cao L1, Xiong R1, Zhang B1, Wu L1, Zhao Z1, Chen SD2
Drug Des Devel Ther. 2014 Oct 31; 8:2121-8
http://dx.doi.org:/10.2147/DDDT.S70866.

Transthyretin (TTR) familial amyloid polyneuropathy (FAP) is an autosomal dominant inherited neurodegenerative disorder caused by various mutations in the transthyretin gene. We aimed to identify the mechanisms underlying TTR FAP with Tyr114Cys (Y114C) mutation. Our study showed that TTR Y114C mutation led to an increase in monomeric TTR and impaired autophagy. Treatment with curcumin resulted in a significant decrease of monomeric TTR by recovering autophagy. Our research suggests that impairment of autophagy might be involved in the pathogenesis of TTR FAP with Y114C mutation, and curcumin might be a potential therapeutic approach for TTR FAP.

Transthyretin (TTR) familial amyloid polyneuropathy (FAP) is an autosomal dominant inherited disease, characterized clinically by progressive sensory, motor, and autonomic impairment, which typically lead to death around a decade after diagnosis.1 Since the first identification of TTR with Val30Met mutation (TTR V30M), the most common gene mutation in FAP patients, more than 100 TTR mutations have been found to cause FAP.2 However, the detailed pathogenesis underlying TTR FAP remains undefined. Previous studies of the TTR V30M mutant have shown that misfolding and self-aggregation of TTR are implicated in the pathogenesis of TTR FAP involving abnormal endoplasmic reticulum (ER) stress.3

Corresponding to the various TTR gene mutations and a wide range of geographical distributions, FAP presents diverse characteristics in genotype-phenotype in different regions. We have recently published the first report of a TTR Tyr114Cys (TTR Y114C) mutation in a Chinese family with TTR FAP.4 Compared with TTR V30M, the TTR Y114C mutation showed different clinical manifestations, and was also observed in a Japanese family.5,6 This suggests that the pathogenesis of the TTR Y114C and TTR V30M mutations might be different. Studies focused on monomer generation and tetramer depolymerization have been performed.1,2 However, the mechanisms underlying the clearing of the abnormally increased monomer are unknown.

Autophagy is the major lysosomal pathway via which cells degrade intracytoplasmic protein. It is widely accepted that autophagy plays a key role in the process of amyloid deposition in certain neurodegenerative diseases, including alpha-synuclein, beta peptides, tau oligomers, and misfolded prion protein.7 Therefore, autophagy may be involved in degradation of the TTR monomer in TTR FAP.

Curcumin and its analogs have demonstrated a protective effect in many diseases involving antimicrobial, antitubercular,8 and anticancer mechanisms,9 and they can also modulate innate immunity.10 Of note, curcumin has been shown to promote autophagy.11 Therefore, we hypothesized that autophagy might be involved in the pathogenetic mechanism of the TTR Y114C mutation in TTR FAP and curcumin might have potential therapeutic role in this disease. In this study, we aimed to identify the role of autophagy in the pathogenetic mechanism of TTR FAP and to assess the therapeutic effect of curcumin in the disease.

TTR Y114C mutation led to increased monomeric TTR and impaired autophagy in vitro

To investigate the alteration of monomeric TTR with different mutations, we generated HEK293T cell lines with wild-type TTR, TTR Y114C, and stable overexpression of TTR V30M. Wild-type TTR represented the normal control and TTR V30M represented the positive control. Western blotting analysis of the TTR level in the cells when cultured for 24 hours showed that the monomer of TTR Y114C and TTR V30M was increased by approximately 2.3 times and 2.78 times, respectively, compared with wild-type TTR (Figure 1A and B). Mutation of TTR Y114C was related to the increase in monomeric TTR, as well as the mutation of TTR V30M.

Changes in autophagy and endoplasmic reticulum stress related to wild-type TTR, TTR V30M, and TTR Y114C dddt-8-2121Fig1

Changes in autophagy and endoplasmic reticulum stress related to wild-type TTR, TTR V30M, and TTR Y114C dddt-8-2121Fig1

Changes in autophagy and endoplasmic reticulum stress related to wild-type TTR, TTR V30M, and TTR Y114C

http://www.ncbi.nlm.nih.gov/pmc/articles/PMC4222630/bin/dddt-8-2121Fig1.jpg

Figure 1 Changes in autophagy and endoplasmic reticulum stress related to wild-type TTR, TTR V30M, and TTR Y114C.

Next we investigated the activation of several markers associated with ER stress, including ER-resident chaperone BiP and p-eIF2α. Our results showed the levels of BiP and p-eIF2α is higher in TTR V30M than those in wild-type TTR. In contrast, BiP and p-eIF2α levels in TTR Y114C were similar to those in wild-type TTR (Figure 1A and C), indicating ER stress might not be the main pathogenetic mechanism for the TTR Y114C mutation. We then investigated whether autophagy plays a role in the mechanism of TTR Y114C mutation. LC3-II is well known to be a robust marker of autophagosomes, and immunofluorescent staining of LC3-II can be used to assay for autophagosome formation. A high ratio of LC3-II to LC3-I would indicate induction of autophagy. Our results revealed that the ratio of LC3-II/I was markedly decreased for TTR Y114C, but less suppressed for TTR V30M (Figure 1A and D). Likewise, a significant decrease in LC3-II immunoreactivity was detected in TTR Y114C (Figure 1E). The results of Western blotting and immunofluorescence indicated that autophagy in TTR Y114C was significantly downregulated. Therefore, impaired autophagy might be responsible for the pathogenesis of TTR Y114C mutation.

Curcumin decreased monomeric TTR by promoting autophagy

The effects of curcumin were investigated in TTR Y114C and wild-type TTR stable overexpressed HEK293T cells. Curcumin did not show toxic effects in the stable overexpressed cell lines at curcumin concentrations below 10 µM (Figure 2A and B). We chose 5 µM as the experimental concentration, because it is the minimal effective concentration of curcumin in these cell lines. Further, we wanted to determine whether curcumin could decrease monomeric TTR by promoting autophagy at the minimal effective concentration. Therefore, we used curcumin (2.5 µM and 5 µM) as a protective agent to assess whether it could decrease monomeric TTR with mutation by promoting autophagy. Quantification of LC3-II and LC3-I indicated markedly higher activation of LC3 in TTR Y114C treated with curcumin 5 µM for 24 hours (Figure 2D). In contrast, treatment with curcumin at different concentrations could not activate LC3 in wild-type TTR (Figure 2C, E). We next examined the ratio of monomers to tetramers in TTR Y114C, which was significantly decreased after 24 hours of treatment with 5 µM curcumin compared with no treatment with curcumin (Figure 2D and F). However, for wild-type TTR, the ratio of monomers to tetramers was unchanged after treatment with curcumin (Figure 2C and E). These results indicate that treatment with curcumin 5 µM for 24 hours was able to decrease the monomer in the TTR Y114C mutation by promoting autophagy.

Curcumin decreased monomeric TTR by promoting autophagy dddt-8-2121Fig2

Curcumin decreased monomeric TTR by promoting autophagy dddt-8-2121Fig2

Curcumin decreased monomeric TTR by promoting autophagy

http://www.ncbi.nlm.nih.gov/pmc/articles/PMC4222630/bin/dddt-8-2121Fig2.jpg

Figure 2 Curcumin decreased monomeric TTR by promoting autophagy.

Protective effect of curcumin on TTR Y114C could be partially blocked by 3-MA

To further validate whether the decrease in monomer by curcumin in our experiments was mediated by autophagy, 3-MA, an inhibitor of autophagosome formation, was implied to negatively regulate autophagy. 3-MA (1 mM) was added to the cell culture medium 2 hours before curcumin and incubated for 24 hours. Analysis of LC3, tetrameric TTR, and monomeric TTR from TTR Y114C revealed that 3-MA partly reversed the LC3 II activation induced by curcumin and increased the monomer of TTR Y114C (Figure 3). These results confirm that curcumin induced the decrease in the TTR Y114C monomer by promoting the autophagy pathway.

http://www.ncbi.nlm.nih.gov/pmc/articles/PMC4222630/bin/dddt-8-2121Fig3.jpg

Figure 3 Protective effect of curcumin on TTR Y114C could be partially blocked by 3-MA.

Discussion

TTR FAP is a severe autosomal dominant inherited disease, for which the treatment options are limited. Liver transplantation performed early in the course of the disease is the only therapeutic strategy known to stabilize this neuropathy.1,13 More recently, tafamidis meglumine, a potent inhibitor of misfolding and deposition of mutated TTR, has completed an 18-month, placebo-controlled Phase II/III clinical trial for the treatment of FAP.14 However, in June 2012, the US Food and Drug Administration Peripheral and Central Nervous System Drugs Advisory Committee rejected this drug, stating a lack of convincing data supporting its efficacy.15 Hence, it is important to identify the pathogenetic mechanism of FAP to find an alternative effective treatment strategy.

Accumulating studies focused on the TTR mutation gene and protein have provided insights into the pathogenesis of TTR FAP, including decreased stability of TTR tetramers, conformational change in the crystal structure of variant TTR, altered kinetics of denaturation, and disturbing endoplasmic ER quality control system.1,16–18 Previous studies have demonstrated that increased levels of ER stress are correlated with extracellular TTR deposition. Two ER stress markers, BiP and p-eIF2α, have been observed to be present and upregulated in the salivary gland tissue of FAP patients.3 However, the precise molecular mechanisms underlying TTR FAP and its phenotypic heterogeneity are not yet fully understood.

Our current study investigated whether the two mutations, TTR Y114C and TTR V30M, share the same pathogenesis and evaluated the effect of pathogenic mutations on the clearance of the monomer. Our results show that the ratio of LC3-II/I was markedly decreased, while BiP and p-eIF2α levels remained constant in TTR Y114C when compared with wild-type TTR and TTR 30M. The results of our research indicate the impaired autophagy contributed to the TTR Y114C mutation, but not ER stress. This observation indicates that abnormal accumulation of TTR caused by a different mutation might be cleared by different pathways, and more studies are necessary to confirm whether this difference applies to other TTR mutations.

Curcumin is known to have neuroprotective properties through a variety of mechanisms.8–11 Our research indicates that curcumin decreased the monomeric TTR by promoting autophagy, and without toxic effects. Moreover, this protective effect of curcumin on TTR Y114C could be partially blocked by 3-MA. Pullakhandam et al showed that curcumin binds to wild-type TTR and prevents urea-induced perturbations in the tertiary structure of TTR in vitro.19 Recently, Ferreira et al reported that dietary curcumin modulated TTR amyloidogenicity.20 Therefore, curcumin might be an effective therapy for FAP involving multiple molecular pathways.

Overall, our findings show that abnormal accumulation of TTR caused by different mutations might be cleared in different ways, and curcumin might be an effective therapy for FAP by promoting autophagy. Further studies are necessary to determine whether this phenomenon exists in other TTR mutations.

Stephen Williams, PhD

For PI3K and related inhibitors of PI3K/AKT/mTOR i would refer you to two people who should be in the discussion of this signaling pathway and PI3K/AKT inhibitors used for chemotherapy. The first is Dr. Mien-Chie Hung and the second is Dr. Gordon Mills. They both had been at MD Anderson and developed some of the first inhibitors as well as the earliest discoveries of overactivity of PI3K/AKT in ovarian cancer.
Next the field had never progressed any inhibitors past Stage II as there has been some serious toxicities seen in preclinical phases (most long term tox studies are done after patients are enrolled in phase I).

I would refer to three papers

Discovery of GSK2126458, a Highly Potent Inhibitor of PI3K and the Mammalian Target of Rapamycin http://pubs.acs.org/doi/abs/10.1021/ml900028r

A new mutational AKTivation in the PI3K pathwayhttp://www.researchgate.net/publication/6146395_A_new_mutational_AKTivation_in_the_PI3K_pathway

These will show how inhibitors of certain isoforms of PI3K (namely delta) had to be developed to circumvent some of the severe toxicity seen with the earliest inhibitors (wortmanin and LY294002.

Also
Take your PIK: phosphatidylinositol 3-kinase inhibitors race through the clinic and toward cancer therapy http://mct.aacrjournals.org/content/8/1/1.full

Targeting the phosphoinositide 3-kinase (PI3K) pathway in cancerhttp://www.ncbi.nlm.nih.gov/pmc/articles/PMC3142564/

Development of PI3K Inhibitors in Breast Cancer http://www.onclive.com/publications/contemporary-oncology/2014/November-2014/Development-of-PI3K-Inhibitors-in-Breast-Cancer by Aggerwal nice review

Phosphatidylinositol 3-kinase (PI3K) inhibitors as cancer therapeuticshttp://www.ncbi.nlm.nih.gov/pmc/articles/PMC3843585/ will explain about some of the toxicities and describes the one PI3K that has made it to phase II

Most of them have failed and I believe now are being thought as an adjuvant not front line therapy

Aurelian Udristioiu

Aurelian

Aurelian Udristioiu

Lab Director at Emergency County Hospital Targu Jiu

In experimental models, disrupting the MDM2–p53
interaction restored p53 function and sensitized tumors to
chemotherapy or radiotherapy. (Kojima et al., 2005). This
strategy could be particularly beneficial in treating
cancers that do not harbor TP53 mutations. For example
in hematologic malignancies, such as multiple myeloma,
chronic lymphocytic leukemia (CLL), acute lymphoblastic
leukemia (ALL), acute myeloid leukemia (AML), and
Hodgkin’s disease, the induction of p53 – using a small
MDM2-inhibitor molecule, nutlin-3 – can induce the
apoptosis of malignant cells. Nutlins are a group of cisimidazoline
analogs, first identified by Vassilev et al.
(2004), which have a high binding potency and selectivity
for MDM2. Crystallization data have shown that nutlin-3
mimics the three residues of the helical region of the
trans-activation domain of p53 (Phe19, Trp23 and
Leu26), which are conserved across species and critical
for binding to MDM2 (Wade et al., 2010). Nutlin-3
displaces p53 by competing for MDM2 binding. It has
also been found that nutlin-3 potently induces apoptosis
in cell lines derived from hematologic malignancies,
including AML, myeloma, ALL, and B-cell CLL (Secchiero
et al., 2010).

Stephen J Williams, PhD

Now as far as PKM2 you would want to look at a company called Synta Pharmaceuticals and their inhibitor Elesclomal. elesclomol binds copper ions causing a change in conformation that enables its uptake through membranes and into cells. Elesclomol binds copper in an oxidative, positively charged state called Cu(II). Once inside mitochondria, the elesclomol-Cu(II) complex interacts with the energy production mechanism of the cell, or the electron transport chain. This interaction reduces the copper from Cu(II) to Cu(I), resulting in a cascade of reduction-oxidation, or redox, reactions, that causes a rapid increase of oxidative stress, disruption of mitochondrial energy production, and ultimately, triggering of the mitochondrial apoptosis pathway.

The important part is that it seemed, to prefer tumors which had lower LDH activity, meaning that these tumor cells actually did have a more active electron transport chain than tumors with high LDH (Warburg) and therefore in clinical trials the tumors with lower LDH activity responded more favorably.

http://www.drugs.com/clinical_trials/synta-pharmaceuticals-announces-updated-elesclomol-symmetry-data-presented-melanoma-xiii-8223.html for press release and study results

Read Full Post »

Mitochondrial Isocitrate Dehydrogenase and Variants

Writer and Curator: Larry H. Bernstein, MD, FCAP 

2.1.4      Mitochondrial Isocitrate Dehydrogenase (IDH) and variants

2.1.4.1 Accumulation of 2-hydroxyglutarate is not a biomarker for malignant progression of IDH-mutated low grade gliomas

Juratli TA, Peitzsch M, Geiger K, Schackert G, Eisenhofer G, Krex D.
Neuro Oncol. 2013 Jun;15(6):682-90
http://dx.doi.org:/10.1093/neuonc/not006

Low-grade gliomas (LGG) occur in the cerebral hemispheres and represent 10%–15% of all astrocytic brain tumors.1 Despite long-term survival in many patients, 50%–75% of patients with LGG eventually die of either progression of a low-grade tumor or transformation to a malignant glioma.2 The time to progression can vary from a few months to several years,3–5 and the median survival among patients with LGG ranges from 5 to 10 years.6,7 Among several risk factors, only age, histology, tumor location, and Karnofsky performance index have generally been accepted as prognostic factors for patients with LGG.8,9 As a prognostic molecular marker, only 1p19q codeletion was identified as such in pure oligodendrogliomas. However, this association was not seen in either astrocytomas or oligoastrocytomas.10

Somatic mutations in human cytosolic isocitrate dehydrogenases 1 (IDH1) were first described in 2008 in ∼12% of glioblastomas11 and later in acute myeloid leukemia, in which the reported mutations were missense and specific for a single R132 residue.11,12 Some gliomas lacking cytosolic IDH1 mutations were later observed to have mutations in IDH2, the mitochondrial homolog of IDH1.12 IDH mutations are the most commonly mutated genes in many types of gliomas, with incidences of up to 75% in grade II and grade III gliomas.13,14 Further frequent mutations in patients with LGG were recently identified, including inactivating alterations in alpha thalassemia/mental retardation syndrome X-linked (ATRX), inactivating mutations in 2 suppressor genes, homolog of Drosophila capicua (CIC) and far-upstream binding protein 1 (FUBP1), in about 70% of grade II gliomas and 57% of sGBM.15–17 The association between ATRX mutations with IDHmutations and the association between CIC/FUBP1 mutations and IDH mutations and 1p/19q loss are especially common among the grade II-III gliomas and remarkably homogeneous in terms of genetic alterations and clinical characteristics.16

It was thought that IDH mutations might be a prognostic factor in LGG, predicting a prolonged survival from the beginning of the disease.18–23 However, this assumption, as shown in our and other earlier studies, had to be corrected because survival among patients who have LGG with IDH mutations is only improved after transformation to secondary high-grade gliomas.18,19,24 Furthermore, it had already been demonstrated that an IDH mutation is not a biomarker for further malignant transformation in LGG.18 IDH1 and IDH2 catalyze the oxidative decarboxylation of isocitrate to α-ketoglutarate (α-KG) and reduce NADP to NADPH.25 The mutations inactivate the standard enzymatic activity of IDH112 and confer novel activity on IDH1 for conversion of α-KG and NADPH to 2-hydroxyglutarate (2HG) and NADP+, supporting the evidence thatIDH1 and 2 are proto-oncogenes. This gain of function causes an accumulation of 2HG in glioma and acute myeloid leukemia samples.26,27 The 2HG levels in cancers with IDH mutations are found to be consistently elevated by 10–100-fold, compared with levels in samples lacking mutations of IDH1 or IDH2.26,28Nevertheless, how exactly the production or accumulation of 2HG by mutant IDH might drive cancer development is not well understood.

In the present study, we postulate that intratumoral 2HG could be a useful biomarker that predicts the malignant transformation of WHO grade II LGG. We therefore screened for IDH mutations in patients with LGG and measured the accumulation of 2HG in 2 populations of patients, patients with LGG with and without malignant transformation, with use of liquid chromatography–tandem mass spectrometry (LC-MS/MS). Furthermore, we compared the concentrations of 2HG in LGG and their consecutive secondary glioblastomas (sGBM) to evaluate changes in metabolite levels during the malignant progression.

Objectives: To determine whether accumulation of 2-hydroxyglutarate in IDH-mutated low-grade gliomas (LGG; WHO grade II) correlates with their malignant transformation and to evaluate changes in metabolite levels during malignant progression. Methods: Samples from 54 patients were screened for IDH mutations: 17 patients with LGG without malignant transformation, 18 patients with both LGG and their consecutive secondary glioblastomas (sGBM; n = 36), 2 additional patients with sGBM, 10 patients with primary glioblastomas (pGBM), and 7 patients without gliomas. The cellular tricarboxylic acid cycle metabolites, citrate, isocitrate, 2-hydroxyglutarate, α-ketoglutarate, fumarate, and succinate were profiled by liquid chromatography-tandem mass spectrometry. Ratios of 2-hydroxyglutarate/isocitrate were used to evaluate differences in 2-hydroxyglutarate accumulation in tumors from LGG and sGBM groups, compared with pGBM and nonglioma groups. Results: IDH1 mutations were detected in 27 (77.1%) of 37 patients with LGG. In addition, in patients with LGG with malignant progression (n = 18), 17 patients were IDH1 mutated with a stable mutation status during their malignant progression. None of the patients with pGBM or nonglioma tumors had an IDH mutation. Increased 2-hydroxyglutarate/isocitrate ratios were seen in patients with IDH1-mutated LGG and sGBM, in comparison with those with IDH1-nonmutated LGG, pGBM, and nonglioma groups. However, no differences in intratumoral 2-hydroxyglutarate/isocitrate ratios were found between patients with LGG with and without malignant transformation. Furthermore, in patients with paired samples of LGG and their consecutive sGBM, the 2-hydroxyglutarate/isocitrate ratios did not differ between both tumor stages. Conclusion: Although intratumoral 2-hydroxyglutarate accumulation provides a marker for the presence of IDH mutations, the metabolite is not a useful biomarker for identifying malignant transformation or evaluating malignant progression.

LC-MS/MS Analysis of Tricarboxylic Acid Cycle (TCA) Metabolites

Instrumentation included an AB Sciex QTRAP 5500 triple quadruple mass spectrometer coupled to a high-performance liquid chromatography (HPLC) system from Shimadzu containing a binary pump system, an autosampler, and a column oven. Targeted analyses of citrate, isocitrate, α-ketoglutarate (α-KG), succinate, fumarate (Sigma-Aldrich), and 2-hydroxyglutarate (2HG; SiChem GmbH) were performed in multiple reaction monitoring (MRM) scan mode with use of negative electrospray ionization (-ESI). Expected mass/charge ratios (m/z), assumed as [M-H+], were m/z 190.9, m/z 191.0, m/z 145.0, m/z 116.9, m/z 114.8, and m/z 147.0 for citrate, isocitrate, α-KG, succinate, fumarate, and 2HG, respectively. For quantification, ratios of analytes and respective stable isotope-labeled internal standards (IS) (Table 2) were used. For quantification of isocitrate and 2HG, stable isotope-labeled succinate was used as IS because of unavailability of labeled analogs. MRM transitions are summarized in Table 2.

IDH1 Mutation and Outcome

An IDH1 mutation was detected in 27 of 35 patients with LGG (77.1%), in 10 of 17 patients in LGG1 (59%), and in 17 of 18 patients in LGG2 (95%). In all cases, IDH1 mutations were found on R132. IDH2mutations were not detected in any of the patients. The IDH1 mutation status was stable during progression from LGG to sGBM in all patients in LGG2. None of the patients with pGBM or nonglioma had an IDH mutation. Patients with LGG with an IDH1 mutation had a median PFS of 3.3 years, which was comparable to that among patients with wild-type LGG (2.8 years; P > .05). Furthermore, the OS among patients with LGG with an IDH1 mutation was not statistically different at 13.0 years compared with that among patients with LGG without an IDH1 mutation, who had an OS of 9.3 years (P = .66).

LC-MS/MS Profiling of TCA Metabolites

TCA metabolites, citrate, isocitrate, α-ketoglutarate, succinate, fumarate, and 2-hydroxyglutarate were measured in glioma samples with and without an IDH1 mutation, in samples identified as primary GBM, and in nonglioma brain tumor specimens (Fig. 1). No differences in citrate, isocitrate, α-KG, succinate, and fumarate concentrations were found when comparing all of the latter groups. Concentrations of 2HG, a side product in IDH1-mutated gliomas, were 20–34-fold higher in IDH1-mutated gliomas (0.64–0.81 µmol/g), compared with non–IDH1-mutated LGG1 (P ≤ .001). No differences were observed between IDH1-mutated gliomas and IDH1-nonmutated LGG2 and sGBM, caused by strongly elevated 2HG levels in either 1 or 2 samples in these groups, respectively. Furthermore, in IDH1-mutated gliomas, 2HG concentrations were a mean of 20 times higher than in pGBM and nongliomas (P ≤ .001) (Fig. 1). No differences were observed between the single groups of IDH1-mutated gliomas LGG1, LGG2, and sGBM in relation to 2HG concentration.

Fig. 1.  Dot-box and whisker plots show concentration ranges for TCA metabolites measured in IDH1-nonmutated (IDH1wt) and IDH1-mutated (IDH1mut) LGG and sGBM and in pGBM and nonglioma tumor specimens

http://www.ncbi.nlm.nih.gov/pmc/articles/PMC3661092/bin/not00601.gif

To detect possible differences among the IDH1-mutated LGG1, LGG2, and sGBM, the α-KG/isocitrate and 2HG/isocitrate ratios were used in additional tests. Therefore, the direct precursor-product relation would correct for all differences possibly expected during pre-analytical processing. To prove this, analyte ratios ofIDH1-mutated and nonmutated gliomas were compared. IDH1-mutated gliomas showed a 2HG/isocitrate ratio that was 13 times higher (P ≤ .001) (Fig. 2A), which corresponds to a lower accumulation of 2HG inIDH1-nonmutated gliomas. α-KG/isocitrate ratios were determined to be approximately 10-fold higher inIDH1-mutated gliomas than in IDH1-nonmutated gliomas (P = .005) (Fig. 2B), which also implies lower accumulation of α-KG in IDH1-nonmutated gliomas.

2-hydroxyglutarate-to-isocitrate-ratios

2-hydroxyglutarate-to-isocitrate-ratios

http://www.ncbi.nlm.nih.gov/pmc/articles/PMC3661092/bin/not00602.jpg

Fig. 2.  2-Hydroxyglutarate to isocitrate ratios (A) and α-ketoglutarate to isocitrate ratios (B) for IDH1-nonmutated (IDH1wt) and IDH1-mutated (IDH1mut) gliomas (LGG and sGBM); boxes span the 25th and 75th percentiles with median, and whiskers represent the 10th and 90th percentiles with points as outliers. Abbreviations: LGG, low-grade gliomas; sGBM, secondary glioblastomas.

2HG/isocitrate and α-KG/isocitrate ratios, respectively, were calculated in all 8 specimen groups (Fig. 3). In addition to the differences in 2HG/isocitrate ratios of IDH1-mutated and nonmutated gliomas (Fig. 2A), the ratios in IDH1-mutated gliomas were 4–9 times higher, compared with those in pGBM (P ≤ .001), and 3–6 times higher, compared with those in non-glioma tumor specimens, which was not statistically significant (Fig. 3A). In detail, ratios of 2HG and isocitrate were established to be 13, 9.4, and 22 times higher in IDH1-mutated LGG1, LGG2, and their consecutive sGBM, respectively, than in IDH1-nonmutated LGG1 (Fig. 3A). No significant differences were observed between IDH1-mutated gliomas and IDH1-nonmutated LGG2 and sGBM. The comparison of 2HG/isocitrate ratios between IDH1-nonmutated gliomas and IDH1-mutated LGG2 and sGBM showed no statistically significant differences. However, a trend toward higher ratios inIDH1-mutated LGG1/2 was seen. Furthermore, no differences could be determined by comparing 2HG/isocitrate ratios measured in the groups of IDH1-mutated LGG1 and LGG2. Although 2HG/isocitrate ratios in IDH1-mutated secondary glioblastomas are 1.7 and 2.3 times higher than in the LGG1 and LGG2 groups, respectively, no statistically significant differences were observed.   Fig. 3.

http://www.ncbi.nlm.nih.gov/pmc/articles/PMC3661092/bin/not00603.gif

The absence of a straight trend to higher 2HG/isocitrate ratios during malignant progression is shown by paired analysis of IDH1-mutated LGG2 and their consecutive sGBM (Fig. 3C). Similar findings were observed using the α-KG/isocitrate ratios. Although significant differences were found, with ratios approximately 10 times higher in IDH1-mutated glioblastomas than in IDH1-nonmutated glioblastomas (Fig. 2B), it was not possible to differentiate among the 3 IDH1-mutated glioblastoma groups LGG1, LGG2, and their consecutive sGBM with use of this analyte ratio (Fig. 3B and D).

On the basis of a comprehensive analysis of cellular TCA metabolites from several cohorts of patients with glioma and nonglioma, our study provides evidence that the level of 2HG accumulation is not suitable as an early biomarker for distinguishing patients with LGG in relation to their course of malignancy. To our knowledge, this is the first report of a paired analysis of 2HG levels in LGG and their consecutive sGBM showing stable 2HG accumulation during malignant progression. This fact assumes that malignant transformation of IDH-mutated LGG appears to be independent of their intracellular 2HG accumulation. Considering these results, we could not stratify patients with LGG into subgroups with distinct survival.

2.1.4.2 An Inhibitor of Mutant IDH1 Delays Growth and Promotes Differentiation of Glioma Cells

Rohle D1, Popovici-Muller J, Palaskas N, Turcan S, Grommes C, et al.
Science. 2013 May 3; 340(6132):626-30
http://dx.doi.org:/10.1126/science.1236062

The recent discovery of mutations in metabolic enzymes has rekindled interest in harnessing the altered metabolism of cancer cells for cancer therapy. One potential drug target is isocitrate dehydrogenase 1 (IDH1), which is mutated in multiple human cancers. Here, we examine the role of mutant IDH1 in fully transformed cells with endogenous IDH1 mutations. A selective R132H-IDH1 inhibitor (AGI-5198) identified through a high-throughput screen blocked, in a dose-dependent manner, the ability of the mutant enzyme (mIDH1) to produce R-2-hydroxyglutarate (R-2HG). Under conditions of near-complete R-2HG inhibition, the mIDH1 inhibitor induced demethylation of histone H3K9me3 and expression of genes associated with gliogenic differentiation. Blockade of mIDH1 impaired the growth of IDH1-mutant–but not IDH1-wild-type–glioma cells without appreciable changes in genome-wide DNA methylation. These data suggest that mIDH1 may promote glioma growth through mechanisms beyond its well-characterized epigenetic effects.

Somatic mutations in the metabolic enzyme isocitrate dehydrogenase (IDH) have recently been identified in multiple human cancers, including glioma (1, 2), sarcoma (3, 4), acute myeloid leukemia (5, 6), and others. All mutations map to arginine residues in the catalytic pockets of IDH1 (R132) or IDH2 (R140 and R172) and confer on the enzymes a new activity: catalysis of alpha-ketoglutarate (2-OG) to the (R)-enantiomer of 2-hydroxyglutarate (R-2HG) (7, 8). R-2HG is structurally similar to 2-OG and, due to its accumulation to millimolar concentrations in IDH1-mutant tumors, competitively inhibits 2-OG–dependent dioxygenases (9).

The mechanism by which mutant IDH1 contributes to the pathogenesis of human glioma remains incompletely understood. Mutations in IDH1 are found in 50 to 80% of human low-grade (WHO grade II) glioma, a disease that progresses to fatal WHO grade III (anaplastic glioma) and WHO grade IV (glioblastoma) tumors over the course of 3 to 15 years. IDH1 mutations appear to precede the occurrence of other mutations (10) and are associated with a distinctive gene-expression profile (“proneural” signature), DNA hypermethylation [CpG island methylator phenotype (CIMP)], and certain clinicopathological features (11–13). When ectopically expressed in immortalized human astrocytes, R132H-IDH1 promotes the growth of these cells in soft agar (14) and induces epigenetic alterations found in IDH1-mutant human gliomas (15,16). However, no tumor formation was observed when R132H-IDH1 was expressed from the endogenousIDH1 locus in several cell types of the murine central nervous system (17).

To explore the role of mutant IDH1 in tumor maintenance, we used a compound that was identified in a high-throughput screen for compounds that inhibit the IDH1-R132H mutant homodimer (fig. S1 and supplementary materials) (18). This compound, subsequently referred to as AGI-5198 (Fig. 1A), potently inhibited mutant IDH1 [R132H-IDH1; half-maximal inhibitory concentration (IC50), 0.07 µM) but not wild-type IDH1 (IC50 > 100 µM) or any of the examined IDH2 isoforms (IC50 > 100 µM) (Fig. 1B). We observed no induction of nonspecific cell death at the highest examined concentration of AGI-5198 (20 µM).

Fig. 1 An R132H-IDH1 inhibitor blocks R-2HG production and soft-agar growth of IDH1-mutant glioma cells

http://www.ncbi.nlm.nih.gov/pmc/articles/PMC3985613/bin/nihms504357f1.jpg

an-r132h-idh1-inhibitor-blocks-r-2hg-production-and-soft-agar-growth-of-idh1-mutant-glioma-cells

an-r132h-idh1-inhibitor-blocks-r-2hg-production-and-soft-agar-growth-of-idh1-mutant-glioma-cells

(A) Chemical structure of AGI-5198. (B) IC50 of AGI-5198 against different isoforms of IDH1 and IDH2, measured in vitro. (C) Sanger sequencing chromatogram (top) and comparative genomic hybridization profile array (bottom) of TS603 glioma cells. (D) AGI-5198 inhibits R-2HG production in R132H-IDH1 mutant TS603 glioma cells. Cells were treated for 2 days with AGI-5198, and R-2HG was measured in cell pellets. R-2HG concentrations are indicated above each bar (in mM). Error bars, mean ± SEM of triplicates. (E and F) AGI-5198 impairs soft-agar colony formation of (E) IDH1-mutant TS603 glioma cells [*P < 0.05, one-way analysis of variance (ANOVA)] but not (F) IDH1–wild-type glioma cell lines (TS676 and TS516). Error bars, mean ± SEM of triplicates.

We next explored the activity of AGI-5198 in TS603 glioma cells with an endogenous heterozygous R132H-IDH1 mutation, the most common IDH mutation in glioma (2). TS603 cells were derived from a patient with anaplastic oligodendroglioma (WHO grade III) and harbor another pathognomomic lesion for this glioma subtype, namely co-deletion of the short arm of chromosome 1 (1p) and the long arm of chromosome 19 (19q) (19) (Fig. 1C). Measurements of R-2HG concentrations in pellets of TS603 glioma cells demonstrated dose-dependent inhibition of the mutant IDH1 enzyme by AGI-5198 (Fig. 1D). When added to TS603 glioma cells growing in soft agar, AGI-5198 inhibited colony formation by 40 to 60% (Fig. 1E). AGI-5198 did not impair colony formation of two patient-derived glioma lines that express only the wild-type IDH1allele (TS676 and TS516) (Fig. 1F), further supporting the selectivity of AGI-5198.

After exploratory pharmacokinetic studies in mice (fig. S2), we examined the effects of orally administered AGI-5198 on the growth of human glioma xenografts. When given daily to mice with established R132H-IDH1 glioma xenografts, AGI-5198 [450 mg per kg of weight (mg/kg) per os] caused 50 to 60% growth inhibition (Fig. 2A). Treatment was tolerated well with no signs of toxicity during 3 weeks of daily treatment (fig. S3). Tumors from AGI-5198– treated mice showed reduced staining with an antibody against the Ki-67 protein, a marker used for quantification of tumor cell proliferation in human brain tumors. In contrast, staining with an antibody against cleaved caspase-3 showed no differences between tumors from vehicle and AGI-5198–treated mice (fig. S4), suggesting that the growth-inhibitory effects of AGI-5198 were primarily due to impaired tumor cell proliferation rather than induction of apoptotic cell death. AGI-5198 did not affect the growth of IDH1 wild-type glioma xenografts (Fig. 2B).

Fig. 2 AGI-5198 impairs growth of IDH1-mutant glioma xenografts in mice

http://www.ncbi.nlm.nih.gov/corecgi/tileshop/tileshop.fcgi?p=PMC3&id=735048&s=43&r=3&c=2

AGI-5198 impairs growth of IDH1-mutant glioma xenografts in mice

AGI-5198 impairs growth of IDH1-mutant glioma xenografts in mice

Given the likely prominent role of R-2HG in the pathogenesis of IDH-mutant human cancers, we investigated whether intratumoral depletion of this metabolite would have similar growth inhibitory effects onR132H-IDH1-mutant glioma cells as AGI-5198. We engineered TS603 sublines in which IDH1–short hairpin RNA (shRNA) targeting sequences were expressed from a doxycycline-inducible cassette. Doxycycline had no effect on IDH1 protein levels in cells expressing the vector control but depleted IDH1 protein levels by 60 to 80% in cells infected with IDH1-shRNA targeting sequences (Fig. 2C). We next injected these cells into the flanks of mice with severe combined immunodeficiency and, after establishment of subcutaneous tumors, randomized the mice to receive either regular chow or doxycycline-containing chow. As predicted from our experiments with AGI-5198, doxycycline impaired the growth of TS603 glioma cells expressing inducible IDH1-shRNAs in soft agar (fig. S5) and in vivo (Fig. 2D) but had no effect on the growth of tumors expressing the vector control (fig. S6). Immunohistochemistry (IHC) with a mutant-specific R132H-IDH1 antibody confirmed depletion of the mutant IDH1 protein in IDH1-shRNA tumors treated with doxycycline. This was associated with an 80 to 90% reduction in intratumoral R-2HG levels, similar to the levels observed in TS603 glioma xenografts treated with AGI-5198 (fig. S7). Knockdown of the IDH1 protein in R132C-IDH1-mutant HT1080 sarcoma cells similarly impaired the growth of these cells in vitro and in vivo (fig. S8).

Fig. 3 AGI-5198 promotes astroglial differentiation in R132H-IDH1  mutant cells
http://www.ncbi.nlm.nih.gov/pmc/articles/PMC3985613/bin/nihms504357f3.jpg

The gene-expression data suggested that treatment of IDH1-mutant glioma xenografts with AGI-5198 promotes a gene-expression program akin to gliogenic (i.e., astrocytic and oligodendrocytic) differentiation. To examine this question further, we treated TS603 glioma cells ex vivo with AGI-5198 and performed immunofluorescence for glial fibrillary acidic protein (GFAP) and nestin (NES) as markers for astrocytes and undifferentiated neuroprogenitor cells, respectively. .. We investigated whether blockade of mutant IDH1 could restore this ability, and this was indeed the case (Fig. 3D). These results indicate that mIDH1 plays an active role in restricting cellular differentiation potential, and this defect is acutely reversible by blockade of the mutant enzyme.

In the developing central nervous system, gliogenic differentiation is regulated through changes in DNA and histone methylation (24). Mutant IDH1 can affect both epigenetic processes through R-2HG mediated suppression of TET (ten-eleven translocation) methyl cytosine hydroxylases and Jumonji-C domain histone demethylases (JHDMs). We therefore sought to define the epigenetic changes that were associated with the acute growth-inhibitory effects of AGI-5198 in vivo. .. Treatment of mice with AGI-5198 resulted in dose-dependent reduction of intratumoral R-2HG with partial R-2HG reduction at the 150 mg/kg dose (0.85 ± 0.22 mM) and near-complete reduction at the 450 mg/kg dose (0.13 ± 0.03 mM) (Fig. 4A).

Fig. 4 Dose-dependent inhibition of histone methylation in IDH1-mutant gliomas after short term treatment with AGI-5198

http://www.ncbi.nlm.nih.gov/pmc/articles/PMC3985613/bin/nihms504357f4.gif

We next examined whether acute pharmacological blockade of the mutant IDH1 enzyme reversed the CIMP, which is strongly associated with IDH1-mutant human gliomas (12). ..  On a genome-wide scale, we observed no statistically significant change in the distribution of β values between AGI-5198– and vehicle-treated tumors (Fig. 4B) (supplementary materials).
We next examined the kinetics of histone demethylation after inhibition of the mutant IDH1 enzyme. The histone demethylases JMJD2A and JMJD2C, which remove bi- and trimethyl marks from H3K9, are significantly more sensitive to inhibition by the R-2HG oncometabolite than other 2-OG–dependent oxygenases (8, 9, 14, 25). Restoring their enzymatic activity in IDH1-mutant cancer cells would thus be expected to require near-complete inhibition of R-2HG production. Consistent with this prediction, tumors from the 450 mg/kg AGI-5198 cohort showed a marked decrease in H3K9me3 staining, but there was no decrease in H3K9me3 staining in tumors from the 150 mg/kg AGI-5198 cohort (Fig. 4C) (fig. S11). Of note, AGI-5198 did not decrease H3K9 trimethylation in IDH1–wild-type glioma xenografts (fig. S12A) or in normal astrocytes (fig. S12B), demonstrating that the effect of AGI-5198 on histone methylation was not only dose-dependent but also IDH1-mutant selective.

Because the inability to erase repressive H3K9 methylation can be sufficient to impair cellular differentiation of nontransformed cells (16), we examined the TS603 xenograft tumors for changes in the RNA expression of astrocytic (GFAP, AQP4, and ATP1A2) and oligodendrocytic (CNP and NG2) differentiation markers by real-time polymerase chain reaction (RT-PCR). Compared with vehicletreated tumors, we observed an increase in the expression of astroglial differentiation genes only in tumors treated with 450 mg/kg AGI-5198 (Fig. 4D).

In summary, we describe a tool compound (AGI-5198) that impairs the growth of R132H-IDH1-mutant, but not IDH1 wild-type, glioma cells. This data demonstrates an important role of mutant IDH1 in tumor maintenance, in addition to its ability to promote transformation in certain cellular contexts (14, 26). Effector pathways of mutant IDH remain incompletely understood and may differ between tumor types, reflecting clinical differences between these disorders. Although much attention has been directed toward TET-family methyl cytosine hydroxylases and Jumonji-C domain histone demethylases, the family of 2-OG–dependent dioxygenases includes more than 50 members with diverse functions in collagen maturation, hypoxic sensing, lipid biosynthesis/metabolism, and regulation of gene expression (27).

2.1.4.3 Detection of oncogenic IDH1 mutations using MRS

OC Andronesi, O Rapalino, E Gerstner, A Chi, TT Batchelor, et al.
J Clin Invest. 2013;123(9):3659–3663
http://dx.doi.org:/10.1172/JCI67229

The investigation of metabolic pathways disturbed in isocitrate dehydrogenase (IDH) mutant tumors revealed that the hallmark metabolic alteration is the production of D-2-hydroxyglutarate (D-2HG). The biological impact of D-2HG strongly suggests that high levels of this metabolite may play a central role in propagating downstream the effects of mutant IDH, leading to malignant transformation of cells. Hence, D-2HG may be an ideal biomarker for both diagnosing and monitoring treatment response targeting IDH mutations. Magnetic resonance spectroscopy (MRS) is well suited to the task of noninvasive D-2HG detection, and there has been much interest in developing such methods. Here, we review recent efforts to translate methodology using MRS to reliably measure in vivo D-2HG into clinical research.

Recurrent heterozygous somatic mutations of the isocitrate dehydrogenase 1 and 2 (IDH1 and IDH2) genes were recently found by genome-wide sequencing to be highly frequent (50%–80%) in human grade II–IV gliomas (1, 2). IDH mutations are also often observed in several other cancers, including acute myeloid leukemia (3), central/periosteal chondrosarcoma and enchondroma (4), and intrahepatic cholangiocarcinoma (5). The identification of frequent IDH mutations in multiple cancers suggests that this pathway is involved in oncogenesis. Indeed, increasing evidence demonstrates that IDH mutations alter downstream epigenetic and genetic cellular signal transduction pathways in tumors (6, 7). In gliomas, IDH1 mutations appear to define a distinct clinical subset of tumors, as these patients have a 2- to 4-fold longer median survival compared with patients with wild-type IDH1 gliomas (8). IDH1 mutations are especially common in secondary glioblastoma (GBM) arising from lower-grade gliomas, arguing that these mutations are early driver events in this disease (9). Despite aggressive therapy with surgery, radiation, and cytotoxic chemotherapy, average survival of patients with GBM is less than 2 years, and less than 10% of patients survive 5 years or more (10).

The discovery of cancer-related IDH1 mutations has raised hopes that this pathway can be targeted for therapeutic benefit (11, 12). Methods that can rapidly and noninvasively identify patients for clinical trials and determine the pharmacodynamic effect of candidate agents in patients enrolled in trials are particularly important to guide and accelerate the translation of these treatments from bench to bedside. Magnetic resonance spectroscopy (MRS) can play an important role in clinical and translational research because IDH mutated tumor cells have such a distinct molecular phenotype (13,14).

The family of IDH enzymes includes three isoforms: IDH1, which localizes in peroxisomes and cytoplasm, and IDH2 and IDH3, which localize in mitochondria as part of the tricarboxylic acid cycle (11). All three wild-type enzymes catalyze the oxidative decarboxylation of isocitrate to α-ketoglutarate (αKG), using the cofactor NADP+ (IDH1 and IDH2) or NAD+(IDH3) as the electron acceptor. To date, only mutations of IDH1 and IDH2 have been identified in human cancers (11), and only one allele is mutated. In gliomas, about 90% of IDH mutations involve a substitution in IDH1 in which arginine 132 (R132) from the catalytic site is replaced by a histidine (IDH1 R132H), known as the canonical IDH1 mutation (8). A number of noncanonical mutations such as IDH1 R132C, IDH1 R132S, IDH1 R132L, and IDH1 R132G are less frequently present. Arginine R172 in IDH2 is the corresponding residue to R132 in IDH1, and the most common mutation is IDH2 R172K. In addition to IDH2 R172K, IDH2 R140Q has also been observed in acute myeloid leukemia. Although most IDH1 mutations occur at R132, a small number of mutations producing D-2-hydroxyglutarate (D-2HG) occur at R100, G97, and Y139 (15). However, only a single residue is mutated in either IDH1 or IDH2 in a given tumor.

IDH mutations result in a very high accumulation of the oncometabolite D-2HG in the range of 5- to 35-mM levels, which is 2–3 orders of magnitude higher than D-2HG levels in tumors with wild-type IDH or in healthy tissue (13). All IDH1 G97, R100, R132, and Y139 and IDH2 R140 and R172 mutations confer a neomorphic activity to the IDH1/2 enzymes, switching their activity toward the reduction of αKG to D-2HG, using NADPH as a cofactor (15). The gain of function conferred by these mutations is possible because in each tumor cell a copy of the wild-type allele exists to supply the αKG substrate and NADPH cofactor for the mutated allele.

A cause and effect relationship between IDH mutation and tumorigenesis is probable, and D-2HG appears to play a pivotal role as the relay agent. Evidence is mounting that high levels of D-2HG alter the biology of tumor cells toward malignancy by influencing the activity of enzymes critical for regulating the metabolic (14) and epigenetic state of cells (6, 7, 16–18). D-2HG may act as an oncometabolite via competitive inhibition of αKG-dependent dioxygenases (16). This includes inhibition of histone demethylases and 5-methlycytosine hydroxylases (e.g., TET2), leading to genome-wide alterations in histone and DNA hypermethylation as well as inhibition of hydroxylases, resulting in upregulation of HIF-1 (19). The effects of D-2HG have been shown to be reversible in leukemic transformation (18), which gives further evidence that treatments that lower D-2HG could be a valid therapeutic approach for IDH-mutant tumors. In addition to increased D-2HG, widespread metabolic disturbances of the cellular metabolome have been measured in cells with IDH mutations, including changes in amino acid concentration (increased levels of glycine, serine, threonine, among others, and decreased levels of aspartate and glutamate), N-acetylated amino acids (N-acetylaspartate, N-acetylserine, N-acetylthreonine), glutathione derivatives, choline metabolites, and TCA cycle intermediates (fumarate, malate) (14). These metabolic changes might be exploited for therapy. For example, IDH mutations cause a depletion of NADPH, which lowers the reductive capabilities of tumor cells (20) and perhaps makes them more susceptible to treatments that create free radicals (e.g., radiation) (21).

In vivo MRS of D-2HG in IDH mutant tumors

D-2HG may be an optimal biomarker for tumors with IDH mutations, as it ideally fulfills several important requirements: (a) there is virtually no normal D-2HG background — in cells without IDH mutations, D-2HG is produced as an error product of normal metabolism and is only present at trace levels; (b) 99% of tumors with IDH mutations have increased levels of D-2HG by several orders of magnitude; (c) the only other known cause of elevated 2HG is hydroxyglutaric aciduria (in this case, high L-2HG caused by a mutation in 2HG dehydrogenase), which is a rare inborn error of metabolism that presents with a different clinical phenotype and marked developmental anomalies in early childhood. Hence, tumors displaying increased levels of D-2HG are unlikely to represent false-positive cases for IDH mutations. Furthermore, this raises the possibility that D-2HG levels could also be used to quantify and predict the efficacy of drugs targeting mutant IDH1 for antitumor therapy (11, 15). In fact, it is hard to find a similar example of another tumor biomarker metabolite that is so well supported by the underlying biology.

The high levels of D-2HG observed in IDH1-mutant gliomas are amenable to detection by in vivo MRS. Given that the detection threshold of in vivo MRS is around 1 mM (1 μmol/g, wet tissue), D-2HG should be measurable only in situations in which it accumulates due to IDH1 mutations. Conversely, D-2HG is not expected to be detectable in tumors in which IDH1 is not mutated or in healthy tissues. In addition, ex vivo MRS measurements of intact biopsies (22) or extracts reach higher sensitivity 0.1–0.01 mM (0.1–0.01 μmol/g) and can be used as a cheaper and faster alternative to mass spectrometry.

Recently, reliable detection of D-2HG using in vivo 1H MRS was demonstrated in glioma patients (29, 30). Andronesi et al. reported the unambiguous detection of D-2HG in mutant IDH1 glioma in vivo using 2D correlation spectroscopy (COSY) and J-difference spectroscopy (29). In 2D COSY the overlapping signals are resolved along a second orthogonal chemical shift dimension (31, 32), and in the case of D-2HG, the cross-peaks resulting from the scalar coupling of Hα-Hβ protons show up in a region that is free of the contribution of other metabolites in both healthy and wild-type tumors. While 2D COSY retains all the metabolites in the spectrum, J-difference spectroscopy (25, 33) takes the opposite approach instead by focusing on the metabolite of interest, such as D-2HG, and selectively applying a narrow-band radiofrequency pulse to selectively refocus the Hα-Hβ scalar coupling evolution, then removing the contribution of overlapping metabolites. In this case a 1D difference spectrum with the Hα signal of D-2HG is detected at 4.02 ppm. Both methods have strengths and weaknesses: 2D COSY has the highest resolving power to disentangle overlapping metabolites, but has less sensitivity and quantification is more complex; J-difference spectroscopy has increased sensitivity, and quantification is straightforward, but it is susceptible to subtraction errors.

In Table 1, a comparison is made among the published methods for D-2HG detection. Results selected from the literature are shown in Figure 1. Besides the approaches discussed thus far, other methods are available in the in vivo MRS armamentarium that could be perhaps explored for reliable detection of 2D-HG, such as multiple-quantum filtering sequences (34, 35) and a variety of 2D spectroscopic methods (36–39).

Table 1 Summary of in vivo 1H MRS methods used in the literature for detection of D-2HG in patients with mutant IDH glioma

http://dm5migu4zj3pb.cloudfront.net/manuscripts/67000/67229/small/JCI67229.t1.gif

Figure 1 In vivo D-2HG measurements: (A) J-difference spectroscopy with MEGA-LASER sequence in a patient with GBM with mutant IDH1. Adapted with permission from Science Translational Medicine (29). (B) Spectral editing with PRESS sequence of TE 97 ms (TE1: 32 ms, TE2: 65 ms) in a patient with mutant IDH1 oligodendroglioma. Adapted with permission from Nature Medicine (30). (C) Spectra acquired with PRESS sequence of TE 30 ms in a patient with mutant IDH1 anaplastic astrocytoma. Adapted with permission from Journal of Neuro-Oncology (24). Cho, choline; Cre, creatine; Gln, glutamine; Glu, glutamate; Lac, lactate; MM, macromolecules; NAA, N-acetyl- aspartate.

http://dm5migu4zj3pb.cloudfront.net/manuscripts/67000/67229/small/JCI67229.f1.gif

Ex vivo MRS of D-2HG in tumors with IDH mutations

The panoply of methods and ability of ex vivo MRS (50) to detect D-2HG in patient samples is far superior to in vivo MRS because the above list of limitations and artifacts is not of concern.

Metabolic profiling of intact tumor biopsies as small as 1 mg can be performed with high-resolution magic angle spinning (HRMAS) (51–53). HRMAS preserves the integrity of the samples that can be further analyzed with immunohistochemistry, genomics, or other metabolic profiling tools such as mass spectrometry. Detection of D-2HG in mutant IDH1 glioma was confirmed by ex vivo HRMAS experiments (29, 54, 55). In addition to D-2HG, ex vivo HRMAS studies can detect quantitative and qualitative changes for a large number of metabolites in IDH mutated tumors (54, 55).

The example of IDH1 mutations is a perfect illustration of the rapid pace of progress brought to the medical sciences by the power and advances of modern technology: genome-wide sequencing, metabolomics, and imaging.

In vivo MRS has the unique ability to noninvasively probe IDH mutations by measuring the endogenously produced oncometabolite D-2HG. As an imaging-based technique, it has the benefit of posing minimal risk to the patients, can be performed repeatedly as many times as necessary, and can probe tumor heterogeneity without disturbing the internal milieu. To date, in vivo MRS is the only imaging method that is specific to IDH mutations — existing PET or SPECT radiotracers are not specific (56, 57), IDH-targeted agents for in vivo molecular imaging do not yet exist, and the prohibitive cost of radiotracers will likely limit their clinical development.
2.1.4.4 Hypoxia promotes IDH-dependent carboxylation of α-KG to citrate to support cell growth and viability

DR Wise, PS Ward, JES Shay, JR Cross, Joshua J Grube, et al.
PNAS | Dec 6, 2011; 108(49):19611–19616
http://www.pnas.org/cgi/doi/10.1073/pnas.1117773108

Citrate is a critical metabolite required to support both mitochondrial bioenergetics and cytosolic macromolecular synthesis. When cells proliferate under normoxic conditions, glucose provides the acetyl-CoA that condenses with oxaloacetate to support citrate production. Tricarboxylic acid (TCA) cycle anaplerosis is maintained primarily by glutamine. Here we report that some hypoxic cells are able to maintain cell proliferation despite a profound reduction in glucose-dependent citrate production. In these hypoxic cells, glutamine becomes a major source of citrate. Glutamine-derived α-ketoglutarate is reductively carboxylated by the NADPH-linked mitochondrial isocitrate dehydrogenase (IDH2) to form isocitrate, which can then be isomerized to citrate. The increased IDH2-dependent carboxylation of glutamine-derived α-ketoglutarate in hypoxia is associated with a concomitantincreased synthesisof2-hydroxyglutarate (2HG) in cells with wild-type IDH1 and IDH2. When either starved of glutamine or rendered IDH2-deficient by RNAi, hypoxic cells areunable toproliferate.The reductive carboxylation ofglutamine is part of the metabolic reprogramming associated with hypoxia-inducible factor 1 (HIF1), as constitutive activation of HIF1 recapitulates the preferential reductive metabolism of glutamine derived α-ketoglutarate even in normoxic conditions. These data support a role for glutamine carboxylation in maintaining citrate synthesis and cell growth under hypoxic conditions.

Citrate plays a critical role at the center of cancer cell metabolism. It provides the cell with a source of carbon for fatty acid and cholesterol synthesis (1). The breakdown of citrate by ATP-citrate lyase is a primary source of acetyl-CoA for protein acetylation (2). Metabolism of cytosolic citrate by aconitase and IDH1 can also provide the cell with a source of NADPH for redox regulation and anabolic synthesis. Mammalian cells depend on the catabolism of glucose and glutamine to fuel proliferation (3). In cancer cells cultured at atmospheric oxygen tension (21% O2), glucose and glutamine have both been shown to contribute to the cellular citrate pool, with glutamine providing the major source of the four-carbon molecule oxaloacetate and glucose providing the major source of the two-carbon molecule acetyl-CoA (4, 5). The condensation of oxaloacetate and acetyl-CoA via citrate synthase generates the 6 carbon citrate molecule. However, both the conversion of glucose-derived pyruvate to acetyl-CoA by pyruvate dehydrogenase (PDH) and the conversion of glutamine to oxaloacetate through the TCA cycle depend on NAD+, which can be compromised under hypoxic conditions. This raises the question of how cells that can proliferate in hypoxia continue to synthesize the citrate required for macromolecular synthesis.

This question is particularly important given that many cancers and stem/progenitor cells can continue proliferating in the setting of limited oxygen availability (6, 7). Louis Pasteur first highlighted the impact of hypoxia on nutrient metabolism based on his observation that hypoxic yeast cells preferred to convert glucose into lactic acid rather than burning it in an oxidative fashion. The molecular basis forthis shift in mammalian cells has been linked to the activity of the transcription factor HIF1 (8–10). Stabilization of the labile HIF1α subunit occurs in hypoxia. It can also occur in normoxia through several mechanisms including loss of the von Hippel-Lindau tumor suppressor (VHL), a common occurrence in renal carcinoma(11). Although hypoxia and/or HIF1α stabilization is a common feature of multiple cancers, to date the source of citrate in the setting of hypoxia or HIF activation has not been determined. Here, we study the sources of hypoxic citrate synthesis in a glioblastoma cell line that proliferates in profound hypoxia (0.5% O2). Glucose uptake and conversion to lactic acid increased in hypoxia. However, glucose conversion into citrate dramatically declined. Glutamine consumption remained constant in hypoxia, and hypoxic cells were addicted to the use of glutamine in hypoxia as a source of α-ketoglutarate. Glutamine provided the major carbon source for citrate synthesis during hypoxia. However, the TCA cycle-dependent conversion of glutamine into citric acid was significantly suppressed. In contrast, there was a relative increase in glutamine-dependent citrate production in hypoxia that resulted from carboxylation of α-ketoglutarate. This reductive synthesis required the presence of mitochondrial isocitrate dehydrogenase 2 (IDH2). In confirmation of the reverse flux through IDH2, the increased reductive metabolism of glutamine-derived α-ketoglutarate in hypoxia was associated with increased synthesis of 2HG. Finally, constitutive HIF1α-expressing cells also demonstrated significant reductive carboxylation-dependent synthesis of citrate in normoxia and a relative defect in the oxidative conversion of glutamine into citrate. Collectively, the data demonstrate that mitochondrial glutaminemetabolismcanbereroutedthroughIDH2-dependent citrate synthesis in support of hypoxic cell growth.

Some Cancer Cells Can Proliferate at 0.5% O2 Despite a Sharp Decline in Glucose-Dependent Citrate Synthesis. At 21% O2, cancer cells have been shown to synthesize citrate by condensing glucose-derived acetyl-CoA with glutamine-derived oxaloacetate through the activity of the canonical TCA cycle enzyme citrate synthase (4). In contrast, less is known regarding the synthesis of citrate by cells that can continue proliferating in hypoxia. The glioblastoma cellline SF188 is able to proliferate at 0.5% O2 (Fig.1A),a level of hypoxia that is sufficient to stabilize HIF1α (Fig. 1B) and predicted to limit respiration (12, 13). Consistent with previous observations in hypoxic cells, we found that SF188 cells demonstrated increased lactate production when incubated in hypoxia
(Fig. 1C), and the ratio of lactate produced to glucose consumed increased demonstrating an increase in the rate of anaerobic glycolysis. When glucose-derived carbon in the form of pyruvate is converted to lactate, it is diverted away from subsequent metabolism that can contribute to citrate production. However, we observed that SF188 cells incubated in hypoxia maintain their intracellular citrate to ∼75% of the level maintained under normoxia (Fig. 1D). This prompted an investigation of how proliferating cells maintain citrate production under hypoxia. Increased glucose uptake and glycolytic metabolism are critical elements of the metabolic response to hypoxia. To evaluate the contributions made by glucose to the citrate pool under normoxia or hypoxia, SF188 cells incubated in normoxia or hypoxia were cultured in medium containing 10 mM [U-13C] glucose. Following a 4-h labeling period, cellular metabolites were extracted and analyzed for isotopic enrichment.

Fig. 1. SF188 glioblastoma cells proliferate at 0.5% O2 despite a profound reduction in glucose-dependent citrate synthesis. (A) SF188 cells were plated in complete medium equilibrated with 21% O2 (Normoxia) or 0.5% O2 (Hypoxia), total viable cells were counted 24 h and 48 h later (Day 1 and Day 2), and population doublings were calculated. Data are the mean ± SEM of four independent experiments. (B) Western blot demonstrates stabilized HIF1α protein in cells cultured in hypoxia compared with normoxia. (C) Cells were grown in normoxia or hypoxia for 24 h, after which culture medium was collected. Medium glucose and lactate levels were measured and compared with the levels in fresh medium. (D) Cells were cultured for 24 h as in C. Intracellular metabolism was then quenched with 80% MeOH prechilled to −80 °C that was spiked with a 13C-labeled citrate as an internal standard. Metabolites were then extracted, and intracellular citrate levels were analyzed with GC-MS and normalized to cell number. Data for C and D are the mean ± SEM of three independent experiments. (E) Model depicting the pathway for cit+2 production from [U-13C] glucose. Glucose uniformly 13Clabeled will generate pyruvate+3. Pyruvate+3 can be oxidatively decarboxylated by PDH to produce acetyl-CoA+2, which can condense with unlabeled oxaloacetate to produce cit+2. (F) Cells were cultured for 24 h as in C and D, followed by an additional 4 h of culture in glucose-deficient medium supplemented with 10 mM [U-13C]glucose. Intracellular metabolites were then extracted, and 13C-enrichment in cellular citrate was analyzed by GCMS and normalized to the total citrate pool size. Data are the mean ± SD of three independent cultures from a representative of two independent experiments. *P < 0.05, ***P < 0.001

Fig. 2. Glutamine carbon is required for hypoxic cell viability and contributes to increased citrate production through reductive carboxylation relative to oxidative metabolism in hypoxia. (A) SF188 cells were cultured for 24 h in complete medium equilibrated with either 21% O2 (Normoxia) or 0.5% O2 (Hypoxia). Culture medium was then removed from cells and analyzed for glutamine levels which were compared with the glutamine levels in fresh medium. Data are the mean ± SEM of three independent experiments. (B) The requirement for glutamine to maintain hypoxic cell viability can be satisfied by α-ketoglutarate. Cells were cultured in complete medium equilibrated with 0.5% O2 for 24 h, followed by an additional 48 h at 0.5% O2 in either complete medium (+Gln), glutamine-deficient medium (−Gln), or glutamine-deficient medium supplemented with 7 mM dimethyl α-ketoglutarate (−Gln +αKG). All medium was preconditioned in 0.5% O2. Cell viability was determined by trypan blue dye exclusion. Data are the mean and range from two independent experiments. (C) Model depicting the pathways for cit+4 and cit+5 production from [U-13C]glutamine (glutamine+5). Glutamine+5 is catabolized to α-ketoglutarate+5, which can then contribute to citrate production by two divergent pathways. Oxidative metabolism produces oxaloacetate+4, which can condense with unlabeled acetyl-CoA to produce cit+4. Alternatively, reductive carboxylation produces isocitrate+5, which can isomerize to cit+5. (D) Glutamine contributes to citrate production through increased reductive carboxylation relative to oxidative metabolism in hypoxic proliferating cancer cells. Cells were cultured for 24 h as in A, followed by 4 h of culture in glutamine-deficient medium supplemented with 4 mM [U-13C]glutamine. 13C enrichment in cellular citrate was quantitated with GC-MS. Data are the mean ± SD of three independent cultures from a representative of three independent experiments. **P < 0.01.

Fig. 3. Cancer cells maintain production of other metabolites in addition to citrate through reductive carboxylation in hypoxia. (A) SF188 cells were cultured in complete medium equilibrated with either 21% O2 (Normoxia) or 0.5% O2 (Hypoxia) for 24 h. Intracellular metabolism was then quenched with 80% MeOH prechilled to −80 °C that was spiked with a 13C-labeled citrate as an internal standard. Metabolites were extracted, and intracellular aspartate (asp), malate (mal), and fumarate (fum) levels were analyzed with GC-MS. Data are the mean± SEM of three independent experiments. (B) Model for the generation of aspartate, malate, and fumarate isotopomers from [U-13C] glutamine (glutamine+5). Glutamine+5 is catabolized to α-ketoglutarate+5. Oxidative metabolism of α-ketoglutarate+5 produces fumarate+4, malate+4, and oxaloacetate (OAA)+4 (OAA+ 4 is in equilibrium with aspartate+4 via transamination). Alternatively, α-ketoglutarate+5 can be reductively carboxylated to generate isocitrate+5 and citrate+5. Cleavage of citrate+5 in the cytosol by ATP-citrate lyase (ACL) will produce oxaloacetate+3 (in equilibrium with aspartate+3). Oxaloacetate+3 can be metabolized to malate+3 and fumarate+3. (C) SF188 cells were cultured for 24 h as in A, and then cultured for an additional 4 h in glutamine-deficient medium supplemented with 4 mM [U-13C] glutamine. 13C enrichment in cellular aspartate, malate, and fumarate was determined by GC-MS and normalized to the relevant metabolite total pool size. Data shown are the mean ± SD of three independent cultures from a representative of three independent experiments. **P < 0.01, ***P < 0.001.

Glutamine Carbon Metabolism Is Required for Viability in Hypoxia. In addition to glucose, we have previously reported that glutamine can contribute to citrate production during cell growth under normoxic conditions (4). Surprisingly, under hypoxic conditions, we observed that SF188 cells retained their high rate of glutamine consumption (Fig. 2A). Moreover, hypoxic cells cultured in glutamine-deficient medium displayed a significant loss of viability (Fig. 2B). In normoxia, the requirement for glutamine to maintain viability of SF188 cells can be satisfied by α-ketoglutarate, the downstream metabolite of glutamine that is devoid of nitrogenous groups (14). α-ketoglutarate cannot fulfill glutamine’s roles as a nitrogen source for nonessential amino acid synthesis or as an amide donor for nucleotide or hexosamine synthesis, but can be metabolized through the oxidative TCA cycle to regenerate oxaloacetate, and subsequently condense with glucose-derived acetyl-CoA to produce citrate. To test whether the restoration of carbon from glutamine metabolism in the form of α-ketoglutarate could rescue the viability defect of glutamine-starved SF188 cells even under hypoxia, SF188 cells incubated in hypoxia were cultured in glutamine-deficient medium supplemented with a cell-penetrant form of α-ketoglutarate (dimethyl α-ketoglutarate). The addition of dimethyl α-ketoglutarate rescued the defect in cell viability observed upon glutamine withdrawal (Fig. 2B). These data demonstrate that, even under hypoxic conditions, when the ability of glutamine to replenish oxaloacetate through oxidative TCA cycle metabolism is diminished, SF188 cells retain their requirement for glutamine as the carbon backbone for α-ketoglutarate. This result raised the possibility that glutamine could be the carbon source for citrate production through an alternative, nonoxidative, pathway in hypoxia.

Cells Proliferating in Hypoxia Preferentially Produce Citrate Through Reductive Carboxylation Rather than Oxidative Metabolism. To distinguish the pathways by which glutamine carbon contributes to citrate production in normoxia and hypoxia, SF188 cells were incubated in normoxia or hypoxia and cultured in medium containing 4 mM [U-13C] glutamine. After 4 h of labeling, intracellular metabolites were extracted and analyzed by GC-MS. In normoxia,the cit+4 pool constituted the majority of the enriched citrate in the cell. Cit+4 arises from the oxidative metabolism of glutamine-derived α-ketoglutarate+5 to oxaloacetate+4 and its subsequent condensation with unenriched, glucose-derived acetyl-CoA (Fig.2C and D). Cit+5 constituted a significantly smaller pool than cit+4 in normoxia. Conversely, in hypoxia, cit+5 constituted the majority of the enriched citrate in the cell. Cit+5 arises from the reductive carboxylation of glutamine-derived α-ketoglutarate+5 to isocitrate+5, followed by the isomerization of isocitrate+5 to cit+5 by aconitase. The contribution of cit+4 to the total citrate pool was significantly lower in hypoxia than normoxia, and the accumulation of other enriched citrate species in hypoxia remained low. These data support the role of glutamine as a carbon source for citrate production in normoxia and hypoxia.

Cells Proliferating in Hypoxia Maintain Levels of Additional Metabolites Through Reductive Carboxylation. Previous work has documented that, in normoxic conditions, SF188 cells use glutamine as the primary anaplerotic substrate, maintaining the pool sizes of TCA cycle intermediates through oxidative metabolism (4). Surprisingly, we found that, when incubated in hypoxia, SF188 cells largely maintained their levels of aspartate (in equilibrium with oxaloacetate), malate, and fumarate (Fig. 3A). To distinguish how glutamine carbon contributes to these metabolites in normoxia and hypoxia, SF188 cells incubated in normoxia or hypoxia were cultured in medium containing 4 mM [U-13C] glutamine. After a 4-h labeling period, metabolites were extracted and the intracellular pools of aspartate, malate, and fumarate were analyzed by GC-MS. In normoxia, the majority of the enriched intracellular asparatate, malate, and fumarate were the +4 species, which arise through oxidative metabolism of glutamine-derived α-ketoglutarate (Fig. 3 B and C). The +3 species, which can be derived from the citrate generated by the reductive carboxylation of glutamine derived α-ketoglutarate, constituted a significantly lower percentage of the total aspartate, malate, and fumarate pools. By contrast, in hypoxia, the +3 species constituted a larger percentage of the total aspartate, malate, and fumarate pools than they did in normoxia. These data demonstrate that, in addition to citrate, hypoxic cells preferentially synthesize oxaloacetate, malate, and fumarate through the pathway of reductive carboxylation rather than the oxidative TCA cycle.

IDH2 Is Critical in Hypoxia for Reductive Metabolism of Glutamine and for Cell Proliferation.We hypothesized that the relative increase in reductive carboxylation we observed in hypoxia could arise from the suppression of α-ketoglutarate oxidation through the TCA cycle. Consistent with this, we found that α-ketoglutarate levels increased in SF188 cells following 24 h in hypoxia (Fig. 4A). Surprisingly, we also found that levels of the closely related metabolite 2-hydroxyglutarate (2HG) increased in hypoxia, concomitant with the increase in α-ketoglutarate under these conditions. 2HG can arise from the noncarboxylating reduction of α-ketoglutarate (Fig. 4B). Recent work has found that specific cancer-associated mutations in the active sites of either IDH1 or IDH2 lead to a 10- to 100-fold enhancement in this activity facilitating 2HG production (15–17), but SF188 cells lack IDH1/2 mutations. However, 2HG levels are also substantially elevated in the inborn error of metabolism 2HG aciduria, and the majority of patients with this disease lack IDH1/2 mutations. As 2HG has been demonstrated to arise in these patients from mitochondrial α-ketoglutarate (18), we hypothesized that both the increased reductive carboxylation of glutamine-derived α-ketoglutarate to citrate and the increased 2HG accumulation we observed in hypoxia could arise from increased reductive metabolism by wild-type IDH2 in the mitochondria.

Fig. 4. Reductive carboxylation of glutamine-derived α-ketoglutarate to citrate in hypoxic cancer cells is dependent on mitochondrial IDH2. (A) α-ketoglutarate and 2HG increase in hypoxia. SF188 cells were cultured in complete medium equilibrated with either 21% O2 (Normoxia) or 0.5% O2 (Hypoxia) for 24 h. Intracellular metabolites were then extracted, cell extracts spiked with a 13C-labeled citrate as an internal standard, and intracellular α-ketoglutarate and 2HG levels were analyzed with GC-MS. Data shown are the mean ± SEM of three independent experiments. (B) Model for reductive metabolism from glutamine-derived α-ketoglutarate. Glutamine+5 is catabolized to α-ketoglutarate+5. Carboxylation of α-ketoglutarate+5 followed by reduction of the carboxylated intermediate (reductive carboxylation) will produce isocitrate+5, which can then isomerize to cit+5. In contrast, reductive activity on α-ketoglutarate+5 that is uncoupled from carboxylation will produce 2HG+5. (C) IDH2 is required for reductive metabolism of glutamine-derived α-ketoglutarate in hypoxia. SF188 cells transfected with a siRNA against IDH2 (siIDH2) or nontargeting negative control (siCTRL) were cultured for 2 d in complete medium equilibrated with 0.5% O2.(Upper) Cells were then cultured at 0.5% O2 for an additional 4 h in glutamine-deficient medium supplemented with 4 mM [U-13C]glutamine. 13C enrichment in intracellular citrate and 2HG was determined and normalized to the relevant metabolite total pool size. (Lower) Cells transfected and cultured in parallel at 0.5% O2 were counted by hemocytometer (excluding nonviable cells with trypan blue staining) or harvested for protein to assess IDH2 expression by Western blot. Data shown for GC-MS and cell counts are the mean ± SD of three independent cultures from a representative experiment. **P < 0.01, ***P < 0.001.

Reprogramming of Metabolism by HIF1 in the Absence of Hypoxia Is Sufficient to Induce Increased Citrate Synthesis by Reductive Carboxylation Relative to Oxidative Metabolism. The relative increase in the reductive metabolism of glutamine-derived α-ketoglutarate at 0.5% O2 may be explained by the decreased ability to carry out oxidative NAD+-dependent reactions as respiration is inhibited (12, 13). However, a shift to preferential reductive glutamine metabolism could also result from the active reprogramming of cellular metabolism by HIF1 (8–10), which inhibits the generation of mitochondrial acetyl-CoA necessary for the synthesis of citrate by oxidative glucose and glutamine metabolism (Fig. 5A). To better understand the role of HIF1 in reductive glutamine metabolism, we used VHL-deficient RCC4 cells, which display constitutive expression of HIF1α under normoxia (Fig. 5B).

Fig. 5. Reprogramming of metabolism by HIF1 in the absence of hypoxia is sufficient to induce reductive carboxylation of glutamine-derived α-ketoglutarate. (A) Model depicting how HIF1 signaling’s inhibition of pyruvate dehydrogenase (PDH) activity and promotion of lactate dehydrogenase-A (LDH-A) activity can block the generation of mitochondrial acetyl-CoA from glucose-derived pyruvate, thereby favoring citrate synthesis from reductive carboxylation of glutamine-derived α-ketoglutarate. (B) Western blot demonstrating HIF1α protein in RCC4 VHL−/− cells in normoxia with a nontargeting shRNA (shCTRL), and the decrease in HIF1α protein in RCC4 VHL−/− cells stably expressing HIF1α shRNA (shHIF1α). (C) HIF1-induced reprogramming of glutamine metabolism. Cells from B at 21% O2 were cultured for 4 h in glutamine-deficient medium supplemented with 4 mM [U-13C]glutamine. Intracellular metabolites were then extracted, and 13C enrichment in cellular citrate was determined by GC-MS. Data shown are the mean ± SD of three independent cultures from a representative of three independent experiments. ***P < 0.001.

Compared with glucose metabolism, much less is known regarding how glutamine metabolism is altered under hypoxia. It has also remained unclear how hypoxic cells can maintain the citrate production necessary for macromolecular biosynthesis. In this report, we demonstrate that in contrast to cells at 21% O2, where citrate is predominantly synthesized through oxidative metabolism of both glucose and glutamine, reductive carboxylation of glutamine carbon becomes the major pathway of citrate synthesis in cells that can effectively proliferate at 0.5% O2. Moreover, we show that in these hypoxic cells, reductive carboxylation of glutamine-derived α-ketoglutarate is dependent on mitochondrial IDH2. Although others have previously suggested the existence of reductive carboxylation in cancer cells (19, 20), these studies failed to demonstrate the intracellular localization or specific IDH isoform responsible for the reductive carboxylation flux. Recently, we identified IDH2 as an isoform that contributes to reductive carboxylation in cancer cells incubated at 21% O2 (16), but remaining unclear were the physiological importance and regulation of this pathway relative to oxidative metabolism, as well as the conditions where this reductive pathway might be advantageous for proliferating cells. Here we report that IDH2-mediated reductive carboxylation of glutamine-derived α-ketoglutarate to citrate is an important feature of cells proliferating in hypoxia. Moreover, the reliance on reductive glutamine metabolism can be recapitulated in normoxia by constitutive HIF1 activation in cells with loss of VHL. The mitochondrial NADPH/NADP+ ratio required to fuel the reductive reaction through IDH2 can arise from the increased NADH/NAD+ ratio existing in the mitochondria under hypoxic conditions (21, 22), with the transfer of electrons from NADH to NADP+ to generate NADPH occurring through the activity of the mitochondrial transhydrogenase (23).

In further support of the increased mitochondrial reductive glutamine metabolism that we observe in hypoxia, we report here that incubation in hypoxia can lead to elevated 2HG levels in cells lacking IDH1/2 mutations. 2HG production from glutamine-derived α-ketoglutarate significantly decreased with knockdown of IDH2, supporting the conclusion that 2HG is produced in hypoxia by enhanced reverse flux of α-ketoglutarate through IDH2in a truncated, noncarboxylating reductive reaction. However,other mechanisms may also contribute to 2HG elevation in hypoxia. These include diminished oxidative activity and/or enhanced reductive activity of the 2HG dehydrogenase, a mitochondrial enzyme that normally functions to oxidize 2HG back to α-ketoglutarate (25). The level of 2HG elevation we observe in hypoxic cells is associated with a concomitant increase in α-ketoglutarate, and is modest relative to that observed in cancers with IDH1/2 gain-of-function mutations. Nonetheless, 2HG elevation resulting from hypoxia in cells with wild-type IDH1/2 may hold promise as a cellular or serum biomarker for tissues undergoing chronic hypoxia and/or excessive glutamine metabolism.

2.1.4.5 IDH mutation impairs histone demethylation and results in a block to cell differentiation.

C Lu, PS Ward, GS Kapoor, D Rohle, S Turcan, et al.
Nature 483, 474–478 (22 Mar 2012)
http://dx.doi.org:/10.1038/nature10860

Recurrent mutations in isocitrate dehydrogenase 1 (IDH1) and IDH2 have been identified in gliomas, acute myeloid leukaemias (AML) and chondrosarcomas, and share a novel enzymatic property of producing 2-hydroxyglutarate (2HG) from α-ketoglutarate1, 2, 3, 4, 5, 6. Here we report that 2HG-producing IDH mutants can prevent the histone demethylation that is required for lineage-specific progenitor cells to differentiate into terminally differentiated cells. In tumour samples from glioma patients, IDH mutations were associated with a distinct gene expression profile enriched for genes expressed in neural progenitor cells, and this was associated with increased histone methylation. To test whether the ability of IDH mutants to promote histone methylation contributes to a block in cell differentiation in non-transformed cells, we tested the effect of neomorphic IDH mutants on adipocyte differentiation in vitro. Introduction of either mutant IDH or cell-permeable 2HG was associated with repression of the inducible expression of lineage-specific differentiation genes and a block to differentiation. This correlated with a significant increase in repressive histone methylation marks without observable changes in promoter DNA methylation. Gliomas were found to have elevated levels of similar histone repressive marks. Stable transfection of a 2HG-producing mutant IDH into immortalized astrocytes resulted in progressive accumulation of histone methylation. Of the marks examined, increased H3K9 methylation reproducibly preceded a rise in DNA methylation as cells were passaged in culture. Furthermore, we found that the 2HG-inhibitable H3K9 demethylase KDM4C was induced during adipocyte differentiation, and that RNA-interference suppression of KDM4C was sufficient to block differentiation. Together these data demonstrate that 2HG can inhibit histone demethylation and that inhibition of histone demethylation can be sufficient to block the differentiation of non-transformed cells.

Figure 1: IDH mutations are associated with dysregulation of glial differentiation and global histone methylation.

http://www.nature.com/nature/journal/v483/n7390/carousel/nature10860-f1.2.jpg

Figure 2: Differentiation arrest induced by mutant IDH or 2HG is associated with increased global and promoter-specific H3K9 and H3K27 methylation.

http://www.nature.com/nature/journal/v483/n7390/carousel/nature10860-f2.2.jpg

Figure 3: IDH mutation induces histone methylation increase in CNS-derived cells and can alter cell lineage gene expression.

http://www.nature.com/nature/journal/v483/n7390/carousel/nature10860-f3.2.jpg
2.1.4.6 Isocitrate dehydrogenase mutations in leukemia

McKenney AS, Levine RL.
J Clin Invest. 2013 Sep; 123(9):3672-7
http://dx.doi.org:/1172/JCI67266

Recent genome-wide discovery studies have identified a spectrum of mutations in different malignancies and have led to the elucidation of novel pathways that contribute to oncogenic transformation. The discovery of mutations in the genes encoding isocitrate dehydrogenase (IDH) has uncovered a critical role for altered metabolism in oncogenesis, and the neomorphic, oncogenic function of IDH mutations affects several epigenetic and gene regulatory pathways. Here we discuss the relevance of IDH mutations to leukemia pathogenesis, therapy, and outcome and how mutations in IDH1 and IDH2 affect the leukemia epigenome, hematopoietic differentiation, and clinical outcome.

Mutations in isocitrate dehydrogenase (IDH) have been identified in a spectrum of human malignancies. Mutations in IDH1 were first identified in an exome resequencing analysis of patients with colorectal cancer (1). Shortly thereafter, recurrent IDH1 and IDH2 mutations were found in patients with glioma, most commonly in patients who present with lower-grade gliomas (2). IDH1 mutations were subsequently discovered in patients with acute myeloid leukemia (AML) through whole genome sequencing (3), which was followed by the identification of somatic IDH2 mutations in patients with AML (4–6). Further studies revealed that IDH mutations induce a neomorphic function to produce the oncometabolite 2-hydroxyglutarate (2HG) (7, 8), which can inhibit many cellular processes (9, 10). In particular, the ability of 2HG to alter the epigenetic landscape makes IDH a prototypical target for prognostic studies and drug targeting in leukemias.

IDH proteins catalyze the oxidative decarboxylation of isocitrate to α-ketoglutarate (αKG, also known as 2-oxoglutarate). IDH3 primarily functions as the allosterically regulated, rate-limiting enzymatic step in the TCA cycle, while the other two isoforms, which are mutated in cancer, utilize this catalytic process in additional contexts including metabolism and glucose sensing (IDH1) and regulation of oxidative respiration (IDH2) (11, 12). Loss-of-function mutations in other TCA cycle components have previously been identified in other types of cancer, specifically in mutations in fumarate hydratase (FH) and succinate dehydrogenase (SDH). As such, many hypothesized that IDH1/2 mutations would result in loss of metabolic activity, and indeed, enzymatic studies confirmed that the mutant protein’s ability to perform its native function is markedly attenuated, as measured by reduced production of αKG or NADPH (13, 14).

However, the genetic data relating to these mutations were more consistent with gain-of-function mutation: all of the observed alterations are somatic, heterozygous mutations that occur at highly conserved positions, which appear to be functionally equivalent between different isoforms. This discrepancy was resolved when metabolic profiling showed that the IDH1 mutant protein catalyzes a neomorphic reaction that converts αKG to 2HG. 2HG can be detected at high levels in gliomas harboring these mutations (4), and the accumulation of 2HG was further found to be common to oncogenic IDH mutations (8). This finding indicated that 2HG may serve as a potential functional biomarker of IDH mutation, and later, metabolomics analysis of 2HG content in patient samples led to the identification of IDH2 mutations in leukemias (6). IDH mutant proteins have been proposed to form a heterodimer with the remaining wild-type IDH isoform (7, 8, 14), which is consistent with genetic data showing retention of the wild-type allele in IDH-mutant cancers.

The discovery of the neomorphic function of IDH opened the doors for true investigation into the implications of these mutations and the resultant intracellular accumulation of 2HG. 2HG is thought to competitively inhibit the activity of a broad spectrum of αKG-dependent enzymes with known and postulated roles in oncogenic transformation. Some targets, such as the prolyl 4-hydroxylases, have unclear implications in leukemia pathogenesis. However, the recent demonstration that alterations in epigenetic factors occur in the majority of acute leukemias led to investigations of the effects of 2HG on the jumonji C domain histone-modifying enzymes and the newly characterized tet methylcytosine dioxygenase (TET) family of methylcytosine hydroxylases. Importantly, expression of IDH or exposure to chemically modified, cell-permeable 2HG affects hematopoietic differentiation, likely due to changes in epigenetic regulation that induce reversible alterations in differentiation states (15).

TET1 was initially discovered as a binding partner of mixed-lineage leukemia (MLL) in patients with MLL-translocated AML (16, 17). However, the function of the TET gene family and its role in leukemogenesis remained unknown until TET1 was shown to catalyze αKG-dependent addition of a hydroxyl group to methylated cytosines (18), which precedes DNA demethylation and results in altered epigenetic control (10,18–24). TET enzymes have further been shown to catalyze conversion of 5-methylcytosine (5mC) to 5-formylcytosine (5fC) or 5-carboxylcytosine (5cC) (25, 26). These data suggest that loss of TET2 enzymatic function can lead to aberrant cytosine methylation and epigenetic silencing in malignant settings. TET2mutations were initially found in array-comparative genomic hybridization and genome-wide SNP arrays, which identified microdeletions containing this gene in a patient with myeloproliferative neoplasm (MPN) and myelodysplastic syndrome (MDS) (27). This discovery was followed by the identification of somatic missense, nonsense, and frameshift TET2 mutations in patients with MDS, MPN, AML, and other myeloid malignancies (27–30). Most TET2 alleles result in nonsense/frameshift mutations, which result in loss of TET2 catalytic function (31), consistent with a tumor suppressor function in myeloid malignancies.

When 2HG was hypothesized to affect specific enzymatic processes in oncogenesis, AML patients were observed to harbor IDH1/2 and TET mutations in a mutually exclusive manner (9). Of note, exploration into the functional relationship between these mutant IDH proteins and the function of TET2 ultimately suggested a role for 2HG in inhibiting TET enzymatic function. IDH- or TET2-mutant patient samples are characterized by increased global hypermethylation of DNA and transcriptional silencing of genes with hypermethylated promoters. Expression of these IDH-mutant alleles in experimental models was further observed to result in increased methylation, reduced hydroxymethylation, and impaired TET2 function (9). Finally, in biochemical assays, 2HG was shown to directly inhibit TET2 as well as other αKG-dependent enzymes (10). These data demonstrate that a key feature of IDH1/2 mutations in hematopoietic cells is to impair TET2 function and disrupt DNA methylation (​Figure1).

Figure 1 Normal IDH functions to convert isocitrate to αKG in the Krebs cycle.

http://www.ncbi.nlm.nih.gov/pmc/articles/PMC3754251/bin/JCI67266.f1.gif

mutations have been observed with IDH1_2 mutations leukemias

mutations have been observed with IDH1_2 mutations leukemias

Many mutations have been observed in conjunction with IDH1/2 mutations in different types of leukemia.

In de novo adult AML, these mutations should be observed in the context of other prognostic indicators such as CEBPA, NPM1, and DNMT3A mutation. In AML that progresses from MPN, IDH1/2 mutations can be examined separately from the mutations responsible for MPN (such as JAK2 or MPL mutations) using paired pre- and post-transformation samples. Evidence supports a role for IDH1/2 hotspot mutations in leukemic transformation.

http://www.ncbi.nlm.nih.gov/pmc/articles/instance/3754251/bin/JCI67266.f2.gif

Conditional loss of Tet2 expression in mice results in a chronic myelomonocytic leukemia (CMML) phenotype and in increased hematopoietic self-renewal in vivo (32). Of note, in vitro systems have shown that TET2 silencing and expression of IDH1/2 mutant alleles leads to impaired hematopoietic differentiation and expansion of stem/progenitor cells (9). More recently, IDH1 (R132H) conditional knockin mice with hematopoietic-specific recombination were analyzed and found to have myeloid expansion, although they did not develop overt AML. This suggests that IDH mutations by themselves cannot promote overt transformation, and that additional genetic, epigenetic, and/or microenvironmental factors are needed to cooperate with mutant IDH alleles to promote hematologic malignancies. The hematopoietic defects included increased numbers of hematopoietic stem cells and myeloid progenitor cells, and a DNA methylation signature that was similar to observed patterns in primary AML patients with IDH1 mutations (33). While many models of IDH-mutant leukemia have shown potential, future models that incorporate the complexity seen in human patients are needed, as discussed below. More recently, the effects of IDH1/2 mutations on hematopoietic cell lines were replicated using exogenously applied 2HG, which was rendered permeable to the cell membrane by esterification. The Kaelin group used this system to dissect the role of 2HG in the αKG-dependent pathways that may be affected in IDH mutation, and to show that the effects are reversible (34). Tools such as these will help advance our understanding of the biology of IDH mutations and, by extension, the potential therapies that may affect mutant IDH and the downstream pathways. Indeed, given the recent description of mutant-selective IDH1/2 inhibitors (34–37), the development of genetically accurate models of IDH mutant–mediated leukemogenesis will be critical to evaluate the effects of targeted therapies in mice with AML and subsequently in the clinical context.

2.1.4.7 The Common Feature of Leukemia-Associated IDH1 and IDH2 Mutations – a Neomorphic Enzyme Activity Converting α-Ketoglutarate to 2-Hydroxyglutarate

PS Ward, J Patel, DR Wise, O Abdel-Wahab, BD Bennett, HA Coller, et al.
Cancer Cell 2010 Mar 16; 17(3):225–234
http://dx.doi.org/10.1016/j.ccr.2010.01.020

Highlights

  • All IDH mutations reported in cancer share a common neomorphic enzymatic activity
  • Both wild-type IDH1 and IDH2 are required for cell proliferation
  • IDH2 R140Q mutations occur in 9% of AML cases
  • Overall, IDH2 mutations appear more common than IDH1 mutations in AML


Summary

The somatic mutations in cytosolic isocitrate dehydrogenase 1 (IDH1) observed in gliomas can lead to the production of 2-hydroxyglutarate (2HG). Here, we report that tumor 2HG is elevated in a high percentage of patients with cytogenetically normal acute myeloid leukemia (AML). Surprisingly, less than half of cases with elevated 2HG possessed IDH1 mutations. The remaining cases with elevated 2HG had mutations in IDH2, the mitochondrial homolog of IDH1. These data demonstrate that a shared feature of all cancer-associated IDH mutations is production of the oncometabolite 2HG. Furthermore, AML patients with IDH mutations display a significantly reduced number of other well characterized AML-associated mutations and/or associated chromosomal abnormalities, potentially implicating IDH mutation in a distinct mechanism of AML pathogenesis.

Significance

Most cancer-associated enzyme mutations result in either catalytic inactivation or constitutive activation. Here we report that the common feature of IDH1 and IDH2 mutations observed in AML and glioma is the acquisition of an enzymatic activity not shared by either wild-type enzyme. The product of this neomorphic enzyme activity can be readily detected in tumor samples, and we show that tumor metabolite analysis can identify patients with tumor-associated IDH mutations. Using this method, we discovered a 2HG-producing IDH2 mutation, IDH2 R140Q, that was present in 9% of serial AML samples. Overall, IDH1 and IDH2 mutations were observed in over 23% of AML patients.

Mutations in human cytosolic isocitrate dehydrogenase I (IDH1) occur somatically in > 70% of grade II-III gliomas and secondary glioblastomas, and in 8.5% of acute myeloid leukemias (AML) (Mardis et al., 2009 and Yan et al., 2009). Mutations have also been reported in cancers of the colon and prostate (Kang et al., 2009 and Sjoblom et al., 2006). To date, all reported IDH1 mutations result in an amino acid substitution at a single arginine residue in the enzyme’s active site, R132. A subset of intermediate grade gliomas lacking mutations in IDH1 has been found to harbor mutations in IDH2, the mitochondrial homolog of IDH1. The IDH2 mutations that have been identified in gliomas occur at the analogous residue to IDH1 R132, IDH2 R172. Both IDH1 R132 and IDH2 R172 mutants lack the wild-type enzyme’s ability to convert isocitrate to α-ketoglutarate (Yan et al., 2009). To date, all reported IDH1 or IDH2 mutations are heterozygous, with the cancer cells retaining one wild-type copy of the relevant IDH1 or IDH2 allele. No patient has been reported with both an IDH1 and IDH2 mutation. These data argue against the IDH mutations resulting in a simple loss of function.

Normally both cytosolic IDH1 and mitochondrial IDH2 exist as homodimers within their respective cellular compartments, and the mutant proteins retain the ability to bind to their respective wild-type partner. Therefore, it has been proposed that mutant IDH1 can act as a dominant negative against wild-type IDH1 function, resulting in a decrease in cytosolic α-ketoglutarate levels and leading to an indirect activation of the HIF-1α pathway (Zhao et al., 2009). However, recent work has provided an alternative explanation. The R132H IDH1 mutation observed in gliomas was found to display a gain of function for the NADPH-dependent reduction of α-ketoglutarate to R(–)-2-hydroxyglutarate (2HG) ( Dang et al., 2009). This in vitro activity was confirmed when 2HG was found to be elevated in IDH1-mutated gliomas. Whether this neomorphic activity is a common feature shared by IDH2 mutations was not determined.

IDH1 R132 mutations identical to those reported to produce 2HG in gliomas were recently reported in AML (Mardis et al., 2009). These IDH1 R132 mutations were observed in 8.5% of AML patients studied, and a significantly higher percentage of mutation was observed in the subset of patients whose tumors lacked cytogenetic abnormalities. IDH2 R172 mutations were not observed in this study. However, during efforts to confirm and extend these findings, we found an IDH2 R172K mutation in an AML sample obtained from a 77-year-old woman. This finding confirmed that both IDH1 and IDH2 mutations can occur in AML and prompted us to more comprehensively investigate the role of IDH2 in AML.

The present study was undertaken to see if IDH2 mutations might share the same neomorphic activity as recently reported for glioma-associated IDH1 R132 mutations. We also determined whether tumor-associated 2HG elevation could prospectively identify AML patients with mutations in IDH. To investigate the lack of reduction to homozygosity for either IDH1 or IDH2 mutations in tumor samples, the ability of wild-type IDH1 and/or IDH2 to contribute to cell proliferation was examined.

IDH2 Is Mutated in AML

A recent study employing a whole-genome sequencing strategy in an AML patient resulted in the identification of somatic IDH1 mutations in AML (Mardis et al., 2009). Based on the report that IDH2 mutations were also observed in the other major tumor type in which IDH1 mutations were implicated (Yan et al., 2009), we sequenced the IDH2 gene in a set of de-identified AML DNA samples. Several cases with IDH2 R172 mutations were identified. In the initial case, the IDH2 mutation found, R172K, was the same mutation reported in glioma samples. It has been recently reported that cancer-associated IDH1 R132 mutants display a loss-of-function for the use of isocitrate as substrate, with a concomitant gain-of-function for the reduction of α-ketoglutarate to 2HG (Dang et al., 2009). This prompted us to determine if the recurrent R172K mutation in IDH2 observed in both gliomas and leukemias might also display the same neomorphic activity. In IDH1, the role of R132 in determining IDH1 enzymatic activity is consistent with the stabilizing charge interaction of its guanidinium moiety with the β-carboxyl group of isocitrate (Figure 1A). This β-carboxyl is critical for IDH’s ability to catalyze the interconversion of isocitrate and α-ketoglutarate, with the overall reaction occurring in two steps through a β-carboxyl-containing intermediate (Ehrlich and Colman, 1976). Proceeding in the oxidative direction, this β-carboxyl remains on the substrate throughout the IDH reaction until the final decarboxylating step which produces α-ketoglutarate.

IDH1 R132 and IDH2 R172 Are Analogous Residues

IDH1 R132 and IDH2 R172 Are Analogous Residues

http://ars.els-cdn.com/content/image/1-s2.0-S153561081000036X-gr1.jpg

Figure 1. IDH1 R132 and IDH2 R172 Are Analogous Residues that Both Interact with the β-Carboxyl of Isocitrate

(A) Active site of crystallized human IDH1 with isocitrate.

(B) Active site of human IDH2 with isocitrate, modeled based on the highly homologous and crystallized pig IDH2 structure. For (A) and (B), carbon 6 of isocitrate containing the β-carboxyl is highlighted in cyan, with remaining isocitrate carbons shown in yellow. Carbon atoms of amino acids (green), amines (blue), and oxygens (red) are also shown. Hydrogen atoms are omitted from the figure for clarity. Dashed lines depict interactions < 3.1 Å, corresponding to hydrogen and ionic bonds. Residues coming from the other monomer of the IDH dimer are denoted with a prime (′) symbol.

To understand how R172 mutations in IDH2 might relate to the R132 mutations in IDH1 characterized for gliomas, we modeled human IDH2 based on the pig IDH2 structure containing bound isocitrate (Ceccarelli et al., 2002). Human and pig IDH2 protein share over 97% identity and all active site residues are identical. The active site of human IDH2 was structurally aligned with human IDH1 (Figure 1). Similar to IDH1, in the active site of IDH2 the isocitrate substrate is stabilized by multiple charge interactions throughout the binding pocket. Moreover, like R132 in IDH1, the analogous R172 in IDH2 is predicted to interact strongly with the β-carboxyl of isocitrate. This raised the possibility that cancer-associated IDH2 mutations at R172 might affect enzymatic interconversion of isocitrate and α-ketoglutarate similarly to IDH1 mutations at R132.

Mutation of IDH2 R172K Enhances α-Ketoglutarate-Dependent NADPH Consumption

To test whether cancer-associated IDH2 R172K mutations shared the gain of function in α-ketoglutarate reduction observed for IDH1 R132 mutations (Dang et al., 2009), we overexpressed wild-type or R172K mutant IDH2 in cells with endogenous wild-type IDH2 expression, and then assessed isocitrate-dependent NADPH production and α-ketoglutarate-dependent NADPH consumption in cell lysates. As reported previously (Yan et al., 2009), extracts from cells expressing the R172K mutant IDH2 did not display isocitrate-dependent NADPH production above the levels observed in extracts from vector-transfected cells. In contrast, extracts from cells expressing a comparable amount of wild-type IDH2 markedly increased isocitrate-dependent NADPH production (Figure 2A). However, when these same extracts were tested for NADPH consumption in the presence of α-ketoglutarate, R172K mutant IDH2 expression was found to correlate with a significant enhancement to α-ketoglutarate-dependent NADPH consumption. Vector-transfected cell lysates did not demonstrate this activity (Figure 2B). Although not nearly to the same degree as with the mutant enzyme, wild-type IDH2 overexpression also reproducibly enhanced α-ketoglutarate-dependent NADPH consumption under these conditions.

Expression of R172K Mutant IDH2 Results in Enhanced α-Ketoglutarate-Dependent Consumption of NADPH

Expression of R172K Mutant IDH2 Results in Enhanced α-Ketoglutarate-Dependent Consumption of NADPH

http://ars.els-cdn.com/content/image/1-s2.0-S153561081000036X-gr2.jpg

Figure 2. Expression of R172K Mutant IDH2 Results in Enhanced α-Ketoglutarate-Dependent Consumption of NADPH

(A) 293T cells transfected with wild-type or R172K mutant IDH2, or empty vector, were lysed and subsequently assayed for their ability to generate NADPH from NADP+ in the presence of 0.1 mM isocitrate.

(B) The same cell lysates described in (A) were assayed for their consumption of NADPH in the presence of 0.5 mM α-ketoglutarate. Data for (A) and (B) are each representative of three independent experiments. Data are presented as the mean and standard error of the mean (SEM) from three independent measurements at the indicated time points.

(C) Expression of wild-type and R172K mutant IDH2 was confirmed by western blotting of the lysates assayed in (A) and (B). Reprobing of the same blot with IDH1 antibody as a control is also shown.

Mutation of IDH2 R172K Results in Elevated 2HG Levels

R172K mutant IDH2 lacks the guanidinium moiety in residue 172 that normally stabilizes β-carboxyl addition in the interconversion of α-ketoglutarate and isocitrate. Yet R172K mutant IDH2 exhibited enhanced α-ketoglutarate-dependent NADPH consumption in cell lysates (Figure 2B). A similar enhancement of α-ketoglutarate-dependent NADPH consumption has been reported for R132 mutations in IDH1, resulting in conversion of α-ketoglutarate to 2HG (Dang et al., 2009). To determine whether cells expressing IDH2 R172K shared this property, we expressed IDH2 wild-type or IDH2 R172K in cells. The accumulation of organic acids, including 2HG, both within cells and in culture medium of the transfectants was then assessed by gas-chromatography mass spectrometry (GC-MS) after MTBSTFA derivatization of the organic acid pool. We observed a metabolite peak eluting at 32.5 min on GC-MS that was of minimal intensity in the culture medium of IDH2-wild-type-expressing cells, but that in the medium of IDH2-R172K-expressing cells had a markedly higher intensity approximating that of the glutamate signal (Figures 3A and 3B). Mass spectra of this metabolite peak fit that predicted for MTBSTFA-derivatized 2HG, and the peak’s identity as 2HG was additionally confirmed by matching its mass spectra with that obtained by derivatization of commercial 2HG standards (Figure 3C). Similar results were obtained when the intracellular organic acid pool was analyzed. IDH2 R172K expressing cells were found to have an approximately 100-fold increase in the intracellular levels of 2HG compared with the levels detected in vector-transfected and IDH2-wild-type-overexpressing cells (Figure 3D). Consistent with previous work, IDH1-R132H-expressing cells analyzed in the same experiment had comparable accumulation of 2HG in both cells and in culture medium. 2HG accumulation was not observed in cells overexpressing IDH1 wild-type (data not shown).

Figure 3. Expression of R172K Mutant IDH2 Elevates 2HG Levels within Cells and in Culture Medium

(A and B) 293T cells transfected with IDH2 wild-type (A) or IDH2 R172K (B) were provided fresh culture medium the day after transfection. Twenty-four hours later, the medium was collected, from which organic acids were extracted, purified, and derivatized with MTBSTFA. Shown are representative gas chromatographs for the derivatized organic acids eluting between 30 to 34 min, including aspartate (Asp) and glutamate (Glu). The arrows indicate the expected elution time of 32.5 min for MTBSTFA-derivatized 2HG, based on similar derivatization of a commercial R(-)-2HG standard. Metabolite abundance refers to GC-MS signal intensity.

(C) Mass spectrum of the metabolite peak eluting at 32.5 min in (B), confirming its identity as MTBSTFA-derivatized 2HG. The structure of this derivative is shown in the inset, with the tert-butyl dimethylsilyl groups added during derivatization highlighted in green. m/e– indicates the mass (in atomic mass units) to charge ratio for fragments generated by electron impact ionization.

(D) Cells were transfected as in (A) and (B), and after 48 hr intracellular metabolites were extracted, purified, MTBSTFA-derivatized, and analyzed by GC-MS. Shown is the quantitation of 2HG signal intensity relative to glutamate for a representative experiment. See also Figure S1.

http://ars.els-cdn.com/content/image/1-s2.0-S153561081000036X-gr3.jpg

Mutant IDH2 Produces the (R) Enantiomer of 2HG

Cancer-associated mutants of IDH1 produce the (R) enantiomer of 2HG ( Dang et al., 2009). To determine the chirality of the 2HG produced by mutant IDH2 and to compare it with that produced by R132H mutant IDH1, we used a two-step derivatization method to distinguish the stereoisomers of 2HG by GC-MS: an esterification step with R-(−)-2-butanolic HCl, followed by acetylation of the 2-hydroxyl with acetic anhydride ( Kamerling et al., 1981). Test of this method on commercial S(+)-2HG and R(−)-2HG standards demonstrated clear separation of the (S) and (R) enantiomers, and mass spectra of the metabolite peaks confirmed their identity as the O-acetylated di-(−)-2-butyl esters of 2HG (see Figures S1A and S1B available online). By this method, we confirmed the chirality of the 2HG found in cells expressing either R132H mutant IDH1 or R172K mutant IDH2 corresponded exclusively to the (R) enantiomer ( Figures S1C and S1D).

Leukemic Cells Bearing Heterozygous R172K IDH2 Mutations Accumulate 2HG

IDH2 Is Critical for Proliferating Cells and Contributes to the Conversion of α-Ketoglutarate into Citrate in the Mitochondria

A peculiar feature of the IDH-mutated cancers described to date is their lack of reduction to homozygosity. All tumors with IDH mutations retain one IDH wild-type allele. To address this issue we examined whether wild-type IDH1 and/or IDH2 might play a role in either cell survival or proliferation. Consistent with this possibility, we found that siRNA knockdown of either IDH1 or IDH2 can significantly reduce the proliferative capacity of a cancer cell line expressing both wild-type IDH1 and IDH2 ( Figure 4A).

Both IDH1 and IDH2 Are Critical for Cell Proliferation

Both IDH1 and IDH2 Are Critical for Cell Proliferation

http://ars.els-cdn.com/content/image/1-s2.0-S153561081000036X-gr4.jpg

Figure 4. Both IDH1 and IDH2 Are Critical for Cell Proliferation

(A) SF188 cells were treated with either of two unique siRNA oligonucleotides against IDH1 (siIDH1-A and siIDH1-B), either of two unique siRNA oligonucleotides against IDH2 (siIDH2-A and siIDH2-B), or control siRNA (siCTRL), and total viable cells were counted 5 days later. Data are the mean ± SEM of four independent experiments. In each case, both pairs of siIDH nucleotides gave comparable results. A representative western blot from one of the experiments, probed with antibody specific for either IDH1 or IDH2 as indicated, is shown on the right-hand side.

(B) Model depicting the pathways for citrate +4 (blue) and citrate +5 (red) formation in proliferating cells from [13C-U]-L-glutamine (glutamine +5).

(C) Cells were treated with two unique siRNA oligonucleotides against IDH2 or control siRNA, labeled with [13C-U]-L-glutamine, and then assessed for isotopic enrichment in citrate by LC-MS. Citrate +5 and Citrate +4 refer to citrate with five or four 13C-enriched atoms, respectively. Reduced expression of IDH2 from the two unique oligonucleotides was confirmed by western blot. Blotting with actin antibody is shown as a loading control.

(D) Cells were treated with two unique siRNA oligonucleotides against IDH3 (siIDH3-A and siIDH3-B) or control siRNA, and then labeled and assessed for isotopic citrate enrichment by GC-MS. Shown are representative data from three independent experiments. Reduced expression of IDH3 from the two unique oligonucleotides was confirmed by western blot. In (C) and (D), data are presented as mean and standard deviation of three replicates per experimental group.

The genetic analysis of these tumor samples revealed two neomorphic IDH mutations that produce 2HG. Among the IDH1 mutations, tumors with IDH1 R132C or IDH1 R132G accumulated 2HG. This result is not unexpected, as a number of mutations of R132 to other residues have also been shown to accumulate 2HG in glioma samples (Dang et al., 2009).

The other neomorphic allele was unexpected. All five of the IDH2 mutations producing 2HG in this sample set contained the same mutation, R140Q. As shown in Figure 1, both R140 in IDH2 and R100 in IDH1 are predicted to interact with the β-carboxyl of isocitrate. Additional modeling revealed that despite the reduced ability to bind isocitrate, the R140Q mutant IDH2 is predicted to maintain its ability to bind and orient α-ketoglutarate in the active site (Figure 6). This potentially explains the ability of cells with this neomorph to accumulate 2HG in vivo. As shown in Figure 5, samples containing IDH2 R140Q mutations were found to have accumulated 2HG to levels 10-fold to 100-fold greater than the highest levels detected in IDH wild-type samples.

Figure 5. Primary Human AML Samples with IDH1 or IDH2 Mutations Display Marked Elevations of 2HG

http://ars.els-cdn.com/content/image/1-s2.0-S153561081000036X-gr5.jpg

Structural Modeling of R140Q Mutant IDH2

Structural Modeling of R140Q Mutant IDH2

Figure 6.  Structural Modeling of R140Q Mutant IDH2

(A) Active site of human wild-type IDH2 with isocitrate replaced by α-ketoglutarate (α-KG). R140 is well positioned to interact with the β-carboxyl group that is added as a branch off carbon 3 when α-ketoglutarate is reductively carboxylated to isocitrate.

(B) Active site of R140Q mutant IDH2 complexed with α-ketoglutarate, demonstrating the loss of proximity to the substrate in the R140Q mutant. This eliminates the charge interaction from residue 140 that stabilizes the addition of the β-carboxyl required to convert α-ketoglutarate to isocitrate.

IDH2 Mutations Are More Common Than IDH1 Mutations in AML

  • Neomorphic Enzymatic Activity to Produce 2HG Is the Shared Feature of IDH1 and IDH2 Mutations
  • 2HG as a Screening and Diagnostic Marker
  • Maintaining At Least One IDH1 and IDH2 Wild-Type Allele May Be Essential for Transformed Cells
  • 2HG as an Oncometabolite

Read Full Post »

The Metabolic View of Epigenetic Expression

Writer and Curator: Larry H Bernstein, MD, FCAP

Introduction

This is the fifth contribution to a series of articles on cancer, genomics, and metabolism.   I begin this after reading an article by Stephen Williams “War on Cancer May Need to Refocus Says Cancer Expert on NPR”, and after listening to NPR “On the Media”. This is an unplanned experience, perhaps partly related to an Op-Ed in the New York Times two days before by Angelina Jolie Pittman.  Taking her article prior to pre-emptive breast surgery for the BRCA1 mutation two years ago and her salpingo-oophorectomy at age 39 years with her family history, and her adoption of several children even prior to her marriage to Brad Pitt, reveals an unusual self-knowledge as well as perspective on the disease risk balanced with her maternal instincts.  I sense (but don’t know) that she had a good knowledge not stated about the estrogen sensitivity of breast cancer for some years, and balanced that knowledge in her life decisions.

Tracing the history of cancer and the Lyndon Johnson initiated “War on Cancer” the initiative is presented as misguided.  Moreover, the imbalance is posed aas focused overly on genomics, and there is an imbalnced in the attention to the types of cancer, bladder cancer (urothelial) receiving too little attention. However, the events that drive this are complex, and not surprising.  The funding is driven partly by media attention (a film star or President’s wife) and not to be overlooked, watch where the money flows.  People who have the ability to donate and also have a family experience will give, regardless of the statistics because it is 100 percent in their eyes.

Insofar as the scientific endeavor goes, young scientists are committed to a successful research career, and they also need funding, so they have to balance the risk of success and failure in the choice of problems they choose to work on.  But until the 20th century, the biological sciences were largely descriptive. The emergence of a “Molecular Biology” is a unique 20th century development. The work of Pathology – pioneered by Rokitansky, Virchow, and to an extent also the anatomist/surgeon John Harvey – was observational science.  The description of Hodgkin’s lymphoma was observational, and it was a breakthrough in medicine.

With the emergence of genomics from biochemistry and genetics in molecular biology (biology at the subcellular level), a part of medicine that was well founded became an afterthought.  After all, after many years of the history of medicine and pathology, it is well known that cancers are not only a dysmetabolism of cellular replication and cellular regulation, but cancers have a natural history related to organ system, tissue specificity, sex, and age of occurrence. This should be well known to the experienced practitioner, but not necessarily to the basic researcher with no little clinical exposure.  Consequently, it was quite remarkable to me to find that the truly amazing biochemist who gave a “Harvey Lecture” at Harvard on the pyridine nucleotide transhydrogenases, and who shared in the discovery of Coenzyme A, had made the observation that organs that are primarily involved with synthetic activity -adrenal, pituitary, and thyroid, testis, ovary, breast (most notably) – have a more benign course than those of stomach, colon, pancreas, melanoma, hematopoietic, and sarcomas. The liver is highly synthetic, but doesn’t fit so nicely because of the role in detoxification and the large role in glucose and fat catabolism.  Further, this was at a time that we knew nothing about the cell death pathway and cellular repair, and how is it in concert with cell proliferation.

The first important reasoning about cancer metabolism was opened by Otto Warburg in the late 1920s.  I have  little reason to doubt his influence on Nathan Kaplan, who used the terms DPN(+/H) and TPN(+/H), disregarding the terms NAD(+/H) and NADP(+/H), although I was told it was because of the synthesis of the pyridine nucleotide adducts for study (APDPN, etc.).

In a recent article, I had an interesting response from Jose ES Rosalino:

In mRNA Translation and Energy Metabolism in Cancer

Topisirovic and N. Sonenberg – Cold Spring Harbor Symposia on Quantitative Biology, Volume LXXVI – http://dx.doi.org:/10.1101/sqb.2011.76.010785

“A prominent feature of cancer cells is the use of aerobic glycolysis under conditions in which oxygen levels are sufficient to support energy production in the mitochondria (Jones and Thompson 2009; Cairns et al. 2010). This phenomenon, named the “Warburg effect,” after its discoverer Otto Warburg, is thought to fuel the biosynthetic requirements of the neoplastic growth (Warburg 1956; Koppenol et al. 2011) and has recently been acknowledged as one of the hallmarks of cancer (Hanahan and Weinberg 2011). mRNA translation is the most energy-demanding process in the cell (Buttgereit and Brand 1995). Again, the use of aerobic glycolysis expression has being twisted.”

To understand my critical observation consider this: Aerobic glycolysis is the carbon flow that goes from Glucose to CO2 and water (includes Krebs cycle and respiratory chain for the restoration of NAD, FAD etc.

Anerobic glyclysis is the carbon flow that goes from glucose to lactate. It uses conversion of pyruvate to lactate to regenerate NAD.

“Pasteur effect” is an expression coined by Warburg it refers to the reduction in the carbon flow from glucose when oxygen is offered to yeasts. The major reason for that is in general terms, derived from the fact that carbon flow is regulated by several cell requirements but majorly by the ATP needs of the cell. Therefore, as ATP is generated 10 more efficiently in aerobiosis than under anaerobiosis, less carbon flow is required under aerobiosis than under anaerobiosis to maintain ATP levels. Warburg, after searching for the same regulatory mechanism in normal and cancer cells for comparison found that transformed cell continued their large flow of glucose carbons to lactate despite of the presence of oxygen.

So, it is wrong to describe that aerobic glycolysis continues in the presence of oxygen. It is what it is expected to occur. The wrong thing is that anaerobic glycolysis continues under aerobiosis.

In our discussion of transcription and cell regulatory processes, we have already encountered a substantial amount of “enzymology” that drives what is referred to as “epigenetics”.  Enzymatic reactions are involved almost everywhere we look at the processes involved in RNA nontranscriptional affairs.

Enzyme catalysis

Pyruvate carboxylase is critical for non–small-cell lung cancer proliferation
K Sellers,…, TW-M Fan
J Clin Invest. Jan 2015; xx
http://dx.doi.org:/10.1172/JCI72873

Anabolic biosynthesis requires precursors supplied by the Krebs cycle, which in turn requires anaplerosis to replenish precursor intermediates. The major anaplerotic sources are pyruvate and glutamine, which require the activity of pyruvate carboxylase (PC) and glutaminase 1 (GLS1), respectively. Due to their rapid proliferation, cancer cells have increased anabolic and energy demands; however, different cancer cell types exhibit differential requirements for PC- and GLS-mediated pathways for anaplerosis and cell proliferation. Here, we infused patients with early-stage non–small-cell lung cancer (NSCLC) with uniformly 13C-labeled glucose before tissue resection and determined that the cancerous tissues in these patients had enhanced PC activity. Freshly resected paired lung tissue slices cultured in 13C6-glucose or 13C5, 15N2-glutamine tracers confirmed selective activation of PC over GLS in NSCLC. Compared with noncancerous tissues, PC expression was greatly enhanced in cancerous tissues, whereas GLS1 expression showed no trend. Moreover, immunohistochemical analysis of paired lung tissues showed PC overexpression in cancer cells rather than in stromal cells of tumor tissues. PC knockdown induced multinucleation, decreased cell proliferation and colony formation in human NSCLC cells, and reduced tumor growth in a mouse xenograft model. Growth inhibition was accompanied by perturbed Krebs cycle activity, inhibition of lipid and nucleotide biosynthesis, and altered glutathione homeostasis. These findings indicate that PC-mediated anaplerosis in early stage NSCLC is required for tumor survival and proliferation.

Accelerated glycolysis under aerobic conditions (the “Warburg effect”) has been a hallmark of cancer for many decades (1). It is now recognized that cancer cells must undergo many other metabolic reprograming changes (2) to meet the increased anabolic and energetic demands of proliferation (3, 4). It is also becoming clear that different cancer types may utilize a variety of metabolic adaptations that are context dependent, commensurate with the notion that altered metabolism is a hallmark of cancer (12). Enhanced glucose uptake and aerobic glycolysis generates both energy (i.e., ATP) and molecular precursors for the biosynthesis of complex carbohydrates, sugar nucleotides, lipids, proteins, and nucleic acids. However, increased glycolysis alone is insufficient to meet the total metabolic demands of proliferating cancer cells. The Krebs cycle is also a source of energy via the oxidation of pyruvate, fatty acids, and amino acids such as glutamine. Moreover, several Krebs cycle intermediates are essential for anabolic and glutathione metabolism, including citrate, oxaloacetate, and α-ketoglutarate (Figure 1A).

Figure 1. PC is activated in human NSCLC tumors. (A) PC and GLS1 catalyze the major anaplerotic inputs (blue) into the Krebs cycle to support the anabolic demand for biosynthesis (green). Also shown is the fate of 13C from 13C6-glucose through glycolysis and into the Krebs cycle via PC (red).
(B) Representative Western blots of PC and GLS1 protein expression levels in human NC lung (N) and NSCLC (C) tissues. (C) Pairwise PC and GLS1 expression (n = 86) was normalized to α-tubulin and plotted as the log10 ratio of CA/NC tissues. For PC, nearly all log ratios were positive (82 of 86), with a clustering in the 0.5–1 range (i.e., typically 3- to 10-fold higher expression in the tumor tissue; Wilcoxon test, P < 0.0001). In contrast, GLS1 expression was nearly evenly distributed between positive and negative log10 ratios and showed no statistically significant difference between the CA and NC tissues (Wilcoxon test, P = 0.213). Horizontal bar represents the median. (D) In vivo PC activity was enhanced in CA tissue compared with that in paired NC lung tissues (n = 34) resected from the same human patients given 13C6-glucose 2.5–3 hours before tumor resection. PC activity was inferred from the enrichment of 13C3-citrate (Cit+3), 13C5-Cit (Cit+5), 13C3-malate (Mal+3), and 13C3-aspartate (Asp+3) as determined by GC-MS. *P < 0.05 and **P < 0.01 by paired Student t test. Error bars represent the SEM.

Continued functioning of the Krebs cycle requires the replenishment of intermediates that are diverted for anabolic uses or glutathione synthesis. This replenishment process, or anaplerosis, is accomplished via 2 major pathways: glutaminolysis (deamidation of glutamine via glutaminase [GLS] plus transamination of glutamate to α-ketoglutarate) and carboxylation of pyruvate to oxaloacetate via ATP-dependent pyruvate carboxylase (PC) (EC 6.4.1.1) (refs. 3, 20, 21, and Figure 1A). The relative importance of these pathways is likely to depend on the nature of the cancer and its specific metabolic adaptations, including those to the microenvironment (20, 22). For example, glutaminolysis was shown to be activated in the glioma cell line SF188, while PC activity was absent, despite the high PC activity present in normal astrocytes. However, SF188 cells use PC to compensate for GLS1 suppression or glutamine restriction (20), and PC, rather than GLS1, was shown to be the major anaplerotic input to the Krebs cycle in primary glioma xenografts in mice. It is also unclear as to the relative importance of PC and GLS1 in other cancer cell types or, most relevantly, in human tumor tissues in situ. Our preliminary evidence from 5 non–small-cell lung cancer (NSCLC) patients indicated that PC expression and activity are upregulated in cancerous (CA) compared with paired noncancerous (NC) lung tissues (21), although it was unclear whether PC activation applies to a larger NSCLC cohort or whether PC expression was associated with the cancer and/or stromal cells

Here, we have greatly extended our previous findings (21) in a larger cohort (n = 86) by assessing glutaminase 1 (GLS1) status and analyzing in detail the biochemical and phenotypic consequences of PC suppression in NSCLC. We found PC activity and protein expression levels to be, on average, respectively, 100% and 5- to 10-fold higher in cancerous (CA) lung tissues than in paired NC lung tissues resected from NSCLC patients, whereas GLS1 expression showed no significant trend. We have also applied stable isotope–resolved metabolomic (SIRM) analysis to paired freshly resected CA and NC lung tissue slices in culture (analogous to the Warburg slices; ref. 25) using either [U-13C] glucose or [U-13C,15N] glutamine as tracers. This novel method provided information about tumor metabolic pathways and dynamics without the complication of whole-body metabolism in vivo.

PC expression and activity, but not glutaminase expression, are significantly enhanced in early stages of malignant NSCLC tumors. PC protein expression was significantly higher in primary NSCLC tumors than in paired adjacent NC lung tissues (n = 86, P < 0.0001, Wilcoxon test) (Figure 1, B and C). The median PC expression was 7-fold higher in the tumor, and the most probable (modal) overexpression in the tumor was approximately 3-fold higher (see Supple-mental Table 1; supplemental material available online with this article; http://dx.doi.org:/10.1172/JCI72873DS1). We found that PC expression was also higher in the tumor tissue compared with that detected in the NC tissue in 82 of 86 patients. In contrast, GLS1 expression was not significantly different between the tumor and NC tissues (P = 0.213, Wilcoxon test) (Figure 1C and Supplemental Table 1). The 13C3-Asp produced from 13C6-glucose (Figure 1A) infused into NSCLC patients was determined by gas chromatography–mass spectrometry (GC-MS) to estimate in vivo PC activity. A bolus injection of 10 g 13C6-glucose in 50 ml saline led to an average of 44% 13C enrichment in the plasma glucose immediately after infusion (Supplemental Table 2). Because the labeled glucose was absorbed by various tissues over the approximately 2.5 hours between infusion and tumor resection, plasma glucose enrichment dropped to 17% (Supplemental Table 2). The labeled glucose in both CA and NC lung tissues was metabolized to labeled lactate, but this occurred to a much greater extent in the CA tissues (Supplemental Figure 1A), which indicates accelerated glycolysis in these tissues.

Fresh tissue (Warburg) slices confirm enhanced PC and Krebs cycle activity in NSCLC. To further assess PC activity relative to GLS1 activity in human lung tissues, thin (<1 mm thick) slices of paired CA and NC lung tissues freshly resected from 13 human NSCLC patients were cultured in 13C6-glucose or 13C5,15N2-glutamine for 24 hours. These tissues maintain biochemical activity and histological integrity for at least 24 hours under culture conditions (Figure 2A, Supplemental Figure 2, A and B, and ref. 26). When the tissues were incubated with 13C6-glucose, CA slices showed a significantly greater percentage of enrichment in glycolytic 13C3-lactate (3 in Figure 2B) than did the NC slices, indicative of the Warburg effect. In addition, the CA tissues had significantly higher fractions of 13C4-, 13C5-, and 13C6-citrate (4, 5, and 6 of citrate, respectively, in Figure 2B) than did the NC tissues. These isotopologs require the combined action of PDH, PC, and multiple turns of the Krebs cycle (Figure 2C). Consistent with the labeled citrate data, the increase in the percentage of enrichment of 13C3-, 13C4-, and 13C5-glutamate (3, 4, and 5 of glutamate, respectively, in Figure 2B) in the CA tissues indicates enhanced Krebs cycle and PC activity.

Figure 2. Ex vivo CA lung tissue slices have enhanced oxidation of glucose through glycolysis and the Krebs cycle with and without PC input compared with that of paired NC lung slices. Thin slices of CA and NC lung tissues freshly resected from 13 human NSCLC patients were incubated with 13C6-glucose for 24 hours as described in the Methods. The percentage of enrichment of lactate, citrate, glutamate, and aspartate was determined by GC-MS. (A) 1H{13C} HSQC NMR showed an increase in labeled lactate, glutamate, and aspartate. In addition, CA tissues had elevated 13C abundance in the ribose moiety of the adenine-containing nucleotides (1′-AXP), indicating that the tissues were viable and had enhanced capacity for nucleotide synthesis. (B) CA tissue slices (n = 13) showed increased glucose metabolism through glycolysis based on the increased percentage of enrichment of 13C3-lactate (“3”), and through the Krebs cycle based on the increased percentage of enrichment of 13C4–6-citrate (“4–6”) and 13C3–5-glutamate (“3–5”) (see 13C fate tracing in C). *P < 0.05 and **P < 0.01 by paired Student’s t test. Error bars represent the SEM. (C) An atom-resolved map illustrates how PC, PDH, and 2 turns of the Krebs cycle activity produced the 13C isotopologs of citrate and glutamate in B, whose enrichment were significantly enhanced in CA tissue slices.

Figure 4. PC suppression via shRNA inhibits proliferation and tumorigenicity of human NSCLC cell lines in vitro and in vivo. Proliferation and colony-formation assays were initiated 1 week after transduction and selection with puromycin. A549 xenograft in NSG mice was performed 8 days after transduction. *P < 0.01, **P < 0.001, ***P < 0.0001, and ****P < 0.00001 by Student t test, assuming unequal variances. Error bars represent the SEM. (A) NSCLC cells lines were transduced with shPC55 or shEV. Proliferation assays (n = 6) revealed substantial growth inhibition induced by PC knockdown in all 5 cell lines after a relatively long latency period. (B) Colony-formation assays indicated that PC knockdown reduced the capacity of A549 and PC9 cells to form colonies in soft agar (n = 3). (C) Tumor xenografts from shPC55-transduced A549 cells showed a 2-fold slower growth rate than did control shEV tumors (P < 0.001 by the unpaired Welch version of the t test). Tumor size was calculated as πab/4, where a and b are the x,y diameters. Each point represents an average of 6 mice. The solid lines are the nonlinear regression fits to the equation: size = a + bt2, as described in the Methods. (D) The extent of PC knockdown in the mouse xenografts (n = 6) was lesser than that in cell cultures, leading to less attenuation of PC expression (30%–60% of control) and growth inhibition. In addition, PC expression in the excised tumors correlated with the individual growth rates, as determined by Pearson’s correlation coefficient.

Fatty acyl synthesis from 13C5-glutamine (“Even” in Figure 6B) via glutaminolysis and the Krebs cycle was greatly attenuated in PC-suppressed cells. Taken together, these results suggest that PC knockdown severely inhibits lipid production by blocking the biosynthesis of fatty acyl components but not the glucose-derived glycerol backbone. This is consistent with decreased Krebs cycle activity (Figure 5), which in turn curtails citrate export from the mitochondria to supply the fatty acid precursor acetyl CoA in the cytoplasm.

Figure 5. PC knockdown perturbs glucose and glutamine flux through the Krebs cycle. 13C Isotopolog concentrations were determined by GC-MS (n = 3). Values represent the averages of triplicates, with standard errors. *P < 0.05, **P < 0.01, ***P < 0.001, and ****P < 0.0001 by Student’s t test, assuming unequal variances. The experiments were repeated 3 times. (A) A549 cells were transduced with shPC55 for 10 days before incubation with 13C6-glucose for 24 hours. As expected, the 13C isotopologs of Krebs cycle metabolites produced via PC and Krebs cycle activity were depleted in PC-deficient cells (tracked by blue dots in the atom-resolved map and blue circles in the bar graphs; see also Figure 2C). In addition, 13C6-glucose metabolism via PDH was also perturbed (indicated by red dots and circles). (B) Treatment of PC-knockdown cells with 13C5,15N2-glutamine revealed that anaplerotic input via GLS did not compensate for the loss of PC activity, since GLS activity was attenuated, as inferred from the activity markers (indicated by red dots and circles). Decarboxylation of glutamine-derived malate by malic enzyme (ME) and reentry of glutamine-derived pyruvate into the Krebs cycle via PC or PDH (shown in blue and green, respectively) were also attenuated. Purple diamonds denote 15N; black diamonds denote 14N.

Figure 6. PC suppression hinders Krebs cycle–fueled biosynthesis. (A) 13C atom–resolved pyrimidine biosynthesis from 13C6-glucose and 13C5-glutamine is depicted with a 13C5-ribose moiety (red dots) produced via the pentose phosphate pathway (PPP) and 13C1-3  uracil ring (blue dots) derived from  13C2-4-aspartate produced via the Krebs cycle or the combined action of ME and PC (blue dots). A549 cells transduced with shPC55 or shEV were incubated with 13C6-glucose or 13C5-glutamine for 24 hours. Fractional enrichment of UTP and CTP isotopologs from FT-ICR-MS analysis of polar cell extracts showed reduced enrichment of 13C6-glucose–derived 13C5-ribose (the “5” isotopolog) and 13C6-glucose– or 13C5-glutamine–derived 13C1-3-pyrimidine rings (the “6–8” or “1–3” isotopologs, highlighted by dashed green rectangles; for the “6–8” isotopologs, 5 13Cs arose from ribose and 1–3 13Cs from the ring) (10, 45). These data suggest that PC knockdown inhibits de novo pyrimidine biosynthesis from both glucose and glutamine. (B) Glucose and glutamine carbons enter fatty acids via citrate. FT-ICR-MS analysis of labeled lipids from the nonpolar cell extracts showed that PC knockdown severely inhibited the incorporation of glucose and glutamine carbons into the fatty acyl chains (even) and fatty acyl chains plus glycerol backbone (odd >3) of phosphatidylcholine lipids. However, synthesis of the 13C3-glycerol backbone (the “3” isotopolog) or its precursor 13C3-α-glycerol-3-phosphate (αG3P, m+3) from 13C6-glucose was enhanced rather than inhibited by PC knockdown. These data suggest that PC suppression specifically hinders fatty acid synthesis in A549 cells. Values represent the averages of triplicates (n = 3), with standard errors. *P < 0.05, **P < 0.01,  and ***P < 0.001 by Student’s t test, assuming unequal variances.

De novo glutathione synthesis was analyzed by 1H{13C} HSQC NMR. Glutathione synthesis from both glucose and glutamine was suppressed by PC knockdown (Supplemental Figure 9, A and B). Reduced de novo synthesis led to a large decrease in the total level of reduced glutathione (GSH; Supplemental Figure 12, A and B). At the same time, PC-knockdown cells accumulated slightly more oxidized GSH (GSSG; Supplemental Figure 12, A and B), leading to a significantly reduced GSH/GSSG ratio both in cell culture and in vivo (Supplemental Figure 12C). To determine whether this perturbation of glutathione homeostasis compromises the ability of PC-suppressed cells to handle oxidative stress, we measured ROS production by DCFDA fluorescence. PC-knockdown cells had over 70% more basal ROS than did control cells (0 mM H2O2; Supplemental Figure 12D). When cells were exposed to increasing concentrations of H2O2, the knockdown cells were less able to quench ROS, as they produced up to 300% more ROS than did control cells (Supplemental Figure 12D). However, N-acetylcysteine (NAC) at 10 mM did not rescue the growth of PC-knockdown cells, suggesting that such a growth effect is not simply related to an inability to regenerate GSH from GSSG. Altogether, these results show that PC suppression compromises anaplerotic input into the Krebs cycle, which in turn reduces the activity of the Krebs cycle, while limiting the ability of A549 cells to synthesize nucleotides, lipids, and glutathione. These downstream effects of PC knockdown were also evident when comparing the metabolism of shPC55-transduced A549 cells against that of A549 cells transduced with a scrambled vector (shScr) (Supplemental Figure 13), which suggests that they are on-target effects of PC knockdown.

  1. Warburg O. On the origin of cancer cells. Science. 1956;123(3191):309–314. 2. Dang CV, Semenza GL. Oncogenic alterations of metabolism. Trends Biochem Sci. 1999; 24(2):68–72.
    3. Fan TW, et al. Rhabdomyosarcoma cells show an energy producing anabolic metabolic phenotype compared with primary myocytes. Mol Cancer. 2008;7:79.
    4. Vander Heiden MG, Cantley LC, Thompson CB. Understanding the Warburg effect: the metabolic requirements of cell proliferation. Science. 2009;324(5930):1029–1033.
    10. Le A, et al. Glucose-independent glutamine metabolism via TCA cycling for proliferation and survival in B cells. Cell Metab. 2012;15(1):110–121
    20. Cheng T, et al. Pyruvate carboxylase is required for glutamine-independent growth of tumor cells. Proc Natl Acad Sci U S A. 2011;108(21):8674–8679.
    21. Fan TW, et al. Altered regulation of metabolic pathways in human lung cancer discerned by (13) C stable isotope-resolved metabolomics (SIRM). Mol Cancer. 2009;8:41.
    22. Marin-Valencia I, et al. Analysis of tumor metabolism reveals mitochondrial glucose oxidation in genetically diverse human glioblastomas in the mouse brain in vivo. Cell Metab. 2012;15(6):827–837.
    25. Warburg O. Versuche an überlebendem Carcinomgewebe (Methoden). Biochem Zeitschr. 1923;142:317–333.
    45. Lorkiewicz P, Higashi RM, Lane AN, Fan TW. High information throughput analysis of nucleotides and their isotopically enriched isotopologues by direct-infusion FTICR-MS. Metabolomics. 2012;8(5):930–939.

In vivo HIF-mediated reductive carboxylation is regulated by citrate levels and sensitizes VHL-deficient cells to glutamine deprivation.
Gameiro PA, Yang J, Metelo AM,…, Stephanopoulos G, Iliopoulos O.
Cell Metab. 2013 Mar 5; 17(3):372-85.
http://dx.doi.org:/10.1016/j.cmet.2013.02.002

Hypoxic and VHL-deficient cells use glutamine to generate citrate and lipids through reductive carboxylation (RC) of α-ketoglutarate. To gain insights into the role of HIF and the molecular mechanisms underlying RC, we took advantage of a panel of disease-associated VHL mutants and showed that HIF expression is necessary and sufficient for the induction of RC in human renal cell carcinoma (RCC) cells. HIF expression drastically reduced intracellular citrate levels. Feeding VHL-deficient RCC cells with acetate or citrate or knocking down PDK-1 and ACLY restored citrate levels and suppressed RC. These data suggest that HIF-induced low intracellular citrate levels promote the reductive flux by mass action to maintain lipogenesis. Using [(1-13)C]glutamine, we demonstrated in vivo RC activity in VHL-deficient tumors growing as xenografts in mice. Lastly, HIF rendered VHL-deficient cells sensitive to glutamine deprivation in vitro, and systemic administration of glutaminase inhibitors suppressed the growth of RCC cells as mice xenografts.

Cancer cells undergo fundamental changes in their metabolism to support rapid growth, adapt to limited nutrient resources, and compete for these supplies with surrounding normal cells. One of the metabolic hallmarks of cancer is the activation of glycolysis and lactate production even in the presence of adequate oxygen. This is termed the Warburg effect, and efforts in cancer biology have revealed some of the molecular mechanisms responsible for this phenotype (Cairns et al., 2011). More recently, 13C isotopic studies have elucidated the complementary switch of glutamine metabolism that supports efficient carbon utilization for anabolism and growth (DeBerardinis and Cheng, 2010). Acetyl-CoA is a central biosynthetic precursor for lipid synthesis, being generated from glucose-derived citrate in well-oxygenated cells (Hatzivassiliou et al., 2005). Warburg-like cells, and those exposed to hypoxia, divert glucose to lactate, raising the question of how the tricarboxylic acid (TCA) cycle is supplied with acetyl-CoA to support lipogenesis. We and others demonstrated, using 13C isotopic tracers, that cells under hypoxic conditions or defective mitochondria primarily utilize glutamine to generate citrate and lipids through reductive carboxylation (RC) of α-ketoglutarate by isocitrate dehydrogenase 1 (IDH1) or 2 (IDH2) (Filipp et al., 2012; Metallo et al., 2012; Mullen et al., 2012; Wise et al., 2011).

The transcription factors hypoxia inducible factors 1α and 2α (HIF-1α, HIF-2α) have been established as master regulators of the hypoxic program and tumor phenotype (Gordan and Simon, 2007; Semenza, 2010). In addition to tumor-associated hypoxia, HIF can be directly activated by cancer-associated mutations. The von Hippel-Lindau (VHL) tumor suppressor is inactivated in the majority of sporadic clear-cell renal carcinomas (RCC), with VHL-deficient RCC cells exhibiting constitutive HIF-1α and/or HIF-2α activity irrespective of oxygen availability (Kim and Kaelin, 2003). Previously, we showed that VHL-deficient cells also relied on RC for lipid synthesis even under normoxia. Moreover, metabolic profiling of two isogenic clones that differ in pVHL expression (WT8 and PRC3) suggested that reintroduction of wild-type VHL can restore glucose utilization for lipogenesis (Metallo et al., 2012). The VHL tumor suppressor protein (pVHL) has been reported to have several functions other than the well-studied targeting of HIF. Specifically, it has been reported that pVHL regulates the large subunit of RNA polymerase (Pol) II (Mikhaylova et al., 2008), p53 (Roe et al., 2006), and the Wnt signaling regulator Jade-1. VHL has also been implicated in regulation of NF-κB signaling, tubulin polymerization, cilia biogenesis, and proper assembly of extracellular fibronectin (Chitalia et al., 2008; Kim and Kaelin, 2003; Ohh et al., 1998; Thoma et al., 2007; Yang et al., 2007). Hypoxia inactivates the α-ketoglutarate-dependent HIF prolyl hydroxylases, leading to stabilization of HIF. In addition to this well-established function, oxygen tension regulates a larger family of α-ketoglutarate-dependent cellular oxygenases, leading to posttranslational modification of several substrates, among which are chromatin modifiers (Melvin and Rocha, 2012). It is therefore conceivable that the effect of hypoxia on RC that was reported previously may be mediated by signaling mechanisms independent of the disruption of the pVHL-HIF interaction. Here we

  • demonstrate that HIF is necessary and sufficient for RC,
  • provide insights into the molecular mechanisms that link HIF to RC,
  • detected RC activity in vivo in human VHL-deficient RCC cells growing as tumors in nude mice,
  • provide evidence that the reductive phenotype of VHL-deficient cells renders them sensitive to glutamine restriction in vitro, and
  • show that inhibition of glutaminase suppresses growth of VHL-deficient cells in nude mice.

These observations lay the ground for metabolism-based therapeutic strategies for targeting HIF-driven tumors (such as RCC) and possibly the hypoxic compartment of solid tumors in general.

HIF Inactivation Is Necessary for Downregulation of Reductive Carboxylation by pVHL

(A) Expression of HIF-1 α, HIF-2α, and their target protein GLUT1 in UMRC2-derived cell lines, as indicated.

(B) Carbon atom transition map: the fate of [1-13C1] and [5-13C1]glutamine used to trace reductive carboxylation in this work (carbon atoms are represented by circles). The [1-13C1] (green circle) and [5-13C1] (red circle) glutamine-derived isotopic labels are retained during the reductive TCA cycle (bold red pathway). Metabolites containing the acetyl-CoA carbon skeleton are highlighted by dashed circles.

(C) Relative contribution of reductive carboxylation.

(D and E) Relative contribution of glucose oxidation to the carbons of indicated metabolites (D) and citrate (E). Student’s t test compared VHL-reconstituted to vector-only or to VHL mutants (Y98N/Y112N). Error bars represent SEM. Pyr, pyruvate; Lac, lactate; AcCoA, acetyl-CoA, Cit, citrate; IsoCit, isocitrate; Akg, α-ketoglutarate; Suc, succinate; Fum, fumarate; Mal, malate; OAA, oxaloacetate; Asp, aspartate; Glu, glutamate; PDH, pyruvate dehydrogenase; ME, malic enzyme; IDH, isocitrate dehydrogenase enzymes; ACO, aconitase enzymes; ACLY, ATP-citrate lyase; GLS, glutaminase.

To test the effect of HIF activation on the overall glutamine incorporation in the TCA cycle, we labeled an isogenic pair of VHL-deficient and VHL-reconstituted UMRC2 cells with [U-13C5]glutamine, which generates M4 fumarate, M4 malate, M4 aspartate, and M4 citrate isotopomers through glutamine oxidation. As seen in Figure S1B, VHL-deficient/VHL-positive UMRC2 cells exhibit similar enrichment of M4 fumarate, M4 malate, and M4 asparate (but not citrate) showing that VHL-deficient cells upregulate reductive carboxylation without compromising oxidative metabolism from glutamine. Next, we tested whether HIF inactivation by pVHL is necessary to regulate the reductive utilization of glutamine for lipogenesis. To this end, we traced the relative incorporation of [U-13C6]glucose or [5-13C1]glutamine into palmitate. Labeled carbon derived from [5-13C1]glutamine can be incorporated into fatty acids exclusively through RC, and the labeled carbon cannot be transferred to palmitate through the oxidative TCA cycle (Figure 1B, red carbons). Tracer incorporation from [5-13C1]glutamine occurs in the one carbon (C1) of acetyl-CoA, which results in labeling of palmitate at M1, M2, M3, M4, M5, M6, M7, and M8 mass isotopomers. In contrast, lipogenic acetyl-CoA molecules originating from [U-13C6]glucose are fully labeled, and the labeled palmitate is represented by M2, M4, M6, M8, M10, M12, M14, and M16 mass isotopomers. VHL-deficient control cells and cells expressing pVHL type 2B mutants exhibited high palmitate labeling from the [5-13C1]glutamine; conversely, reintroduction of wild-type or type 2C pVHL mutant (L188V) resulted in high labeling from [U-13C6]glucose (Figures 2A and 2B, box inserts highlight the heavier mass isotopomers).

hif-inactivation-is-necessary-for-downregulation-of-reductive-carboxylation-by-pvhl

hif-inactivation-is-necessary-for-downregulation-of-reductive-carboxylation-by-pvhl

Figure 2.  HIF Inactivation Is Necessary for Downregulation of Reductive Lipogenesis by pVHL

Next, to determine the specific contribution from glucose oxidation or glutamine reduction to lipogenic acetyl-CoA, we performed isotopomer spectral analysis (ISA) of palmitate labeling patterns. ISA indicates that wild-type pVHL or pVHL L188V mutant-reconstituted UMRC2 cells relied mainly on glucose oxidation to produce lipogenic acetyl-CoA, while UMRC2 cells reconstituted with a pVHL mutant defective in HIF inactivation (Y112N or Y98N) primarily employed RC. Upon disruption of the pVHL-HIF interaction, glutamine becomes the preferred substrate for lipogenesis, supplying 70%–80% of the lipogenic acetyl-CoA (Figure 2C). This is not a cell-line-specific phenomenon, but it applies to VHL-deficient human RCC cells in general; the same changes are observed in 786-O cells reconstituted with wild-type pVHL or mutant pVHL or infected with vector only as control (Figure S2). Type 2A pVHL mutants (Y112H, which retain partial HIF binding) confer an intermediate reductive phenotype between wild-type VHL (which inactivates HIF) and type 2B pVHL mutants (which are totally defective in HIF regulation) as seen in Figures 1 and ​and 2.2. Taken together, these data demonstrate that the ability of pVHL to regulate reductive carboxylation and lipogenesis from glutamine tracks genetically with its ability to bind and degrade HIF, at least in RCC cells.

HIF Is Sufficient to Induce RC from Glutamine in RCC Cells

To test the hypothesis that HIF-2α is sufficient to promote RC from glutamine, we expressed a pVHL-insensitive HIF-2α mutant (HIF-2α P405A/P531A, marked as HIF-2α P-A) in VHL-reconstituted 786-O cells (Figure 3). HIF-2α P-A is constitutively expressed in this polyclonal cell population, despite the reintroduction of wild-type VHL, reflecting a pseudohypoxia condition (Figure 3A). We confirmed that this mutant is transcriptionally active by assaying for the expression of its targets genes GLUT1, LDHA, HK1, EGLN, HIG2, and VEGF (Figures 3B and S3A). As shown in Figure 3C, reintroduction of wild-type VHLinto 786-O cells suppressed RC, whereas the expression of the constitutively active HIF-2α mutant was sufficient to stimulate this reaction, restoring the M1 enrichment of TCA cycle metabolites observed in VHL-deficient 786-O cells. Expression of HIF-2α P-A also led to a concomitant decrease in glucose oxidation, corroborating the metabolic alterations observed in glutamine metabolism (Figures 3D and 3E). Additional evidence of the HIF2α-regulation on the reductive phenotype was obtained with [U-13C5]glutamine, which generates M5 citrate, M3 fumarate, M3 malate, and M3 aspartate through RC (Figure 3F).

Our current work showed that HIF-2α is sufficient to induce the reductive program in RCC cells that express only the HIF-2α paralog, while mouse NEK cells appeared to use HIF-1α preferentially to promote RC. Together with the evidence that HIF-1α and HIF-2α may have opposite roles in tumor growth, it is possible that the cellular context dictates which paralog activates RC. It is also possible that HIF-2α adopts the RC regulatory function of HIF-1α upon deletion of the latter in RCC cells. Further studies are warranted in understanding the relative role of HIF-α paralogs in regulating RC in different cell types.

Finally, the selective sensitivity to glutaminase inhibitors exhibited by VHL-deficient cells, together with the observed RC activity in vivo, strongly suggests that reductive glutamine metabolism may fuel tumor growth. Investigating whether the reductive flux correlates with tumor hypoxia and/or contributes to the actual cell survival under low oxygen conditions is warranted. Together, our findings underscore the biological significance of reductive carboxylation in VHL-deficient RCC cells. Targeting this metabolic signature of HIF may open viable therapeutic opportunities for the treatment of hypoxic and VHL-deficient tumors.

Elevated levels of 14-3-3 proteins, serotonin, gamma enolase and pyruvate kinase identified in clinical samples from patients diagnosed with colorectal cancer
Dowling P, Hughes DJ, Larkin AM, Meiller J, …, Clynes M
Clin Chim Acta. 2015 Feb 20;441:133-41.
http://dx.doi.org:/10.1016/j.cca.2014.12.005.

Highlights

  • Identification of a number of significant proteins and metabolites in CRC patients
  • 14-3-3 proteins, serotonin, gamma enolase and pyruvate kinase all significant
  • Intense staining for 14-3-3 epsilon in tissue specimens from CRC patients
  • Tissue 14-3-3 epsilon levels concordant with abundance in the circulation
  • Biomolecules provide insight into the biology associated with tumor development

Background: Colorectal cancer (CRC), a heterogeneous disease that is common in both men and women, continues to be one of the predominant cancers worldwide. Lifestyle, diet, environmental factors and gene defects all contribute towards CRC development risk. Therefore, the identification of novel biomarkers to aid in the management of CRC is crucial. The aim of the present study was to identify candidate biomarkers for CRC, and to develop a better understanding of their role in tumorogenesis. Methods: In this study, both plasma and tissue samples from patients diagnosed with CRC, together with non-malignant and normal controls were examined using mass spectrometry based proteomics and metabolomics approaches.
Results: It was established that the level of several biomolecules, including serotonin, gamma enolase, pyruvate kinase and members of the 14-3-3 family of proteins, showed statistically significant changes when comparing malignant versus non-malignant patient samples, with a distinct pattern emerging mirroring cancer cell energy production. Conclusion: The diagnosis and management of CRC could be enhanced by the discovery and validation of new candidate biomarkers, as found in this study, aimed at facilitating early detection and/or patient stratification together with providing information on the complex behavior of cancer cells.

Table 2 – List of proteins found to show statistically significant differences between control (n=10) and CRC (n=16; 8 stage III/8 stage IV) patient plasma samples fractionated using Proteominer beads. Information provided in the table includes accession number, discovery platform used, protein description, the number of unique peptides for quantitation, a mascot score for protein identification (confidence number), ANOVA p-values(≥0.05), fold change in protein abundance (≥2-fold) and highest/lowest mean change.

Table 3 – List of metabolites found to show statistically significant differences between control (n=8) and CRC (n=16; 8 stage III/8 stage IV) patient plasma samples. Included in the table is the Human Metabolome Database (HMDB) entry, platform used to analyse the biochemicals, biochemical name, ANOVA p-values (≥0.05), fold-change and highest/lowest mean change.

Fig.1. Box and whisker plots for: (A) M2-PK, (B) gamma enolase, (C) 14-3-3 (pan) and (D) serotonin. ELISA analysisofM2-PK, gamma enolase, serotonin and 14-3-3 (pan) in plasma samples from control (n = 20), polyps (n = 10), adenoma (n = 10), stage I/II CRC (n= 20) and stage III/IV (n= 20)patients. The figures show statistically significant p-value for various comparisons between the different sample groups. This ELISA measurement for 14-3-3 detects all known isoforms of mammalian 14-3-3 proteins (β/α, γ, ε, η, ζ/δ, θ/τ and σ).

Role of lipid peroxidation derived 4-hydroxynonenal (4-HNE) in cancer- Focusing on mitochondria
Huiqin Zhonga, Huiyong Yin
Redox Biol Apr 2015; 4: 193–199

Oxidative stress-induced lipid peroxidation has been associated with human physiology and diseases including cancer. Overwhelming data suggest that reactive lipid mediators generated from this process, such as 4-hydroxynonenal (4-HNE), are biomarkers for oxidative stress and important players for mediating a number of signaling pathways. The biological effects of 4-HNE are primarily due to covalent modification of important biomolecules including proteins, DNA, and phospholipids containing amino group. In this review, we summarize recent progress on the role of 4-HNE in pathogenesis of cancer and focus on the involvement of mitochondria: generation of 4-HNE from oxidation of mitochondria-specific phospholipid cardiolipin; covalent modification of mitochondrial proteins, lipids, and DNA; potential therapeutic strategies for targeting mitochondrial ROS generation, lipid peroxidation, and 4-HNE.

Reactive oxygen species (ROS), such as superoxide anion, hydrogen peroxide, hydroxyl radicals, singlet oxygen, and lipid peroxyl radicals, are ubiquitous and considered as byproducts of aerobic life [1]. Most of these chemically reactive molecules are short-lived and react with surrounding molecules at the site of formation while some of the more stable molecules diffuse and cause damages far away from their sites of generation. Overproduction of these ROS, termed oxidative stress, may provoke oxidation of polyunsaturated fatty acids (PUFAs) in cellular membranes through free radical chain reactions and form lipid hydroperoxides as primary products [2]; some of these primary oxidation products may decompose and lead to the formation of reactive lipid electrophiles. Among these lipid peroxidation (LPO) products, 4-hydroxy-2-nonenals (4-HNE) represents one of the most bioactive and well-studied lipid alkenals [3]. 4-HNE can modulate a number of signaling processes mainly through forming covalent adducts with nucleophilic functional groups in proteins, nucleic acids, and membrane lipids. These properties have been extensively summarized in some excellent reviews [4], [5], [6], [7], [8], [9] and [10].

Conclusions

Lipid peroxidation-derived 4-HNE is a prototypical reactive lipid electrophile that readily forms covalent adducts with nucleophilic functional groups in macromolecule such as proteins, DNA, and lipids (Fig. 3). A body of work have shown that generation of 4-HNE macromolecule adducts plays important pathological roles in cancer through interactions with mitochondria. First of all, mitochondria are one of the most important cellular sites of 4-HNE production, presumably from oxidation of abundant PUFA-containing lipids, such as L4CL. Emerging evidence suggest that this process play a critical role in apoptosis. Secondly, in response to the toxicity of 4-HNE, mitochondria have developed a number of defense mechanisms to convert 4-HNE to less reactive chemical species and minimize its toxic effects. Thirdly, 4-HNE macromolecule adducts in mitochondria are involved in the cancer initiation and progression by modulating mitochondrial function and metabolic reprogramming. 4-HNE protein adducts have been widely studied but the mtDNA modification by lipid electrophiles has yet to emerge. The biological consequence of PE modification remains to be defined, especially in the context of cancer. Last but not the least, manipulation of mitochondrial ROS generation, lipid peroxidation, and production of lipid electrophiles may be a viable approach for cancer prevention and treatment.

K.J. Davies. Oxidative stress, antioxidant defenses, and damage removal, repair, and replacement systems. IUBMB Life, 50 (4–5) (2000): 279–289. http://dx.doi.org/10.1080/713803728.1132732

Shoeb, N.H. Ansari, S.K. Srivastava, K.V. Ramana. 4-hydroxynonenal in the pathogenesis and progression of human diseases. Current Medicinal Chemistry, 21 (2) (2014):230–237 http://dx.doi.org/10.2174/09298673113209990181 23848536

J.D. West, L.J. Marnett. Endogenous reactive intermediates as modulators of cell signaling and cell death. Chemical Research in Toxicology, 19 (2)(2006): 173–194 http://dx.doi.org/10.1021/tx050321u.16485894

Barrera, S. Pizzimenti,…, A. Lepore, et al. Role of 4-hydroxynonenal-protein adducts in human diseases. Antioxidants & Redox Signaling (2014) http://dx.doi.org/10.1089/ars.2014.6166 25365742

J.R. Roede, D.P. Jones. Reactive species and mitochondrial dysfunction: mechanistic significance of 4-hydroxynonenal. Environmental and Molecular Mutagenesis, 51 (5) (2010):380–390 http://dx.doi.org/10.1002/em.20553 20544880

Guéraud, M. Atalay, N. Bresgen, …, I. Jouanin, W. Siems, K. Uchida. Chemistry and biochemistry of lipid peroxidation products. Free Radical Research, 44 (10) (2010): 1098–1124 http://dx.doi.org/10.3109/10715762.2010.498477.20836659

Z.H. Chen, E. Niki. 4-hydroxynonenal (4-HNE) has been widely accepted as an inducer of oxidative stress. Is this the whole truth about it or can 4-HNE also exert protective effects? IUBMB Life, 58 (5–6) (2006): 372–373. http://dx.doi.org/10.1080/15216540600686896 16754333

Aldini, M. Carini, K.-J. Yeum, G. Vistoli. Novel molecular approaches for improving enzymatic and nonenzymatic detoxification of 4-hydroxynonenal: toward the discovery of a novel class of bioactive compounds. Free Radical Biology and Medicine, 69 (0) (2014): 145–156 http://dx.doi.org/10.1016/j.freeradbiomed.2014.01.017 24456906

Fig. 2.   Catabolism of 4-HNE in mitochondria. ROS induced lipid peroxidation in IMM and OMM (outer membrane of mitochondria) leads to 4-HNE formation. In matrix, 4-HNE conjugation with GSH produces glutathionyl-HNE (GS-HNE); this process occurs spontaneously or can be catalyzed by GSTs. 4-HNE is reduced to 1,4-dihydroxy-2-nonene (DHN) catalyzed ADH or AKRs. ALDH2 catalyzes the oxidation of 4-HNE to form 4-hydroxy-2-nonenoic acid (HNA).

Role of 4-hydroxynonenal in cancer focusing on mitochondria

Role of 4-hydroxynonenal in cancer focusing on mitochondria

http://ars.els-cdn.com/content/image/1-s2.0-S2213231714001359-gr2.jpg

Role of 4-hydroxynonenal in cancer focusing on mitochondria

http://ars.els-cdn.com/content/image/1-s2.0-S2213231714001359-gr3.jpg

Fig. 3. A schematic view of 4-HNE macromolecule adducts in cancer cell. 4-HNE macromolecule adducts are involved in cancer initiation, progression, metabolic reprogramming, and cell death. 4-HNE (depicted as a zigzag line) is produced through ROS-induced lipid peroxidation of mitochondrial and plasma membranes. Biological consequences of 4-HNE adduction:

  1. reducing membrane integrity;
  2. affecting protein function in cytosol;
  3. causing nuclear and mitochondrial DNA damage;
  4. inhibiting ETC activity;
  5. activating UCPs activity;
  6. reducing TCA activity;
  7. inhibiting ALDH2 activity.

DNA methylation paradigm shift: 15-lipoxygenase-1 upregulation in prostatic intraepithelial neoplasia and prostate cancer by atypical promoter hypermethylation.
Kelavkar UP1, Harya NS, … , Chandran U, Dhir R, O’Keefe DS.
Prostaglandins Other Lipid Mediat. 2007 Jan; 82(1-4):185-97

Fifteen (15)-lipoxygenase type 1 (15-LO-1, ALOX15), a highly regulated, tissue- and cell-type-specific lipid-peroxidating enzyme has several functions ranging from physiological membrane remodeling, pathogenesis of atherosclerosis, inflammation and carcinogenesis. Several of our findings support a possible role for 15-LO-1 in prostate cancer (PCa) tumorigenesis. In the present study, we identified a CpG island in the 15-LO-1 promoter and demonstrate that the methylation status of a specific CpG within this island region is associated with transcriptional activation or repression of the 15-LO-1 gene. High levels of 15-LO-1 expression was exclusively correlated with one of the CpG dinucleotides within the 15-LO-1 promoter in all examined PCa cell-lines expressing 15-LO-1 mRNA. We examined the methylation status of this specific CpG in microdissected high grade prostatic intraepithelial neoplasia (HGPIN), PCa, metastatic human prostate tissues, normal prostate cell lines and human donor (normal) prostates. Methylation of this CpG correlated with HGPIN, PCa and metastatic human prostate tissues, while this CpG was unmethylated in all of the normal prostate cell lines and human donor (normal) prostates that either did not display or had minimal basal 15-LO-1 expression. Immunohistochemistry for 15-LO-1 was performed in prostates from PCa patients with Gleason scores 6, 7 [(4+3) and (3+4)], >7 with metastasis, (8-10) and 5 normal (donor) individual males. Quantitative reverse transcription-polymerase chain reaction (qRT-PCR) was used to detect 15-LO-1 in PrEC, RWPE-1, BPH-1, DU-145, LAPC-4, LNCaP, MDAPCa2b and PC-3 cell lines. The specific methylated CpG dinucleotide within the CpG island of the 15-LO-1 promoter was identified by bisulfite sequencing from these cell lines. The methylation status was determined by COBRA analyses of one specific CpG dinucleotide within the 15-LO-1 promoter in these cell lines and in prostates from patients and normal individuals. Fifteen-LO-1, GSTPi and beta-actin mRNA expression in BPH-1, LNCaP and MDAPCa2b cell lines with or without 5-aza-2′-deoxycytidine (5-aza-dC) and trichostatin-A (TSA) treatment were investigated by qRT-PCR. Complete or partial methylation of 15-LO-1 promoter was observed in all PCa patients but the normal donor prostates showed significantly less or no methylation. Exposure of LNCAP and MDAPCa2b cell lines to 5-aza-dC and TSA resulted in the downregulation of 15-LO-1 gene expression. Our results demonstrate that 15-LO-1 promoter methylation is frequently present in PCa patients and identify a new role for epigenetic phenomenon in PCa wherein hypermethylation of the 15-LO-1 promoter leads to the upregulation of 15-LO-1 expression and enzyme activity contributes to PCa initiation and progression.

Transcriptional regulation of 15-lipoxygenase expression by promoter methylation.
Liu C1, Xu D, Sjöberg J, Forsell P, Björkholm M, Claesson H
Exp Cell Res. 2004 Jul 1; 297(1):61-7.

15-Lipoxygenase type 1 (15-LO), a lipid-peroxidating enzyme implicated in physiological membrane remodeling and the pathogenesis of atherosclerosis, inflammation, and carcinogenesis, is highly regulated and expressed in a tissue- and cell-type-specific fashion. It is known that interleukins (IL) 4 and 13 play important roles in transactivating the 15-LO gene. However, the fact that they only exert such effects on a few types of cells suggests additional mechanism(s) for the profile control of 15-LO expression. In the present study, we demonstrate that hyper- and hypomethylation of CpG islands in the 15-LO promoter region is intimately associated with the transcriptional repression and activation of the 15-LO gene, respectively. The 15-LO promoter was exclusively methylated in all examined cells incapable of expressing 15-LO (certain solid tumor and human lymphoma cell lines and human T lymphocytes) while unmethylated in 15-LO-competent cells (the human airway epithelial cell line A549 and human monocytes) where 15-LO expression is IL4-inducible. Inhibition of DNA methylation in L428 lymphoma cells restores IL4 inducibility to 15-LO expression. Consistent with this, the unmethylated 15-LO promoter reporter construct exhibited threefold higher activity in A549 cells compared to its methylated counterpart. Taken together, demethylation of the 15-LO promoter is a prerequisite for the gene transactivation, which contributes to tissue- and cell-type-specific regulation of 15-LO expression.

mechanism of the lipoxygenase reaction

Radical mechanism of the lipoxygenase reaction pattabhiraman

Radical mechanism of the lipoxygenase reaction pattabhiraman

http://edoc.hu-berlin.de/dissertationen/pattabhiraman-shankaranarayanan-2003-11-03/HTML/pattabhiraman_html_705b7fbd.png

Position determinants of lipoxygenase reaction pattabhiraman

Position determinants of lipoxygenase reaction pattabhiraman

http://edoc.hu-berlin.de/dissertationen/pattabhiraman-shankaranarayanan-2003-11-03/HTML/pattabhiraman_html_m3642741b.jpg

Position determinants of lipoxygenase reaction

This suggests that the space inside the active site cavity plays an important role in the positional specificity (Borngräber et al., 1999). The reverse process on 12-LOX works equally well (Suzuki et al., 1994; Watanabe and Haeggstrom, 1993). However, conversion to 5-LOX by mutagenesis has not been successful. The positional determinant residues on 15-LOX were mutated to those of 5-LOX but the enzyme was inactive (Sloane et al., 1990). 15-LOX possess the ability to oxygenate 15-HpETE to form 5, 15-diHpETE. Methylation of carboxy end of the substrate increased the activity significantly. This phenomenon was hypothesised to be due to an inverse orientation of the substrate at the active site. In this case the caroboxy end may slide into the cavity as suggested by experiments with modified [page 6↓]substrates and site directed mutagenesis (Schwarz et al., 1998; Walther et al., 2001). Thus, the determinant of positional specificity is not only the volume but also the orientation of the substrate in the active site.

The N-terminal domain of the enzyme does not play a major role in the dioxygenation reaction of 12/15 lipoxygenase. N-terminal domain truncations did not impair the lipoxygenase activity. The ability of the enzyme to bind to membranes, however, is impaired in the mutants (point and truncations) of the N-ternimal domain without significant alterations to the catalytic activity (Walther et al., 2002). Mutation to Trp 181, which is localised in the catalytic domain, also impaired membrane binding function. This suggests that the C-terminal domain is responsible for the catalytic activity and a concerted action of N-terminal and C-terminal domain was necessary for effective membrane binding.

Metabolomic studies

New paradigms for metabolic modeling of human cells

Mardinoglu A, Nielsen J
Curr Opin Biotechnol. 2015 Jan 2; 34C:91-97.
http://dx.doi.org:/10.1016/j.copbio.2014

integration of genetic and biochemical knowledge

integration of genetic and biochemical knowledge

http://ars.els-cdn.com/content/image/1-s2.0-S0958166914002286-fx1.jpg

Highlights

  • We presented the timeline of generation and evaluation of global reconstructions of human metabolism.
  • We reviewed the generation of the context specific GEMs through the use of human generic GEMs.
  • We discussed the generation of multi-tissue GEMs in the context of whole-body metabolism.
  • We finally discussed the integration of GEMs with other biological networks.

Abnormalities in cellular functions are associated with the progression of human diseases, often resulting in metabolic reprogramming. GEnome-scale metabolic Models (GEMs) have enabled studying global metabolic reprogramming in connection with disease development in a systematic manner. Here we review recent work on reconstruction of GEMs for human cell/tissue types and cancer, and the use of GEMs for identification of metabolic changes occurring in response to disease development. We further discuss how GEMs can be used for the development of efficient therapeutic strategies. Finally, challenges in integration of cell/tissue models for simulation of whole body functions as well as integration of GEMs with other biological networks for generating complete cell/tissue models are presented.

http://ars.els-cdn.com/content/image/1-s2.0-S0958166914002286-gr2.sml

Inter- and intra-tumor profiling of multi-regional colon cancer and metastasis
Kogita A, Yoshioka Y, …, Nakai T, Okuno K, Nishio K
Biochem Biophys Res Commun. 2015 Feb 27; 458(1):52-6.
http://dx.doi.org:/10.1016/j.bbrc.2015.01.064

Highlights

  • Mutation profiling of tumors of multi-regional colon cancers using targeted sequencing.
  • Formalin-fixed paraffin embedded samples were available for next-generation sequencing.
  • Different clones existed in primary tumors and metastatic tumors.
  • Muti-clonalities between intra- and inter-tumors.

Intra- and inter-tumor heterogeneity may hinder personalized molecular-target treatment that depends on the somatic mutation profiles. We performed mutation profiling of formalin-fixed paraffin embedded tumors of multi-regional colon cancer and characterized the consequences of intra- and inter-tumor heterogeneity and metastasis using targeted re-sequencing. We performed targeted re-sequencing on multiple spatially separated samples obtained from multi-regional primary colon carcinoma and associated metastatic sites in two patients using next-generation sequencing. In Patient 1 with four primary tumors (P1-1, P1-2, P1-3, and P1-4) and one liver metastasis (H1), mutually exclusive pattern of mutations was observed in four primary tumors. Mutations in primary tumors were identified in three regions; KARS (G13D) and APC (R876*) in P1-2, TP53 (A161S) in P1-3, and KRAS (G12D), PIK3CA (Q546R), and ERBB4 (T272A) in P1-4. Similar combinatorial mutations were observed between P1-4 and H1. The ERBB4 (T272A) mutation observed in P1-4, however, disappeared in H1. In Patient 2 with two primary tumors (P2-1 and P2-2) and one liver metastasis (H2), mutually exclusive pattern of mutations were observed in two primary tumors. We identified mutations; KRAS (G12V), SMAD4 (N129K, R445*, and G508D), TP53 (R175H), and FGFR3 (R805W) in P2-1, and NRAS (Q61K) and FBXW7 (R425C) in P2-2. Similar combinatorial mutations were observed between P2-1 and H2. The SMAD4 (N129K and G508D) mutations observed in P2-1, however, were nor detected in H2. These results suggested that different clones existed in primary tumors and metastatic tumor in Patient 1 and 2 likely originated from P1-4 and P2-1, respectively. In conclusion, we detected the muti-clonalities between intra- and inter-tumors based on mutational profiling in multi-regional colon cancer using next-generation sequencing. Primary region from which metastasis originated could be speculated by mutation profile. Characterization of inter- and inter-tumor heterogeneity can lead to underestimation of the tumor genomics landscape and treatment strategy of personal medicine.

Fig.1. Treatment timelines for the two patients. A) Patient 1 (a 55-year-old man) had multifocal sigmoid colon cancers, and all of which were surgically resected in their entirety (P1-1, P1-2, P1-3, and P1-4). The patient received adjuvant chemotherapy (8 courses of XELOX). Eight months later, a single liver metastasis (H1) was detected, and the patients received neoadjuvant treatment of XELOX plus bevacizumab. Thereafter, he received a partial hepatectomy. B) Patient 2 (an 84-year-old woman) had cecal and sigmoid colon cancers (P2-1 and P2-2, respectively) with a single liver metastasis (H2). She received a subtotal colectomy and subsegmental hepatectomy.

Fig. 2. Schematic representation of intra-tumor heterogeneity in two patients. A) In patient 1, primary tumor (P1-4) contains two or more subclones. The clone without the ERBB4 (T272A) mutation created the liver metastasis. B) In patient 2, primary tumor (P2-1) contains two or more subclones. The clone without the SMAD4 (N129K and G508D) mutation created the liver metastasis.

Loss of Raf-1 Kinase Inhibitor Protein Expression Is Associated With Tumor Progression and Metastasis in Colorectal Cancer

Parham Minoo, Inti Zlobec, Kristi Baker, Luigi Tornillo, Luigi Terracciano, Jeremy R. Jass, and Alessandro Lugli
American Journal of Clinical Pathology, 127, 820-827
http://dx.doi.org:/10.1309/5D7MM22DAVGDT1R8(2007)

Raf-1 kinase inhibitor protein (RKIP) is known as a critical down-regulator of the mitogen-activated protein kinase signaling pathway and a potential molecular determinant of malignant metastasis. The aim of this study was to determine the prognostic significance of RKIP expression in colorectal cancer (CRC). Immunohistochemical staining for RKIP was performed on a tissue microarray comprising 1,197 mismatch repair (MMR)-proficient and 141 MMR-deficient CRCs. The association of RKIP with clinicopathologic features was analyzed. Loss of cytoplasmic RKIP was associated with distant metastasis (P = .038), higher N stage (P = .032), vascular invasion (P = .01), and worse survival (P = .001) in the MMR-proficient group. In MMR-deficient CRCs, loss of cytoplasmic RKIP was associated with distant metastasis (P = .043) and independently predicted worse survival (P = .004). Methylation analysis of 28 cases showed that loss of RKIP expression is unlikely to be due to promoter methylation.

Raf-1 kinase inhibitor protein (RKIP) is a ubiquitously expressed and highly conserved protein that belongs to the phosphatidylethanolamine-binding protein family.1,2 RKIP is present in the cytoplasm and at the cell membrane3 and appears to have multiple biologic functions that implicate spermatogenesis, neural development, cardiac function, and membrane biogenesis.4-6 RKIP has also been shown to have a role in the regulation of multiple signaling pathways. Originally, RKIP was identified as a phospholipid-binding protein and, subsequently, as an interacting partner of Raf-1 kinase that blocks mitogen-activated protein kinase (MAPK) initiated by Raf-1.7 Initial studies showed that RKIP achieves this role by competitive interference with the binding of MEK to Raf-1.8 Recently, RKIP was shown to inhibit activation of Raf-1 by blocking phosphorylation of Raf-1 by p21-activated kinase and Src family kinases.9 It has also been suggested that RKIP could be involved in regulation of apoptosis by modulating the NF-κB pathway10 and in regulation of the spindle checkpoint via Aurora B.11 RKIP has also been implicated in tumor biology. In breast and prostate cancers, ectopic expression of RKIP sensitized cells to chemotherapeutic-induced apoptosis, and reduced expression of RKIP led to resistance to chemotherapy.12 A link between RKIP and cancer was first established in prostate cancer, with RKIP showing reduced expression in prostate cancer cells and the lowest expression levels in metastatic cells, suggesting that RKIP expression is inversely associated with the invasiveness of prostate cancer.13 Restoration of RKIP expression in metastatic prostate cancer cells inhibited invasiveness of the cells in vitro and in vivo in spontaneous lung metastasis but not the growth of the primary tumor in a murine model.13

Clinicopathologic Parameters The clinicopathologic data for 1,420 patients included T stage (T1, T2, T3, and T4), N stage (N0, N1, and N2), tumor grade (G1, G2, and G3), vascular invasion (presence or absence), and survival. The distribution of these features has been described previously.18-20 For 478 patients, information on local recurrence and distant metastasis was also available.

Methylation of RKIP Methylation of RKIP promoter was examined by methylation-specific polymerase chain reaction (PCR) using an AmpliTaq Gold kit (Roche, Branchburg, NJ) as described previously.25 The primers for amplification of the unmethylated sequence were 5′-TTTAGTGATATTTTTTGAGATATGA-3′ and 3′-CACTCCCTAACCTCTAATTAACCAA-5′ and for the methylated reaction were 5′-TTTAGCGATATTTTTTGAGATACGA-3′ and 3′-GCTCCCTAACCTCTAATTAACCG- 5′. The conditions for amplification were 10 minutes at 95°C followed by 39 cycles of denaturing at 95°C for 30 seconds, annealing at 52°C for 30 seconds, and 30 seconds of extension at 72°C. The PCR products were subjected to electrophoresis on 8% acrylamide gels and visualized by SYBR gold nucleic acid gel stain (Molecular Probes, Eugene, OR). CpGenome Universal Methylated DNA (Chemicon, Temecula, CA) was used as a positive control sample for methylation. Randomization of MMR-Proficient CRCs The 1,197 MMR-proficient CRCs were randomly assigned into 2 groups consisting of 599 (group 1) and 598 (group 2) cases and matched for sex, tumor location, T stage, N stage, tumor grade, vascular invasion, and survival ❚Table 1❚. Immunohistochemical cutoff scores for RKIP expression were determined for group 1, and the association of RKIP expression and T stage, N stage, tumor grade, vascular invasion, local recurrence, distant metastasis, and 10-year survival were studied in group 2.

❚Table 1❚ Characteristics of the Randomized Mismatch Repair–Proficient Subgroups of Colorectal Cancer Cases*

Variable p
Group Gp 1 (n=599) Gp 2 (n=598) 0.235
Sex M F M F
288 (48.3) 308

(51.7)

287

(48.2)

308

(51.8)

0.82
Tumor location Right-sided 417 (70.6) 417 (71.2) Left-sided 174 (29.4) 169 (28.8)
T1 T2 T3 T4
T stage 25 (4.3) 35 (6.0) 92(15.8) 97(16.7) 375(64.2)
365(62.8)
92(15.8)
84(14.5)
0.514
N stage N0 N1 N2
289(50.7) 154(27.0) 154(26.9) 127(22.3) 120(21.0) 0.847
Tumor grade G1 G2 G3
14 (2.4) 13 (2.2) 503(86.7) 507(86.7) 63 (10.9) 65 (11.1) 0.969
Vascular invasion Presence 412 (70.9) 422 (72.1) Absence 169 (29.1) 163 (27.9) 0.643
Median survival, mo 68.0 (57.0-91.0) 76.0 (62.0-88.0) 0.59

(95% confidence interval) * Data are given as number (percentage) unless otherwise indicated.
Data were not available for all cases; percentages are based on the number of cases available for the variable, not the total number of cases in the group. Cases were assigned into groups matched for all variables listed. †
The χ2 test was used for sex, tumor location, T stage, N stage, tumor grade, and vascular invasion and log-rank test for survival analysis. P > .05 indicates that there is no difference between groups 1 and 2.
Breast and prostate cancer: more similar than different

Gail P. Risbridger1, Ian D. Davis2, Stephen N. Birrell3 & Wayne D. Tilley3
Nature Reviews Cancer 10, 205-212 (March 2010)
http://dx.doi.org:/10.1038/nrc2795

Breast cancer and prostate cancer are the two most common invasive cancers in women and men, respectively. Although these cancers arise in organs that are different in terms of anatomy and physiological function both organs require gonadal steroids for their development, and tumours that arise from them are typically hormone-dependent and have remarkable underlying biological similarities. Many of the recent advances in understanding the pathophysiology of breast and prostate cancers have paved the way for new treatment strategies. In this Opinion article we discuss some key issues common to breast and prostate cancer and how new insights into these cancers could improve patient outcomes.

Emerging field of metabolomics. Big promise for cancer biomarker identification and drug discovery
Patel S, Ahmed S.
J Pharm Biomed Anal. 2015 Mar 25; 107C:63-74.
http://DX.doi.ORG:/10.1016/j.jpba.2014.12.020

Highlights

  • Mass spectrometry, nuclear magnetic resonance and chemometrics have enabled cancer biomarker discovery.
  • Metabolomics can non-invasively identify biomarkers for diagnosis, prognosis and treatment of cancer.
  • All major types of cancers and their biomarkers discovered by metabolomics have been discussed.
  • This review sheds light on the pitfalls and potentials of metabolomics with respect to oncology.

Most cancers are lethal and metabolic alterations are considered a hallmark of this deadly disease. Genomics and proteomics have contributed vastly to understand cancer biology. Still there are missing links as downstream to them molecular divergence occurs. Metabolomics, the omic science that furnishes a dynamic portrait of metabolic profile is expected to bridge these gaps and boost cancer research. Metabolites being the end products are more stable than mRNAs or proteins. Previous studies have shown the efficacy of metabolomics in identifying biomarkers associated with diagnosis, prognosis and treatment of cancer. Metabolites are highly informative about the functional status of the biological system, owing to their proximity to organismal phenotypes. Scores of publications have reported about high-throughput data generation by cutting-edge analytic platforms (mass spectrometry and nuclear magnetic resonance). Further sophisticated statistical softwares (chemometrics) have enabled meaningful information extraction from the metabolomic data. Metabolomics studies have demonstrated the perturbation in glycolysis, tricarboxylic acid cycle, choline and fatty acid metabolism as traits of cancer cells. This review discusses the latest progress in this field, the future trends and the deficiencies to be surmounted for optimally implementation in oncology. The authors scoured through the most recent, high-impact papers archived in Pubmed, ScienceDirect, Wiley and Springer databases to compile this review to pique the interest of researchers towards cancer metabolomics.

Table.  Novel Cancer Markers Identified by Metabolomics

Quantitative analysis of acetyl-CoA production in hypoxic cancer cells reveals substantial contribution from acetate
Jurre J Kamphorst, Michelle K Chung, Jing Fan and Joshua D Rabinowitz
Cancer & Metabolism 2014, 2:23
http://dx.doi.org:/10.1186/2049-3002-2-23

Background: Cell growth requires fatty acids for membrane synthesis. Fatty acids are assembled from 2-carbon units in the form of acetyl-CoA (AcCoA). In nutrient and oxygen replete conditions, acetyl-CoA is predominantly derived from glucose. In hypoxia, however, flux from glucose to acetyl-CoA decreases, and the fractional contribution of glutamine to acetyl-CoA increases. The significance of other acetyl-CoA sources, however, has not been rigorously evaluated. Here we investigate quantitatively, using 13C-tracers and mass spectrometry, the sources of acetyl-CoA in hypoxia. Results: In normoxic conditions, cultured cells produced more than 90% of acetyl-CoA from glucose and glutamine-derived carbon. In hypoxic cells, this contribution dropped, ranging across cell lines from 50% to 80%. Thus, under hypoxia, one or more additional substrates significantly contribute to acetyl-CoA production. 13C-tracer experiments revealed that neither amino acids nor fatty acids are the primary source of this acetyl-CoA. Instead, the main additional source is acetate. A large contribution from acetate occurs despite it being present in the medium at a low concentration (50–500 μM). Conclusions: Acetate is an important source of acetyl-CoA in hypoxia. Inhibition of acetate metabolism may impair tumor growth.

Cancer cells have genetic mutations that drive proliferation. Such proliferation creates a continuous demand for structural components to produce daughter cells [1–3]. This includes demand for fatty acids for lipid membranes. Cancer cells can obtain fatty acids both through uptake from extracellular sources and through de novo synthesis, with the latter as a major route by which non-essential fatty acids are acquired in many cancer types [4,5].

The first fatty acid to be produced by de novo fatty acid synthesis is palmitate. The enzyme fatty acid synthase (FAS) makes palmitate by catalyzing the ligation and reduction of 8-acetyl (2-carbon) units donated by cytosolic acetyl-CoA. This 16-carbon fatty acid palmitate is then incorporated into structural lipids or subjected to additional elongation (again using acetyl-CoA) and desaturation reactions to produce the diversity of fatty acids required by the cell.

Acetyl-CoA sits at the interface between central carbon and fatty acid metabolism. In well-oxygenated conditions with abundant nutrients, its 2-carbon acetyl unit is largely produced from glucose. First, pyruvate dehydrogenase produces acetyl-CoA from glucose-derived pyruvate in the mitochondrion, followed by ligation of the acetyl group to oxaloacetate to produce citrate. Citrate is then transported into the cytosol and cytosolic acetyl-CoA produced by ATP citrate lyase.

In hypoxia, flux from glucose to acetyl-CoA is impaired. Low oxygen leads to the stabilization of the HIF1 complex, blocking pyruvate dehydrogenase (PDH) activity via activation of HIF1-responsive pyruvate dehydrogenase kinase 1 (PDK1) [6,7]. As a result, the glucose-derived carbon is shunted towards lactate rather than being used for generating acetyl-CoA, affecting carbon availability for fatty acid synthesis.

To understand how proliferating cells rearrange metabolism to maintain fatty acid synthesis under hypoxia, multiple studies focused on the role of glutamine as an alternative carbon donor[8–10]. The observation that citrate M+5 labeling from U-13C-glutamine increased in hypoxia led to the hypothesis that reductive carboxylation of glutamine-derived α-ketoglutarate enables hypoxic cells to maintain citrate and acetyl-CoA production. As was noted later, though, dropping citrate levels in hypoxic cells make the α-ketoglutarate to citrate conversion more reversible and an alternative explanation of the extensive citrate and fatty acid labeling from glutamine in hypoxia is isotope exchange without a net reductive flux [11]. Instead, we and others found that hypoxic cells can at least in part bypass the need for acetyl-CoA for fatty acid synthesis by scavenging serum fatty acids [12,13].

In addition to increased serum fatty acid scavenging, we observed a large fraction of fatty acid carbon (20%–50% depending on the cell line) in hypoxic cells not coming from either glucose or glutamine. Here, we used 13C-tracers and mass spectrometry to quantify the contribution from various carbon sources to acetyl-CoA and hence identify this unknown source. We found only a minor contribution of non-glutamine amino acids and of fatty acids to acetyl-CoA in hypoxia. Instead, acetate is the major previously unaccounted for carbon donor. Thus, acetate assimilation is a route by which hypoxic cells can maintain lipogenesis and thus proliferation.

Figure 1. Percentage 13C-labeling of cytosolic acetyl-CoA can be quantified from palmitate labeling. (A) Increasing 13C2-acetyl-CoA labeling shifts palmitate labeling pattern to the right. 13C2-acetyl-CoA labeling can be quantified by determining a best fit between observed palmitate labeling and computed binomial distributions (shown on right-hand side) from varying fractions of acetyl-CoA (AcCoA) labeling. (B) Steady-state palmitate labeling from U-13C-glucose and U-13C-glutamine in MDA-MB-468 cells. (C) Percentage acetyl-CoA production from glucose and glutamine. For (B) and (C), data are means ± SD of n = 3.

Fraction palmitate M + x = (16/x)(p)x (1−p)(16−x)

We applied this approach to MDA-MB-468 cells grown in medium containing U-13C-glucose and U-13C-glutamine. The resulting steady-state palmitate labeling patterns showed multiple heavily 13C-labeled forms as well as a remaining unlabeled M0 peak (Figure 1B). The M0-labeled form results from scavenging of unlabeled serum fatty acids and can be disregarded for the purpose of determining AcCoA labeling. From the remaining labeling distribution, we calculated 87% AcCoA labeling from glucose and 6% from glutamine, with 93% collectively accounted for by these two major carbon sources (Additional file 1: Figure S1). Similar results were also obtained for HeLa and A549 cells (Figure 1C)

Figure 2. Acetyl-CoA labeling from 13C-glucose and 13C-glutamine decreases in hypoxia. (A) Steady-state palmitate labeling from U-13C-glucose and U-13C-glutamine in normoxic and hypoxic (1% O2) conditions. (B) Percentage acetyl-CoA production from glucose and glutamine in hypoxia. (C) One or more additional carbon donors contribute substantially to acetyl-CoA production in hypoxia. Abbreviations: Gluc, glucose; Gln, glutamine. Data are means ± SD of n = 3.

Figure 3.  Amino acids (other than glutamine) and fatty acids are not major sources of cytosolic acetyl-CoA in hypoxia. (A) Palmitate labeling in hypoxic (1% O2) MDA-MB-468 cells, grown for 48 h in medium where branched chain amino acids plus lysine and threonine were substituted with their respective U-13C-labeled forms. (B) Same conditions, except that glucose and glutamine only or glucose and all amino acids, were substituted with the U-13C-labeled forms. (C) Palmitate labeling in hypoxic (1% O2) MDA-MB-468 cells, grown in medium supplemented with 20 μM U-13C-palmitate for 48 h. Data are means ± SD of n = 3.

Acetate is the main additional AcCoA carbon source in hypoxia

We next investigated if hypoxic cells could activate acetate to AcCoA. Although we used dialyzed serum in our experiments and acetate is not a component of DMEM, we contemplated the possibility that trace levels could still be present or that acetate is produced as a catabolic intermediate from other sources (for example from protein de-acetylation). We cultured MDA-MB-468 cells in 1% O2 in DMEM containing U-13C-glucose and U-13C-glutamine and added increasing amounts of U-13C-acetate (Figure 4A). AcCoA labeling rose considerably with increasing U-13C-acetate concentrations, from approximately 50% to 86% with 500 μM U-13C-acetate. No significant increase in labeling of AcCoA was observed in normoxic cells following incubation with U-13C-acetate. Thus, acetate selectively contributes to AcCoA in hypoxia.

Figure 4.  The main additional AcCoA source in hypoxia is acetate. (A) Percentage 13C2-acetyl-CoA labeling quantified from palmitate labeling in hypoxic (1% O2) and normoxic MDA-MB-468 cells grown in medium with U-13C-glucose and U-13C-glutamine and additionally supplemented with indicated concentrations of U-13C-acetate. (B) Acetate concentrations in fresh 10% DFBS, DMEM, and DMEM with 10% DFBS. (C) Percentage 13C2-acetyl-CoA labeling for hypoxic (1% O2) HeLa and A549 cells. For (A) and (C), data are means ± SD of n ≥ 2. For (B), data are means ± SEM of n = 3.

Tumors require a constant supply of fatty acids to sustain cellular replication. It is thought that most cancers derive a considerable fraction of the non-essential fatty acids through de novo synthesis. This requires AcCoA with its 2-carbon acetyl group acting as the carbon donor. In nutrient replete and well-oxygenated conditions, AcCoA is predominantly made from glucose. However, tumor cells often experience hypoxia, causing limited entry of glucose-carbon into the TCA cycle. This in turn affects AcCoA production, and it has been proposed that hypoxic cells can compensate by increasing AcCoA production from glutamine-derived carbon in a pathway involving reductive carboxylation of α-ketoglutarate [8–10].

Irrespective of the precise net contribution of acetate in hypoxia, a remarkable aspect is that a significant contribution occurs based only on contaminating acetate (~300 μM) in the culturing medium. This is considerably less than glucose (25 mM) or glutamine (4 mM). Acetate concentrations in the plasma of human subjects have been reported in the range of 50 to 650 μM [22–25], and therefore, significant acetate conversion to AcCoA may occur in human tumors. This is supported by clinical observations that 11C-acetate PET can be used to image tumors, in particular those where conventional FDG-PET typically fails [26]. Our results indicate that 11C-acetate PET could be particularly important in notoriously hypoxic tumors, such as pancreatic cancer. Preliminary results provide evidence in this direction [27].

Finally, as our measurements of fatty acid labeling reflect specifically cytosolic AcCoA, it is likely that the cytosolic acetyl-CoA synthetase ACSS2 plays an important role in the observed acetate assimilation. Accordingly, inhibition of ACSS2 merits investigation as a potential therapeutic approach.

In hypoxic cultured cancer cells, one-quarter to one-half of cytosolic acetyl-CoA is not derived from glucose, glutamine, or other amino acids. A major additional acetyl-CoA source is acetate. Low concentrations of acetate (e.g., 50–650 μM) are found in the human plasma and also occur as contaminants in typical tissue culture media. These amounts are avidly incorporated into cellular acetyl-CoA selectively in hypoxia. Thus, 11C-acetate PET imaging may be useful for probing hypoxic tumors or tumor regions. Moreover, inhibiting acetate assimilation by targeting acetyl-CoA synthetases (e.g., ACSS2) may impair tumor growth.

Differential metabolomic analysis of the potential antiproliferative mechanism of olive leaf extract on the JIMT-1 breast cancer cell line
Barrajón-Catalán E, Taamalli A, Quirantes-Piné R, …, Micol V, Zarrouk M
J Pharm Biomed Anal. 2015 Feb; 105:156-62.
http://dx.doi.org:/10.1016/j.jpba.2014.11.048

A new differential metabolomic approach has been developed to identify the phenolic cellular metabolites derived from breast cancer cells treated with a supercritical fluid extracted (SFE) olive leaf extract. The SFE extract was previously shown to have significant antiproliferative activity relative to several other olive leaf extracts examined in the same model. Upon SFE extract incubation of JIMT-1 human breast cancer cells, major metabolites were identified by using HPLC coupled to electrospray ionization quadrupole-time-of-flight mass spectrometry (ESI-Q-TOF-MS). After treatment, diosmetin was the most abundant intracellular metabolite, and it was accompanied by minor quantities of apigenin and luteolin. To identify the putative antiproliferative mechanism, the major metabolites and the complete extract were assayed for cell cycle, MAPK and PI3K proliferation pathways modulation. Incubation with only luteolin showed a significant effect in cell survival. Luteolin induced apoptosis, whereas the whole olive leaf extract incubation led to a significant cell cycle arrest at the G1 phase. The antiproliferative activity of both pure luteolin and olive leaf extract was mediated by the inactivation of the MAPK-proliferation pathway at the extracellular signal-related kinase (ERK1/2). However, the flavone concentration of the olive leaf extract did not fully explain the strong antiproliferative activity of the extract. Therefore, the effects of other compounds in the extract, probably at the membrane level, must be considered. The potential synergistic effects of the extract also deserve further attention. Our differential metabolomics approach identified the putative intracellular metabolites from a botanical extract that have antiproliferative effects, and this metabolomics approach can be expanded to other herbal extracts or pharmacological complex mixtures.

Pancreatic cancer early detection. Expanding higher-risk group with clinical and metabolomics parameters
Shiro Urayama
World J Gastroenterol. 2015 Feb 14; 21(6): 1707–1717.
http://dx.doi.org:/10.3748/wjg.v21.i6.1707

Pancreatic ductal adenocarcinoma (PDAC) is the fourth and fifth leading cause of cancer death for each gender in developed countries. With lack of effective treatment and screening scheme available for the general population, the mortality rate is expected to increase over the next several decades in contrast to the other major malignancies such as lung, breast, prostate and colorectal cancers. Endoscopic ultrasound, with its highest level of detection capacity of smaller pancreatic lesions, is the commonly employed and preferred clinical imaging-based PDAC detection method. Various molecular biomarkers have been investigated for characterization of the disease, but none are shown to be useful or validated for clinical utilization for early detection. As seen from studies of a small subset of familial or genetically high-risk PDAC groups, the higher yield and utility of imaging-based screening methods are demonstrated for these groups. Multiple recent studies on the unique cancer metabolism including PDAC, demonstrate the potential for utility of the metabolites as the discriminant markers for this disease. In order to generate an early PDAC detection screening strategy available for a wider population, we propose to expand the population of higher risk PDAC group with combination clinical and metabolomics parameters.

Core tip: This is a summary of current pancreatic cancer cohort early detection studies and a potential approach being considered for future application. This is an area that requires heightened efforts as lack of effective treatment and screening scheme for wider population is leading this particular disease to be the second lethal cancer by 2030.

Currently, pancreatic ductal adenocarcinoma (PDAC) is the fourth major cause of cancer mortality in the United States[1]. It is predicted that 46420 new cases and 39590 deaths would result from pancreatic cancer in the United States in 2014[2]. Worldwide, there were 277668 new cases and 266029 deaths from this cancer in 2008[3]. In comparison to other major malignancies such as breast, colon, lung and prostate cancers with their respective 89%, 64%, 16%, 99% 5-year survival rate, PDAC at 6% is conspicuously low[2]. For PDAC, the only curative option is surgical resection, which is applicable in only 10%-15% of patients due to the common discovery of late stage at diagnosis[4]. In fact, PDAC is notorious for late stage discovery as evidenced by the low percentage of localized disease at diagnosis, compared to other malignancies: breast (61%), colon (40%), lung (16%), ovarian (19%), prostate (91%), and pancreatic cancer (7%) [5]. With the existing effective screening methods, the decreasing trends of cancer death rate are seen in major malignancies such as breast, prostate and colorectal cancer. In contrast, it is estimated that PDAC is expected to be surfacing as the second leading cause of cancer death by 2030[6].

With the distinct contribution of late-stage discovery and general lack of effective medical therapy, a critical approach in reversing the poor outcome of pancreatic cancer is to develop an early detection scheme for the tumor. In support of this, we see the trend that despite the poor prognosis of the disease, for those who have undergone curative resection with negative margins, the 5-year survival rate is 22% in contrast to 2% for the advanced-stage with distant metastasis[7,8]. An earlier diagnosis with tumor less than 2 cm (T1) is associated with a better 5-year survival of 58% compared to 17% for stage IIB PDAC[9]. Ariyama et al. [10] reported complete survival of 79 patients with less than 1 cm tumors after surgical resection. Furthermore, as a recent report indicates, the estimated time from the transformation to pre-metastatic growths of pancreatic cancer is approximately 15 years[11]; there is a wide potential window of opportunity to apply developing technologies in early detection of this cancer.

Current screening programs have demonstrated that the EUS evaluation can detect premalignant lesions and early cancers in certain small subset of high-risk groups. However, as the overwhelming majority of PDAC cases involve patients who develop the disease sporadically without a recognized genetic abnormality, the application of this modality for PDAC detection screening is very limited for the general adult population.

Select population based approach

Identification of a higher-PDAC-risk group: As the prevalence of PDAC in the general United States population over the age 55 is approximately 68 per 100000, a candidate discriminant test with a specificity of 98% and a sensitivity of 100% would generate 1999 false-positive test results and 68 true-positives[74]. Thus, relying on a single determinant for distinguishing the PDAC early-stage cases from the general population would necessitate a highly accurate test with a specificity of greater than 99%. More practical approach, then, would be to begin with a subset of population with a higher prevalence, and in conjunction with novel surrogate markers to curtail the at-risk subset, we could begin to identify the group with significantly increased PDAC risk for whom the endoscopic/imaging-based screening strategy could be applied.

An initial approach in selection of the screening population is to utilize selective clinical parameters that could be used to curtail the subset of the general population at increased PDAC risk. For instance, based on the epidemiological evidence, such clinical parameters include hyperglycemia or diabetes, which are noted in 50%-80% of pancreatic cancer patients [75–79]. Though not encompassing all PDAC patients, this subset includes a much larger proportion of PDAC patients for whom we may select further for screening. Similarly, patients with a history of chronic pancreatitis or obesity are reported to have increased PDAC risk during their lifetime[80–85].

With the recent advancement in the technology and resumed interest in the cancer-associated metabolic abnormality [89,90], application of metabolomics in the cancer field has attracted more attention [91]. Cancer-related metabolic reprogramming, Warburg effect, has been known since nearly a century ago in association with various solid tumors including PDAC [92], as cancer cells undergo energetically inefficient glycolysis even in the presence of oxygen in the environment (aerobic glycolysis)[93]. A number of common cancer mutations including Akt1, HIF (hypoxia-inducible factor), and p53 have been shown to support the Warburg effect through glycolysis and down-regulation of metabolite flux through the Krebs cycle [94–101]. In PDAC, increased phosphorylation or activation of Akt1 has also been reported (illuminating on the importance of enzyme functionality)[102] as well as involvement of HIF1 in the tumor growth via effects on glycolytic process [103,104] and membrane-bound glycoprotein (MUC17) regulation [105] – reflective of activation of metabolic pathways. Further evidences of loss-of-function genetic mutations in key mitochondrial metabolic enzymes such as succinate dehydrogenase and fumarate hydratase, isocitrate dehydrogenase, phosphoglycerate dehydrogenase support carcinogenesis and the Warburg effect [106–110]. Other important alternative pathways in cancer metabolism such as glutaminolysis and pyruvate kinase isoform suppression have been shown to accumulate respective upstream intermediates and reduction of associated end products such as NADPH, ribose-5-phosphate and nucleic acids [111-116]. As such, various groups have reported metabolomics biomarker applications for different cancers [117,118].

As a major organ involved in metabolic regulation in a healthy individual, pancreatic disorder such as malignancy is anticipated to influence the normal metabolism, presenting further rationale and interest in elucidating the implication of malignant transformation and PDAC development. Proteomic analysis of the pancreatic cancer cells demonstrated alteration in proteins involved in metabolic pathways including increased expression of glycolytic and reduced Krebs cycle enzymes, and accumulation of key proteins involved in glutamine metabolism, in support of Warburg effect. These in turn play significant role in nucleotide and amino acid biosynthesis required for sustaining the proliferating cancer cells[119]. Applications of sensitive mass spectrometric techniques in metabolomics study of PDAC detection biomarkers have led to identification of a set of small molecules or metabolites (or biochemical intermediates) that are potent discriminants of developing PDAC and the controls (See Figure ​1  as an example of metabolomics based analysis, allowing segregation of PDAC from benign cases). Recent reports from our group as well as others have demonstrated that specific candidate metabolites consisting of amino acids, bile acids, and a number of lipids and fatty acids – suspected to be reflective of tumor proliferation as well as many systemic response yet to be determined – were identified as potential discriminant for blood-based PDAC biomarkers[120-123]. As a further supporting data, elucidation of lipids and fatty acids as discriminant factors from PDAC and benign lesions from the cancer tissue and adjacent normal tissue has been reported recently[124].

metabolomics based analysis for PDC WJG-21-1707-g001

metabolomics based analysis for PDC WJG-21-1707-g001

http://www.ncbi.nlm.nih.gov/pmc/articles/PMC4323446/bin/WJG-21-1707-g001.gif

Figure 1 Example of metabolomics based analysis, allowing segregation of pancreatic ductal adenocarcinoma from benign cases. Heat map illustration of discriminant capability of a metabolite set derived from gas chromatography and liquid chromatography/mass spectrometry …

By virtue of simultaneously depicting the multiple metabolite levels, metabolomics approach reveals various biochemical pathways that are uniquely involved in malignant conditions and has led to findings such as abnormalities of glycine and its mitochondrial biosynthetic pathway, as a potential therapeutic target in certain cancers[125]. Moreover, in combination with other systems biology approaches such as transcriptomics and proteomics, further refinement in characterization of cancer development and therapeutic targets as well as identification of potential biomarkers could be realized for PDAC. Since many enzymes in a metabolic network determine metabolites’ level and nonlinear quantitative relationship from the genes to the proteome and metabolome levels exist, a metabolome cannot be easily decomposed to a specific single marker, which will designate the cancer state[126]. Thus, in order to delineate a pathological state such as PDAC, multiple metabolomic features might be required for accurate depiction of a developing cancer. Future studies are anticipated to incorporate cancer systems’ biological knowledge, including metabolomics, for optimal designation of PDAC biomarkers, which would be utilized in conjunction with a clinical-parameter-derived population subset for establishing the PDAC screening population. Subsequently, further validation studies for the PDAC biomarkers need to be performed.

Current imaging-based detection and diagnostic methods for PDAC is effectively providing answers to clinical questions raised for patients with signs or symptoms of suspected pancreatic lesions. However, the endoscopic/imaging-based screening schemes are currently limited in applications to early PDAC detection in asymptomatic patients, aside from a small group of known genetically high-risk groups. There is a high demand for developing a method of selecting distinct subsets among the general population for implementing the endoscopic/imaging screening test effectively. Application of combinations of clinical risk parameters/factors with the developing molecular biomarkers from translational science such as metabolomics analysis brings hopes of providing us with early PDAC detection markers, and developing effective early detection screening scheme for the patients in the near future.

Serum metabolomic profiles evaluated after surgery may identify patients with estrogen receptor negative early breast cancer at increased risk of disease recurrence
Tenori L, Oakman C, Morris PG, …, Luchinat C, Di Leo A.
Mol Oncol. 2015 Jan; 9(1):128-39.
http://dx.doi.org:/10.1016/j.molonc.2014.07.012

Purpose: Metabolomics is a global study of metabolites in biological samples. In this study we explored whether serum metabolomic spectra could distinguish between early and metastatic breast cancer patients and predict disease relapse. Methods: Serum samples were analysed from women with metastatic (n = 95) and predominantly oestrogen receptor (ER) negative early stage (n = 80) breast cancer using high resolution nuclear magnetic resonance spectroscopy. Multivariate statistics and a Random Forest classifier were used to create a prognostic model for disease relapse in early patients.
Results: In the early breast cancer training set (n = 40), metabolomics correctly distinguished between early and metastatic disease in 83.7% of cases. A prognostic risk model predicted relapse with 90% sensitivity (95% CI 74.9-94.8%), 67% specificity (95% CI 63.0-73.4%) and 73% predictive accuracy (95% CI 70.6-74.8%). These results were reproduced in an independent early breast cancer set (n = 40), with 82% sensitivity, 72% specificity and 75% predictive accuracy. Disease relapse was associated with significantly lower levels of histidine (p = 0.0003) and higher levels of glucose (p = 0.01), and lipids (p = 0.0003), compared with patients with no relapse.
Conclusions: The performance of a serum metabolomic prognostic model for disease relapse in individuals with ER-negative early stage breast cancer is promising. A confirmation study is ongoing to better define the potential of metabolomics as a host and tumour-derived prognostic tool.

Figure 1 e Clusterization of serum metabolomic profiles. Discrimination between metastatic (green, n [ 95) and early (red, n [ 40) breast cancer patients using the random forest classifier. (a) CPMG; (b) NOESY1D; (c) Diffusion.

Figure 2 e Training set. Comparison between metabolomic classification and actual relapse. The receiver operator curves (ROC) and the area under the curve (AUC) scores are presented for CPMG, NOESY1D and Diffusion.

Figure 3 e Validation set. Comparison between CPMG random forest risk score metabolomic classification and actual relapse The receiver operator curve (ROC) and the area under the curve (AUC) score are presented for the CPMG analysis.

Figure 4 e Discriminant metabolites. Discriminant metabolites (p < 0.05) between profiles from early (green, n [ 80) and metastatic (red, n [ 95) breast cancer patients. Box and whisker plots: horizontal line within the box [ mean; bottom and top lines of the box [ 25th and 75th percentiles, respectively; bottom and top whiskers [ 5th and 95th percentiles, respectively. Median values (arbitrary units) are provided in the associated table, along with raw p values and p values adjusted for multiple testing. pts: patients.

Transparency in metabolic network reconstruction enables scalable biological discovery
Benjamin D Heavner, Nathan D Price
Current Opinion in Biotechnology, Aug 2015; 34: 105–109
Highlights

  • Assembling a network reconstruction can reveal knowledge gaps.
  • Building a functional metabolic model enables testable prediction.
  • Recent work has found that most models contain the same reactions.
  • Reconstruction and functional model building should be explicitly separated.

Reconstructing metabolic pathways has long been a focus of active research. Now, draft models can be generated from genomic annotation and used to simulate metabolic fluxes of mass and energy at the whole-cell scale. This approach has led to an explosion in the number of functional metabolic network models. However, more models have not led to expanded coverage of metabolic reactions known to occur in the biosphere. Thus, there exists opportunity to reconsider the process of reconstruction and model derivation to better support the less-scalable investigative processes of biocuration and experimentation. Realizing this opportunity to improve our knowledge of metabolism requires developing new tools that make reconstructions more useful by highlighting metabolic network knowledge limitations to guide future research.

metabolic network reconstruction

metabolic network reconstruction

http://ars.els-cdn.com/content/image/1-s2.0-S0958166914002250-fx1.jpg

Mapping metabolic pathways has been a focus of significant scientific efforts dating from the emergence of biochemistry as a distinct scientific field in the late 19th century [1]. This endeavor remains an important effort for at least two compelling reasons. First, cataloguing and characterizing the full range of metabolic processes across species (which because of genomics are being discovered at an incredible pace) is a fundamentally important step towards a complete understanding of our ecological environment. Second, mapping metabolic pathways in organisms — many of which can be found with specialized properties shaped by their environment — facilitates metabolic engineering to advance nascent industrial biotechnology efforts ranging from augmenting/replacing petroleum-derived chemical precursors or fuels to biopharmaceutical production [2]. However, despite laudable efforts to enable high-throughput ‘genomic enzymology’ [3•], the traditional biochemical approaches of enzyme expression, purification, and characterization remain time-intensive, capital-intensive, and labor-intensive, and have not expanded in scale like our ability to identify and characterize life genomically. Characterizing new metabolic function is further hampered by the challenge of cultivating environmental isolates in laboratory conditions [4]. Fortunately, recent efforts to leverage genome functional annotation and established knowledge of biochemistry have enabled the computational assembly of ‘draft metabolic reconstructions’ [5], which are parts lists of metabolic network components. In this context, a reconstruction is not just the information embodied in the stoichiometric matrix describing metabolic network structure, but also the associated metadata and annotation that entails an organism-specific knowledge base. Such a reconstruction can serve as the basis for making functional models amenable to mathematical simulation. Thus, a reconstruction is a bottom-up assembly of biochemical information, and a model can serve as a framework for integrating top-down information (for example, model constraints can be generated from statistically inferred gene regulatory networks [6]). Such computational approaches are significantly faster and less expensive than biochemical characterization [7]. They are also providing new resources facilitate cultivation of novel environmental isolates [8], and the scope of draft metabolic network coverage across the biome has increased much faster than wet lab characterization. If the distinction between reconstruction and model formulation can be strengthened and supported through software implementation, there is great opportunity for using both tasks to further advance rapid discovery of biological function.

The iterative process of manual curation of a draft metabolic network reconstruction to assemble a higher confidence compendium of organism-specific metabolism (a process termed ‘biocuration’ [9 and 10]) remains time-intensive and labor-intensive. Biocuration of metabolic reconstructions currently advances on a decadal time scale [11 and 12]. Thus, much research effort has focused instead on developing techniques for rapid development of models that are amenable to simulation [13 and 14]. Thousands of models have been derived from automatically assembled draft reconstructions [15], but most of these models consist of highly conserved portions of metabolism since they are propagated primarily via orthology. Though the number of models is large, they do not reflect the true diversity of cellular metabolic capabilities across different organisms [16•]. Applying the rapid and scalable process of draft network reconstruction to support and accelerate the less-scalable processes of biocuration and in vitro or in vivo experimentation remains an unrealized opportunity. The path forward should focus on increased emphasis on transparently documenting the reconstruction process and developing tools to highlight, rather than obscure, knowledge limitations that ultimately cause limitations to model predictive accuracy.

More explicit annotation of metabolic network reconstruction and model derivation steps can help direct research efforts

Testing implicit hypotheses arising from reconstruction assembly provides one opportunity for guiding experimental efforts. However, the very act of identifying ambiguous information in the literature should also be exploited to contribute to experimental efforts, independent of the choices a researcher makes in assembling a reconstruction. Preliminary steps to facilitate large-scale computational identification of biological uncertainty have been made, such as the development of the Evidence Ontology [18]. However, realizing the potential for using reconstruction assembly to highlight experimental opportunities will require a broader shift to emphasize the limits of our knowledge, rather than only the predictive power of a model that can be derived from a reconstruction. Computational reconstruction of metabolic networks provides two distinct opportunities for guiding experimental efforts even before a mathematically computable model is derived from the assembled knowledge: highlighting areas of uncertainty in the current knowledge of an organism, and introducing hypotheses of metabolic function as choices are made throughout biocuration efforts.

The subsequent process of deriving a mathematically computable model from a reconstruction provides additional opportunities for scalable hypothesis generation that could be exploited to inform experimental efforts. While stoichiometrically constrained models derived from reconstructions are ‘parameter-light’ when compared to dynamic enzyme kinetic models, they are not really ‘parameter free’ [19]. As modelers derive a model from an assembled reconstruction, they must make choices. And, like the ambiguities and choices that are made and should be highlighted in assembling a reconstruction, highlighting the choices made in deriving a model provides further opportunity for scalable hypothesis generation. Examples of choices that often arise in deriving a functional model include adding intracellular transport reactions, filling network gaps, or trimming network dead ends to improve network connectivity [20]. Researchers seeking to conduct Flux Balance Analysis (FBA) [21] or similar approaches must formulate an objective function, can include testable parameters such as ATP maintenance requirements, and can compare model predictions to designated reference phenotype observations. Each of these model-building and tuning activities presents opportunities to rapidly develop and prioritize new hypotheses of metabolic function.

The effort to computationally reconstruct biochemical knowledge to compile organism-specific reconstructions, and to derive computable models from these reconstructions, is a relatively young field of research with abundant opportunity for facilitating biological discovery of metabolic function. Judgment is required in assembling a reconstruction, and there should be careful consideration of the fact that judgment calls represent an implicit hypothesis. Making these hypotheses more explicit would help guide subsequent investigation. Bernhard Palsson and colleagues call for ‘an open discussion to define the minimal quality criteria for a genome scale reconstruction’ [16•] — an effort we fully support. We believe that such a beneficial ‘minimal quality criteria’ should be guided by the goals of reproducibility and transparency, including those aspects that can help to guide discovery of novel gene functions.

Read Full Post »

CRISPR/Cas9: Contributions on Endoribonuclease Structure and Function, Role in Immunity and Applications in Genome Engineering

Writer and Curator:Larry H Bernstein, MD, FCAP 

2.2.25

2.2.25   CRISPR/Cas9: Contributions on Endoribonuclease Structure and Function, Role in Immunity and Applications in Genome Engineering, Volume 2 (Volume Two: Latest in Genomics Methodologies for Therapeutics: Gene Editing, NGS and BioInformatics, Simulations and the Genome Ontology), Part 2: CRISPR for Gene Editing and DNA Repair

This is the fourth contribution to a series on transcriptional control and cellular remodeling. The previous dealt with RNAs – mRNA, miRNA, RNAi, siRNA, shRNA, small RNAs, lncRNAs, DICER, SLICER, RISC, recombination, and related processes.  It is clear that the classical model was limited, is history, and could not predict a large universe encompassing DNA, RNA, transcription, translation, signaling, proteins, protein conformation, mRNA-miRNA interactions, protein-protein interactions, inter- and intracellular interactions, and cellular remodeling.

Cutting it close: CRISPR-associated endoribonuclease structure and function
Hochstrasser ML and Doudna JA
Trends in Biochemical Sciences, Jan 2015; 40(1):58-66
http://dx.doi.org/10.1016/j.tibs.2014.10.007

RNAi pathways in eukaryotes, as in archaea, possess an adaptive immune system consisting of repetitive genetic elements known as clustered regularly clustered interspersed short palindromic repeats (CRISPERS) and CRISPR-associated (cas) proteins. CRISPR-cas systems require small RNAs for sequence-specific detection and degradation of complex nucleic acids. Cas 5 and cas 6 enzymes have evolved to specifically recognize and process CRISPR-derived transcripts to function as small RNAs used as guides by interference complexes.

Figure 1. Overview of CRISPR RNA (crRNA) processing and comparison between CRISPR–Cas interference systems. There are three main pathways of CRISPR adaptive immunity (Types I–III) and several subtypes, each typified by a different set of Cas proteins. The first stage of the CRISPR–Cas system is acquisition, in which a foreign DNA sequence is incorporated into the host CRISPR locus. Next, the entire repeat-spacer array is transcribed into a long precursor crRNA (pre-crRNA). A single cleavage within each repeat sequence generates shorter, mature crRNAs. Some crRNAs undergo an additional trimming step. The enzymes responsible for catalysis and exact mode of crRNA processing differ in each system. The crRNA is loaded into an interference complex where it serves as a guide for targeting invasive DNA, or in Type III-B systems, RNA.

Figure 2. Fundamental structural features of CRISPR endoRNases. (A) Topology diagram of a typical Cas6 C-terminal RRM fold with key structural features labeled. (B) Two views of Thermus thermophilus Cas6e (PDB: 2Y8W) colored as in (A). For clarity, the N-terminal RRM fold has been omitted in the left panel. (C) Comparison of structures of Cas6 and Cas5c enzymes associated with different CRISPR subtypes (in parentheses), highlighting shared structural elements, colored as in (A) and (B), with the Cas5 ‘thumb’ in black (PDB: 4ILL, 2XLK, 3UFC, 4F3M). Note that no active site residues are shown for Pyrococcus furiosus Cas6-3nc because this protein is non-catalytic.

Figure 3. Structure and sequence-specific RNA binding by Cas6 enzymes. (A) First two images: Thermus thermophilus Cas6A in the apo form and bound to its product CRISPR RNA (crRNA) (PDB: apo – 4C97, product-bound – 4C8Z). Second two images: electrostatic surface potential rendering of the same enzyme in two views with the first eight nucleotides of the Pyrococcus furiosus crRNA 30 handle (PDB: 3PKM) modeled onto the structure based on alignment of the two proteins, as in Niewoehner et al. [30]. For simplicity, only one subunit of the non-crystallographic dimer is shown. (B) Pseudomonas aeruginosa Cas6f bound to its cognate RNA (PDB: 2XLK). Close-up views highlight the active site and sequence-specific interactions by the groove-binding element. (C) Sulfolobus solfataricus Cas6-1A bound to its pre-crRNA substrate (PDB: 4ILL). The active site and sequence-specific contacts made by the glycine-rich loop are shown in detail. For simplicity, only one subunit of the SsoCas6-1A dimer is shown.

CRISPRs (clustered regularly interspaced short palindromic repeats) are DNA loci containing short repetitions of base sequences. Each repetition is followed by short segments of “spacer DNA” from previous exposures to a virus.[2]

CRISPRs are found in approximately 40% of sequenced bacteria genomes and 90% of sequenced archaea.[3][4]

CRISPRs are often associated with cas genes that code for proteins related to CRISPRs. The CRISPR/Cas system is a prokaryotic immune system that confers resistance to foreign genetic elements such as plasmids and phages[5][6] and provides a form of acquired immunity. CRISPR spacers recognize and cut these exogenous genetic elements in a manner analogous to RNAi in eukaryotic organisms.[2]

Since 2013, the CRISPR/Cas system has been used for gene editing (adding, disrupting or changing the sequence of specific genes) and gene regulation in species throughout the tree of life.[7] By delivering the Cas9 protein and appropriate guide RNAs into a cell, the organism’s genome can be cut at any desired location.

It may be possible to use CRISPR to build RNA-guided gene drives capable of altering the genomes of entire populations.

Gene-editing predecessors

In the early 2000s, researchers developed zinc finger nucleases, synthetic proteins whose DNA-binding domains enable them to cut DNA at specific spots. Later, synthetic nucleases called TALENs provided an easier way to target specific DNA and were predicted to surpass zinc fingers. They both depend on making custom proteins for each DNA target, a more cumbersome procedure than guide RNAs. CRISPRs are more efficient and can target more genes than these earlier techniques.

Repeats and spacers

CRISPR loci range in size from 24 to 48 base pairs. They usually show some dyad symmetry, implying the formation of a secondary structure such as a hairpin, but are not truly palindromic. Repeats are separated by spacers of similar length. Some CRISPR spacer sequences exactly match sequences from plasmids and phages, although some spacers match the prokaryote’s genome (self-targeting spacers). New spacers can be added rapidly in response to phage infection.

http://en.wikipedia.org/wiki/CRISPR

http://upload.wikimedia.org/wikipedia/commons/thumb/5/5f/Crispr.png/1024px-Crispr.png

http://www.frontiersin.org/files/Articles/58953/fgene-04-00193-r2/image_m/fgene-04-00193-g001.jpg

http://2013.igem.org/wiki/images/thumb/c/c0/CRISPR_Cooperativity_2.png/720px-CRISPR_Cooperativity_2.png

http://img.scoop.it/2Y0f1M2hXSr35d9-xn4WVTl72eJkfbmt4t8yenImKBVvK0kTmF0xjctABnaLJIm9

A CRISPR CASe for high-throughput silencing

A CRISPR CASe for high-throughput silencing

dual gRNA vector

dual gRNA vector

Genome editing with RNA-guided Cas9 nuclease in Zebrafish embryos

Genome editing with RNA-guided Cas9 nuclease in Zebrafish embryos

The role of CRISPR–Cas systems in adaptive immunity and beyond

Barrangue R
Current Opinion in Immunology 2015; 32:36–41
http://dx.doi.org/10.1016/j.coi.2014.12.008

CRISPR–Cas immune systems. CRISPR-encoded immunization and interference. In the adaptation stage, exogenous DNA is sampled and a novel spacer is integrated into the CRISPR locus; in the expression stage, the CRISPR array is transcribed and processed into small interfering CRISPR RNAs (crRNAs) that guide Cas endonucleases towards target complementary DNA in the interference stage.

Cas-mediated DNA targeting and cleavage. The Cas9 endonuclease forms a ribonucleoprotein complex in combination with the dual guide RNA (crRNA and tracrRNA), and the target dsDNA. First, the Cas9:guide RNA complex binds to proto-spacer adjacent motif (PAM) and drives the formation of an R-loop in the target DNA for genesis of a double stranded break using the RuvC and HNH nickase domains. The former primarily involves the recognition (REC) Cas9 lobe (top), and the latter is primarily driven by the nuclease (NUC) lobe (bottom). Cas-mediated targeting can aim at phage DNA for antiviral resistance (cleaved viral DNA cannot replicate), plasmid DNA to preclude the uptake and dissemination of plasmids (cleaved plasmid DNA cannot replicate), and chromosomal DNA for genome editing (insertion of mutations using endogenous DNA repair systems at the site of cleavage) or transcriptional control (dCas9 binding blocks RNA polymerase).

CRISPR-Cas9 Knockin Mice for Genome Editing and Cancer Modeling
Cell Oct 9, 2014; 159:440–455
http://dx.doi.org/10.1016/j.cell.2014.09.014

Figure2. Ex Vivo Genome Editing of Primary Immune Cells Derived from Constitutive Cas9-Expressing Mice (A) Schematic of ex vivo genome editing experimental flow. (B)Flow cytometry histogram of bone marrow cells from constitutive Cas9-expressing (green) and wild-type (blue) mice, showing Cas9-P2A-EGFP expressiononlyinCas9mice.Dataareplottedasa percentage of the total number of cells. (C) sgRNA design for targeting the mouse Myd88 locus. (D) sgRNA design for targeting the mouse A20 locus. (E) Myd88 indel analysis of constitutive Cas9expressing DCs transduced with either a Myd88targeting sgRNA (sgMyd88-1 and sgMyd88-2) or controls (CTR, average of four control sgRNAs), showing indel formation only in Myd88-targeted cells. Data are plotted as the percent of Illumina sequencing reads containing indels at the target site. Mutations are categorized as frameshift (fs, yellow bar) or non-frameshift (nfs, orange bar). (F) A20 indel analysis of constitutive Cas9-expressing DCs transduced with either an A20-targeting sgRNA (sgA20-1) or controls (CTR, average of four control sgRNAs), showing indel formation only in A20-targeted cells. Data are plotted as the percent of Illumina sequencing reads containing indels at the target site. Mutations are categorized as frameshift (fs, yellow bar) or non-frameshift (nfs, orange bar). (G) Myd88 mRNA quantification of constitutive Cas9-expressing DCs transduced with either Myd88-targeting sgRNA (sgMyd88-1 or sgMyd882) or controls (CTR, average of six control sgRNAs), showing reduced expression only in Myd88-targeted cells. Data are plotted as Myd88 mRNA levels from Nanostring nCounter analysis. (H) Immunoblot of constitutive Cas9-expressing DCs transduced with either Myd88-targeting sgRNA (sgMyd88-1 or sgMyd88-2) or controls (four control sgRNAs), showing depletion of MyD88 protein only in Myd88-targeted cells. b-actin was used as a loading control. (*) Overexposed, repeated-measurement. (I) Nanostring nCounter analysis of constitutive Cas9-expressing DCs transduced with either Myd88-targeting sgRNA (sgMyd88-1 or sgMyd882) or shRNA (shMyd88), A20-targeting sgRNA (sgA20-1 or sgA20-2), or shRNA (shA20), showing analtered LPS response.(Inset)Theclustershowing the highest difference between Myd88- and A20 targeting sgRNAs, including key inflammatory genes(IL1a,IL1b,Cxcl1,Tnf,etc.).(Red)High;(blue) low; (white) unchanged; based on fold change relative to measurements with six control sgRNAs. See also Figure S2.

Figure 5. In Vivo Tumor Formation in AAV9-KPL-Injected Mice (A) Lung mCT images of Cre-dependent Cas9 mice injected with either AAV9-KPL or AAV9-sgLacZ 2 months posttransduction, showing tumor formation (indicated by the arrowhead) only in AAV9-KPL injected mice. (B)LungmCT3DrenderingofCre-dependent Cas9 mice injected with AAV9-KPL 2 months posttransduction, showing tumor formation (indicated by a yellow oval). (C) Major tumor burden quantification of Cre-dependent Cas9 mice injected with either AAV9-KPL or AAV9-sgLacZ, showing significant tumor burden in AAV9KPL-injected mice. Data are plotted as mean ± SEM. **p < 0.005. (D) Representative lung H&E images of Cre-dependent Cas9 mice injected with either AAV9-KPL or AAV9-sgLacZ 9 weeks posttransduction, showing heterogeneous tumor formation in AAV9-KPL-injected mice. Arrowheads highlight a representative subset of tumors within the lungs of AAV9-KPL injected mice.

Development and Applications of CRISPR-Cas9 for Genome Engineering
Zhu PD, Lander ES, Zhang F
Cell Jun 5, 2014; 157:1262-1278
http://dx.doi.org/10.1016/j.cell.2014.05.010

Figure 1. Applications of Genome Engineering Genetic and epigenetic control of cells with genome engineering technologies is enabling a broad range of applications from basic biology to biotechnology and medicine. (Clockwise from top) Causal genetic mutations or epigenetic variants associated with altered biological function or disease phenotypes can nowberapidlyandefficientlyrecapitulated inanimalorcellularmodels (Animal models, Genetic variation). Manipulating biological circuits couldalso facilitate the generation of useful synthetic materials, such as algae-derived, silicabased diatoms for oral drug delivery (Materials). Additionally, precise genetic engineering of important agricultural crops could confer resistance to environmental deprivation or pathogenic infection, improving food security while avoiding the introduction of foreign DNA (Food). Sustainable and cost-effective biofuels are attractive sources for renewable energy, which could be achieved by creating efficient metabolic pathways for ethanol production in algae or corn (Fuel). Direct in vivo correction of genetic or epigenetic defects in somatic tissue would be permanent genetic solutions that address the root cause of genetically encoded disorders (Gene surgery). Finally, engineering cells to optimize high yield generation of drug precursors in bacterial factories could significantly reduce the cost and accessibility of useful therapeutics (Drug development).

Figure 2. Genome Editing Technologies Exploit Endogenous DNA Repair Machinery (A) DNA double-strand breaks (DSBs) are typically repaired by nonhomologous end-joining (NHEJ) or homology-directed repair (HDR). In the errorprone NHEJ pathway, Ku heterodimers bind to DSB ends and serve as a molecular scaffold for associated repair proteins. Indels are introduced when the complementary strands undergo end resection and misaligned repair due to microhomology, eventually leading to frameshift mutations and gene knockout. Alternatively, Rad51 proteins may bind DSB ends during the initial phase of HDR, recruiting accessory factors that direct genomic recombination with homology arms on an exogenous repair template. Bypassing the matching sister chromatid facilitates the introduction of precise gene modifications. (B) Zinc finger (ZF) proteins and transcription activator-like effectors (TALEs) are naturally occurring DNA-binding domains that can be modularly assembled to target specific sequences. ZF and TALE domains each recognize 3 and 1 bp of DNA, respectively. Such DNA-binding proteins can be fused to the FokI endonuclease to generate programmable site-specific nucleases. (C) The Cas9 nuclease from the microbial CRISPR adaptive immune system is localized to specific DNA sequences via the guide sequence on its guide RNA (red), directly base-pairing with the DNA target. Binding of a protospacer-adjacent motif (PAM, blue) downstream of the target locus helps to direct Cas9-mediated DSBs.

Figure 3. Key Studies Characterizing and Engineering CRISPR Systems Cas9 has also been referred to as Cas5, Csx12, and Csn1 in literature prior to 2012. For clarity, we exclusively adopt the Cas9 nomenclature throughout this Review. CRISPR, clustered regularly interspaced short palindromic repeats; Cas, CRISPR-associated; crRNA, CRISPR RNA; DSB, double-strand break; tracrRNA, trans-activating CRISPR RNA.

Figure 4. Natural Mechanisms of Microbial CRISPR Systems in Adaptive Immunity Following invasion of the cell by foreign genetic elements from bacteriophages or plasmids (step 1: phage infection), certain CRISPR-associated (Cas) enzymes acquire spacers from the exogenous protospacer sequences and install them into the CRISPR locus within the prokaryotic genome (step 2: spacer acquisition). These spacers are segregated between direct repeats that allow the CRISPR system to mediate self and nonself recognition. The CRISPR array is a noncoding RNA transcript that is enzymatically maturated through distinct pathways that are unique to each type of CRISPR system (step 3: crRNA biogenesis and processing). In types I and III CRISPR, the pre-crRNA transcript is cleaved within the repeats by CRISPR-associated ribonucleases, releasing multiple small crRNAs. Type III crRNA intermediates are further processed at the 30 end by yet-to-be-identified RNases to produce the fully mature transcript. In type II CRISPR, an associated trans-activating CRISPR RNA (tracrRNA) hybridizes with the direct repeats, forming an RNA duplex that is cleaved and processed by endogenous RNase III and other unknown nucleases. Maturated crRNAs from type I and III CRISPR systems are then loaded onto effector protein complexes for target recognition and degradation. In type II systems, crRNA-tracrRNA hybrids complex with Cas9 to mediate interference. Both type I and III CRISPR systems use multiprotein interference modules to facilitate target recognition. In type I CRISPR, the Cascade complex is loaded with a crRNA molecule, constituting a catalytically inert surveillance complex that recognizes target DNA. The Cas3 nuclease is then recruited to the Cascade-bound R loop, mediating target degradation. In type III CRISPR, crRNAs associate either with Csm or Cmr complexes that bind and cleave DNA and RNA substrates, respectively. In contrast, the type II system requires only the Cas9 nuclease to degrade DNA matching its dual guide RNA consisting of a crRNA-tracrRNA hybrid.

Figure 5. Structural and Metagenomic Diversity of Cas9 Orthologs (A) Crystal structure of Streptococcus pyogenes Cas9 in complex with guide RNA and target DNA. (B) Canonical CRISPR locus organization from type II CRISPR systems, which can be classified into IIA-IIC based on their cas gene clusters. Whereas type IIC CRISPR loci contain the minimal set of cas9, cas1, and cas2, IIA and IIB retain their signature csn2 and cas4 genes, respectively. (C) Histogram displaying length distribution of known Cas9 orthologs as described in UniProt, HAMAP protein family profile MF_01480. (D) Phylogenetic tree displaying the microbial origin of Cas9 nucleases from the type II CRISPR immune system. Taxonomic information was derived from greengenes 16S rRNA gene sequence alignment, and the tree was visualized using the Interactive Tree of Life tool (iTol). (E) Four Cas9 orthologs from families IIA, IIB, and IIC were aligned by ClustalW (BLOSUM). Domain alignment is based on the Streptococcus pyogenes Cas9, whereas residues highlighted in red indicate highly conserved catalytic residues within the RuvC I and HNH nuclease domains.

Figure 6. Applications ofCas9 as aGenome Engineering Platform (A) The Cas9 nuclease cleaves DNA via its RuvC and HNHnucleasedomains,eachofwhichnicks a DNA strand to generate blunt-end DSBs. Either catalytic domain can be inactivated to generate nickase mutants that cause single-strand DNA breaks. (B) Two Cas9 nickase complexes with appropriatelyspacedtargetsitescanmimictargetedDSBs viacooperative nicks, doubling thelengthof target recognition without sacrificing cleavage efficiency. (C) Expression plasmids encoding the Cas9 gene and a short sgRNA cassette driven by the U6 RNA polymerase III promoter can be directly transfected into cell lines of interest. (D) Purified Cas9 protein and in vitro transcribed sgRNA can be microinjected into fertilized zygotes for rapid generation of transgenic animal models. (E) For somatic genetic modification, high-titer viral vectors encoding CRISPR reagents can be transduced into tissues or cells of interest. (F) Genome-scale functional screening can be facilitated by mass synthesis and delivery of guide RNA libraries. (G) Catalytically dead Cas9 (dCas9) can be converted into a general DNA-binding domain and fused to functional effectors such as transcriptional activators or epigenetic enzymes. The modularity of targeting and flexible choice of functional domains enable rapid expansion of the Cas9 toolbox. (H) Cas9 coupled to fluorescent reporters facilitates live imaging of DNA loci for illuminating the dynamics of genome architecture. (I) Reconstituting split fragments of Cas9 via chemical or optical induction of heterodimer domains, such as the cib1/cry2 system from Arabidopsis, confers temporal control of dynamic cellular processes.

Characterization and Optimization of the CRISPR/Cas System for Applications in Genome Engineering
http://nrs.harvard.edu/urn-3:HUL.InstRepos:12407619

Two important advances in the last several decades have propelled our understanding of molecular processes far beyond descriptions of biology at macroscopic levels and fundamentally altered the way that we comprehend organisms, tissues, and cells. First, growing hand in hand with the exponential expansion of computing power, the development of genome sequencing technology, enabling high resolution mapping of DNA sequences, has allowed us to define, down to the nucleotide level, differences between multiple species, members of a species, and within an individual, between classes of cells, as well as diseased and malignant cells. At this point, our ability to make sense of this wealth of genomic information is only limited by our ability to make ever-more precise cellular and genomic alterations to which we may ascribe a phenotypic change. To achieve this, we have concurrently created tools that have allowed us to query the functions of genes and genetic variations from scales large to small by means of first random and then targeted mutagenesis, followed by increasingly refined means of manipulating either the genome directly or the activity of the genes themselves at the level of RNA or protein.

The ability to precisely manipulate the genome in a targeted manner is fundamental to driving both basic science research and development of medical therapeutics. Until recently, this has been primarily achieved through coupling of a nuclease domain with customizable protein modules that recognize DNA in a sequence-specific manner such as zinc finger or transcription activator-like effector domains. Though these approaches have allowed unprecedented precision in manipulating the genome, in practice they have been limited by the reproducibility, predictability, and specificity of targeted cleavage, all of which are partially attributable to the nature of protein-mediated DNA sequence recognition. It has been recently shown that the microbial CRISPR-Cas system can be adapted for eukaryotic genome editing. Cas9, an RNA guided DNA endonuclease, is directed by a 20-nt guide sequence via Watson-Crick base-pairing to its genomic target. Cas9 subsequently induces a double-stranded DNA break that results in targeted gene disruption through non-homologous end-joining repair or gene replacement via homologous recombination. Finally, the RNA guide and protein nuclease dual component system allows simultaneous delivery of multiple guide RNAs (sgRNA) to achieve multiplex genome editing with ease and efficiency.

The potential effects of off-target genomic modification represent a significant caveat to genome editing approaches in both research and therapeutic applications. Prior work from our lab and others has shown that Cas9 can tolerate some degree of mismatch with the guide RNA to target DNA base pairing. To increase substrate specificity, we devised a technique that uses a Cas9 nickase mutant with appropriately paired guide RNAs to efficiently inducing double-stranded breaks via simultaneous nicks on both strands of target DNA. As single-stranded nicks are repaired with high fidelity, targeted genome modification only occurs when the two opposite-strand nicks are closely spaced. This double nickase approach allows for marked reduction of off-target genome modification while maintaining robust on-target cleavage efficiency, making a significant step towards addressing one of the primary concerns regarding the use of genome editing technologies.

The ability to multiplex genome engineering by simply co-delivering multiple sgRNAs is a versatile property unique to the CRISPR-Cas system. While co-transfection of multiple guides is readily feasible in tissue culture, many in vivo and therapeutic applications would benefit from a compact, single vector system that would allow robust and reproducible multiplex editing. To achieve this, we first generated and functionally validated alternate sgRNA architectures to characterize the structure-function relationship of the Cas9 protein with the sgRNA in DNA recognition and cleavage. We then applied this knowledge towards the development and optimization of a tandem synthetic guide RNA (tsgRNA) scaffold that allows for a single promoter to drive expression of a single RNA transcript encoding two sgRNAs, which are subsequently processed into individual active sgRNAs.

A programmable genome editing tool fundamentally consists of two key elements: a DNA recognition domain conferring target specificity and a nuclease domain, ideally without any sequence specificity on its own. A key breakthrough came with the observation that the restriction enzyme FokI has molecularly distinct binding and cleavage domains, and that swapping of recognition domains could alter FokI targeting specificity. Prior to this realization, zinc fingers were discovered as a class of protein motifs in X. laevi, and found to be frequently occurring in mammalian cells as transcription factors where bind DNA in a modular, sequence specific manner. Each individual module of a Cys2-His2 zinc finger domain, the most commonly used ZF-type domain in genome engineering applications, contains approximately 30 amino acids that fold to interact with 3-bp of DNA.

With the creation of custom zinc-finger arrays capable of targeting any DNA sequence, either through stringing together of pre-defined modules with known, predicted 3bp-binding affinity or selection-based protocols with randomized ZF array libraries to account and optimize for inter-modular interactions, the pairing of the DNA-targeting ZF and FokI nuclease components created a new class of zinc finger nucleases (ZFNs) that quickly proved to be an adaptable and efficient method for targeting specific genomic loci in a variety of model organisms. While zinc finger technology can in theory target any specific genomic sequence, the difficulty of accurately predicting protein conformational folding and DNA-protein interactions prior to array assembly can make ZFN construction a somewhat tedious and costly process involving a substantial validation phase prior to practical use.

More recently, an analogous, simpler alternative was developed following the deciphering of the DNA recognition patterns of another class of proteins: the transcription activator-like effector proteins (TALEs). First observed in the rice pathogen Xanthomonas, these proteins consisted of naturally occurring modular arrays of 33-35 amino acid domains, each interacting with a single base pair. Although the single base discrimination of TALE modules compared to 3bp recognition in ZF domains provides greater ease and flexibility in designing TALE arrays to genomic targets, the inherently repetitive nature of TALE repeats posed a technical challenge that required the development of new assembly methodologies. Even so, given the modular separation of DNA recognition activity from nuclease or other effector domains, TALE-derived proteins have been able to quickly co-opt existing technology generated by the studies involving ZF proteins to similarly demonstrate effective genome editing capabilities in a wide variety of model organisms and systems.

One of the major limitations of the aforementioned genome-engineering technologies is their intrinsic dependence on protein-DNA interactions to drive specificity. As such, even after following rational design or thorough in vitro selection processes, it is necessary to perform extensive in vitro validation as protein activity and affinity may vary depending on the specific context in unpredictable ways. Practically, these factors necessitate the construction of multiple sets of TALENs or ZFNs for each locus targeted and, as a consequence, make high-throughput screening applications less tractable.

Although not directly manipulating the genome, the use of small-interfering RNAs (siRNA) to modulate gene expression represents a powerful alternative technology that is not bound by many of the short-comings of these existing genome editing technologies and revolutionized our ability to functionally interrogate the genome. The foundational observation was first made in C. elegans, that the introduction of double-stranded RNA into a cell results in potent post- transcriptional silencing of gene or genes carrying sequences complementary to the exogenous sequence. There are a number of key features that made the RNAi approach particularly tractable and drove its widespread and rapid adoption in basic science research.

  1. RNAi is an extremely efficient method of gene silencing. It is not uncommon to achieve greater than 85% gene knockdown, which, while not complete, is often more than sufficient for inducing a phenotype by which to assess gene function.
  2. siRNA targeting is mediated by predictable Watson-Crick base-pairing. This has allowed the elucidation of design parameters to both maximize on-target silencing and minimize off-target effects. Additionally, the relative ease of designing and creating siRNA constructs allows for rapid prototyping and validation of new targets.
  3. the mechanism of siRNA action takes advantage of a highly-conserved endogenous pathway for processing small RNAs, which minimizes the amount of material that needs to be delivered for adequate effect.

This has had a number of key impacts including but not limited to the possibility of multiplexed delivery to silence more than a single gene at a time or to target a single gene with multiple siRNAs to maximize knock-down, as well as the generation of large siRNA libraries allowing the development of high-throughput screening methodologies for rapid phenotyping in different contexts. The efficacy, predictability, and generalizability of RNAi technologies provided it with enough compelling qualities to become a truly disruptive technology in the field of genome engineering.

Re-purposing the bacterial CRISPR/Cas system for genome editing

The RNA-guided CRISPR (clustered regularly interspaced short palindromic repeats) endonuclease system was first observed in E. coli in 1987 by its striking eponymous genomic structure evolved as an adaptive immune system, bacteria and archaea use a set of CRISPR- associated (Cas) genes to incorporate exogenous material into the CRISPR locus, and subsequently transcribe them as RNA templates for targeted destruction of the mobile elements at either DNA or RNA level.

Three types of CRISPR systems have been identified to date, differing in their targets as well as mechanisms of action. Type I and III CRISPR systems employ an ensemble of Cas gene to carryout RNA processing, recognition of target, and cleavage33,34. By contrast, the type II CRISPRCas system makes use of a single endonuclease, Cas9, to locate and cleave target DNA. Cas9 is guided by a pair non-coding RNAs, a guide-bearing and variable crRNA and a required auxiliary transactivating crRNA (tracrRNA). The crRNA contains a 20-nt guide sequence, also known as a spacer, that determines target specificity by via Watson-Crick base-pairing with target DNA, followed by the invariant “direct repeat” portion that base-pairs with the “antirepeat” portion of the tracrRNA to form an RNA duplex. In the native bacterial system, multiple crRNAs are co-transcribed as a pre-crRNA array before being processed down to individual units for directing Cas9 against various targets. In the CRISPR-Cas system derived from Streptococcus pyogenes, the target DNA sequence always precedes a 5’-NGG protospacer adjacent motif (PAM), which can differ depending on the CRISPR system.

The S. pyogenes CRISPR-Cas system was the first to be reconstituted in mammalian cells through the heterologous expression of human codon-optimized Cas9 and the two RNA components. By altering the the 20-nt guide sequence within the sgRNA, Cas9 can be redirected toward any target bearing an appropriate PAM. Furthermore, elements from the crRNA and tracrRNA can be artificially linked to create a chimeric, single guide RNA (sgRNA), further simplifying the system for eukaryotic gene targeting.

At an overall structural level, Cas9 contains two nuclease domains, HNH and RuvC, each of which cleaves one strand of the target DNA. A mutation in either one of its catalytic domains converts Cas9 nuclease into a nickase, which has shown to induce single-stranded breaks for high-fidelity HDR applications, potentially ameliorating unwanted indel mutations from off target DSBs. Finally, a catalytically inactive or dead Cas9 (dCas9) with mutations in both DNA-cleaving catalytic residues can serve as an RNA-guided DNA-binding scaffold for localizing target effector domains that gene expression at the transcriptional level.

Engineering synthetic TALE and CRISPR-Cas9 transcription factors for regulating gene expression
Methods 2014; 69:188-197
http://dx.doi.org/10.1016/j.ymeth.2014.06.014

Fig.1. TheTAL effectorDNA-binding domain.(A) Through a DNA–protein interaction, each TALE repeatbinds one bp of DNA.TheTALE repeat is shown in blue, and the repeat variable di residue (RVD) at the 12th and 13th position are shown in green and red, respectively. (B) TALEs can be linked in tandem to recognize virtually any DNA sequence. The desired string of TALEs is then fused to an effector domain to induce a specific action at a predetermined DNA sequence. Crystal structure adapted from [60].

Fig. 2. The CRISPR/Cas9 DNA-binding domain. The Cas9 protein forms a complex with the gRNA, which recognizes a specific 20 bp DNA target sequence, known as the protospacer. A short sequence directly downstream from the protospacer, the protospacer adjacent motif (PAM),is requiredfor Cas9-mediated cleavage. ThePAM sequence is highly variable between different organisms (Table 2). With only two amino acid substitutions (D10A and H840A), Cas9 endonuclease activity can been eliminated while maintaining its RNA-guided DNA-binding activity. This deactivated Cas9 (dCas9) functions as a modular DNA-binding domain, similar to TALEs. RNA-guided transcriptional activators and repressors have been created by fusing dCas9 with different effector domains.

Fig.3. Golden gate assembly ofTALEs.Golden Gate assembly makesuse of type IIS restriction enzymes, including BsaI, BsmBI,and Esp3I, that cleave outside their recognition sequence to create unique overhangs. Therefore it is possible to digest and ligate multiple inserts into a destination plasmid with a single restriction enzyme in a single reaction. In step 1, single RVDs are excised from module plasmids and ligated into the desired array plasmid (sample overhangs are shown). This platform allows for construction ofup to 10RVDsinto each array plasmid. Importantly,the array plasmids confer spectinomycin resistance (SpecR) rather than tetracycline resistance (TetR). This ensures that only successfully assembled array plasmids are propagated. In step 2, the array plasmids and the last repeat (LR) plasmid are assembled in a second Golden Gate reaction to obtain the final desired TALE construct. Similar to step 1, in step 2 the final backbone vector confers ampicillin resistance (AmpR), rather than spectinomycin or tetracycline resistance, to ensure that only successfully assembled vectors are propagated. Replacement of the b-galactosidase expression cassette (LacZ) in the final step allows for blue-white screening of successful ligations. Figure adapted from [37].

Fig. 4. Custom gRNA cloning. The most common gRNA cloning methods make use of the BbsI type IIS restriction enzyme that cleaves outside its recognition sequence to create unique overhangs. Single stranded oligonucleotides containing each protospacer are annealed to create overhangs that are compatible with the BbsI sites in the destination vector. Upon ligation, the protospacer is inserted directly following the human U6 promoter and in front of the remainder of the chimeric gRNA sequence. The underlined G indicates the transcriptional start site.

The CRISPR/Cas9 gRNA Targeting System

The recent discovery of the CRISPR/Cas9 sysem has provided researchers an invaluable tool to target and modify any genomic sequence with high levels of efficacy and specificity. The system, consisting of a nuclease (Cas9) and a DNA-directed guide RNA (gRNA), allows for sequence-specific cleavage of target sequence containing a protospacer adaptor motif “NGG”. By changing the gRNA target sequence, virtually any gene sequence upstream of a PAM motif can be targeted by the CRISPR/Cas9 system, enabling the possibility of systematic targeting of sequences on a genomic scale. The most successful gene targeting using the CRISPR/Cas9 system is through expression of multiple gRNAs to guide the enzyme complex to several locations within the target gene to be cut or nicked.

The scalability of the Multiplex gRNA Cloning Kit allows for simultaneous cloning of two or more gRNAs at once into a single vector. This enables researchers to perform more advanced CRISPR/Cas9 techniques such as tandem double-nicking (4 gRNAs total) to remove defined genomic segments using Cas9 Nickase with significantly decreased chances for off-target effects.

The cloning of four gRNAs will require the researcher to perform three separate PCR reactions with separate primer pairs and blocks. Once the correct size amplicons are generated and gel-purified, they can be mixed at equimolar ratios (1:1:1) based on their concentrations and used as inserts in the subsequent fusion reaction with a suitable linearized destination vector.

https://www.systembio.com/downloads/Multiplex-gRNA-Cas9-system_ver5.pdf

https://www.systembio.com/images/How-quad-plex-cloning-works.jpg

https://www.addgene.org/static/data/easy-thumbnails/filer_public/cms/filer_public/7a/b2/7ab294b8-7f7a-4c30-8650-dbb520e2beb4/grna-and-cas9_1.jpg__600x277_q85_subsampling-2_upscale.png

Generation and utility of genetically humanized mouse models
Scheer N, Snaith M, Wolf CR, and Seibler J
Drug Discov Today 2013; 18(23/24):1200-1210
http://dx.doi.org/10.1016/j.drudis.2013.07.007

Applications of genetically humanized mouse models
Type of humanized mouse model Applications
Proteins involved in drug metabolismand disposition Drug–drug interaction studies
Identification and safety assessmentof human metabolites

Assessment of drug bioavailability

and clearance
PKPD modelling

Proteins of the immune and hematopoietic system Studying infectious diseases
Vaccine development and testingStudying autoimmune disorders, ..

involving the immune system

Discovery and testing of antibodies

for therapeutic use

Supported engraftment of human

cells in mice

Proteins involved in pathogeninfection Studying human infectiousdiseases
Aneuploidies or chromosomalre-arrangements Studying human hereditarydiseases
Drug targets Efficacy testing
Human regulatory elements Studying human gene expressionand regulation
Human proto-oncogenes ortumor suppressor genes Cancerogenicity testing

Components of the major pathway for drug metabolism and disposition.

Ligand-dependent activation of the xenobiotic receptors PXR, CAR, PPARa and AHR leads to a translocation to the nucleus and, together with their respective heterodimerization partners retinoic X receptor (RXR) and aryl hydrocarbon receptor nuclear translocator (ARNT), to binding of corresponding response elements and an induction of target genes.

Identifying Drug-Target Selectivity of Small-Molecule CRM1/XPO1 Inhibitors by CRISPR-Cas9 Genome Editing
JE Neggers, et al.
Chemistry & Biology , Jan 22, 2015; 22:107–116
http://dx.doi.org/10.1016/j.chembiol.2014.11.015

Figure 1. Generation of a Mutant XPO1C528S Cell Line Using CRISPR/Cas9 Genome Editing and Homologous Recombination (A) A schematic presentation of the two SINE compounds KPT-185 and KPT-330. (B) Schematic overview of the CRISPR/Cas9induced homologous recombination of human XPO1. Exons are represented by open thick arrows. The blue arrow indicates the sgRNA target site, and small arrowheads beneath the exons indicate forward and reverse PCR A or sequencing primersB.Thesiteofrecombinationis enlarged, and the location of the double strand break (scissors and arrow) is shown. Both the WT XPO1 and donor mutant template sequences are shown at the bottom (magenta, PAM motif; bold, cysteine 528 codon; red, template mutations; underlined, sgRNA sequence). (C) Sequencing chromatogram of genomic DNA of the XPO1 region around the targeted cysteine codon (in bold) from XPO1C528S cells (clone 6).See also Figure S1 and Table S1. (D) Partial protein sequence of XPO1 in WT and mutant XPO1C528S cells (clone 6). Residue 528 of XPO1 is shown in bold. (E) Sequencing chromatogram of the mRNA from XPO1C528S cells (clone 6) in the XPO1 region around the targeted cysteine codon. (F) Visualization of XPO1 protein expression in WT and mutant XPO1C528S cells (clone 6) by immunoblot with b-tubulin as loading control. (G) Relative comparison of XPO1 mRNA expression levels quantified with a probe specific to exon 2 of XPO1 (unpaired student’s t test p value, <0.0001). GAPDH and b-actin were used as internal controls. (H) Relative comparison of mean XPO1 protein expression in WT and XPO1C528S cells (clone 6) as measured by immunofluorescence staining and quantified by confocal fluorescence microscopy (unpaired student’s t test p value, <0.0001). Error bars indicate the 95% confidence interval.

Repurposing CRISPR as an RNA-Guided platform for sequence-specific control of gene expression
LS Qi. MH Larson, LA Gilbert, JA Duoda, et al.
Cell Feb 28, 2013; 152:1173–1183
http://dx.doi.org/10.1016/j.cell.2013.02.022

Figure 1. Design of the CRISPR Interference System (A)Theminimalinterferencesystemconsistsofasingleproteinandadesigned sgRNA chimera. The sgRNA chimera consists of three domains (boxed region): a 20 nt complementary region for specific DNA binding, a 42 nt hairpin for Cas9 binding (Cas9 handle), and a 40 nt transcription terminator derived from S. pyogenes. The wild-type Cas9 protein contains the nuclease activity. The dCas9 protein is defective in nuclease activity. (B) The wild-type Cas9 protein binds to the sgRNA and forms a protein-RNA complex. The complex binds to specific DNA targets by Watson-Crick base pairing between the sgRNA and the DNA target. In the case of wild-type Cas9, the DNA will be cleaved due to the nuclease activity of the Cas9 protein. We hypothesize that the dCas9 is still able to form a complex with the sgRNA and bind to specific DNA target. When the targeting occurs on the protein-coding region, it could block RNA polymerase and transcript elongation. See also Figure S1

Figure 2. CRISPRi Effectively Silences Transcription Elongation and Initiation (A) The CRISPRi system consists of an inducible Cas9 protein and a designed sgRNA chimera. The dCas9 contains mutations of the RuvC1 and HNH nuclease domains. The sgRNA chimera contains three functional domains, as described in Figure 1. (B) Sequence of designed sgRNA (NT1) and the DNA target. NT1 targets the nontemplate DNA strand of the mRFP-coding region. Only the region surrounding the base-pairing motif (20 nt) is shown. Base-pairing nucleotides are shown in orange, and the dCas9-binding hairpin is in blue. The PAM sequence is shown in red. (C) CRISPRi blocks transcription elongation in a strand-specific manner. A synthetic fluorescence-based reporter system containing an mRFP-coding gene is inserted into the E.coli MG1655 genome (then sfA locus). Six sgRNAs that bind to either the template DNA strand or the nontemplate DNA strand are coexpressed with the dCas9 protein, with their effects on the target mRFP measured by in vivo fluorescence assay. Only sgRNAs that bind to the nontemplate DNA strand showed silencing (10- to 300-fold). The control shows fluorescence of the cells with dCas9 protein but without the sgRNA. (D) CRISPRi blocks transcription initiation. Five sgRNAs are designed to bind to different regions around an E.coli promoter (J23119). The transcription start site is labeled as +1. The dotted oval shows the initial RNAP complex that covers a 75 bp region from 55 to +20. Only sgRNAs targeting regions inside of the initial RNAP complex show repression (P1–P4). Unlike transcription elongation block, silencing is independent of the targeted DNA strand. (E) CRISPRi regulation is reversible. Both dCas9 and sgRNA (NT1) are under the control of an aTc-inducible promoter. Cell culture was maintained during exponential phase. At timeT=0, 1mM of a Tc was supplemented to cells with OD=0.001. Repression of target mRFP starts within 10min.The fluorescence signal decays in a way that is consistent with cell growth, suggesting that the decay is due to cell division. In 240 min, the fluorescence reaches the fully repressed level. At T= 370 min, a T cis washed away from the growth media, and cells are diluted back to OD = 0.001. Fluorescence starts to increase after 50 min and takes about 300 min to rise to the same level as the positive control. Positive control: always without the inducer; negative control: always with 1 mM aTc inducer. Fluorescence results in (C)–(E) represent average and SEM of at least three biological replicates. See also Figures S2 and S3.

Figure 3. CRISPRi Functions by Blocking Transcription Elongation (A) FLAG-tagged RNAP molecules were immunoprecipitated, and the associated nascent mRNA transcripts were sequenced. (Top) Sequencing results of the nascent
mRFP transcript in cells without sgRNA. (Bottom) Results in cells with sgRNA. In the presence of sgRNA, a strong transcriptional pause is observed 19 bp upstream of the target site, after which the number of sequencing reads drops precipitously. (B) A proposed CRISPRi mechanism based on physical collision between RNAP and dCas9-sgRNA. The distance from the center of RNAP to its front edge is ~19 bp, which matches well with our measured distance between the transcription pause site and 30 of sgRNA base-pairing region. The paused RNAP aborts transcription elongation upon encountering the dCas9-sgRNA roadblock.

Figure 4. Targeting Specificity of the CRISPRi System (A) Genome-scale mRNA sequencing (RNA-seq) confirms that CRISPRi targeting has no off-target effects. The sgRNA NT1 that bindsto the mRFP coding region is used. The dCas9, mRFP, and sfGFP genes are highlighted. (B)Multiple sgRNAs can independently silence two fluorescent protein reporters in the same cell. Each sgRNA specifically represses its cognate gene,but not the other gene. When both sgRNAs are present, both genes are silenced. Error bars represent SEM from at least three biological replicates. (C) Microscopic images for using two sgRNAs to control two fluorescent proteins. (Top) Bright-field images of the E. coli cells; (middle) RFP channel; (bottom) GFP channel. Coexpression of one sgRNA and dCas9 only silences the cognate fluorescent protein, but not the other. The knockdown effect is strong, as almost no fluorescence is observed from cells with certain fluorescent protein silenced. Scale bar, 10 mm. Control shows cells without any fluorescent protein reporters.

In vitro and in vivo growth suppression of human papillomavirus 16-positive cervical cancer cells by CRISPR-Cas9
S Zhen, L Hua, et al.
BBRC 2014; 450:1422-1426
http://dx.doi.org/10.1016/j.bbrc.2014.07.014

Fig. 4. Suppression of in vivo growth of SiHa cells in BALB/c nude mice by CRISPR/ Cas9. (A) In vivo tumor growth curves of CRISPR/Cas9 systems-treated SiHa cells. The mean tumor volumes ± SD (bars) are shown at the times that tumor measurements were made (n = 6). (B) Tumor weight 10 weeks after inoculation. All tumors were excised and weighted.

One-Step Generation of Mice Carrying Mutations in Multiple Genes by CRISPR-Cas-mediated genome engineering
Wang H, Yang H, et al.
Cell  2013; 153:910-918
http://dx.doi.org/10.1016/j.cell.2013.04.025

Figure 2. Single- and Double-Gene Targeting In Vivo by Injection into Fertilized Eggs (A) Genotyping of Tet1 single-targeted mice. (B) Upper: genotyping of Tet2 single-targeted mice. RFLP analysis; lower: Southern blot analysis. (C) The sequence of both alleles of targeted gene in Tet1 biallelic mutant mouse 2 and Tet2 biallelic mutant mouse 4. (D) Genotyping of Tet1/Tet2 double-mutant mice. Analysis of mice 1 to 12 is shown. Upper: RFLP analysis; lower: southern blot analysis. The Tet1 locus is displayed on the left and the Tet2 locus on the right. (E) The sequence of four mutant alleles from double-mutant mouse 9 and 10. PAM sequences are labeled in red. (F) Three-week-old double-mutant mice. All RFLP and Southern digestions and probes are the same as those used in Figure 1. See also Figures S2 and S3.

The impact of CRISPR–Cas9 on target identification and validation
JD Moore
Drug Discov Develop 2015
http://dx.doi.org/10.1016/j.drudis.2014.12.016

Gene editing with Cas9. (a) Knock-out generation via Cas9 and a single synthetic guide (sg)RNA. sgRNAs form Watson–Crick base pairs with target sequences recruiting the wild-type Cas9 nuclease. Cas9 generates double stranded breaks that are typically repaired by the imprecise NHEJ mechanism resulting in small insertions or deletions, most of which generate frameshift mutations. Transient expression of sgRNA plus Cas9 leads to editing of 2–25% of alleles. Derivative clones are analysed to find examples where Gene editing with Cas9. (a) Knock-out generation via Cas9 and a single synthetic guide (sg)RNA. sgRNAs form Watson–Crick base pairs with target sequences recruiting the wild-type Cas9 nuclease. Cas9 generates double stranded breaks that are typically repaired by the imprecise NHEJ mechanism resulting in small insertions or deletions, most of which generate frameshift mutations. Transient expression of sgRNA plus Cas9 leads to editing of 2–25% of alleles. Derivative clones are analysed to find examples where both alleles have been repaired with frame shift mutations. (b) Knock-out generation via Cas9 and a pair of sgRNAs. When wild-type Cas9 is expressed with a pair of sgRNAs targeting sites in the same region of a gene, simultaneous dual double-stranded breaks will be introduced in a fraction of cells. Repair via NHEJ will tend to delete the intervening sequence. (c) Knock-in generation using sgRNAs, donor DNA and either wild-type Cas9 or the Cas9-D10A nickase mutant. Wild-type Cas9 generates double stranded breaks that can be repaired by NHEJ generating indels or by homology-directed repair (HDR) leading to knock-in of mutations present on homology templates. The Cas9-D10A nickase mutant only generates single stranded breaks, which are not a substrate for the NHEJ pathway. However, these can be processed by HDR leading to the introduction of knock-in mutations. (d) Using the Cas9D10A nickase mutant to enhance the specificity of gene editing. The sgRNA shown in red also recruits Cas9 to partially mismatched off-target sites where wild-type Cas9 can efficiently introduce double stranded breaks leading to editing of an off-target exon.  More…

Repurposing CRISPR-Cas9 for in situ functional assays
Malina A, Mills JR, …, Pelletier J.
Genes & Development 2015; 27:2602–2614
http://www.genesdev.org/cgi/doi/10.1101/gad.227132.113

Figure 1. Genome editing of a TLR locus in 293Tcells using an engineered all-in-one type II CRISPR system. (A) Schematic diagram of LeGO-based lentivirus (pLC) constructs driving expression of Cas9 and sgRNAs. (B) Predicted secondary structure (http://rna.tbi. univie.ac.at/cgi-bin/RNAfold.cgi) of sgRNA showing alignment of trigger sequence with target and PAM. The first nucleotide of the trigger sequence is forcibly a G, since the sgRNA is expressed from the murine U6 promoter. (C) Schematic of TLR with the position and nucleotide sequence of the TLR trigger, PAM, and stop codon shown. (D) A genomically integrated TLR is efficiently targeted by pLC-TLR. Quantitation of 293T TLR cells transfected with the indicated Cas9/sgRNA expression constructs and, where indicated, in combination with D20 eGFP. (E) Immunoblot showing expression and subcellular localization of Cas9 from the experiment presented in D. (C) Cytoplasmic fraction; (M) membrane fraction; (N) nuclear fraction. Blots were probed with the antibodies indicated below each panel. (F) Lentiviral-mediated NHEJ and HDR in 293T TLR cells. Cells were infected with lentivirus expressing Cas9 and the corresponding sgRNA and analyzed by flow cytometry 6 d later. The D20 eGFP donor plasmid was introduced by transfection 1 d prior to transduction with the Cas9/sgRNA lentiviral construct.

Figure 2. Cas9-mediated editing of Trp53 in Arf[1]/[1] MEFs leads to Nutlin-3a resistance. (A) Schematic diagram of the pQ-based retroviral constructs driving expression of Cas9, GFP, and sgRNAs (pQCiG). (B) Flow cytometric analysis of Arf[1]/[1] and p53[1]/[1] MEFs transduced with QCiG-Rosa, QCiG-p53, or MLP-p53.1224 retroviruses, cultured 3 d later in the presence of vehicle or 10 mM Nutlin-3a for 24 h, and then allowed to recover for 4 d. (C) Colony formation assay of infected Arf[1]/[1] and p53[1]/[1] MEFs with QCiG-Rosa, QCiGp53, or MLP-p53.1224. Five-thousand cells were seeded, exposed to 10 mM Nutlin-3a for 24 h, and allowed to recover for 12 d in the absence of drug, at which point they were stained with crystal violet. (D) SURVEYOR assay of DNA isolated from QCiG-p53- and QCiG-Rosa-infected Arf[1]/[1] MEFs exposed to 10 mM Nutlin-3a for 24 h and allowed to recover for 4 d. The arrowhead denotes the expected SURVEYOR cleavage products. (E) Immunoblot documenting Cas9 and p53 expression in QCiG- and MLP-infected MEFs. The asterisk denotes the position of a prominent p53 truncated product

Figure 3. Cas9-mediated editing of Trp53 in Arf[1]/[1]Em-myc lymphomas is positively selected for following DXR treatment in vivo. (A) Schematic diagram of in vivo fitness assay. (B) Kaplan-Meier analysis of tumor-free survival of mice injected with Rosa26 or Trp53 Cas9 targeted Arf[1]/[1]Em-myc and p53[1]/[1]Em-myc lymphomas following treatment with DXR. (C) Detection of GFP in tumors arising from QCiG-p53-infected Arf[1]/[1]Em-myc lymphomas following exposure to DXR and analyzed 3 d later. White arrows denote GFP fluorescence in lymph nodes originating from the presence of QCiG-p53 in the resulting tumors. (D) FACS analysis of the indicated Cas9 targeted Em-myc lymphomas analyzed before injection into mice (input), from tumors arising in vivo (pre-DXR), and from tumors for which the host had received DXR treatment (post-DXR). (E) SURVEYOR assay of DNA from QCiG-p53- and QCiG-Rosa-infected Arf-/-Em-myc lymphomas isolated from mice prior to DXR treatment. (F) Immunoblot showing long-term Cas9, p53, and GFP expression in QCiG-Rosa and QCiG-p53 Arf-/-Em-Myc lymphomas in vivo. Samples are from three separate tumors isolated prior to (pre-DXR) or following (post-DXR) DXR treatment. In the case of post-DXR samples for QCiG-Rosa Arf-/-Em-myc lymphomas, tumors were harvested after relapse (~10 d after post-DXR treatment). The asterisk highlights a truncated p53 protein arising in the Cas9 edited samples.

Figure 4. Analysis of indels at the Trp53 locus and at predicted off-target sites in Arf-/-MEFs and Arf-/-Em-myc tumors edited with Rosa26 and Trp53 sgRNAs. (A) Total count and location of insertions and deletions in exon 7 of Trp53 in Arf-/-Em-myc cells prior to injection, post-implantation, and post-DXR treatment, respectively. The vertical dashed line represents the predicted Cas9 cleavage site. (B) Frequency of mutant reads obtained following sequencing of Trp53 exon 7 from the indicated cells and tumors. T-1, T-2, and T-3 represent three independent tumors. (C, top panel) Sequence alignment of the trigger site in the Trp53 and Trp53 pseudogene. Differences are highlighted in green. (Bottom panel) Pie charts illustrating the proportion of mutated sequence reads at Trp53 (left) and the Trp53 pseudogene (right) relative to wild-type sequences (wt; blue). DNA was isolated from samples of Arf-/-Em-myc lymphoma cells infected with QCiG-Rosa-infected (top), QCiG-p53-infected (middle), or QCiG-p53-infected cells that were exposed to 10 mM Nutlin-3a for 3 d followed by a 10-d recovery period (bottom). (D) Prediction of genomic sequences showing sequences complementary to the first 13 perfectly matched nucleotides 59 to the PAM of the Trp53 trigger sequence with all possible combinations of PAM. The trigger sequence is shown in blue, PAM is in red, and flanking nucleotides are in black. The genomic location is shown at the right. (E) Percent mutant reads at the indicated genomic locus in Rosa26- and Trp53-modified Arf-/- MEFs. The total read count for each amplified region ranged from ;11,000 to 15,000 (sample #8), ;18,000 to 23,000 (sample #7), and ;20,000 to 53,000 (all others). Read counts for locus #2 are absent, since the barcode that had been used in the preparation of that sample could not be deciphered from the output of reads.

TALE nucleases- tailored genome engineering made easy
Mussolino C, Cathomen T
Current Opinion in Biotechnology 2012; 23:644–650
http://dx.doi.10.1016/j.copbio.2012.01.013

Generation of customized TALENs by ‘Golden Gate’ cloning. Dependent on the user-defined target sequence, the respective repeat units with desired specificities can be assembled using a two-step ‘Golden Gate’ cloning protocol. A TALEN monomer is generated by incorporating the TALE designer array in a TALEN backbone, which contains an N-terminal NLS, the ‘0 repeat’ binding to the 50-T nucleotide, the 17.5 ‘half-repeat’, and the terminal FokI cleavage domain (N).

TALEN or Cas9 – Rapid, efficient and specific choices for genome modifications
Wei C, Liu J, et al.
J Genetics and Genomics 40 (2013) 281e289
http://dx.doi.org/10.1016/j.jgg.2013.03.013

Fig. 1. Schematic principles of TALEN- and CRISPR/Cas9-mediated genomic modifications. A: a single TALEN consists of an N-terminal domain including a nuclear localization signal (NLS, blue); a central domain typically composed of tandem TALE repeats (green) for the recognition of a specific DNA sequence; and a C-terminal domain of the functional endonuclease Fok I (black). Each TALE repeat comprises of a 34-amino-acid unit that differs at the position of 12th and 13th amino acids: NG (recognizing T), NI (recognizing A), HD (recognizing C), or NN (recognizing G) (color boxes). B: double-strand breaks (DSBs) that are resulted from the cut by dimeric Fok I can be repaired either by non-homologous end joining (NHEJ) to yield indels or by homologous recombination (HR) with available homologous donor templates. The red star indicates where indels occur. C: the CRISPR/Cas9 system consists of a group of CRISPR-associated (Cas) genes (arrows with the direction to the right) and a CRISPR locus that contains an array of repeats (dark diamonds) e spacer (color boxes) sequences. All repeats are the same in sequence and all spacers are different and complementary to their target DNA sequences. The tracrRNA (trans-activating crRNA, arrow on the most left) can help to produce the crRNA (CRISPR RNA). D: the Cas9 protein (blue) binds to crRNA (orange) and tracrRNA (purple) to form a ribonucleoprotein complex. The crRNA sequence guides this complex to a complementary sequence in the target DNA (black). Then the HNH and RuvC domains of Cas9 nick the complementary and non-complementary strands, respectively, making a DSB. PAM: protospacer adjacent motif NGG (yellow box). gRNA: guiding RNA. NCC is a complementary motif of the PAM motif (NGG).

Table 1 Comparison of TALEN- and CRISPR/Cas9-mediated genomic modifications e principles and applications

TALEN CRIPR/Cas9
Target-binding principle Protein-DNA specific recognition Watson Crick complementary rule
Working mode TALE specifically recognizes the target DNA and dimeric Fok I makes the DSB, which is repaired by NHEJ or HR Guide RNA specifically recognizes the target DNA and Cas9 makes the DSB, which is repaired by NHEJ or HR
Essential components TALE-Fok I fusion protein Guide RNA and Cas9
Off-target effects Minor effects Not determined
Efficiency High but variable High but variable
Target site availability No restriction PAM (NGG) motif restriction
Work in pair/dimmer Yes No
Inheritability in animals Yes Not determined
3D structure Yes Yes
Time to construct 5-7 d 1-3 d
Origin discovery Plant pathogen E. coli

Genome-Scale CRISPR-Mediated Control of Gene Repression and Activation
Gilbert LA, et al.
Cell, Oct 23, 2014; 159: 647–661
http://dx.doi.org/10.1016/j.cell.2014.09.029

Figure 1. A Tiling sgRNA Screen Defines Rules for CRISPRi Activity at Endogenous Genes in Human Cells (A) Massively parallel determination of growth or toxin-resistance phenotypes caused by sgRNAs in mammalian cells expressing dCas9 or dCas9 fusion constructs. (B) UCSC genome browser tracks showing the genomic organization, GC content, and repetitive elements around the TSS of a representative gene, VPS54, across a 10 kb window targeted by the tiling sgRNA library. sgRNA ricin-resistance phenotypes (as Z scores, see Figure S1 and Experimental Procedures) in dCas9 and dCas9-KRAB expressing K562 cells are depicted in black on the top and bottom, respectively. See also Figure S2A for more examples. (C) Sliding-window analysis of all 49 genes targeted in a tiling sgRNA library. Green line: median sgRNA activity in a defined window for all genes. Orange region: observed average window of maximum CRISPRi activity. Data displayed as a phenotype signed Z score, excluding all guides longer than 22 bp. (D) CRISPRi activity for all 49 genes in defined windows relative to the TSS of each gene. (E) Ricin-resistance phenotypes, comparing CRISPRi sgRNAs selected by our rules to RNAi, for genes previously established to cause ricin-resistance phenotypes when knocked down by RNAi. Mean ± SD phenotype-signed Z score of 100 sets of 10 randomly subsampled sgRNAs or shRNAs. See also Figure S2F

Figure 2. CRISPRi Activity is Highly Sensitive to Mismatches Between the sgRNA and DNA sequence On- and off-target activity of dCas9, dCas9-KRAB and Cas9 for sgRNAs with a varying number and position of mismatches. Off-target activity of sgRNAs with mismatches is displayed as percent of the on-target activity for the corresponding sgRNA without mismatches. Asterisk indicates sgRNAs with three, four, or five mismatches randomly distributed across region 3 of the sgRNA sequence. Data are displayed for each mismatch position as the mean of all sgRNAs with that mismatch; see Figure S3 for individual sgRNA activities. sgRNAs were included in the analysis only if the fully matched guide was highly active (phenotype-signed Z score R 4); n = 5 for dCas9, n = 11 for dCas9-KRAB, and n = 10 for Cas9.

Figure 3. A Tiling sgRNA Screen Defines Rules for CRISPRa Activity at Endogenous Genes in Human Cells (A) A schematic of the dCas9-SunTag + scFV-VP64 + sgRNA system for CRISPRa. (B)ActivityofsgRNAsinK562cellsstablyexpressingeachcomponentofCRISPRa,asafunctionofthedistanceofthesgRNAsitetotheTSSofthetargetedgene (Phenotype-signed Z scores; therefore, negative values represent opposite results than from knockdown). Top, sgRNAs targeting VPS54; Bottom, slidingwindow analysis of all 49 genes targeted by our tiling library in green. Green line, median activity; orange, window of maximal activity. Guides longer than 22 bp were excluded. See also Figure S4. (C)CRISPRaphenotypesandCRISPRi(dCas9-KRAB)phenotypesareanticorrelated forselect genes.Foreachgene,aMann-Whitneypvalueiscalculatedusing CRISPRi/a sgRNA activity relative to a negative control distribution for 24 subsampled sgRNAs. Mean ± SD p value of 100 randomly subsampled sets is displayed. (D) CRISPRi knockdown and CRISPRa activation of the same gene can have opposing effects on ricin resistance in both primary screens and single sgRNA validation experiments (mean ± SD of 3 replicates). (E) Modulation of expression levels for 3 genes by CRISPRi and CRISPRa as quantified by qPCR plotted against the ricin-resistance phenotype (mean ± SD of 3 replicates) measured for each sgRNA.

Figure 4. Genome-Scale CRISPRi and CRISPRa Screens Reveal Genes Controlling Cell Growth (A) sgRNA phenotypes from a genome-scale CRISPRi screen for growth in human K562 cells (black). Three classes of negative control sgRNAs are color-coded: nontargeting sgRNAs (gray), sgRNAs targeting Y-chromosomal genes (green) and sgRNAs targeting olfactory genes (orange). (B) Coexpression of sgRNAs and dCas9-KRAB or dCas9-SunTag + scFV-VP64 is not toxic in K562 cell lines over 16 days. (C) Gene set enrichment analysis (GSEA) for hits from the CRISPRi screen. A histogram of gene distribution is shown under the GSEA curve. (D) CRISPRi versus CRISPRa gene phenotypes for genome-scale growth screens (black). For the 50 genes in the CRISPRa screen with the most negative growth phenotype, each gene was annotated and labeled based on evidence of activity as a tumor suppressor (orange), developmental transcription factor (green), or in regulation of the centrosome (purple). Two additional CRISPRi hit genes that are discussed in the text are labeled in red. See Table S4 for annotations and references. (E) GSEA for hits from the CRISPRa growth screen. A histogram of gene distribution is shown under the GSEA curve.

Figure 5. CRISPRi Gene Silencing Is Inducible, Reversible, and Nontoxic (A) Expression construct encoding an inducible KRAB-dCas9 fusion protein. (B) Western blot analysis of inducible KRAB-dCas9 in the absence, presence, and after washout of doxycycline. (C) Relative RAB1A expression levels (as quantified by qPCR) in inducible CRISPRi K562 cells transduced with RAB1A-targeting sgRNAs in the absence, presence, and after washout of doxycycline. Mean ± standard error of technical replicates (n = 2) normalized to control cells (assayed in the presence of doxycycline) from the day 2 time point. (D) Competitive growth assays performed with inducible CRISPRi K562 cells transduced with the indicated sgRNAs in the presence and absence of doxycycline. Data are represented as the mean ± SD of replicates (n = 3). See also Figure S5G. (E) A CRISPRi sublibrary screen for effects on cell growth was performed with inducible CRISPRi K562 cells in the presence and absence of doxycycline. (F) Cumulative growth curves from the sublibrary screen represented in (E) show no bulk changes to growth caused by induction of KRAB-dCas9. Mean ± SD of replicate infections each screened in duplicate.

Figure 6. Genome-Scale CRISPRi and CRISPRa Screens Reveal Known and New Pathways and Complexes Governing the Response to a Cholera-Diphtheria Fusion Toxin (A) Model for CTx-DTA binding, retrograde trafficking, retrotranslocation, and cellular toxicity. (B) Overview of top hit genes detected by the CTx-DTA screen. Dark red and blue circles: Top 50 sensitizing and protective hits, respectively. Light red and blue circles: further hits that fall into the same protein complexes or pathways as top 50 hits. Circle area is proportional to phenotype strength. White stars denote genes identified in a previous haploid mutagenesis screen (Guimaraes et al., 2011). See also Figure S6 for hit gene names. (C) CRISPRi and CRISPRa hits in sphingolipid metabolism. Display as in (B), except that the left and right sides of each circle represent the phenotypes in the CRISPRi and CRISPRa screens, respectively.

Figure 7. CRISPRi Strongly Represses Gene Expression of Both Protein-Coding and Noncoding Genes, Resulting in Reproducible Phenotypes (A–C) Cells expressing a negative control sgRNA or an sgRNA targeting SEL1L or B4GALNT1 were incubated with cholera toxin and fractionated to quantify cholera toxin present in the cytosolic and membrane fractions by western blot. B4GALNT1 repression blocks toxin uptake, whereas SEL1L repression prevents toxin retrotranslocation from the membrane fraction to the cytosol. (D) Validation of CTx-DTA screen phenotypes with single sgRNA retest experiments. Data are represented as the mean ± SD of replicates (n = 3). (E) CRISPRi knockdown of 13 hit genes (28 sgRNAs; sgRNAs correspond to 7D) identified in the CTx-DTA screen was quantified by qPCR. The gray shaded region denotes sgRNAs showing at least 90% knockdown for each gene. Data are normalized to a negative control sgRNA (NC). (F) CRISPRi knockdown of 6 lncRNA genes was quantified by qPCR. Two to three sgRNAs computationally predicted to target each gene were cloned and transduced into K562 cells expressing dCas9-KRAB. Data are normalized to a negative control sgRNA (NC). (G) K562 cells expressing dCas9-KRAB were transduced with either a nontargeting sgRNA or an sgRNA targeting the XIST locus (sgXIST-1). The cells were then stained with DAPI and an RNA FISH probe for the XIST transcript. Two hundred nonapoptotic interphase cells in each condition were scored for XIST RNA coating. XIST is undetectable in cells transduced with sgXIST-1. Scale bar, 5 mm

Other related articles published on this topic in this Open Access Online Scientific Journal include the following:

Advances in Gene Editing Technology: New Gene Therapy Options in Personalized Medicine

Curators: Stephen J Williams, PhD and Aviva Lev-Ari, PhD, RN

http://pharmaceuticalintelligence.com/2015/03/16/advances-in-gene-editing-technology-new-gene-therapy-options-in-personalized-medicine/

Read Full Post »

« Newer Posts - Older Posts »